Zip Codes with the Highest Percentage of Population Employed in Computer & Mathematics in Battle Creek, MI
RELATED REPORTS & OPTIONS
Computer & Mathematics
Battle Creek
Compare Zip Codes
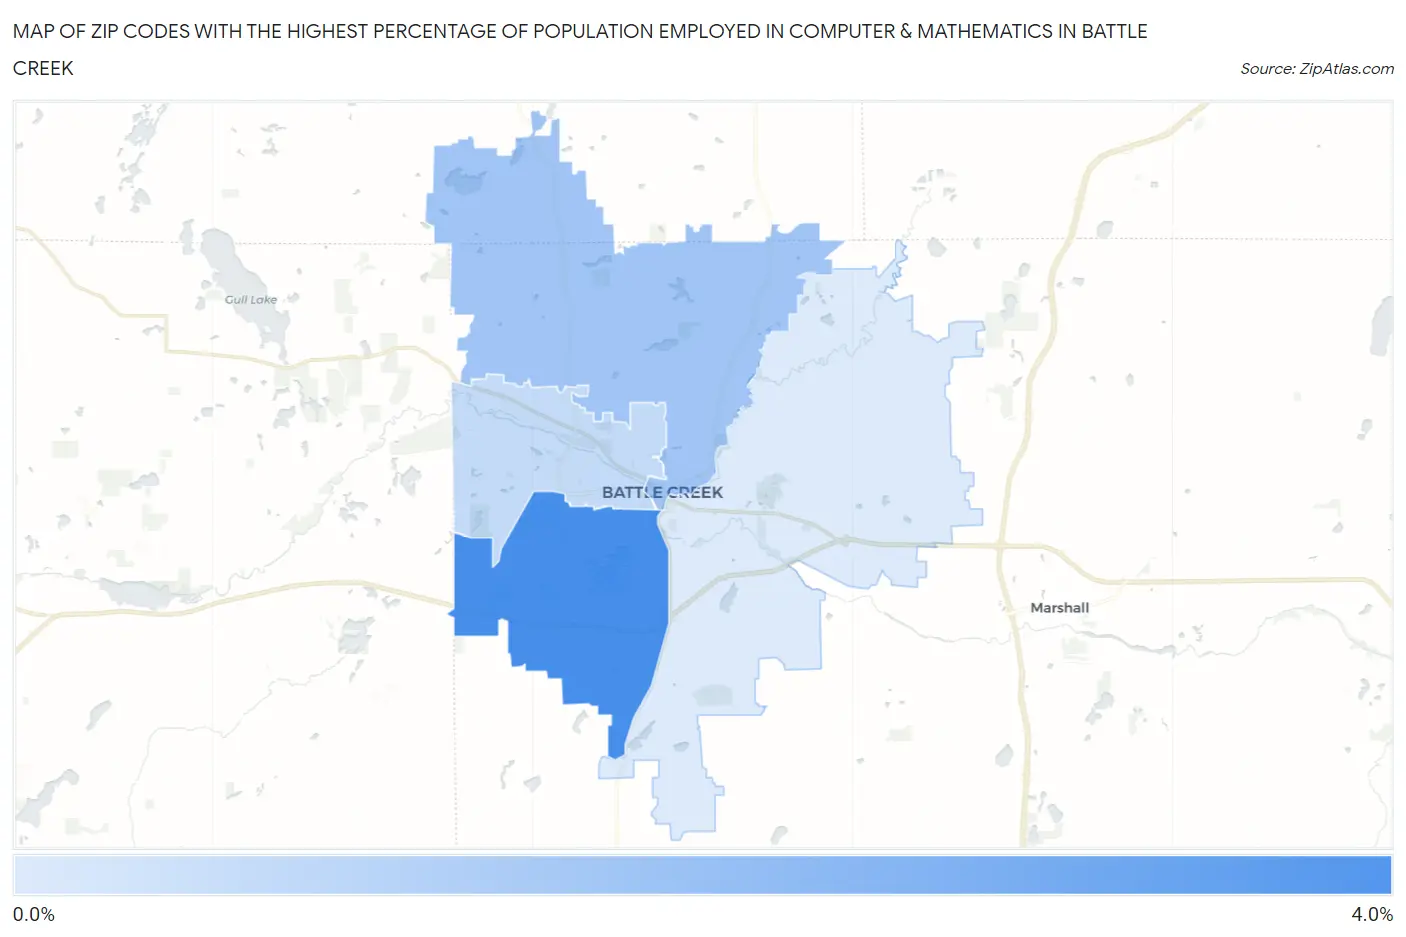
Map of Zip Codes with the Highest Percentage of Population Employed in Computer & Mathematics in Battle Creek
0.97%
3.3%
Zip Codes with the Highest Percentage of Population Employed in Computer & Mathematics in Battle Creek, MI
| Zip Code | % Employed | vs State | vs National | |
| 1. | 49015 | 3.3% | 2.9%(+0.399)#172 | 3.5%(-0.201)#6,707 |
| 2. | 49017 | 1.9% | 2.9%(-1.03)#393 | 3.5%(-1.63)#12,347 |
| 3. | 49037 | 1.4% | 2.9%(-1.56)#525 | 3.5%(-2.16)#15,170 |
| 4. | 49014 | 0.97% | 2.9%(-1.95)#631 | 3.5%(-2.55)#17,533 |
1
Common Questions
What are the Top 3 Zip Codes with the Highest Percentage of Population Employed in Computer & Mathematics in Battle Creek, MI?
Top 3 Zip Codes with the Highest Percentage of Population Employed in Computer & Mathematics in Battle Creek, MI are:
What zip code has the Highest Percentage of Population Employed in Computer & Mathematics in Battle Creek, MI?
49015 has the Highest Percentage of Population Employed in Computer & Mathematics in Battle Creek, MI with 3.3%.
What is the Percentage of Population Employed in Computer & Mathematics in Battle Creek, MI?
Percentage of Population Employed in Computer & Mathematics in Battle Creek is 2.4%.
What is the Percentage of Population Employed in Computer & Mathematics in Michigan?
Percentage of Population Employed in Computer & Mathematics in Michigan is 2.9%.
What is the Percentage of Population Employed in Computer & Mathematics in the United States?
Percentage of Population Employed in Computer & Mathematics in the United States is 3.5%.