Zip Codes with the Highest Percentage of Population Employed in Computer & Mathematics in Brighton, MI
RELATED REPORTS & OPTIONS
Computer & Mathematics
Brighton
Compare Zip Codes
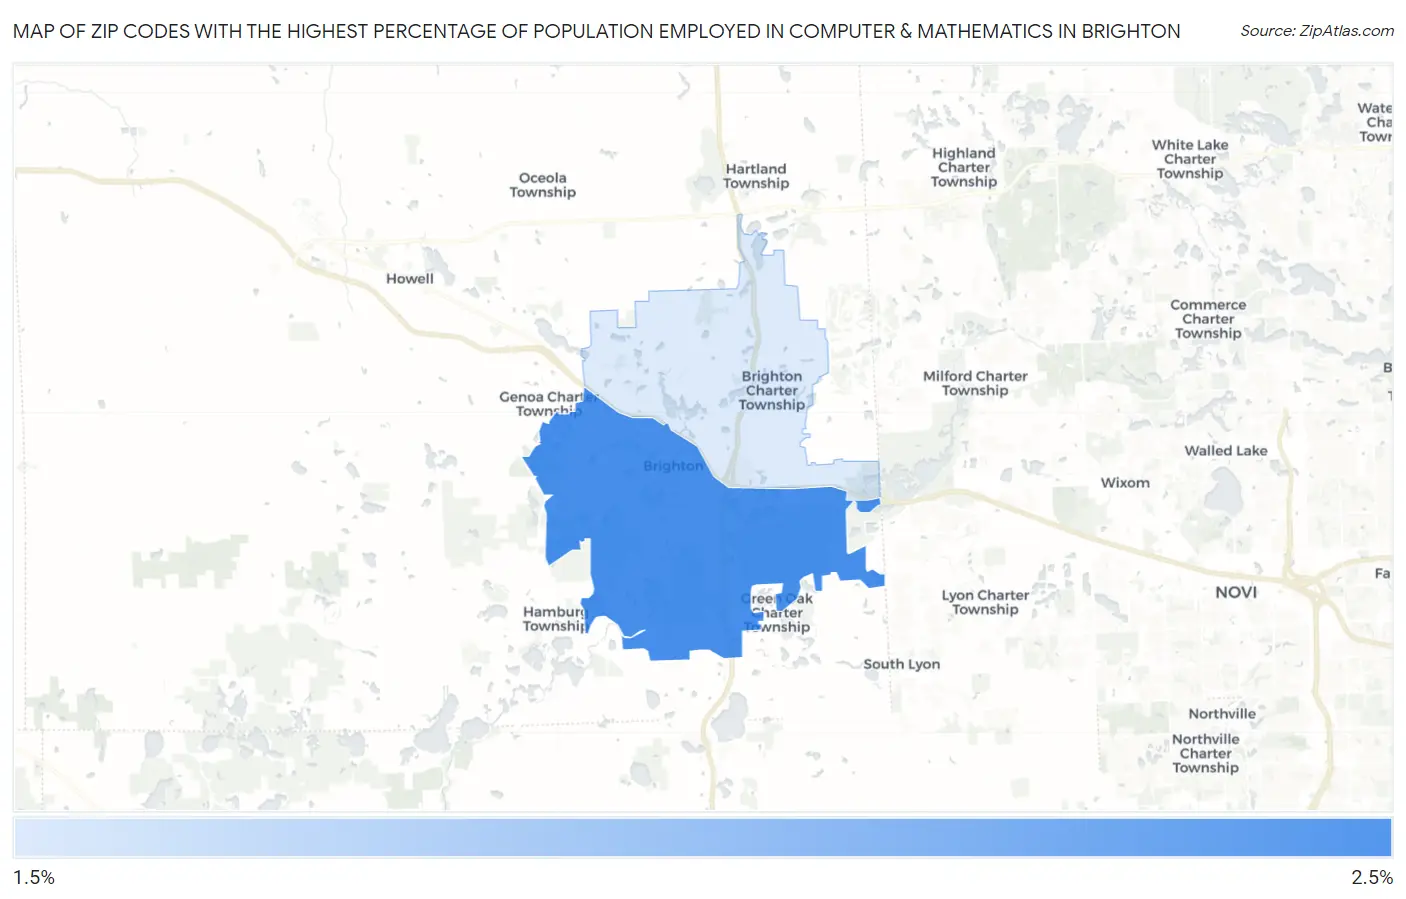
Map of Zip Codes with the Highest Percentage of Population Employed in Computer & Mathematics in Brighton
2.0%
2.3%
Zip Codes with the Highest Percentage of Population Employed in Computer & Mathematics in Brighton, MI
| Zip Code | % Employed | vs State | vs National | |
| 1. | 48116 | 2.3% | 2.9%(-0.651)#321 | 3.5%(-1.25)#10,582 |
| 2. | 48114 | 2.0% | 2.9%(-0.893)#359 | 3.5%(-1.49)#11,658 |
1
Common Questions
What are the Top Zip Codes with the Highest Percentage of Population Employed in Computer & Mathematics in Brighton, MI?
Top Zip Codes with the Highest Percentage of Population Employed in Computer & Mathematics in Brighton, MI are:
What zip code has the Highest Percentage of Population Employed in Computer & Mathematics in Brighton, MI?
48116 has the Highest Percentage of Population Employed in Computer & Mathematics in Brighton, MI with 2.3%.
What is the Percentage of Population Employed in Computer & Mathematics in Brighton, MI?
Percentage of Population Employed in Computer & Mathematics in Brighton is 1.8%.
What is the Percentage of Population Employed in Computer & Mathematics in Michigan?
Percentage of Population Employed in Computer & Mathematics in Michigan is 2.9%.
What is the Percentage of Population Employed in Computer & Mathematics in the United States?
Percentage of Population Employed in Computer & Mathematics in the United States is 3.5%.