Southgate, MI Map & Demographics
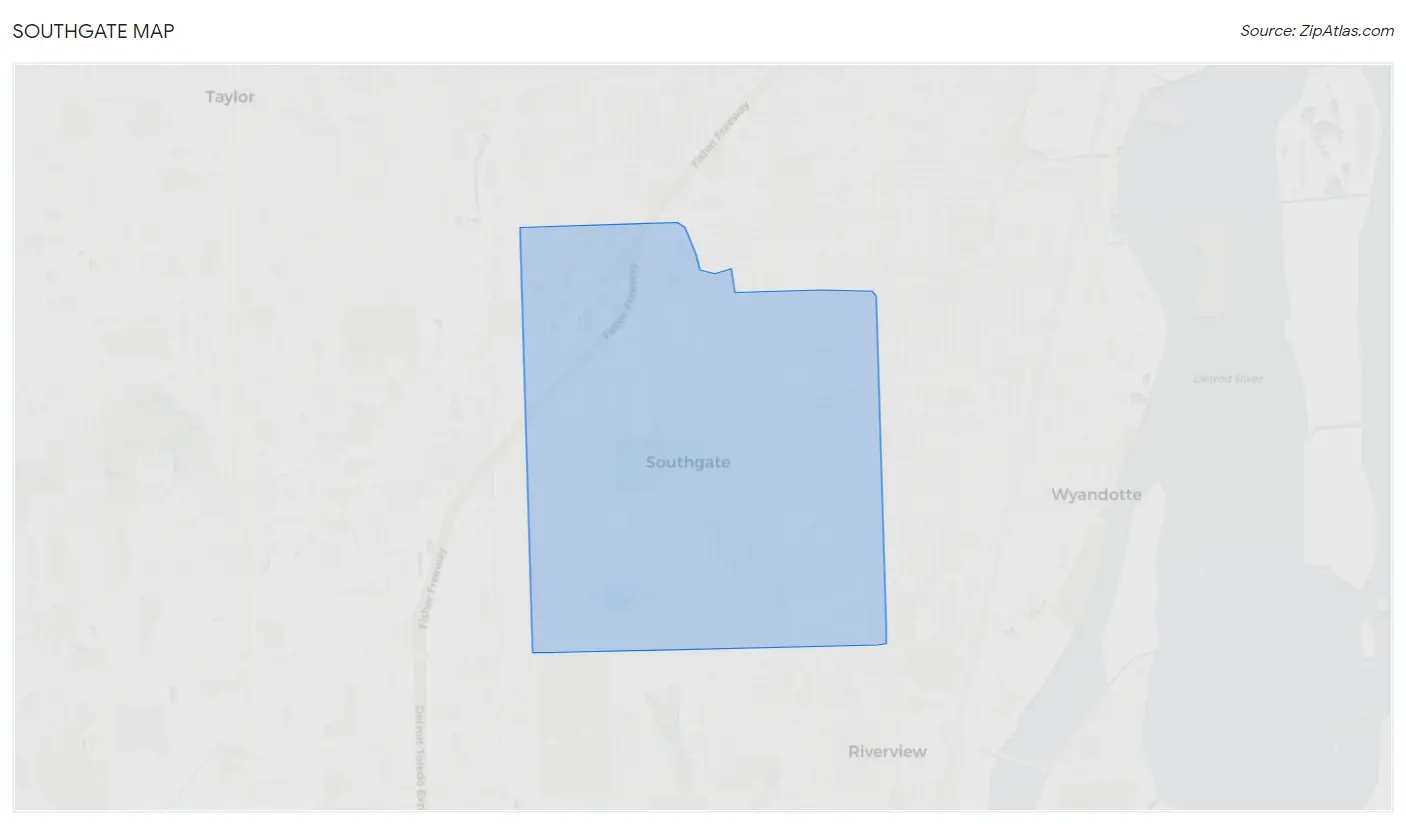
Southgate Map
Southgate Overview
$34,480
PER CAPITA INCOME
$78,088
AVG FAMILY INCOME
$62,792
AVG HOUSEHOLD INCOME
19.9%
WAGE / INCOME GAP [ % ]
80.1¢/ $1
WAGE / INCOME GAP [ $ ]
$10,132
FAMILY INCOME DEFICIT
0.41
INEQUALITY / GINI INDEX
29,948
TOTAL POPULATION
14,648
MALE POPULATION
15,300
FEMALE POPULATION
95.74
MALES / 100 FEMALES
104.45
FEMALES / 100 MALES
40.3
MEDIAN AGE
3.1
AVG FAMILY SIZE
2.4
AVG HOUSEHOLD SIZE
15,213
LABOR FORCE [ PEOPLE ]
62.1%
PERCENT IN LABOR FORCE
4.8%
UNEMPLOYMENT RATE
Southgate Zip Codes
Income in Southgate
Income Overview in Southgate
Per Capita Income in Southgate is $34,480, while median incomes of families and households are $78,088 and $62,792 respectively.
| Characteristic | Number | Measure |
| Per Capita Income | 29,948 | $34,480 |
| Median Family Income | 7,559 | $78,088 |
| Mean Family Income | 7,559 | $93,266 |
| Median Household Income | 12,549 | $62,792 |
| Mean Household Income | 12,549 | $79,459 |
| Income Deficit | 7,559 | $10,132 |
| Wage / Income Gap (%) | 29,948 | 19.93% |
| Wage / Income Gap ($) | 29,948 | 80.07¢ per $1 |
| Gini / Inequality Index | 29,948 | 0.41 |
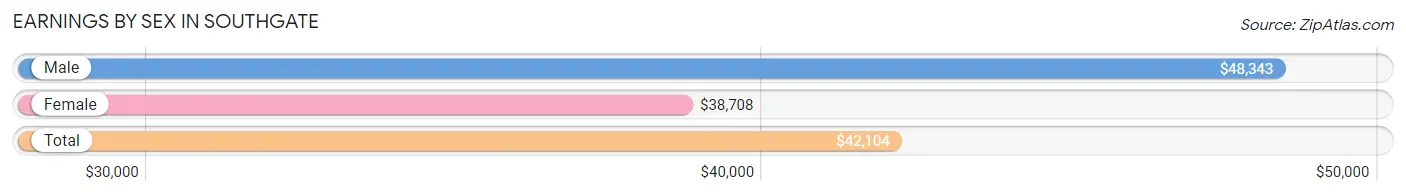
Earnings by Sex in Southgate
Average Earnings in Southgate are $42,104, $48,343 for men and $38,708 for women, a difference of 19.9%.
| Sex | Number | Average Earnings |
| Male | 7,965 (51.5%) | $48,343 |
| Female | 7,504 (48.5%) | $38,708 |
| Total | 15,469 (100.0%) | $42,104 |
Earnings by Sex by Income Bracket in Southgate
The most common earnings brackets in Southgate are $75,000 to $99,999 for men (1,117 | 14.0%) and $75,000 to $99,999 for women (754 | 10.1%).
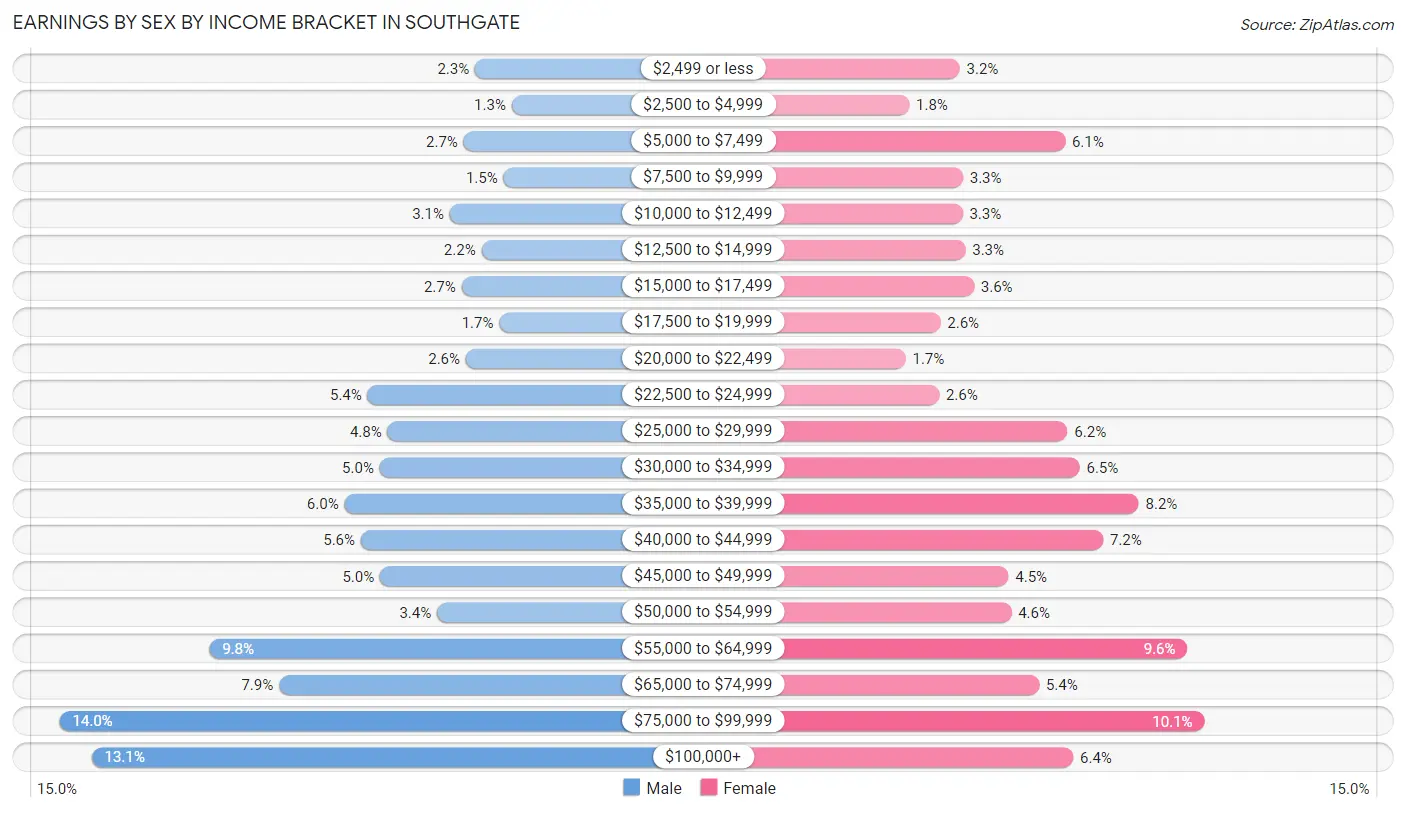
| Income | Male | Female |
| $2,499 or less | 186 (2.3%) | 238 (3.2%) |
| $2,500 to $4,999 | 104 (1.3%) | 131 (1.8%) |
| $5,000 to $7,499 | 212 (2.7%) | 460 (6.1%) |
| $7,500 to $9,999 | 123 (1.5%) | 245 (3.3%) |
| $10,000 to $12,499 | 243 (3.0%) | 244 (3.3%) |
| $12,500 to $14,999 | 172 (2.2%) | 250 (3.3%) |
| $15,000 to $17,499 | 217 (2.7%) | 268 (3.6%) |
| $17,500 to $19,999 | 132 (1.7%) | 197 (2.6%) |
| $20,000 to $22,499 | 207 (2.6%) | 124 (1.7%) |
| $22,500 to $24,999 | 427 (5.4%) | 194 (2.6%) |
| $25,000 to $29,999 | 382 (4.8%) | 465 (6.2%) |
| $30,000 to $34,999 | 400 (5.0%) | 491 (6.5%) |
| $35,000 to $39,999 | 479 (6.0%) | 615 (8.2%) |
| $40,000 to $44,999 | 442 (5.6%) | 540 (7.2%) |
| $45,000 to $49,999 | 399 (5.0%) | 341 (4.5%) |
| $50,000 to $54,999 | 272 (3.4%) | 347 (4.6%) |
| $55,000 to $64,999 | 781 (9.8%) | 718 (9.6%) |
| $65,000 to $74,999 | 625 (7.9%) | 405 (5.4%) |
| $75,000 to $99,999 | 1,117 (14.0%) | 754 (10.1%) |
| $100,000+ | 1,045 (13.1%) | 477 (6.4%) |
| Total | 7,965 (100.0%) | 7,504 (100.0%) |
Earnings by Sex by Educational Attainment in Southgate
Average earnings in Southgate are $54,933 for men and $41,560 for women, a difference of 24.3%. Men with an educational attainment of graduate degree enjoy the highest average annual earnings of $75,489, while those with less than high school education earn the least with $34,080. Women with an educational attainment of bachelor's degree earn the most with the average annual earnings of $64,583, while those with high school diploma education have the smallest earnings of $29,262.
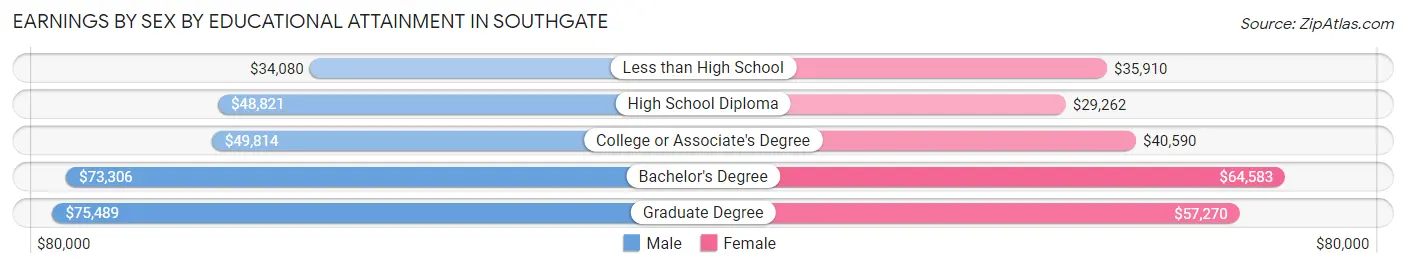
| Educational Attainment | Male Income | Female Income |
| Less than High School | $34,080 | $35,910 |
| High School Diploma | $48,821 | $29,262 |
| College or Associate's Degree | $49,814 | $40,590 |
| Bachelor's Degree | $73,306 | $64,583 |
| Graduate Degree | $75,489 | $57,270 |
| Total | $54,933 | $41,560 |
Family Income in Southgate
Family Income Brackets in Southgate
According to the Southgate family income data, there are 1,436 families falling into the $50,000 to $74,999 income range, which is the most common income bracket and makes up 19.0% of all families. Conversely, the $10,000 to $14,999 income bracket is the least frequent group with only 219 families (2.9%) belonging to this category.
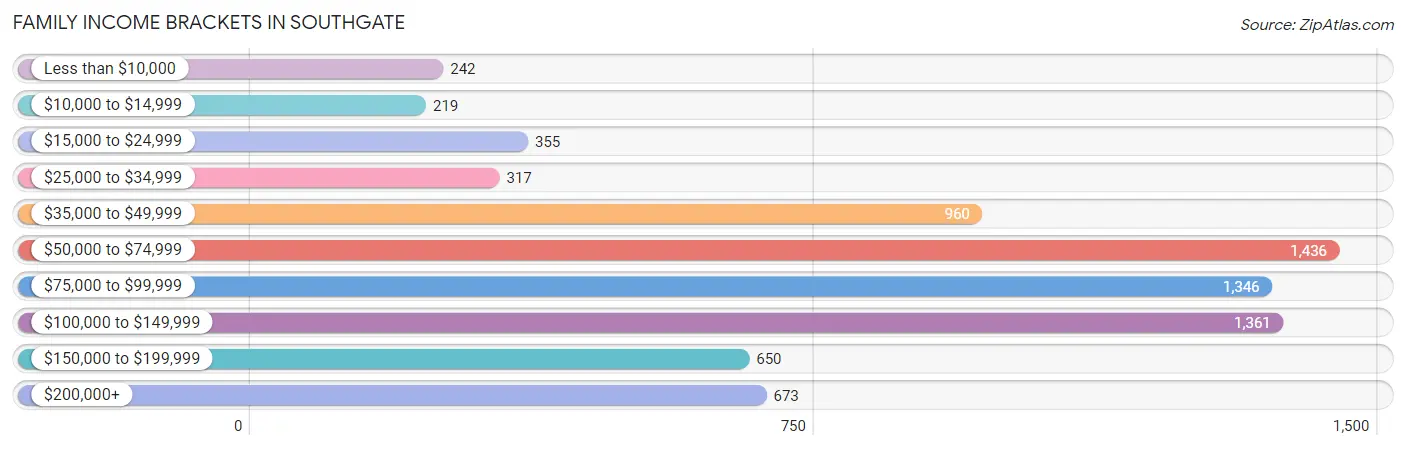
| Income Bracket | # Families | % Families |
| Less than $10,000 | 242 | 3.2% |
| $10,000 to $14,999 | 219 | 2.9% |
| $15,000 to $24,999 | 355 | 4.7% |
| $25,000 to $34,999 | 317 | 4.2% |
| $35,000 to $49,999 | 960 | 12.7% |
| $50,000 to $74,999 | 1,436 | 19.0% |
| $75,000 to $99,999 | 1,346 | 17.8% |
| $100,000 to $149,999 | 1,361 | 18.0% |
| $150,000 to $199,999 | 650 | 8.6% |
| $200,000+ | 673 | 8.9% |
Family Income by Famaliy Size in Southgate
6-person families (161 | 2.1%) account for the highest median family income in Southgate with $153,958 per family, while 2-person families (3,994 | 52.8%) have the highest median income of $31,700 per family member.

| Income Bracket | # Families | Median Income |
| 2-Person Families | 3,994 (52.8%) | $63,400 |
| 3-Person Families | 1,453 (19.2%) | $83,542 |
| 4-Person Families | 1,495 (19.8%) | $105,717 |
| 5-Person Families | 439 (5.8%) | $91,402 |
| 6-Person Families | 161 (2.1%) | $153,958 |
| 7+ Person Families | 17 (0.2%) | $0 |
| Total | 7,559 (100.0%) | $78,088 |
Family Income by Number of Earners in Southgate
The median family income in Southgate is $78,088, with families comprising 3+ earners (811) having the highest median family income of $149,125, while families with no earners (1,388) have the lowest median family income of $52,955, accounting for 10.7% and 18.4% of families, respectively.
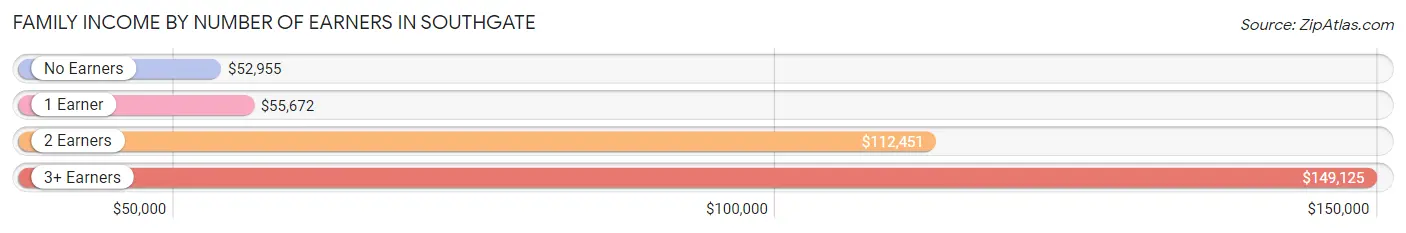
| Number of Earners | # Families | Median Income |
| No Earners | 1,388 (18.4%) | $52,955 |
| 1 Earner | 2,615 (34.6%) | $55,672 |
| 2 Earners | 2,745 (36.3%) | $112,451 |
| 3+ Earners | 811 (10.7%) | $149,125 |
| Total | 7,559 (100.0%) | $78,088 |
Household Income in Southgate
Household Income Brackets in Southgate
With 2,547 households falling in the category, the $50,000 to $74,999 income range is the most frequent in Southgate, accounting for 20.3% of all households. In contrast, only 439 households (3.5%) fall into the $10,000 to $14,999 income bracket, making it the least populous group.
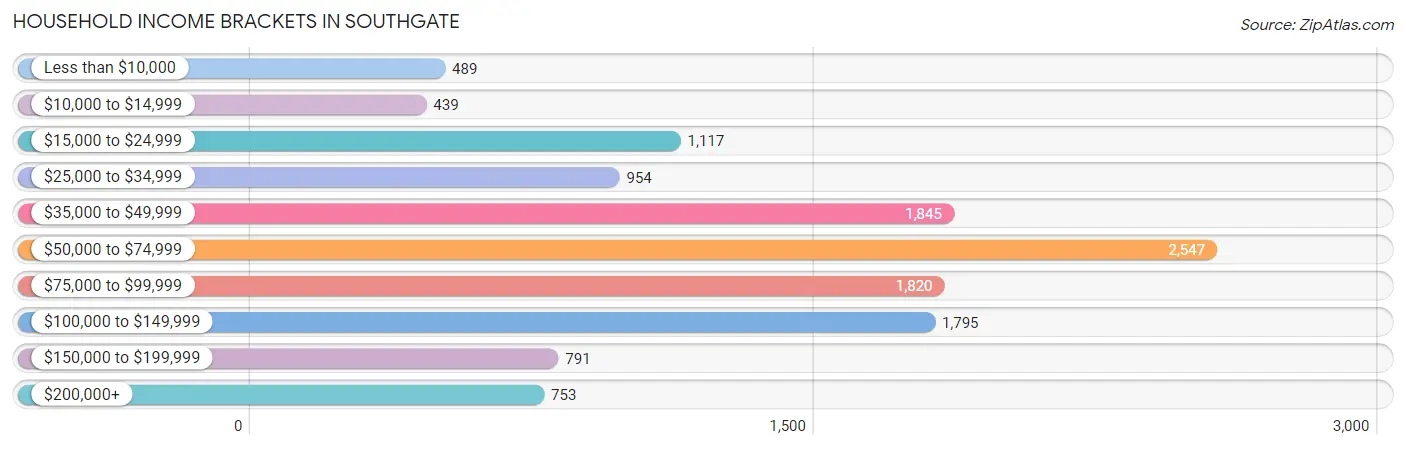
| Income Bracket | # Households | % Households |
| Less than $10,000 | 489 | 3.9% |
| $10,000 to $14,999 | 439 | 3.5% |
| $15,000 to $24,999 | 1,117 | 8.9% |
| $25,000 to $34,999 | 954 | 7.6% |
| $35,000 to $49,999 | 1,845 | 14.7% |
| $50,000 to $74,999 | 2,547 | 20.3% |
| $75,000 to $99,999 | 1,820 | 14.5% |
| $100,000 to $149,999 | 1,795 | 14.3% |
| $150,000 to $199,999 | 791 | 6.3% |
| $200,000+ | 753 | 6.0% |
Household Income by Householder Age in Southgate
The median household income in Southgate is $62,792, with the highest median household income of $86,292 found in the 45 to 64 years age bracket for the primary householder. A total of 4,256 households (33.9%) fall into this category. Meanwhile, the 15 to 24 years age bracket for the primary householder has the lowest median household income of $42,129, with 319 households (2.5%) in this group.
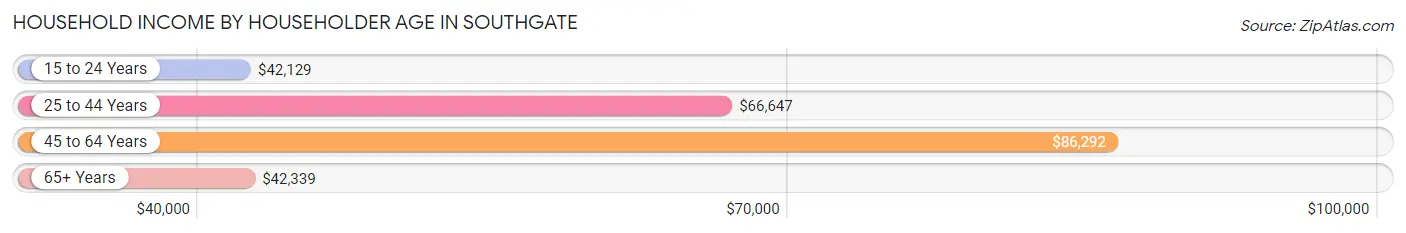
| Income Bracket | # Households | Median Income |
| 15 to 24 Years | 319 (2.5%) | $42,129 |
| 25 to 44 Years | 4,269 (34.0%) | $66,647 |
| 45 to 64 Years | 4,256 (33.9%) | $86,292 |
| 65+ Years | 3,705 (29.5%) | $42,339 |
| Total | 12,549 (100.0%) | $62,792 |
Poverty in Southgate
Income Below Poverty by Sex and Age in Southgate
With 8.1% poverty level for males and 11.3% for females among the residents of Southgate, 5 year old males and under 5 year old females are the most vulnerable to poverty, with 76 males (57.6%) and 239 females (34.8%) in their respective age groups living below the poverty level.
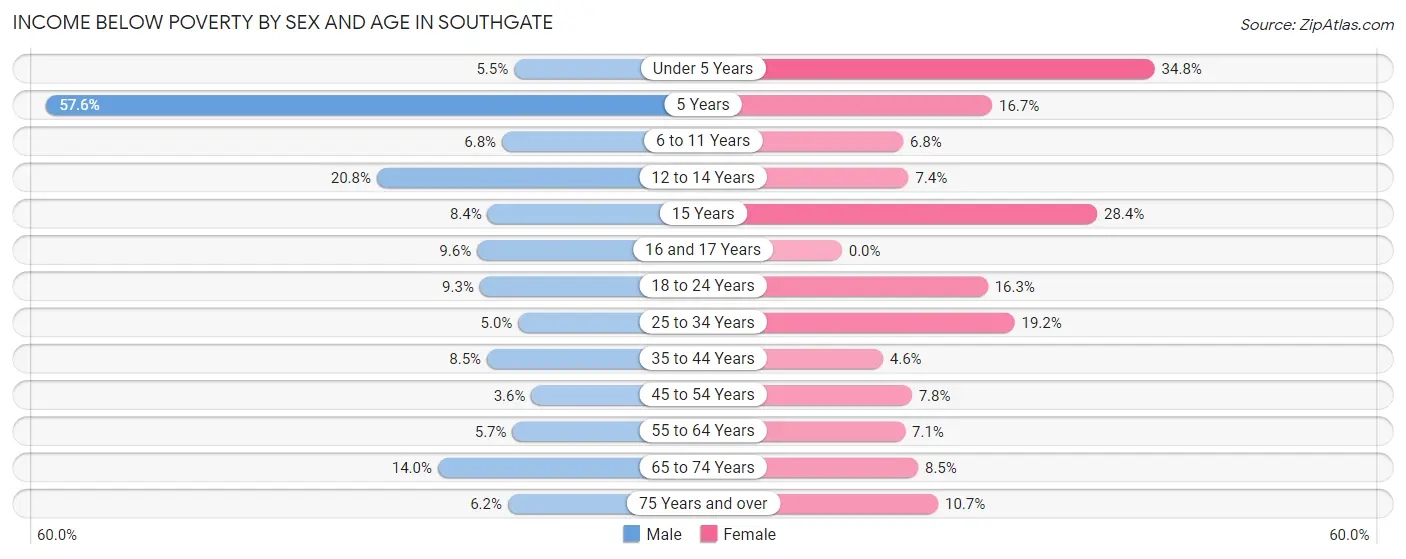
| Age Bracket | Male | Female |
| Under 5 Years | 49 (5.5%) | 239 (34.8%) |
| 5 Years | 76 (57.6%) | 45 (16.7%) |
| 6 to 11 Years | 62 (6.8%) | 69 (6.8%) |
| 12 to 14 Years | 123 (20.8%) | 40 (7.4%) |
| 15 Years | 20 (8.4%) | 29 (28.4%) |
| 16 and 17 Years | 20 (9.6%) | 0 (0.0%) |
| 18 to 24 Years | 119 (9.3%) | 156 (16.3%) |
| 25 to 34 Years | 120 (5.0%) | 465 (19.2%) |
| 35 to 44 Years | 161 (8.5%) | 87 (4.6%) |
| 45 to 54 Years | 58 (3.6%) | 150 (7.8%) |
| 55 to 64 Years | 111 (5.7%) | 144 (7.0%) |
| 65 to 74 Years | 197 (14.0%) | 143 (8.5%) |
| 75 Years and over | 66 (6.2%) | 151 (10.7%) |
| Total | 1,182 (8.1%) | 1,718 (11.3%) |
Income Above Poverty by Sex and Age in Southgate
According to the poverty statistics in Southgate, males aged 45 to 54 years and females aged 16 and 17 years are the age groups that are most secure financially, with 96.4% of males and 100.0% of females in these age groups living above the poverty line.
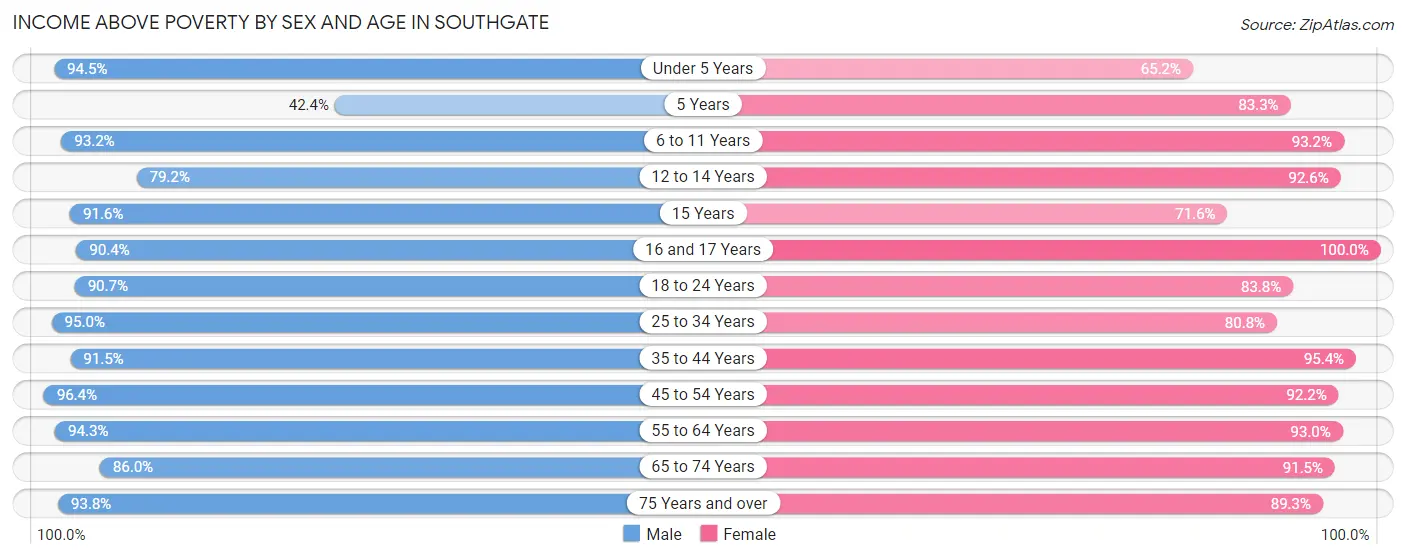
| Age Bracket | Male | Female |
| Under 5 Years | 844 (94.5%) | 447 (65.2%) |
| 5 Years | 56 (42.4%) | 224 (83.3%) |
| 6 to 11 Years | 845 (93.2%) | 943 (93.2%) |
| 12 to 14 Years | 469 (79.2%) | 498 (92.6%) |
| 15 Years | 217 (91.6%) | 73 (71.6%) |
| 16 and 17 Years | 188 (90.4%) | 262 (100.0%) |
| 18 to 24 Years | 1,159 (90.7%) | 804 (83.8%) |
| 25 to 34 Years | 2,264 (95.0%) | 1,952 (80.8%) |
| 35 to 44 Years | 1,730 (91.5%) | 1,817 (95.4%) |
| 45 to 54 Years | 1,567 (96.4%) | 1,775 (92.2%) |
| 55 to 64 Years | 1,842 (94.3%) | 1,899 (92.9%) |
| 65 to 74 Years | 1,212 (86.0%) | 1,542 (91.5%) |
| 75 Years and over | 1,000 (93.8%) | 1,257 (89.3%) |
| Total | 13,393 (91.9%) | 13,493 (88.7%) |
Income Below Poverty Among Married-Couple Families in Southgate
The poverty statistics for married-couple families in Southgate show that 3.3% or 174 of the total 5,279 families live below the poverty line. Families with 5 or more children have the highest poverty rate of 100.0%, comprising of 5 families. On the other hand, families with 1 or 2 children have the lowest poverty rate of 1.8%, which includes 30 families.
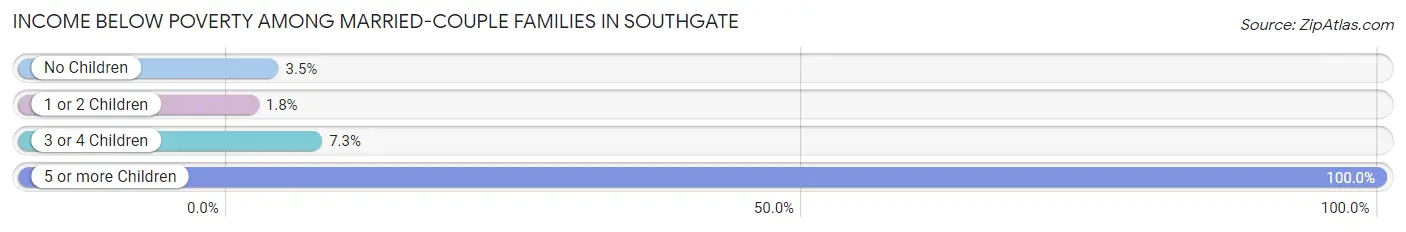
| Children | Above Poverty | Below Poverty |
| No Children | 3,200 (96.5%) | 117 (3.5%) |
| 1 or 2 Children | 1,627 (98.2%) | 30 (1.8%) |
| 3 or 4 Children | 278 (92.7%) | 22 (7.3%) |
| 5 or more Children | 0 (0.0%) | 5 (100.0%) |
| Total | 5,105 (96.7%) | 174 (3.3%) |
Income Below Poverty Among Single-Parent Households in Southgate
According to the poverty data in Southgate, 20.1% or 136 single-father households and 21.3% or 342 single-mother households are living below the poverty line. Among single-father households, those with 3 or 4 children have the highest poverty rate, with 35 households (36.8%) experiencing poverty. Likewise, among single-mother households, those with 1 or 2 children have the highest poverty rate, with 268 households (26.2%) falling below the poverty line.
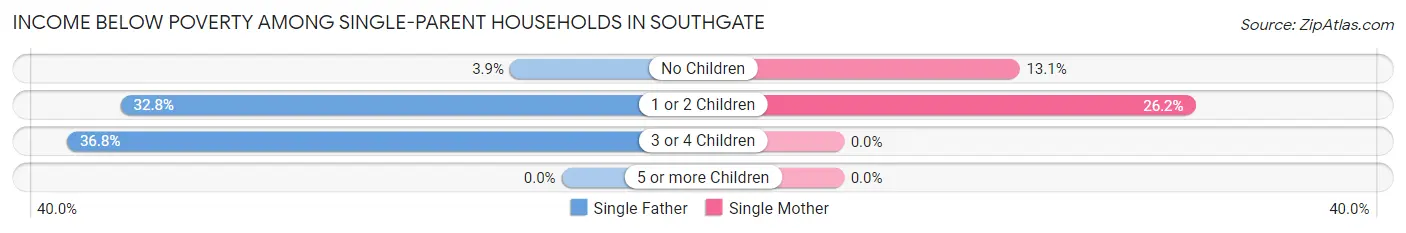
| Children | Single Father | Single Mother |
| No Children | 12 (3.8%) | 74 (13.1%) |
| 1 or 2 Children | 89 (32.8%) | 268 (26.2%) |
| 3 or 4 Children | 35 (36.8%) | 0 (0.0%) |
| 5 or more Children | 0 (0.0%) | 0 (0.0%) |
| Total | 136 (20.1%) | 342 (21.3%) |
Income Below Poverty Among Married-Couple vs Single-Parent Households in Southgate
The poverty data for Southgate shows that 174 of the married-couple family households (3.3%) and 478 of the single-parent households (21.0%) are living below the poverty level. Within the married-couple family households, those with 5 or more children have the highest poverty rate, with 5 households (100.0%) falling below the poverty line. Among the single-parent households, those with 3 or 4 children have the highest poverty rate, with 35 household (32.1%) living below poverty.
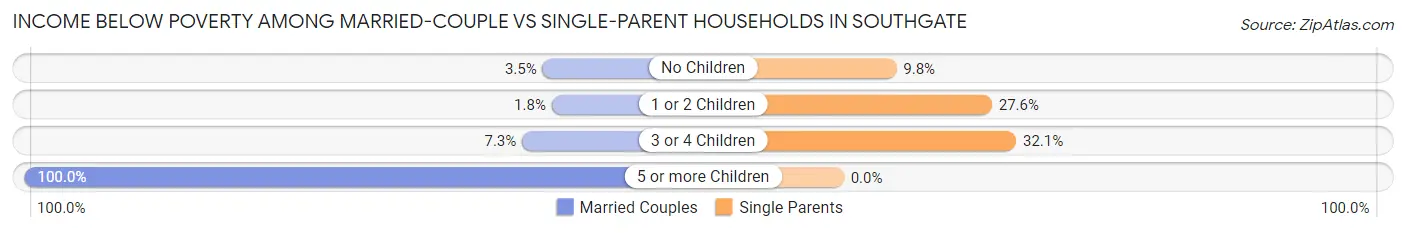
| Children | Married-Couple Families | Single-Parent Households |
| No Children | 117 (3.5%) | 86 (9.8%) |
| 1 or 2 Children | 30 (1.8%) | 357 (27.6%) |
| 3 or 4 Children | 22 (7.3%) | 35 (32.1%) |
| 5 or more Children | 5 (100.0%) | 0 (0.0%) |
| Total | 174 (3.3%) | 478 (21.0%) |
Race in Southgate
The most populous races in Southgate are White / Caucasian (23,970 | 80.0%), Hispanic or Latino (3,156 | 10.5%), and Black / African American (2,320 | 7.7%).
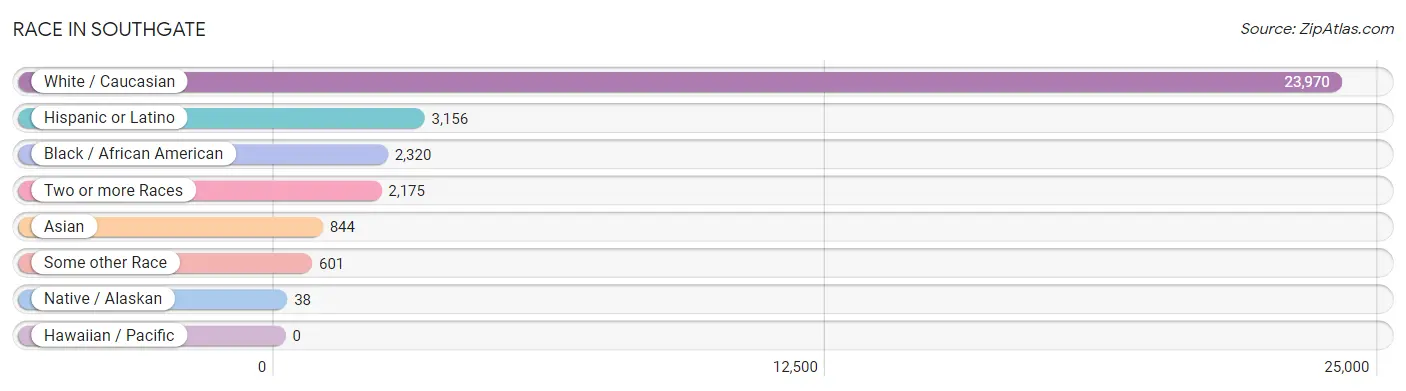
| Race | # Population | % Population |
| Asian | 844 | 2.8% |
| Black / African American | 2,320 | 7.7% |
| Hawaiian / Pacific | 0 | 0.0% |
| Hispanic or Latino | 3,156 | 10.5% |
| Native / Alaskan | 38 | 0.1% |
| White / Caucasian | 23,970 | 80.0% |
| Two or more Races | 2,175 | 7.3% |
| Some other Race | 601 | 2.0% |
| Total | 29,948 | 100.0% |
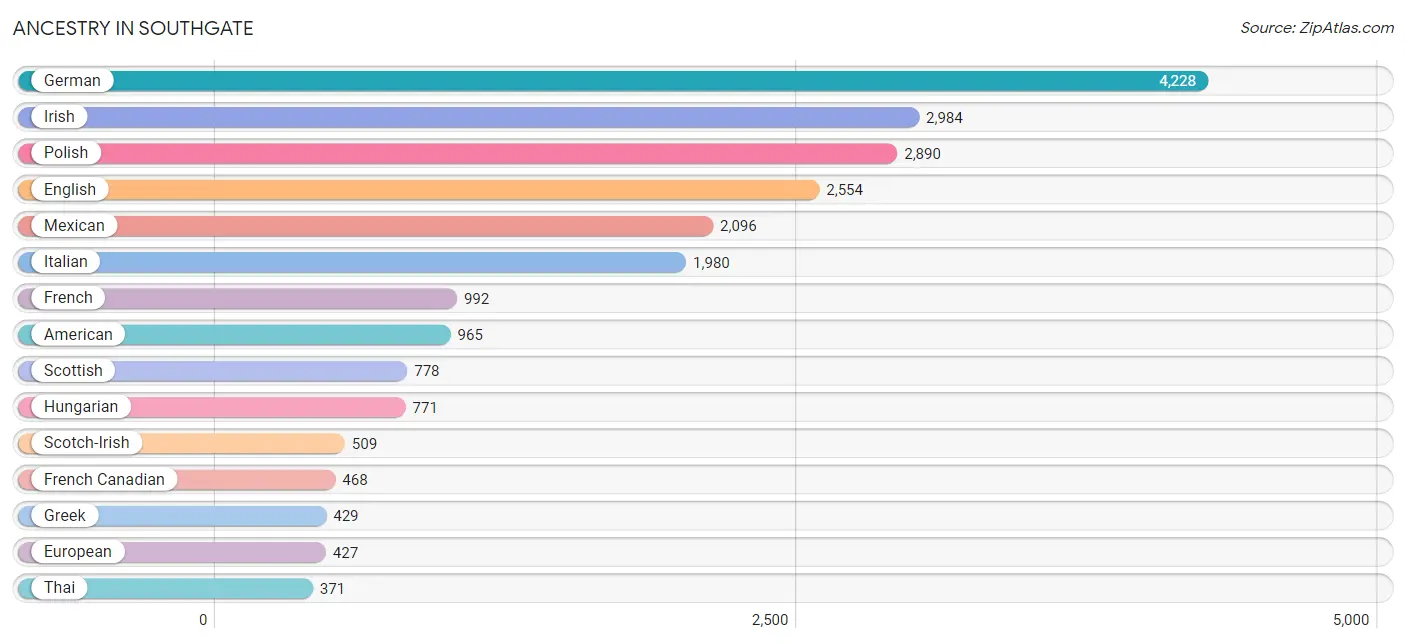
Ancestry in Southgate
The most populous ancestries reported in Southgate are German (4,228 | 14.1%), Irish (2,984 | 10.0%), Polish (2,890 | 9.7%), English (2,554 | 8.5%), and Mexican (2,096 | 7.0%), together accounting for 49.3% of all Southgate residents.
| Ancestry | # Population | % Population |
| African | 198 | 0.7% |
| Albanian | 107 | 0.4% |
| American | 965 | 3.2% |
| Arab | 213 | 0.7% |
| Armenian | 101 | 0.3% |
| Assyrian / Chaldean / Syriac | 31 | 0.1% |
| Australian | 17 | 0.1% |
| Austrian | 72 | 0.2% |
| Belgian | 68 | 0.2% |
| Bhutanese | 19 | 0.1% |
| Blackfeet | 50 | 0.2% |
| Brazilian | 49 | 0.2% |
| British | 86 | 0.3% |
| Burmese | 223 | 0.7% |
| Canadian | 42 | 0.1% |
| Central American | 78 | 0.3% |
| Cherokee | 114 | 0.4% |
| Chippewa | 4 | 0.0% |
| Colombian | 8 | 0.0% |
| Cree | 11 | 0.0% |
| Croatian | 22 | 0.1% |
| Cuban | 68 | 0.2% |
| Czech | 72 | 0.2% |
| Czechoslovakian | 17 | 0.1% |
| Danish | 34 | 0.1% |
| Dominican | 163 | 0.5% |
| Dutch | 335 | 1.1% |
| Eastern European | 60 | 0.2% |
| Ecuadorian | 78 | 0.3% |
| Egyptian | 20 | 0.1% |
| English | 2,554 | 8.5% |
| European | 427 | 1.4% |
| Finnish | 146 | 0.5% |
| French | 992 | 3.3% |
| French American Indian | 18 | 0.1% |
| French Canadian | 468 | 1.6% |
| German | 4,228 | 14.1% |
| Greek | 429 | 1.4% |
| Haitian | 17 | 0.1% |
| Hungarian | 771 | 2.6% |
| Indian (Asian) | 207 | 0.7% |
| Iranian | 41 | 0.1% |
| Irish | 2,984 | 10.0% |
| Italian | 1,980 | 6.6% |
| Korean | 126 | 0.4% |
| Lebanese | 56 | 0.2% |
| Lithuanian | 162 | 0.5% |
| Lumbee | 46 | 0.2% |
| Maltese | 173 | 0.6% |
| Mexican | 2,096 | 7.0% |
| Mexican American Indian | 1 | 0.0% |
| Northern European | 14 | 0.1% |
| Norwegian | 81 | 0.3% |
| Ottawa | 12 | 0.0% |
| Pakistani | 4 | 0.0% |
| Pennsylvania German | 26 | 0.1% |
| Polish | 2,890 | 9.7% |
| Portuguese | 42 | 0.1% |
| Potawatomi | 15 | 0.1% |
| Puerto Rican | 352 | 1.2% |
| Romanian | 111 | 0.4% |
| Russian | 287 | 1.0% |
| Salvadoran | 78 | 0.3% |
| Scandinavian | 76 | 0.3% |
| Scotch-Irish | 509 | 1.7% |
| Scottish | 778 | 2.6% |
| Serbian | 62 | 0.2% |
| Slovak | 129 | 0.4% |
| South American | 86 | 0.3% |
| Spaniard | 94 | 0.3% |
| Spanish | 213 | 0.7% |
| Sri Lankan | 74 | 0.3% |
| Subsaharan African | 205 | 0.7% |
| Swedish | 59 | 0.2% |
| Swiss | 70 | 0.2% |
| Thai | 371 | 1.2% |
| Turkish | 7 | 0.0% |
| Ukrainian | 90 | 0.3% |
| Vietnamese | 33 | 0.1% |
| Welsh | 114 | 0.4% |
| Yakama | 32 | 0.1% |
| Yugoslavian | 12 | 0.0% | View All 82 Rows |
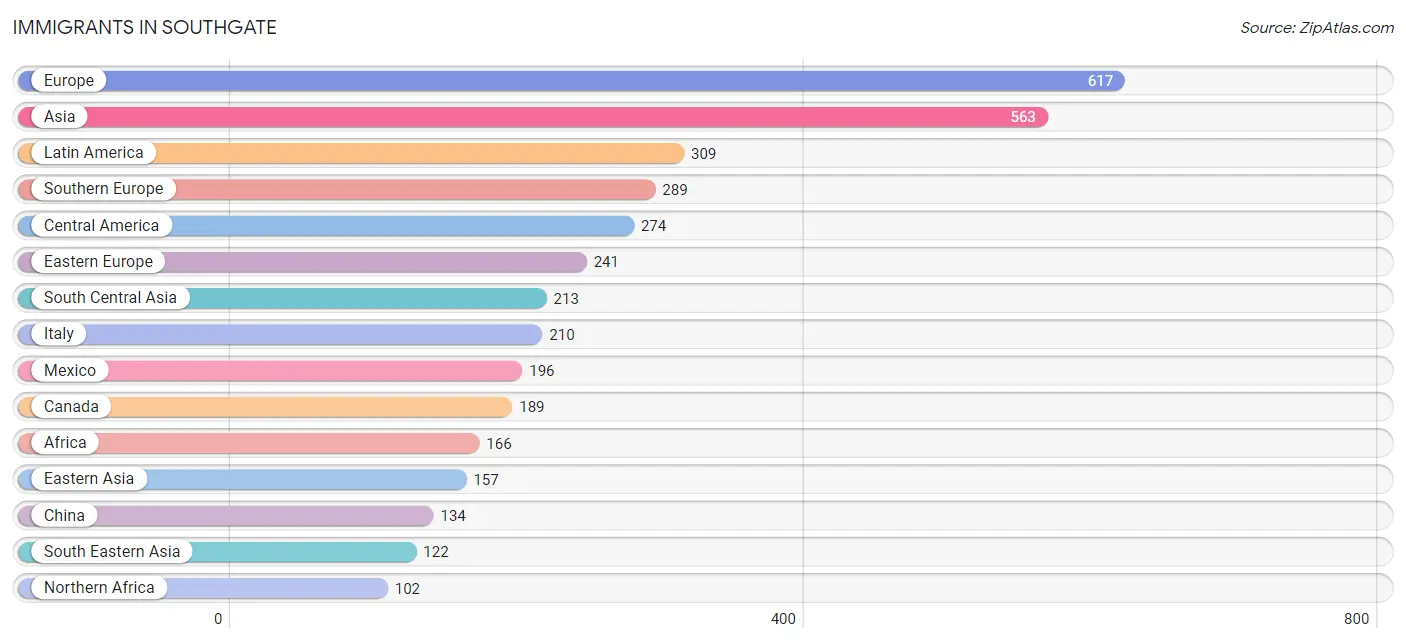
Immigrants in Southgate
The most numerous immigrant groups reported in Southgate came from Europe (617 | 2.1%), Asia (563 | 1.9%), Latin America (309 | 1.0%), Southern Europe (289 | 1.0%), and Central America (274 | 0.9%), together accounting for 6.9% of all Southgate residents.
| Immigration Origin | # Population | % Population |
| Africa | 166 | 0.5% |
| Albania | 86 | 0.3% |
| Asia | 563 | 1.9% |
| Bangladesh | 93 | 0.3% |
| Belarus | 9 | 0.0% |
| Brazil | 24 | 0.1% |
| Canada | 189 | 0.6% |
| Central America | 274 | 0.9% |
| China | 134 | 0.4% |
| Colombia | 6 | 0.0% |
| Eastern Africa | 24 | 0.1% |
| Eastern Asia | 157 | 0.5% |
| Eastern Europe | 241 | 0.8% |
| El Salvador | 78 | 0.3% |
| England | 6 | 0.0% |
| Europe | 617 | 2.1% |
| Germany | 57 | 0.2% |
| Greece | 71 | 0.2% |
| Guyana | 5 | 0.0% |
| Hungary | 13 | 0.0% |
| India | 50 | 0.2% |
| Iran | 41 | 0.1% |
| Iraq | 16 | 0.1% |
| Ireland | 11 | 0.0% |
| Israel | 10 | 0.0% |
| Italy | 210 | 0.7% |
| Jordan | 7 | 0.0% |
| Korea | 23 | 0.1% |
| Latin America | 309 | 1.0% |
| Lithuania | 67 | 0.2% |
| Mexico | 196 | 0.6% |
| Nepal | 13 | 0.0% |
| Northern Africa | 102 | 0.3% |
| Northern Europe | 30 | 0.1% |
| Pakistan | 16 | 0.1% |
| Philippines | 82 | 0.3% |
| Romania | 57 | 0.2% |
| Scotland | 7 | 0.0% |
| South America | 35 | 0.1% |
| South Central Asia | 213 | 0.7% |
| South Eastern Asia | 122 | 0.4% |
| Southern Europe | 289 | 1.0% |
| Turkey | 16 | 0.1% |
| Ukraine | 9 | 0.0% |
| Vietnam | 40 | 0.1% |
| Western Africa | 40 | 0.1% |
| Western Asia | 71 | 0.2% |
| Western Europe | 57 | 0.2% | View All 48 Rows |
Sex and Age in Southgate
Sex and Age in Southgate
The most populous age groups in Southgate are 25 to 29 Years (1,318 | 9.0%) for men and 25 to 29 Years (1,336 | 8.7%) for women.
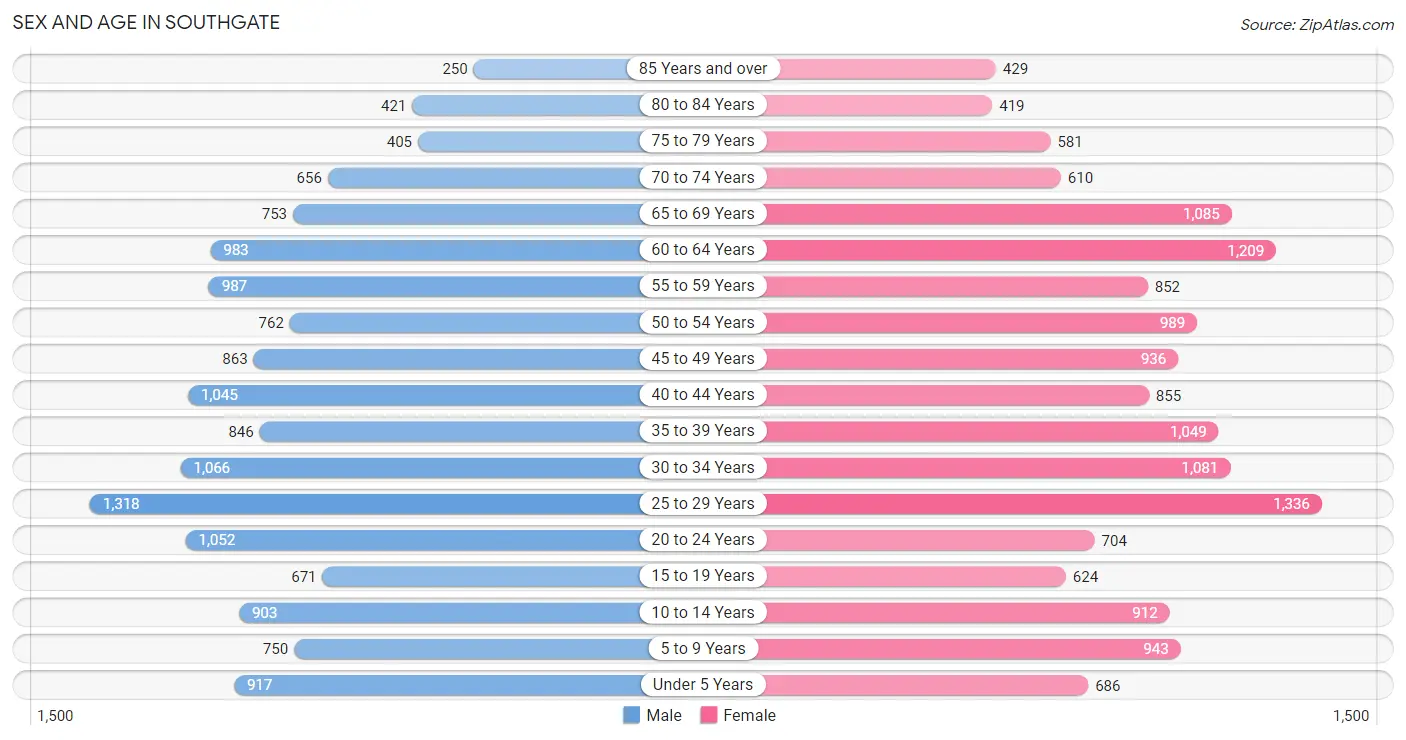
| Age Bracket | Male | Female |
| Under 5 Years | 917 (6.3%) | 686 (4.5%) |
| 5 to 9 Years | 750 (5.1%) | 943 (6.2%) |
| 10 to 14 Years | 903 (6.2%) | 912 (6.0%) |
| 15 to 19 Years | 671 (4.6%) | 624 (4.1%) |
| 20 to 24 Years | 1,052 (7.2%) | 704 (4.6%) |
| 25 to 29 Years | 1,318 (9.0%) | 1,336 (8.7%) |
| 30 to 34 Years | 1,066 (7.3%) | 1,081 (7.1%) |
| 35 to 39 Years | 846 (5.8%) | 1,049 (6.9%) |
| 40 to 44 Years | 1,045 (7.1%) | 855 (5.6%) |
| 45 to 49 Years | 863 (5.9%) | 936 (6.1%) |
| 50 to 54 Years | 762 (5.2%) | 989 (6.5%) |
| 55 to 59 Years | 987 (6.7%) | 852 (5.6%) |
| 60 to 64 Years | 983 (6.7%) | 1,209 (7.9%) |
| 65 to 69 Years | 753 (5.1%) | 1,085 (7.1%) |
| 70 to 74 Years | 656 (4.5%) | 610 (4.0%) |
| 75 to 79 Years | 405 (2.8%) | 581 (3.8%) |
| 80 to 84 Years | 421 (2.9%) | 419 (2.7%) |
| 85 Years and over | 250 (1.7%) | 429 (2.8%) |
| Total | 14,648 (100.0%) | 15,300 (100.0%) |
Families and Households in Southgate
Median Family Size in Southgate
The median family size in Southgate is 3.06 persons per family, with married-couple families (5,279 | 69.8%) accounting for the largest median family size of 3.17 persons per family. On the other hand, single female/mother families (1,602 | 21.2%) represent the smallest median family size with 2.73 persons per family.
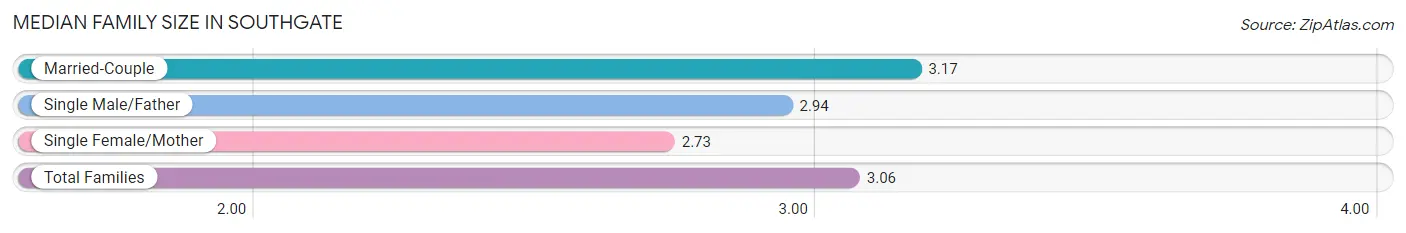
| Family Type | # Families | Family Size |
| Married-Couple | 5,279 (69.8%) | 3.17 |
| Single Male/Father | 678 (9.0%) | 2.94 |
| Single Female/Mother | 1,602 (21.2%) | 2.73 |
| Total Families | 7,559 (100.0%) | 3.06 |
Median Household Size in Southgate
The median household size in Southgate is 2.38 persons per household, with single male/father households (678 | 5.4%) accounting for the largest median household size of 3.37 persons per household. non-family households (4,990 | 39.8%) represent the smallest median household size with 1.23 persons per household.
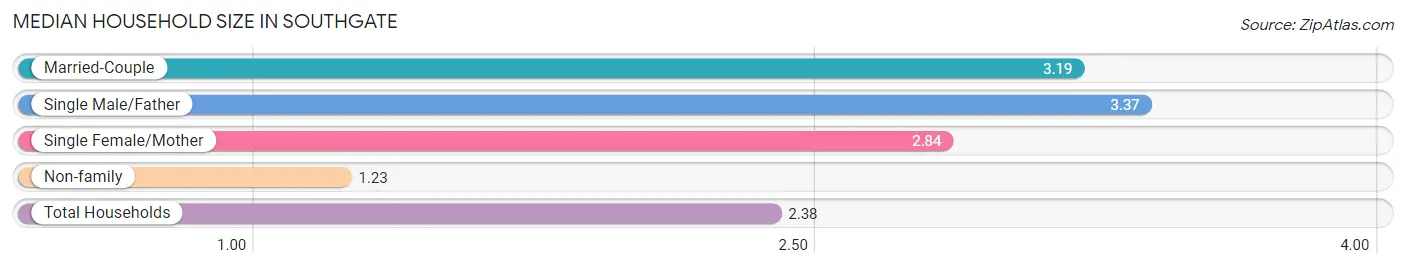
| Household Type | # Households | Household Size |
| Married-Couple | 5,279 (42.1%) | 3.19 |
| Single Male/Father | 678 (5.4%) | 3.37 |
| Single Female/Mother | 1,602 (12.8%) | 2.84 |
| Non-family | 4,990 (39.8%) | 1.23 |
| Total Households | 12,549 (100.0%) | 2.38 |
Household Size by Marriage Status in Southgate
Out of a total of 12,549 households in Southgate, 7,559 (60.2%) are family households, while 4,990 (39.8%) are nonfamily households. The most numerous type of family households are 2-person households, comprising 3,797, and the most common type of nonfamily households are 1-person households, comprising 4,084.
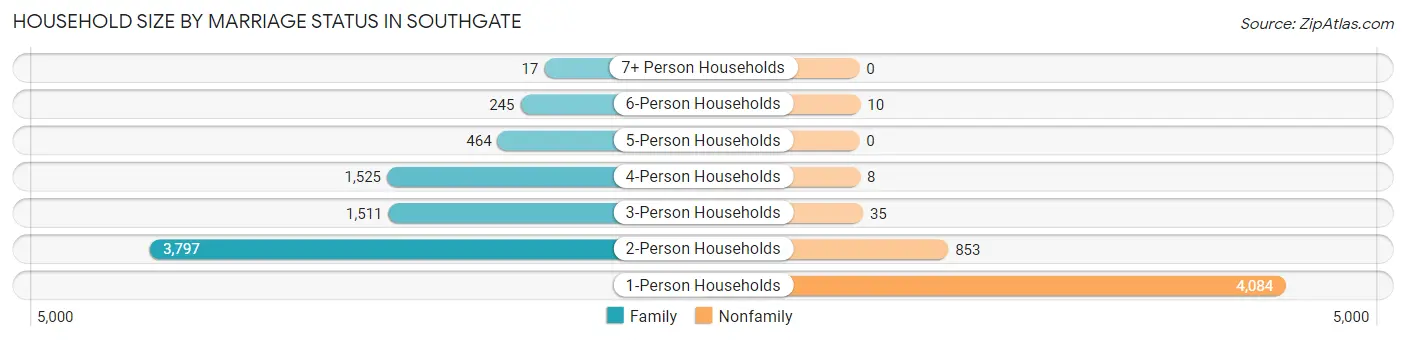
| Household Size | Family Households | Nonfamily Households |
| 1-Person Households | - | 4,084 (32.5%) |
| 2-Person Households | 3,797 (30.3%) | 853 (6.8%) |
| 3-Person Households | 1,511 (12.0%) | 35 (0.3%) |
| 4-Person Households | 1,525 (12.1%) | 8 (0.1%) |
| 5-Person Households | 464 (3.7%) | 0 (0.0%) |
| 6-Person Households | 245 (1.9%) | 10 (0.1%) |
| 7+ Person Households | 17 (0.1%) | 0 (0.0%) |
| Total | 7,559 (60.2%) | 4,990 (39.8%) |
Female Fertility in Southgate
Fertility by Age in Southgate
Average fertility rate in Southgate is 34.0 births per 1,000 women. Women in the age bracket of 20 to 34 years have the highest fertility rate with 71.0 births per 1,000 women. Women in the age bracket of 20 to 34 years acount for 96.1% of all women with births.
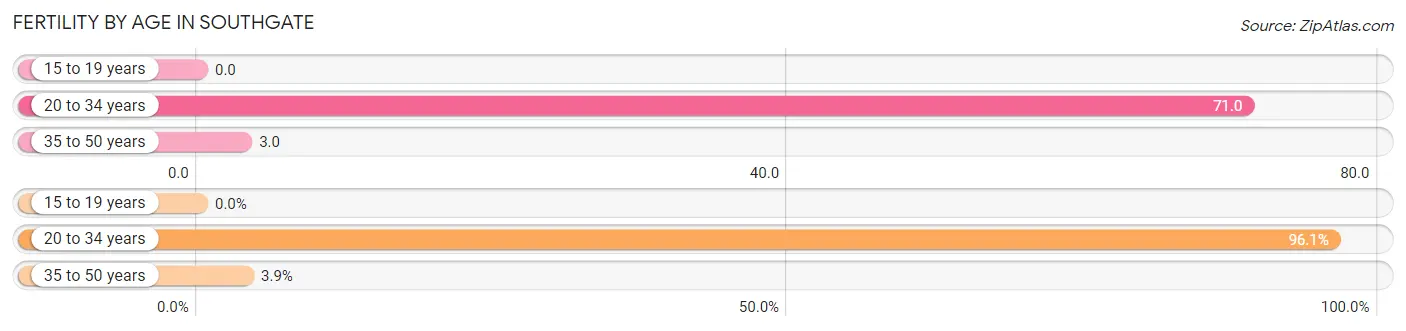
| Age Bracket | Women with Births | Births / 1,000 Women |
| 15 to 19 years | 0 (0.0%) | 0.0 |
| 20 to 34 years | 221 (96.1%) | 71.0 |
| 35 to 50 years | 9 (3.9%) | 3.0 |
| Total | 230 (100.0%) | 34.0 |
Fertility by Age by Marriage Status in Southgate
64.3% of women with births (230) in Southgate are married. The highest percentage of unmarried women with births falls into 20 to 34 years age bracket with 37.1% of them unmarried at the time of birth, while the lowest percentage of unmarried women with births belong to 35 to 50 years age bracket with 0.0% of them unmarried.
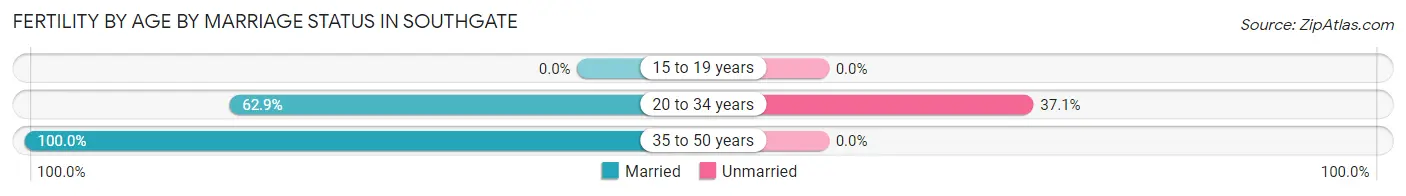
| Age Bracket | Married | Unmarried |
| 15 to 19 years | 0 (0.0%) | 0 (0.0%) |
| 20 to 34 years | 139 (62.9%) | 82 (37.1%) |
| 35 to 50 years | 9 (100.0%) | 0 (0.0%) |
| Total | 148 (64.3%) | 82 (35.6%) |
Fertility by Education in Southgate
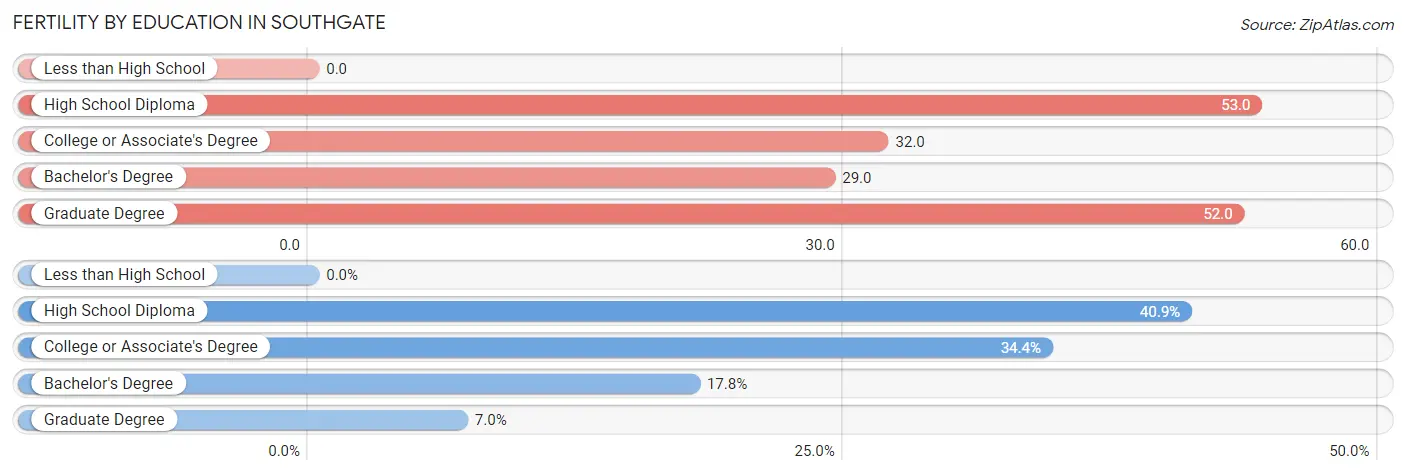
| Educational Attainment | Women with Births | Births / 1,000 Women |
| Less than High School | 0 (0.0%) | 0.0 |
| High School Diploma | 94 (40.9%) | 53.0 |
| College or Associate's Degree | 79 (34.4%) | 32.0 |
| Bachelor's Degree | 41 (17.8%) | 29.0 |
| Graduate Degree | 16 (7.0%) | 52.0 |
| Total | 230 (100.0%) | 34.0 |
Fertility by Education by Marriage Status in Southgate
35.6% of women with births in Southgate are unmarried. Women with the educational attainment of bachelor's degree are most likely to be married with 100.0% of them married at childbirth, while women with the educational attainment of high school diploma are least likely to be married with 79.8% of them unmarried at childbirth.
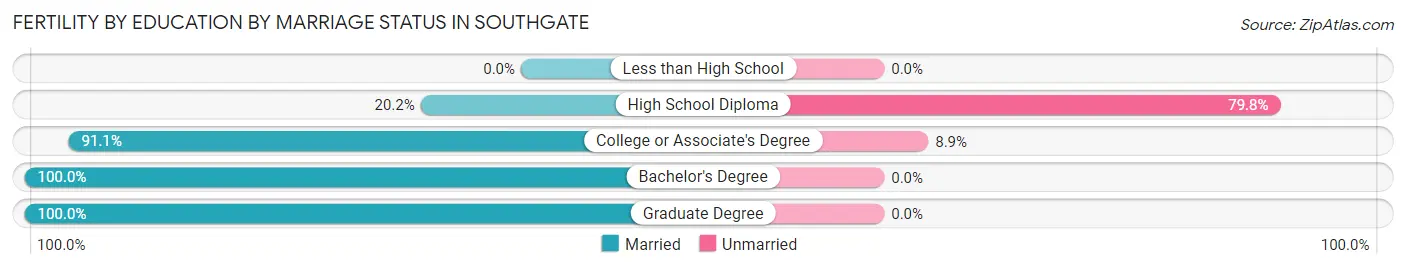
| Educational Attainment | Married | Unmarried |
| Less than High School | 0 (0.0%) | 0 (0.0%) |
| High School Diploma | 19 (20.2%) | 75 (79.8%) |
| College or Associate's Degree | 72 (91.1%) | 7 (8.9%) |
| Bachelor's Degree | 41 (100.0%) | 0 (0.0%) |
| Graduate Degree | 16 (100.0%) | 0 (0.0%) |
| Total | 148 (64.3%) | 82 (35.6%) |
Employment Characteristics in Southgate
Employment by Class of Employer in Southgate
Among the 14,222 employed individuals in Southgate, private company employees (10,919 | 76.8%), not-for-profit organizations (1,318 | 9.3%), and local government employees (745 | 5.2%) make up the most common classes of employment.
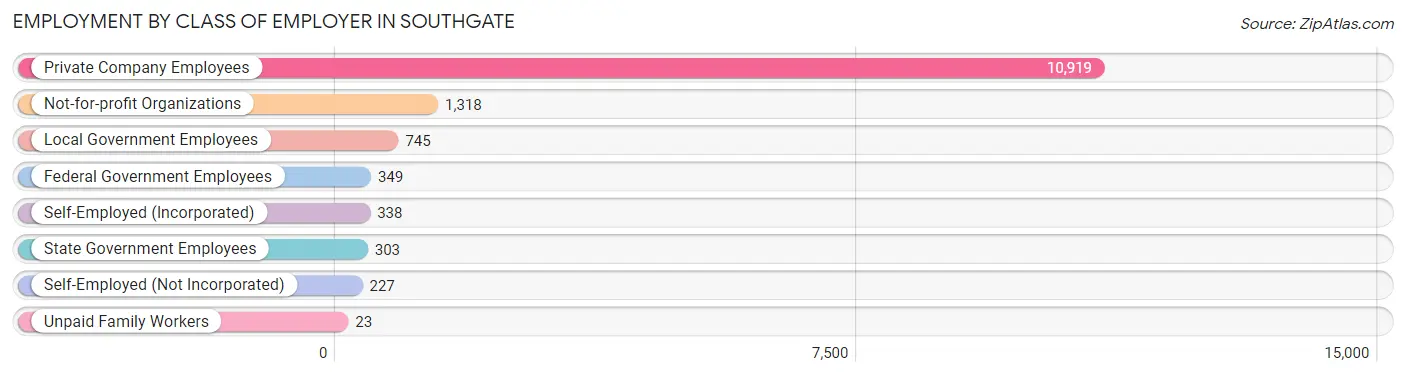
| Employer Class | # Employees | % Employees |
| Private Company Employees | 10,919 | 76.8% |
| Self-Employed (Incorporated) | 338 | 2.4% |
| Self-Employed (Not Incorporated) | 227 | 1.6% |
| Not-for-profit Organizations | 1,318 | 9.3% |
| Local Government Employees | 745 | 5.2% |
| State Government Employees | 303 | 2.1% |
| Federal Government Employees | 349 | 2.5% |
| Unpaid Family Workers | 23 | 0.2% |
| Total | 14,222 | 100.0% |
Employment Status by Age in Southgate
According to the labor force statistics for Southgate, out of the total population over 16 years of age (24,498), 62.1% or 15,213 individuals are in the labor force, with 4.8% or 730 of them unemployed. The age group with the highest labor force participation rate is 30 to 34 years, with 90.4% or 1,941 individuals in the labor force. Within the labor force, the 75 years and over age range has the highest percentage of unemployed individuals, with 27.5% or 36 of them being unemployed.
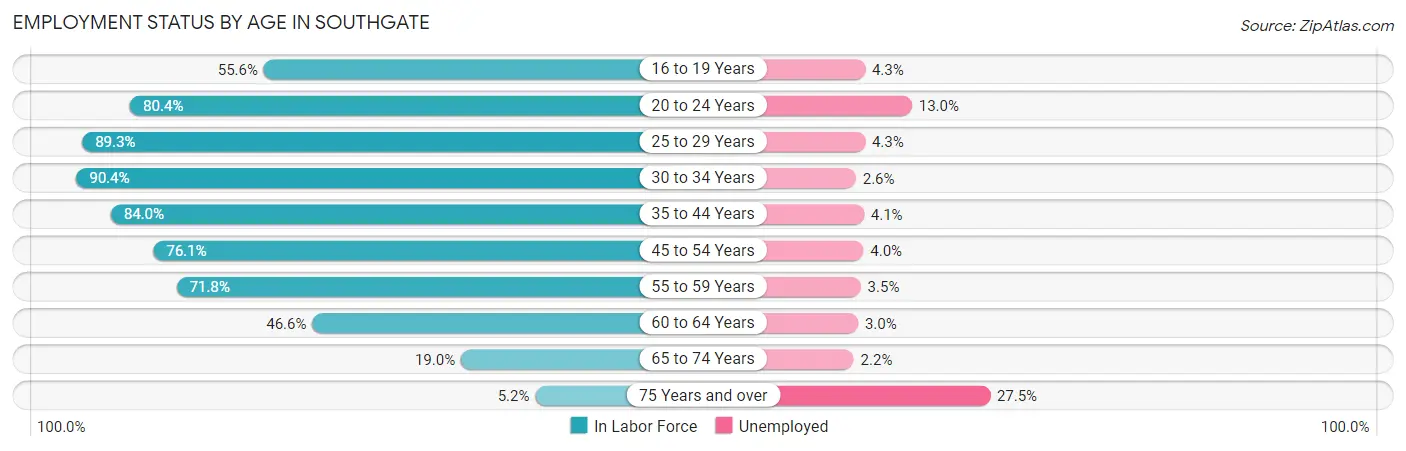
| Age Bracket | In Labor Force | Unemployed |
| 16 to 19 Years | 532 (55.6%) | 23 (4.3%) |
| 20 to 24 Years | 1,412 (80.4%) | 184 (13.0%) |
| 25 to 29 Years | 2,370 (89.3%) | 102 (4.3%) |
| 30 to 34 Years | 1,941 (90.4%) | 50 (2.6%) |
| 35 to 44 Years | 3,188 (84.0%) | 131 (4.1%) |
| 45 to 54 Years | 2,702 (76.1%) | 108 (4.0%) |
| 55 to 59 Years | 1,320 (71.8%) | 46 (3.5%) |
| 60 to 64 Years | 1,021 (46.6%) | 31 (3.0%) |
| 65 to 74 Years | 590 (19.0%) | 13 (2.2%) |
| 75 Years and over | 130 (5.2%) | 36 (27.5%) |
| Total | 15,213 (62.1%) | 730 (4.8%) |
Employment Status by Educational Attainment in Southgate
According to labor force statistics for Southgate, 77.5% of individuals (12,537) out of the total population between 25 and 64 years of age (16,177) are in the labor force, with 3.7% or 464 of them being unemployed. The group with the highest labor force participation rate are those with the educational attainment of bachelor's degree or higher, with 87.7% or 3,338 individuals in the labor force. Within the labor force, individuals with less than high school education have the highest percentage of unemployment, with 13.7% or 88 of them being unemployed.
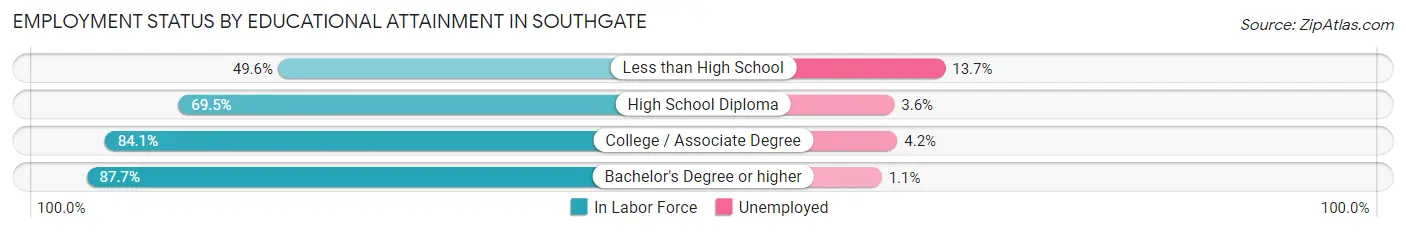
| Educational Attainment | In Labor Force | Unemployed |
| Less than High School | 641 (49.6%) | 177 (13.7%) |
| High School Diploma | 3,569 (69.5%) | 185 (3.6%) |
| College / Associate Degree | 4,999 (84.1%) | 250 (4.2%) |
| Bachelor's Degree or higher | 3,338 (87.7%) | 42 (1.1%) |
| Total | 12,537 (77.5%) | 599 (3.7%) |
Employment Occupations by Sex in Southgate
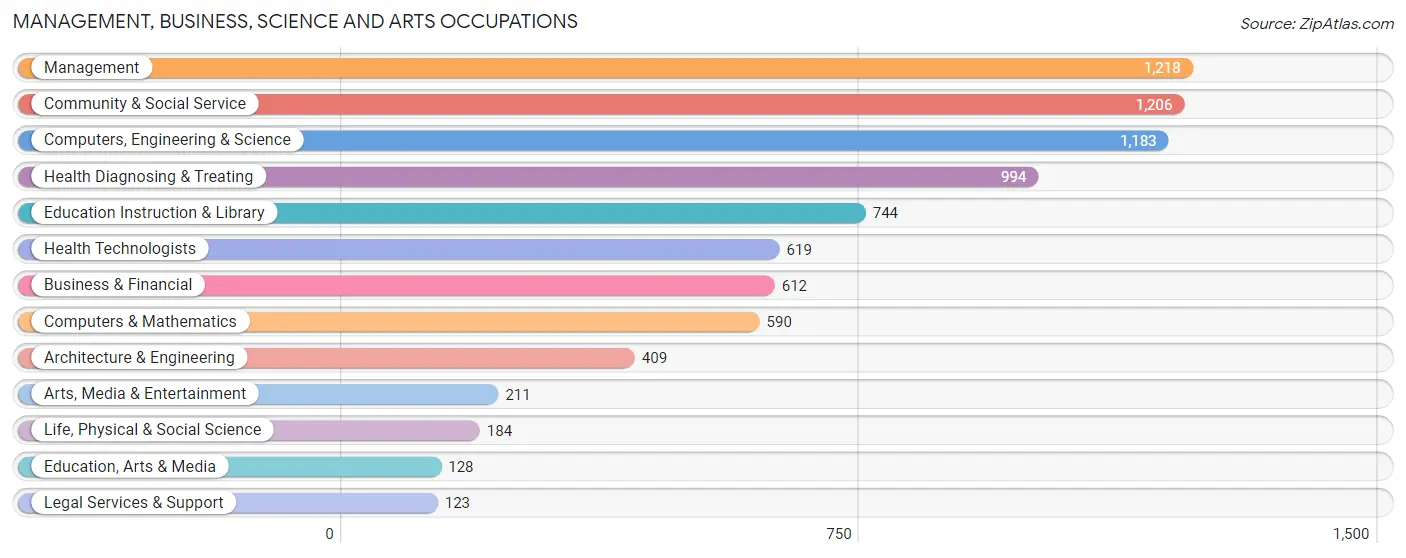
Management, Business, Science and Arts Occupations
The most common Management, Business, Science and Arts occupations in Southgate are Management (1,218 | 8.4%), Community & Social Service (1,206 | 8.3%), Computers, Engineering & Science (1,183 | 8.2%), Health Diagnosing & Treating (994 | 6.9%), and Education Instruction & Library (744 | 5.1%).
Management, Business, Science and Arts Occupations by Sex
Within the Management, Business, Science and Arts occupations in Southgate, the most male-oriented occupations are Architecture & Engineering (89.2%), Legal Services & Support (84.6%), and Arts, Media & Entertainment (65.4%), while the most female-oriented occupations are Education, Arts & Media (93.0%), Health Diagnosing & Treating (79.6%), and Education Instruction & Library (78.4%).
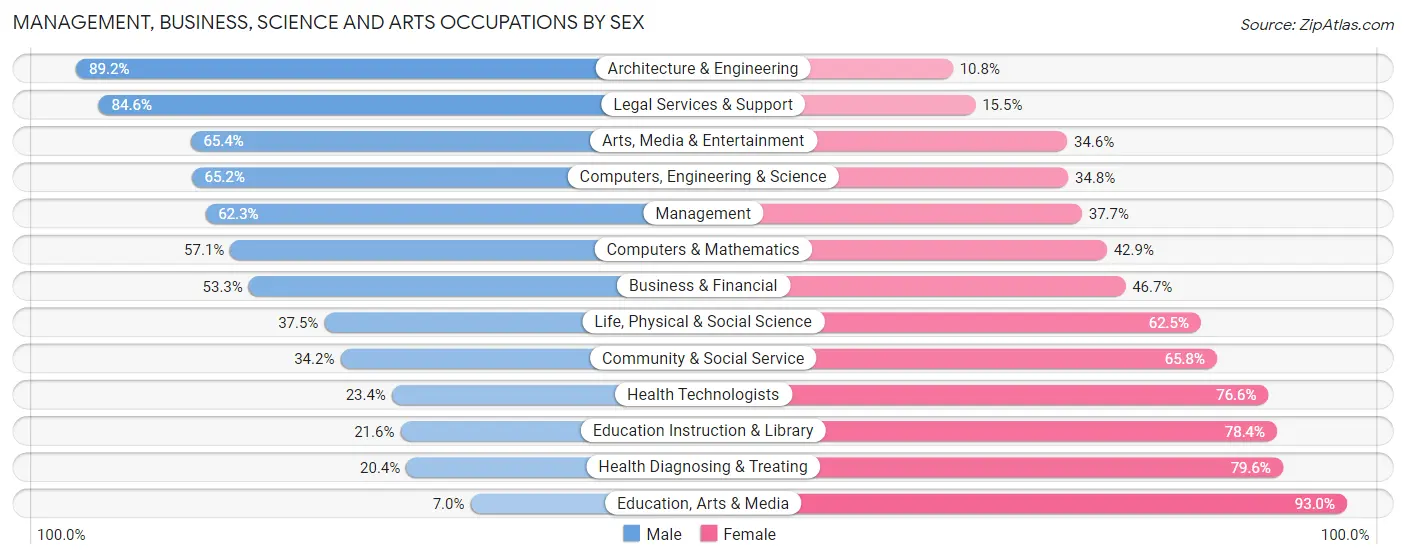
| Occupation | Male | Female |
| Management | 759 (62.3%) | 459 (37.7%) |
| Business & Financial | 326 (53.3%) | 286 (46.7%) |
| Computers, Engineering & Science | 771 (65.2%) | 412 (34.8%) |
| Computers & Mathematics | 337 (57.1%) | 253 (42.9%) |
| Architecture & Engineering | 365 (89.2%) | 44 (10.8%) |
| Life, Physical & Social Science | 69 (37.5%) | 115 (62.5%) |
| Community & Social Service | 412 (34.2%) | 794 (65.8%) |
| Education, Arts & Media | 9 (7.0%) | 119 (93.0%) |
| Legal Services & Support | 104 (84.6%) | 19 (15.4%) |
| Education Instruction & Library | 161 (21.6%) | 583 (78.4%) |
| Arts, Media & Entertainment | 138 (65.4%) | 73 (34.6%) |
| Health Diagnosing & Treating | 203 (20.4%) | 791 (79.6%) |
| Health Technologists | 145 (23.4%) | 474 (76.6%) |
| Total (Category) | 2,471 (47.4%) | 2,742 (52.6%) |
| Total (Overall) | 7,519 (51.9%) | 6,966 (48.1%) |
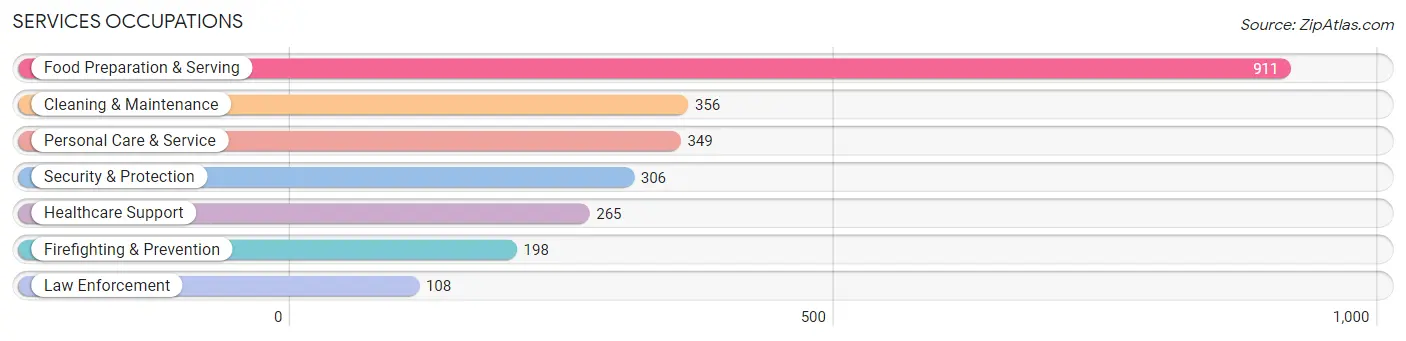
Services Occupations
The most common Services occupations in Southgate are Food Preparation & Serving (911 | 6.3%), Cleaning & Maintenance (356 | 2.5%), Personal Care & Service (349 | 2.4%), Security & Protection (306 | 2.1%), and Healthcare Support (265 | 1.8%).
Services Occupations by Sex
Within the Services occupations in Southgate, the most male-oriented occupations are Law Enforcement (100.0%), Security & Protection (87.6%), and Firefighting & Prevention (80.8%), while the most female-oriented occupations are Healthcare Support (100.0%), Personal Care & Service (70.2%), and Cleaning & Maintenance (51.7%).
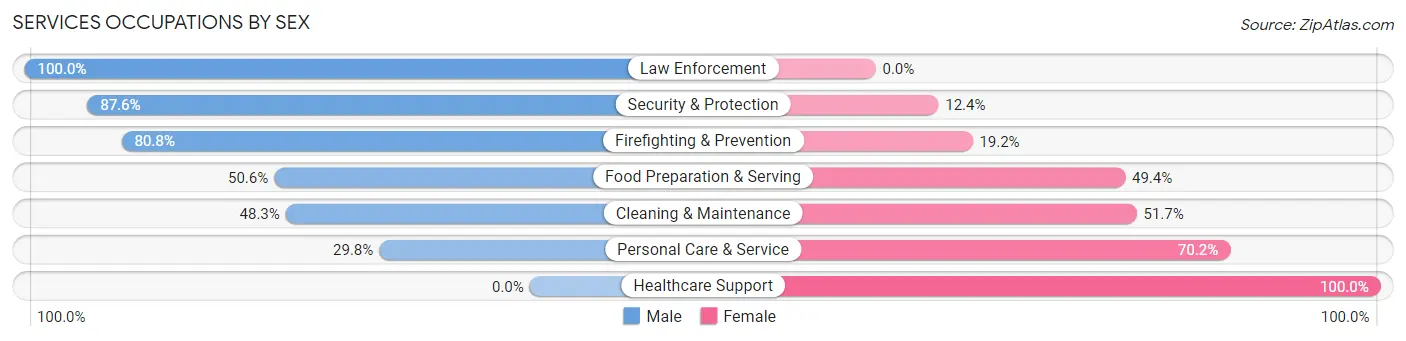
| Occupation | Male | Female |
| Healthcare Support | 0 (0.0%) | 265 (100.0%) |
| Security & Protection | 268 (87.6%) | 38 (12.4%) |
| Firefighting & Prevention | 160 (80.8%) | 38 (19.2%) |
| Law Enforcement | 108 (100.0%) | 0 (0.0%) |
| Food Preparation & Serving | 461 (50.6%) | 450 (49.4%) |
| Cleaning & Maintenance | 172 (48.3%) | 184 (51.7%) |
| Personal Care & Service | 104 (29.8%) | 245 (70.2%) |
| Total (Category) | 1,005 (46.0%) | 1,182 (54.0%) |
| Total (Overall) | 7,519 (51.9%) | 6,966 (48.1%) |
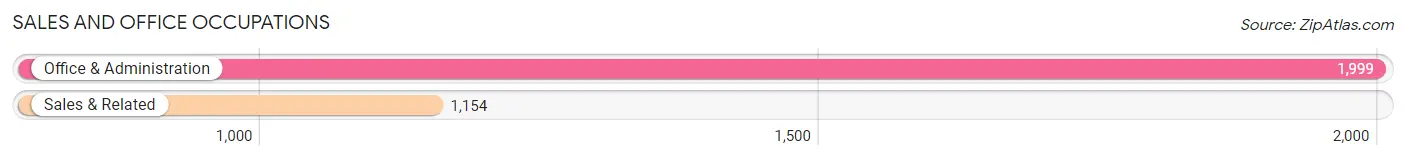
Sales and Office Occupations
The most common Sales and Office occupations in Southgate are Office & Administration (1,999 | 13.8%), and Sales & Related (1,154 | 8.0%).
Sales and Office Occupations by Sex
| Occupation | Male | Female |
| Sales & Related | 371 (32.2%) | 783 (67.8%) |
| Office & Administration | 458 (22.9%) | 1,541 (77.1%) |
| Total (Category) | 829 (26.3%) | 2,324 (73.7%) |
| Total (Overall) | 7,519 (51.9%) | 6,966 (48.1%) |
Natural Resources, Construction and Maintenance Occupations
The most common Natural Resources, Construction and Maintenance occupations in Southgate are Installation, Maintenance & Repair (541 | 3.7%), and Construction & Extraction (496 | 3.4%).
Natural Resources, Construction and Maintenance Occupations by Sex
| Occupation | Male | Female |
| Farming, Fishing & Forestry | 0 (0.0%) | 0 (0.0%) |
| Construction & Extraction | 484 (97.6%) | 12 (2.4%) |
| Installation, Maintenance & Repair | 526 (97.2%) | 15 (2.8%) |
| Total (Category) | 1,010 (97.4%) | 27 (2.6%) |
| Total (Overall) | 7,519 (51.9%) | 6,966 (48.1%) |
Production, Transportation and Moving Occupations
The most common Production, Transportation and Moving occupations in Southgate are Production (1,538 | 10.6%), Material Moving (687 | 4.7%), and Transportation (670 | 4.6%).
Production, Transportation and Moving Occupations by Sex
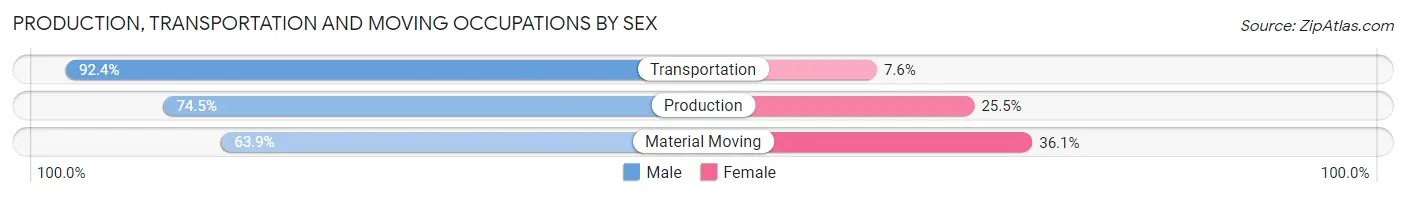
| Occupation | Male | Female |
| Production | 1,146 (74.5%) | 392 (25.5%) |
| Transportation | 619 (92.4%) | 51 (7.6%) |
| Material Moving | 439 (63.9%) | 248 (36.1%) |
| Total (Category) | 2,204 (76.1%) | 691 (23.9%) |
| Total (Overall) | 7,519 (51.9%) | 6,966 (48.1%) |
Employment Industries by Sex in Southgate
Employment Industries in Southgate
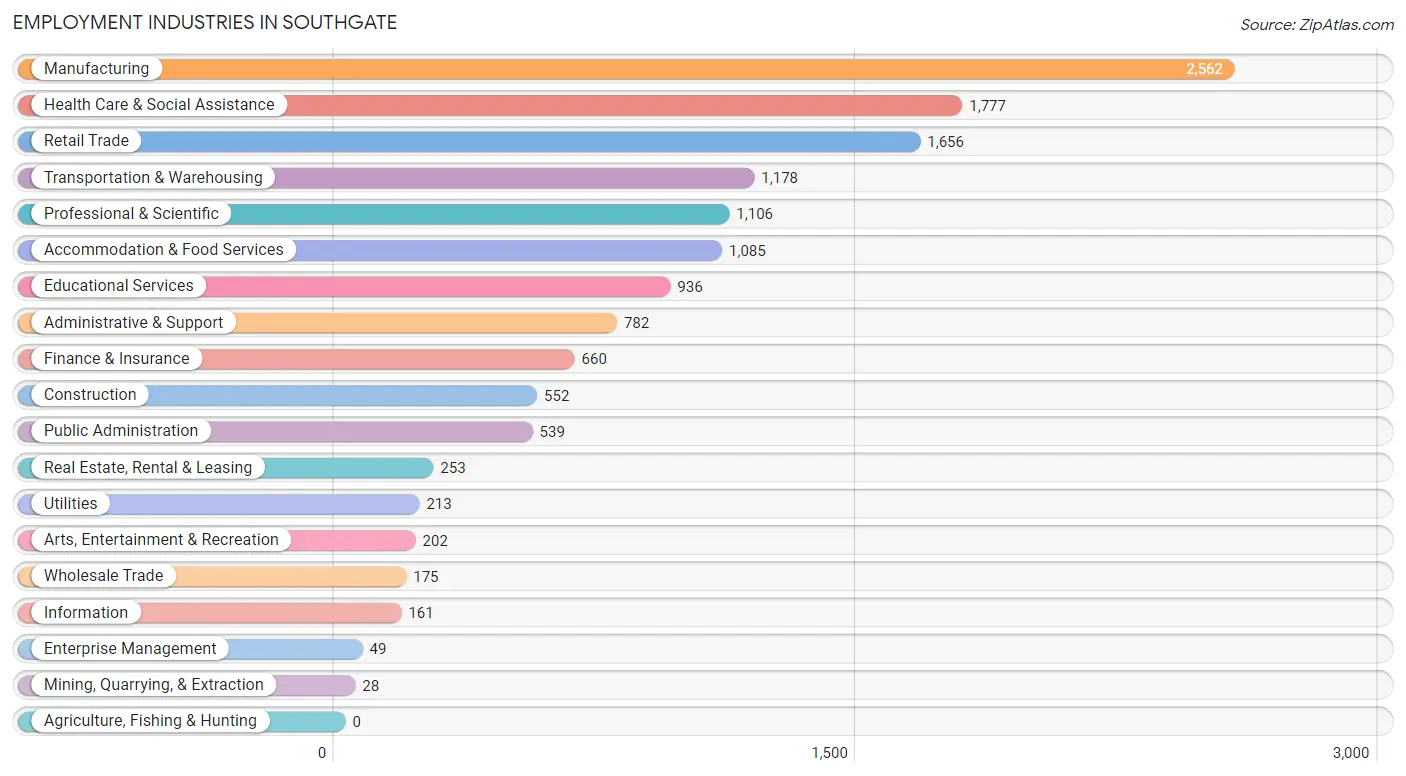
The major employment industries in Southgate include Manufacturing (2,562 | 17.7%), Health Care & Social Assistance (1,777 | 12.3%), Retail Trade (1,656 | 11.4%), Transportation & Warehousing (1,178 | 8.1%), and Professional & Scientific (1,106 | 7.6%).
Employment Industries by Sex in Southgate
The Southgate industries that see more men than women are Mining, Quarrying, & Extraction (100.0%), Construction (93.3%), and Utilities (91.5%), whereas the industries that tend to have a higher number of women are Educational Services (78.9%), Health Care & Social Assistance (78.3%), and Real Estate, Rental & Leasing (73.1%).
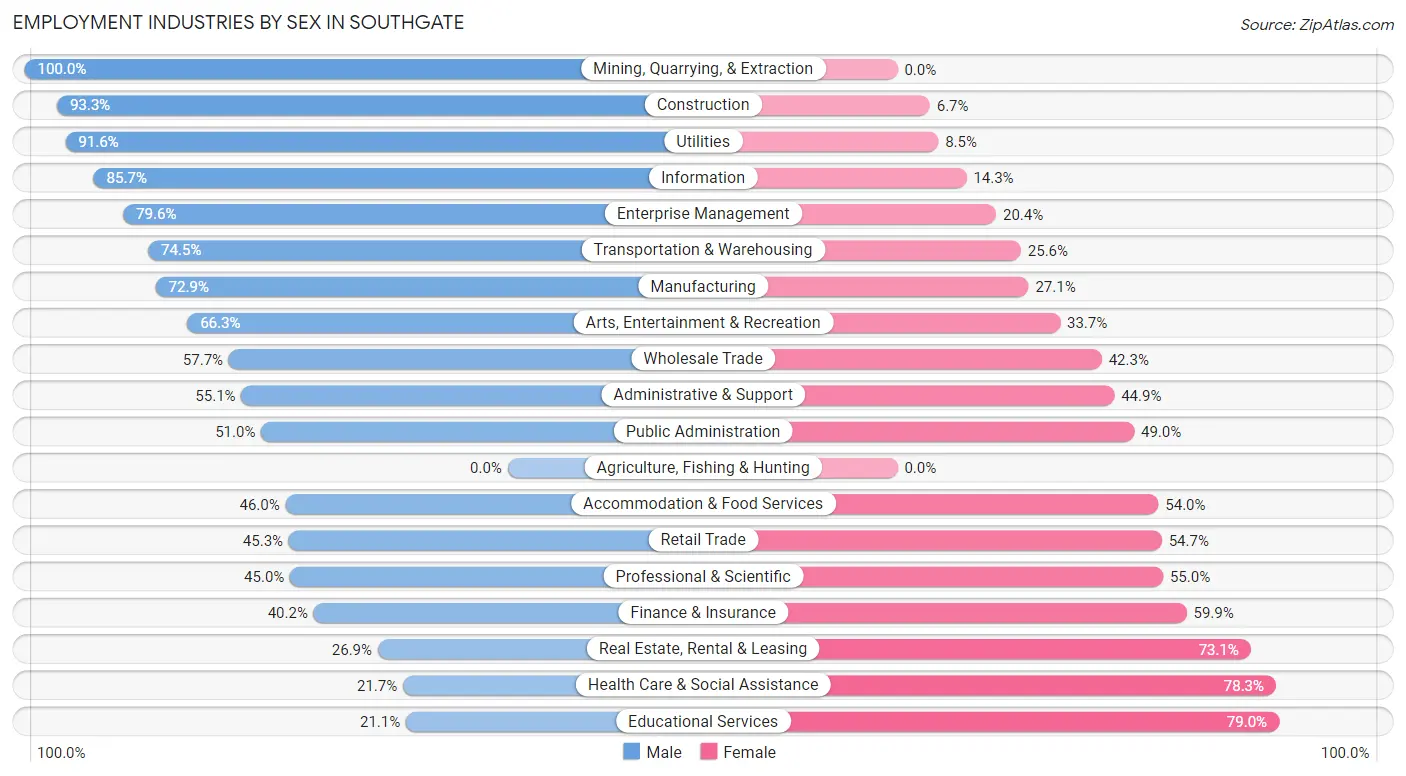
| Industry | Male | Female |
| Agriculture, Fishing & Hunting | 0 (0.0%) | 0 (0.0%) |
| Mining, Quarrying, & Extraction | 28 (100.0%) | 0 (0.0%) |
| Construction | 515 (93.3%) | 37 (6.7%) |
| Manufacturing | 1,867 (72.9%) | 695 (27.1%) |
| Wholesale Trade | 101 (57.7%) | 74 (42.3%) |
| Retail Trade | 750 (45.3%) | 906 (54.7%) |
| Transportation & Warehousing | 877 (74.5%) | 301 (25.6%) |
| Utilities | 195 (91.5%) | 18 (8.5%) |
| Information | 138 (85.7%) | 23 (14.3%) |
| Finance & Insurance | 265 (40.2%) | 395 (59.9%) |
| Real Estate, Rental & Leasing | 68 (26.9%) | 185 (73.1%) |
| Professional & Scientific | 498 (45.0%) | 608 (55.0%) |
| Enterprise Management | 39 (79.6%) | 10 (20.4%) |
| Administrative & Support | 431 (55.1%) | 351 (44.9%) |
| Educational Services | 197 (21.0%) | 739 (78.9%) |
| Health Care & Social Assistance | 385 (21.7%) | 1,392 (78.3%) |
| Arts, Entertainment & Recreation | 134 (66.3%) | 68 (33.7%) |
| Accommodation & Food Services | 499 (46.0%) | 586 (54.0%) |
| Public Administration | 275 (51.0%) | 264 (49.0%) |
| Total | 7,519 (51.9%) | 6,966 (48.1%) |
Education in Southgate
School Enrollment in Southgate
The most common levels of schooling among the 6,544 students in Southgate are middle school (1,443 | 22.1%), high school (1,286 | 19.7%), and college / undergraduate (1,261 | 19.3%).
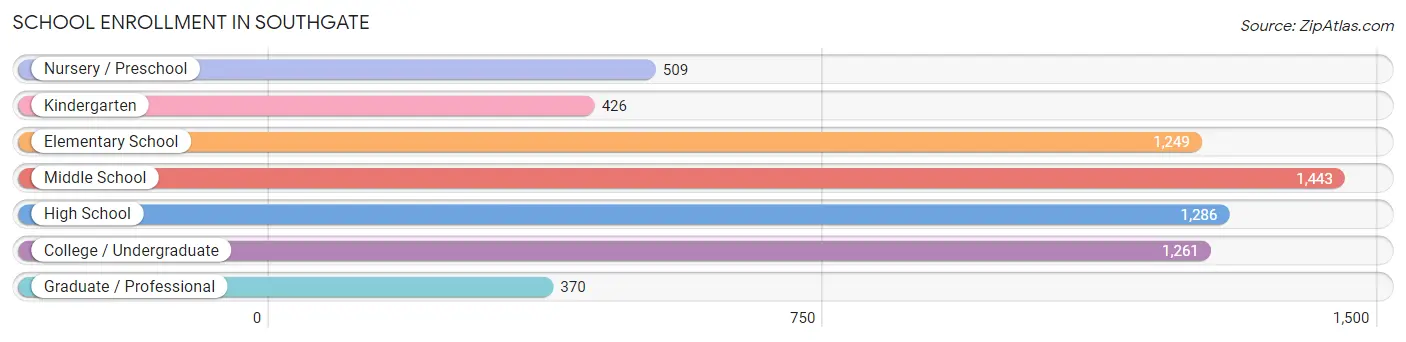
| School Level | # Students | % Students |
| Nursery / Preschool | 509 | 7.8% |
| Kindergarten | 426 | 6.5% |
| Elementary School | 1,249 | 19.1% |
| Middle School | 1,443 | 22.1% |
| High School | 1,286 | 19.7% |
| College / Undergraduate | 1,261 | 19.3% |
| Graduate / Professional | 370 | 5.7% |
| Total | 6,544 | 100.0% |
School Enrollment by Age by Funding Source in Southgate
Out of a total of 6,544 students who are enrolled in schools in Southgate, 1,211 (18.5%) attend a private institution, while the remaining 5,333 (81.5%) are enrolled in public schools. The age group of 25 to 34 year olds has the highest likelihood of being enrolled in private schools, with 166 (25.4% in the age bracket) enrolled. Conversely, the age group of 18 to 19 year olds has the lowest likelihood of being enrolled in a private school, with 327 (98.2% in the age bracket) attending a public institution.
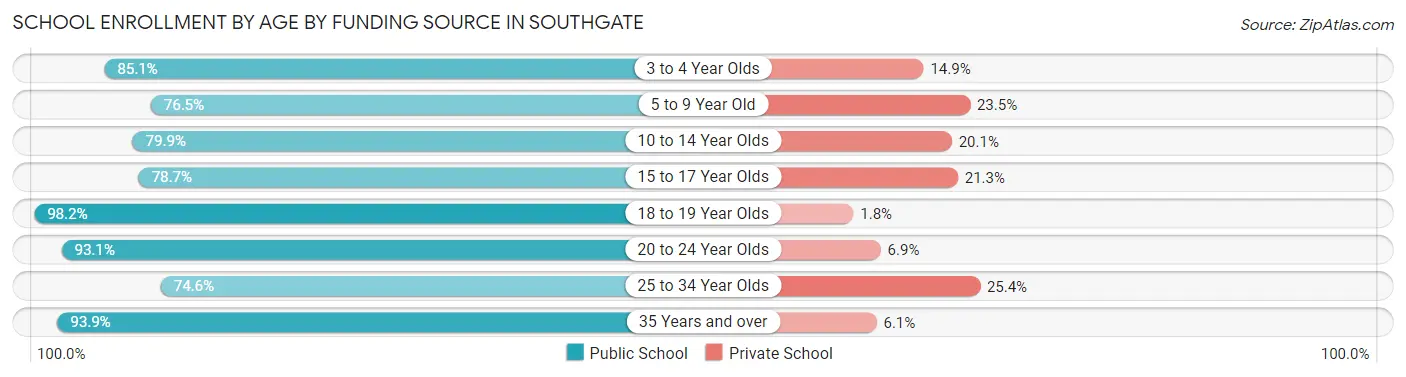
| Age Bracket | Public School | Private School |
| 3 to 4 Year Olds | 355 (85.1%) | 62 (14.9%) |
| 5 to 9 Year Old | 1,245 (76.5%) | 383 (23.5%) |
| 10 to 14 Year Olds | 1,440 (79.9%) | 363 (20.1%) |
| 15 to 17 Year Olds | 637 (78.7%) | 172 (21.3%) |
| 18 to 19 Year Olds | 327 (98.2%) | 6 (1.8%) |
| 20 to 24 Year Olds | 473 (93.1%) | 35 (6.9%) |
| 25 to 34 Year Olds | 488 (74.6%) | 166 (25.4%) |
| 35 Years and over | 368 (93.9%) | 24 (6.1%) |
| Total | 5,333 (81.5%) | 1,211 (18.5%) |
Educational Attainment by Field of Study in Southgate
Business (1,046 | 21.3%), education (604 | 12.3%), science & technology (577 | 11.8%), psychology (374 | 7.6%), and arts & humanities (327 | 6.7%) are the most common fields of study among 4,901 individuals in Southgate who have obtained a bachelor's degree or higher.
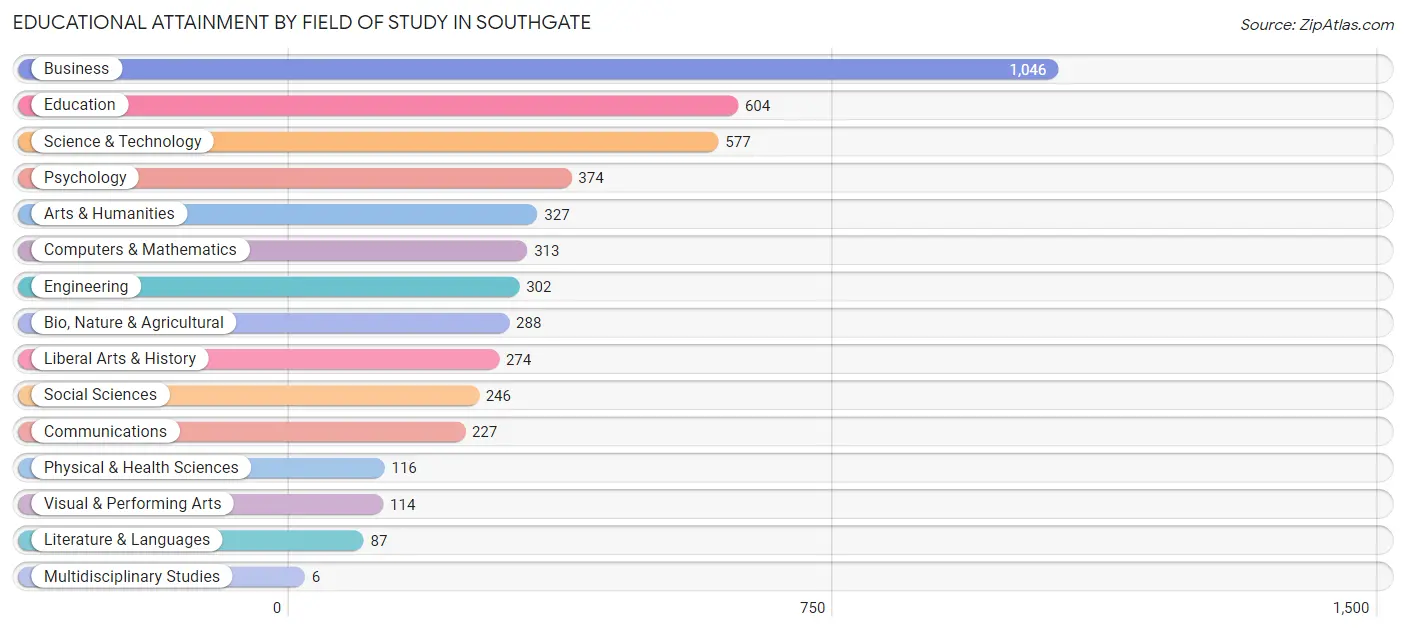
| Field of Study | # Graduates | % Graduates |
| Computers & Mathematics | 313 | 6.4% |
| Bio, Nature & Agricultural | 288 | 5.9% |
| Physical & Health Sciences | 116 | 2.4% |
| Psychology | 374 | 7.6% |
| Social Sciences | 246 | 5.0% |
| Engineering | 302 | 6.2% |
| Multidisciplinary Studies | 6 | 0.1% |
| Science & Technology | 577 | 11.8% |
| Business | 1,046 | 21.3% |
| Education | 604 | 12.3% |
| Literature & Languages | 87 | 1.8% |
| Liberal Arts & History | 274 | 5.6% |
| Visual & Performing Arts | 114 | 2.3% |
| Communications | 227 | 4.6% |
| Arts & Humanities | 327 | 6.7% |
| Total | 4,901 | 100.0% |
Transportation & Commute in Southgate
Vehicle Availability by Sex in Southgate
The most prevalent vehicle ownership categories in Southgate are males with 2 vehicles (3,835, accounting for 51.8%) and females with 2 vehicles (3,450, making up 56.2%).
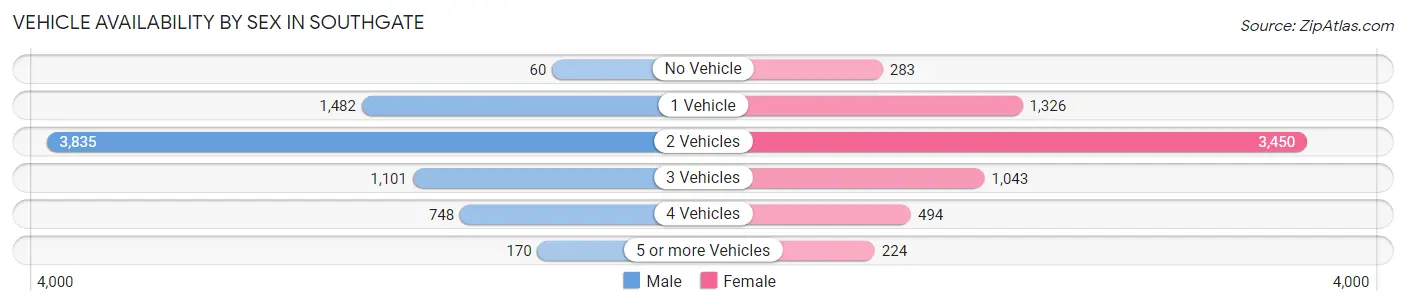
| Vehicles Available | Male | Female |
| No Vehicle | 60 (0.8%) | 283 (4.2%) |
| 1 Vehicle | 1,482 (20.0%) | 1,326 (19.4%) |
| 2 Vehicles | 3,835 (51.8%) | 3,450 (50.6%) |
| 3 Vehicles | 1,101 (14.9%) | 1,043 (15.3%) |
| 4 Vehicles | 748 (10.1%) | 494 (7.2%) |
| 5 or more Vehicles | 170 (2.3%) | 224 (3.3%) |
| Total | 7,396 (100.0%) | 6,820 (100.0%) |
Commute Time in Southgate
The most frequently occuring commute durations in Southgate are 10 to 14 minutes (2,035 commuters, 15.9%), 20 to 24 minutes (2,010 commuters, 15.7%), and 15 to 19 minutes (1,900 commuters, 14.8%).
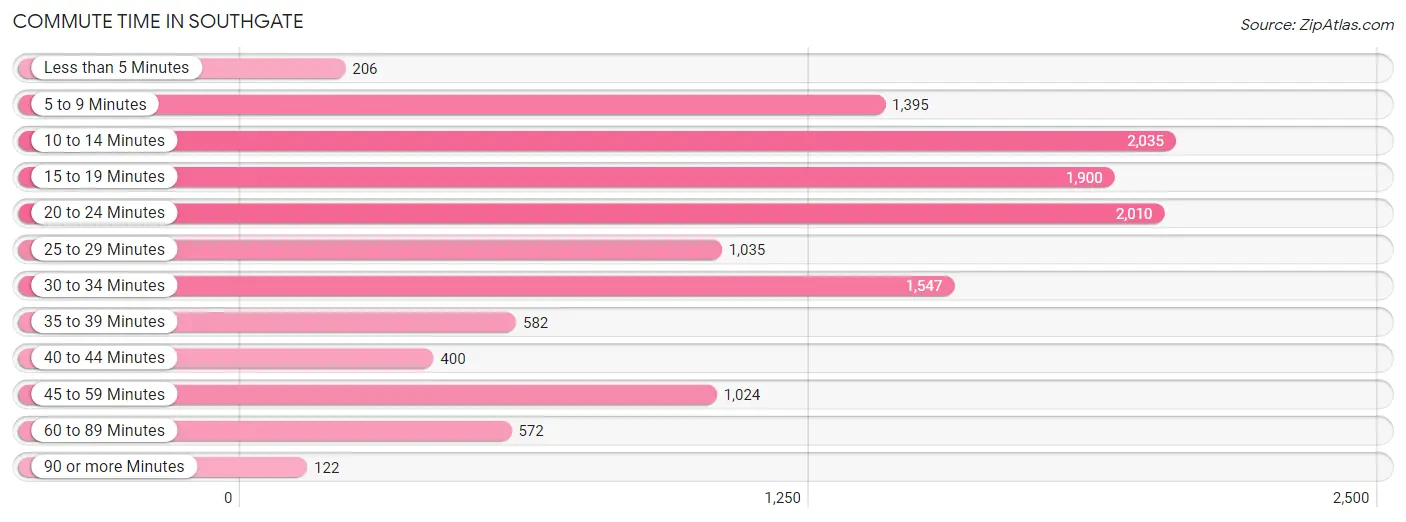
| Commute Time | # Commuters | % Commuters |
| Less than 5 Minutes | 206 | 1.6% |
| 5 to 9 Minutes | 1,395 | 10.9% |
| 10 to 14 Minutes | 2,035 | 15.9% |
| 15 to 19 Minutes | 1,900 | 14.8% |
| 20 to 24 Minutes | 2,010 | 15.7% |
| 25 to 29 Minutes | 1,035 | 8.1% |
| 30 to 34 Minutes | 1,547 | 12.1% |
| 35 to 39 Minutes | 582 | 4.5% |
| 40 to 44 Minutes | 400 | 3.1% |
| 45 to 59 Minutes | 1,024 | 8.0% |
| 60 to 89 Minutes | 572 | 4.5% |
| 90 or more Minutes | 122 | 0.9% |
Commute Time by Sex in Southgate
The most common commute times in Southgate are 20 to 24 minutes (1,306 commuters, 18.9%) for males and 10 to 14 minutes (1,093 commuters, 18.5%) for females.
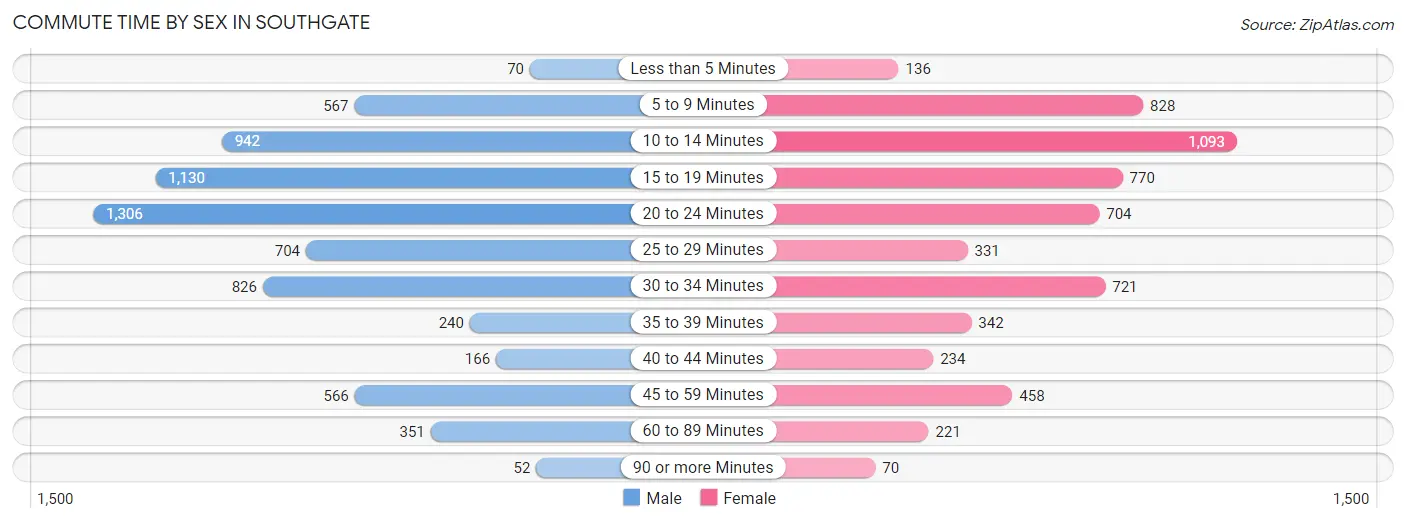
| Commute Time | Male | Female |
| Less than 5 Minutes | 70 (1.0%) | 136 (2.3%) |
| 5 to 9 Minutes | 567 (8.2%) | 828 (14.0%) |
| 10 to 14 Minutes | 942 (13.6%) | 1,093 (18.5%) |
| 15 to 19 Minutes | 1,130 (16.3%) | 770 (13.0%) |
| 20 to 24 Minutes | 1,306 (18.9%) | 704 (11.9%) |
| 25 to 29 Minutes | 704 (10.2%) | 331 (5.6%) |
| 30 to 34 Minutes | 826 (11.9%) | 721 (12.2%) |
| 35 to 39 Minutes | 240 (3.5%) | 342 (5.8%) |
| 40 to 44 Minutes | 166 (2.4%) | 234 (4.0%) |
| 45 to 59 Minutes | 566 (8.2%) | 458 (7.7%) |
| 60 to 89 Minutes | 351 (5.1%) | 221 (3.7%) |
| 90 or more Minutes | 52 (0.7%) | 70 (1.2%) |
Time of Departure to Work by Sex in Southgate
The most frequent times of departure to work in Southgate are 12:00 PM to 3:59 PM (895, 12.9%) for males and 7:00 AM to 7:29 AM (952, 16.1%) for females.
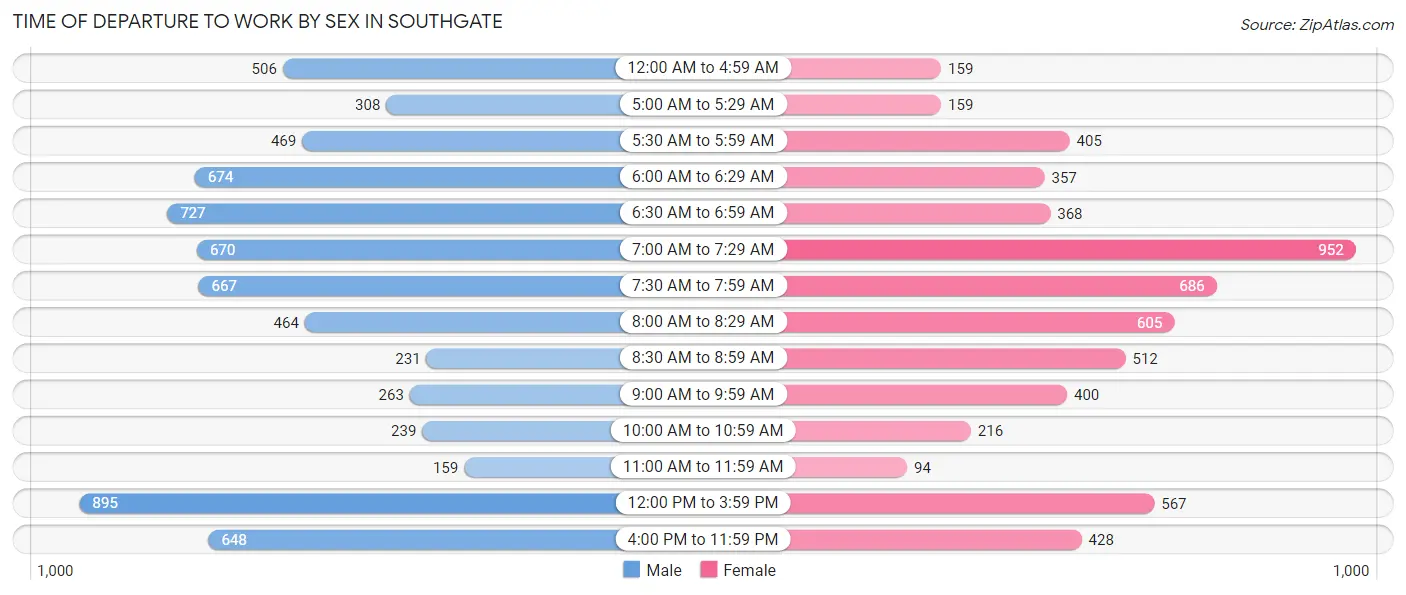
| Time of Departure | Male | Female |
| 12:00 AM to 4:59 AM | 506 (7.3%) | 159 (2.7%) |
| 5:00 AM to 5:29 AM | 308 (4.4%) | 159 (2.7%) |
| 5:30 AM to 5:59 AM | 469 (6.8%) | 405 (6.9%) |
| 6:00 AM to 6:29 AM | 674 (9.7%) | 357 (6.0%) |
| 6:30 AM to 6:59 AM | 727 (10.5%) | 368 (6.2%) |
| 7:00 AM to 7:29 AM | 670 (9.7%) | 952 (16.1%) |
| 7:30 AM to 7:59 AM | 667 (9.6%) | 686 (11.6%) |
| 8:00 AM to 8:29 AM | 464 (6.7%) | 605 (10.2%) |
| 8:30 AM to 8:59 AM | 231 (3.3%) | 512 (8.7%) |
| 9:00 AM to 9:59 AM | 263 (3.8%) | 400 (6.8%) |
| 10:00 AM to 10:59 AM | 239 (3.5%) | 216 (3.7%) |
| 11:00 AM to 11:59 AM | 159 (2.3%) | 94 (1.6%) |
| 12:00 PM to 3:59 PM | 895 (12.9%) | 567 (9.6%) |
| 4:00 PM to 11:59 PM | 648 (9.4%) | 428 (7.2%) |
| Total | 6,920 (100.0%) | 5,908 (100.0%) |
Housing Occupancy in Southgate
Occupancy by Ownership in Southgate
Of the total 12,549 dwellings in Southgate, owner-occupied units account for 8,533 (68.0%), while renter-occupied units make up 4,016 (32.0%).
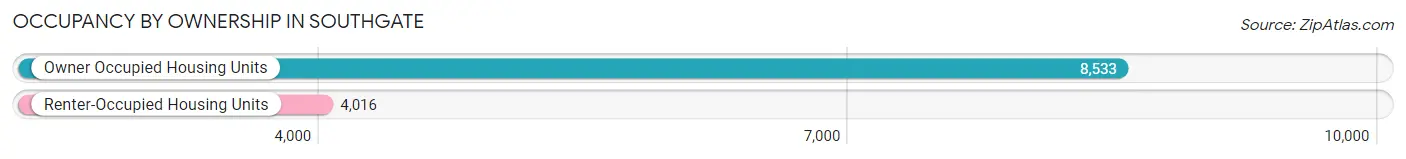
| Occupancy | # Housing Units | % Housing Units |
| Owner Occupied Housing Units | 8,533 | 68.0% |
| Renter-Occupied Housing Units | 4,016 | 32.0% |
| Total Occupied Housing Units | 12,549 | 100.0% |
Occupancy by Household Size in Southgate
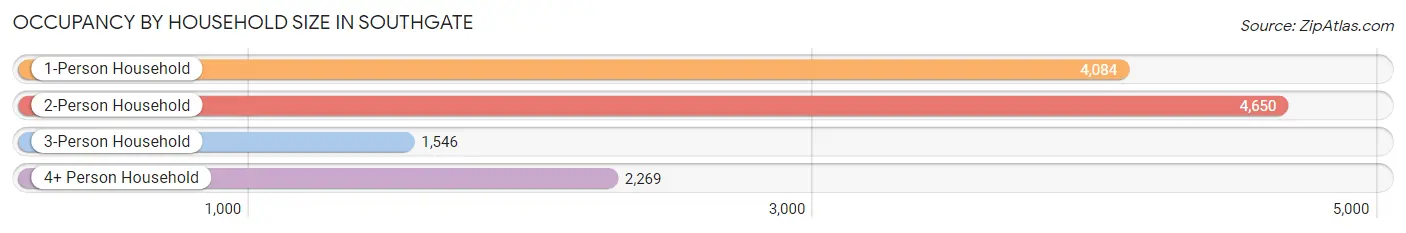
| Household Size | # Housing Units | % Housing Units |
| 1-Person Household | 4,084 | 32.5% |
| 2-Person Household | 4,650 | 37.0% |
| 3-Person Household | 1,546 | 12.3% |
| 4+ Person Household | 2,269 | 18.1% |
| Total Housing Units | 12,549 | 100.0% |
Occupancy by Ownership by Household Size in Southgate
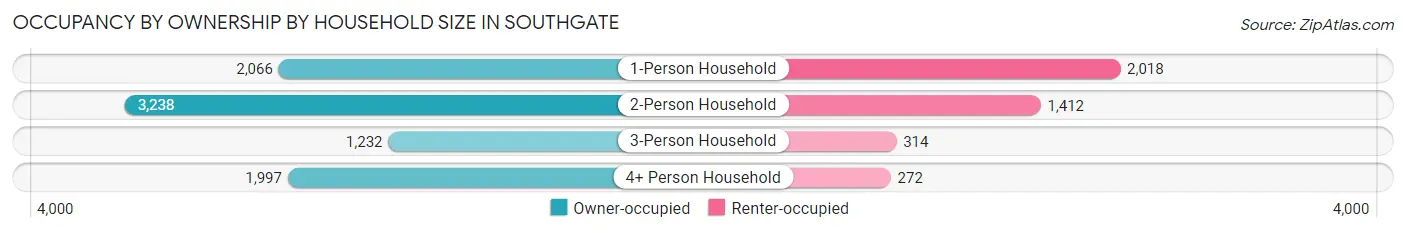
| Household Size | Owner-occupied | Renter-occupied |
| 1-Person Household | 2,066 (50.6%) | 2,018 (49.4%) |
| 2-Person Household | 3,238 (69.6%) | 1,412 (30.4%) |
| 3-Person Household | 1,232 (79.7%) | 314 (20.3%) |
| 4+ Person Household | 1,997 (88.0%) | 272 (12.0%) |
| Total Housing Units | 8,533 (68.0%) | 4,016 (32.0%) |
Occupancy by Educational Attainment in Southgate
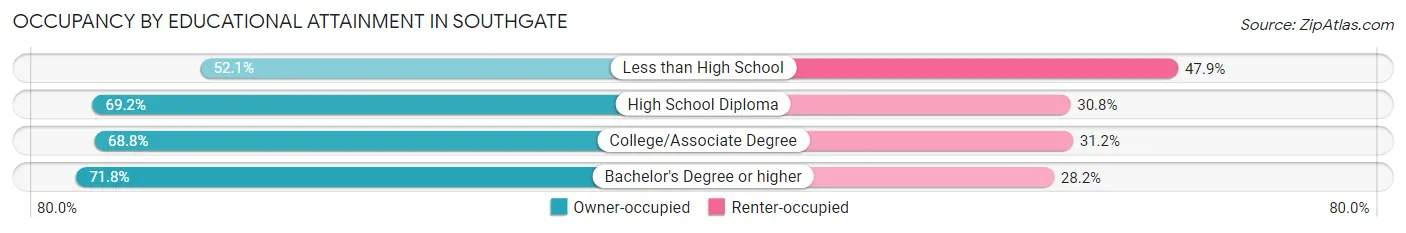
| Household Size | Owner-occupied | Renter-occupied |
| Less than High School | 619 (52.1%) | 569 (47.9%) |
| High School Diploma | 2,744 (69.2%) | 1,221 (30.8%) |
| College/Associate Degree | 3,234 (68.8%) | 1,466 (31.2%) |
| Bachelor's Degree or higher | 1,936 (71.8%) | 760 (28.2%) |
Occupancy by Age of Householder in Southgate
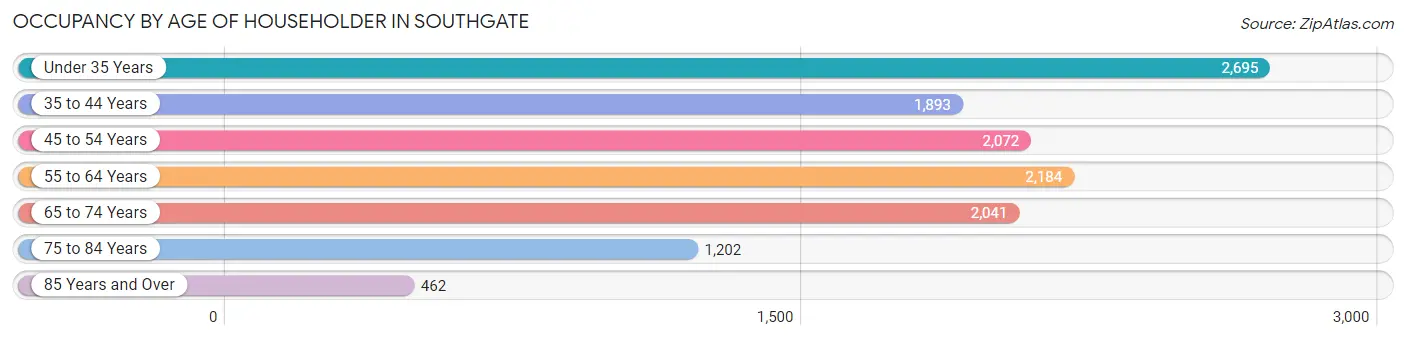
| Age Bracket | # Households | % Households |
| Under 35 Years | 2,695 | 21.5% |
| 35 to 44 Years | 1,893 | 15.1% |
| 45 to 54 Years | 2,072 | 16.5% |
| 55 to 64 Years | 2,184 | 17.4% |
| 65 to 74 Years | 2,041 | 16.3% |
| 75 to 84 Years | 1,202 | 9.6% |
| 85 Years and Over | 462 | 3.7% |
| Total | 12,549 | 100.0% |
Housing Finances in Southgate
Median Income by Occupancy in Southgate
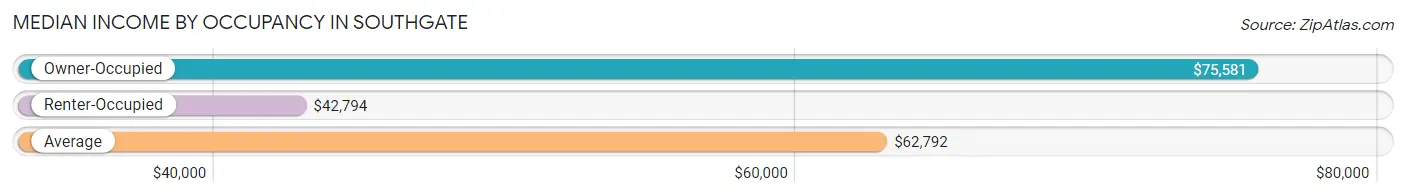
| Occupancy Type | # Households | Median Income |
| Owner-Occupied | 8,533 (68.0%) | $75,581 |
| Renter-Occupied | 4,016 (32.0%) | $42,794 |
| Average | 12,549 (100.0%) | $62,792 |
Occupancy by Householder Income Bracket in Southgate
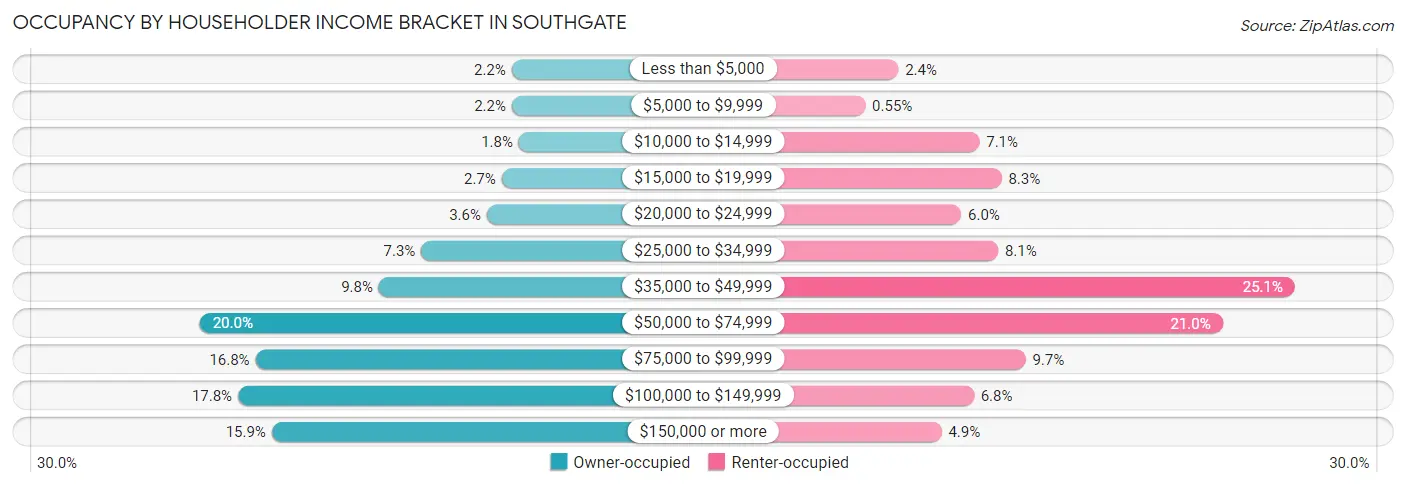
| Income Bracket | Owner-occupied | Renter-occupied |
| Less than $5,000 | 185 (2.2%) | 98 (2.4%) |
| $5,000 to $9,999 | 184 (2.2%) | 22 (0.5%) |
| $10,000 to $14,999 | 150 (1.8%) | 284 (7.1%) |
| $15,000 to $19,999 | 234 (2.7%) | 335 (8.3%) |
| $20,000 to $24,999 | 306 (3.6%) | 242 (6.0%) |
| $25,000 to $34,999 | 626 (7.3%) | 327 (8.1%) |
| $35,000 to $49,999 | 833 (9.8%) | 1,008 (25.1%) |
| $50,000 to $74,999 | 1,706 (20.0%) | 842 (21.0%) |
| $75,000 to $99,999 | 1,434 (16.8%) | 390 (9.7%) |
| $100,000 to $149,999 | 1,520 (17.8%) | 271 (6.8%) |
| $150,000 or more | 1,355 (15.9%) | 197 (4.9%) |
| Total | 8,533 (100.0%) | 4,016 (100.0%) |
Monthly Housing Cost Tiers in Southgate
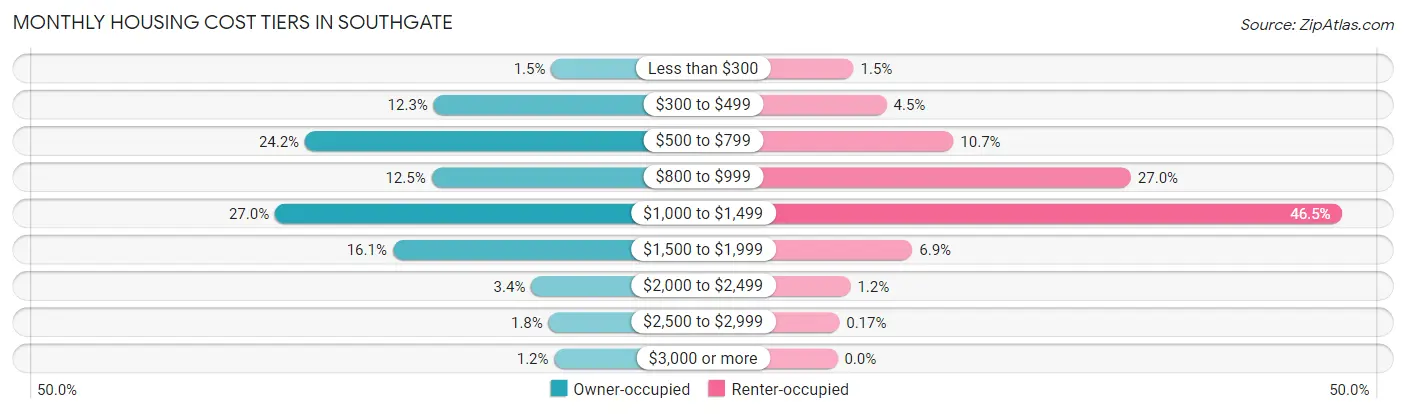
| Monthly Cost | Owner-occupied | Renter-occupied |
| Less than $300 | 129 (1.5%) | 60 (1.5%) |
| $300 to $499 | 1,053 (12.3%) | 182 (4.5%) |
| $500 to $799 | 2,064 (24.2%) | 429 (10.7%) |
| $800 to $999 | 1,070 (12.5%) | 1,085 (27.0%) |
| $1,000 to $1,499 | 2,300 (27.0%) | 1,867 (46.5%) |
| $1,500 to $1,999 | 1,375 (16.1%) | 277 (6.9%) |
| $2,000 to $2,499 | 287 (3.4%) | 48 (1.2%) |
| $2,500 to $2,999 | 150 (1.8%) | 7 (0.2%) |
| $3,000 or more | 105 (1.2%) | 0 (0.0%) |
| Total | 8,533 (100.0%) | 4,016 (100.0%) |
Physical Housing Characteristics in Southgate
Housing Structures in Southgate
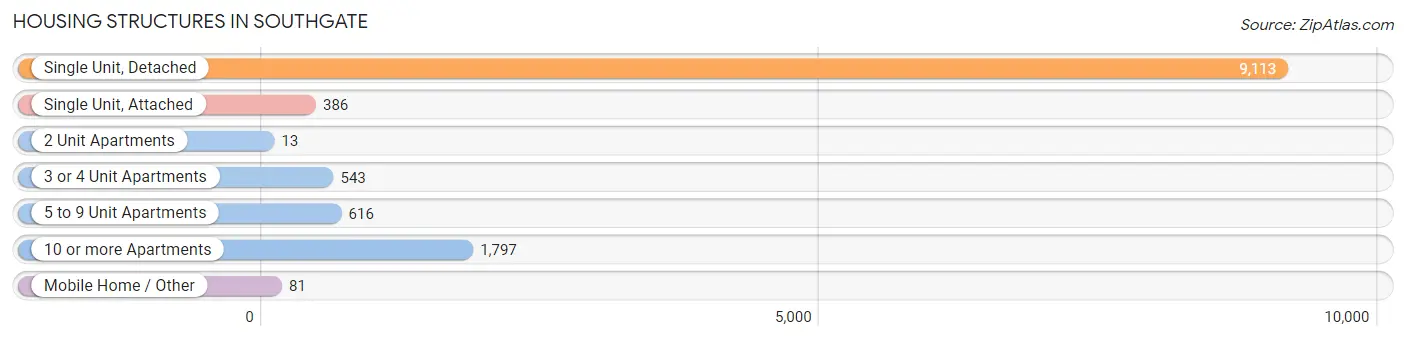
| Structure Type | # Housing Units | % Housing Units |
| Single Unit, Detached | 9,113 | 72.6% |
| Single Unit, Attached | 386 | 3.1% |
| 2 Unit Apartments | 13 | 0.1% |
| 3 or 4 Unit Apartments | 543 | 4.3% |
| 5 to 9 Unit Apartments | 616 | 4.9% |
| 10 or more Apartments | 1,797 | 14.3% |
| Mobile Home / Other | 81 | 0.6% |
| Total | 12,549 | 100.0% |
Housing Structures by Occupancy in Southgate
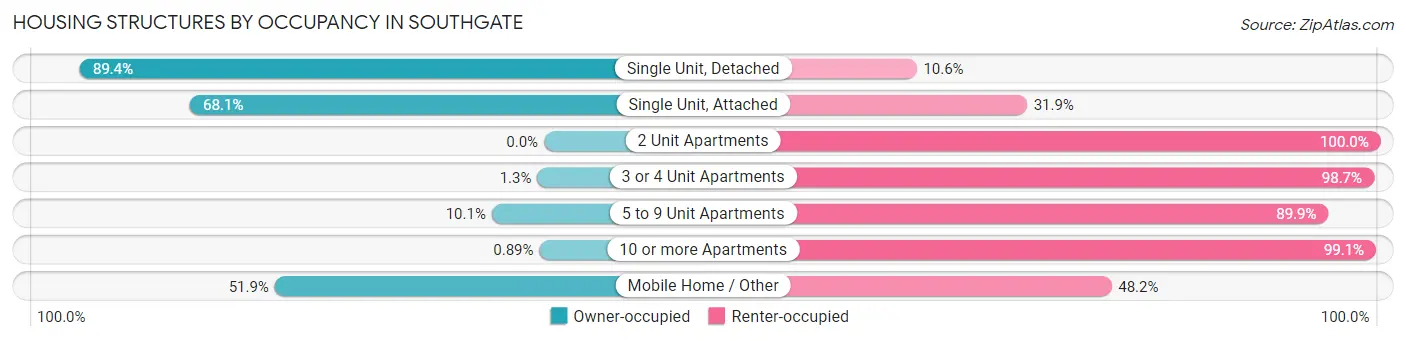
| Structure Type | Owner-occupied | Renter-occupied |
| Single Unit, Detached | 8,143 (89.4%) | 970 (10.6%) |
| Single Unit, Attached | 263 (68.1%) | 123 (31.9%) |
| 2 Unit Apartments | 0 (0.0%) | 13 (100.0%) |
| 3 or 4 Unit Apartments | 7 (1.3%) | 536 (98.7%) |
| 5 to 9 Unit Apartments | 62 (10.1%) | 554 (89.9%) |
| 10 or more Apartments | 16 (0.9%) | 1,781 (99.1%) |
| Mobile Home / Other | 42 (51.8%) | 39 (48.1%) |
| Total | 8,533 (68.0%) | 4,016 (32.0%) |
Housing Structures by Number of Rooms in Southgate
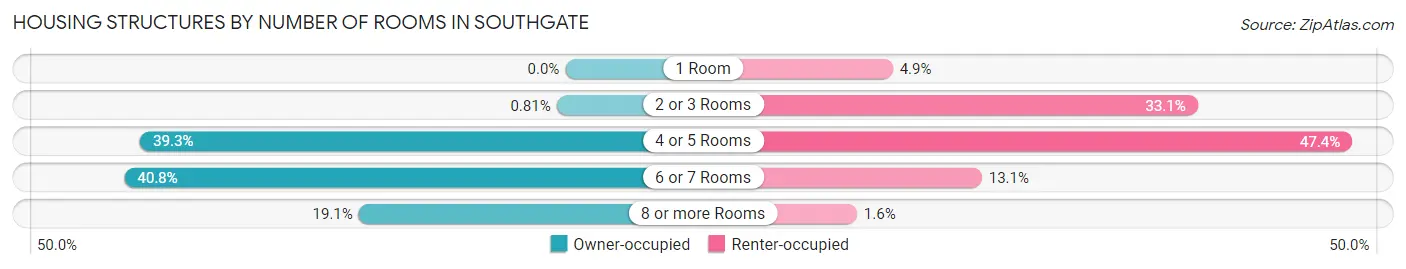
| Number of Rooms | Owner-occupied | Renter-occupied |
| 1 Room | 0 (0.0%) | 196 (4.9%) |
| 2 or 3 Rooms | 69 (0.8%) | 1,328 (33.1%) |
| 4 or 5 Rooms | 3,354 (39.3%) | 1,902 (47.4%) |
| 6 or 7 Rooms | 3,479 (40.8%) | 527 (13.1%) |
| 8 or more Rooms | 1,631 (19.1%) | 63 (1.6%) |
| Total | 8,533 (100.0%) | 4,016 (100.0%) |
Housing Structure by Heating Type in Southgate
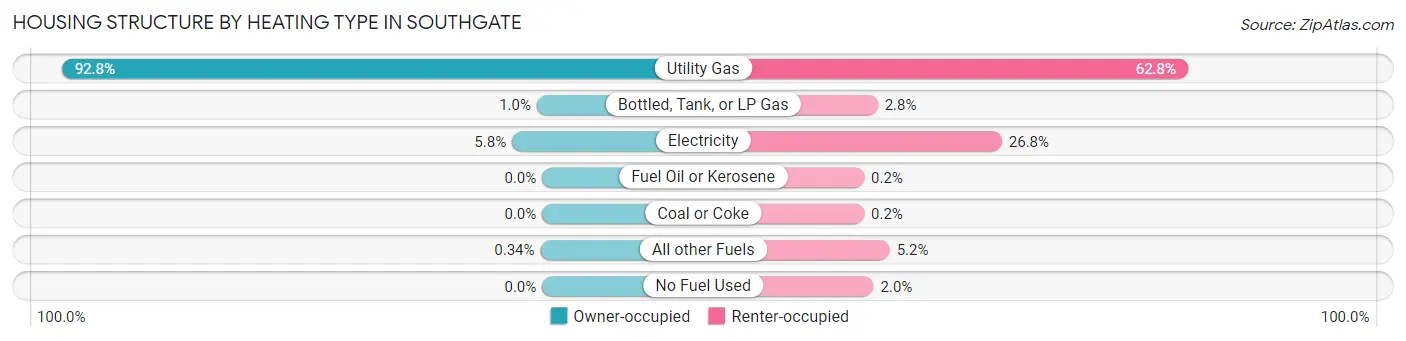
| Heating Type | Owner-occupied | Renter-occupied |
| Utility Gas | 7,920 (92.8%) | 2,520 (62.7%) |
| Bottled, Tank, or LP Gas | 87 (1.0%) | 114 (2.8%) |
| Electricity | 497 (5.8%) | 1,077 (26.8%) |
| Fuel Oil or Kerosene | 0 (0.0%) | 8 (0.2%) |
| Coal or Coke | 0 (0.0%) | 8 (0.2%) |
| All other Fuels | 29 (0.3%) | 207 (5.1%) |
| No Fuel Used | 0 (0.0%) | 82 (2.0%) |
| Total | 8,533 (100.0%) | 4,016 (100.0%) |
Household Vehicle Usage in Southgate
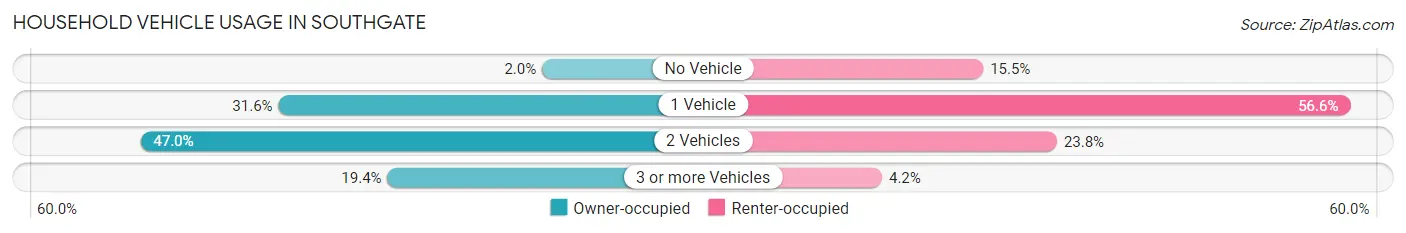
| Vehicles per Household | Owner-occupied | Renter-occupied |
| No Vehicle | 174 (2.0%) | 622 (15.5%) |
| 1 Vehicle | 2,694 (31.6%) | 2,273 (56.6%) |
| 2 Vehicles | 4,013 (47.0%) | 954 (23.7%) |
| 3 or more Vehicles | 1,652 (19.4%) | 167 (4.2%) |
| Total | 8,533 (100.0%) | 4,016 (100.0%) |
Real Estate & Mortgages in Southgate
Real Estate and Mortgage Overview in Southgate
| Characteristic | Without Mortgage | With Mortgage |
| Housing Units | 3,310 | 5,223 |
| Median Property Value | $154,500 | $150,400 |
| Median Household Income | $59,941 | $954 |
| Monthly Housing Costs | $562 | $105 |
| Real Estate Taxes | $2,938 | $221 |
Property Value by Mortgage Status in Southgate
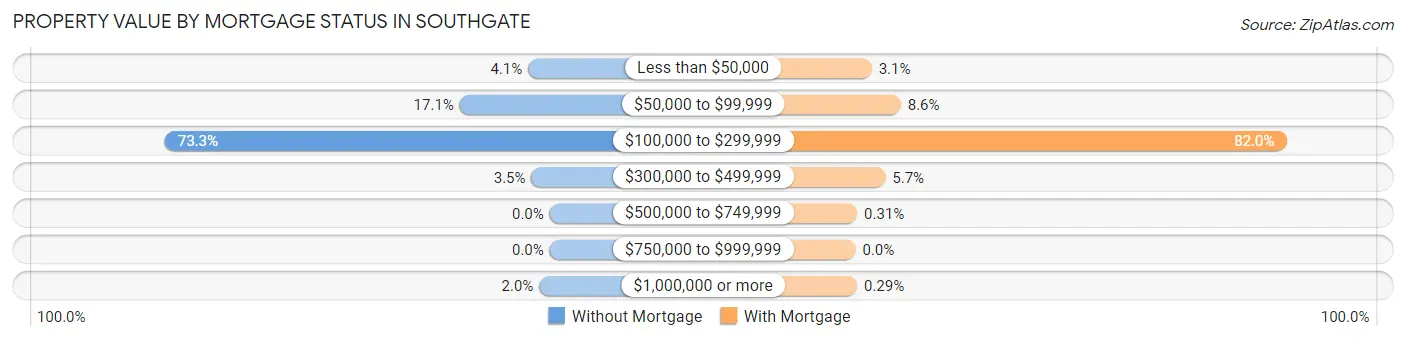
| Property Value | Without Mortgage | With Mortgage |
| Less than $50,000 | 136 (4.1%) | 161 (3.1%) |
| $50,000 to $99,999 | 567 (17.1%) | 450 (8.6%) |
| $100,000 to $299,999 | 2,426 (73.3%) | 4,285 (82.0%) |
| $300,000 to $499,999 | 115 (3.5%) | 296 (5.7%) |
| $500,000 to $749,999 | 0 (0.0%) | 16 (0.3%) |
| $750,000 to $999,999 | 0 (0.0%) | 0 (0.0%) |
| $1,000,000 or more | 66 (2.0%) | 15 (0.3%) |
| Total | 3,310 (100.0%) | 5,223 (100.0%) |
Household Income by Mortgage Status in Southgate
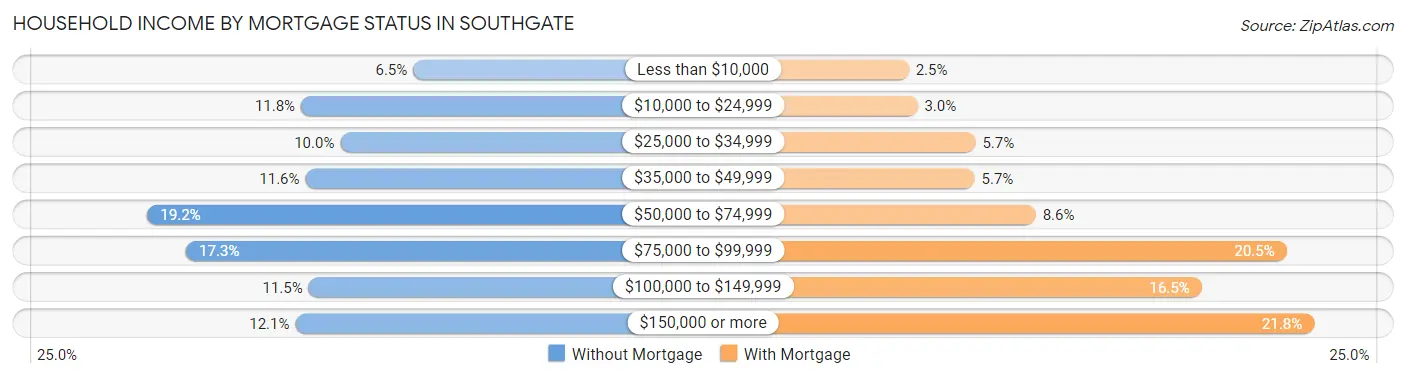
| Household Income | Without Mortgage | With Mortgage |
| Less than $10,000 | 215 (6.5%) | 132 (2.5%) |
| $10,000 to $24,999 | 392 (11.8%) | 154 (2.9%) |
| $25,000 to $34,999 | 330 (10.0%) | 298 (5.7%) |
| $35,000 to $49,999 | 385 (11.6%) | 296 (5.7%) |
| $50,000 to $74,999 | 634 (19.2%) | 448 (8.6%) |
| $75,000 to $99,999 | 573 (17.3%) | 1,072 (20.5%) |
| $100,000 to $149,999 | 380 (11.5%) | 861 (16.5%) |
| $150,000 or more | 401 (12.1%) | 1,140 (21.8%) |
| Total | 3,310 (100.0%) | 5,223 (100.0%) |
Property Value to Household Income Ratio in Southgate
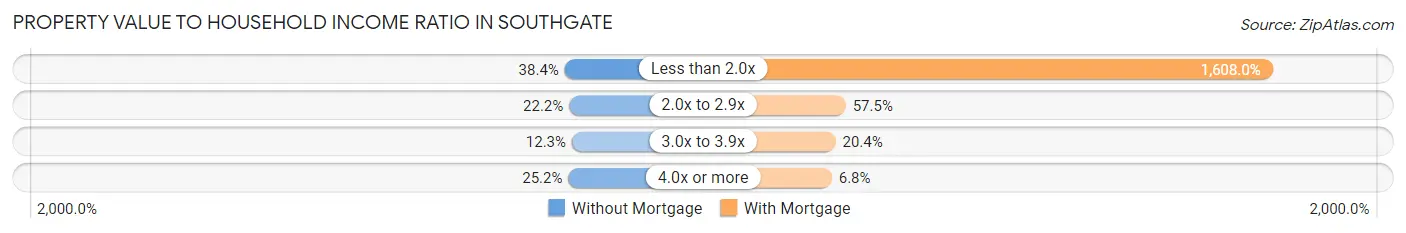
| Value-to-Income Ratio | Without Mortgage | With Mortgage |
| Less than 2.0x | 1,271 (38.4%) | 83,984 (1,608.0%) |
| 2.0x to 2.9x | 734 (22.2%) | 3,001 (57.5%) |
| 3.0x to 3.9x | 406 (12.3%) | 1,066 (20.4%) |
| 4.0x or more | 834 (25.2%) | 356 (6.8%) |
| Total | 3,310 (100.0%) | 5,223 (100.0%) |
Real Estate Taxes by Mortgage Status in Southgate
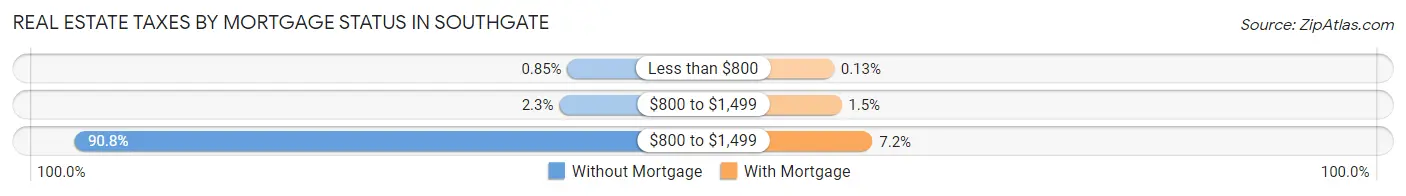
| Property Taxes | Without Mortgage | With Mortgage |
| Less than $800 | 28 (0.9%) | 7 (0.1%) |
| $800 to $1,499 | 77 (2.3%) | 79 (1.5%) |
| $800 to $1,499 | 3,005 (90.8%) | 375 (7.2%) |
| Total | 3,310 (100.0%) | 5,223 (100.0%) |
Health & Disability in Southgate
Health Insurance Coverage by Age in Southgate
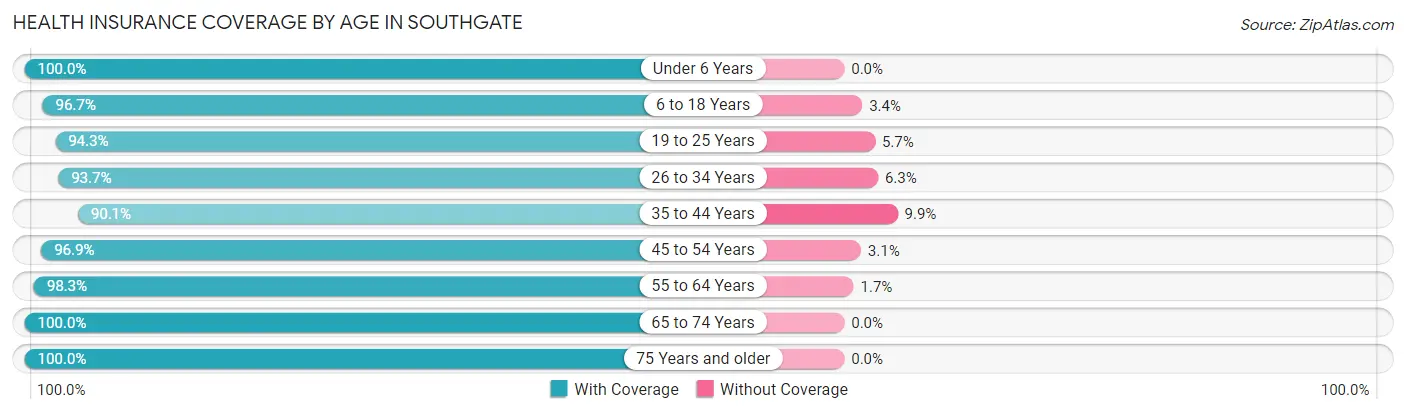
| Age Bracket | With Coverage | Without Coverage |
| Under 6 Years | 2,014 (100.0%) | 0 (0.0%) |
| 6 to 18 Years | 4,005 (96.7%) | 139 (3.4%) |
| 19 to 25 Years | 2,194 (94.3%) | 133 (5.7%) |
| 26 to 34 Years | 4,197 (93.7%) | 281 (6.3%) |
| 35 to 44 Years | 3,415 (90.1%) | 377 (9.9%) |
| 45 to 54 Years | 3,440 (96.9%) | 110 (3.1%) |
| 55 to 64 Years | 3,927 (98.3%) | 69 (1.7%) |
| 65 to 74 Years | 3,094 (100.0%) | 0 (0.0%) |
| 75 Years and older | 2,474 (100.0%) | 0 (0.0%) |
| Total | 28,760 (96.3%) | 1,109 (3.7%) |
Health Insurance Coverage by Citizenship Status in Southgate
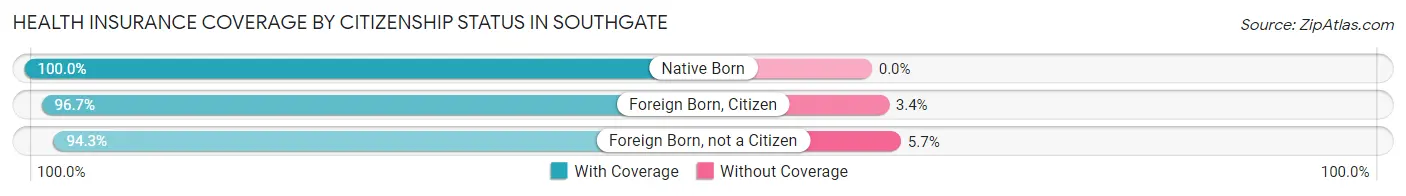
| Citizenship Status | With Coverage | Without Coverage |
| Native Born | 2,014 (100.0%) | 0 (0.0%) |
| Foreign Born, Citizen | 4,005 (96.7%) | 139 (3.4%) |
| Foreign Born, not a Citizen | 2,194 (94.3%) | 133 (5.7%) |
Health Insurance Coverage by Household Income in Southgate
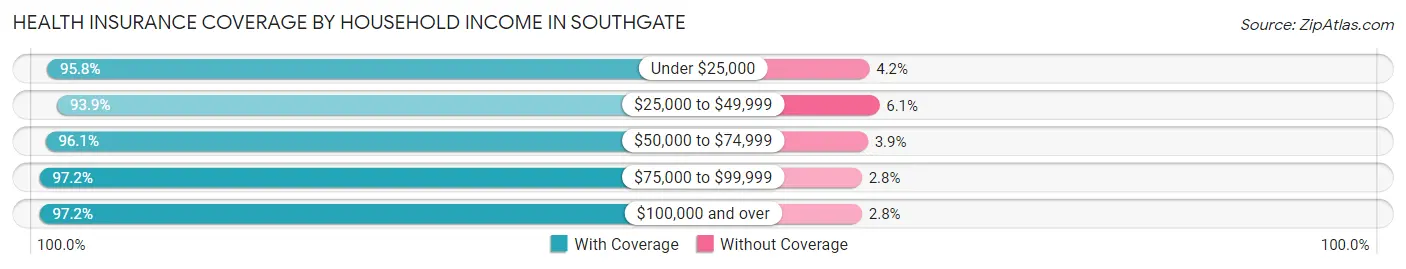
| Household Income | With Coverage | Without Coverage |
| Under $25,000 | 3,345 (95.8%) | 147 (4.2%) |
| $25,000 to $49,999 | 4,499 (93.9%) | 292 (6.1%) |
| $50,000 to $74,999 | 5,464 (96.1%) | 223 (3.9%) |
| $75,000 to $99,999 | 4,727 (97.2%) | 136 (2.8%) |
| $100,000 and over | 10,679 (97.2%) | 310 (2.8%) |
Public vs Private Health Insurance Coverage by Age in Southgate
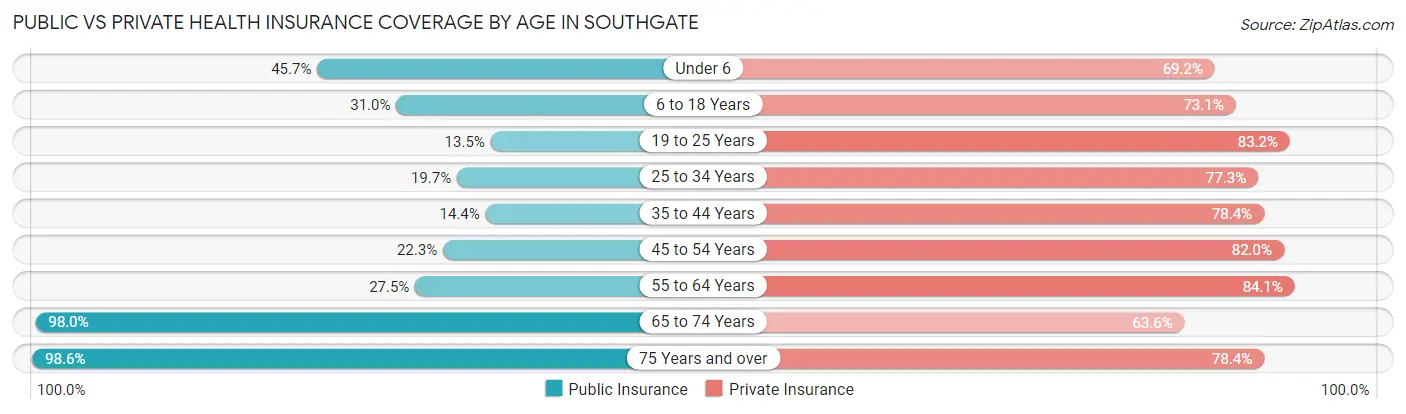
| Age Bracket | Public Insurance | Private Insurance |
| Under 6 | 920 (45.7%) | 1,394 (69.2%) |
| 6 to 18 Years | 1,285 (31.0%) | 3,028 (73.1%) |
| 19 to 25 Years | 314 (13.5%) | 1,935 (83.2%) |
| 25 to 34 Years | 884 (19.7%) | 3,460 (77.3%) |
| 35 to 44 Years | 547 (14.4%) | 2,971 (78.3%) |
| 45 to 54 Years | 793 (22.3%) | 2,912 (82.0%) |
| 55 to 64 Years | 1,099 (27.5%) | 3,359 (84.1%) |
| 65 to 74 Years | 3,032 (98.0%) | 1,968 (63.6%) |
| 75 Years and over | 2,439 (98.6%) | 1,939 (78.4%) |
| Total | 11,313 (37.9%) | 22,966 (76.9%) |
Disability Status by Sex by Age in Southgate
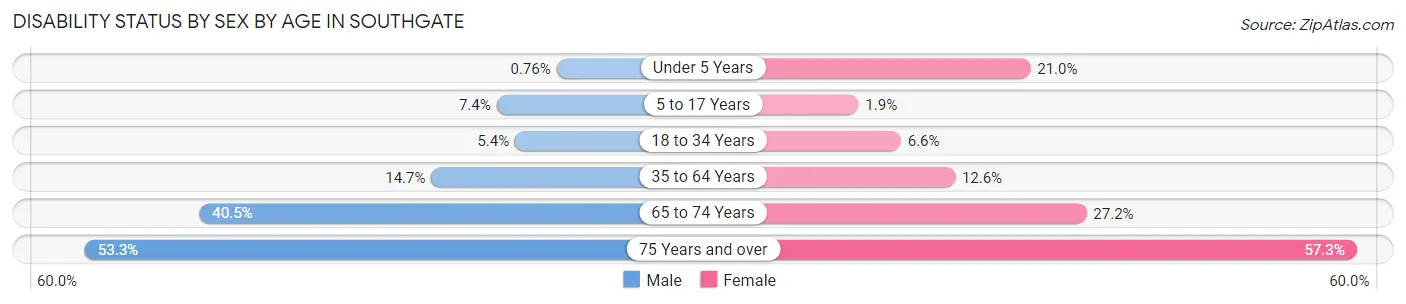
| Age Bracket | Male | Female |
| Under 5 Years | 7 (0.8%) | 144 (21.0%) |
| 5 to 17 Years | 156 (7.4%) | 41 (1.8%) |
| 18 to 34 Years | 197 (5.4%) | 222 (6.6%) |
| 35 to 64 Years | 804 (14.7%) | 740 (12.6%) |
| 65 to 74 Years | 571 (40.5%) | 459 (27.2%) |
| 75 Years and over | 568 (53.3%) | 807 (57.3%) |
Disability Class by Sex by Age in Southgate
Disability Class: Hearing Difficulty
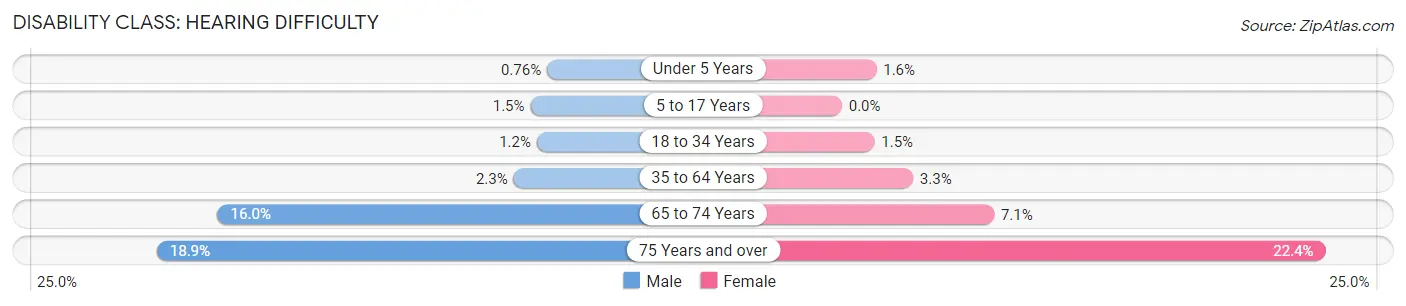
| Age Bracket | Male | Female |
| Under 5 Years | 7 (0.8%) | 11 (1.6%) |
| 5 to 17 Years | 32 (1.5%) | 0 (0.0%) |
| 18 to 34 Years | 45 (1.2%) | 51 (1.5%) |
| 35 to 64 Years | 126 (2.3%) | 194 (3.3%) |
| 65 to 74 Years | 226 (16.0%) | 119 (7.1%) |
| 75 Years and over | 201 (18.9%) | 316 (22.4%) |
Disability Class: Vision Difficulty
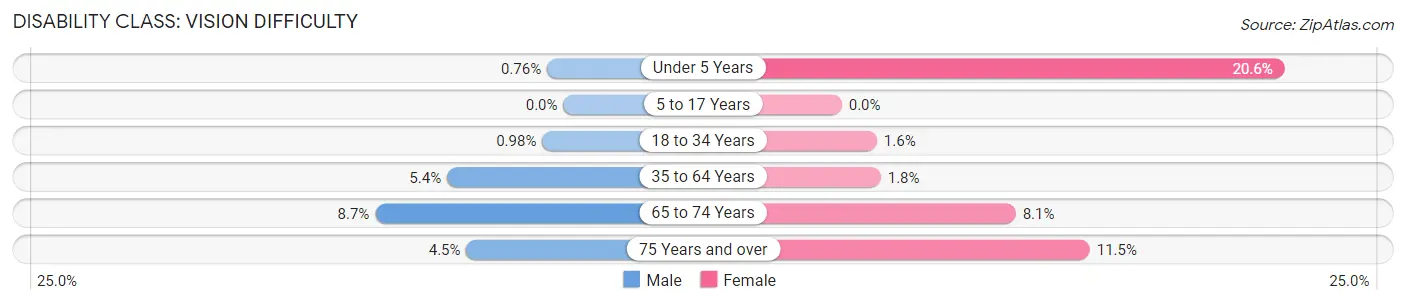
| Age Bracket | Male | Female |
| Under 5 Years | 7 (0.8%) | 141 (20.5%) |
| 5 to 17 Years | 0 (0.0%) | 0 (0.0%) |
| 18 to 34 Years | 36 (1.0%) | 55 (1.6%) |
| 35 to 64 Years | 295 (5.4%) | 106 (1.8%) |
| 65 to 74 Years | 123 (8.7%) | 136 (8.1%) |
| 75 Years and over | 48 (4.5%) | 162 (11.5%) |
Disability Class: Cognitive Difficulty
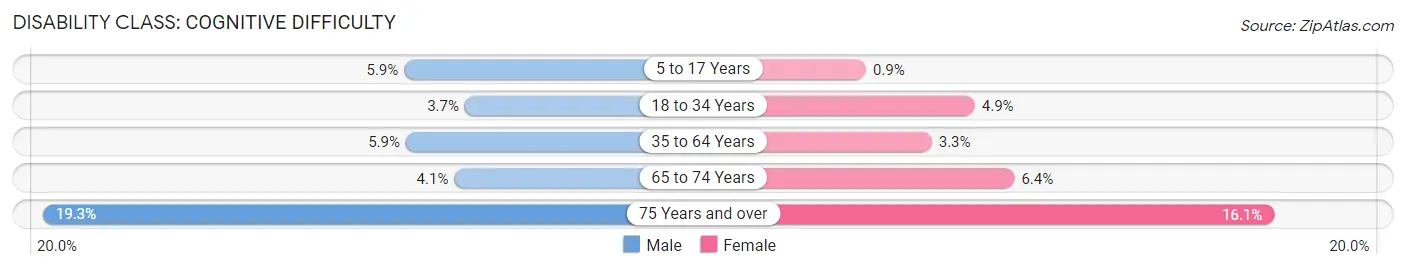
| Age Bracket | Male | Female |
| 5 to 17 Years | 124 (5.9%) | 20 (0.9%) |
| 18 to 34 Years | 134 (3.7%) | 167 (4.9%) |
| 35 to 64 Years | 320 (5.9%) | 196 (3.3%) |
| 65 to 74 Years | 57 (4.1%) | 108 (6.4%) |
| 75 Years and over | 206 (19.3%) | 226 (16.1%) |
Disability Class: Ambulatory Difficulty
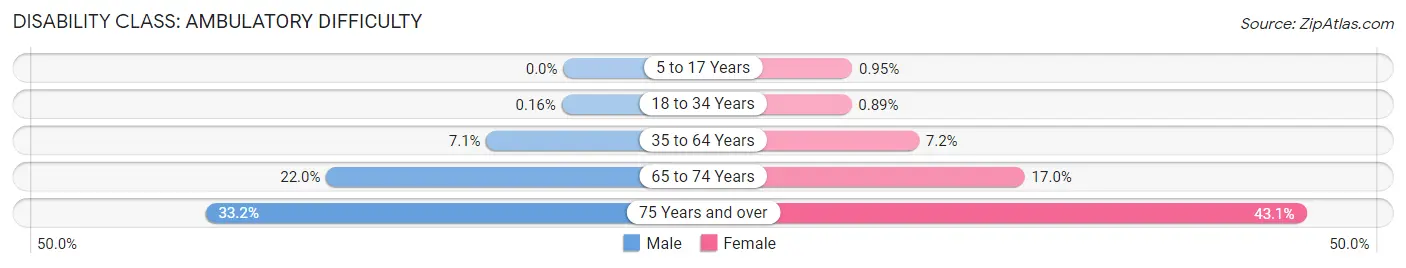
| Age Bracket | Male | Female |
| 5 to 17 Years | 0 (0.0%) | 21 (0.9%) |
| 18 to 34 Years | 6 (0.2%) | 30 (0.9%) |
| 35 to 64 Years | 390 (7.1%) | 420 (7.1%) |
| 65 to 74 Years | 310 (22.0%) | 286 (17.0%) |
| 75 Years and over | 354 (33.2%) | 607 (43.1%) |
Disability Class: Self-Care Difficulty
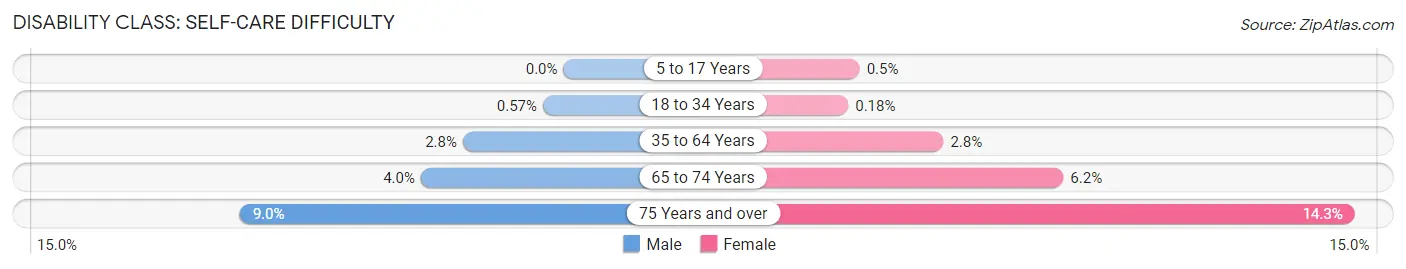
| Age Bracket | Male | Female |
| 5 to 17 Years | 0 (0.0%) | 11 (0.5%) |
| 18 to 34 Years | 21 (0.6%) | 6 (0.2%) |
| 35 to 64 Years | 153 (2.8%) | 166 (2.8%) |
| 65 to 74 Years | 56 (4.0%) | 104 (6.2%) |
| 75 Years and over | 96 (9.0%) | 201 (14.3%) |
Technology Access in Southgate
Computing Device Access in Southgate
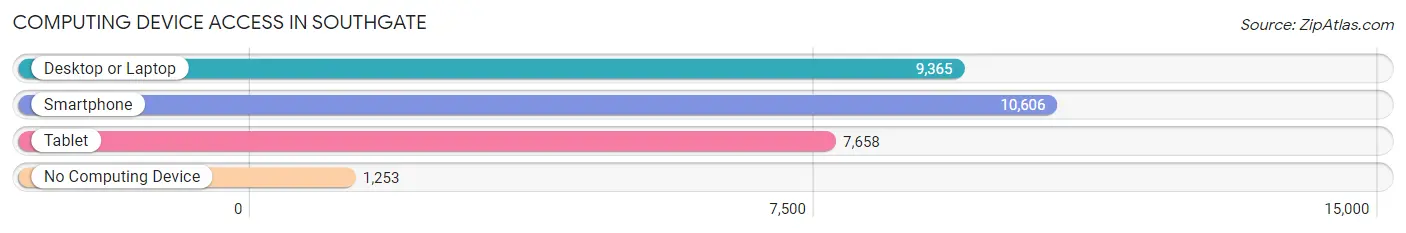
| Device Type | # Households | % Households |
| Desktop or Laptop | 9,365 | 74.6% |
| Smartphone | 10,606 | 84.5% |
| Tablet | 7,658 | 61.0% |
| No Computing Device | 1,253 | 10.0% |
| Total | 12,549 | 100.0% |
Internet Access in Southgate
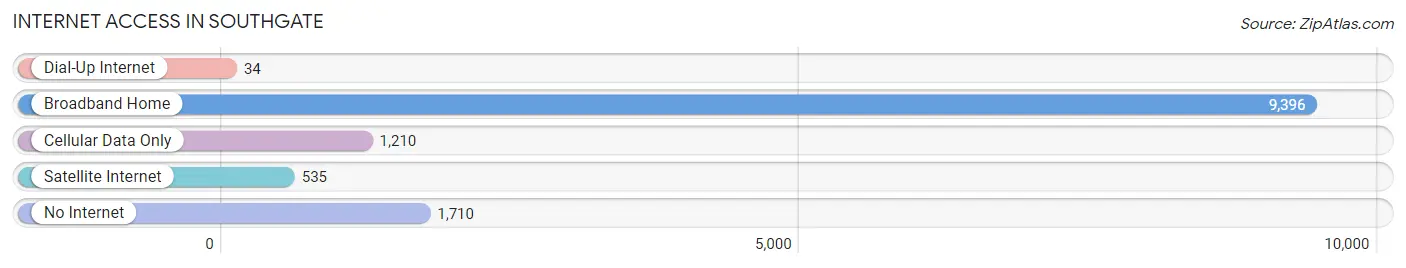
| Internet Type | # Households | % Households |
| Dial-Up Internet | 34 | 0.3% |
| Broadband Home | 9,396 | 74.9% |
| Cellular Data Only | 1,210 | 9.6% |
| Satellite Internet | 535 | 4.3% |
| No Internet | 1,710 | 13.6% |
| Total | 12,549 | 100.0% |
Southgate Summary
History
Southgate is a city located in Wayne County, Michigan. It is a suburb of Detroit and is part of the Downriver area. The city was founded in 1837 by William and Mary Southgate, who purchased the land from the Potawatomi Indians. The city was originally known as Southgateville, but the name was changed to Southgate in 1927.
The city was originally a farming community, but it began to grow in the early 20th century as Detroit’s population increased. The city was incorporated in 1945 and has since grown to a population of over 30,000.
Southgate has a rich history of industry and manufacturing. During World War II, the city was home to several factories that produced war materials. After the war, the city continued to be a major industrial center, with factories producing automotive parts, steel, and other products.
Geography
Southgate is located in southeastern Michigan, about 15 miles south of Detroit. The city is situated on the Detroit River, which forms the border between Michigan and Ontario, Canada. The city is bordered by the cities of Wyandotte to the north, Taylor to the east, and Lincoln Park to the south.
The city has a total area of 5.3 square miles, of which 5.2 square miles is land and 0.1 square miles is water. The terrain is mostly flat, with some rolling hills in the northern part of the city.
Economy
Southgate’s economy is largely based on manufacturing and retail. The city is home to several factories that produce automotive parts, steel, and other products. The city also has a large retail sector, with several shopping centers and malls.
The city’s largest employer is the Ford Motor Company, which has a plant in the city. Other major employers include the Southgate Community School District, the City of Southgate, and the Southgate Shopping Center.
Demographics
As of the 2010 census, Southgate had a population of 30,047. The racial makeup of the city was 79.2% White, 14.2% African American, 0.5% Native American, 1.7% Asian, 0.1% Pacific Islander, and 3.3% from other races. Hispanic or Latino of any race were 5.2% of the population.
The median household income in Southgate was $45,845, and the median family income was $54,845. The per capita income was $21,845. About 11.2% of the population was below the poverty line.
Southgate is served by the Southgate Community School District, which includes four elementary schools, one middle school, and one high school. The city also has several private schools, including St. Mary’s Catholic School and Southgate Christian Academy.
Common Questions
What is Per Capita Income in Southgate?
Per Capita income in Southgate is $34,480.
What is the Median Family Income in Southgate?
Median Family Income in Southgate is $78,088.
What is the Median Household income in Southgate?
Median Household Income in Southgate is $62,792.
What is Income or Wage Gap in Southgate?
Income or Wage Gap in Southgate is 19.9%.
Women in Southgate earn 80.1 cents for every dollar earned by a man.
What is Family Income Deficit in Southgate?
Family Income Deficit in Southgate is $10,132.
Families that are below poverty line in Southgate earn $10,132 less on average than the poverty threshold level.
What is Inequality or Gini Index in Southgate?
Inequality or Gini Index in Southgate is 0.41.
What is the Total Population of Southgate?
Total Population of Southgate is 29,948.
What is the Total Male Population of Southgate?
Total Male Population of Southgate is 14,648.
What is the Total Female Population of Southgate?
Total Female Population of Southgate is 15,300.
What is the Ratio of Males per 100 Females in Southgate?
There are 95.74 Males per 100 Females in Southgate.
What is the Ratio of Females per 100 Males in Southgate?
There are 104.45 Females per 100 Males in Southgate.
What is the Median Population Age in Southgate?
Median Population Age in Southgate is 40.3 Years.
What is the Average Family Size in Southgate
Average Family Size in Southgate is 3.1 People.
What is the Average Household Size in Southgate
Average Household Size in Southgate is 2.4 People.
How Large is the Labor Force in Southgate?
There are 15,213 People in the Labor Forcein in Southgate.
What is the Percentage of People in the Labor Force in Southgate?
62.1% of People are in the Labor Force in Southgate.
What is the Unemployment Rate in Southgate?
Unemployment Rate in Southgate is 4.8%.