Zip Codes with the Highest Percentage of Households Heated by Fuel Oil / Kerosene in Massachusetts
RELATED REPORTS & OPTIONS
Fuel Oil Heating
Massachusetts
Compare Zip Codes
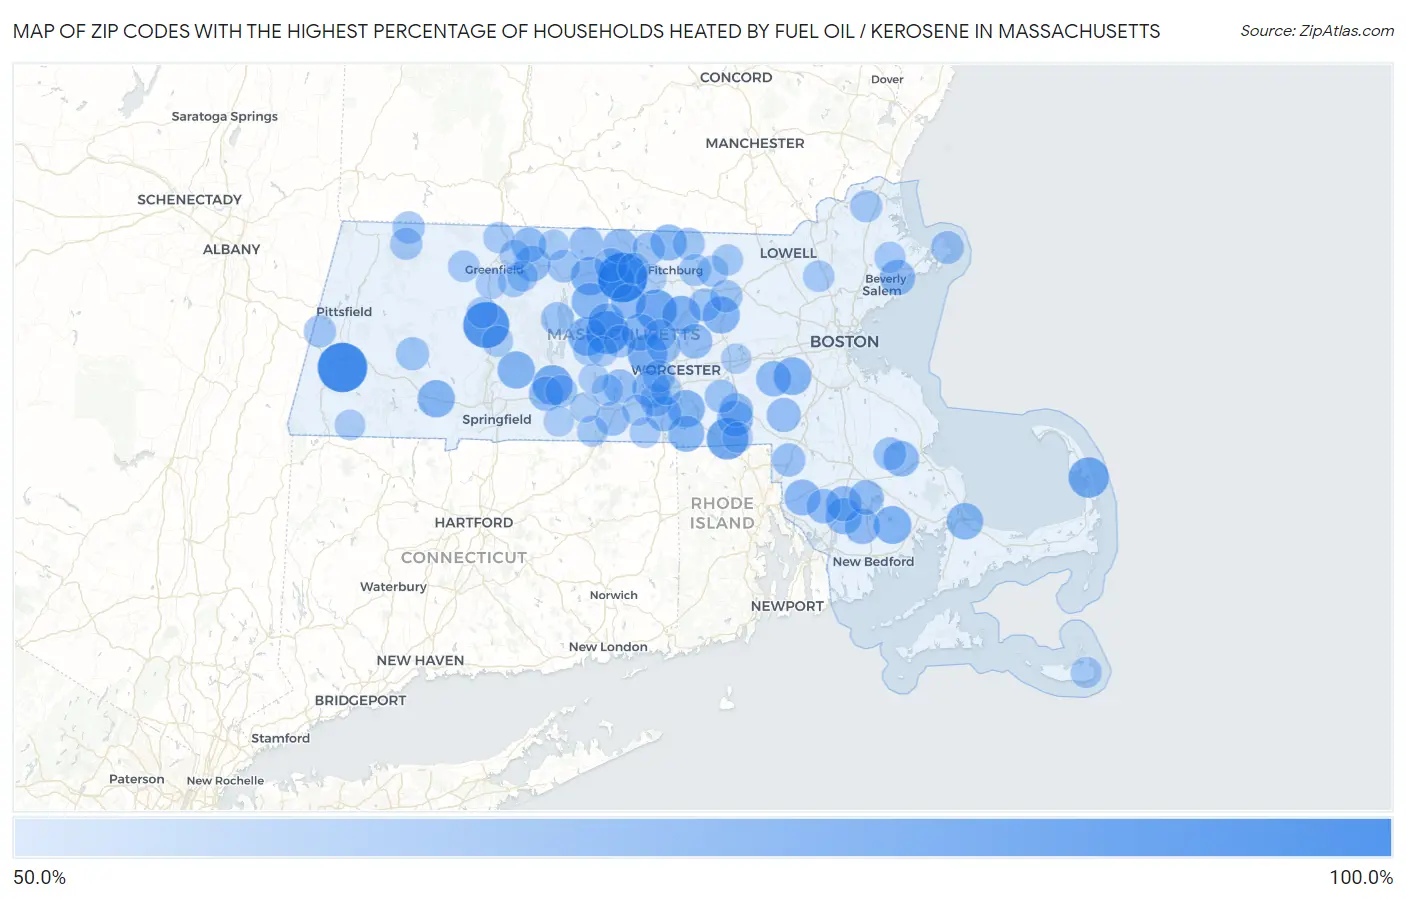
Map of Zip Codes with the Highest Percentage of Households Heated by Fuel Oil / Kerosene in Massachusetts
50.0%
100.0%
Zip Codes with the Highest Percentage of Households Heated by Fuel Oil / Kerosene in Massachusetts
| Zip Code | Fuel Oil Heating | vs State | vs National | |
| 1. | 01438 | 100.0% | 23.8%(+76.2)#1 | 4.2%(+95.8)#9 |
| 2. | 01260 | 100.0% | 23.8%(+76.2)#2 | 4.2%(+95.8)#83 |
| 3. | 01066 | 91.3% | 23.8%(+67.5)#3 | 4.2%(+87.1)#152 |
| 4. | 01074 | 84.4% | 23.8%(+60.6)#4 | 4.2%(+80.2)#218 |
| 5. | 01529 | 80.5% | 23.8%(+56.7)#5 | 4.2%(+76.3)#255 |
| 6. | 01541 | 79.3% | 23.8%(+55.5)#6 | 4.2%(+75.1)#274 |
| 7. | 02663 | 77.7% | 23.8%(+53.9)#7 | 4.2%(+73.5)#304 |
| 8. | 01009 | 76.5% | 23.8%(+52.7)#8 | 4.2%(+72.3)#329 |
| 9. | 01612 | 75.7% | 23.8%(+51.9)#9 | 4.2%(+71.5)#344 |
| 10. | 01037 | 74.3% | 23.8%(+50.5)#10 | 4.2%(+70.1)#379 |
| 11. | 01564 | 73.0% | 23.8%(+49.2)#11 | 4.2%(+68.8)#422 |
| 12. | 01331 | 72.4% | 23.8%(+48.6)#12 | 4.2%(+68.2)#435 |
| 13. | 02030 | 71.4% | 23.8%(+47.6)#13 | 4.2%(+67.2)#461 |
| 14. | 02770 | 71.4% | 23.8%(+47.6)#14 | 4.2%(+67.2)#462 |
| 15. | 01542 | 70.9% | 23.8%(+47.1)#15 | 4.2%(+66.7)#479 |
| 16. | 01590 | 70.6% | 23.8%(+46.8)#16 | 4.2%(+66.4)#491 |
| 17. | 01033 | 70.4% | 23.8%(+46.6)#17 | 4.2%(+66.2)#497 |
| 18. | 01071 | 70.4% | 23.8%(+46.6)#18 | 4.2%(+66.2)#501 |
| 19. | 01543 | 70.1% | 23.8%(+46.3)#19 | 4.2%(+65.9)#517 |
| 20. | 01740 | 69.9% | 23.8%(+46.1)#20 | 4.2%(+65.7)#527 |
| 21. | 01366 | 69.0% | 23.8%(+45.2)#21 | 4.2%(+64.8)#569 |
| 22. | 01468 | 68.8% | 23.8%(+45.0)#22 | 4.2%(+64.6)#573 |
| 23. | 02561 | 68.5% | 23.8%(+44.7)#23 | 4.2%(+64.3)#590 |
| 24. | 01516 | 67.5% | 23.8%(+43.7)#24 | 4.2%(+63.3)#638 |
| 25. | 02702 | 67.5% | 23.8%(+43.7)#25 | 4.2%(+63.3)#639 |
| 26. | 01431 | 67.4% | 23.8%(+43.6)#26 | 4.2%(+63.2)#652 |
| 27. | 02769 | 67.2% | 23.8%(+43.4)#27 | 4.2%(+63.0)#663 |
| 28. | 01756 | 67.0% | 23.8%(+43.2)#28 | 4.2%(+62.8)#677 |
| 29. | 01005 | 67.0% | 23.8%(+43.2)#29 | 4.2%(+62.8)#679 |
| 30. | 02367 | 66.3% | 23.8%(+42.5)#30 | 4.2%(+62.1)#720 |
| 31. | 02717 | 66.1% | 23.8%(+42.3)#31 | 4.2%(+61.9)#732 |
| 32. | 01452 | 66.0% | 23.8%(+42.2)#32 | 4.2%(+61.8)#736 |
| 33. | 01344 | 66.0% | 23.8%(+42.2)#33 | 4.2%(+61.8)#737 |
| 34. | 01770 | 65.8% | 23.8%(+42.0)#34 | 4.2%(+61.6)#750 |
| 35. | 01965 | 65.8% | 23.8%(+42.0)#35 | 4.2%(+61.6)#751 |
| 36. | 01540 | 65.7% | 23.8%(+41.9)#36 | 4.2%(+61.5)#754 |
| 37. | 02779 | 65.7% | 23.8%(+41.9)#37 | 4.2%(+61.5)#755 |
| 38. | 01360 | 64.7% | 23.8%(+40.9)#38 | 4.2%(+60.5)#799 |
| 39. | 02347 | 64.6% | 23.8%(+40.8)#39 | 4.2%(+60.4)#807 |
| 40. | 01475 | 64.4% | 23.8%(+40.6)#40 | 4.2%(+60.2)#822 |
| 41. | 01505 | 64.2% | 23.8%(+40.4)#41 | 4.2%(+60.0)#836 |
| 42. | 01080 | 64.1% | 23.8%(+40.3)#42 | 4.2%(+59.9)#841 |
| 43. | 02715 | 63.8% | 23.8%(+40.0)#43 | 4.2%(+59.6)#864 |
| 44. | 01520 | 62.8% | 23.8%(+39.0)#44 | 4.2%(+58.6)#921 |
| 45. | 02056 | 62.8% | 23.8%(+39.0)#45 | 4.2%(+58.6)#922 |
| 46. | 01566 | 62.5% | 23.8%(+38.7)#46 | 4.2%(+58.3)#936 |
| 47. | 01368 | 62.5% | 23.8%(+38.7)#47 | 4.2%(+58.3)#937 |
| 48. | 01515 | 62.3% | 23.8%(+38.5)#48 | 4.2%(+58.1)#947 |
| 49. | 01747 | 61.9% | 23.8%(+38.1)#49 | 4.2%(+57.7)#976 |
| 50. | 01436 | 61.9% | 23.8%(+38.1)#50 | 4.2%(+57.7)#979 |
| 51. | 02763 | 61.0% | 23.8%(+37.2)#51 | 4.2%(+56.8)#1,041 |
| 52. | 01011 | 60.7% | 23.8%(+36.9)#52 | 4.2%(+56.5)#1,061 |
| 53. | 01568 | 60.6% | 23.8%(+36.8)#53 | 4.2%(+56.4)#1,064 |
| 54. | 01355 | 60.4% | 23.8%(+36.6)#54 | 4.2%(+56.2)#1,077 |
| 55. | 01966 | 60.1% | 23.8%(+36.3)#55 | 4.2%(+55.9)#1,091 |
| 56. | 01523 | 60.0% | 23.8%(+36.2)#56 | 4.2%(+55.8)#1,098 |
| 57. | 02338 | 60.0% | 23.8%(+36.2)#57 | 4.2%(+55.8)#1,100 |
| 58. | 01537 | 59.8% | 23.8%(+36.0)#58 | 4.2%(+55.6)#1,117 |
| 59. | 01364 | 59.6% | 23.8%(+35.8)#59 | 4.2%(+55.4)#1,131 |
| 60. | 01430 | 59.4% | 23.8%(+35.6)#60 | 4.2%(+55.2)#1,153 |
| 61. | 01451 | 59.4% | 23.8%(+35.6)#61 | 4.2%(+55.2)#1,154 |
| 62. | 01611 | 59.1% | 23.8%(+35.3)#62 | 4.2%(+54.9)#1,168 |
| 63. | 01068 | 58.9% | 23.8%(+35.1)#63 | 4.2%(+54.7)#1,188 |
| 64. | 01350 | 58.5% | 23.8%(+34.7)#64 | 4.2%(+54.3)#1,212 |
| 65. | 01985 | 58.4% | 23.8%(+34.6)#65 | 4.2%(+54.2)#1,214 |
| 66. | 01474 | 58.4% | 23.8%(+34.6)#66 | 4.2%(+54.2)#1,218 |
| 67. | 01254 | 58.4% | 23.8%(+34.6)#67 | 4.2%(+54.2)#1,221 |
| 68. | 01343 | 58.3% | 23.8%(+34.5)#68 | 4.2%(+54.1)#1,229 |
| 69. | 01069 | 58.2% | 23.8%(+34.4)#69 | 4.2%(+54.0)#1,235 |
| 70. | 01440 | 58.0% | 23.8%(+34.2)#70 | 4.2%(+53.8)#1,246 |
| 71. | 01462 | 57.9% | 23.8%(+34.1)#71 | 4.2%(+53.7)#1,254 |
| 72. | 01351 | 56.9% | 23.8%(+33.1)#72 | 4.2%(+52.7)#1,325 |
| 73. | 01887 | 56.7% | 23.8%(+32.9)#73 | 4.2%(+52.5)#1,338 |
| 74. | 01464 | 56.6% | 23.8%(+32.8)#74 | 4.2%(+52.4)#1,350 |
| 75. | 01370 | 56.6% | 23.8%(+32.8)#75 | 4.2%(+52.4)#1,351 |
| 76. | 01522 | 56.6% | 23.8%(+32.8)#76 | 4.2%(+52.4)#1,352 |
| 77. | 01093 | 56.5% | 23.8%(+32.7)#77 | 4.2%(+52.3)#1,362 |
| 78. | 01506 | 56.4% | 23.8%(+32.6)#78 | 4.2%(+52.2)#1,366 |
| 79. | 01450 | 56.2% | 23.8%(+32.4)#79 | 4.2%(+52.0)#1,380 |
| 80. | 01982 | 56.2% | 23.8%(+32.4)#80 | 4.2%(+52.0)#1,381 |
| 81. | 01035 | 56.0% | 23.8%(+32.2)#81 | 4.2%(+51.8)#1,390 |
| 82. | 01031 | 55.9% | 23.8%(+32.1)#82 | 4.2%(+51.7)#1,400 |
| 83. | 02564 | 55.9% | 23.8%(+32.1)#83 | 4.2%(+51.7)#1,408 |
| 84. | 01507 | 55.7% | 23.8%(+31.9)#84 | 4.2%(+51.5)#1,415 |
| 85. | 01337 | 55.6% | 23.8%(+31.8)#85 | 4.2%(+51.4)#1,423 |
| 86. | 01521 | 55.5% | 23.8%(+31.7)#86 | 4.2%(+51.3)#1,433 |
| 87. | 01349 | 55.4% | 23.8%(+31.6)#87 | 4.2%(+51.2)#1,445 |
| 88. | 01378 | 55.2% | 23.8%(+31.4)#88 | 4.2%(+51.0)#1,462 |
| 89. | 01571 | 55.1% | 23.8%(+31.3)#89 | 4.2%(+50.9)#1,468 |
| 90. | 01354 | 55.0% | 23.8%(+31.2)#90 | 4.2%(+50.8)#1,480 |
| 91. | 01342 | 55.0% | 23.8%(+31.2)#91 | 4.2%(+50.8)#1,482 |
| 92. | 01504 | 54.8% | 23.8%(+31.0)#92 | 4.2%(+50.6)#1,498 |
| 93. | 01259 | 54.5% | 23.8%(+30.7)#93 | 4.2%(+50.3)#1,524 |
| 94. | 01057 | 54.4% | 23.8%(+30.6)#94 | 4.2%(+50.2)#1,530 |
| 95. | 01501 | 54.3% | 23.8%(+30.5)#95 | 4.2%(+50.1)#1,535 |
| 96. | 01585 | 54.1% | 23.8%(+30.3)#96 | 4.2%(+49.9)#1,547 |
| 97. | 01473 | 54.0% | 23.8%(+30.2)#97 | 4.2%(+49.8)#1,554 |
| 98. | 01531 | 54.0% | 23.8%(+30.2)#98 | 4.2%(+49.8)#1,557 |
| 99. | 01772 | 53.8% | 23.8%(+30.0)#99 | 4.2%(+49.6)#1,567 |
| 100. | 01010 | 53.8% | 23.8%(+30.0)#100 | 4.2%(+49.6)#1,570 |
Common Questions
What are the Top 10 Zip Codes with the Highest Percentage of Households Heated by Fuel Oil / Kerosene in Massachusetts?
Top 10 Zip Codes with the Highest Percentage of Households Heated by Fuel Oil / Kerosene in Massachusetts are:
What zip code has the Highest Percentage of Households Heated by Fuel Oil / Kerosene in Massachusetts?
01438 has the Highest Percentage of Households Heated by Fuel Oil / Kerosene in Massachusetts with 100.0%.
What is the Percentage of Households Heated by Fuel Oil / Kerosene in the State of Massachusetts?
Percentage of Households Heated by Fuel Oil / Kerosene in Massachusetts is 23.8%.
What is the Percentage of Households Heated by Fuel Oil / Kerosene in the United States?
Percentage of Households Heated by Fuel Oil / Kerosene in the United States is 4.2%.