Pinardville, NH Map & Demographics
Pinardville Map
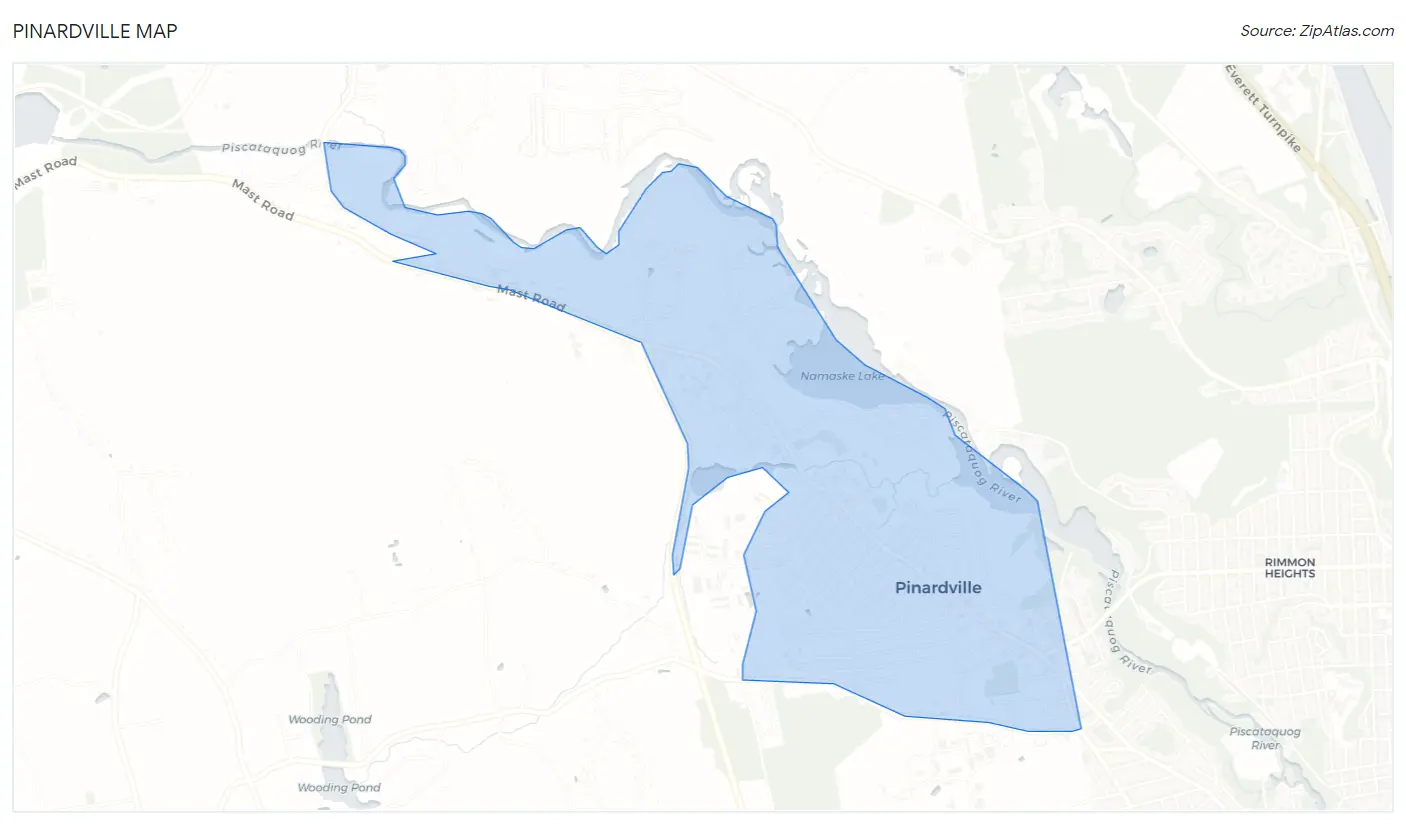
Pinardville Overview
$36,069
PER CAPITA INCOME
$91,923
AVG FAMILY INCOME
$71,690
AVG HOUSEHOLD INCOME
2.4%
WAGE / INCOME GAP [ % ]
97.6¢/ $1
WAGE / INCOME GAP [ $ ]
0.38
INEQUALITY / GINI INDEX
4,851
TOTAL POPULATION
2,209
MALE POPULATION
2,642
FEMALE POPULATION
83.61
MALES / 100 FEMALES
119.60
FEMALES / 100 MALES
38.0
MEDIAN AGE
3.0
AVG FAMILY SIZE
2.3
AVG HOUSEHOLD SIZE
2,867
LABOR FORCE [ PEOPLE ]
70.8%
PERCENT IN LABOR FORCE
0.8%
UNEMPLOYMENT RATE
Income in Pinardville
Income Overview in Pinardville
Per Capita Income in Pinardville is $36,069, while median incomes of families and households are $91,923 and $71,690 respectively.
| Characteristic | Number | Measure |
| Per Capita Income | 4,851 | $36,069 |
| Median Family Income | 1,214 | $91,923 |
| Mean Family Income | 1,214 | $100,479 |
| Median Household Income | 2,091 | $71,690 |
| Mean Household Income | 2,091 | $80,477 |
| Income Deficit | 1,214 | $0 |
| Wage / Income Gap (%) | 4,851 | 2.36% |
| Wage / Income Gap ($) | 4,851 | 97.64¢ per $1 |
| Gini / Inequality Index | 4,851 | 0.38 |
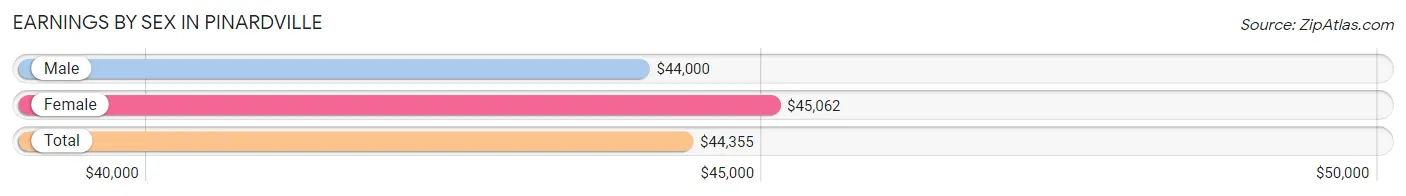
Earnings by Sex in Pinardville
Average Earnings in Pinardville are $44,355, $44,000 for men and $45,062 for women, a difference of 2.4%.
| Sex | Number | Average Earnings |
| Male | 1,394 (45.6%) | $44,000 |
| Female | 1,661 (54.4%) | $45,062 |
| Total | 3,055 (100.0%) | $44,355 |
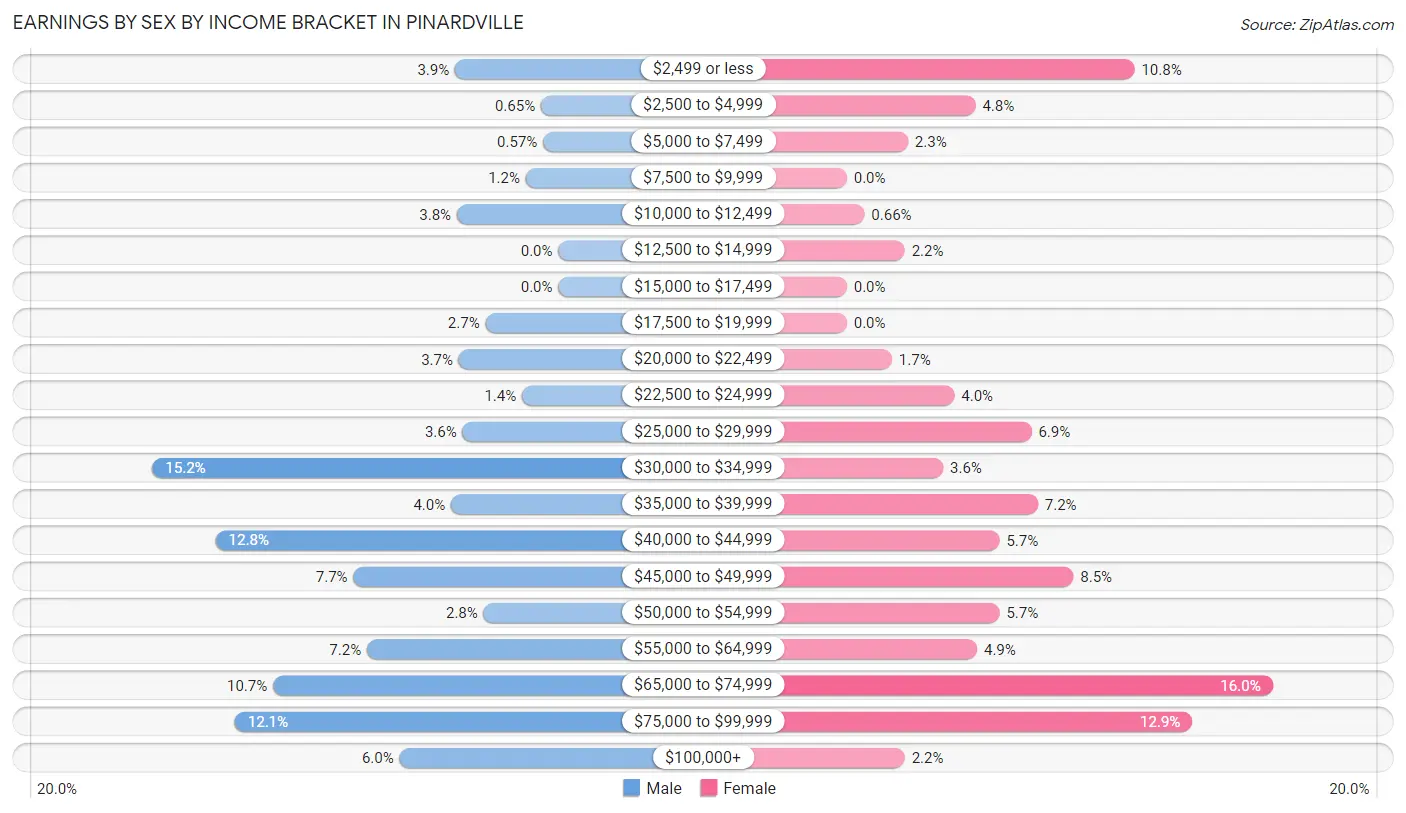
Earnings by Sex by Income Bracket in Pinardville
The most common earnings brackets in Pinardville are $30,000 to $34,999 for men (212 | 15.2%) and $65,000 to $74,999 for women (265 | 16.0%).
| Income | Male | Female |
| $2,499 or less | 54 (3.9%) | 179 (10.8%) |
| $2,500 to $4,999 | 9 (0.6%) | 80 (4.8%) |
| $5,000 to $7,499 | 8 (0.6%) | 38 (2.3%) |
| $7,500 to $9,999 | 17 (1.2%) | 0 (0.0%) |
| $10,000 to $12,499 | 53 (3.8%) | 11 (0.7%) |
| $12,500 to $14,999 | 0 (0.0%) | 36 (2.2%) |
| $15,000 to $17,499 | 0 (0.0%) | 0 (0.0%) |
| $17,500 to $19,999 | 38 (2.7%) | 0 (0.0%) |
| $20,000 to $22,499 | 52 (3.7%) | 28 (1.7%) |
| $22,500 to $24,999 | 19 (1.4%) | 67 (4.0%) |
| $25,000 to $29,999 | 50 (3.6%) | 115 (6.9%) |
| $30,000 to $34,999 | 212 (15.2%) | 60 (3.6%) |
| $35,000 to $39,999 | 56 (4.0%) | 119 (7.2%) |
| $40,000 to $44,999 | 179 (12.8%) | 95 (5.7%) |
| $45,000 to $49,999 | 107 (7.7%) | 141 (8.5%) |
| $50,000 to $54,999 | 39 (2.8%) | 95 (5.7%) |
| $55,000 to $64,999 | 100 (7.2%) | 81 (4.9%) |
| $65,000 to $74,999 | 149 (10.7%) | 265 (16.0%) |
| $75,000 to $99,999 | 169 (12.1%) | 215 (12.9%) |
| $100,000+ | 83 (5.9%) | 36 (2.2%) |
| Total | 1,394 (100.0%) | 1,661 (100.0%) |
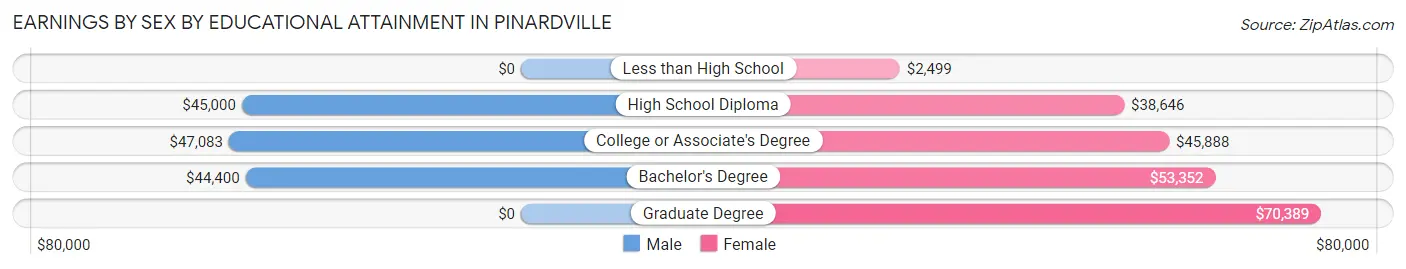
Earnings by Sex by Educational Attainment in Pinardville
Average earnings in Pinardville are $45,875 for men and $49,094 for women, a difference of 6.6%. Men with an educational attainment of college or associate's degree enjoy the highest average annual earnings of $47,083, while those with bachelor's degree education earn the least with $44,400. Women with an educational attainment of graduate degree earn the most with the average annual earnings of $70,389, while those with less than high school education have the smallest earnings of $2,499.
| Educational Attainment | Male Income | Female Income |
| Less than High School | - | - |
| High School Diploma | $45,000 | $38,646 |
| College or Associate's Degree | $47,083 | $45,888 |
| Bachelor's Degree | $44,400 | $53,352 |
| Graduate Degree | - | - |
| Total | $45,875 | $49,094 |
Family Income in Pinardville
Family Income Brackets in Pinardville
According to the Pinardville family income data, there are 395 families falling into the $100,000 to $149,999 income range, which is the most common income bracket and makes up 32.5% of all families.
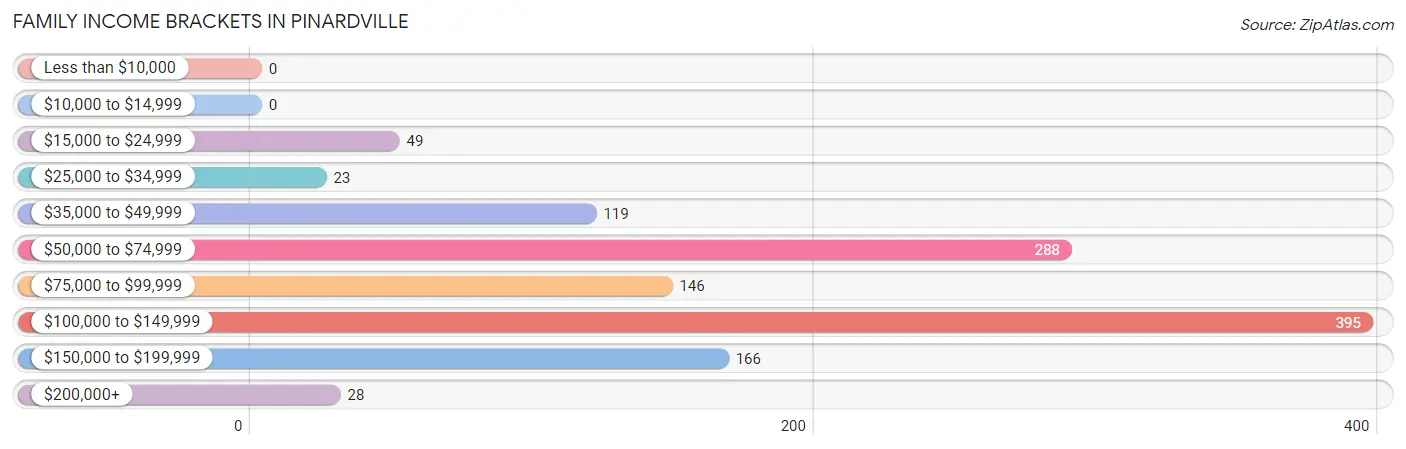
| Income Bracket | # Families | % Families |
| Less than $10,000 | 0 | 0.0% |
| $10,000 to $14,999 | 0 | 0.0% |
| $15,000 to $24,999 | 49 | 4.0% |
| $25,000 to $34,999 | 23 | 1.9% |
| $35,000 to $49,999 | 119 | 9.8% |
| $50,000 to $74,999 | 288 | 23.7% |
| $75,000 to $99,999 | 146 | 12.0% |
| $100,000 to $149,999 | 395 | 32.5% |
| $150,000 to $199,999 | 166 | 13.7% |
| $200,000+ | 28 | 2.3% |
Family Income by Famaliy Size in Pinardville
4-person families (134 | 11.0%) account for the highest median family income in Pinardville with $150,476 per family, while 3-person families (288 | 23.7%) have the highest median income of $39,093 per family member.
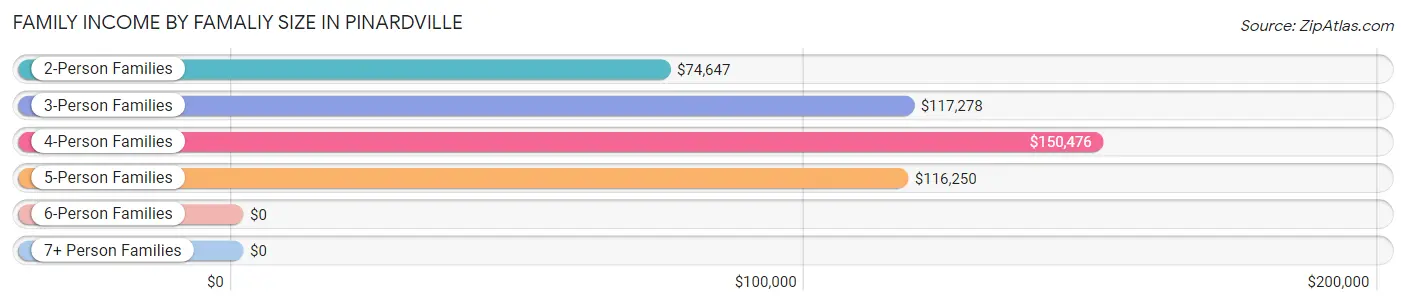
| Income Bracket | # Families | Median Income |
| 2-Person Families | 648 (53.4%) | $74,647 |
| 3-Person Families | 288 (23.7%) | $117,278 |
| 4-Person Families | 134 (11.0%) | $150,476 |
| 5-Person Families | 113 (9.3%) | $116,250 |
| 6-Person Families | 17 (1.4%) | $0 |
| 7+ Person Families | 14 (1.1%) | $0 |
| Total | 1,214 (100.0%) | $91,923 |
Family Income by Number of Earners in Pinardville
The median family income in Pinardville is $91,923, with families comprising 3+ earners (270) having the highest median family income of $150,357, while families with no earners (194) have the lowest median family income of $43,375, accounting for 22.2% and 16.0% of families, respectively.
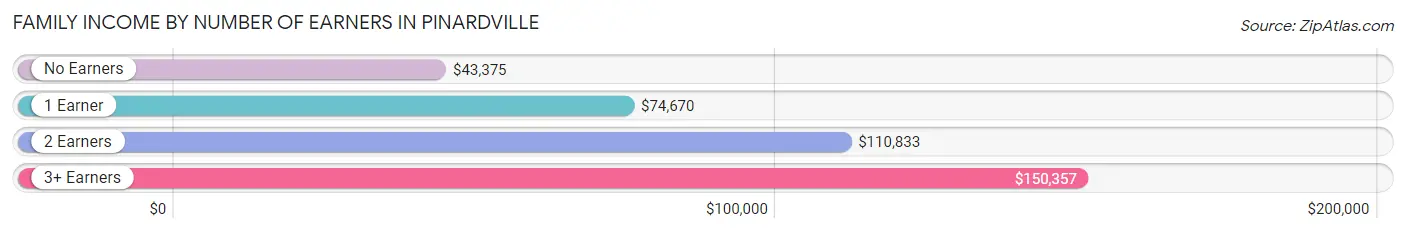
| Number of Earners | # Families | Median Income |
| No Earners | 194 (16.0%) | $43,375 |
| 1 Earner | 220 (18.1%) | $74,670 |
| 2 Earners | 530 (43.7%) | $110,833 |
| 3+ Earners | 270 (22.2%) | $150,357 |
| Total | 1,214 (100.0%) | $91,923 |
Household Income in Pinardville
Household Income Brackets in Pinardville
With 533 households falling in the category, the $50,000 to $74,999 income range is the most frequent in Pinardville, accounting for 25.5% of all households. In contrast, only 94 households (4.5%) fall into the $25,000 to $34,999 income bracket, making it the least populous group.
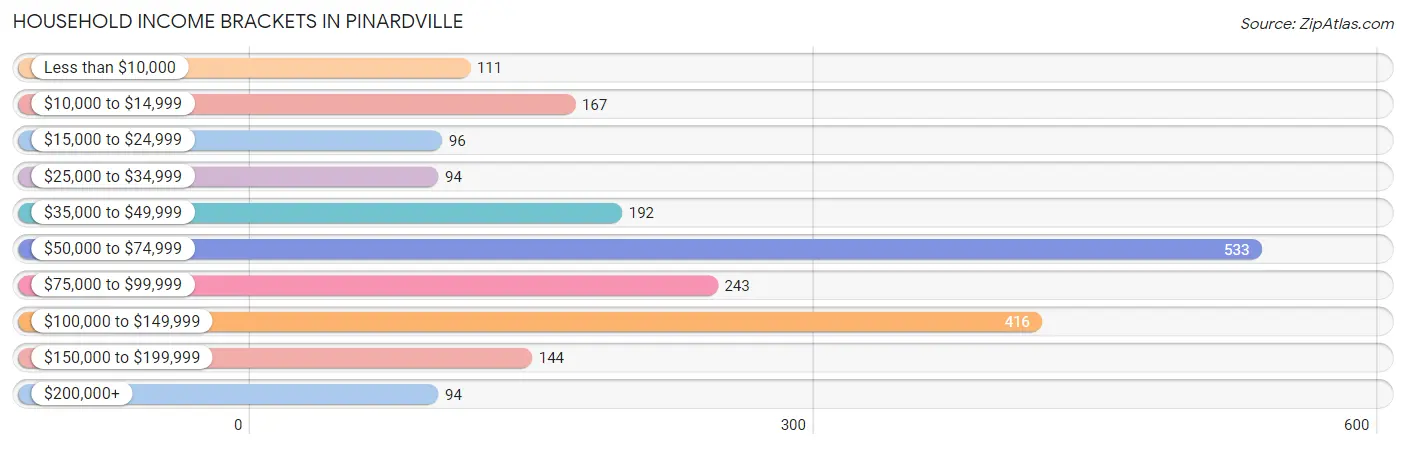
| Income Bracket | # Households | % Households |
| Less than $10,000 | 111 | 5.3% |
| $10,000 to $14,999 | 167 | 8.0% |
| $15,000 to $24,999 | 96 | 4.6% |
| $25,000 to $34,999 | 94 | 4.5% |
| $35,000 to $49,999 | 192 | 9.2% |
| $50,000 to $74,999 | 533 | 25.5% |
| $75,000 to $99,999 | 243 | 11.6% |
| $100,000 to $149,999 | 416 | 19.9% |
| $150,000 to $199,999 | 144 | 6.9% |
| $200,000+ | 94 | 4.5% |
Household Income by Householder Age in Pinardville
The median household income in Pinardville is $71,690, with the highest median household income of $101,688 found in the 15 to 24 years age bracket for the primary householder. A total of 69 households (3.3%) fall into this category. Meanwhile, the 65+ years age bracket for the primary householder has the lowest median household income of $27,554, with 529 households (25.3%) in this group.
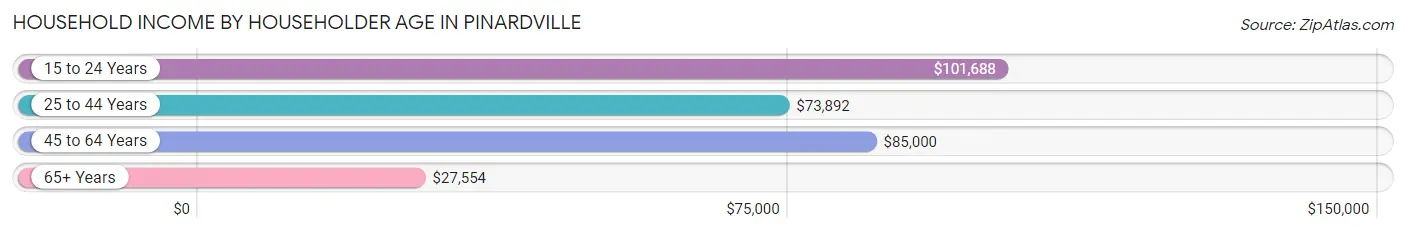
| Income Bracket | # Households | Median Income |
| 15 to 24 Years | 69 (3.3%) | $101,688 |
| 25 to 44 Years | 773 (37.0%) | $73,892 |
| 45 to 64 Years | 720 (34.4%) | $85,000 |
| 65+ Years | 529 (25.3%) | $27,554 |
| Total | 2,091 (100.0%) | $71,690 |
Poverty in Pinardville
Income Below Poverty by Sex and Age in Pinardville
With 6.0% poverty level for males and 12.6% for females among the residents of Pinardville, 18 to 24 year old males and 65 to 74 year old females are the most vulnerable to poverty, with 58 males (31.2%) and 179 females (58.1%) in their respective age groups living below the poverty level.
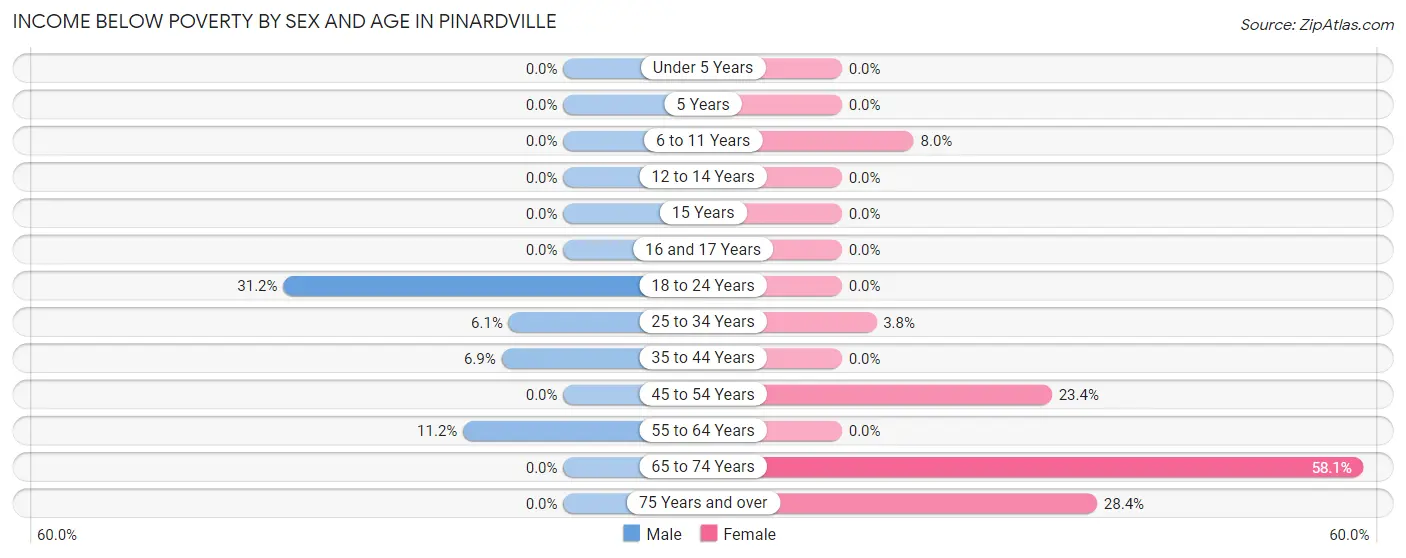
| Age Bracket | Male | Female |
| Under 5 Years | 0 (0.0%) | 0 (0.0%) |
| 5 Years | 0 (0.0%) | 0 (0.0%) |
| 6 to 11 Years | 0 (0.0%) | 24 (8.0%) |
| 12 to 14 Years | 0 (0.0%) | 0 (0.0%) |
| 15 Years | 0 (0.0%) | 0 (0.0%) |
| 16 and 17 Years | 0 (0.0%) | 0 (0.0%) |
| 18 to 24 Years | 58 (31.2%) | 0 (0.0%) |
| 25 to 34 Years | 18 (6.1%) | 11 (3.8%) |
| 35 to 44 Years | 30 (6.9%) | 0 (0.0%) |
| 45 to 54 Years | 0 (0.0%) | 65 (23.4%) |
| 55 to 64 Years | 25 (11.2%) | 0 (0.0%) |
| 65 to 74 Years | 0 (0.0%) | 179 (58.1%) |
| 75 Years and over | 0 (0.0%) | 50 (28.4%) |
| Total | 131 (6.0%) | 329 (12.6%) |
Income Above Poverty by Sex and Age in Pinardville
According to the poverty statistics in Pinardville, males aged under 5 years and females aged under 5 years are the age groups that are most secure financially, with 100.0% of males and 100.0% of females in these age groups living above the poverty line.
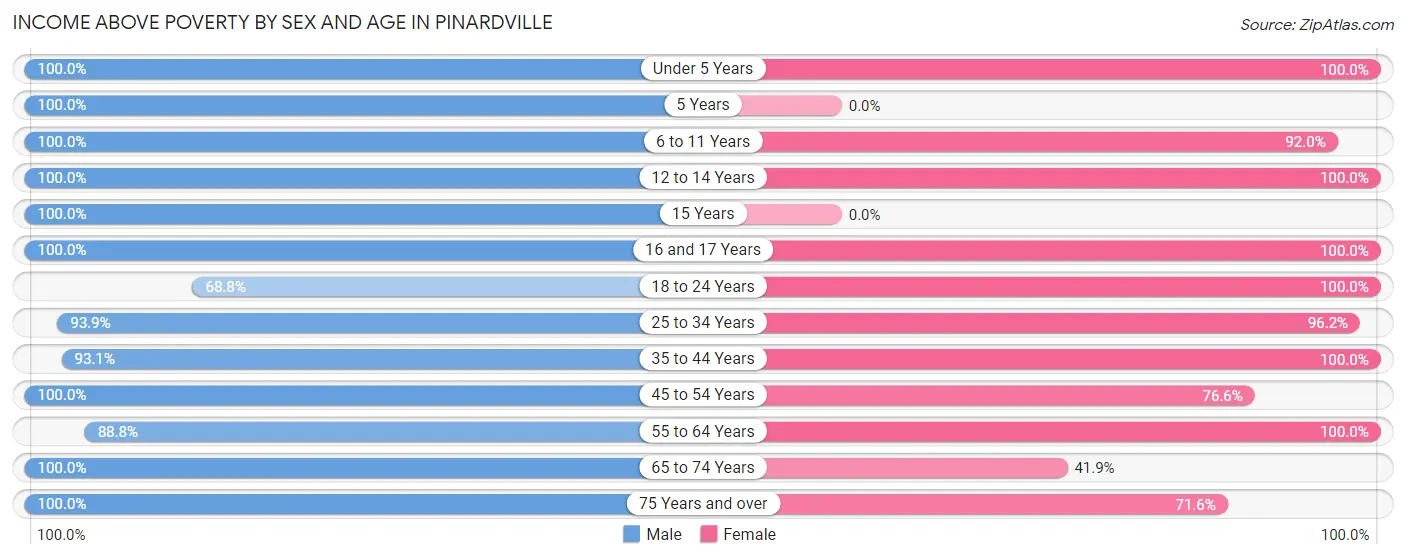
| Age Bracket | Male | Female |
| Under 5 Years | 57 (100.0%) | 21 (100.0%) |
| 5 Years | 16 (100.0%) | 0 (0.0%) |
| 6 to 11 Years | 188 (100.0%) | 276 (92.0%) |
| 12 to 14 Years | 76 (100.0%) | 98 (100.0%) |
| 15 Years | 46 (100.0%) | 0 (0.0%) |
| 16 and 17 Years | 64 (100.0%) | 42 (100.0%) |
| 18 to 24 Years | 128 (68.8%) | 255 (100.0%) |
| 25 to 34 Years | 278 (93.9%) | 276 (96.2%) |
| 35 to 44 Years | 406 (93.1%) | 474 (100.0%) |
| 45 to 54 Years | 260 (100.0%) | 213 (76.6%) |
| 55 to 64 Years | 199 (88.8%) | 373 (100.0%) |
| 65 to 74 Years | 186 (100.0%) | 129 (41.9%) |
| 75 Years and over | 131 (100.0%) | 126 (71.6%) |
| Total | 2,035 (94.0%) | 2,283 (87.4%) |
Income Below Poverty Among Married-Couple Families in Pinardville
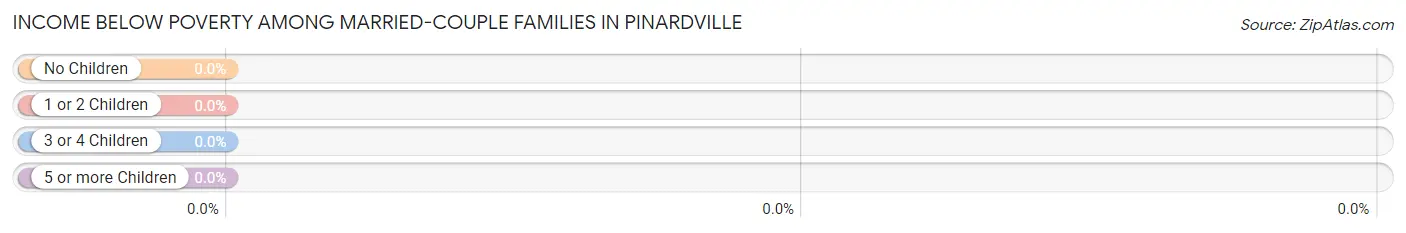
| Children | Above Poverty | Below Poverty |
| No Children | 469 (100.0%) | 0 (0.0%) |
| 1 or 2 Children | 325 (100.0%) | 0 (0.0%) |
| 3 or 4 Children | 67 (100.0%) | 0 (0.0%) |
| 5 or more Children | 0 (0.0%) | 0 (0.0%) |
| Total | 861 (100.0%) | 0 (0.0%) |
Income Below Poverty Among Single-Parent Households in Pinardville
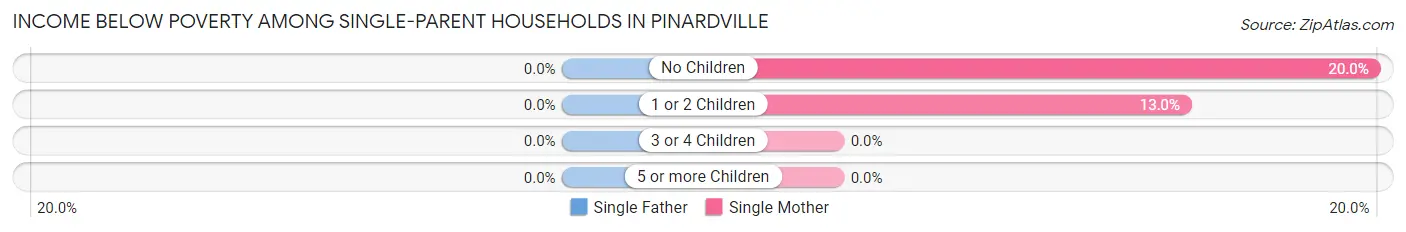
| Children | Single Father | Single Mother |
| No Children | 0 (0.0%) | 9 (20.0%) |
| 1 or 2 Children | 0 (0.0%) | 24 (13.0%) |
| 3 or 4 Children | 0 (0.0%) | 0 (0.0%) |
| 5 or more Children | 0 (0.0%) | 0 (0.0%) |
| Total | 0 (0.0%) | 33 (14.3%) |
Income Below Poverty Among Married-Couple vs Single-Parent Households in Pinardville
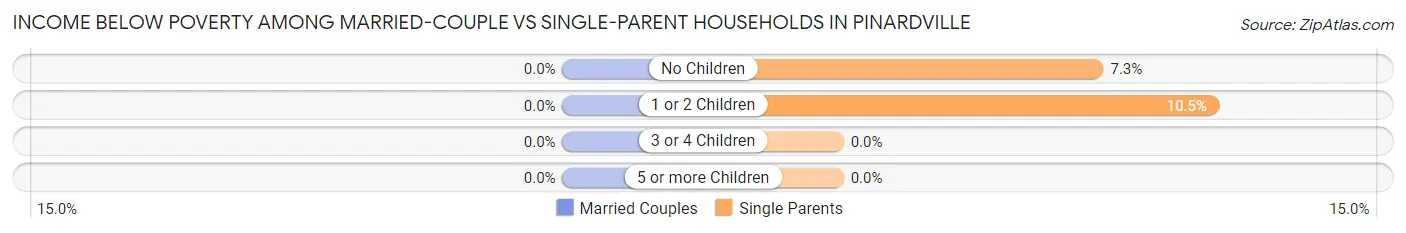
| Children | Married-Couple Families | Single-Parent Households |
| No Children | 0 (0.0%) | 9 (7.3%) |
| 1 or 2 Children | 0 (0.0%) | 24 (10.5%) |
| 3 or 4 Children | 0 (0.0%) | 0 (0.0%) |
| 5 or more Children | 0 (0.0%) | 0 (0.0%) |
| Total | 0 (0.0%) | 33 (9.3%) |
Race in Pinardville
The most populous races in Pinardville are White / Caucasian (4,376 | 90.2%), Two or more Races (247 | 5.1%), and Hispanic or Latino (104 | 2.1%).
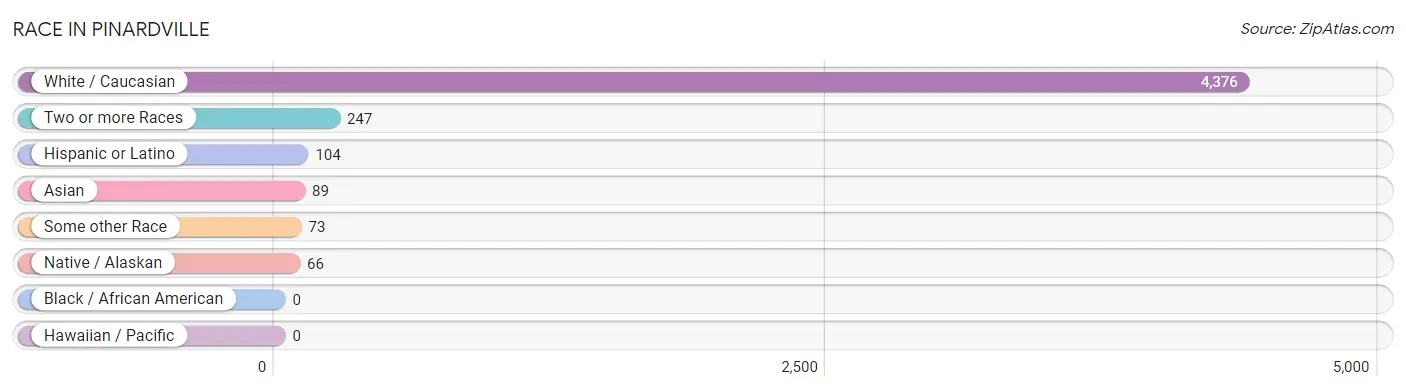
| Race | # Population | % Population |
| Asian | 89 | 1.8% |
| Black / African American | 0 | 0.0% |
| Hawaiian / Pacific | 0 | 0.0% |
| Hispanic or Latino | 104 | 2.1% |
| Native / Alaskan | 66 | 1.4% |
| White / Caucasian | 4,376 | 90.2% |
| Two or more Races | 247 | 5.1% |
| Some other Race | 73 | 1.5% |
| Total | 4,851 | 100.0% |
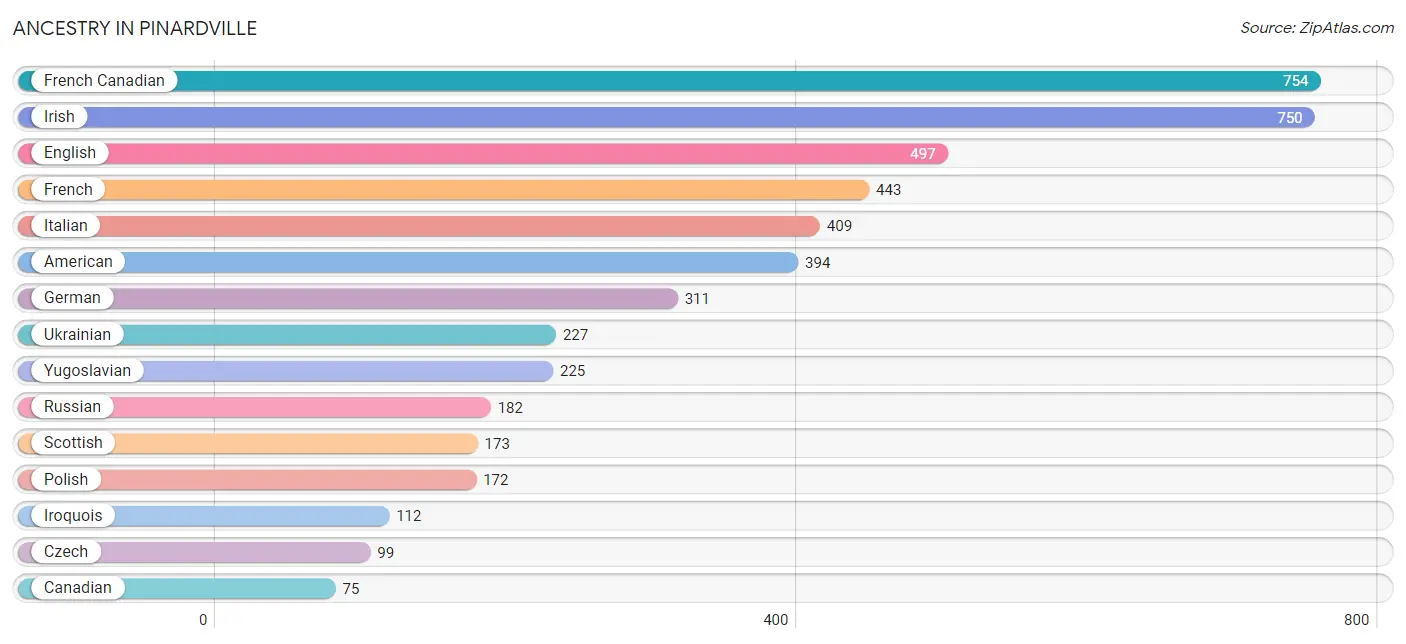
Ancestry in Pinardville
The most populous ancestries reported in Pinardville are French Canadian (754 | 15.5%), Irish (750 | 15.5%), English (497 | 10.2%), French (443 | 9.1%), and Italian (409 | 8.4%), together accounting for 58.8% of all Pinardville residents.
| Ancestry | # Population | % Population |
| Albanian | 24 | 0.5% |
| American | 394 | 8.1% |
| Arab | 44 | 0.9% |
| Bhutanese | 44 | 0.9% |
| British | 50 | 1.0% |
| Canadian | 75 | 1.5% |
| Central American | 23 | 0.5% |
| Cherokee | 49 | 1.0% |
| Czech | 99 | 2.0% |
| Dominican | 21 | 0.4% |
| English | 497 | 10.2% |
| French | 443 | 9.1% |
| French Canadian | 754 | 15.5% |
| German | 311 | 6.4% |
| Greek | 40 | 0.8% |
| Irish | 750 | 15.5% |
| Iroquois | 112 | 2.3% |
| Italian | 409 | 8.4% |
| Korean | 71 | 1.5% |
| Lebanese | 44 | 0.9% |
| Lithuanian | 3 | 0.1% |
| Polish | 172 | 3.5% |
| Portuguese | 51 | 1.1% |
| Puerto Rican | 21 | 0.4% |
| Russian | 182 | 3.7% |
| Salvadoran | 23 | 0.5% |
| Scandinavian | 2 | 0.0% |
| Scotch-Irish | 50 | 1.0% |
| Scottish | 173 | 3.6% |
| Slovak | 18 | 0.4% |
| South American | 39 | 0.8% |
| Sri Lankan | 6 | 0.1% |
| Ukrainian | 227 | 4.7% |
| Uruguayan | 39 | 0.8% |
| Welsh | 30 | 0.6% |
| Yugoslavian | 225 | 4.6% | View All 36 Rows |
Immigrants in Pinardville
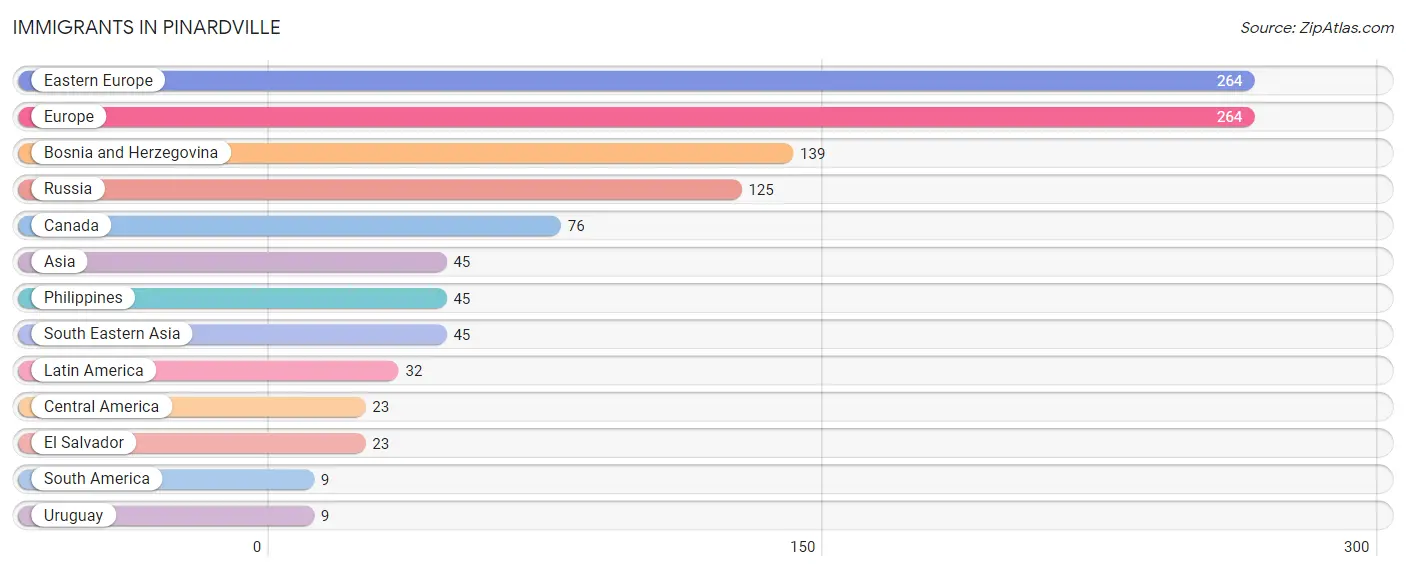
The most numerous immigrant groups reported in Pinardville came from Eastern Europe (264 | 5.4%), Europe (264 | 5.4%), Bosnia and Herzegovina (139 | 2.9%), Russia (125 | 2.6%), and Canada (76 | 1.6%), together accounting for 17.9% of all Pinardville residents.
| Immigration Origin | # Population | % Population |
| Asia | 45 | 0.9% |
| Bosnia and Herzegovina | 139 | 2.9% |
| Canada | 76 | 1.6% |
| Central America | 23 | 0.5% |
| Eastern Europe | 264 | 5.4% |
| El Salvador | 23 | 0.5% |
| Europe | 264 | 5.4% |
| Latin America | 32 | 0.7% |
| Philippines | 45 | 0.9% |
| Russia | 125 | 2.6% |
| South America | 9 | 0.2% |
| South Eastern Asia | 45 | 0.9% |
| Uruguay | 9 | 0.2% | View All 13 Rows |
Sex and Age in Pinardville
Sex and Age in Pinardville
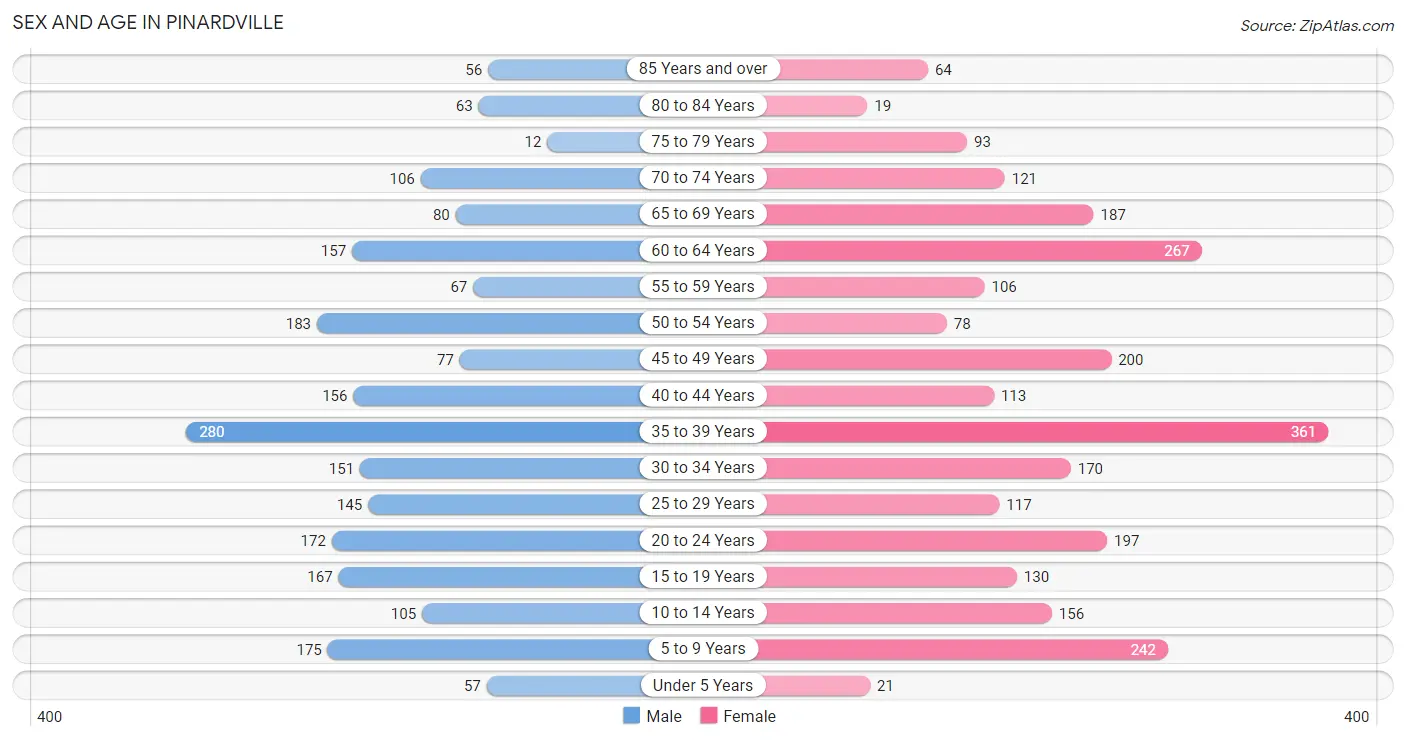
The most populous age groups in Pinardville are 35 to 39 Years (280 | 12.7%) for men and 35 to 39 Years (361 | 13.7%) for women.
| Age Bracket | Male | Female |
| Under 5 Years | 57 (2.6%) | 21 (0.8%) |
| 5 to 9 Years | 175 (7.9%) | 242 (9.2%) |
| 10 to 14 Years | 105 (4.8%) | 156 (5.9%) |
| 15 to 19 Years | 167 (7.6%) | 130 (4.9%) |
| 20 to 24 Years | 172 (7.8%) | 197 (7.5%) |
| 25 to 29 Years | 145 (6.6%) | 117 (4.4%) |
| 30 to 34 Years | 151 (6.8%) | 170 (6.4%) |
| 35 to 39 Years | 280 (12.7%) | 361 (13.7%) |
| 40 to 44 Years | 156 (7.1%) | 113 (4.3%) |
| 45 to 49 Years | 77 (3.5%) | 200 (7.6%) |
| 50 to 54 Years | 183 (8.3%) | 78 (2.9%) |
| 55 to 59 Years | 67 (3.0%) | 106 (4.0%) |
| 60 to 64 Years | 157 (7.1%) | 267 (10.1%) |
| 65 to 69 Years | 80 (3.6%) | 187 (7.1%) |
| 70 to 74 Years | 106 (4.8%) | 121 (4.6%) |
| 75 to 79 Years | 12 (0.5%) | 93 (3.5%) |
| 80 to 84 Years | 63 (2.9%) | 19 (0.7%) |
| 85 Years and over | 56 (2.5%) | 64 (2.4%) |
| Total | 2,209 (100.0%) | 2,642 (100.0%) |
Families and Households in Pinardville
Median Family Size in Pinardville
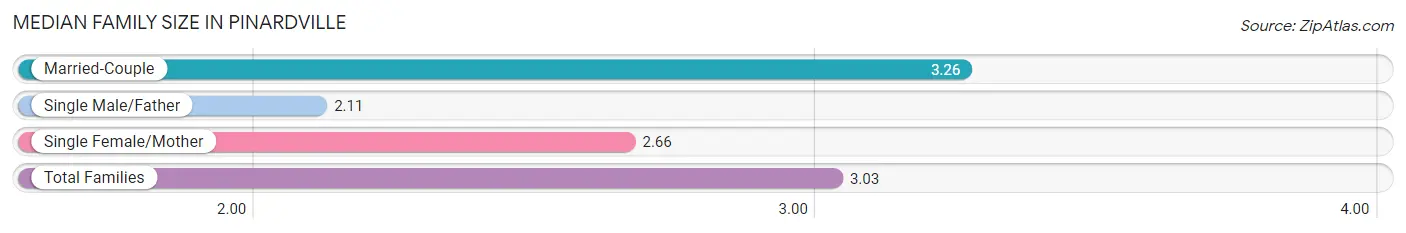
The median family size in Pinardville is 3.03 persons per family, with married-couple families (861 | 70.9%) accounting for the largest median family size of 3.26 persons per family. On the other hand, single male/father families (123 | 10.1%) represent the smallest median family size with 2.11 persons per family.
| Family Type | # Families | Family Size |
| Married-Couple | 861 (70.9%) | 3.26 |
| Single Male/Father | 123 (10.1%) | 2.11 |
| Single Female/Mother | 230 (19.0%) | 2.66 |
| Total Families | 1,214 (100.0%) | 3.03 |
Median Household Size in Pinardville
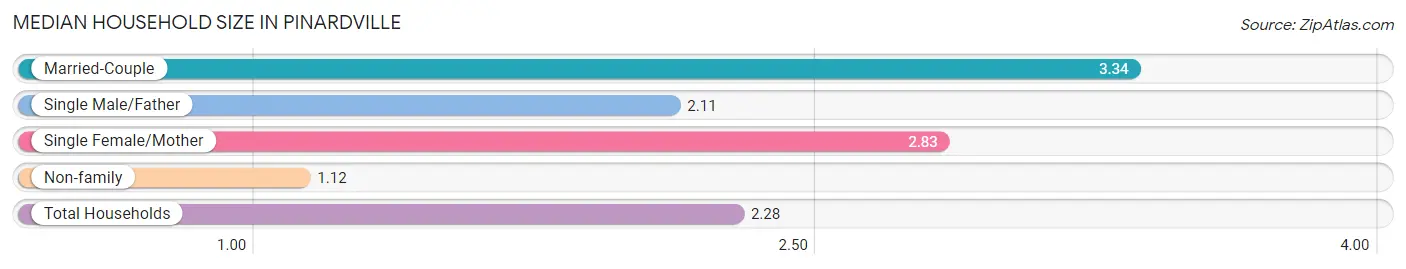
The median household size in Pinardville is 2.28 persons per household, with married-couple households (861 | 41.2%) accounting for the largest median household size of 3.34 persons per household. non-family households (877 | 41.9%) represent the smallest median household size with 1.12 persons per household.
| Household Type | # Households | Household Size |
| Married-Couple | 861 (41.2%) | 3.34 |
| Single Male/Father | 123 (5.9%) | 2.11 |
| Single Female/Mother | 230 (11.0%) | 2.83 |
| Non-family | 877 (41.9%) | 1.12 |
| Total Households | 2,091 (100.0%) | 2.28 |
Household Size by Marriage Status in Pinardville
Out of a total of 2,091 households in Pinardville, 1,214 (58.1%) are family households, while 877 (41.9%) are nonfamily households. The most numerous type of family households are 2-person households, comprising 626, and the most common type of nonfamily households are 1-person households, comprising 781.
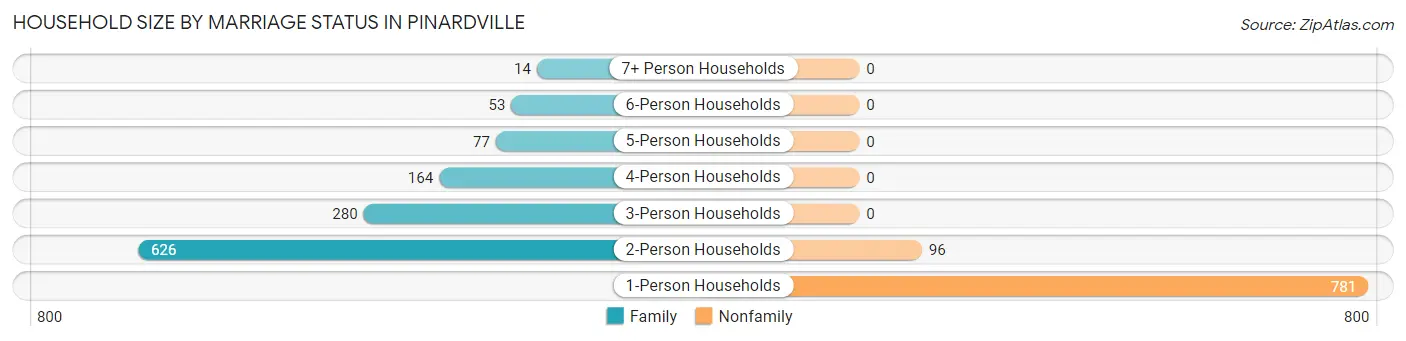
| Household Size | Family Households | Nonfamily Households |
| 1-Person Households | - | 781 (37.3%) |
| 2-Person Households | 626 (29.9%) | 96 (4.6%) |
| 3-Person Households | 280 (13.4%) | 0 (0.0%) |
| 4-Person Households | 164 (7.8%) | 0 (0.0%) |
| 5-Person Households | 77 (3.7%) | 0 (0.0%) |
| 6-Person Households | 53 (2.5%) | 0 (0.0%) |
| 7+ Person Households | 14 (0.7%) | 0 (0.0%) |
| Total | 1,214 (58.1%) | 877 (41.9%) |
Female Fertility in Pinardville
Fertility by Age in Pinardville
| Age Bracket | Women with Births | Births / 1,000 Women |
| 15 to 19 years | 0 (0.0%) | 0.0 |
| 20 to 34 years | 0 (0.0%) | 0.0 |
| 35 to 50 years | 0 (0.0%) | 0.0 |
| Total | 0 (0.0%) | 0.0 |
Fertility by Age by Marriage Status in Pinardville
| Age Bracket | Married | Unmarried |
| 15 to 19 years | 0 (0.0%) | 0 (0.0%) |
| 20 to 34 years | 0 (0.0%) | 0 (0.0%) |
| 35 to 50 years | 0 (0.0%) | 0 (0.0%) |
| Total | 0 (0.0%) | 0 (0.0%) |
Fertility by Education in Pinardville
| Educational Attainment | Women with Births | Births / 1,000 Women |
| Less than High School | 0 (0.0%) | 0.0 |
| High School Diploma | 0 (0.0%) | 0.0 |
| College or Associate's Degree | 0 (0.0%) | 0.0 |
| Bachelor's Degree | 0 (0.0%) | 0.0 |
| Graduate Degree | 0 (0.0%) | 0.0 |
| Total | 0 (0.0%) | 0.0 |
Fertility by Education by Marriage Status in Pinardville
| Educational Attainment | Married | Unmarried |
| Less than High School | 0 (0.0%) | 0 (0.0%) |
| High School Diploma | 0 (0.0%) | 0 (0.0%) |
| College or Associate's Degree | 0 (0.0%) | 0 (0.0%) |
| Bachelor's Degree | 0 (0.0%) | 0 (0.0%) |
| Graduate Degree | 0 (0.0%) | 0 (0.0%) |
| Total | 0 (0.0%) | 0 (0.0%) |
Employment Characteristics in Pinardville
Employment by Class of Employer in Pinardville
Among the 2,670 employed individuals in Pinardville, private company employees (1,776 | 66.5%), not-for-profit organizations (267 | 10.0%), and self-employed (not incorporated) (253 | 9.5%) make up the most common classes of employment.
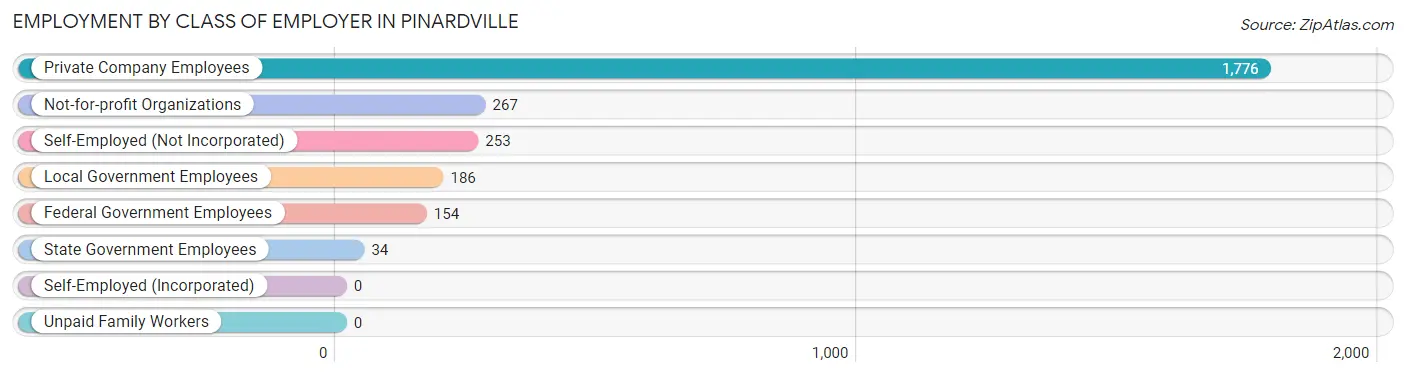
| Employer Class | # Employees | % Employees |
| Private Company Employees | 1,776 | 66.5% |
| Self-Employed (Incorporated) | 0 | 0.0% |
| Self-Employed (Not Incorporated) | 253 | 9.5% |
| Not-for-profit Organizations | 267 | 10.0% |
| Local Government Employees | 186 | 7.0% |
| State Government Employees | 34 | 1.3% |
| Federal Government Employees | 154 | 5.8% |
| Unpaid Family Workers | 0 | 0.0% |
| Total | 2,670 | 100.0% |
Employment Status by Age in Pinardville
According to the labor force statistics for Pinardville, out of the total population over 16 years of age (4,049), 70.8% or 2,867 individuals are in the labor force, with 0.8% or 23 of them unemployed. The age group with the highest labor force participation rate is 30 to 34 years, with 94.4% or 303 individuals in the labor force. Within the labor force, the 25 to 29 years age range has the highest percentage of unemployed individuals, with 3.0% or 7 of them being unemployed.
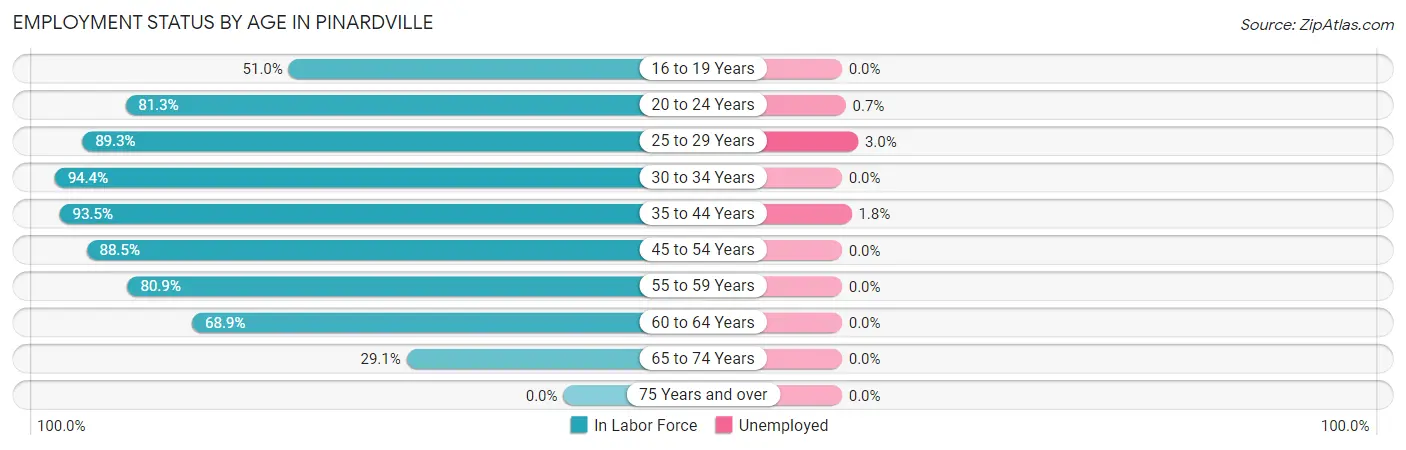
| Age Bracket | In Labor Force | Unemployed |
| 16 to 19 Years | 128 (51.0%) | 0 (0.0%) |
| 20 to 24 Years | 300 (81.3%) | 2 (0.7%) |
| 25 to 29 Years | 234 (89.3%) | 7 (3.0%) |
| 30 to 34 Years | 303 (94.4%) | 0 (0.0%) |
| 35 to 44 Years | 851 (93.5%) | 15 (1.8%) |
| 45 to 54 Years | 476 (88.5%) | 0 (0.0%) |
| 55 to 59 Years | 140 (80.9%) | 0 (0.0%) |
| 60 to 64 Years | 292 (68.9%) | 0 (0.0%) |
| 65 to 74 Years | 144 (29.1%) | 0 (0.0%) |
| 75 Years and over | 0 (0.0%) | 0 (0.0%) |
| Total | 2,867 (70.8%) | 23 (0.8%) |
Employment Status by Educational Attainment in Pinardville
According to labor force statistics for Pinardville, 87.4% of individuals (2,297) out of the total population between 25 and 64 years of age (2,628) are in the labor force, with 1.0% or 23 of them being unemployed. The group with the highest labor force participation rate are those with the educational attainment of bachelor's degree or higher, with 96.5% or 871 individuals in the labor force. Within the labor force, individuals with high school diploma education have the highest percentage of unemployment, with 2.6% or 15 of them being unemployed.

| Educational Attainment | In Labor Force | Unemployed |
| Less than High School | 117 (49.6%) | 0 (0.0%) |
| High School Diploma | 573 (93.0%) | 16 (2.6%) |
| College / Associate Degree | 735 (84.2%) | 0 (0.0%) |
| Bachelor's Degree or higher | 871 (96.5%) | 7 (0.8%) |
| Total | 2,297 (87.4%) | 26 (1.0%) |
Employment Occupations by Sex in Pinardville
Management, Business, Science and Arts Occupations
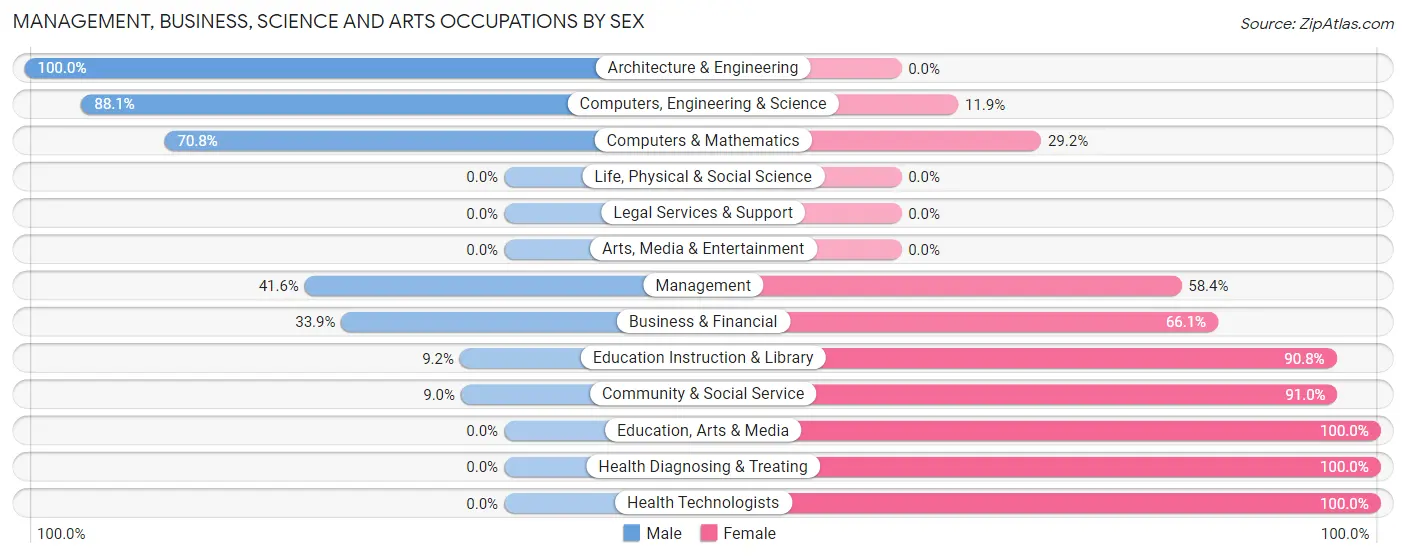
The most common Management, Business, Science and Arts occupations in Pinardville are Management (356 | 12.5%), Community & Social Service (300 | 10.5%), Education Instruction & Library (293 | 10.3%), Business & Financial (168 | 5.9%), and Health Diagnosing & Treating (111 | 3.9%).
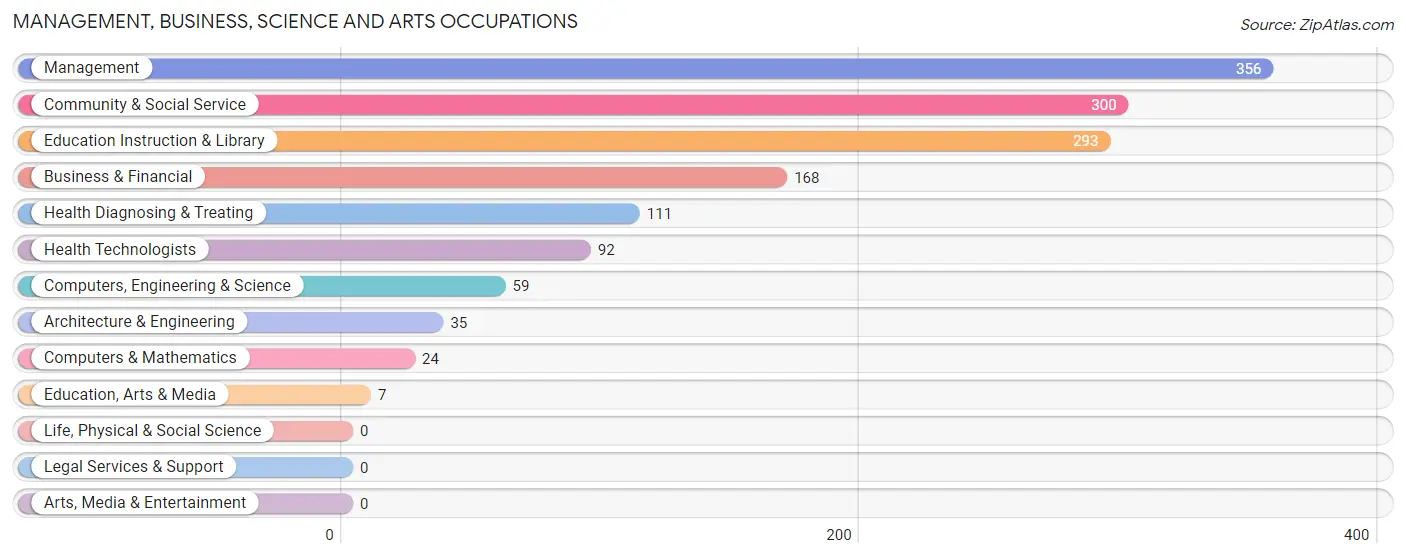
Management, Business, Science and Arts Occupations by Sex
Within the Management, Business, Science and Arts occupations in Pinardville, the most male-oriented occupations are Architecture & Engineering (100.0%), Computers, Engineering & Science (88.1%), and Computers & Mathematics (70.8%), while the most female-oriented occupations are Education, Arts & Media (100.0%), Health Diagnosing & Treating (100.0%), and Health Technologists (100.0%).
| Occupation | Male | Female |
| Management | 148 (41.6%) | 208 (58.4%) |
| Business & Financial | 57 (33.9%) | 111 (66.1%) |
| Computers, Engineering & Science | 52 (88.1%) | 7 (11.9%) |
| Computers & Mathematics | 17 (70.8%) | 7 (29.2%) |
| Architecture & Engineering | 35 (100.0%) | 0 (0.0%) |
| Life, Physical & Social Science | 0 (0.0%) | 0 (0.0%) |
| Community & Social Service | 27 (9.0%) | 273 (91.0%) |
| Education, Arts & Media | 0 (0.0%) | 7 (100.0%) |
| Legal Services & Support | 0 (0.0%) | 0 (0.0%) |
| Education Instruction & Library | 27 (9.2%) | 266 (90.8%) |
| Arts, Media & Entertainment | 0 (0.0%) | 0 (0.0%) |
| Health Diagnosing & Treating | 0 (0.0%) | 111 (100.0%) |
| Health Technologists | 0 (0.0%) | 92 (100.0%) |
| Total (Category) | 284 (28.6%) | 710 (71.4%) |
| Total (Overall) | 1,331 (46.8%) | 1,513 (53.2%) |
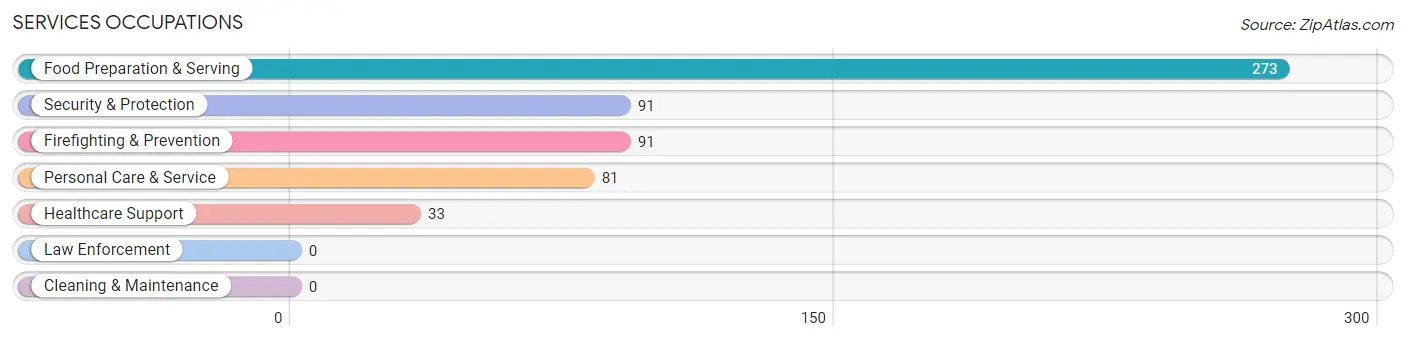
Services Occupations
The most common Services occupations in Pinardville are Food Preparation & Serving (273 | 9.6%), Security & Protection (91 | 3.2%), Firefighting & Prevention (91 | 3.2%), Personal Care & Service (81 | 2.9%), and Healthcare Support (33 | 1.2%).
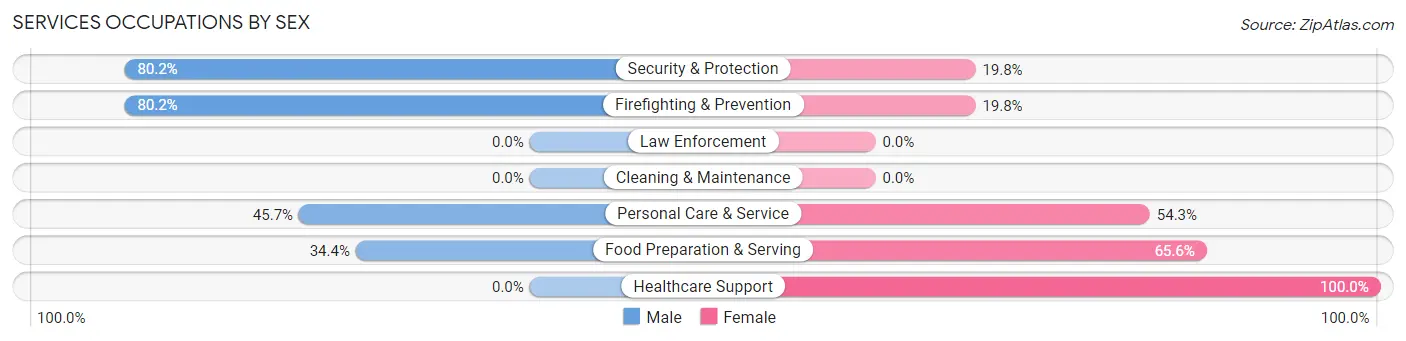
Services Occupations by Sex
Within the Services occupations in Pinardville, the most male-oriented occupations are Security & Protection (80.2%), Firefighting & Prevention (80.2%), and Personal Care & Service (45.7%), while the most female-oriented occupations are Healthcare Support (100.0%), Food Preparation & Serving (65.6%), and Personal Care & Service (54.3%).
| Occupation | Male | Female |
| Healthcare Support | 0 (0.0%) | 33 (100.0%) |
| Security & Protection | 73 (80.2%) | 18 (19.8%) |
| Firefighting & Prevention | 73 (80.2%) | 18 (19.8%) |
| Law Enforcement | 0 (0.0%) | 0 (0.0%) |
| Food Preparation & Serving | 94 (34.4%) | 179 (65.6%) |
| Cleaning & Maintenance | 0 (0.0%) | 0 (0.0%) |
| Personal Care & Service | 37 (45.7%) | 44 (54.3%) |
| Total (Category) | 204 (42.7%) | 274 (57.3%) |
| Total (Overall) | 1,331 (46.8%) | 1,513 (53.2%) |
Sales and Office Occupations
The most common Sales and Office occupations in Pinardville are Office & Administration (484 | 17.0%), and Sales & Related (222 | 7.8%).

Sales and Office Occupations by Sex

| Occupation | Male | Female |
| Sales & Related | 125 (56.3%) | 97 (43.7%) |
| Office & Administration | 149 (30.8%) | 335 (69.2%) |
| Total (Category) | 274 (38.8%) | 432 (61.2%) |
| Total (Overall) | 1,331 (46.8%) | 1,513 (53.2%) |
Natural Resources, Construction and Maintenance Occupations
The most common Natural Resources, Construction and Maintenance occupations in Pinardville are Installation, Maintenance & Repair (135 | 4.8%), Construction & Extraction (123 | 4.3%), and Farming, Fishing & Forestry (35 | 1.2%).

Natural Resources, Construction and Maintenance Occupations by Sex

| Occupation | Male | Female |
| Farming, Fishing & Forestry | 35 (100.0%) | 0 (0.0%) |
| Construction & Extraction | 123 (100.0%) | 0 (0.0%) |
| Installation, Maintenance & Repair | 135 (100.0%) | 0 (0.0%) |
| Total (Category) | 293 (100.0%) | 0 (0.0%) |
| Total (Overall) | 1,331 (46.8%) | 1,513 (53.2%) |
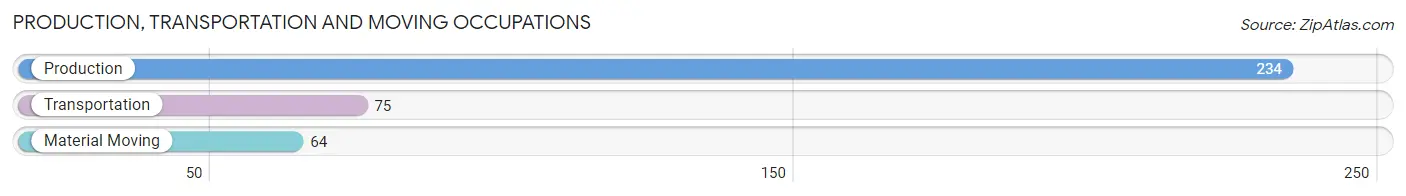
Production, Transportation and Moving Occupations
The most common Production, Transportation and Moving occupations in Pinardville are Production (234 | 8.2%), Transportation (75 | 2.6%), and Material Moving (64 | 2.2%).
Production, Transportation and Moving Occupations by Sex
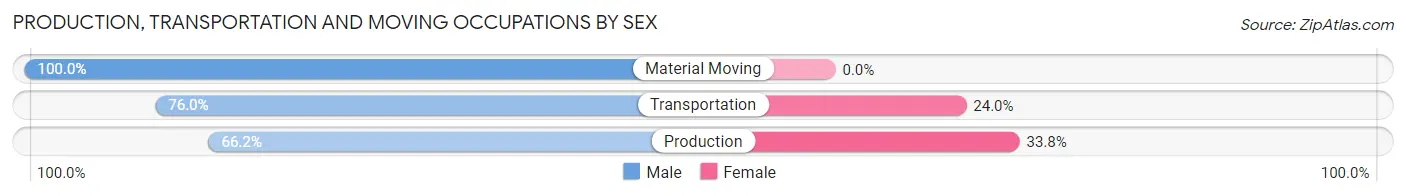
| Occupation | Male | Female |
| Production | 155 (66.2%) | 79 (33.8%) |
| Transportation | 57 (76.0%) | 18 (24.0%) |
| Material Moving | 64 (100.0%) | 0 (0.0%) |
| Total (Category) | 276 (74.0%) | 97 (26.0%) |
| Total (Overall) | 1,331 (46.8%) | 1,513 (53.2%) |
Employment Industries by Sex in Pinardville
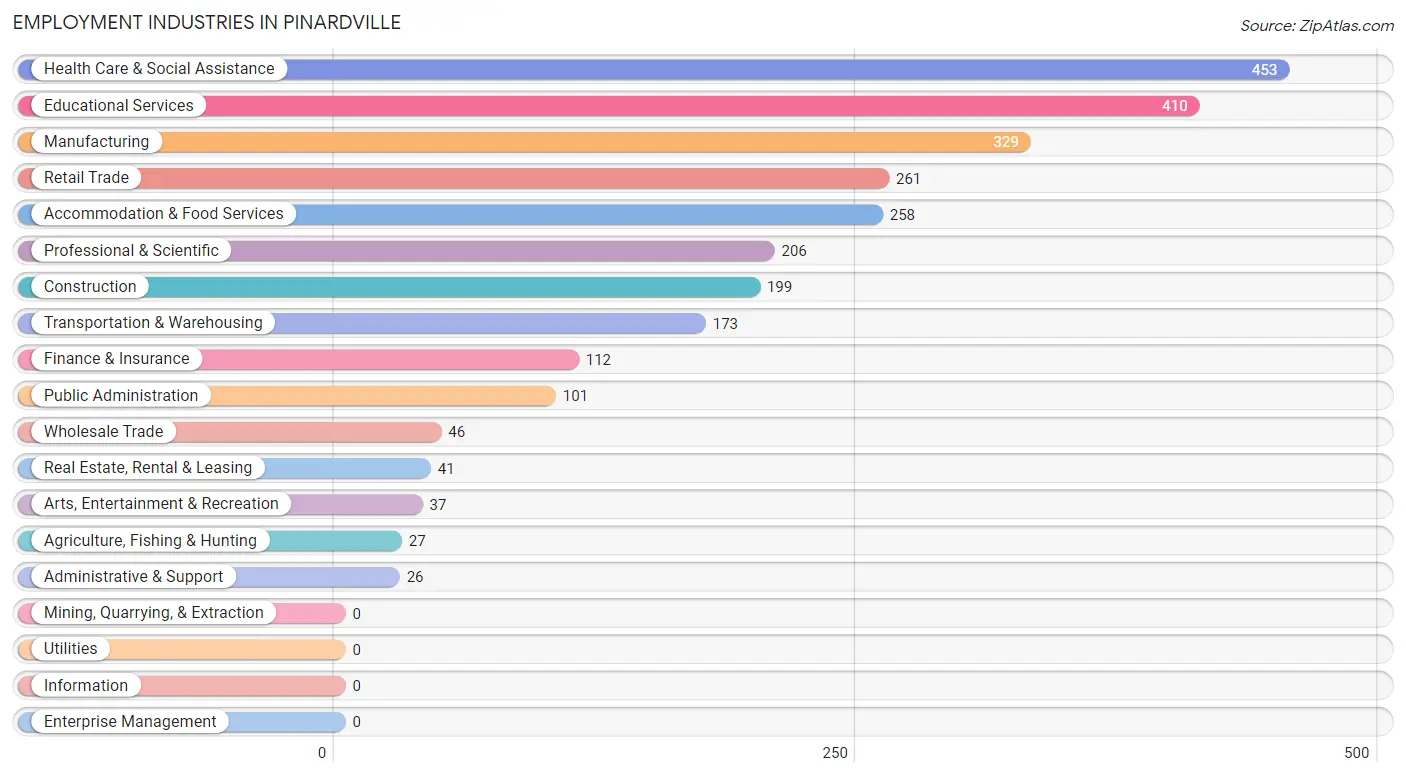
Employment Industries in Pinardville
The major employment industries in Pinardville include Health Care & Social Assistance (453 | 15.9%), Educational Services (410 | 14.4%), Manufacturing (329 | 11.6%), Retail Trade (261 | 9.2%), and Accommodation & Food Services (258 | 9.1%).
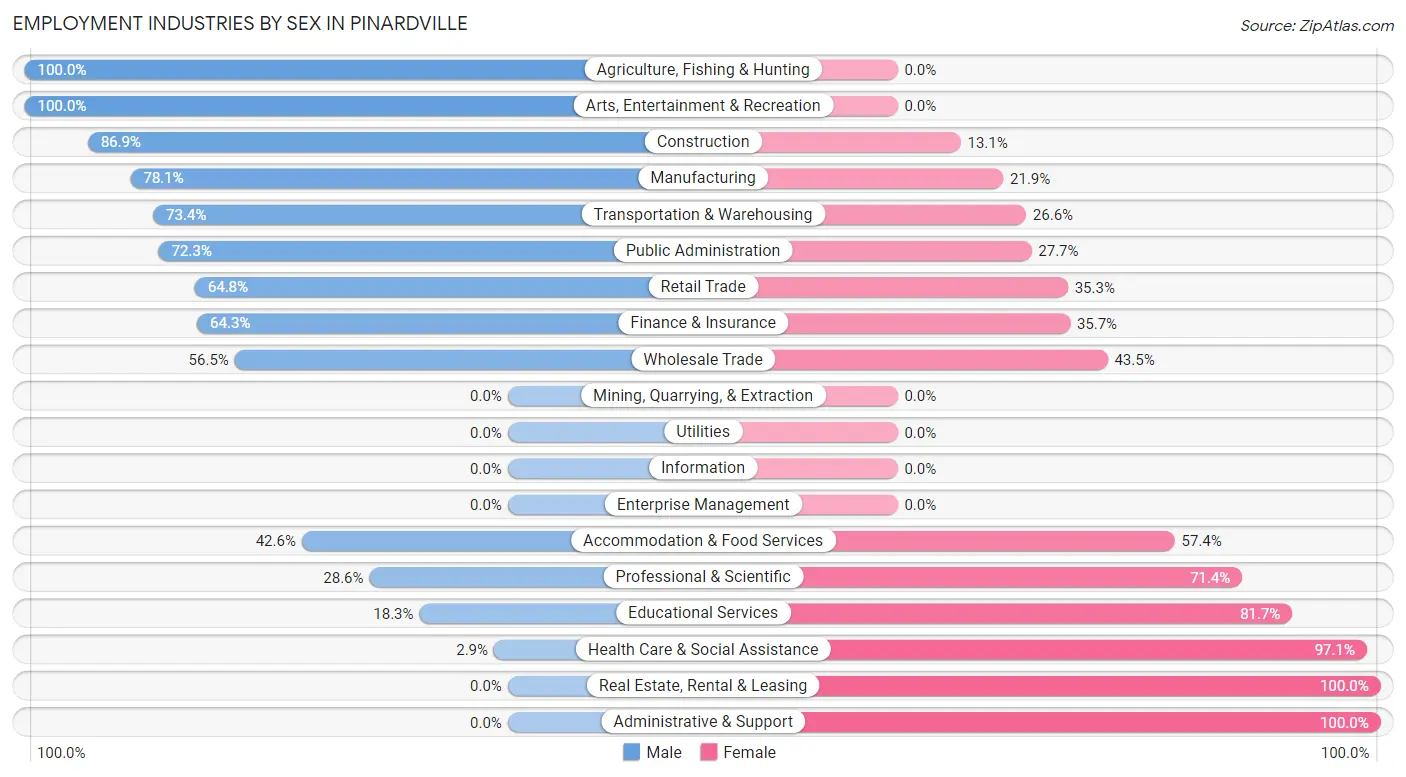
Employment Industries by Sex in Pinardville
The Pinardville industries that see more men than women are Agriculture, Fishing & Hunting (100.0%), Arts, Entertainment & Recreation (100.0%), and Construction (86.9%), whereas the industries that tend to have a higher number of women are Real Estate, Rental & Leasing (100.0%), Administrative & Support (100.0%), and Health Care & Social Assistance (97.1%).
| Industry | Male | Female |
| Agriculture, Fishing & Hunting | 27 (100.0%) | 0 (0.0%) |
| Mining, Quarrying, & Extraction | 0 (0.0%) | 0 (0.0%) |
| Construction | 173 (86.9%) | 26 (13.1%) |
| Manufacturing | 257 (78.1%) | 72 (21.9%) |
| Wholesale Trade | 26 (56.5%) | 20 (43.5%) |
| Retail Trade | 169 (64.7%) | 92 (35.2%) |
| Transportation & Warehousing | 127 (73.4%) | 46 (26.6%) |
| Utilities | 0 (0.0%) | 0 (0.0%) |
| Information | 0 (0.0%) | 0 (0.0%) |
| Finance & Insurance | 72 (64.3%) | 40 (35.7%) |
| Real Estate, Rental & Leasing | 0 (0.0%) | 41 (100.0%) |
| Professional & Scientific | 59 (28.6%) | 147 (71.4%) |
| Enterprise Management | 0 (0.0%) | 0 (0.0%) |
| Administrative & Support | 0 (0.0%) | 26 (100.0%) |
| Educational Services | 75 (18.3%) | 335 (81.7%) |
| Health Care & Social Assistance | 13 (2.9%) | 440 (97.1%) |
| Arts, Entertainment & Recreation | 37 (100.0%) | 0 (0.0%) |
| Accommodation & Food Services | 110 (42.6%) | 148 (57.4%) |
| Public Administration | 73 (72.3%) | 28 (27.7%) |
| Total | 1,331 (46.8%) | 1,513 (53.2%) |
Education in Pinardville
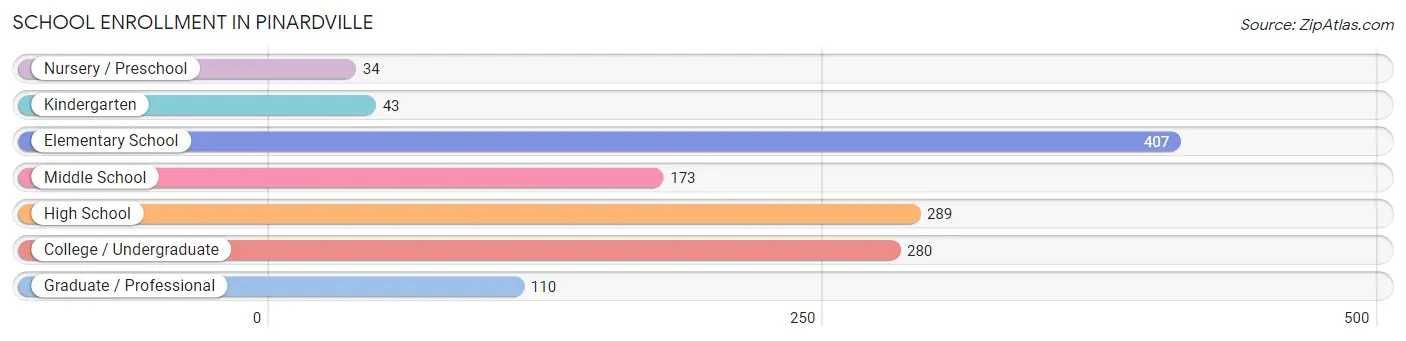
School Enrollment in Pinardville
The most common levels of schooling among the 1,336 students in Pinardville are elementary school (407 | 30.5%), high school (289 | 21.6%), and college / undergraduate (280 | 21.0%).
| School Level | # Students | % Students |
| Nursery / Preschool | 34 | 2.5% |
| Kindergarten | 43 | 3.2% |
| Elementary School | 407 | 30.5% |
| Middle School | 173 | 13.0% |
| High School | 289 | 21.6% |
| College / Undergraduate | 280 | 21.0% |
| Graduate / Professional | 110 | 8.2% |
| Total | 1,336 | 100.0% |
School Enrollment by Age by Funding Source in Pinardville
Out of a total of 1,336 students who are enrolled in schools in Pinardville, 257 (19.2%) attend a private institution, while the remaining 1,079 (80.8%) are enrolled in public schools. The age group of 25 to 34 year olds has the highest likelihood of being enrolled in private schools, with 81 (57.5% in the age bracket) enrolled. Conversely, the age group of 3 to 4 year olds has the lowest likelihood of being enrolled in a private school, with 34 (100.0% in the age bracket) attending a public institution.
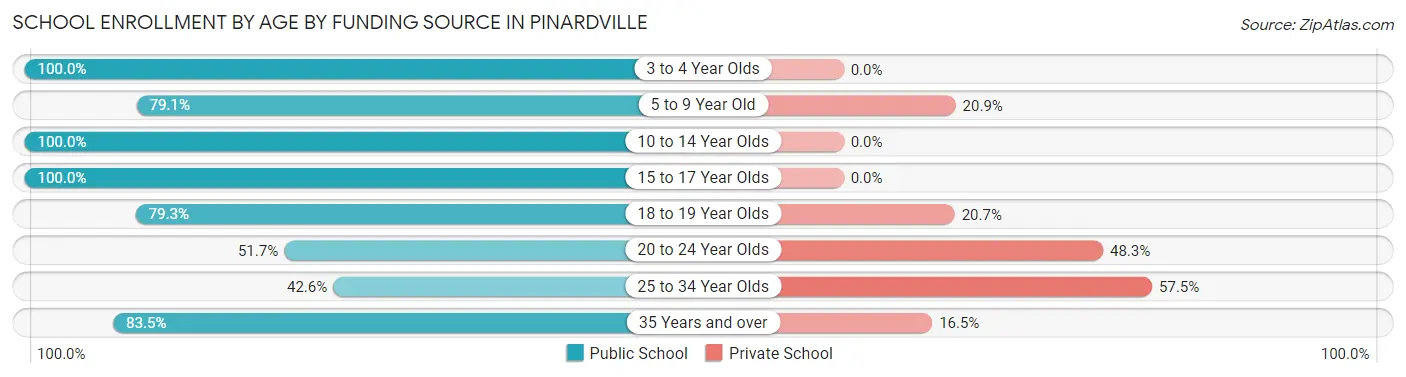
| Age Bracket | Public School | Private School |
| 3 to 4 Year Olds | 34 (100.0%) | 0 (0.0%) |
| 5 to 9 Year Old | 330 (79.1%) | 87 (20.9%) |
| 10 to 14 Year Olds | 261 (100.0%) | 0 (0.0%) |
| 15 to 17 Year Olds | 152 (100.0%) | 0 (0.0%) |
| 18 to 19 Year Olds | 115 (79.3%) | 30 (20.7%) |
| 20 to 24 Year Olds | 46 (51.7%) | 43 (48.3%) |
| 25 to 34 Year Olds | 60 (42.5%) | 81 (57.5%) |
| 35 Years and over | 81 (83.5%) | 16 (16.5%) |
| Total | 1,079 (80.8%) | 257 (19.2%) |
Educational Attainment by Field of Study in Pinardville
Psychology (221 | 20.5%), business (190 | 17.6%), science & technology (149 | 13.8%), education (110 | 10.2%), and bio, nature & agricultural (104 | 9.6%) are the most common fields of study among 1,079 individuals in Pinardville who have obtained a bachelor's degree or higher.
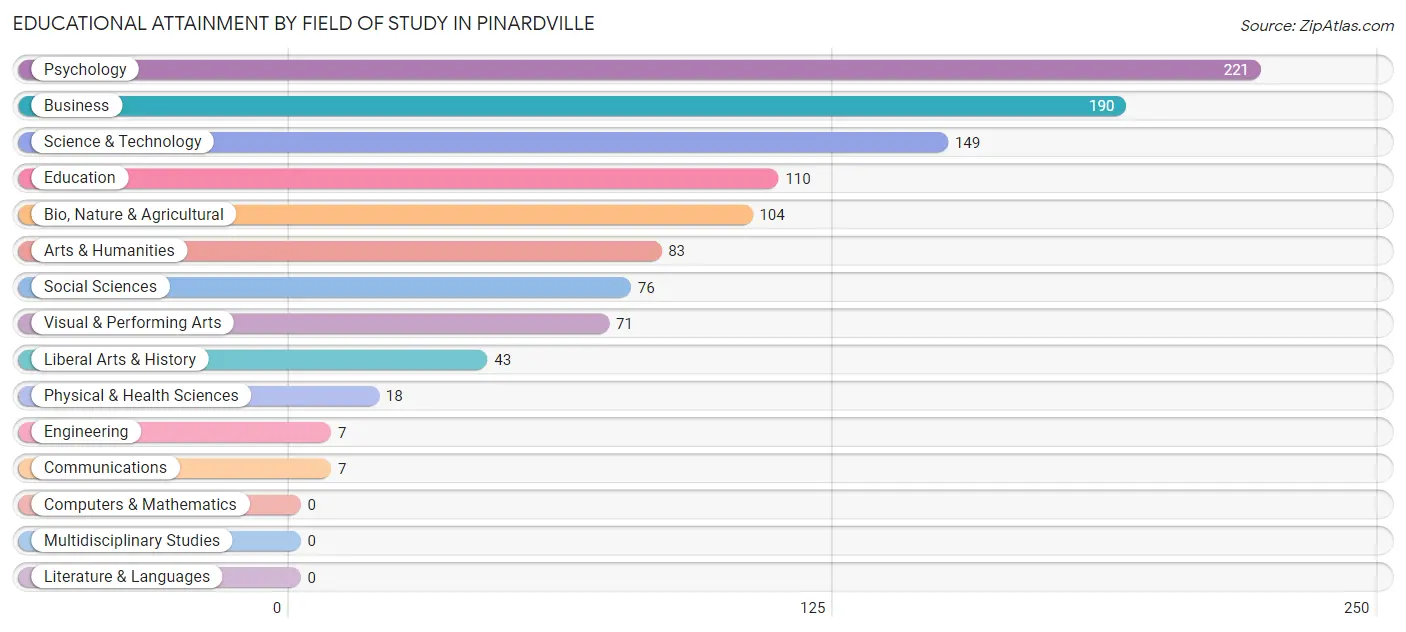
| Field of Study | # Graduates | % Graduates |
| Computers & Mathematics | 0 | 0.0% |
| Bio, Nature & Agricultural | 104 | 9.6% |
| Physical & Health Sciences | 18 | 1.7% |
| Psychology | 221 | 20.5% |
| Social Sciences | 76 | 7.0% |
| Engineering | 7 | 0.6% |
| Multidisciplinary Studies | 0 | 0.0% |
| Science & Technology | 149 | 13.8% |
| Business | 190 | 17.6% |
| Education | 110 | 10.2% |
| Literature & Languages | 0 | 0.0% |
| Liberal Arts & History | 43 | 4.0% |
| Visual & Performing Arts | 71 | 6.6% |
| Communications | 7 | 0.6% |
| Arts & Humanities | 83 | 7.7% |
| Total | 1,079 | 100.0% |
Transportation & Commute in Pinardville
Vehicle Availability by Sex in Pinardville
The most prevalent vehicle ownership categories in Pinardville are males with 2 vehicles (752, accounting for 56.7%) and females with 2 vehicles (601, making up 56.3%).
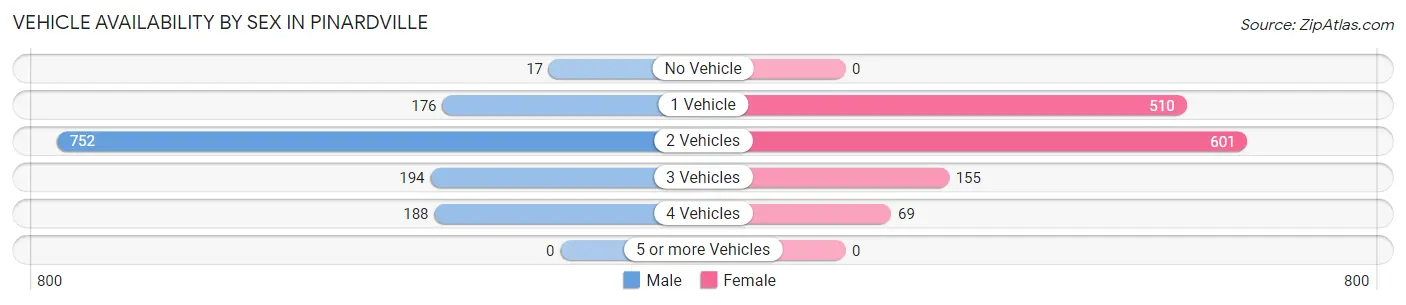
| Vehicles Available | Male | Female |
| No Vehicle | 17 (1.3%) | 0 (0.0%) |
| 1 Vehicle | 176 (13.3%) | 510 (38.2%) |
| 2 Vehicles | 752 (56.7%) | 601 (45.0%) |
| 3 Vehicles | 194 (14.6%) | 155 (11.6%) |
| 4 Vehicles | 188 (14.2%) | 69 (5.2%) |
| 5 or more Vehicles | 0 (0.0%) | 0 (0.0%) |
| Total | 1,327 (100.0%) | 1,335 (100.0%) |
Commute Time in Pinardville
The most frequently occuring commute durations in Pinardville are 15 to 19 minutes (535 commuters, 21.0%), 20 to 24 minutes (377 commuters, 14.8%), and 30 to 34 minutes (374 commuters, 14.7%).
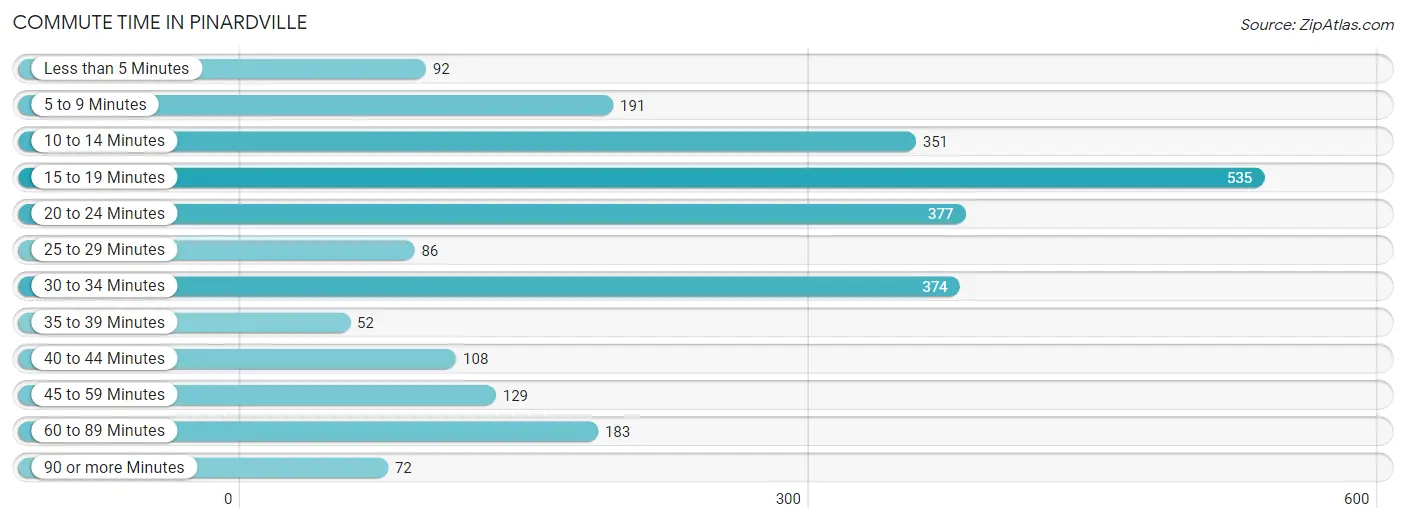
| Commute Time | # Commuters | % Commuters |
| Less than 5 Minutes | 92 | 3.6% |
| 5 to 9 Minutes | 191 | 7.5% |
| 10 to 14 Minutes | 351 | 13.8% |
| 15 to 19 Minutes | 535 | 21.0% |
| 20 to 24 Minutes | 377 | 14.8% |
| 25 to 29 Minutes | 86 | 3.4% |
| 30 to 34 Minutes | 374 | 14.7% |
| 35 to 39 Minutes | 52 | 2.0% |
| 40 to 44 Minutes | 108 | 4.2% |
| 45 to 59 Minutes | 129 | 5.1% |
| 60 to 89 Minutes | 183 | 7.2% |
| 90 or more Minutes | 72 | 2.8% |
Commute Time by Sex in Pinardville
The most common commute times in Pinardville are 15 to 19 minutes (263 commuters, 20.6%) for males and 15 to 19 minutes (272 commuters, 21.4%) for females.
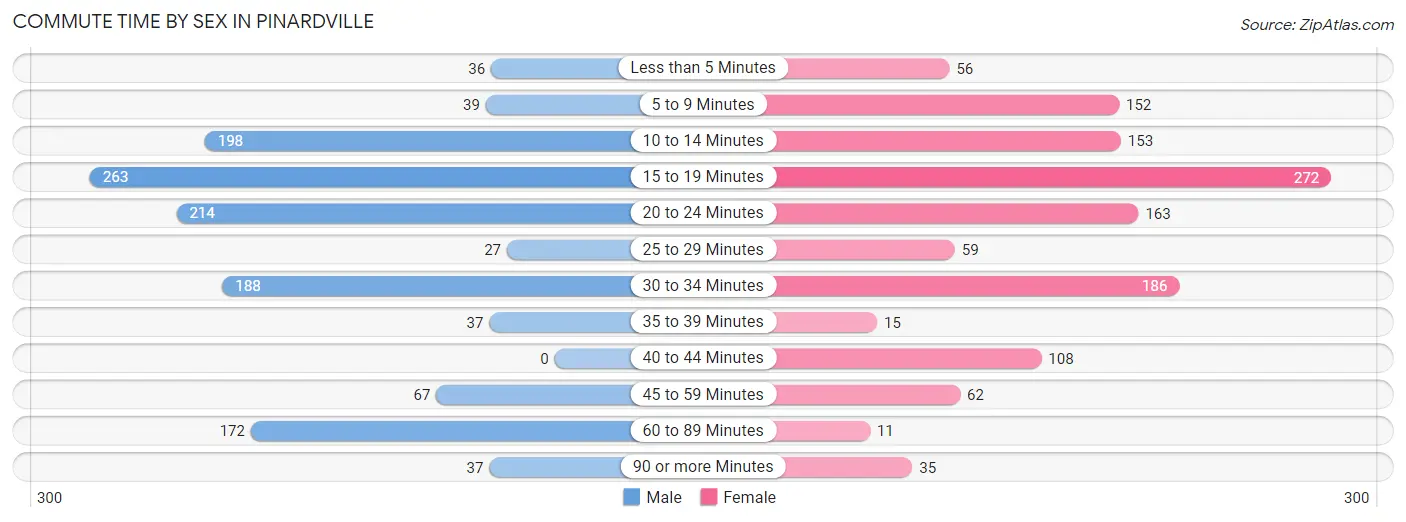
| Commute Time | Male | Female |
| Less than 5 Minutes | 36 (2.8%) | 56 (4.4%) |
| 5 to 9 Minutes | 39 (3.0%) | 152 (11.9%) |
| 10 to 14 Minutes | 198 (15.5%) | 153 (12.0%) |
| 15 to 19 Minutes | 263 (20.6%) | 272 (21.4%) |
| 20 to 24 Minutes | 214 (16.7%) | 163 (12.8%) |
| 25 to 29 Minutes | 27 (2.1%) | 59 (4.6%) |
| 30 to 34 Minutes | 188 (14.7%) | 186 (14.6%) |
| 35 to 39 Minutes | 37 (2.9%) | 15 (1.2%) |
| 40 to 44 Minutes | 0 (0.0%) | 108 (8.5%) |
| 45 to 59 Minutes | 67 (5.2%) | 62 (4.9%) |
| 60 to 89 Minutes | 172 (13.5%) | 11 (0.9%) |
| 90 or more Minutes | 37 (2.9%) | 35 (2.8%) |
Time of Departure to Work by Sex in Pinardville
The most frequent times of departure to work in Pinardville are 7:30 AM to 7:59 AM (293, 22.9%) for males and 7:30 AM to 7:59 AM (357, 28.1%) for females.
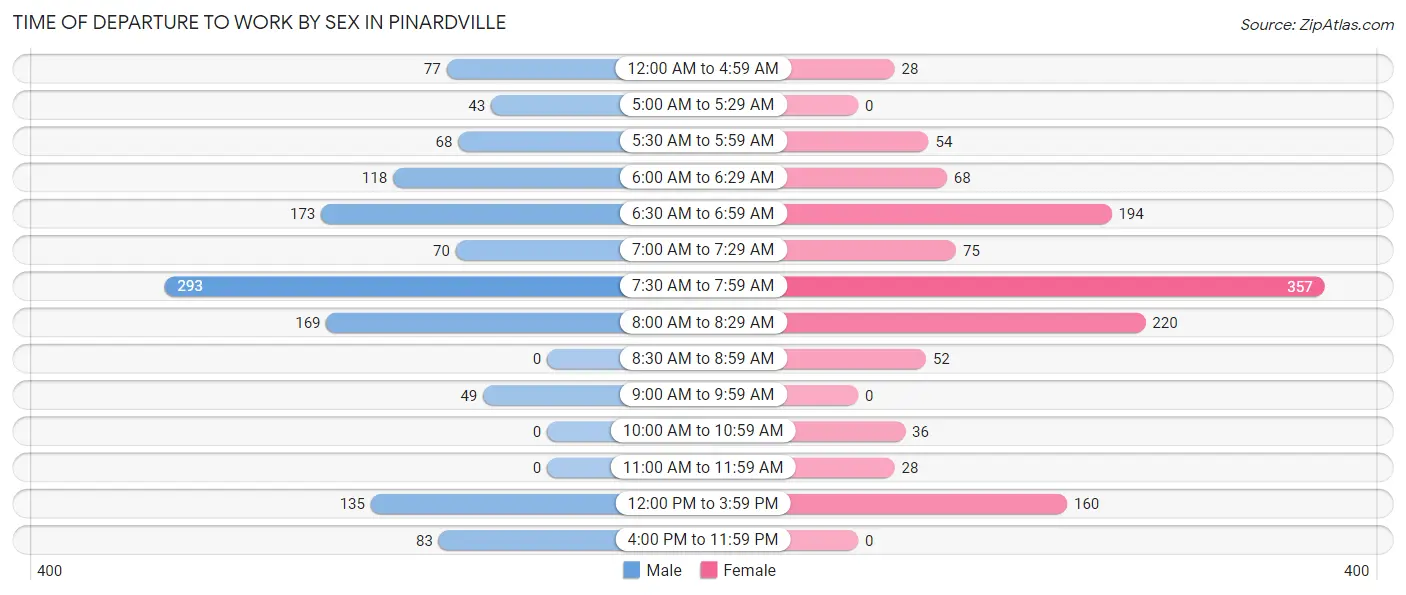
| Time of Departure | Male | Female |
| 12:00 AM to 4:59 AM | 77 (6.0%) | 28 (2.2%) |
| 5:00 AM to 5:29 AM | 43 (3.4%) | 0 (0.0%) |
| 5:30 AM to 5:59 AM | 68 (5.3%) | 54 (4.3%) |
| 6:00 AM to 6:29 AM | 118 (9.2%) | 68 (5.3%) |
| 6:30 AM to 6:59 AM | 173 (13.5%) | 194 (15.2%) |
| 7:00 AM to 7:29 AM | 70 (5.5%) | 75 (5.9%) |
| 7:30 AM to 7:59 AM | 293 (22.9%) | 357 (28.1%) |
| 8:00 AM to 8:29 AM | 169 (13.2%) | 220 (17.3%) |
| 8:30 AM to 8:59 AM | 0 (0.0%) | 52 (4.1%) |
| 9:00 AM to 9:59 AM | 49 (3.8%) | 0 (0.0%) |
| 10:00 AM to 10:59 AM | 0 (0.0%) | 36 (2.8%) |
| 11:00 AM to 11:59 AM | 0 (0.0%) | 28 (2.2%) |
| 12:00 PM to 3:59 PM | 135 (10.6%) | 160 (12.6%) |
| 4:00 PM to 11:59 PM | 83 (6.5%) | 0 (0.0%) |
| Total | 1,278 (100.0%) | 1,272 (100.0%) |
Housing Occupancy in Pinardville
Occupancy by Ownership in Pinardville
Of the total 2,091 dwellings in Pinardville, owner-occupied units account for 1,345 (64.3%), while renter-occupied units make up 746 (35.7%).
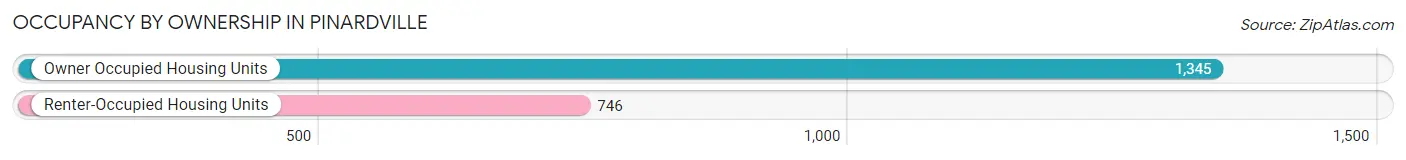
| Occupancy | # Housing Units | % Housing Units |
| Owner Occupied Housing Units | 1,345 | 64.3% |
| Renter-Occupied Housing Units | 746 | 35.7% |
| Total Occupied Housing Units | 2,091 | 100.0% |
Occupancy by Household Size in Pinardville
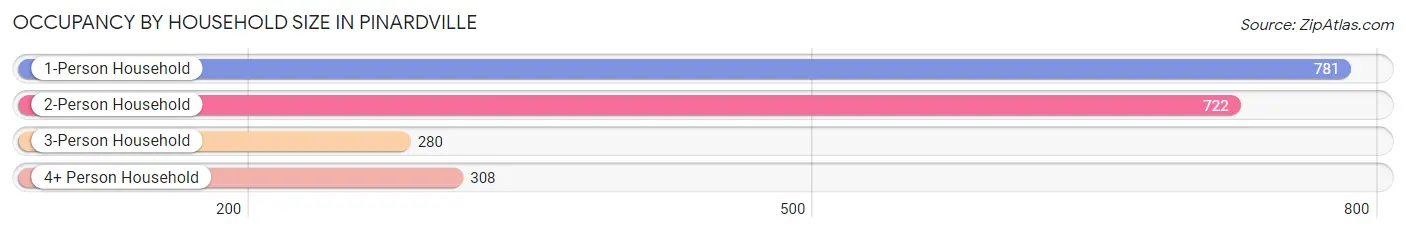
| Household Size | # Housing Units | % Housing Units |
| 1-Person Household | 781 | 37.3% |
| 2-Person Household | 722 | 34.5% |
| 3-Person Household | 280 | 13.4% |
| 4+ Person Household | 308 | 14.7% |
| Total Housing Units | 2,091 | 100.0% |
Occupancy by Ownership by Household Size in Pinardville
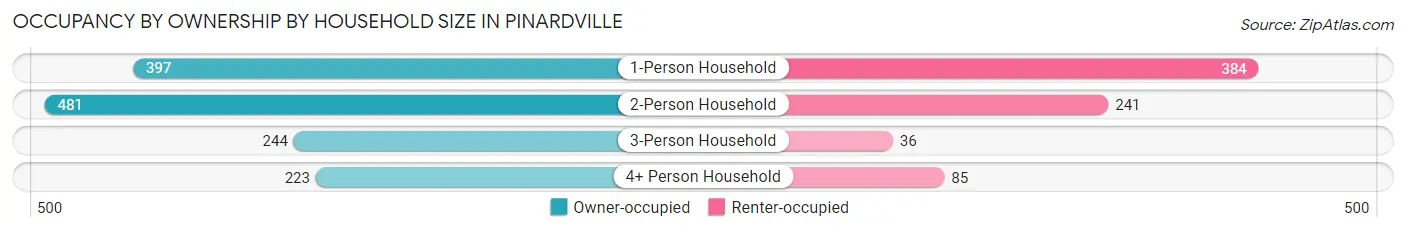
| Household Size | Owner-occupied | Renter-occupied |
| 1-Person Household | 397 (50.8%) | 384 (49.2%) |
| 2-Person Household | 481 (66.6%) | 241 (33.4%) |
| 3-Person Household | 244 (87.1%) | 36 (12.9%) |
| 4+ Person Household | 223 (72.4%) | 85 (27.6%) |
| Total Housing Units | 1,345 (64.3%) | 746 (35.7%) |
Occupancy by Educational Attainment in Pinardville
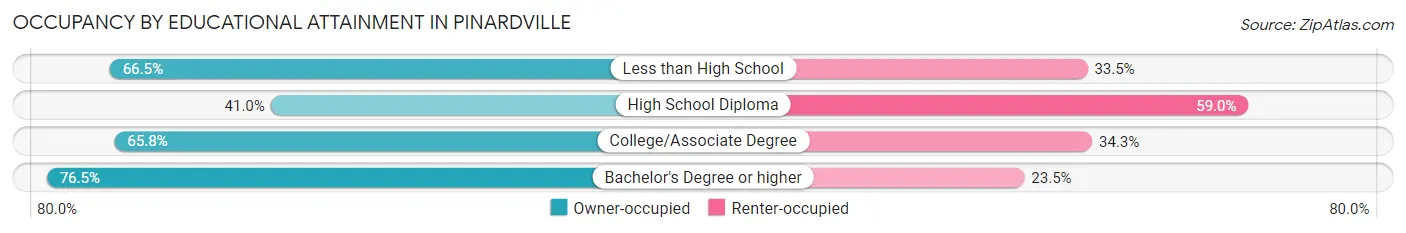
| Household Size | Owner-occupied | Renter-occupied |
| Less than High School | 127 (66.5%) | 64 (33.5%) |
| High School Diploma | 168 (41.0%) | 242 (59.0%) |
| College/Associate Degree | 549 (65.7%) | 286 (34.3%) |
| Bachelor's Degree or higher | 501 (76.5%) | 154 (23.5%) |
Occupancy by Age of Householder in Pinardville
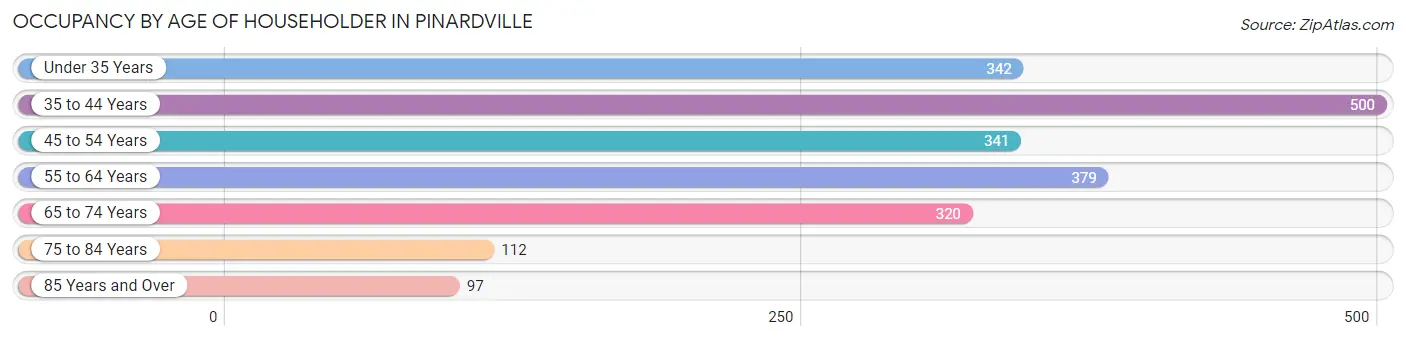
| Age Bracket | # Households | % Households |
| Under 35 Years | 342 | 16.4% |
| 35 to 44 Years | 500 | 23.9% |
| 45 to 54 Years | 341 | 16.3% |
| 55 to 64 Years | 379 | 18.1% |
| 65 to 74 Years | 320 | 15.3% |
| 75 to 84 Years | 112 | 5.4% |
| 85 Years and Over | 97 | 4.6% |
| Total | 2,091 | 100.0% |
Housing Finances in Pinardville
Median Income by Occupancy in Pinardville
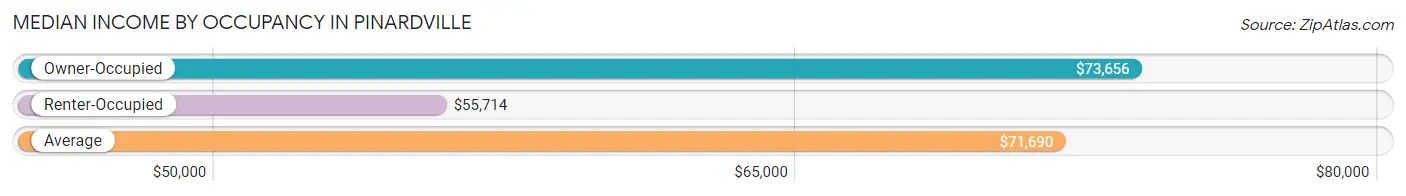
| Occupancy Type | # Households | Median Income |
| Owner-Occupied | 1,345 (64.3%) | $73,656 |
| Renter-Occupied | 746 (35.7%) | $55,714 |
| Average | 2,091 (100.0%) | $71,690 |
Occupancy by Householder Income Bracket in Pinardville
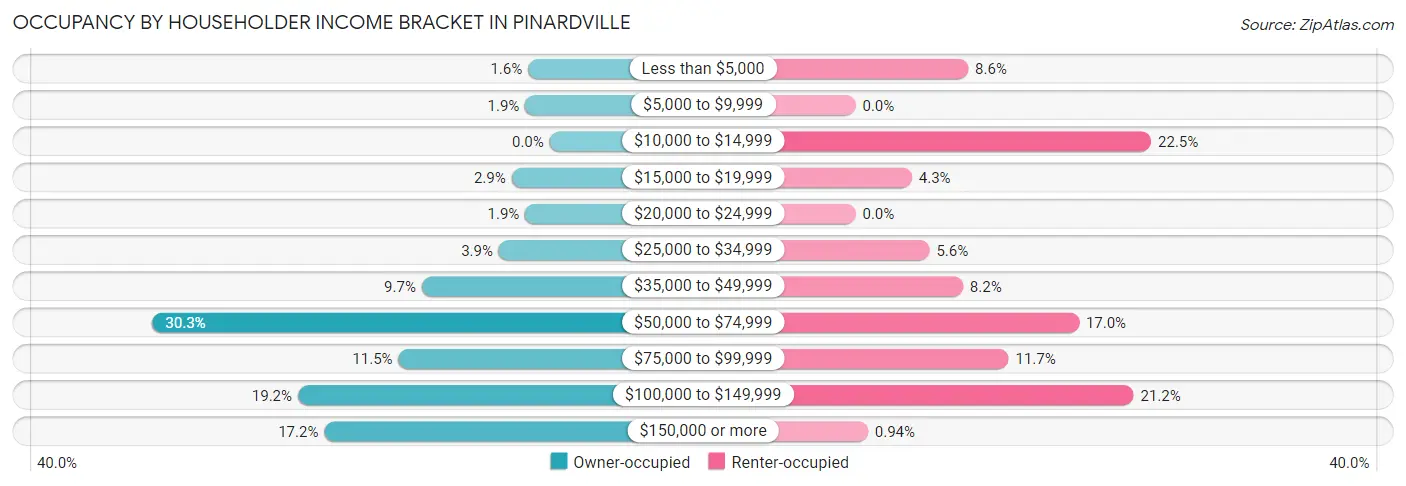
| Income Bracket | Owner-occupied | Renter-occupied |
| Less than $5,000 | 22 (1.6%) | 64 (8.6%) |
| $5,000 to $9,999 | 25 (1.9%) | 0 (0.0%) |
| $10,000 to $14,999 | 0 (0.0%) | 168 (22.5%) |
| $15,000 to $19,999 | 39 (2.9%) | 32 (4.3%) |
| $20,000 to $24,999 | 25 (1.9%) | 0 (0.0%) |
| $25,000 to $34,999 | 52 (3.9%) | 42 (5.6%) |
| $35,000 to $49,999 | 131 (9.7%) | 61 (8.2%) |
| $50,000 to $74,999 | 407 (30.3%) | 127 (17.0%) |
| $75,000 to $99,999 | 155 (11.5%) | 87 (11.7%) |
| $100,000 to $149,999 | 258 (19.2%) | 158 (21.2%) |
| $150,000 or more | 231 (17.2%) | 7 (0.9%) |
| Total | 1,345 (100.0%) | 746 (100.0%) |
Monthly Housing Cost Tiers in Pinardville
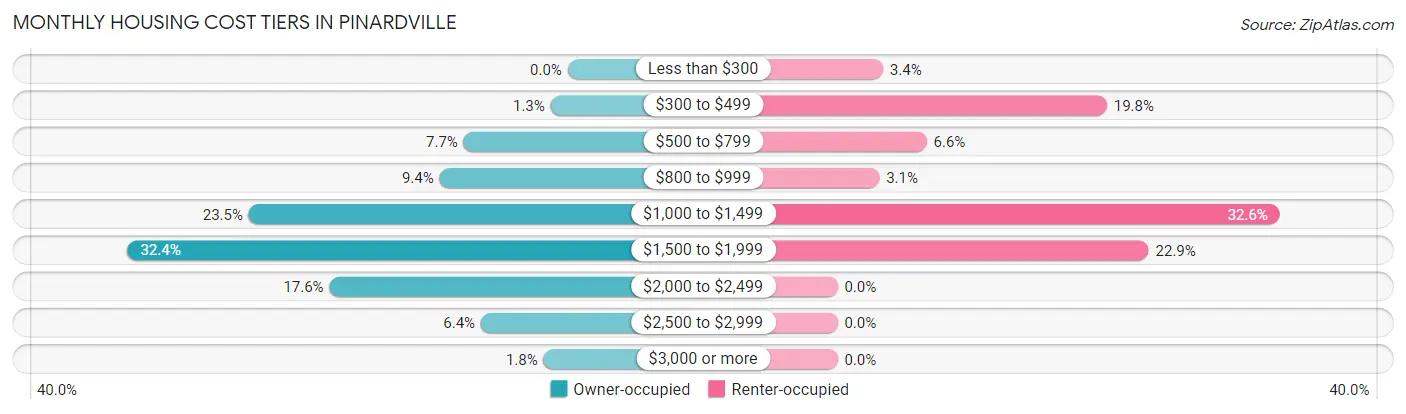
| Monthly Cost | Owner-occupied | Renter-occupied |
| Less than $300 | 0 (0.0%) | 25 (3.4%) |
| $300 to $499 | 17 (1.3%) | 148 (19.8%) |
| $500 to $799 | 103 (7.7%) | 49 (6.6%) |
| $800 to $999 | 127 (9.4%) | 23 (3.1%) |
| $1,000 to $1,499 | 316 (23.5%) | 243 (32.6%) |
| $1,500 to $1,999 | 436 (32.4%) | 171 (22.9%) |
| $2,000 to $2,499 | 236 (17.5%) | 0 (0.0%) |
| $2,500 to $2,999 | 86 (6.4%) | 0 (0.0%) |
| $3,000 or more | 24 (1.8%) | 0 (0.0%) |
| Total | 1,345 (100.0%) | 746 (100.0%) |
Physical Housing Characteristics in Pinardville
Housing Structures in Pinardville
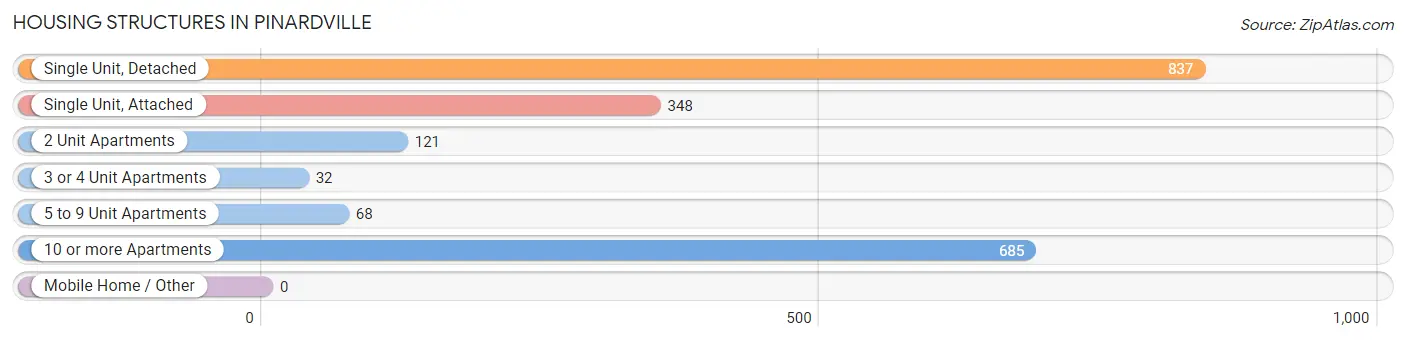
| Structure Type | # Housing Units | % Housing Units |
| Single Unit, Detached | 837 | 40.0% |
| Single Unit, Attached | 348 | 16.6% |
| 2 Unit Apartments | 121 | 5.8% |
| 3 or 4 Unit Apartments | 32 | 1.5% |
| 5 to 9 Unit Apartments | 68 | 3.3% |
| 10 or more Apartments | 685 | 32.8% |
| Mobile Home / Other | 0 | 0.0% |
| Total | 2,091 | 100.0% |
Housing Structures by Occupancy in Pinardville
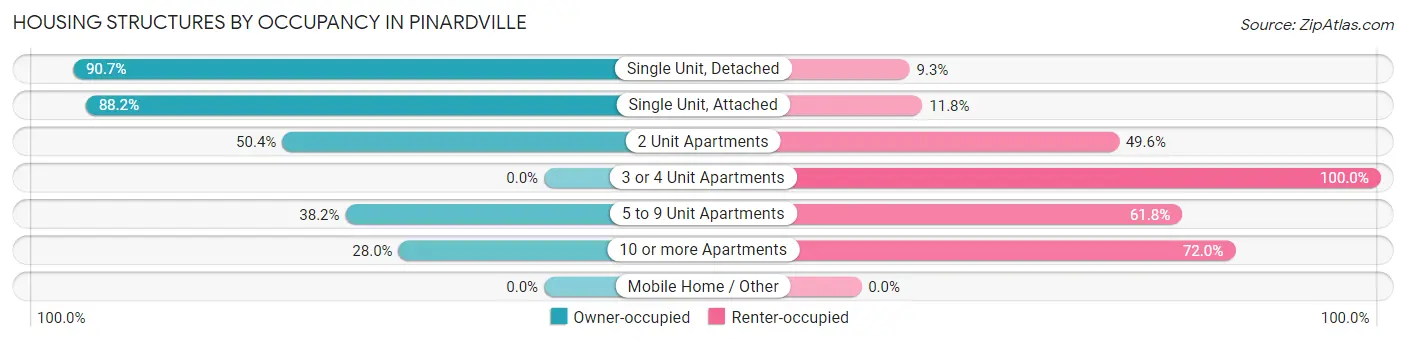
| Structure Type | Owner-occupied | Renter-occupied |
| Single Unit, Detached | 759 (90.7%) | 78 (9.3%) |
| Single Unit, Attached | 307 (88.2%) | 41 (11.8%) |
| 2 Unit Apartments | 61 (50.4%) | 60 (49.6%) |
| 3 or 4 Unit Apartments | 0 (0.0%) | 32 (100.0%) |
| 5 to 9 Unit Apartments | 26 (38.2%) | 42 (61.8%) |
| 10 or more Apartments | 192 (28.0%) | 493 (72.0%) |
| Mobile Home / Other | 0 (0.0%) | 0 (0.0%) |
| Total | 1,345 (64.3%) | 746 (35.7%) |
Housing Structures by Number of Rooms in Pinardville
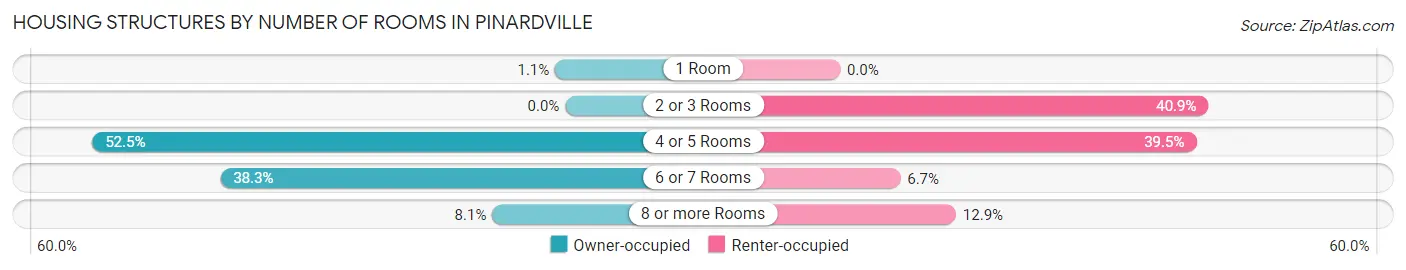
| Number of Rooms | Owner-occupied | Renter-occupied |
| 1 Room | 15 (1.1%) | 0 (0.0%) |
| 2 or 3 Rooms | 0 (0.0%) | 305 (40.9%) |
| 4 or 5 Rooms | 706 (52.5%) | 295 (39.5%) |
| 6 or 7 Rooms | 515 (38.3%) | 50 (6.7%) |
| 8 or more Rooms | 109 (8.1%) | 96 (12.9%) |
| Total | 1,345 (100.0%) | 746 (100.0%) |
Housing Structure by Heating Type in Pinardville
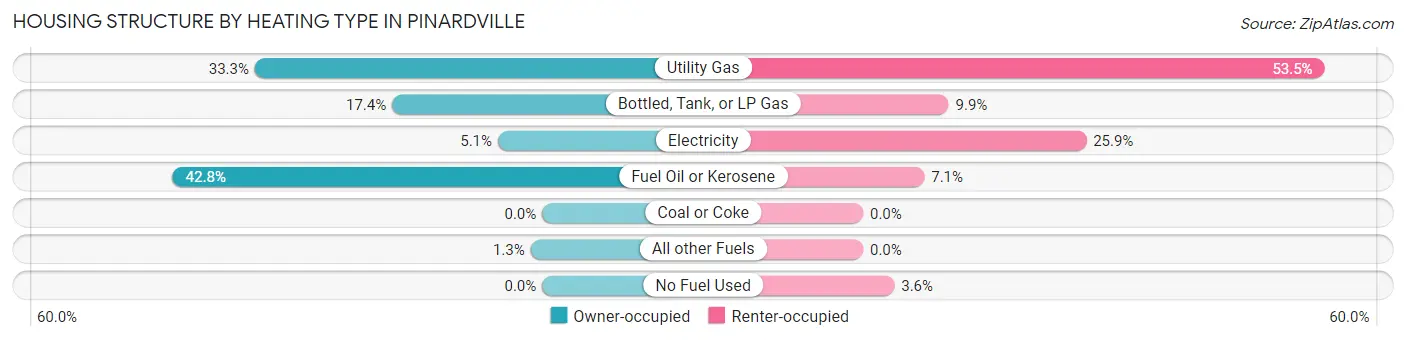
| Heating Type | Owner-occupied | Renter-occupied |
| Utility Gas | 448 (33.3%) | 399 (53.5%) |
| Bottled, Tank, or LP Gas | 234 (17.4%) | 74 (9.9%) |
| Electricity | 69 (5.1%) | 193 (25.9%) |
| Fuel Oil or Kerosene | 576 (42.8%) | 53 (7.1%) |
| Coal or Coke | 0 (0.0%) | 0 (0.0%) |
| All other Fuels | 18 (1.3%) | 0 (0.0%) |
| No Fuel Used | 0 (0.0%) | 27 (3.6%) |
| Total | 1,345 (100.0%) | 746 (100.0%) |
Household Vehicle Usage in Pinardville
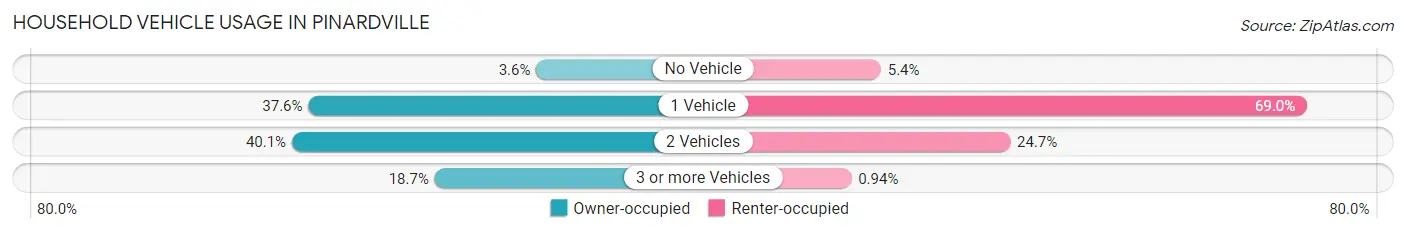
| Vehicles per Household | Owner-occupied | Renter-occupied |
| No Vehicle | 48 (3.6%) | 40 (5.4%) |
| 1 Vehicle | 506 (37.6%) | 515 (69.0%) |
| 2 Vehicles | 539 (40.1%) | 184 (24.7%) |
| 3 or more Vehicles | 252 (18.7%) | 7 (0.9%) |
| Total | 1,345 (100.0%) | 746 (100.0%) |
Real Estate & Mortgages in Pinardville
Real Estate and Mortgage Overview in Pinardville
| Characteristic | Without Mortgage | With Mortgage |
| Housing Units | 314 | 1,031 |
| Median Property Value | $255,700 | $236,300 |
| Median Household Income | $39,663 | $206 |
| Monthly Housing Costs | $886 | $24 |
| Real Estate Taxes | $5,747 | $0 |
Property Value by Mortgage Status in Pinardville
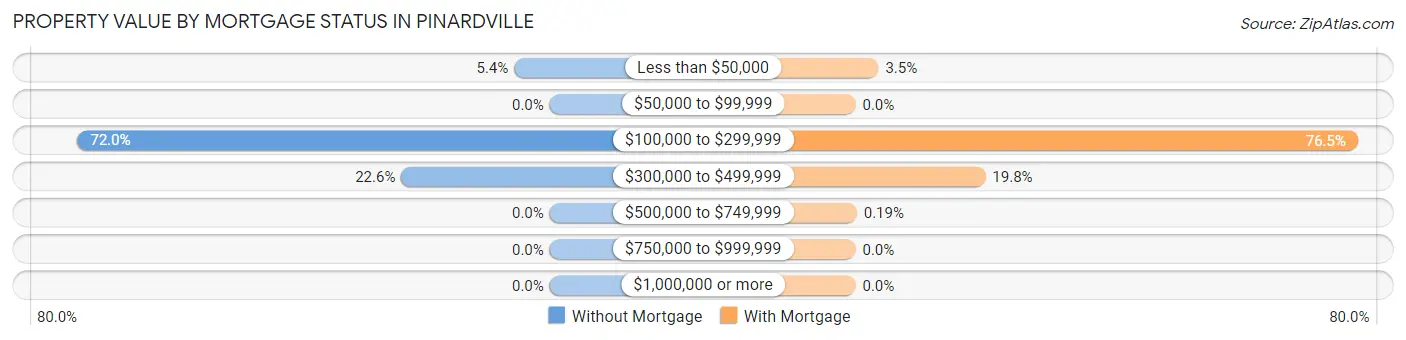
| Property Value | Without Mortgage | With Mortgage |
| Less than $50,000 | 17 (5.4%) | 36 (3.5%) |
| $50,000 to $99,999 | 0 (0.0%) | 0 (0.0%) |
| $100,000 to $299,999 | 226 (72.0%) | 789 (76.5%) |
| $300,000 to $499,999 | 71 (22.6%) | 204 (19.8%) |
| $500,000 to $749,999 | 0 (0.0%) | 2 (0.2%) |
| $750,000 to $999,999 | 0 (0.0%) | 0 (0.0%) |
| $1,000,000 or more | 0 (0.0%) | 0 (0.0%) |
| Total | 314 (100.0%) | 1,031 (100.0%) |
Household Income by Mortgage Status in Pinardville
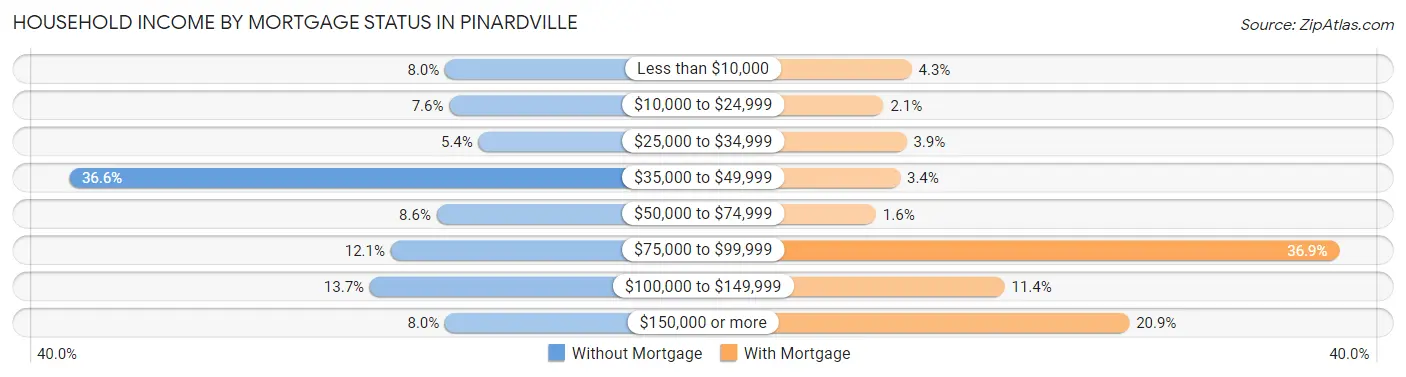
| Household Income | Without Mortgage | With Mortgage |
| Less than $10,000 | 25 (8.0%) | 44 (4.3%) |
| $10,000 to $24,999 | 24 (7.6%) | 22 (2.1%) |
| $25,000 to $34,999 | 17 (5.4%) | 40 (3.9%) |
| $35,000 to $49,999 | 115 (36.6%) | 35 (3.4%) |
| $50,000 to $74,999 | 27 (8.6%) | 16 (1.5%) |
| $75,000 to $99,999 | 38 (12.1%) | 380 (36.9%) |
| $100,000 to $149,999 | 43 (13.7%) | 117 (11.4%) |
| $150,000 or more | 25 (8.0%) | 215 (20.8%) |
| Total | 314 (100.0%) | 1,031 (100.0%) |
Property Value to Household Income Ratio in Pinardville
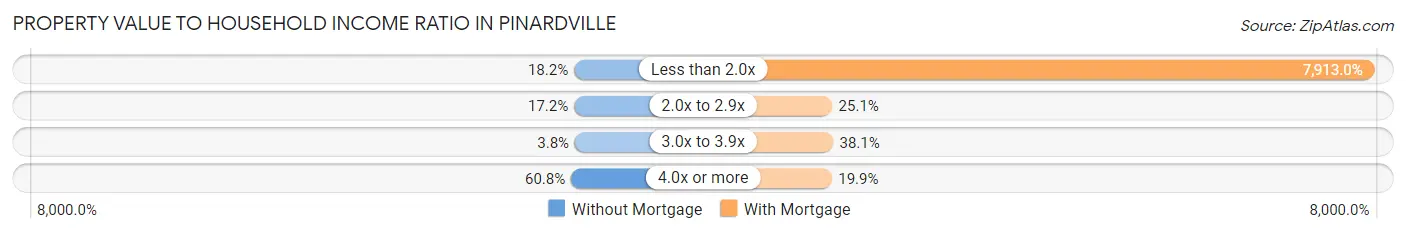
| Value-to-Income Ratio | Without Mortgage | With Mortgage |
| Less than 2.0x | 57 (18.1%) | 81,583 (7,913.0%) |
| 2.0x to 2.9x | 54 (17.2%) | 259 (25.1%) |
| 3.0x to 3.9x | 12 (3.8%) | 393 (38.1%) |
| 4.0x or more | 191 (60.8%) | 205 (19.9%) |
| Total | 314 (100.0%) | 1,031 (100.0%) |
Real Estate Taxes by Mortgage Status in Pinardville

| Property Taxes | Without Mortgage | With Mortgage |
| Less than $800 | 0 (0.0%) | 0 (0.0%) |
| $800 to $1,499 | 0 (0.0%) | 23 (2.2%) |
| $800 to $1,499 | 314 (100.0%) | 36 (3.5%) |
| Total | 314 (100.0%) | 1,031 (100.0%) |
Health & Disability in Pinardville
Health Insurance Coverage by Age in Pinardville
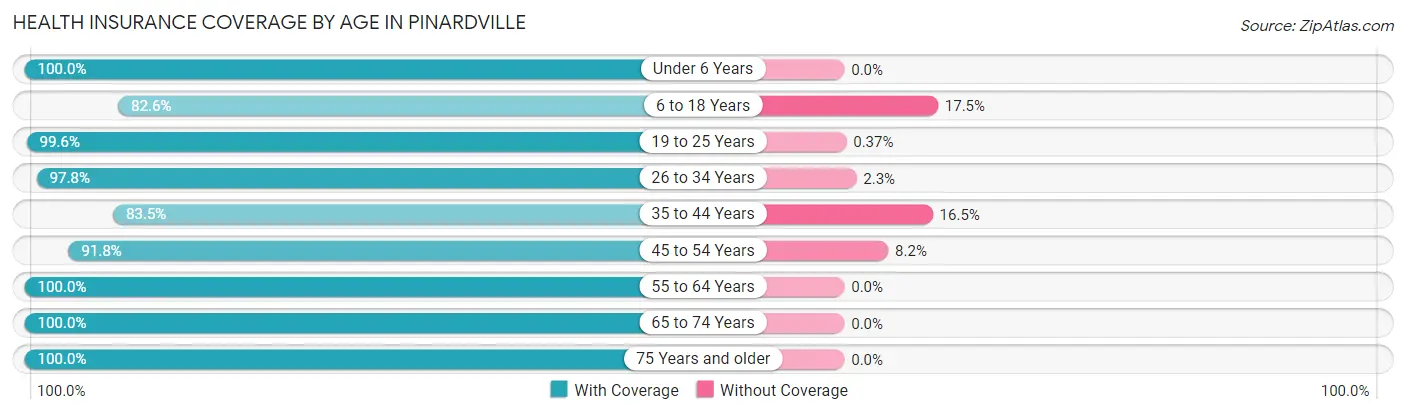
| Age Bracket | With Coverage | Without Coverage |
| Under 6 Years | 94 (100.0%) | 0 (0.0%) |
| 6 to 18 Years | 724 (82.6%) | 153 (17.4%) |
| 19 to 25 Years | 543 (99.6%) | 2 (0.4%) |
| 26 to 34 Years | 478 (97.8%) | 11 (2.2%) |
| 35 to 44 Years | 760 (83.5%) | 150 (16.5%) |
| 45 to 54 Years | 494 (91.8%) | 44 (8.2%) |
| 55 to 64 Years | 597 (100.0%) | 0 (0.0%) |
| 65 to 74 Years | 494 (100.0%) | 0 (0.0%) |
| 75 Years and older | 307 (100.0%) | 0 (0.0%) |
| Total | 4,491 (92.6%) | 360 (7.4%) |
Health Insurance Coverage by Citizenship Status in Pinardville

| Citizenship Status | With Coverage | Without Coverage |
| Native Born | 94 (100.0%) | 0 (0.0%) |
| Foreign Born, Citizen | 724 (82.6%) | 153 (17.4%) |
| Foreign Born, not a Citizen | 543 (99.6%) | 2 (0.4%) |
Health Insurance Coverage by Household Income in Pinardville
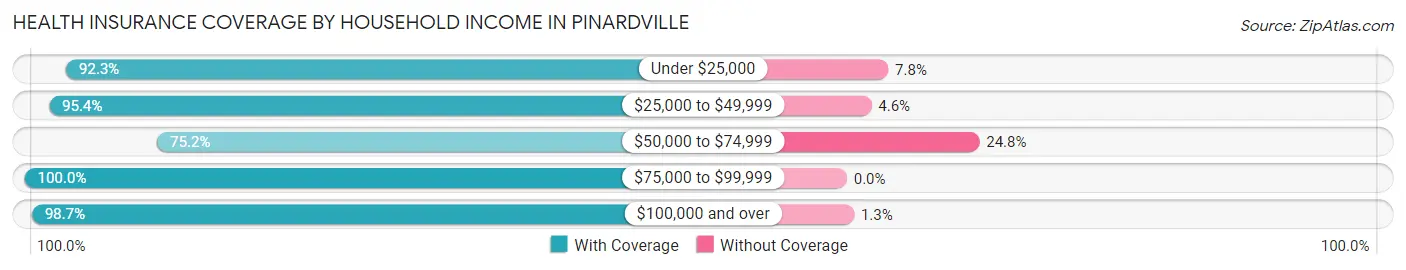
| Household Income | With Coverage | Without Coverage |
| Under $25,000 | 464 (92.2%) | 39 (7.7%) |
| $25,000 to $49,999 | 415 (95.4%) | 20 (4.6%) |
| $50,000 to $74,999 | 818 (75.2%) | 270 (24.8%) |
| $75,000 to $99,999 | 587 (100.0%) | 0 (0.0%) |
| $100,000 and over | 2,128 (98.7%) | 29 (1.3%) |
Public vs Private Health Insurance Coverage by Age in Pinardville
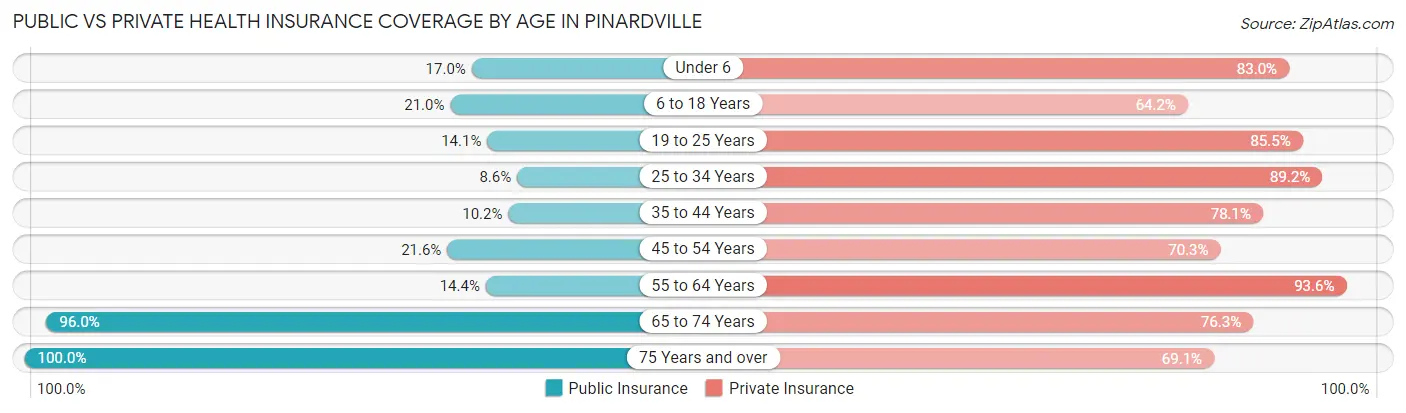
| Age Bracket | Public Insurance | Private Insurance |
| Under 6 | 16 (17.0%) | 78 (83.0%) |
| 6 to 18 Years | 184 (21.0%) | 563 (64.2%) |
| 19 to 25 Years | 77 (14.1%) | 466 (85.5%) |
| 25 to 34 Years | 42 (8.6%) | 436 (89.2%) |
| 35 to 44 Years | 93 (10.2%) | 711 (78.1%) |
| 45 to 54 Years | 116 (21.6%) | 378 (70.3%) |
| 55 to 64 Years | 86 (14.4%) | 559 (93.6%) |
| 65 to 74 Years | 474 (96.0%) | 377 (76.3%) |
| 75 Years and over | 307 (100.0%) | 212 (69.1%) |
| Total | 1,395 (28.8%) | 3,780 (77.9%) |
Disability Status by Sex by Age in Pinardville
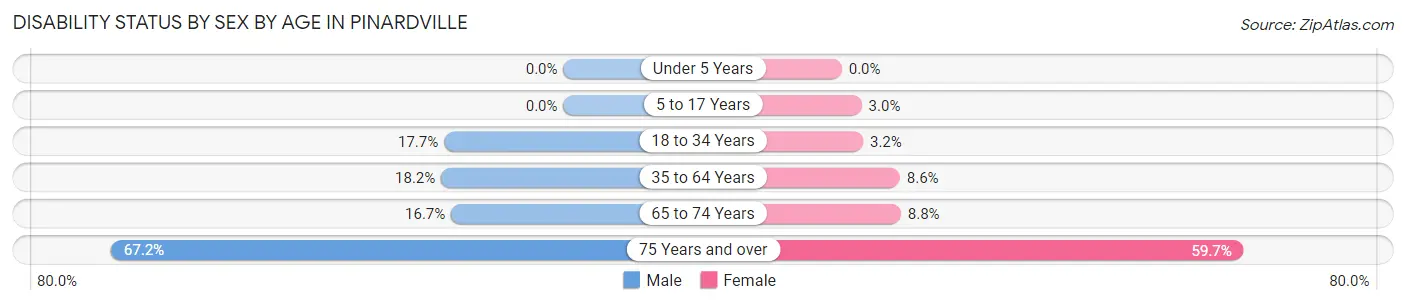
| Age Bracket | Male | Female |
| Under 5 Years | 0 (0.0%) | 0 (0.0%) |
| 5 to 17 Years | 0 (0.0%) | 13 (2.9%) |
| 18 to 34 Years | 93 (17.7%) | 18 (3.2%) |
| 35 to 64 Years | 167 (18.1%) | 97 (8.6%) |
| 65 to 74 Years | 31 (16.7%) | 27 (8.8%) |
| 75 Years and over | 88 (67.2%) | 105 (59.7%) |
Disability Class by Sex by Age in Pinardville
Disability Class: Hearing Difficulty
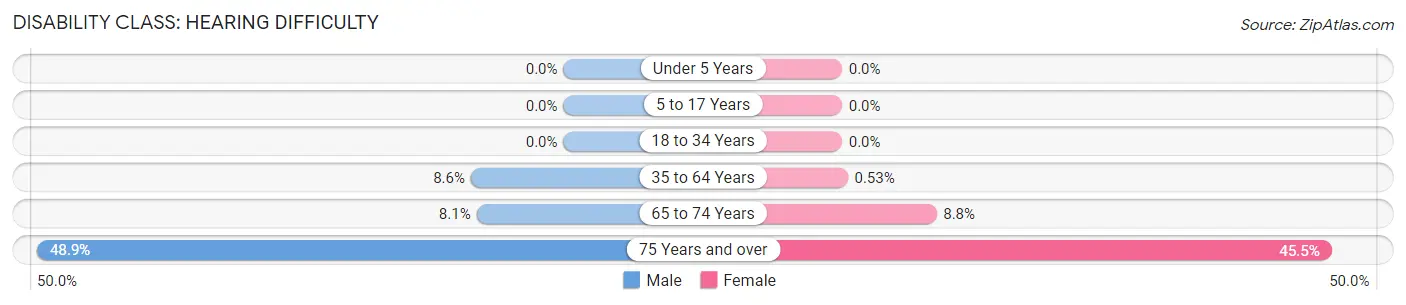
| Age Bracket | Male | Female |
| Under 5 Years | 0 (0.0%) | 0 (0.0%) |
| 5 to 17 Years | 0 (0.0%) | 0 (0.0%) |
| 18 to 34 Years | 0 (0.0%) | 0 (0.0%) |
| 35 to 64 Years | 79 (8.6%) | 6 (0.5%) |
| 65 to 74 Years | 15 (8.1%) | 27 (8.8%) |
| 75 Years and over | 64 (48.8%) | 80 (45.5%) |
Disability Class: Vision Difficulty
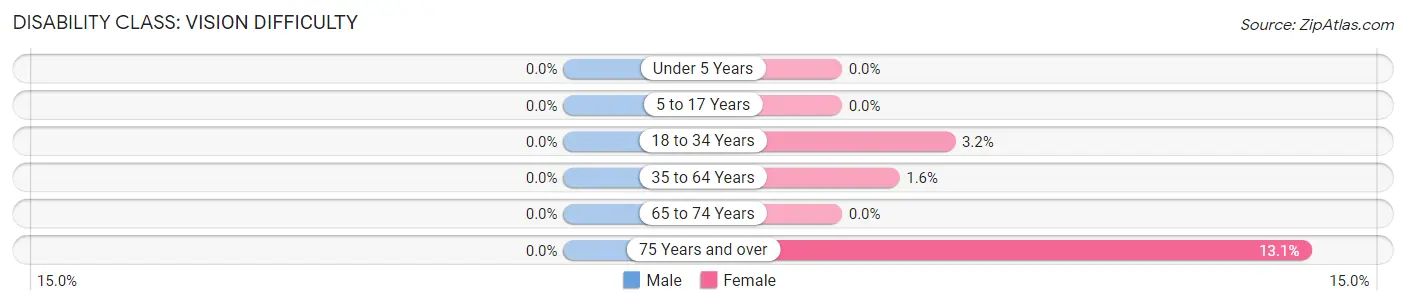
| Age Bracket | Male | Female |
| Under 5 Years | 0 (0.0%) | 0 (0.0%) |
| 5 to 17 Years | 0 (0.0%) | 0 (0.0%) |
| 18 to 34 Years | 0 (0.0%) | 18 (3.2%) |
| 35 to 64 Years | 0 (0.0%) | 18 (1.6%) |
| 65 to 74 Years | 0 (0.0%) | 0 (0.0%) |
| 75 Years and over | 0 (0.0%) | 23 (13.1%) |
Disability Class: Cognitive Difficulty
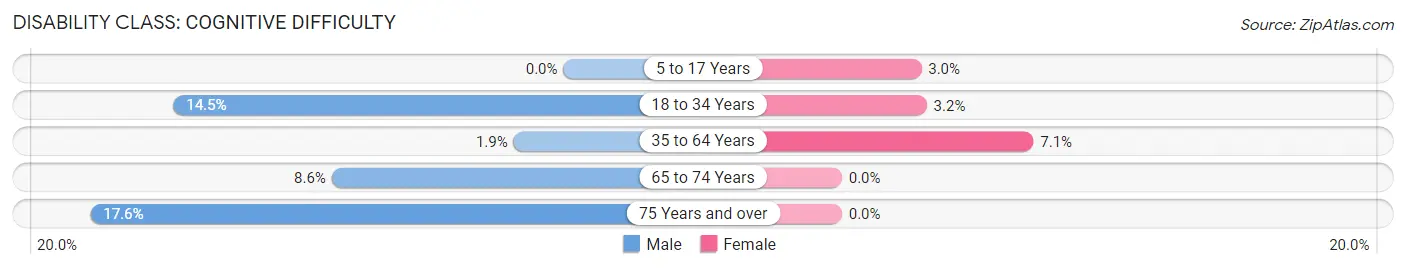
| Age Bracket | Male | Female |
| 5 to 17 Years | 0 (0.0%) | 13 (2.9%) |
| 18 to 34 Years | 76 (14.5%) | 18 (3.2%) |
| 35 to 64 Years | 17 (1.8%) | 80 (7.1%) |
| 65 to 74 Years | 16 (8.6%) | 0 (0.0%) |
| 75 Years and over | 23 (17.6%) | 0 (0.0%) |
Disability Class: Ambulatory Difficulty
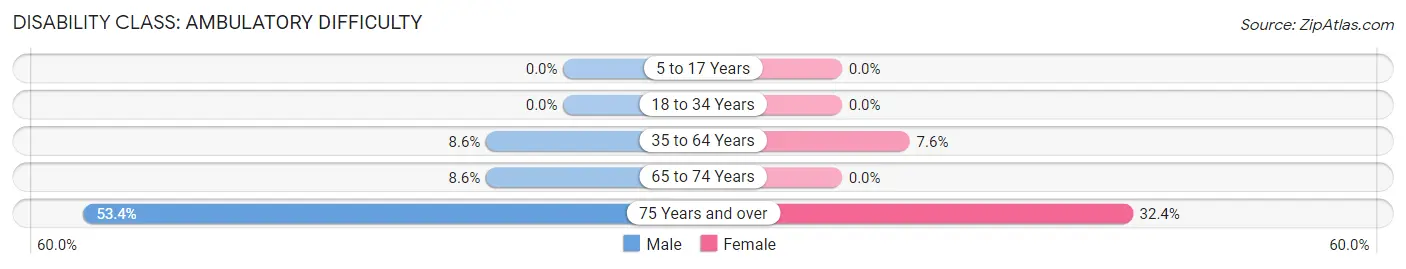
| Age Bracket | Male | Female |
| 5 to 17 Years | 0 (0.0%) | 0 (0.0%) |
| 18 to 34 Years | 0 (0.0%) | 0 (0.0%) |
| 35 to 64 Years | 79 (8.6%) | 85 (7.6%) |
| 65 to 74 Years | 16 (8.6%) | 0 (0.0%) |
| 75 Years and over | 70 (53.4%) | 57 (32.4%) |
Disability Class: Self-Care Difficulty
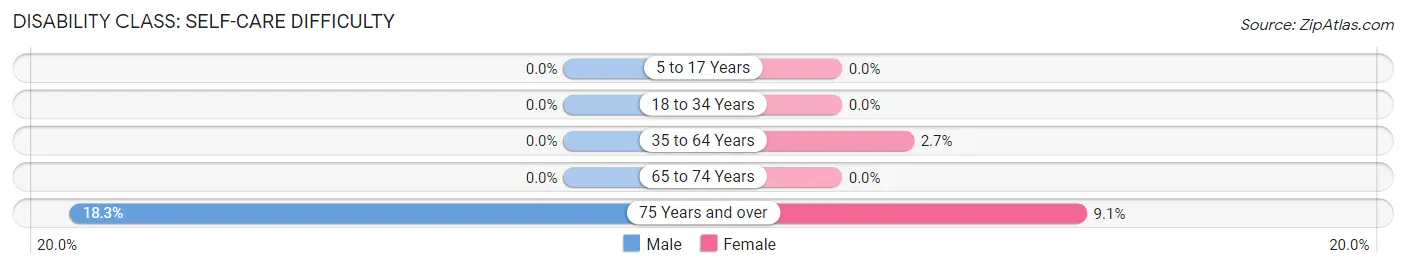
| Age Bracket | Male | Female |
| 5 to 17 Years | 0 (0.0%) | 0 (0.0%) |
| 18 to 34 Years | 0 (0.0%) | 0 (0.0%) |
| 35 to 64 Years | 0 (0.0%) | 30 (2.7%) |
| 65 to 74 Years | 0 (0.0%) | 0 (0.0%) |
| 75 Years and over | 24 (18.3%) | 16 (9.1%) |
Technology Access in Pinardville
Computing Device Access in Pinardville
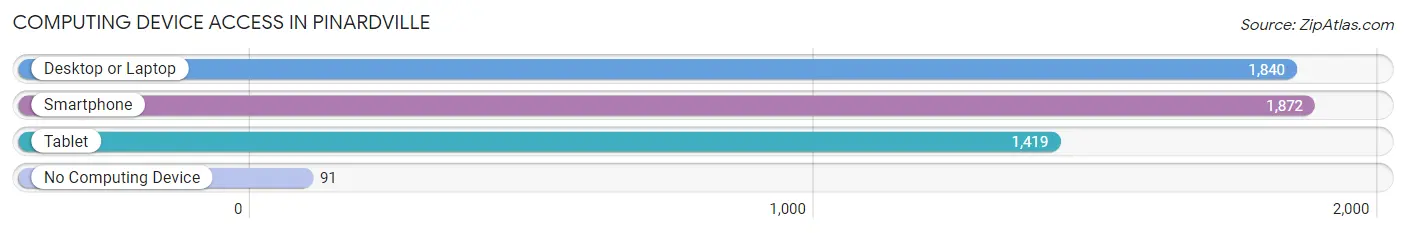
| Device Type | # Households | % Households |
| Desktop or Laptop | 1,840 | 88.0% |
| Smartphone | 1,872 | 89.5% |
| Tablet | 1,419 | 67.9% |
| No Computing Device | 91 | 4.3% |
| Total | 2,091 | 100.0% |
Internet Access in Pinardville
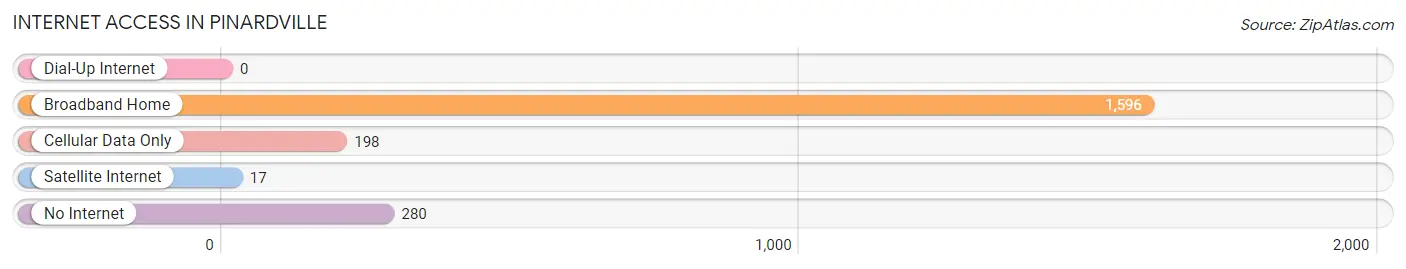
| Internet Type | # Households | % Households |
| Dial-Up Internet | 0 | 0.0% |
| Broadband Home | 1,596 | 76.3% |
| Cellular Data Only | 198 | 9.5% |
| Satellite Internet | 17 | 0.8% |
| No Internet | 280 | 13.4% |
| Total | 2,091 | 100.0% |
Pinardville Summary
Pinardville is a small town located in Hillsborough County, New Hampshire. It is situated in the southwestern part of the state, about 20 miles from the state capital of Concord. The town was first settled in 1764 and was incorporated in 1768. The town was named after the Pinard family, who were among the first settlers.
Geography
Pinardville is located in the southwestern part of Hillsborough County, New Hampshire. It is situated in the Merrimack Valley, which is a region of rolling hills and valleys. The town is bordered by the towns of Goffstown to the north, Weare to the east, and Dunbarton to the south. The town is located about 20 miles from the state capital of Concord.
The town has a total area of 8.2 square miles, of which 8.1 square miles is land and 0.1 square miles is water. The highest point in the town is located at the summit of Pinard Hill, which has an elevation of 845 feet. The town is drained by the Souhegan River, which flows through the center of town.
Economy
The economy of Pinardville is largely based on agriculture and tourism. The town is home to several farms, which produce a variety of crops, including corn, hay, and apples. The town is also home to several small businesses, including a general store, a hardware store, and a restaurant.
Tourism is an important part of the town's economy. The town is home to several attractions, including the Pinardville Historical Society Museum, which houses artifacts from the town's history. The town is also home to several parks, including the Pinardville State Park, which offers camping, hiking, and fishing.
Demographics
As of the 2010 census, the town had a population of 2,845. The racial makeup of the town was 97.3% White, 0.7% African American, 0.3% Native American, 0.3% Asian, 0.1% Pacific Islander, 0.3% from other races, and 1.0% from two or more races. Hispanic or Latino of any race were 1.2% of the population.
The median household income in the town was $60,938, and the median family income was $68,750. The per capita income for the town was $25,945. About 4.3% of families and 5.7% of the population were below the poverty line, including 6.3% of those under age 18 and 4.2% of those age 65 or over.
Conclusion
Pinardville is a small town located in Hillsborough County, New Hampshire. It is situated in the southwestern part of the state, about 20 miles from the state capital of Concord. The town was first settled in 1764 and was incorporated in 1768. The town has a total area of 8.2 square miles, of which 8.1 square miles is land and 0.1 square miles is water. The economy of Pinardville is largely based on agriculture and tourism. As of the 2010 census, the town had a population of 2,845. The median household income in the town was $60,938, and the median family income was $68,750. Pinardville is a small town with a rich history and a vibrant economy.
Common Questions
What is Per Capita Income in Pinardville?
Per Capita income in Pinardville is $36,069.
What is the Median Family Income in Pinardville?
Median Family Income in Pinardville is $91,923.
What is the Median Household income in Pinardville?
Median Household Income in Pinardville is $71,690.
What is Income or Wage Gap in Pinardville?
Income or Wage Gap in Pinardville is 2.4%.
Women in Pinardville earn 97.6 cents for every dollar earned by a man.
What is Inequality or Gini Index in Pinardville?
Inequality or Gini Index in Pinardville is 0.38.
What is the Total Population of Pinardville?
Total Population of Pinardville is 4,851.
What is the Total Male Population of Pinardville?
Total Male Population of Pinardville is 2,209.
What is the Total Female Population of Pinardville?
Total Female Population of Pinardville is 2,642.
What is the Ratio of Males per 100 Females in Pinardville?
There are 83.61 Males per 100 Females in Pinardville.
What is the Ratio of Females per 100 Males in Pinardville?
There are 119.60 Females per 100 Males in Pinardville.
What is the Median Population Age in Pinardville?
Median Population Age in Pinardville is 38.0 Years.
What is the Average Family Size in Pinardville
Average Family Size in Pinardville is 3.0 People.
What is the Average Household Size in Pinardville
Average Household Size in Pinardville is 2.3 People.
How Large is the Labor Force in Pinardville?
There are 2,867 People in the Labor Forcein in Pinardville.
What is the Percentage of People in the Labor Force in Pinardville?
70.8% of People are in the Labor Force in Pinardville.
What is the Unemployment Rate in Pinardville?
Unemployment Rate in Pinardville is 0.8%.