Virginia, MN Map & Demographics
Virginia Map
Virginia Overview
$28,976
PER CAPITA INCOME
$69,932
AVG FAMILY INCOME
$49,789
AVG HOUSEHOLD INCOME
15.6%
WAGE / INCOME GAP [ % ]
84.4¢/ $1
WAGE / INCOME GAP [ $ ]
0.46
INEQUALITY / GINI INDEX
8,415
TOTAL POPULATION
4,323
MALE POPULATION
4,092
FEMALE POPULATION
105.65
MALES / 100 FEMALES
94.66
FEMALES / 100 MALES
42.8
MEDIAN AGE
2.8
AVG FAMILY SIZE
2.0
AVG HOUSEHOLD SIZE
3,573
LABOR FORCE [ PEOPLE ]
50.9%
PERCENT IN LABOR FORCE
5.7%
UNEMPLOYMENT RATE
Virginia Zip Codes
Virginia Area Codes
Income in Virginia
Income Overview in Virginia
Per Capita Income in Virginia is $28,976, while median incomes of families and households are $69,932 and $49,789 respectively.
| Characteristic | Number | Measure |
| Per Capita Income | 8,415 | $28,976 |
| Median Family Income | 1,908 | $69,932 |
| Mean Family Income | 1,908 | $75,935 |
| Median Household Income | 3,960 | $49,789 |
| Mean Household Income | 3,960 | $59,681 |
| Income Deficit | 1,908 | $0 |
| Wage / Income Gap (%) | 8,415 | 15.63% |
| Wage / Income Gap ($) | 8,415 | 84.37¢ per $1 |
| Gini / Inequality Index | 8,415 | 0.46 |
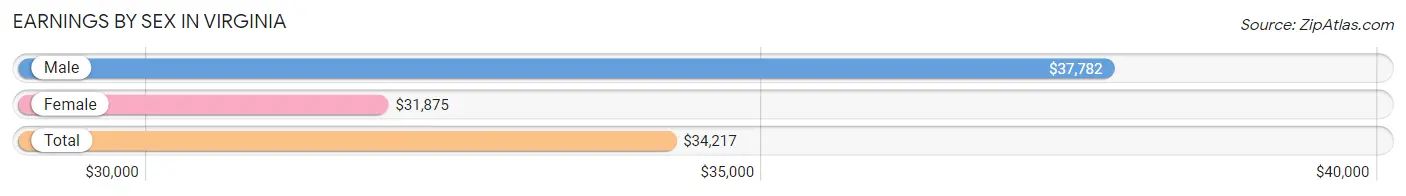
Earnings by Sex in Virginia
Average Earnings in Virginia are $34,217, $37,782 for men and $31,875 for women, a difference of 15.6%.
| Sex | Number | Average Earnings |
| Male | 2,092 (53.8%) | $37,782 |
| Female | 1,794 (46.2%) | $31,875 |
| Total | 3,886 (100.0%) | $34,217 |
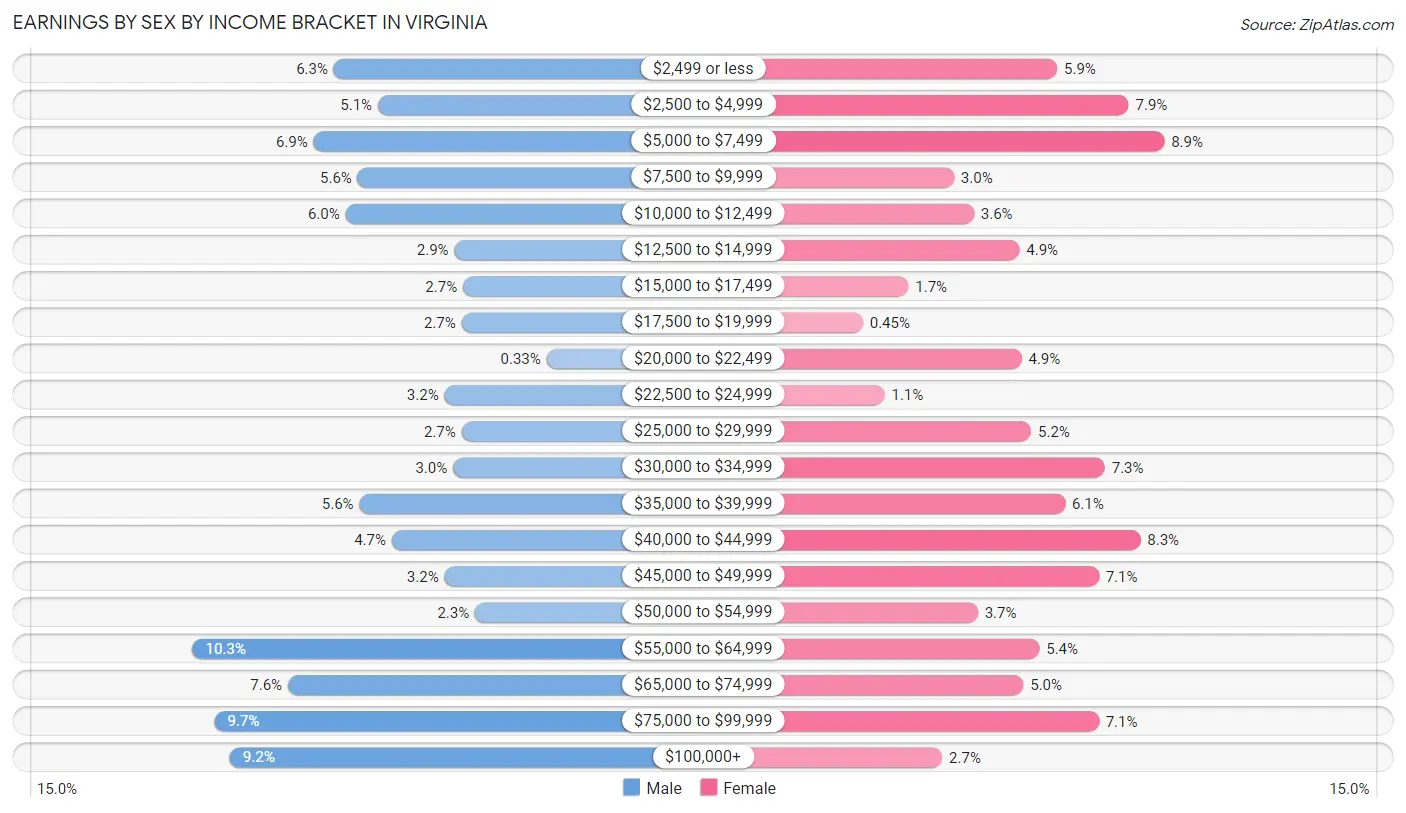
Earnings by Sex by Income Bracket in Virginia
The most common earnings brackets in Virginia are $55,000 to $64,999 for men (215 | 10.3%) and $5,000 to $7,499 for women (160 | 8.9%).
| Income | Male | Female |
| $2,499 or less | 132 (6.3%) | 106 (5.9%) |
| $2,500 to $4,999 | 106 (5.1%) | 142 (7.9%) |
| $5,000 to $7,499 | 144 (6.9%) | 160 (8.9%) |
| $7,500 to $9,999 | 118 (5.6%) | 54 (3.0%) |
| $10,000 to $12,499 | 125 (6.0%) | 64 (3.6%) |
| $12,500 to $14,999 | 61 (2.9%) | 87 (4.9%) |
| $15,000 to $17,499 | 56 (2.7%) | 31 (1.7%) |
| $17,500 to $19,999 | 57 (2.7%) | 8 (0.4%) |
| $20,000 to $22,499 | 7 (0.3%) | 88 (4.9%) |
| $22,500 to $24,999 | 67 (3.2%) | 19 (1.1%) |
| $25,000 to $29,999 | 57 (2.7%) | 93 (5.2%) |
| $30,000 to $34,999 | 62 (3.0%) | 130 (7.2%) |
| $35,000 to $39,999 | 117 (5.6%) | 110 (6.1%) |
| $40,000 to $44,999 | 98 (4.7%) | 148 (8.3%) |
| $45,000 to $49,999 | 67 (3.2%) | 127 (7.1%) |
| $50,000 to $54,999 | 49 (2.3%) | 66 (3.7%) |
| $55,000 to $64,999 | 215 (10.3%) | 97 (5.4%) |
| $65,000 to $74,999 | 159 (7.6%) | 89 (5.0%) |
| $75,000 to $99,999 | 202 (9.7%) | 127 (7.1%) |
| $100,000+ | 193 (9.2%) | 48 (2.7%) |
| Total | 2,092 (100.0%) | 1,794 (100.0%) |
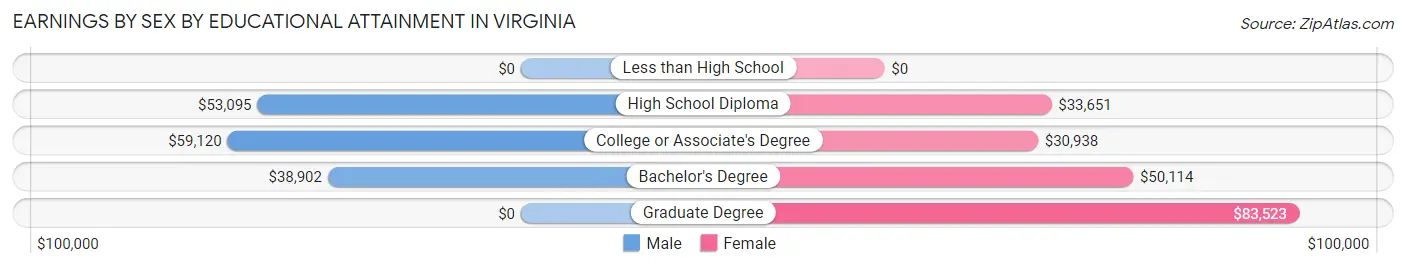
Earnings by Sex by Educational Attainment in Virginia
Average earnings in Virginia are $53,167 for men and $36,153 for women, a difference of 32.0%. Men with an educational attainment of college or associate's degree enjoy the highest average annual earnings of $59,120, while those with bachelor's degree education earn the least with $38,902. Women with an educational attainment of graduate degree earn the most with the average annual earnings of $83,523, while those with college or associate's degree education have the smallest earnings of $30,938.
| Educational Attainment | Male Income | Female Income |
| Less than High School | - | - |
| High School Diploma | $53,095 | $33,651 |
| College or Associate's Degree | $59,120 | $30,938 |
| Bachelor's Degree | $38,902 | $50,114 |
| Graduate Degree | - | - |
| Total | $53,167 | $36,153 |
Family Income in Virginia
Family Income Brackets in Virginia
According to the Virginia family income data, there are 551 families falling into the $50,000 to $74,999 income range, which is the most common income bracket and makes up 28.9% of all families. Conversely, the $200,000+ income bracket is the least frequent group with only 53 families (2.8%) belonging to this category.
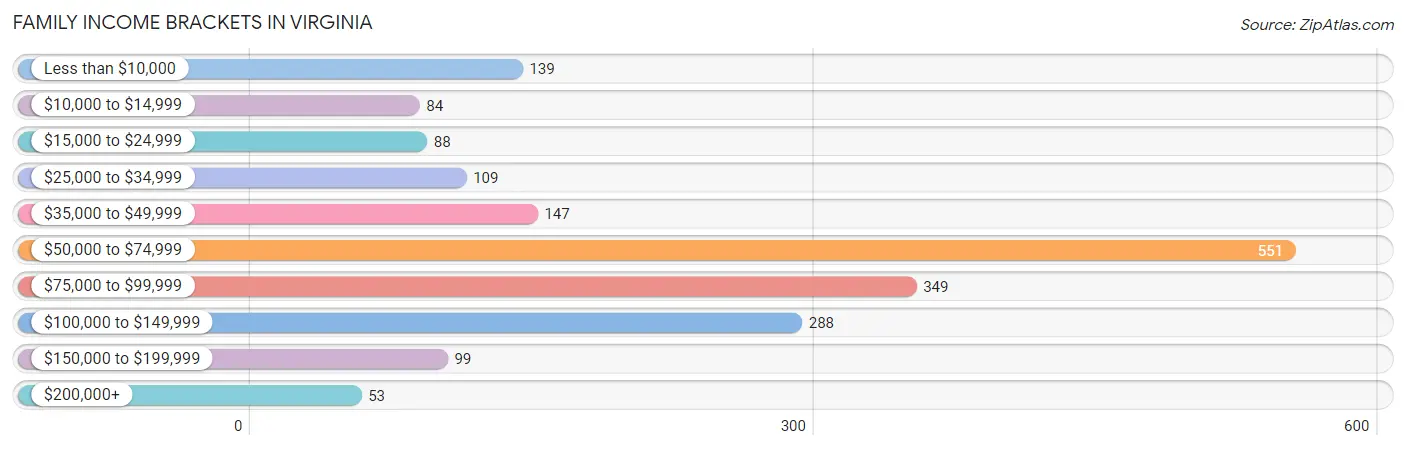
| Income Bracket | # Families | % Families |
| Less than $10,000 | 139 | 7.3% |
| $10,000 to $14,999 | 84 | 4.4% |
| $15,000 to $24,999 | 88 | 4.6% |
| $25,000 to $34,999 | 109 | 5.7% |
| $35,000 to $49,999 | 147 | 7.7% |
| $50,000 to $74,999 | 551 | 28.9% |
| $75,000 to $99,999 | 349 | 18.3% |
| $100,000 to $149,999 | 288 | 15.1% |
| $150,000 to $199,999 | 99 | 5.2% |
| $200,000+ | 53 | 2.8% |
Family Income by Famaliy Size in Virginia
4-person families (260 | 13.6%) account for the highest median family income in Virginia with $70,577 per family, while 2-person families (1,067 | 55.9%) have the highest median income of $35,067 per family member.
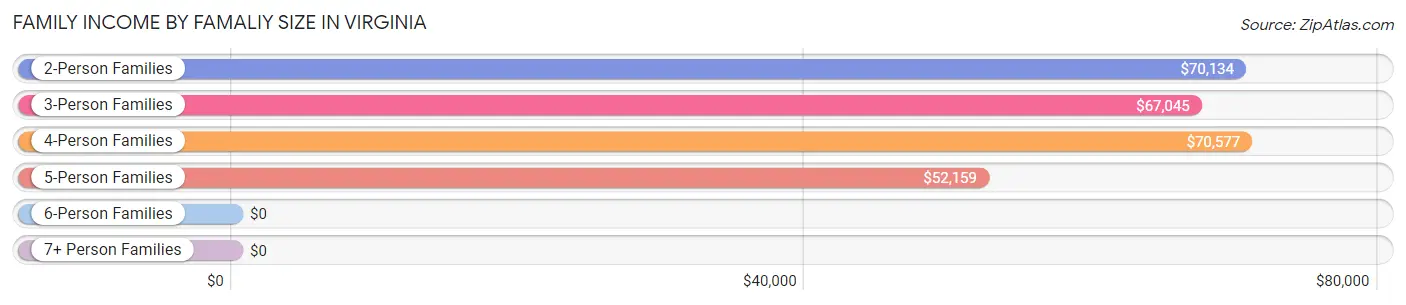
| Income Bracket | # Families | Median Income |
| 2-Person Families | 1,067 (55.9%) | $70,134 |
| 3-Person Families | 386 (20.2%) | $67,045 |
| 4-Person Families | 260 (13.6%) | $70,577 |
| 5-Person Families | 157 (8.2%) | $52,159 |
| 6-Person Families | 38 (2.0%) | $0 |
| 7+ Person Families | 0 (0.0%) | $0 |
| Total | 1,908 (100.0%) | $69,932 |
Family Income by Number of Earners in Virginia
The median family income in Virginia is $69,932, with families comprising 3+ earners (98) having the highest median family income of $165,000, while families with no earners (424) have the lowest median family income of $50,326, accounting for 5.1% and 22.2% of families, respectively.
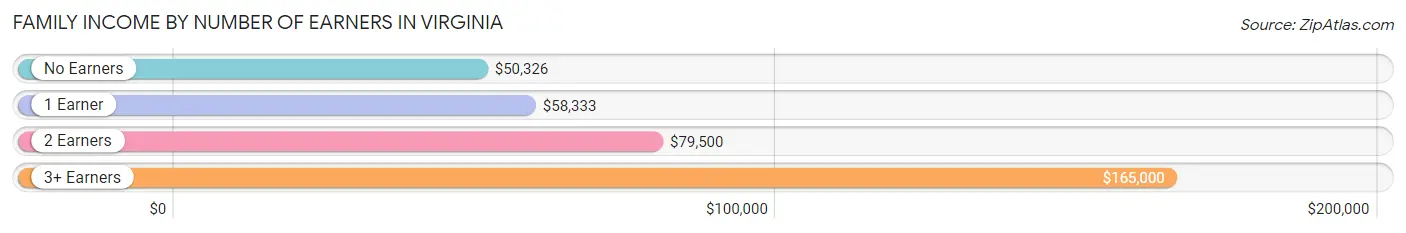
| Number of Earners | # Families | Median Income |
| No Earners | 424 (22.2%) | $50,326 |
| 1 Earner | 664 (34.8%) | $58,333 |
| 2 Earners | 722 (37.8%) | $79,500 |
| 3+ Earners | 98 (5.1%) | $165,000 |
| Total | 1,908 (100.0%) | $69,932 |
Household Income in Virginia
Household Income Brackets in Virginia
With 855 households falling in the category, the $50,000 to $74,999 income range is the most frequent in Virginia, accounting for 21.6% of all households. In contrast, only 79 households (2.0%) fall into the $200,000+ income bracket, making it the least populous group.
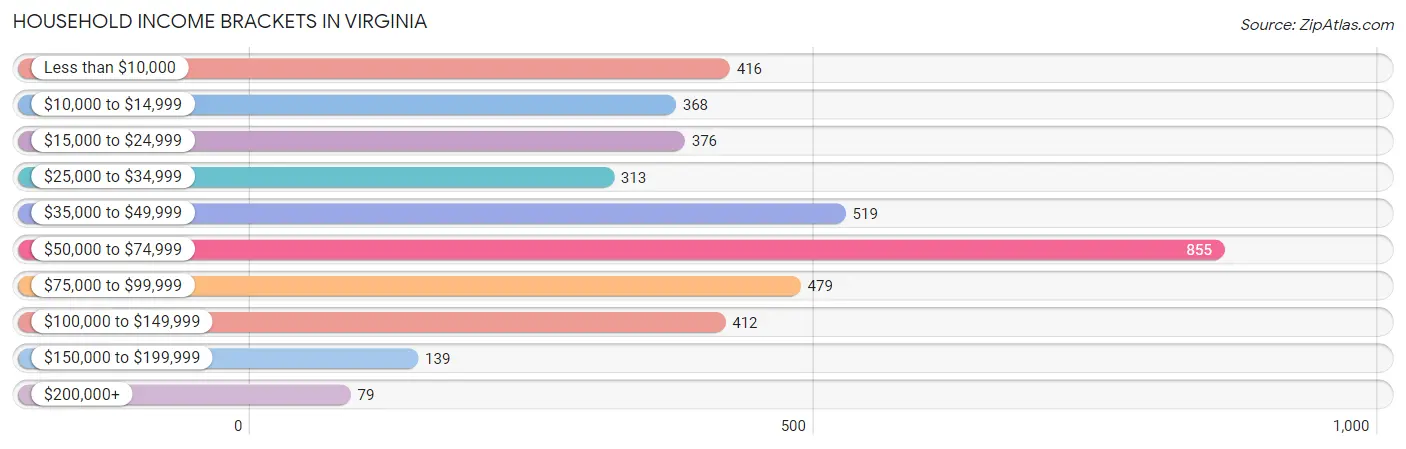
| Income Bracket | # Households | % Households |
| Less than $10,000 | 416 | 10.5% |
| $10,000 to $14,999 | 368 | 9.3% |
| $15,000 to $24,999 | 376 | 9.5% |
| $25,000 to $34,999 | 313 | 7.9% |
| $35,000 to $49,999 | 519 | 13.1% |
| $50,000 to $74,999 | 855 | 21.6% |
| $75,000 to $99,999 | 479 | 12.1% |
| $100,000 to $149,999 | 412 | 10.4% |
| $150,000 to $199,999 | 139 | 3.5% |
| $200,000+ | 79 | 2.0% |
Household Income by Householder Age in Virginia
The median household income in Virginia is $49,789, with the highest median household income of $52,197 found in the 25 to 44 years age bracket for the primary householder. A total of 1,112 households (28.1%) fall into this category. Meanwhile, the 15 to 24 years age bracket for the primary householder has the lowest median household income of $33,203, with 161 households (4.1%) in this group.
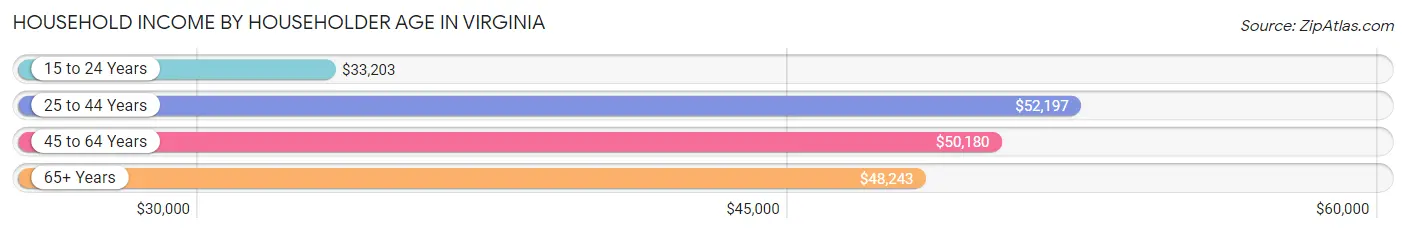
| Income Bracket | # Households | Median Income |
| 15 to 24 Years | 161 (4.1%) | $33,203 |
| 25 to 44 Years | 1,112 (28.1%) | $52,197 |
| 45 to 64 Years | 1,537 (38.8%) | $50,180 |
| 65+ Years | 1,150 (29.0%) | $48,243 |
| Total | 3,960 (100.0%) | $49,789 |
Poverty in Virginia
Income Below Poverty by Sex and Age in Virginia
With 22.5% poverty level for males and 24.3% for females among the residents of Virginia, 15 year old males and 5 year old females are the most vulnerable to poverty, with 19 males (63.3%) and 22 females (100.0%) in their respective age groups living below the poverty level.
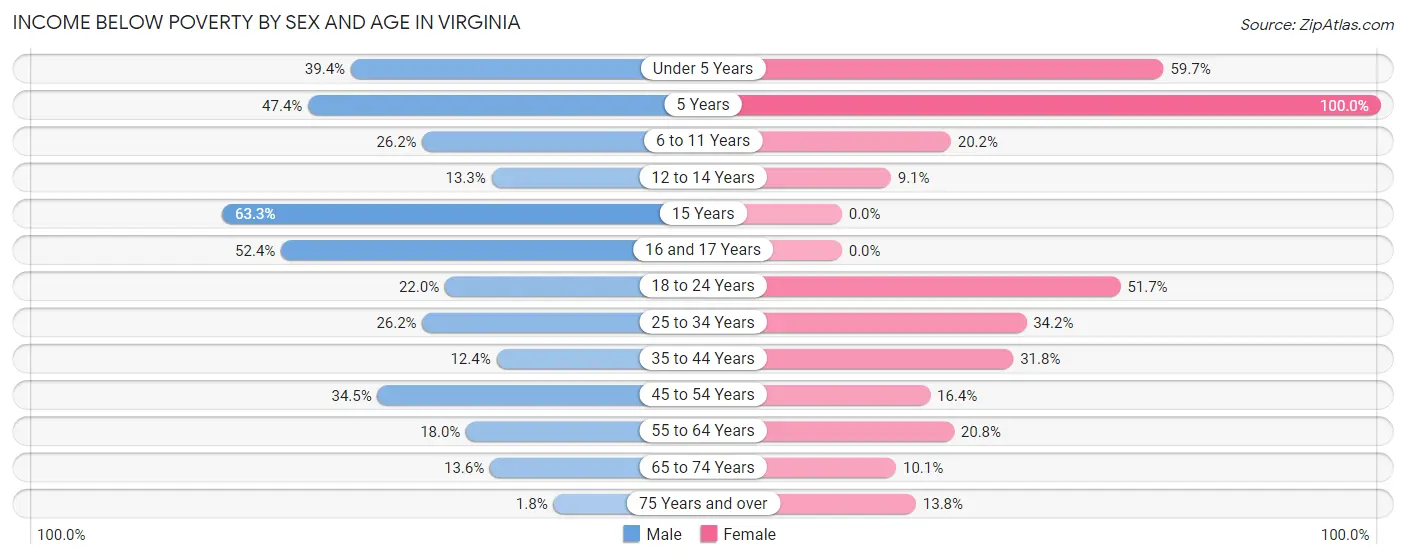
| Age Bracket | Male | Female |
| Under 5 Years | 97 (39.4%) | 83 (59.7%) |
| 5 Years | 27 (47.4%) | 22 (100.0%) |
| 6 to 11 Years | 68 (26.2%) | 53 (20.2%) |
| 12 to 14 Years | 24 (13.3%) | 13 (9.1%) |
| 15 Years | 19 (63.3%) | 0 (0.0%) |
| 16 and 17 Years | 110 (52.4%) | 0 (0.0%) |
| 18 to 24 Years | 87 (22.0%) | 150 (51.7%) |
| 25 to 34 Years | 85 (26.2%) | 114 (34.2%) |
| 35 to 44 Years | 71 (12.4%) | 203 (31.8%) |
| 45 to 54 Years | 189 (34.5%) | 70 (16.4%) |
| 55 to 64 Years | 86 (18.0%) | 135 (20.8%) |
| 65 to 74 Years | 65 (13.6%) | 42 (10.1%) |
| 75 Years and over | 7 (1.8%) | 70 (13.8%) |
| Total | 935 (22.5%) | 955 (24.3%) |
Income Above Poverty by Sex and Age in Virginia
According to the poverty statistics in Virginia, males aged 75 years and over and females aged 15 years are the age groups that are most secure financially, with 98.2% of males and 100.0% of females in these age groups living above the poverty line.
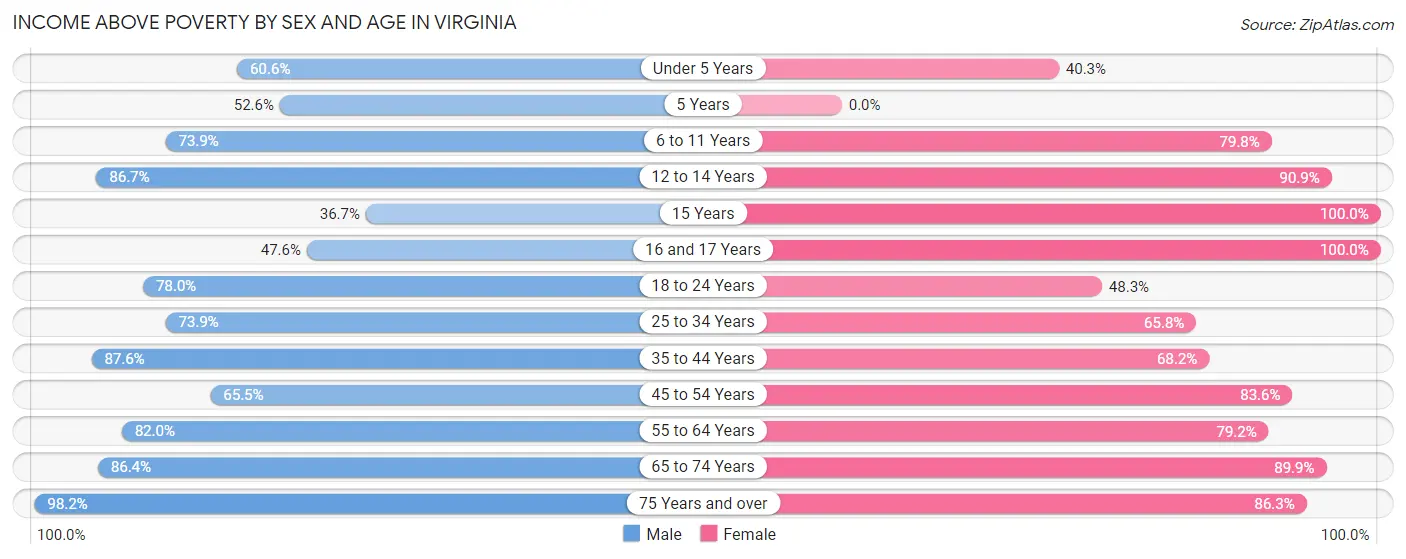
| Age Bracket | Male | Female |
| Under 5 Years | 149 (60.6%) | 56 (40.3%) |
| 5 Years | 30 (52.6%) | 0 (0.0%) |
| 6 to 11 Years | 192 (73.9%) | 209 (79.8%) |
| 12 to 14 Years | 156 (86.7%) | 130 (90.9%) |
| 15 Years | 11 (36.7%) | 11 (100.0%) |
| 16 and 17 Years | 100 (47.6%) | 95 (100.0%) |
| 18 to 24 Years | 309 (78.0%) | 140 (48.3%) |
| 25 to 34 Years | 240 (73.9%) | 219 (65.8%) |
| 35 to 44 Years | 501 (87.6%) | 435 (68.2%) |
| 45 to 54 Years | 359 (65.5%) | 357 (83.6%) |
| 55 to 64 Years | 391 (82.0%) | 514 (79.2%) |
| 65 to 74 Years | 413 (86.4%) | 375 (89.9%) |
| 75 Years and over | 376 (98.2%) | 439 (86.3%) |
| Total | 3,227 (77.5%) | 2,980 (75.7%) |
Income Below Poverty Among Married-Couple Families in Virginia
The poverty statistics for married-couple families in Virginia show that 4.2% or 52 of the total 1,238 families live below the poverty line. Families with 3 or 4 children have the highest poverty rate of 38.3%, comprising of 44 families. On the other hand, families with 1 or 2 children have the lowest poverty rate of 0.0%, which includes 0 families.
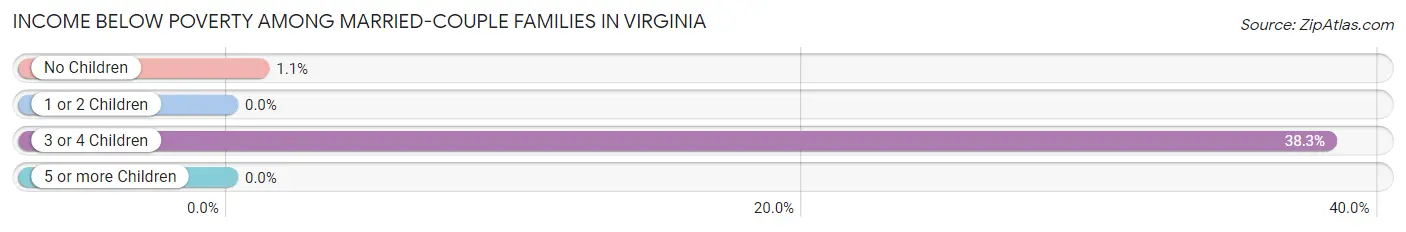
| Children | Above Poverty | Below Poverty |
| No Children | 723 (98.9%) | 8 (1.1%) |
| 1 or 2 Children | 392 (100.0%) | 0 (0.0%) |
| 3 or 4 Children | 71 (61.7%) | 44 (38.3%) |
| 5 or more Children | 0 (0.0%) | 0 (0.0%) |
| Total | 1,186 (95.8%) | 52 (4.2%) |
Income Below Poverty Among Single-Parent Households in Virginia
According to the poverty data in Virginia, 21.6% or 30 single-father households and 40.1% or 213 single-mother households are living below the poverty line. Among single-father households, those with 1 or 2 children have the highest poverty rate, with 30 households (30.6%) experiencing poverty. Likewise, among single-mother households, those with 3 or 4 children have the highest poverty rate, with 27 households (58.7%) falling below the poverty line.
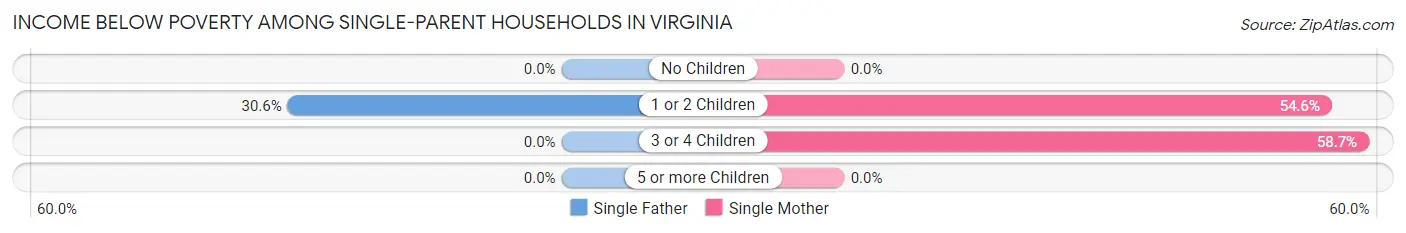
| Children | Single Father | Single Mother |
| No Children | 0 (0.0%) | 0 (0.0%) |
| 1 or 2 Children | 30 (30.6%) | 186 (54.5%) |
| 3 or 4 Children | 0 (0.0%) | 27 (58.7%) |
| 5 or more Children | 0 (0.0%) | 0 (0.0%) |
| Total | 30 (21.6%) | 213 (40.1%) |
Income Below Poverty Among Married-Couple vs Single-Parent Households in Virginia
The poverty data for Virginia shows that 52 of the married-couple family households (4.2%) and 243 of the single-parent households (36.3%) are living below the poverty level. Within the married-couple family households, those with 3 or 4 children have the highest poverty rate, with 44 households (38.3%) falling below the poverty line. Among the single-parent households, those with 3 or 4 children have the highest poverty rate, with 27 household (58.7%) living below poverty.
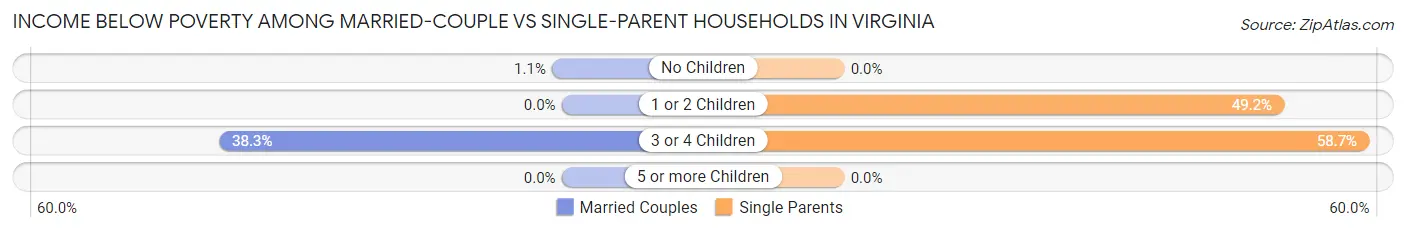
| Children | Married-Couple Families | Single-Parent Households |
| No Children | 8 (1.1%) | 0 (0.0%) |
| 1 or 2 Children | 0 (0.0%) | 216 (49.2%) |
| 3 or 4 Children | 44 (38.3%) | 27 (58.7%) |
| 5 or more Children | 0 (0.0%) | 0 (0.0%) |
| Total | 52 (4.2%) | 243 (36.3%) |
Race in Virginia
The most populous races in Virginia are White / Caucasian (7,701 | 91.5%), Two or more Races (315 | 3.7%), and Native / Alaskan (236 | 2.8%).
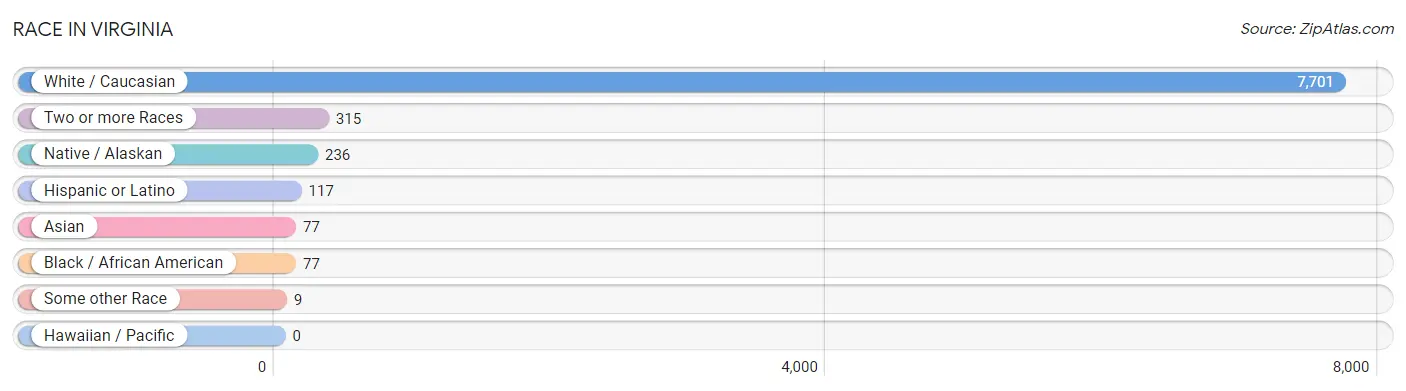
| Race | # Population | % Population |
| Asian | 77 | 0.9% |
| Black / African American | 77 | 0.9% |
| Hawaiian / Pacific | 0 | 0.0% |
| Hispanic or Latino | 117 | 1.4% |
| Native / Alaskan | 236 | 2.8% |
| White / Caucasian | 7,701 | 91.5% |
| Two or more Races | 315 | 3.7% |
| Some other Race | 9 | 0.1% |
| Total | 8,415 | 100.0% |
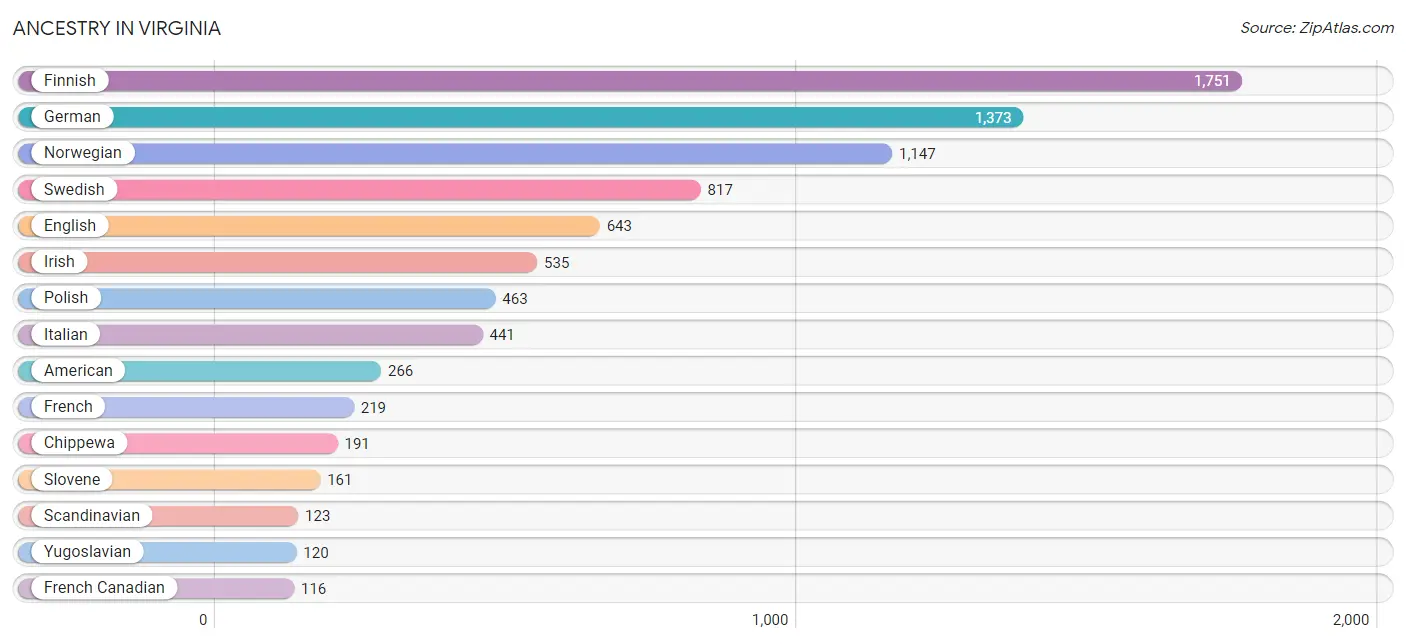
Ancestry in Virginia
The most populous ancestries reported in Virginia are Finnish (1,751 | 20.8%), German (1,373 | 16.3%), Norwegian (1,147 | 13.6%), Swedish (817 | 9.7%), and English (643 | 7.6%), together accounting for 68.1% of all Virginia residents.
| Ancestry | # Population | % Population |
| African | 20 | 0.2% |
| Albanian | 6 | 0.1% |
| American | 266 | 3.2% |
| Apache | 10 | 0.1% |
| Bangladeshi | 19 | 0.2% |
| Belgian | 34 | 0.4% |
| Bhutanese | 21 | 0.3% |
| British | 14 | 0.2% |
| Burmese | 39 | 0.5% |
| Cherokee | 90 | 1.1% |
| Chippewa | 191 | 2.3% |
| Croatian | 95 | 1.1% |
| Czech | 93 | 1.1% |
| Czechoslovakian | 10 | 0.1% |
| Danish | 61 | 0.7% |
| Dutch | 59 | 0.7% |
| English | 643 | 7.6% |
| Ethiopian | 20 | 0.2% |
| European | 98 | 1.2% |
| Finnish | 1,751 | 20.8% |
| French | 219 | 2.6% |
| French American Indian | 1 | 0.0% |
| French Canadian | 116 | 1.4% |
| German | 1,373 | 16.3% |
| Greek | 4 | 0.1% |
| Haitian | 4 | 0.1% |
| Hungarian | 57 | 0.7% |
| Icelander | 10 | 0.1% |
| Irish | 535 | 6.4% |
| Italian | 441 | 5.2% |
| Korean | 19 | 0.2% |
| Mexican | 91 | 1.1% |
| Nigerian | 13 | 0.2% |
| Norwegian | 1,147 | 13.6% |
| Polish | 463 | 5.5% |
| Puerto Rican | 13 | 0.2% |
| Romanian | 57 | 0.7% |
| Russian | 54 | 0.6% |
| Scandinavian | 123 | 1.5% |
| Scotch-Irish | 102 | 1.2% |
| Scottish | 53 | 0.6% |
| Serbian | 21 | 0.3% |
| Slavic | 26 | 0.3% |
| Slovak | 9 | 0.1% |
| Slovene | 161 | 1.9% |
| Spaniard | 10 | 0.1% |
| Sri Lankan | 40 | 0.5% |
| Subsaharan African | 33 | 0.4% |
| Swedish | 817 | 9.7% |
| Ukrainian | 5 | 0.1% |
| Welsh | 28 | 0.3% |
| Yugoslavian | 120 | 1.4% | View All 52 Rows |
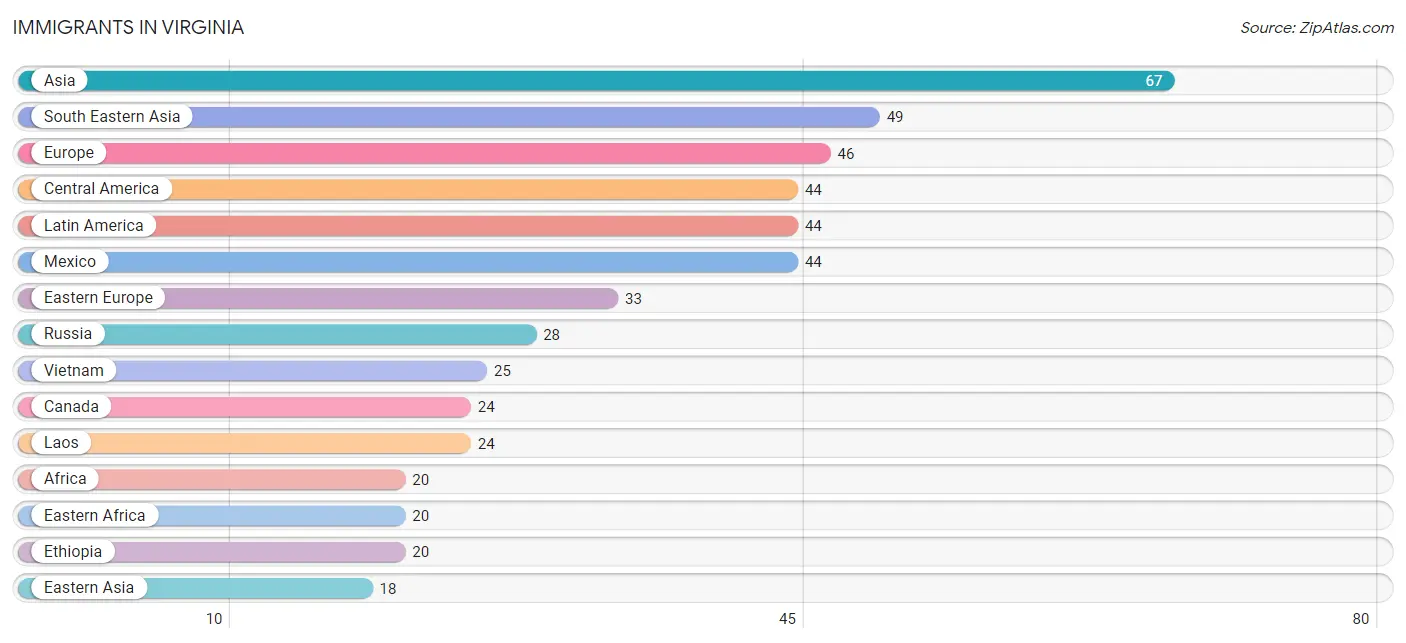
Immigrants in Virginia
The most numerous immigrant groups reported in Virginia came from Asia (67 | 0.8%), South Eastern Asia (49 | 0.6%), Europe (46 | 0.5%), Central America (44 | 0.5%), and Latin America (44 | 0.5%), together accounting for 3.0% of all Virginia residents.
| Immigration Origin | # Population | % Population |
| Africa | 20 | 0.2% |
| Asia | 67 | 0.8% |
| Canada | 24 | 0.3% |
| Central America | 44 | 0.5% |
| Eastern Africa | 20 | 0.2% |
| Eastern Asia | 18 | 0.2% |
| Eastern Europe | 33 | 0.4% |
| Ethiopia | 20 | 0.2% |
| Europe | 46 | 0.5% |
| Italy | 13 | 0.2% |
| Korea | 18 | 0.2% |
| Laos | 24 | 0.3% |
| Latin America | 44 | 0.5% |
| Mexico | 44 | 0.5% |
| Russia | 28 | 0.3% |
| South Eastern Asia | 49 | 0.6% |
| Southern Europe | 13 | 0.2% |
| Ukraine | 5 | 0.1% |
| Vietnam | 25 | 0.3% | View All 19 Rows |
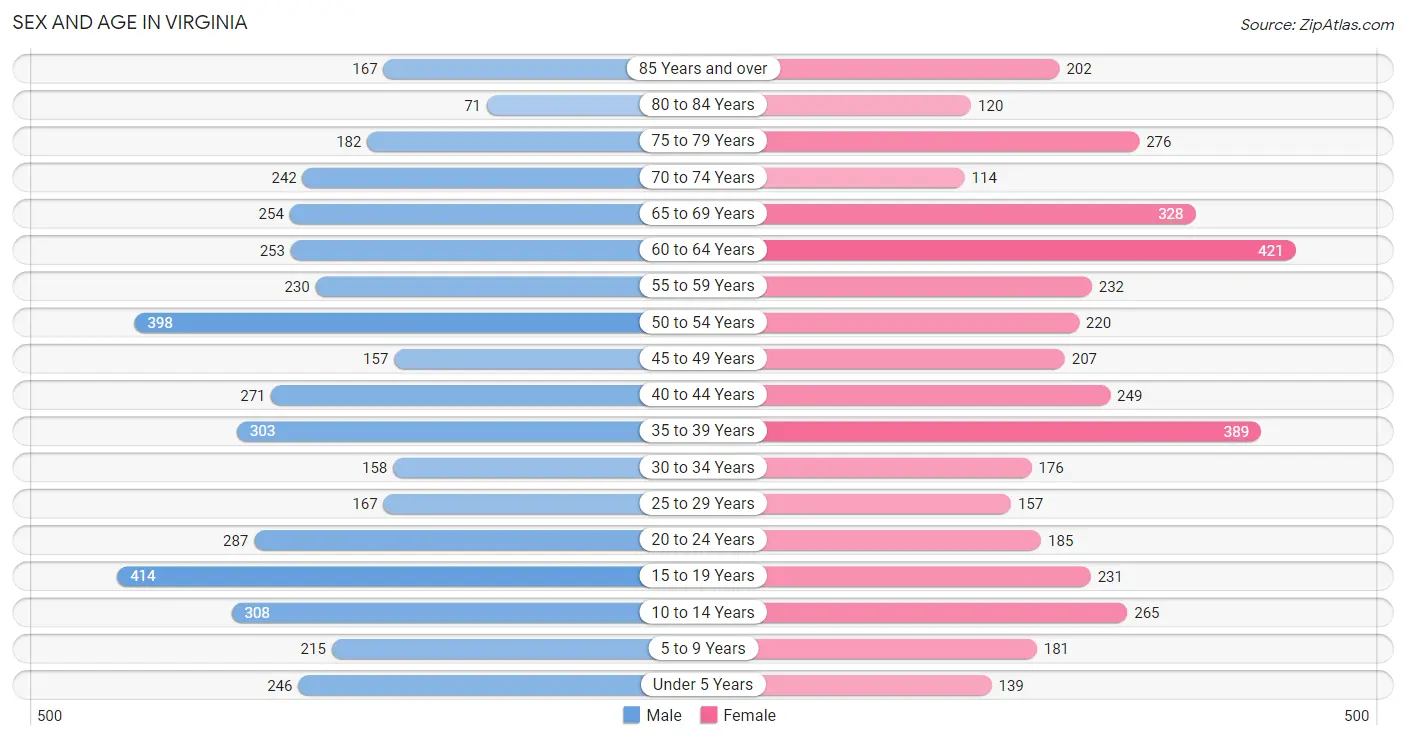
Sex and Age in Virginia
Sex and Age in Virginia
The most populous age groups in Virginia are 15 to 19 Years (414 | 9.6%) for men and 60 to 64 Years (421 | 10.3%) for women.
| Age Bracket | Male | Female |
| Under 5 Years | 246 (5.7%) | 139 (3.4%) |
| 5 to 9 Years | 215 (5.0%) | 181 (4.4%) |
| 10 to 14 Years | 308 (7.1%) | 265 (6.5%) |
| 15 to 19 Years | 414 (9.6%) | 231 (5.7%) |
| 20 to 24 Years | 287 (6.6%) | 185 (4.5%) |
| 25 to 29 Years | 167 (3.9%) | 157 (3.8%) |
| 30 to 34 Years | 158 (3.6%) | 176 (4.3%) |
| 35 to 39 Years | 303 (7.0%) | 389 (9.5%) |
| 40 to 44 Years | 271 (6.3%) | 249 (6.1%) |
| 45 to 49 Years | 157 (3.6%) | 207 (5.1%) |
| 50 to 54 Years | 398 (9.2%) | 220 (5.4%) |
| 55 to 59 Years | 230 (5.3%) | 232 (5.7%) |
| 60 to 64 Years | 253 (5.9%) | 421 (10.3%) |
| 65 to 69 Years | 254 (5.9%) | 328 (8.0%) |
| 70 to 74 Years | 242 (5.6%) | 114 (2.8%) |
| 75 to 79 Years | 182 (4.2%) | 276 (6.7%) |
| 80 to 84 Years | 71 (1.6%) | 120 (2.9%) |
| 85 Years and over | 167 (3.9%) | 202 (4.9%) |
| Total | 4,323 (100.0%) | 4,092 (100.0%) |
Families and Households in Virginia
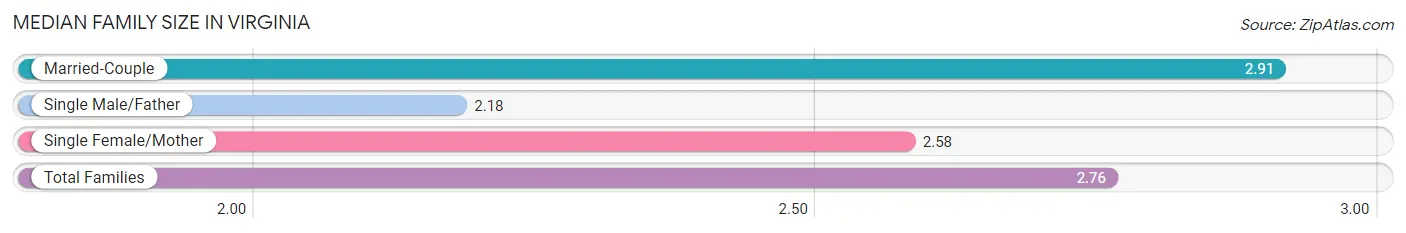
Median Family Size in Virginia
The median family size in Virginia is 2.76 persons per family, with married-couple families (1,238 | 64.9%) accounting for the largest median family size of 2.91 persons per family. On the other hand, single male/father families (139 | 7.3%) represent the smallest median family size with 2.18 persons per family.
| Family Type | # Families | Family Size |
| Married-Couple | 1,238 (64.9%) | 2.91 |
| Single Male/Father | 139 (7.3%) | 2.18 |
| Single Female/Mother | 531 (27.8%) | 2.58 |
| Total Families | 1,908 (100.0%) | 2.76 |
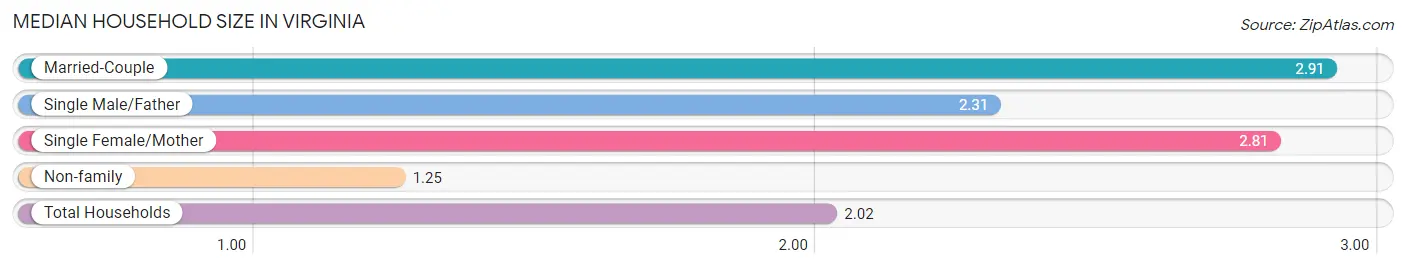
Median Household Size in Virginia
The median household size in Virginia is 2.02 persons per household, with married-couple households (1,238 | 31.3%) accounting for the largest median household size of 2.91 persons per household. non-family households (2,052 | 51.8%) represent the smallest median household size with 1.25 persons per household.
| Household Type | # Households | Household Size |
| Married-Couple | 1,238 (31.3%) | 2.91 |
| Single Male/Father | 139 (3.5%) | 2.31 |
| Single Female/Mother | 531 (13.4%) | 2.81 |
| Non-family | 2,052 (51.8%) | 1.25 |
| Total Households | 3,960 (100.0%) | 2.02 |
Household Size by Marriage Status in Virginia
Out of a total of 3,960 households in Virginia, 1,908 (48.2%) are family households, while 2,052 (51.8%) are nonfamily households. The most numerous type of family households are 2-person households, comprising 1,009, and the most common type of nonfamily households are 1-person households, comprising 1,705.
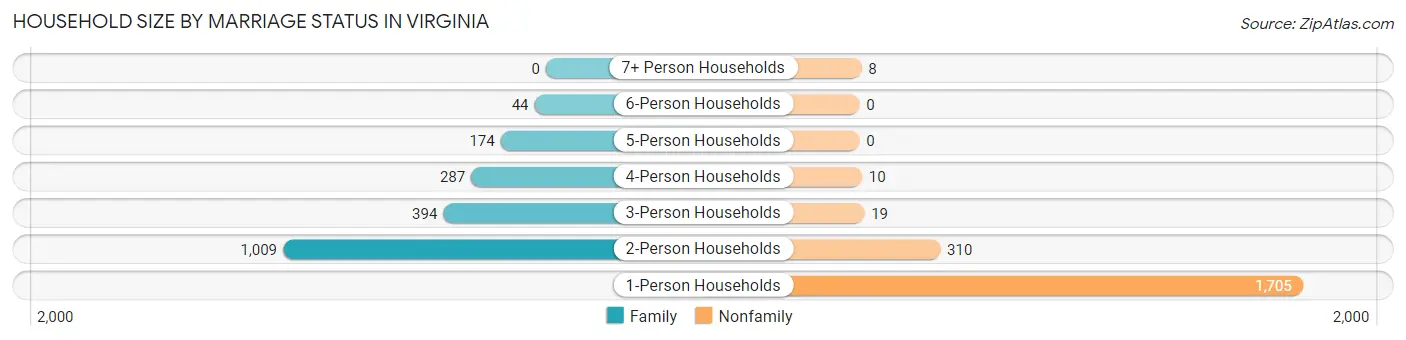
| Household Size | Family Households | Nonfamily Households |
| 1-Person Households | - | 1,705 (43.1%) |
| 2-Person Households | 1,009 (25.5%) | 310 (7.8%) |
| 3-Person Households | 394 (10.0%) | 19 (0.5%) |
| 4-Person Households | 287 (7.2%) | 10 (0.3%) |
| 5-Person Households | 174 (4.4%) | 0 (0.0%) |
| 6-Person Households | 44 (1.1%) | 0 (0.0%) |
| 7+ Person Households | 0 (0.0%) | 8 (0.2%) |
| Total | 1,908 (48.2%) | 2,052 (51.8%) |
Female Fertility in Virginia
Fertility by Age in Virginia
Average fertility rate in Virginia is 64.0 births per 1,000 women. Women in the age bracket of 20 to 34 years have the highest fertility rate with 174.0 births per 1,000 women. Women in the age bracket of 20 to 34 years acount for 87.4% of all women with births.
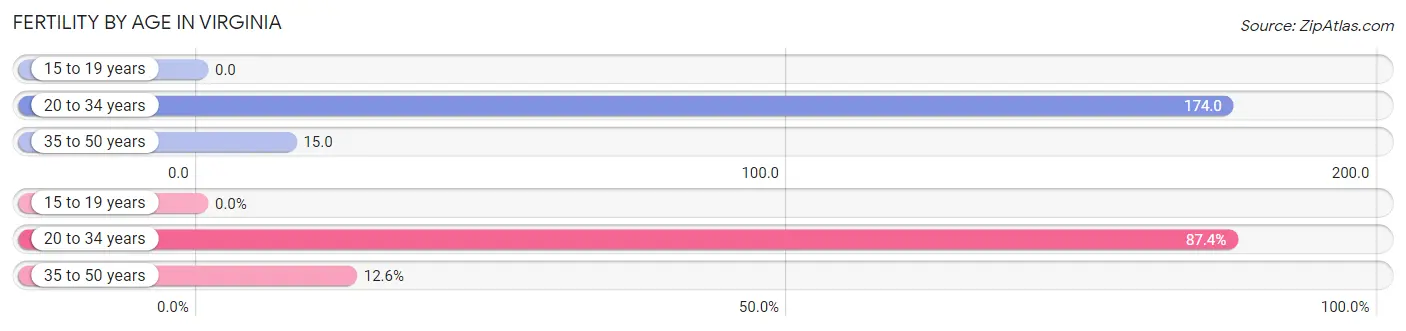
| Age Bracket | Women with Births | Births / 1,000 Women |
| 15 to 19 years | 0 (0.0%) | 0.0 |
| 20 to 34 years | 90 (87.4%) | 174.0 |
| 35 to 50 years | 13 (12.6%) | 15.0 |
| Total | 103 (100.0%) | 64.0 |
Fertility by Age by Marriage Status in Virginia
39.8% of women with births (103) in Virginia are married. The highest percentage of unmarried women with births falls into 20 to 34 years age bracket with 68.9% of them unmarried at the time of birth, while the lowest percentage of unmarried women with births belong to 35 to 50 years age bracket with 0.0% of them unmarried.
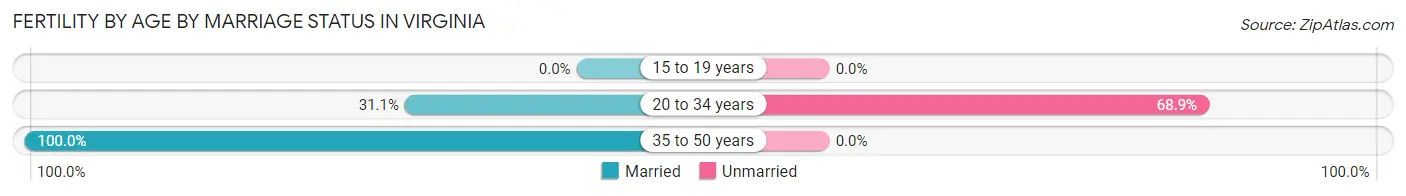
| Age Bracket | Married | Unmarried |
| 15 to 19 years | 0 (0.0%) | 0 (0.0%) |
| 20 to 34 years | 28 (31.1%) | 62 (68.9%) |
| 35 to 50 years | 13 (100.0%) | 0 (0.0%) |
| Total | 41 (39.8%) | 62 (60.2%) |
Fertility by Education in Virginia
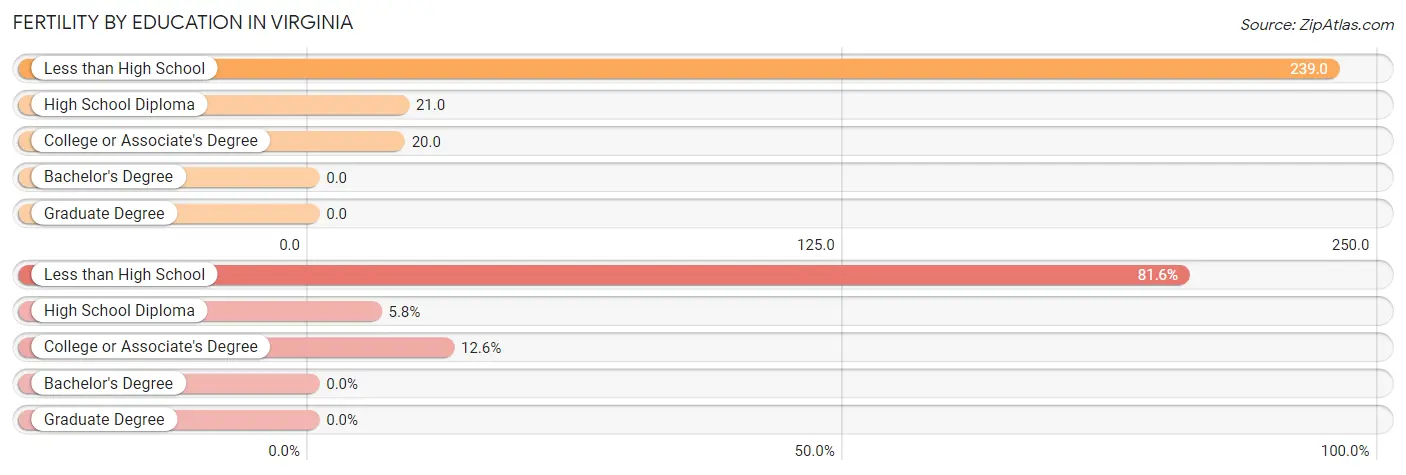
| Educational Attainment | Women with Births | Births / 1,000 Women |
| Less than High School | 84 (81.6%) | 239.0 |
| High School Diploma | 6 (5.8%) | 21.0 |
| College or Associate's Degree | 13 (12.6%) | 20.0 |
| Bachelor's Degree | 0 (0.0%) | 0.0 |
| Graduate Degree | 0 (0.0%) | 0.0 |
| Total | 103 (100.0%) | 64.0 |
Fertility by Education by Marriage Status in Virginia
60.2% of women with births in Virginia are unmarried. Women with the educational attainment of college or associate's degree are most likely to be married with 100.0% of them married at childbirth, while women with the educational attainment of high school diploma are least likely to be married with 100.0% of them unmarried at childbirth.
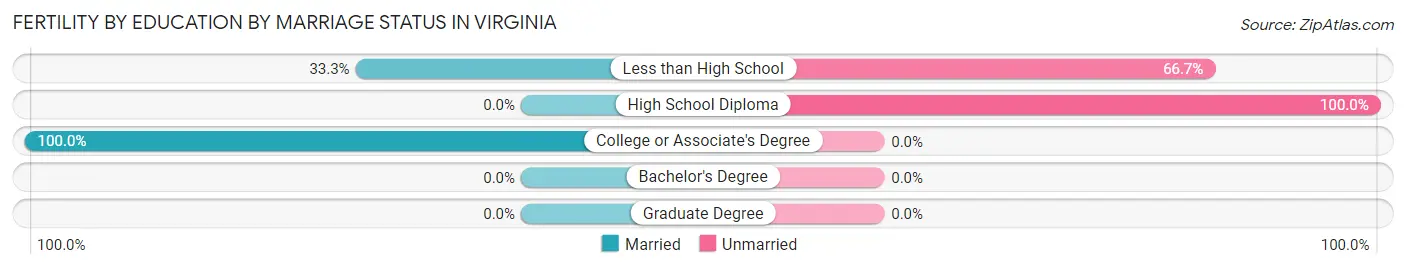
| Educational Attainment | Married | Unmarried |
| Less than High School | 28 (33.3%) | 56 (66.7%) |
| High School Diploma | 0 (0.0%) | 6 (100.0%) |
| College or Associate's Degree | 13 (100.0%) | 0 (0.0%) |
| Bachelor's Degree | 0 (0.0%) | 0 (0.0%) |
| Graduate Degree | 0 (0.0%) | 0 (0.0%) |
| Total | 41 (39.8%) | 62 (60.2%) |
Employment Characteristics in Virginia
Employment by Class of Employer in Virginia
Among the 3,319 employed individuals in Virginia, private company employees (2,182 | 65.7%), not-for-profit organizations (517 | 15.6%), and local government employees (362 | 10.9%) make up the most common classes of employment.
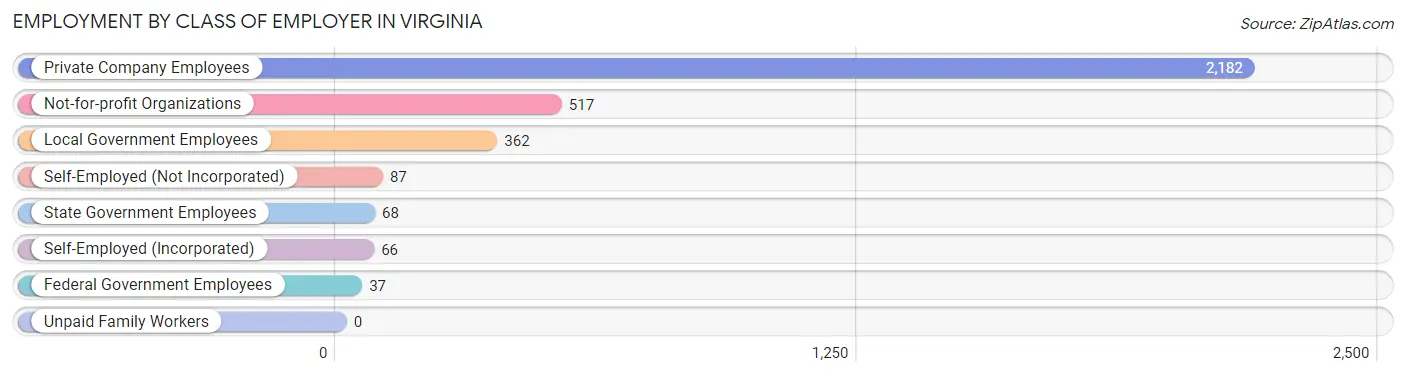
| Employer Class | # Employees | % Employees |
| Private Company Employees | 2,182 | 65.7% |
| Self-Employed (Incorporated) | 66 | 2.0% |
| Self-Employed (Not Incorporated) | 87 | 2.6% |
| Not-for-profit Organizations | 517 | 15.6% |
| Local Government Employees | 362 | 10.9% |
| State Government Employees | 68 | 2.1% |
| Federal Government Employees | 37 | 1.1% |
| Unpaid Family Workers | 0 | 0.0% |
| Total | 3,319 | 100.0% |
Employment Status by Age in Virginia
According to the labor force statistics for Virginia, out of the total population over 16 years of age (7,020), 50.9% or 3,573 individuals are in the labor force, with 5.7% or 204 of them unemployed. The age group with the highest labor force participation rate is 30 to 34 years, with 83.2% or 278 individuals in the labor force. Within the labor force, the 25 to 29 years age range has the highest percentage of unemployed individuals, with 22.4% or 45 of them being unemployed.
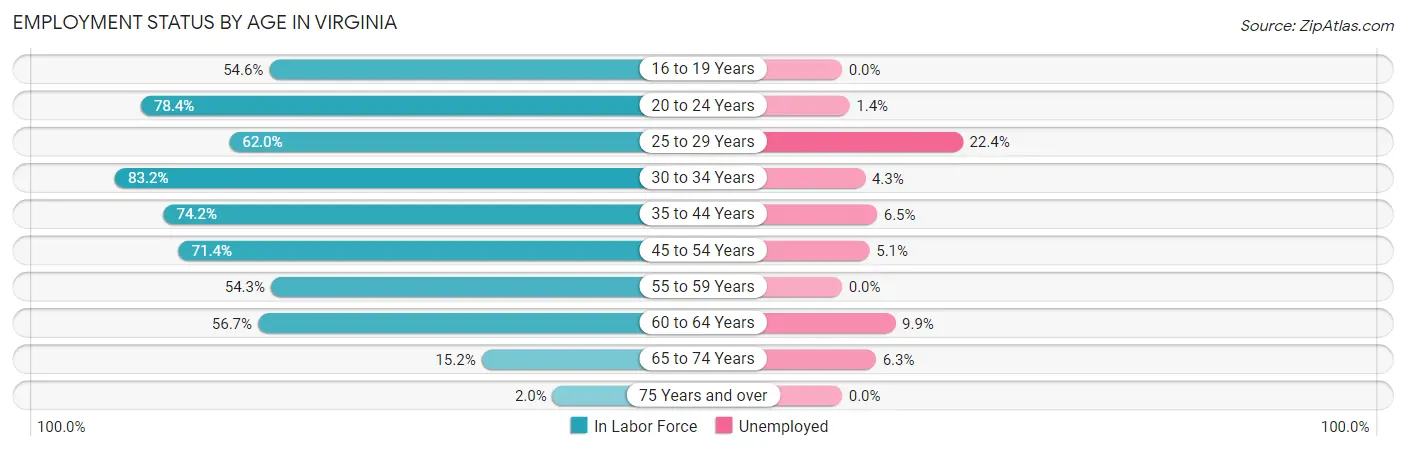
| Age Bracket | In Labor Force | Unemployed |
| 16 to 19 Years | 330 (54.6%) | 0 (0.0%) |
| 20 to 24 Years | 370 (78.4%) | 5 (1.4%) |
| 25 to 29 Years | 201 (62.0%) | 45 (22.4%) |
| 30 to 34 Years | 278 (83.2%) | 12 (4.3%) |
| 35 to 44 Years | 899 (74.2%) | 58 (6.5%) |
| 45 to 54 Years | 701 (71.4%) | 36 (5.1%) |
| 55 to 59 Years | 251 (54.3%) | 0 (0.0%) |
| 60 to 64 Years | 382 (56.7%) | 38 (9.9%) |
| 65 to 74 Years | 143 (15.2%) | 9 (6.3%) |
| 75 Years and over | 20 (2.0%) | 0 (0.0%) |
| Total | 3,573 (50.9%) | 204 (5.7%) |
Employment Status by Educational Attainment in Virginia
According to labor force statistics for Virginia, 68.0% of individuals (2,712) out of the total population between 25 and 64 years of age (3,988) are in the labor force, with 7.0% or 190 of them being unemployed. The group with the highest labor force participation rate are those with the educational attainment of bachelor's degree or higher, with 84.8% or 571 individuals in the labor force. Within the labor force, individuals with less than high school education have the highest percentage of unemployment, with 23.5% or 32 of them being unemployed.
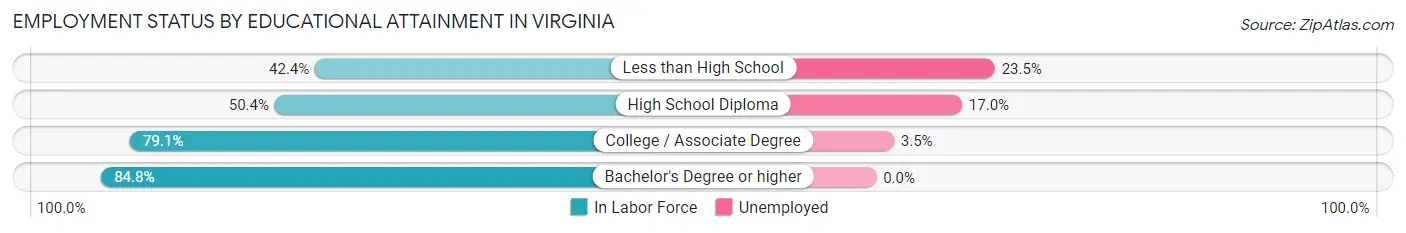
| Educational Attainment | In Labor Force | Unemployed |
| Less than High School | 136 (42.4%) | 75 (23.5%) |
| High School Diploma | 640 (50.4%) | 216 (17.0%) |
| College / Associate Degree | 1,364 (79.1%) | 60 (3.5%) |
| Bachelor's Degree or higher | 571 (84.8%) | 0 (0.0%) |
| Total | 2,712 (68.0%) | 279 (7.0%) |
Employment Occupations by Sex in Virginia
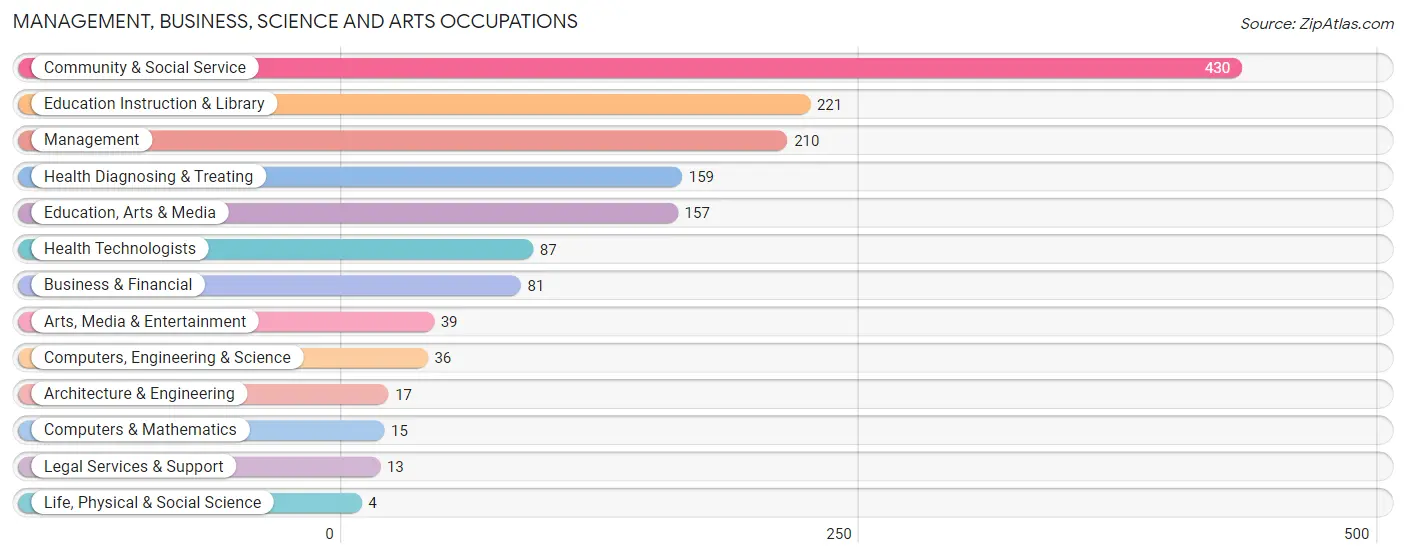
Management, Business, Science and Arts Occupations
The most common Management, Business, Science and Arts occupations in Virginia are Community & Social Service (430 | 12.8%), Education Instruction & Library (221 | 6.6%), Management (210 | 6.2%), Health Diagnosing & Treating (159 | 4.7%), and Education, Arts & Media (157 | 4.7%).
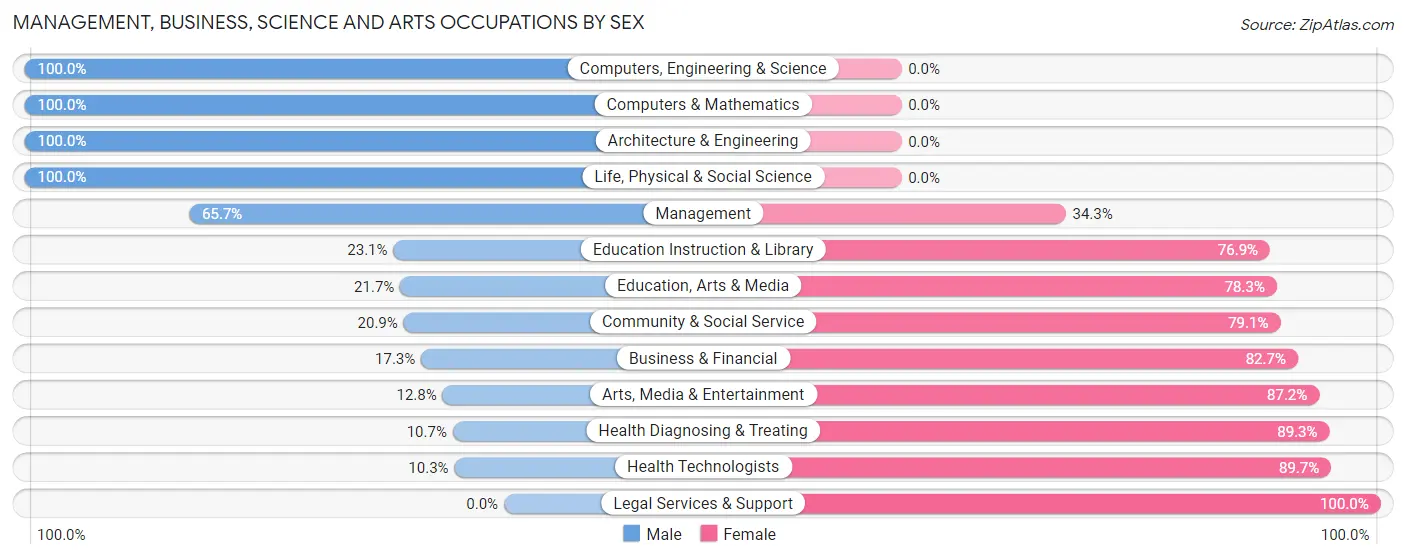
Management, Business, Science and Arts Occupations by Sex
Within the Management, Business, Science and Arts occupations in Virginia, the most male-oriented occupations are Computers, Engineering & Science (100.0%), Computers & Mathematics (100.0%), and Architecture & Engineering (100.0%), while the most female-oriented occupations are Legal Services & Support (100.0%), Health Technologists (89.7%), and Health Diagnosing & Treating (89.3%).
| Occupation | Male | Female |
| Management | 138 (65.7%) | 72 (34.3%) |
| Business & Financial | 14 (17.3%) | 67 (82.7%) |
| Computers, Engineering & Science | 36 (100.0%) | 0 (0.0%) |
| Computers & Mathematics | 15 (100.0%) | 0 (0.0%) |
| Architecture & Engineering | 17 (100.0%) | 0 (0.0%) |
| Life, Physical & Social Science | 4 (100.0%) | 0 (0.0%) |
| Community & Social Service | 90 (20.9%) | 340 (79.1%) |
| Education, Arts & Media | 34 (21.7%) | 123 (78.3%) |
| Legal Services & Support | 0 (0.0%) | 13 (100.0%) |
| Education Instruction & Library | 51 (23.1%) | 170 (76.9%) |
| Arts, Media & Entertainment | 5 (12.8%) | 34 (87.2%) |
| Health Diagnosing & Treating | 17 (10.7%) | 142 (89.3%) |
| Health Technologists | 9 (10.3%) | 78 (89.7%) |
| Total (Category) | 295 (32.2%) | 621 (67.8%) |
| Total (Overall) | 1,831 (54.3%) | 1,541 (45.7%) |
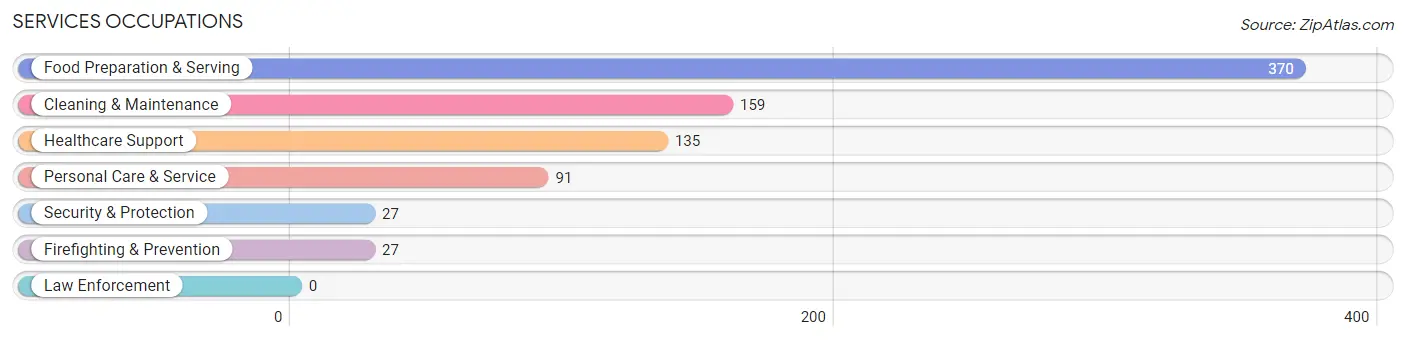
Services Occupations
The most common Services occupations in Virginia are Food Preparation & Serving (370 | 11.0%), Cleaning & Maintenance (159 | 4.7%), Healthcare Support (135 | 4.0%), Personal Care & Service (91 | 2.7%), and Security & Protection (27 | 0.8%).
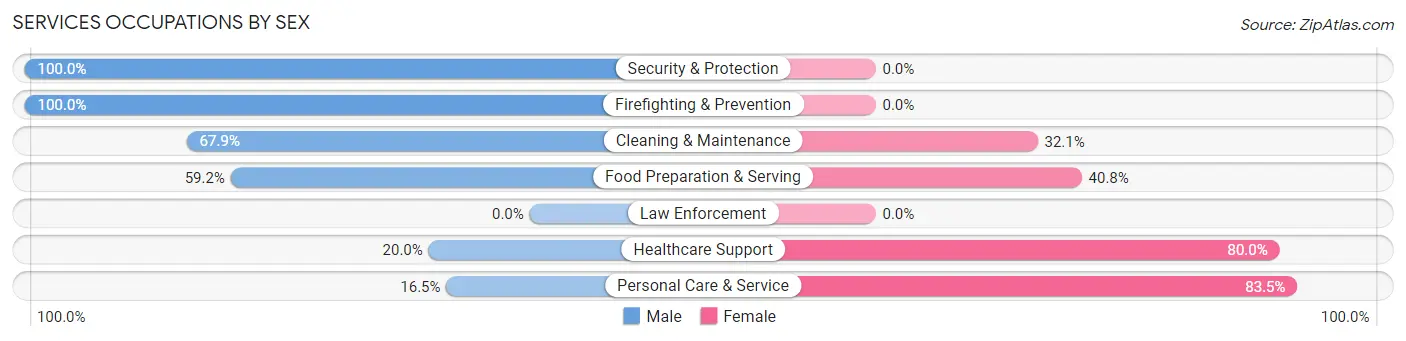
Services Occupations by Sex
Within the Services occupations in Virginia, the most male-oriented occupations are Security & Protection (100.0%), Firefighting & Prevention (100.0%), and Cleaning & Maintenance (67.9%), while the most female-oriented occupations are Personal Care & Service (83.5%), Healthcare Support (80.0%), and Food Preparation & Serving (40.8%).
| Occupation | Male | Female |
| Healthcare Support | 27 (20.0%) | 108 (80.0%) |
| Security & Protection | 27 (100.0%) | 0 (0.0%) |
| Firefighting & Prevention | 27 (100.0%) | 0 (0.0%) |
| Law Enforcement | 0 (0.0%) | 0 (0.0%) |
| Food Preparation & Serving | 219 (59.2%) | 151 (40.8%) |
| Cleaning & Maintenance | 108 (67.9%) | 51 (32.1%) |
| Personal Care & Service | 15 (16.5%) | 76 (83.5%) |
| Total (Category) | 396 (50.6%) | 386 (49.4%) |
| Total (Overall) | 1,831 (54.3%) | 1,541 (45.7%) |
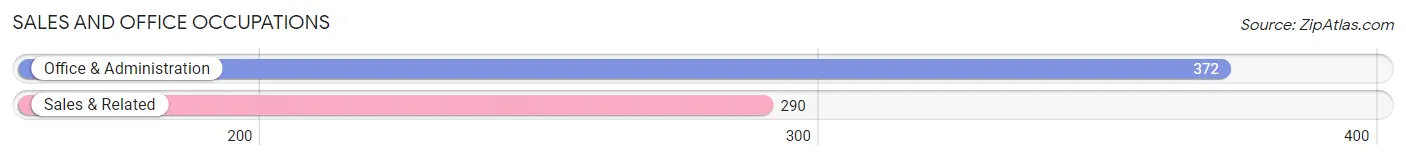
Sales and Office Occupations
The most common Sales and Office occupations in Virginia are Office & Administration (372 | 11.0%), and Sales & Related (290 | 8.6%).
Sales and Office Occupations by Sex
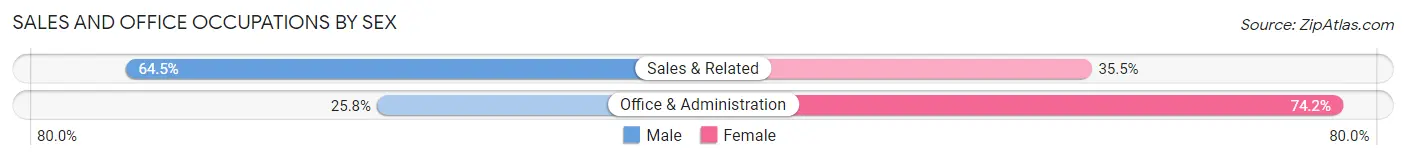
| Occupation | Male | Female |
| Sales & Related | 187 (64.5%) | 103 (35.5%) |
| Office & Administration | 96 (25.8%) | 276 (74.2%) |
| Total (Category) | 283 (42.7%) | 379 (57.3%) |
| Total (Overall) | 1,831 (54.3%) | 1,541 (45.7%) |
Natural Resources, Construction and Maintenance Occupations
The most common Natural Resources, Construction and Maintenance occupations in Virginia are Installation, Maintenance & Repair (286 | 8.5%), Construction & Extraction (130 | 3.9%), and Farming, Fishing & Forestry (8 | 0.2%).
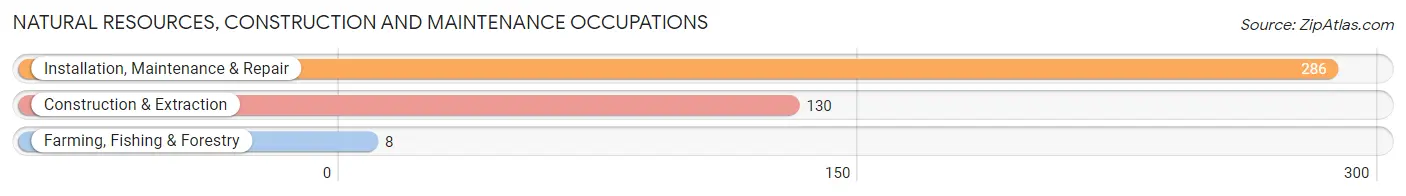
Natural Resources, Construction and Maintenance Occupations by Sex
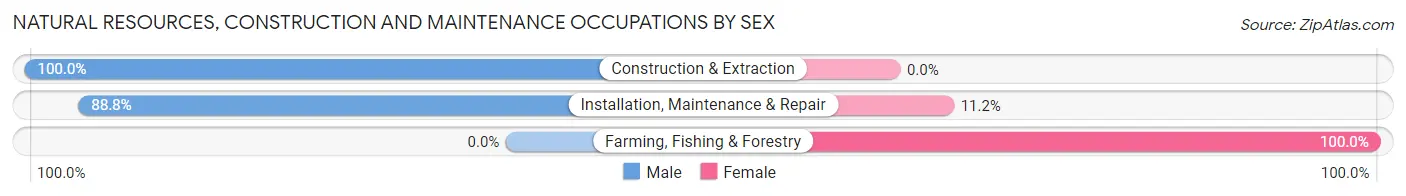
| Occupation | Male | Female |
| Farming, Fishing & Forestry | 0 (0.0%) | 8 (100.0%) |
| Construction & Extraction | 130 (100.0%) | 0 (0.0%) |
| Installation, Maintenance & Repair | 254 (88.8%) | 32 (11.2%) |
| Total (Category) | 384 (90.6%) | 40 (9.4%) |
| Total (Overall) | 1,831 (54.3%) | 1,541 (45.7%) |
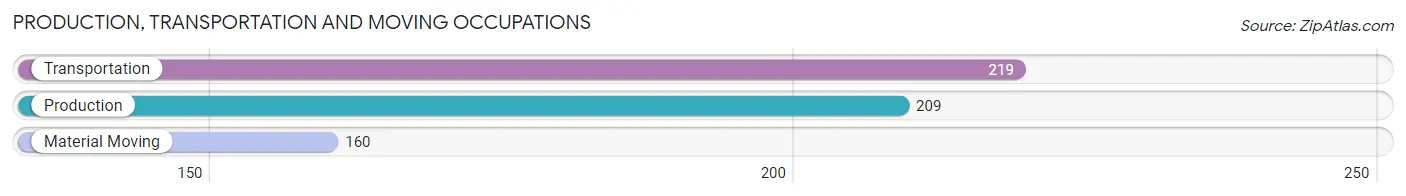
Production, Transportation and Moving Occupations
The most common Production, Transportation and Moving occupations in Virginia are Transportation (219 | 6.5%), Production (209 | 6.2%), and Material Moving (160 | 4.7%).
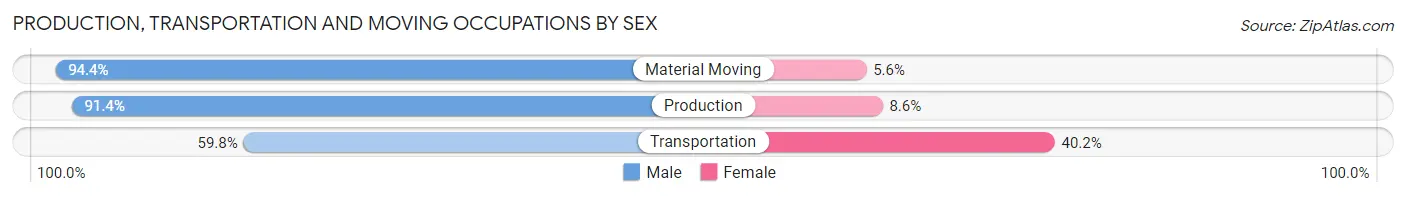
Production, Transportation and Moving Occupations by Sex
| Occupation | Male | Female |
| Production | 191 (91.4%) | 18 (8.6%) |
| Transportation | 131 (59.8%) | 88 (40.2%) |
| Material Moving | 151 (94.4%) | 9 (5.6%) |
| Total (Category) | 473 (80.4%) | 115 (19.6%) |
| Total (Overall) | 1,831 (54.3%) | 1,541 (45.7%) |
Employment Industries by Sex in Virginia
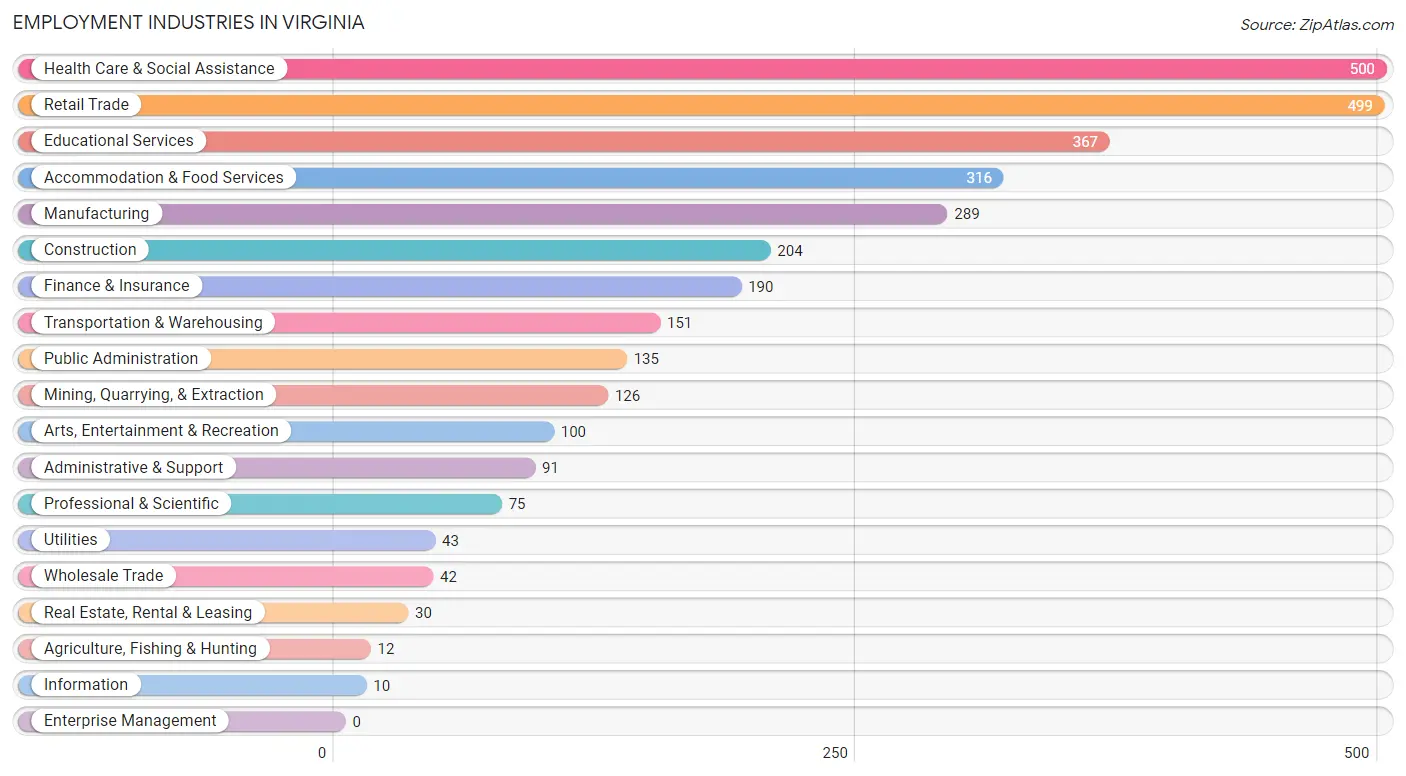
Employment Industries in Virginia
The major employment industries in Virginia include Health Care & Social Assistance (500 | 14.8%), Retail Trade (499 | 14.8%), Educational Services (367 | 10.9%), Accommodation & Food Services (316 | 9.4%), and Manufacturing (289 | 8.6%).
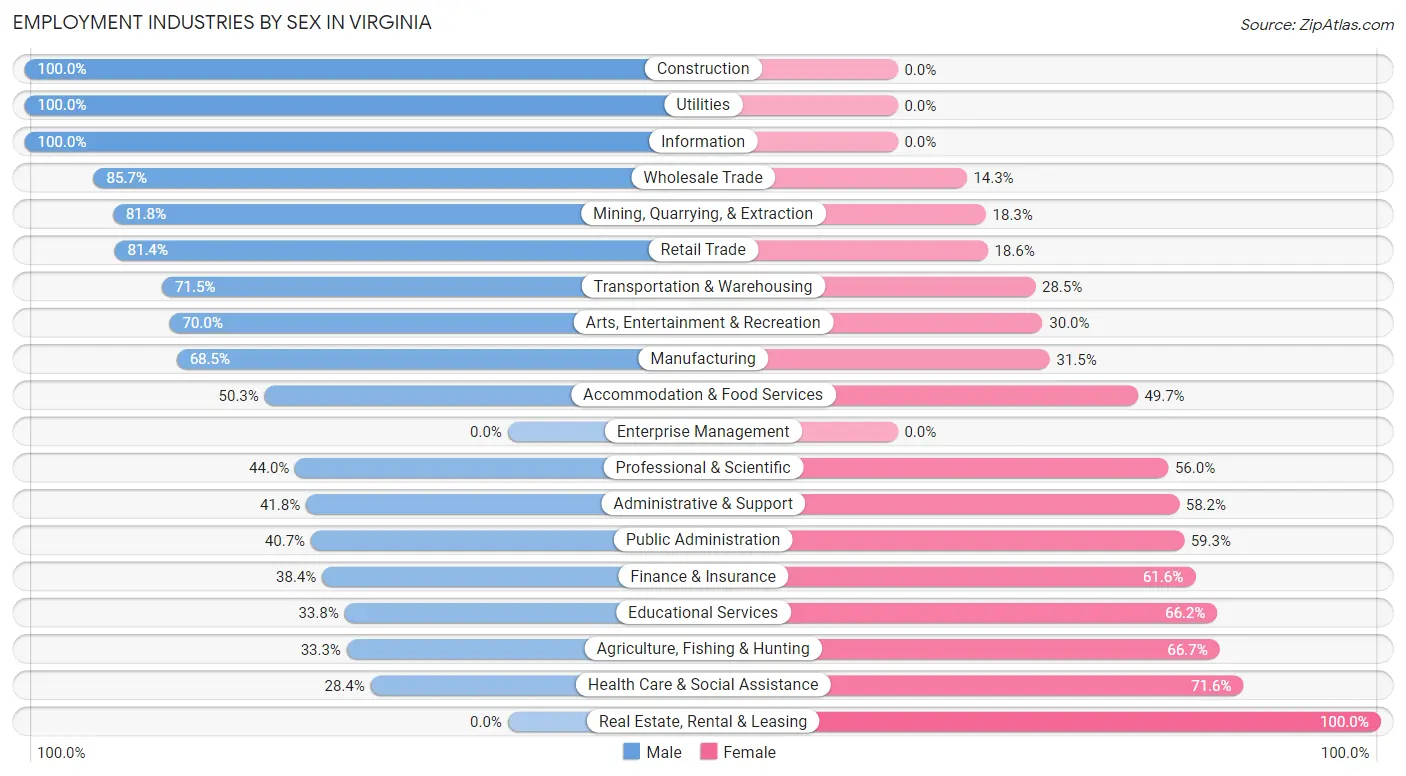
Employment Industries by Sex in Virginia
The Virginia industries that see more men than women are Construction (100.0%), Utilities (100.0%), and Information (100.0%), whereas the industries that tend to have a higher number of women are Real Estate, Rental & Leasing (100.0%), Health Care & Social Assistance (71.6%), and Agriculture, Fishing & Hunting (66.7%).
| Industry | Male | Female |
| Agriculture, Fishing & Hunting | 4 (33.3%) | 8 (66.7%) |
| Mining, Quarrying, & Extraction | 103 (81.8%) | 23 (18.2%) |
| Construction | 204 (100.0%) | 0 (0.0%) |
| Manufacturing | 198 (68.5%) | 91 (31.5%) |
| Wholesale Trade | 36 (85.7%) | 6 (14.3%) |
| Retail Trade | 406 (81.4%) | 93 (18.6%) |
| Transportation & Warehousing | 108 (71.5%) | 43 (28.5%) |
| Utilities | 43 (100.0%) | 0 (0.0%) |
| Information | 10 (100.0%) | 0 (0.0%) |
| Finance & Insurance | 73 (38.4%) | 117 (61.6%) |
| Real Estate, Rental & Leasing | 0 (0.0%) | 30 (100.0%) |
| Professional & Scientific | 33 (44.0%) | 42 (56.0%) |
| Enterprise Management | 0 (0.0%) | 0 (0.0%) |
| Administrative & Support | 38 (41.8%) | 53 (58.2%) |
| Educational Services | 124 (33.8%) | 243 (66.2%) |
| Health Care & Social Assistance | 142 (28.4%) | 358 (71.6%) |
| Arts, Entertainment & Recreation | 70 (70.0%) | 30 (30.0%) |
| Accommodation & Food Services | 159 (50.3%) | 157 (49.7%) |
| Public Administration | 55 (40.7%) | 80 (59.3%) |
| Total | 1,831 (54.3%) | 1,541 (45.7%) |
Education in Virginia
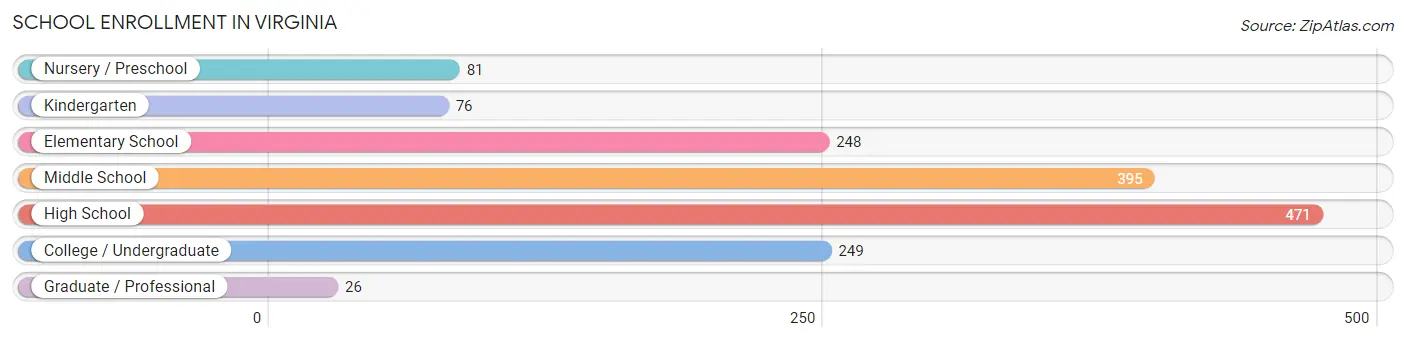
School Enrollment in Virginia
The most common levels of schooling among the 1,546 students in Virginia are high school (471 | 30.5%), middle school (395 | 25.6%), and college / undergraduate (249 | 16.1%).
| School Level | # Students | % Students |
| Nursery / Preschool | 81 | 5.2% |
| Kindergarten | 76 | 4.9% |
| Elementary School | 248 | 16.0% |
| Middle School | 395 | 25.6% |
| High School | 471 | 30.5% |
| College / Undergraduate | 249 | 16.1% |
| Graduate / Professional | 26 | 1.7% |
| Total | 1,546 | 100.0% |
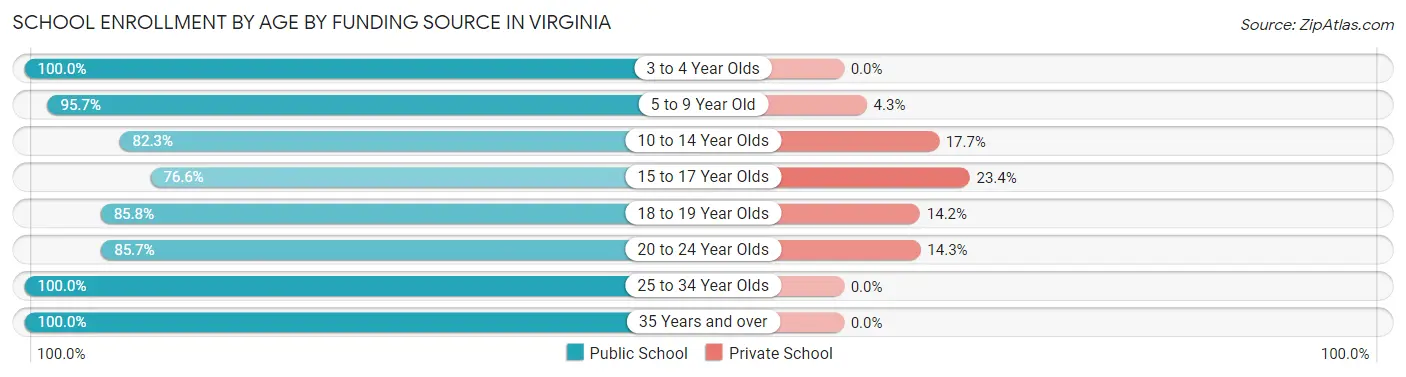
School Enrollment by Age by Funding Source in Virginia
Out of a total of 1,546 students who are enrolled in schools in Virginia, 218 (14.1%) attend a private institution, while the remaining 1,328 (85.9%) are enrolled in public schools. The age group of 15 to 17 year olds has the highest likelihood of being enrolled in private schools, with 79 (23.4% in the age bracket) enrolled. Conversely, the age group of 3 to 4 year olds has the lowest likelihood of being enrolled in a private school, with 57 (100.0% in the age bracket) attending a public institution.
| Age Bracket | Public School | Private School |
| 3 to 4 Year Olds | 57 (100.0%) | 0 (0.0%) |
| 5 to 9 Year Old | 313 (95.7%) | 14 (4.3%) |
| 10 to 14 Year Olds | 423 (82.3%) | 91 (17.7%) |
| 15 to 17 Year Olds | 258 (76.6%) | 79 (23.4%) |
| 18 to 19 Year Olds | 127 (85.8%) | 21 (14.2%) |
| 20 to 24 Year Olds | 78 (85.7%) | 13 (14.3%) |
| 25 to 34 Year Olds | 15 (100.0%) | 0 (0.0%) |
| 35 Years and over | 57 (100.0%) | 0 (0.0%) |
| Total | 1,328 (85.9%) | 218 (14.1%) |
Educational Attainment by Field of Study in Virginia
Education (348 | 28.2%), science & technology (301 | 24.4%), business (150 | 12.2%), arts & humanities (91 | 7.4%), and psychology (56 | 4.5%) are the most common fields of study among 1,234 individuals in Virginia who have obtained a bachelor's degree or higher.
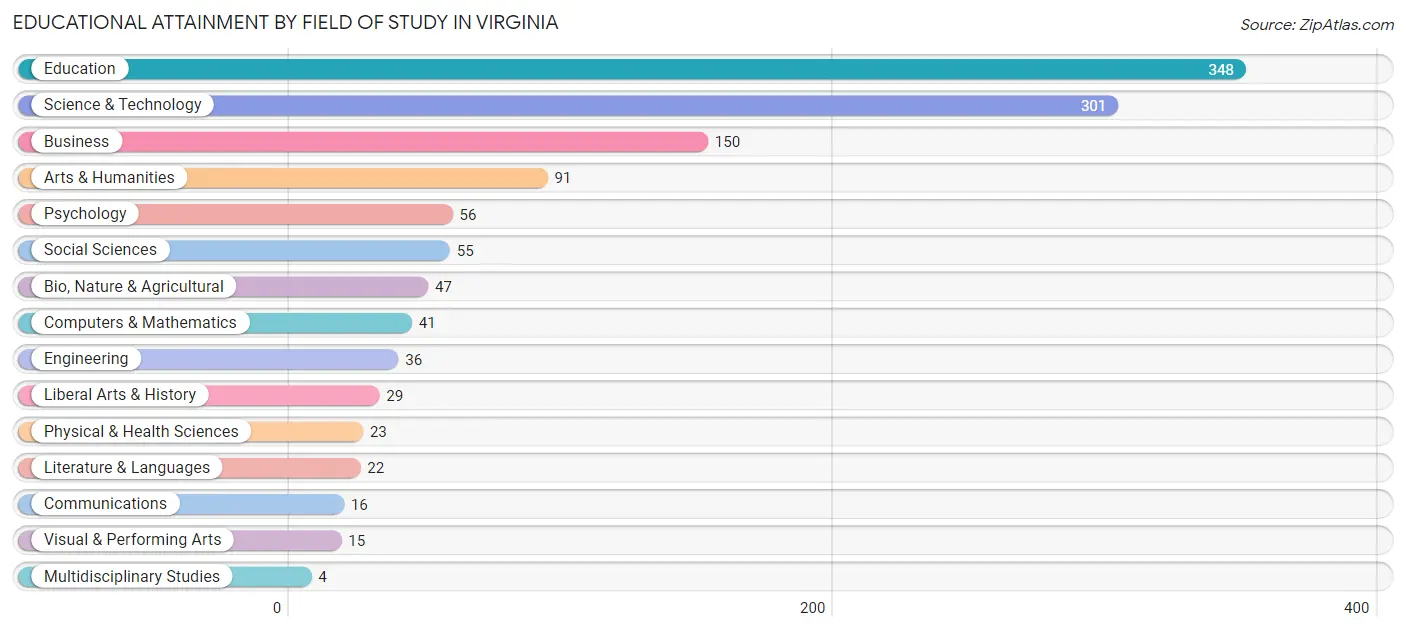
| Field of Study | # Graduates | % Graduates |
| Computers & Mathematics | 41 | 3.3% |
| Bio, Nature & Agricultural | 47 | 3.8% |
| Physical & Health Sciences | 23 | 1.9% |
| Psychology | 56 | 4.5% |
| Social Sciences | 55 | 4.5% |
| Engineering | 36 | 2.9% |
| Multidisciplinary Studies | 4 | 0.3% |
| Science & Technology | 301 | 24.4% |
| Business | 150 | 12.2% |
| Education | 348 | 28.2% |
| Literature & Languages | 22 | 1.8% |
| Liberal Arts & History | 29 | 2.4% |
| Visual & Performing Arts | 15 | 1.2% |
| Communications | 16 | 1.3% |
| Arts & Humanities | 91 | 7.4% |
| Total | 1,234 | 100.0% |
Transportation & Commute in Virginia
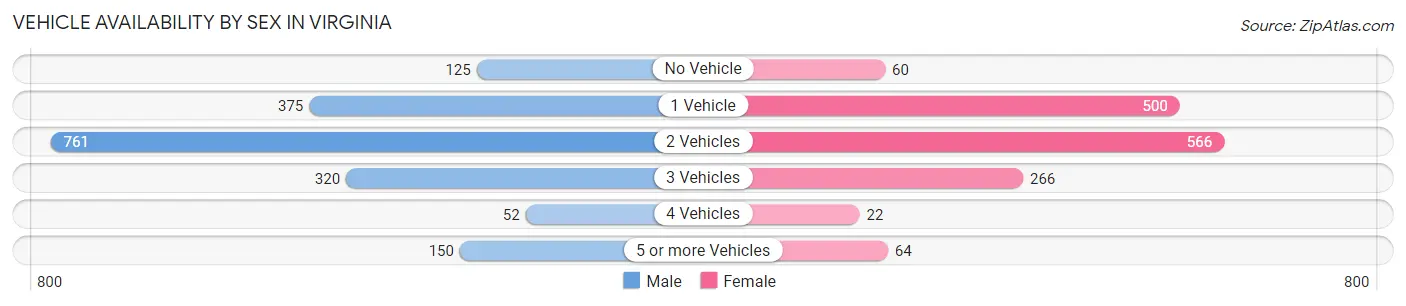
Vehicle Availability by Sex in Virginia
The most prevalent vehicle ownership categories in Virginia are males with 2 vehicles (761, accounting for 42.7%) and females with 2 vehicles (566, making up 51.5%).
| Vehicles Available | Male | Female |
| No Vehicle | 125 (7.0%) | 60 (4.1%) |
| 1 Vehicle | 375 (21.0%) | 500 (33.8%) |
| 2 Vehicles | 761 (42.7%) | 566 (38.3%) |
| 3 Vehicles | 320 (17.9%) | 266 (18.0%) |
| 4 Vehicles | 52 (2.9%) | 22 (1.5%) |
| 5 or more Vehicles | 150 (8.4%) | 64 (4.3%) |
| Total | 1,783 (100.0%) | 1,478 (100.0%) |
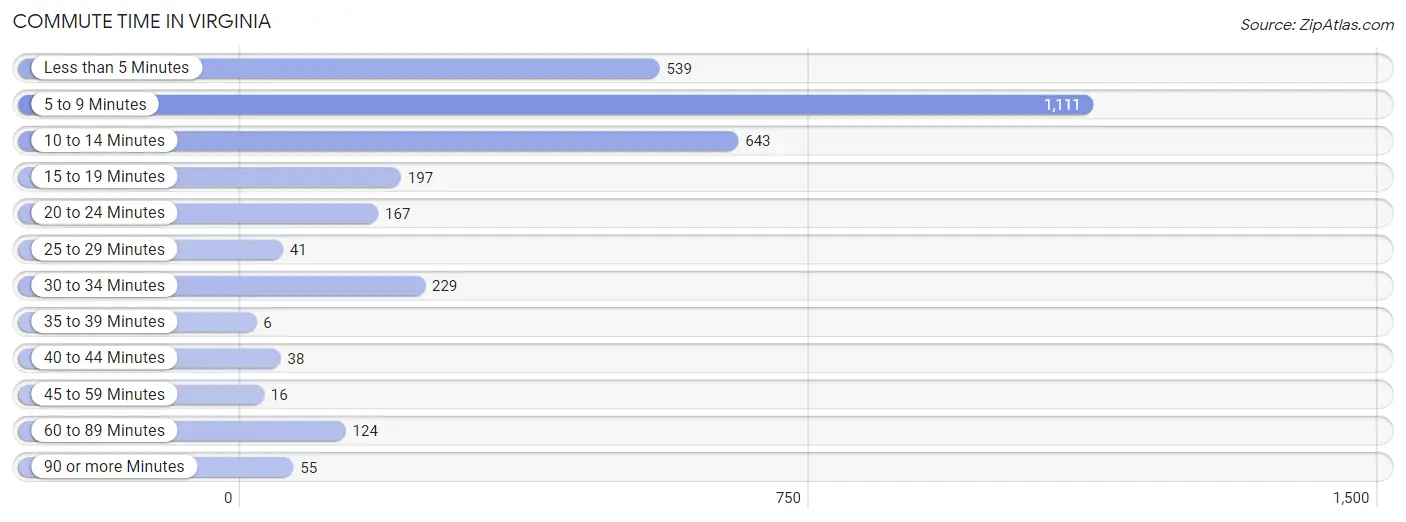
Commute Time in Virginia
The most frequently occuring commute durations in Virginia are 5 to 9 minutes (1,111 commuters, 35.1%), 10 to 14 minutes (643 commuters, 20.3%), and less than 5 minutes (539 commuters, 17.0%).
| Commute Time | # Commuters | % Commuters |
| Less than 5 Minutes | 539 | 17.0% |
| 5 to 9 Minutes | 1,111 | 35.1% |
| 10 to 14 Minutes | 643 | 20.3% |
| 15 to 19 Minutes | 197 | 6.2% |
| 20 to 24 Minutes | 167 | 5.3% |
| 25 to 29 Minutes | 41 | 1.3% |
| 30 to 34 Minutes | 229 | 7.2% |
| 35 to 39 Minutes | 6 | 0.2% |
| 40 to 44 Minutes | 38 | 1.2% |
| 45 to 59 Minutes | 16 | 0.5% |
| 60 to 89 Minutes | 124 | 3.9% |
| 90 or more Minutes | 55 | 1.7% |
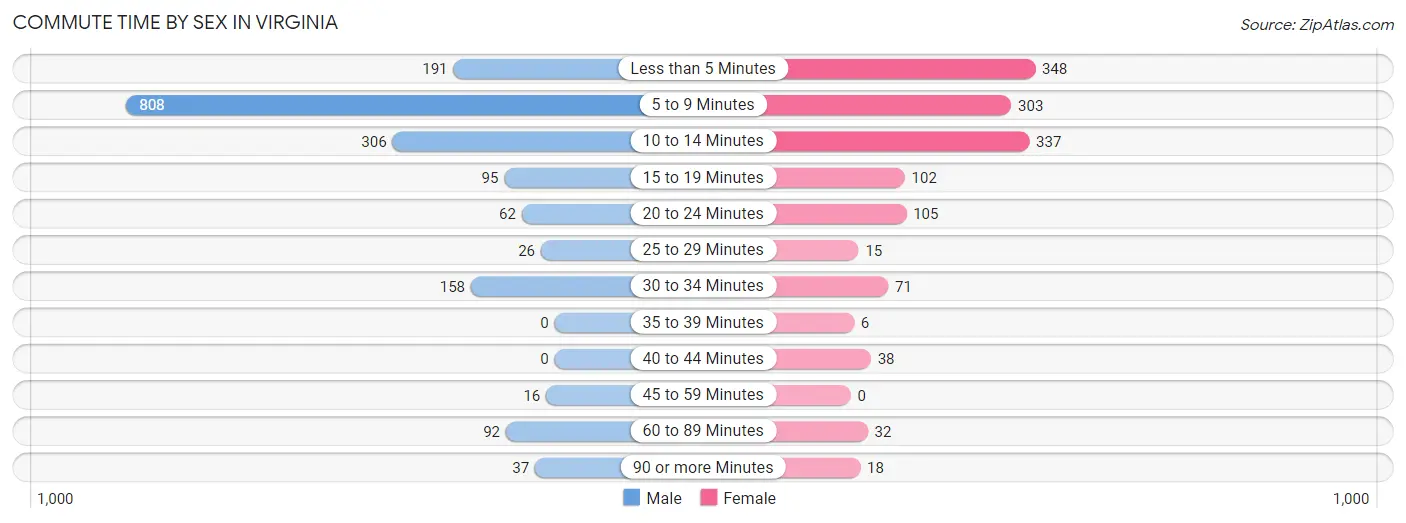
Commute Time by Sex in Virginia
The most common commute times in Virginia are 5 to 9 minutes (808 commuters, 45.1%) for males and less than 5 minutes (348 commuters, 25.3%) for females.
| Commute Time | Male | Female |
| Less than 5 Minutes | 191 (10.7%) | 348 (25.3%) |
| 5 to 9 Minutes | 808 (45.1%) | 303 (22.0%) |
| 10 to 14 Minutes | 306 (17.1%) | 337 (24.5%) |
| 15 to 19 Minutes | 95 (5.3%) | 102 (7.4%) |
| 20 to 24 Minutes | 62 (3.5%) | 105 (7.6%) |
| 25 to 29 Minutes | 26 (1.5%) | 15 (1.1%) |
| 30 to 34 Minutes | 158 (8.8%) | 71 (5.2%) |
| 35 to 39 Minutes | 0 (0.0%) | 6 (0.4%) |
| 40 to 44 Minutes | 0 (0.0%) | 38 (2.8%) |
| 45 to 59 Minutes | 16 (0.9%) | 0 (0.0%) |
| 60 to 89 Minutes | 92 (5.1%) | 32 (2.3%) |
| 90 or more Minutes | 37 (2.1%) | 18 (1.3%) |
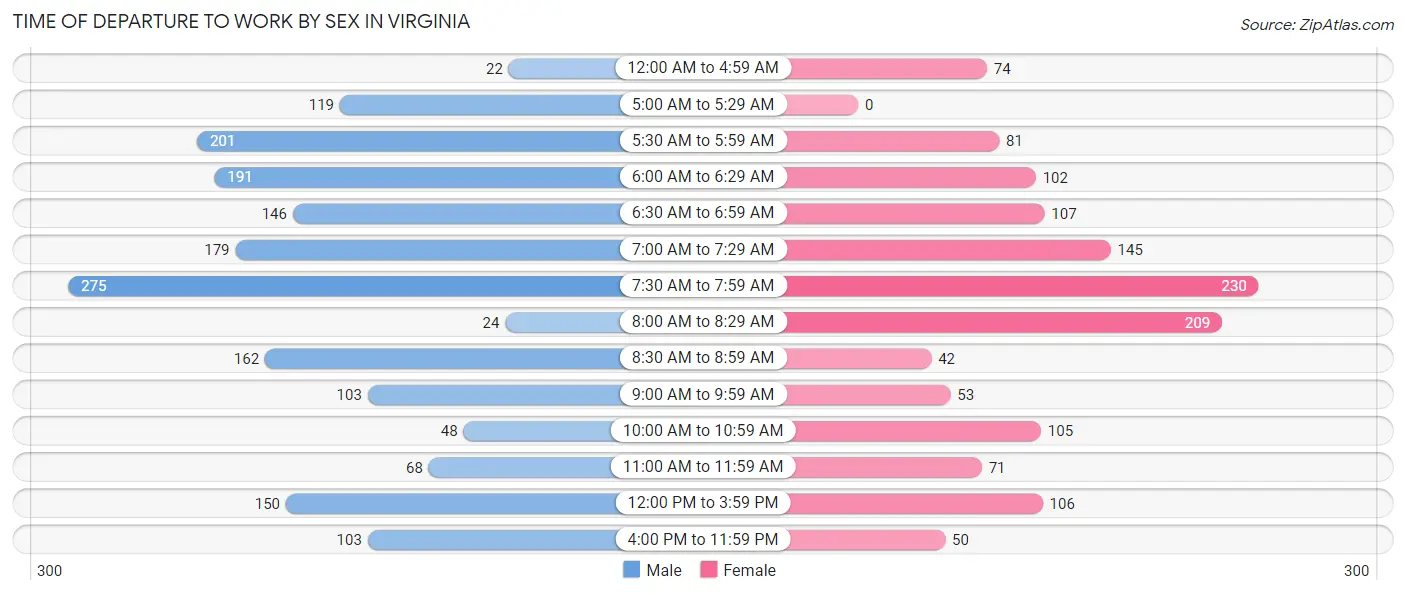
Time of Departure to Work by Sex in Virginia
The most frequent times of departure to work in Virginia are 7:30 AM to 7:59 AM (275, 15.3%) for males and 7:30 AM to 7:59 AM (230, 16.7%) for females.
| Time of Departure | Male | Female |
| 12:00 AM to 4:59 AM | 22 (1.2%) | 74 (5.4%) |
| 5:00 AM to 5:29 AM | 119 (6.6%) | 0 (0.0%) |
| 5:30 AM to 5:59 AM | 201 (11.2%) | 81 (5.9%) |
| 6:00 AM to 6:29 AM | 191 (10.7%) | 102 (7.4%) |
| 6:30 AM to 6:59 AM | 146 (8.2%) | 107 (7.8%) |
| 7:00 AM to 7:29 AM | 179 (10.0%) | 145 (10.5%) |
| 7:30 AM to 7:59 AM | 275 (15.3%) | 230 (16.7%) |
| 8:00 AM to 8:29 AM | 24 (1.3%) | 209 (15.2%) |
| 8:30 AM to 8:59 AM | 162 (9.0%) | 42 (3.0%) |
| 9:00 AM to 9:59 AM | 103 (5.8%) | 53 (3.8%) |
| 10:00 AM to 10:59 AM | 48 (2.7%) | 105 (7.6%) |
| 11:00 AM to 11:59 AM | 68 (3.8%) | 71 (5.2%) |
| 12:00 PM to 3:59 PM | 150 (8.4%) | 106 (7.7%) |
| 4:00 PM to 11:59 PM | 103 (5.8%) | 50 (3.6%) |
| Total | 1,791 (100.0%) | 1,375 (100.0%) |
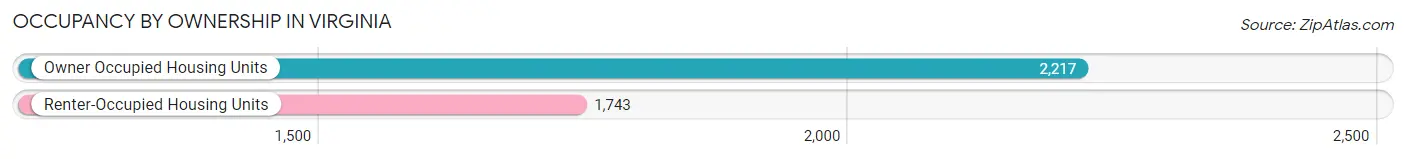
Housing Occupancy in Virginia
Occupancy by Ownership in Virginia
Of the total 3,960 dwellings in Virginia, owner-occupied units account for 2,217 (56.0%), while renter-occupied units make up 1,743 (44.0%).
| Occupancy | # Housing Units | % Housing Units |
| Owner Occupied Housing Units | 2,217 | 56.0% |
| Renter-Occupied Housing Units | 1,743 | 44.0% |
| Total Occupied Housing Units | 3,960 | 100.0% |
Occupancy by Household Size in Virginia
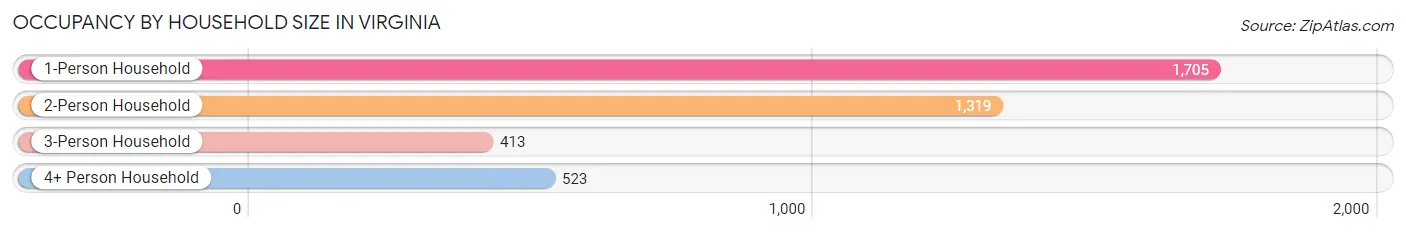
| Household Size | # Housing Units | % Housing Units |
| 1-Person Household | 1,705 | 43.1% |
| 2-Person Household | 1,319 | 33.3% |
| 3-Person Household | 413 | 10.4% |
| 4+ Person Household | 523 | 13.2% |
| Total Housing Units | 3,960 | 100.0% |
Occupancy by Ownership by Household Size in Virginia
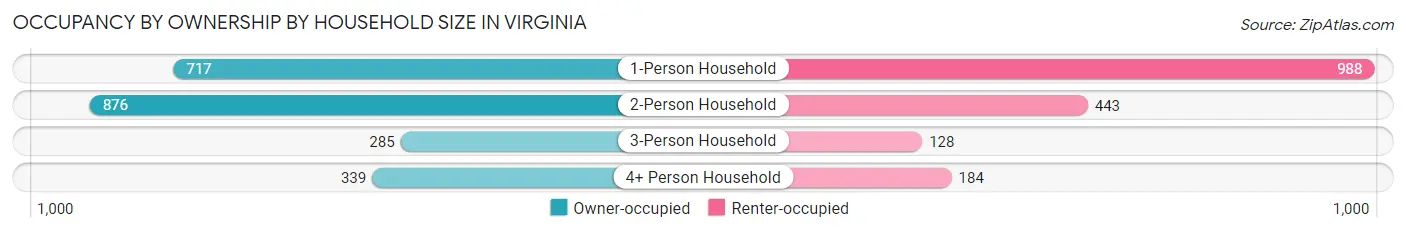
| Household Size | Owner-occupied | Renter-occupied |
| 1-Person Household | 717 (42.0%) | 988 (58.0%) |
| 2-Person Household | 876 (66.4%) | 443 (33.6%) |
| 3-Person Household | 285 (69.0%) | 128 (31.0%) |
| 4+ Person Household | 339 (64.8%) | 184 (35.2%) |
| Total Housing Units | 2,217 (56.0%) | 1,743 (44.0%) |
Occupancy by Educational Attainment in Virginia
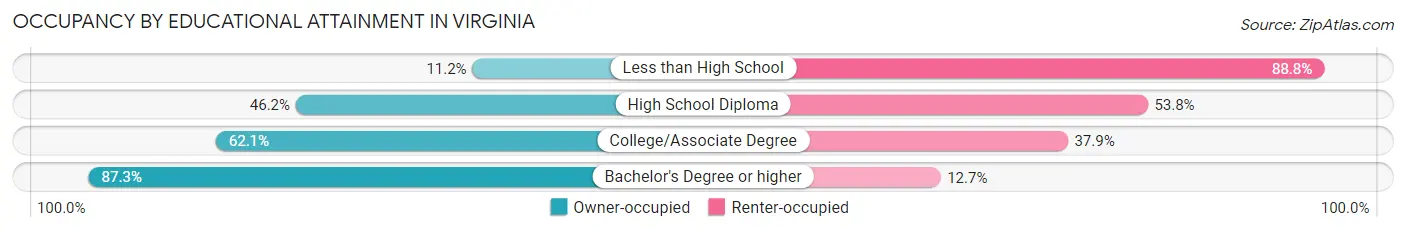
| Household Size | Owner-occupied | Renter-occupied |
| Less than High School | 36 (11.2%) | 285 (88.8%) |
| High School Diploma | 684 (46.2%) | 796 (53.8%) |
| College/Associate Degree | 954 (62.1%) | 583 (37.9%) |
| Bachelor's Degree or higher | 543 (87.3%) | 79 (12.7%) |
Occupancy by Age of Householder in Virginia
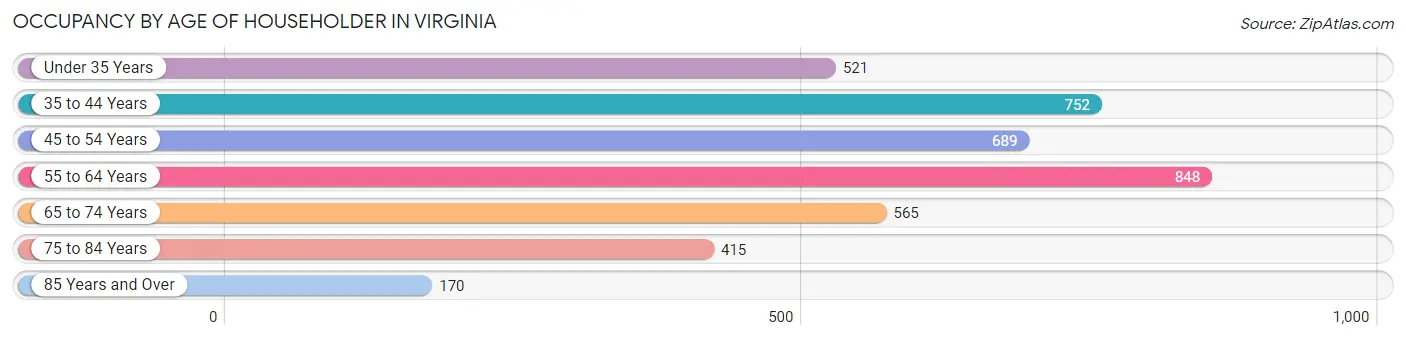
| Age Bracket | # Households | % Households |
| Under 35 Years | 521 | 13.2% |
| 35 to 44 Years | 752 | 19.0% |
| 45 to 54 Years | 689 | 17.4% |
| 55 to 64 Years | 848 | 21.4% |
| 65 to 74 Years | 565 | 14.3% |
| 75 to 84 Years | 415 | 10.5% |
| 85 Years and Over | 170 | 4.3% |
| Total | 3,960 | 100.0% |
Housing Finances in Virginia
Median Income by Occupancy in Virginia
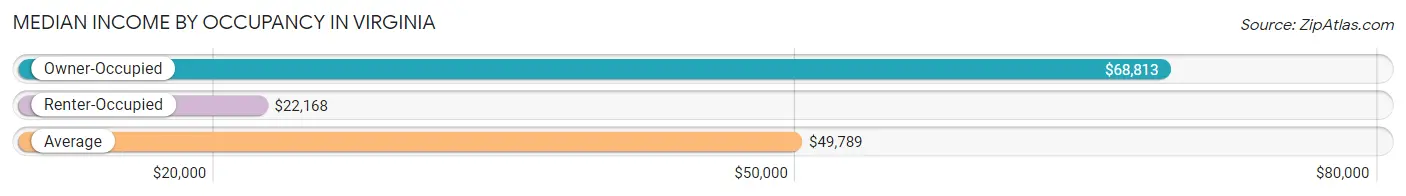
| Occupancy Type | # Households | Median Income |
| Owner-Occupied | 2,217 (56.0%) | $68,813 |
| Renter-Occupied | 1,743 (44.0%) | $22,168 |
| Average | 3,960 (100.0%) | $49,789 |
Occupancy by Householder Income Bracket in Virginia
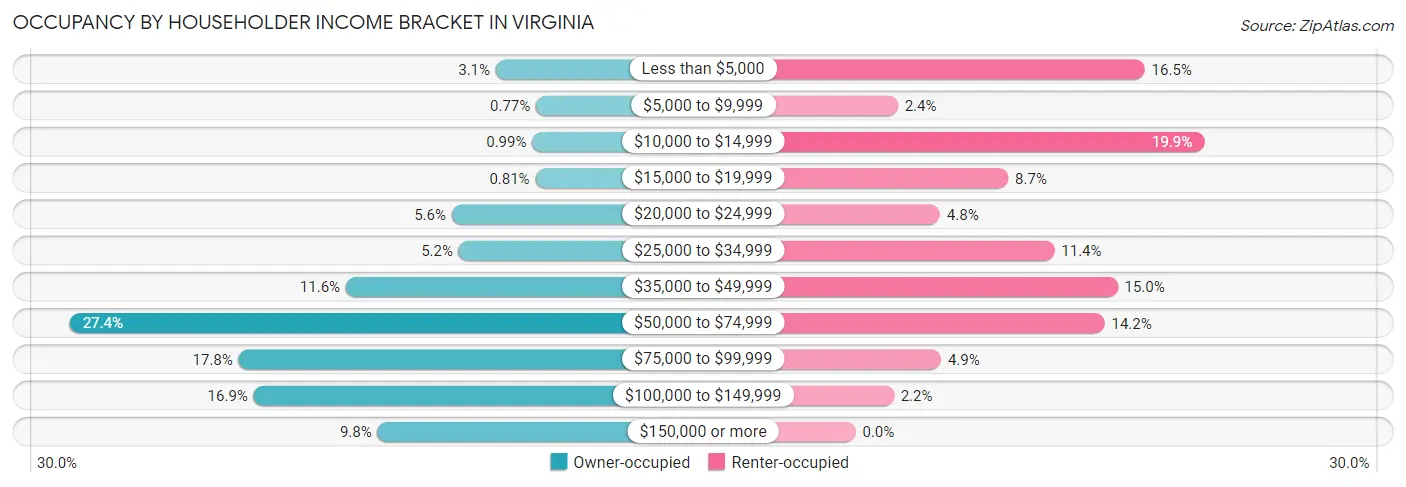
| Income Bracket | Owner-occupied | Renter-occupied |
| Less than $5,000 | 68 (3.1%) | 288 (16.5%) |
| $5,000 to $9,999 | 17 (0.8%) | 42 (2.4%) |
| $10,000 to $14,999 | 22 (1.0%) | 347 (19.9%) |
| $15,000 to $19,999 | 18 (0.8%) | 152 (8.7%) |
| $20,000 to $24,999 | 124 (5.6%) | 84 (4.8%) |
| $25,000 to $34,999 | 115 (5.2%) | 198 (11.4%) |
| $35,000 to $49,999 | 258 (11.6%) | 261 (15.0%) |
| $50,000 to $74,999 | 608 (27.4%) | 248 (14.2%) |
| $75,000 to $99,999 | 394 (17.8%) | 85 (4.9%) |
| $100,000 to $149,999 | 375 (16.9%) | 38 (2.2%) |
| $150,000 or more | 218 (9.8%) | 0 (0.0%) |
| Total | 2,217 (100.0%) | 1,743 (100.0%) |
Monthly Housing Cost Tiers in Virginia
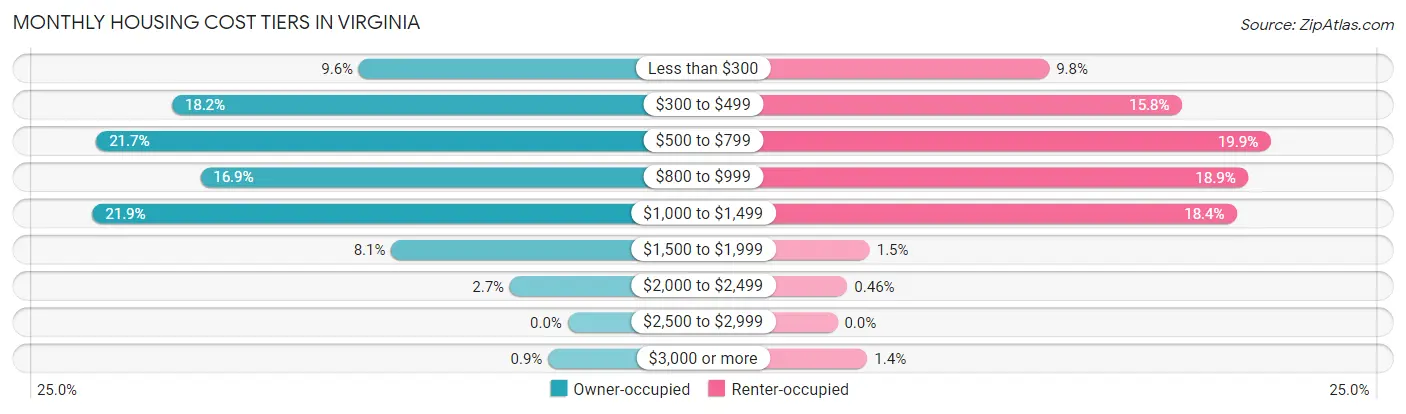
| Monthly Cost | Owner-occupied | Renter-occupied |
| Less than $300 | 213 (9.6%) | 170 (9.8%) |
| $300 to $499 | 404 (18.2%) | 276 (15.8%) |
| $500 to $799 | 481 (21.7%) | 347 (19.9%) |
| $800 to $999 | 375 (16.9%) | 329 (18.9%) |
| $1,000 to $1,499 | 485 (21.9%) | 320 (18.4%) |
| $1,500 to $1,999 | 180 (8.1%) | 26 (1.5%) |
| $2,000 to $2,499 | 59 (2.7%) | 8 (0.5%) |
| $2,500 to $2,999 | 0 (0.0%) | 0 (0.0%) |
| $3,000 or more | 20 (0.9%) | 24 (1.4%) |
| Total | 2,217 (100.0%) | 1,743 (100.0%) |
Physical Housing Characteristics in Virginia
Housing Structures in Virginia
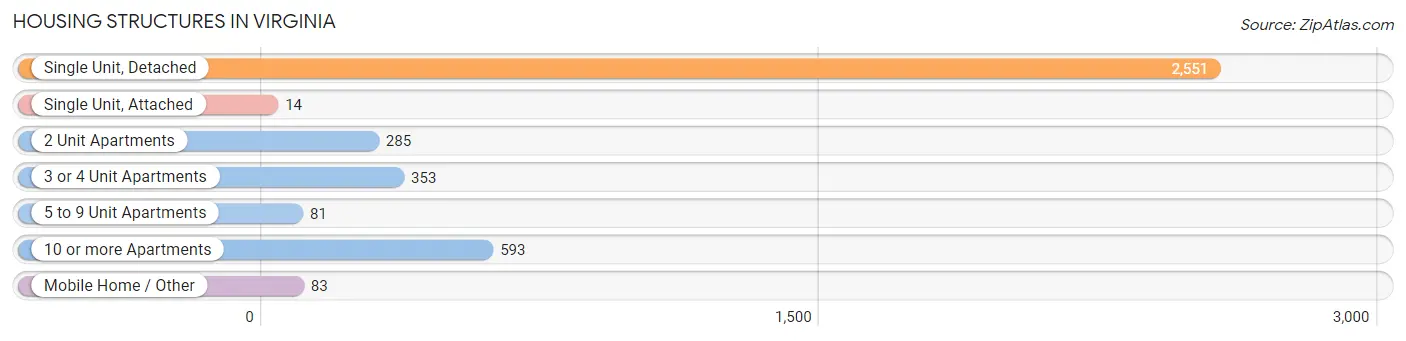
| Structure Type | # Housing Units | % Housing Units |
| Single Unit, Detached | 2,551 | 64.4% |
| Single Unit, Attached | 14 | 0.4% |
| 2 Unit Apartments | 285 | 7.2% |
| 3 or 4 Unit Apartments | 353 | 8.9% |
| 5 to 9 Unit Apartments | 81 | 2.1% |
| 10 or more Apartments | 593 | 15.0% |
| Mobile Home / Other | 83 | 2.1% |
| Total | 3,960 | 100.0% |
Housing Structures by Occupancy in Virginia
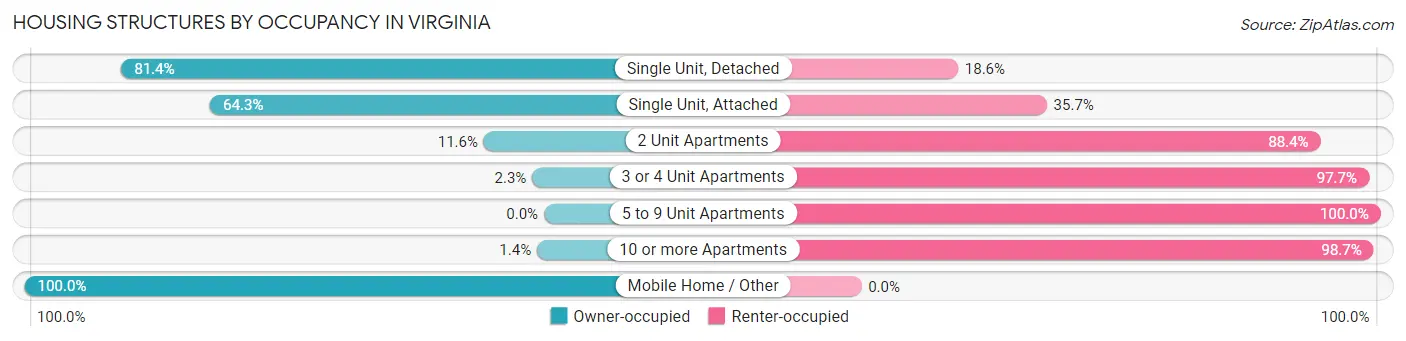
| Structure Type | Owner-occupied | Renter-occupied |
| Single Unit, Detached | 2,076 (81.4%) | 475 (18.6%) |
| Single Unit, Attached | 9 (64.3%) | 5 (35.7%) |
| 2 Unit Apartments | 33 (11.6%) | 252 (88.4%) |
| 3 or 4 Unit Apartments | 8 (2.3%) | 345 (97.7%) |
| 5 to 9 Unit Apartments | 0 (0.0%) | 81 (100.0%) |
| 10 or more Apartments | 8 (1.3%) | 585 (98.7%) |
| Mobile Home / Other | 83 (100.0%) | 0 (0.0%) |
| Total | 2,217 (56.0%) | 1,743 (44.0%) |
Housing Structures by Number of Rooms in Virginia
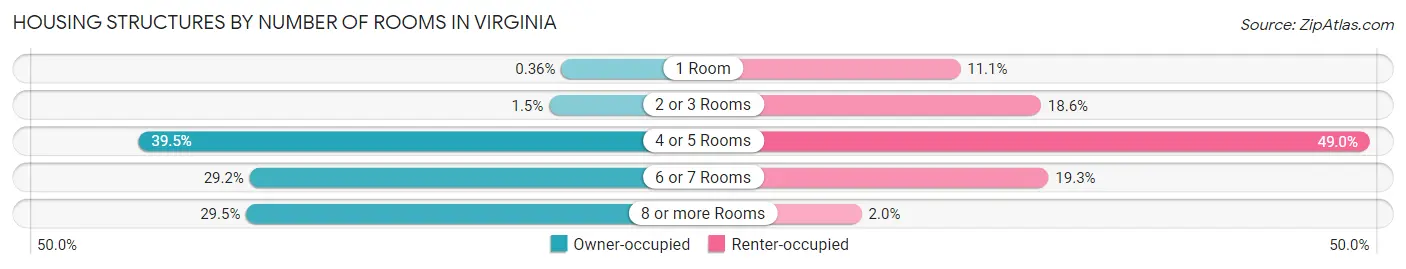
| Number of Rooms | Owner-occupied | Renter-occupied |
| 1 Room | 8 (0.4%) | 194 (11.1%) |
| 2 or 3 Rooms | 33 (1.5%) | 324 (18.6%) |
| 4 or 5 Rooms | 875 (39.5%) | 854 (49.0%) |
| 6 or 7 Rooms | 647 (29.2%) | 336 (19.3%) |
| 8 or more Rooms | 654 (29.5%) | 35 (2.0%) |
| Total | 2,217 (100.0%) | 1,743 (100.0%) |
Housing Structure by Heating Type in Virginia
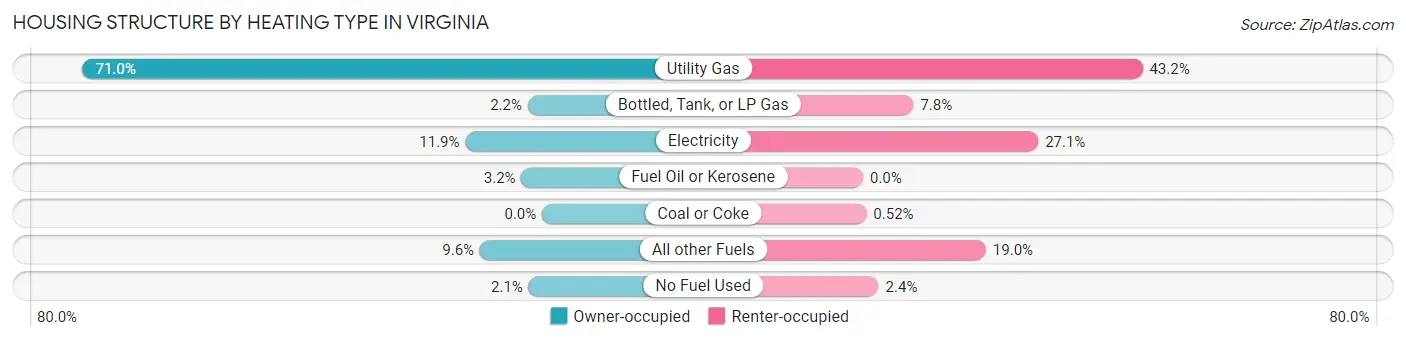
| Heating Type | Owner-occupied | Renter-occupied |
| Utility Gas | 1,575 (71.0%) | 753 (43.2%) |
| Bottled, Tank, or LP Gas | 49 (2.2%) | 136 (7.8%) |
| Electricity | 263 (11.9%) | 472 (27.1%) |
| Fuel Oil or Kerosene | 71 (3.2%) | 0 (0.0%) |
| Coal or Coke | 0 (0.0%) | 9 (0.5%) |
| All other Fuels | 213 (9.6%) | 331 (19.0%) |
| No Fuel Used | 46 (2.1%) | 42 (2.4%) |
| Total | 2,217 (100.0%) | 1,743 (100.0%) |
Household Vehicle Usage in Virginia
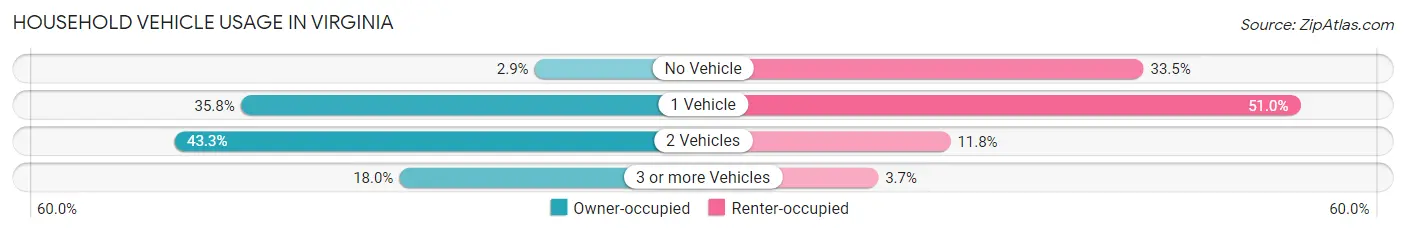
| Vehicles per Household | Owner-occupied | Renter-occupied |
| No Vehicle | 64 (2.9%) | 583 (33.5%) |
| 1 Vehicle | 794 (35.8%) | 889 (51.0%) |
| 2 Vehicles | 959 (43.3%) | 206 (11.8%) |
| 3 or more Vehicles | 400 (18.0%) | 65 (3.7%) |
| Total | 2,217 (100.0%) | 1,743 (100.0%) |
Real Estate & Mortgages in Virginia
Real Estate and Mortgage Overview in Virginia
| Characteristic | Without Mortgage | With Mortgage |
| Housing Units | 996 | 1,221 |
| Median Property Value | $98,800 | $118,700 |
| Median Household Income | $57,097 | $142 |
| Monthly Housing Costs | $458 | $12 |
| Real Estate Taxes | $921 | $8 |
Property Value by Mortgage Status in Virginia
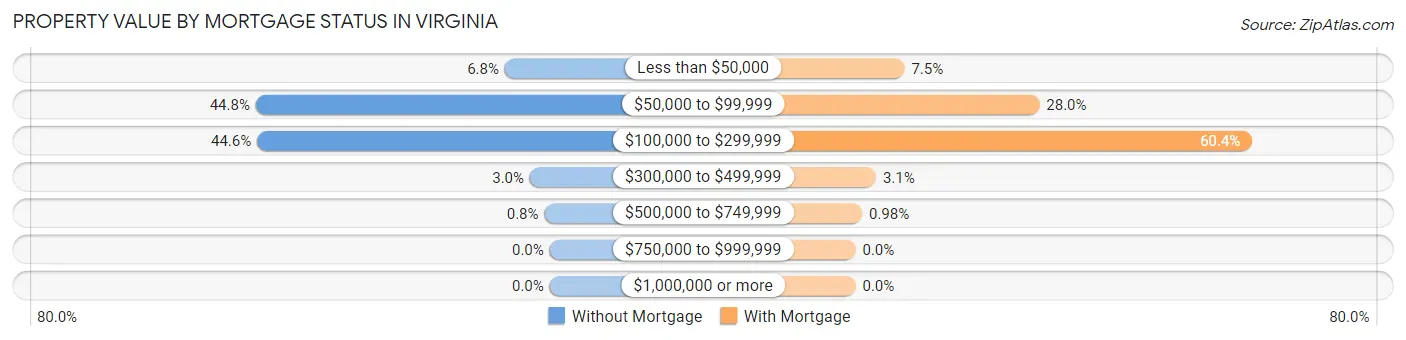
| Property Value | Without Mortgage | With Mortgage |
| Less than $50,000 | 68 (6.8%) | 91 (7.4%) |
| $50,000 to $99,999 | 446 (44.8%) | 342 (28.0%) |
| $100,000 to $299,999 | 444 (44.6%) | 738 (60.4%) |
| $300,000 to $499,999 | 30 (3.0%) | 38 (3.1%) |
| $500,000 to $749,999 | 8 (0.8%) | 12 (1.0%) |
| $750,000 to $999,999 | 0 (0.0%) | 0 (0.0%) |
| $1,000,000 or more | 0 (0.0%) | 0 (0.0%) |
| Total | 996 (100.0%) | 1,221 (100.0%) |
Household Income by Mortgage Status in Virginia
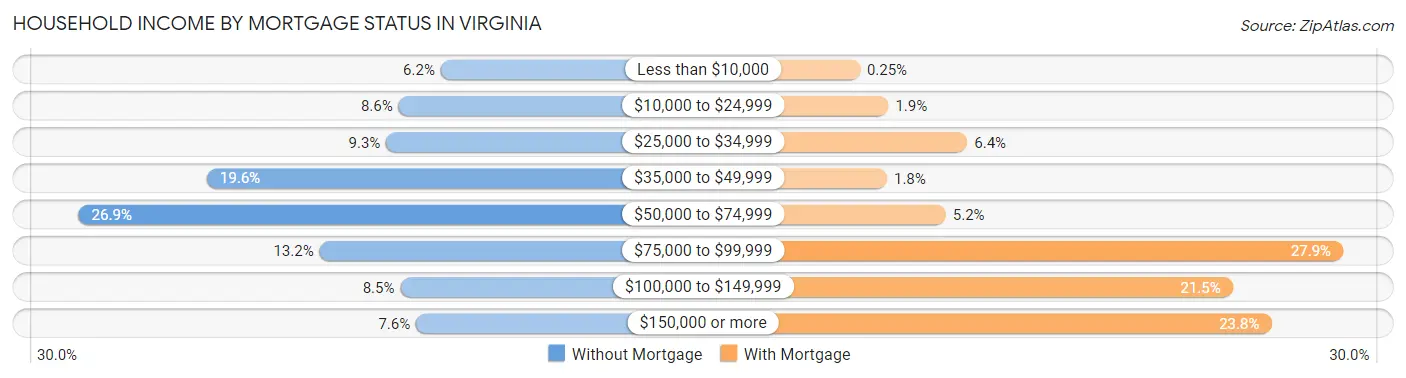
| Household Income | Without Mortgage | With Mortgage |
| Less than $10,000 | 62 (6.2%) | 3 (0.3%) |
| $10,000 to $24,999 | 86 (8.6%) | 23 (1.9%) |
| $25,000 to $34,999 | 93 (9.3%) | 78 (6.4%) |
| $35,000 to $49,999 | 195 (19.6%) | 22 (1.8%) |
| $50,000 to $74,999 | 268 (26.9%) | 63 (5.2%) |
| $75,000 to $99,999 | 131 (13.2%) | 340 (27.9%) |
| $100,000 to $149,999 | 85 (8.5%) | 263 (21.5%) |
| $150,000 or more | 76 (7.6%) | 290 (23.7%) |
| Total | 996 (100.0%) | 1,221 (100.0%) |
Property Value to Household Income Ratio in Virginia
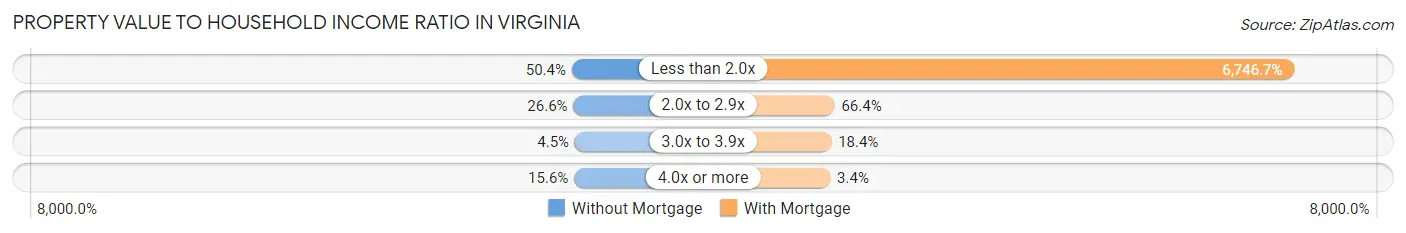
| Value-to-Income Ratio | Without Mortgage | With Mortgage |
| Less than 2.0x | 502 (50.4%) | 82,377 (6,746.7%) |
| 2.0x to 2.9x | 265 (26.6%) | 811 (66.4%) |
| 3.0x to 3.9x | 45 (4.5%) | 225 (18.4%) |
| 4.0x or more | 155 (15.6%) | 41 (3.4%) |
| Total | 996 (100.0%) | 1,221 (100.0%) |
Real Estate Taxes by Mortgage Status in Virginia
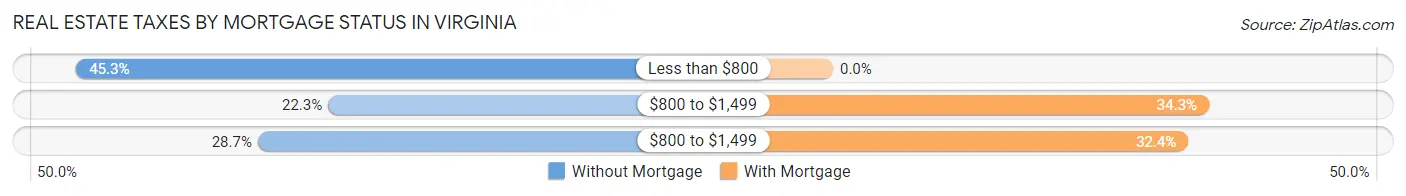
| Property Taxes | Without Mortgage | With Mortgage |
| Less than $800 | 451 (45.3%) | 0 (0.0%) |
| $800 to $1,499 | 222 (22.3%) | 419 (34.3%) |
| $800 to $1,499 | 286 (28.7%) | 396 (32.4%) |
| Total | 996 (100.0%) | 1,221 (100.0%) |
Health & Disability in Virginia
Health Insurance Coverage by Age in Virginia
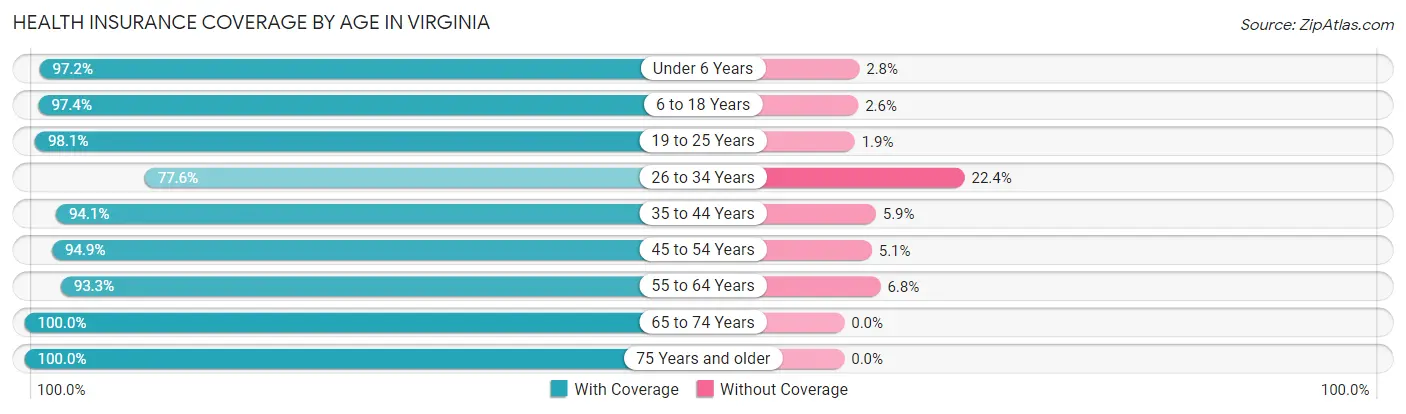
| Age Bracket | With Coverage | Without Coverage |
| Under 6 Years | 451 (97.2%) | 13 (2.8%) |
| 6 to 18 Years | 1,350 (97.4%) | 36 (2.6%) |
| 19 to 25 Years | 706 (98.1%) | 14 (1.9%) |
| 26 to 34 Years | 429 (77.6%) | 124 (22.4%) |
| 35 to 44 Years | 1,139 (94.1%) | 71 (5.9%) |
| 45 to 54 Years | 925 (94.9%) | 50 (5.1%) |
| 55 to 64 Years | 1,050 (93.2%) | 76 (6.8%) |
| 65 to 74 Years | 895 (100.0%) | 0 (0.0%) |
| 75 Years and older | 892 (100.0%) | 0 (0.0%) |
| Total | 7,837 (95.3%) | 384 (4.7%) |
Health Insurance Coverage by Citizenship Status in Virginia
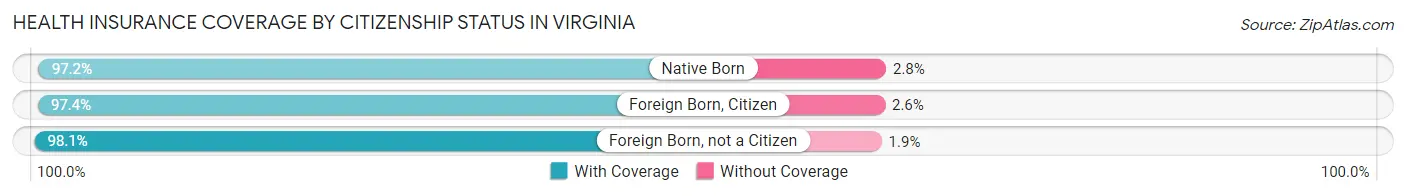
| Citizenship Status | With Coverage | Without Coverage |
| Native Born | 451 (97.2%) | 13 (2.8%) |
| Foreign Born, Citizen | 1,350 (97.4%) | 36 (2.6%) |
| Foreign Born, not a Citizen | 706 (98.1%) | 14 (1.9%) |
Health Insurance Coverage by Household Income in Virginia
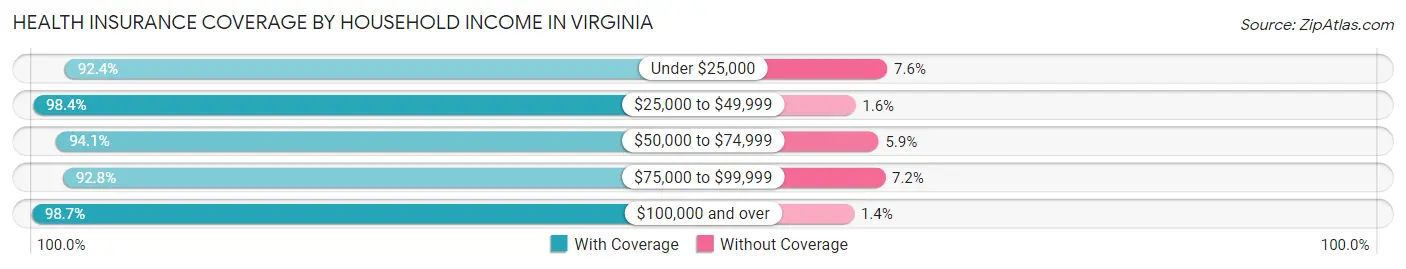
| Household Income | With Coverage | Without Coverage |
| Under $25,000 | 1,626 (92.4%) | 133 (7.6%) |
| $25,000 to $49,999 | 1,347 (98.4%) | 22 (1.6%) |
| $50,000 to $74,999 | 1,889 (94.1%) | 119 (5.9%) |
| $75,000 to $99,999 | 920 (92.8%) | 71 (7.2%) |
| $100,000 and over | 1,828 (98.7%) | 25 (1.3%) |
Public vs Private Health Insurance Coverage by Age in Virginia
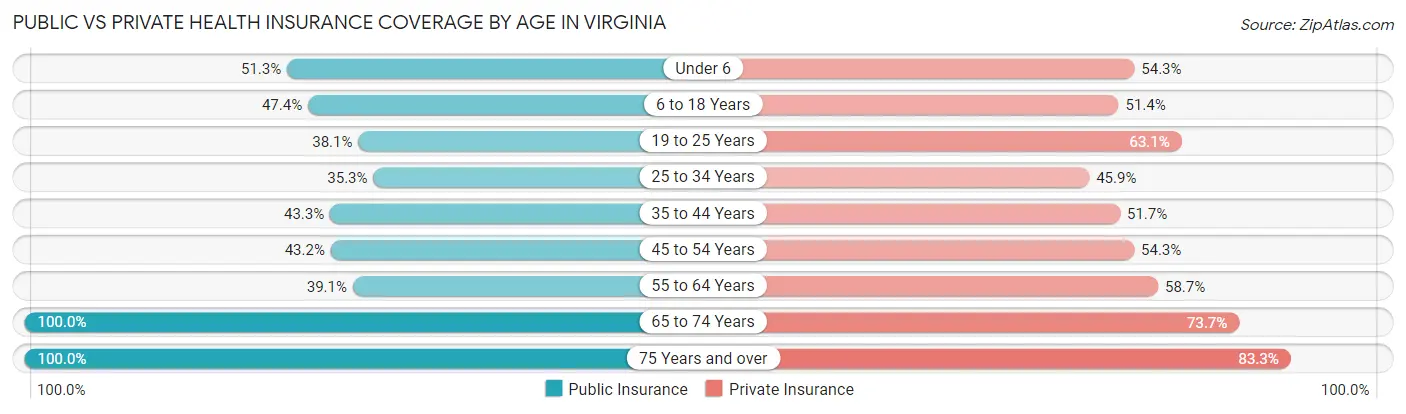
| Age Bracket | Public Insurance | Private Insurance |
| Under 6 | 238 (51.3%) | 252 (54.3%) |
| 6 to 18 Years | 657 (47.4%) | 712 (51.4%) |
| 19 to 25 Years | 274 (38.1%) | 454 (63.1%) |
| 25 to 34 Years | 195 (35.3%) | 254 (45.9%) |
| 35 to 44 Years | 524 (43.3%) | 625 (51.6%) |
| 45 to 54 Years | 421 (43.2%) | 529 (54.3%) |
| 55 to 64 Years | 440 (39.1%) | 661 (58.7%) |
| 65 to 74 Years | 895 (100.0%) | 660 (73.7%) |
| 75 Years and over | 892 (100.0%) | 743 (83.3%) |
| Total | 4,536 (55.2%) | 4,890 (59.5%) |
Disability Status by Sex by Age in Virginia
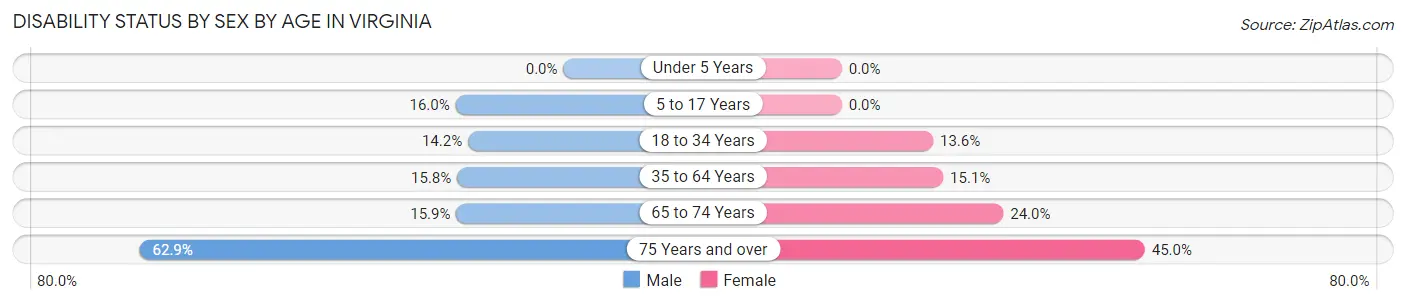
| Age Bracket | Male | Female |
| Under 5 Years | 0 (0.0%) | 0 (0.0%) |
| 5 to 17 Years | 122 (16.0%) | 0 (0.0%) |
| 18 to 34 Years | 111 (14.2%) | 87 (13.6%) |
| 35 to 64 Years | 252 (15.8%) | 258 (15.0%) |
| 65 to 74 Years | 76 (15.9%) | 100 (24.0%) |
| 75 Years and over | 241 (62.9%) | 229 (45.0%) |
Disability Class by Sex by Age in Virginia
Disability Class: Hearing Difficulty
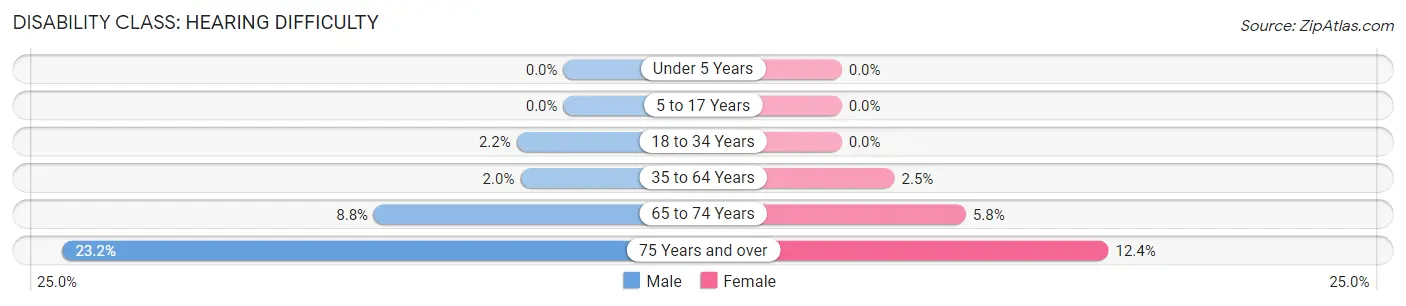
| Age Bracket | Male | Female |
| Under 5 Years | 0 (0.0%) | 0 (0.0%) |
| 5 to 17 Years | 0 (0.0%) | 0 (0.0%) |
| 18 to 34 Years | 17 (2.2%) | 0 (0.0%) |
| 35 to 64 Years | 32 (2.0%) | 42 (2.5%) |
| 65 to 74 Years | 42 (8.8%) | 24 (5.8%) |
| 75 Years and over | 89 (23.2%) | 63 (12.4%) |
Disability Class: Vision Difficulty
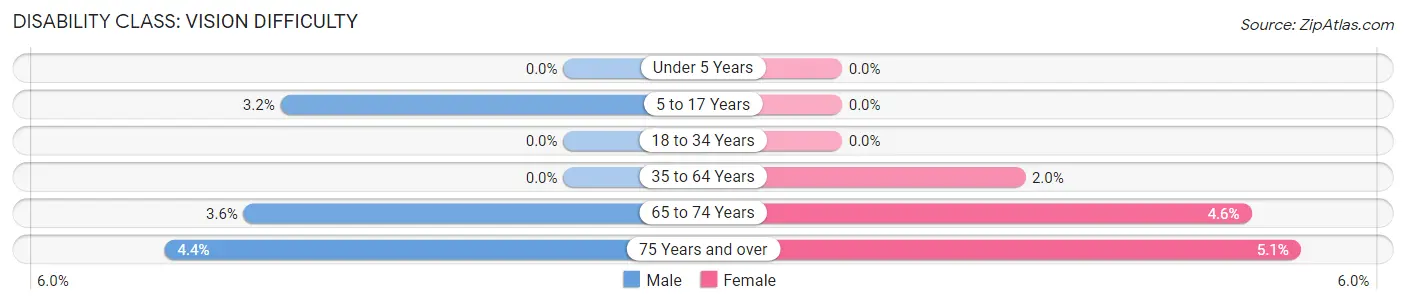
| Age Bracket | Male | Female |
| Under 5 Years | 0 (0.0%) | 0 (0.0%) |
| 5 to 17 Years | 24 (3.2%) | 0 (0.0%) |
| 18 to 34 Years | 0 (0.0%) | 0 (0.0%) |
| 35 to 64 Years | 0 (0.0%) | 35 (2.0%) |
| 65 to 74 Years | 17 (3.6%) | 19 (4.6%) |
| 75 Years and over | 17 (4.4%) | 26 (5.1%) |
Disability Class: Cognitive Difficulty
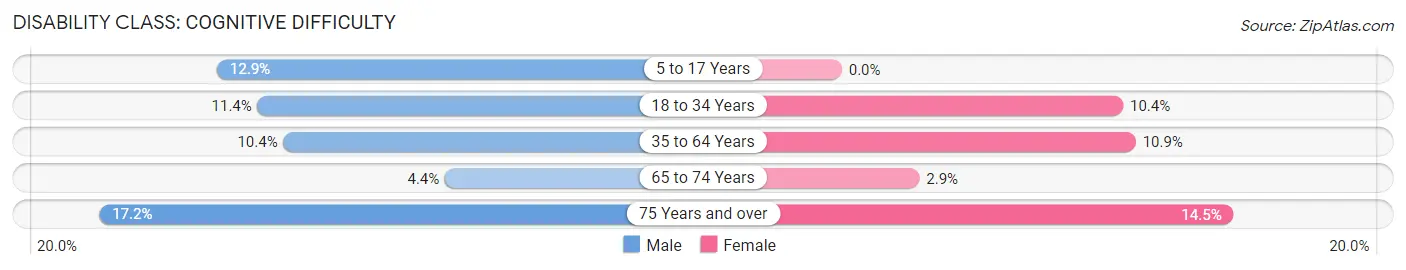
| Age Bracket | Male | Female |
| 5 to 17 Years | 98 (12.9%) | 0 (0.0%) |
| 18 to 34 Years | 89 (11.4%) | 67 (10.4%) |
| 35 to 64 Years | 166 (10.4%) | 187 (10.9%) |
| 65 to 74 Years | 21 (4.4%) | 12 (2.9%) |
| 75 Years and over | 66 (17.2%) | 74 (14.5%) |
Disability Class: Ambulatory Difficulty
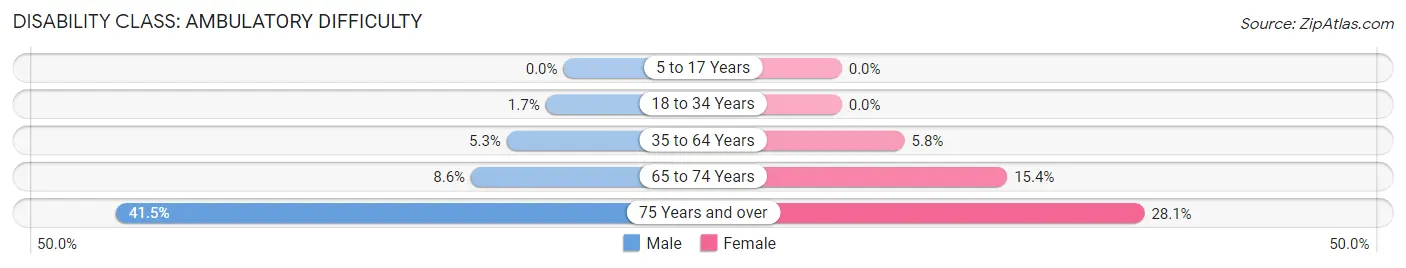
| Age Bracket | Male | Female |
| 5 to 17 Years | 0 (0.0%) | 0 (0.0%) |
| 18 to 34 Years | 13 (1.7%) | 0 (0.0%) |
| 35 to 64 Years | 84 (5.3%) | 100 (5.8%) |
| 65 to 74 Years | 41 (8.6%) | 64 (15.3%) |
| 75 Years and over | 159 (41.5%) | 143 (28.1%) |
Disability Class: Self-Care Difficulty
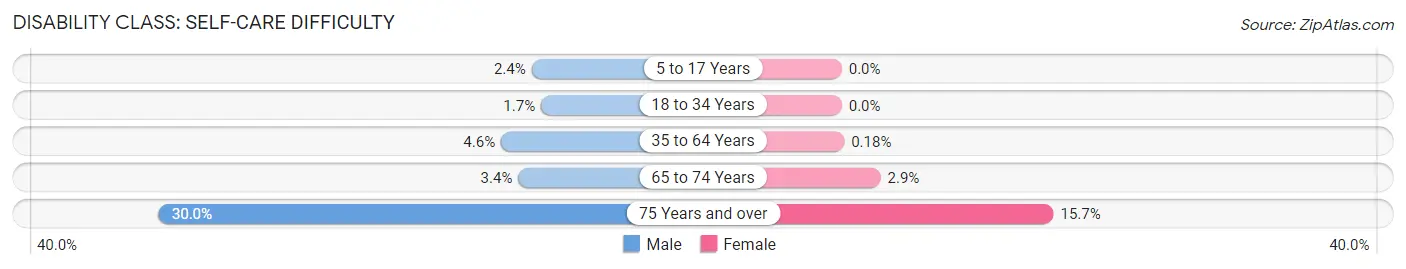
| Age Bracket | Male | Female |
| 5 to 17 Years | 18 (2.4%) | 0 (0.0%) |
| 18 to 34 Years | 13 (1.7%) | 0 (0.0%) |
| 35 to 64 Years | 74 (4.6%) | 3 (0.2%) |
| 65 to 74 Years | 16 (3.4%) | 12 (2.9%) |
| 75 Years and over | 115 (30.0%) | 80 (15.7%) |
Technology Access in Virginia
Computing Device Access in Virginia
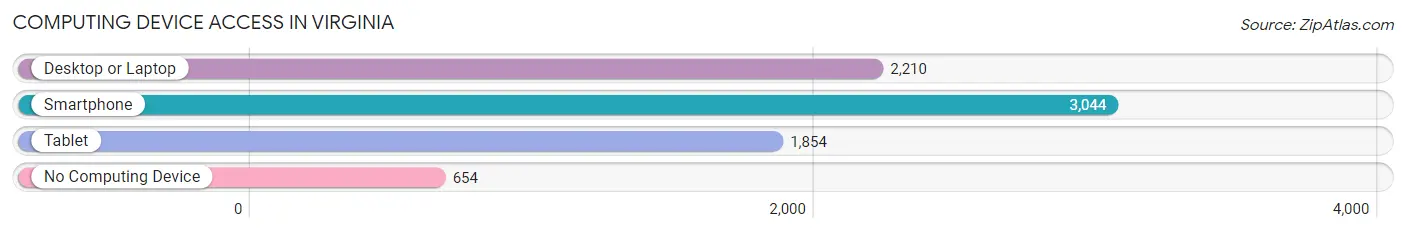
| Device Type | # Households | % Households |
| Desktop or Laptop | 2,210 | 55.8% |
| Smartphone | 3,044 | 76.9% |
| Tablet | 1,854 | 46.8% |
| No Computing Device | 654 | 16.5% |
| Total | 3,960 | 100.0% |
Internet Access in Virginia
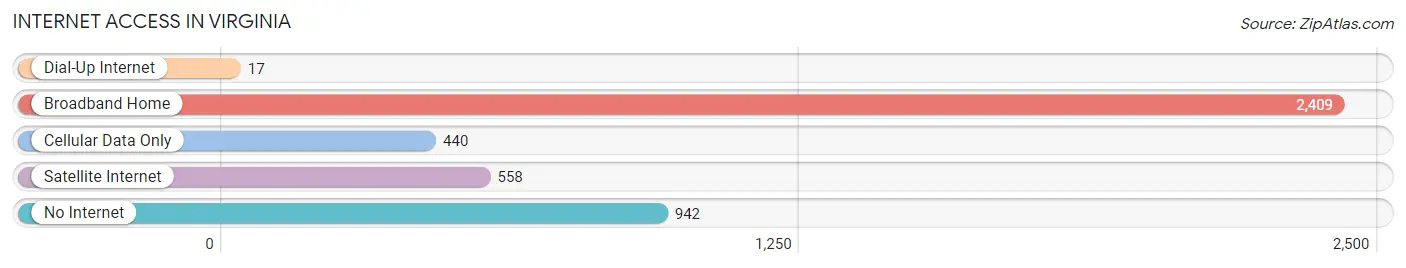
| Internet Type | # Households | % Households |
| Dial-Up Internet | 17 | 0.4% |
| Broadband Home | 2,409 | 60.8% |
| Cellular Data Only | 440 | 11.1% |
| Satellite Internet | 558 | 14.1% |
| No Internet | 942 | 23.8% |
| Total | 3,960 | 100.0% |
Virginia Summary
Virginia, Minnesota is a city located in the northeastern part of the state, in St. Louis County. It is situated on the Mesabi Iron Range, and is the county seat of St. Louis County. The city is located on the banks of the Mississippi River, and is home to a population of 8,712 people, according to the 2010 census.
History
The area that is now Virginia, Minnesota was first settled in the late 1800s by Finnish and Swedish immigrants. The city was originally known as “Finn Town”, and was later renamed Virginia in honor of the wife of a local businessman. The city was officially incorporated in 1892.
The city’s economy was initially based on logging and mining, and the city was home to several iron ore mines. The city’s economy shifted to manufacturing in the early 1900s, and the city became home to several factories, including a paper mill, a sawmill, and a furniture factory.
The city was also home to a large Finnish population, and the city was home to several Finnish-American organizations, including the Finnish-American Historical Society and the Finnish-American Cultural Center.
Geography
Virginia is located in the northeastern part of Minnesota, in St. Louis County. The city is situated on the Mesabi Iron Range, and is located on the banks of the Mississippi River. The city is located approximately 75 miles north of Duluth, and is approximately 200 miles north of Minneapolis.
The city has a total area of 8.3 square miles, of which 8.2 square miles is land and 0.1 square miles is water. The city is located in a hilly region, and is surrounded by several lakes, including Lake Vermilion, Lake Pokegama, and Lake Sturgeon.
Economy
The economy of Virginia is largely based on manufacturing and tourism. The city is home to several factories, including a paper mill, a sawmill, and a furniture factory. The city is also home to several tourist attractions, including the Ironworld Discovery Center, the Minnesota Discovery Center, and the Virginia Mine Museum.
The city is also home to several retail stores, restaurants, and hotels. The city is served by the Duluth International Airport, which is located approximately 75 miles south of the city.
Demographics
According to the 2010 census, the population of Virginia was 8,712 people. The racial makeup of the city was 94.3% White, 0.7% African American, 0.3% Native American, 0.7% Asian, 0.1% Pacific Islander, 2.2% from other races, and 1.9% from two or more races. Hispanic or Latino of any race were 4.2% of the population.
The median income for a household in the city was $37,917, and the median income for a family was $45,938. The per capita income for the city was $20,845. About 11.2% of families and 14.2% of the population were below the poverty line, including 19.2% of those under age 18 and 8.2% of those age 65 or over.
Common Questions
What is Per Capita Income in Virginia?
Per Capita income in Virginia is $28,976.
What is the Median Family Income in Virginia?
Median Family Income in Virginia is $69,932.
What is the Median Household income in Virginia?
Median Household Income in Virginia is $49,789.
What is Income or Wage Gap in Virginia?
Income or Wage Gap in Virginia is 15.6%.
Women in Virginia earn 84.4 cents for every dollar earned by a man.
What is Inequality or Gini Index in Virginia?
Inequality or Gini Index in Virginia is 0.46.
What is the Total Population of Virginia?
Total Population of Virginia is 8,415.
What is the Total Male Population of Virginia?
Total Male Population of Virginia is 4,323.
What is the Total Female Population of Virginia?
Total Female Population of Virginia is 4,092.
What is the Ratio of Males per 100 Females in Virginia?
There are 105.65 Males per 100 Females in Virginia.
What is the Ratio of Females per 100 Males in Virginia?
There are 94.66 Females per 100 Males in Virginia.
What is the Median Population Age in Virginia?
Median Population Age in Virginia is 42.8 Years.
What is the Average Family Size in Virginia
Average Family Size in Virginia is 2.8 People.
What is the Average Household Size in Virginia
Average Household Size in Virginia is 2.0 People.
How Large is the Labor Force in Virginia?
There are 3,573 People in the Labor Forcein in Virginia.
What is the Percentage of People in the Labor Force in Virginia?
50.9% of People are in the Labor Force in Virginia.
What is the Unemployment Rate in Virginia?
Unemployment Rate in Virginia is 5.7%.