Hobart, WI Map & Demographics
Hobart Map
Hobart Overview
$58,784
PER CAPITA INCOME
$116,080
AVG FAMILY INCOME
$107,222
AVG HOUSEHOLD INCOME
40.2%
WAGE / INCOME GAP [ % ]
59.8¢/ $1
WAGE / INCOME GAP [ $ ]
0.47
INEQUALITY / GINI INDEX
10,130
TOTAL POPULATION
5,064
MALE POPULATION
5,066
FEMALE POPULATION
99.96
MALES / 100 FEMALES
100.04
FEMALES / 100 MALES
38.5
MEDIAN AGE
2.8
AVG FAMILY SIZE
2.6
AVG HOUSEHOLD SIZE
5,975
LABOR FORCE [ PEOPLE ]
71.5%
PERCENT IN LABOR FORCE
0.2%
UNEMPLOYMENT RATE
Hobart Area Codes
Income in Hobart
Income Overview in Hobart
Per Capita Income in Hobart is $58,784, while median incomes of families and households are $116,080 and $107,222 respectively.
| Characteristic | Number | Measure |
| Per Capita Income | 10,130 | $58,784 |
| Median Family Income | 2,883 | $116,080 |
| Mean Family Income | 2,883 | $178,925 |
| Median Household Income | 3,944 | $107,222 |
| Mean Household Income | 3,944 | $154,313 |
| Income Deficit | 2,883 | $0 |
| Wage / Income Gap (%) | 10,130 | 40.23% |
| Wage / Income Gap ($) | 10,130 | 59.77¢ per $1 |
| Gini / Inequality Index | 10,130 | 0.47 |
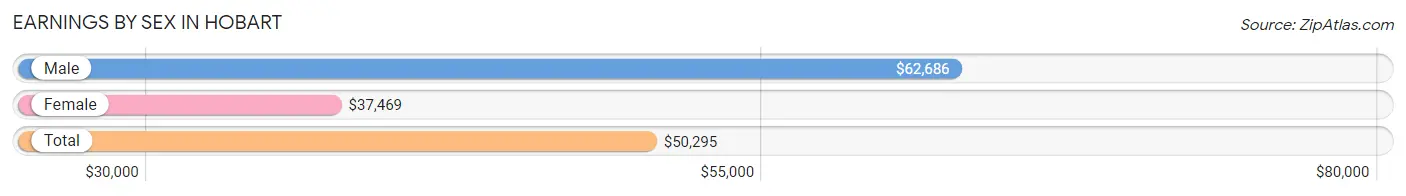
Earnings by Sex in Hobart
Average Earnings in Hobart are $50,295, $62,686 for men and $37,469 for women, a difference of 40.2%.
| Sex | Number | Average Earnings |
| Male | 3,330 (52.3%) | $62,686 |
| Female | 3,036 (47.7%) | $37,469 |
| Total | 6,366 (100.0%) | $50,295 |
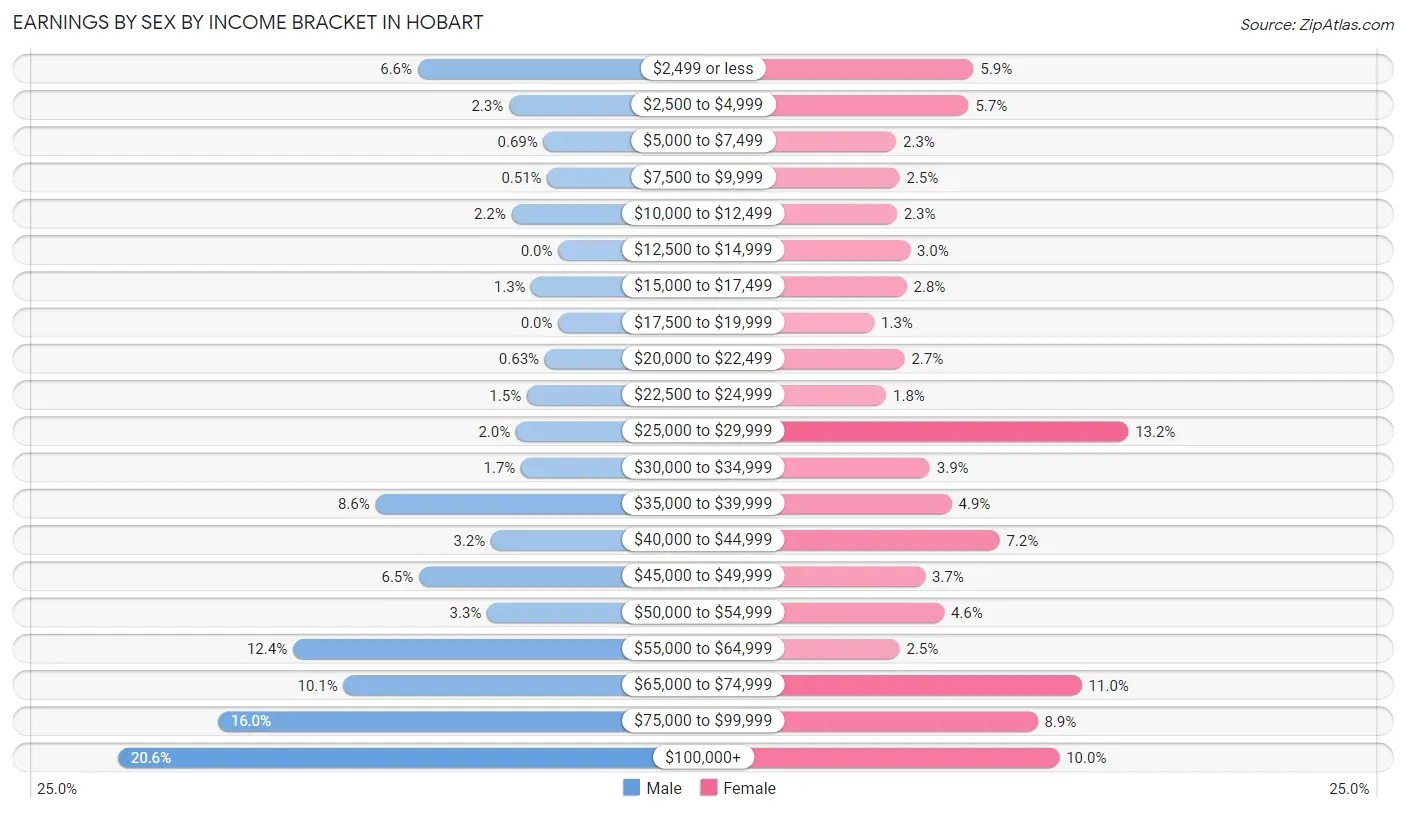
Earnings by Sex by Income Bracket in Hobart
The most common earnings brackets in Hobart are $100,000+ for men (687 | 20.6%) and $25,000 to $29,999 for women (400 | 13.2%).
| Income | Male | Female |
| $2,499 or less | 219 (6.6%) | 180 (5.9%) |
| $2,500 to $4,999 | 77 (2.3%) | 173 (5.7%) |
| $5,000 to $7,499 | 23 (0.7%) | 70 (2.3%) |
| $7,500 to $9,999 | 17 (0.5%) | 75 (2.5%) |
| $10,000 to $12,499 | 73 (2.2%) | 71 (2.3%) |
| $12,500 to $14,999 | 0 (0.0%) | 90 (3.0%) |
| $15,000 to $17,499 | 42 (1.3%) | 85 (2.8%) |
| $17,500 to $19,999 | 0 (0.0%) | 39 (1.3%) |
| $20,000 to $22,499 | 21 (0.6%) | 82 (2.7%) |
| $22,500 to $24,999 | 49 (1.5%) | 56 (1.8%) |
| $25,000 to $29,999 | 66 (2.0%) | 400 (13.2%) |
| $30,000 to $34,999 | 58 (1.7%) | 118 (3.9%) |
| $35,000 to $39,999 | 285 (8.6%) | 149 (4.9%) |
| $40,000 to $44,999 | 105 (3.2%) | 217 (7.1%) |
| $45,000 to $49,999 | 217 (6.5%) | 111 (3.7%) |
| $50,000 to $54,999 | 111 (3.3%) | 138 (4.5%) |
| $55,000 to $64,999 | 414 (12.4%) | 75 (2.5%) |
| $65,000 to $74,999 | 335 (10.1%) | 334 (11.0%) |
| $75,000 to $99,999 | 531 (16.0%) | 271 (8.9%) |
| $100,000+ | 687 (20.6%) | 302 (10.0%) |
| Total | 3,330 (100.0%) | 3,036 (100.0%) |
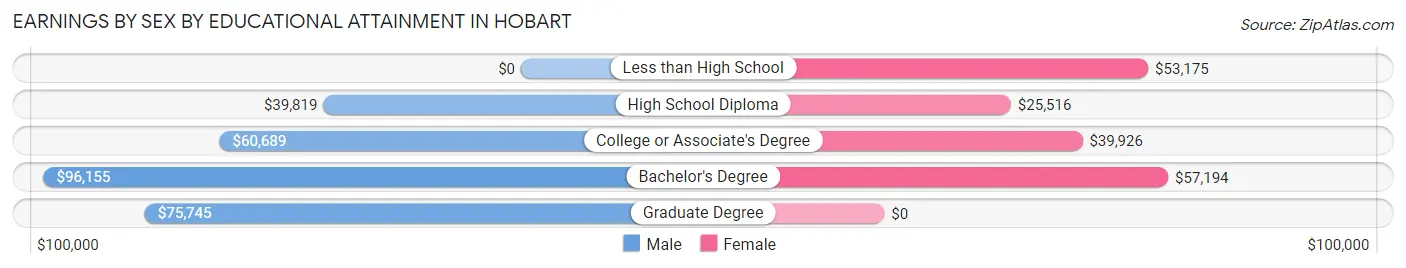
Earnings by Sex by Educational Attainment in Hobart
Average earnings in Hobart are $66,093 for men and $44,705 for women, a difference of 32.4%. Men with an educational attainment of bachelor's degree enjoy the highest average annual earnings of $96,155, while those with high school diploma education earn the least with $39,819. Women with an educational attainment of bachelor's degree earn the most with the average annual earnings of $57,194, while those with high school diploma education have the smallest earnings of $25,516.
| Educational Attainment | Male Income | Female Income |
| Less than High School | - | - |
| High School Diploma | $39,819 | $25,516 |
| College or Associate's Degree | $60,689 | $39,926 |
| Bachelor's Degree | $96,155 | $57,194 |
| Graduate Degree | $75,745 | $0 |
| Total | $66,093 | $44,705 |
Family Income in Hobart
Family Income Brackets in Hobart
According to the Hobart family income data, there are 718 families falling into the $100,000 to $149,999 income range, which is the most common income bracket and makes up 24.9% of all families.
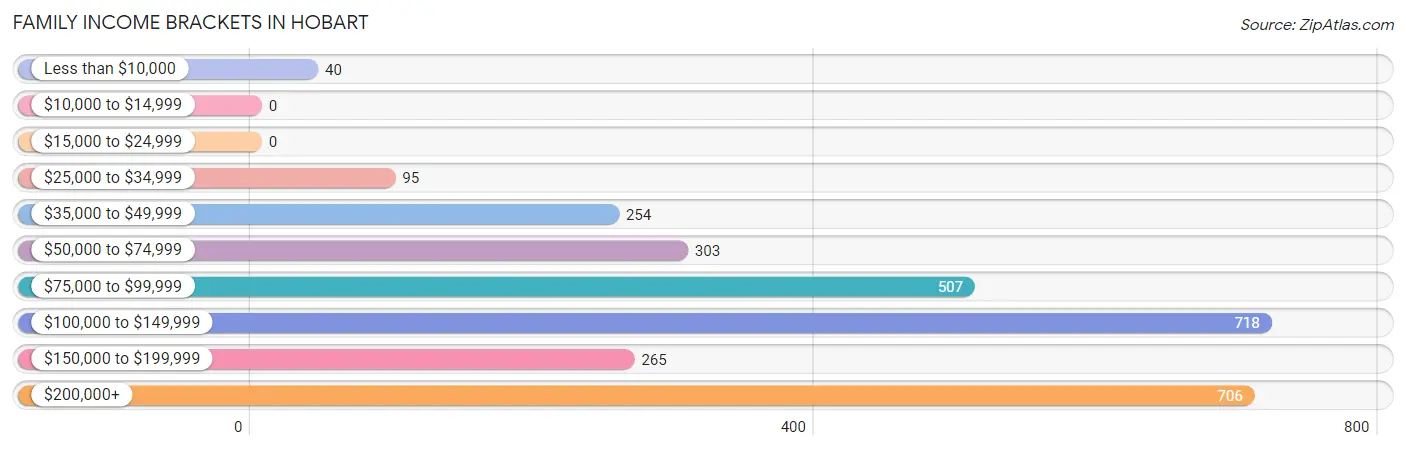
| Income Bracket | # Families | % Families |
| Less than $10,000 | 40 | 1.4% |
| $10,000 to $14,999 | 0 | 0.0% |
| $15,000 to $24,999 | 0 | 0.0% |
| $25,000 to $34,999 | 95 | 3.3% |
| $35,000 to $49,999 | 254 | 8.8% |
| $50,000 to $74,999 | 303 | 10.5% |
| $75,000 to $99,999 | 507 | 17.6% |
| $100,000 to $149,999 | 718 | 24.9% |
| $150,000 to $199,999 | 265 | 9.2% |
| $200,000+ | 706 | 24.5% |
Family Income by Famaliy Size in Hobart
3-person families (578 | 20.1%) account for the highest median family income in Hobart with $140,115 per family, while 2-person families (1,509 | 52.3%) have the highest median income of $59,004 per family member.
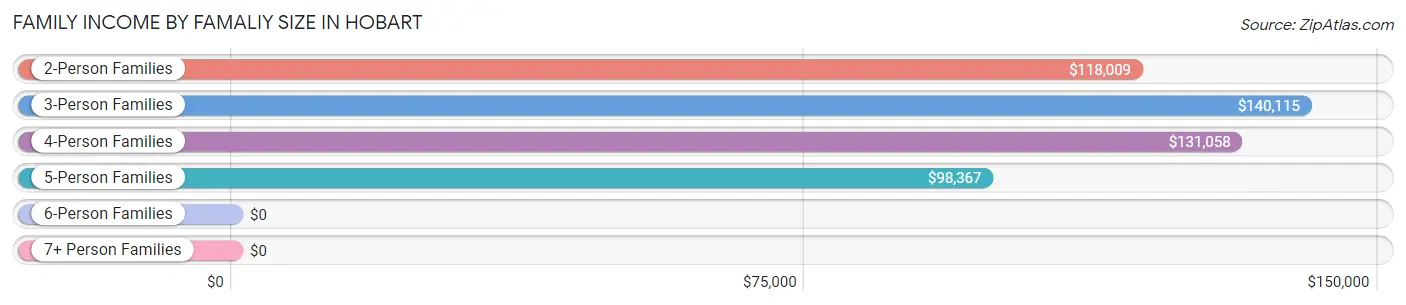
| Income Bracket | # Families | Median Income |
| 2-Person Families | 1,509 (52.3%) | $118,009 |
| 3-Person Families | 578 (20.1%) | $140,115 |
| 4-Person Families | 481 (16.7%) | $131,058 |
| 5-Person Families | 304 (10.5%) | $98,367 |
| 6-Person Families | 11 (0.4%) | $0 |
| 7+ Person Families | 0 (0.0%) | $0 |
| Total | 2,883 (100.0%) | $116,080 |
Family Income by Number of Earners in Hobart
The median family income in Hobart is $116,080, with families comprising no earners (302) having the highest median family income of $250,001, while families with 1 earner (918) have the lowest median family income of $93,421, accounting for 10.5% and 31.8% of families, respectively.
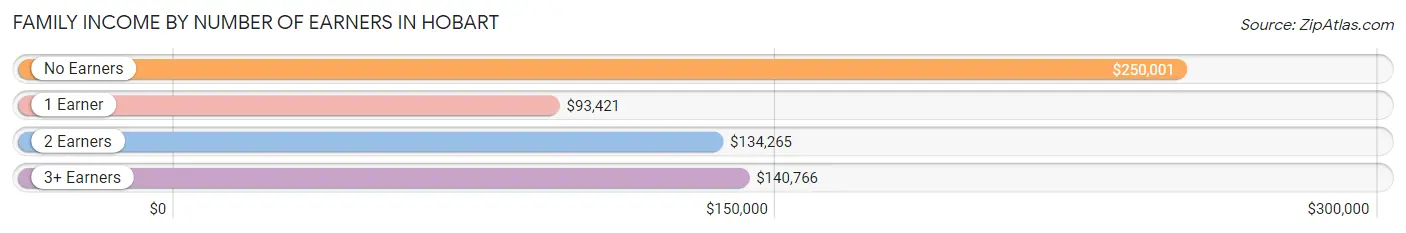
| Number of Earners | # Families | Median Income |
| No Earners | 302 (10.5%) | $250,001 |
| 1 Earner | 918 (31.8%) | $93,421 |
| 2 Earners | 1,422 (49.3%) | $134,265 |
| 3+ Earners | 241 (8.4%) | $140,766 |
| Total | 2,883 (100.0%) | $116,080 |
Household Income in Hobart
Household Income Brackets in Hobart
With 939 households falling in the category, the $100,000 to $149,999 income range is the most frequent in Hobart, accounting for 23.8% of all households.
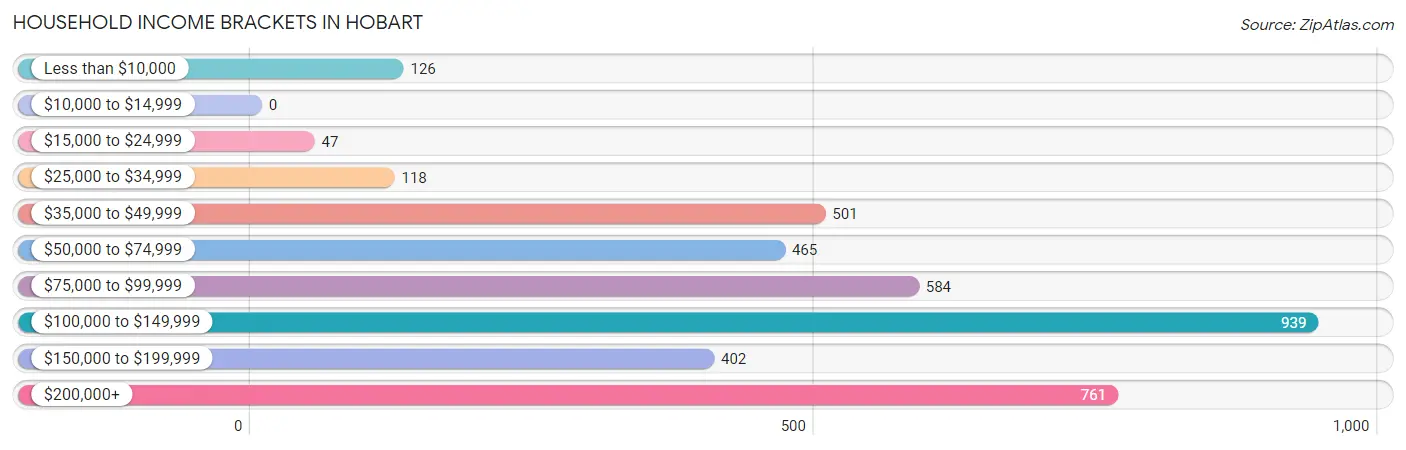
| Income Bracket | # Households | % Households |
| Less than $10,000 | 126 | 3.2% |
| $10,000 to $14,999 | 0 | 0.0% |
| $15,000 to $24,999 | 47 | 1.2% |
| $25,000 to $34,999 | 118 | 3.0% |
| $35,000 to $49,999 | 501 | 12.7% |
| $50,000 to $74,999 | 465 | 11.8% |
| $75,000 to $99,999 | 584 | 14.8% |
| $100,000 to $149,999 | 939 | 23.8% |
| $150,000 to $199,999 | 402 | 10.2% |
| $200,000+ | 761 | 19.3% |
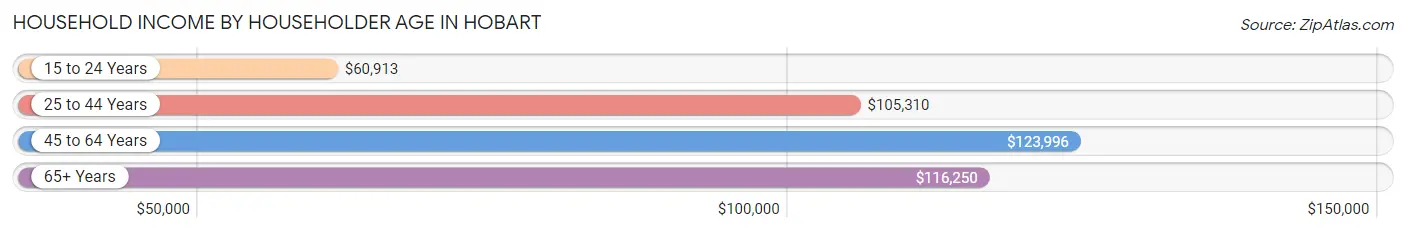
Household Income by Householder Age in Hobart
The median household income in Hobart is $107,222, with the highest median household income of $123,996 found in the 45 to 64 years age bracket for the primary householder. A total of 1,625 households (41.2%) fall into this category. Meanwhile, the 15 to 24 years age bracket for the primary householder has the lowest median household income of $60,913, with 266 households (6.7%) in this group.
| Income Bracket | # Households | Median Income |
| 15 to 24 Years | 266 (6.7%) | $60,913 |
| 25 to 44 Years | 1,461 (37.0%) | $105,310 |
| 45 to 64 Years | 1,625 (41.2%) | $123,996 |
| 65+ Years | 592 (15.0%) | $116,250 |
| Total | 3,944 (100.0%) | $107,222 |
Poverty in Hobart
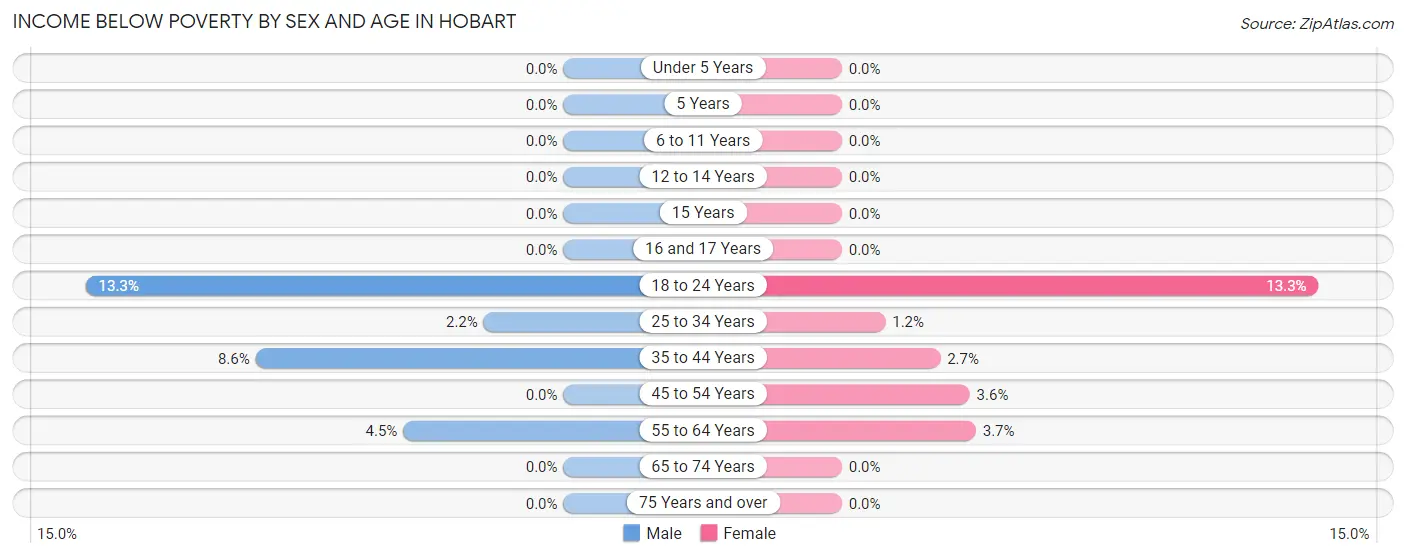
Income Below Poverty by Sex and Age in Hobart
With 3.8% poverty level for males and 3.3% for females among the residents of Hobart, 18 to 24 year old males and 18 to 24 year old females are the most vulnerable to poverty, with 52 males (13.3%) and 86 females (13.3%) in their respective age groups living below the poverty level.
| Age Bracket | Male | Female |
| Under 5 Years | 0 (0.0%) | 0 (0.0%) |
| 5 Years | 0 (0.0%) | 0 (0.0%) |
| 6 to 11 Years | 0 (0.0%) | 0 (0.0%) |
| 12 to 14 Years | 0 (0.0%) | 0 (0.0%) |
| 15 Years | 0 (0.0%) | 0 (0.0%) |
| 16 and 17 Years | 0 (0.0%) | 0 (0.0%) |
| 18 to 24 Years | 52 (13.3%) | 86 (13.3%) |
| 25 to 34 Years | 14 (2.2%) | 9 (1.2%) |
| 35 to 44 Years | 70 (8.6%) | 15 (2.7%) |
| 45 to 54 Years | 0 (0.0%) | 19 (3.6%) |
| 55 to 64 Years | 56 (4.5%) | 36 (3.7%) |
| 65 to 74 Years | 0 (0.0%) | 0 (0.0%) |
| 75 Years and over | 0 (0.0%) | 0 (0.0%) |
| Total | 192 (3.8%) | 165 (3.3%) |
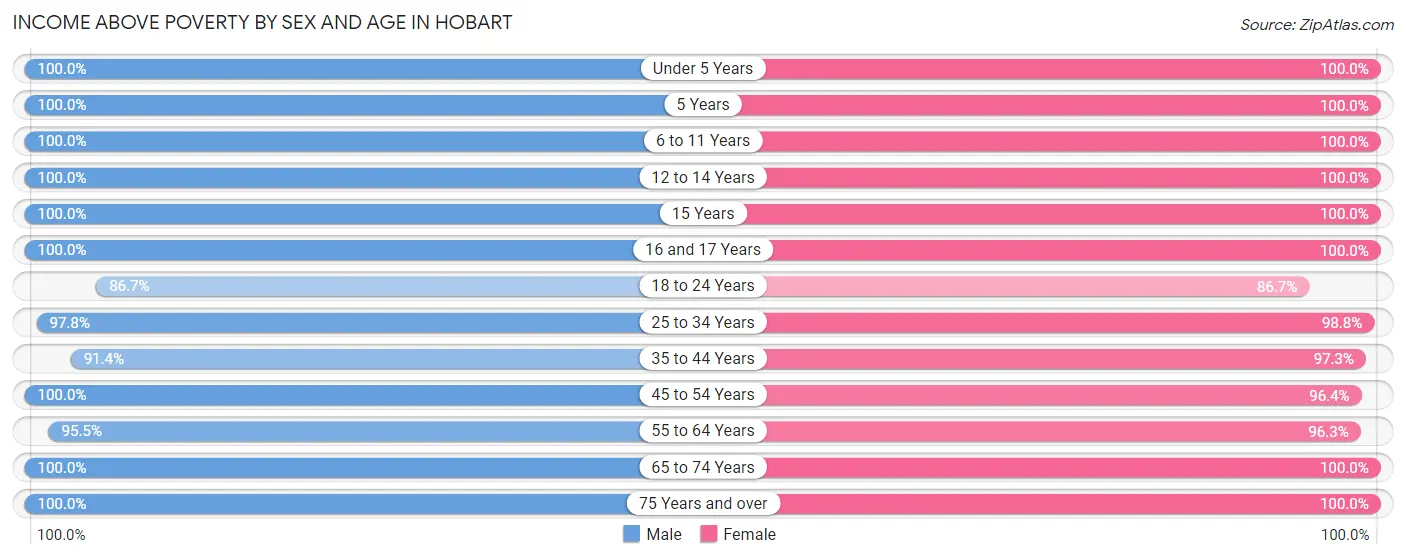
Income Above Poverty by Sex and Age in Hobart
According to the poverty statistics in Hobart, males aged under 5 years and females aged under 5 years are the age groups that are most secure financially, with 100.0% of males and 100.0% of females in these age groups living above the poverty line.
| Age Bracket | Male | Female |
| Under 5 Years | 171 (100.0%) | 406 (100.0%) |
| 5 Years | 139 (100.0%) | 95 (100.0%) |
| 6 to 11 Years | 319 (100.0%) | 281 (100.0%) |
| 12 to 14 Years | 152 (100.0%) | 67 (100.0%) |
| 15 Years | 38 (100.0%) | 36 (100.0%) |
| 16 and 17 Years | 99 (100.0%) | 180 (100.0%) |
| 18 to 24 Years | 339 (86.7%) | 562 (86.7%) |
| 25 to 34 Years | 617 (97.8%) | 737 (98.8%) |
| 35 to 44 Years | 747 (91.4%) | 533 (97.3%) |
| 45 to 54 Years | 293 (100.0%) | 515 (96.4%) |
| 55 to 64 Years | 1,199 (95.5%) | 928 (96.3%) |
| 65 to 74 Years | 631 (100.0%) | 363 (100.0%) |
| 75 Years and over | 128 (100.0%) | 121 (100.0%) |
| Total | 4,872 (96.2%) | 4,824 (96.7%) |
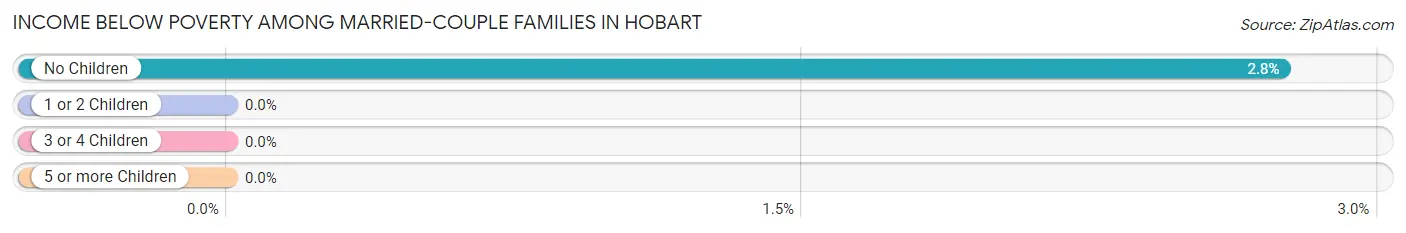
Income Below Poverty Among Married-Couple Families in Hobart
The poverty statistics for married-couple families in Hobart show that 1.8% or 39 of the total 2,233 families live below the poverty line. Families with no children have the highest poverty rate of 2.8%, comprising of 39 families. On the other hand, families with 1 or 2 children have the lowest poverty rate of 0.0%, which includes 0 families.
| Children | Above Poverty | Below Poverty |
| No Children | 1,380 (97.3%) | 39 (2.8%) |
| 1 or 2 Children | 602 (100.0%) | 0 (0.0%) |
| 3 or 4 Children | 212 (100.0%) | 0 (0.0%) |
| 5 or more Children | 0 (0.0%) | 0 (0.0%) |
| Total | 2,194 (98.3%) | 39 (1.8%) |
Income Below Poverty Among Single-Parent Households in Hobart
| Children | Single Father | Single Mother |
| No Children | 0 (0.0%) | 0 (0.0%) |
| 1 or 2 Children | 0 (0.0%) | 0 (0.0%) |
| 3 or 4 Children | 0 (0.0%) | 0 (0.0%) |
| 5 or more Children | 0 (0.0%) | 0 (0.0%) |
| Total | 0 (0.0%) | 0 (0.0%) |
Income Below Poverty Among Married-Couple vs Single-Parent Households in Hobart
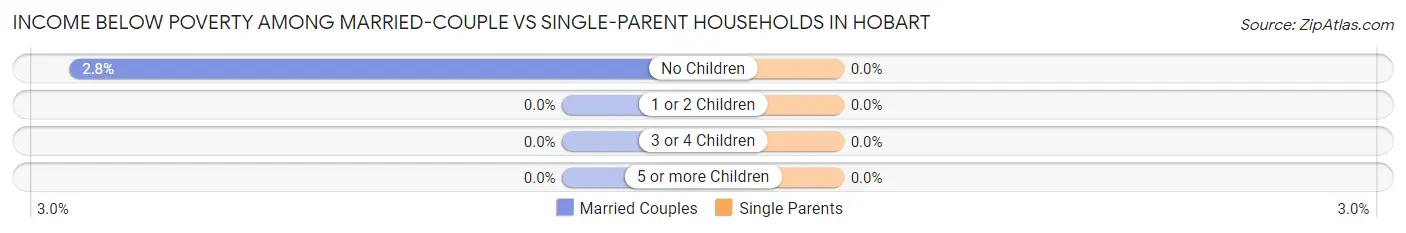
| Children | Married-Couple Families | Single-Parent Households |
| No Children | 39 (2.8%) | 0 (0.0%) |
| 1 or 2 Children | 0 (0.0%) | 0 (0.0%) |
| 3 or 4 Children | 0 (0.0%) | 0 (0.0%) |
| 5 or more Children | 0 (0.0%) | 0 (0.0%) |
| Total | 39 (1.8%) | 0 (0.0%) |
Race in Hobart
The most populous races in Hobart are White / Caucasian (7,514 | 74.2%), Two or more Races (1,204 | 11.9%), and Native / Alaskan (608 | 6.0%).
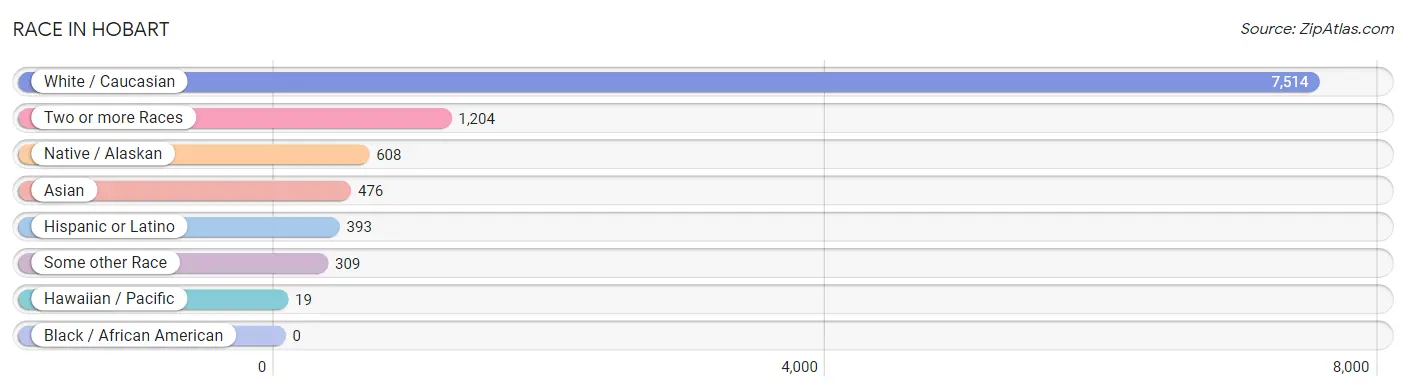
| Race | # Population | % Population |
| Asian | 476 | 4.7% |
| Black / African American | 0 | 0.0% |
| Hawaiian / Pacific | 19 | 0.2% |
| Hispanic or Latino | 393 | 3.9% |
| Native / Alaskan | 608 | 6.0% |
| White / Caucasian | 7,514 | 74.2% |
| Two or more Races | 1,204 | 11.9% |
| Some other Race | 309 | 3.0% |
| Total | 10,130 | 100.0% |
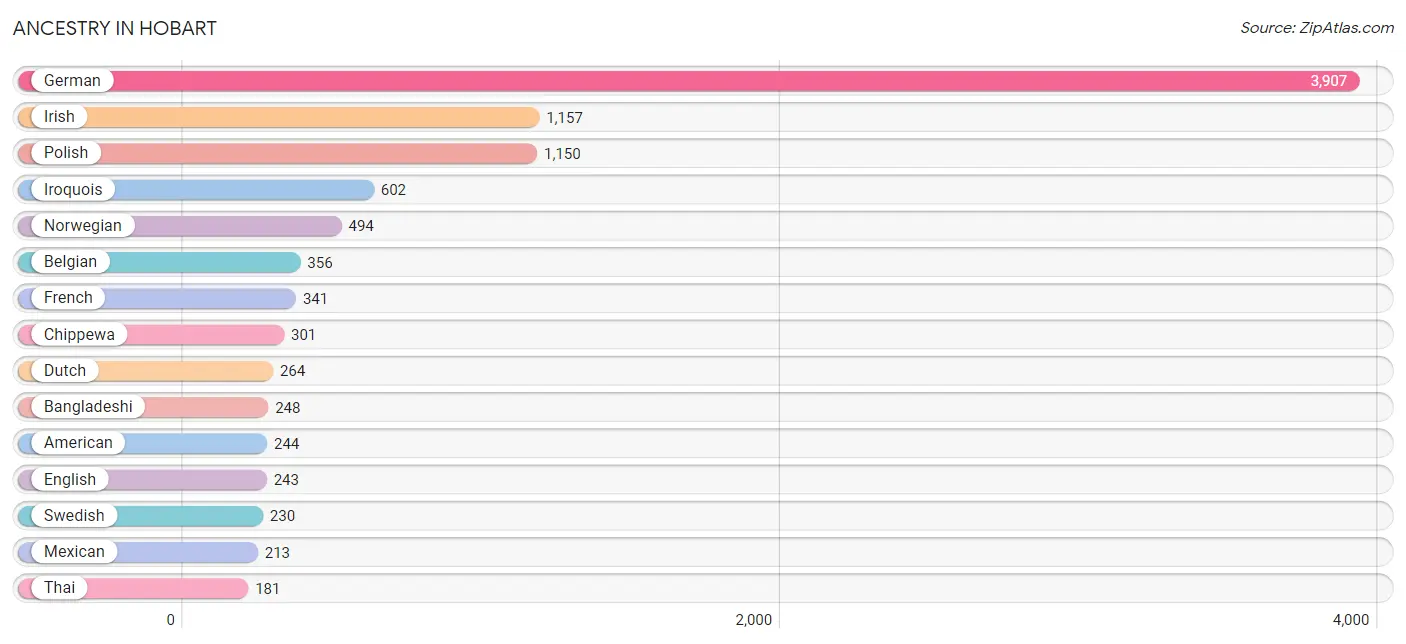
Ancestry in Hobart
The most populous ancestries reported in Hobart are German (3,907 | 38.6%), Irish (1,157 | 11.4%), Polish (1,150 | 11.4%), Iroquois (602 | 5.9%), and Norwegian (494 | 4.9%), together accounting for 72.2% of all Hobart residents.
| Ancestry | # Population | % Population |
| African | 14 | 0.1% |
| American | 244 | 2.4% |
| Austrian | 65 | 0.6% |
| Bangladeshi | 248 | 2.5% |
| Belgian | 356 | 3.5% |
| British | 77 | 0.8% |
| Carpatho Rusyn | 50 | 0.5% |
| Chickasaw | 14 | 0.1% |
| Chippewa | 301 | 3.0% |
| Cuban | 15 | 0.2% |
| Czech | 80 | 0.8% |
| Danish | 86 | 0.9% |
| Dutch | 264 | 2.6% |
| Eastern European | 116 | 1.1% |
| Ecuadorian | 117 | 1.1% |
| English | 243 | 2.4% |
| European | 83 | 0.8% |
| Finnish | 117 | 1.1% |
| French | 341 | 3.4% |
| French Canadian | 137 | 1.3% |
| German | 3,907 | 38.6% |
| Greek | 14 | 0.1% |
| Guamanian / Chamorro | 172 | 1.7% |
| Hungarian | 16 | 0.2% |
| Irish | 1,157 | 11.4% |
| Iroquois | 602 | 5.9% |
| Italian | 121 | 1.2% |
| Korean | 157 | 1.5% |
| Menominee | 16 | 0.2% |
| Mexican | 213 | 2.1% |
| Native Hawaiian | 19 | 0.2% |
| Norwegian | 494 | 4.9% |
| Polish | 1,150 | 11.4% |
| Portuguese | 26 | 0.3% |
| Puerto Rican | 22 | 0.2% |
| Russian | 57 | 0.6% |
| Scandinavian | 51 | 0.5% |
| Scotch-Irish | 52 | 0.5% |
| Scottish | 130 | 1.3% |
| South American | 117 | 1.1% |
| Spanish | 26 | 0.3% |
| Subsaharan African | 14 | 0.1% |
| Swedish | 230 | 2.3% |
| Swiss | 102 | 1.0% |
| Thai | 181 | 1.8% |
| Ukrainian | 45 | 0.4% |
| Welsh | 21 | 0.2% | View All 47 Rows |
Immigrants in Hobart
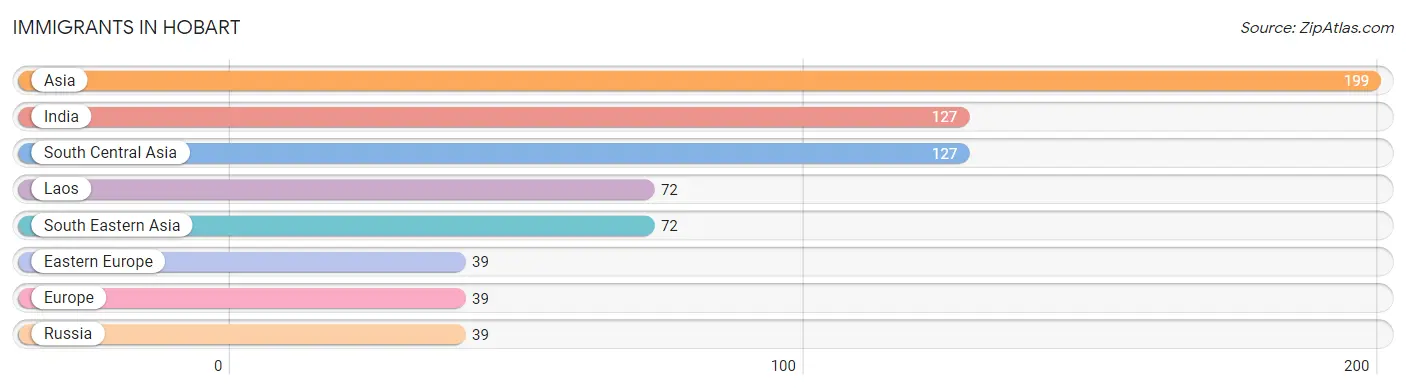
The most numerous immigrant groups reported in Hobart came from Asia (199 | 2.0%), India (127 | 1.3%), South Central Asia (127 | 1.3%), Laos (72 | 0.7%), and South Eastern Asia (72 | 0.7%), together accounting for 5.9% of all Hobart residents.
| Immigration Origin | # Population | % Population |
| Asia | 199 | 2.0% |
| Eastern Europe | 39 | 0.4% |
| Europe | 39 | 0.4% |
| India | 127 | 1.3% |
| Laos | 72 | 0.7% |
| Russia | 39 | 0.4% |
| South Central Asia | 127 | 1.3% |
| South Eastern Asia | 72 | 0.7% | View All 8 Rows |
Sex and Age in Hobart
Sex and Age in Hobart
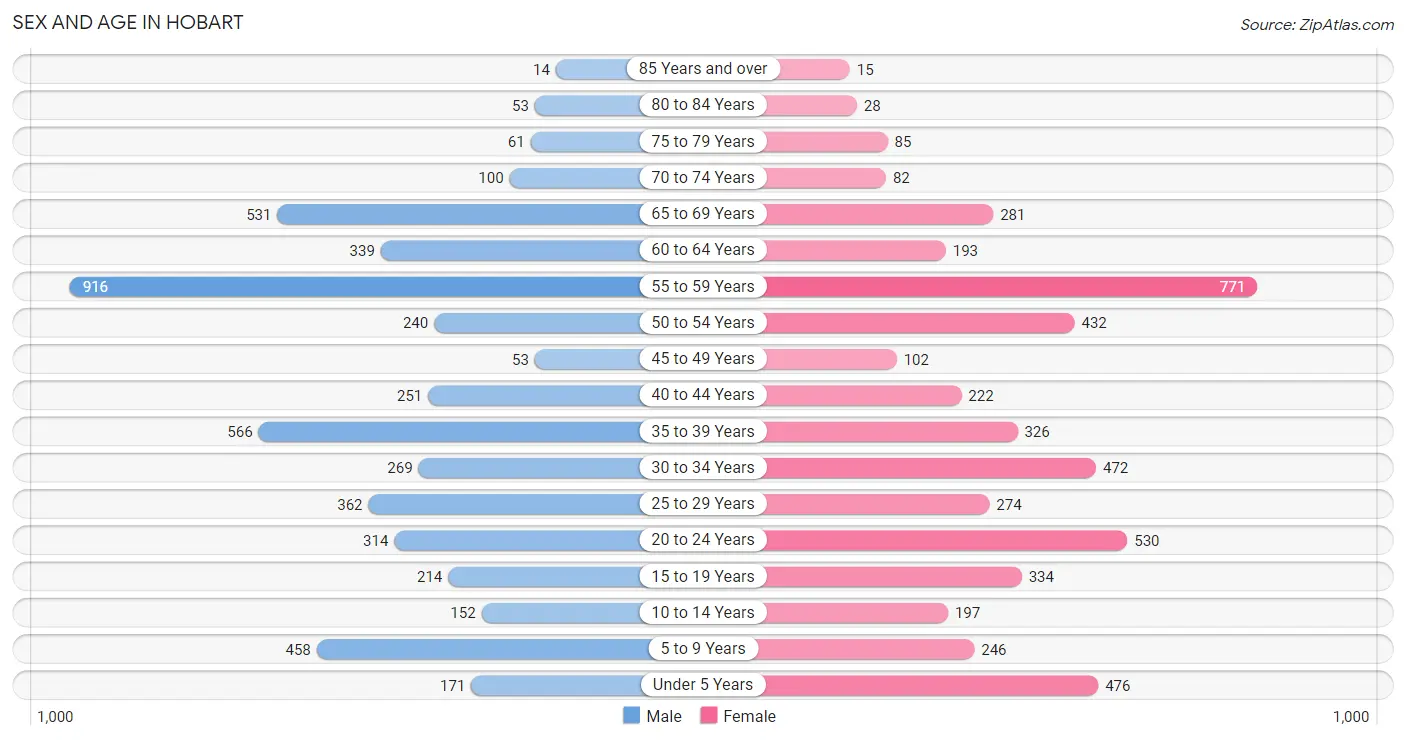
The most populous age groups in Hobart are 55 to 59 Years (916 | 18.1%) for men and 55 to 59 Years (771 | 15.2%) for women.
| Age Bracket | Male | Female |
| Under 5 Years | 171 (3.4%) | 476 (9.4%) |
| 5 to 9 Years | 458 (9.0%) | 246 (4.9%) |
| 10 to 14 Years | 152 (3.0%) | 197 (3.9%) |
| 15 to 19 Years | 214 (4.2%) | 334 (6.6%) |
| 20 to 24 Years | 314 (6.2%) | 530 (10.5%) |
| 25 to 29 Years | 362 (7.1%) | 274 (5.4%) |
| 30 to 34 Years | 269 (5.3%) | 472 (9.3%) |
| 35 to 39 Years | 566 (11.2%) | 326 (6.4%) |
| 40 to 44 Years | 251 (5.0%) | 222 (4.4%) |
| 45 to 49 Years | 53 (1.1%) | 102 (2.0%) |
| 50 to 54 Years | 240 (4.7%) | 432 (8.5%) |
| 55 to 59 Years | 916 (18.1%) | 771 (15.2%) |
| 60 to 64 Years | 339 (6.7%) | 193 (3.8%) |
| 65 to 69 Years | 531 (10.5%) | 281 (5.6%) |
| 70 to 74 Years | 100 (2.0%) | 82 (1.6%) |
| 75 to 79 Years | 61 (1.2%) | 85 (1.7%) |
| 80 to 84 Years | 53 (1.1%) | 28 (0.5%) |
| 85 Years and over | 14 (0.3%) | 15 (0.3%) |
| Total | 5,064 (100.0%) | 5,066 (100.0%) |
Families and Households in Hobart
Median Family Size in Hobart
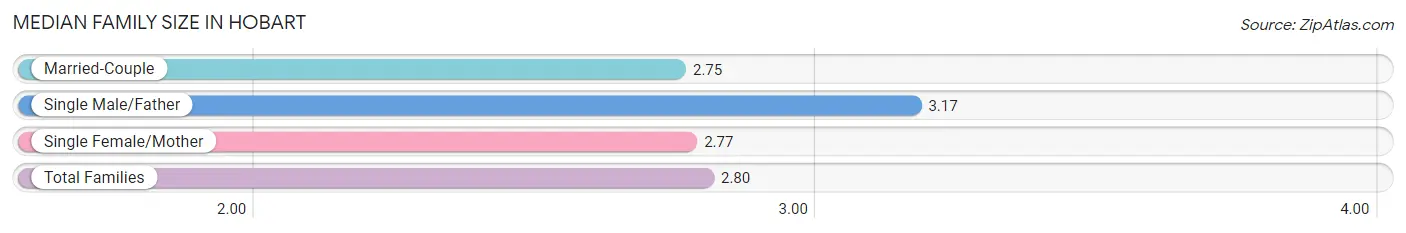
The median family size in Hobart is 2.80 persons per family, with single male/father families (367 | 12.7%) accounting for the largest median family size of 3.17 persons per family. On the other hand, married-couple families (2,233 | 77.4%) represent the smallest median family size with 2.75 persons per family.
| Family Type | # Families | Family Size |
| Married-Couple | 2,233 (77.4%) | 2.75 |
| Single Male/Father | 367 (12.7%) | 3.17 |
| Single Female/Mother | 283 (9.8%) | 2.77 |
| Total Families | 2,883 (100.0%) | 2.80 |
Median Household Size in Hobart
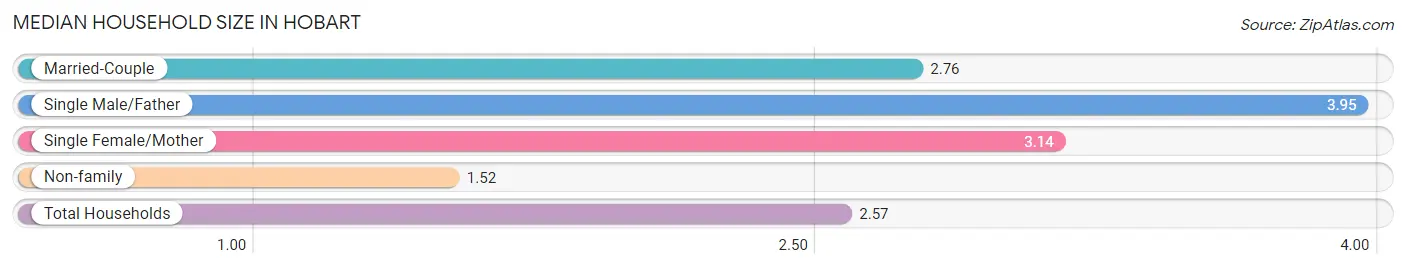
The median household size in Hobart is 2.57 persons per household, with single male/father households (367 | 9.3%) accounting for the largest median household size of 3.95 persons per household. non-family households (1,061 | 26.9%) represent the smallest median household size with 1.52 persons per household.
| Household Type | # Households | Household Size |
| Married-Couple | 2,233 (56.6%) | 2.76 |
| Single Male/Father | 367 (9.3%) | 3.95 |
| Single Female/Mother | 283 (7.2%) | 3.14 |
| Non-family | 1,061 (26.9%) | 1.52 |
| Total Households | 3,944 (100.0%) | 2.57 |
Household Size by Marriage Status in Hobart
Out of a total of 3,944 households in Hobart, 2,883 (73.1%) are family households, while 1,061 (26.9%) are nonfamily households. The most numerous type of family households are 2-person households, comprising 1,397, and the most common type of nonfamily households are 1-person households, comprising 598.
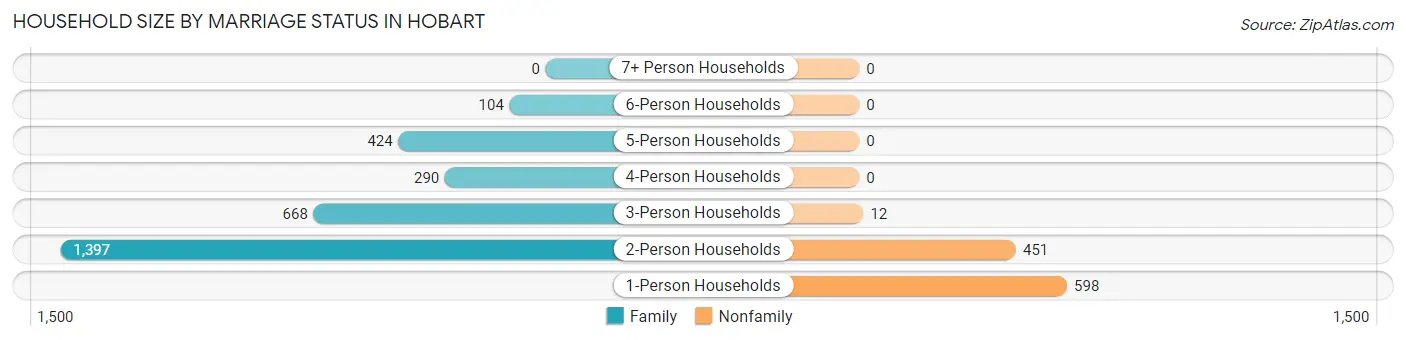
| Household Size | Family Households | Nonfamily Households |
| 1-Person Households | - | 598 (15.2%) |
| 2-Person Households | 1,397 (35.4%) | 451 (11.4%) |
| 3-Person Households | 668 (16.9%) | 12 (0.3%) |
| 4-Person Households | 290 (7.3%) | 0 (0.0%) |
| 5-Person Households | 424 (10.7%) | 0 (0.0%) |
| 6-Person Households | 104 (2.6%) | 0 (0.0%) |
| 7+ Person Households | 0 (0.0%) | 0 (0.0%) |
| Total | 2,883 (73.1%) | 1,061 (26.9%) |
Female Fertility in Hobart
Fertility by Age in Hobart
Average fertility rate in Hobart is 38.0 births per 1,000 women. Women in the age bracket of 20 to 34 years have the highest fertility rate with 60.0 births per 1,000 women. Women in the age bracket of 20 to 34 years acount for 87.4% of all women with births.
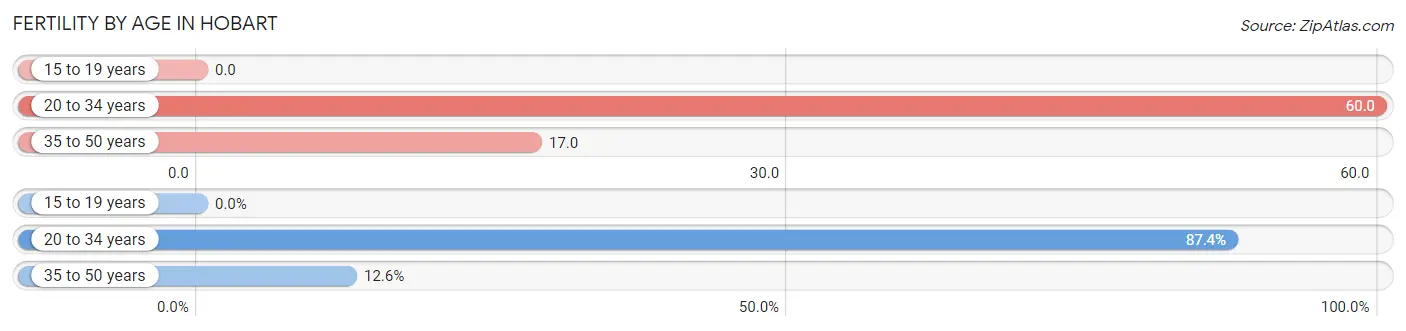
| Age Bracket | Women with Births | Births / 1,000 Women |
| 15 to 19 years | 0 (0.0%) | 0.0 |
| 20 to 34 years | 76 (87.4%) | 60.0 |
| 35 to 50 years | 11 (12.6%) | 17.0 |
| Total | 87 (100.0%) | 38.0 |
Fertility by Age by Marriage Status in Hobart
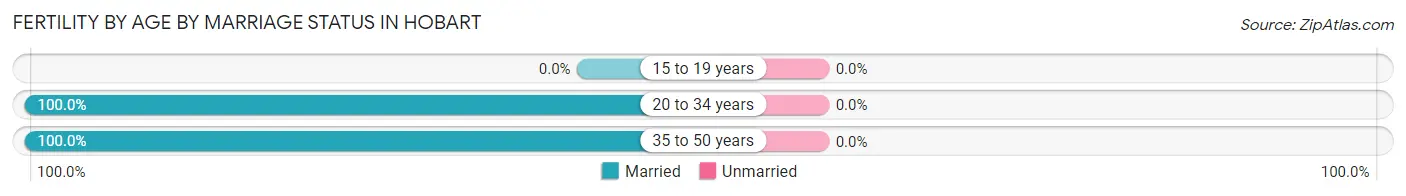
| Age Bracket | Married | Unmarried |
| 15 to 19 years | 0 (0.0%) | 0 (0.0%) |
| 20 to 34 years | 76 (100.0%) | 0 (0.0%) |
| 35 to 50 years | 11 (100.0%) | 0 (0.0%) |
| Total | 87 (100.0%) | 0 (0.0%) |
Fertility by Education in Hobart
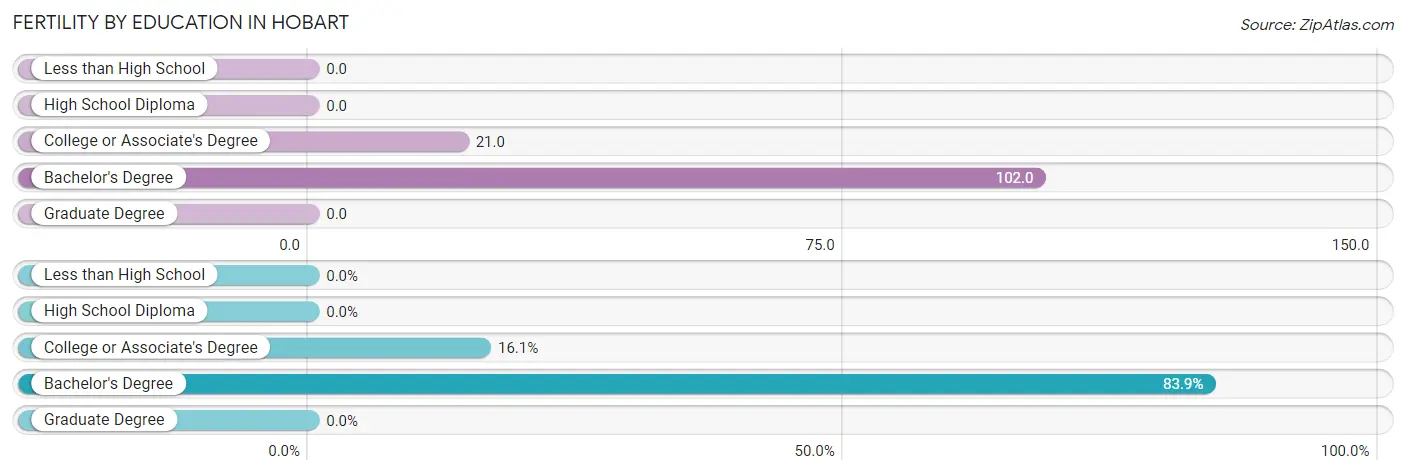
| Educational Attainment | Women with Births | Births / 1,000 Women |
| Less than High School | 0 (0.0%) | 0.0 |
| High School Diploma | 0 (0.0%) | 0.0 |
| College or Associate's Degree | 14 (16.1%) | 21.0 |
| Bachelor's Degree | 73 (83.9%) | 102.0 |
| Graduate Degree | 0 (0.0%) | 0.0 |
| Total | 87 (100.0%) | 38.0 |
Fertility by Education by Marriage Status in Hobart
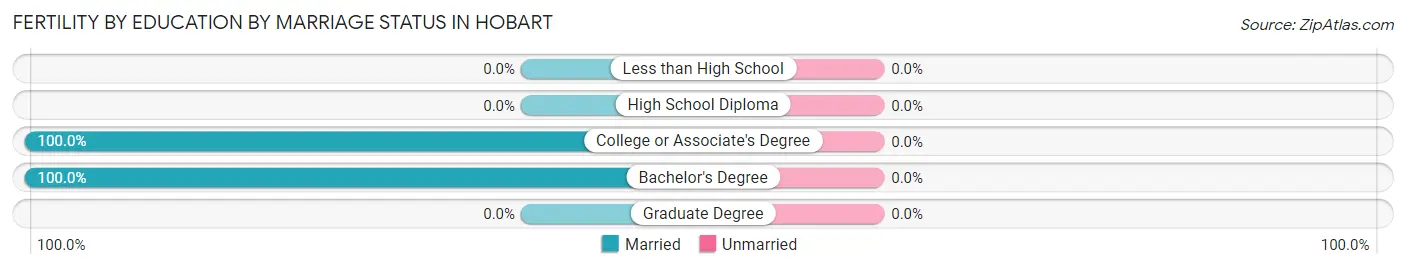
| Educational Attainment | Married | Unmarried |
| Less than High School | 0 (0.0%) | 0 (0.0%) |
| High School Diploma | 0 (0.0%) | 0 (0.0%) |
| College or Associate's Degree | 14 (100.0%) | 0 (0.0%) |
| Bachelor's Degree | 73 (100.0%) | 0 (0.0%) |
| Graduate Degree | 0 (0.0%) | 0 (0.0%) |
| Total | 87 (100.0%) | 0 (0.0%) |
Employment Characteristics in Hobart
Employment by Class of Employer in Hobart
Among the 5,968 employed individuals in Hobart, private company employees (4,290 | 71.9%), local government employees (522 | 8.7%), and not-for-profit organizations (480 | 8.0%) make up the most common classes of employment.
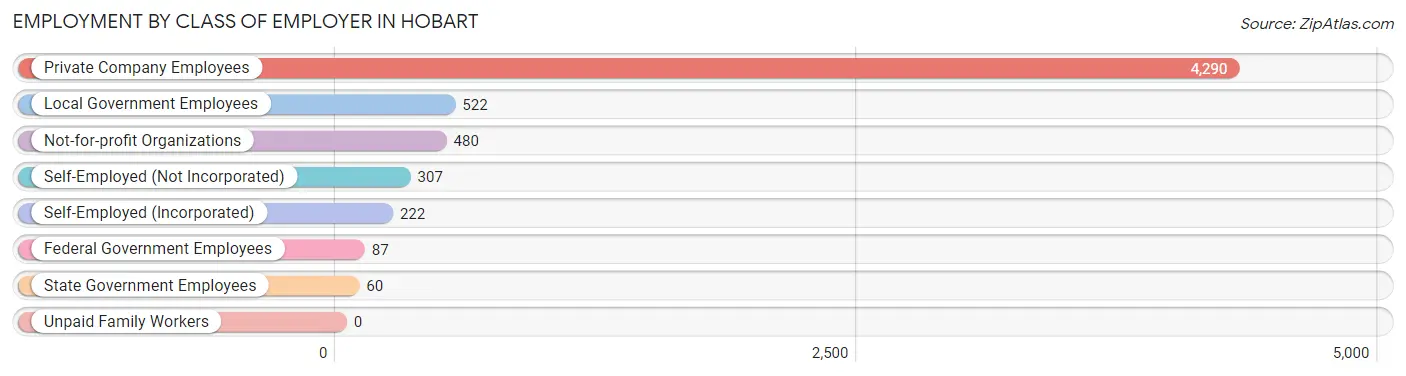
| Employer Class | # Employees | % Employees |
| Private Company Employees | 4,290 | 71.9% |
| Self-Employed (Incorporated) | 222 | 3.7% |
| Self-Employed (Not Incorporated) | 307 | 5.1% |
| Not-for-profit Organizations | 480 | 8.0% |
| Local Government Employees | 522 | 8.7% |
| State Government Employees | 60 | 1.0% |
| Federal Government Employees | 87 | 1.5% |
| Unpaid Family Workers | 0 | 0.0% |
| Total | 5,968 | 100.0% |
Employment Status by Age in Hobart
According to the labor force statistics for Hobart, out of the total population over 16 years of age (8,356), 71.5% or 5,975 individuals are in the labor force, with 0.2% or 12 of them unemployed. The age group with the highest labor force participation rate is 25 to 29 years, with 100.0% or 636 individuals in the labor force. Within the labor force, the 16 to 19 years age range has the highest percentage of unemployed individuals, with 4.0% or 9 of them being unemployed.
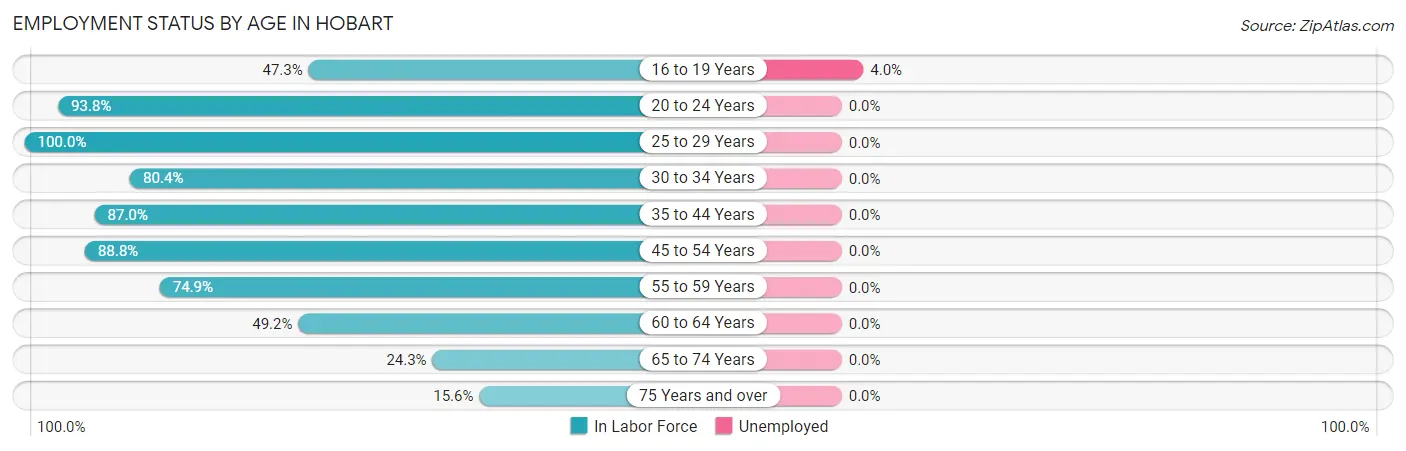
| Age Bracket | In Labor Force | Unemployed |
| 16 to 19 Years | 224 (47.3%) | 9 (4.0%) |
| 20 to 24 Years | 792 (93.8%) | 0 (0.0%) |
| 25 to 29 Years | 636 (100.0%) | 0 (0.0%) |
| 30 to 34 Years | 596 (80.4%) | 0 (0.0%) |
| 35 to 44 Years | 1,188 (87.0%) | 0 (0.0%) |
| 45 to 54 Years | 734 (88.8%) | 0 (0.0%) |
| 55 to 59 Years | 1,264 (74.9%) | 0 (0.0%) |
| 60 to 64 Years | 262 (49.2%) | 0 (0.0%) |
| 65 to 74 Years | 242 (24.3%) | 0 (0.0%) |
| 75 Years and over | 40 (15.6%) | 0 (0.0%) |
| Total | 5,975 (71.5%) | 12 (0.2%) |
Employment Status by Educational Attainment in Hobart
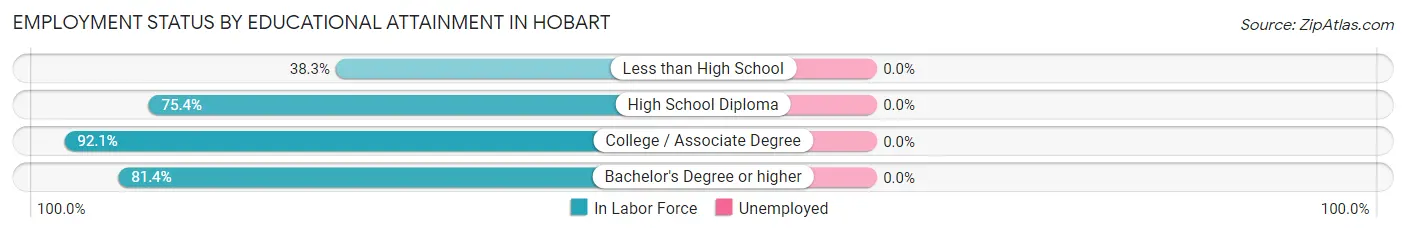
| Educational Attainment | In Labor Force | Unemployed |
| Less than High School | 130 (38.3%) | 0 (0.0%) |
| High School Diploma | 746 (75.4%) | 0 (0.0%) |
| College / Associate Degree | 1,489 (92.1%) | 0 (0.0%) |
| Bachelor's Degree or higher | 2,313 (81.4%) | 0 (0.0%) |
| Total | 4,677 (80.8%) | 0 (0.0%) |
Employment Occupations by Sex in Hobart
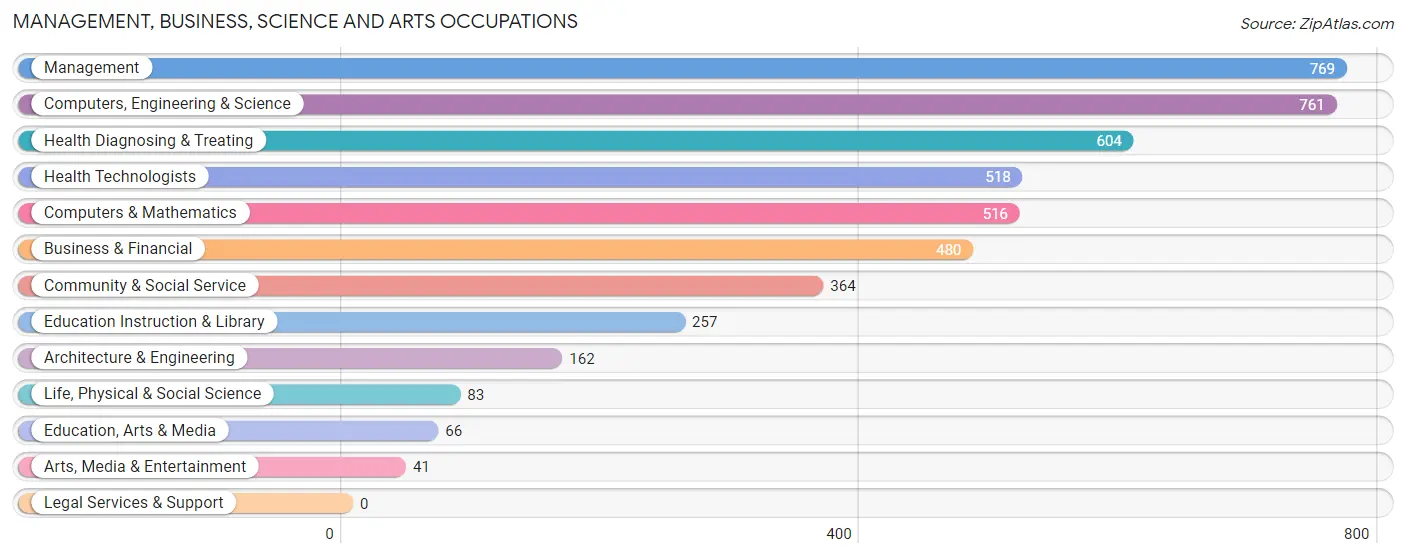
Management, Business, Science and Arts Occupations
The most common Management, Business, Science and Arts occupations in Hobart are Management (769 | 12.9%), Computers, Engineering & Science (761 | 12.8%), Health Diagnosing & Treating (604 | 10.1%), Health Technologists (518 | 8.7%), and Computers & Mathematics (516 | 8.6%).
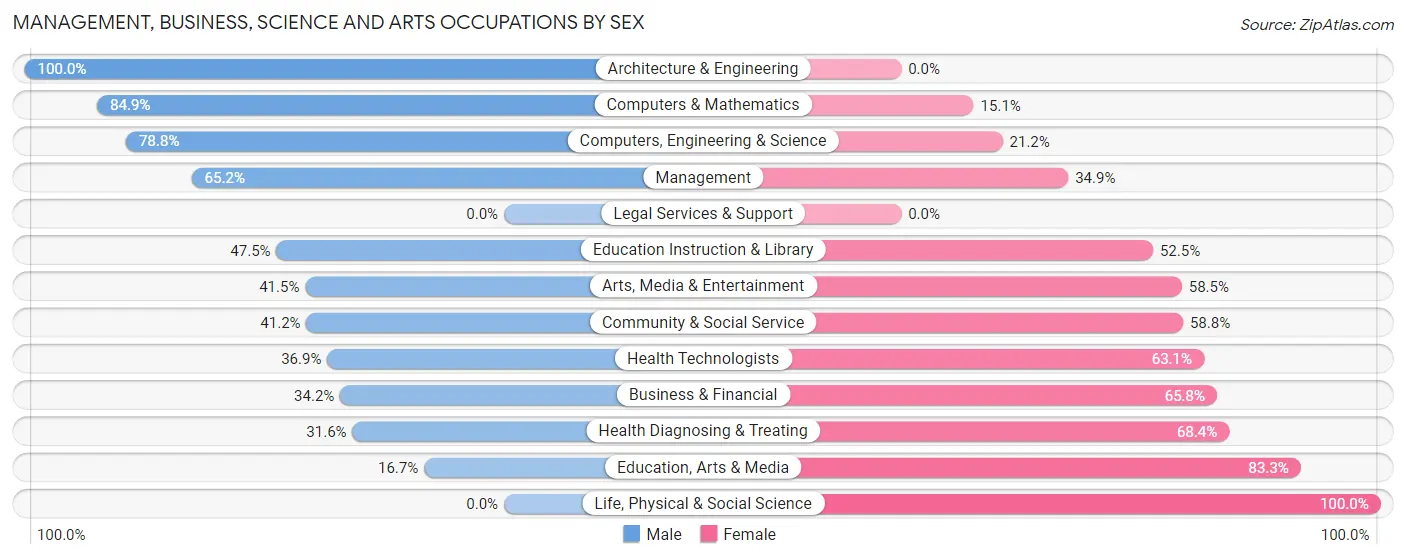
Management, Business, Science and Arts Occupations by Sex
Within the Management, Business, Science and Arts occupations in Hobart, the most male-oriented occupations are Architecture & Engineering (100.0%), Computers & Mathematics (84.9%), and Computers, Engineering & Science (78.8%), while the most female-oriented occupations are Life, Physical & Social Science (100.0%), Education, Arts & Media (83.3%), and Health Diagnosing & Treating (68.4%).
| Occupation | Male | Female |
| Management | 501 (65.1%) | 268 (34.8%) |
| Business & Financial | 164 (34.2%) | 316 (65.8%) |
| Computers, Engineering & Science | 600 (78.8%) | 161 (21.2%) |
| Computers & Mathematics | 438 (84.9%) | 78 (15.1%) |
| Architecture & Engineering | 162 (100.0%) | 0 (0.0%) |
| Life, Physical & Social Science | 0 (0.0%) | 83 (100.0%) |
| Community & Social Service | 150 (41.2%) | 214 (58.8%) |
| Education, Arts & Media | 11 (16.7%) | 55 (83.3%) |
| Legal Services & Support | 0 (0.0%) | 0 (0.0%) |
| Education Instruction & Library | 122 (47.5%) | 135 (52.5%) |
| Arts, Media & Entertainment | 17 (41.5%) | 24 (58.5%) |
| Health Diagnosing & Treating | 191 (31.6%) | 413 (68.4%) |
| Health Technologists | 191 (36.9%) | 327 (63.1%) |
| Total (Category) | 1,606 (53.9%) | 1,372 (46.1%) |
| Total (Overall) | 3,054 (51.2%) | 2,914 (48.8%) |
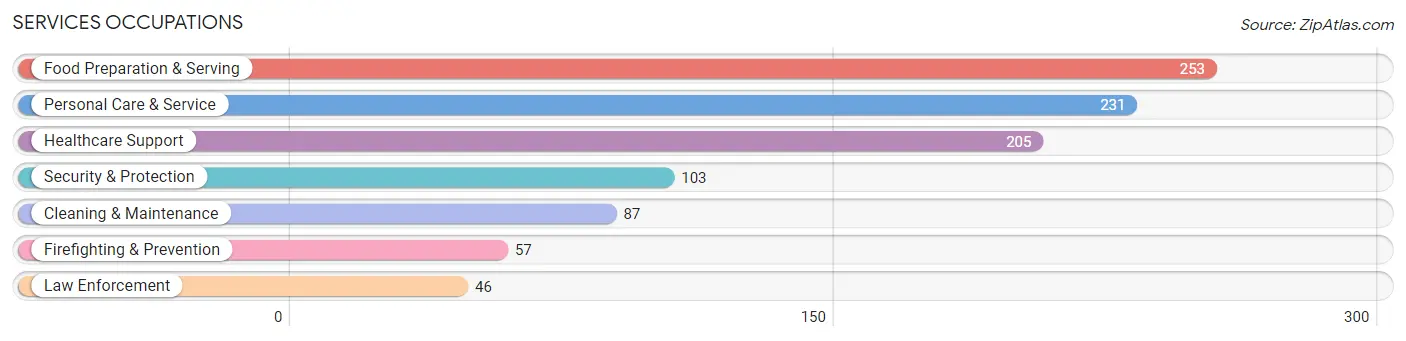
Services Occupations
The most common Services occupations in Hobart are Food Preparation & Serving (253 | 4.2%), Personal Care & Service (231 | 3.9%), Healthcare Support (205 | 3.4%), Security & Protection (103 | 1.7%), and Cleaning & Maintenance (87 | 1.5%).
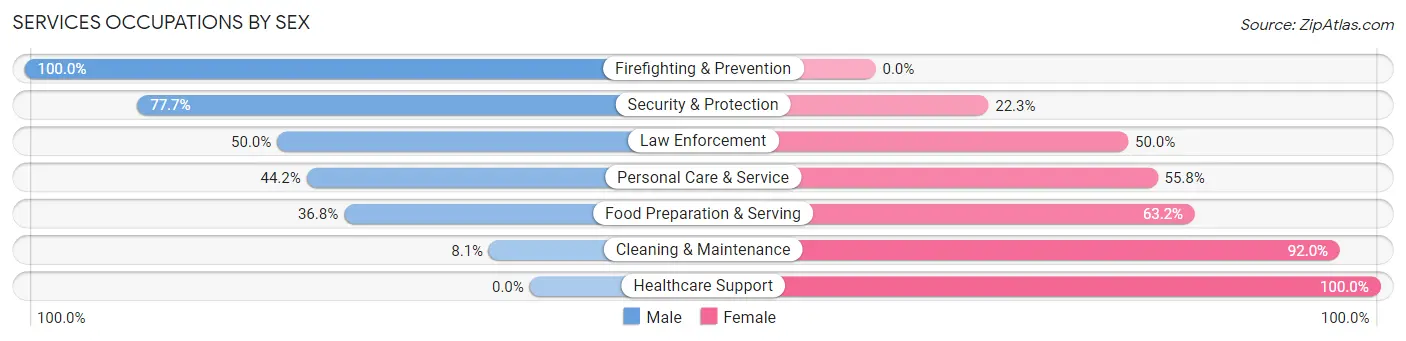
Services Occupations by Sex
Within the Services occupations in Hobart, the most male-oriented occupations are Firefighting & Prevention (100.0%), Security & Protection (77.7%), and Law Enforcement (50.0%), while the most female-oriented occupations are Healthcare Support (100.0%), Cleaning & Maintenance (91.9%), and Food Preparation & Serving (63.2%).
| Occupation | Male | Female |
| Healthcare Support | 0 (0.0%) | 205 (100.0%) |
| Security & Protection | 80 (77.7%) | 23 (22.3%) |
| Firefighting & Prevention | 57 (100.0%) | 0 (0.0%) |
| Law Enforcement | 23 (50.0%) | 23 (50.0%) |
| Food Preparation & Serving | 93 (36.8%) | 160 (63.2%) |
| Cleaning & Maintenance | 7 (8.1%) | 80 (91.9%) |
| Personal Care & Service | 102 (44.2%) | 129 (55.8%) |
| Total (Category) | 282 (32.1%) | 597 (67.9%) |
| Total (Overall) | 3,054 (51.2%) | 2,914 (48.8%) |
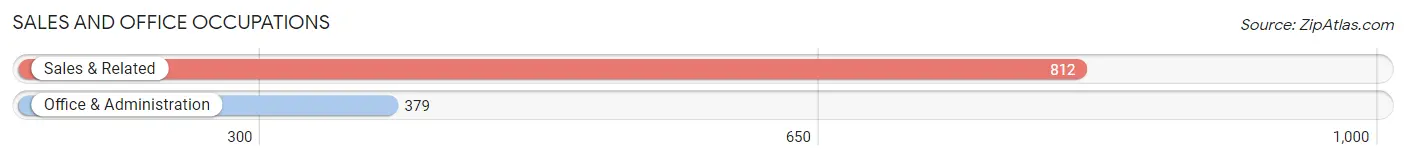
Sales and Office Occupations
The most common Sales and Office occupations in Hobart are Sales & Related (812 | 13.6%), and Office & Administration (379 | 6.4%).
Sales and Office Occupations by Sex
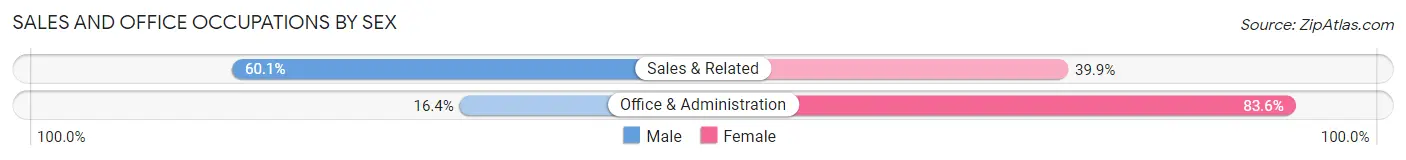
| Occupation | Male | Female |
| Sales & Related | 488 (60.1%) | 324 (39.9%) |
| Office & Administration | 62 (16.4%) | 317 (83.6%) |
| Total (Category) | 550 (46.2%) | 641 (53.8%) |
| Total (Overall) | 3,054 (51.2%) | 2,914 (48.8%) |
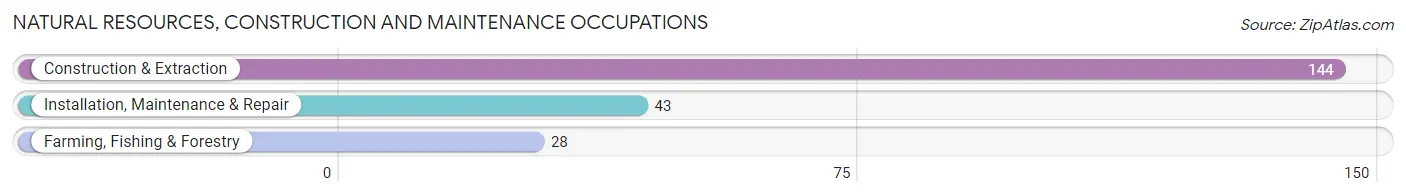
Natural Resources, Construction and Maintenance Occupations
The most common Natural Resources, Construction and Maintenance occupations in Hobart are Construction & Extraction (144 | 2.4%), Installation, Maintenance & Repair (43 | 0.7%), and Farming, Fishing & Forestry (28 | 0.5%).
Natural Resources, Construction and Maintenance Occupations by Sex
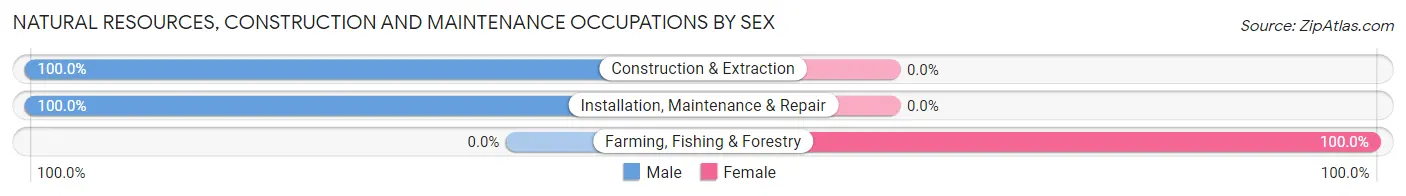
| Occupation | Male | Female |
| Farming, Fishing & Forestry | 0 (0.0%) | 28 (100.0%) |
| Construction & Extraction | 144 (100.0%) | 0 (0.0%) |
| Installation, Maintenance & Repair | 43 (100.0%) | 0 (0.0%) |
| Total (Category) | 187 (87.0%) | 28 (13.0%) |
| Total (Overall) | 3,054 (51.2%) | 2,914 (48.8%) |
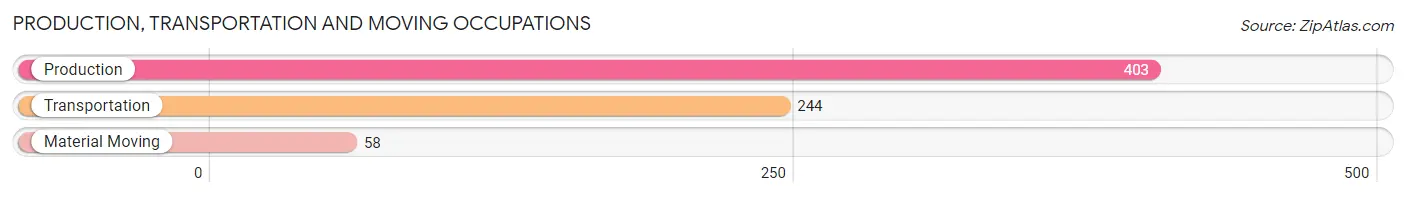
Production, Transportation and Moving Occupations
The most common Production, Transportation and Moving occupations in Hobart are Production (403 | 6.8%), Transportation (244 | 4.1%), and Material Moving (58 | 1.0%).
Production, Transportation and Moving Occupations by Sex
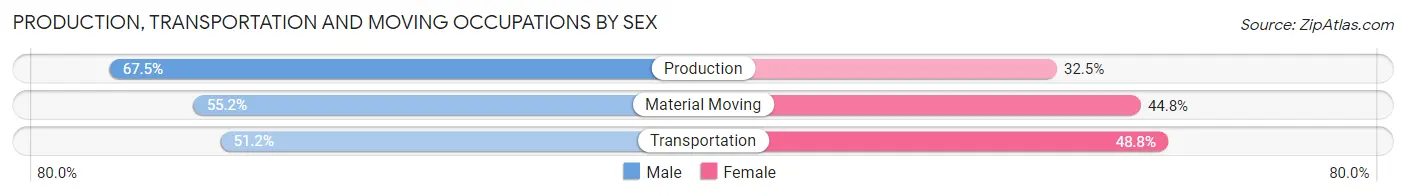
| Occupation | Male | Female |
| Production | 272 (67.5%) | 131 (32.5%) |
| Transportation | 125 (51.2%) | 119 (48.8%) |
| Material Moving | 32 (55.2%) | 26 (44.8%) |
| Total (Category) | 429 (60.9%) | 276 (39.2%) |
| Total (Overall) | 3,054 (51.2%) | 2,914 (48.8%) |
Employment Industries by Sex in Hobart
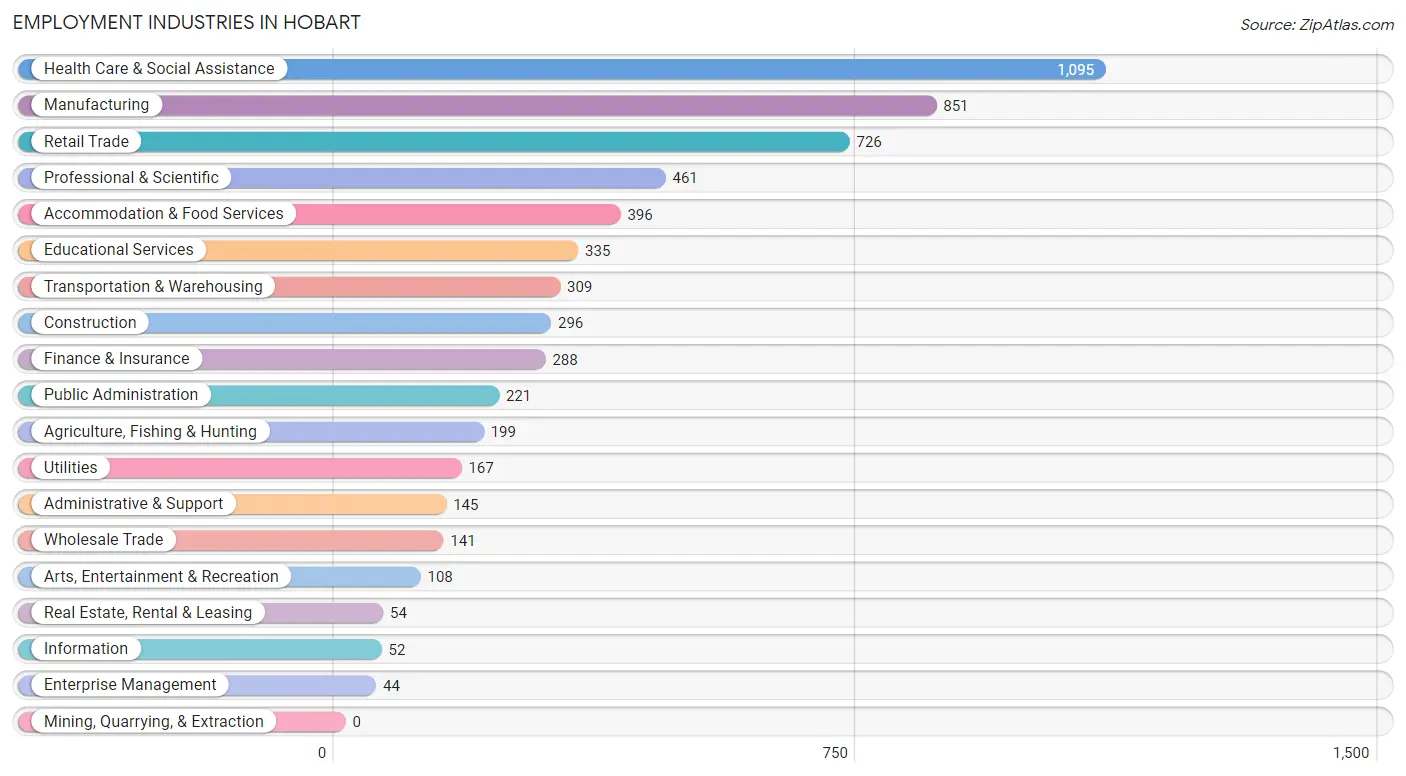
Employment Industries in Hobart
The major employment industries in Hobart include Health Care & Social Assistance (1,095 | 18.3%), Manufacturing (851 | 14.3%), Retail Trade (726 | 12.2%), Professional & Scientific (461 | 7.7%), and Accommodation & Food Services (396 | 6.6%).
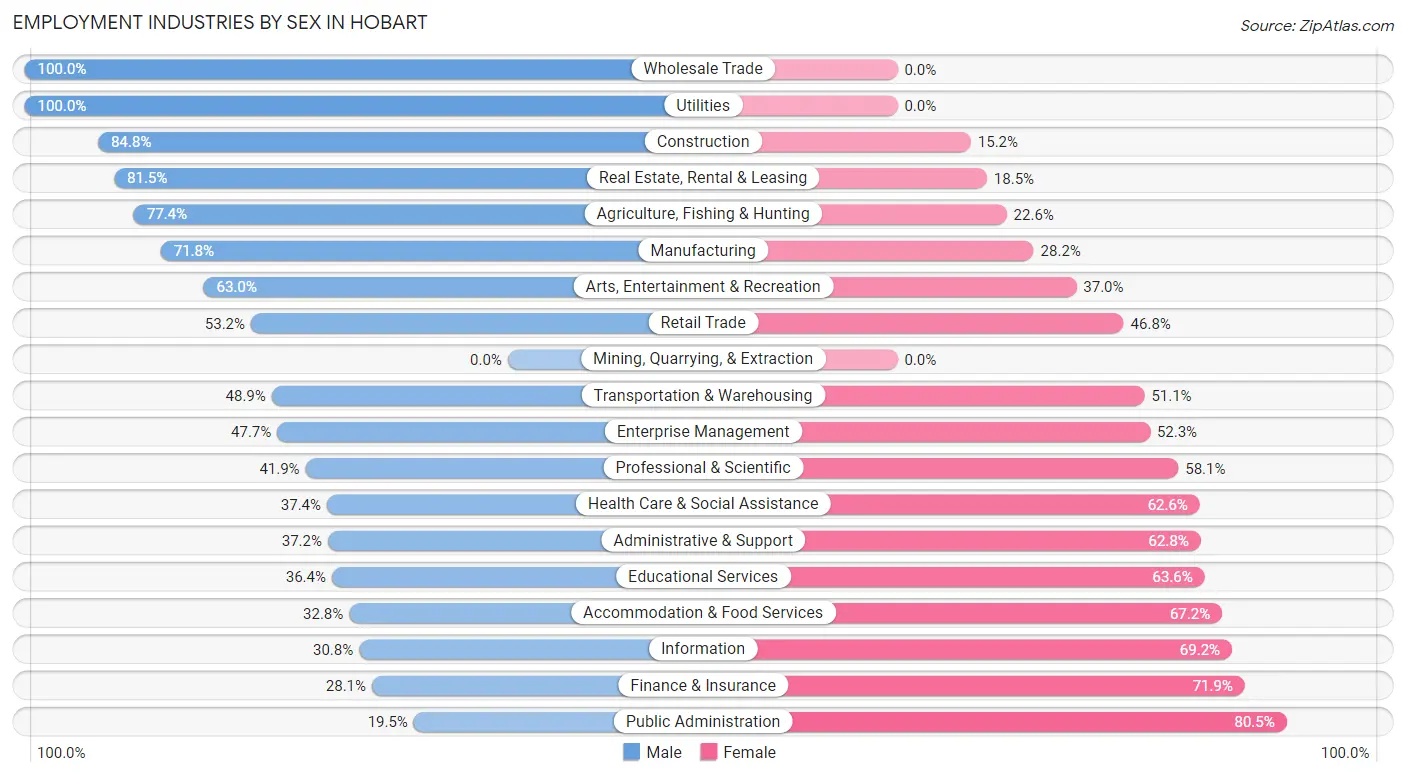
Employment Industries by Sex in Hobart
The Hobart industries that see more men than women are Wholesale Trade (100.0%), Utilities (100.0%), and Construction (84.8%), whereas the industries that tend to have a higher number of women are Public Administration (80.5%), Finance & Insurance (71.9%), and Information (69.2%).
| Industry | Male | Female |
| Agriculture, Fishing & Hunting | 154 (77.4%) | 45 (22.6%) |
| Mining, Quarrying, & Extraction | 0 (0.0%) | 0 (0.0%) |
| Construction | 251 (84.8%) | 45 (15.2%) |
| Manufacturing | 611 (71.8%) | 240 (28.2%) |
| Wholesale Trade | 141 (100.0%) | 0 (0.0%) |
| Retail Trade | 386 (53.2%) | 340 (46.8%) |
| Transportation & Warehousing | 151 (48.9%) | 158 (51.1%) |
| Utilities | 167 (100.0%) | 0 (0.0%) |
| Information | 16 (30.8%) | 36 (69.2%) |
| Finance & Insurance | 81 (28.1%) | 207 (71.9%) |
| Real Estate, Rental & Leasing | 44 (81.5%) | 10 (18.5%) |
| Professional & Scientific | 193 (41.9%) | 268 (58.1%) |
| Enterprise Management | 21 (47.7%) | 23 (52.3%) |
| Administrative & Support | 54 (37.2%) | 91 (62.8%) |
| Educational Services | 122 (36.4%) | 213 (63.6%) |
| Health Care & Social Assistance | 410 (37.4%) | 685 (62.6%) |
| Arts, Entertainment & Recreation | 68 (63.0%) | 40 (37.0%) |
| Accommodation & Food Services | 130 (32.8%) | 266 (67.2%) |
| Public Administration | 43 (19.5%) | 178 (80.5%) |
| Total | 3,054 (51.2%) | 2,914 (48.8%) |
Education in Hobart
School Enrollment in Hobart
The most common levels of schooling among the 2,270 students in Hobart are college / undergraduate (581 | 25.6%), high school (426 | 18.8%), and elementary school (359 | 15.8%).
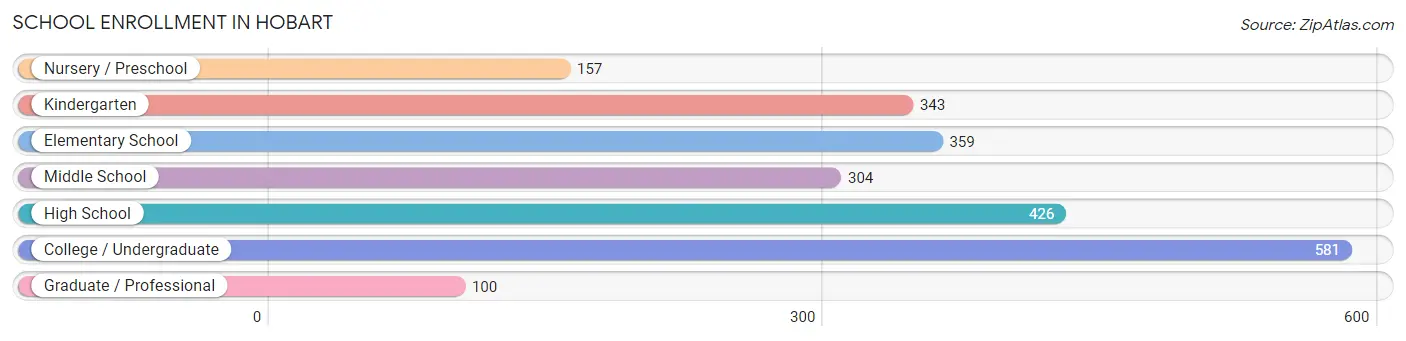
| School Level | # Students | % Students |
| Nursery / Preschool | 157 | 6.9% |
| Kindergarten | 343 | 15.1% |
| Elementary School | 359 | 15.8% |
| Middle School | 304 | 13.4% |
| High School | 426 | 18.8% |
| College / Undergraduate | 581 | 25.6% |
| Graduate / Professional | 100 | 4.4% |
| Total | 2,270 | 100.0% |
School Enrollment by Age by Funding Source in Hobart
Out of a total of 2,270 students who are enrolled in schools in Hobart, 325 (14.3%) attend a private institution, while the remaining 1,945 (85.7%) are enrolled in public schools. The age group of 18 to 19 year olds has the highest likelihood of being enrolled in private schools, with 103 (56.0% in the age bracket) enrolled. Conversely, the age group of 20 to 24 year olds has the lowest likelihood of being enrolled in a private school, with 258 (100.0% in the age bracket) attending a public institution.
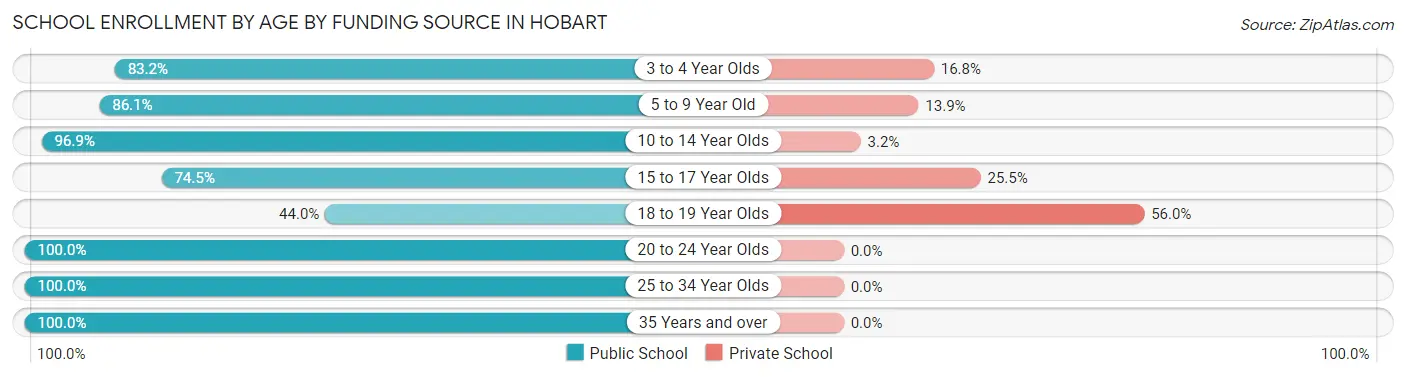
| Age Bracket | Public School | Private School |
| 3 to 4 Year Olds | 109 (83.2%) | 22 (16.8%) |
| 5 to 9 Year Old | 606 (86.1%) | 98 (13.9%) |
| 10 to 14 Year Olds | 338 (96.9%) | 11 (3.2%) |
| 15 to 17 Year Olds | 263 (74.5%) | 90 (25.5%) |
| 18 to 19 Year Olds | 81 (44.0%) | 103 (56.0%) |
| 20 to 24 Year Olds | 258 (100.0%) | 0 (0.0%) |
| 25 to 34 Year Olds | 176 (100.0%) | 0 (0.0%) |
| 35 Years and over | 115 (100.0%) | 0 (0.0%) |
| Total | 1,945 (85.7%) | 325 (14.3%) |
Educational Attainment by Field of Study in Hobart
Business (818 | 24.2%), science & technology (447 | 13.3%), engineering (386 | 11.4%), education (343 | 10.2%), and psychology (332 | 9.8%) are the most common fields of study among 3,374 individuals in Hobart who have obtained a bachelor's degree or higher.
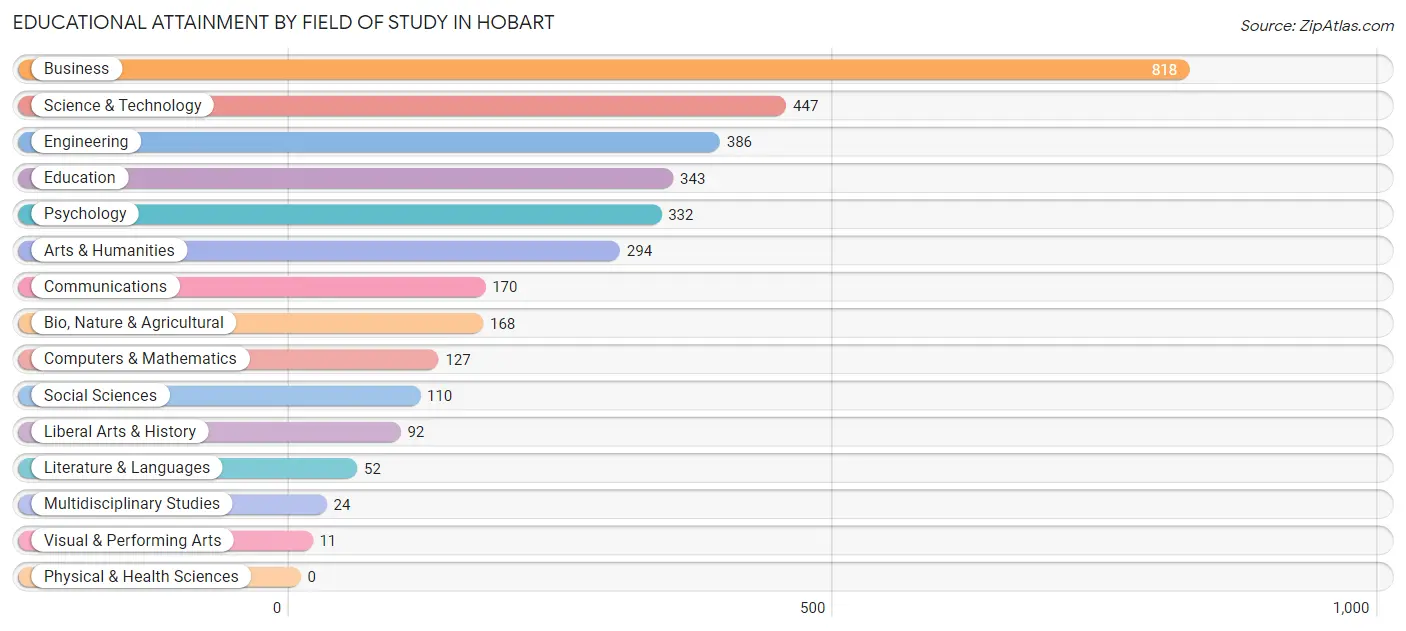
| Field of Study | # Graduates | % Graduates |
| Computers & Mathematics | 127 | 3.8% |
| Bio, Nature & Agricultural | 168 | 5.0% |
| Physical & Health Sciences | 0 | 0.0% |
| Psychology | 332 | 9.8% |
| Social Sciences | 110 | 3.3% |
| Engineering | 386 | 11.4% |
| Multidisciplinary Studies | 24 | 0.7% |
| Science & Technology | 447 | 13.3% |
| Business | 818 | 24.2% |
| Education | 343 | 10.2% |
| Literature & Languages | 52 | 1.5% |
| Liberal Arts & History | 92 | 2.7% |
| Visual & Performing Arts | 11 | 0.3% |
| Communications | 170 | 5.0% |
| Arts & Humanities | 294 | 8.7% |
| Total | 3,374 | 100.0% |
Transportation & Commute in Hobart
Vehicle Availability by Sex in Hobart
The most prevalent vehicle ownership categories in Hobart are males with 2 vehicles (1,459, accounting for 47.8%) and females with 2 vehicles (1,379, making up 50.1%).
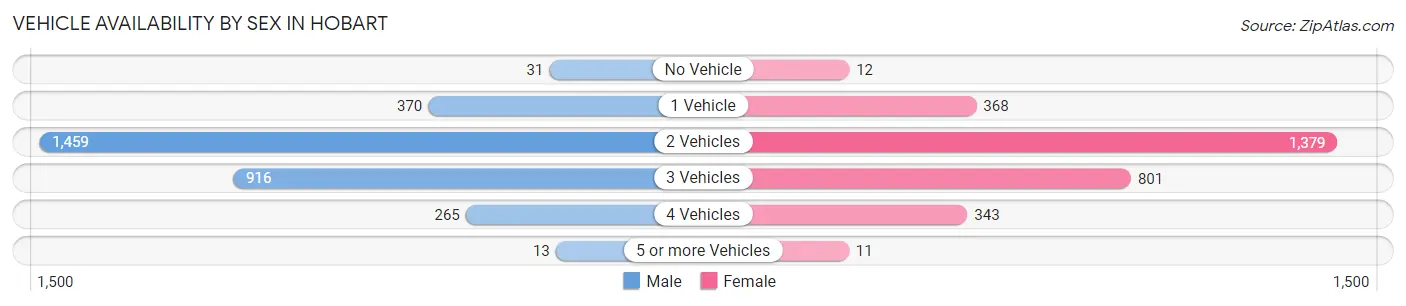
| Vehicles Available | Male | Female |
| No Vehicle | 31 (1.0%) | 12 (0.4%) |
| 1 Vehicle | 370 (12.1%) | 368 (12.6%) |
| 2 Vehicles | 1,459 (47.8%) | 1,379 (47.3%) |
| 3 Vehicles | 916 (30.0%) | 801 (27.5%) |
| 4 Vehicles | 265 (8.7%) | 343 (11.8%) |
| 5 or more Vehicles | 13 (0.4%) | 11 (0.4%) |
| Total | 3,054 (100.0%) | 2,914 (100.0%) |
Commute Time in Hobart
The most frequently occuring commute durations in Hobart are 15 to 19 minutes (1,424 commuters, 28.7%), 10 to 14 minutes (1,080 commuters, 21.8%), and 20 to 24 minutes (975 commuters, 19.7%).
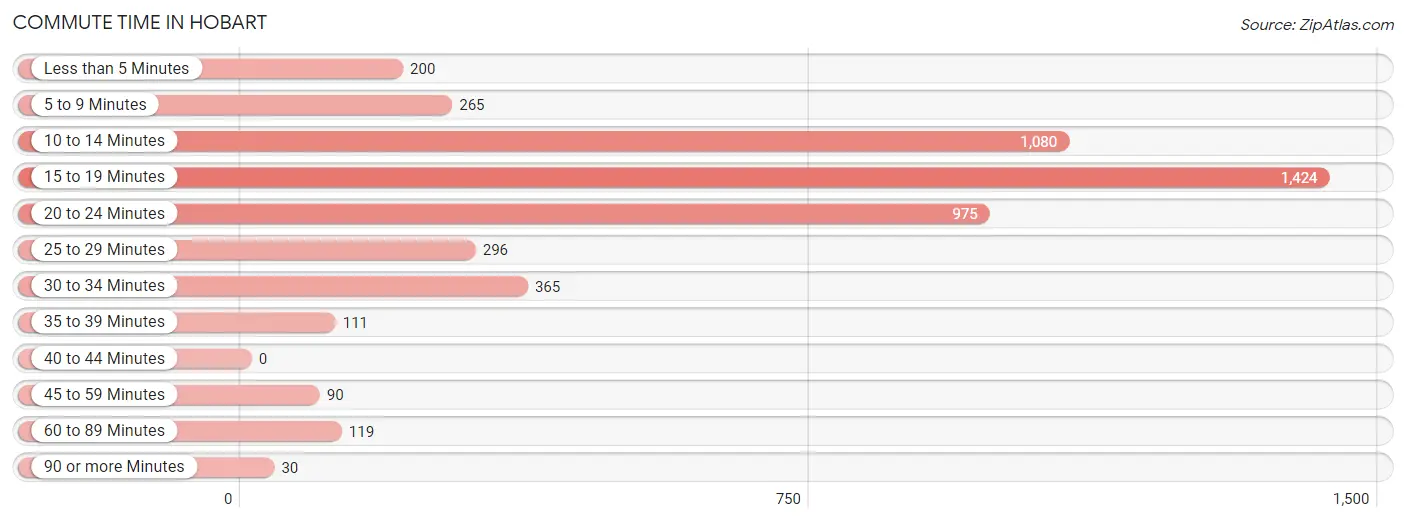
| Commute Time | # Commuters | % Commuters |
| Less than 5 Minutes | 200 | 4.0% |
| 5 to 9 Minutes | 265 | 5.3% |
| 10 to 14 Minutes | 1,080 | 21.8% |
| 15 to 19 Minutes | 1,424 | 28.7% |
| 20 to 24 Minutes | 975 | 19.7% |
| 25 to 29 Minutes | 296 | 6.0% |
| 30 to 34 Minutes | 365 | 7.4% |
| 35 to 39 Minutes | 111 | 2.2% |
| 40 to 44 Minutes | 0 | 0.0% |
| 45 to 59 Minutes | 90 | 1.8% |
| 60 to 89 Minutes | 119 | 2.4% |
| 90 or more Minutes | 30 | 0.6% |
Commute Time by Sex in Hobart
The most common commute times in Hobart are 15 to 19 minutes (838 commuters, 32.6%) for males and 10 to 14 minutes (690 commuters, 29.0%) for females.
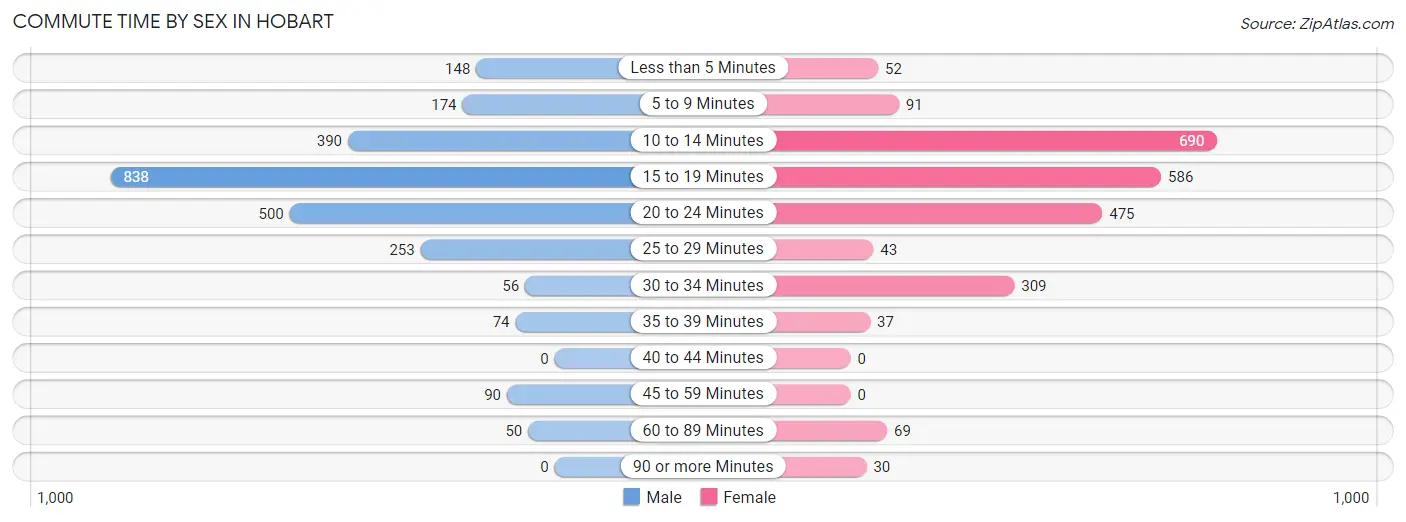
| Commute Time | Male | Female |
| Less than 5 Minutes | 148 (5.8%) | 52 (2.2%) |
| 5 to 9 Minutes | 174 (6.8%) | 91 (3.8%) |
| 10 to 14 Minutes | 390 (15.2%) | 690 (29.0%) |
| 15 to 19 Minutes | 838 (32.6%) | 586 (24.6%) |
| 20 to 24 Minutes | 500 (19.4%) | 475 (19.9%) |
| 25 to 29 Minutes | 253 (9.8%) | 43 (1.8%) |
| 30 to 34 Minutes | 56 (2.2%) | 309 (13.0%) |
| 35 to 39 Minutes | 74 (2.9%) | 37 (1.5%) |
| 40 to 44 Minutes | 0 (0.0%) | 0 (0.0%) |
| 45 to 59 Minutes | 90 (3.5%) | 0 (0.0%) |
| 60 to 89 Minutes | 50 (1.9%) | 69 (2.9%) |
| 90 or more Minutes | 0 (0.0%) | 30 (1.3%) |
Time of Departure to Work by Sex in Hobart
The most frequent times of departure to work in Hobart are 7:00 AM to 7:29 AM (643, 25.0%) for males and 7:30 AM to 7:59 AM (569, 23.9%) for females.
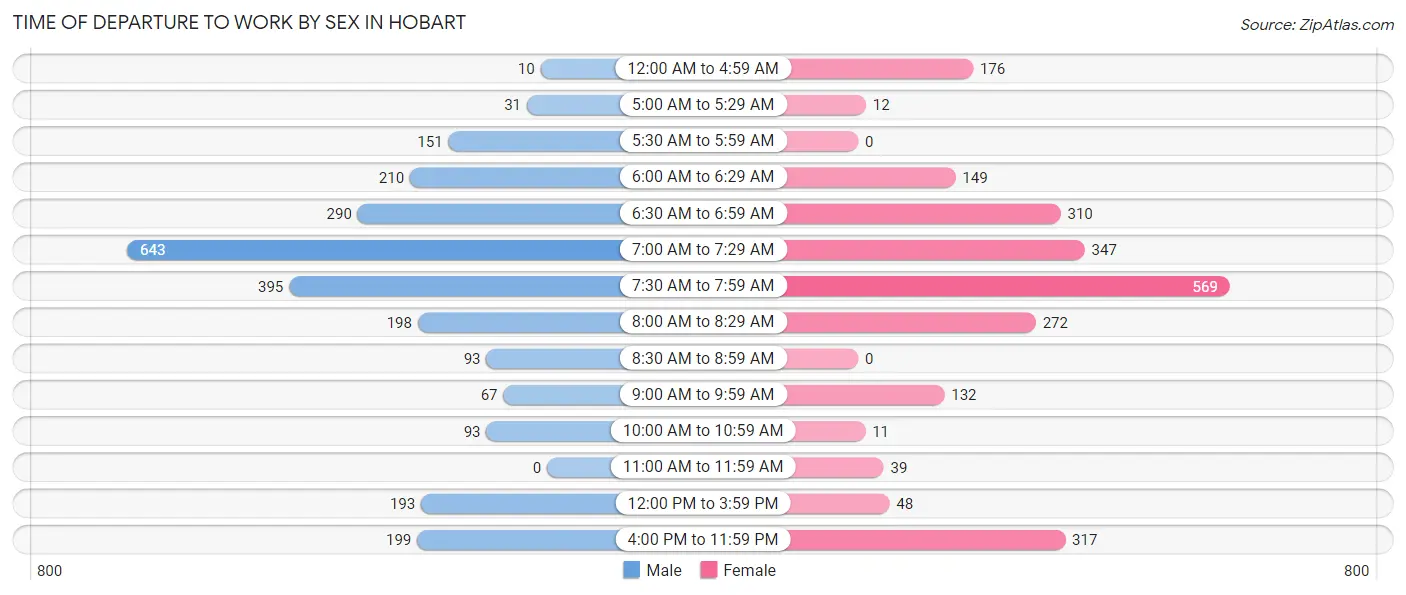
| Time of Departure | Male | Female |
| 12:00 AM to 4:59 AM | 10 (0.4%) | 176 (7.4%) |
| 5:00 AM to 5:29 AM | 31 (1.2%) | 12 (0.5%) |
| 5:30 AM to 5:59 AM | 151 (5.9%) | 0 (0.0%) |
| 6:00 AM to 6:29 AM | 210 (8.2%) | 149 (6.3%) |
| 6:30 AM to 6:59 AM | 290 (11.3%) | 310 (13.0%) |
| 7:00 AM to 7:29 AM | 643 (25.0%) | 347 (14.6%) |
| 7:30 AM to 7:59 AM | 395 (15.3%) | 569 (23.9%) |
| 8:00 AM to 8:29 AM | 198 (7.7%) | 272 (11.4%) |
| 8:30 AM to 8:59 AM | 93 (3.6%) | 0 (0.0%) |
| 9:00 AM to 9:59 AM | 67 (2.6%) | 132 (5.5%) |
| 10:00 AM to 10:59 AM | 93 (3.6%) | 11 (0.5%) |
| 11:00 AM to 11:59 AM | 0 (0.0%) | 39 (1.6%) |
| 12:00 PM to 3:59 PM | 193 (7.5%) | 48 (2.0%) |
| 4:00 PM to 11:59 PM | 199 (7.7%) | 317 (13.3%) |
| Total | 2,573 (100.0%) | 2,382 (100.0%) |
Housing Occupancy in Hobart
Occupancy by Ownership in Hobart
Of the total 3,944 dwellings in Hobart, owner-occupied units account for 2,590 (65.7%), while renter-occupied units make up 1,354 (34.3%).
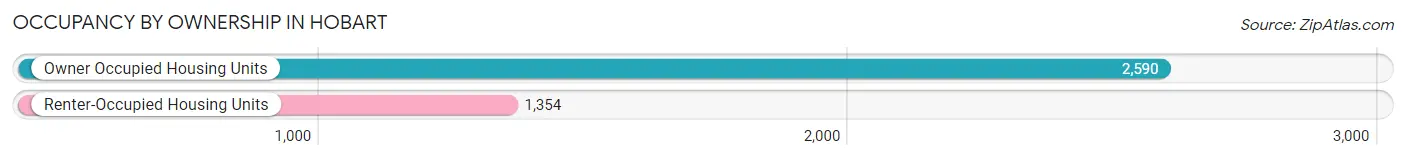
| Occupancy | # Housing Units | % Housing Units |
| Owner Occupied Housing Units | 2,590 | 65.7% |
| Renter-Occupied Housing Units | 1,354 | 34.3% |
| Total Occupied Housing Units | 3,944 | 100.0% |
Occupancy by Household Size in Hobart
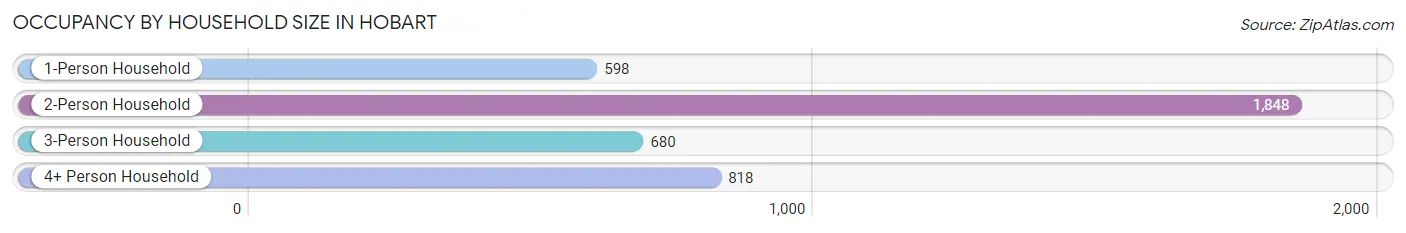
| Household Size | # Housing Units | % Housing Units |
| 1-Person Household | 598 | 15.2% |
| 2-Person Household | 1,848 | 46.9% |
| 3-Person Household | 680 | 17.2% |
| 4+ Person Household | 818 | 20.7% |
| Total Housing Units | 3,944 | 100.0% |
Occupancy by Ownership by Household Size in Hobart
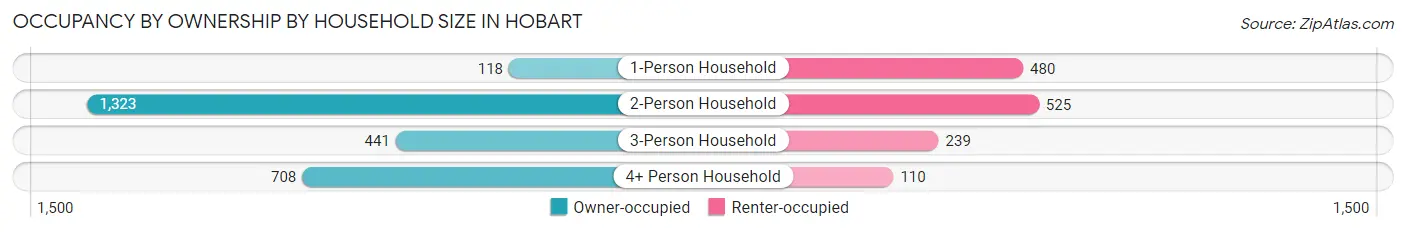
| Household Size | Owner-occupied | Renter-occupied |
| 1-Person Household | 118 (19.7%) | 480 (80.3%) |
| 2-Person Household | 1,323 (71.6%) | 525 (28.4%) |
| 3-Person Household | 441 (64.8%) | 239 (35.1%) |
| 4+ Person Household | 708 (86.6%) | 110 (13.5%) |
| Total Housing Units | 2,590 (65.7%) | 1,354 (34.3%) |
Occupancy by Educational Attainment in Hobart
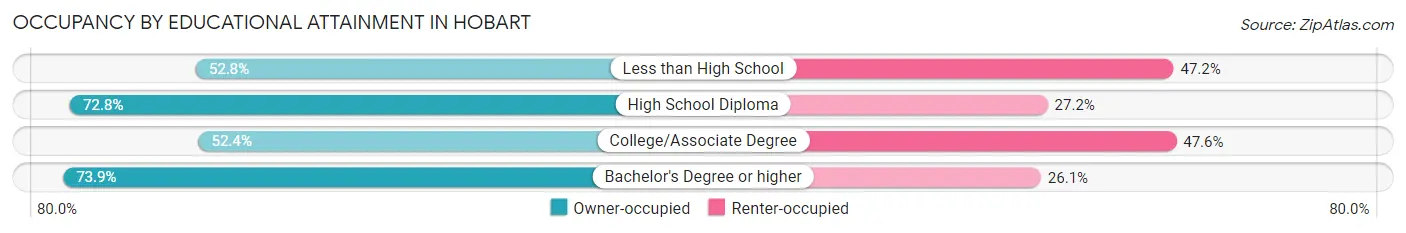
| Household Size | Owner-occupied | Renter-occupied |
| Less than High School | 84 (52.8%) | 75 (47.2%) |
| High School Diploma | 273 (72.8%) | 102 (27.2%) |
| College/Associate Degree | 698 (52.4%) | 634 (47.6%) |
| Bachelor's Degree or higher | 1,535 (73.9%) | 543 (26.1%) |
Occupancy by Age of Householder in Hobart
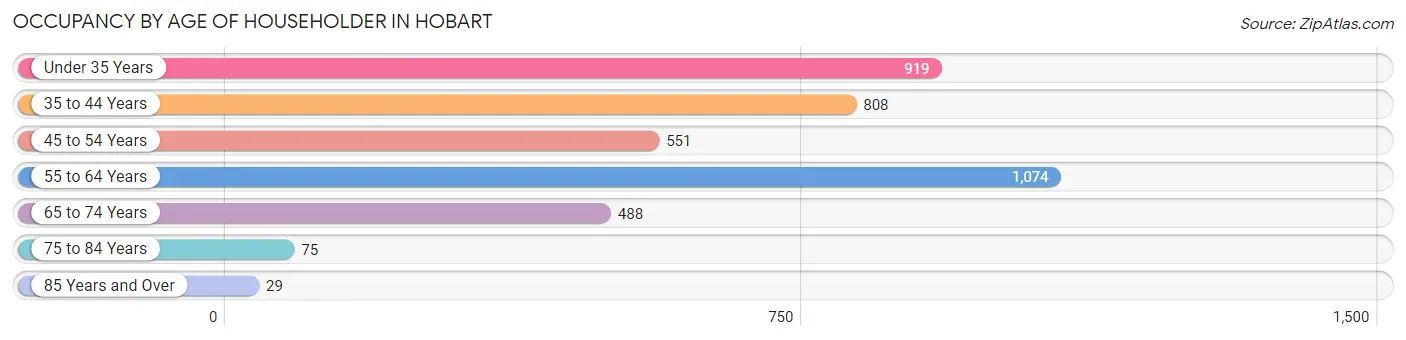
| Age Bracket | # Households | % Households |
| Under 35 Years | 919 | 23.3% |
| 35 to 44 Years | 808 | 20.5% |
| 45 to 54 Years | 551 | 14.0% |
| 55 to 64 Years | 1,074 | 27.2% |
| 65 to 74 Years | 488 | 12.4% |
| 75 to 84 Years | 75 | 1.9% |
| 85 Years and Over | 29 | 0.7% |
| Total | 3,944 | 100.0% |
Housing Finances in Hobart
Median Income by Occupancy in Hobart
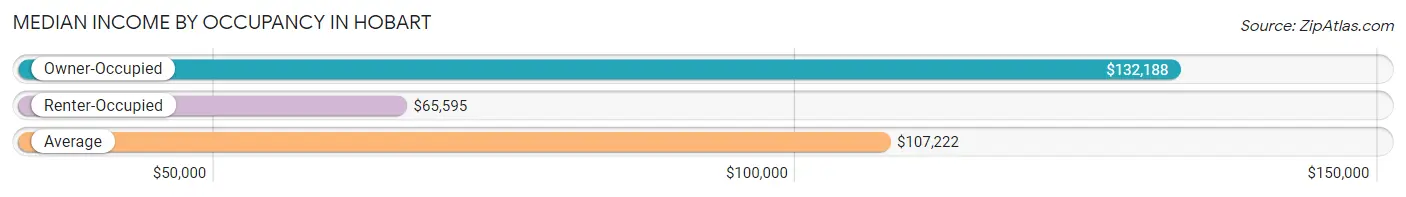
| Occupancy Type | # Households | Median Income |
| Owner-Occupied | 2,590 (65.7%) | $132,188 |
| Renter-Occupied | 1,354 (34.3%) | $65,595 |
| Average | 3,944 (100.0%) | $107,222 |
Occupancy by Householder Income Bracket in Hobart
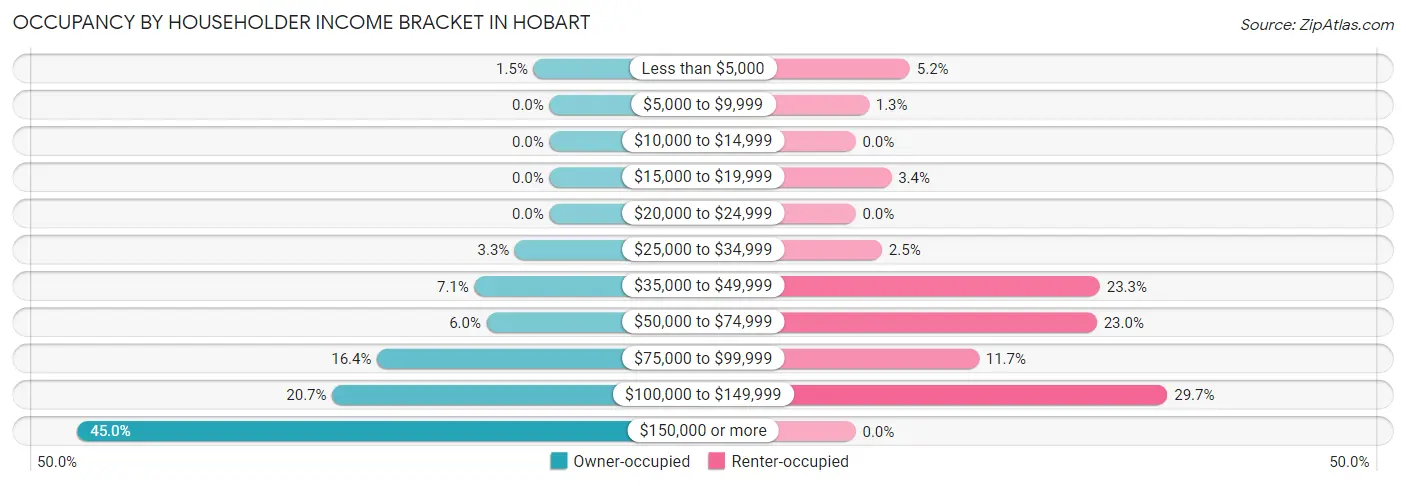
| Income Bracket | Owner-occupied | Renter-occupied |
| Less than $5,000 | 39 (1.5%) | 70 (5.2%) |
| $5,000 to $9,999 | 0 (0.0%) | 17 (1.3%) |
| $10,000 to $14,999 | 0 (0.0%) | 0 (0.0%) |
| $15,000 to $19,999 | 0 (0.0%) | 46 (3.4%) |
| $20,000 to $24,999 | 0 (0.0%) | 0 (0.0%) |
| $25,000 to $34,999 | 85 (3.3%) | 34 (2.5%) |
| $35,000 to $49,999 | 185 (7.1%) | 315 (23.3%) |
| $50,000 to $74,999 | 155 (6.0%) | 311 (23.0%) |
| $75,000 to $99,999 | 425 (16.4%) | 159 (11.7%) |
| $100,000 to $149,999 | 536 (20.7%) | 402 (29.7%) |
| $150,000 or more | 1,165 (45.0%) | 0 (0.0%) |
| Total | 2,590 (100.0%) | 1,354 (100.0%) |
Monthly Housing Cost Tiers in Hobart
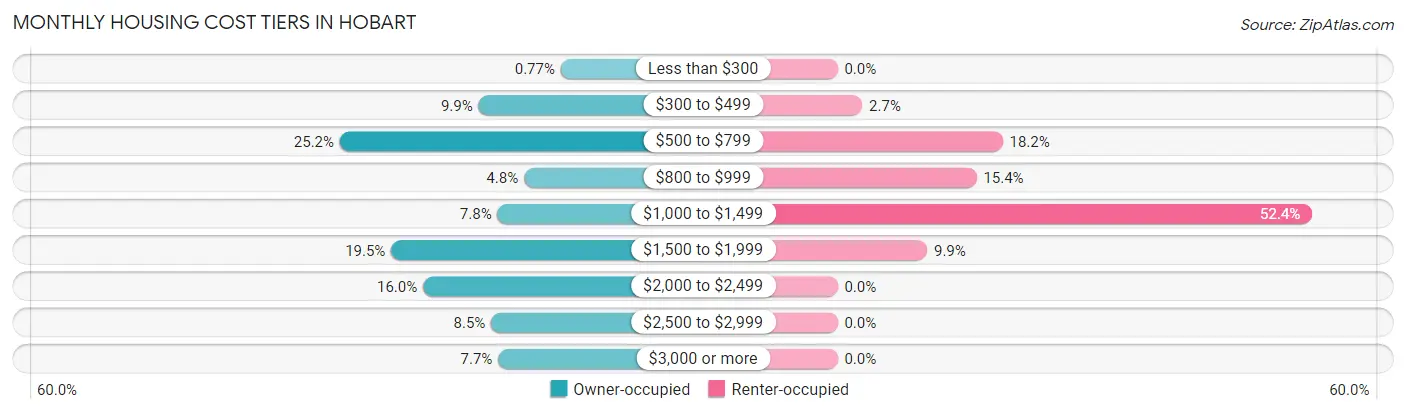
| Monthly Cost | Owner-occupied | Renter-occupied |
| Less than $300 | 20 (0.8%) | 0 (0.0%) |
| $300 to $499 | 255 (9.9%) | 37 (2.7%) |
| $500 to $799 | 652 (25.2%) | 247 (18.2%) |
| $800 to $999 | 125 (4.8%) | 208 (15.4%) |
| $1,000 to $1,499 | 201 (7.8%) | 710 (52.4%) |
| $1,500 to $1,999 | 505 (19.5%) | 134 (9.9%) |
| $2,000 to $2,499 | 414 (16.0%) | 0 (0.0%) |
| $2,500 to $2,999 | 219 (8.5%) | 0 (0.0%) |
| $3,000 or more | 199 (7.7%) | 0 (0.0%) |
| Total | 2,590 (100.0%) | 1,354 (100.0%) |
Physical Housing Characteristics in Hobart
Housing Structures in Hobart
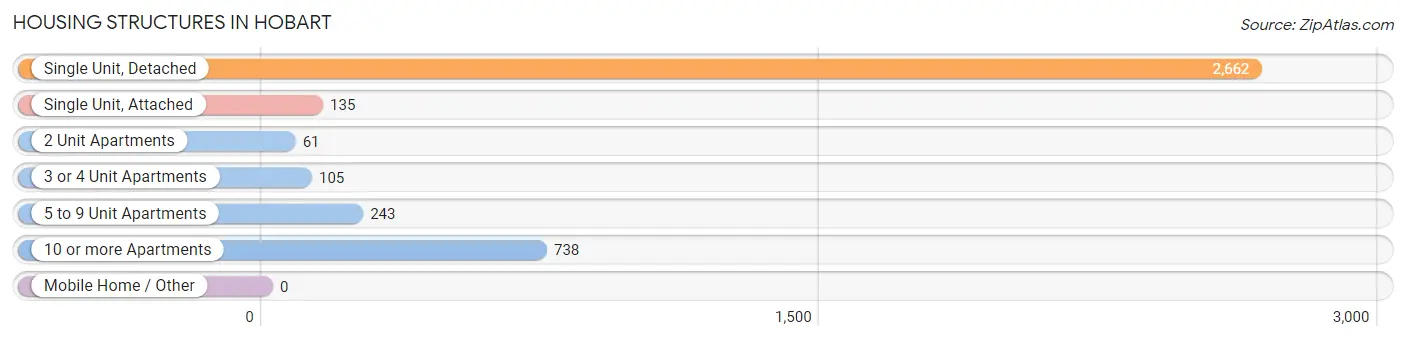
| Structure Type | # Housing Units | % Housing Units |
| Single Unit, Detached | 2,662 | 67.5% |
| Single Unit, Attached | 135 | 3.4% |
| 2 Unit Apartments | 61 | 1.5% |
| 3 or 4 Unit Apartments | 105 | 2.7% |
| 5 to 9 Unit Apartments | 243 | 6.2% |
| 10 or more Apartments | 738 | 18.7% |
| Mobile Home / Other | 0 | 0.0% |
| Total | 3,944 | 100.0% |
Housing Structures by Occupancy in Hobart
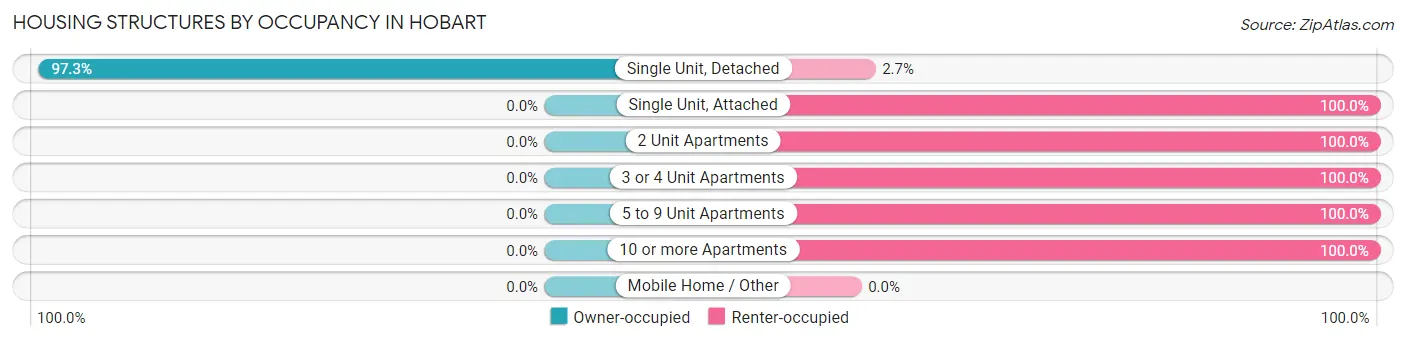
| Structure Type | Owner-occupied | Renter-occupied |
| Single Unit, Detached | 2,590 (97.3%) | 72 (2.7%) |
| Single Unit, Attached | 0 (0.0%) | 135 (100.0%) |
| 2 Unit Apartments | 0 (0.0%) | 61 (100.0%) |
| 3 or 4 Unit Apartments | 0 (0.0%) | 105 (100.0%) |
| 5 to 9 Unit Apartments | 0 (0.0%) | 243 (100.0%) |
| 10 or more Apartments | 0 (0.0%) | 738 (100.0%) |
| Mobile Home / Other | 0 (0.0%) | 0 (0.0%) |
| Total | 2,590 (65.7%) | 1,354 (34.3%) |
Housing Structures by Number of Rooms in Hobart
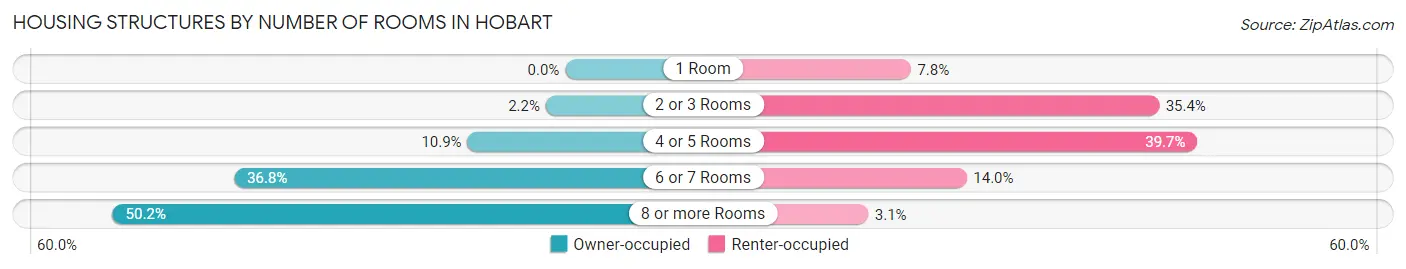
| Number of Rooms | Owner-occupied | Renter-occupied |
| 1 Room | 0 (0.0%) | 106 (7.8%) |
| 2 or 3 Rooms | 56 (2.2%) | 479 (35.4%) |
| 4 or 5 Rooms | 281 (10.8%) | 537 (39.7%) |
| 6 or 7 Rooms | 952 (36.8%) | 190 (14.0%) |
| 8 or more Rooms | 1,301 (50.2%) | 42 (3.1%) |
| Total | 2,590 (100.0%) | 1,354 (100.0%) |
Housing Structure by Heating Type in Hobart
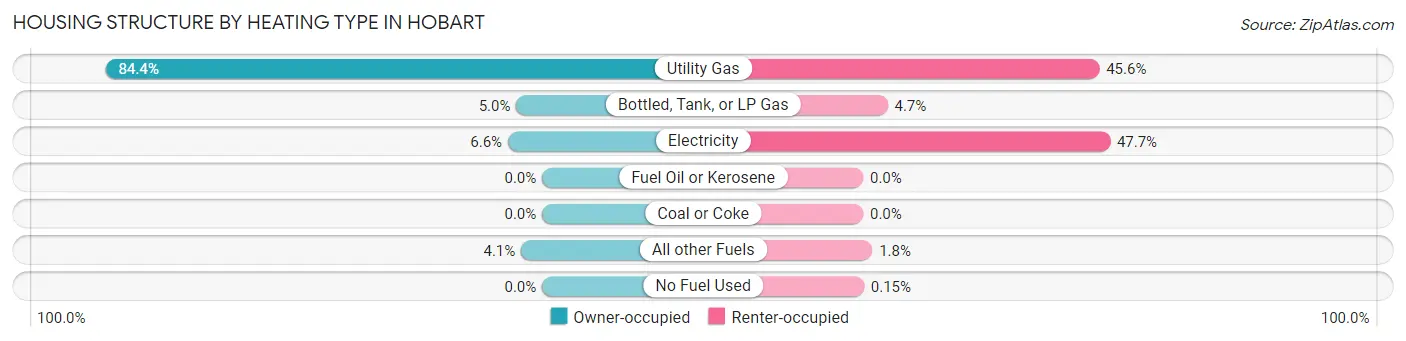
| Heating Type | Owner-occupied | Renter-occupied |
| Utility Gas | 2,185 (84.4%) | 618 (45.6%) |
| Bottled, Tank, or LP Gas | 129 (5.0%) | 64 (4.7%) |
| Electricity | 171 (6.6%) | 646 (47.7%) |
| Fuel Oil or Kerosene | 0 (0.0%) | 0 (0.0%) |
| Coal or Coke | 0 (0.0%) | 0 (0.0%) |
| All other Fuels | 105 (4.1%) | 24 (1.8%) |
| No Fuel Used | 0 (0.0%) | 2 (0.2%) |
| Total | 2,590 (100.0%) | 1,354 (100.0%) |
Household Vehicle Usage in Hobart
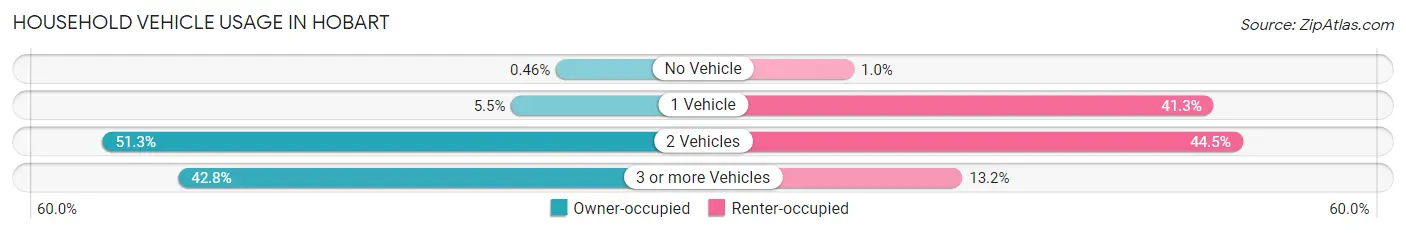
| Vehicles per Household | Owner-occupied | Renter-occupied |
| No Vehicle | 12 (0.5%) | 14 (1.0%) |
| 1 Vehicle | 142 (5.5%) | 559 (41.3%) |
| 2 Vehicles | 1,328 (51.3%) | 603 (44.5%) |
| 3 or more Vehicles | 1,108 (42.8%) | 178 (13.2%) |
| Total | 2,590 (100.0%) | 1,354 (100.0%) |
Real Estate & Mortgages in Hobart
Real Estate and Mortgage Overview in Hobart
| Characteristic | Without Mortgage | With Mortgage |
| Housing Units | 1,113 | 1,477 |
| Median Property Value | $282,000 | $361,900 |
| Median Household Income | $121,274 | $664 |
| Monthly Housing Costs | $654 | $163 |
| Real Estate Taxes | $4,228 | $19 |
Property Value by Mortgage Status in Hobart
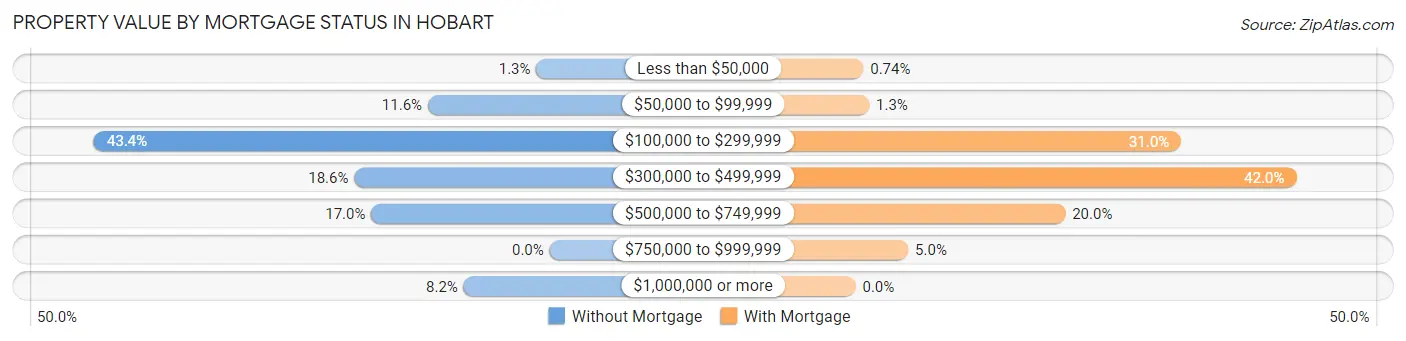
| Property Value | Without Mortgage | With Mortgage |
| Less than $50,000 | 14 (1.3%) | 11 (0.7%) |
| $50,000 to $99,999 | 129 (11.6%) | 19 (1.3%) |
| $100,000 to $299,999 | 483 (43.4%) | 458 (31.0%) |
| $300,000 to $499,999 | 207 (18.6%) | 620 (42.0%) |
| $500,000 to $749,999 | 189 (17.0%) | 295 (20.0%) |
| $750,000 to $999,999 | 0 (0.0%) | 74 (5.0%) |
| $1,000,000 or more | 91 (8.2%) | 0 (0.0%) |
| Total | 1,113 (100.0%) | 1,477 (100.0%) |
Household Income by Mortgage Status in Hobart
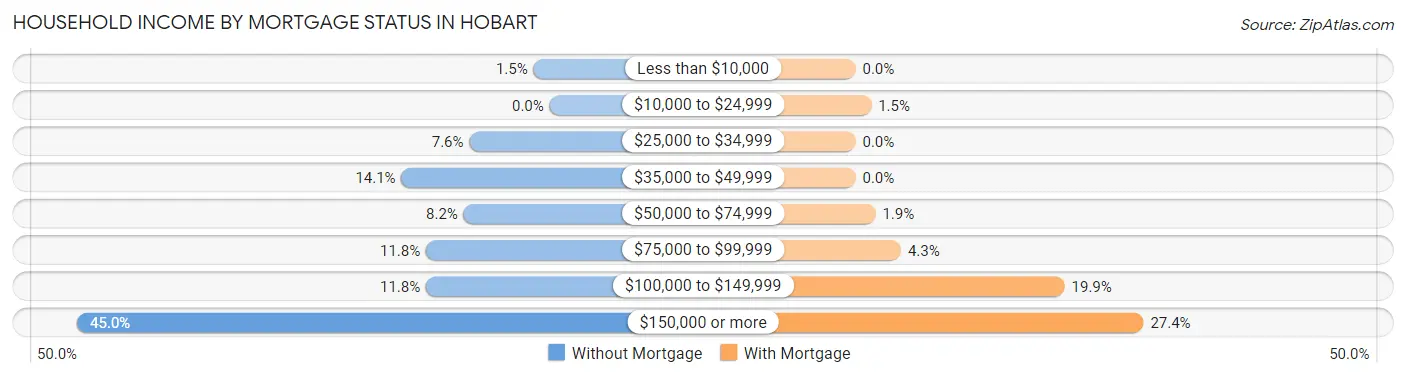
| Household Income | Without Mortgage | With Mortgage |
| Less than $10,000 | 17 (1.5%) | 0 (0.0%) |
| $10,000 to $24,999 | 0 (0.0%) | 22 (1.5%) |
| $25,000 to $34,999 | 85 (7.6%) | 0 (0.0%) |
| $35,000 to $49,999 | 157 (14.1%) | 0 (0.0%) |
| $50,000 to $74,999 | 91 (8.2%) | 28 (1.9%) |
| $75,000 to $99,999 | 131 (11.8%) | 64 (4.3%) |
| $100,000 to $149,999 | 131 (11.8%) | 294 (19.9%) |
| $150,000 or more | 501 (45.0%) | 405 (27.4%) |
| Total | 1,113 (100.0%) | 1,477 (100.0%) |
Property Value to Household Income Ratio in Hobart
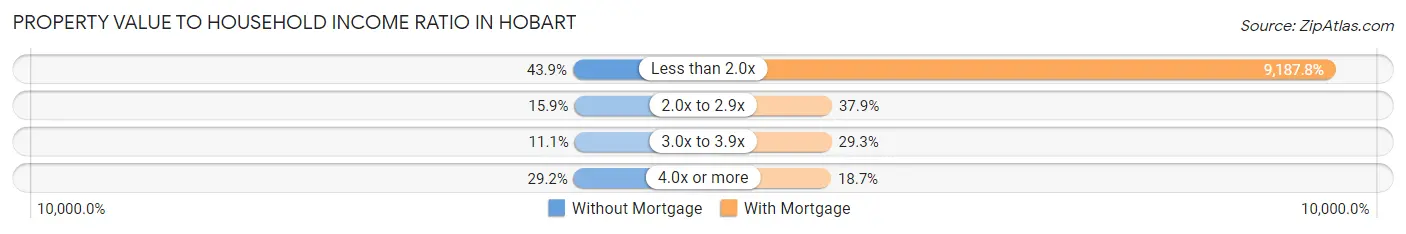
| Value-to-Income Ratio | Without Mortgage | With Mortgage |
| Less than 2.0x | 488 (43.9%) | 135,703 (9,187.7%) |
| 2.0x to 2.9x | 177 (15.9%) | 559 (37.9%) |
| 3.0x to 3.9x | 123 (11.1%) | 432 (29.2%) |
| 4.0x or more | 325 (29.2%) | 276 (18.7%) |
| Total | 1,113 (100.0%) | 1,477 (100.0%) |
Real Estate Taxes by Mortgage Status in Hobart
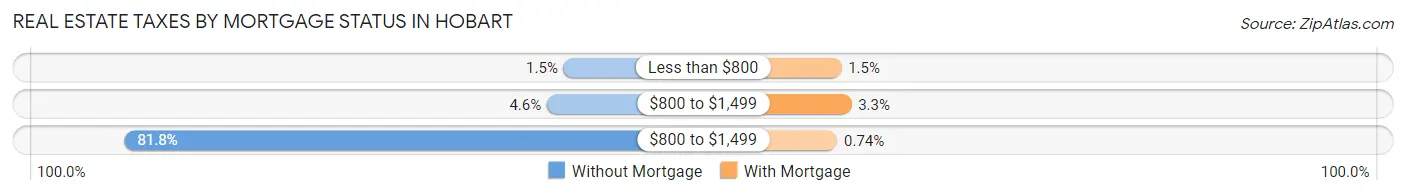
| Property Taxes | Without Mortgage | With Mortgage |
| Less than $800 | 17 (1.5%) | 22 (1.5%) |
| $800 to $1,499 | 51 (4.6%) | 49 (3.3%) |
| $800 to $1,499 | 910 (81.8%) | 11 (0.7%) |
| Total | 1,113 (100.0%) | 1,477 (100.0%) |
Health & Disability in Hobart
Health Insurance Coverage by Age in Hobart
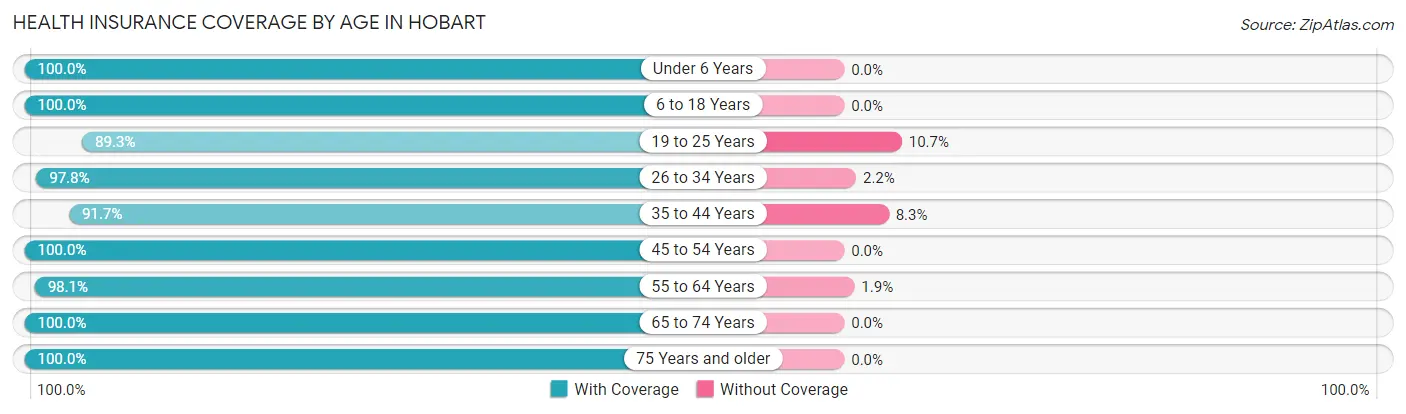
| Age Bracket | With Coverage | Without Coverage |
| Under 6 Years | 881 (100.0%) | 0 (0.0%) |
| 6 to 18 Years | 1,271 (100.0%) | 0 (0.0%) |
| 19 to 25 Years | 1,008 (89.3%) | 121 (10.7%) |
| 26 to 34 Years | 1,162 (97.8%) | 26 (2.2%) |
| 35 to 44 Years | 1,252 (91.7%) | 113 (8.3%) |
| 45 to 54 Years | 827 (100.0%) | 0 (0.0%) |
| 55 to 64 Years | 2,177 (98.1%) | 42 (1.9%) |
| 65 to 74 Years | 994 (100.0%) | 0 (0.0%) |
| 75 Years and older | 249 (100.0%) | 0 (0.0%) |
| Total | 9,821 (97.0%) | 302 (3.0%) |
Health Insurance Coverage by Citizenship Status in Hobart
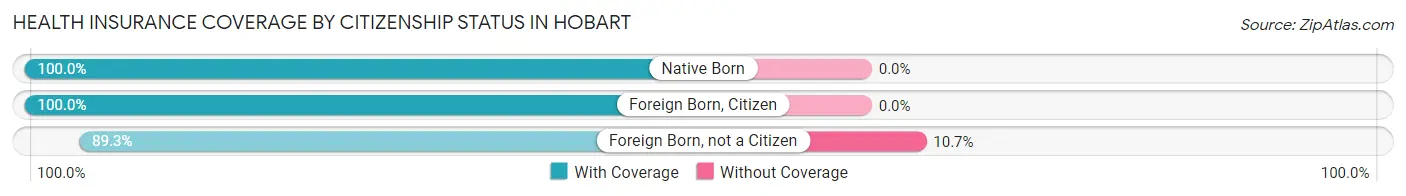
| Citizenship Status | With Coverage | Without Coverage |
| Native Born | 881 (100.0%) | 0 (0.0%) |
| Foreign Born, Citizen | 1,271 (100.0%) | 0 (0.0%) |
| Foreign Born, not a Citizen | 1,008 (89.3%) | 121 (10.7%) |
Health Insurance Coverage by Household Income in Hobart
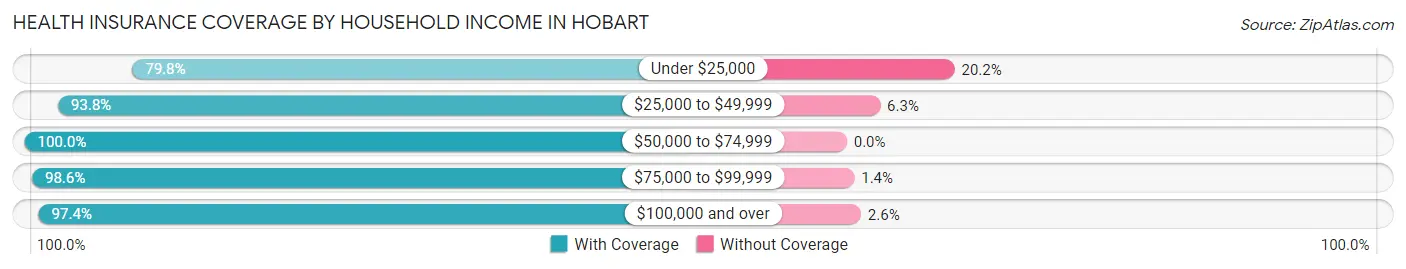
| Household Income | With Coverage | Without Coverage |
| Under $25,000 | 166 (79.8%) | 42 (20.2%) |
| $25,000 to $49,999 | 1,201 (93.8%) | 80 (6.2%) |
| $50,000 to $74,999 | 896 (100.0%) | 0 (0.0%) |
| $75,000 to $99,999 | 1,906 (98.6%) | 27 (1.4%) |
| $100,000 and over | 5,652 (97.4%) | 153 (2.6%) |
Public vs Private Health Insurance Coverage by Age in Hobart
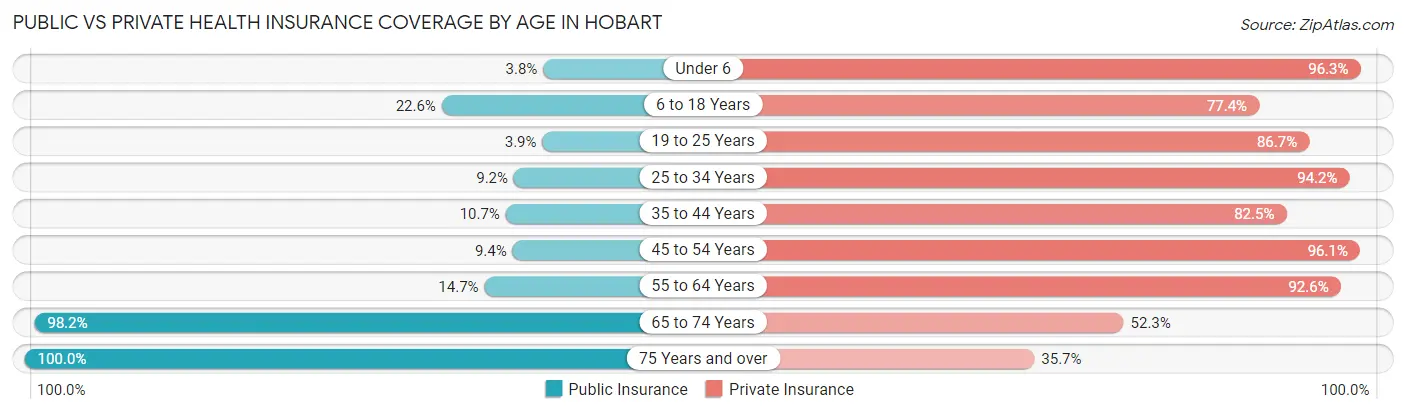
| Age Bracket | Public Insurance | Private Insurance |
| Under 6 | 33 (3.7%) | 848 (96.3%) |
| 6 to 18 Years | 287 (22.6%) | 984 (77.4%) |
| 19 to 25 Years | 44 (3.9%) | 979 (86.7%) |
| 25 to 34 Years | 109 (9.2%) | 1,119 (94.2%) |
| 35 to 44 Years | 146 (10.7%) | 1,126 (82.5%) |
| 45 to 54 Years | 78 (9.4%) | 795 (96.1%) |
| 55 to 64 Years | 325 (14.6%) | 2,054 (92.6%) |
| 65 to 74 Years | 976 (98.2%) | 520 (52.3%) |
| 75 Years and over | 249 (100.0%) | 89 (35.7%) |
| Total | 2,247 (22.2%) | 8,514 (84.1%) |
Disability Status by Sex by Age in Hobart
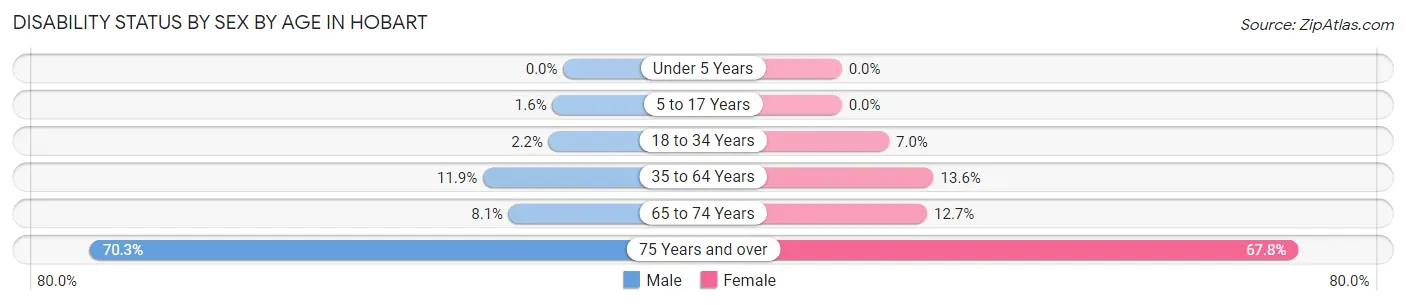
| Age Bracket | Male | Female |
| Under 5 Years | 0 (0.0%) | 0 (0.0%) |
| 5 to 17 Years | 12 (1.6%) | 0 (0.0%) |
| 18 to 34 Years | 22 (2.1%) | 98 (7.0%) |
| 35 to 64 Years | 282 (11.9%) | 279 (13.6%) |
| 65 to 74 Years | 51 (8.1%) | 46 (12.7%) |
| 75 Years and over | 90 (70.3%) | 82 (67.8%) |
Disability Class by Sex by Age in Hobart
Disability Class: Hearing Difficulty
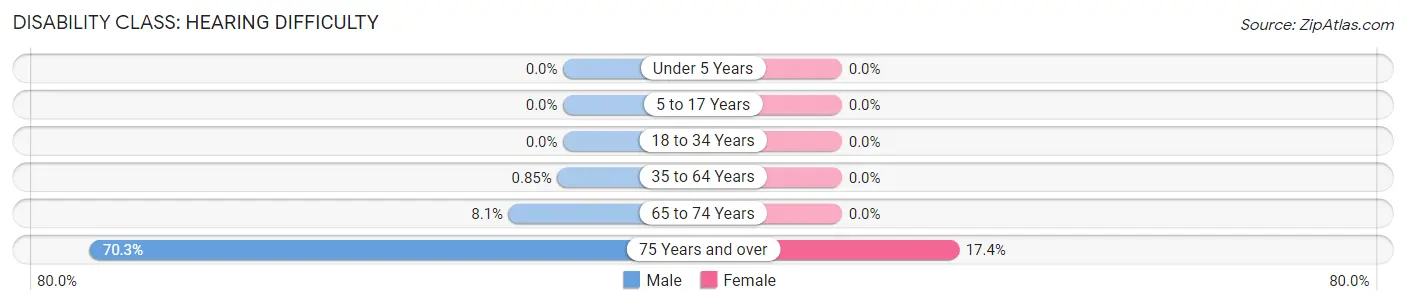
| Age Bracket | Male | Female |
| Under 5 Years | 0 (0.0%) | 0 (0.0%) |
| 5 to 17 Years | 0 (0.0%) | 0 (0.0%) |
| 18 to 34 Years | 0 (0.0%) | 0 (0.0%) |
| 35 to 64 Years | 20 (0.9%) | 0 (0.0%) |
| 65 to 74 Years | 51 (8.1%) | 0 (0.0%) |
| 75 Years and over | 90 (70.3%) | 21 (17.4%) |
Disability Class: Vision Difficulty
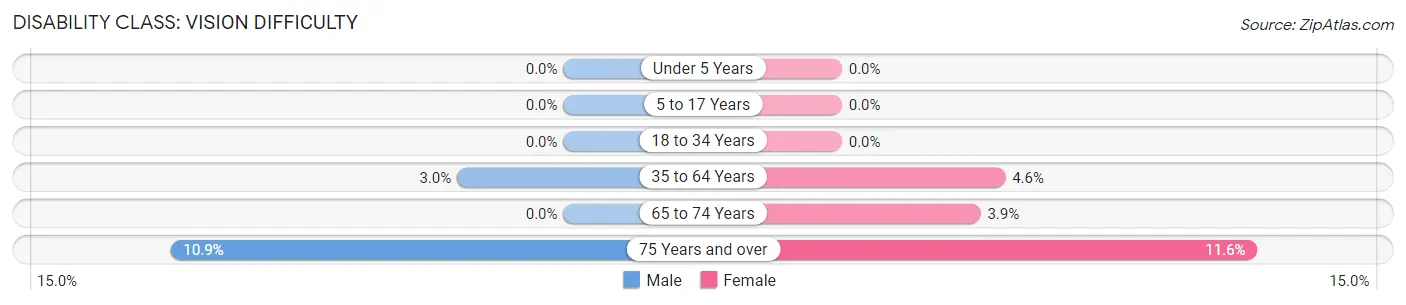
| Age Bracket | Male | Female |
| Under 5 Years | 0 (0.0%) | 0 (0.0%) |
| 5 to 17 Years | 0 (0.0%) | 0 (0.0%) |
| 18 to 34 Years | 0 (0.0%) | 0 (0.0%) |
| 35 to 64 Years | 70 (3.0%) | 93 (4.5%) |
| 65 to 74 Years | 0 (0.0%) | 14 (3.9%) |
| 75 Years and over | 14 (10.9%) | 14 (11.6%) |
Disability Class: Cognitive Difficulty
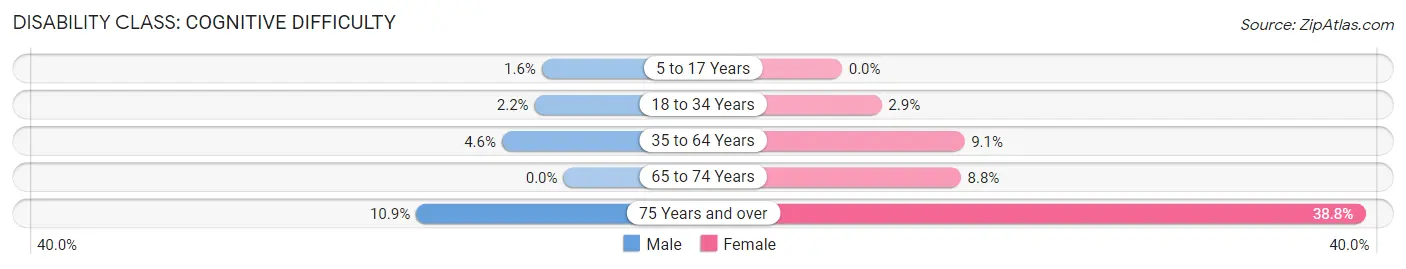
| Age Bracket | Male | Female |
| 5 to 17 Years | 12 (1.6%) | 0 (0.0%) |
| 18 to 34 Years | 22 (2.1%) | 41 (2.9%) |
| 35 to 64 Years | 108 (4.6%) | 186 (9.1%) |
| 65 to 74 Years | 0 (0.0%) | 32 (8.8%) |
| 75 Years and over | 14 (10.9%) | 47 (38.8%) |
Disability Class: Ambulatory Difficulty
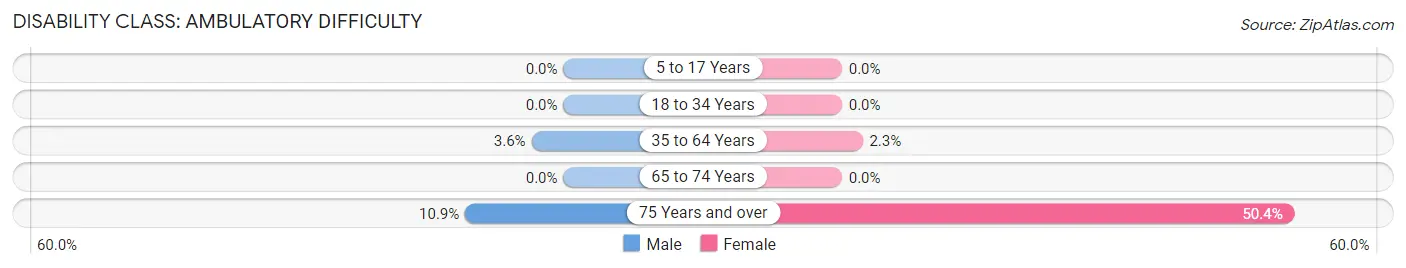
| Age Bracket | Male | Female |
| 5 to 17 Years | 0 (0.0%) | 0 (0.0%) |
| 18 to 34 Years | 0 (0.0%) | 0 (0.0%) |
| 35 to 64 Years | 84 (3.5%) | 47 (2.3%) |
| 65 to 74 Years | 0 (0.0%) | 0 (0.0%) |
| 75 Years and over | 14 (10.9%) | 61 (50.4%) |
Disability Class: Self-Care Difficulty
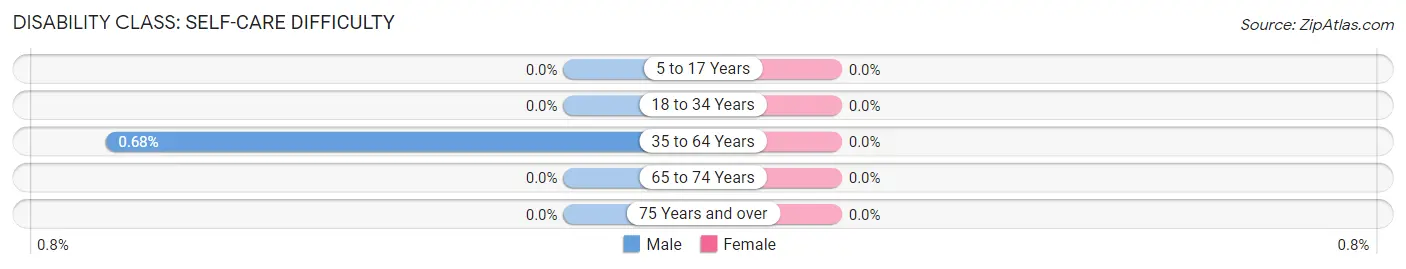
| Age Bracket | Male | Female |
| 5 to 17 Years | 0 (0.0%) | 0 (0.0%) |
| 18 to 34 Years | 0 (0.0%) | 0 (0.0%) |
| 35 to 64 Years | 16 (0.7%) | 0 (0.0%) |
| 65 to 74 Years | 0 (0.0%) | 0 (0.0%) |
| 75 Years and over | 0 (0.0%) | 0 (0.0%) |
Technology Access in Hobart
Computing Device Access in Hobart
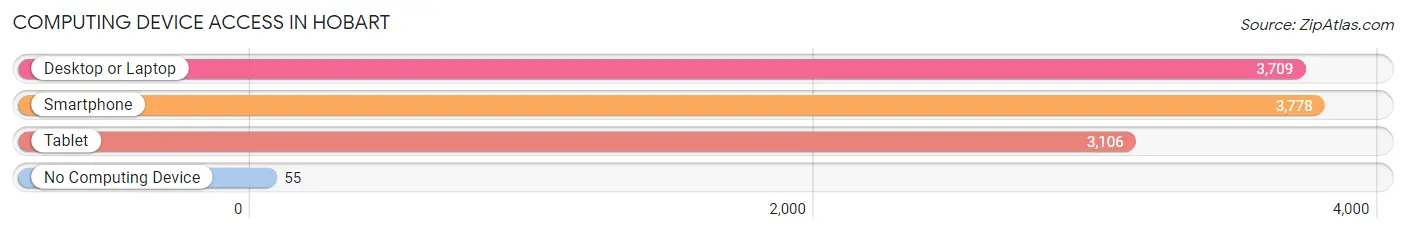
| Device Type | # Households | % Households |
| Desktop or Laptop | 3,709 | 94.0% |
| Smartphone | 3,778 | 95.8% |
| Tablet | 3,106 | 78.7% |
| No Computing Device | 55 | 1.4% |
| Total | 3,944 | 100.0% |
Internet Access in Hobart
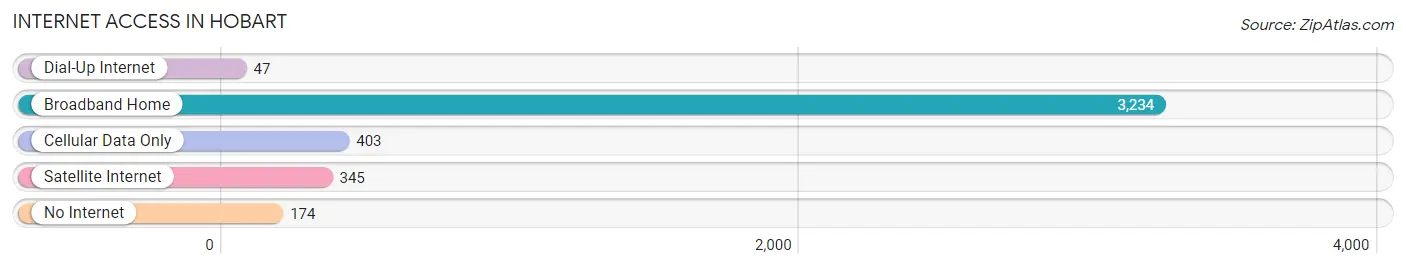
| Internet Type | # Households | % Households |
| Dial-Up Internet | 47 | 1.2% |
| Broadband Home | 3,234 | 82.0% |
| Cellular Data Only | 403 | 10.2% |
| Satellite Internet | 345 | 8.7% |
| No Internet | 174 | 4.4% |
| Total | 3,944 | 100.0% |
Hobart Summary
Hobart, Wisconsin is a small town located in Brown County, Wisconsin. It is situated on the Fox River, about 25 miles south of Green Bay. The population of Hobart was 1,845 in the 2010 census.
History
Hobart was founded in 1848 by a group of settlers from New York. The town was named after the city of Hobart in Tasmania, Australia. The settlers were attracted to the area by the abundance of timber and the potential for farming. The first settlers built a sawmill and a gristmill, and the town quickly grew.
In 1854, the first post office was established in Hobart. The town was incorporated in 1858. In the late 19th century, Hobart was a thriving community with a variety of businesses, including a hotel, a bank, a newspaper, and a variety of stores.
In the early 20th century, Hobart experienced a period of decline. The sawmill and gristmill closed, and the population began to decline. In the 1950s, the town was revitalized by the construction of a paper mill. The paper mill provided jobs for many of the town’s residents and helped to revive the local economy.
Geography
Hobart is located in Brown County, Wisconsin. It is situated on the Fox River, about 25 miles south of Green Bay. The town is surrounded by rolling hills and forests. The climate is humid continental, with cold winters and warm summers.
Economy
Hobart’s economy is largely based on agriculture and manufacturing. The town is home to a variety of farms, including dairy farms, beef farms, and vegetable farms. The town also has a paper mill, which provides jobs for many of the town’s residents.
Demographics
According to the 2010 census, the population of Hobart was 1,845. The median age of the population was 43.7 years. The median household income was $45,938. The town is predominantly white, with 92.3% of the population identifying as white. The town also has a small Hispanic population, with 4.2% of the population identifying as Hispanic or Latino.
Hobart is a small town with a rich history and a vibrant economy. The town is home to a variety of businesses and farms, and the paper mill provides jobs for many of the town’s residents. The town has a diverse population, with a mix of white, Hispanic, and other ethnicities.
Common Questions
What is Per Capita Income in Hobart?
Per Capita income in Hobart is $58,784.
What is the Median Family Income in Hobart?
Median Family Income in Hobart is $116,080.
What is the Median Household income in Hobart?
Median Household Income in Hobart is $107,222.
What is Income or Wage Gap in Hobart?
Income or Wage Gap in Hobart is 40.2%.
Women in Hobart earn 59.8 cents for every dollar earned by a man.
What is Inequality or Gini Index in Hobart?
Inequality or Gini Index in Hobart is 0.47.
What is the Total Population of Hobart?
Total Population of Hobart is 10,130.
What is the Total Male Population of Hobart?
Total Male Population of Hobart is 5,064.
What is the Total Female Population of Hobart?
Total Female Population of Hobart is 5,066.
What is the Ratio of Males per 100 Females in Hobart?
There are 99.96 Males per 100 Females in Hobart.
What is the Ratio of Females per 100 Males in Hobart?
There are 100.04 Females per 100 Males in Hobart.
What is the Median Population Age in Hobart?
Median Population Age in Hobart is 38.5 Years.
What is the Average Family Size in Hobart
Average Family Size in Hobart is 2.8 People.
What is the Average Household Size in Hobart
Average Household Size in Hobart is 2.6 People.
How Large is the Labor Force in Hobart?
There are 5,975 People in the Labor Forcein in Hobart.
What is the Percentage of People in the Labor Force in Hobart?
71.5% of People are in the Labor Force in Hobart.
What is the Unemployment Rate in Hobart?
Unemployment Rate in Hobart is 0.2%.