Bethel Acres, OK Map & Demographics
Bethel Acres Map
Bethel Acres Overview
$32,637
PER CAPITA INCOME
$100,250
AVG FAMILY INCOME
$82,670
AVG HOUSEHOLD INCOME
29.8%
WAGE / INCOME GAP [ % ]
70.2¢/ $1
WAGE / INCOME GAP [ $ ]
0.39
INEQUALITY / GINI INDEX
3,066
TOTAL POPULATION
1,555
MALE POPULATION
1,511
FEMALE POPULATION
102.91
MALES / 100 FEMALES
97.17
FEMALES / 100 MALES
36.5
MEDIAN AGE
3.4
AVG FAMILY SIZE
2.9
AVG HOUSEHOLD SIZE
1,443
LABOR FORCE [ PEOPLE ]
60.4%
PERCENT IN LABOR FORCE
1.8%
UNEMPLOYMENT RATE
Bethel Acres Area Codes
Income in Bethel Acres
Income Overview in Bethel Acres
Per Capita Income in Bethel Acres is $32,637, while median incomes of families and households are $100,250 and $82,670 respectively.
| Characteristic | Number | Measure |
| Per Capita Income | 3,066 | $32,637 |
| Median Family Income | 770 | $100,250 |
| Mean Family Income | 770 | $107,747 |
| Median Household Income | 1,049 | $82,670 |
| Mean Household Income | 1,049 | $91,929 |
| Income Deficit | 770 | $0 |
| Wage / Income Gap (%) | 3,066 | 29.83% |
| Wage / Income Gap ($) | 3,066 | 70.17¢ per $1 |
| Gini / Inequality Index | 3,066 | 0.39 |
Earnings by Sex in Bethel Acres
Average Earnings in Bethel Acres are $47,422, $55,458 for men and $38,917 for women, a difference of 29.8%.
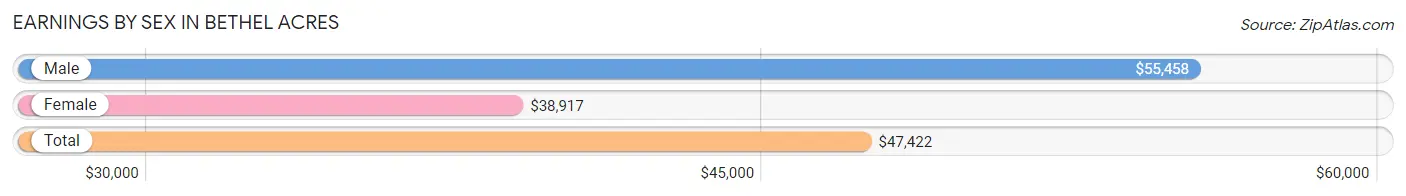
| Sex | Number | Average Earnings |
| Male | 794 (53.0%) | $55,458 |
| Female | 703 (47.0%) | $38,917 |
| Total | 1,497 (100.0%) | $47,422 |
Earnings by Sex by Income Bracket in Bethel Acres
The most common earnings brackets in Bethel Acres are $100,000+ for men (164 | 20.6%) and $50,000 to $54,999 for women (113 | 16.1%).
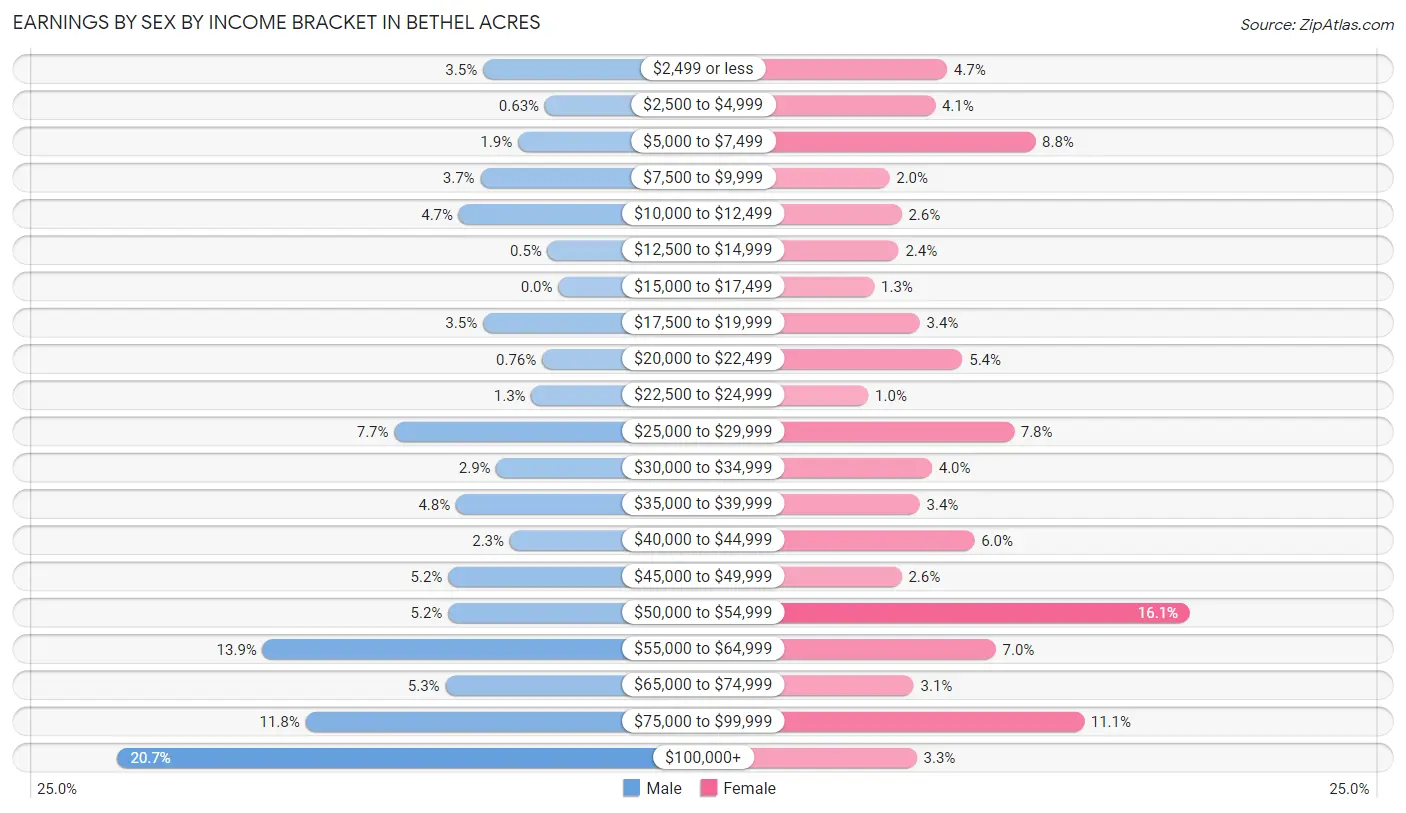
| Income | Male | Female |
| $2,499 or less | 28 (3.5%) | 33 (4.7%) |
| $2,500 to $4,999 | 5 (0.6%) | 29 (4.1%) |
| $5,000 to $7,499 | 15 (1.9%) | 62 (8.8%) |
| $7,500 to $9,999 | 29 (3.6%) | 14 (2.0%) |
| $10,000 to $12,499 | 37 (4.7%) | 18 (2.6%) |
| $12,500 to $14,999 | 4 (0.5%) | 17 (2.4%) |
| $15,000 to $17,499 | 0 (0.0%) | 9 (1.3%) |
| $17,500 to $19,999 | 28 (3.5%) | 24 (3.4%) |
| $20,000 to $22,499 | 6 (0.8%) | 38 (5.4%) |
| $22,500 to $24,999 | 10 (1.3%) | 7 (1.0%) |
| $25,000 to $29,999 | 61 (7.7%) | 55 (7.8%) |
| $30,000 to $34,999 | 23 (2.9%) | 28 (4.0%) |
| $35,000 to $39,999 | 38 (4.8%) | 24 (3.4%) |
| $40,000 to $44,999 | 18 (2.3%) | 42 (6.0%) |
| $45,000 to $49,999 | 41 (5.2%) | 18 (2.6%) |
| $50,000 to $54,999 | 41 (5.2%) | 113 (16.1%) |
| $55,000 to $64,999 | 110 (13.9%) | 49 (7.0%) |
| $65,000 to $74,999 | 42 (5.3%) | 22 (3.1%) |
| $75,000 to $99,999 | 94 (11.8%) | 78 (11.1%) |
| $100,000+ | 164 (20.6%) | 23 (3.3%) |
| Total | 794 (100.0%) | 703 (100.0%) |
Earnings by Sex by Educational Attainment in Bethel Acres
Average earnings in Bethel Acres are $56,849 for men and $43,182 for women, a difference of 24.0%. Men with an educational attainment of graduate degree enjoy the highest average annual earnings of $104,271, while those with less than high school education earn the least with $34,750. Women with an educational attainment of graduate degree earn the most with the average annual earnings of $66,500, while those with less than high school education have the smallest earnings of $10,865.
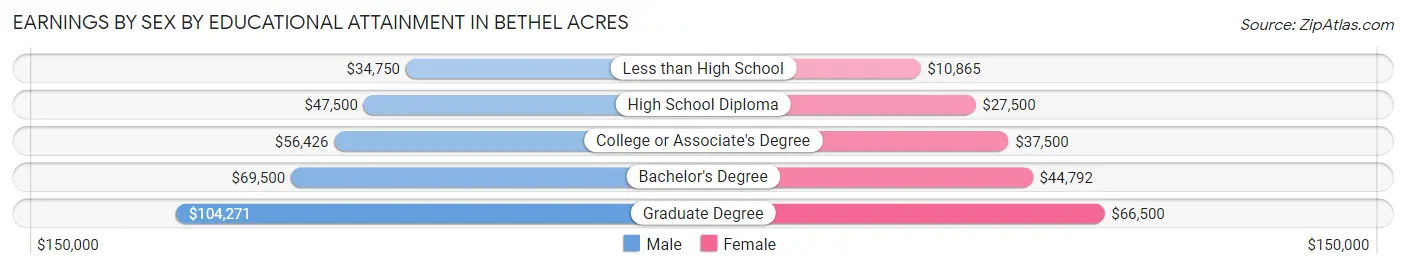
| Educational Attainment | Male Income | Female Income |
| Less than High School | $34,750 | $10,865 |
| High School Diploma | $47,500 | $27,500 |
| College or Associate's Degree | $56,426 | $37,500 |
| Bachelor's Degree | $69,500 | $44,792 |
| Graduate Degree | $104,271 | $66,500 |
| Total | $56,849 | $43,182 |
Family Income in Bethel Acres
Family Income Brackets in Bethel Acres
According to the Bethel Acres family income data, there are 227 families falling into the $100,000 to $149,999 income range, which is the most common income bracket and makes up 29.5% of all families. Conversely, the $10,000 to $14,999 income bracket is the least frequent group with only 12 families (1.6%) belonging to this category.
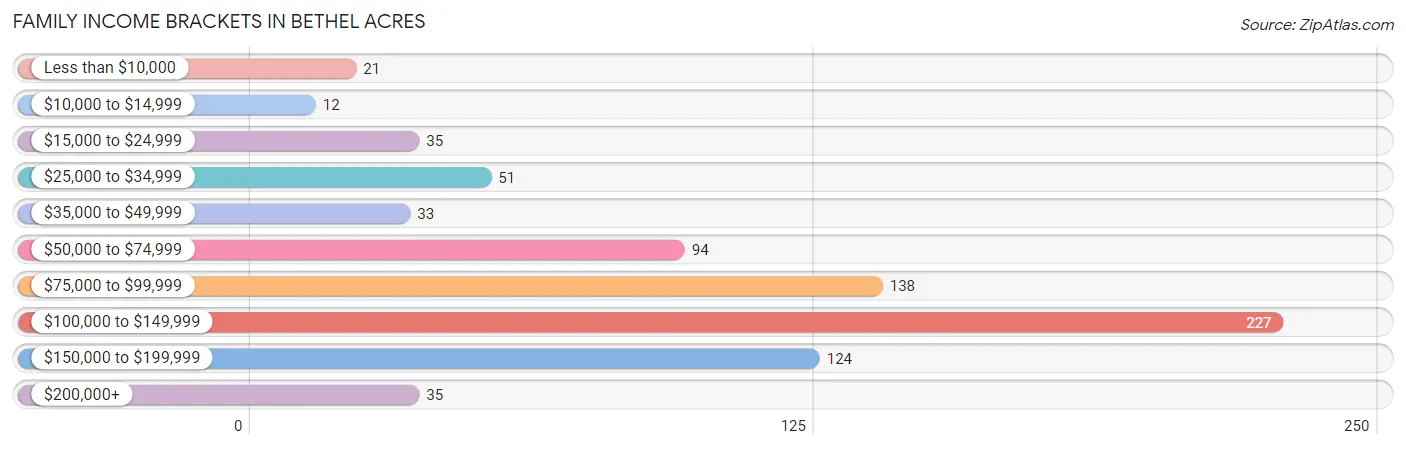
| Income Bracket | # Families | % Families |
| Less than $10,000 | 21 | 2.7% |
| $10,000 to $14,999 | 12 | 1.6% |
| $15,000 to $24,999 | 35 | 4.5% |
| $25,000 to $34,999 | 51 | 6.6% |
| $35,000 to $49,999 | 33 | 4.3% |
| $50,000 to $74,999 | 94 | 12.2% |
| $75,000 to $99,999 | 138 | 17.9% |
| $100,000 to $149,999 | 227 | 29.5% |
| $150,000 to $199,999 | 124 | 16.1% |
| $200,000+ | 35 | 4.5% |
Family Income by Famaliy Size in Bethel Acres
4-person families (178 | 23.1%) account for the highest median family income in Bethel Acres with $144,000 per family, while 2-person families (322 | 41.8%) have the highest median income of $45,938 per family member.
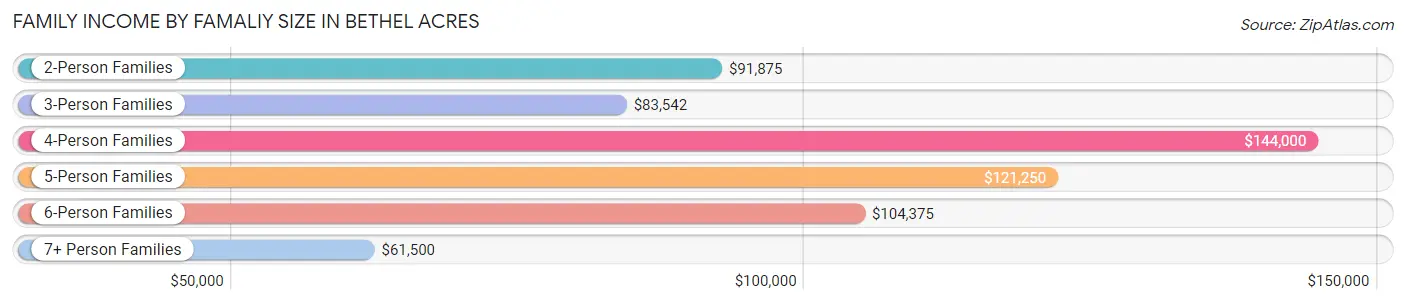
| Income Bracket | # Families | Median Income |
| 2-Person Families | 322 (41.8%) | $91,875 |
| 3-Person Families | 171 (22.2%) | $83,542 |
| 4-Person Families | 178 (23.1%) | $144,000 |
| 5-Person Families | 52 (6.8%) | $121,250 |
| 6-Person Families | 21 (2.7%) | $104,375 |
| 7+ Person Families | 26 (3.4%) | $61,500 |
| Total | 770 (100.0%) | $100,250 |
Family Income by Number of Earners in Bethel Acres
The median family income in Bethel Acres is $100,250, with families comprising 2 earners (423) having the highest median family income of $141,250, while families with no earners (93) have the lowest median family income of $51,458, accounting for 54.9% and 12.1% of families, respectively.
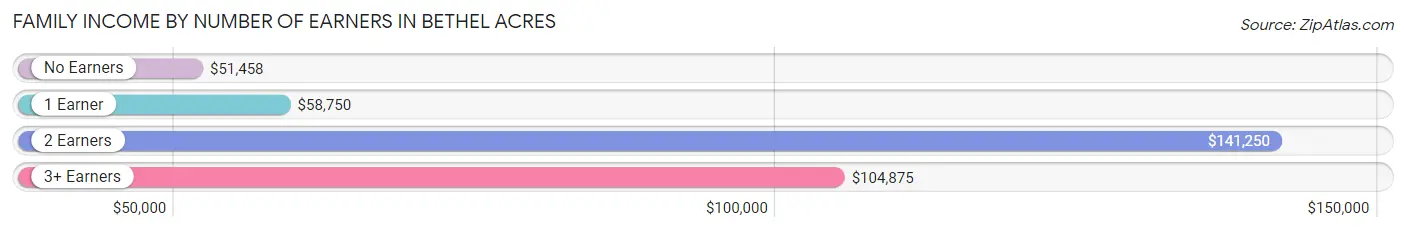
| Number of Earners | # Families | Median Income |
| No Earners | 93 (12.1%) | $51,458 |
| 1 Earner | 195 (25.3%) | $58,750 |
| 2 Earners | 423 (54.9%) | $141,250 |
| 3+ Earners | 59 (7.7%) | $104,875 |
| Total | 770 (100.0%) | $100,250 |
Household Income in Bethel Acres
Household Income Brackets in Bethel Acres
With 227 households falling in the category, the $100,000 to $149,999 income range is the most frequent in Bethel Acres, accounting for 21.6% of all households. In contrast, only 25 households (2.4%) fall into the $10,000 to $14,999 income bracket, making it the least populous group.
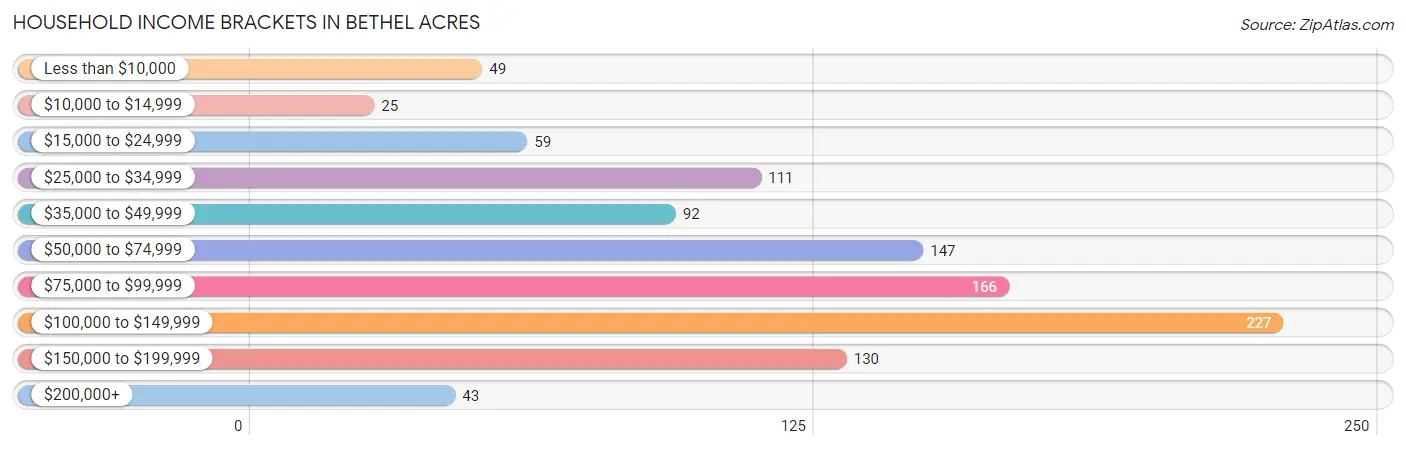
| Income Bracket | # Households | % Households |
| Less than $10,000 | 49 | 4.7% |
| $10,000 to $14,999 | 25 | 2.4% |
| $15,000 to $24,999 | 59 | 5.6% |
| $25,000 to $34,999 | 111 | 10.6% |
| $35,000 to $49,999 | 92 | 8.8% |
| $50,000 to $74,999 | 147 | 14.0% |
| $75,000 to $99,999 | 166 | 15.8% |
| $100,000 to $149,999 | 227 | 21.6% |
| $150,000 to $199,999 | 130 | 12.4% |
| $200,000+ | 43 | 4.1% |
Household Income by Householder Age in Bethel Acres
The median household income in Bethel Acres is $82,670, with the highest median household income of $138,750 found in the 25 to 44 years age bracket for the primary householder. A total of 381 households (36.3%) fall into this category. Meanwhile, the 65+ years age bracket for the primary householder has the lowest median household income of $38,173, with 257 households (24.5%) in this group.
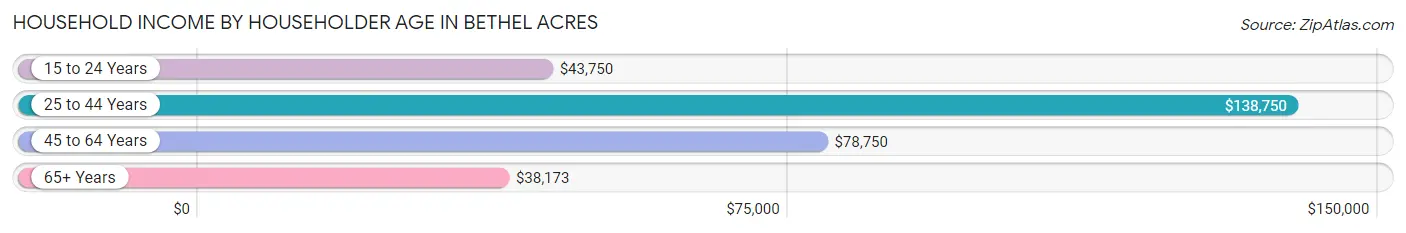
| Income Bracket | # Households | Median Income |
| 15 to 24 Years | 19 (1.8%) | $43,750 |
| 25 to 44 Years | 381 (36.3%) | $138,750 |
| 45 to 64 Years | 392 (37.4%) | $78,750 |
| 65+ Years | 257 (24.5%) | $38,173 |
| Total | 1,049 (100.0%) | $82,670 |
Poverty in Bethel Acres
Income Below Poverty by Sex and Age in Bethel Acres
With 8.9% poverty level for males and 13.3% for females among the residents of Bethel Acres, under 5 year old males and 18 to 24 year old females are the most vulnerable to poverty, with 28 males (31.5%) and 36 females (36.0%) in their respective age groups living below the poverty level.
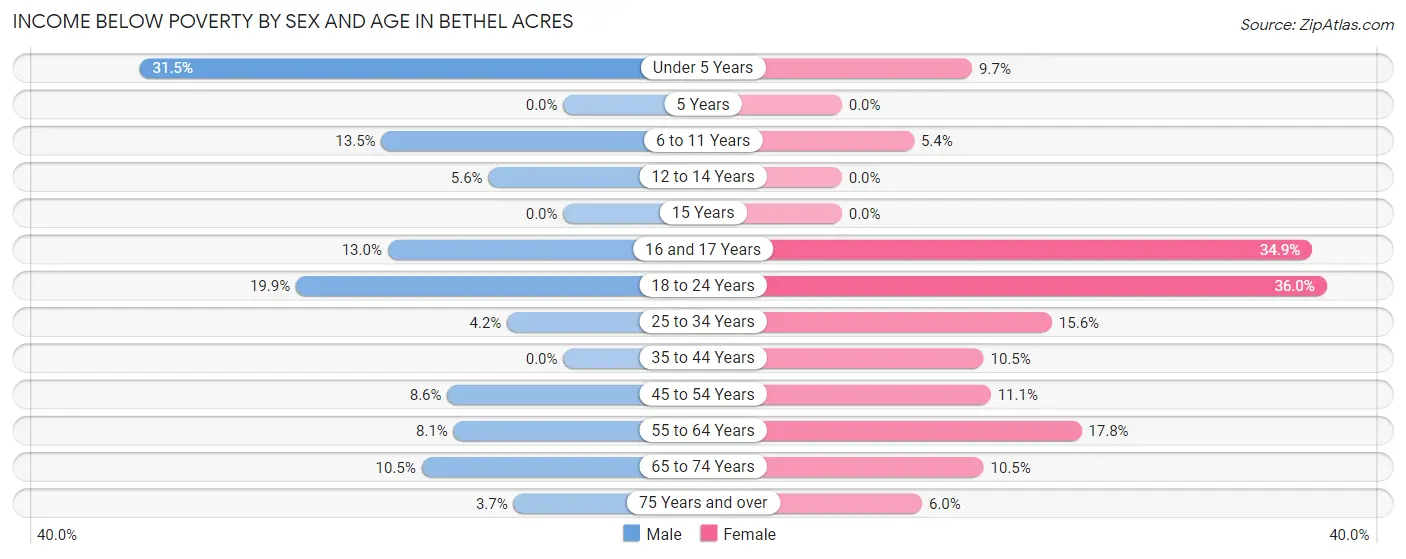
| Age Bracket | Male | Female |
| Under 5 Years | 28 (31.5%) | 6 (9.7%) |
| 5 Years | 0 (0.0%) | 0 (0.0%) |
| 6 to 11 Years | 10 (13.5%) | 9 (5.4%) |
| 12 to 14 Years | 7 (5.6%) | 0 (0.0%) |
| 15 Years | 0 (0.0%) | 0 (0.0%) |
| 16 and 17 Years | 6 (13.0%) | 22 (34.9%) |
| 18 to 24 Years | 27 (19.9%) | 36 (36.0%) |
| 25 to 34 Years | 11 (4.2%) | 34 (15.6%) |
| 35 to 44 Years | 0 (0.0%) | 22 (10.5%) |
| 45 to 54 Years | 13 (8.6%) | 23 (11.1%) |
| 55 to 64 Years | 18 (8.1%) | 29 (17.8%) |
| 65 to 74 Years | 12 (10.5%) | 10 (10.5%) |
| 75 Years and over | 4 (3.7%) | 5 (5.9%) |
| Total | 136 (8.9%) | 196 (13.3%) |
Income Above Poverty by Sex and Age in Bethel Acres
According to the poverty statistics in Bethel Acres, males aged 5 years and females aged 5 years are the age groups that are most secure financially, with 100.0% of males and 100.0% of females in these age groups living above the poverty line.
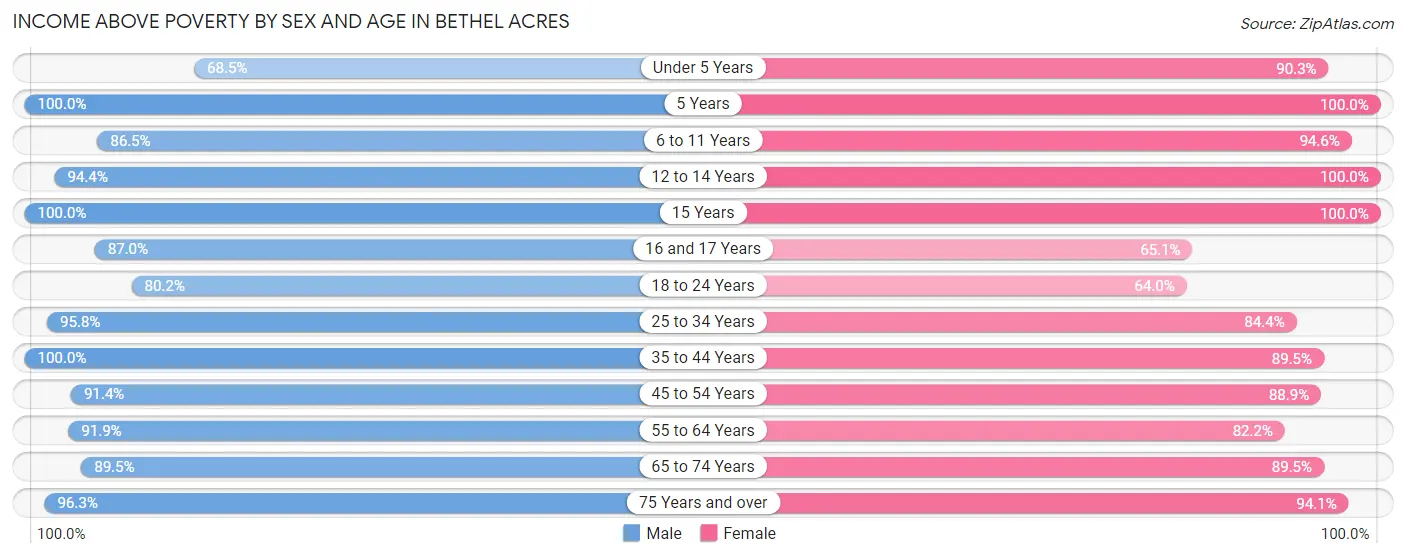
| Age Bracket | Male | Female |
| Under 5 Years | 61 (68.5%) | 56 (90.3%) |
| 5 Years | 8 (100.0%) | 6 (100.0%) |
| 6 to 11 Years | 64 (86.5%) | 159 (94.6%) |
| 12 to 14 Years | 119 (94.4%) | 85 (100.0%) |
| 15 Years | 35 (100.0%) | 12 (100.0%) |
| 16 and 17 Years | 40 (87.0%) | 41 (65.1%) |
| 18 to 24 Years | 109 (80.1%) | 64 (64.0%) |
| 25 to 34 Years | 253 (95.8%) | 184 (84.4%) |
| 35 to 44 Years | 151 (100.0%) | 187 (89.5%) |
| 45 to 54 Years | 138 (91.4%) | 185 (88.9%) |
| 55 to 64 Years | 203 (91.9%) | 134 (82.2%) |
| 65 to 74 Years | 102 (89.5%) | 85 (89.5%) |
| 75 Years and over | 104 (96.3%) | 79 (94.1%) |
| Total | 1,387 (91.1%) | 1,277 (86.7%) |
Income Below Poverty Among Married-Couple Families in Bethel Acres
The poverty statistics for married-couple families in Bethel Acres show that 5.8% or 40 of the total 689 families live below the poverty line. Families with 3 or 4 children have the highest poverty rate of 14.6%, comprising of 7 families. On the other hand, families with 5 or more children have the lowest poverty rate of 0.0%, which includes 0 families.
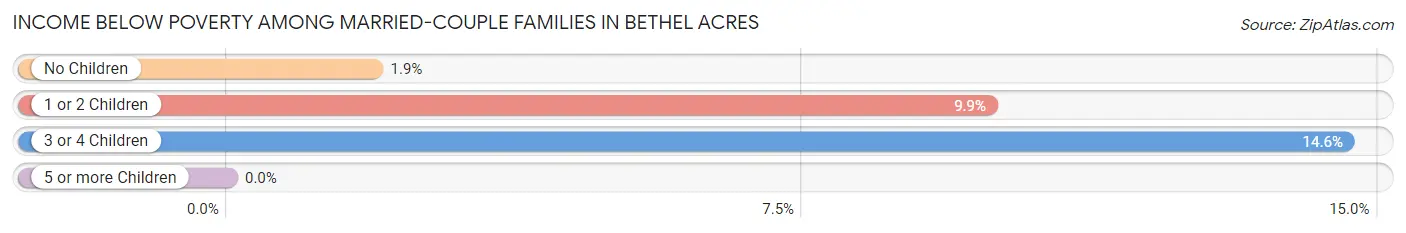
| Children | Above Poverty | Below Poverty |
| No Children | 362 (98.1%) | 7 (1.9%) |
| 1 or 2 Children | 236 (90.1%) | 26 (9.9%) |
| 3 or 4 Children | 41 (85.4%) | 7 (14.6%) |
| 5 or more Children | 10 (100.0%) | 0 (0.0%) |
| Total | 649 (94.2%) | 40 (5.8%) |
Income Below Poverty Among Single-Parent Households in Bethel Acres
According to the poverty data in Bethel Acres, 13.6% or 3 single-father households and 32.2% or 19 single-mother households are living below the poverty line. Among single-father households, those with 1 or 2 children have the highest poverty rate, with 3 households (16.7%) experiencing poverty. Likewise, among single-mother households, those with 1 or 2 children have the highest poverty rate, with 19 households (45.2%) falling below the poverty line.
| Children | Single Father | Single Mother |
| No Children | 0 (0.0%) | 0 (0.0%) |
| 1 or 2 Children | 3 (16.7%) | 19 (45.2%) |
| 3 or 4 Children | 0 (0.0%) | 0 (0.0%) |
| 5 or more Children | 0 (0.0%) | 0 (0.0%) |
| Total | 3 (13.6%) | 19 (32.2%) |
Income Below Poverty Among Married-Couple vs Single-Parent Households in Bethel Acres
The poverty data for Bethel Acres shows that 40 of the married-couple family households (5.8%) and 22 of the single-parent households (27.2%) are living below the poverty level. Within the married-couple family households, those with 3 or 4 children have the highest poverty rate, with 7 households (14.6%) falling below the poverty line. Among the single-parent households, those with 1 or 2 children have the highest poverty rate, with 22 household (36.7%) living below poverty.
| Children | Married-Couple Families | Single-Parent Households |
| No Children | 7 (1.9%) | 0 (0.0%) |
| 1 or 2 Children | 26 (9.9%) | 22 (36.7%) |
| 3 or 4 Children | 7 (14.6%) | 0 (0.0%) |
| 5 or more Children | 0 (0.0%) | 0 (0.0%) |
| Total | 40 (5.8%) | 22 (27.2%) |
Race in Bethel Acres
The most populous races in Bethel Acres are White / Caucasian (2,451 | 79.9%), Two or more Races (279 | 9.1%), and Native / Alaskan (271 | 8.8%).
| Race | # Population | % Population |
| Asian | 18 | 0.6% |
| Black / African American | 42 | 1.4% |
| Hawaiian / Pacific | 0 | 0.0% |
| Hispanic or Latino | 96 | 3.1% |
| Native / Alaskan | 271 | 8.8% |
| White / Caucasian | 2,451 | 79.9% |
| Two or more Races | 279 | 9.1% |
| Some other Race | 5 | 0.2% |
| Total | 3,066 | 100.0% |
Ancestry in Bethel Acres
The most populous ancestries reported in Bethel Acres are English (398 | 13.0%), American (385 | 12.6%), German (275 | 9.0%), Irish (234 | 7.6%), and European (162 | 5.3%), together accounting for 47.4% of all Bethel Acres residents.
| Ancestry | # Population | % Population |
| American | 385 | 12.6% |
| Bhutanese | 50 | 1.6% |
| Burmese | 53 | 1.7% |
| Canadian | 3 | 0.1% |
| Carpatho Rusyn | 8 | 0.3% |
| Cherokee | 51 | 1.7% |
| Chickasaw | 24 | 0.8% |
| Choctaw | 96 | 3.1% |
| Creek | 22 | 0.7% |
| Dutch | 15 | 0.5% |
| Dutch West Indian | 5 | 0.2% |
| Eastern European | 2 | 0.1% |
| English | 398 | 13.0% |
| European | 162 | 5.3% |
| French | 53 | 1.7% |
| German | 275 | 9.0% |
| Irish | 234 | 7.6% |
| Italian | 22 | 0.7% |
| Jamaican | 3 | 0.1% |
| Kiowa | 10 | 0.3% |
| Korean | 36 | 1.2% |
| Mexican | 96 | 3.1% |
| Northern European | 3 | 0.1% |
| Norwegian | 20 | 0.6% |
| Polish | 11 | 0.4% |
| Portuguese | 6 | 0.2% |
| Potawatomi | 72 | 2.4% |
| Scandinavian | 4 | 0.1% |
| Scotch-Irish | 16 | 0.5% |
| Scottish | 34 | 1.1% |
| Seminole | 46 | 1.5% |
| Serbian | 3 | 0.1% |
| Sri Lankan | 12 | 0.4% |
| Swedish | 11 | 0.4% |
| Swiss | 4 | 0.1% |
| Welsh | 5 | 0.2% | View All 36 Rows |
Immigrants in Bethel Acres
The most numerous immigrant groups reported in Bethel Acres came from Europe (16 | 0.5%), Germany (9 | 0.3%), Western Europe (9 | 0.3%), Eastern Europe (7 | 0.2%), and Ukraine (7 | 0.2%), together accounting for 1.6% of all Bethel Acres residents.
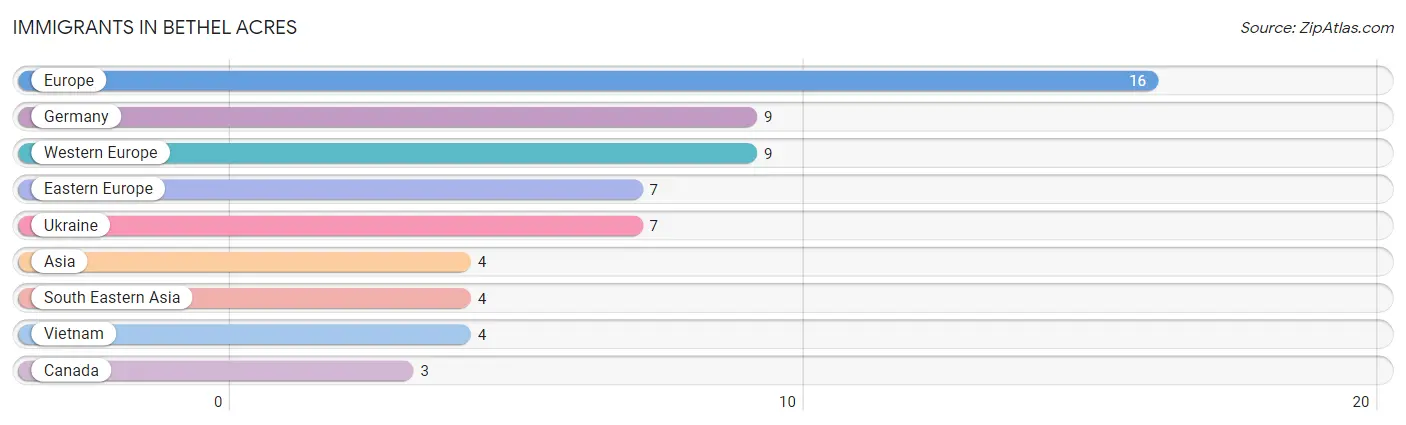
| Immigration Origin | # Population | % Population |
| Asia | 4 | 0.1% |
| Canada | 3 | 0.1% |
| Eastern Europe | 7 | 0.2% |
| Europe | 16 | 0.5% |
| Germany | 9 | 0.3% |
| South Eastern Asia | 4 | 0.1% |
| Ukraine | 7 | 0.2% |
| Vietnam | 4 | 0.1% |
| Western Europe | 9 | 0.3% | View All 9 Rows |
Sex and Age in Bethel Acres
Sex and Age in Bethel Acres
The most populous age groups in Bethel Acres are 30 to 34 Years (185 | 11.9%) for men and 10 to 14 Years (190 | 12.6%) for women.
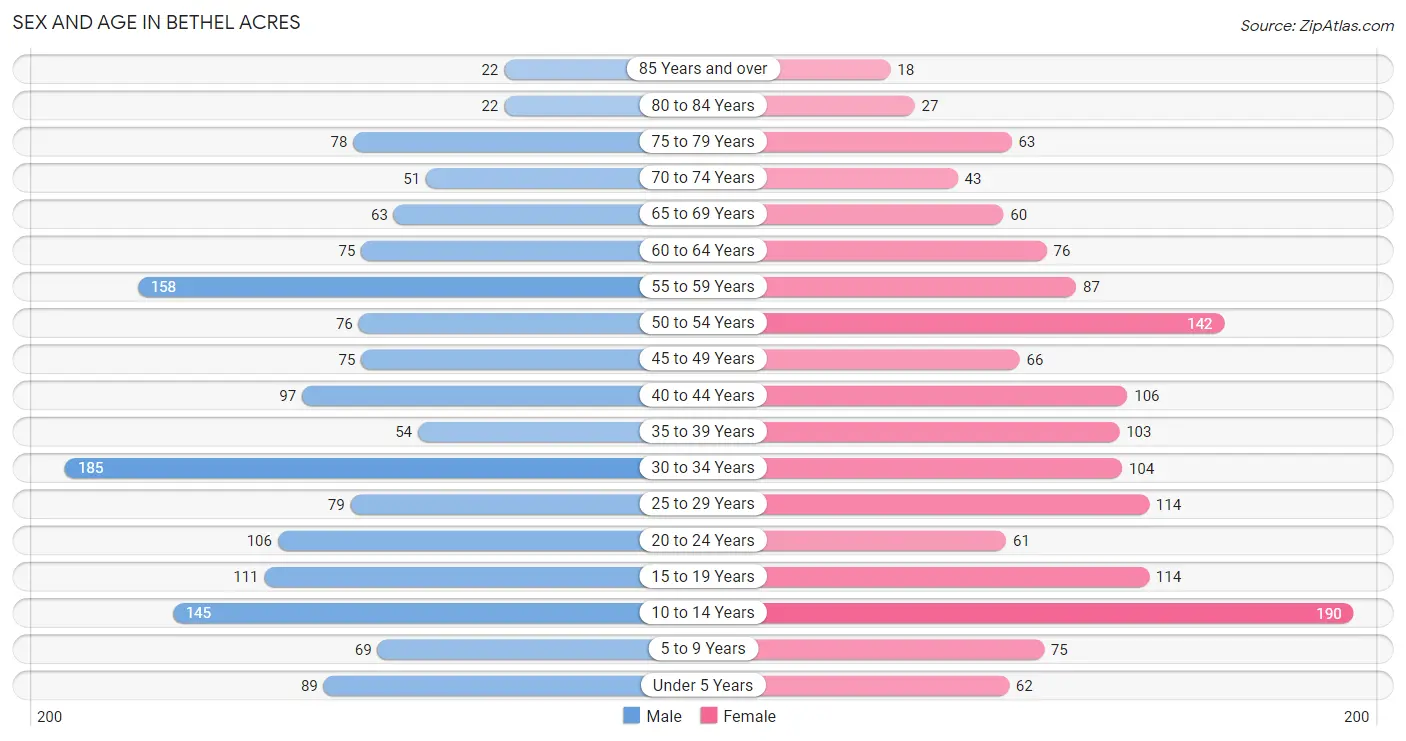
| Age Bracket | Male | Female |
| Under 5 Years | 89 (5.7%) | 62 (4.1%) |
| 5 to 9 Years | 69 (4.4%) | 75 (5.0%) |
| 10 to 14 Years | 145 (9.3%) | 190 (12.6%) |
| 15 to 19 Years | 111 (7.1%) | 114 (7.5%) |
| 20 to 24 Years | 106 (6.8%) | 61 (4.0%) |
| 25 to 29 Years | 79 (5.1%) | 114 (7.5%) |
| 30 to 34 Years | 185 (11.9%) | 104 (6.9%) |
| 35 to 39 Years | 54 (3.5%) | 103 (6.8%) |
| 40 to 44 Years | 97 (6.2%) | 106 (7.0%) |
| 45 to 49 Years | 75 (4.8%) | 66 (4.4%) |
| 50 to 54 Years | 76 (4.9%) | 142 (9.4%) |
| 55 to 59 Years | 158 (10.2%) | 87 (5.8%) |
| 60 to 64 Years | 75 (4.8%) | 76 (5.0%) |
| 65 to 69 Years | 63 (4.1%) | 60 (4.0%) |
| 70 to 74 Years | 51 (3.3%) | 43 (2.9%) |
| 75 to 79 Years | 78 (5.0%) | 63 (4.2%) |
| 80 to 84 Years | 22 (1.4%) | 27 (1.8%) |
| 85 Years and over | 22 (1.4%) | 18 (1.2%) |
| Total | 1,555 (100.0%) | 1,511 (100.0%) |
Families and Households in Bethel Acres
Median Family Size in Bethel Acres
The median family size in Bethel Acres is 3.42 persons per family, with single female/mother families (59 | 7.7%) accounting for the largest median family size of 3.59 persons per family. On the other hand, single male/father families (22 | 2.9%) represent the smallest median family size with 2.82 persons per family.
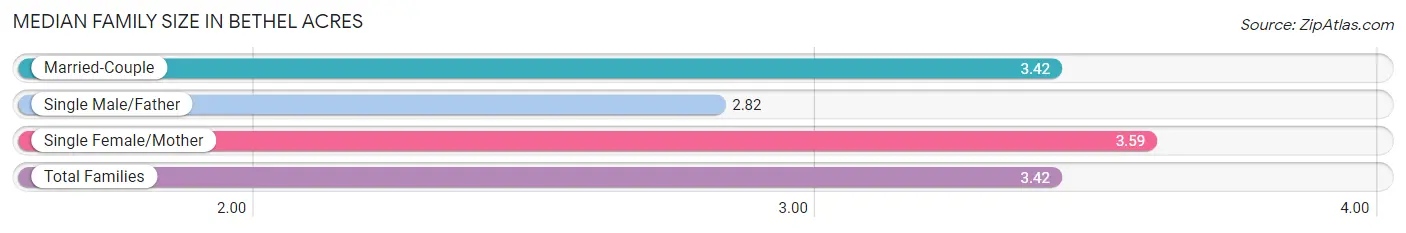
| Family Type | # Families | Family Size |
| Married-Couple | 689 (89.5%) | 3.42 |
| Single Male/Father | 22 (2.9%) | 2.82 |
| Single Female/Mother | 59 (7.7%) | 3.59 |
| Total Families | 770 (100.0%) | 3.42 |
Median Household Size in Bethel Acres
The median household size in Bethel Acres is 2.87 persons per household, with single female/mother households (59 | 5.6%) accounting for the largest median household size of 3.86 persons per household. non-family households (279 | 26.6%) represent the smallest median household size with 1.14 persons per household.
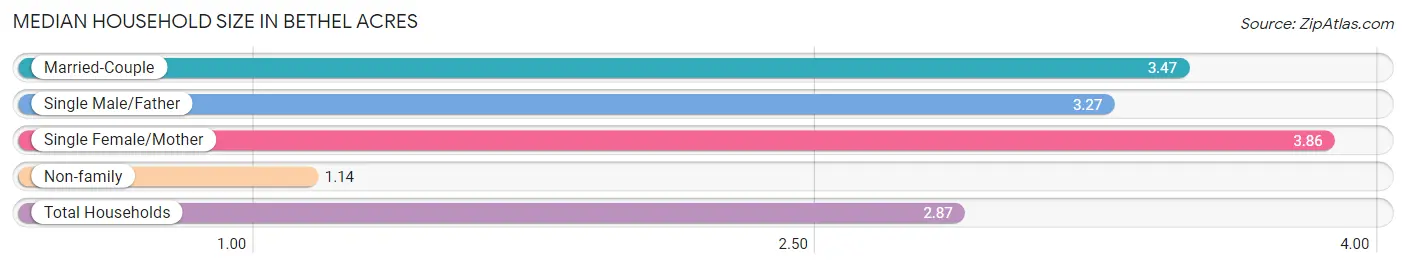
| Household Type | # Households | Household Size |
| Married-Couple | 689 (65.7%) | 3.47 |
| Single Male/Father | 22 (2.1%) | 3.27 |
| Single Female/Mother | 59 (5.6%) | 3.86 |
| Non-family | 279 (26.6%) | 1.14 |
| Total Households | 1,049 (100.0%) | 2.87 |
Household Size by Marriage Status in Bethel Acres
Out of a total of 1,049 households in Bethel Acres, 770 (73.4%) are family households, while 279 (26.6%) are nonfamily households. The most numerous type of family households are 2-person households, comprising 306, and the most common type of nonfamily households are 1-person households, comprising 243.
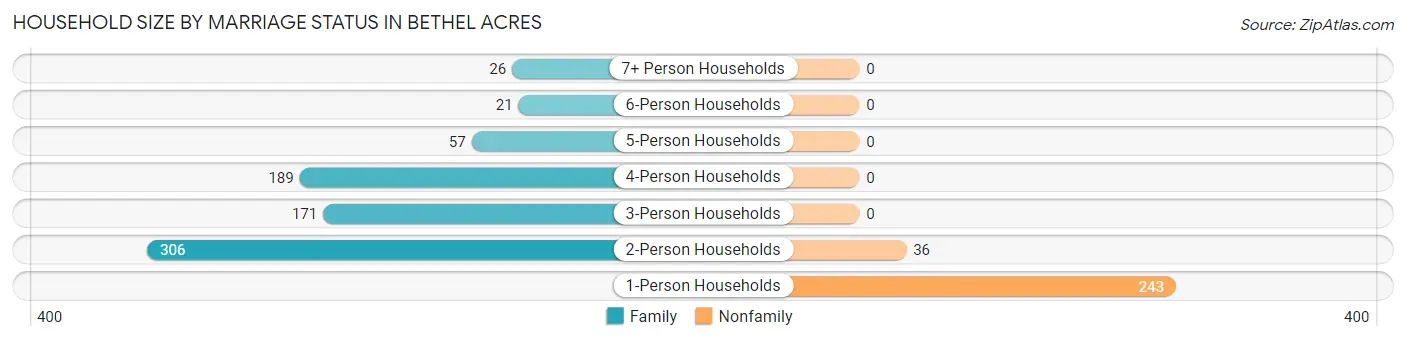
| Household Size | Family Households | Nonfamily Households |
| 1-Person Households | - | 243 (23.2%) |
| 2-Person Households | 306 (29.2%) | 36 (3.4%) |
| 3-Person Households | 171 (16.3%) | 0 (0.0%) |
| 4-Person Households | 189 (18.0%) | 0 (0.0%) |
| 5-Person Households | 57 (5.4%) | 0 (0.0%) |
| 6-Person Households | 21 (2.0%) | 0 (0.0%) |
| 7+ Person Households | 26 (2.5%) | 0 (0.0%) |
| Total | 770 (73.4%) | 279 (26.6%) |
Female Fertility in Bethel Acres
Fertility by Age in Bethel Acres
Average fertility rate in Bethel Acres is 31.0 births per 1,000 women. Women in the age bracket of 20 to 34 years have the highest fertility rate with 79.0 births per 1,000 women. Women in the age bracket of 20 to 34 years acount for 100.0% of all women with births.
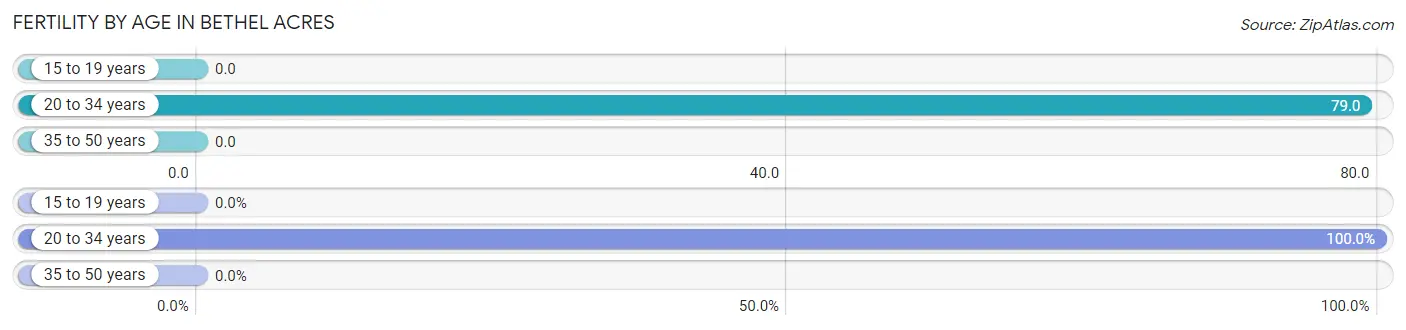
| Age Bracket | Women with Births | Births / 1,000 Women |
| 15 to 19 years | 0 (0.0%) | 0.0 |
| 20 to 34 years | 22 (100.0%) | 79.0 |
| 35 to 50 years | 0 (0.0%) | 0.0 |
| Total | 22 (100.0%) | 31.0 |
Fertility by Age by Marriage Status in Bethel Acres
27.3% of women with births (22) in Bethel Acres are married. The highest percentage of unmarried women with births falls into 20 to 34 years age bracket with 72.7% of them unmarried at the time of birth, while the lowest percentage of unmarried women with births belong to 20 to 34 years age bracket with 72.7% of them unmarried.
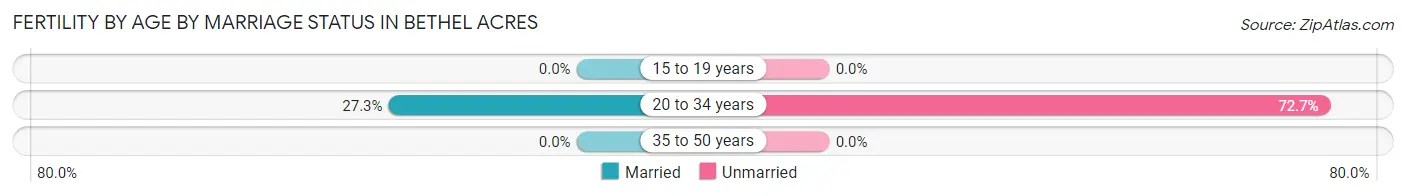
| Age Bracket | Married | Unmarried |
| 15 to 19 years | 0 (0.0%) | 0 (0.0%) |
| 20 to 34 years | 6 (27.3%) | 16 (72.7%) |
| 35 to 50 years | 0 (0.0%) | 0 (0.0%) |
| Total | 6 (27.3%) | 16 (72.7%) |
Fertility by Education in Bethel Acres
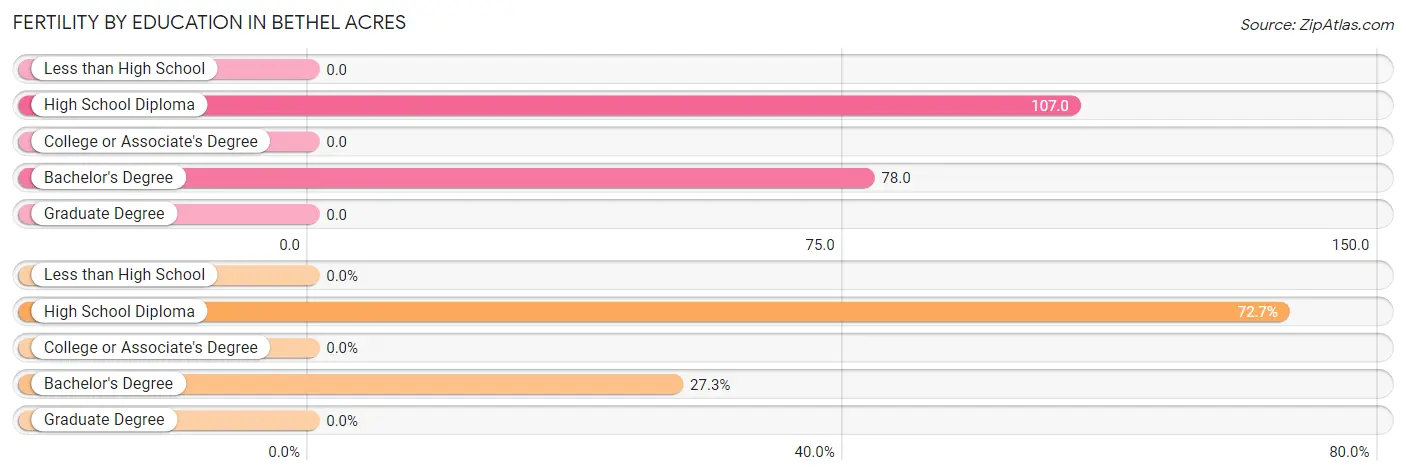
| Educational Attainment | Women with Births | Births / 1,000 Women |
| Less than High School | 0 (0.0%) | 0.0 |
| High School Diploma | 16 (72.7%) | 107.0 |
| College or Associate's Degree | 0 (0.0%) | 0.0 |
| Bachelor's Degree | 6 (27.3%) | 78.0 |
| Graduate Degree | 0 (0.0%) | 0.0 |
| Total | 22 (100.0%) | 31.0 |
Fertility by Education by Marriage Status in Bethel Acres
72.7% of women with births in Bethel Acres are unmarried. Women with the educational attainment of bachelor's degree are most likely to be married with 100.0% of them married at childbirth, while women with the educational attainment of high school diploma are least likely to be married with 100.0% of them unmarried at childbirth.
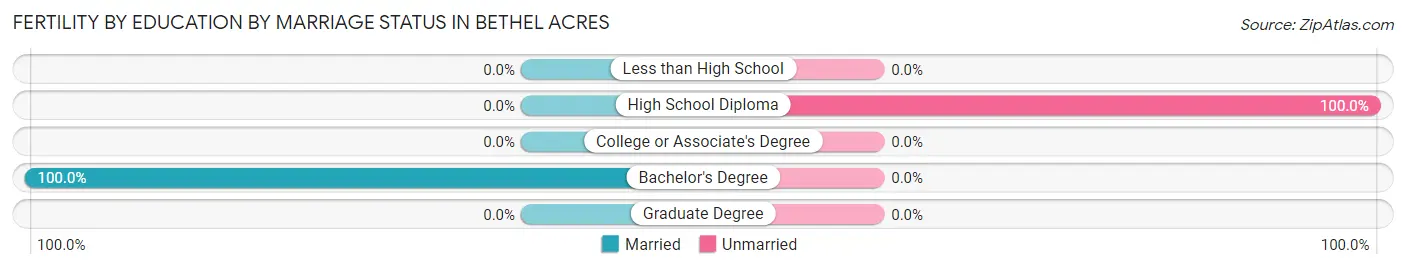
| Educational Attainment | Married | Unmarried |
| Less than High School | 0 (0.0%) | 0 (0.0%) |
| High School Diploma | 0 (0.0%) | 16 (100.0%) |
| College or Associate's Degree | 0 (0.0%) | 0 (0.0%) |
| Bachelor's Degree | 6 (100.0%) | 0 (0.0%) |
| Graduate Degree | 0 (0.0%) | 0 (0.0%) |
| Total | 6 (27.3%) | 16 (72.7%) |
Employment Characteristics in Bethel Acres
Employment by Class of Employer in Bethel Acres
Among the 1,412 employed individuals in Bethel Acres, private company employees (902 | 63.9%), federal government employees (164 | 11.6%), and local government employees (109 | 7.7%) make up the most common classes of employment.
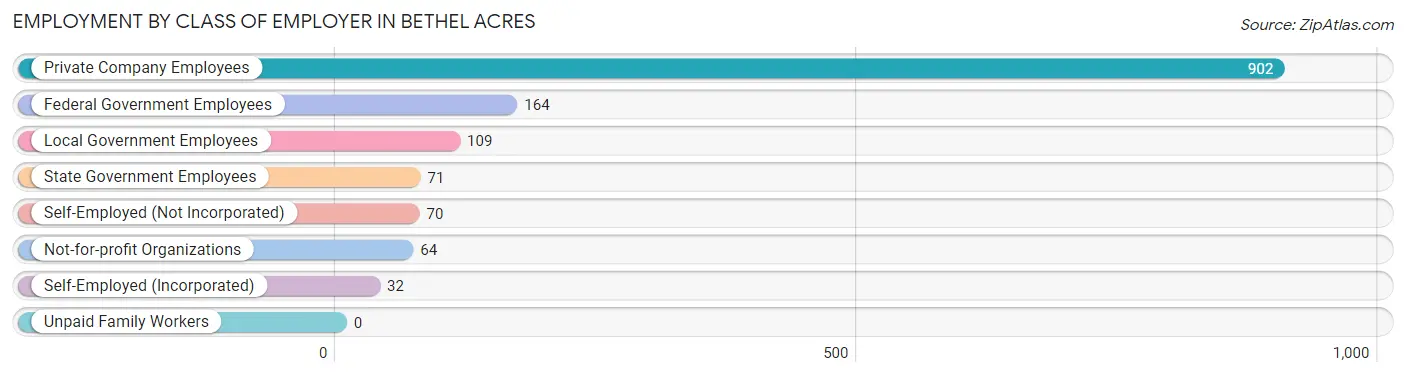
| Employer Class | # Employees | % Employees |
| Private Company Employees | 902 | 63.9% |
| Self-Employed (Incorporated) | 32 | 2.3% |
| Self-Employed (Not Incorporated) | 70 | 5.0% |
| Not-for-profit Organizations | 64 | 4.5% |
| Local Government Employees | 109 | 7.7% |
| State Government Employees | 71 | 5.0% |
| Federal Government Employees | 164 | 11.6% |
| Unpaid Family Workers | 0 | 0.0% |
| Total | 1,412 | 100.0% |
Employment Status by Age in Bethel Acres
According to the labor force statistics for Bethel Acres, out of the total population over 16 years of age (2,389), 60.4% or 1,443 individuals are in the labor force, with 1.8% or 26 of them unemployed. The age group with the highest labor force participation rate is 30 to 34 years, with 97.6% or 282 individuals in the labor force. Within the labor force, the 25 to 29 years age range has the highest percentage of unemployed individuals, with 4.3% or 6 of them being unemployed.
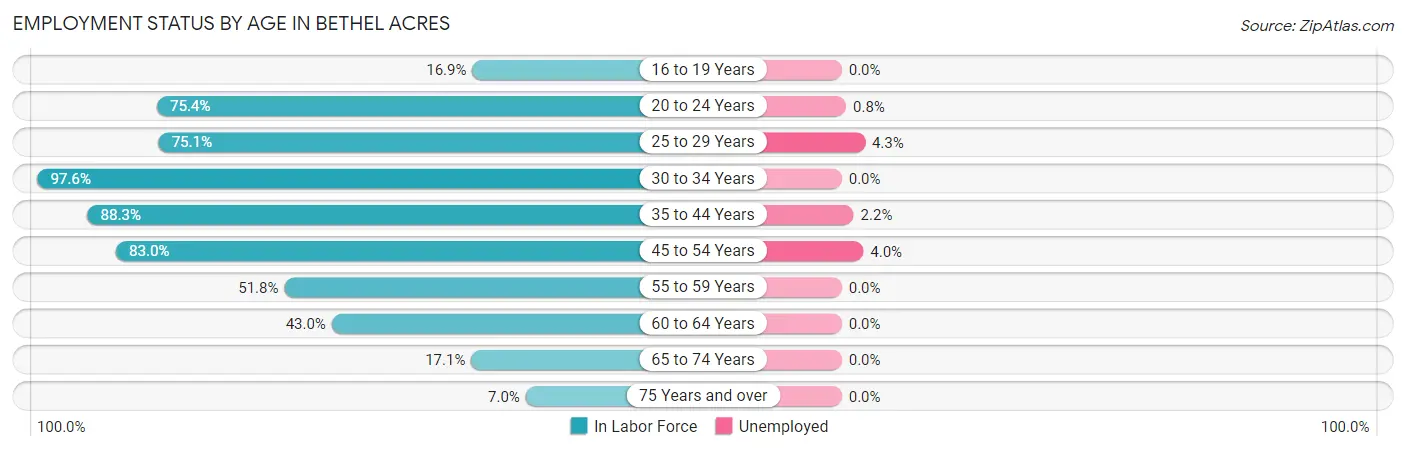
| Age Bracket | In Labor Force | Unemployed |
| 16 to 19 Years | 30 (16.9%) | 0 (0.0%) |
| 20 to 24 Years | 126 (75.4%) | 1 (0.8%) |
| 25 to 29 Years | 145 (75.1%) | 6 (4.3%) |
| 30 to 34 Years | 282 (97.6%) | 0 (0.0%) |
| 35 to 44 Years | 318 (88.3%) | 7 (2.2%) |
| 45 to 54 Years | 298 (83.0%) | 12 (4.0%) |
| 55 to 59 Years | 127 (51.8%) | 0 (0.0%) |
| 60 to 64 Years | 65 (43.0%) | 0 (0.0%) |
| 65 to 74 Years | 37 (17.1%) | 0 (0.0%) |
| 75 Years and over | 16 (7.0%) | 0 (0.0%) |
| Total | 1,443 (60.4%) | 26 (1.8%) |
Employment Status by Educational Attainment in Bethel Acres
According to labor force statistics for Bethel Acres, 77.3% of individuals (1,234) out of the total population between 25 and 64 years of age (1,597) are in the labor force, with 2.0% or 25 of them being unemployed. The group with the highest labor force participation rate are those with the educational attainment of bachelor's degree or higher, with 92.9% or 326 individuals in the labor force. Within the labor force, individuals with high school diploma education have the highest percentage of unemployment, with 6.8% or 25 of them being unemployed.
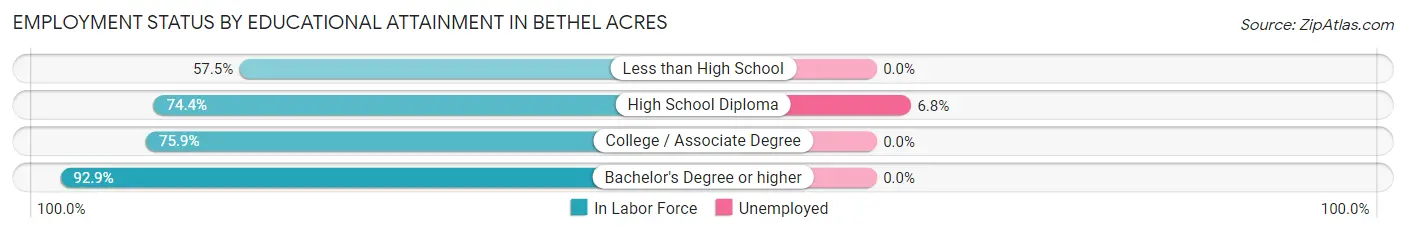
| Educational Attainment | In Labor Force | Unemployed |
| Less than High School | 92 (57.5%) | 0 (0.0%) |
| High School Diploma | 369 (74.4%) | 34 (6.8%) |
| College / Associate Degree | 448 (75.9%) | 0 (0.0%) |
| Bachelor's Degree or higher | 326 (92.9%) | 0 (0.0%) |
| Total | 1,234 (77.3%) | 32 (2.0%) |
Employment Occupations by Sex in Bethel Acres
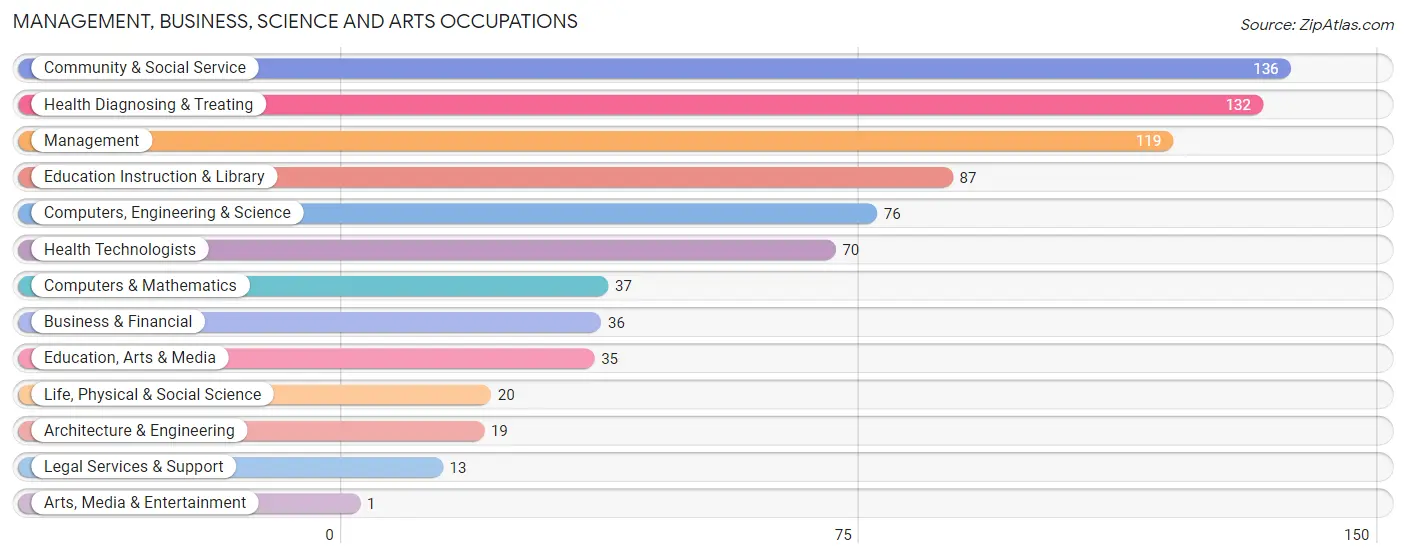
Management, Business, Science and Arts Occupations
The most common Management, Business, Science and Arts occupations in Bethel Acres are Community & Social Service (136 | 9.7%), Health Diagnosing & Treating (132 | 9.4%), Management (119 | 8.5%), Education Instruction & Library (87 | 6.2%), and Computers, Engineering & Science (76 | 5.4%).
Management, Business, Science and Arts Occupations by Sex
Within the Management, Business, Science and Arts occupations in Bethel Acres, the most male-oriented occupations are Arts, Media & Entertainment (100.0%), Architecture & Engineering (78.9%), and Computers & Mathematics (64.9%), while the most female-oriented occupations are Education, Arts & Media (100.0%), Legal Services & Support (100.0%), and Health Diagnosing & Treating (100.0%).
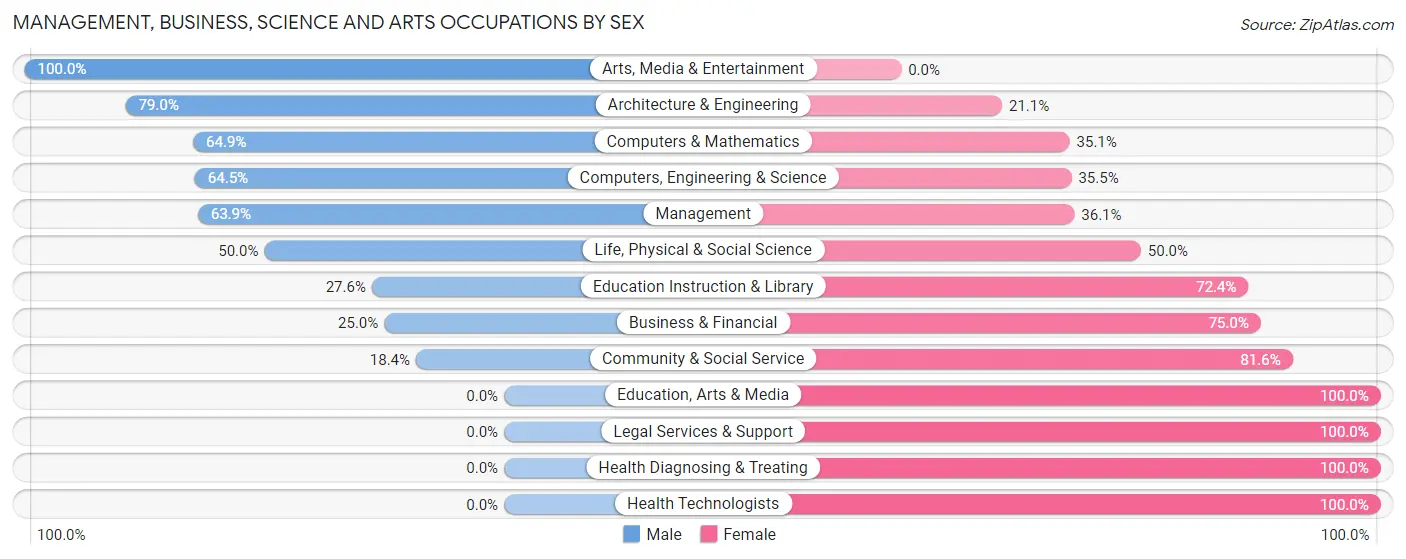
| Occupation | Male | Female |
| Management | 76 (63.9%) | 43 (36.1%) |
| Business & Financial | 9 (25.0%) | 27 (75.0%) |
| Computers, Engineering & Science | 49 (64.5%) | 27 (35.5%) |
| Computers & Mathematics | 24 (64.9%) | 13 (35.1%) |
| Architecture & Engineering | 15 (78.9%) | 4 (21.0%) |
| Life, Physical & Social Science | 10 (50.0%) | 10 (50.0%) |
| Community & Social Service | 25 (18.4%) | 111 (81.6%) |
| Education, Arts & Media | 0 (0.0%) | 35 (100.0%) |
| Legal Services & Support | 0 (0.0%) | 13 (100.0%) |
| Education Instruction & Library | 24 (27.6%) | 63 (72.4%) |
| Arts, Media & Entertainment | 1 (100.0%) | 0 (0.0%) |
| Health Diagnosing & Treating | 0 (0.0%) | 132 (100.0%) |
| Health Technologists | 0 (0.0%) | 70 (100.0%) |
| Total (Category) | 159 (31.9%) | 340 (68.1%) |
| Total (Overall) | 744 (52.9%) | 662 (47.1%) |
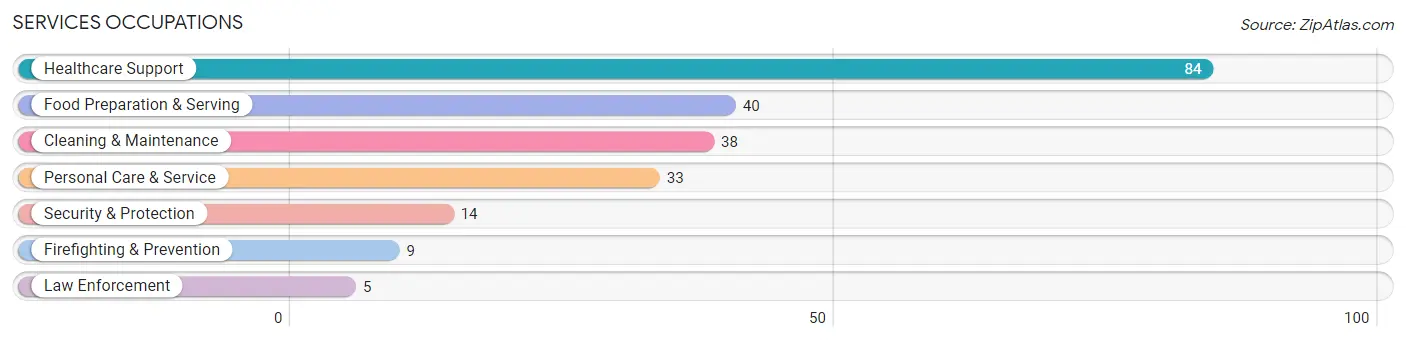
Services Occupations
The most common Services occupations in Bethel Acres are Healthcare Support (84 | 6.0%), Food Preparation & Serving (40 | 2.8%), Cleaning & Maintenance (38 | 2.7%), Personal Care & Service (33 | 2.4%), and Security & Protection (14 | 1.0%).
Services Occupations by Sex
Within the Services occupations in Bethel Acres, the most male-oriented occupations are Firefighting & Prevention (100.0%), Cleaning & Maintenance (89.5%), and Food Preparation & Serving (75.0%), while the most female-oriented occupations are Law Enforcement (100.0%), Personal Care & Service (84.9%), and Healthcare Support (36.9%).
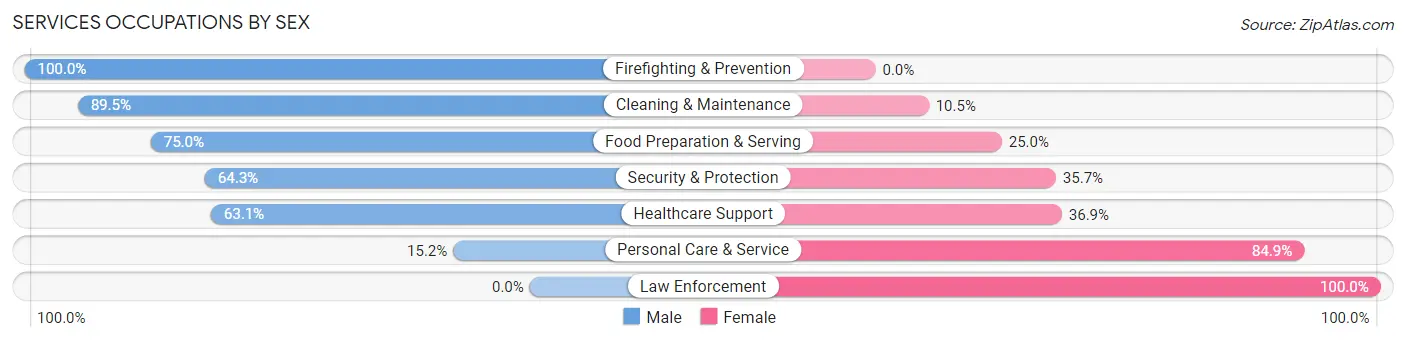
| Occupation | Male | Female |
| Healthcare Support | 53 (63.1%) | 31 (36.9%) |
| Security & Protection | 9 (64.3%) | 5 (35.7%) |
| Firefighting & Prevention | 9 (100.0%) | 0 (0.0%) |
| Law Enforcement | 0 (0.0%) | 5 (100.0%) |
| Food Preparation & Serving | 30 (75.0%) | 10 (25.0%) |
| Cleaning & Maintenance | 34 (89.5%) | 4 (10.5%) |
| Personal Care & Service | 5 (15.1%) | 28 (84.9%) |
| Total (Category) | 131 (62.7%) | 78 (37.3%) |
| Total (Overall) | 744 (52.9%) | 662 (47.1%) |
Sales and Office Occupations
The most common Sales and Office occupations in Bethel Acres are Office & Administration (204 | 14.5%), and Sales & Related (102 | 7.2%).
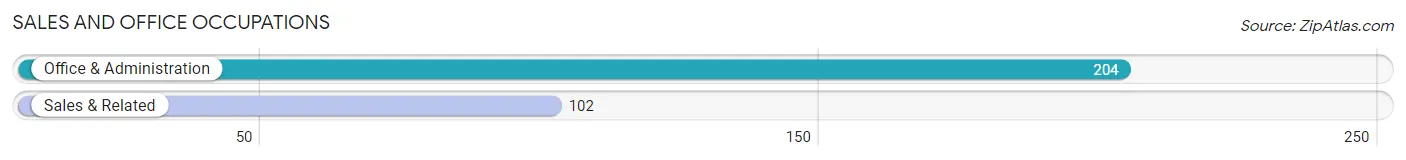
Sales and Office Occupations by Sex
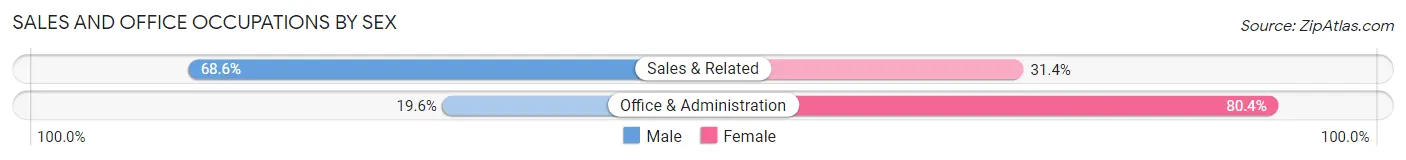
| Occupation | Male | Female |
| Sales & Related | 70 (68.6%) | 32 (31.4%) |
| Office & Administration | 40 (19.6%) | 164 (80.4%) |
| Total (Category) | 110 (35.9%) | 196 (64.0%) |
| Total (Overall) | 744 (52.9%) | 662 (47.1%) |
Natural Resources, Construction and Maintenance Occupations
The most common Natural Resources, Construction and Maintenance occupations in Bethel Acres are Construction & Extraction (126 | 9.0%), Installation, Maintenance & Repair (87 | 6.2%), and Farming, Fishing & Forestry (24 | 1.7%).
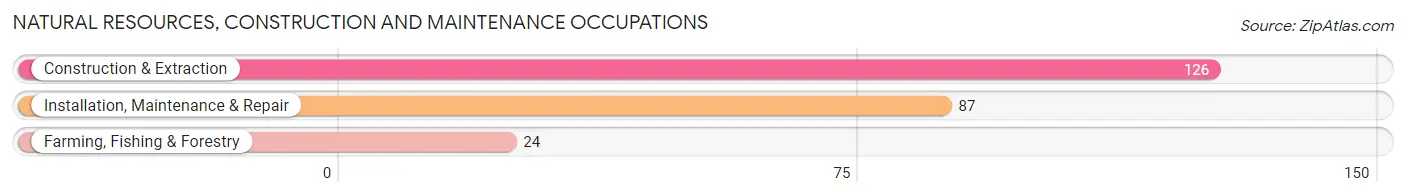
Natural Resources, Construction and Maintenance Occupations by Sex
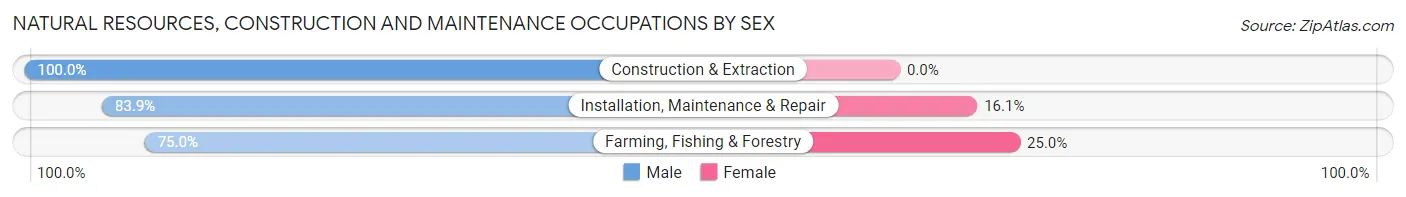
| Occupation | Male | Female |
| Farming, Fishing & Forestry | 18 (75.0%) | 6 (25.0%) |
| Construction & Extraction | 126 (100.0%) | 0 (0.0%) |
| Installation, Maintenance & Repair | 73 (83.9%) | 14 (16.1%) |
| Total (Category) | 217 (91.6%) | 20 (8.4%) |
| Total (Overall) | 744 (52.9%) | 662 (47.1%) |
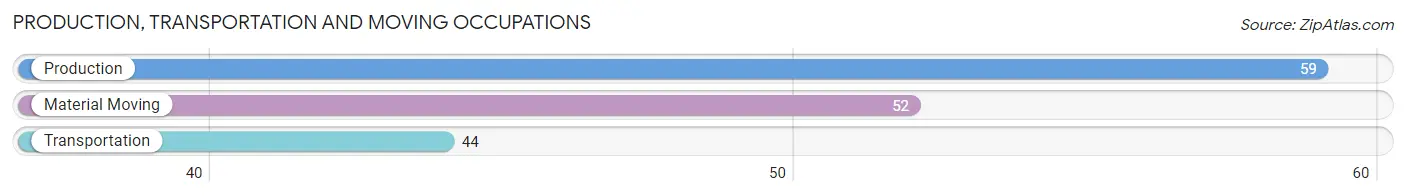
Production, Transportation and Moving Occupations
The most common Production, Transportation and Moving occupations in Bethel Acres are Production (59 | 4.2%), Material Moving (52 | 3.7%), and Transportation (44 | 3.1%).
Production, Transportation and Moving Occupations by Sex
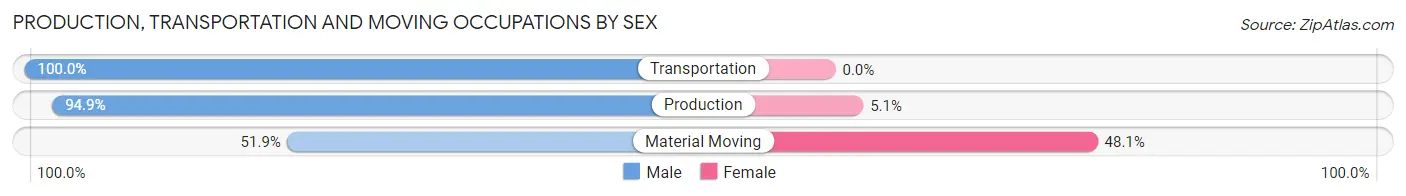
| Occupation | Male | Female |
| Production | 56 (94.9%) | 3 (5.1%) |
| Transportation | 44 (100.0%) | 0 (0.0%) |
| Material Moving | 27 (51.9%) | 25 (48.1%) |
| Total (Category) | 127 (81.9%) | 28 (18.1%) |
| Total (Overall) | 744 (52.9%) | 662 (47.1%) |
Employment Industries by Sex in Bethel Acres
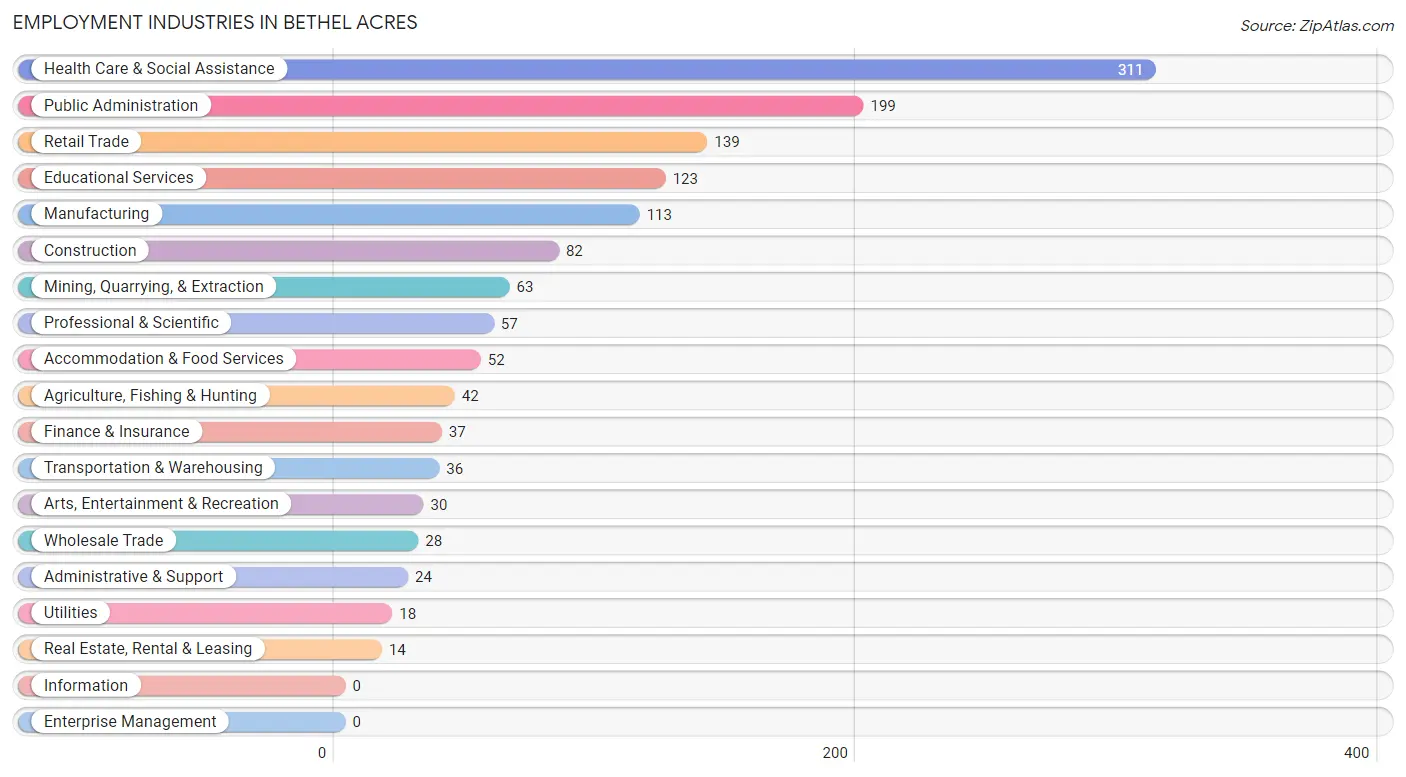
Employment Industries in Bethel Acres
The major employment industries in Bethel Acres include Health Care & Social Assistance (311 | 22.1%), Public Administration (199 | 14.1%), Retail Trade (139 | 9.9%), Educational Services (123 | 8.7%), and Manufacturing (113 | 8.0%).
Employment Industries by Sex in Bethel Acres
The Bethel Acres industries that see more men than women are Mining, Quarrying, & Extraction (100.0%), Wholesale Trade (100.0%), and Utilities (100.0%), whereas the industries that tend to have a higher number of women are Educational Services (81.3%), Health Care & Social Assistance (78.1%), and Real Estate, Rental & Leasing (71.4%).
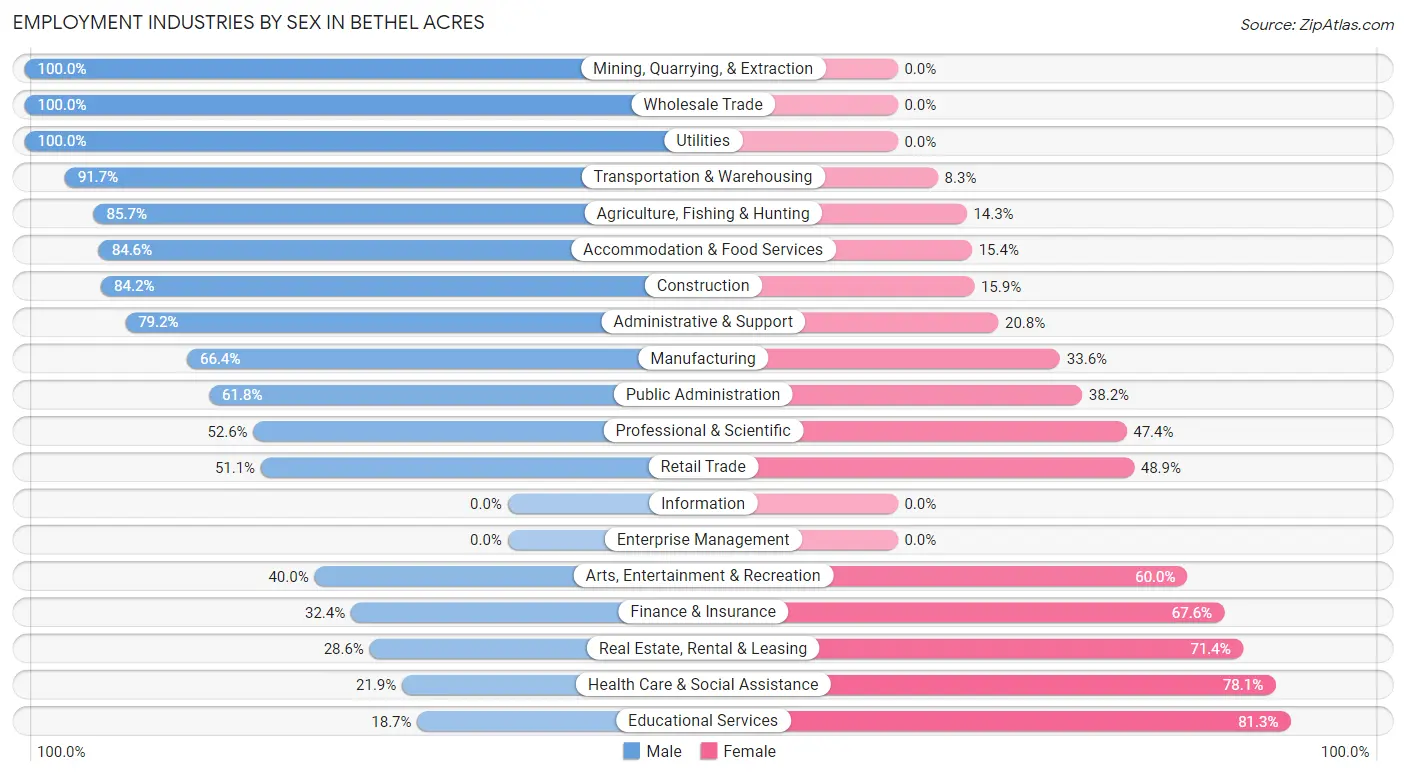
| Industry | Male | Female |
| Agriculture, Fishing & Hunting | 36 (85.7%) | 6 (14.3%) |
| Mining, Quarrying, & Extraction | 63 (100.0%) | 0 (0.0%) |
| Construction | 69 (84.2%) | 13 (15.9%) |
| Manufacturing | 75 (66.4%) | 38 (33.6%) |
| Wholesale Trade | 28 (100.0%) | 0 (0.0%) |
| Retail Trade | 71 (51.1%) | 68 (48.9%) |
| Transportation & Warehousing | 33 (91.7%) | 3 (8.3%) |
| Utilities | 18 (100.0%) | 0 (0.0%) |
| Information | 0 (0.0%) | 0 (0.0%) |
| Finance & Insurance | 12 (32.4%) | 25 (67.6%) |
| Real Estate, Rental & Leasing | 4 (28.6%) | 10 (71.4%) |
| Professional & Scientific | 30 (52.6%) | 27 (47.4%) |
| Enterprise Management | 0 (0.0%) | 0 (0.0%) |
| Administrative & Support | 19 (79.2%) | 5 (20.8%) |
| Educational Services | 23 (18.7%) | 100 (81.3%) |
| Health Care & Social Assistance | 68 (21.9%) | 243 (78.1%) |
| Arts, Entertainment & Recreation | 12 (40.0%) | 18 (60.0%) |
| Accommodation & Food Services | 44 (84.6%) | 8 (15.4%) |
| Public Administration | 123 (61.8%) | 76 (38.2%) |
| Total | 744 (52.9%) | 662 (47.1%) |
Education in Bethel Acres
School Enrollment in Bethel Acres
The most common levels of schooling among the 879 students in Bethel Acres are middle school (299 | 34.0%), high school (212 | 24.1%), and elementary school (116 | 13.2%).
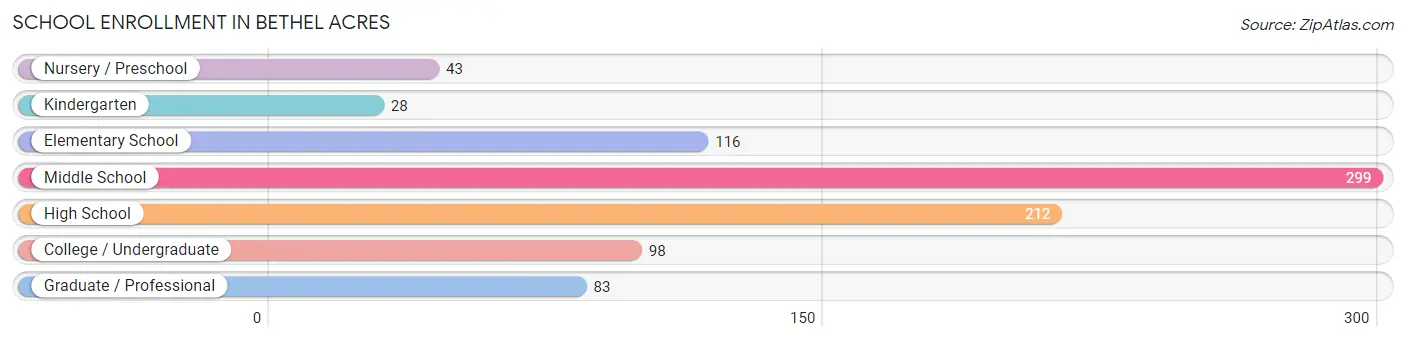
| School Level | # Students | % Students |
| Nursery / Preschool | 43 | 4.9% |
| Kindergarten | 28 | 3.2% |
| Elementary School | 116 | 13.2% |
| Middle School | 299 | 34.0% |
| High School | 212 | 24.1% |
| College / Undergraduate | 98 | 11.2% |
| Graduate / Professional | 83 | 9.4% |
| Total | 879 | 100.0% |
School Enrollment by Age by Funding Source in Bethel Acres
Out of a total of 879 students who are enrolled in schools in Bethel Acres, 88 (10.0%) attend a private institution, while the remaining 791 (90.0%) are enrolled in public schools. The age group of 35 years and over has the highest likelihood of being enrolled in private schools, with 22 (50.0% in the age bracket) enrolled. Conversely, the age group of 20 to 24 year olds has the lowest likelihood of being enrolled in a private school, with 58 (100.0% in the age bracket) attending a public institution.
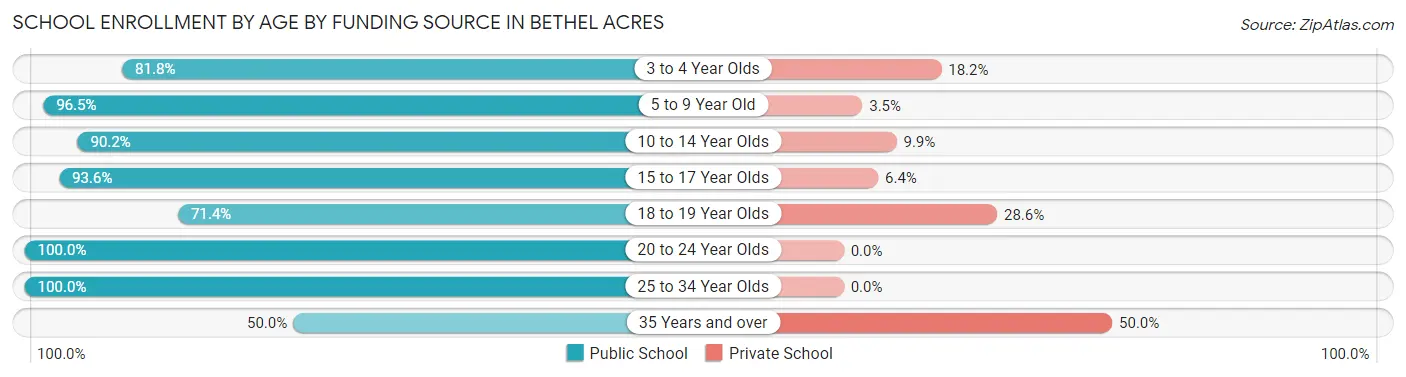
| Age Bracket | Public School | Private School |
| 3 to 4 Year Olds | 27 (81.8%) | 6 (18.2%) |
| 5 to 9 Year Old | 139 (96.5%) | 5 (3.5%) |
| 10 to 14 Year Olds | 302 (90.1%) | 33 (9.9%) |
| 15 to 17 Year Olds | 146 (93.6%) | 10 (6.4%) |
| 18 to 19 Year Olds | 30 (71.4%) | 12 (28.6%) |
| 20 to 24 Year Olds | 58 (100.0%) | 0 (0.0%) |
| 25 to 34 Year Olds | 67 (100.0%) | 0 (0.0%) |
| 35 Years and over | 22 (50.0%) | 22 (50.0%) |
| Total | 791 (90.0%) | 88 (10.0%) |
Educational Attainment by Field of Study in Bethel Acres
Bio, nature & agricultural (86 | 18.0%), business (80 | 16.8%), education (78 | 16.4%), psychology (57 | 11.9%), and science & technology (50 | 10.5%) are the most common fields of study among 477 individuals in Bethel Acres who have obtained a bachelor's degree or higher.
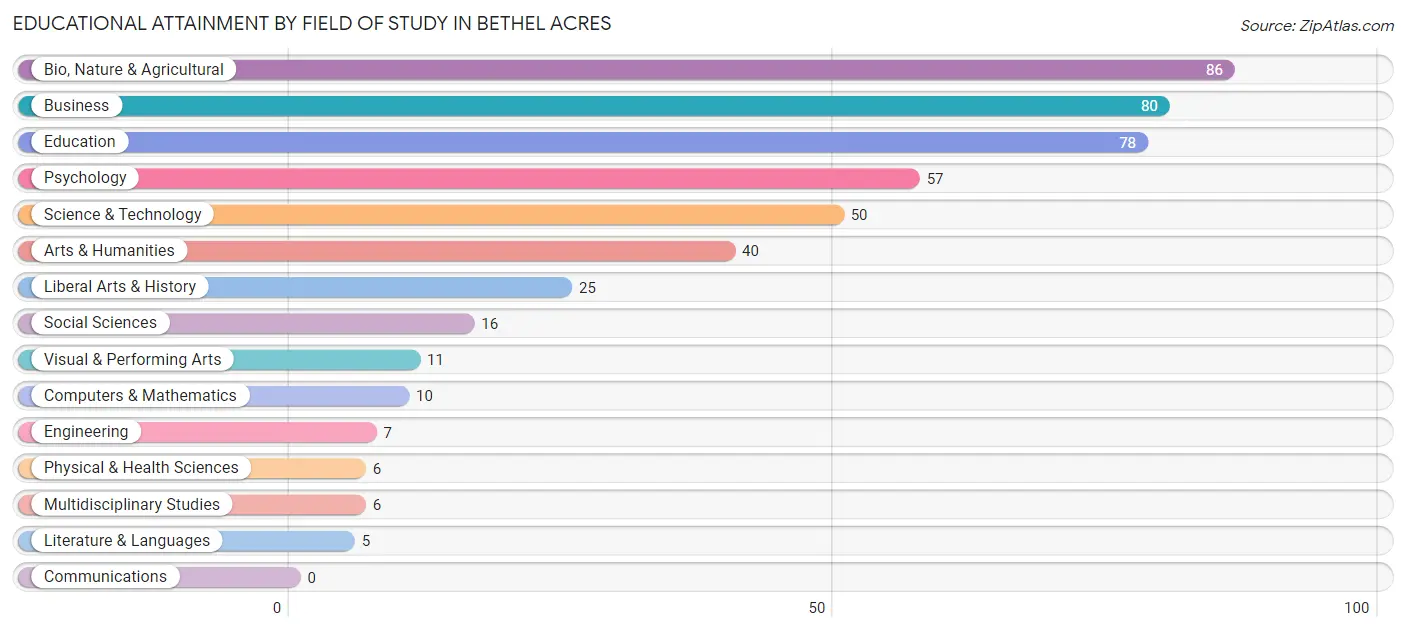
| Field of Study | # Graduates | % Graduates |
| Computers & Mathematics | 10 | 2.1% |
| Bio, Nature & Agricultural | 86 | 18.0% |
| Physical & Health Sciences | 6 | 1.3% |
| Psychology | 57 | 11.9% |
| Social Sciences | 16 | 3.4% |
| Engineering | 7 | 1.5% |
| Multidisciplinary Studies | 6 | 1.3% |
| Science & Technology | 50 | 10.5% |
| Business | 80 | 16.8% |
| Education | 78 | 16.4% |
| Literature & Languages | 5 | 1.1% |
| Liberal Arts & History | 25 | 5.2% |
| Visual & Performing Arts | 11 | 2.3% |
| Communications | 0 | 0.0% |
| Arts & Humanities | 40 | 8.4% |
| Total | 477 | 100.0% |
Transportation & Commute in Bethel Acres
Vehicle Availability by Sex in Bethel Acres
The most prevalent vehicle ownership categories in Bethel Acres are males with 2 vehicles (258, accounting for 34.4%) and females with 2 vehicles (254, making up 39.0%).
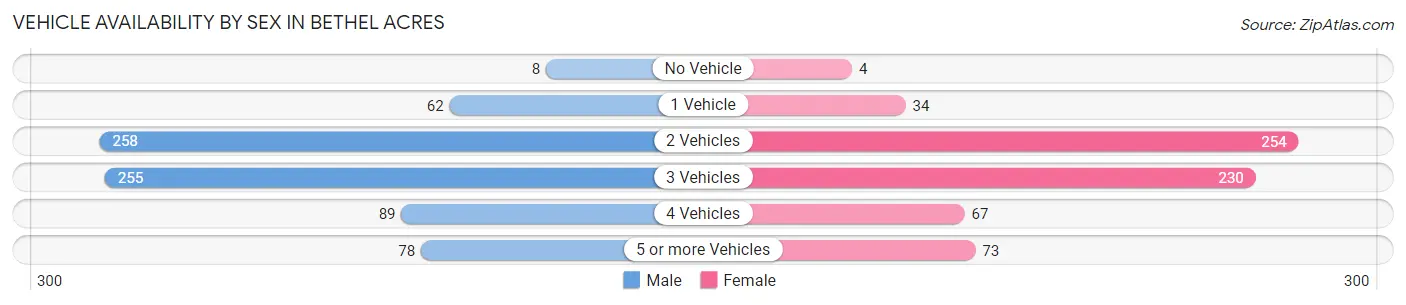
| Vehicles Available | Male | Female |
| No Vehicle | 8 (1.1%) | 4 (0.6%) |
| 1 Vehicle | 62 (8.3%) | 34 (5.1%) |
| 2 Vehicles | 258 (34.4%) | 254 (38.4%) |
| 3 Vehicles | 255 (34.0%) | 230 (34.7%) |
| 4 Vehicles | 89 (11.9%) | 67 (10.1%) |
| 5 or more Vehicles | 78 (10.4%) | 73 (11.0%) |
| Total | 750 (100.0%) | 662 (100.0%) |
Commute Time in Bethel Acres
The most frequently occuring commute durations in Bethel Acres are 30 to 34 minutes (246 commuters, 18.2%), 45 to 59 minutes (238 commuters, 17.6%), and 15 to 19 minutes (192 commuters, 14.2%).
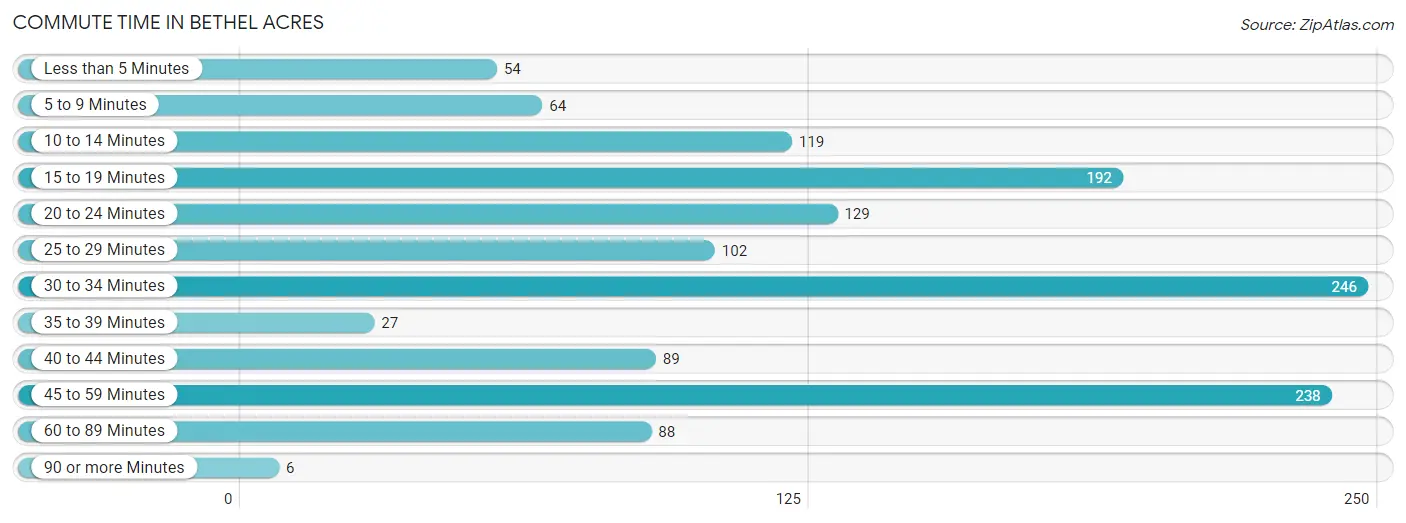
| Commute Time | # Commuters | % Commuters |
| Less than 5 Minutes | 54 | 4.0% |
| 5 to 9 Minutes | 64 | 4.7% |
| 10 to 14 Minutes | 119 | 8.8% |
| 15 to 19 Minutes | 192 | 14.2% |
| 20 to 24 Minutes | 129 | 9.5% |
| 25 to 29 Minutes | 102 | 7.5% |
| 30 to 34 Minutes | 246 | 18.2% |
| 35 to 39 Minutes | 27 | 2.0% |
| 40 to 44 Minutes | 89 | 6.6% |
| 45 to 59 Minutes | 238 | 17.6% |
| 60 to 89 Minutes | 88 | 6.5% |
| 90 or more Minutes | 6 | 0.4% |
Commute Time by Sex in Bethel Acres
The most common commute times in Bethel Acres are 30 to 34 minutes (161 commuters, 22.6%) for males and 15 to 19 minutes (133 commuters, 20.7%) for females.
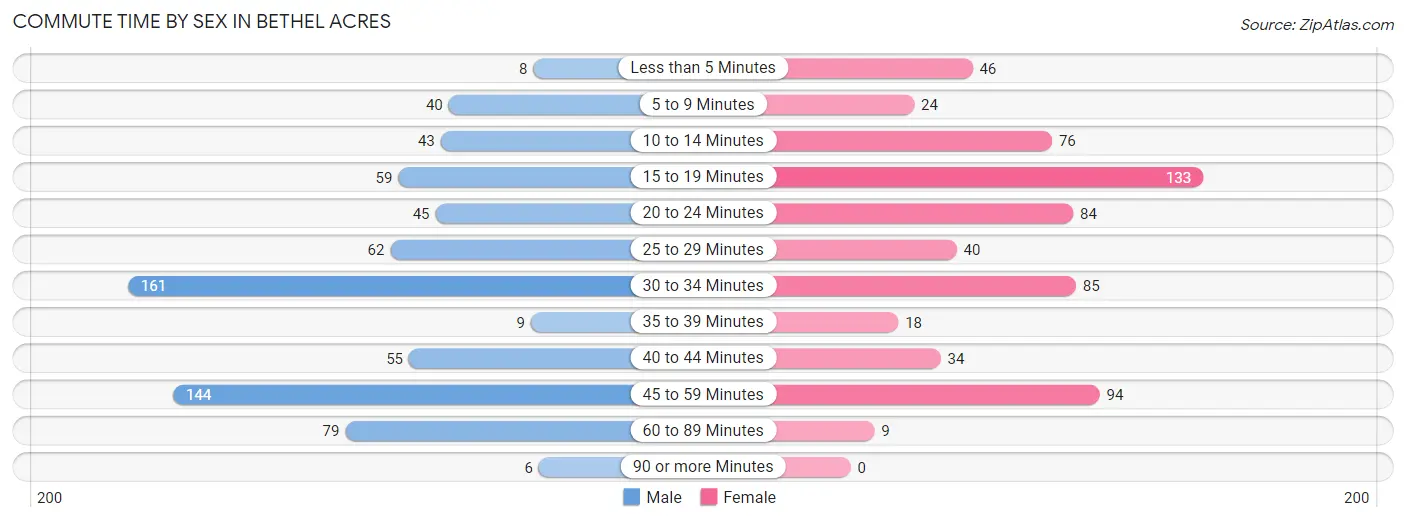
| Commute Time | Male | Female |
| Less than 5 Minutes | 8 (1.1%) | 46 (7.1%) |
| 5 to 9 Minutes | 40 (5.6%) | 24 (3.7%) |
| 10 to 14 Minutes | 43 (6.0%) | 76 (11.8%) |
| 15 to 19 Minutes | 59 (8.3%) | 133 (20.7%) |
| 20 to 24 Minutes | 45 (6.3%) | 84 (13.1%) |
| 25 to 29 Minutes | 62 (8.7%) | 40 (6.2%) |
| 30 to 34 Minutes | 161 (22.6%) | 85 (13.2%) |
| 35 to 39 Minutes | 9 (1.3%) | 18 (2.8%) |
| 40 to 44 Minutes | 55 (7.7%) | 34 (5.3%) |
| 45 to 59 Minutes | 144 (20.3%) | 94 (14.6%) |
| 60 to 89 Minutes | 79 (11.1%) | 9 (1.4%) |
| 90 or more Minutes | 6 (0.8%) | 0 (0.0%) |
Time of Departure to Work by Sex in Bethel Acres
The most frequent times of departure to work in Bethel Acres are 6:00 AM to 6:29 AM (127, 17.9%) for males and 7:00 AM to 7:29 AM (157, 24.4%) for females.
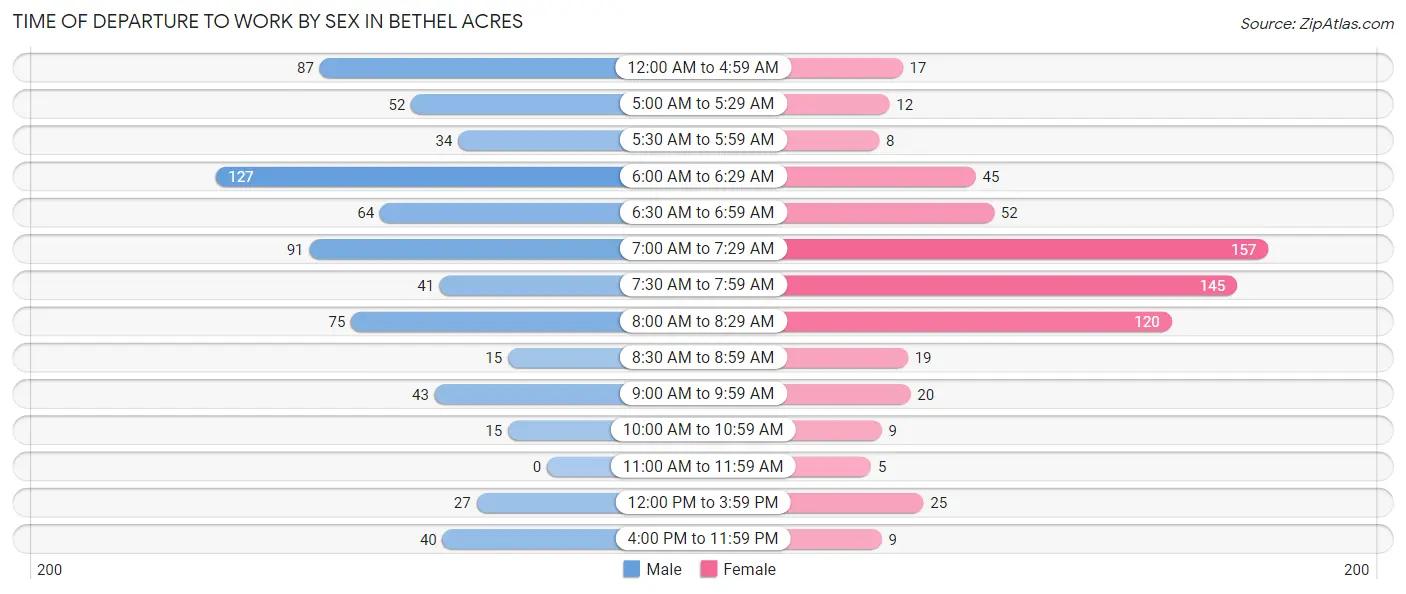
| Time of Departure | Male | Female |
| 12:00 AM to 4:59 AM | 87 (12.2%) | 17 (2.6%) |
| 5:00 AM to 5:29 AM | 52 (7.3%) | 12 (1.9%) |
| 5:30 AM to 5:59 AM | 34 (4.8%) | 8 (1.2%) |
| 6:00 AM to 6:29 AM | 127 (17.9%) | 45 (7.0%) |
| 6:30 AM to 6:59 AM | 64 (9.0%) | 52 (8.1%) |
| 7:00 AM to 7:29 AM | 91 (12.8%) | 157 (24.4%) |
| 7:30 AM to 7:59 AM | 41 (5.8%) | 145 (22.6%) |
| 8:00 AM to 8:29 AM | 75 (10.5%) | 120 (18.7%) |
| 8:30 AM to 8:59 AM | 15 (2.1%) | 19 (2.9%) |
| 9:00 AM to 9:59 AM | 43 (6.0%) | 20 (3.1%) |
| 10:00 AM to 10:59 AM | 15 (2.1%) | 9 (1.4%) |
| 11:00 AM to 11:59 AM | 0 (0.0%) | 5 (0.8%) |
| 12:00 PM to 3:59 PM | 27 (3.8%) | 25 (3.9%) |
| 4:00 PM to 11:59 PM | 40 (5.6%) | 9 (1.4%) |
| Total | 711 (100.0%) | 643 (100.0%) |
Housing Occupancy in Bethel Acres
Occupancy by Ownership in Bethel Acres
Of the total 1,049 dwellings in Bethel Acres, owner-occupied units account for 925 (88.2%), while renter-occupied units make up 124 (11.8%).
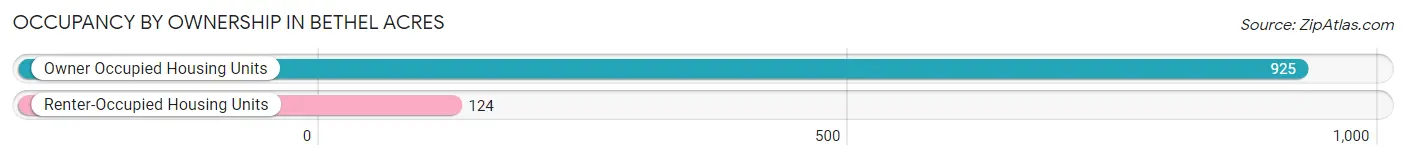
| Occupancy | # Housing Units | % Housing Units |
| Owner Occupied Housing Units | 925 | 88.2% |
| Renter-Occupied Housing Units | 124 | 11.8% |
| Total Occupied Housing Units | 1,049 | 100.0% |
Occupancy by Household Size in Bethel Acres
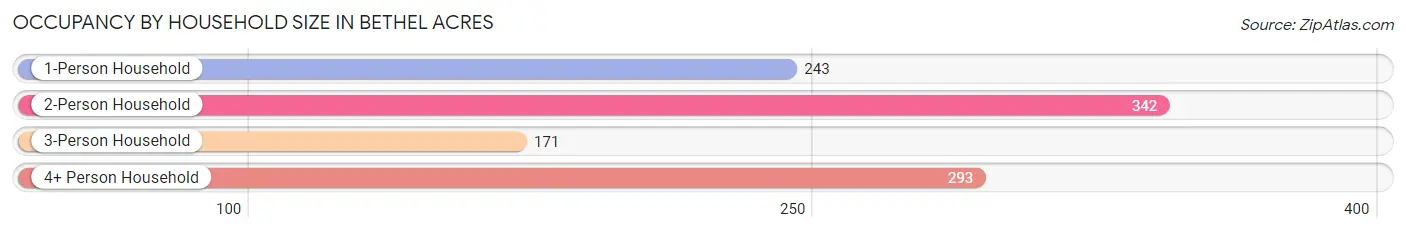
| Household Size | # Housing Units | % Housing Units |
| 1-Person Household | 243 | 23.2% |
| 2-Person Household | 342 | 32.6% |
| 3-Person Household | 171 | 16.3% |
| 4+ Person Household | 293 | 27.9% |
| Total Housing Units | 1,049 | 100.0% |
Occupancy by Ownership by Household Size in Bethel Acres
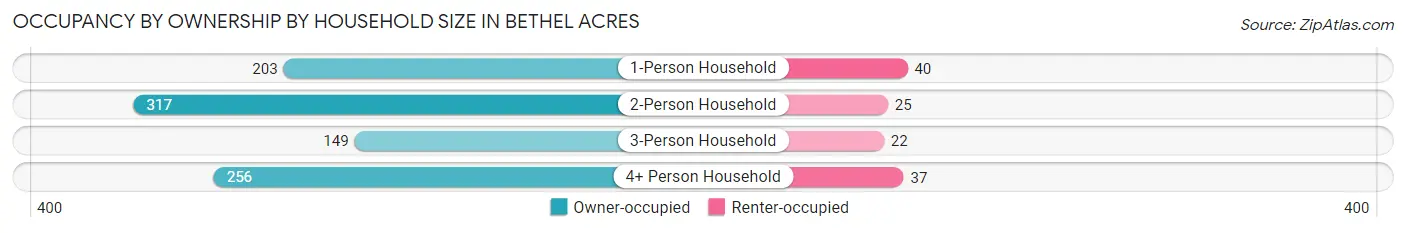
| Household Size | Owner-occupied | Renter-occupied |
| 1-Person Household | 203 (83.5%) | 40 (16.5%) |
| 2-Person Household | 317 (92.7%) | 25 (7.3%) |
| 3-Person Household | 149 (87.1%) | 22 (12.9%) |
| 4+ Person Household | 256 (87.4%) | 37 (12.6%) |
| Total Housing Units | 925 (88.2%) | 124 (11.8%) |
Occupancy by Educational Attainment in Bethel Acres
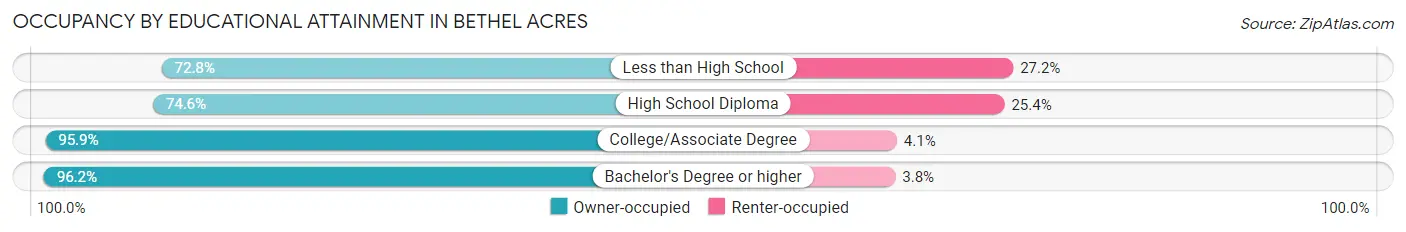
| Household Size | Owner-occupied | Renter-occupied |
| Less than High School | 67 (72.8%) | 25 (27.2%) |
| High School Diploma | 211 (74.6%) | 72 (25.4%) |
| College/Associate Degree | 420 (95.9%) | 18 (4.1%) |
| Bachelor's Degree or higher | 227 (96.2%) | 9 (3.8%) |
Occupancy by Age of Householder in Bethel Acres
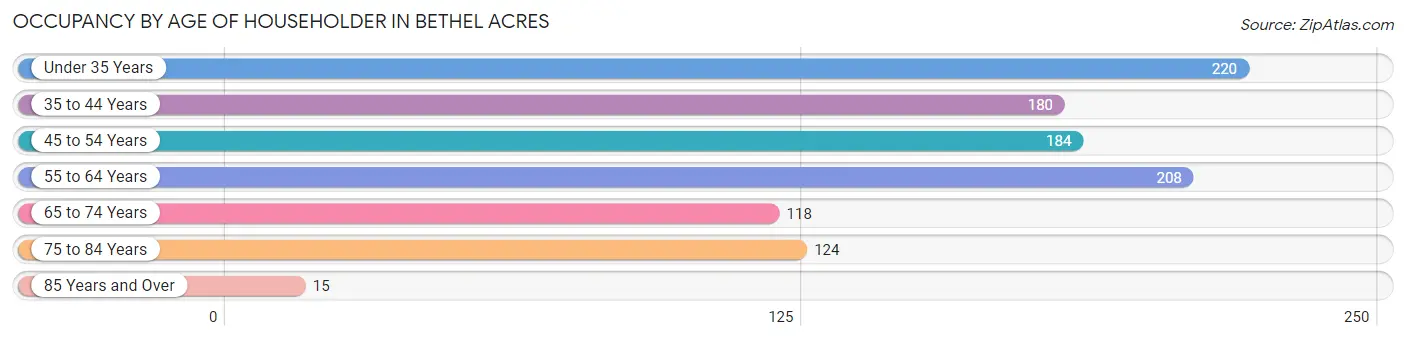
| Age Bracket | # Households | % Households |
| Under 35 Years | 220 | 21.0% |
| 35 to 44 Years | 180 | 17.2% |
| 45 to 54 Years | 184 | 17.5% |
| 55 to 64 Years | 208 | 19.8% |
| 65 to 74 Years | 118 | 11.3% |
| 75 to 84 Years | 124 | 11.8% |
| 85 Years and Over | 15 | 1.4% |
| Total | 1,049 | 100.0% |
Housing Finances in Bethel Acres
Median Income by Occupancy in Bethel Acres
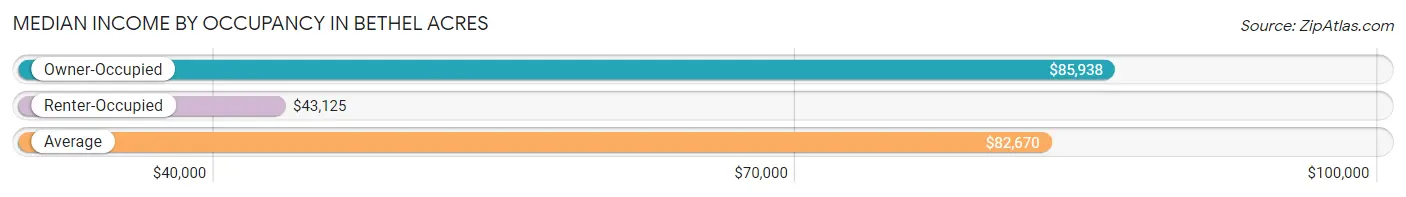
| Occupancy Type | # Households | Median Income |
| Owner-Occupied | 925 (88.2%) | $85,938 |
| Renter-Occupied | 124 (11.8%) | $43,125 |
| Average | 1,049 (100.0%) | $82,670 |
Occupancy by Householder Income Bracket in Bethel Acres
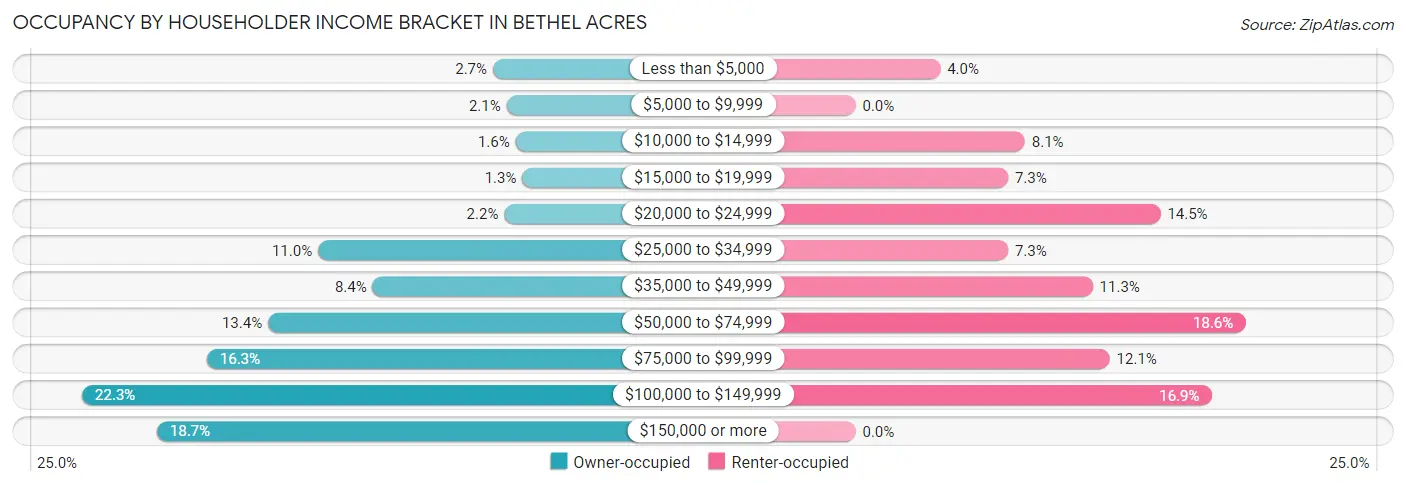
| Income Bracket | Owner-occupied | Renter-occupied |
| Less than $5,000 | 25 (2.7%) | 5 (4.0%) |
| $5,000 to $9,999 | 19 (2.1%) | 0 (0.0%) |
| $10,000 to $14,999 | 15 (1.6%) | 10 (8.1%) |
| $15,000 to $19,999 | 12 (1.3%) | 9 (7.3%) |
| $20,000 to $24,999 | 20 (2.2%) | 18 (14.5%) |
| $25,000 to $34,999 | 102 (11.0%) | 9 (7.3%) |
| $35,000 to $49,999 | 78 (8.4%) | 14 (11.3%) |
| $50,000 to $74,999 | 124 (13.4%) | 23 (18.5%) |
| $75,000 to $99,999 | 151 (16.3%) | 15 (12.1%) |
| $100,000 to $149,999 | 206 (22.3%) | 21 (16.9%) |
| $150,000 or more | 173 (18.7%) | 0 (0.0%) |
| Total | 925 (100.0%) | 124 (100.0%) |
Monthly Housing Cost Tiers in Bethel Acres
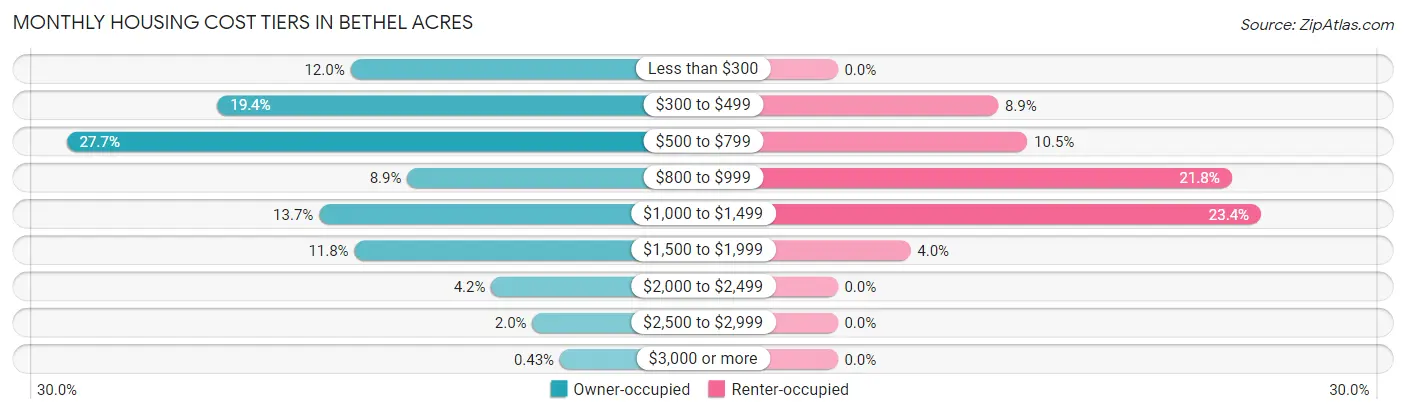
| Monthly Cost | Owner-occupied | Renter-occupied |
| Less than $300 | 111 (12.0%) | 0 (0.0%) |
| $300 to $499 | 179 (19.4%) | 11 (8.9%) |
| $500 to $799 | 256 (27.7%) | 13 (10.5%) |
| $800 to $999 | 82 (8.9%) | 27 (21.8%) |
| $1,000 to $1,499 | 127 (13.7%) | 29 (23.4%) |
| $1,500 to $1,999 | 109 (11.8%) | 5 (4.0%) |
| $2,000 to $2,499 | 39 (4.2%) | 0 (0.0%) |
| $2,500 to $2,999 | 18 (1.9%) | 0 (0.0%) |
| $3,000 or more | 4 (0.4%) | 0 (0.0%) |
| Total | 925 (100.0%) | 124 (100.0%) |
Physical Housing Characteristics in Bethel Acres
Housing Structures in Bethel Acres
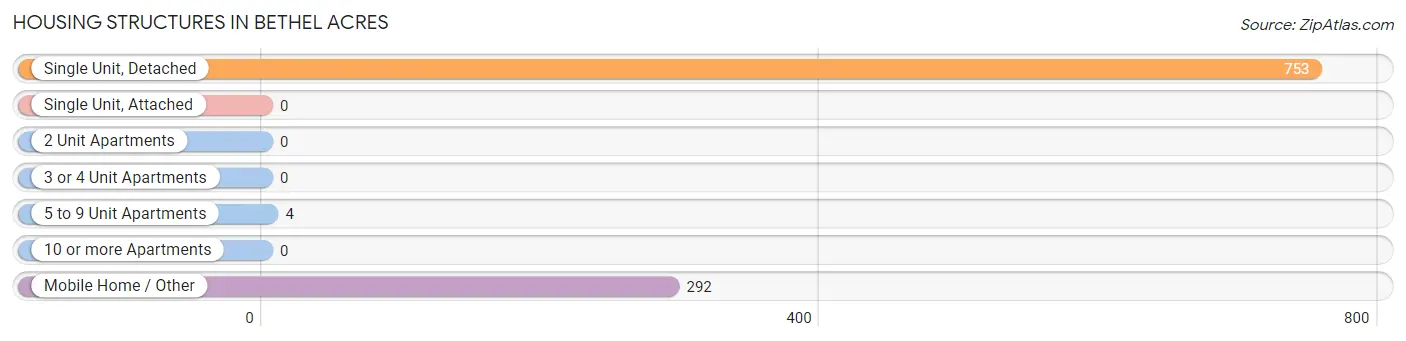
| Structure Type | # Housing Units | % Housing Units |
| Single Unit, Detached | 753 | 71.8% |
| Single Unit, Attached | 0 | 0.0% |
| 2 Unit Apartments | 0 | 0.0% |
| 3 or 4 Unit Apartments | 0 | 0.0% |
| 5 to 9 Unit Apartments | 4 | 0.4% |
| 10 or more Apartments | 0 | 0.0% |
| Mobile Home / Other | 292 | 27.8% |
| Total | 1,049 | 100.0% |
Housing Structures by Occupancy in Bethel Acres
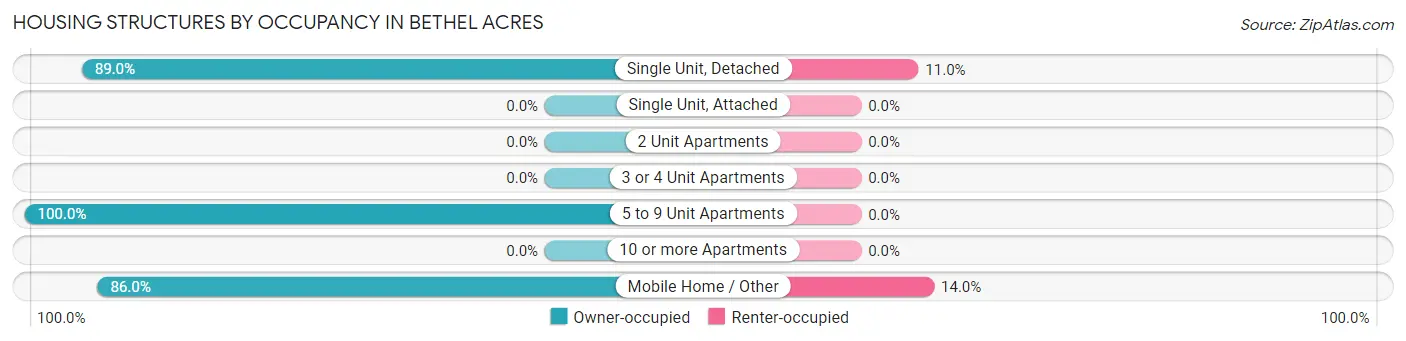
| Structure Type | Owner-occupied | Renter-occupied |
| Single Unit, Detached | 670 (89.0%) | 83 (11.0%) |
| Single Unit, Attached | 0 (0.0%) | 0 (0.0%) |
| 2 Unit Apartments | 0 (0.0%) | 0 (0.0%) |
| 3 or 4 Unit Apartments | 0 (0.0%) | 0 (0.0%) |
| 5 to 9 Unit Apartments | 4 (100.0%) | 0 (0.0%) |
| 10 or more Apartments | 0 (0.0%) | 0 (0.0%) |
| Mobile Home / Other | 251 (86.0%) | 41 (14.0%) |
| Total | 925 (88.2%) | 124 (11.8%) |
Housing Structures by Number of Rooms in Bethel Acres
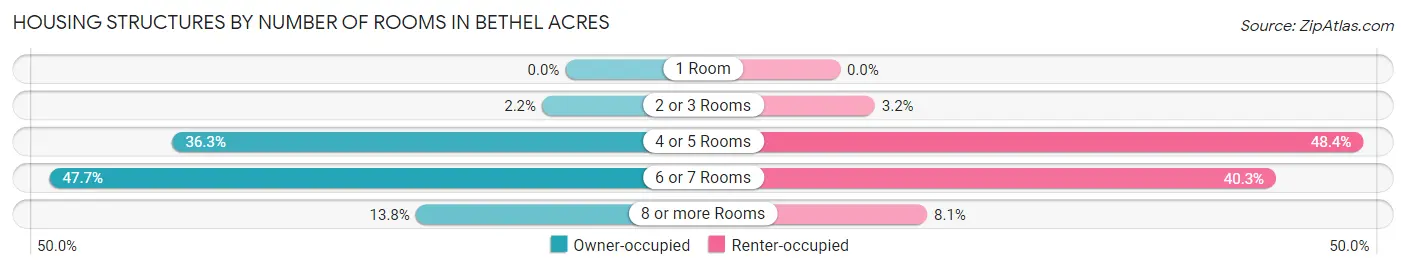
| Number of Rooms | Owner-occupied | Renter-occupied |
| 1 Room | 0 (0.0%) | 0 (0.0%) |
| 2 or 3 Rooms | 20 (2.2%) | 4 (3.2%) |
| 4 or 5 Rooms | 336 (36.3%) | 60 (48.4%) |
| 6 or 7 Rooms | 441 (47.7%) | 50 (40.3%) |
| 8 or more Rooms | 128 (13.8%) | 10 (8.1%) |
| Total | 925 (100.0%) | 124 (100.0%) |
Housing Structure by Heating Type in Bethel Acres
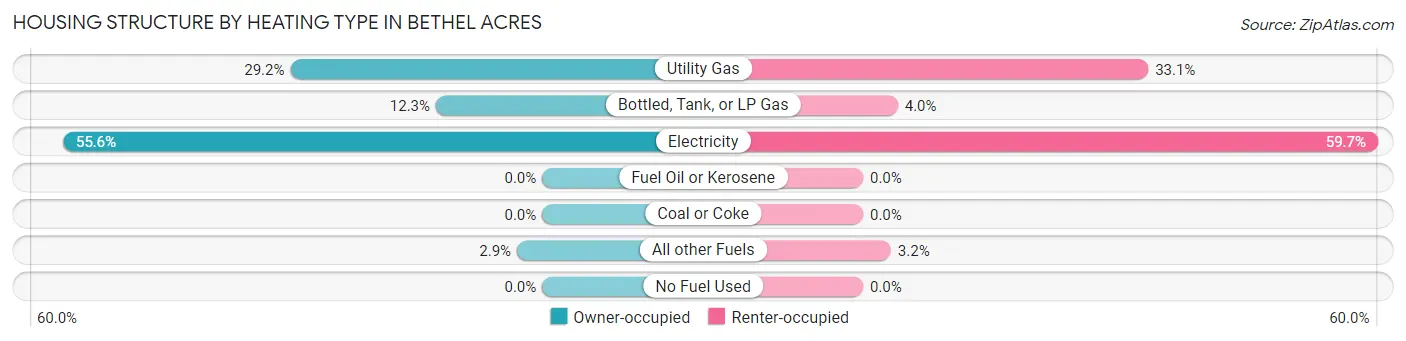
| Heating Type | Owner-occupied | Renter-occupied |
| Utility Gas | 270 (29.2%) | 41 (33.1%) |
| Bottled, Tank, or LP Gas | 114 (12.3%) | 5 (4.0%) |
| Electricity | 514 (55.6%) | 74 (59.7%) |
| Fuel Oil or Kerosene | 0 (0.0%) | 0 (0.0%) |
| Coal or Coke | 0 (0.0%) | 0 (0.0%) |
| All other Fuels | 27 (2.9%) | 4 (3.2%) |
| No Fuel Used | 0 (0.0%) | 0 (0.0%) |
| Total | 925 (100.0%) | 124 (100.0%) |
Household Vehicle Usage in Bethel Acres
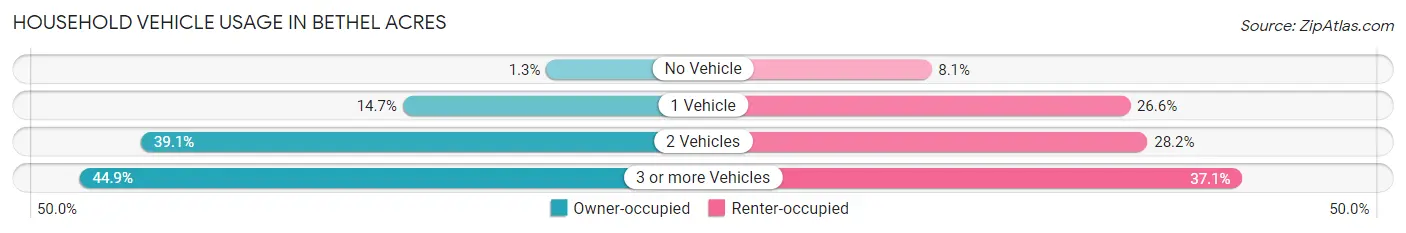
| Vehicles per Household | Owner-occupied | Renter-occupied |
| No Vehicle | 12 (1.3%) | 10 (8.1%) |
| 1 Vehicle | 136 (14.7%) | 33 (26.6%) |
| 2 Vehicles | 362 (39.1%) | 35 (28.2%) |
| 3 or more Vehicles | 415 (44.9%) | 46 (37.1%) |
| Total | 925 (100.0%) | 124 (100.0%) |
Real Estate & Mortgages in Bethel Acres
Real Estate and Mortgage Overview in Bethel Acres
| Characteristic | Without Mortgage | With Mortgage |
| Housing Units | 475 | 450 |
| Median Property Value | $158,900 | $167,100 |
| Median Household Income | $66,354 | $136 |
| Monthly Housing Costs | $443 | $4 |
| Real Estate Taxes | $809 | $22 |
Property Value by Mortgage Status in Bethel Acres
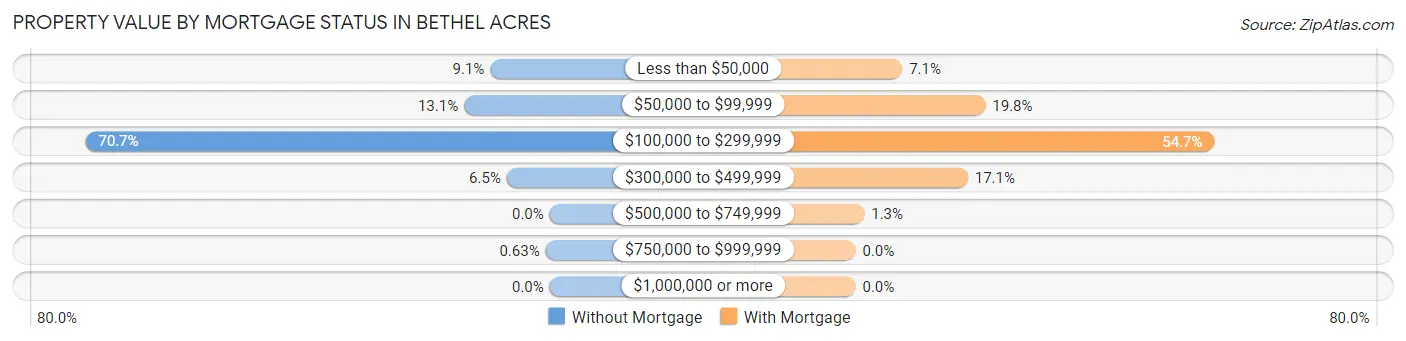
| Property Value | Without Mortgage | With Mortgage |
| Less than $50,000 | 43 (9.0%) | 32 (7.1%) |
| $50,000 to $99,999 | 62 (13.1%) | 89 (19.8%) |
| $100,000 to $299,999 | 336 (70.7%) | 246 (54.7%) |
| $300,000 to $499,999 | 31 (6.5%) | 77 (17.1%) |
| $500,000 to $749,999 | 0 (0.0%) | 6 (1.3%) |
| $750,000 to $999,999 | 3 (0.6%) | 0 (0.0%) |
| $1,000,000 or more | 0 (0.0%) | 0 (0.0%) |
| Total | 475 (100.0%) | 450 (100.0%) |
Household Income by Mortgage Status in Bethel Acres
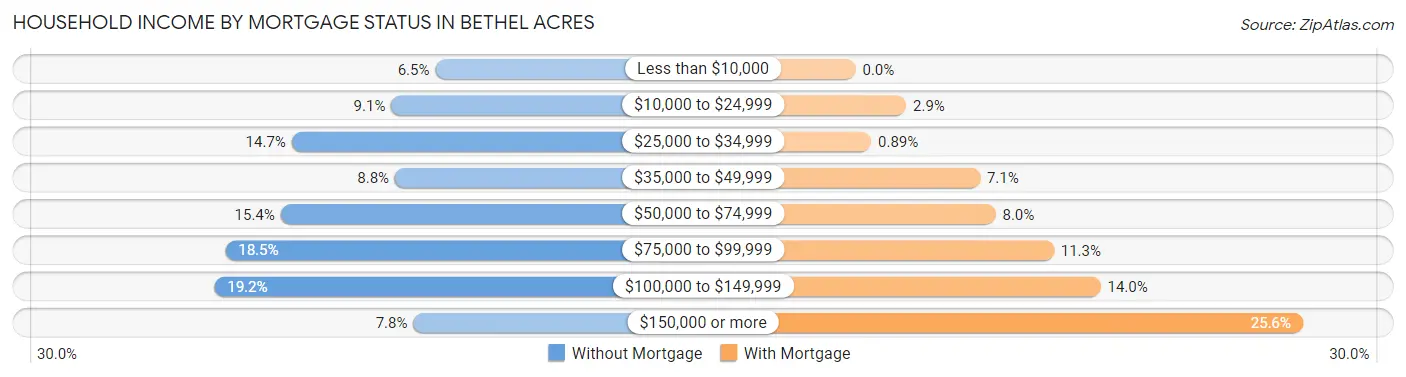
| Household Income | Without Mortgage | With Mortgage |
| Less than $10,000 | 31 (6.5%) | 0 (0.0%) |
| $10,000 to $24,999 | 43 (9.0%) | 13 (2.9%) |
| $25,000 to $34,999 | 70 (14.7%) | 4 (0.9%) |
| $35,000 to $49,999 | 42 (8.8%) | 32 (7.1%) |
| $50,000 to $74,999 | 73 (15.4%) | 36 (8.0%) |
| $75,000 to $99,999 | 88 (18.5%) | 51 (11.3%) |
| $100,000 to $149,999 | 91 (19.2%) | 63 (14.0%) |
| $150,000 or more | 37 (7.8%) | 115 (25.6%) |
| Total | 475 (100.0%) | 450 (100.0%) |
Property Value to Household Income Ratio in Bethel Acres
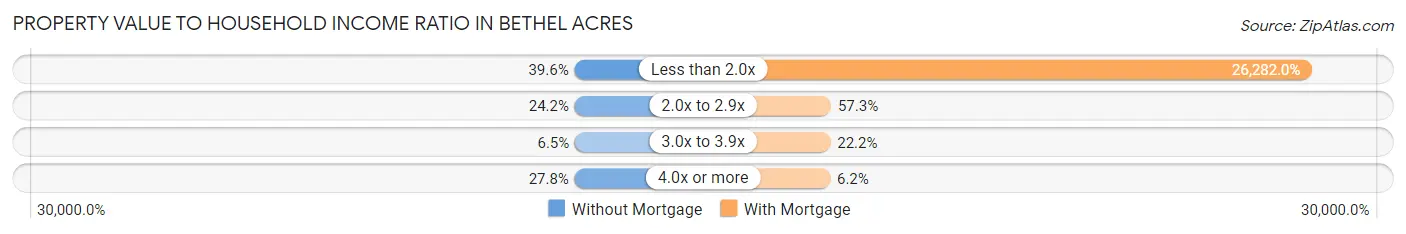
| Value-to-Income Ratio | Without Mortgage | With Mortgage |
| Less than 2.0x | 188 (39.6%) | 118,269 (26,282.0%) |
| 2.0x to 2.9x | 115 (24.2%) | 258 (57.3%) |
| 3.0x to 3.9x | 31 (6.5%) | 100 (22.2%) |
| 4.0x or more | 132 (27.8%) | 28 (6.2%) |
| Total | 475 (100.0%) | 450 (100.0%) |
Real Estate Taxes by Mortgage Status in Bethel Acres
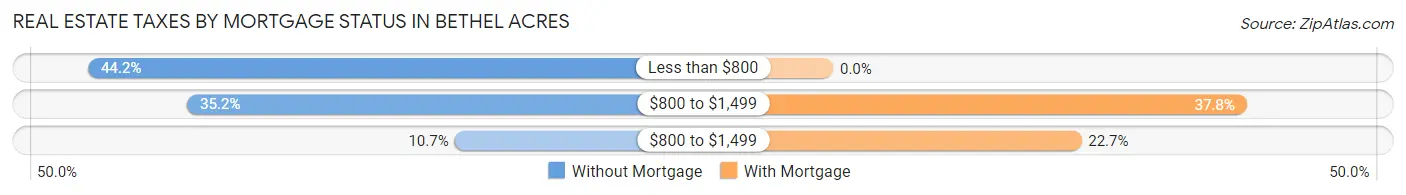
| Property Taxes | Without Mortgage | With Mortgage |
| Less than $800 | 210 (44.2%) | 0 (0.0%) |
| $800 to $1,499 | 167 (35.2%) | 170 (37.8%) |
| $800 to $1,499 | 51 (10.7%) | 102 (22.7%) |
| Total | 475 (100.0%) | 450 (100.0%) |
Health & Disability in Bethel Acres
Health Insurance Coverage by Age in Bethel Acres
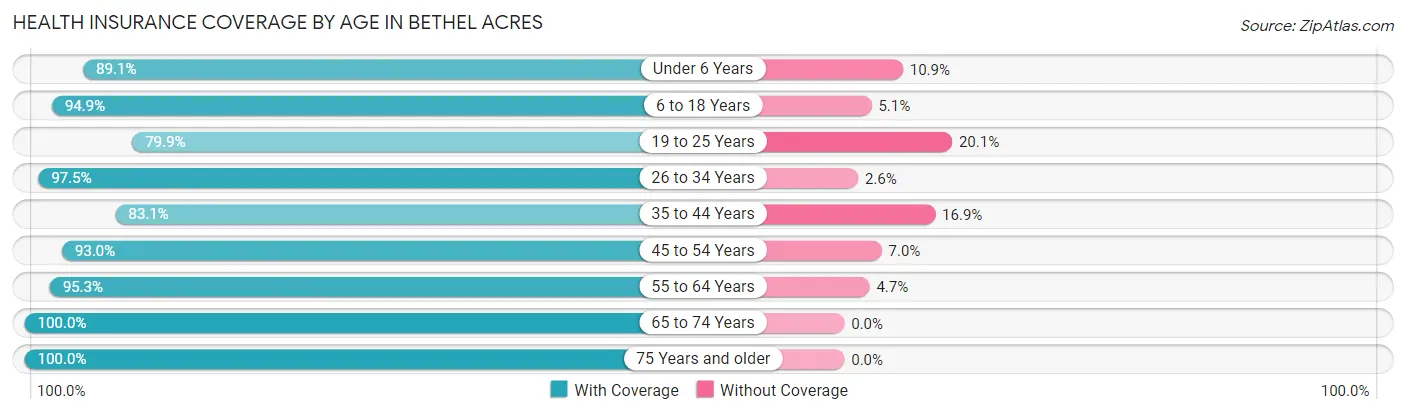
| Age Bracket | With Coverage | Without Coverage |
| Under 6 Years | 147 (89.1%) | 18 (10.9%) |
| 6 to 18 Years | 618 (94.9%) | 33 (5.1%) |
| 19 to 25 Years | 195 (79.9%) | 49 (20.1%) |
| 26 to 34 Years | 421 (97.5%) | 11 (2.5%) |
| 35 to 44 Years | 299 (83.1%) | 61 (16.9%) |
| 45 to 54 Years | 334 (93.0%) | 25 (7.0%) |
| 55 to 64 Years | 366 (95.3%) | 18 (4.7%) |
| 65 to 74 Years | 209 (100.0%) | 0 (0.0%) |
| 75 Years and older | 192 (100.0%) | 0 (0.0%) |
| Total | 2,781 (92.8%) | 215 (7.2%) |
Health Insurance Coverage by Citizenship Status in Bethel Acres
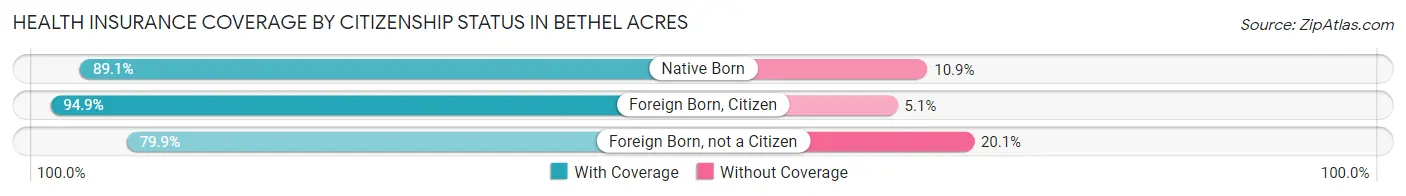
| Citizenship Status | With Coverage | Without Coverage |
| Native Born | 147 (89.1%) | 18 (10.9%) |
| Foreign Born, Citizen | 618 (94.9%) | 33 (5.1%) |
| Foreign Born, not a Citizen | 195 (79.9%) | 49 (20.1%) |
Health Insurance Coverage by Household Income in Bethel Acres
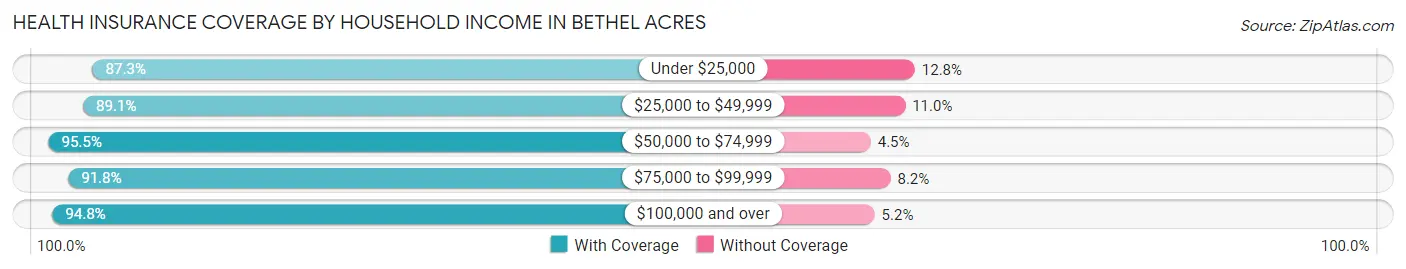
| Household Income | With Coverage | Without Coverage |
| Under $25,000 | 260 (87.3%) | 38 (12.8%) |
| $25,000 to $49,999 | 374 (89.0%) | 46 (11.0%) |
| $50,000 to $74,999 | 362 (95.5%) | 17 (4.5%) |
| $75,000 to $99,999 | 459 (91.8%) | 41 (8.2%) |
| $100,000 and over | 1,326 (94.8%) | 73 (5.2%) |
Public vs Private Health Insurance Coverage by Age in Bethel Acres
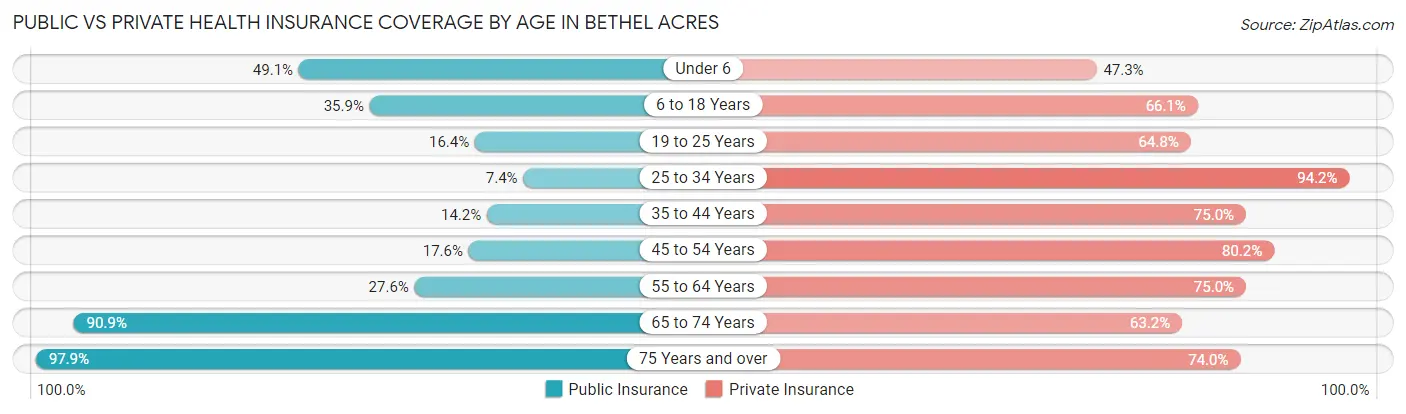
| Age Bracket | Public Insurance | Private Insurance |
| Under 6 | 81 (49.1%) | 78 (47.3%) |
| 6 to 18 Years | 234 (35.9%) | 430 (66.0%) |
| 19 to 25 Years | 40 (16.4%) | 158 (64.7%) |
| 25 to 34 Years | 32 (7.4%) | 407 (94.2%) |
| 35 to 44 Years | 51 (14.2%) | 270 (75.0%) |
| 45 to 54 Years | 63 (17.5%) | 288 (80.2%) |
| 55 to 64 Years | 106 (27.6%) | 288 (75.0%) |
| 65 to 74 Years | 190 (90.9%) | 132 (63.2%) |
| 75 Years and over | 188 (97.9%) | 142 (74.0%) |
| Total | 985 (32.9%) | 2,193 (73.2%) |
Disability Status by Sex by Age in Bethel Acres
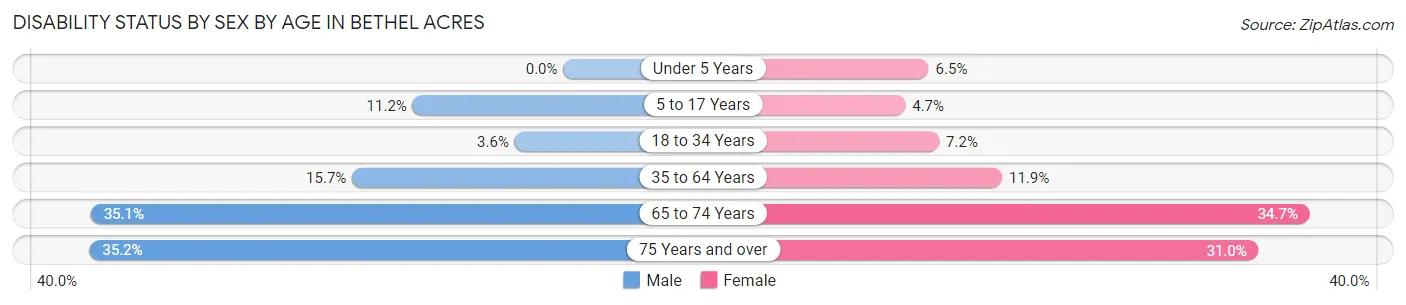
| Age Bracket | Male | Female |
| Under 5 Years | 0 (0.0%) | 4 (6.5%) |
| 5 to 17 Years | 33 (11.2%) | 16 (4.7%) |
| 18 to 34 Years | 14 (3.6%) | 23 (7.2%) |
| 35 to 64 Years | 82 (15.7%) | 69 (11.9%) |
| 65 to 74 Years | 40 (35.1%) | 33 (34.7%) |
| 75 Years and over | 38 (35.2%) | 26 (30.9%) |
Disability Class by Sex by Age in Bethel Acres
Disability Class: Hearing Difficulty
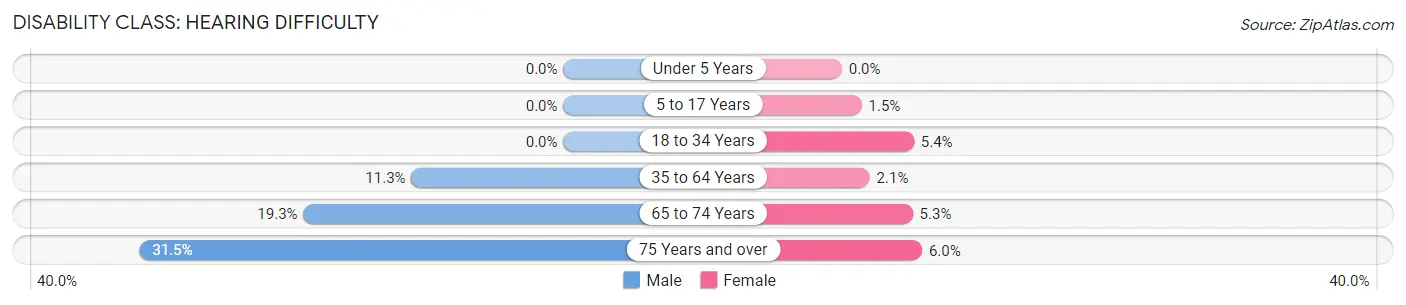
| Age Bracket | Male | Female |
| Under 5 Years | 0 (0.0%) | 0 (0.0%) |
| 5 to 17 Years | 0 (0.0%) | 5 (1.5%) |
| 18 to 34 Years | 0 (0.0%) | 17 (5.3%) |
| 35 to 64 Years | 59 (11.3%) | 12 (2.1%) |
| 65 to 74 Years | 22 (19.3%) | 5 (5.3%) |
| 75 Years and over | 34 (31.5%) | 5 (5.9%) |
Disability Class: Vision Difficulty
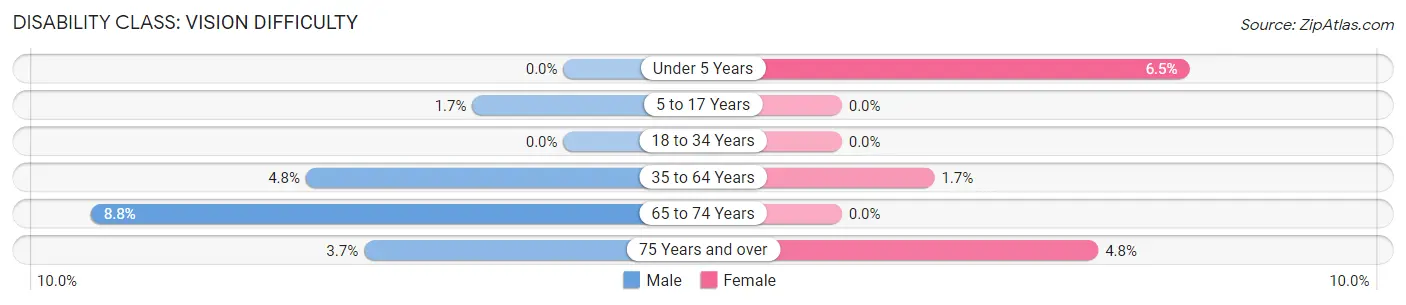
| Age Bracket | Male | Female |
| Under 5 Years | 0 (0.0%) | 4 (6.5%) |
| 5 to 17 Years | 5 (1.7%) | 0 (0.0%) |
| 18 to 34 Years | 0 (0.0%) | 0 (0.0%) |
| 35 to 64 Years | 25 (4.8%) | 10 (1.7%) |
| 65 to 74 Years | 10 (8.8%) | 0 (0.0%) |
| 75 Years and over | 4 (3.7%) | 4 (4.8%) |
Disability Class: Cognitive Difficulty
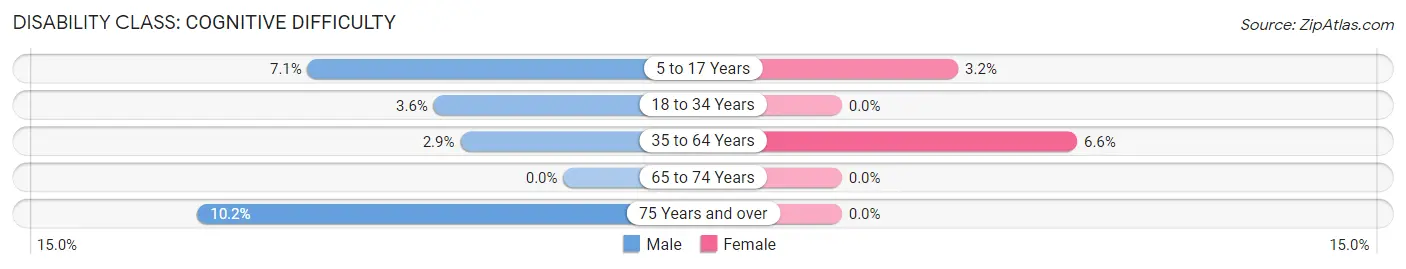
| Age Bracket | Male | Female |
| 5 to 17 Years | 21 (7.1%) | 11 (3.2%) |
| 18 to 34 Years | 14 (3.6%) | 0 (0.0%) |
| 35 to 64 Years | 15 (2.9%) | 38 (6.6%) |
| 65 to 74 Years | 0 (0.0%) | 0 (0.0%) |
| 75 Years and over | 11 (10.2%) | 0 (0.0%) |
Disability Class: Ambulatory Difficulty
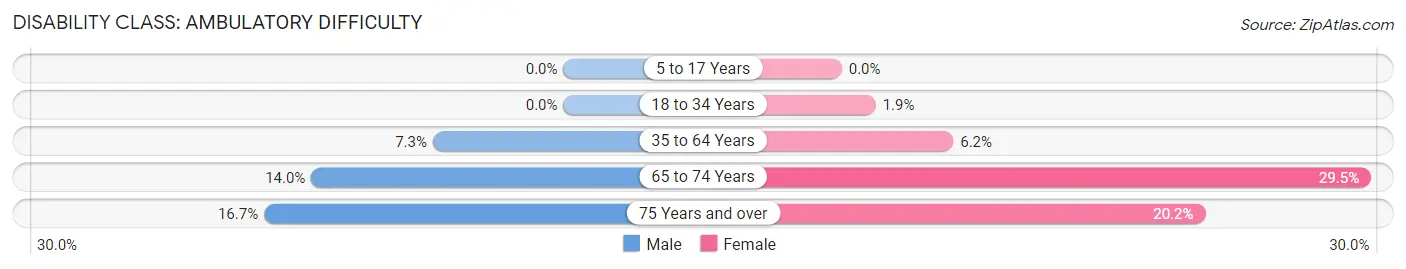
| Age Bracket | Male | Female |
| 5 to 17 Years | 0 (0.0%) | 0 (0.0%) |
| 18 to 34 Years | 0 (0.0%) | 6 (1.9%) |
| 35 to 64 Years | 38 (7.3%) | 36 (6.2%) |
| 65 to 74 Years | 16 (14.0%) | 28 (29.5%) |
| 75 Years and over | 18 (16.7%) | 17 (20.2%) |
Disability Class: Self-Care Difficulty
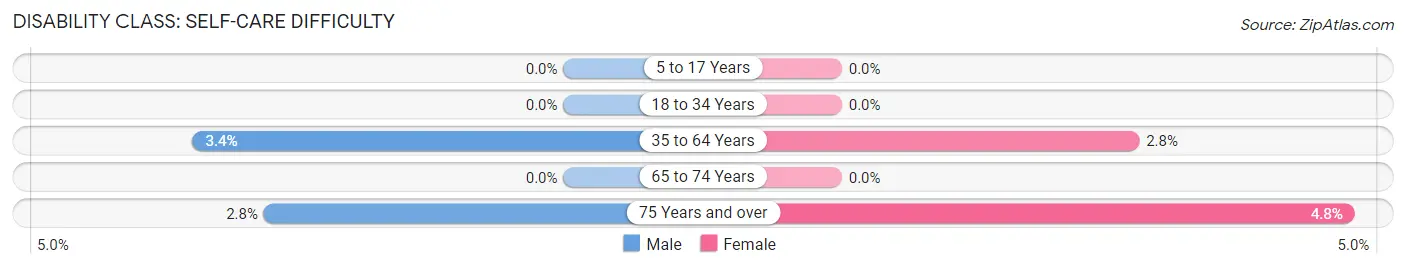
| Age Bracket | Male | Female |
| 5 to 17 Years | 0 (0.0%) | 0 (0.0%) |
| 18 to 34 Years | 0 (0.0%) | 0 (0.0%) |
| 35 to 64 Years | 18 (3.4%) | 16 (2.8%) |
| 65 to 74 Years | 0 (0.0%) | 0 (0.0%) |
| 75 Years and over | 3 (2.8%) | 4 (4.8%) |
Technology Access in Bethel Acres
Computing Device Access in Bethel Acres
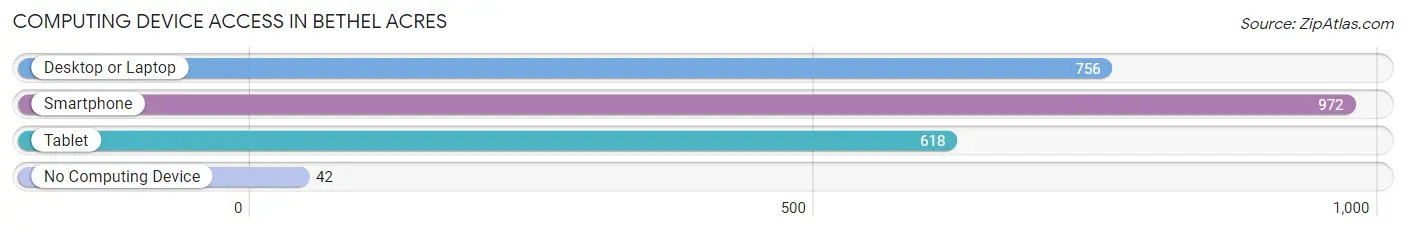
| Device Type | # Households | % Households |
| Desktop or Laptop | 756 | 72.1% |
| Smartphone | 972 | 92.7% |
| Tablet | 618 | 58.9% |
| No Computing Device | 42 | 4.0% |
| Total | 1,049 | 100.0% |
Internet Access in Bethel Acres
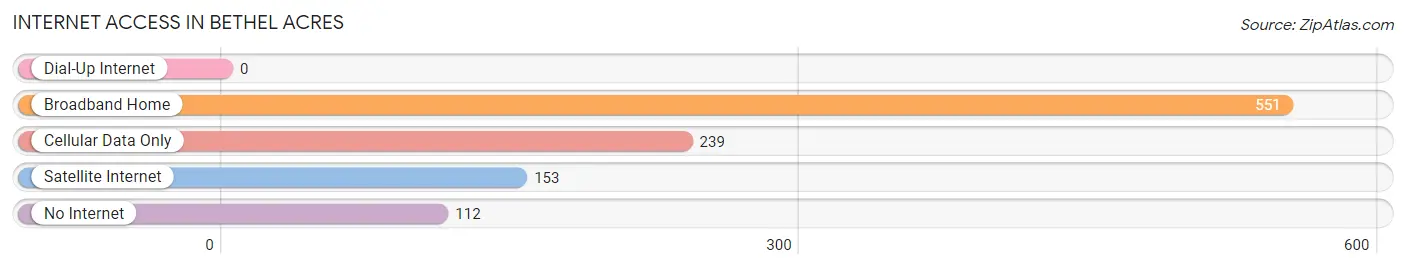
| Internet Type | # Households | % Households |
| Dial-Up Internet | 0 | 0.0% |
| Broadband Home | 551 | 52.5% |
| Cellular Data Only | 239 | 22.8% |
| Satellite Internet | 153 | 14.6% |
| No Internet | 112 | 10.7% |
| Total | 1,049 | 100.0% |
Bethel Acres Summary
Bethel Acres is a small town located in Pottawatomie County, Oklahoma. It is situated about 10 miles east of Shawnee, Oklahoma and about 30 miles east of Oklahoma City. The town was founded in the late 1800s and has a population of approximately 1,500 people.
Geography
Bethel Acres is located in the rolling hills of central Oklahoma. The town is situated on the banks of the North Canadian River, which is a tributary of the Arkansas River. The town is surrounded by farmland and is located in a rural area. The town is located in the Central Great Plains ecoregion, which is characterized by grasslands and prairies. The climate in Bethel Acres is temperate, with hot summers and cold winters.
History
Bethel Acres was founded in the late 1800s by a group of settlers from the Bethel Baptist Church. The town was originally known as Bethel, but the name was changed to Bethel Acres in the early 1900s. The town was incorporated in 1909 and has remained a small, rural community ever since.
The town was originally a farming community, but in the early 1900s, the town began to develop a small manufacturing industry. The town was home to several small factories, including a cotton mill, a furniture factory, and a brick factory. The town also had a small railroad station, which connected the town to the larger cities in the region.
Economy
The economy of Bethel Acres is largely based on agriculture. The town is surrounded by farmland and many of the residents are involved in farming. The town also has a small manufacturing industry, which includes a furniture factory and a brick factory. The town also has a few small businesses, including a grocery store, a hardware store, and a few restaurants.
Demographics
As of the 2010 census, the population of Bethel Acres was 1,500. The town is predominantly white, with about 90% of the population being white. The town also has a small Hispanic population, with about 5% of the population being Hispanic. The median household income in Bethel Acres is $37,000, which is slightly lower than the national average.
Conclusion
Bethel Acres is a small town located in Pottawatomie County, Oklahoma. The town was founded in the late 1800s and has a population of approximately 1,500 people. The town is surrounded by farmland and is located in a rural area. The economy of Bethel Acres is largely based on agriculture and the town also has a small manufacturing industry. The town is predominantly white, with about 90% of the population being white. The median household income in Bethel Acres is $37,000, which is slightly lower than the national average.
Common Questions
What is Per Capita Income in Bethel Acres?
Per Capita income in Bethel Acres is $32,637.
What is the Median Family Income in Bethel Acres?
Median Family Income in Bethel Acres is $100,250.
What is the Median Household income in Bethel Acres?
Median Household Income in Bethel Acres is $82,670.
What is Income or Wage Gap in Bethel Acres?
Income or Wage Gap in Bethel Acres is 29.8%.
Women in Bethel Acres earn 70.2 cents for every dollar earned by a man.
What is Inequality or Gini Index in Bethel Acres?
Inequality or Gini Index in Bethel Acres is 0.39.
What is the Total Population of Bethel Acres?
Total Population of Bethel Acres is 3,066.
What is the Total Male Population of Bethel Acres?
Total Male Population of Bethel Acres is 1,555.
What is the Total Female Population of Bethel Acres?
Total Female Population of Bethel Acres is 1,511.
What is the Ratio of Males per 100 Females in Bethel Acres?
There are 102.91 Males per 100 Females in Bethel Acres.
What is the Ratio of Females per 100 Males in Bethel Acres?
There are 97.17 Females per 100 Males in Bethel Acres.
What is the Median Population Age in Bethel Acres?
Median Population Age in Bethel Acres is 36.5 Years.
What is the Average Family Size in Bethel Acres
Average Family Size in Bethel Acres is 3.4 People.
What is the Average Household Size in Bethel Acres
Average Household Size in Bethel Acres is 2.9 People.
How Large is the Labor Force in Bethel Acres?
There are 1,443 People in the Labor Forcein in Bethel Acres.
What is the Percentage of People in the Labor Force in Bethel Acres?
60.4% of People are in the Labor Force in Bethel Acres.
What is the Unemployment Rate in Bethel Acres?
Unemployment Rate in Bethel Acres is 1.8%.