Seaside, OR Map & Demographics
Seaside Map
Seaside Overview
$32,963
PER CAPITA INCOME
$77,634
AVG FAMILY INCOME
$44,087
AVG HOUSEHOLD INCOME
3.0%
WAGE / INCOME GAP [ % ]
97.0¢/ $1
WAGE / INCOME GAP [ $ ]
0.43
INEQUALITY / GINI INDEX
7,142
TOTAL POPULATION
3,170
MALE POPULATION
3,972
FEMALE POPULATION
79.81
MALES / 100 FEMALES
125.30
FEMALES / 100 MALES
47.9
MEDIAN AGE
2.9
AVG FAMILY SIZE
1.9
AVG HOUSEHOLD SIZE
3,540
LABOR FORCE [ PEOPLE ]
56.8%
PERCENT IN LABOR FORCE
7.9%
UNEMPLOYMENT RATE
Seaside Zip Codes
Income in Seaside
Income Overview in Seaside
Per Capita Income in Seaside is $32,963, while median incomes of families and households are $77,634 and $44,087 respectively.
| Characteristic | Number | Measure |
| Per Capita Income | 7,142 | $32,963 |
| Median Family Income | 1,559 | $77,634 |
| Mean Family Income | 1,559 | $91,220 |
| Median Household Income | 3,600 | $44,087 |
| Mean Household Income | 3,600 | $63,252 |
| Income Deficit | 1,559 | $0 |
| Wage / Income Gap (%) | 7,142 | 3.03% |
| Wage / Income Gap ($) | 7,142 | 96.97¢ per $1 |
| Gini / Inequality Index | 7,142 | 0.43 |
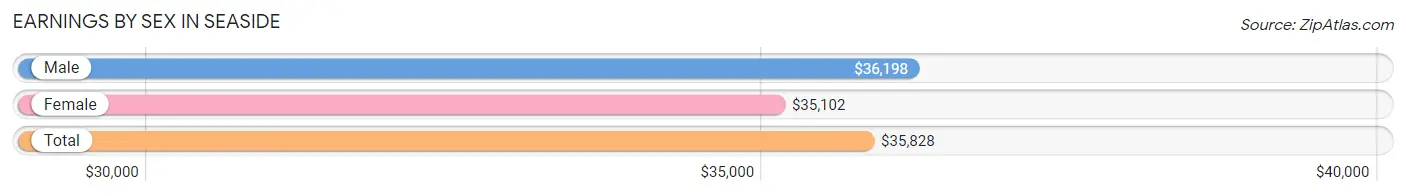
Earnings by Sex in Seaside
Average Earnings in Seaside are $35,828, $36,198 for men and $35,102 for women, a difference of 3.0%.
| Sex | Number | Average Earnings |
| Male | 1,864 (53.4%) | $36,198 |
| Female | 1,629 (46.6%) | $35,102 |
| Total | 3,493 (100.0%) | $35,828 |
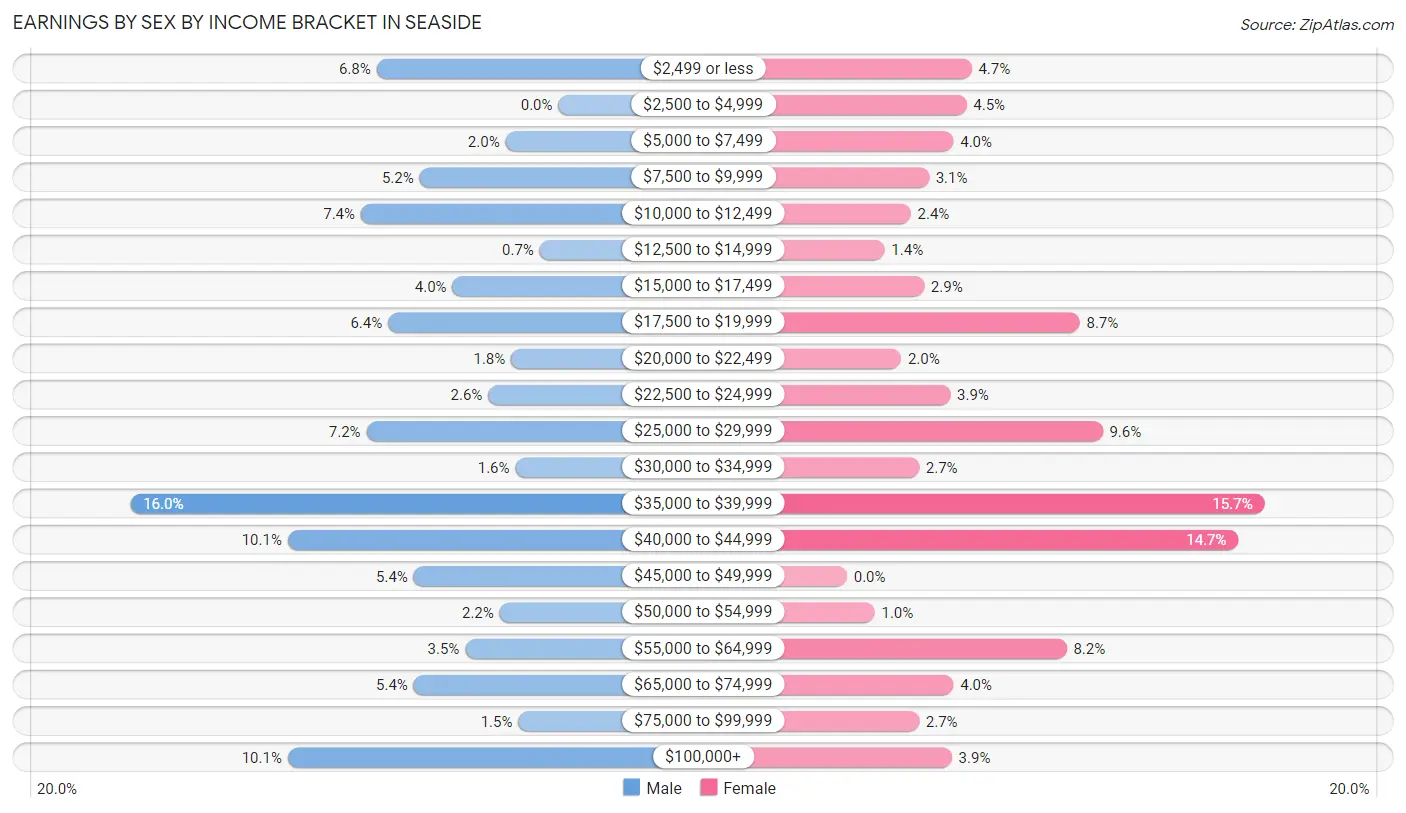
Earnings by Sex by Income Bracket in Seaside
The most common earnings brackets in Seaside are $35,000 to $39,999 for men (299 | 16.0%) and $35,000 to $39,999 for women (255 | 15.7%).
| Income | Male | Female |
| $2,499 or less | 127 (6.8%) | 76 (4.7%) |
| $2,500 to $4,999 | 0 (0.0%) | 73 (4.5%) |
| $5,000 to $7,499 | 37 (2.0%) | 65 (4.0%) |
| $7,500 to $9,999 | 97 (5.2%) | 50 (3.1%) |
| $10,000 to $12,499 | 138 (7.4%) | 39 (2.4%) |
| $12,500 to $14,999 | 13 (0.7%) | 23 (1.4%) |
| $15,000 to $17,499 | 74 (4.0%) | 47 (2.9%) |
| $17,500 to $19,999 | 119 (6.4%) | 142 (8.7%) |
| $20,000 to $22,499 | 33 (1.8%) | 33 (2.0%) |
| $22,500 to $24,999 | 49 (2.6%) | 63 (3.9%) |
| $25,000 to $29,999 | 134 (7.2%) | 156 (9.6%) |
| $30,000 to $34,999 | 30 (1.6%) | 44 (2.7%) |
| $35,000 to $39,999 | 299 (16.0%) | 255 (15.7%) |
| $40,000 to $44,999 | 189 (10.1%) | 239 (14.7%) |
| $45,000 to $49,999 | 101 (5.4%) | 0 (0.0%) |
| $50,000 to $54,999 | 41 (2.2%) | 17 (1.0%) |
| $55,000 to $64,999 | 65 (3.5%) | 134 (8.2%) |
| $65,000 to $74,999 | 101 (5.4%) | 65 (4.0%) |
| $75,000 to $99,999 | 28 (1.5%) | 44 (2.7%) |
| $100,000+ | 189 (10.1%) | 64 (3.9%) |
| Total | 1,864 (100.0%) | 1,629 (100.0%) |
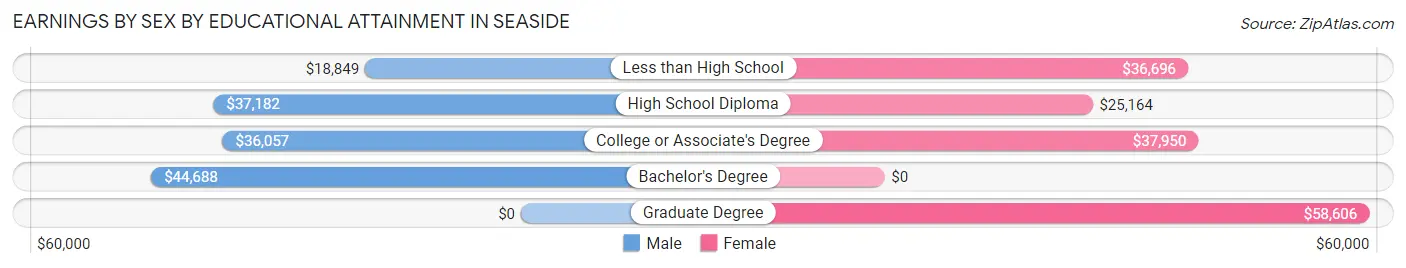
Earnings by Sex by Educational Attainment in Seaside
Average earnings in Seaside are $36,568 for men and $35,702 for women, a difference of 2.4%. Men with an educational attainment of bachelor's degree enjoy the highest average annual earnings of $44,688, while those with less than high school education earn the least with $18,849. Women with an educational attainment of graduate degree earn the most with the average annual earnings of $58,606, while those with high school diploma education have the smallest earnings of $25,164.
| Educational Attainment | Male Income | Female Income |
| Less than High School | $18,849 | $36,696 |
| High School Diploma | $37,182 | $25,164 |
| College or Associate's Degree | $36,057 | $37,950 |
| Bachelor's Degree | $44,688 | $0 |
| Graduate Degree | - | - |
| Total | $36,568 | $35,702 |
Family Income in Seaside
Family Income Brackets in Seaside
According to the Seaside family income data, there are 376 families falling into the $35,000 to $49,999 income range, which is the most common income bracket and makes up 24.1% of all families.
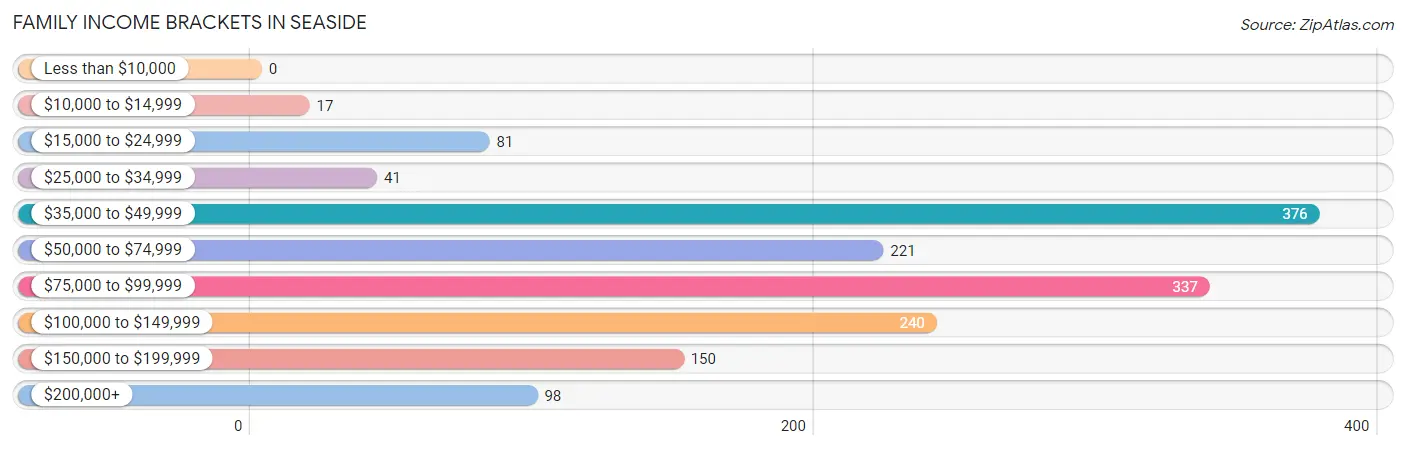
| Income Bracket | # Families | % Families |
| Less than $10,000 | 0 | 0.0% |
| $10,000 to $14,999 | 17 | 1.1% |
| $15,000 to $24,999 | 81 | 5.2% |
| $25,000 to $34,999 | 41 | 2.6% |
| $35,000 to $49,999 | 376 | 24.1% |
| $50,000 to $74,999 | 221 | 14.2% |
| $75,000 to $99,999 | 337 | 21.6% |
| $100,000 to $149,999 | 240 | 15.4% |
| $150,000 to $199,999 | 150 | 9.6% |
| $200,000+ | 98 | 6.3% |
Family Income by Famaliy Size in Seaside
5-person families (115 | 7.4%) account for the highest median family income in Seaside with $165,452 per family, while 2-person families (966 | 62.0%) have the highest median income of $36,792 per family member.
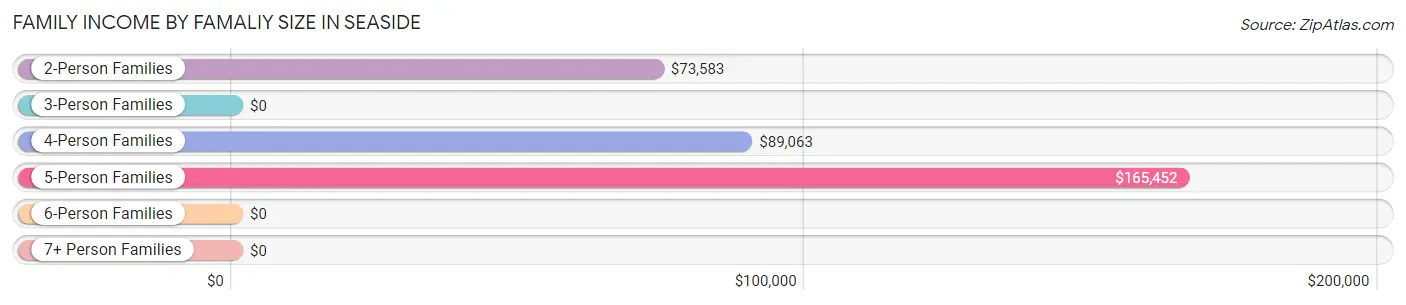
| Income Bracket | # Families | Median Income |
| 2-Person Families | 966 (62.0%) | $73,583 |
| 3-Person Families | 257 (16.5%) | $0 |
| 4-Person Families | 204 (13.1%) | $89,063 |
| 5-Person Families | 115 (7.4%) | $165,452 |
| 6-Person Families | 0 (0.0%) | $0 |
| 7+ Person Families | 17 (1.1%) | $0 |
| Total | 1,559 (100.0%) | $77,634 |
Family Income by Number of Earners in Seaside
The median family income in Seaside is $77,634, with families comprising 3+ earners (135) having the highest median family income of $164,625, while families with 1 earner (514) have the lowest median family income of $44,013, accounting for 8.7% and 33.0% of families, respectively.
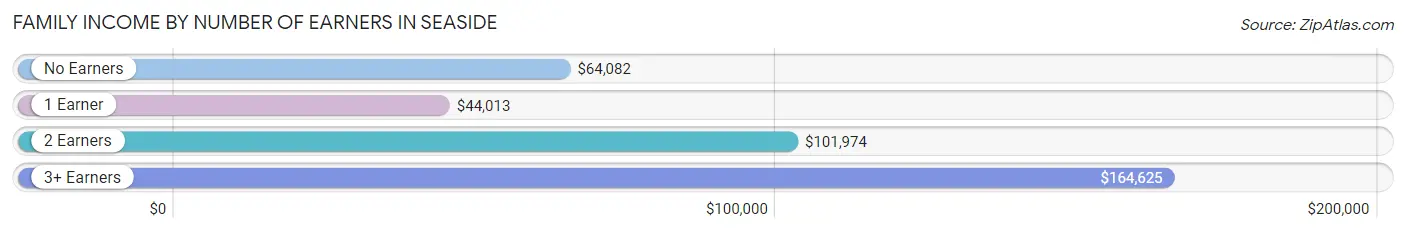
| Number of Earners | # Families | Median Income |
| No Earners | 372 (23.9%) | $64,082 |
| 1 Earner | 514 (33.0%) | $44,013 |
| 2 Earners | 538 (34.5%) | $101,974 |
| 3+ Earners | 135 (8.7%) | $164,625 |
| Total | 1,559 (100.0%) | $77,634 |
Household Income in Seaside
Household Income Brackets in Seaside
With 1,008 households falling in the category, the $35,000 to $49,999 income range is the most frequent in Seaside, accounting for 28.0% of all households. In contrast, only 90 households (2.5%) fall into the $25,000 to $34,999 income bracket, making it the least populous group.
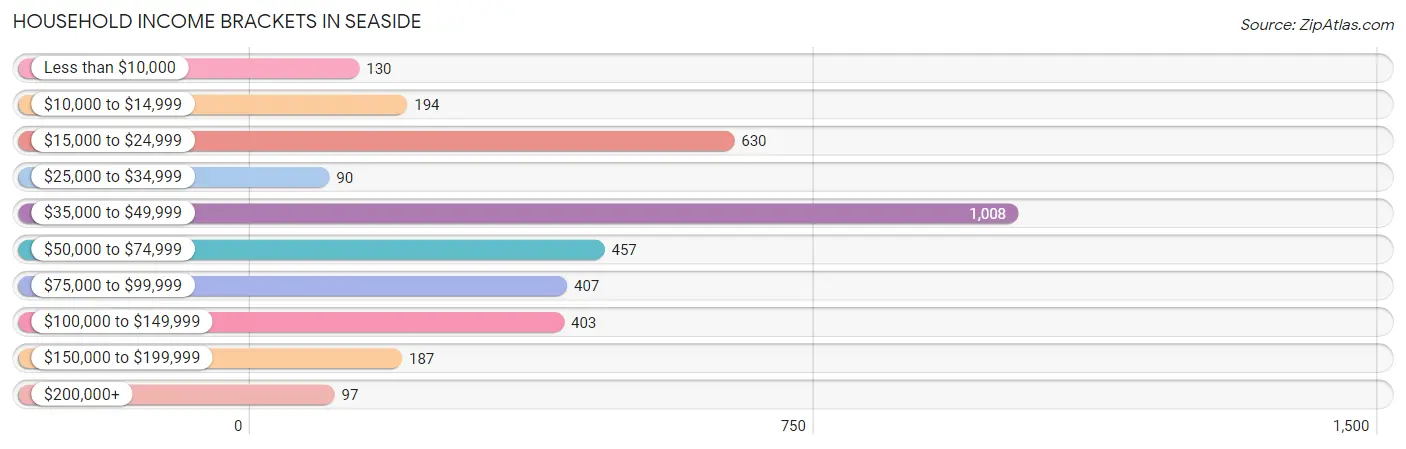
| Income Bracket | # Households | % Households |
| Less than $10,000 | 130 | 3.6% |
| $10,000 to $14,999 | 194 | 5.4% |
| $15,000 to $24,999 | 630 | 17.5% |
| $25,000 to $34,999 | 90 | 2.5% |
| $35,000 to $49,999 | 1,008 | 28.0% |
| $50,000 to $74,999 | 457 | 12.7% |
| $75,000 to $99,999 | 407 | 11.3% |
| $100,000 to $149,999 | 403 | 11.2% |
| $150,000 to $199,999 | 187 | 5.2% |
| $200,000+ | 97 | 2.7% |
Household Income by Householder Age in Seaside
The median household income in Seaside is $44,087, with the highest median household income of $47,656 found in the 65+ years age bracket for the primary householder. A total of 1,300 households (36.1%) fall into this category. Meanwhile, the 15 to 24 years age bracket for the primary householder has the lowest median household income of $0, with 49 households (1.4%) in this group.
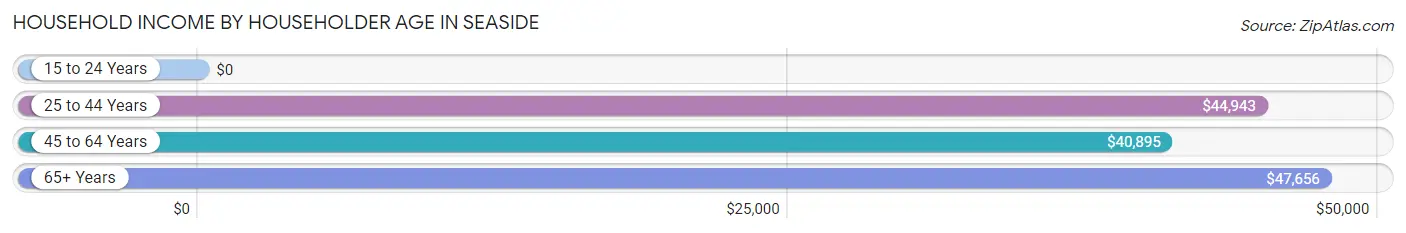
| Income Bracket | # Households | Median Income |
| 15 to 24 Years | 49 (1.4%) | $0 |
| 25 to 44 Years | 934 (25.9%) | $44,943 |
| 45 to 64 Years | 1,317 (36.6%) | $40,895 |
| 65+ Years | 1,300 (36.1%) | $47,656 |
| Total | 3,600 (100.0%) | $44,087 |
Poverty in Seaside
Income Below Poverty by Sex and Age in Seaside
With 16.0% poverty level for males and 11.8% for females among the residents of Seaside, under 5 year old males and 12 to 14 year old females are the most vulnerable to poverty, with 64 males (100.0%) and 57 females (48.7%) in their respective age groups living below the poverty level.
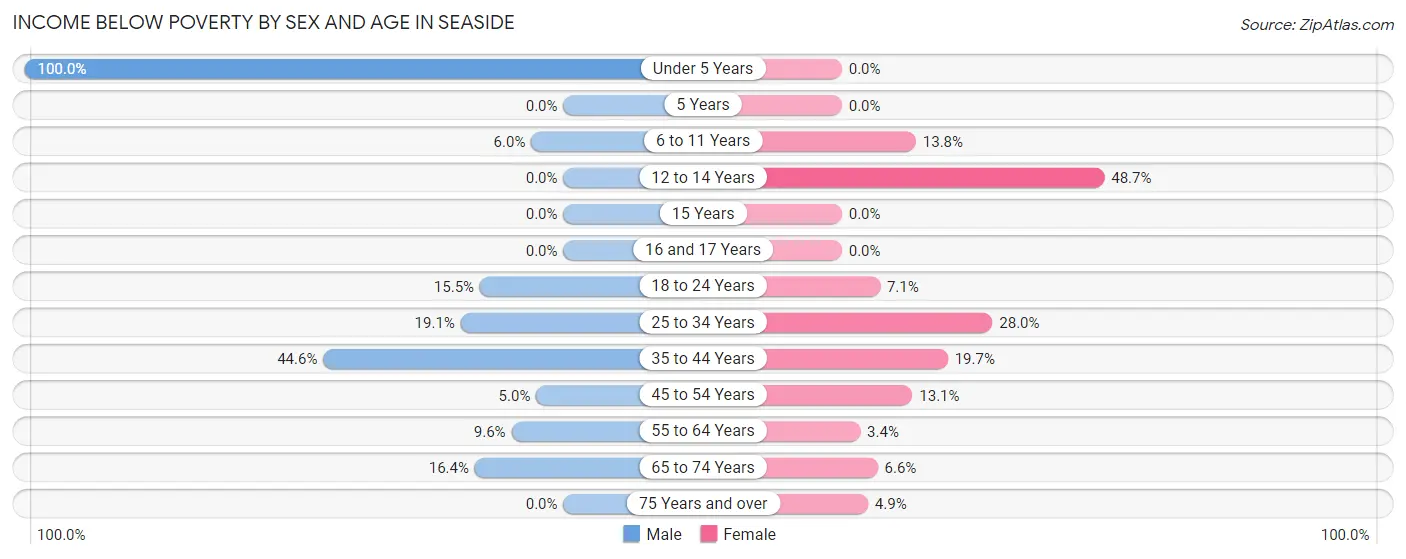
| Age Bracket | Male | Female |
| Under 5 Years | 64 (100.0%) | 0 (0.0%) |
| 5 Years | 0 (0.0%) | 0 (0.0%) |
| 6 to 11 Years | 13 (6.0%) | 37 (13.8%) |
| 12 to 14 Years | 0 (0.0%) | 57 (48.7%) |
| 15 Years | 0 (0.0%) | 0 (0.0%) |
| 16 and 17 Years | 0 (0.0%) | 0 (0.0%) |
| 18 to 24 Years | 46 (15.5%) | 19 (7.1%) |
| 25 to 34 Years | 65 (19.1%) | 109 (28.0%) |
| 35 to 44 Years | 193 (44.6%) | 92 (19.7%) |
| 45 to 54 Years | 33 (5.0%) | 57 (13.1%) |
| 55 to 64 Years | 31 (9.6%) | 22 (3.4%) |
| 65 to 74 Years | 59 (16.4%) | 52 (6.6%) |
| 75 Years and over | 0 (0.0%) | 19 (4.9%) |
| Total | 504 (16.0%) | 464 (11.8%) |
Income Above Poverty by Sex and Age in Seaside
According to the poverty statistics in Seaside, males aged 5 years and females aged under 5 years are the age groups that are most secure financially, with 100.0% of males and 100.0% of females in these age groups living above the poverty line.
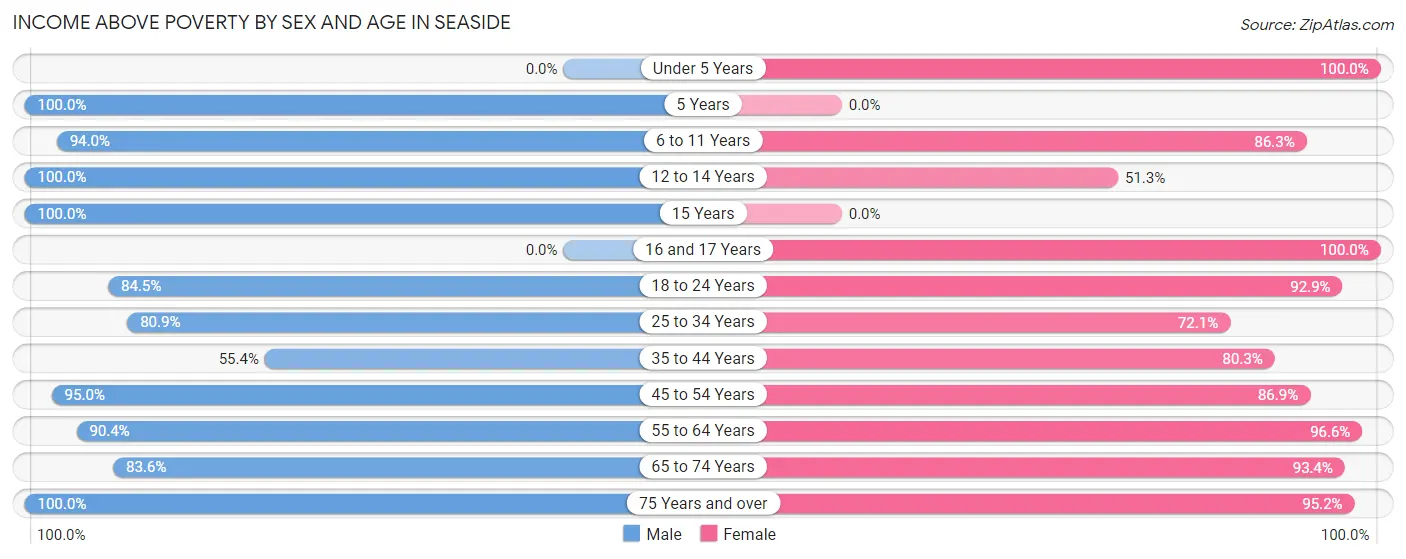
| Age Bracket | Male | Female |
| Under 5 Years | 0 (0.0%) | 59 (100.0%) |
| 5 Years | 40 (100.0%) | 0 (0.0%) |
| 6 to 11 Years | 205 (94.0%) | 232 (86.3%) |
| 12 to 14 Years | 98 (100.0%) | 60 (51.3%) |
| 15 Years | 44 (100.0%) | 0 (0.0%) |
| 16 and 17 Years | 0 (0.0%) | 98 (100.0%) |
| 18 to 24 Years | 251 (84.5%) | 249 (92.9%) |
| 25 to 34 Years | 276 (80.9%) | 281 (72.1%) |
| 35 to 44 Years | 240 (55.4%) | 376 (80.3%) |
| 45 to 54 Years | 623 (95.0%) | 378 (86.9%) |
| 55 to 64 Years | 291 (90.4%) | 623 (96.6%) |
| 65 to 74 Years | 300 (83.6%) | 731 (93.4%) |
| 75 Years and over | 284 (100.0%) | 373 (95.2%) |
| Total | 2,652 (84.0%) | 3,460 (88.2%) |
Income Below Poverty Among Married-Couple Families in Seaside
The poverty statistics for married-couple families in Seaside show that 7.3% or 81 of the total 1,102 families live below the poverty line. Families with 1 or 2 children have the highest poverty rate of 16.7%, comprising of 58 families. On the other hand, families with 3 or 4 children have the lowest poverty rate of 0.0%, which includes 0 families.
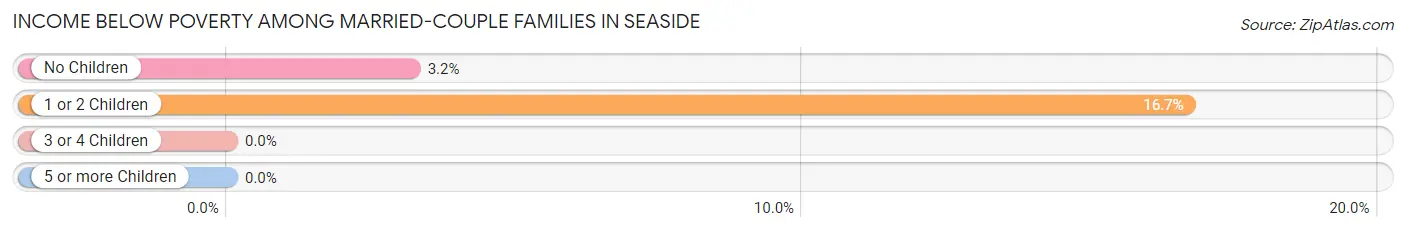
| Children | Above Poverty | Below Poverty |
| No Children | 700 (96.8%) | 23 (3.2%) |
| 1 or 2 Children | 290 (83.3%) | 58 (16.7%) |
| 3 or 4 Children | 14 (100.0%) | 0 (0.0%) |
| 5 or more Children | 17 (100.0%) | 0 (0.0%) |
| Total | 1,021 (92.6%) | 81 (7.3%) |
Income Below Poverty Among Single-Parent Households in Seaside
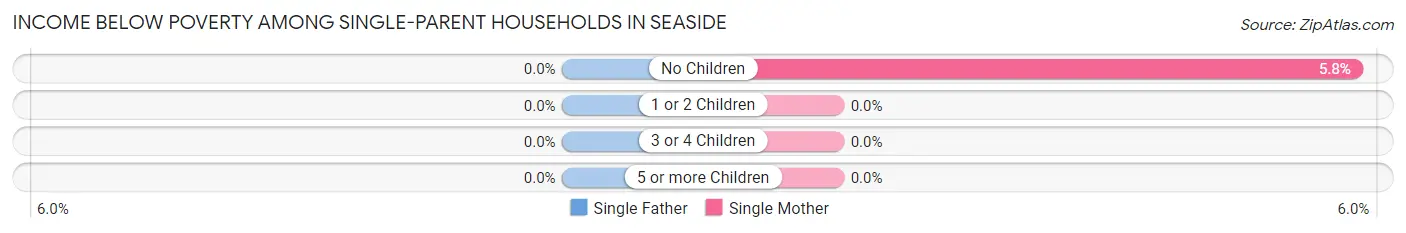
| Children | Single Father | Single Mother |
| No Children | 0 (0.0%) | 17 (5.8%) |
| 1 or 2 Children | 0 (0.0%) | 0 (0.0%) |
| 3 or 4 Children | 0 (0.0%) | 0 (0.0%) |
| 5 or more Children | 0 (0.0%) | 0 (0.0%) |
| Total | 0 (0.0%) | 17 (4.6%) |
Income Below Poverty Among Married-Couple vs Single-Parent Households in Seaside
The poverty data for Seaside shows that 81 of the married-couple family households (7.3%) and 17 of the single-parent households (3.7%) are living below the poverty level. Within the married-couple family households, those with 1 or 2 children have the highest poverty rate, with 58 households (16.7%) falling below the poverty line. Among the single-parent households, those with no children have the highest poverty rate, with 17 household (5.8%) living below poverty.
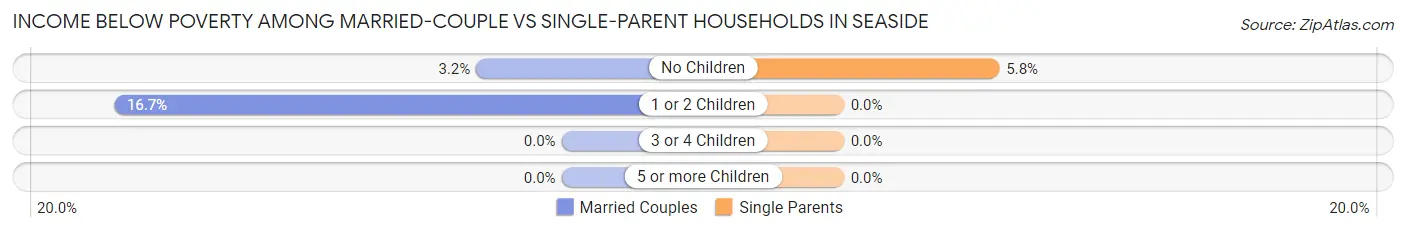
| Children | Married-Couple Families | Single-Parent Households |
| No Children | 23 (3.2%) | 17 (5.8%) |
| 1 or 2 Children | 58 (16.7%) | 0 (0.0%) |
| 3 or 4 Children | 0 (0.0%) | 0 (0.0%) |
| 5 or more Children | 0 (0.0%) | 0 (0.0%) |
| Total | 81 (7.3%) | 17 (3.7%) |
Race in Seaside
The most populous races in Seaside are White / Caucasian (6,724 | 94.2%), Hispanic or Latino (589 | 8.3%), and Black / African American (187 | 2.6%).
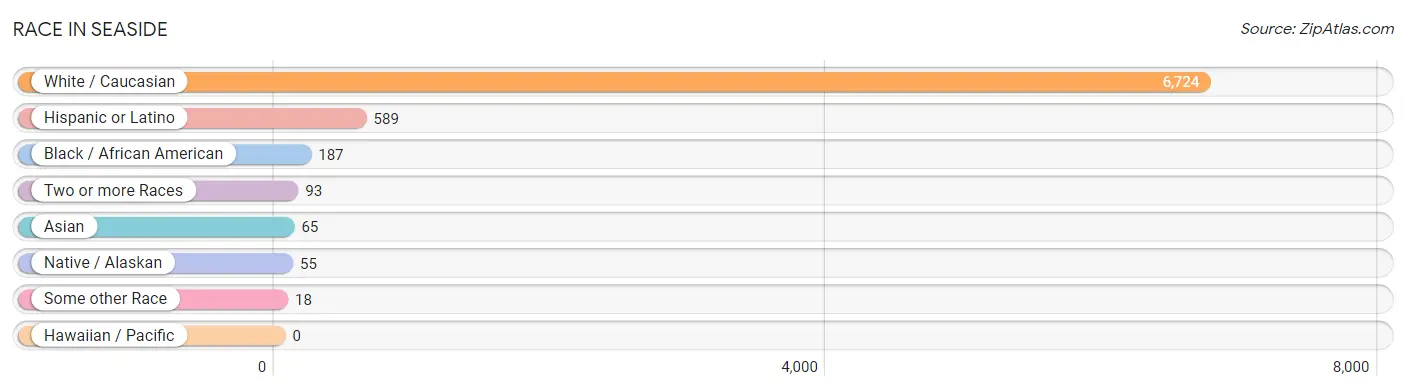
| Race | # Population | % Population |
| Asian | 65 | 0.9% |
| Black / African American | 187 | 2.6% |
| Hawaiian / Pacific | 0 | 0.0% |
| Hispanic or Latino | 589 | 8.3% |
| Native / Alaskan | 55 | 0.8% |
| White / Caucasian | 6,724 | 94.2% |
| Two or more Races | 93 | 1.3% |
| Some other Race | 18 | 0.3% |
| Total | 7,142 | 100.0% |
Ancestry in Seaside
The most populous ancestries reported in Seaside are Irish (1,494 | 20.9%), English (1,366 | 19.1%), German (1,349 | 18.9%), Mexican (508 | 7.1%), and Italian (341 | 4.8%), together accounting for 70.8% of all Seaside residents.
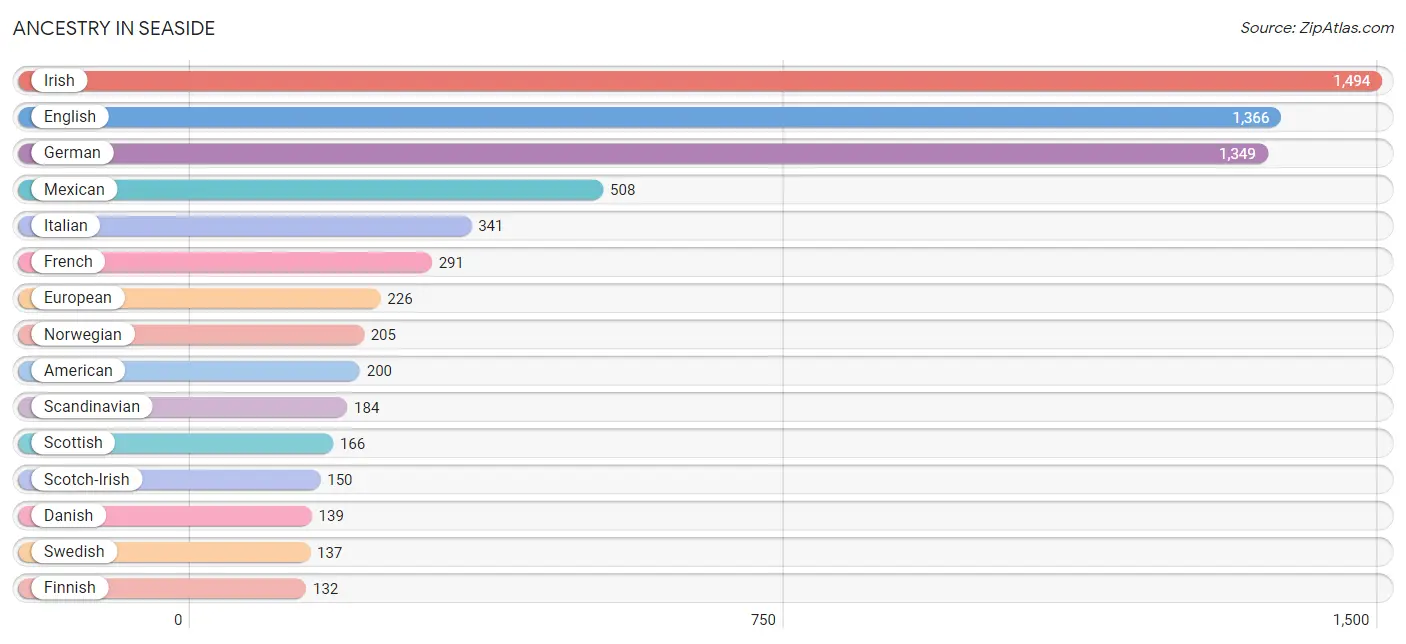
| Ancestry | # Population | % Population |
| American | 200 | 2.8% |
| Austrian | 19 | 0.3% |
| Bhutanese | 29 | 0.4% |
| British | 97 | 1.4% |
| Burmese | 19 | 0.3% |
| Central American | 43 | 0.6% |
| Cherokee | 3 | 0.0% |
| Czech | 66 | 0.9% |
| Czechoslovakian | 37 | 0.5% |
| Danish | 139 | 1.9% |
| Dutch | 48 | 0.7% |
| English | 1,366 | 19.1% |
| European | 226 | 3.2% |
| Finnish | 132 | 1.8% |
| French | 291 | 4.1% |
| French Canadian | 86 | 1.2% |
| German | 1,349 | 18.9% |
| Guatemalan | 18 | 0.3% |
| Honduran | 25 | 0.4% |
| Irish | 1,494 | 20.9% |
| Iroquois | 30 | 0.4% |
| Italian | 341 | 4.8% |
| Korean | 17 | 0.2% |
| Laotian | 17 | 0.2% |
| Lithuanian | 16 | 0.2% |
| Mexican | 508 | 7.1% |
| Mexican American Indian | 25 | 0.4% |
| Norwegian | 205 | 2.9% |
| Polish | 119 | 1.7% |
| Puerto Rican | 15 | 0.2% |
| Russian | 25 | 0.4% |
| Scandinavian | 184 | 2.6% |
| Scotch-Irish | 150 | 2.1% |
| Scottish | 166 | 2.3% |
| South American | 20 | 0.3% |
| Swedish | 137 | 1.9% |
| Ukrainian | 32 | 0.4% |
| Venezuelan | 20 | 0.3% |
| Welsh | 41 | 0.6% | View All 39 Rows |
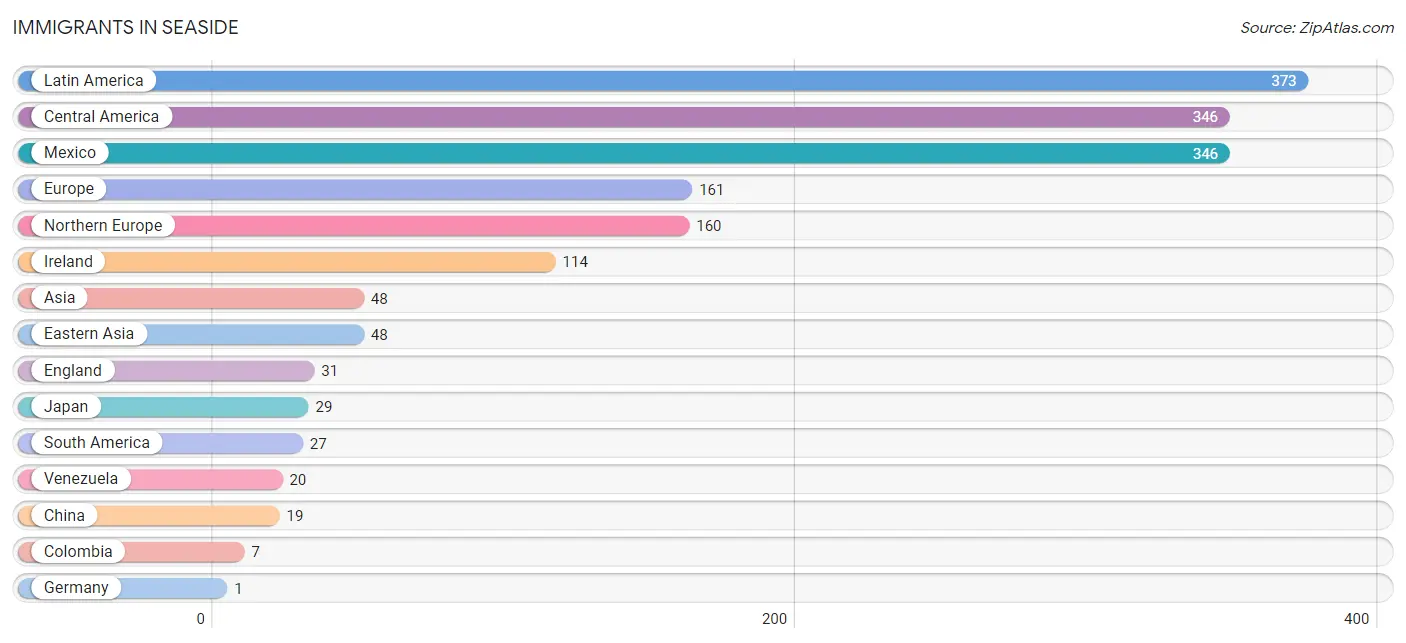
Immigrants in Seaside
The most numerous immigrant groups reported in Seaside came from Latin America (373 | 5.2%), Central America (346 | 4.8%), Mexico (346 | 4.8%), Europe (161 | 2.2%), and Northern Europe (160 | 2.2%), together accounting for 19.4% of all Seaside residents.
| Immigration Origin | # Population | % Population |
| Asia | 48 | 0.7% |
| Central America | 346 | 4.8% |
| China | 19 | 0.3% |
| Colombia | 7 | 0.1% |
| Eastern Asia | 48 | 0.7% |
| England | 31 | 0.4% |
| Europe | 161 | 2.2% |
| Germany | 1 | 0.0% |
| Ireland | 114 | 1.6% |
| Japan | 29 | 0.4% |
| Latin America | 373 | 5.2% |
| Mexico | 346 | 4.8% |
| Northern Europe | 160 | 2.2% |
| South America | 27 | 0.4% |
| Venezuela | 20 | 0.3% |
| Western Europe | 1 | 0.0% | View All 16 Rows |
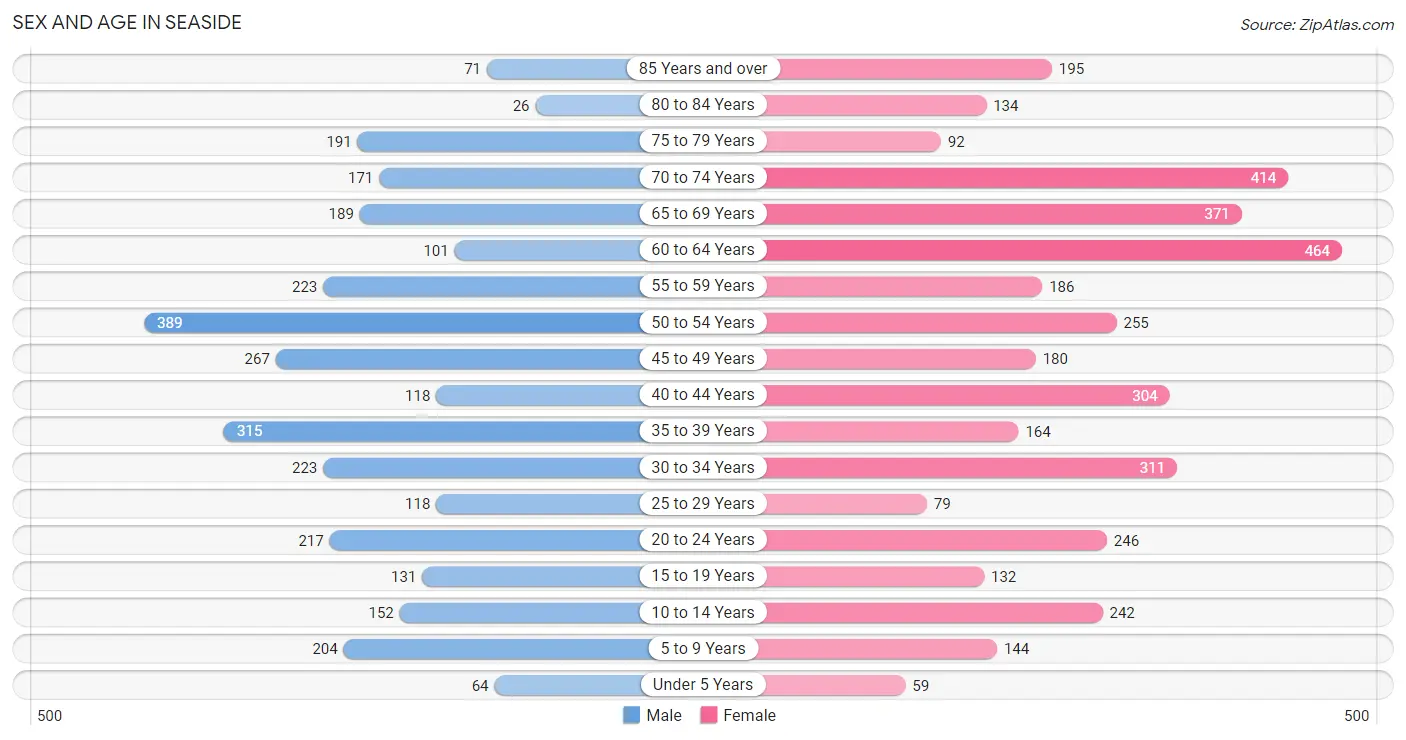
Sex and Age in Seaside
Sex and Age in Seaside
The most populous age groups in Seaside are 50 to 54 Years (389 | 12.3%) for men and 60 to 64 Years (464 | 11.7%) for women.
| Age Bracket | Male | Female |
| Under 5 Years | 64 (2.0%) | 59 (1.5%) |
| 5 to 9 Years | 204 (6.4%) | 144 (3.6%) |
| 10 to 14 Years | 152 (4.8%) | 242 (6.1%) |
| 15 to 19 Years | 131 (4.1%) | 132 (3.3%) |
| 20 to 24 Years | 217 (6.9%) | 246 (6.2%) |
| 25 to 29 Years | 118 (3.7%) | 79 (2.0%) |
| 30 to 34 Years | 223 (7.0%) | 311 (7.8%) |
| 35 to 39 Years | 315 (9.9%) | 164 (4.1%) |
| 40 to 44 Years | 118 (3.7%) | 304 (7.6%) |
| 45 to 49 Years | 267 (8.4%) | 180 (4.5%) |
| 50 to 54 Years | 389 (12.3%) | 255 (6.4%) |
| 55 to 59 Years | 223 (7.0%) | 186 (4.7%) |
| 60 to 64 Years | 101 (3.2%) | 464 (11.7%) |
| 65 to 69 Years | 189 (6.0%) | 371 (9.3%) |
| 70 to 74 Years | 171 (5.4%) | 414 (10.4%) |
| 75 to 79 Years | 191 (6.0%) | 92 (2.3%) |
| 80 to 84 Years | 26 (0.8%) | 134 (3.4%) |
| 85 Years and over | 71 (2.2%) | 195 (4.9%) |
| Total | 3,170 (100.0%) | 3,972 (100.0%) |
Families and Households in Seaside
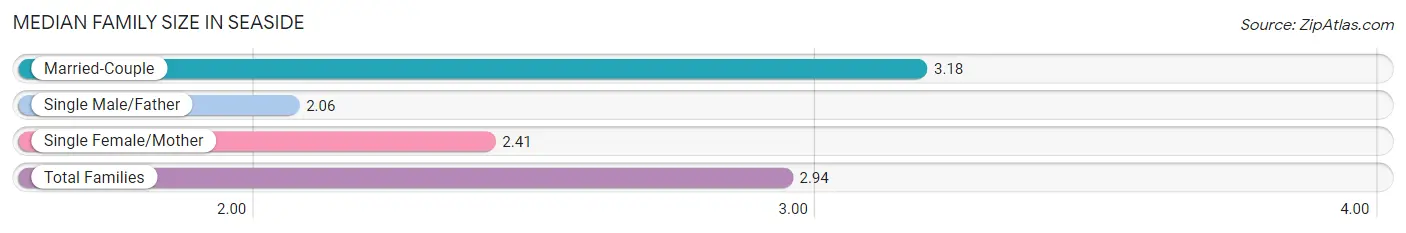
Median Family Size in Seaside
The median family size in Seaside is 2.94 persons per family, with married-couple families (1,102 | 70.7%) accounting for the largest median family size of 3.18 persons per family. On the other hand, single male/father families (85 | 5.4%) represent the smallest median family size with 2.06 persons per family.
| Family Type | # Families | Family Size |
| Married-Couple | 1,102 (70.7%) | 3.18 |
| Single Male/Father | 85 (5.4%) | 2.06 |
| Single Female/Mother | 372 (23.9%) | 2.41 |
| Total Families | 1,559 (100.0%) | 2.94 |
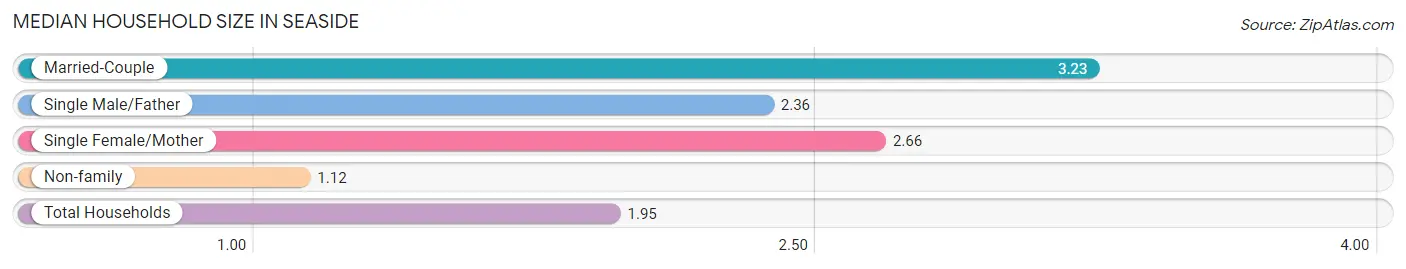
Median Household Size in Seaside
The median household size in Seaside is 1.95 persons per household, with married-couple households (1,102 | 30.6%) accounting for the largest median household size of 3.23 persons per household. non-family households (2,041 | 56.7%) represent the smallest median household size with 1.12 persons per household.
| Household Type | # Households | Household Size |
| Married-Couple | 1,102 (30.6%) | 3.23 |
| Single Male/Father | 85 (2.4%) | 2.36 |
| Single Female/Mother | 372 (10.3%) | 2.66 |
| Non-family | 2,041 (56.7%) | 1.12 |
| Total Households | 3,600 (100.0%) | 1.95 |
Household Size by Marriage Status in Seaside
Out of a total of 3,600 households in Seaside, 1,559 (43.3%) are family households, while 2,041 (56.7%) are nonfamily households. The most numerous type of family households are 2-person households, comprising 865, and the most common type of nonfamily households are 1-person households, comprising 1,791.
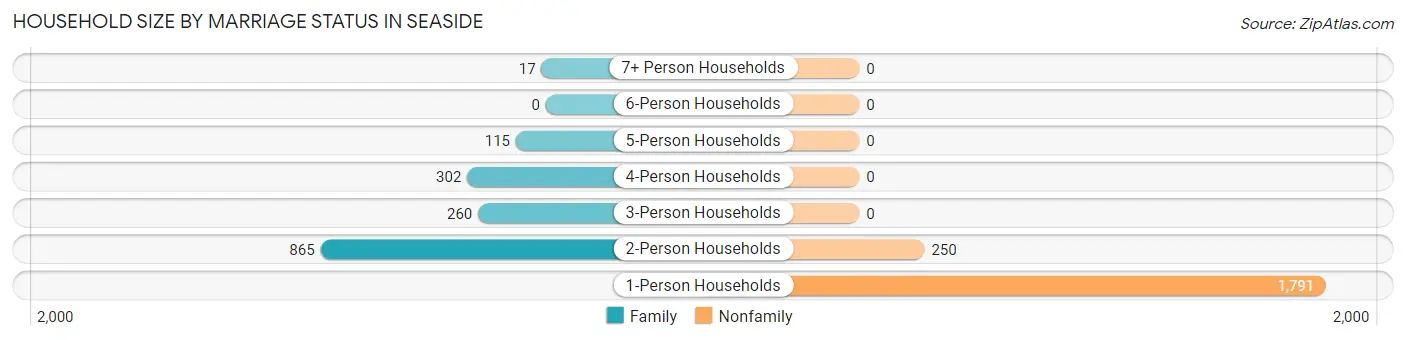
| Household Size | Family Households | Nonfamily Households |
| 1-Person Households | - | 1,791 (49.7%) |
| 2-Person Households | 865 (24.0%) | 250 (6.9%) |
| 3-Person Households | 260 (7.2%) | 0 (0.0%) |
| 4-Person Households | 302 (8.4%) | 0 (0.0%) |
| 5-Person Households | 115 (3.2%) | 0 (0.0%) |
| 6-Person Households | 0 (0.0%) | 0 (0.0%) |
| 7+ Person Households | 17 (0.5%) | 0 (0.0%) |
| Total | 1,559 (43.3%) | 2,041 (56.7%) |
Female Fertility in Seaside
Fertility by Age in Seaside
Average fertility rate in Seaside is 12.0 births per 1,000 women. Women in the age bracket of 20 to 34 years have the highest fertility rate with 27.0 births per 1,000 women. Women in the age bracket of 20 to 34 years acount for 100.0% of all women with births.
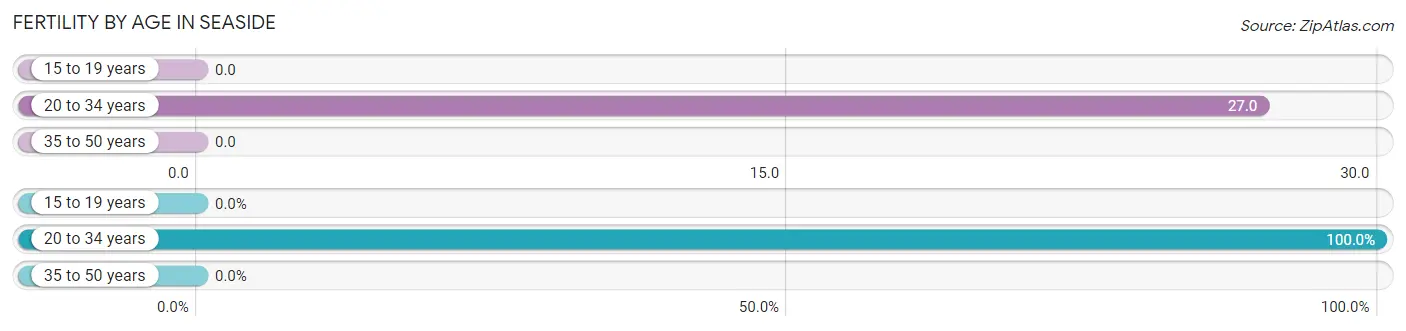
| Age Bracket | Women with Births | Births / 1,000 Women |
| 15 to 19 years | 0 (0.0%) | 0.0 |
| 20 to 34 years | 17 (100.0%) | 27.0 |
| 35 to 50 years | 0 (0.0%) | 0.0 |
| Total | 17 (100.0%) | 12.0 |
Fertility by Age by Marriage Status in Seaside
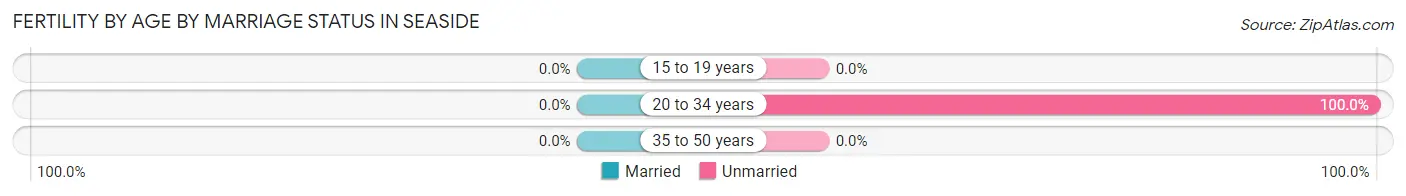
| Age Bracket | Married | Unmarried |
| 15 to 19 years | 0 (0.0%) | 0 (0.0%) |
| 20 to 34 years | 0 (0.0%) | 17 (100.0%) |
| 35 to 50 years | 0 (0.0%) | 0 (0.0%) |
| Total | 0 (0.0%) | 17 (100.0%) |
Fertility by Education in Seaside
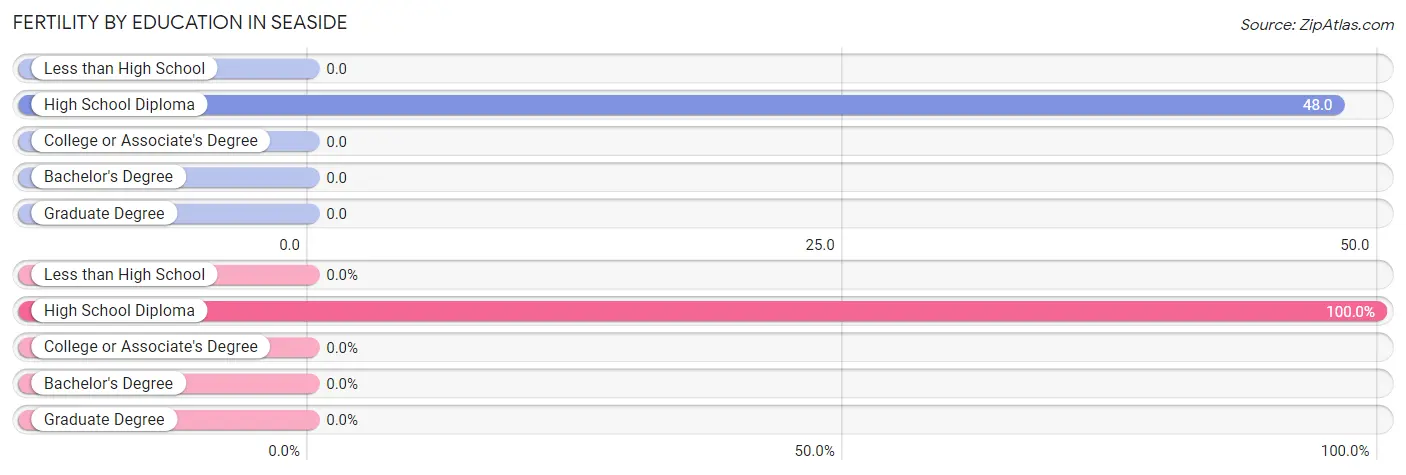
| Educational Attainment | Women with Births | Births / 1,000 Women |
| Less than High School | 0 (0.0%) | 0.0 |
| High School Diploma | 17 (100.0%) | 48.0 |
| College or Associate's Degree | 0 (0.0%) | 0.0 |
| Bachelor's Degree | 0 (0.0%) | 0.0 |
| Graduate Degree | 0 (0.0%) | 0.0 |
| Total | 17 (100.0%) | 12.0 |
Fertility by Education by Marriage Status in Seaside
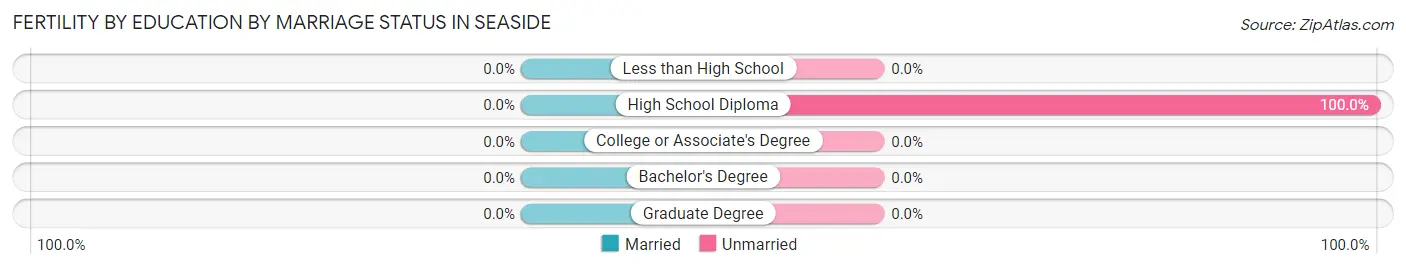
| Educational Attainment | Married | Unmarried |
| Less than High School | 0 (0.0%) | 0 (0.0%) |
| High School Diploma | 0 (0.0%) | 17 (100.0%) |
| College or Associate's Degree | 0 (0.0%) | 0 (0.0%) |
| Bachelor's Degree | 0 (0.0%) | 0 (0.0%) |
| Graduate Degree | 0 (0.0%) | 0 (0.0%) |
| Total | 0 (0.0%) | 17 (100.0%) |
Employment Characteristics in Seaside
Employment by Class of Employer in Seaside
Among the 3,210 employed individuals in Seaside, private company employees (1,982 | 61.7%), not-for-profit organizations (402 | 12.5%), and self-employed (not incorporated) (335 | 10.4%) make up the most common classes of employment.
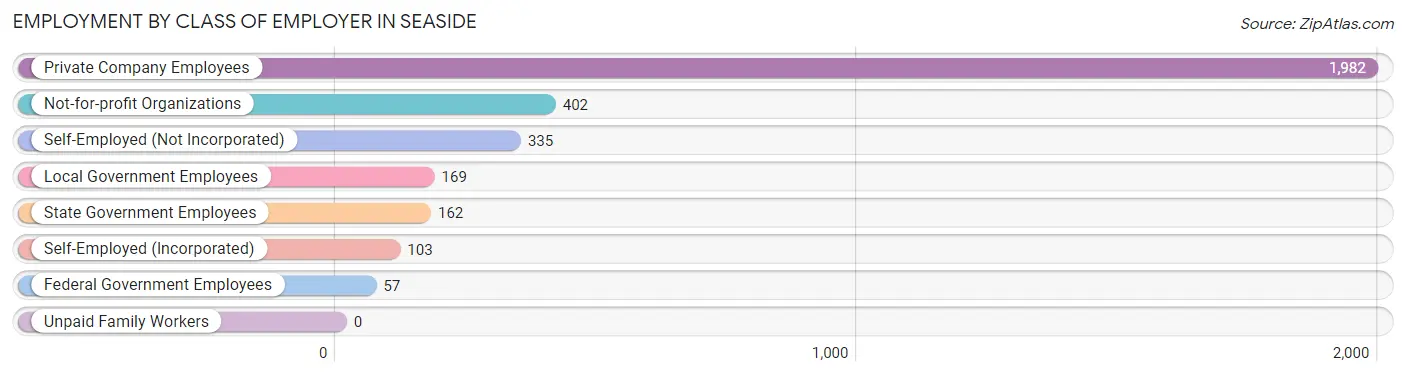
| Employer Class | # Employees | % Employees |
| Private Company Employees | 1,982 | 61.7% |
| Self-Employed (Incorporated) | 103 | 3.2% |
| Self-Employed (Not Incorporated) | 335 | 10.4% |
| Not-for-profit Organizations | 402 | 12.5% |
| Local Government Employees | 169 | 5.3% |
| State Government Employees | 162 | 5.1% |
| Federal Government Employees | 57 | 1.8% |
| Unpaid Family Workers | 0 | 0.0% |
| Total | 3,210 | 100.0% |
Employment Status by Age in Seaside
According to the labor force statistics for Seaside, out of the total population over 16 years of age (6,233), 56.8% or 3,540 individuals are in the labor force, with 7.9% or 280 of them unemployed. The age group with the highest labor force participation rate is 25 to 29 years, with 98.0% or 193 individuals in the labor force. Within the labor force, the 30 to 34 years age range has the highest percentage of unemployed individuals, with 40.3% or 189 of them being unemployed.
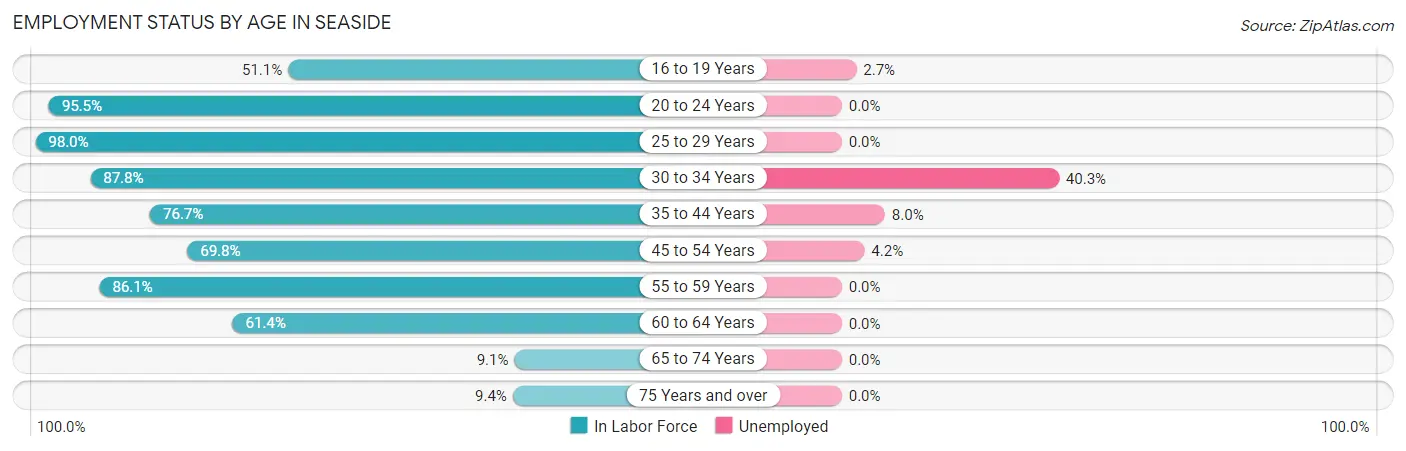
| Age Bracket | In Labor Force | Unemployed |
| 16 to 19 Years | 112 (51.1%) | 3 (2.7%) |
| 20 to 24 Years | 442 (95.5%) | 0 (0.0%) |
| 25 to 29 Years | 193 (98.0%) | 0 (0.0%) |
| 30 to 34 Years | 469 (87.8%) | 189 (40.3%) |
| 35 to 44 Years | 691 (76.7%) | 55 (8.0%) |
| 45 to 54 Years | 762 (69.8%) | 32 (4.2%) |
| 55 to 59 Years | 352 (86.1%) | 0 (0.0%) |
| 60 to 64 Years | 347 (61.4%) | 0 (0.0%) |
| 65 to 74 Years | 104 (9.1%) | 0 (0.0%) |
| 75 Years and over | 67 (9.4%) | 0 (0.0%) |
| Total | 3,540 (56.8%) | 280 (7.9%) |
Employment Status by Educational Attainment in Seaside
According to labor force statistics for Seaside, 76.1% of individuals (2,813) out of the total population between 25 and 64 years of age (3,697) are in the labor force, with 9.9% or 278 of them being unemployed. The group with the highest labor force participation rate are those with the educational attainment of bachelor's degree or higher, with 94.3% or 746 individuals in the labor force. Within the labor force, individuals with bachelor's degree or higher education have the highest percentage of unemployment, with 17.6% or 131 of them being unemployed.
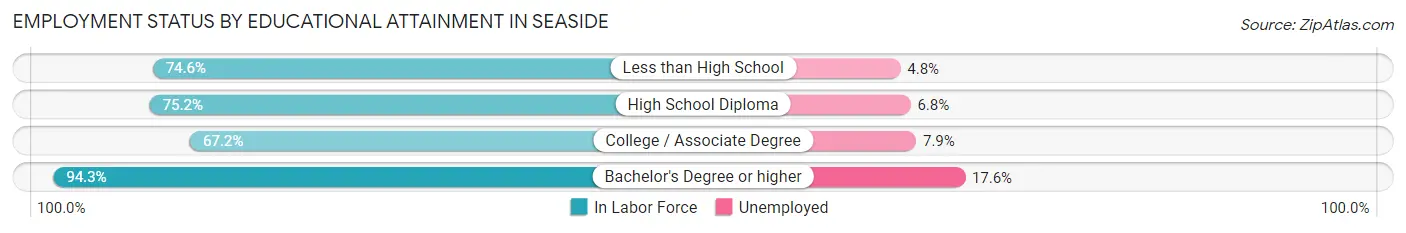
| Educational Attainment | In Labor Force | Unemployed |
| Less than High School | 249 (74.6%) | 16 (4.8%) |
| High School Diploma | 837 (75.2%) | 76 (6.8%) |
| College / Associate Degree | 980 (67.2%) | 115 (7.9%) |
| Bachelor's Degree or higher | 746 (94.3%) | 139 (17.6%) |
| Total | 2,813 (76.1%) | 366 (9.9%) |
Employment Occupations by Sex in Seaside
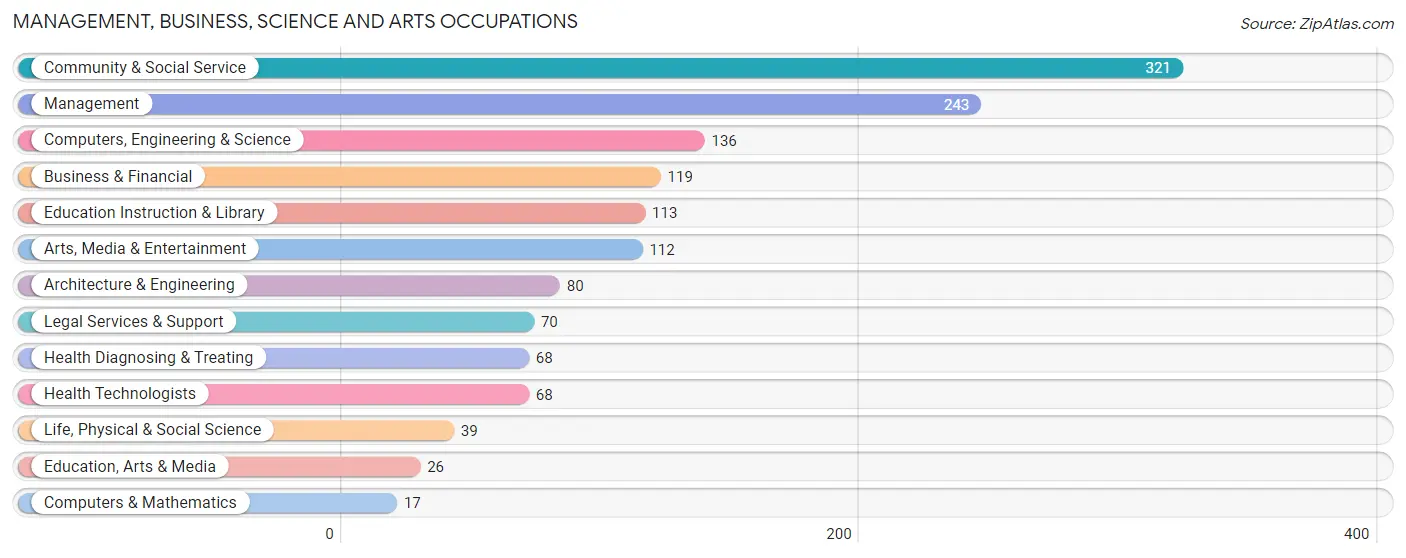
Management, Business, Science and Arts Occupations
The most common Management, Business, Science and Arts occupations in Seaside are Community & Social Service (321 | 9.9%), Management (243 | 7.5%), Computers, Engineering & Science (136 | 4.2%), Business & Financial (119 | 3.7%), and Education Instruction & Library (113 | 3.5%).
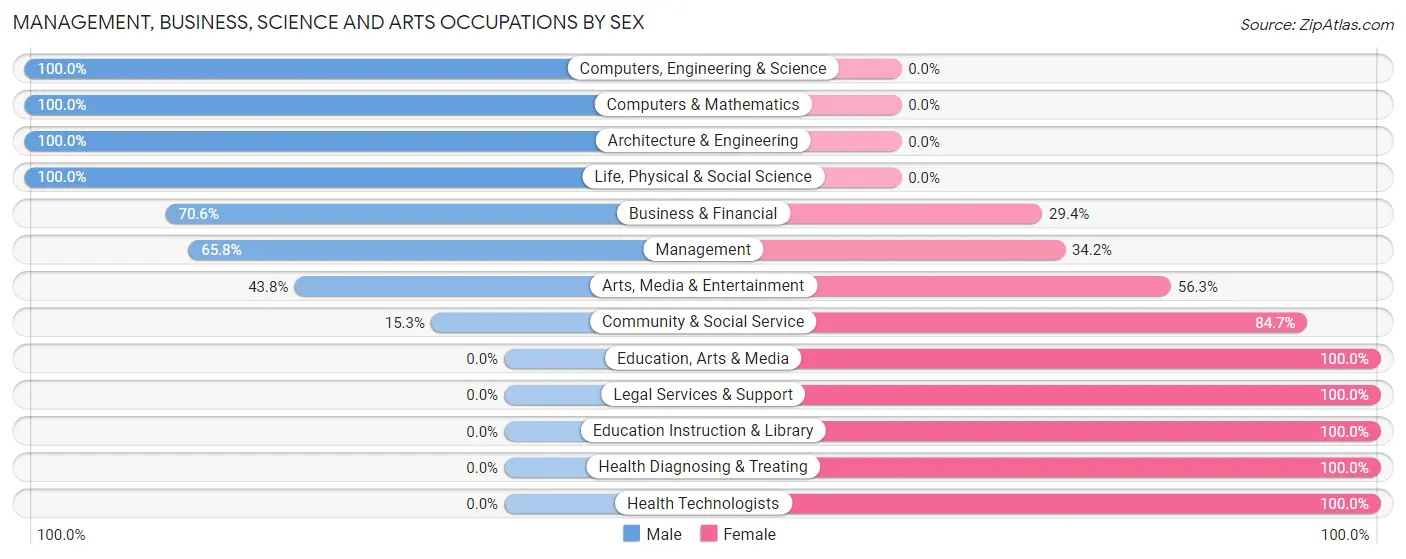
Management, Business, Science and Arts Occupations by Sex
Within the Management, Business, Science and Arts occupations in Seaside, the most male-oriented occupations are Computers, Engineering & Science (100.0%), Computers & Mathematics (100.0%), and Architecture & Engineering (100.0%), while the most female-oriented occupations are Education, Arts & Media (100.0%), Legal Services & Support (100.0%), and Education Instruction & Library (100.0%).
| Occupation | Male | Female |
| Management | 160 (65.8%) | 83 (34.2%) |
| Business & Financial | 84 (70.6%) | 35 (29.4%) |
| Computers, Engineering & Science | 136 (100.0%) | 0 (0.0%) |
| Computers & Mathematics | 17 (100.0%) | 0 (0.0%) |
| Architecture & Engineering | 80 (100.0%) | 0 (0.0%) |
| Life, Physical & Social Science | 39 (100.0%) | 0 (0.0%) |
| Community & Social Service | 49 (15.3%) | 272 (84.7%) |
| Education, Arts & Media | 0 (0.0%) | 26 (100.0%) |
| Legal Services & Support | 0 (0.0%) | 70 (100.0%) |
| Education Instruction & Library | 0 (0.0%) | 113 (100.0%) |
| Arts, Media & Entertainment | 49 (43.8%) | 63 (56.2%) |
| Health Diagnosing & Treating | 0 (0.0%) | 68 (100.0%) |
| Health Technologists | 0 (0.0%) | 68 (100.0%) |
| Total (Category) | 429 (48.4%) | 458 (51.6%) |
| Total (Overall) | 1,745 (53.8%) | 1,497 (46.2%) |
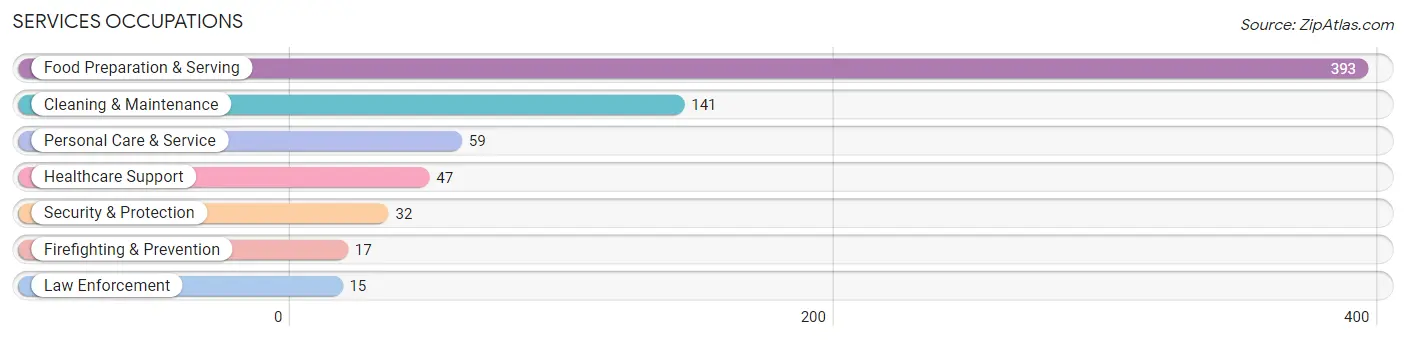
Services Occupations
The most common Services occupations in Seaside are Food Preparation & Serving (393 | 12.1%), Cleaning & Maintenance (141 | 4.3%), Personal Care & Service (59 | 1.8%), Healthcare Support (47 | 1.5%), and Security & Protection (32 | 1.0%).
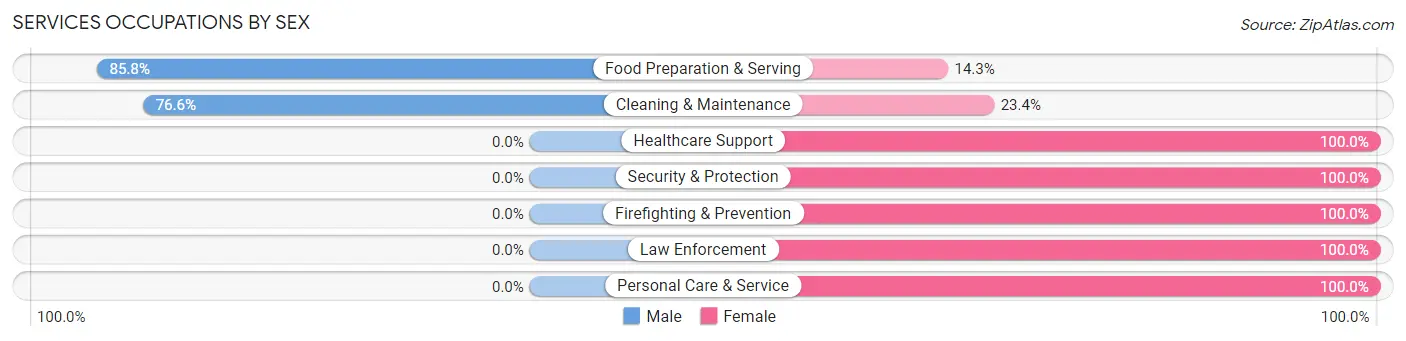
Services Occupations by Sex
Within the Services occupations in Seaside, the most male-oriented occupations are Food Preparation & Serving (85.8%), and Cleaning & Maintenance (76.6%), while the most female-oriented occupations are Healthcare Support (100.0%), Security & Protection (100.0%), and Firefighting & Prevention (100.0%).
| Occupation | Male | Female |
| Healthcare Support | 0 (0.0%) | 47 (100.0%) |
| Security & Protection | 0 (0.0%) | 32 (100.0%) |
| Firefighting & Prevention | 0 (0.0%) | 17 (100.0%) |
| Law Enforcement | 0 (0.0%) | 15 (100.0%) |
| Food Preparation & Serving | 337 (85.8%) | 56 (14.2%) |
| Cleaning & Maintenance | 108 (76.6%) | 33 (23.4%) |
| Personal Care & Service | 0 (0.0%) | 59 (100.0%) |
| Total (Category) | 445 (66.2%) | 227 (33.8%) |
| Total (Overall) | 1,745 (53.8%) | 1,497 (46.2%) |
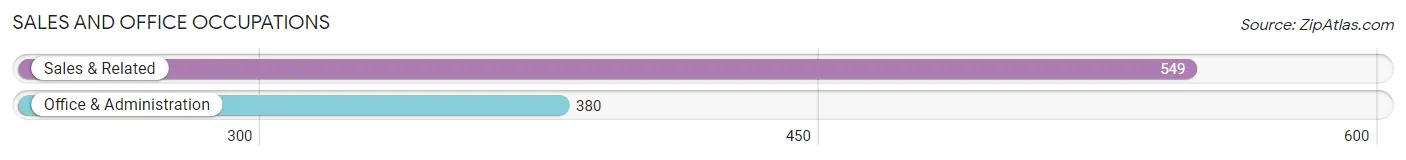
Sales and Office Occupations
The most common Sales and Office occupations in Seaside are Sales & Related (549 | 16.9%), and Office & Administration (380 | 11.7%).
Sales and Office Occupations by Sex
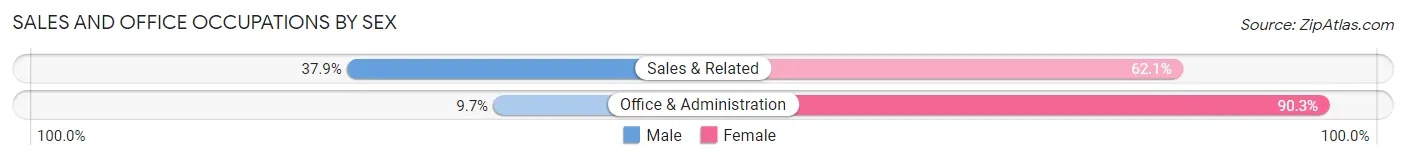
| Occupation | Male | Female |
| Sales & Related | 208 (37.9%) | 341 (62.1%) |
| Office & Administration | 37 (9.7%) | 343 (90.3%) |
| Total (Category) | 245 (26.4%) | 684 (73.6%) |
| Total (Overall) | 1,745 (53.8%) | 1,497 (46.2%) |
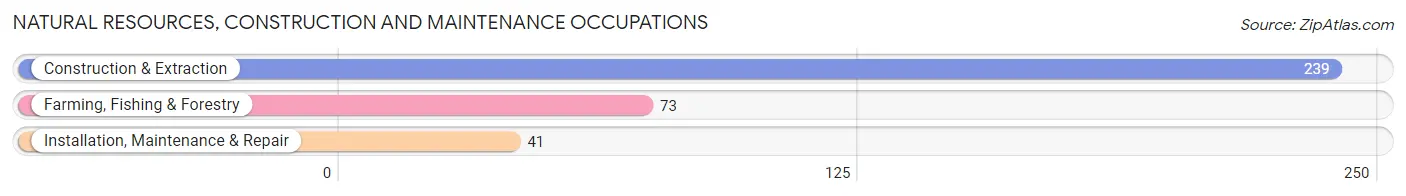
Natural Resources, Construction and Maintenance Occupations
The most common Natural Resources, Construction and Maintenance occupations in Seaside are Construction & Extraction (239 | 7.4%), Farming, Fishing & Forestry (73 | 2.2%), and Installation, Maintenance & Repair (41 | 1.3%).
Natural Resources, Construction and Maintenance Occupations by Sex
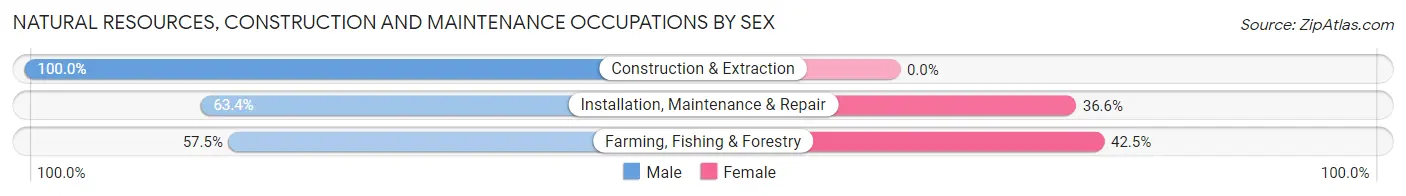
| Occupation | Male | Female |
| Farming, Fishing & Forestry | 42 (57.5%) | 31 (42.5%) |
| Construction & Extraction | 239 (100.0%) | 0 (0.0%) |
| Installation, Maintenance & Repair | 26 (63.4%) | 15 (36.6%) |
| Total (Category) | 307 (87.0%) | 46 (13.0%) |
| Total (Overall) | 1,745 (53.8%) | 1,497 (46.2%) |
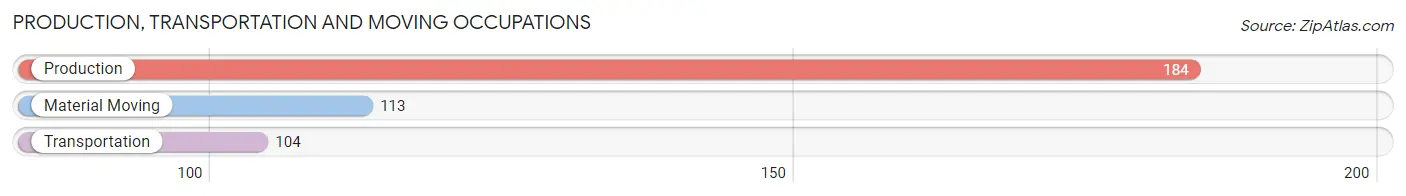
Production, Transportation and Moving Occupations
The most common Production, Transportation and Moving occupations in Seaside are Production (184 | 5.7%), Material Moving (113 | 3.5%), and Transportation (104 | 3.2%).
Production, Transportation and Moving Occupations by Sex
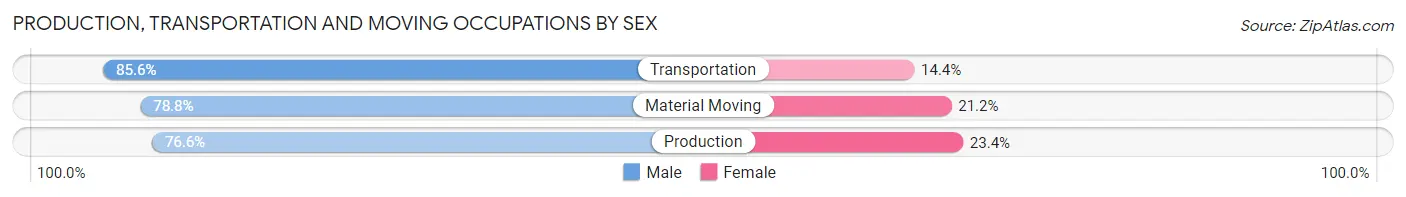
| Occupation | Male | Female |
| Production | 141 (76.6%) | 43 (23.4%) |
| Transportation | 89 (85.6%) | 15 (14.4%) |
| Material Moving | 89 (78.8%) | 24 (21.2%) |
| Total (Category) | 319 (79.5%) | 82 (20.4%) |
| Total (Overall) | 1,745 (53.8%) | 1,497 (46.2%) |
Employment Industries by Sex in Seaside
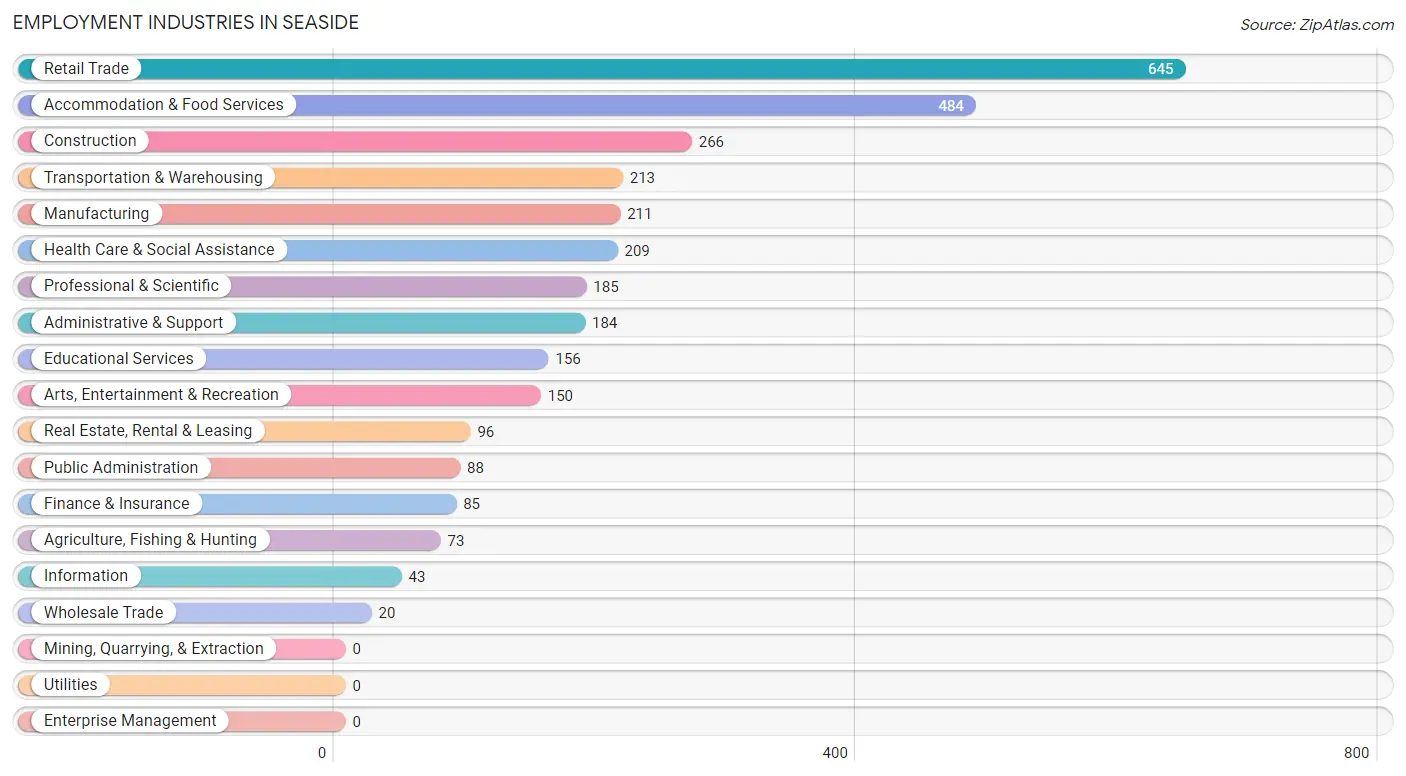
Employment Industries in Seaside
The major employment industries in Seaside include Retail Trade (645 | 19.9%), Accommodation & Food Services (484 | 14.9%), Construction (266 | 8.2%), Transportation & Warehousing (213 | 6.6%), and Manufacturing (211 | 6.5%).
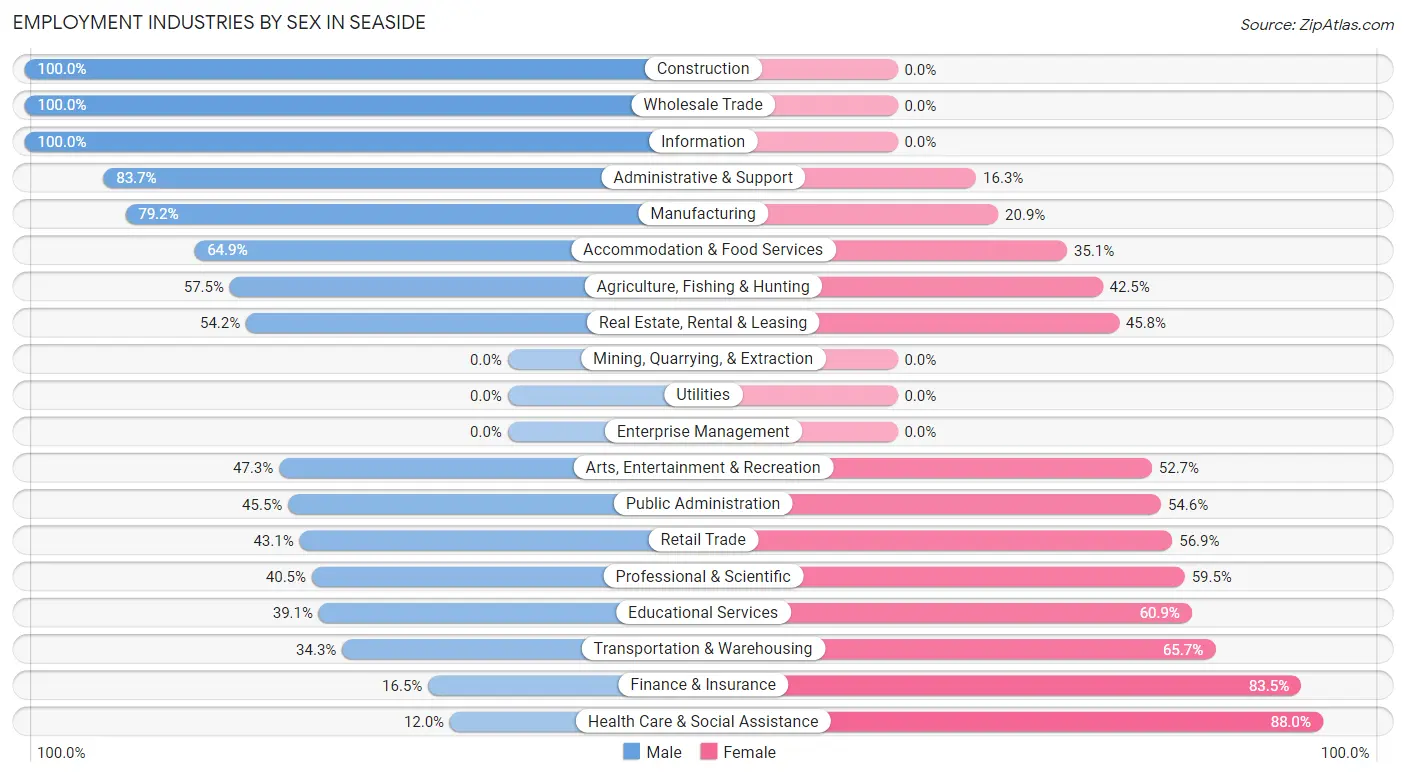
Employment Industries by Sex in Seaside
The Seaside industries that see more men than women are Construction (100.0%), Wholesale Trade (100.0%), and Information (100.0%), whereas the industries that tend to have a higher number of women are Health Care & Social Assistance (88.0%), Finance & Insurance (83.5%), and Transportation & Warehousing (65.7%).
| Industry | Male | Female |
| Agriculture, Fishing & Hunting | 42 (57.5%) | 31 (42.5%) |
| Mining, Quarrying, & Extraction | 0 (0.0%) | 0 (0.0%) |
| Construction | 266 (100.0%) | 0 (0.0%) |
| Manufacturing | 167 (79.1%) | 44 (20.8%) |
| Wholesale Trade | 20 (100.0%) | 0 (0.0%) |
| Retail Trade | 278 (43.1%) | 367 (56.9%) |
| Transportation & Warehousing | 73 (34.3%) | 140 (65.7%) |
| Utilities | 0 (0.0%) | 0 (0.0%) |
| Information | 43 (100.0%) | 0 (0.0%) |
| Finance & Insurance | 14 (16.5%) | 71 (83.5%) |
| Real Estate, Rental & Leasing | 52 (54.2%) | 44 (45.8%) |
| Professional & Scientific | 75 (40.5%) | 110 (59.5%) |
| Enterprise Management | 0 (0.0%) | 0 (0.0%) |
| Administrative & Support | 154 (83.7%) | 30 (16.3%) |
| Educational Services | 61 (39.1%) | 95 (60.9%) |
| Health Care & Social Assistance | 25 (12.0%) | 184 (88.0%) |
| Arts, Entertainment & Recreation | 71 (47.3%) | 79 (52.7%) |
| Accommodation & Food Services | 314 (64.9%) | 170 (35.1%) |
| Public Administration | 40 (45.5%) | 48 (54.5%) |
| Total | 1,745 (53.8%) | 1,497 (46.2%) |
Education in Seaside
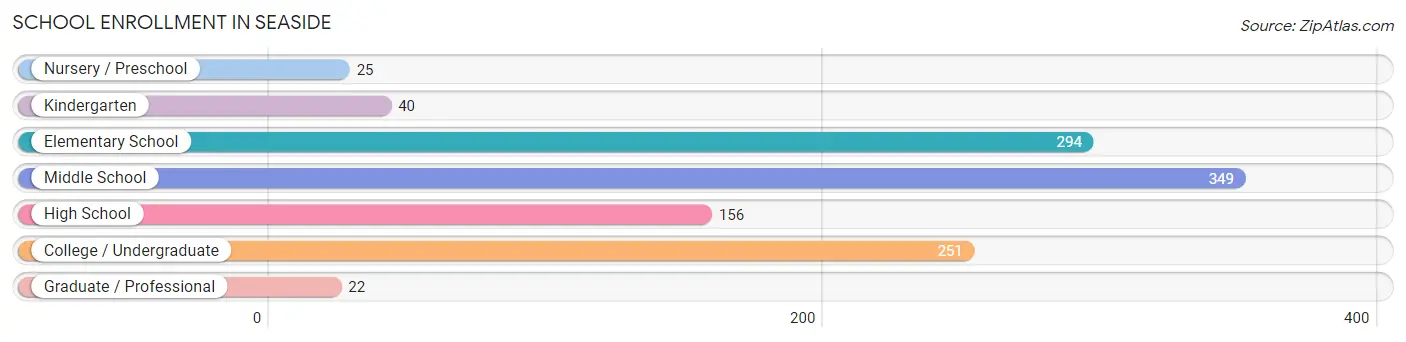
School Enrollment in Seaside
The most common levels of schooling among the 1,137 students in Seaside are middle school (349 | 30.7%), elementary school (294 | 25.9%), and college / undergraduate (251 | 22.1%).
| School Level | # Students | % Students |
| Nursery / Preschool | 25 | 2.2% |
| Kindergarten | 40 | 3.5% |
| Elementary School | 294 | 25.9% |
| Middle School | 349 | 30.7% |
| High School | 156 | 13.7% |
| College / Undergraduate | 251 | 22.1% |
| Graduate / Professional | 22 | 1.9% |
| Total | 1,137 | 100.0% |
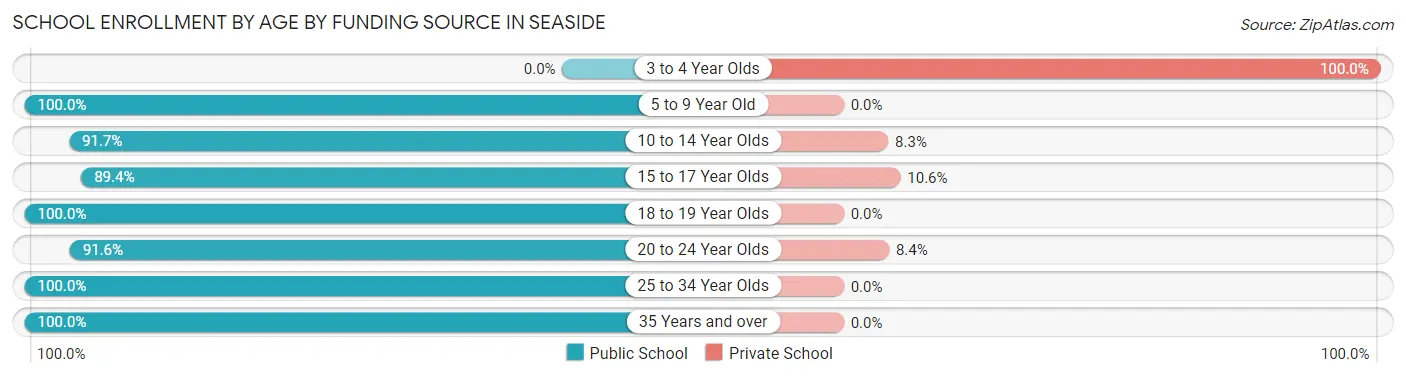
School Enrollment by Age by Funding Source in Seaside
Out of a total of 1,137 students who are enrolled in schools in Seaside, 77 (6.8%) attend a private institution, while the remaining 1,060 (93.2%) are enrolled in public schools. The age group of 3 to 4 year olds has the highest likelihood of being enrolled in private schools, with 25 (100.0% in the age bracket) enrolled. Conversely, the age group of 5 to 9 year old has the lowest likelihood of being enrolled in a private school, with 321 (100.0% in the age bracket) attending a public institution.
| Age Bracket | Public School | Private School |
| 3 to 4 Year Olds | 0 (0.0%) | 25 (100.0%) |
| 5 to 9 Year Old | 321 (100.0%) | 0 (0.0%) |
| 10 to 14 Year Olds | 332 (91.7%) | 30 (8.3%) |
| 15 to 17 Year Olds | 127 (89.4%) | 15 (10.6%) |
| 18 to 19 Year Olds | 48 (100.0%) | 0 (0.0%) |
| 20 to 24 Year Olds | 76 (91.6%) | 7 (8.4%) |
| 25 to 34 Year Olds | 130 (100.0%) | 0 (0.0%) |
| 35 Years and over | 26 (100.0%) | 0 (0.0%) |
| Total | 1,060 (93.2%) | 77 (6.8%) |
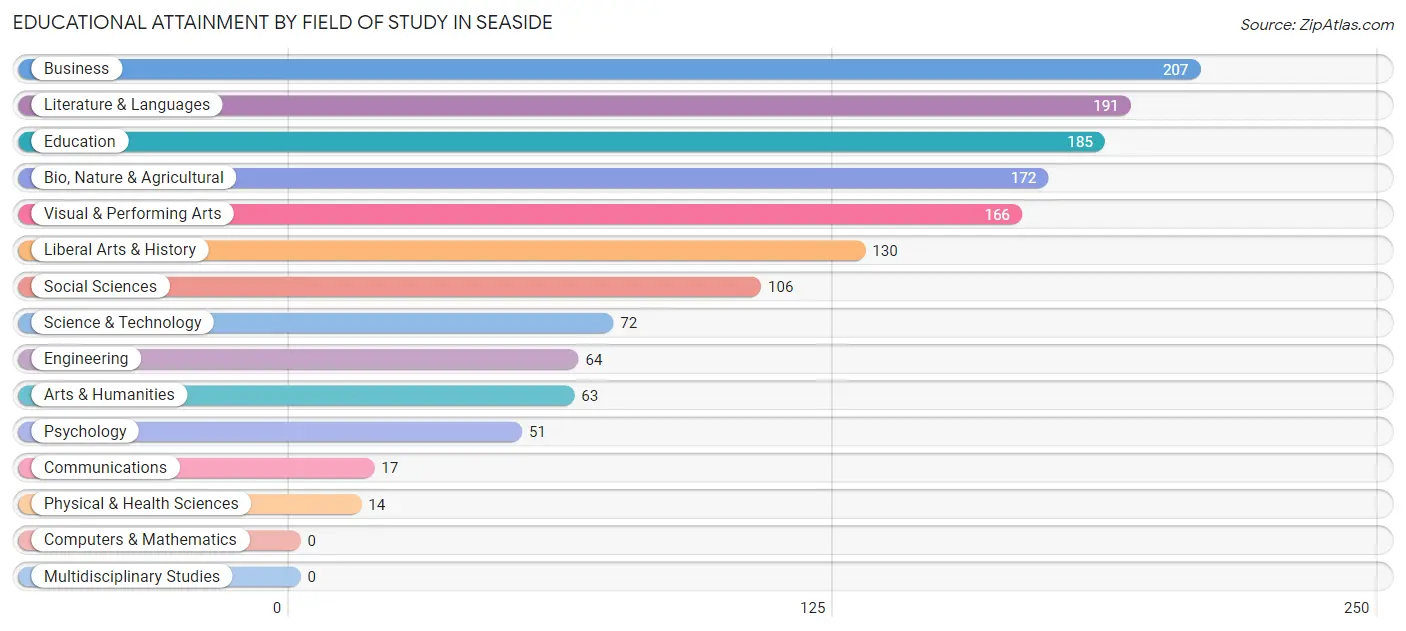
Educational Attainment by Field of Study in Seaside
Business (207 | 14.4%), literature & languages (191 | 13.3%), education (185 | 12.9%), bio, nature & agricultural (172 | 12.0%), and visual & performing arts (166 | 11.5%) are the most common fields of study among 1,438 individuals in Seaside who have obtained a bachelor's degree or higher.
| Field of Study | # Graduates | % Graduates |
| Computers & Mathematics | 0 | 0.0% |
| Bio, Nature & Agricultural | 172 | 12.0% |
| Physical & Health Sciences | 14 | 1.0% |
| Psychology | 51 | 3.5% |
| Social Sciences | 106 | 7.4% |
| Engineering | 64 | 4.4% |
| Multidisciplinary Studies | 0 | 0.0% |
| Science & Technology | 72 | 5.0% |
| Business | 207 | 14.4% |
| Education | 185 | 12.9% |
| Literature & Languages | 191 | 13.3% |
| Liberal Arts & History | 130 | 9.0% |
| Visual & Performing Arts | 166 | 11.5% |
| Communications | 17 | 1.2% |
| Arts & Humanities | 63 | 4.4% |
| Total | 1,438 | 100.0% |
Transportation & Commute in Seaside
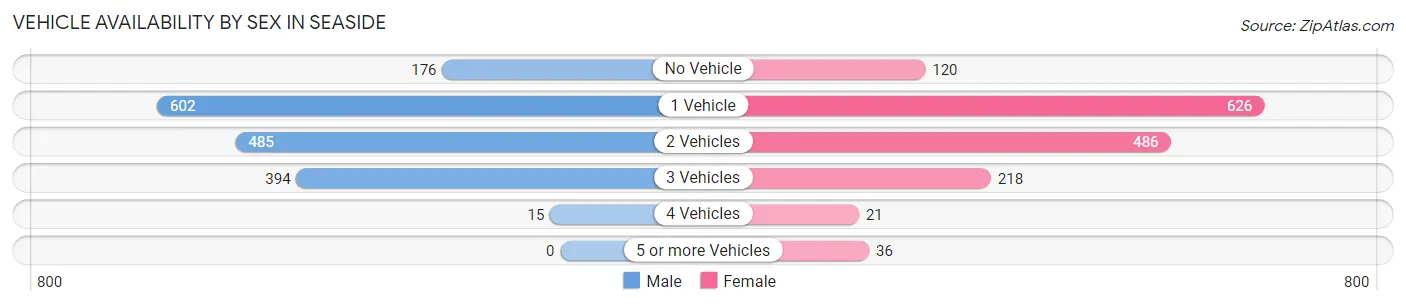
Vehicle Availability by Sex in Seaside
The most prevalent vehicle ownership categories in Seaside are males with 1 vehicle (602, accounting for 36.0%) and females with 1 vehicle (626, making up 40.0%).
| Vehicles Available | Male | Female |
| No Vehicle | 176 (10.5%) | 120 (8.0%) |
| 1 Vehicle | 602 (36.0%) | 626 (41.5%) |
| 2 Vehicles | 485 (29.0%) | 486 (32.3%) |
| 3 Vehicles | 394 (23.6%) | 218 (14.5%) |
| 4 Vehicles | 15 (0.9%) | 21 (1.4%) |
| 5 or more Vehicles | 0 (0.0%) | 36 (2.4%) |
| Total | 1,672 (100.0%) | 1,507 (100.0%) |
Commute Time in Seaside
The most frequently occuring commute durations in Seaside are 5 to 9 minutes (972 commuters, 34.0%), 15 to 19 minutes (429 commuters, 15.0%), and 10 to 14 minutes (361 commuters, 12.6%).
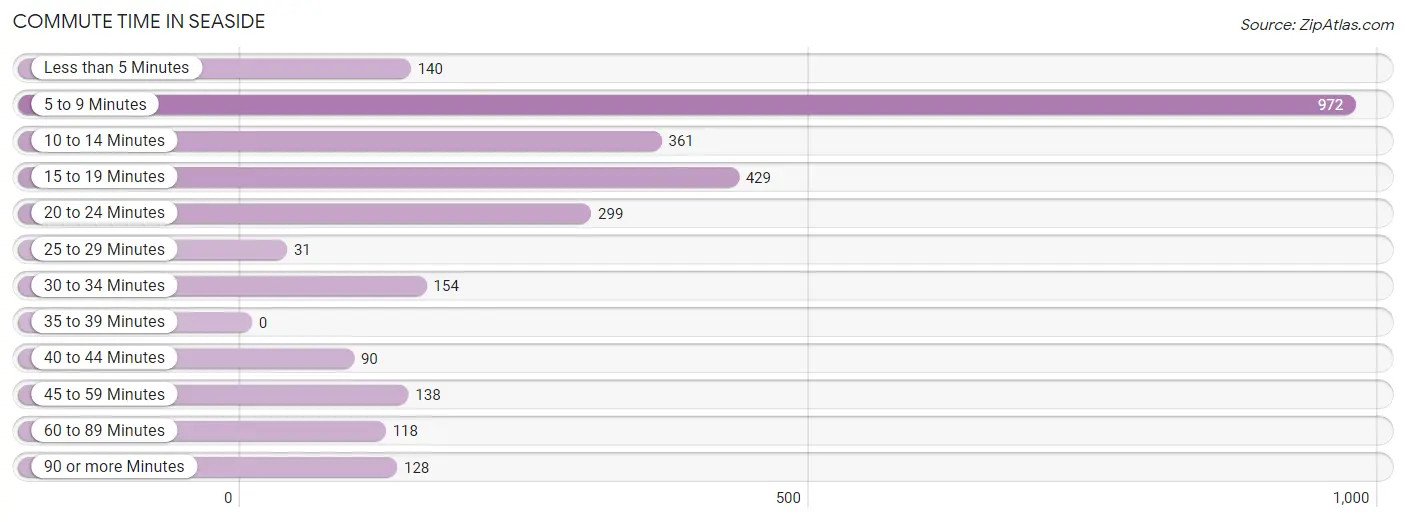
| Commute Time | # Commuters | % Commuters |
| Less than 5 Minutes | 140 | 4.9% |
| 5 to 9 Minutes | 972 | 34.0% |
| 10 to 14 Minutes | 361 | 12.6% |
| 15 to 19 Minutes | 429 | 15.0% |
| 20 to 24 Minutes | 299 | 10.4% |
| 25 to 29 Minutes | 31 | 1.1% |
| 30 to 34 Minutes | 154 | 5.4% |
| 35 to 39 Minutes | 0 | 0.0% |
| 40 to 44 Minutes | 90 | 3.2% |
| 45 to 59 Minutes | 138 | 4.8% |
| 60 to 89 Minutes | 118 | 4.1% |
| 90 or more Minutes | 128 | 4.5% |
Commute Time by Sex in Seaside
The most common commute times in Seaside are 5 to 9 minutes (527 commuters, 36.5%) for males and 5 to 9 minutes (445 commuters, 31.4%) for females.
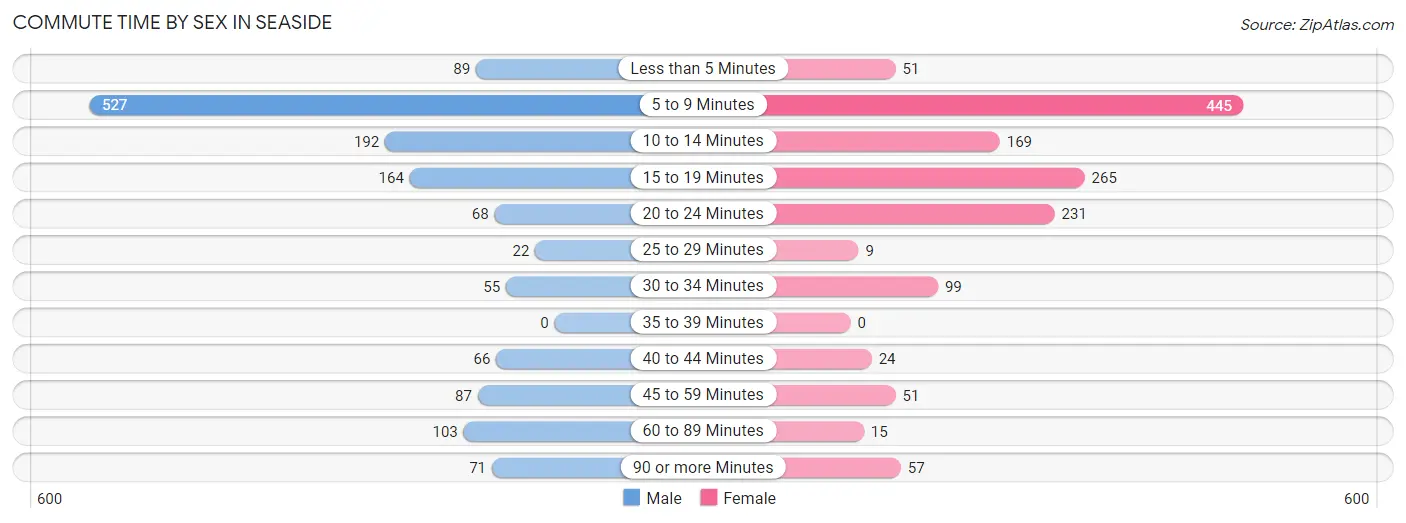
| Commute Time | Male | Female |
| Less than 5 Minutes | 89 (6.2%) | 51 (3.6%) |
| 5 to 9 Minutes | 527 (36.5%) | 445 (31.4%) |
| 10 to 14 Minutes | 192 (13.3%) | 169 (11.9%) |
| 15 to 19 Minutes | 164 (11.4%) | 265 (18.7%) |
| 20 to 24 Minutes | 68 (4.7%) | 231 (16.3%) |
| 25 to 29 Minutes | 22 (1.5%) | 9 (0.6%) |
| 30 to 34 Minutes | 55 (3.8%) | 99 (7.0%) |
| 35 to 39 Minutes | 0 (0.0%) | 0 (0.0%) |
| 40 to 44 Minutes | 66 (4.6%) | 24 (1.7%) |
| 45 to 59 Minutes | 87 (6.0%) | 51 (3.6%) |
| 60 to 89 Minutes | 103 (7.1%) | 15 (1.1%) |
| 90 or more Minutes | 71 (4.9%) | 57 (4.0%) |
Time of Departure to Work by Sex in Seaside
The most frequent times of departure to work in Seaside are 7:00 AM to 7:29 AM (222, 15.4%) for males and 6:30 AM to 6:59 AM (267, 18.9%) for females.
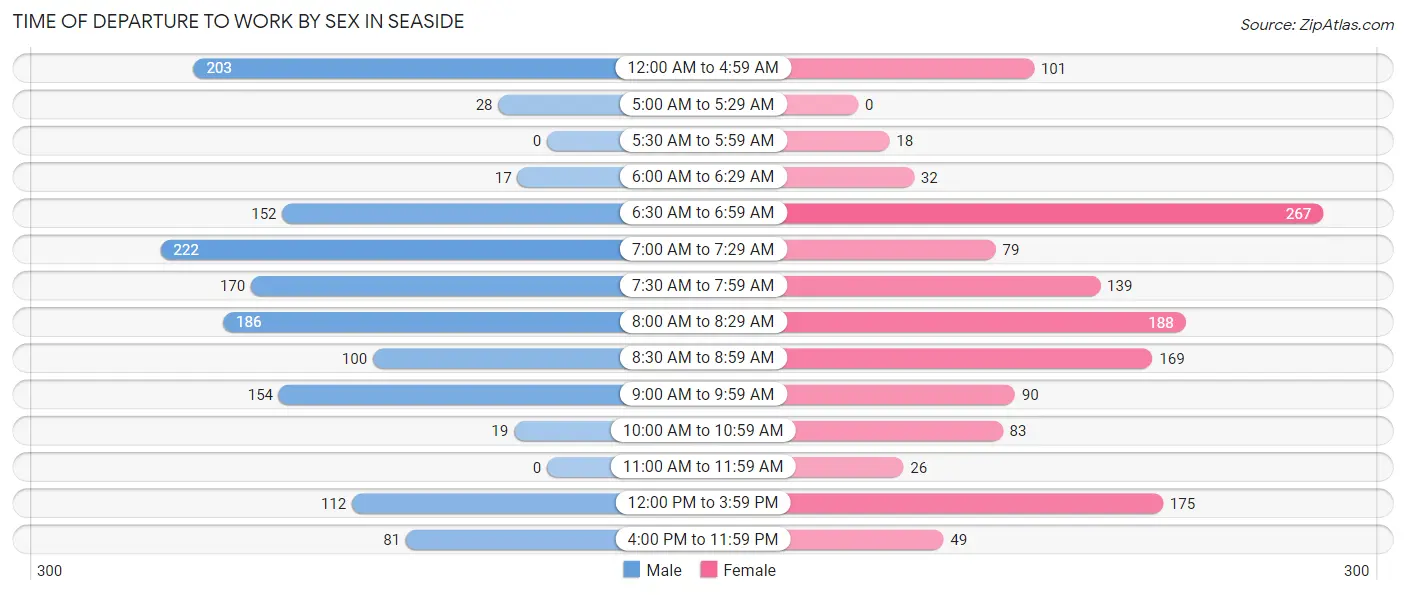
| Time of Departure | Male | Female |
| 12:00 AM to 4:59 AM | 203 (14.1%) | 101 (7.1%) |
| 5:00 AM to 5:29 AM | 28 (1.9%) | 0 (0.0%) |
| 5:30 AM to 5:59 AM | 0 (0.0%) | 18 (1.3%) |
| 6:00 AM to 6:29 AM | 17 (1.2%) | 32 (2.3%) |
| 6:30 AM to 6:59 AM | 152 (10.5%) | 267 (18.9%) |
| 7:00 AM to 7:29 AM | 222 (15.4%) | 79 (5.6%) |
| 7:30 AM to 7:59 AM | 170 (11.8%) | 139 (9.8%) |
| 8:00 AM to 8:29 AM | 186 (12.9%) | 188 (13.3%) |
| 8:30 AM to 8:59 AM | 100 (6.9%) | 169 (11.9%) |
| 9:00 AM to 9:59 AM | 154 (10.7%) | 90 (6.4%) |
| 10:00 AM to 10:59 AM | 19 (1.3%) | 83 (5.9%) |
| 11:00 AM to 11:59 AM | 0 (0.0%) | 26 (1.8%) |
| 12:00 PM to 3:59 PM | 112 (7.8%) | 175 (12.4%) |
| 4:00 PM to 11:59 PM | 81 (5.6%) | 49 (3.5%) |
| Total | 1,444 (100.0%) | 1,416 (100.0%) |
Housing Occupancy in Seaside
Occupancy by Ownership in Seaside
Of the total 3,600 dwellings in Seaside, owner-occupied units account for 1,647 (45.8%), while renter-occupied units make up 1,953 (54.2%).
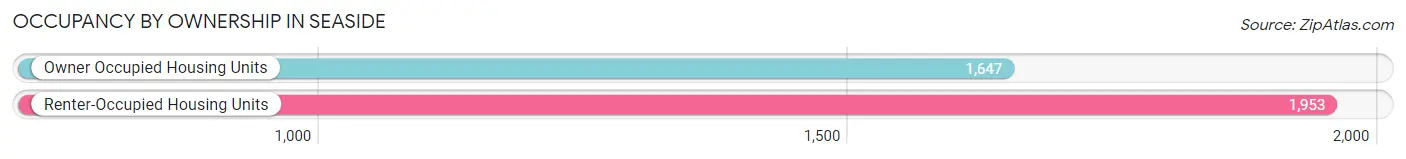
| Occupancy | # Housing Units | % Housing Units |
| Owner Occupied Housing Units | 1,647 | 45.8% |
| Renter-Occupied Housing Units | 1,953 | 54.2% |
| Total Occupied Housing Units | 3,600 | 100.0% |
Occupancy by Household Size in Seaside
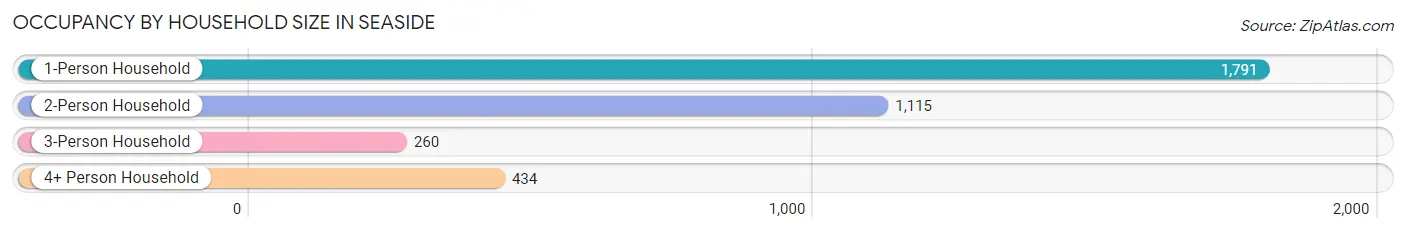
| Household Size | # Housing Units | % Housing Units |
| 1-Person Household | 1,791 | 49.7% |
| 2-Person Household | 1,115 | 31.0% |
| 3-Person Household | 260 | 7.2% |
| 4+ Person Household | 434 | 12.1% |
| Total Housing Units | 3,600 | 100.0% |
Occupancy by Ownership by Household Size in Seaside
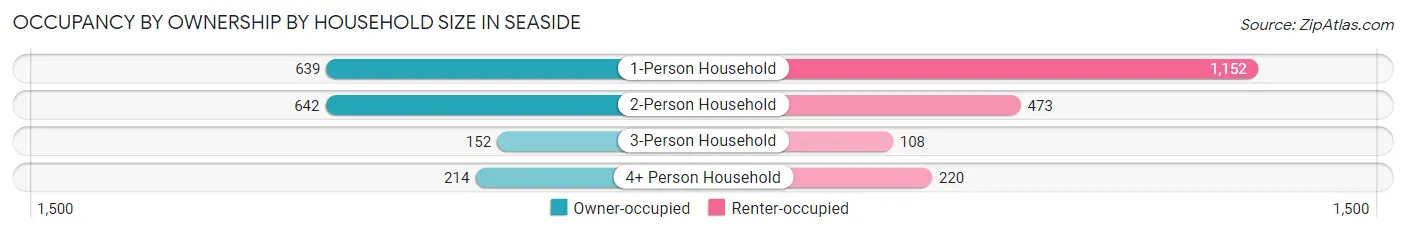
| Household Size | Owner-occupied | Renter-occupied |
| 1-Person Household | 639 (35.7%) | 1,152 (64.3%) |
| 2-Person Household | 642 (57.6%) | 473 (42.4%) |
| 3-Person Household | 152 (58.5%) | 108 (41.5%) |
| 4+ Person Household | 214 (49.3%) | 220 (50.7%) |
| Total Housing Units | 1,647 (45.8%) | 1,953 (54.2%) |
Occupancy by Educational Attainment in Seaside
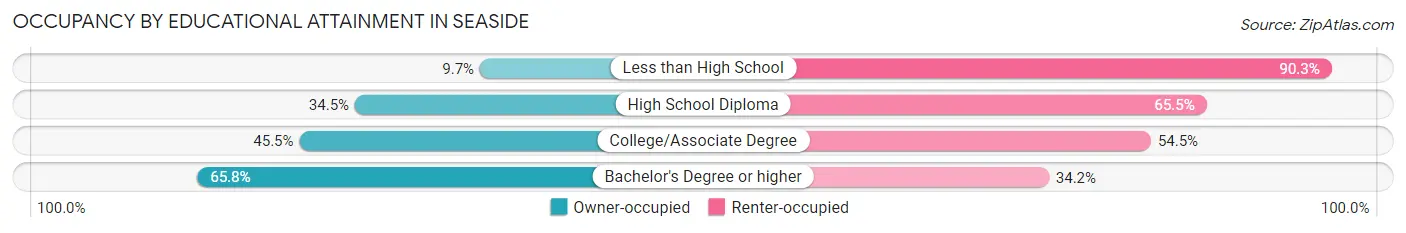
| Household Size | Owner-occupied | Renter-occupied |
| Less than High School | 14 (9.7%) | 130 (90.3%) |
| High School Diploma | 372 (34.5%) | 706 (65.5%) |
| College/Associate Degree | 681 (45.5%) | 815 (54.5%) |
| Bachelor's Degree or higher | 580 (65.8%) | 302 (34.2%) |
Occupancy by Age of Householder in Seaside
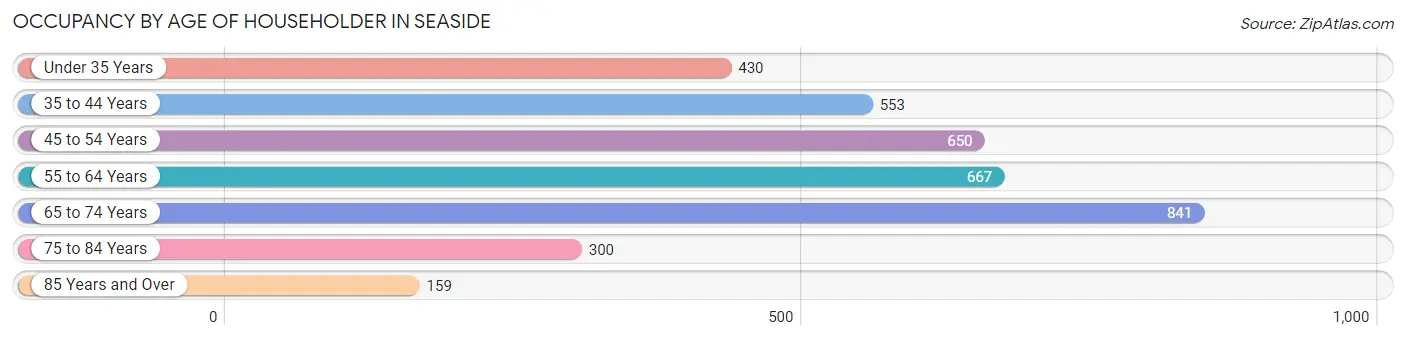
| Age Bracket | # Households | % Households |
| Under 35 Years | 430 | 11.9% |
| 35 to 44 Years | 553 | 15.4% |
| 45 to 54 Years | 650 | 18.1% |
| 55 to 64 Years | 667 | 18.5% |
| 65 to 74 Years | 841 | 23.4% |
| 75 to 84 Years | 300 | 8.3% |
| 85 Years and Over | 159 | 4.4% |
| Total | 3,600 | 100.0% |
Housing Finances in Seaside
Median Income by Occupancy in Seaside
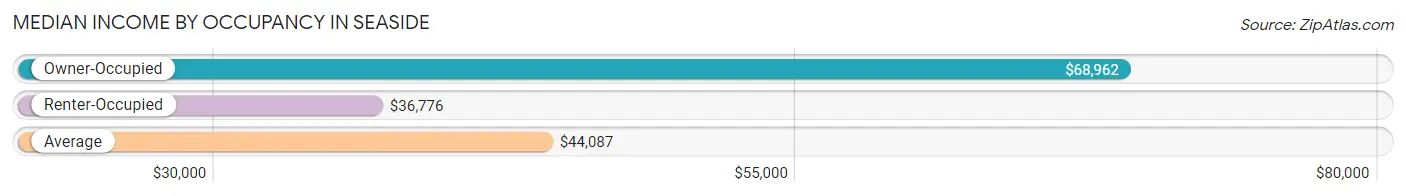
| Occupancy Type | # Households | Median Income |
| Owner-Occupied | 1,647 (45.8%) | $68,962 |
| Renter-Occupied | 1,953 (54.2%) | $36,776 |
| Average | 3,600 (100.0%) | $44,087 |
Occupancy by Householder Income Bracket in Seaside
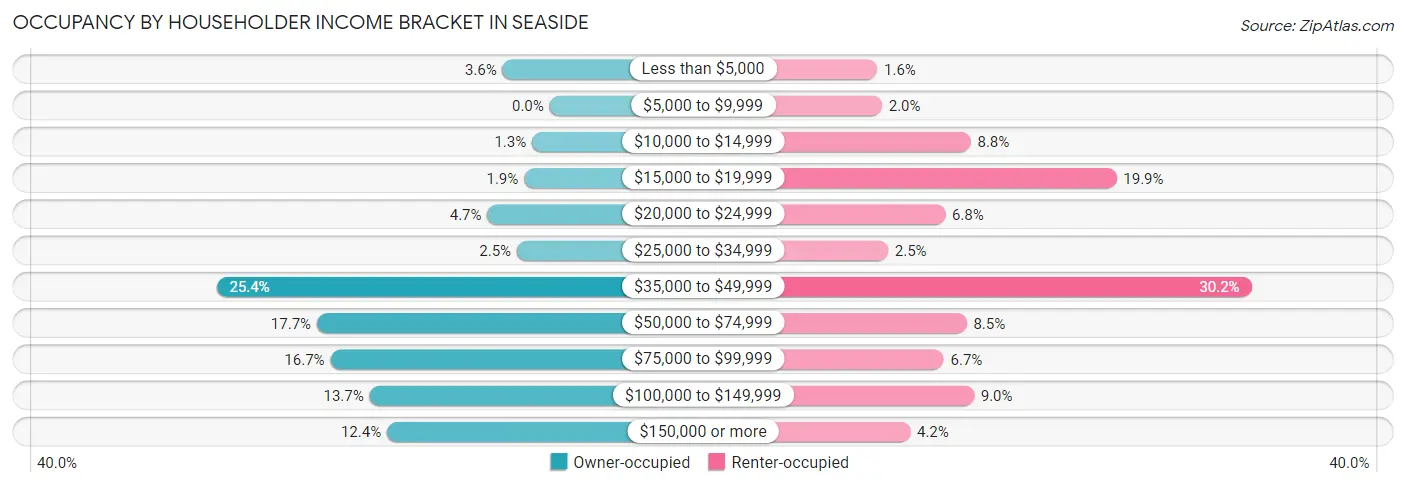
| Income Bracket | Owner-occupied | Renter-occupied |
| Less than $5,000 | 59 (3.6%) | 32 (1.6%) |
| $5,000 to $9,999 | 0 (0.0%) | 39 (2.0%) |
| $10,000 to $14,999 | 22 (1.3%) | 171 (8.8%) |
| $15,000 to $19,999 | 32 (1.9%) | 388 (19.9%) |
| $20,000 to $24,999 | 78 (4.7%) | 133 (6.8%) |
| $25,000 to $34,999 | 41 (2.5%) | 48 (2.5%) |
| $35,000 to $49,999 | 418 (25.4%) | 589 (30.2%) |
| $50,000 to $74,999 | 292 (17.7%) | 165 (8.5%) |
| $75,000 to $99,999 | 275 (16.7%) | 131 (6.7%) |
| $100,000 to $149,999 | 226 (13.7%) | 176 (9.0%) |
| $150,000 or more | 204 (12.4%) | 81 (4.2%) |
| Total | 1,647 (100.0%) | 1,953 (100.0%) |
Monthly Housing Cost Tiers in Seaside
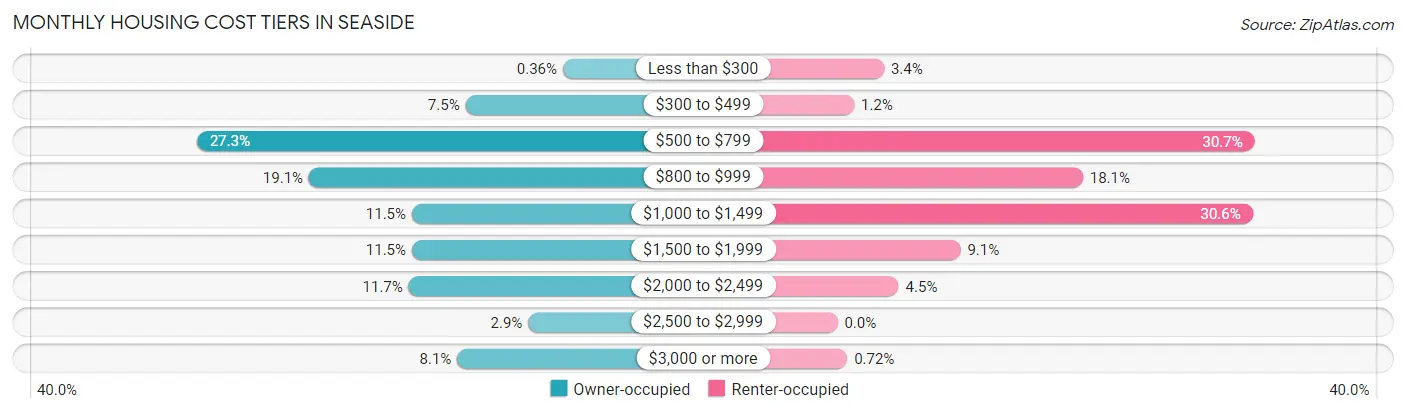
| Monthly Cost | Owner-occupied | Renter-occupied |
| Less than $300 | 6 (0.4%) | 67 (3.4%) |
| $300 to $499 | 124 (7.5%) | 24 (1.2%) |
| $500 to $799 | 450 (27.3%) | 600 (30.7%) |
| $800 to $999 | 314 (19.1%) | 353 (18.1%) |
| $1,000 to $1,499 | 189 (11.5%) | 597 (30.6%) |
| $1,500 to $1,999 | 189 (11.5%) | 177 (9.1%) |
| $2,000 to $2,499 | 193 (11.7%) | 88 (4.5%) |
| $2,500 to $2,999 | 48 (2.9%) | 0 (0.0%) |
| $3,000 or more | 134 (8.1%) | 14 (0.7%) |
| Total | 1,647 (100.0%) | 1,953 (100.0%) |
Physical Housing Characteristics in Seaside
Housing Structures in Seaside
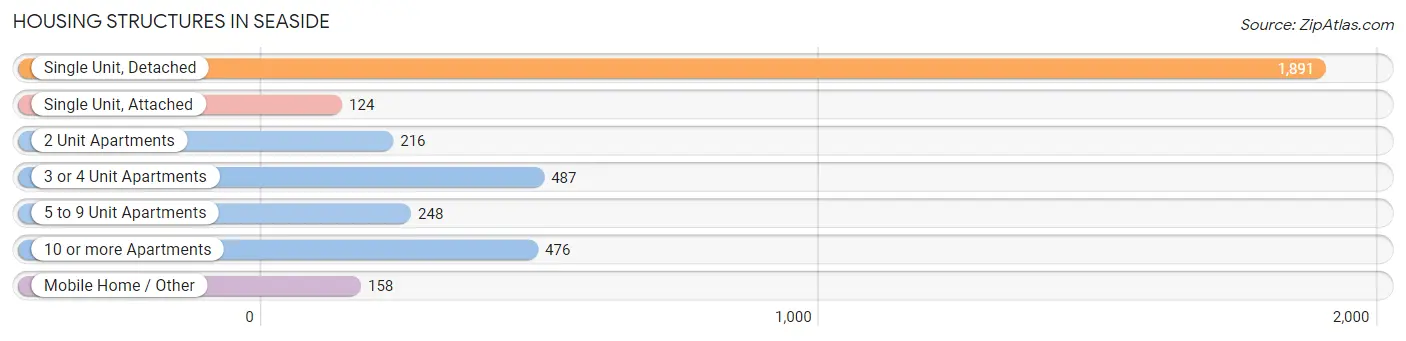
| Structure Type | # Housing Units | % Housing Units |
| Single Unit, Detached | 1,891 | 52.5% |
| Single Unit, Attached | 124 | 3.4% |
| 2 Unit Apartments | 216 | 6.0% |
| 3 or 4 Unit Apartments | 487 | 13.5% |
| 5 to 9 Unit Apartments | 248 | 6.9% |
| 10 or more Apartments | 476 | 13.2% |
| Mobile Home / Other | 158 | 4.4% |
| Total | 3,600 | 100.0% |
Housing Structures by Occupancy in Seaside
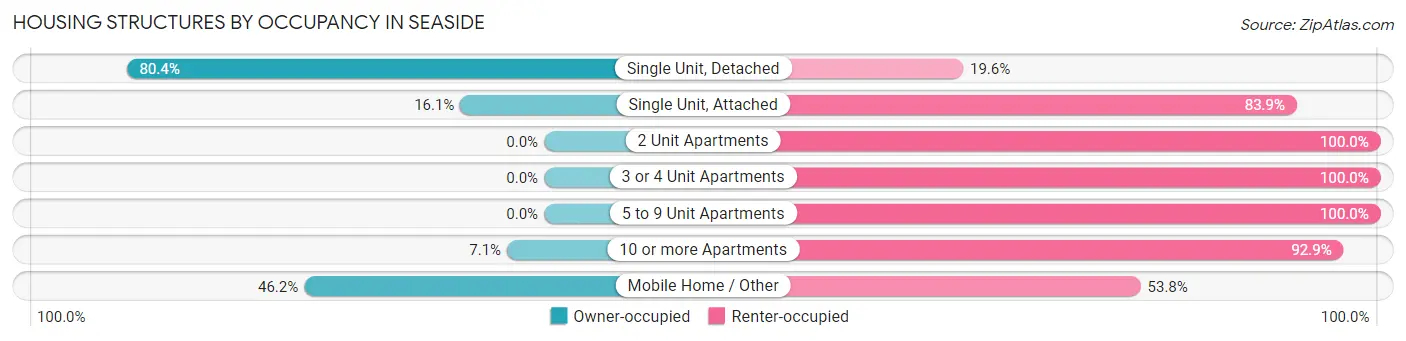
| Structure Type | Owner-occupied | Renter-occupied |
| Single Unit, Detached | 1,520 (80.4%) | 371 (19.6%) |
| Single Unit, Attached | 20 (16.1%) | 104 (83.9%) |
| 2 Unit Apartments | 0 (0.0%) | 216 (100.0%) |
| 3 or 4 Unit Apartments | 0 (0.0%) | 487 (100.0%) |
| 5 to 9 Unit Apartments | 0 (0.0%) | 248 (100.0%) |
| 10 or more Apartments | 34 (7.1%) | 442 (92.9%) |
| Mobile Home / Other | 73 (46.2%) | 85 (53.8%) |
| Total | 1,647 (45.8%) | 1,953 (54.2%) |
Housing Structures by Number of Rooms in Seaside
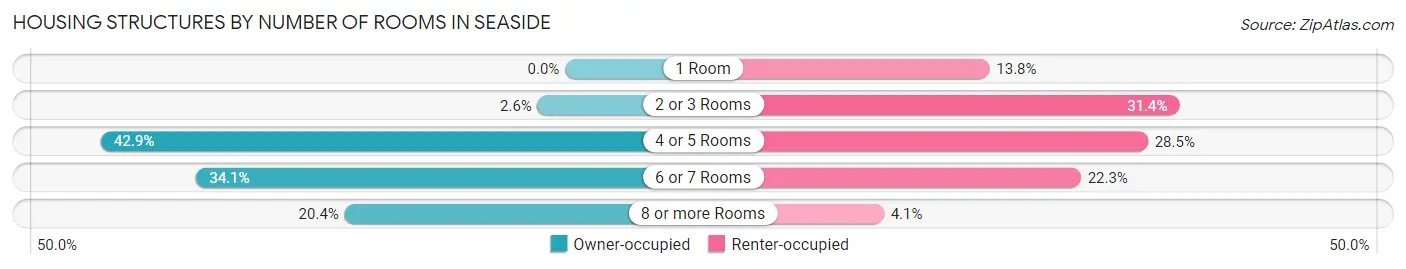
| Number of Rooms | Owner-occupied | Renter-occupied |
| 1 Room | 0 (0.0%) | 270 (13.8%) |
| 2 or 3 Rooms | 42 (2.5%) | 613 (31.4%) |
| 4 or 5 Rooms | 707 (42.9%) | 556 (28.5%) |
| 6 or 7 Rooms | 562 (34.1%) | 435 (22.3%) |
| 8 or more Rooms | 336 (20.4%) | 79 (4.1%) |
| Total | 1,647 (100.0%) | 1,953 (100.0%) |
Housing Structure by Heating Type in Seaside
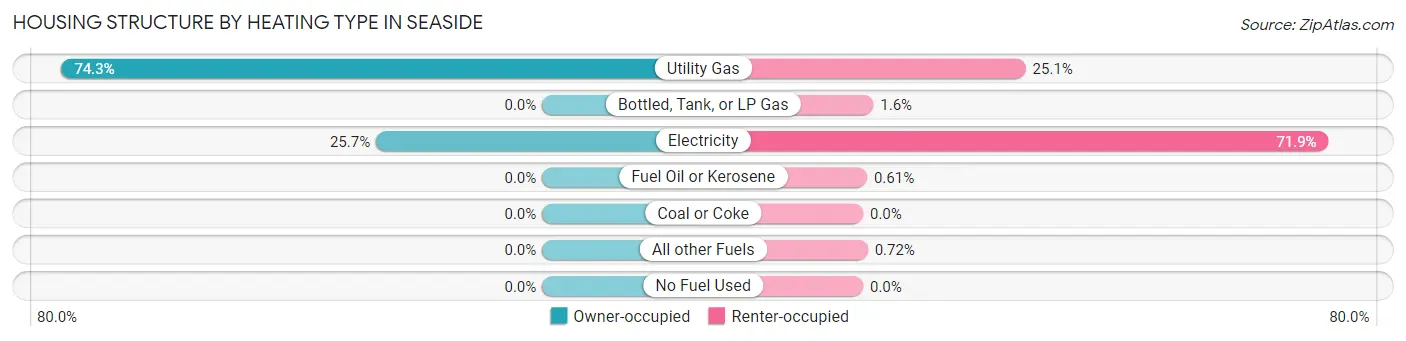
| Heating Type | Owner-occupied | Renter-occupied |
| Utility Gas | 1,224 (74.3%) | 491 (25.1%) |
| Bottled, Tank, or LP Gas | 0 (0.0%) | 31 (1.6%) |
| Electricity | 423 (25.7%) | 1,405 (71.9%) |
| Fuel Oil or Kerosene | 0 (0.0%) | 12 (0.6%) |
| Coal or Coke | 0 (0.0%) | 0 (0.0%) |
| All other Fuels | 0 (0.0%) | 14 (0.7%) |
| No Fuel Used | 0 (0.0%) | 0 (0.0%) |
| Total | 1,647 (100.0%) | 1,953 (100.0%) |
Household Vehicle Usage in Seaside
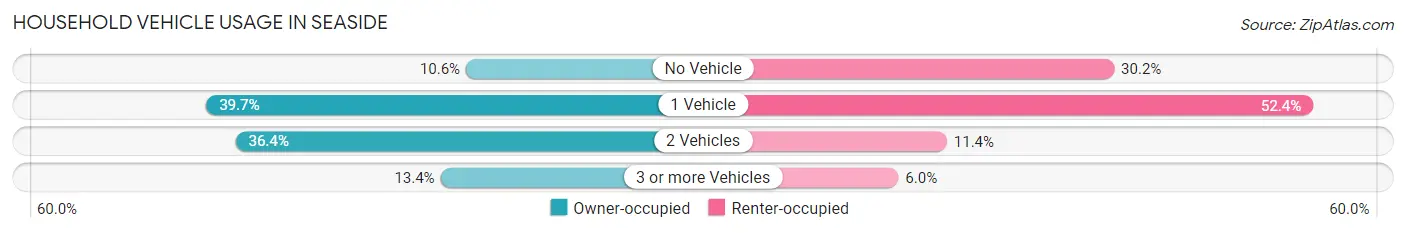
| Vehicles per Household | Owner-occupied | Renter-occupied |
| No Vehicle | 174 (10.6%) | 589 (30.2%) |
| 1 Vehicle | 653 (39.7%) | 1,024 (52.4%) |
| 2 Vehicles | 599 (36.4%) | 223 (11.4%) |
| 3 or more Vehicles | 221 (13.4%) | 117 (6.0%) |
| Total | 1,647 (100.0%) | 1,953 (100.0%) |
Real Estate & Mortgages in Seaside
Real Estate and Mortgage Overview in Seaside
| Characteristic | Without Mortgage | With Mortgage |
| Housing Units | 612 | 1,035 |
| Median Property Value | $418,100 | $379,600 |
| Median Household Income | $75,658 | $128 |
| Monthly Housing Costs | $646 | $134 |
| Real Estate Taxes | $3,656 | $0 |
Property Value by Mortgage Status in Seaside
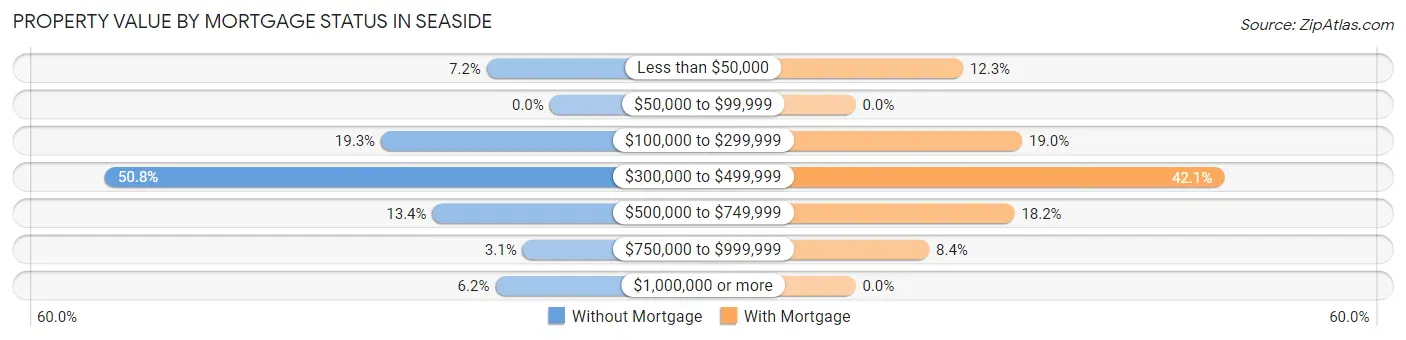
| Property Value | Without Mortgage | With Mortgage |
| Less than $50,000 | 44 (7.2%) | 127 (12.3%) |
| $50,000 to $99,999 | 0 (0.0%) | 0 (0.0%) |
| $100,000 to $299,999 | 118 (19.3%) | 197 (19.0%) |
| $300,000 to $499,999 | 311 (50.8%) | 436 (42.1%) |
| $500,000 to $749,999 | 82 (13.4%) | 188 (18.2%) |
| $750,000 to $999,999 | 19 (3.1%) | 87 (8.4%) |
| $1,000,000 or more | 38 (6.2%) | 0 (0.0%) |
| Total | 612 (100.0%) | 1,035 (100.0%) |
Household Income by Mortgage Status in Seaside
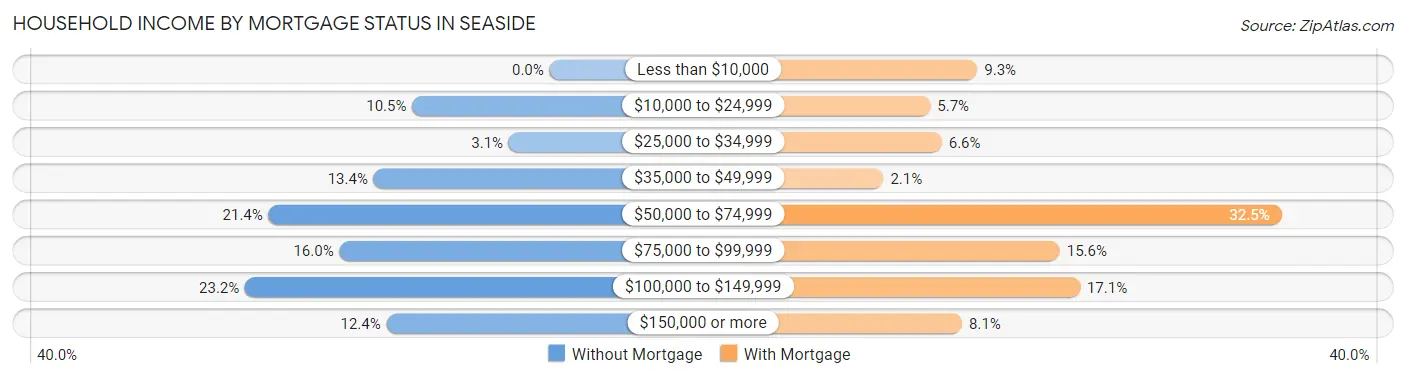
| Household Income | Without Mortgage | With Mortgage |
| Less than $10,000 | 0 (0.0%) | 96 (9.3%) |
| $10,000 to $24,999 | 64 (10.5%) | 59 (5.7%) |
| $25,000 to $34,999 | 19 (3.1%) | 68 (6.6%) |
| $35,000 to $49,999 | 82 (13.4%) | 22 (2.1%) |
| $50,000 to $74,999 | 131 (21.4%) | 336 (32.5%) |
| $75,000 to $99,999 | 98 (16.0%) | 161 (15.6%) |
| $100,000 to $149,999 | 142 (23.2%) | 177 (17.1%) |
| $150,000 or more | 76 (12.4%) | 84 (8.1%) |
| Total | 612 (100.0%) | 1,035 (100.0%) |
Property Value to Household Income Ratio in Seaside
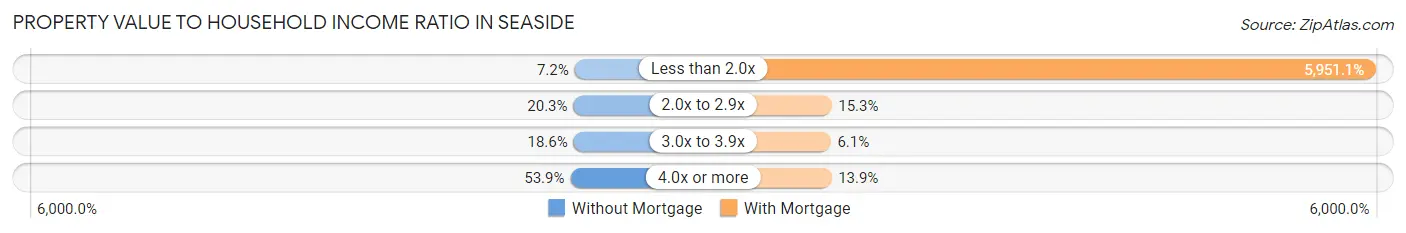
| Value-to-Income Ratio | Without Mortgage | With Mortgage |
| Less than 2.0x | 44 (7.2%) | 61,594 (5,951.1%) |
| 2.0x to 2.9x | 124 (20.3%) | 158 (15.3%) |
| 3.0x to 3.9x | 114 (18.6%) | 63 (6.1%) |
| 4.0x or more | 330 (53.9%) | 144 (13.9%) |
| Total | 612 (100.0%) | 1,035 (100.0%) |
Real Estate Taxes by Mortgage Status in Seaside
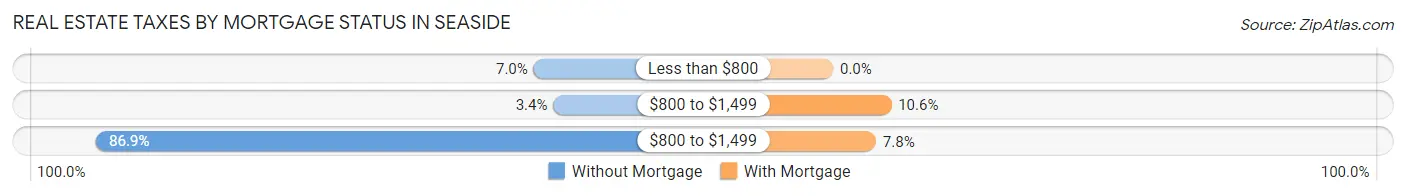
| Property Taxes | Without Mortgage | With Mortgage |
| Less than $800 | 43 (7.0%) | 0 (0.0%) |
| $800 to $1,499 | 21 (3.4%) | 110 (10.6%) |
| $800 to $1,499 | 532 (86.9%) | 81 (7.8%) |
| Total | 612 (100.0%) | 1,035 (100.0%) |
Health & Disability in Seaside
Health Insurance Coverage by Age in Seaside
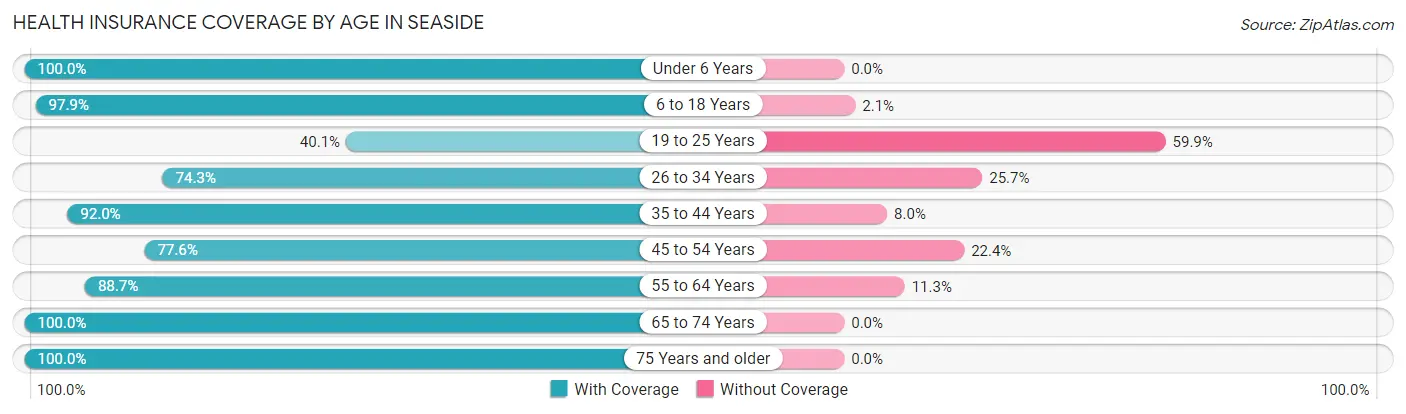
| Age Bracket | With Coverage | Without Coverage |
| Under 6 Years | 163 (100.0%) | 0 (0.0%) |
| 6 to 18 Years | 902 (97.9%) | 19 (2.1%) |
| 19 to 25 Years | 206 (40.1%) | 308 (59.9%) |
| 26 to 34 Years | 525 (74.3%) | 182 (25.7%) |
| 35 to 44 Years | 829 (92.0%) | 72 (8.0%) |
| 45 to 54 Years | 847 (77.6%) | 244 (22.4%) |
| 55 to 64 Years | 858 (88.7%) | 109 (11.3%) |
| 65 to 74 Years | 1,142 (100.0%) | 0 (0.0%) |
| 75 Years and older | 676 (100.0%) | 0 (0.0%) |
| Total | 6,148 (86.8%) | 934 (13.2%) |
Health Insurance Coverage by Citizenship Status in Seaside
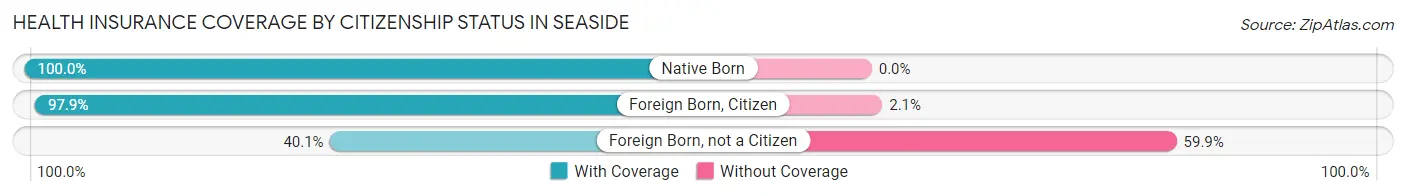
| Citizenship Status | With Coverage | Without Coverage |
| Native Born | 163 (100.0%) | 0 (0.0%) |
| Foreign Born, Citizen | 902 (97.9%) | 19 (2.1%) |
| Foreign Born, not a Citizen | 206 (40.1%) | 308 (59.9%) |
Health Insurance Coverage by Household Income in Seaside
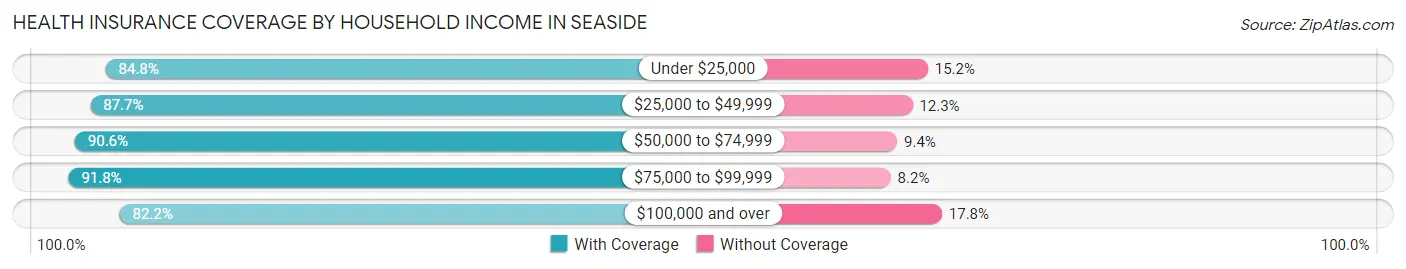
| Household Income | With Coverage | Without Coverage |
| Under $25,000 | 1,067 (84.8%) | 191 (15.2%) |
| $25,000 to $49,999 | 1,562 (87.7%) | 219 (12.3%) |
| $50,000 to $74,999 | 962 (90.6%) | 100 (9.4%) |
| $75,000 to $99,999 | 938 (91.8%) | 84 (8.2%) |
| $100,000 and over | 1,551 (82.2%) | 336 (17.8%) |
Public vs Private Health Insurance Coverage by Age in Seaside
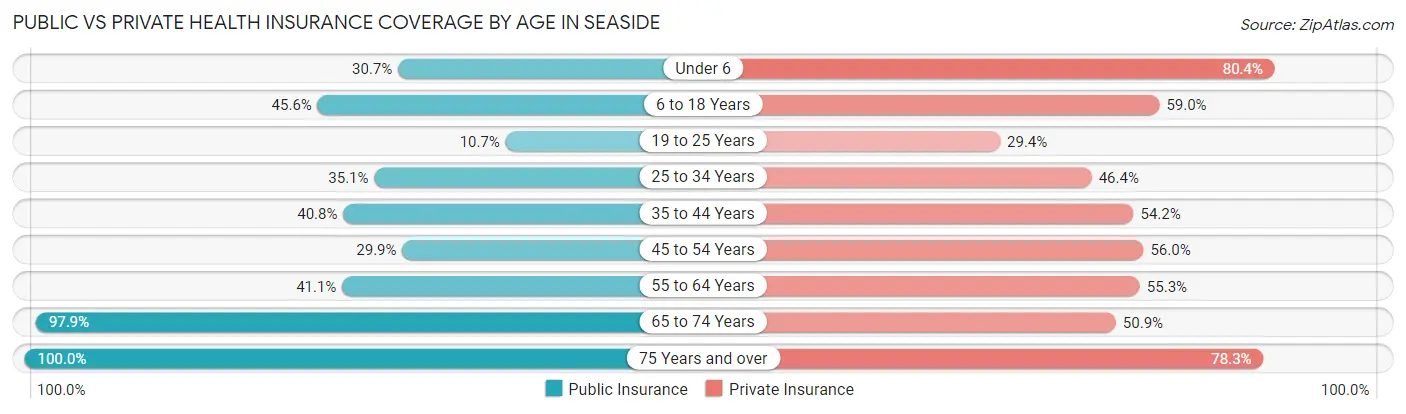
| Age Bracket | Public Insurance | Private Insurance |
| Under 6 | 50 (30.7%) | 131 (80.4%) |
| 6 to 18 Years | 420 (45.6%) | 543 (59.0%) |
| 19 to 25 Years | 55 (10.7%) | 151 (29.4%) |
| 25 to 34 Years | 248 (35.1%) | 328 (46.4%) |
| 35 to 44 Years | 368 (40.8%) | 488 (54.2%) |
| 45 to 54 Years | 326 (29.9%) | 611 (56.0%) |
| 55 to 64 Years | 397 (41.0%) | 535 (55.3%) |
| 65 to 74 Years | 1,118 (97.9%) | 581 (50.9%) |
| 75 Years and over | 676 (100.0%) | 529 (78.2%) |
| Total | 3,658 (51.6%) | 3,897 (55.0%) |
Disability Status by Sex by Age in Seaside
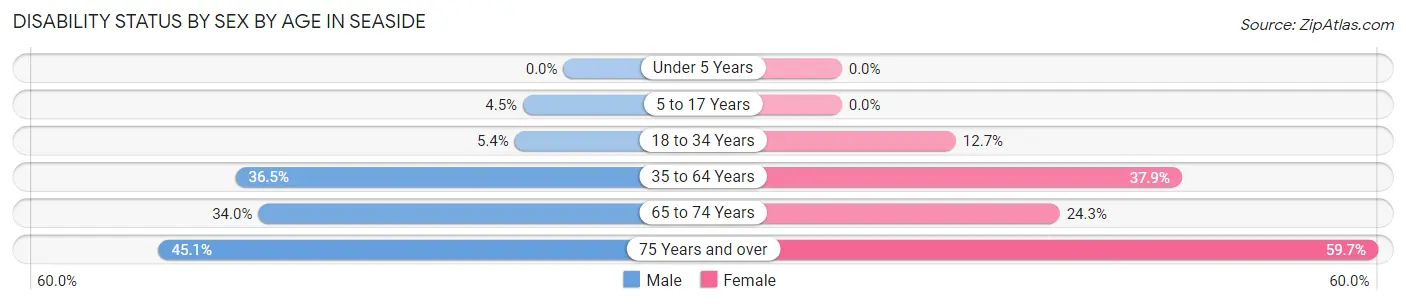
| Age Bracket | Male | Female |
| Under 5 Years | 0 (0.0%) | 0 (0.0%) |
| 5 to 17 Years | 18 (4.5%) | 0 (0.0%) |
| 18 to 34 Years | 35 (5.4%) | 83 (12.7%) |
| 35 to 64 Years | 515 (36.5%) | 586 (37.9%) |
| 65 to 74 Years | 122 (34.0%) | 190 (24.3%) |
| 75 Years and over | 128 (45.1%) | 234 (59.7%) |
Disability Class by Sex by Age in Seaside
Disability Class: Hearing Difficulty
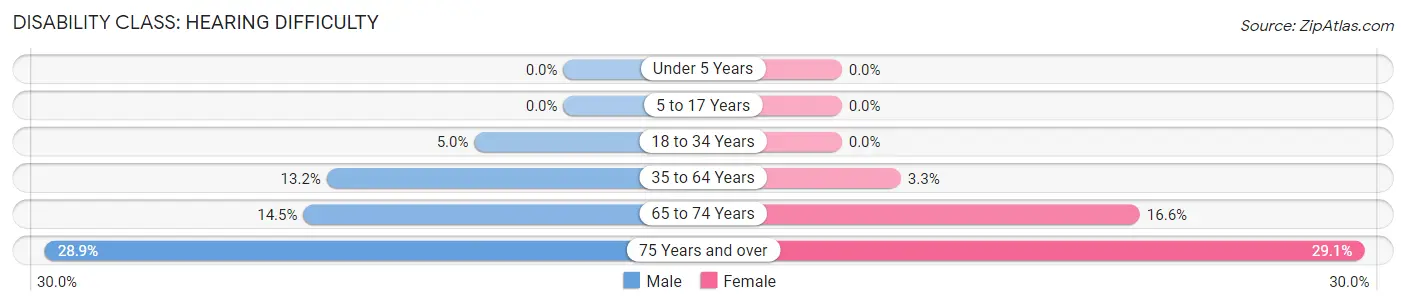
| Age Bracket | Male | Female |
| Under 5 Years | 0 (0.0%) | 0 (0.0%) |
| 5 to 17 Years | 0 (0.0%) | 0 (0.0%) |
| 18 to 34 Years | 32 (5.0%) | 0 (0.0%) |
| 35 to 64 Years | 186 (13.2%) | 51 (3.3%) |
| 65 to 74 Years | 52 (14.5%) | 130 (16.6%) |
| 75 Years and over | 82 (28.9%) | 114 (29.1%) |
Disability Class: Vision Difficulty
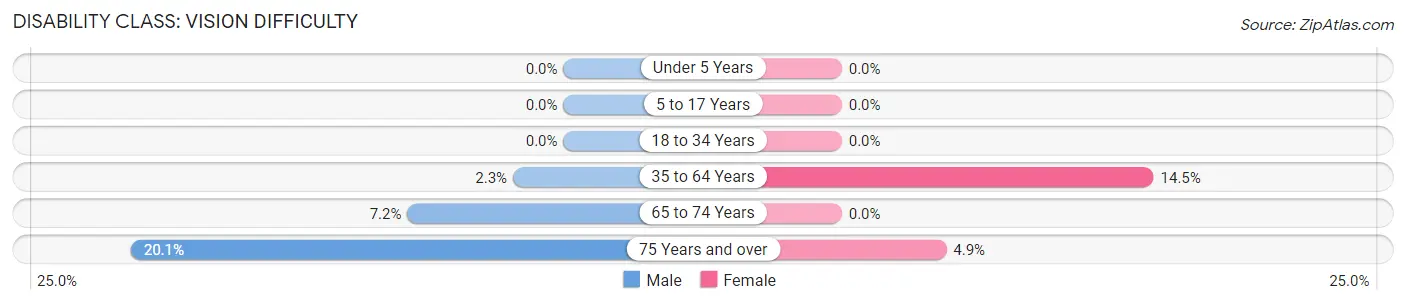
| Age Bracket | Male | Female |
| Under 5 Years | 0 (0.0%) | 0 (0.0%) |
| 5 to 17 Years | 0 (0.0%) | 0 (0.0%) |
| 18 to 34 Years | 0 (0.0%) | 0 (0.0%) |
| 35 to 64 Years | 33 (2.3%) | 224 (14.5%) |
| 65 to 74 Years | 26 (7.2%) | 0 (0.0%) |
| 75 Years and over | 57 (20.1%) | 19 (4.9%) |
Disability Class: Cognitive Difficulty
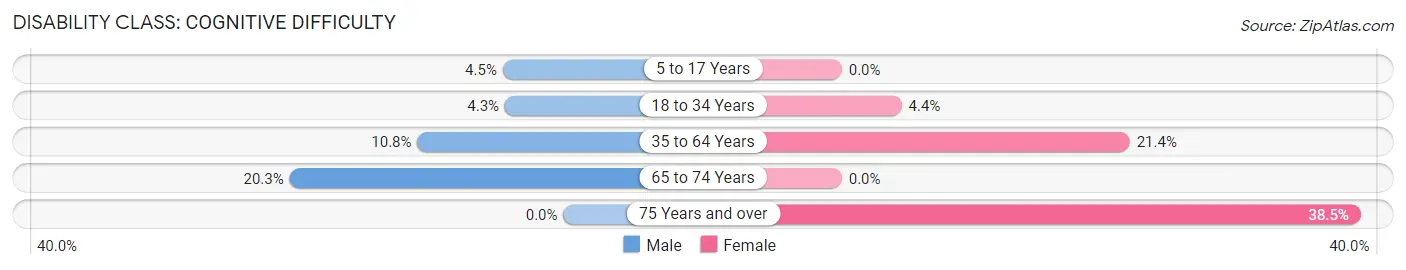
| Age Bracket | Male | Female |
| 5 to 17 Years | 18 (4.5%) | 0 (0.0%) |
| 18 to 34 Years | 28 (4.3%) | 29 (4.4%) |
| 35 to 64 Years | 153 (10.8%) | 331 (21.4%) |
| 65 to 74 Years | 73 (20.3%) | 0 (0.0%) |
| 75 Years and over | 0 (0.0%) | 151 (38.5%) |
Disability Class: Ambulatory Difficulty
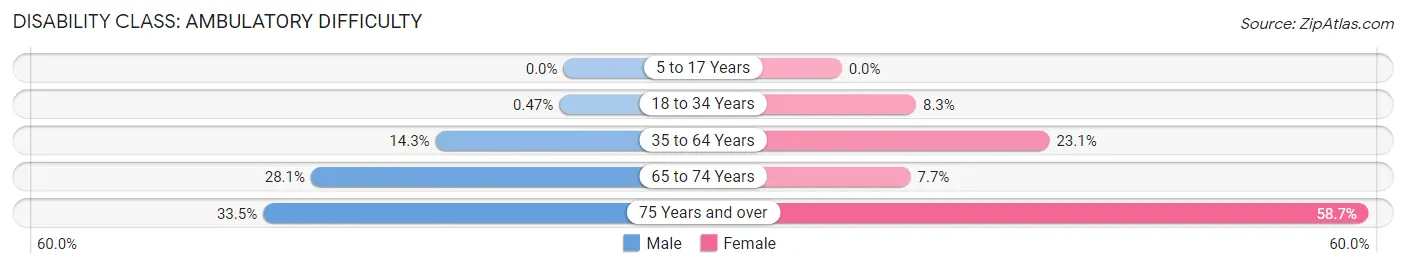
| Age Bracket | Male | Female |
| 5 to 17 Years | 0 (0.0%) | 0 (0.0%) |
| 18 to 34 Years | 3 (0.5%) | 54 (8.3%) |
| 35 to 64 Years | 201 (14.2%) | 358 (23.1%) |
| 65 to 74 Years | 101 (28.1%) | 60 (7.7%) |
| 75 Years and over | 95 (33.5%) | 230 (58.7%) |
Disability Class: Self-Care Difficulty
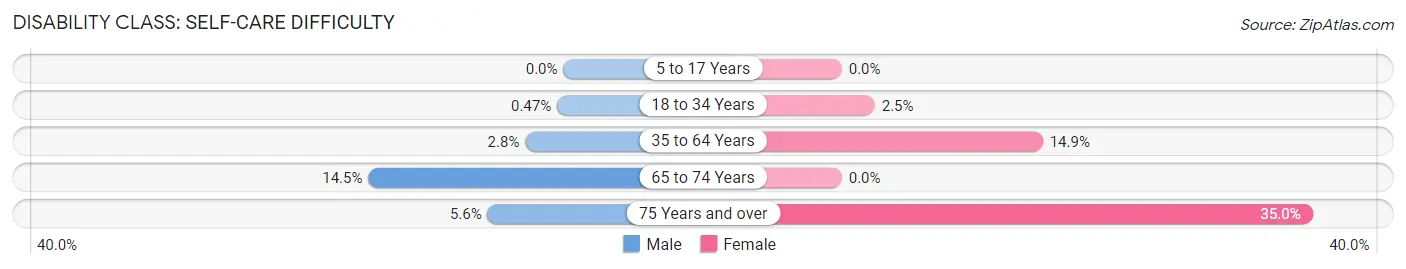
| Age Bracket | Male | Female |
| 5 to 17 Years | 0 (0.0%) | 0 (0.0%) |
| 18 to 34 Years | 3 (0.5%) | 16 (2.5%) |
| 35 to 64 Years | 40 (2.8%) | 231 (14.9%) |
| 65 to 74 Years | 52 (14.5%) | 0 (0.0%) |
| 75 Years and over | 16 (5.6%) | 137 (34.9%) |
Technology Access in Seaside
Computing Device Access in Seaside
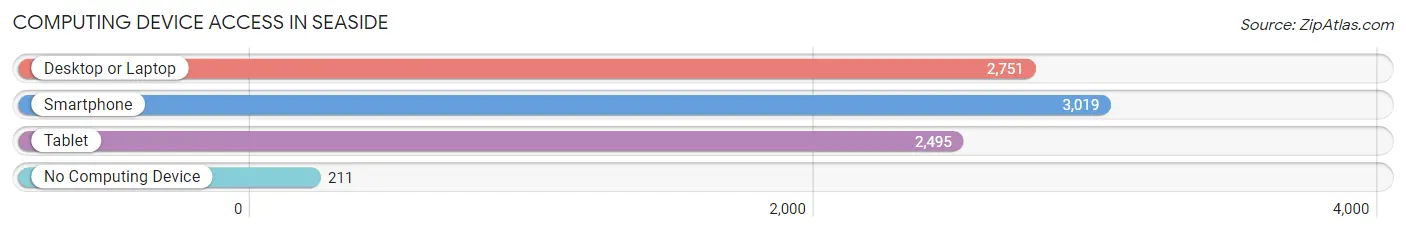
| Device Type | # Households | % Households |
| Desktop or Laptop | 2,751 | 76.4% |
| Smartphone | 3,019 | 83.9% |
| Tablet | 2,495 | 69.3% |
| No Computing Device | 211 | 5.9% |
| Total | 3,600 | 100.0% |
Internet Access in Seaside
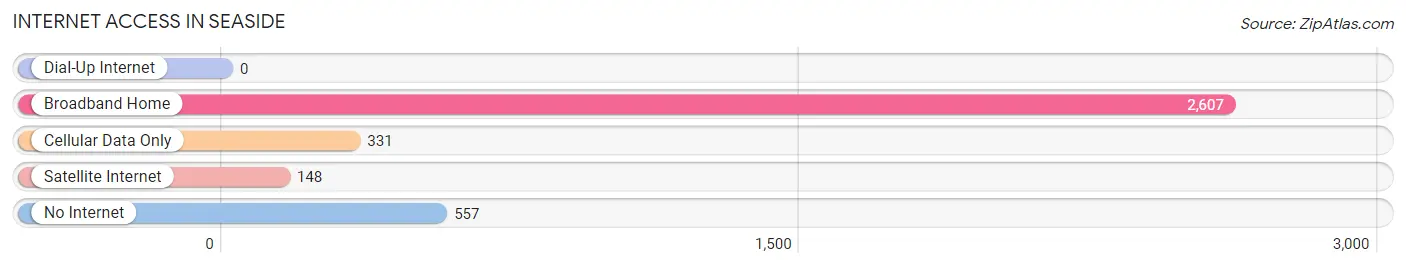
| Internet Type | # Households | % Households |
| Dial-Up Internet | 0 | 0.0% |
| Broadband Home | 2,607 | 72.4% |
| Cellular Data Only | 331 | 9.2% |
| Satellite Internet | 148 | 4.1% |
| No Internet | 557 | 15.5% |
| Total | 3,600 | 100.0% |
Seaside Summary
Seaside, Oregon is a city located in Clatsop County, Oregon, United States. It is situated on the Pacific Ocean, approximately 80 miles (130 km) northwest of Portland. The city is known for its beautiful beaches, its historic downtown, and its vibrant tourist industry.
History
The area that is now Seaside was first inhabited by the Clatsop people, who lived in the area for thousands of years before the arrival of European settlers. The first European settlers arrived in the area in the early 1800s, and the town of Seaside was officially founded in 1884. The town was named after the nearby Seaside Creek, which was named by early settlers who noticed the ocean waves crashing against the shore.
In the late 1800s, Seaside became a popular tourist destination, and the town began to grow rapidly. The town was incorporated in 1898, and the first mayor was elected in 1899. The town continued to grow throughout the early 1900s, and by the 1950s, it had become a popular beach resort.
Geography
Seaside is located in Clatsop County, Oregon, on the Pacific Ocean. It is situated on the north side of the Columbia River, approximately 80 miles (130 km) northwest of Portland. The city covers an area of 4.2 square miles (11 km2), and has a population of 6,457 as of the 2010 census.
The city is bordered by the Pacific Ocean to the west, the Necanicum River to the north, and the city of Gearhart to the east. The city is located on a flat coastal plain, and is surrounded by hills and mountains. The highest point in the city is the Seaside Hill, which rises to an elevation of 545 feet (166 m).
Economy
Seaside’s economy is largely based on tourism. The city is home to a number of hotels, restaurants, and other tourist attractions, and it is a popular destination for beachgoers and outdoor enthusiasts. The city also has a number of retail stores, and is home to the Seaside Factory Outlet Mall.
The city is also home to a number of manufacturing and technology companies, including the Seaside Technology Center, which is a research and development facility for the semiconductor industry.
Demographics
As of the 2010 census, the population of Seaside was 6,457. The racial makeup of the city was 87.2% White, 0.7% African American, 0.7% Native American, 1.2% Asian, 0.2% Pacific Islander, 6.2% from other races, and 3.8% from two or more races. Hispanic or Latino of any race were 11.2% of the population.
The median income for a household in the city was $37,917, and the median income for a family was $45,917. The per capita income for the city was $20,917. About 11.2% of families and 14.2% of the population were below the poverty line, including 18.2% of those under age 18 and 8.2% of those age 65 or over.
Common Questions
What is Per Capita Income in Seaside?
Per Capita income in Seaside is $32,963.
What is the Median Family Income in Seaside?
Median Family Income in Seaside is $77,634.
What is the Median Household income in Seaside?
Median Household Income in Seaside is $44,087.
What is Income or Wage Gap in Seaside?
Income or Wage Gap in Seaside is 3.0%.
Women in Seaside earn 97.0 cents for every dollar earned by a man.
What is Inequality or Gini Index in Seaside?
Inequality or Gini Index in Seaside is 0.43.
What is the Total Population of Seaside?
Total Population of Seaside is 7,142.
What is the Total Male Population of Seaside?
Total Male Population of Seaside is 3,170.
What is the Total Female Population of Seaside?
Total Female Population of Seaside is 3,972.
What is the Ratio of Males per 100 Females in Seaside?
There are 79.81 Males per 100 Females in Seaside.
What is the Ratio of Females per 100 Males in Seaside?
There are 125.30 Females per 100 Males in Seaside.
What is the Median Population Age in Seaside?
Median Population Age in Seaside is 47.9 Years.
What is the Average Family Size in Seaside
Average Family Size in Seaside is 2.9 People.
What is the Average Household Size in Seaside
Average Household Size in Seaside is 1.9 People.
How Large is the Labor Force in Seaside?
There are 3,540 People in the Labor Forcein in Seaside.
What is the Percentage of People in the Labor Force in Seaside?
56.8% of People are in the Labor Force in Seaside.
What is the Unemployment Rate in Seaside?
Unemployment Rate in Seaside is 7.9%.