Grayson, GA Map & Demographics
Grayson Map
Grayson Overview
$34,085
PER CAPITA INCOME
$122,080
AVG FAMILY INCOME
$121,421
AVG HOUSEHOLD INCOME
16.7%
WAGE / INCOME GAP [ % ]
83.3¢/ $1
WAGE / INCOME GAP [ $ ]
0.23
INEQUALITY / GINI INDEX
4,572
TOTAL POPULATION
1,972
MALE POPULATION
2,600
FEMALE POPULATION
75.85
MALES / 100 FEMALES
131.85
FEMALES / 100 MALES
31.2
MEDIAN AGE
4.2
AVG FAMILY SIZE
3.8
AVG HOUSEHOLD SIZE
2,108
LABOR FORCE [ PEOPLE ]
67.9%
PERCENT IN LABOR FORCE
1.6%
UNEMPLOYMENT RATE
Grayson Zip Codes
Grayson Area Codes
Income in Grayson
Income Overview in Grayson
Per Capita Income in Grayson is $34,085, while median incomes of families and households are $122,080 and $121,421 respectively.
| Characteristic | Number | Measure |
| Per Capita Income | 4,572 | $34,085 |
| Median Family Income | 1,028 | $122,080 |
| Mean Family Income | 1,028 | $129,181 |
| Median Household Income | 1,209 | $121,421 |
| Mean Household Income | 1,209 | $123,829 |
| Income Deficit | 1,028 | $0 |
| Wage / Income Gap (%) | 4,572 | 16.68% |
| Wage / Income Gap ($) | 4,572 | 83.32¢ per $1 |
| Gini / Inequality Index | 4,572 | 0.23 |
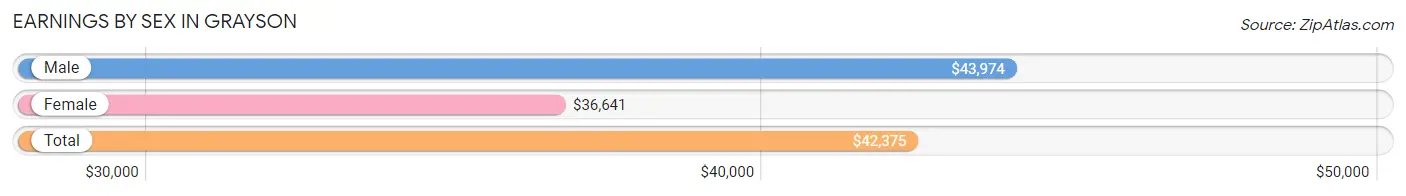
Earnings by Sex in Grayson
Average Earnings in Grayson are $42,375, $43,974 for men and $36,641 for women, a difference of 16.7%.
| Sex | Number | Average Earnings |
| Male | 1,261 (58.1%) | $43,974 |
| Female | 911 (41.9%) | $36,641 |
| Total | 2,172 (100.0%) | $42,375 |
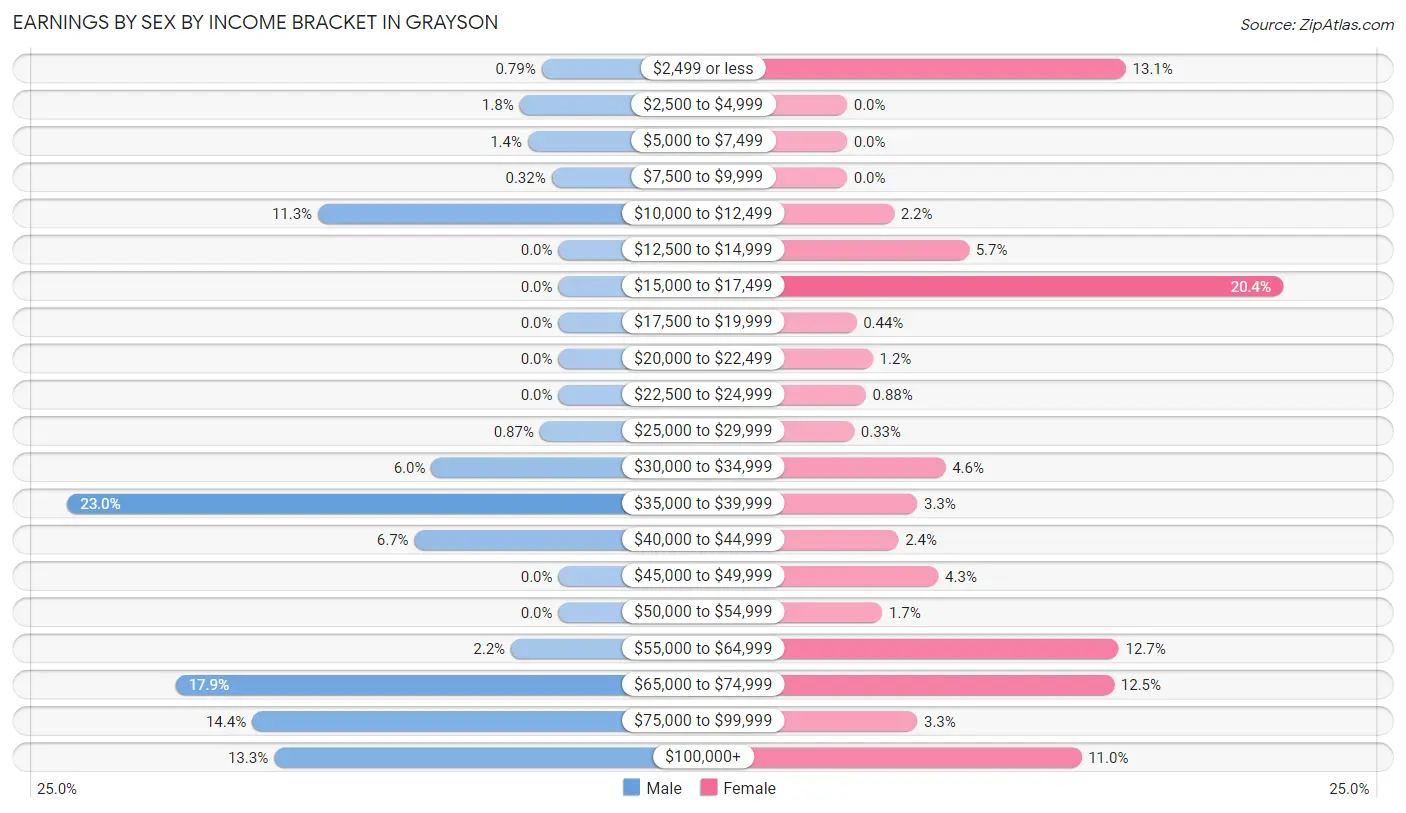
Earnings by Sex by Income Bracket in Grayson
The most common earnings brackets in Grayson are $35,000 to $39,999 for men (290 | 23.0%) and $15,000 to $17,499 for women (186 | 20.4%).
| Income | Male | Female |
| $2,499 or less | 10 (0.8%) | 119 (13.1%) |
| $2,500 to $4,999 | 23 (1.8%) | 0 (0.0%) |
| $5,000 to $7,499 | 18 (1.4%) | 0 (0.0%) |
| $7,500 to $9,999 | 4 (0.3%) | 0 (0.0%) |
| $10,000 to $12,499 | 142 (11.3%) | 20 (2.2%) |
| $12,500 to $14,999 | 0 (0.0%) | 52 (5.7%) |
| $15,000 to $17,499 | 0 (0.0%) | 186 (20.4%) |
| $17,500 to $19,999 | 0 (0.0%) | 4 (0.4%) |
| $20,000 to $22,499 | 0 (0.0%) | 11 (1.2%) |
| $22,500 to $24,999 | 0 (0.0%) | 8 (0.9%) |
| $25,000 to $29,999 | 11 (0.9%) | 3 (0.3%) |
| $30,000 to $34,999 | 75 (5.9%) | 42 (4.6%) |
| $35,000 to $39,999 | 290 (23.0%) | 30 (3.3%) |
| $40,000 to $44,999 | 85 (6.7%) | 22 (2.4%) |
| $45,000 to $49,999 | 0 (0.0%) | 39 (4.3%) |
| $50,000 to $54,999 | 0 (0.0%) | 15 (1.7%) |
| $55,000 to $64,999 | 28 (2.2%) | 116 (12.7%) |
| $65,000 to $74,999 | 226 (17.9%) | 114 (12.5%) |
| $75,000 to $99,999 | 181 (14.3%) | 30 (3.3%) |
| $100,000+ | 168 (13.3%) | 100 (11.0%) |
| Total | 1,261 (100.0%) | 911 (100.0%) |
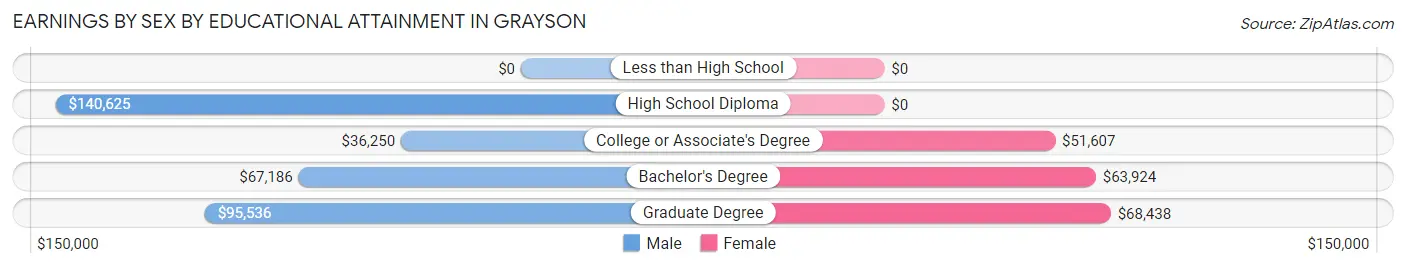
Earnings by Sex by Educational Attainment in Grayson
Average earnings in Grayson are $65,388 for men and $47,532 for women, a difference of 27.3%. Men with an educational attainment of high school diploma enjoy the highest average annual earnings of $140,625, while those with college or associate's degree education earn the least with $36,250. Women with an educational attainment of graduate degree earn the most with the average annual earnings of $68,438, while those with college or associate's degree education have the smallest earnings of $51,607.
| Educational Attainment | Male Income | Female Income |
| Less than High School | - | - |
| High School Diploma | $140,625 | $0 |
| College or Associate's Degree | $36,250 | $51,607 |
| Bachelor's Degree | $67,186 | $63,924 |
| Graduate Degree | $95,536 | $68,438 |
| Total | $65,388 | $47,532 |
Family Income in Grayson
Family Income Brackets in Grayson
According to the Grayson family income data, there are 395 families falling into the $100,000 to $149,999 income range, which is the most common income bracket and makes up 38.4% of all families.
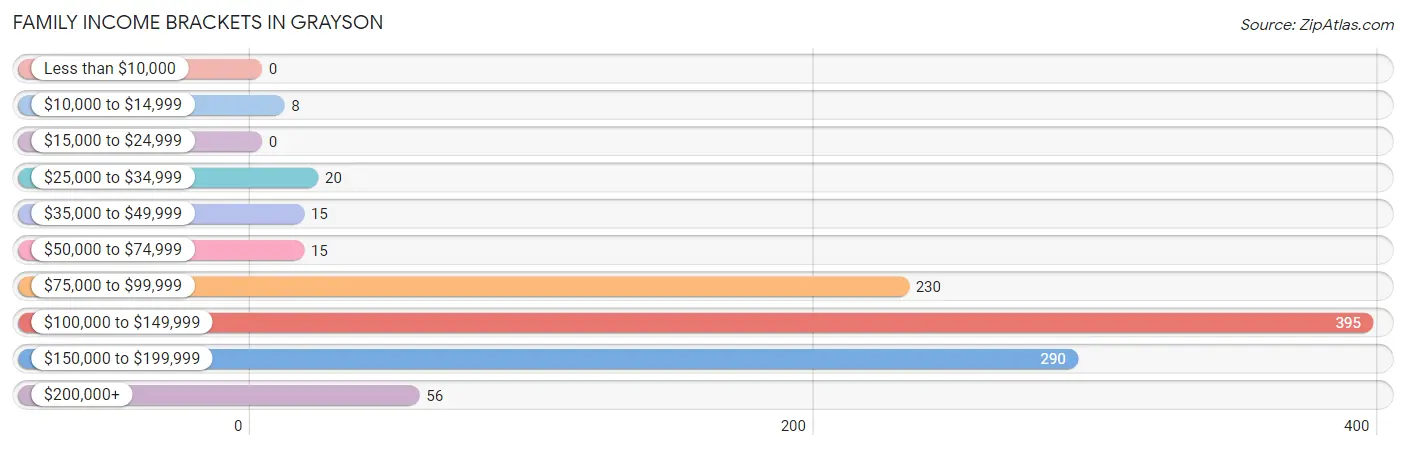
| Income Bracket | # Families | % Families |
| Less than $10,000 | 0 | 0.0% |
| $10,000 to $14,999 | 8 | 0.8% |
| $15,000 to $24,999 | 0 | 0.0% |
| $25,000 to $34,999 | 20 | 1.9% |
| $35,000 to $49,999 | 15 | 1.5% |
| $50,000 to $74,999 | 15 | 1.5% |
| $75,000 to $99,999 | 230 | 22.4% |
| $100,000 to $149,999 | 395 | 38.4% |
| $150,000 to $199,999 | 290 | 28.2% |
| $200,000+ | 56 | 5.4% |
Family Income by Famaliy Size in Grayson
4-person families (210 | 20.4%) account for the highest median family income in Grayson with $155,868 per family, while 2-person families (381 | 37.1%) have the highest median income of $67,684 per family member.
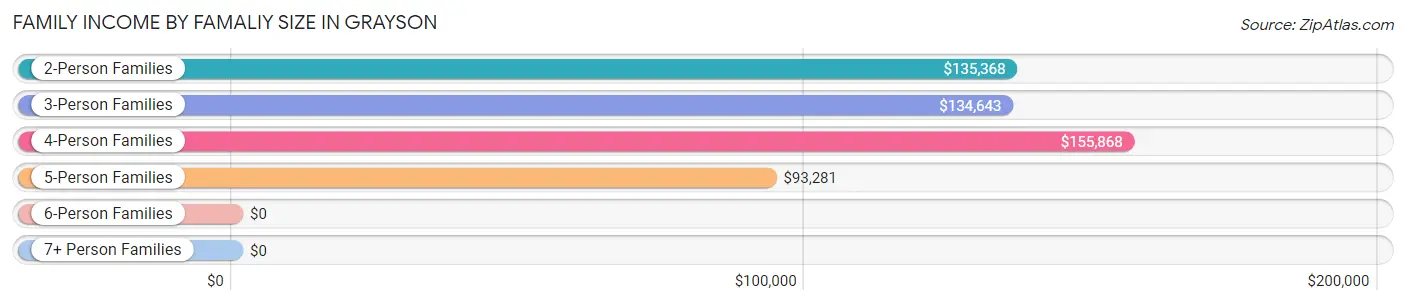
| Income Bracket | # Families | Median Income |
| 2-Person Families | 381 (37.1%) | $135,368 |
| 3-Person Families | 168 (16.3%) | $134,643 |
| 4-Person Families | 210 (20.4%) | $155,868 |
| 5-Person Families | 69 (6.7%) | $93,281 |
| 6-Person Families | 5 (0.5%) | $0 |
| 7+ Person Families | 195 (19.0%) | $0 |
| Total | 1,028 (100.0%) | $122,080 |
Family Income by Number of Earners in Grayson
The median family income in Grayson is $122,080, with families comprising 2 earners (305) having the highest median family income of $151,061, while families with no earners (219) have the lowest median family income of $82,639, accounting for 29.7% and 21.3% of families, respectively.
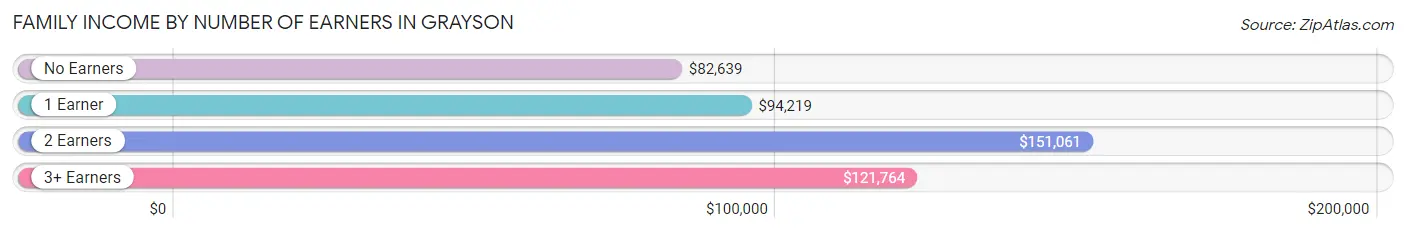
| Number of Earners | # Families | Median Income |
| No Earners | 219 (21.3%) | $82,639 |
| 1 Earner | 127 (12.3%) | $94,219 |
| 2 Earners | 305 (29.7%) | $151,061 |
| 3+ Earners | 377 (36.7%) | $121,764 |
| Total | 1,028 (100.0%) | $122,080 |
Household Income in Grayson
Household Income Brackets in Grayson
With 403 households falling in the category, the $100,000 to $149,999 income range is the most frequent in Grayson, accounting for 33.3% of all households.
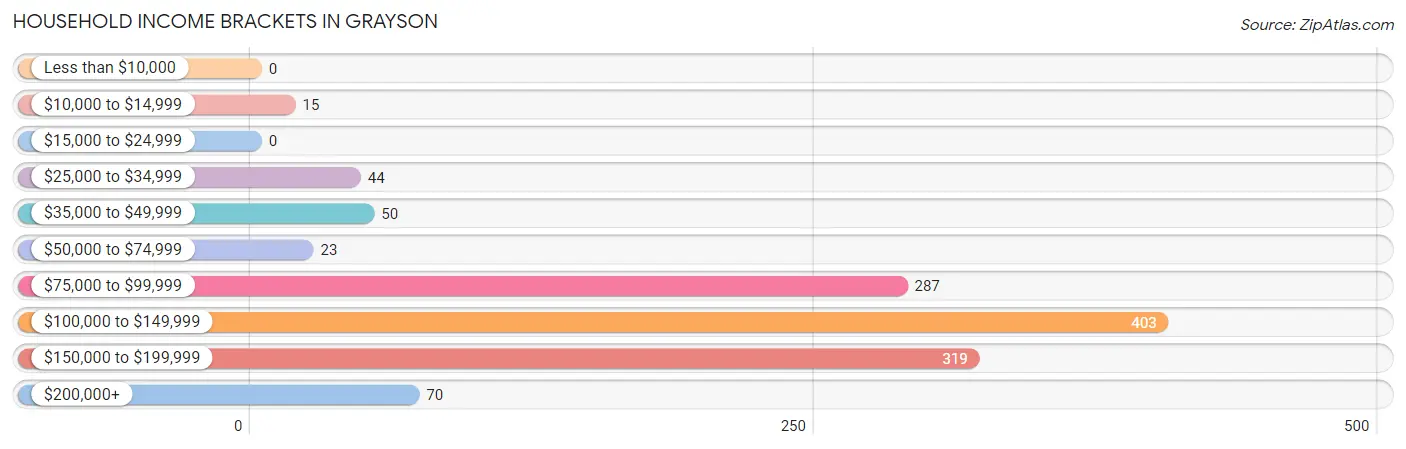
| Income Bracket | # Households | % Households |
| Less than $10,000 | 0 | 0.0% |
| $10,000 to $14,999 | 15 | 1.2% |
| $15,000 to $24,999 | 0 | 0.0% |
| $25,000 to $34,999 | 44 | 3.6% |
| $35,000 to $49,999 | 50 | 4.1% |
| $50,000 to $74,999 | 23 | 1.9% |
| $75,000 to $99,999 | 287 | 23.7% |
| $100,000 to $149,999 | 403 | 33.3% |
| $150,000 to $199,999 | 319 | 26.4% |
| $200,000+ | 70 | 5.8% |
Household Income by Householder Age in Grayson
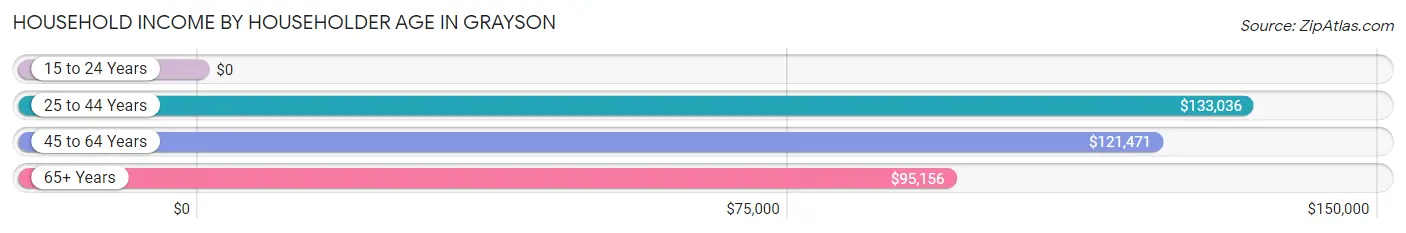
The median household income in Grayson is $121,421, with the highest median household income of $133,036 found in the 25 to 44 years age bracket for the primary householder. A total of 165 households (13.7%) fall into this category.
| Income Bracket | # Households | Median Income |
| 15 to 24 Years | 0 (0.0%) | $0 |
| 25 to 44 Years | 165 (13.7%) | $133,036 |
| 45 to 64 Years | 732 (60.6%) | $121,471 |
| 65+ Years | 312 (25.8%) | $95,156 |
| Total | 1,209 (100.0%) | $121,421 |
Poverty in Grayson
Income Below Poverty by Sex and Age in Grayson
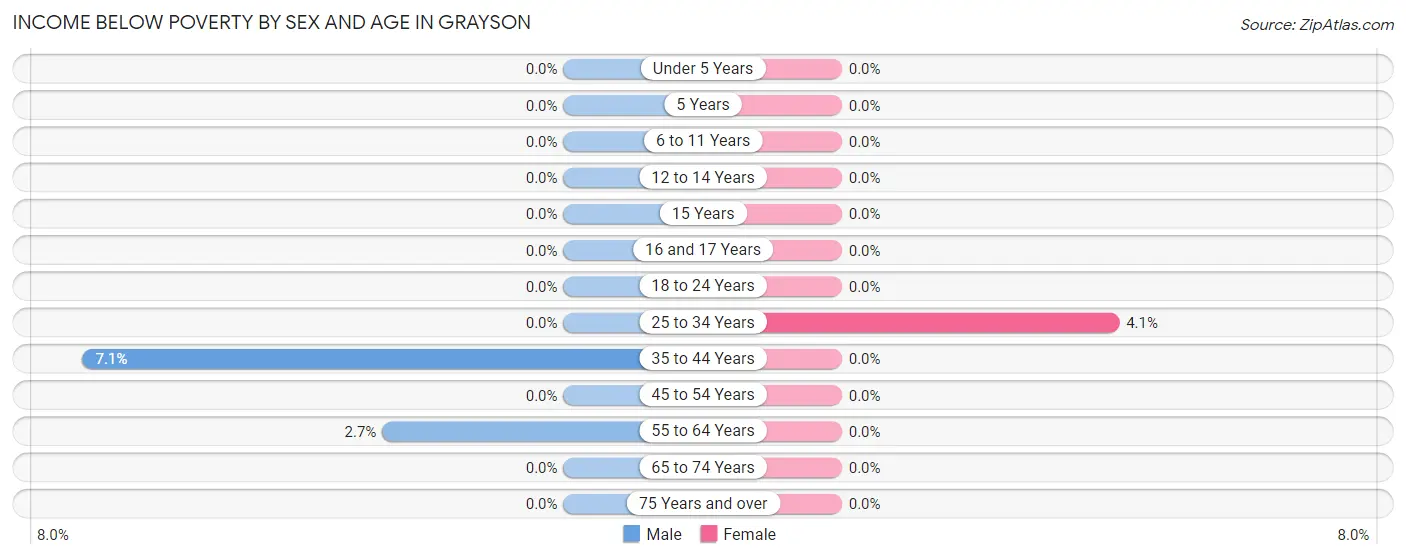
With 0.8% poverty level for males and 0.4% for females among the residents of Grayson, 35 to 44 year old males and 25 to 34 year old females are the most vulnerable to poverty, with 8 males (7.1%) and 10 females (4.1%) in their respective age groups living below the poverty level.
| Age Bracket | Male | Female |
| Under 5 Years | 0 (0.0%) | 0 (0.0%) |
| 5 Years | 0 (0.0%) | 0 (0.0%) |
| 6 to 11 Years | 0 (0.0%) | 0 (0.0%) |
| 12 to 14 Years | 0 (0.0%) | 0 (0.0%) |
| 15 Years | 0 (0.0%) | 0 (0.0%) |
| 16 and 17 Years | 0 (0.0%) | 0 (0.0%) |
| 18 to 24 Years | 0 (0.0%) | 0 (0.0%) |
| 25 to 34 Years | 0 (0.0%) | 10 (4.1%) |
| 35 to 44 Years | 8 (7.1%) | 0 (0.0%) |
| 45 to 54 Years | 0 (0.0%) | 0 (0.0%) |
| 55 to 64 Years | 8 (2.7%) | 0 (0.0%) |
| 65 to 74 Years | 0 (0.0%) | 0 (0.0%) |
| 75 Years and over | 0 (0.0%) | 0 (0.0%) |
| Total | 16 (0.8%) | 10 (0.4%) |
Income Above Poverty by Sex and Age in Grayson
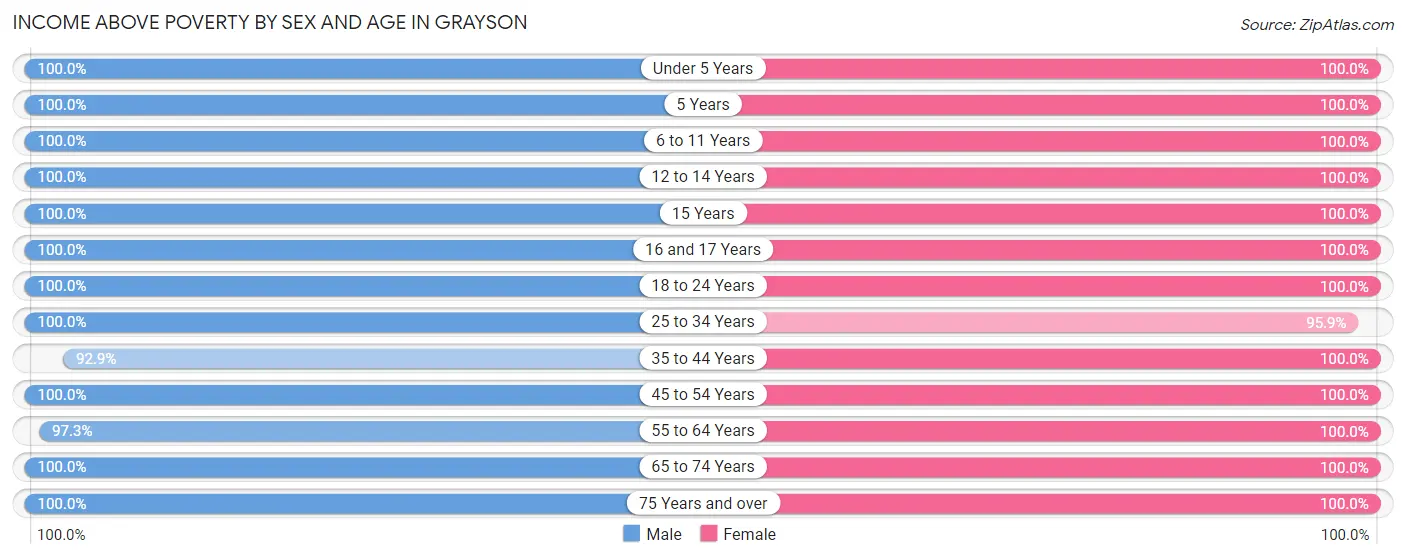
According to the poverty statistics in Grayson, males aged under 5 years and females aged under 5 years are the age groups that are most secure financially, with 100.0% of males and 100.0% of females in these age groups living above the poverty line.
| Age Bracket | Male | Female |
| Under 5 Years | 288 (100.0%) | 363 (100.0%) |
| 5 Years | 5 (100.0%) | 26 (100.0%) |
| 6 to 11 Years | 95 (100.0%) | 205 (100.0%) |
| 12 to 14 Years | 36 (100.0%) | 247 (100.0%) |
| 15 Years | 54 (100.0%) | 149 (100.0%) |
| 16 and 17 Years | 21 (100.0%) | 22 (100.0%) |
| 18 to 24 Years | 173 (100.0%) | 204 (100.0%) |
| 25 to 34 Years | 332 (100.0%) | 233 (95.9%) |
| 35 to 44 Years | 104 (92.9%) | 118 (100.0%) |
| 45 to 54 Years | 334 (100.0%) | 501 (100.0%) |
| 55 to 64 Years | 289 (97.3%) | 244 (100.0%) |
| 65 to 74 Years | 132 (100.0%) | 183 (100.0%) |
| 75 Years and over | 93 (100.0%) | 95 (100.0%) |
| Total | 1,956 (99.2%) | 2,590 (99.6%) |
Income Below Poverty Among Married-Couple Families in Grayson
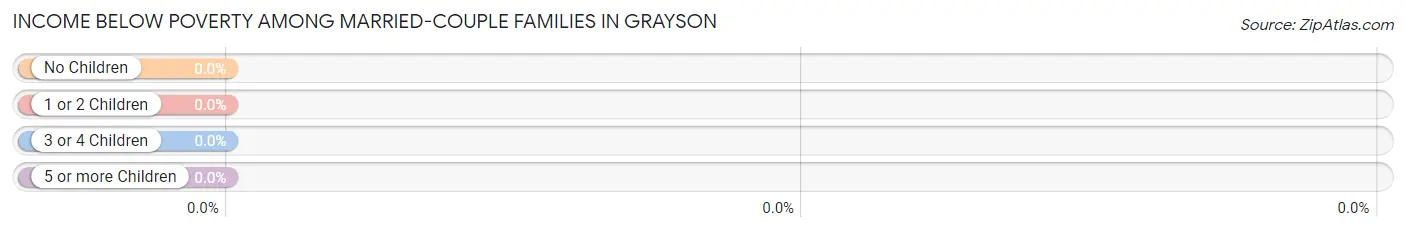
| Children | Above Poverty | Below Poverty |
| No Children | 348 (100.0%) | 0 (0.0%) |
| 1 or 2 Children | 293 (100.0%) | 0 (0.0%) |
| 3 or 4 Children | 233 (100.0%) | 0 (0.0%) |
| 5 or more Children | 0 (0.0%) | 0 (0.0%) |
| Total | 874 (100.0%) | 0 (0.0%) |
Income Below Poverty Among Single-Parent Households in Grayson
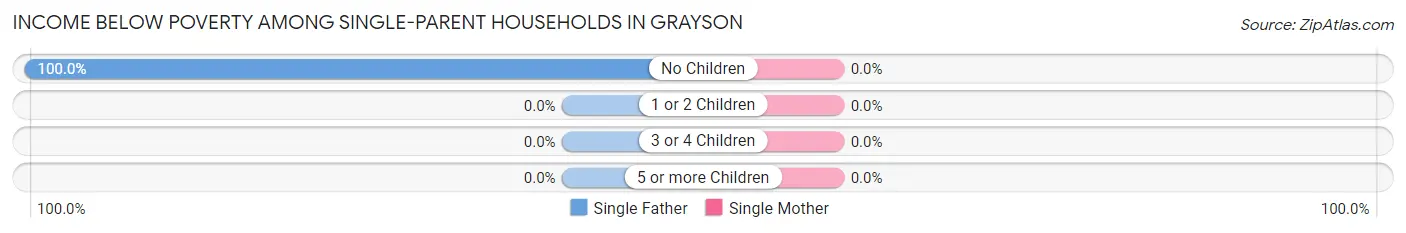
| Children | Single Father | Single Mother |
| No Children | 8 (100.0%) | 0 (0.0%) |
| 1 or 2 Children | 0 (0.0%) | 0 (0.0%) |
| 3 or 4 Children | 0 (0.0%) | 0 (0.0%) |
| 5 or more Children | 0 (0.0%) | 0 (0.0%) |
| Total | 8 (100.0%) | 0 (0.0%) |
Income Below Poverty Among Married-Couple vs Single-Parent Households in Grayson
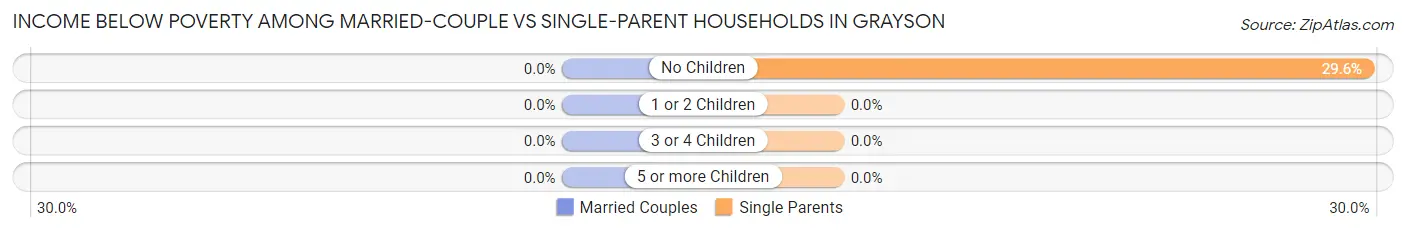
| Children | Married-Couple Families | Single-Parent Households |
| No Children | 0 (0.0%) | 8 (29.6%) |
| 1 or 2 Children | 0 (0.0%) | 0 (0.0%) |
| 3 or 4 Children | 0 (0.0%) | 0 (0.0%) |
| 5 or more Children | 0 (0.0%) | 0 (0.0%) |
| Total | 0 (0.0%) | 8 (5.2%) |
Race in Grayson
The most populous races in Grayson are Black / African American (3,538 | 77.4%), White / Caucasian (893 | 19.5%), and Hispanic or Latino (192 | 4.2%).
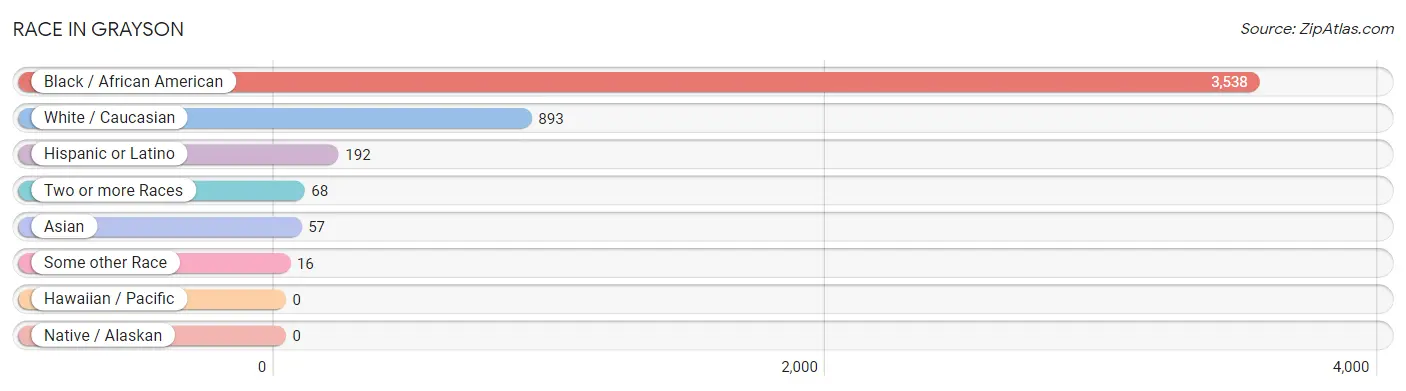
| Race | # Population | % Population |
| Asian | 57 | 1.3% |
| Black / African American | 3,538 | 77.4% |
| Hawaiian / Pacific | 0 | 0.0% |
| Hispanic or Latino | 192 | 4.2% |
| Native / Alaskan | 0 | 0.0% |
| White / Caucasian | 893 | 19.5% |
| Two or more Races | 68 | 1.5% |
| Some other Race | 16 | 0.4% |
| Total | 4,572 | 100.0% |
Ancestry in Grayson
The most populous ancestries reported in Grayson are Subsaharan African (1,839 | 40.2%), African (1,742 | 38.1%), English (189 | 4.1%), Irish (161 | 3.5%), and Scottish (133 | 2.9%), together accounting for 88.9% of all Grayson residents.
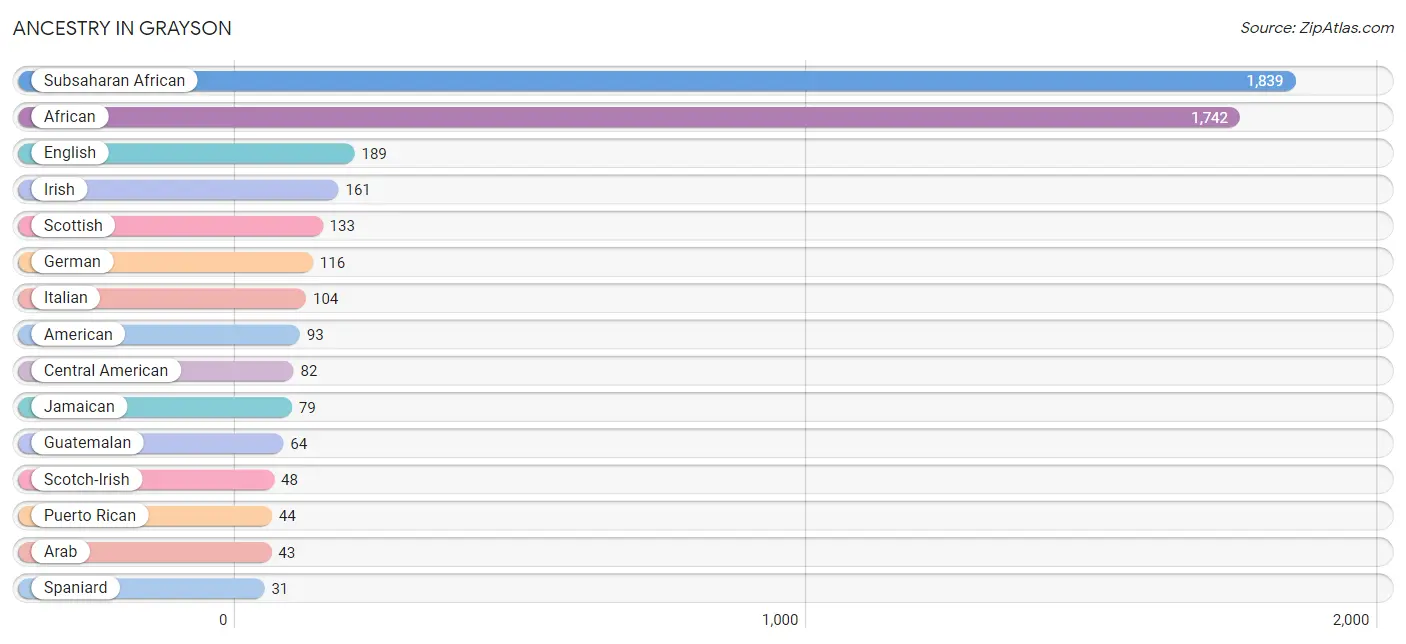
| Ancestry | # Population | % Population |
| African | 1,742 | 38.1% |
| American | 93 | 2.0% |
| Arab | 43 | 0.9% |
| British | 4 | 0.1% |
| Central American | 82 | 1.8% |
| Central American Indian | 24 | 0.5% |
| Chickasaw | 16 | 0.4% |
| Dominican | 9 | 0.2% |
| Eastern European | 7 | 0.2% |
| English | 189 | 4.1% |
| European | 16 | 0.4% |
| French | 15 | 0.3% |
| German | 116 | 2.5% |
| Guatemalan | 64 | 1.4% |
| Haitian | 12 | 0.3% |
| Honduran | 10 | 0.2% |
| Indian (Asian) | 6 | 0.1% |
| Irish | 161 | 3.5% |
| Italian | 104 | 2.3% |
| Jamaican | 79 | 1.7% |
| Korean | 29 | 0.6% |
| Mexican | 8 | 0.2% |
| Palestinian | 16 | 0.4% |
| Polish | 23 | 0.5% |
| Puerto Rican | 44 | 1.0% |
| Russian | 9 | 0.2% |
| Salvadoran | 8 | 0.2% |
| Scotch-Irish | 48 | 1.1% |
| Scottish | 133 | 2.9% |
| Slovak | 1 | 0.0% |
| South American | 18 | 0.4% |
| Spaniard | 31 | 0.7% |
| Subsaharan African | 1,839 | 40.2% |
| Syrian | 27 | 0.6% |
| Thai | 22 | 0.5% |
| Trinidadian and Tobagonian | 15 | 0.3% |
| Venezuelan | 18 | 0.4% |
| Welsh | 15 | 0.3% | View All 38 Rows |
Immigrants in Grayson
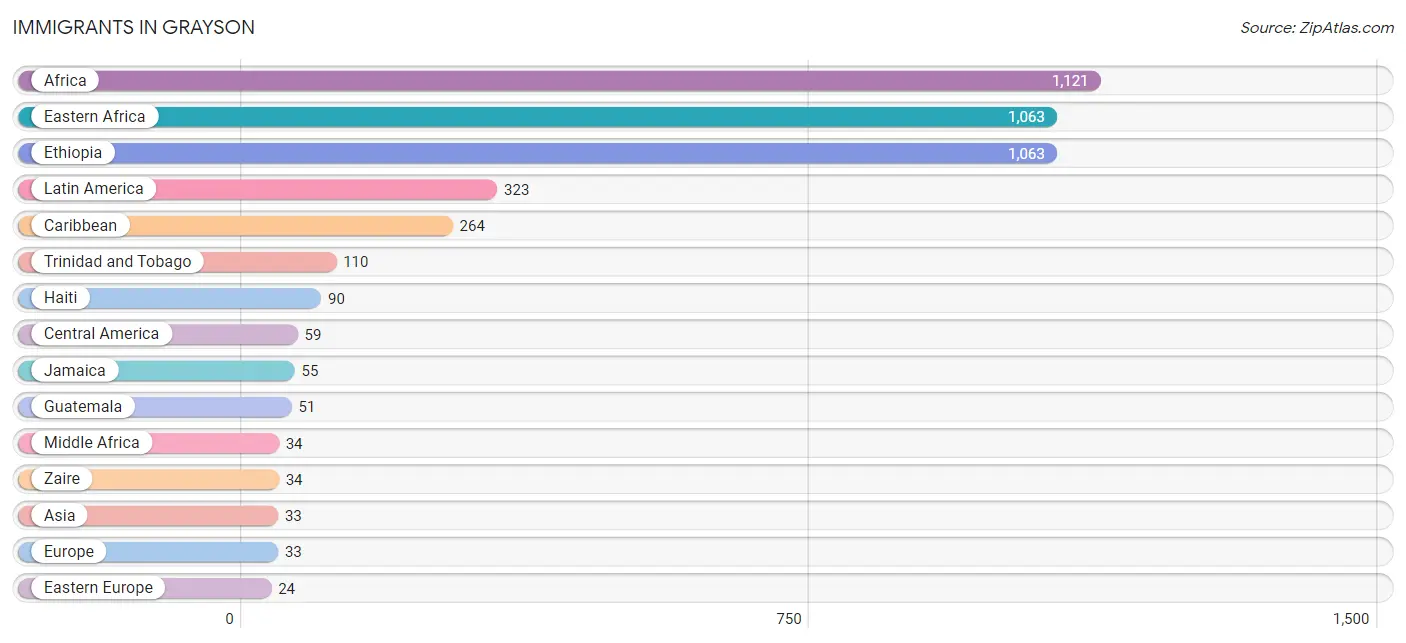
The most numerous immigrant groups reported in Grayson came from Africa (1,121 | 24.5%), Eastern Africa (1,063 | 23.3%), Ethiopia (1,063 | 23.3%), Latin America (323 | 7.1%), and Caribbean (264 | 5.8%), together accounting for 83.9% of all Grayson residents.
| Immigration Origin | # Population | % Population |
| Africa | 1,121 | 24.5% |
| Asia | 33 | 0.7% |
| Bosnia and Herzegovina | 8 | 0.2% |
| Caribbean | 264 | 5.8% |
| Central America | 59 | 1.3% |
| Dominican Republic | 9 | 0.2% |
| Eastern Africa | 1,063 | 23.3% |
| Eastern Europe | 24 | 0.5% |
| El Salvador | 8 | 0.2% |
| Ethiopia | 1,063 | 23.3% |
| Europe | 33 | 0.7% |
| Ghana | 11 | 0.2% |
| Guatemala | 51 | 1.1% |
| Haiti | 90 | 2.0% |
| India | 24 | 0.5% |
| Jamaica | 55 | 1.2% |
| Latin America | 323 | 7.1% |
| Liberia | 11 | 0.2% |
| Middle Africa | 34 | 0.7% |
| Northern Europe | 9 | 0.2% |
| Philippines | 9 | 0.2% |
| Romania | 16 | 0.4% |
| South Africa | 2 | 0.0% |
| South Central Asia | 24 | 0.5% |
| South Eastern Asia | 9 | 0.2% |
| Trinidad and Tobago | 110 | 2.4% |
| Western Africa | 22 | 0.5% |
| Zaire | 34 | 0.7% | View All 28 Rows |
Sex and Age in Grayson
Sex and Age in Grayson
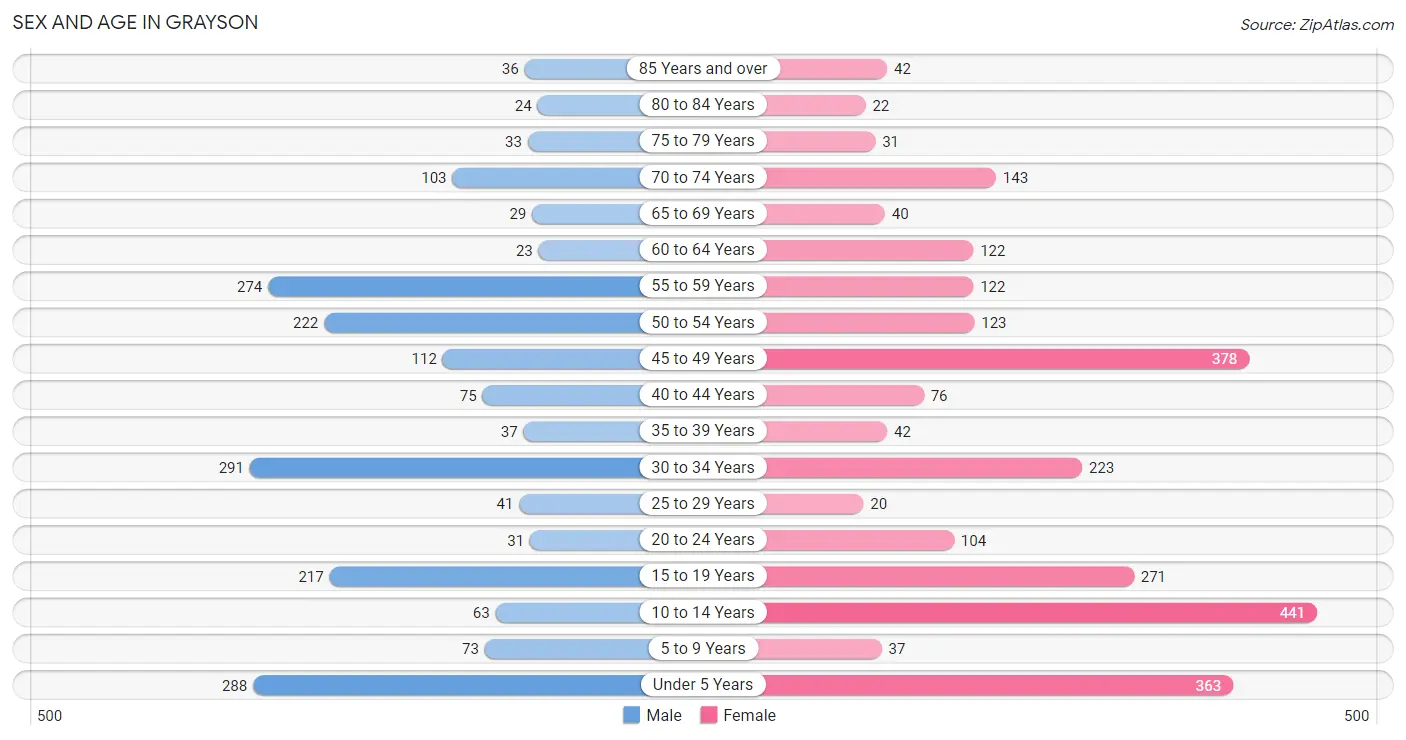
The most populous age groups in Grayson are 30 to 34 Years (291 | 14.8%) for men and 10 to 14 Years (441 | 17.0%) for women.
| Age Bracket | Male | Female |
| Under 5 Years | 288 (14.6%) | 363 (14.0%) |
| 5 to 9 Years | 73 (3.7%) | 37 (1.4%) |
| 10 to 14 Years | 63 (3.2%) | 441 (17.0%) |
| 15 to 19 Years | 217 (11.0%) | 271 (10.4%) |
| 20 to 24 Years | 31 (1.6%) | 104 (4.0%) |
| 25 to 29 Years | 41 (2.1%) | 20 (0.8%) |
| 30 to 34 Years | 291 (14.8%) | 223 (8.6%) |
| 35 to 39 Years | 37 (1.9%) | 42 (1.6%) |
| 40 to 44 Years | 75 (3.8%) | 76 (2.9%) |
| 45 to 49 Years | 112 (5.7%) | 378 (14.5%) |
| 50 to 54 Years | 222 (11.3%) | 123 (4.7%) |
| 55 to 59 Years | 274 (13.9%) | 122 (4.7%) |
| 60 to 64 Years | 23 (1.2%) | 122 (4.7%) |
| 65 to 69 Years | 29 (1.5%) | 40 (1.5%) |
| 70 to 74 Years | 103 (5.2%) | 143 (5.5%) |
| 75 to 79 Years | 33 (1.7%) | 31 (1.2%) |
| 80 to 84 Years | 24 (1.2%) | 22 (0.9%) |
| 85 Years and over | 36 (1.8%) | 42 (1.6%) |
| Total | 1,972 (100.0%) | 2,600 (100.0%) |
Families and Households in Grayson
Median Family Size in Grayson
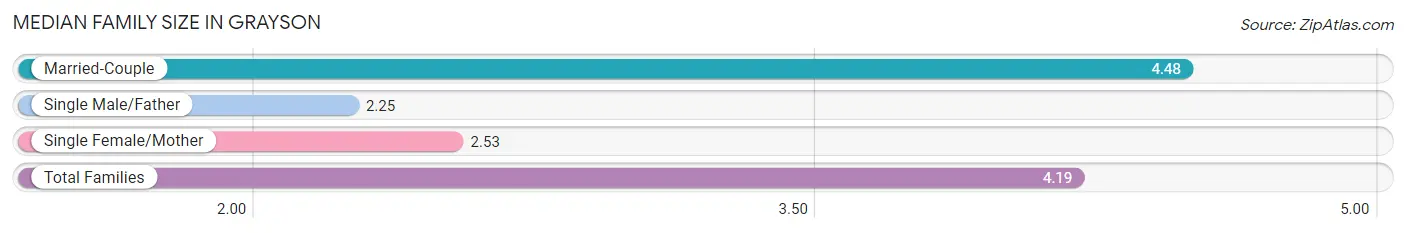
The median family size in Grayson is 4.19 persons per family, with married-couple families (874 | 85.0%) accounting for the largest median family size of 4.48 persons per family. On the other hand, single male/father families (8 | 0.8%) represent the smallest median family size with 2.25 persons per family.
| Family Type | # Families | Family Size |
| Married-Couple | 874 (85.0%) | 4.48 |
| Single Male/Father | 8 (0.8%) | 2.25 |
| Single Female/Mother | 146 (14.2%) | 2.53 |
| Total Families | 1,028 (100.0%) | 4.19 |
Median Household Size in Grayson
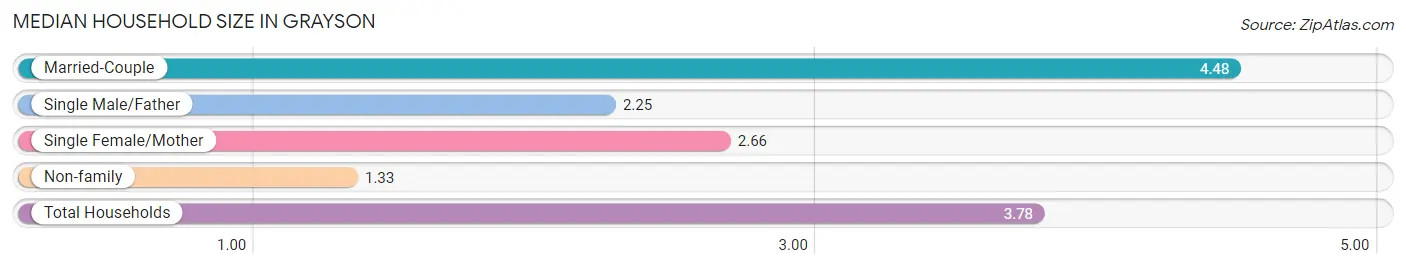
The median household size in Grayson is 3.78 persons per household, with married-couple households (874 | 72.3%) accounting for the largest median household size of 4.48 persons per household. non-family households (181 | 15.0%) represent the smallest median household size with 1.33 persons per household.
| Household Type | # Households | Household Size |
| Married-Couple | 874 (72.3%) | 4.48 |
| Single Male/Father | 8 (0.7%) | 2.25 |
| Single Female/Mother | 146 (12.1%) | 2.66 |
| Non-family | 181 (15.0%) | 1.33 |
| Total Households | 1,209 (100.0%) | 3.78 |
Household Size by Marriage Status in Grayson
Out of a total of 1,209 households in Grayson, 1,028 (85.0%) are family households, while 181 (15.0%) are nonfamily households. The most numerous type of family households are 2-person households, comprising 364, and the most common type of nonfamily households are 1-person households, comprising 152.
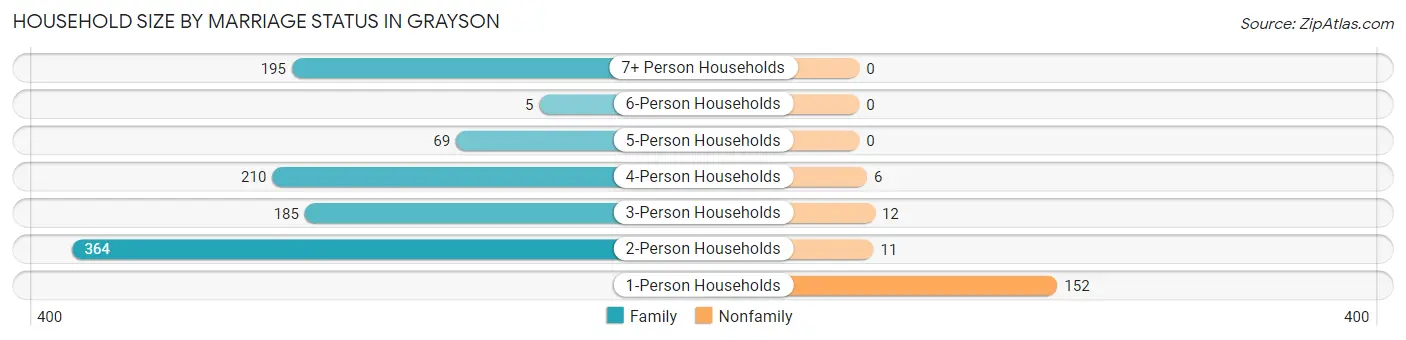
| Household Size | Family Households | Nonfamily Households |
| 1-Person Households | - | 152 (12.6%) |
| 2-Person Households | 364 (30.1%) | 11 (0.9%) |
| 3-Person Households | 185 (15.3%) | 12 (1.0%) |
| 4-Person Households | 210 (17.4%) | 6 (0.5%) |
| 5-Person Households | 69 (5.7%) | 0 (0.0%) |
| 6-Person Households | 5 (0.4%) | 0 (0.0%) |
| 7+ Person Households | 195 (16.1%) | 0 (0.0%) |
| Total | 1,028 (85.0%) | 181 (15.0%) |
Female Fertility in Grayson
Fertility by Age in Grayson
Average fertility rate in Grayson is 194.0 births per 1,000 women. Women in the age bracket of 20 to 34 years have the highest fertility rate with 585.0 births per 1,000 women. Women in the age bracket of 20 to 34 years acount for 94.0% of all women with births.
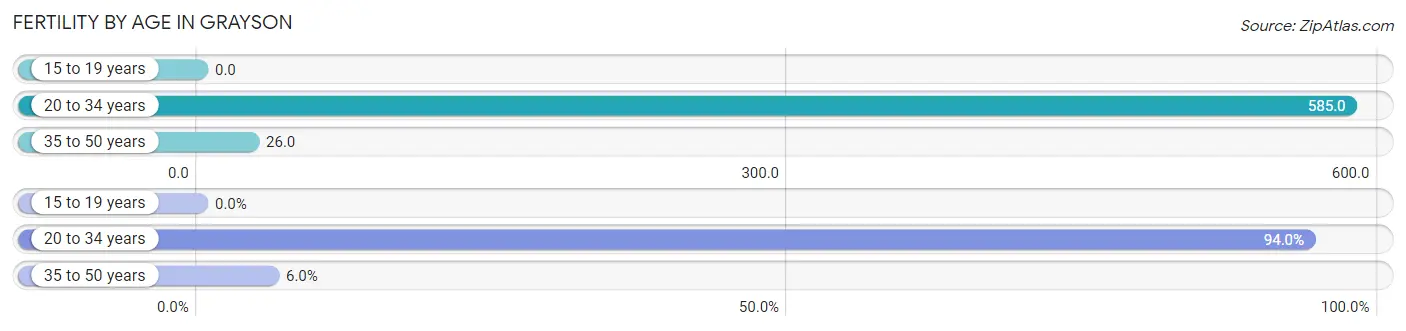
| Age Bracket | Women with Births | Births / 1,000 Women |
| 15 to 19 years | 0 (0.0%) | 0.0 |
| 20 to 34 years | 203 (94.0%) | 585.0 |
| 35 to 50 years | 13 (6.0%) | 26.0 |
| Total | 216 (100.0%) | 194.0 |
Fertility by Age by Marriage Status in Grayson
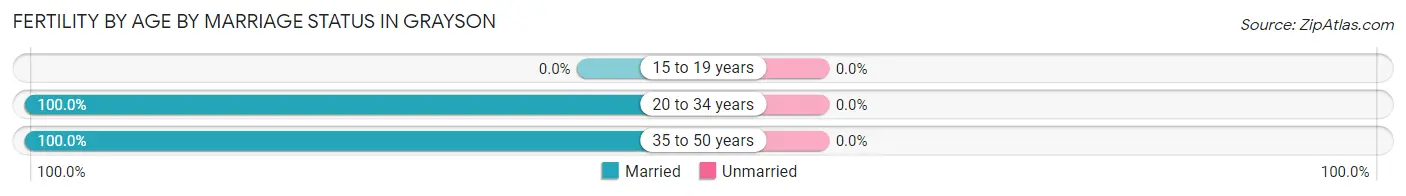
| Age Bracket | Married | Unmarried |
| 15 to 19 years | 0 (0.0%) | 0 (0.0%) |
| 20 to 34 years | 203 (100.0%) | 0 (0.0%) |
| 35 to 50 years | 13 (100.0%) | 0 (0.0%) |
| Total | 216 (100.0%) | 0 (0.0%) |
Fertility by Education in Grayson
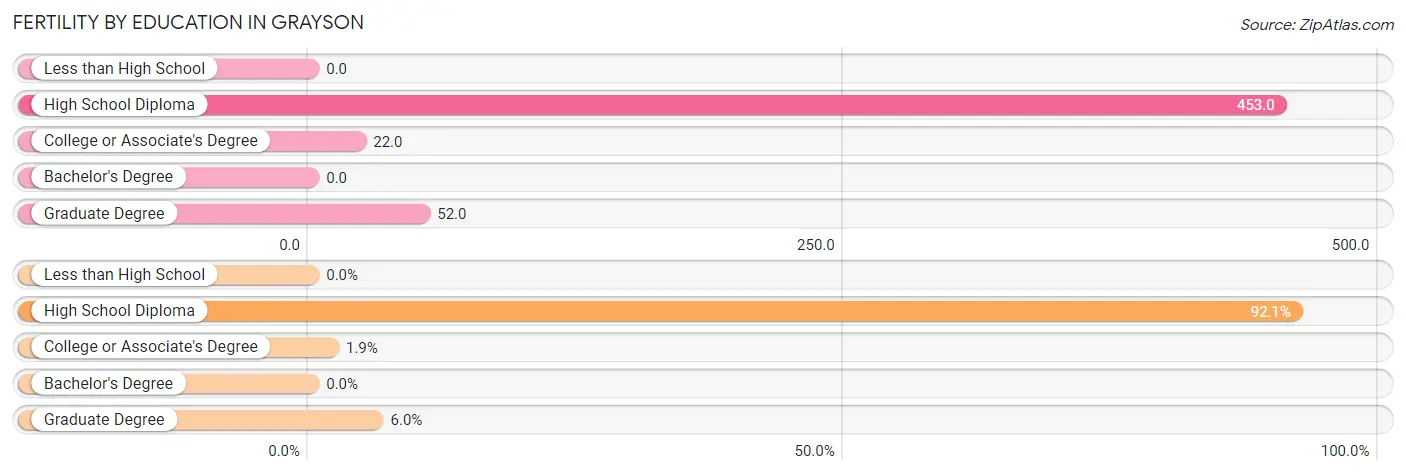
| Educational Attainment | Women with Births | Births / 1,000 Women |
| Less than High School | 0 (0.0%) | 0.0 |
| High School Diploma | 199 (92.1%) | 453.0 |
| College or Associate's Degree | 4 (1.8%) | 22.0 |
| Bachelor's Degree | 0 (0.0%) | 0.0 |
| Graduate Degree | 13 (6.0%) | 52.0 |
| Total | 216 (100.0%) | 194.0 |
Fertility by Education by Marriage Status in Grayson
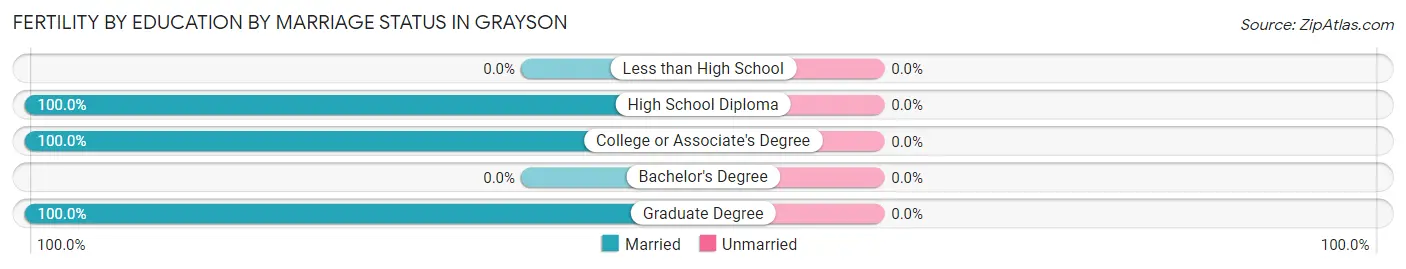
| Educational Attainment | Married | Unmarried |
| Less than High School | 0 (0.0%) | 0 (0.0%) |
| High School Diploma | 199 (100.0%) | 0 (0.0%) |
| College or Associate's Degree | 4 (100.0%) | 0 (0.0%) |
| Bachelor's Degree | 0 (0.0%) | 0 (0.0%) |
| Graduate Degree | 13 (100.0%) | 0 (0.0%) |
| Total | 216 (100.0%) | 0 (0.0%) |
Employment Characteristics in Grayson
Employment by Class of Employer in Grayson
Among the 1,919 employed individuals in Grayson, private company employees (1,162 | 60.6%), not-for-profit organizations (239 | 12.4%), and local government employees (224 | 11.7%) make up the most common classes of employment.
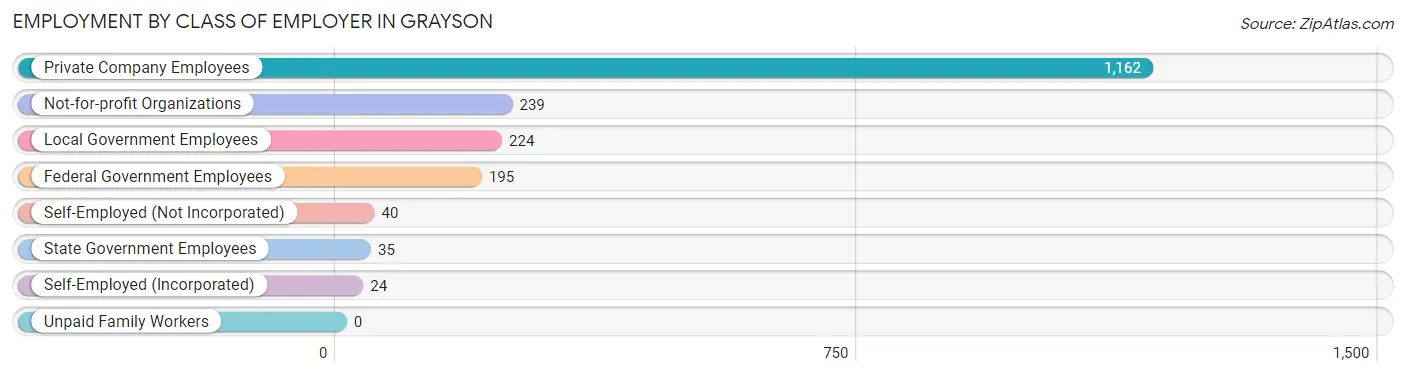
| Employer Class | # Employees | % Employees |
| Private Company Employees | 1,162 | 60.6% |
| Self-Employed (Incorporated) | 24 | 1.3% |
| Self-Employed (Not Incorporated) | 40 | 2.1% |
| Not-for-profit Organizations | 239 | 12.4% |
| Local Government Employees | 224 | 11.7% |
| State Government Employees | 35 | 1.8% |
| Federal Government Employees | 195 | 10.2% |
| Unpaid Family Workers | 0 | 0.0% |
| Total | 1,919 | 100.0% |
Employment Status by Age in Grayson
According to the labor force statistics for Grayson, out of the total population over 16 years of age (3,104), 67.9% or 2,108 individuals are in the labor force, with 1.6% or 34 of them unemployed. The age group with the highest labor force participation rate is 55 to 59 years, with 96.0% or 380 individuals in the labor force. Within the labor force, the 35 to 44 years age range has the highest percentage of unemployed individuals, with 4.8% or 10 of them being unemployed.
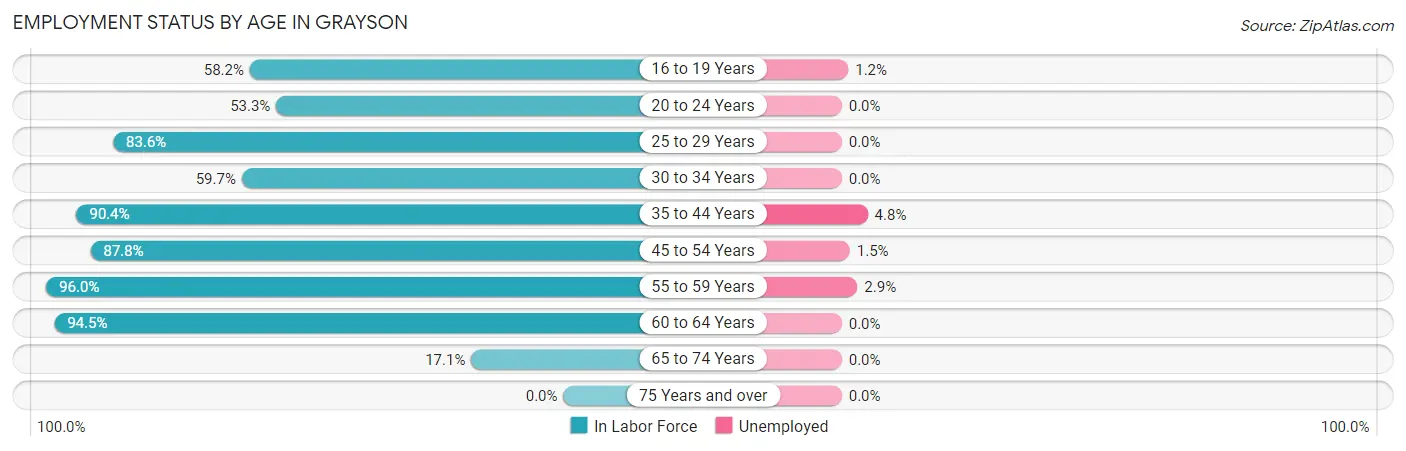
| Age Bracket | In Labor Force | Unemployed |
| 16 to 19 Years | 166 (58.2%) | 2 (1.2%) |
| 20 to 24 Years | 72 (53.3%) | 0 (0.0%) |
| 25 to 29 Years | 51 (83.6%) | 0 (0.0%) |
| 30 to 34 Years | 307 (59.7%) | 0 (0.0%) |
| 35 to 44 Years | 208 (90.4%) | 10 (4.8%) |
| 45 to 54 Years | 733 (87.8%) | 11 (1.5%) |
| 55 to 59 Years | 380 (96.0%) | 11 (2.9%) |
| 60 to 64 Years | 137 (94.5%) | 0 (0.0%) |
| 65 to 74 Years | 54 (17.1%) | 0 (0.0%) |
| 75 Years and over | 0 (0.0%) | 0 (0.0%) |
| Total | 2,108 (67.9%) | 34 (1.6%) |
Employment Status by Educational Attainment in Grayson
According to labor force statistics for Grayson, 83.3% of individuals (1,817) out of the total population between 25 and 64 years of age (2,181) are in the labor force, with 1.8% or 33 of them being unemployed. The group with the highest labor force participation rate are those with the educational attainment of college / associate degree, with 94.8% or 346 individuals in the labor force. Within the labor force, individuals with high school diploma education have the highest percentage of unemployment, with 3.9% or 15 of them being unemployed.
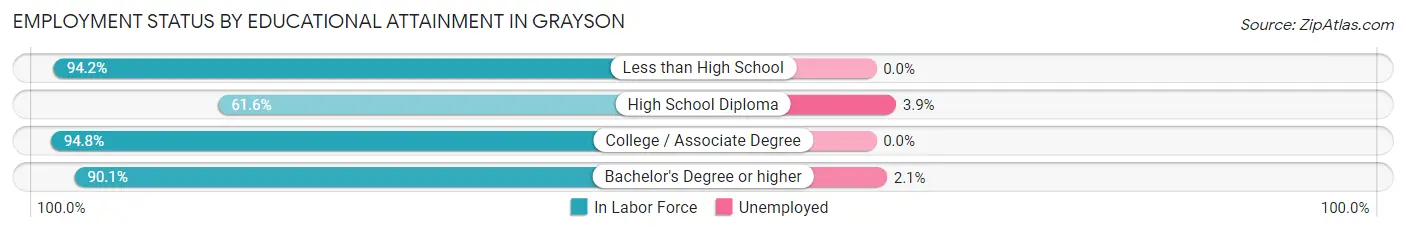
| Educational Attainment | In Labor Force | Unemployed |
| Less than High School | 262 (94.2%) | 0 (0.0%) |
| High School Diploma | 384 (61.6%) | 24 (3.9%) |
| College / Associate Degree | 346 (94.8%) | 0 (0.0%) |
| Bachelor's Degree or higher | 824 (90.1%) | 19 (2.1%) |
| Total | 1,817 (83.3%) | 39 (1.8%) |
Employment Occupations by Sex in Grayson
Management, Business, Science and Arts Occupations
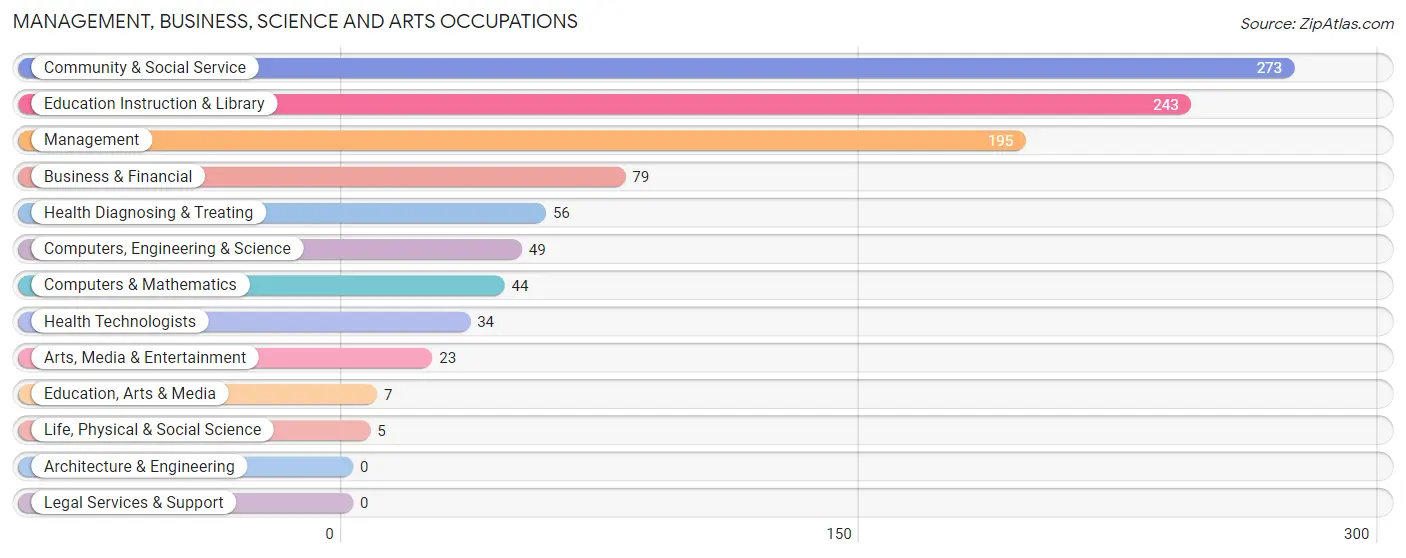
The most common Management, Business, Science and Arts occupations in Grayson are Community & Social Service (273 | 13.2%), Education Instruction & Library (243 | 11.7%), Management (195 | 9.4%), Business & Financial (79 | 3.8%), and Health Diagnosing & Treating (56 | 2.7%).
Management, Business, Science and Arts Occupations by Sex
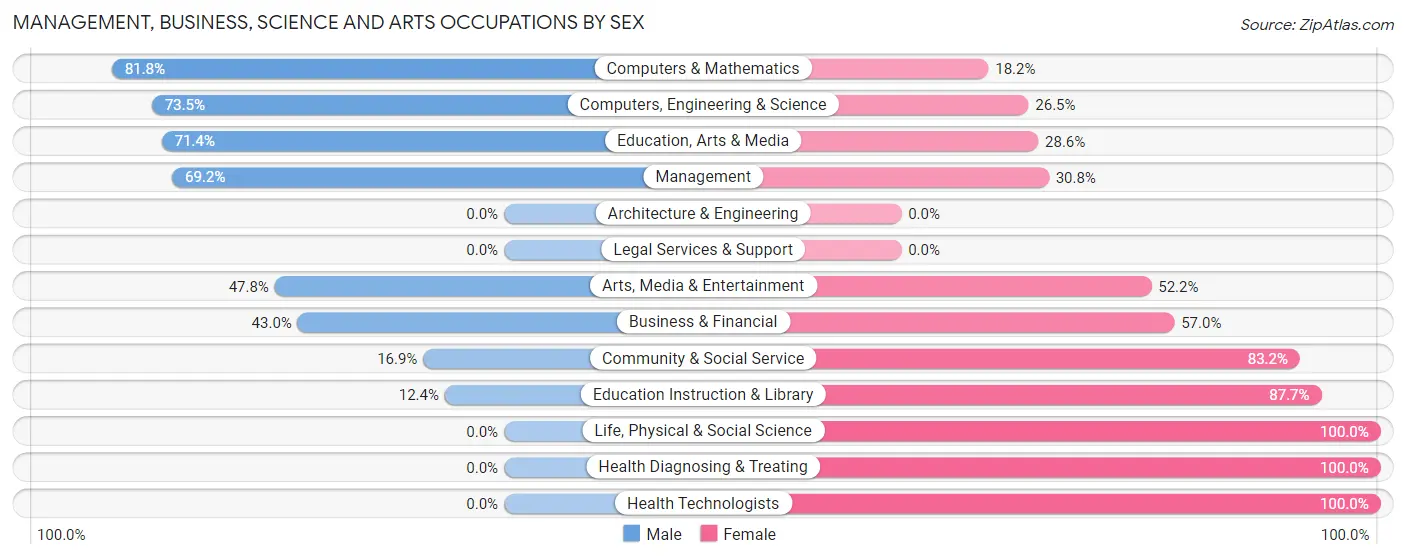
Within the Management, Business, Science and Arts occupations in Grayson, the most male-oriented occupations are Computers & Mathematics (81.8%), Computers, Engineering & Science (73.5%), and Education, Arts & Media (71.4%), while the most female-oriented occupations are Life, Physical & Social Science (100.0%), Health Diagnosing & Treating (100.0%), and Health Technologists (100.0%).
| Occupation | Male | Female |
| Management | 135 (69.2%) | 60 (30.8%) |
| Business & Financial | 34 (43.0%) | 45 (57.0%) |
| Computers, Engineering & Science | 36 (73.5%) | 13 (26.5%) |
| Computers & Mathematics | 36 (81.8%) | 8 (18.2%) |
| Architecture & Engineering | 0 (0.0%) | 0 (0.0%) |
| Life, Physical & Social Science | 0 (0.0%) | 5 (100.0%) |
| Community & Social Service | 46 (16.9%) | 227 (83.2%) |
| Education, Arts & Media | 5 (71.4%) | 2 (28.6%) |
| Legal Services & Support | 0 (0.0%) | 0 (0.0%) |
| Education Instruction & Library | 30 (12.3%) | 213 (87.6%) |
| Arts, Media & Entertainment | 11 (47.8%) | 12 (52.2%) |
| Health Diagnosing & Treating | 0 (0.0%) | 56 (100.0%) |
| Health Technologists | 0 (0.0%) | 34 (100.0%) |
| Total (Category) | 251 (38.5%) | 401 (61.5%) |
| Total (Overall) | 1,227 (59.2%) | 847 (40.8%) |
Services Occupations
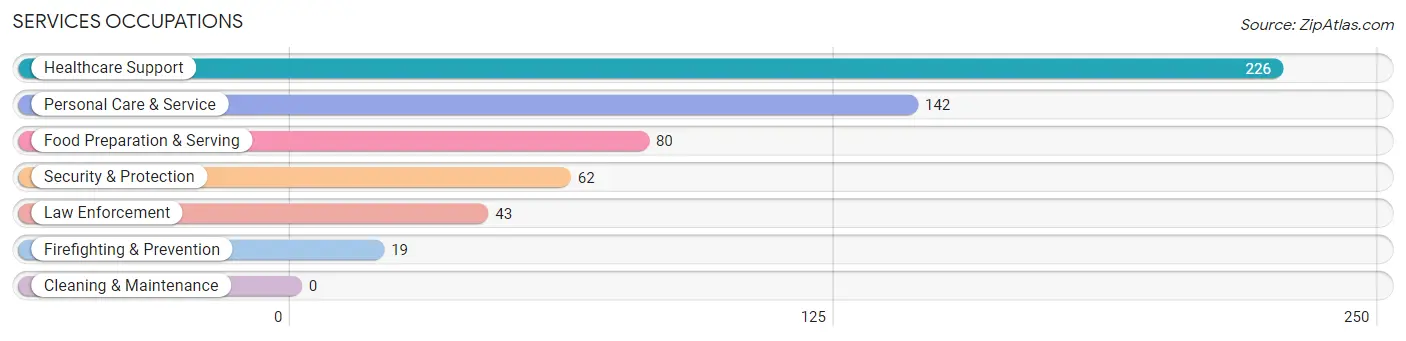
The most common Services occupations in Grayson are Healthcare Support (226 | 10.9%), Personal Care & Service (142 | 6.9%), Food Preparation & Serving (80 | 3.9%), Security & Protection (62 | 3.0%), and Law Enforcement (43 | 2.1%).
Services Occupations by Sex
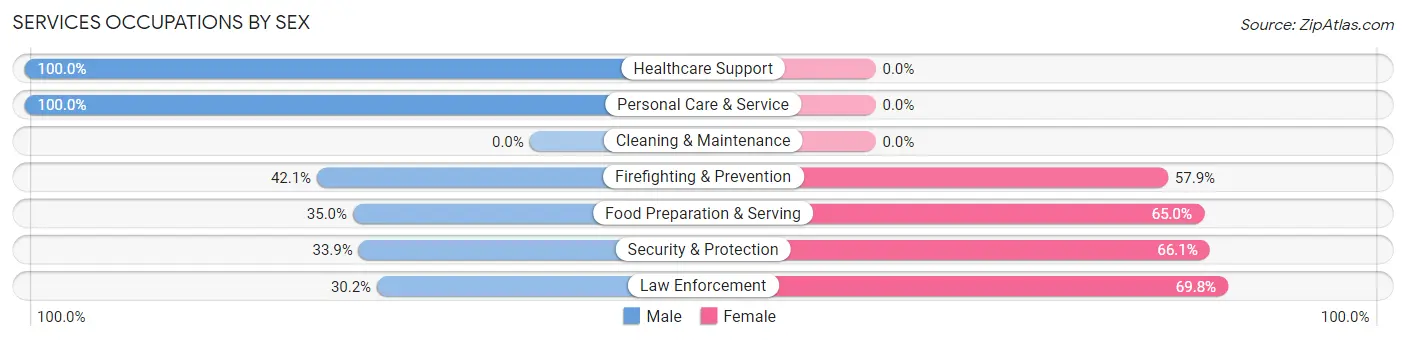
Within the Services occupations in Grayson, the most male-oriented occupations are Healthcare Support (100.0%), Personal Care & Service (100.0%), and Firefighting & Prevention (42.1%), while the most female-oriented occupations are Law Enforcement (69.8%), Security & Protection (66.1%), and Food Preparation & Serving (65.0%).
| Occupation | Male | Female |
| Healthcare Support | 226 (100.0%) | 0 (0.0%) |
| Security & Protection | 21 (33.9%) | 41 (66.1%) |
| Firefighting & Prevention | 8 (42.1%) | 11 (57.9%) |
| Law Enforcement | 13 (30.2%) | 30 (69.8%) |
| Food Preparation & Serving | 28 (35.0%) | 52 (65.0%) |
| Cleaning & Maintenance | 0 (0.0%) | 0 (0.0%) |
| Personal Care & Service | 142 (100.0%) | 0 (0.0%) |
| Total (Category) | 417 (81.8%) | 93 (18.2%) |
| Total (Overall) | 1,227 (59.2%) | 847 (40.8%) |
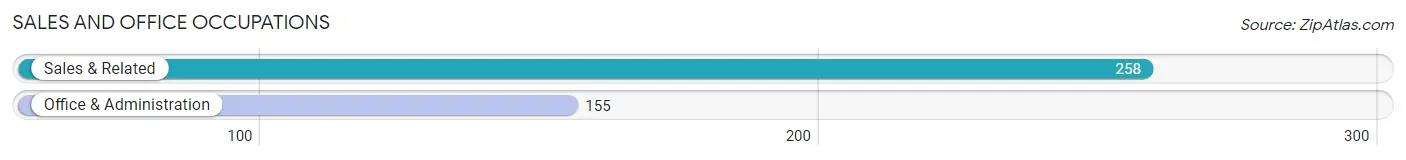
Sales and Office Occupations
The most common Sales and Office occupations in Grayson are Sales & Related (258 | 12.4%), and Office & Administration (155 | 7.5%).
Sales and Office Occupations by Sex
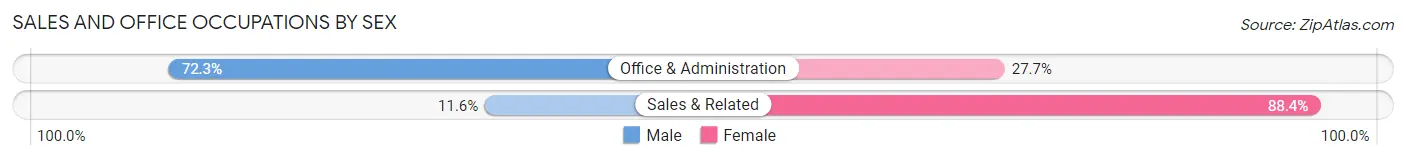
| Occupation | Male | Female |
| Sales & Related | 30 (11.6%) | 228 (88.4%) |
| Office & Administration | 112 (72.3%) | 43 (27.7%) |
| Total (Category) | 142 (34.4%) | 271 (65.6%) |
| Total (Overall) | 1,227 (59.2%) | 847 (40.8%) |
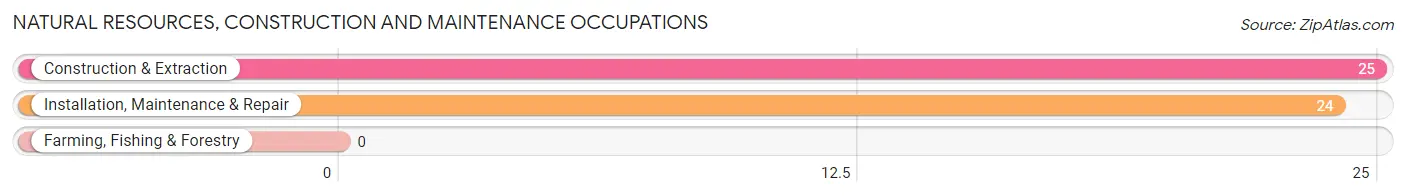
Natural Resources, Construction and Maintenance Occupations
The most common Natural Resources, Construction and Maintenance occupations in Grayson are Construction & Extraction (25 | 1.2%), and Installation, Maintenance & Repair (24 | 1.2%).
Natural Resources, Construction and Maintenance Occupations by Sex
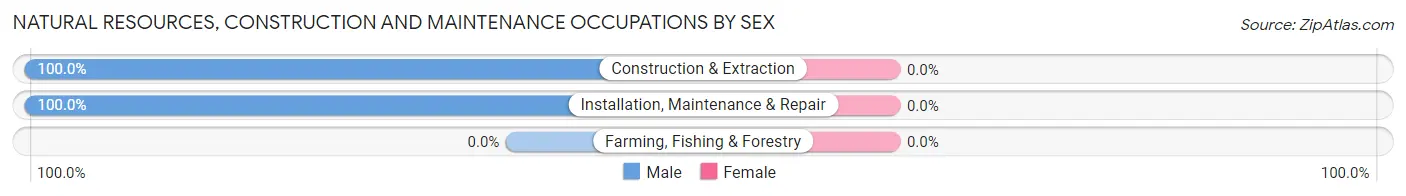
| Occupation | Male | Female |
| Farming, Fishing & Forestry | 0 (0.0%) | 0 (0.0%) |
| Construction & Extraction | 25 (100.0%) | 0 (0.0%) |
| Installation, Maintenance & Repair | 24 (100.0%) | 0 (0.0%) |
| Total (Category) | 49 (100.0%) | 0 (0.0%) |
| Total (Overall) | 1,227 (59.2%) | 847 (40.8%) |
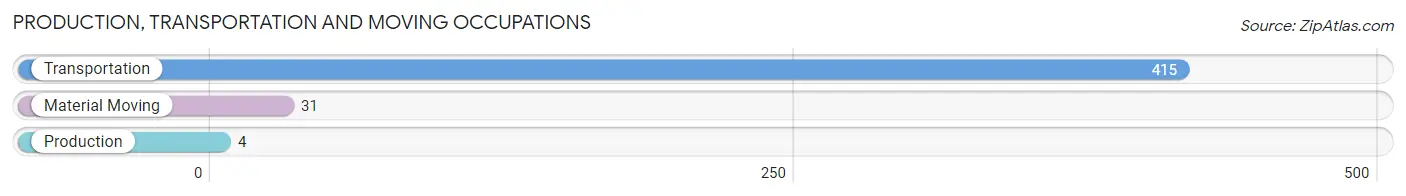
Production, Transportation and Moving Occupations
The most common Production, Transportation and Moving occupations in Grayson are Transportation (415 | 20.0%), Material Moving (31 | 1.5%), and Production (4 | 0.2%).
Production, Transportation and Moving Occupations by Sex
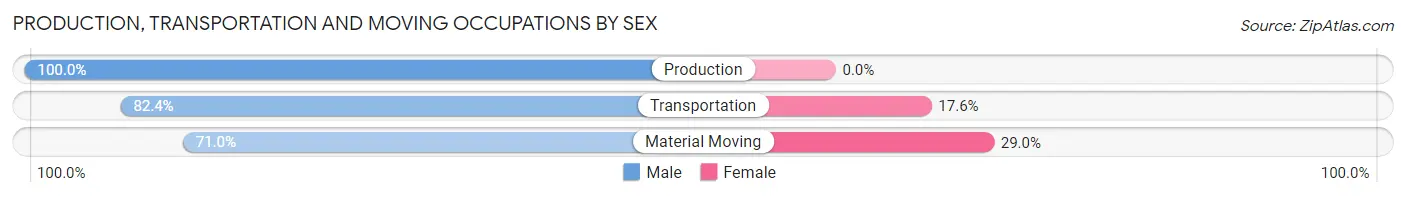
| Occupation | Male | Female |
| Production | 4 (100.0%) | 0 (0.0%) |
| Transportation | 342 (82.4%) | 73 (17.6%) |
| Material Moving | 22 (71.0%) | 9 (29.0%) |
| Total (Category) | 368 (81.8%) | 82 (18.2%) |
| Total (Overall) | 1,227 (59.2%) | 847 (40.8%) |
Employment Industries by Sex in Grayson
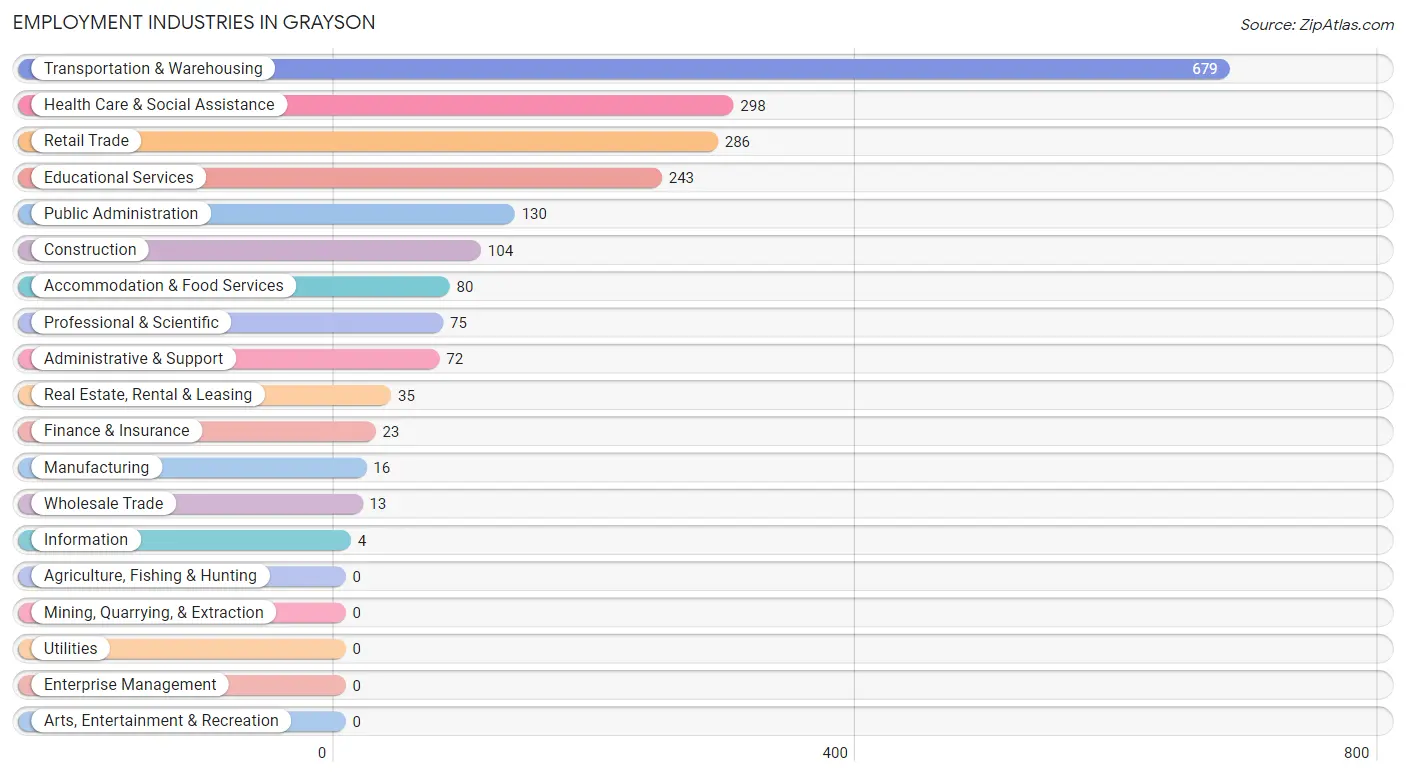
Employment Industries in Grayson
The major employment industries in Grayson include Transportation & Warehousing (679 | 32.7%), Health Care & Social Assistance (298 | 14.4%), Retail Trade (286 | 13.8%), Educational Services (243 | 11.7%), and Public Administration (130 | 6.3%).
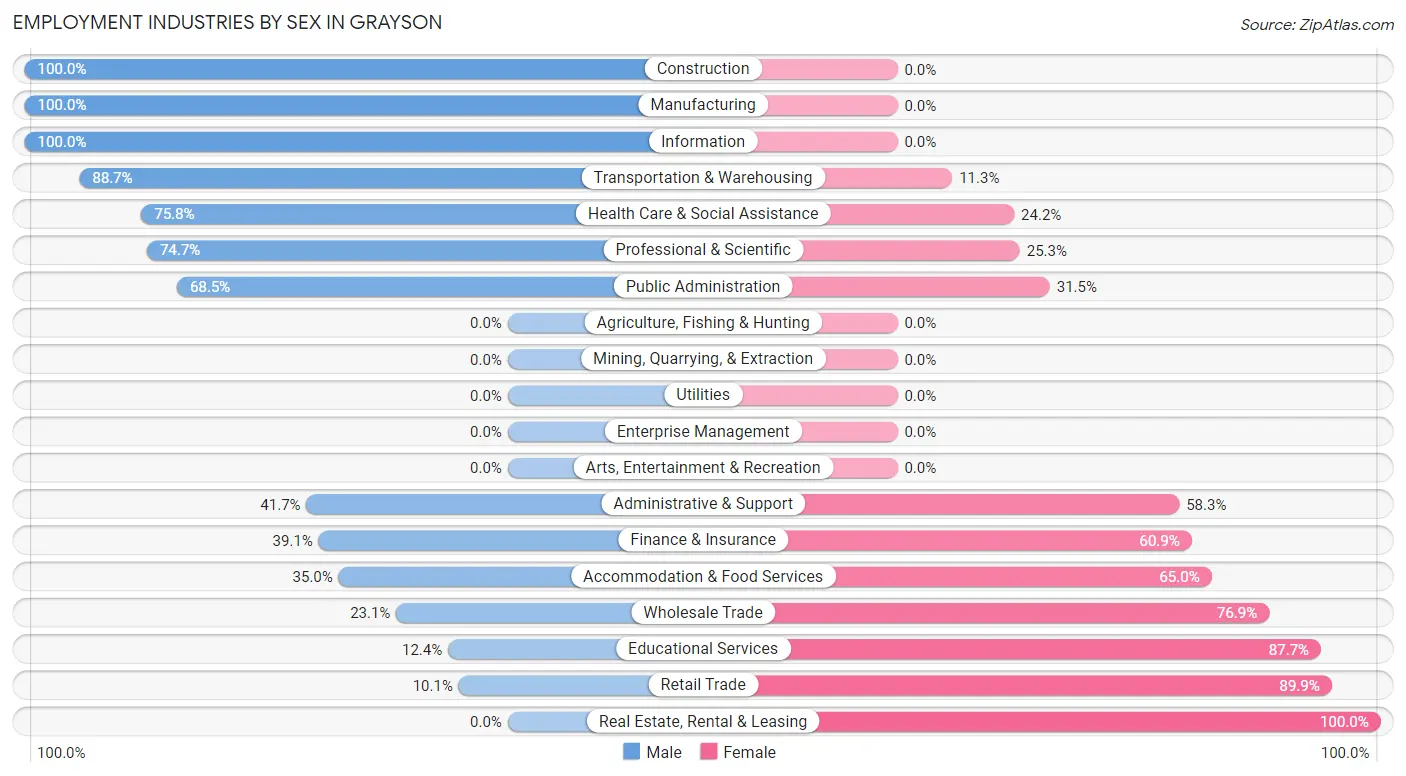
Employment Industries by Sex in Grayson
The Grayson industries that see more men than women are Construction (100.0%), Manufacturing (100.0%), and Information (100.0%), whereas the industries that tend to have a higher number of women are Real Estate, Rental & Leasing (100.0%), Retail Trade (89.9%), and Educational Services (87.6%).
| Industry | Male | Female |
| Agriculture, Fishing & Hunting | 0 (0.0%) | 0 (0.0%) |
| Mining, Quarrying, & Extraction | 0 (0.0%) | 0 (0.0%) |
| Construction | 104 (100.0%) | 0 (0.0%) |
| Manufacturing | 16 (100.0%) | 0 (0.0%) |
| Wholesale Trade | 3 (23.1%) | 10 (76.9%) |
| Retail Trade | 29 (10.1%) | 257 (89.9%) |
| Transportation & Warehousing | 602 (88.7%) | 77 (11.3%) |
| Utilities | 0 (0.0%) | 0 (0.0%) |
| Information | 4 (100.0%) | 0 (0.0%) |
| Finance & Insurance | 9 (39.1%) | 14 (60.9%) |
| Real Estate, Rental & Leasing | 0 (0.0%) | 35 (100.0%) |
| Professional & Scientific | 56 (74.7%) | 19 (25.3%) |
| Enterprise Management | 0 (0.0%) | 0 (0.0%) |
| Administrative & Support | 30 (41.7%) | 42 (58.3%) |
| Educational Services | 30 (12.3%) | 213 (87.6%) |
| Health Care & Social Assistance | 226 (75.8%) | 72 (24.2%) |
| Arts, Entertainment & Recreation | 0 (0.0%) | 0 (0.0%) |
| Accommodation & Food Services | 28 (35.0%) | 52 (65.0%) |
| Public Administration | 89 (68.5%) | 41 (31.5%) |
| Total | 1,227 (59.2%) | 847 (40.8%) |
Education in Grayson
School Enrollment in Grayson
The most common levels of schooling among the 1,284 students in Grayson are middle school (487 | 37.9%), high school (312 | 24.3%), and college / undergraduate (251 | 19.6%).
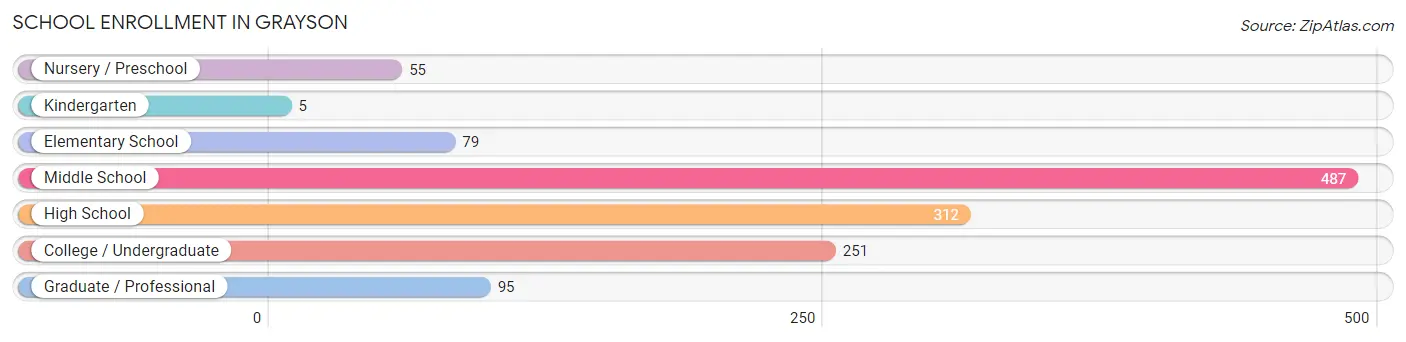
| School Level | # Students | % Students |
| Nursery / Preschool | 55 | 4.3% |
| Kindergarten | 5 | 0.4% |
| Elementary School | 79 | 6.1% |
| Middle School | 487 | 37.9% |
| High School | 312 | 24.3% |
| College / Undergraduate | 251 | 19.6% |
| Graduate / Professional | 95 | 7.4% |
| Total | 1,284 | 100.0% |
School Enrollment by Age by Funding Source in Grayson
Out of a total of 1,284 students who are enrolled in schools in Grayson, 212 (16.5%) attend a private institution, while the remaining 1,072 (83.5%) are enrolled in public schools. The age group of 3 to 4 year olds has the highest likelihood of being enrolled in private schools, with 29 (100.0% in the age bracket) enrolled. Conversely, the age group of 10 to 14 year olds has the lowest likelihood of being enrolled in a private school, with 489 (100.0% in the age bracket) attending a public institution.
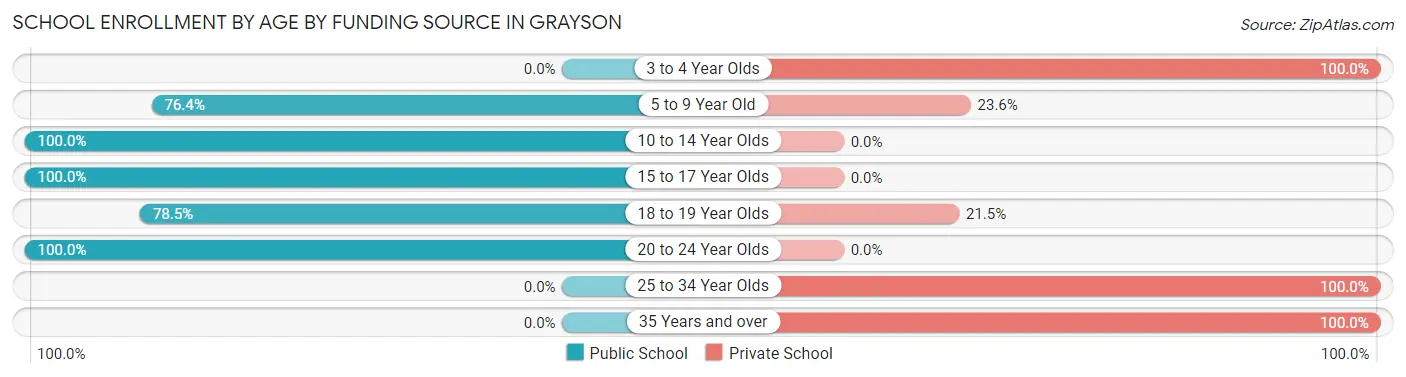
| Age Bracket | Public School | Private School |
| 3 to 4 Year Olds | 0 (0.0%) | 29 (100.0%) |
| 5 to 9 Year Old | 84 (76.4%) | 26 (23.6%) |
| 10 to 14 Year Olds | 489 (100.0%) | 0 (0.0%) |
| 15 to 17 Year Olds | 246 (100.0%) | 0 (0.0%) |
| 18 to 19 Year Olds | 190 (78.5%) | 52 (21.5%) |
| 20 to 24 Year Olds | 63 (100.0%) | 0 (0.0%) |
| 25 to 34 Year Olds | 0 (0.0%) | 10 (100.0%) |
| 35 Years and over | 0 (0.0%) | 95 (100.0%) |
| Total | 1,072 (83.5%) | 212 (16.5%) |
Educational Attainment by Field of Study in Grayson
Education (270 | 22.0%), science & technology (245 | 19.9%), business (167 | 13.6%), computers & mathematics (149 | 12.1%), and engineering (110 | 8.9%) are the most common fields of study among 1,229 individuals in Grayson who have obtained a bachelor's degree or higher.
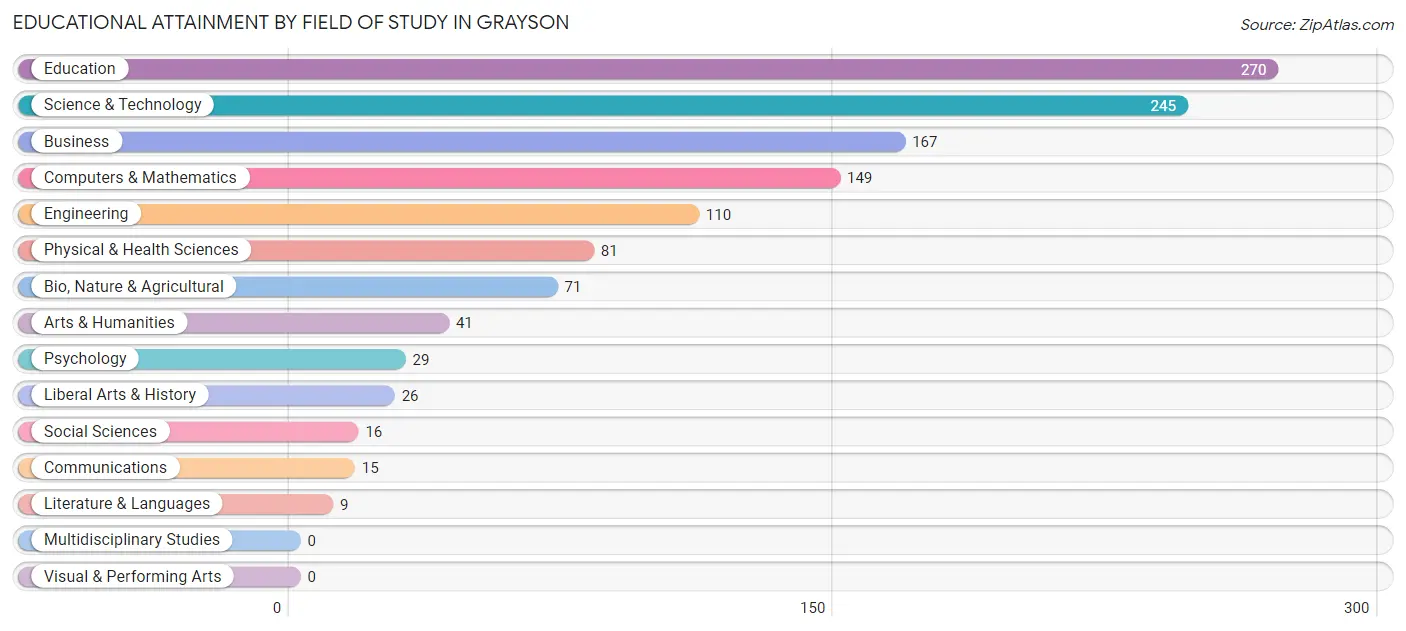
| Field of Study | # Graduates | % Graduates |
| Computers & Mathematics | 149 | 12.1% |
| Bio, Nature & Agricultural | 71 | 5.8% |
| Physical & Health Sciences | 81 | 6.6% |
| Psychology | 29 | 2.4% |
| Social Sciences | 16 | 1.3% |
| Engineering | 110 | 8.9% |
| Multidisciplinary Studies | 0 | 0.0% |
| Science & Technology | 245 | 19.9% |
| Business | 167 | 13.6% |
| Education | 270 | 22.0% |
| Literature & Languages | 9 | 0.7% |
| Liberal Arts & History | 26 | 2.1% |
| Visual & Performing Arts | 0 | 0.0% |
| Communications | 15 | 1.2% |
| Arts & Humanities | 41 | 3.3% |
| Total | 1,229 | 100.0% |
Transportation & Commute in Grayson
Vehicle Availability by Sex in Grayson
The most prevalent vehicle ownership categories in Grayson are males with 3 vehicles (643, accounting for 59.3%) and females with 3 vehicles (399, making up 77.1%).
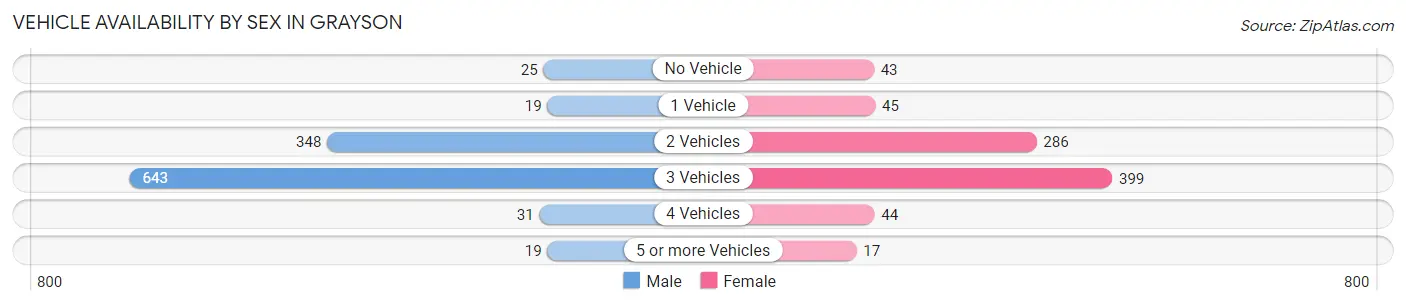
| Vehicles Available | Male | Female |
| No Vehicle | 25 (2.3%) | 43 (5.2%) |
| 1 Vehicle | 19 (1.8%) | 45 (5.4%) |
| 2 Vehicles | 348 (32.1%) | 286 (34.3%) |
| 3 Vehicles | 643 (59.3%) | 399 (47.8%) |
| 4 Vehicles | 31 (2.9%) | 44 (5.3%) |
| 5 or more Vehicles | 19 (1.8%) | 17 (2.0%) |
| Total | 1,085 (100.0%) | 834 (100.0%) |
Commute Time in Grayson
The most frequently occuring commute durations in Grayson are 45 to 59 minutes (457 commuters, 25.1%), 15 to 19 minutes (413 commuters, 22.7%), and 10 to 14 minutes (332 commuters, 18.2%).
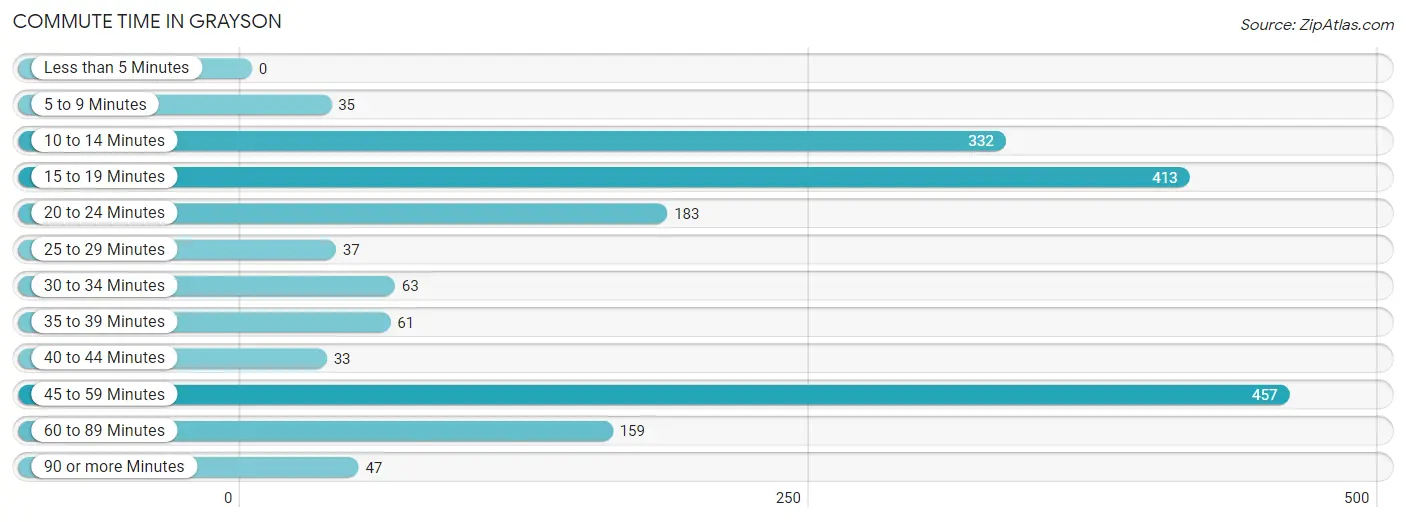
| Commute Time | # Commuters | % Commuters |
| Less than 5 Minutes | 0 | 0.0% |
| 5 to 9 Minutes | 35 | 1.9% |
| 10 to 14 Minutes | 332 | 18.2% |
| 15 to 19 Minutes | 413 | 22.7% |
| 20 to 24 Minutes | 183 | 10.1% |
| 25 to 29 Minutes | 37 | 2.0% |
| 30 to 34 Minutes | 63 | 3.5% |
| 35 to 39 Minutes | 61 | 3.4% |
| 40 to 44 Minutes | 33 | 1.8% |
| 45 to 59 Minutes | 457 | 25.1% |
| 60 to 89 Minutes | 159 | 8.7% |
| 90 or more Minutes | 47 | 2.6% |
Commute Time by Sex in Grayson
The most common commute times in Grayson are 45 to 59 minutes (357 commuters, 34.9%) for males and 10 to 14 minutes (276 commuters, 34.6%) for females.
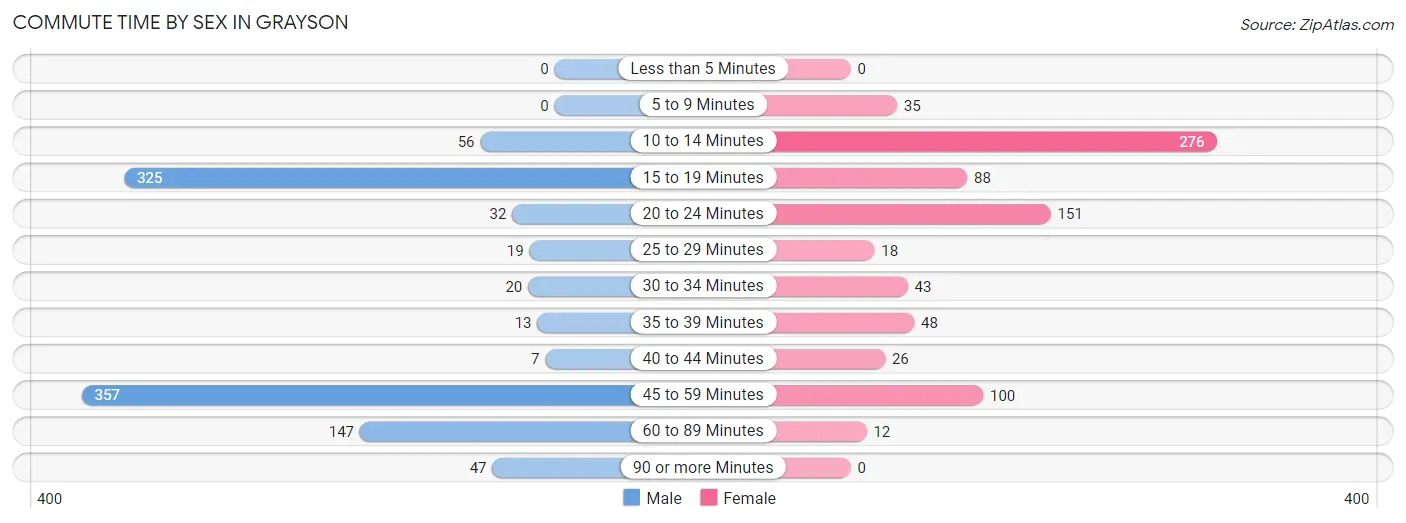
| Commute Time | Male | Female |
| Less than 5 Minutes | 0 (0.0%) | 0 (0.0%) |
| 5 to 9 Minutes | 0 (0.0%) | 35 (4.4%) |
| 10 to 14 Minutes | 56 (5.5%) | 276 (34.6%) |
| 15 to 19 Minutes | 325 (31.8%) | 88 (11.0%) |
| 20 to 24 Minutes | 32 (3.1%) | 151 (19.0%) |
| 25 to 29 Minutes | 19 (1.9%) | 18 (2.3%) |
| 30 to 34 Minutes | 20 (2.0%) | 43 (5.4%) |
| 35 to 39 Minutes | 13 (1.3%) | 48 (6.0%) |
| 40 to 44 Minutes | 7 (0.7%) | 26 (3.3%) |
| 45 to 59 Minutes | 357 (34.9%) | 100 (12.6%) |
| 60 to 89 Minutes | 147 (14.4%) | 12 (1.5%) |
| 90 or more Minutes | 47 (4.6%) | 0 (0.0%) |
Time of Departure to Work by Sex in Grayson
The most frequent times of departure to work in Grayson are 6:00 AM to 6:29 AM (538, 52.6%) for males and 7:00 AM to 7:29 AM (391, 49.1%) for females.
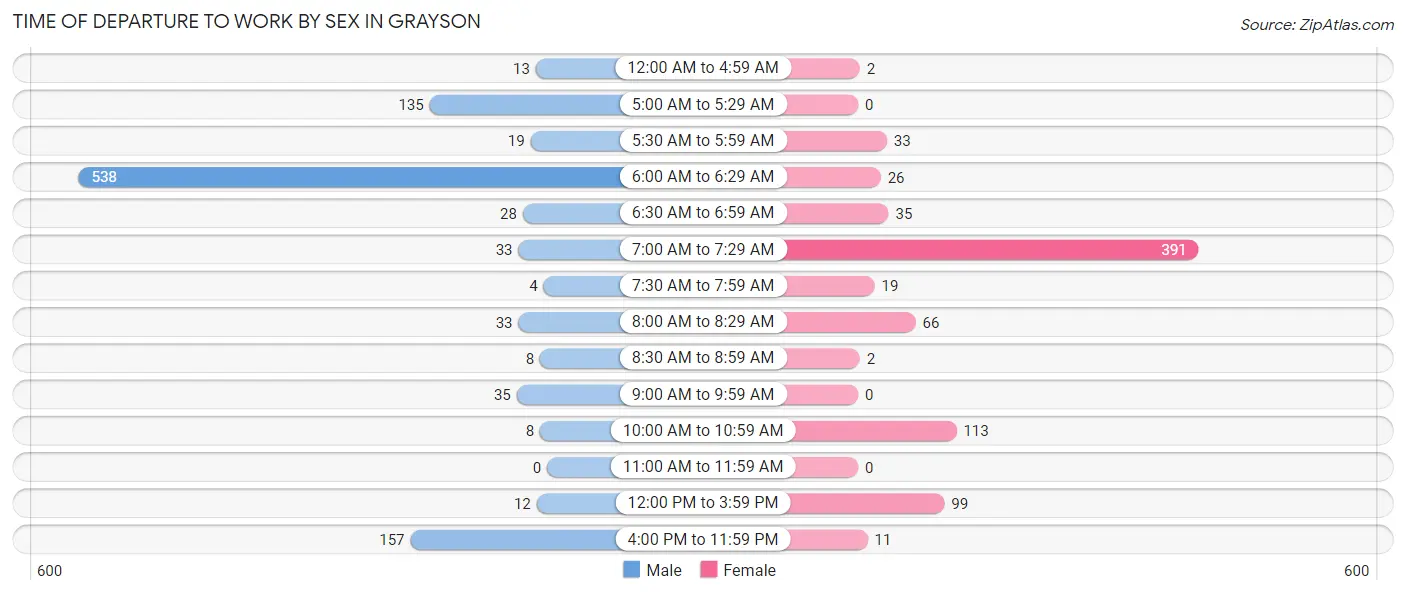
| Time of Departure | Male | Female |
| 12:00 AM to 4:59 AM | 13 (1.3%) | 2 (0.3%) |
| 5:00 AM to 5:29 AM | 135 (13.2%) | 0 (0.0%) |
| 5:30 AM to 5:59 AM | 19 (1.9%) | 33 (4.1%) |
| 6:00 AM to 6:29 AM | 538 (52.6%) | 26 (3.3%) |
| 6:30 AM to 6:59 AM | 28 (2.7%) | 35 (4.4%) |
| 7:00 AM to 7:29 AM | 33 (3.2%) | 391 (49.1%) |
| 7:30 AM to 7:59 AM | 4 (0.4%) | 19 (2.4%) |
| 8:00 AM to 8:29 AM | 33 (3.2%) | 66 (8.3%) |
| 8:30 AM to 8:59 AM | 8 (0.8%) | 2 (0.3%) |
| 9:00 AM to 9:59 AM | 35 (3.4%) | 0 (0.0%) |
| 10:00 AM to 10:59 AM | 8 (0.8%) | 113 (14.2%) |
| 11:00 AM to 11:59 AM | 0 (0.0%) | 0 (0.0%) |
| 12:00 PM to 3:59 PM | 12 (1.2%) | 99 (12.4%) |
| 4:00 PM to 11:59 PM | 157 (15.3%) | 11 (1.4%) |
| Total | 1,023 (100.0%) | 797 (100.0%) |
Housing Occupancy in Grayson
Occupancy by Ownership in Grayson
Of the total 1,209 dwellings in Grayson, owner-occupied units account for 1,138 (94.1%), while renter-occupied units make up 71 (5.9%).
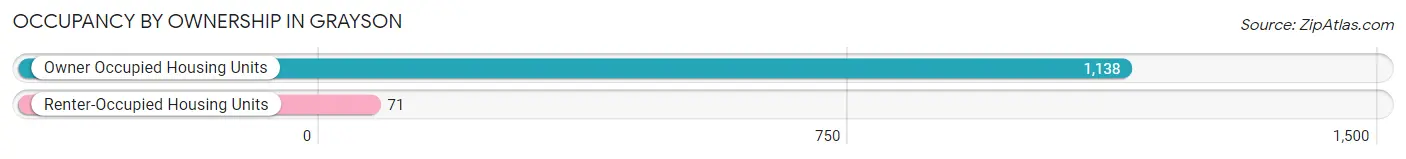
| Occupancy | # Housing Units | % Housing Units |
| Owner Occupied Housing Units | 1,138 | 94.1% |
| Renter-Occupied Housing Units | 71 | 5.9% |
| Total Occupied Housing Units | 1,209 | 100.0% |
Occupancy by Household Size in Grayson
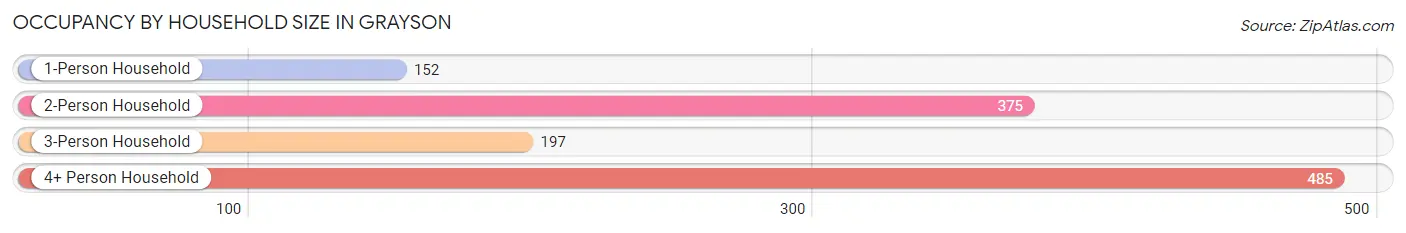
| Household Size | # Housing Units | % Housing Units |
| 1-Person Household | 152 | 12.6% |
| 2-Person Household | 375 | 31.0% |
| 3-Person Household | 197 | 16.3% |
| 4+ Person Household | 485 | 40.1% |
| Total Housing Units | 1,209 | 100.0% |
Occupancy by Ownership by Household Size in Grayson
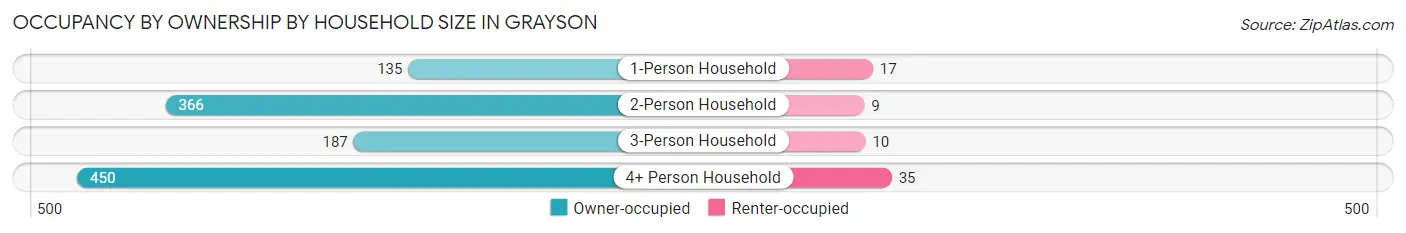
| Household Size | Owner-occupied | Renter-occupied |
| 1-Person Household | 135 (88.8%) | 17 (11.2%) |
| 2-Person Household | 366 (97.6%) | 9 (2.4%) |
| 3-Person Household | 187 (94.9%) | 10 (5.1%) |
| 4+ Person Household | 450 (92.8%) | 35 (7.2%) |
| Total Housing Units | 1,138 (94.1%) | 71 (5.9%) |
Occupancy by Educational Attainment in Grayson
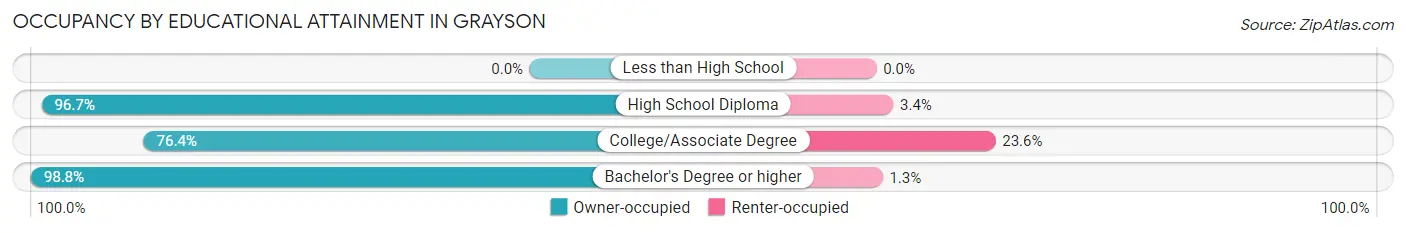
| Household Size | Owner-occupied | Renter-occupied |
| Less than High School | 0 (0.0%) | 0 (0.0%) |
| High School Diploma | 173 (96.7%) | 6 (3.4%) |
| College/Associate Degree | 178 (76.4%) | 55 (23.6%) |
| Bachelor's Degree or higher | 787 (98.8%) | 10 (1.3%) |
Occupancy by Age of Householder in Grayson
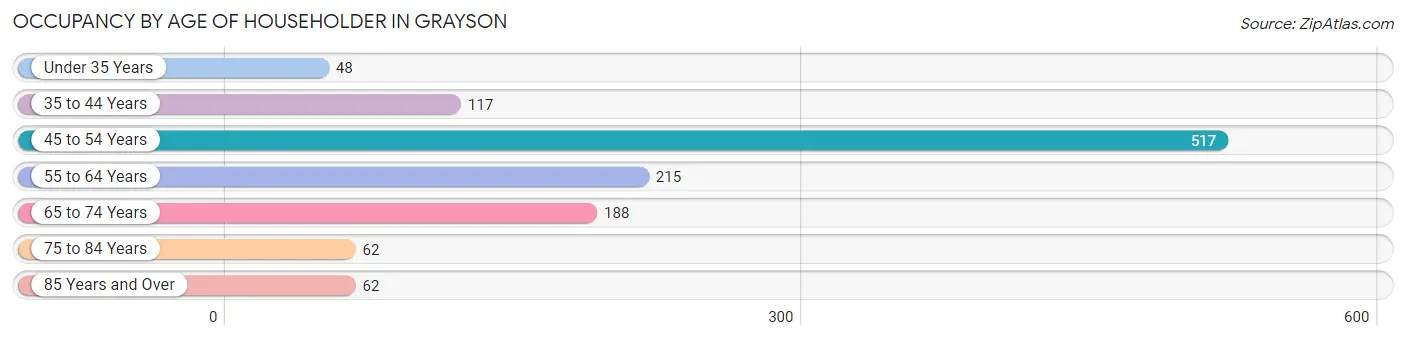
| Age Bracket | # Households | % Households |
| Under 35 Years | 48 | 4.0% |
| 35 to 44 Years | 117 | 9.7% |
| 45 to 54 Years | 517 | 42.8% |
| 55 to 64 Years | 215 | 17.8% |
| 65 to 74 Years | 188 | 15.5% |
| 75 to 84 Years | 62 | 5.1% |
| 85 Years and Over | 62 | 5.1% |
| Total | 1,209 | 100.0% |
Housing Finances in Grayson
Median Income by Occupancy in Grayson
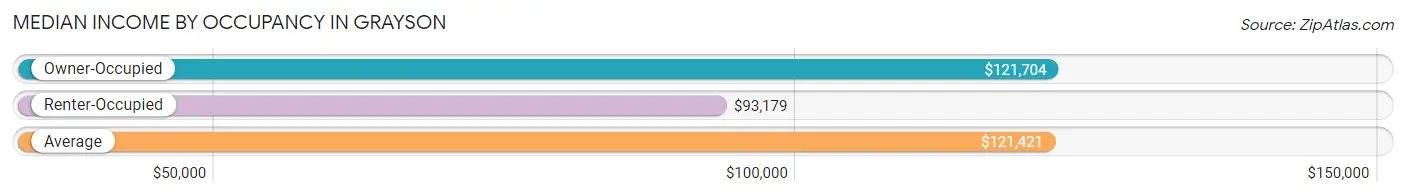
| Occupancy Type | # Households | Median Income |
| Owner-Occupied | 1,138 (94.1%) | $121,704 |
| Renter-Occupied | 71 (5.9%) | $93,179 |
| Average | 1,209 (100.0%) | $121,421 |
Occupancy by Householder Income Bracket in Grayson
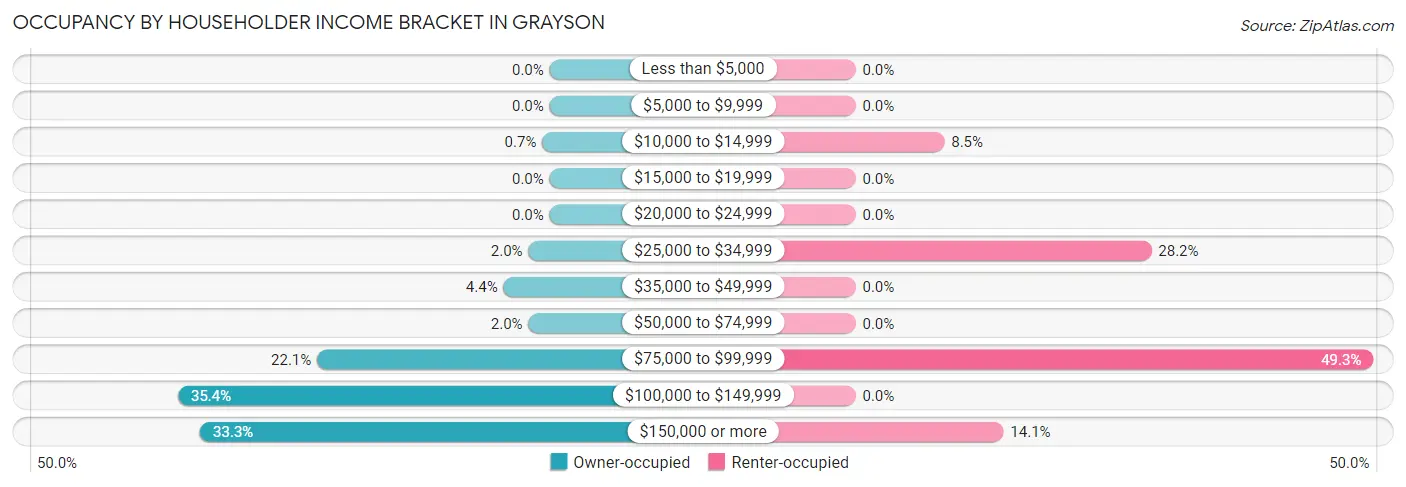
| Income Bracket | Owner-occupied | Renter-occupied |
| Less than $5,000 | 0 (0.0%) | 0 (0.0%) |
| $5,000 to $9,999 | 0 (0.0%) | 0 (0.0%) |
| $10,000 to $14,999 | 8 (0.7%) | 6 (8.5%) |
| $15,000 to $19,999 | 0 (0.0%) | 0 (0.0%) |
| $20,000 to $24,999 | 0 (0.0%) | 0 (0.0%) |
| $25,000 to $34,999 | 23 (2.0%) | 20 (28.2%) |
| $35,000 to $49,999 | 50 (4.4%) | 0 (0.0%) |
| $50,000 to $74,999 | 23 (2.0%) | 0 (0.0%) |
| $75,000 to $99,999 | 252 (22.1%) | 35 (49.3%) |
| $100,000 to $149,999 | 403 (35.4%) | 0 (0.0%) |
| $150,000 or more | 379 (33.3%) | 10 (14.1%) |
| Total | 1,138 (100.0%) | 71 (100.0%) |
Monthly Housing Cost Tiers in Grayson
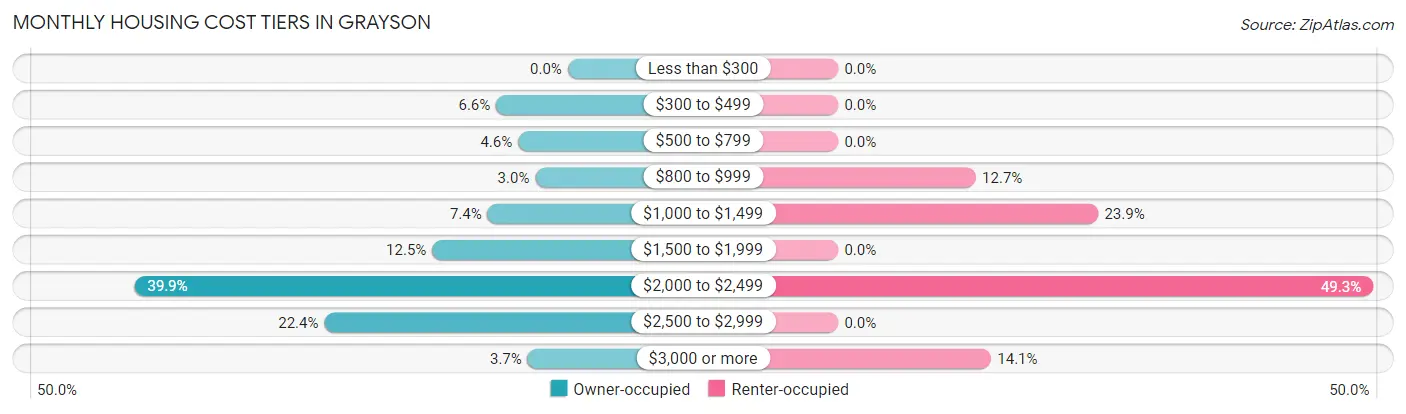
| Monthly Cost | Owner-occupied | Renter-occupied |
| Less than $300 | 0 (0.0%) | 0 (0.0%) |
| $300 to $499 | 75 (6.6%) | 0 (0.0%) |
| $500 to $799 | 52 (4.6%) | 0 (0.0%) |
| $800 to $999 | 34 (3.0%) | 9 (12.7%) |
| $1,000 to $1,499 | 84 (7.4%) | 17 (23.9%) |
| $1,500 to $1,999 | 142 (12.5%) | 0 (0.0%) |
| $2,000 to $2,499 | 454 (39.9%) | 35 (49.3%) |
| $2,500 to $2,999 | 255 (22.4%) | 0 (0.0%) |
| $3,000 or more | 42 (3.7%) | 10 (14.1%) |
| Total | 1,138 (100.0%) | 71 (100.0%) |
Physical Housing Characteristics in Grayson
Housing Structures in Grayson
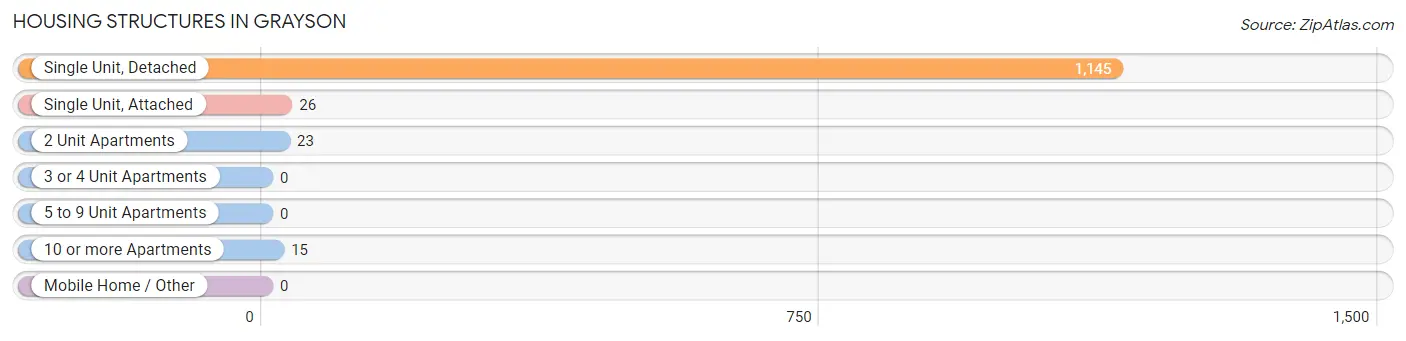
| Structure Type | # Housing Units | % Housing Units |
| Single Unit, Detached | 1,145 | 94.7% |
| Single Unit, Attached | 26 | 2.1% |
| 2 Unit Apartments | 23 | 1.9% |
| 3 or 4 Unit Apartments | 0 | 0.0% |
| 5 to 9 Unit Apartments | 0 | 0.0% |
| 10 or more Apartments | 15 | 1.2% |
| Mobile Home / Other | 0 | 0.0% |
| Total | 1,209 | 100.0% |
Housing Structures by Occupancy in Grayson
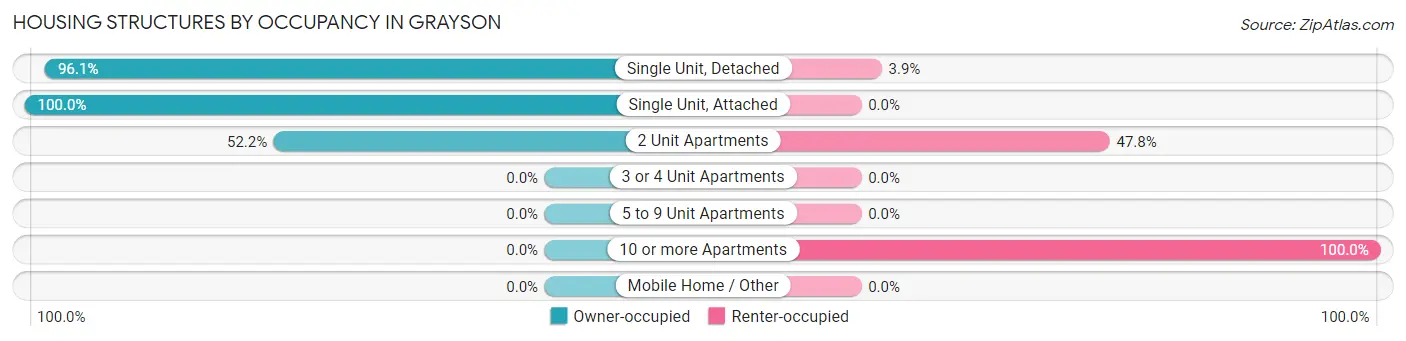
| Structure Type | Owner-occupied | Renter-occupied |
| Single Unit, Detached | 1,100 (96.1%) | 45 (3.9%) |
| Single Unit, Attached | 26 (100.0%) | 0 (0.0%) |
| 2 Unit Apartments | 12 (52.2%) | 11 (47.8%) |
| 3 or 4 Unit Apartments | 0 (0.0%) | 0 (0.0%) |
| 5 to 9 Unit Apartments | 0 (0.0%) | 0 (0.0%) |
| 10 or more Apartments | 0 (0.0%) | 15 (100.0%) |
| Mobile Home / Other | 0 (0.0%) | 0 (0.0%) |
| Total | 1,138 (94.1%) | 71 (5.9%) |
Housing Structures by Number of Rooms in Grayson
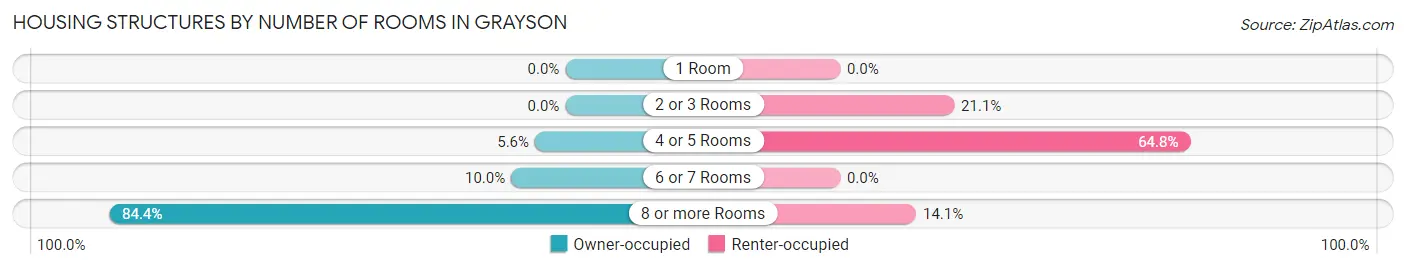
| Number of Rooms | Owner-occupied | Renter-occupied |
| 1 Room | 0 (0.0%) | 0 (0.0%) |
| 2 or 3 Rooms | 0 (0.0%) | 15 (21.1%) |
| 4 or 5 Rooms | 64 (5.6%) | 46 (64.8%) |
| 6 or 7 Rooms | 114 (10.0%) | 0 (0.0%) |
| 8 or more Rooms | 960 (84.4%) | 10 (14.1%) |
| Total | 1,138 (100.0%) | 71 (100.0%) |
Housing Structure by Heating Type in Grayson
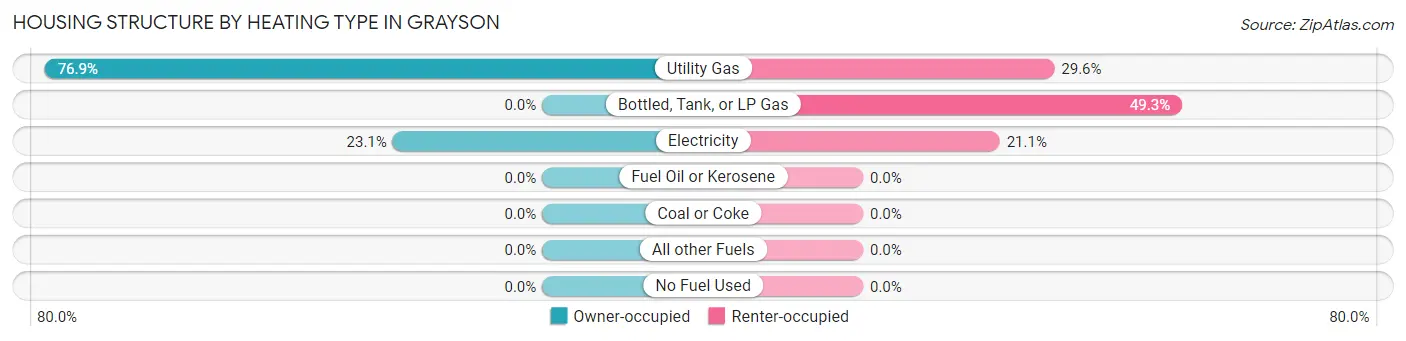
| Heating Type | Owner-occupied | Renter-occupied |
| Utility Gas | 875 (76.9%) | 21 (29.6%) |
| Bottled, Tank, or LP Gas | 0 (0.0%) | 35 (49.3%) |
| Electricity | 263 (23.1%) | 15 (21.1%) |
| Fuel Oil or Kerosene | 0 (0.0%) | 0 (0.0%) |
| Coal or Coke | 0 (0.0%) | 0 (0.0%) |
| All other Fuels | 0 (0.0%) | 0 (0.0%) |
| No Fuel Used | 0 (0.0%) | 0 (0.0%) |
| Total | 1,138 (100.0%) | 71 (100.0%) |
Household Vehicle Usage in Grayson
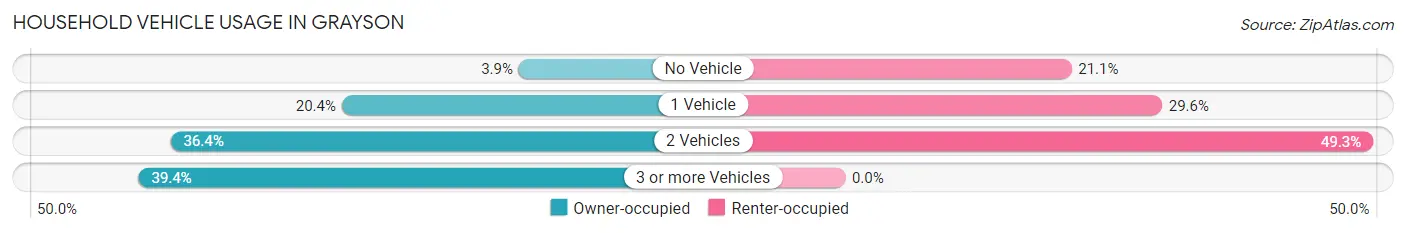
| Vehicles per Household | Owner-occupied | Renter-occupied |
| No Vehicle | 44 (3.9%) | 15 (21.1%) |
| 1 Vehicle | 232 (20.4%) | 21 (29.6%) |
| 2 Vehicles | 414 (36.4%) | 35 (49.3%) |
| 3 or more Vehicles | 448 (39.4%) | 0 (0.0%) |
| Total | 1,138 (100.0%) | 71 (100.0%) |
Real Estate & Mortgages in Grayson
Real Estate and Mortgage Overview in Grayson
| Characteristic | Without Mortgage | With Mortgage |
| Housing Units | 143 | 995 |
| Median Property Value | $382,700 | $398,200 |
| Median Household Income | $91,550 | $362 |
| Monthly Housing Costs | $633 | $42 |
| Real Estate Taxes | - | - |
Property Value by Mortgage Status in Grayson
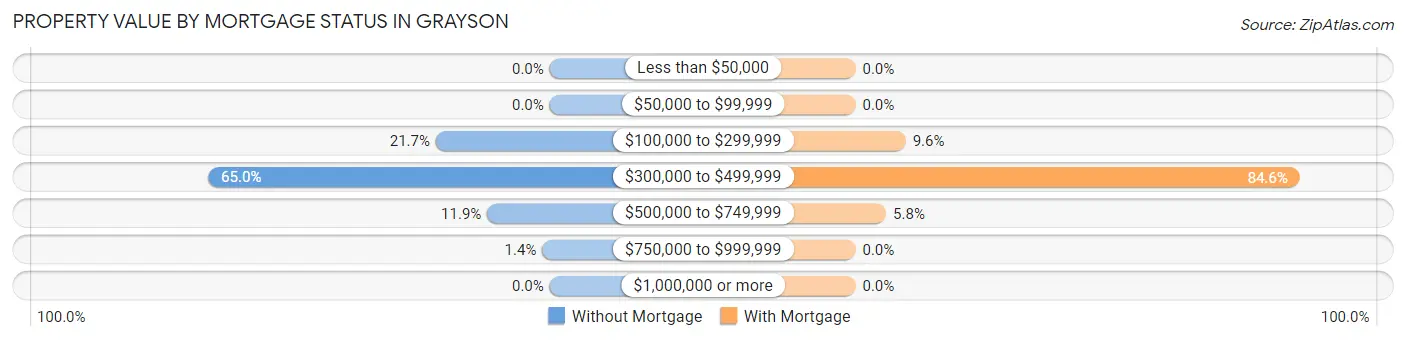
| Property Value | Without Mortgage | With Mortgage |
| Less than $50,000 | 0 (0.0%) | 0 (0.0%) |
| $50,000 to $99,999 | 0 (0.0%) | 0 (0.0%) |
| $100,000 to $299,999 | 31 (21.7%) | 95 (9.6%) |
| $300,000 to $499,999 | 93 (65.0%) | 842 (84.6%) |
| $500,000 to $749,999 | 17 (11.9%) | 58 (5.8%) |
| $750,000 to $999,999 | 2 (1.4%) | 0 (0.0%) |
| $1,000,000 or more | 0 (0.0%) | 0 (0.0%) |
| Total | 143 (100.0%) | 995 (100.0%) |
Household Income by Mortgage Status in Grayson
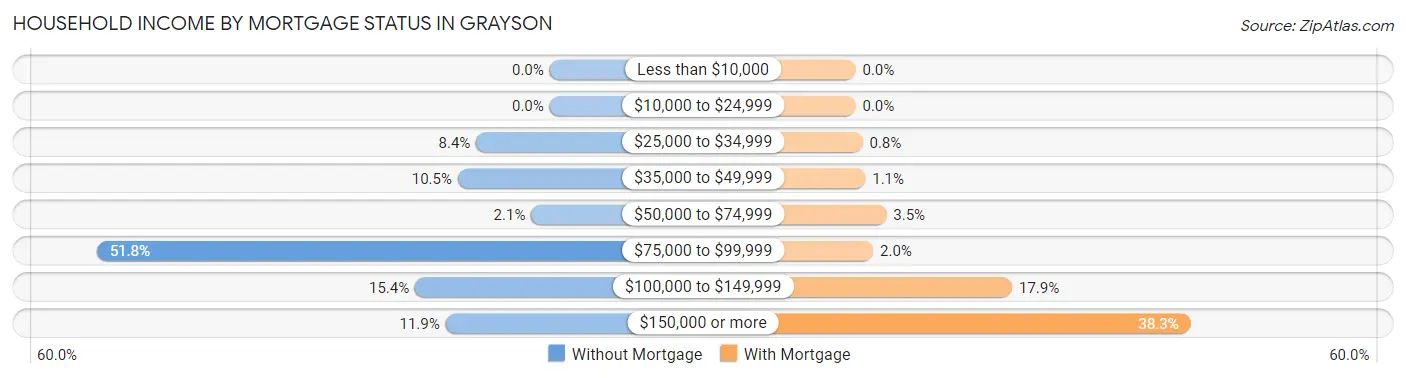
| Household Income | Without Mortgage | With Mortgage |
| Less than $10,000 | 0 (0.0%) | 0 (0.0%) |
| $10,000 to $24,999 | 0 (0.0%) | 0 (0.0%) |
| $25,000 to $34,999 | 12 (8.4%) | 8 (0.8%) |
| $35,000 to $49,999 | 15 (10.5%) | 11 (1.1%) |
| $50,000 to $74,999 | 3 (2.1%) | 35 (3.5%) |
| $75,000 to $99,999 | 74 (51.7%) | 20 (2.0%) |
| $100,000 to $149,999 | 22 (15.4%) | 178 (17.9%) |
| $150,000 or more | 17 (11.9%) | 381 (38.3%) |
| Total | 143 (100.0%) | 995 (100.0%) |
Property Value to Household Income Ratio in Grayson
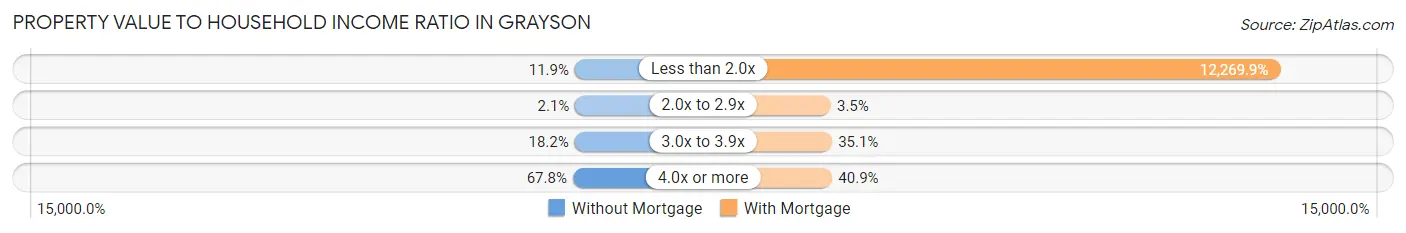
| Value-to-Income Ratio | Without Mortgage | With Mortgage |
| Less than 2.0x | 17 (11.9%) | 122,085 (12,269.8%) |
| 2.0x to 2.9x | 3 (2.1%) | 35 (3.5%) |
| 3.0x to 3.9x | 26 (18.2%) | 349 (35.1%) |
| 4.0x or more | 97 (67.8%) | 407 (40.9%) |
| Total | 143 (100.0%) | 995 (100.0%) |
Real Estate Taxes by Mortgage Status in Grayson
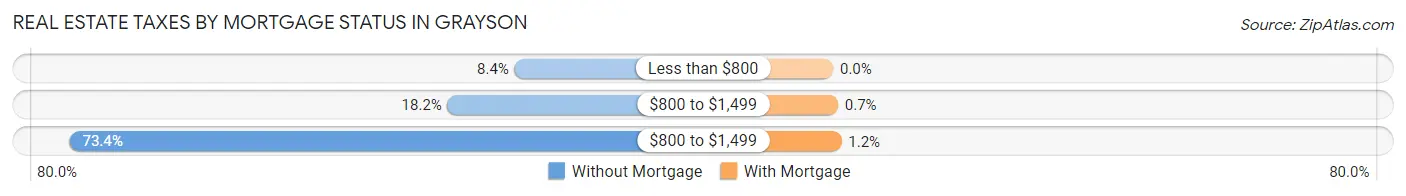
| Property Taxes | Without Mortgage | With Mortgage |
| Less than $800 | 12 (8.4%) | 0 (0.0%) |
| $800 to $1,499 | 26 (18.2%) | 7 (0.7%) |
| $800 to $1,499 | 105 (73.4%) | 12 (1.2%) |
| Total | 143 (100.0%) | 995 (100.0%) |
Health & Disability in Grayson
Health Insurance Coverage by Age in Grayson
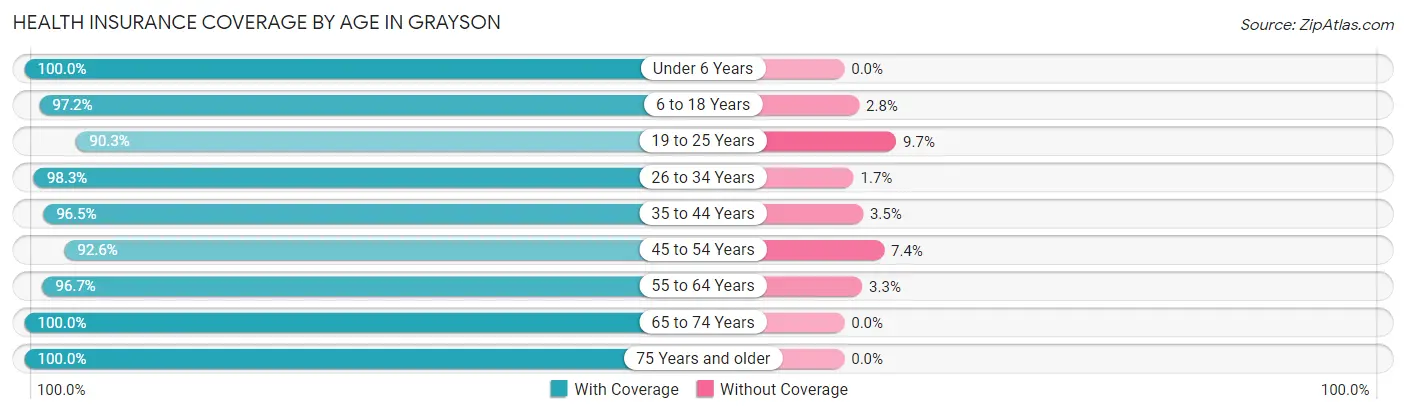
| Age Bracket | With Coverage | Without Coverage |
| Under 6 Years | 682 (100.0%) | 0 (0.0%) |
| 6 to 18 Years | 881 (97.2%) | 25 (2.8%) |
| 19 to 25 Years | 271 (90.3%) | 29 (9.7%) |
| 26 to 34 Years | 565 (98.3%) | 10 (1.7%) |
| 35 to 44 Years | 222 (96.5%) | 8 (3.5%) |
| 45 to 54 Years | 773 (92.6%) | 62 (7.4%) |
| 55 to 64 Years | 523 (96.7%) | 18 (3.3%) |
| 65 to 74 Years | 315 (100.0%) | 0 (0.0%) |
| 75 Years and older | 188 (100.0%) | 0 (0.0%) |
| Total | 4,420 (96.7%) | 152 (3.3%) |
Health Insurance Coverage by Citizenship Status in Grayson
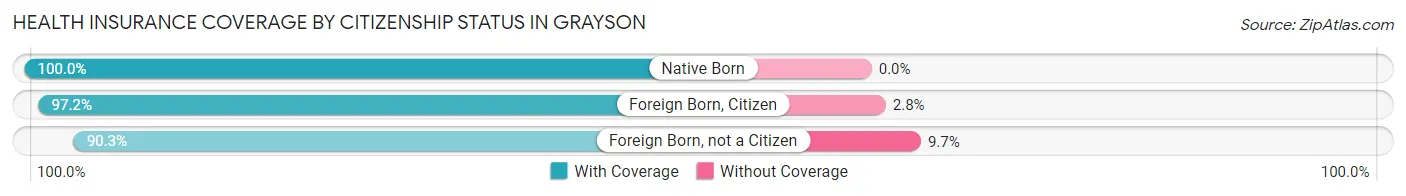
| Citizenship Status | With Coverage | Without Coverage |
| Native Born | 682 (100.0%) | 0 (0.0%) |
| Foreign Born, Citizen | 881 (97.2%) | 25 (2.8%) |
| Foreign Born, not a Citizen | 271 (90.3%) | 29 (9.7%) |
Health Insurance Coverage by Household Income in Grayson
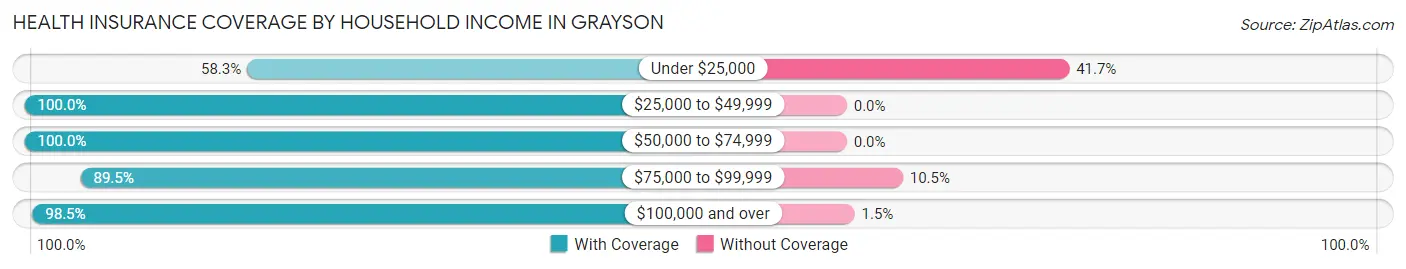
| Household Income | With Coverage | Without Coverage |
| Under $25,000 | 14 (58.3%) | 10 (41.7%) |
| $25,000 to $49,999 | 149 (100.0%) | 0 (0.0%) |
| $50,000 to $74,999 | 54 (100.0%) | 0 (0.0%) |
| $75,000 to $99,999 | 700 (89.5%) | 82 (10.5%) |
| $100,000 and over | 3,503 (98.5%) | 52 (1.5%) |
Public vs Private Health Insurance Coverage by Age in Grayson
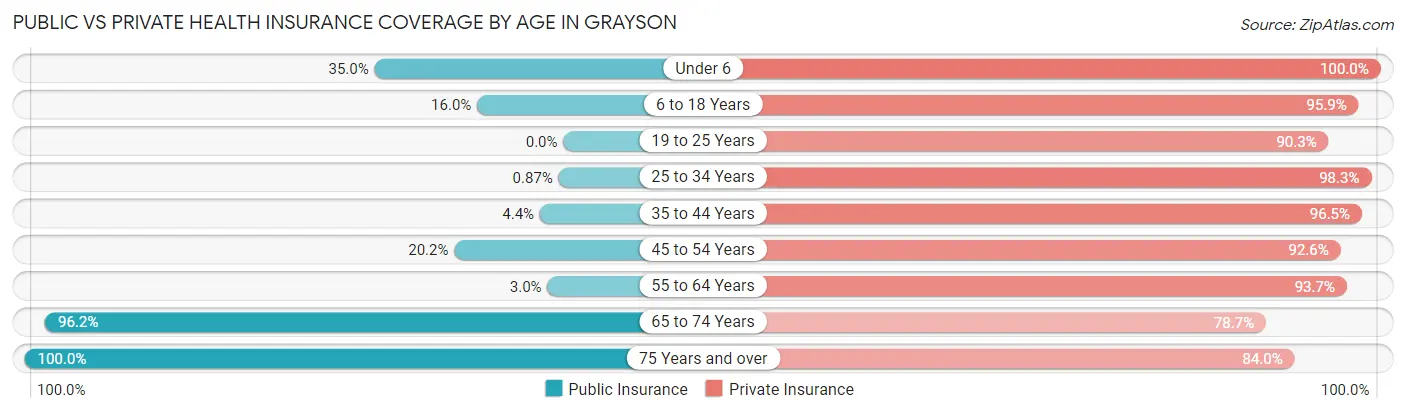
| Age Bracket | Public Insurance | Private Insurance |
| Under 6 | 239 (35.0%) | 682 (100.0%) |
| 6 to 18 Years | 145 (16.0%) | 869 (95.9%) |
| 19 to 25 Years | 0 (0.0%) | 271 (90.3%) |
| 25 to 34 Years | 5 (0.9%) | 565 (98.3%) |
| 35 to 44 Years | 10 (4.3%) | 222 (96.5%) |
| 45 to 54 Years | 169 (20.2%) | 773 (92.6%) |
| 55 to 64 Years | 16 (3.0%) | 507 (93.7%) |
| 65 to 74 Years | 303 (96.2%) | 248 (78.7%) |
| 75 Years and over | 188 (100.0%) | 158 (84.0%) |
| Total | 1,075 (23.5%) | 4,295 (93.9%) |
Disability Status by Sex by Age in Grayson
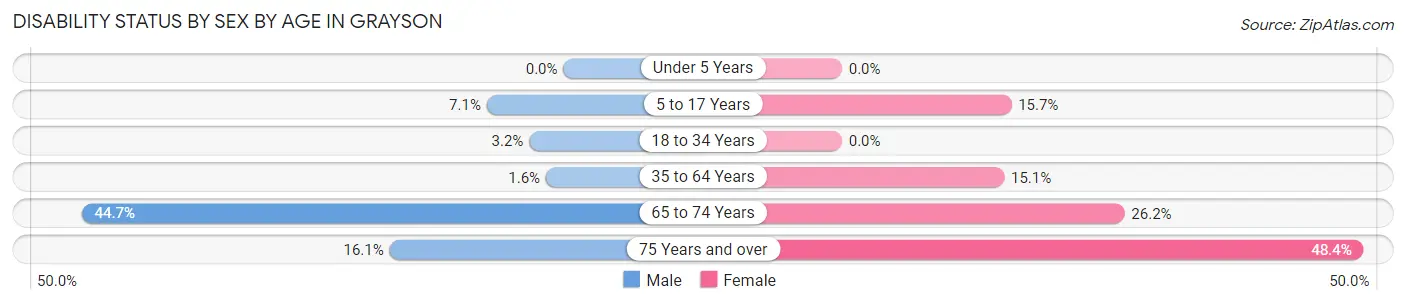
| Age Bracket | Male | Female |
| Under 5 Years | 0 (0.0%) | 0 (0.0%) |
| 5 to 17 Years | 15 (7.1%) | 102 (15.7%) |
| 18 to 34 Years | 16 (3.2%) | 0 (0.0%) |
| 35 to 64 Years | 12 (1.6%) | 130 (15.1%) |
| 65 to 74 Years | 59 (44.7%) | 48 (26.2%) |
| 75 Years and over | 15 (16.1%) | 46 (48.4%) |
Disability Class by Sex by Age in Grayson
Disability Class: Hearing Difficulty
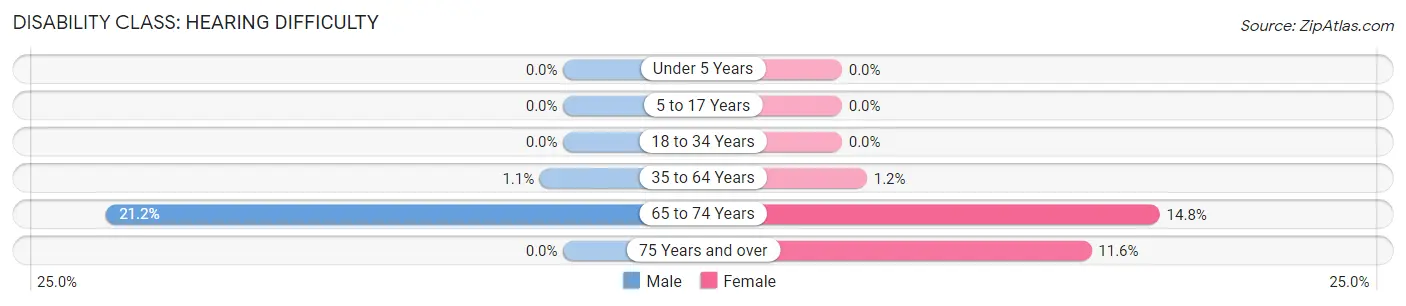
| Age Bracket | Male | Female |
| Under 5 Years | 0 (0.0%) | 0 (0.0%) |
| 5 to 17 Years | 0 (0.0%) | 0 (0.0%) |
| 18 to 34 Years | 0 (0.0%) | 0 (0.0%) |
| 35 to 64 Years | 8 (1.1%) | 10 (1.2%) |
| 65 to 74 Years | 28 (21.2%) | 27 (14.7%) |
| 75 Years and over | 0 (0.0%) | 11 (11.6%) |
Disability Class: Vision Difficulty
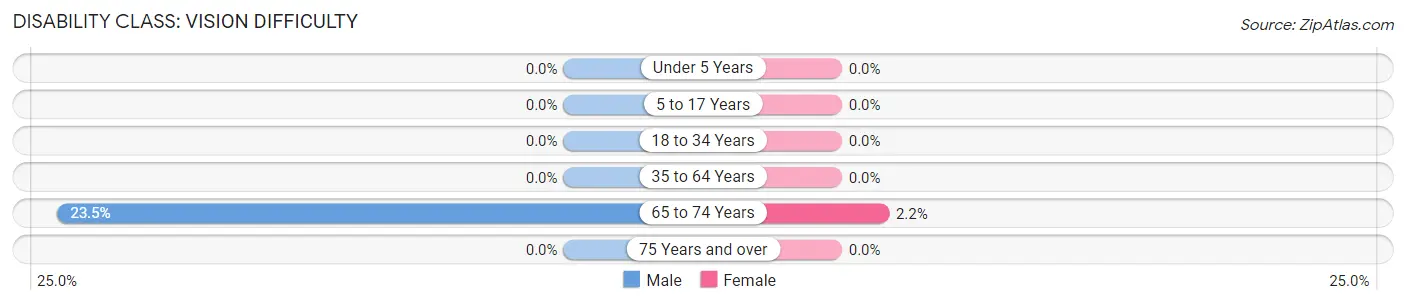
| Age Bracket | Male | Female |
| Under 5 Years | 0 (0.0%) | 0 (0.0%) |
| 5 to 17 Years | 0 (0.0%) | 0 (0.0%) |
| 18 to 34 Years | 0 (0.0%) | 0 (0.0%) |
| 35 to 64 Years | 0 (0.0%) | 0 (0.0%) |
| 65 to 74 Years | 31 (23.5%) | 4 (2.2%) |
| 75 Years and over | 0 (0.0%) | 0 (0.0%) |
Disability Class: Cognitive Difficulty
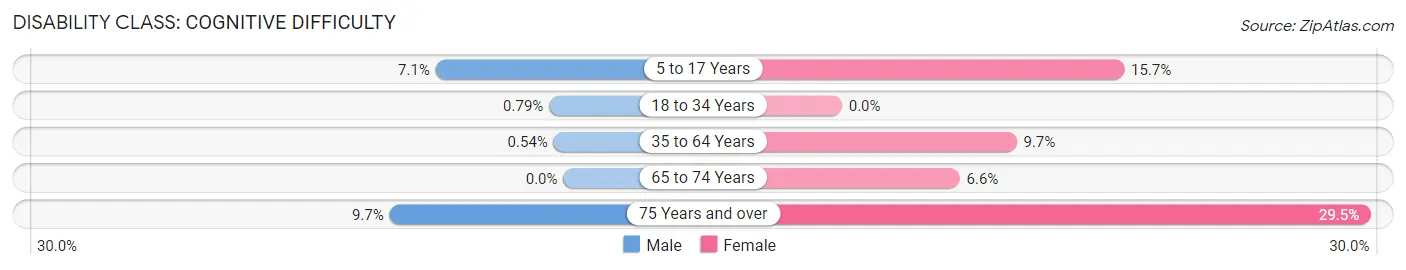
| Age Bracket | Male | Female |
| 5 to 17 Years | 15 (7.1%) | 102 (15.7%) |
| 18 to 34 Years | 4 (0.8%) | 0 (0.0%) |
| 35 to 64 Years | 4 (0.5%) | 84 (9.7%) |
| 65 to 74 Years | 0 (0.0%) | 12 (6.6%) |
| 75 Years and over | 9 (9.7%) | 28 (29.5%) |
Disability Class: Ambulatory Difficulty
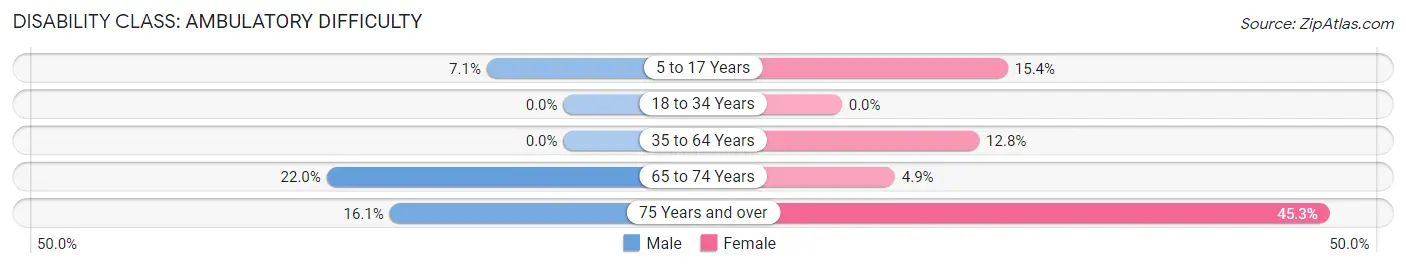
| Age Bracket | Male | Female |
| 5 to 17 Years | 15 (7.1%) | 100 (15.4%) |
| 18 to 34 Years | 0 (0.0%) | 0 (0.0%) |
| 35 to 64 Years | 0 (0.0%) | 110 (12.8%) |
| 65 to 74 Years | 29 (22.0%) | 9 (4.9%) |
| 75 Years and over | 15 (16.1%) | 43 (45.3%) |
Disability Class: Self-Care Difficulty
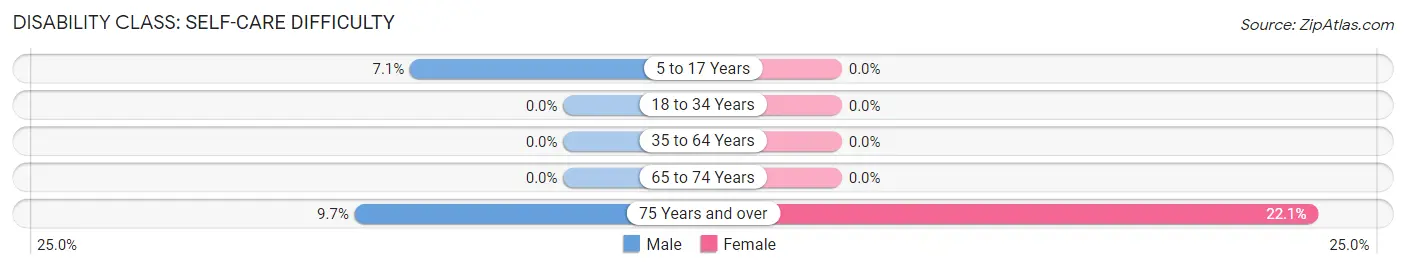
| Age Bracket | Male | Female |
| 5 to 17 Years | 15 (7.1%) | 0 (0.0%) |
| 18 to 34 Years | 0 (0.0%) | 0 (0.0%) |
| 35 to 64 Years | 0 (0.0%) | 0 (0.0%) |
| 65 to 74 Years | 0 (0.0%) | 0 (0.0%) |
| 75 Years and over | 9 (9.7%) | 21 (22.1%) |
Technology Access in Grayson
Computing Device Access in Grayson
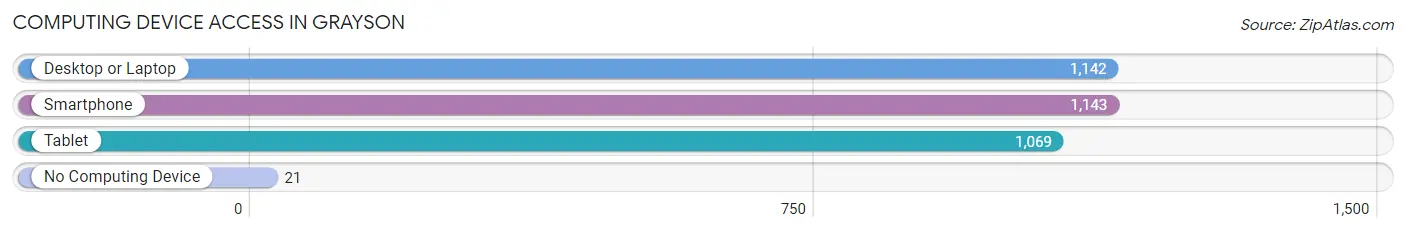
| Device Type | # Households | % Households |
| Desktop or Laptop | 1,142 | 94.5% |
| Smartphone | 1,143 | 94.5% |
| Tablet | 1,069 | 88.4% |
| No Computing Device | 21 | 1.7% |
| Total | 1,209 | 100.0% |
Internet Access in Grayson
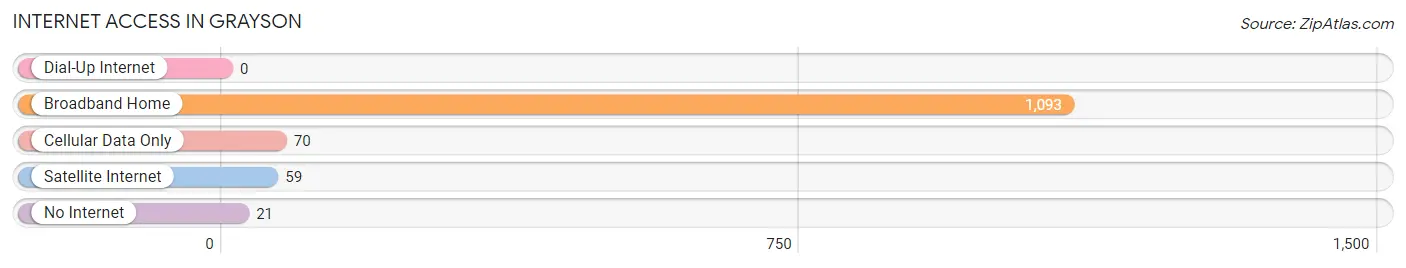
| Internet Type | # Households | % Households |
| Dial-Up Internet | 0 | 0.0% |
| Broadband Home | 1,093 | 90.4% |
| Cellular Data Only | 70 | 5.8% |
| Satellite Internet | 59 | 4.9% |
| No Internet | 21 | 1.7% |
| Total | 1,209 | 100.0% |
Grayson Summary
Grayson, Georgia is a small city located in Gwinnett County, Georgia, United States. It is part of the Atlanta metropolitan area and is located about 30 miles northeast of downtown Atlanta. The city has a population of approximately 3,000 people and is known for its small-town charm and friendly atmosphere.
History
Grayson was founded in 1882 by a group of settlers from the nearby town of Lawrenceville. The town was named after the Grayson family, who were among the first settlers. The town was originally a farming community, but in the early 1900s, the town began to grow and develop. The town was incorporated in 1906 and the first mayor was elected in 1907.
In the early 1900s, Grayson was a thriving agricultural community, with cotton, corn, and tobacco being the main crops. The town also had a number of small businesses, including a general store, a blacksmith shop, and a grist mill.
In the 1950s, the town began to experience a period of growth and development. The town was connected to the rest of the Atlanta metropolitan area by the construction of Interstate 85 in the 1960s. This allowed for easy access to the city and helped to spur further growth.
Geography
Grayson is located in the foothills of the Blue Ridge Mountains in the Piedmont region of Georgia. The city is situated on the banks of the Yellow River, which flows through the city. The city is surrounded by rolling hills and forests, making it a popular destination for outdoor activities such as hiking, camping, and fishing.
The climate in Grayson is mild and humid, with hot summers and mild winters. The average temperature in the summer is around 80 degrees Fahrenheit, while the average temperature in the winter is around 50 degrees Fahrenheit.
Economy
Grayson’s economy is largely based on the service industry, with many businesses providing services to the surrounding area. The city is home to a number of small businesses, including restaurants, retail stores, and professional services. The city is also home to a number of manufacturing companies, including a paper mill and a plastics factory.
The city is also home to a number of educational institutions, including a community college and a technical college. The city is also home to a number of parks and recreational facilities, including a golf course and a public swimming pool.
Demographics
As of the 2010 census, the population of Grayson was 3,039. The racial makeup of the city was 79.3% White, 14.2% African American, 0.3% Native American, 1.2% Asian, 0.1% Pacific Islander, and 4.9% from other races. The median household income in Grayson was $50,945, and the median family income was $60,945.
Grayson is a small city with a friendly atmosphere and a strong sense of community. The city is home to a number of small businesses and educational institutions, making it a great place to live and work. The city is also home to a number of parks and recreational facilities, making it a great place to spend time outdoors.
Common Questions
What is Per Capita Income in Grayson?
Per Capita income in Grayson is $34,085.
What is the Median Family Income in Grayson?
Median Family Income in Grayson is $122,080.
What is the Median Household income in Grayson?
Median Household Income in Grayson is $121,421.
What is Income or Wage Gap in Grayson?
Income or Wage Gap in Grayson is 16.7%.
Women in Grayson earn 83.3 cents for every dollar earned by a man.
What is Inequality or Gini Index in Grayson?
Inequality or Gini Index in Grayson is 0.23.
What is the Total Population of Grayson?
Total Population of Grayson is 4,572.
What is the Total Male Population of Grayson?
Total Male Population of Grayson is 1,972.
What is the Total Female Population of Grayson?
Total Female Population of Grayson is 2,600.
What is the Ratio of Males per 100 Females in Grayson?
There are 75.85 Males per 100 Females in Grayson.
What is the Ratio of Females per 100 Males in Grayson?
There are 131.85 Females per 100 Males in Grayson.
What is the Median Population Age in Grayson?
Median Population Age in Grayson is 31.2 Years.
What is the Average Family Size in Grayson
Average Family Size in Grayson is 4.2 People.
What is the Average Household Size in Grayson
Average Household Size in Grayson is 3.8 People.
How Large is the Labor Force in Grayson?
There are 2,108 People in the Labor Forcein in Grayson.
What is the Percentage of People in the Labor Force in Grayson?
67.9% of People are in the Labor Force in Grayson.
What is the Unemployment Rate in Grayson?
Unemployment Rate in Grayson is 1.6%.