Waihee Waiehu, HI Map & Demographics
Waihee Waiehu Map
Waihee Waiehu Overview
$33,828
PER CAPITA INCOME
$124,535
AVG FAMILY INCOME
$124,601
AVG HOUSEHOLD INCOME
11.2%
WAGE / INCOME GAP [ % ]
88.8¢/ $1
WAGE / INCOME GAP [ $ ]
0.32
INEQUALITY / GINI INDEX
11,029
TOTAL POPULATION
5,737
MALE POPULATION
5,292
FEMALE POPULATION
108.41
MALES / 100 FEMALES
92.24
FEMALES / 100 MALES
39.1
MEDIAN AGE
4.3
AVG FAMILY SIZE
4.2
AVG HOUSEHOLD SIZE
5,340
LABOR FORCE [ PEOPLE ]
62.5%
PERCENT IN LABOR FORCE
3.1%
UNEMPLOYMENT RATE
Income in Waihee Waiehu
Income Overview in Waihee Waiehu
Per Capita Income in Waihee Waiehu is $33,828, while median incomes of families and households are $124,535 and $124,601 respectively.
| Characteristic | Number | Measure |
| Per Capita Income | 11,029 | $33,828 |
| Median Family Income | 2,250 | $124,535 |
| Mean Family Income | 2,250 | $128,109 |
| Median Household Income | 2,641 | $124,601 |
| Mean Household Income | 2,641 | $130,024 |
| Income Deficit | 2,250 | $0 |
| Wage / Income Gap (%) | 11,029 | 11.23% |
| Wage / Income Gap ($) | 11,029 | 88.77¢ per $1 |
| Gini / Inequality Index | 11,029 | 0.32 |
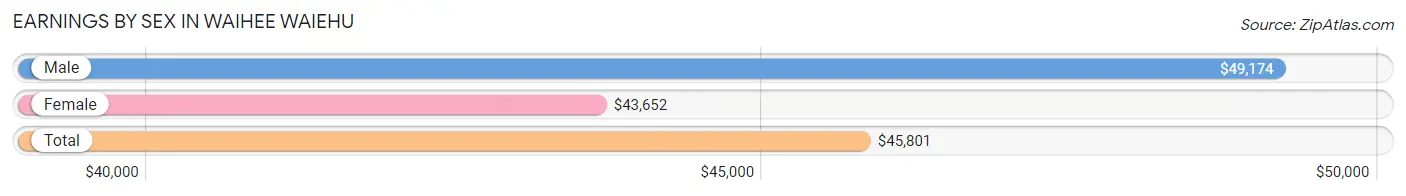
Earnings by Sex in Waihee Waiehu
Average Earnings in Waihee Waiehu are $45,801, $49,174 for men and $43,652 for women, a difference of 11.2%.
| Sex | Number | Average Earnings |
| Male | 3,035 (54.2%) | $49,174 |
| Female | 2,560 (45.8%) | $43,652 |
| Total | 5,595 (100.0%) | $45,801 |
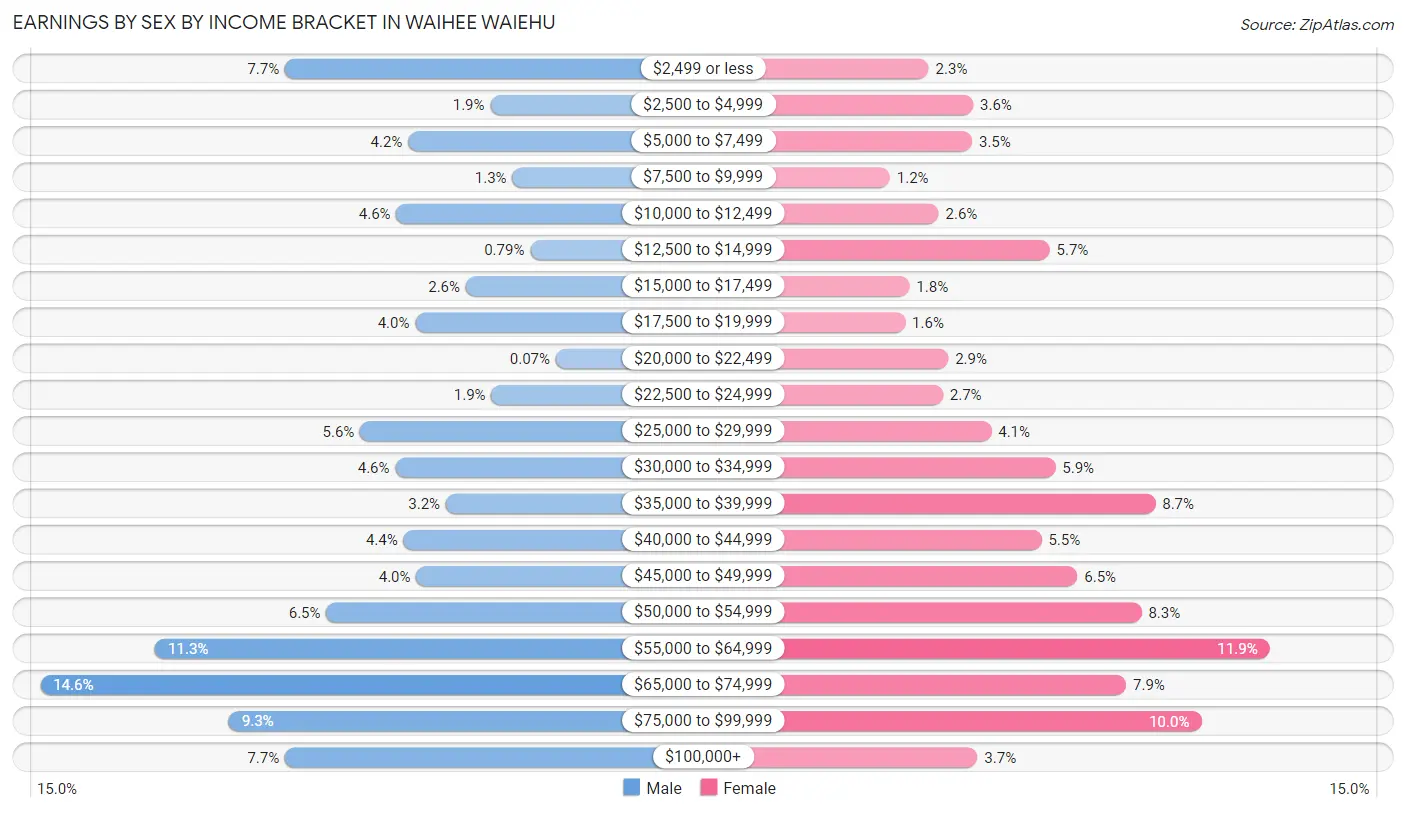
Earnings by Sex by Income Bracket in Waihee Waiehu
The most common earnings brackets in Waihee Waiehu are $65,000 to $74,999 for men (442 | 14.6%) and $55,000 to $64,999 for women (304 | 11.9%).
| Income | Male | Female |
| $2,499 or less | 233 (7.7%) | 59 (2.3%) |
| $2,500 to $4,999 | 58 (1.9%) | 91 (3.5%) |
| $5,000 to $7,499 | 128 (4.2%) | 90 (3.5%) |
| $7,500 to $9,999 | 39 (1.3%) | 31 (1.2%) |
| $10,000 to $12,499 | 138 (4.5%) | 66 (2.6%) |
| $12,500 to $14,999 | 24 (0.8%) | 146 (5.7%) |
| $15,000 to $17,499 | 79 (2.6%) | 45 (1.8%) |
| $17,500 to $19,999 | 122 (4.0%) | 42 (1.6%) |
| $20,000 to $22,499 | 2 (0.1%) | 73 (2.9%) |
| $22,500 to $24,999 | 57 (1.9%) | 69 (2.7%) |
| $25,000 to $29,999 | 169 (5.6%) | 104 (4.1%) |
| $30,000 to $34,999 | 139 (4.6%) | 150 (5.9%) |
| $35,000 to $39,999 | 96 (3.2%) | 222 (8.7%) |
| $40,000 to $44,999 | 132 (4.3%) | 140 (5.5%) |
| $45,000 to $49,999 | 121 (4.0%) | 166 (6.5%) |
| $50,000 to $54,999 | 198 (6.5%) | 212 (8.3%) |
| $55,000 to $64,999 | 344 (11.3%) | 304 (11.9%) |
| $65,000 to $74,999 | 442 (14.6%) | 201 (7.9%) |
| $75,000 to $99,999 | 281 (9.3%) | 255 (10.0%) |
| $100,000+ | 233 (7.7%) | 94 (3.7%) |
| Total | 3,035 (100.0%) | 2,560 (100.0%) |
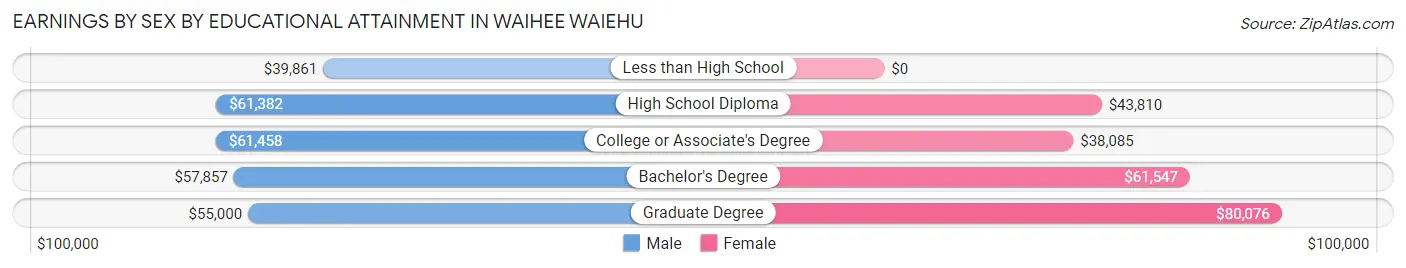
Earnings by Sex by Educational Attainment in Waihee Waiehu
Average earnings in Waihee Waiehu are $57,757 for men and $45,202 for women, a difference of 21.7%. Men with an educational attainment of college or associate's degree enjoy the highest average annual earnings of $61,458, while those with less than high school education earn the least with $39,861. Women with an educational attainment of graduate degree earn the most with the average annual earnings of $80,076, while those with college or associate's degree education have the smallest earnings of $38,085.
| Educational Attainment | Male Income | Female Income |
| Less than High School | $39,861 | $0 |
| High School Diploma | $61,382 | $43,810 |
| College or Associate's Degree | $61,458 | $38,085 |
| Bachelor's Degree | $57,857 | $61,547 |
| Graduate Degree | $55,000 | $80,076 |
| Total | $57,757 | $45,202 |
Family Income in Waihee Waiehu
Family Income Brackets in Waihee Waiehu
According to the Waihee Waiehu family income data, there are 857 families falling into the $100,000 to $149,999 income range, which is the most common income bracket and makes up 38.1% of all families. Conversely, the $15,000 to $24,999 income bracket is the least frequent group with only 27 families (1.2%) belonging to this category.
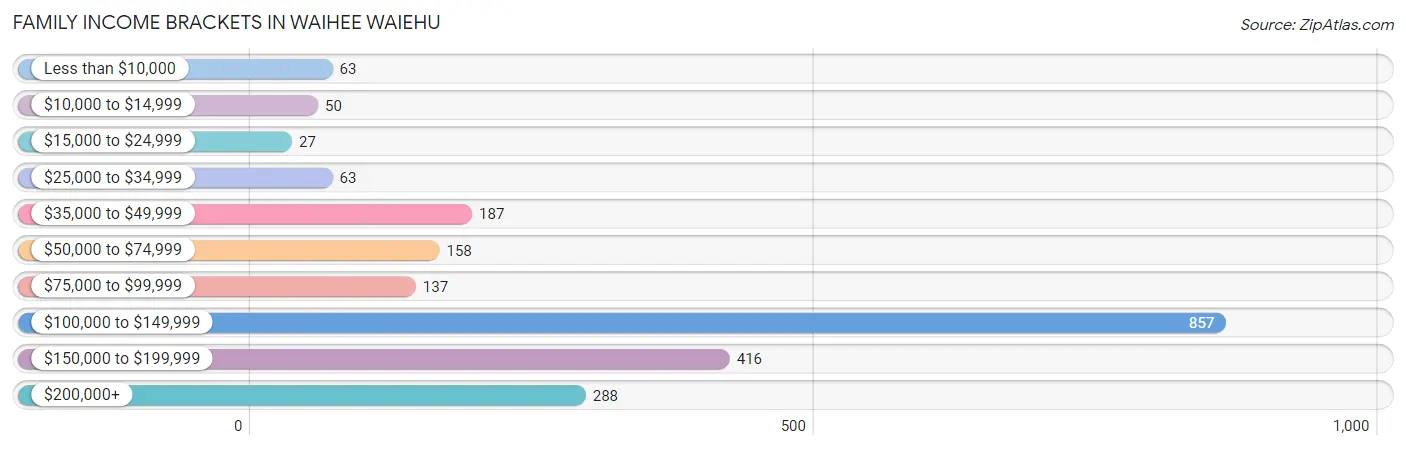
| Income Bracket | # Families | % Families |
| Less than $10,000 | 63 | 2.8% |
| $10,000 to $14,999 | 50 | 2.2% |
| $15,000 to $24,999 | 27 | 1.2% |
| $25,000 to $34,999 | 63 | 2.8% |
| $35,000 to $49,999 | 187 | 8.3% |
| $50,000 to $74,999 | 158 | 7.0% |
| $75,000 to $99,999 | 137 | 6.1% |
| $100,000 to $149,999 | 857 | 38.1% |
| $150,000 to $199,999 | 416 | 18.5% |
| $200,000+ | 288 | 12.8% |
Family Income by Famaliy Size in Waihee Waiehu
6-person families (130 | 5.8%) account for the highest median family income in Waihee Waiehu with $190,081 per family, while 2-person families (692 | 30.8%) have the highest median income of $38,750 per family member.
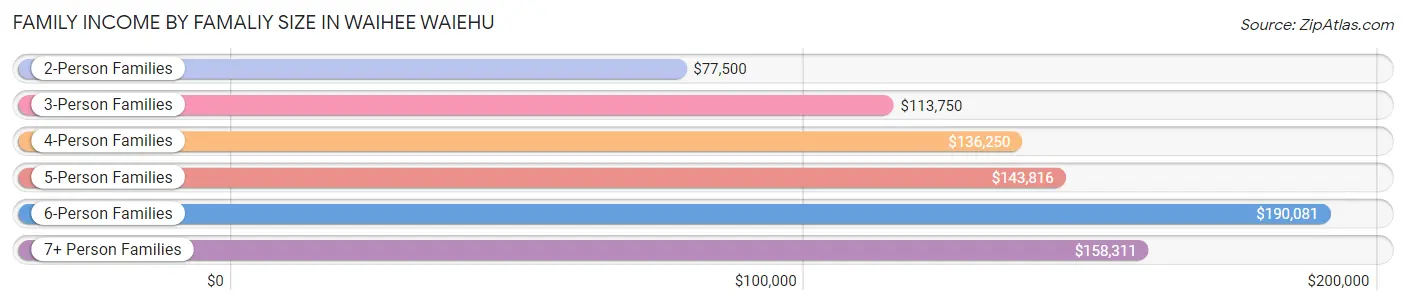
| Income Bracket | # Families | Median Income |
| 2-Person Families | 692 (30.8%) | $77,500 |
| 3-Person Families | 537 (23.9%) | $113,750 |
| 4-Person Families | 259 (11.5%) | $136,250 |
| 5-Person Families | 302 (13.4%) | $143,816 |
| 6-Person Families | 130 (5.8%) | $190,081 |
| 7+ Person Families | 330 (14.7%) | $158,311 |
| Total | 2,250 (100.0%) | $124,535 |
Family Income by Number of Earners in Waihee Waiehu
The median family income in Waihee Waiehu is $124,535, with families comprising 3+ earners (664) having the highest median family income of $159,143, while families with no earners (312) have the lowest median family income of $41,814, accounting for 29.5% and 13.9% of families, respectively.
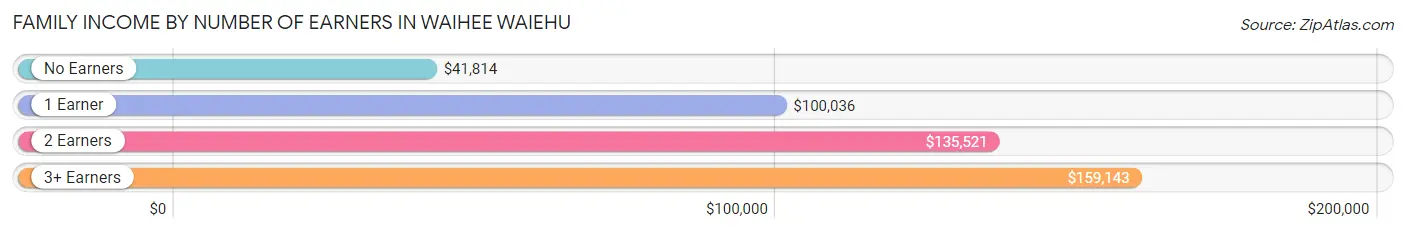
| Number of Earners | # Families | Median Income |
| No Earners | 312 (13.9%) | $41,814 |
| 1 Earner | 567 (25.2%) | $100,036 |
| 2 Earners | 707 (31.4%) | $135,521 |
| 3+ Earners | 664 (29.5%) | $159,143 |
| Total | 2,250 (100.0%) | $124,535 |
Household Income in Waihee Waiehu
Household Income Brackets in Waihee Waiehu
With 895 households falling in the category, the $100,000 to $149,999 income range is the most frequent in Waihee Waiehu, accounting for 33.9% of all households. In contrast, only 50 households (1.9%) fall into the $15,000 to $24,999 income bracket, making it the least populous group.
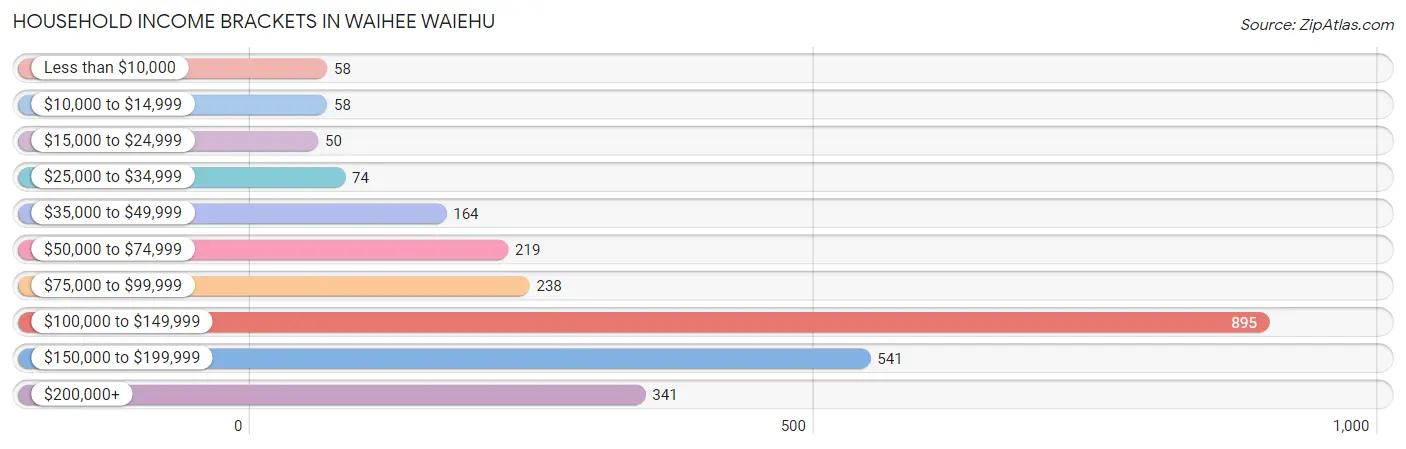
| Income Bracket | # Households | % Households |
| Less than $10,000 | 58 | 2.2% |
| $10,000 to $14,999 | 58 | 2.2% |
| $15,000 to $24,999 | 50 | 1.9% |
| $25,000 to $34,999 | 74 | 2.8% |
| $35,000 to $49,999 | 164 | 6.2% |
| $50,000 to $74,999 | 219 | 8.3% |
| $75,000 to $99,999 | 238 | 9.0% |
| $100,000 to $149,999 | 895 | 33.9% |
| $150,000 to $199,999 | 541 | 20.5% |
| $200,000+ | 341 | 12.9% |
Household Income by Householder Age in Waihee Waiehu
The median household income in Waihee Waiehu is $124,601, with the highest median household income of $132,672 found in the 45 to 64 years age bracket for the primary householder. A total of 1,298 households (49.1%) fall into this category. Meanwhile, the 15 to 24 years age bracket for the primary householder has the lowest median household income of $69,063, with 9 households (0.3%) in this group.
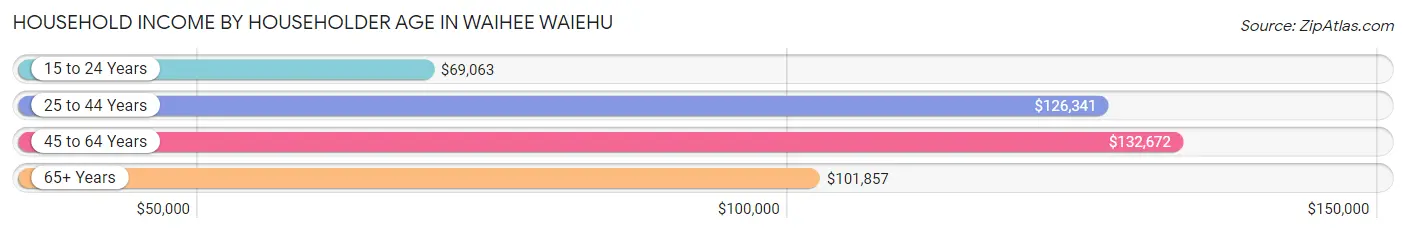
| Income Bracket | # Households | Median Income |
| 15 to 24 Years | 9 (0.3%) | $69,063 |
| 25 to 44 Years | 442 (16.7%) | $126,341 |
| 45 to 64 Years | 1,298 (49.1%) | $132,672 |
| 65+ Years | 892 (33.8%) | $101,857 |
| Total | 2,641 (100.0%) | $124,601 |
Poverty in Waihee Waiehu
Income Below Poverty by Sex and Age in Waihee Waiehu
With 6.9% poverty level for males and 9.1% for females among the residents of Waihee Waiehu, 15 year old males and 6 to 11 year old females are the most vulnerable to poverty, with 88 males (48.6%) and 122 females (22.5%) in their respective age groups living below the poverty level.
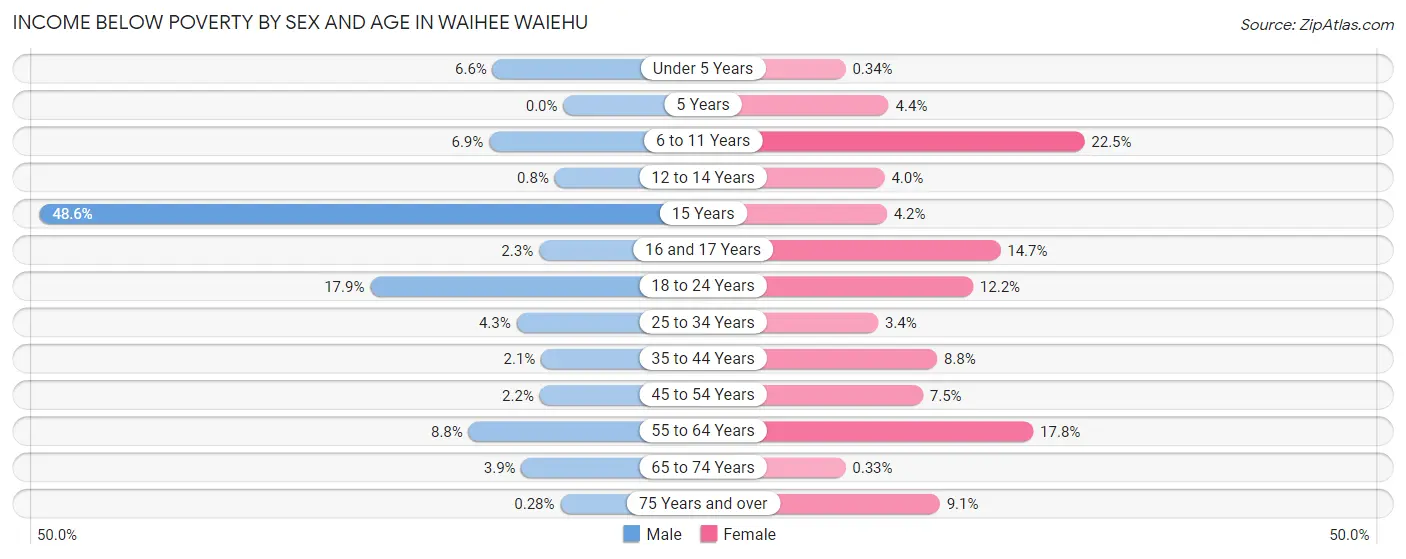
| Age Bracket | Male | Female |
| Under 5 Years | 24 (6.6%) | 1 (0.3%) |
| 5 Years | 0 (0.0%) | 2 (4.3%) |
| 6 to 11 Years | 21 (6.9%) | 122 (22.5%) |
| 12 to 14 Years | 2 (0.8%) | 11 (4.0%) |
| 15 Years | 88 (48.6%) | 4 (4.2%) |
| 16 and 17 Years | 3 (2.3%) | 20 (14.7%) |
| 18 to 24 Years | 129 (17.9%) | 32 (12.2%) |
| 25 to 34 Years | 20 (4.3%) | 20 (3.4%) |
| 35 to 44 Years | 17 (2.1%) | 55 (8.8%) |
| 45 to 54 Years | 19 (2.2%) | 48 (7.5%) |
| 55 to 64 Years | 43 (8.8%) | 125 (17.8%) |
| 65 to 74 Years | 26 (3.9%) | 2 (0.3%) |
| 75 Years and over | 1 (0.3%) | 41 (9.1%) |
| Total | 393 (6.9%) | 483 (9.1%) |
Income Above Poverty by Sex and Age in Waihee Waiehu
According to the poverty statistics in Waihee Waiehu, males aged 5 years and females aged 65 to 74 years are the age groups that are most secure financially, with 100.0% of males and 99.7% of females in these age groups living above the poverty line.
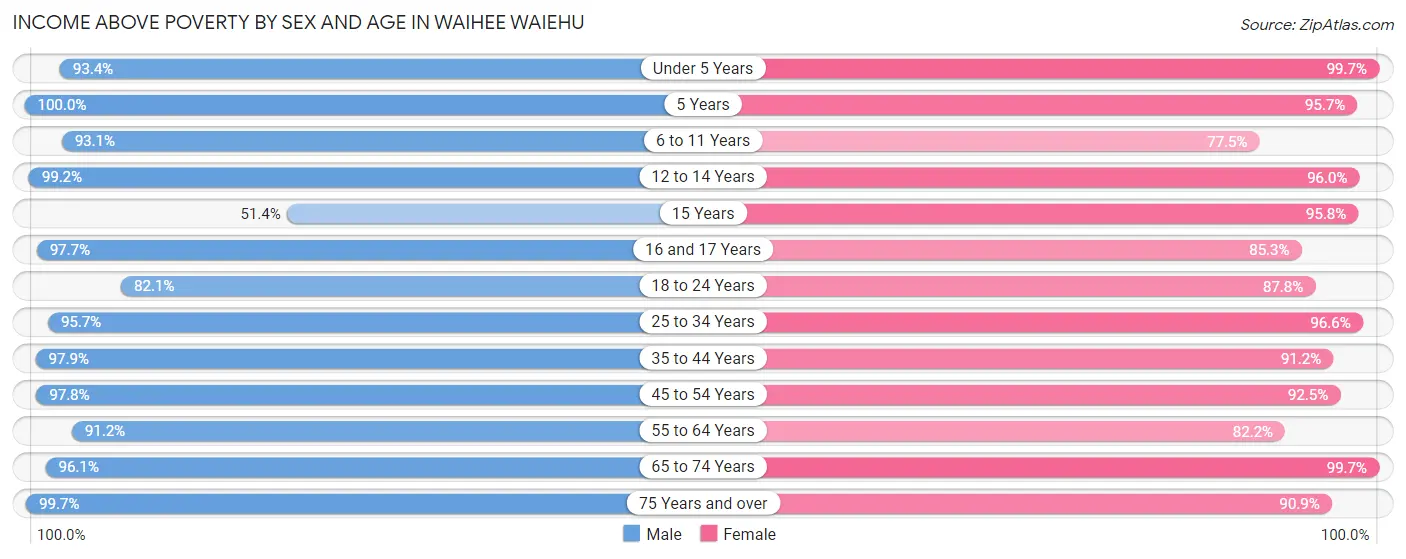
| Age Bracket | Male | Female |
| Under 5 Years | 342 (93.4%) | 292 (99.7%) |
| 5 Years | 116 (100.0%) | 44 (95.7%) |
| 6 to 11 Years | 284 (93.1%) | 420 (77.5%) |
| 12 to 14 Years | 248 (99.2%) | 267 (96.0%) |
| 15 Years | 93 (51.4%) | 92 (95.8%) |
| 16 and 17 Years | 130 (97.7%) | 116 (85.3%) |
| 18 to 24 Years | 591 (82.1%) | 231 (87.8%) |
| 25 to 34 Years | 441 (95.7%) | 575 (96.6%) |
| 35 to 44 Years | 809 (97.9%) | 568 (91.2%) |
| 45 to 54 Years | 848 (97.8%) | 590 (92.5%) |
| 55 to 64 Years | 446 (91.2%) | 579 (82.2%) |
| 65 to 74 Years | 642 (96.1%) | 613 (99.7%) |
| 75 Years and over | 354 (99.7%) | 410 (90.9%) |
| Total | 5,344 (93.1%) | 4,797 (90.8%) |
Income Below Poverty Among Married-Couple Families in Waihee Waiehu
The poverty statistics for married-couple families in Waihee Waiehu show that 1.3% or 20 of the total 1,520 families live below the poverty line. Families with no children have the highest poverty rate of 1.5%, comprising of 14 families. On the other hand, families with 5 or more children have the lowest poverty rate of 0.0%, which includes 0 families.
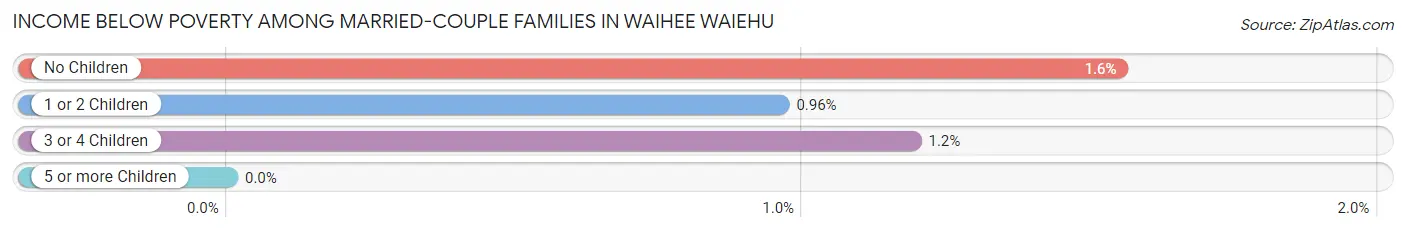
| Children | Above Poverty | Below Poverty |
| No Children | 890 (98.5%) | 14 (1.5%) |
| 1 or 2 Children | 411 (99.0%) | 4 (1.0%) |
| 3 or 4 Children | 166 (98.8%) | 2 (1.2%) |
| 5 or more Children | 33 (100.0%) | 0 (0.0%) |
| Total | 1,500 (98.7%) | 20 (1.3%) |
Income Below Poverty Among Single-Parent Households in Waihee Waiehu
According to the poverty data in Waihee Waiehu, 0.7% or 2 single-father households and 27.3% or 126 single-mother households are living below the poverty line. Among single-father households, those with 3 or 4 children have the highest poverty rate, with 2 households (100.0%) experiencing poverty. Likewise, among single-mother households, those with 3 or 4 children have the highest poverty rate, with 22 households (29.7%) falling below the poverty line.
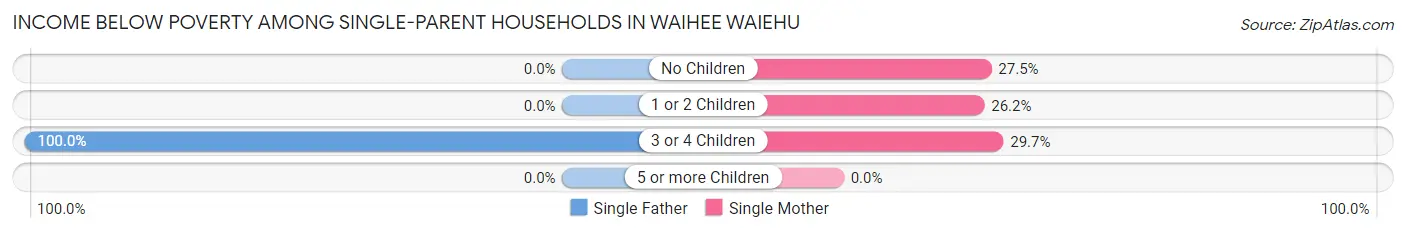
| Children | Single Father | Single Mother |
| No Children | 0 (0.0%) | 60 (27.5%) |
| 1 or 2 Children | 0 (0.0%) | 44 (26.2%) |
| 3 or 4 Children | 2 (100.0%) | 22 (29.7%) |
| 5 or more Children | 0 (0.0%) | 0 (0.0%) |
| Total | 2 (0.7%) | 126 (27.3%) |
Income Below Poverty Among Married-Couple vs Single-Parent Households in Waihee Waiehu
The poverty data for Waihee Waiehu shows that 20 of the married-couple family households (1.3%) and 128 of the single-parent households (17.5%) are living below the poverty level. Within the married-couple family households, those with no children have the highest poverty rate, with 14 households (1.5%) falling below the poverty line. Among the single-parent households, those with 3 or 4 children have the highest poverty rate, with 24 household (31.6%) living below poverty.
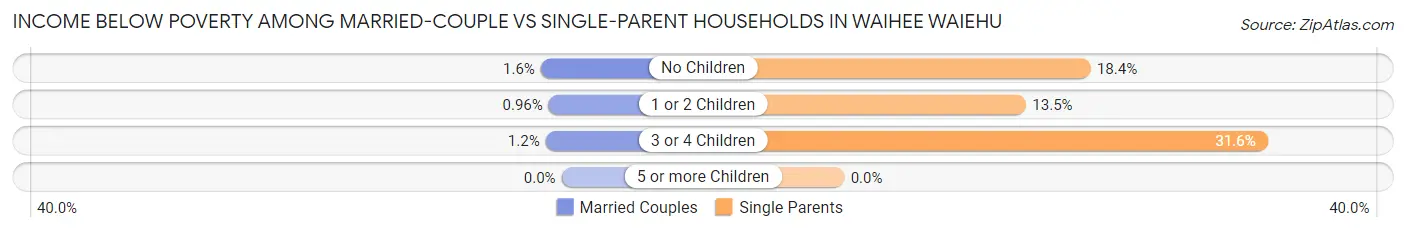
| Children | Married-Couple Families | Single-Parent Households |
| No Children | 14 (1.5%) | 60 (18.3%) |
| 1 or 2 Children | 4 (1.0%) | 44 (13.5%) |
| 3 or 4 Children | 2 (1.2%) | 24 (31.6%) |
| 5 or more Children | 0 (0.0%) | 0 (0.0%) |
| Total | 20 (1.3%) | 128 (17.5%) |
Race in Waihee Waiehu
The most populous races in Waihee Waiehu are Asian (4,238 | 38.4%), Two or more Races (2,950 | 26.8%), and Hawaiian / Pacific (2,499 | 22.7%).
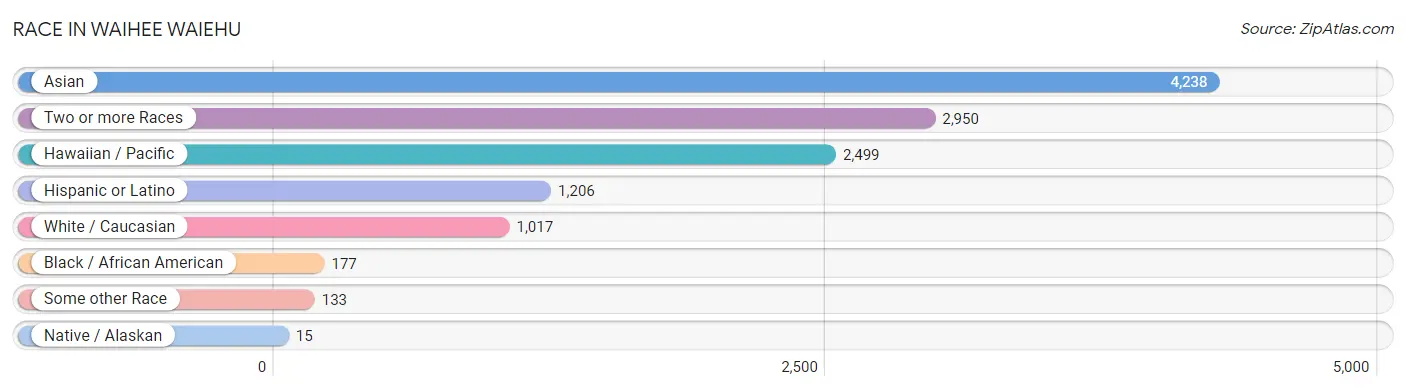
| Race | # Population | % Population |
| Asian | 4,238 | 38.4% |
| Black / African American | 177 | 1.6% |
| Hawaiian / Pacific | 2,499 | 22.7% |
| Hispanic or Latino | 1,206 | 10.9% |
| Native / Alaskan | 15 | 0.1% |
| White / Caucasian | 1,017 | 9.2% |
| Two or more Races | 2,950 | 26.8% |
| Some other Race | 133 | 1.2% |
| Total | 11,029 | 100.0% |
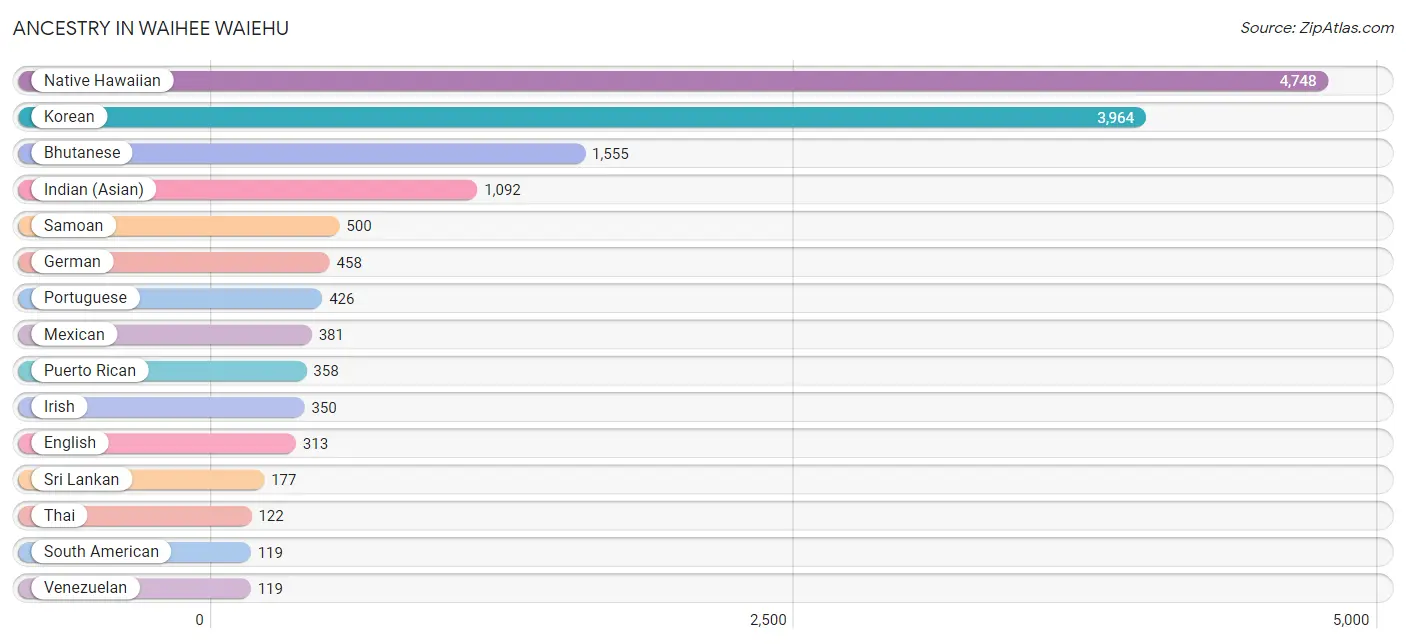
Ancestry in Waihee Waiehu
The most populous ancestries reported in Waihee Waiehu are Native Hawaiian (4,748 | 43.0%), Korean (3,964 | 35.9%), Bhutanese (1,555 | 14.1%), Indian (Asian) (1,092 | 9.9%), and Samoan (500 | 4.5%), together accounting for 107.5% of all Waihee Waiehu residents.
| Ancestry | # Population | % Population |
| American | 26 | 0.2% |
| Arab | 4 | 0.0% |
| Bhutanese | 1,555 | 14.1% |
| Burmese | 103 | 0.9% |
| Central American | 45 | 0.4% |
| Cherokee | 2 | 0.0% |
| Chinese | 13 | 0.1% |
| Chippewa | 11 | 0.1% |
| Choctaw | 10 | 0.1% |
| Comanche | 3 | 0.0% |
| Cuban | 91 | 0.8% |
| Czechoslovakian | 6 | 0.1% |
| Dominican | 2 | 0.0% |
| Eastern European | 1 | 0.0% |
| English | 313 | 2.8% |
| European | 5 | 0.1% |
| Fijian | 11 | 0.1% |
| French | 29 | 0.3% |
| German | 458 | 4.2% |
| Guatemalan | 15 | 0.1% |
| Honduran | 30 | 0.3% |
| Indian (Asian) | 1,092 | 9.9% |
| Irish | 350 | 3.2% |
| Italian | 16 | 0.2% |
| Korean | 3,964 | 35.9% |
| Lebanese | 4 | 0.0% |
| Malaysian | 1 | 0.0% |
| Marshallese | 11 | 0.1% |
| Mexican | 381 | 3.5% |
| Native Hawaiian | 4,748 | 43.0% |
| Norwegian | 54 | 0.5% |
| Pakistani | 34 | 0.3% |
| Polish | 41 | 0.4% |
| Portuguese | 426 | 3.9% |
| Puerto Rican | 358 | 3.3% |
| Russian | 24 | 0.2% |
| Samoan | 500 | 4.5% |
| Scandinavian | 19 | 0.2% |
| Scotch-Irish | 46 | 0.4% |
| Scottish | 117 | 1.1% |
| Serbian | 14 | 0.1% |
| Sioux | 12 | 0.1% |
| Slavic | 26 | 0.2% |
| South American | 119 | 1.1% |
| Spaniard | 10 | 0.1% |
| Spanish | 44 | 0.4% |
| Sri Lankan | 177 | 1.6% |
| Swedish | 4 | 0.0% |
| Thai | 122 | 1.1% |
| Tongan | 78 | 0.7% |
| Venezuelan | 119 | 1.1% |
| Welsh | 27 | 0.2% |
| Yaqui | 4 | 0.0% | View All 53 Rows |
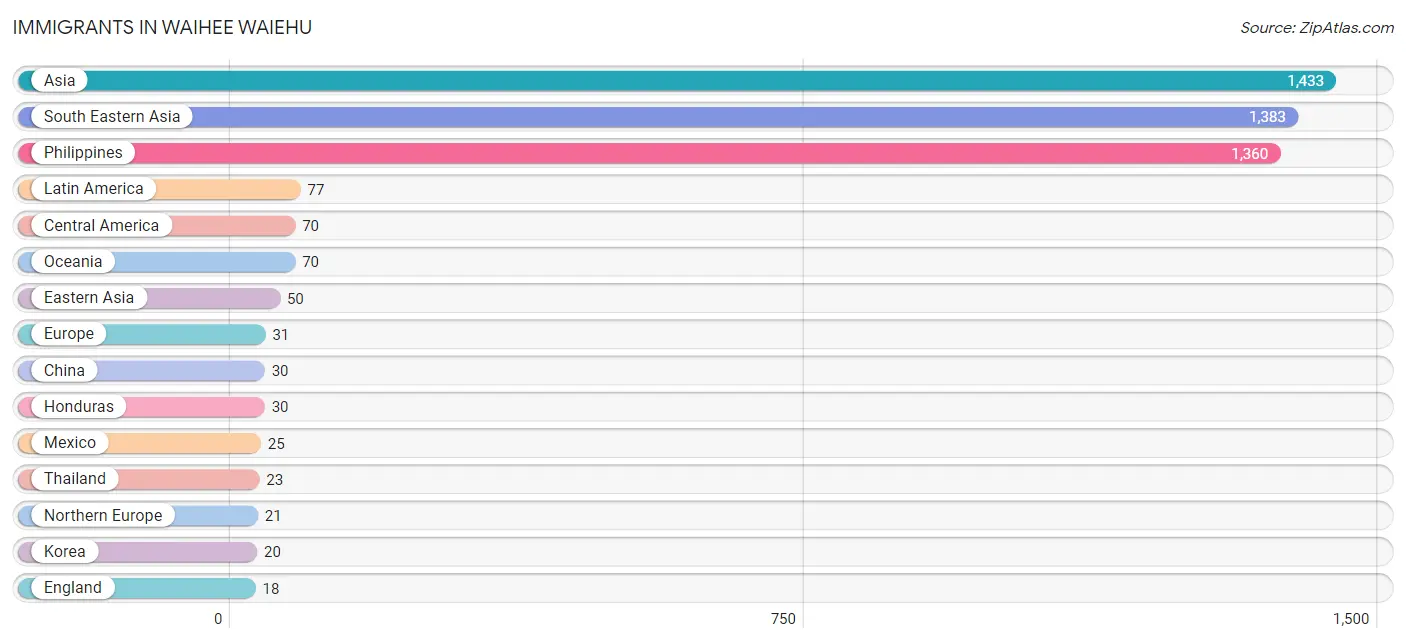
Immigrants in Waihee Waiehu
The most numerous immigrant groups reported in Waihee Waiehu came from Asia (1,433 | 13.0%), South Eastern Asia (1,383 | 12.5%), Philippines (1,360 | 12.3%), Latin America (77 | 0.7%), and Central America (70 | 0.6%), together accounting for 39.2% of all Waihee Waiehu residents.
| Immigration Origin | # Population | % Population |
| Asia | 1,433 | 13.0% |
| Caribbean | 2 | 0.0% |
| Central America | 70 | 0.6% |
| China | 30 | 0.3% |
| Dominican Republic | 2 | 0.0% |
| Eastern Asia | 50 | 0.4% |
| Eastern Europe | 1 | 0.0% |
| England | 18 | 0.2% |
| Europe | 31 | 0.3% |
| Germany | 9 | 0.1% |
| Guatemala | 15 | 0.1% |
| Honduras | 30 | 0.3% |
| Korea | 20 | 0.2% |
| Latin America | 77 | 0.7% |
| Mexico | 25 | 0.2% |
| Micronesia | 2 | 0.0% |
| Northern Europe | 21 | 0.2% |
| Oceania | 70 | 0.6% |
| Philippines | 1,360 | 12.3% |
| Russia | 1 | 0.0% |
| Scotland | 3 | 0.0% |
| South America | 5 | 0.1% |
| South Eastern Asia | 1,383 | 12.5% |
| Thailand | 23 | 0.2% |
| Venezuela | 5 | 0.1% |
| Western Europe | 9 | 0.1% | View All 26 Rows |
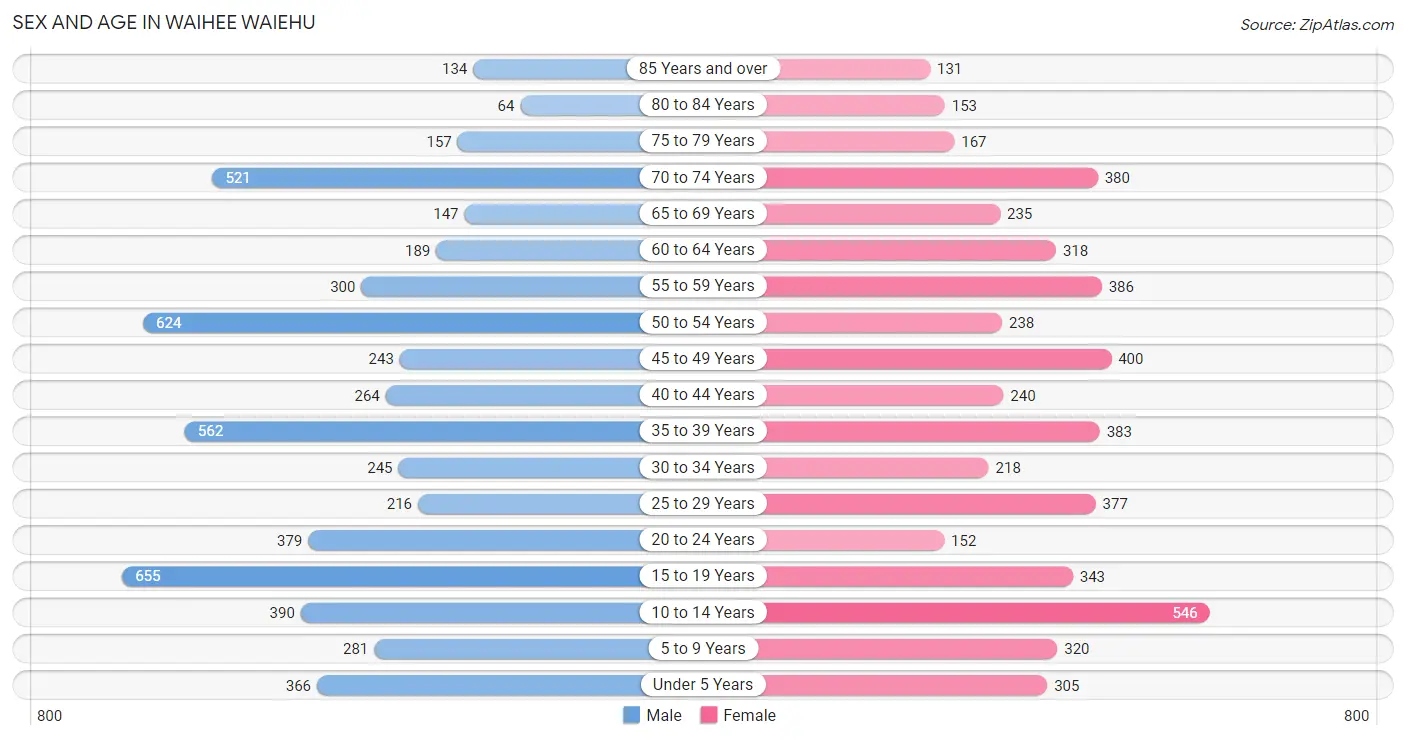
Sex and Age in Waihee Waiehu
Sex and Age in Waihee Waiehu
The most populous age groups in Waihee Waiehu are 15 to 19 Years (655 | 11.4%) for men and 10 to 14 Years (546 | 10.3%) for women.
| Age Bracket | Male | Female |
| Under 5 Years | 366 (6.4%) | 305 (5.8%) |
| 5 to 9 Years | 281 (4.9%) | 320 (6.0%) |
| 10 to 14 Years | 390 (6.8%) | 546 (10.3%) |
| 15 to 19 Years | 655 (11.4%) | 343 (6.5%) |
| 20 to 24 Years | 379 (6.6%) | 152 (2.9%) |
| 25 to 29 Years | 216 (3.8%) | 377 (7.1%) |
| 30 to 34 Years | 245 (4.3%) | 218 (4.1%) |
| 35 to 39 Years | 562 (9.8%) | 383 (7.2%) |
| 40 to 44 Years | 264 (4.6%) | 240 (4.5%) |
| 45 to 49 Years | 243 (4.2%) | 400 (7.6%) |
| 50 to 54 Years | 624 (10.9%) | 238 (4.5%) |
| 55 to 59 Years | 300 (5.2%) | 386 (7.3%) |
| 60 to 64 Years | 189 (3.3%) | 318 (6.0%) |
| 65 to 69 Years | 147 (2.6%) | 235 (4.4%) |
| 70 to 74 Years | 521 (9.1%) | 380 (7.2%) |
| 75 to 79 Years | 157 (2.7%) | 167 (3.2%) |
| 80 to 84 Years | 64 (1.1%) | 153 (2.9%) |
| 85 Years and over | 134 (2.3%) | 131 (2.5%) |
| Total | 5,737 (100.0%) | 5,292 (100.0%) |
Families and Households in Waihee Waiehu
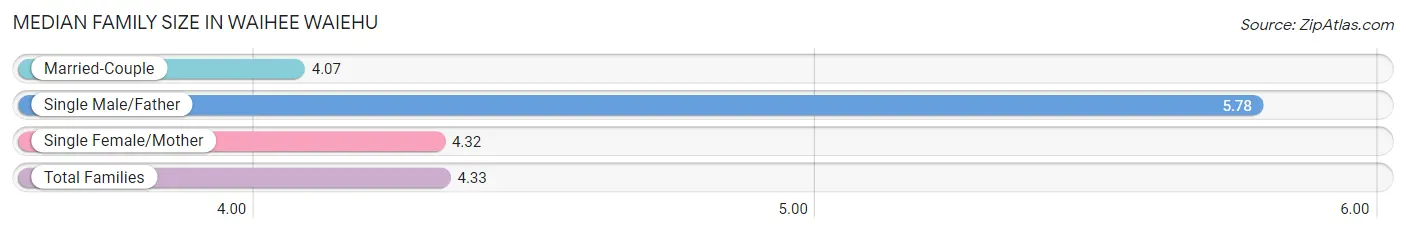
Median Family Size in Waihee Waiehu
The median family size in Waihee Waiehu is 4.33 persons per family, with single male/father families (268 | 11.9%) accounting for the largest median family size of 5.78 persons per family. On the other hand, married-couple families (1,520 | 67.6%) represent the smallest median family size with 4.07 persons per family.
| Family Type | # Families | Family Size |
| Married-Couple | 1,520 (67.6%) | 4.07 |
| Single Male/Father | 268 (11.9%) | 5.78 |
| Single Female/Mother | 462 (20.5%) | 4.32 |
| Total Families | 2,250 (100.0%) | 4.33 |
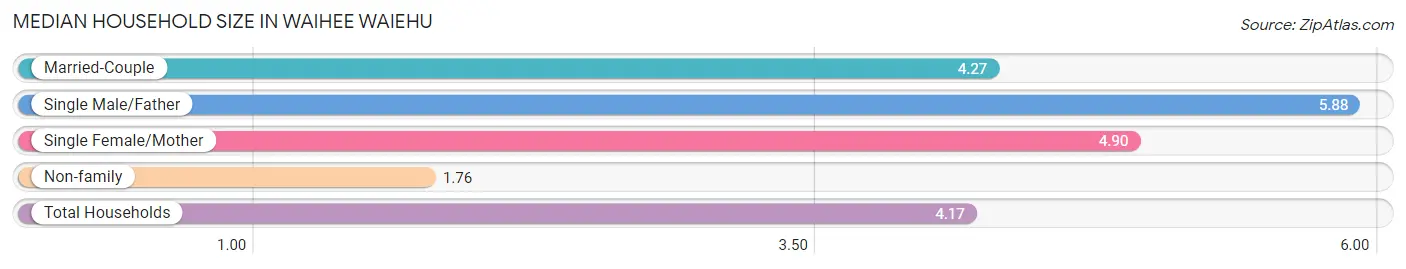
Median Household Size in Waihee Waiehu
The median household size in Waihee Waiehu is 4.17 persons per household, with single male/father households (268 | 10.2%) accounting for the largest median household size of 5.88 persons per household. non-family households (391 | 14.8%) represent the smallest median household size with 1.76 persons per household.
| Household Type | # Households | Household Size |
| Married-Couple | 1,520 (57.6%) | 4.27 |
| Single Male/Father | 268 (10.2%) | 5.88 |
| Single Female/Mother | 462 (17.5%) | 4.90 |
| Non-family | 391 (14.8%) | 1.76 |
| Total Households | 2,641 (100.0%) | 4.17 |
Household Size by Marriage Status in Waihee Waiehu
Out of a total of 2,641 households in Waihee Waiehu, 2,250 (85.2%) are family households, while 391 (14.8%) are nonfamily households. The most numerous type of family households are 2-person households, comprising 604, and the most common type of nonfamily households are 1-person households, comprising 244.
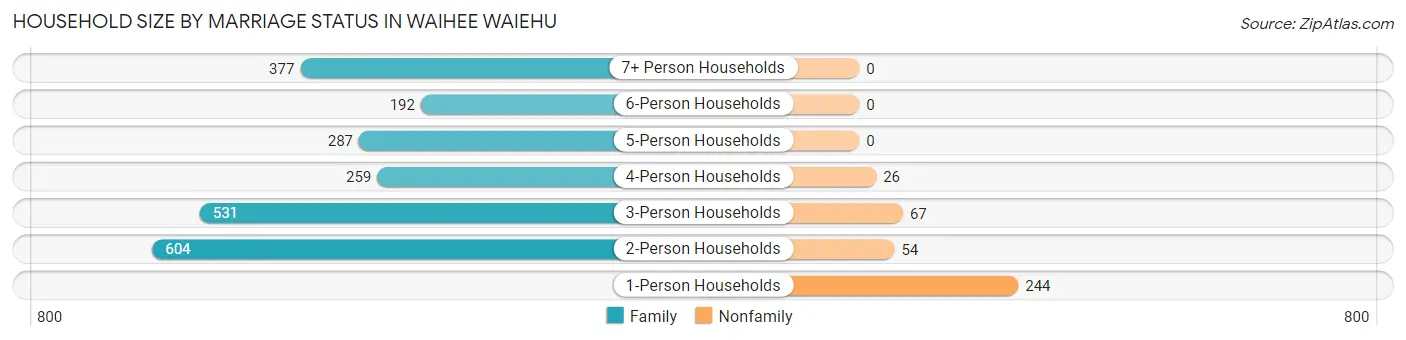
| Household Size | Family Households | Nonfamily Households |
| 1-Person Households | - | 244 (9.2%) |
| 2-Person Households | 604 (22.9%) | 54 (2.0%) |
| 3-Person Households | 531 (20.1%) | 67 (2.5%) |
| 4-Person Households | 259 (9.8%) | 26 (1.0%) |
| 5-Person Households | 287 (10.9%) | 0 (0.0%) |
| 6-Person Households | 192 (7.3%) | 0 (0.0%) |
| 7+ Person Households | 377 (14.3%) | 0 (0.0%) |
| Total | 2,250 (85.2%) | 391 (14.8%) |
Female Fertility in Waihee Waiehu
Fertility by Age in Waihee Waiehu
Average fertility rate in Waihee Waiehu is 37.0 births per 1,000 women. Women in the age bracket of 20 to 34 years have the highest fertility rate with 95.0 births per 1,000 women. Women in the age bracket of 20 to 34 years acount for 88.7% of all women with births.
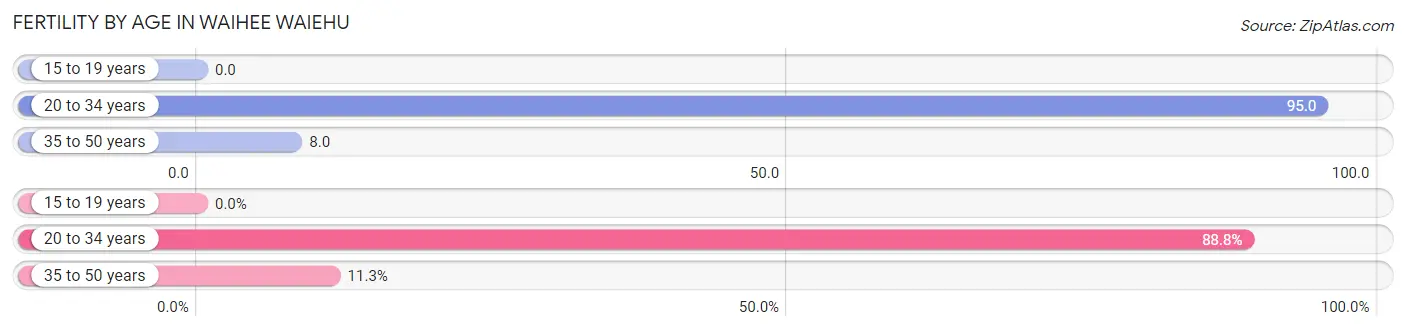
| Age Bracket | Women with Births | Births / 1,000 Women |
| 15 to 19 years | 0 (0.0%) | 0.0 |
| 20 to 34 years | 71 (88.7%) | 95.0 |
| 35 to 50 years | 9 (11.3%) | 8.0 |
| Total | 80 (100.0%) | 37.0 |
Fertility by Age by Marriage Status in Waihee Waiehu
13.8% of women with births (80) in Waihee Waiehu are married. The highest percentage of unmarried women with births falls into 20 to 34 years age bracket with 91.5% of them unmarried at the time of birth, while the lowest percentage of unmarried women with births belong to 35 to 50 years age bracket with 44.4% of them unmarried.
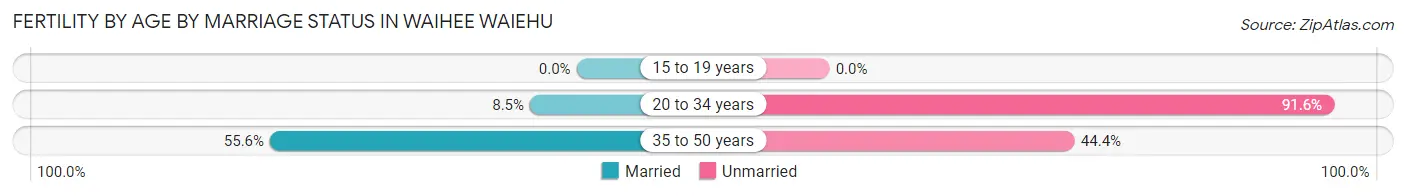
| Age Bracket | Married | Unmarried |
| 15 to 19 years | 0 (0.0%) | 0 (0.0%) |
| 20 to 34 years | 6 (8.5%) | 65 (91.5%) |
| 35 to 50 years | 5 (55.6%) | 4 (44.4%) |
| Total | 11 (13.8%) | 69 (86.3%) |
Fertility by Education in Waihee Waiehu
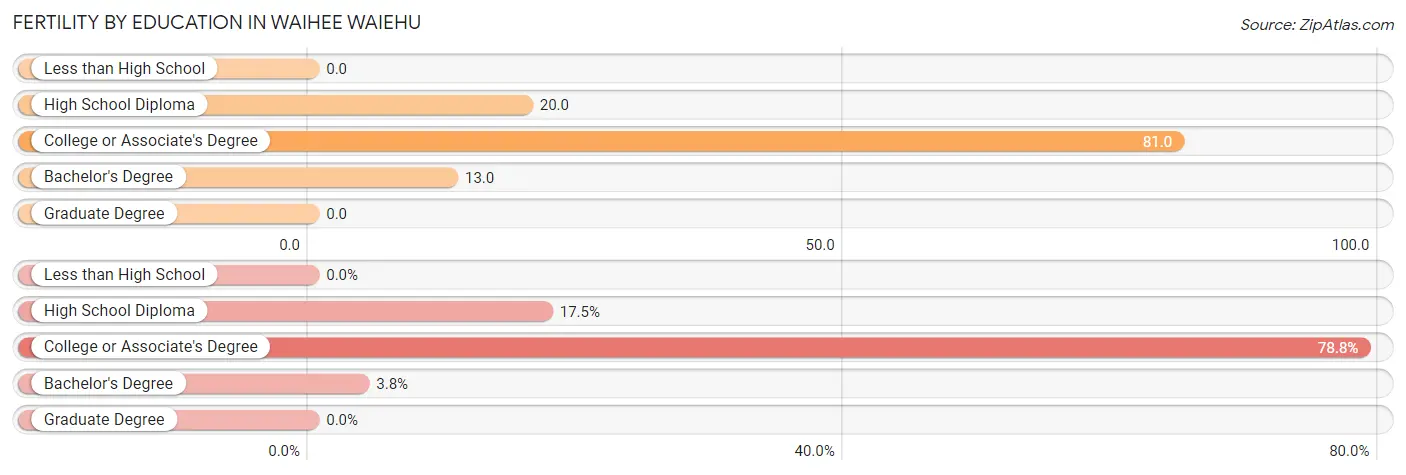
| Educational Attainment | Women with Births | Births / 1,000 Women |
| Less than High School | 0 (0.0%) | 0.0 |
| High School Diploma | 14 (17.5%) | 20.0 |
| College or Associate's Degree | 63 (78.7%) | 81.0 |
| Bachelor's Degree | 3 (3.7%) | 13.0 |
| Graduate Degree | 0 (0.0%) | 0.0 |
| Total | 80 (100.0%) | 37.0 |
Fertility by Education by Marriage Status in Waihee Waiehu
86.3% of women with births in Waihee Waiehu are unmarried. Women with the educational attainment of bachelor's degree are most likely to be married with 100.0% of them married at childbirth, while women with the educational attainment of college or associate's degree are least likely to be married with 100.0% of them unmarried at childbirth.
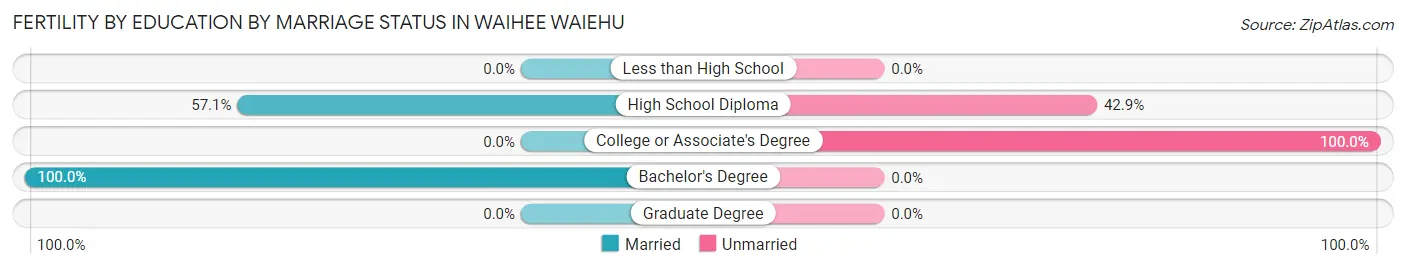
| Educational Attainment | Married | Unmarried |
| Less than High School | 0 (0.0%) | 0 (0.0%) |
| High School Diploma | 8 (57.1%) | 6 (42.9%) |
| College or Associate's Degree | 0 (0.0%) | 63 (100.0%) |
| Bachelor's Degree | 3 (100.0%) | 0 (0.0%) |
| Graduate Degree | 0 (0.0%) | 0 (0.0%) |
| Total | 11 (13.8%) | 69 (86.3%) |
Employment Characteristics in Waihee Waiehu
Employment by Class of Employer in Waihee Waiehu
Among the 5,115 employed individuals in Waihee Waiehu, private company employees (3,379 | 66.1%), state government employees (508 | 9.9%), and local government employees (423 | 8.3%) make up the most common classes of employment.
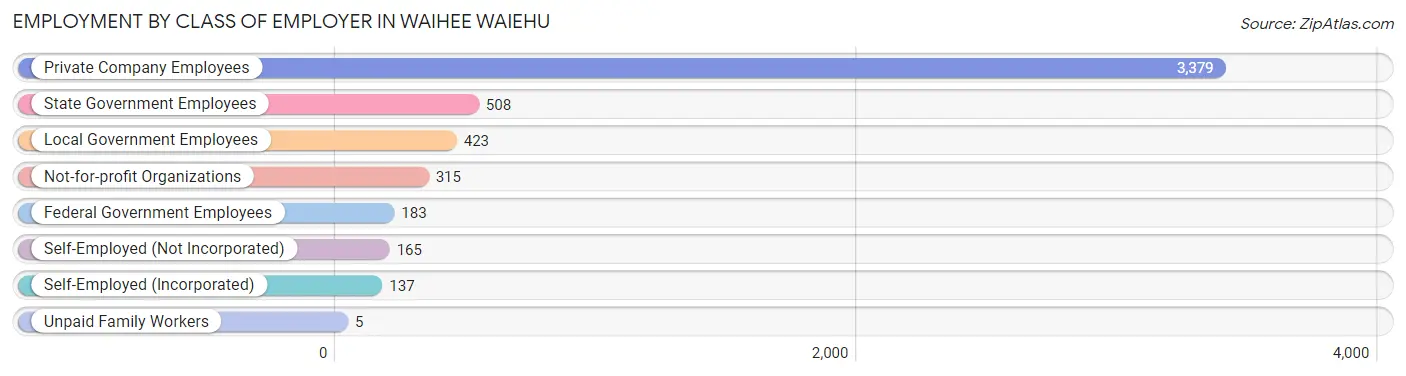
| Employer Class | # Employees | % Employees |
| Private Company Employees | 3,379 | 66.1% |
| Self-Employed (Incorporated) | 137 | 2.7% |
| Self-Employed (Not Incorporated) | 165 | 3.2% |
| Not-for-profit Organizations | 315 | 6.2% |
| Local Government Employees | 423 | 8.3% |
| State Government Employees | 508 | 9.9% |
| Federal Government Employees | 183 | 3.6% |
| Unpaid Family Workers | 5 | 0.1% |
| Total | 5,115 | 100.0% |
Employment Status by Age in Waihee Waiehu
According to the labor force statistics for Waihee Waiehu, out of the total population over 16 years of age (8,544), 62.5% or 5,340 individuals are in the labor force, with 3.1% or 166 of them unemployed. The age group with the highest labor force participation rate is 25 to 29 years, with 94.6% or 561 individuals in the labor force. Within the labor force, the 30 to 34 years age range has the highest percentage of unemployed individuals, with 9.3% or 35 of them being unemployed.
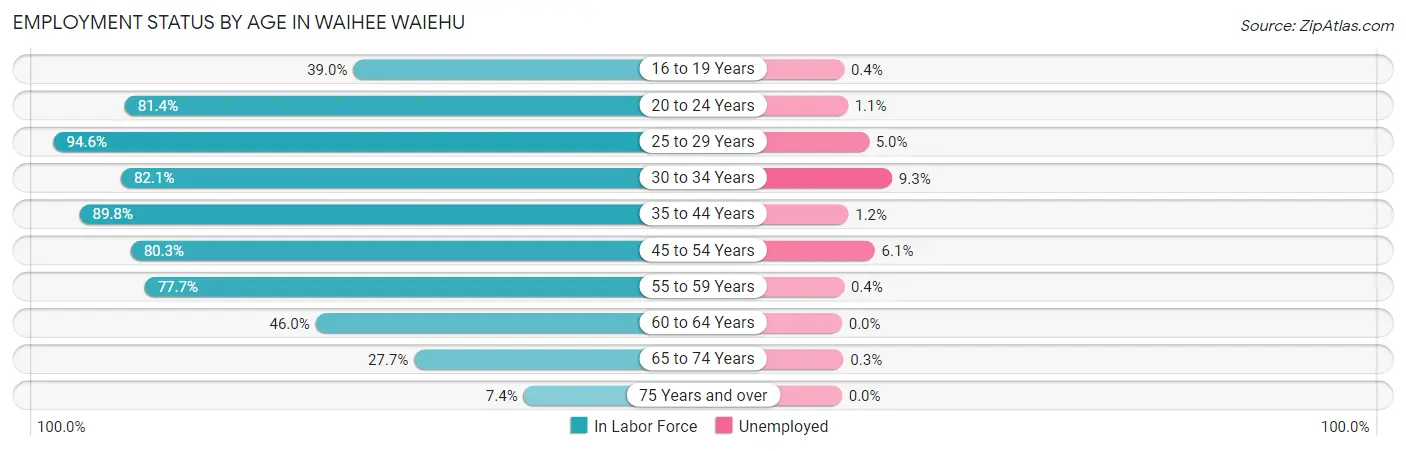
| Age Bracket | In Labor Force | Unemployed |
| 16 to 19 Years | 281 (39.0%) | 1 (0.4%) |
| 20 to 24 Years | 432 (81.4%) | 5 (1.1%) |
| 25 to 29 Years | 561 (94.6%) | 28 (5.0%) |
| 30 to 34 Years | 380 (82.1%) | 35 (9.3%) |
| 35 to 44 Years | 1,301 (89.8%) | 16 (1.2%) |
| 45 to 54 Years | 1,209 (80.3%) | 74 (6.1%) |
| 55 to 59 Years | 533 (77.7%) | 2 (0.4%) |
| 60 to 64 Years | 233 (46.0%) | 0 (0.0%) |
| 65 to 74 Years | 355 (27.7%) | 1 (0.3%) |
| 75 Years and over | 60 (7.4%) | 0 (0.0%) |
| Total | 5,340 (62.5%) | 166 (3.1%) |
Employment Status by Educational Attainment in Waihee Waiehu
According to labor force statistics for Waihee Waiehu, 81.0% of individuals (4,214) out of the total population between 25 and 64 years of age (5,203) are in the labor force, with 3.7% or 156 of them being unemployed. The group with the highest labor force participation rate are those with the educational attainment of college / associate degree, with 86.9% or 1,821 individuals in the labor force. Within the labor force, individuals with high school diploma education have the highest percentage of unemployment, with 4.9% or 73 of them being unemployed.
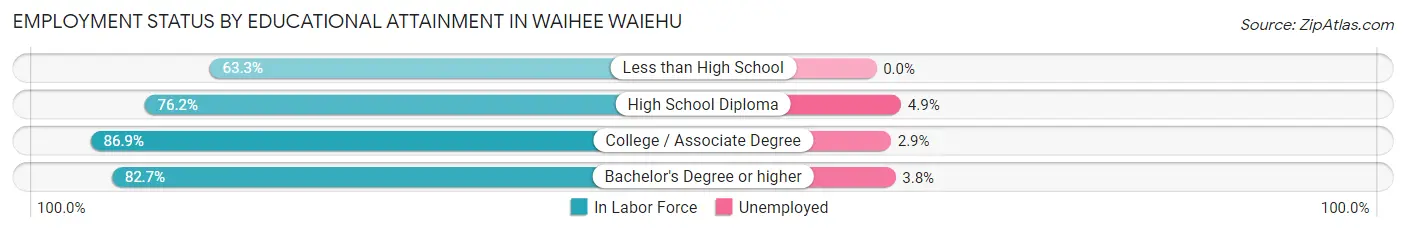
| Educational Attainment | In Labor Force | Unemployed |
| Less than High School | 159 (63.3%) | 0 (0.0%) |
| High School Diploma | 1,481 (76.2%) | 95 (4.9%) |
| College / Associate Degree | 1,821 (86.9%) | 61 (2.9%) |
| Bachelor's Degree or higher | 755 (82.7%) | 35 (3.8%) |
| Total | 4,214 (81.0%) | 193 (3.7%) |
Employment Occupations by Sex in Waihee Waiehu
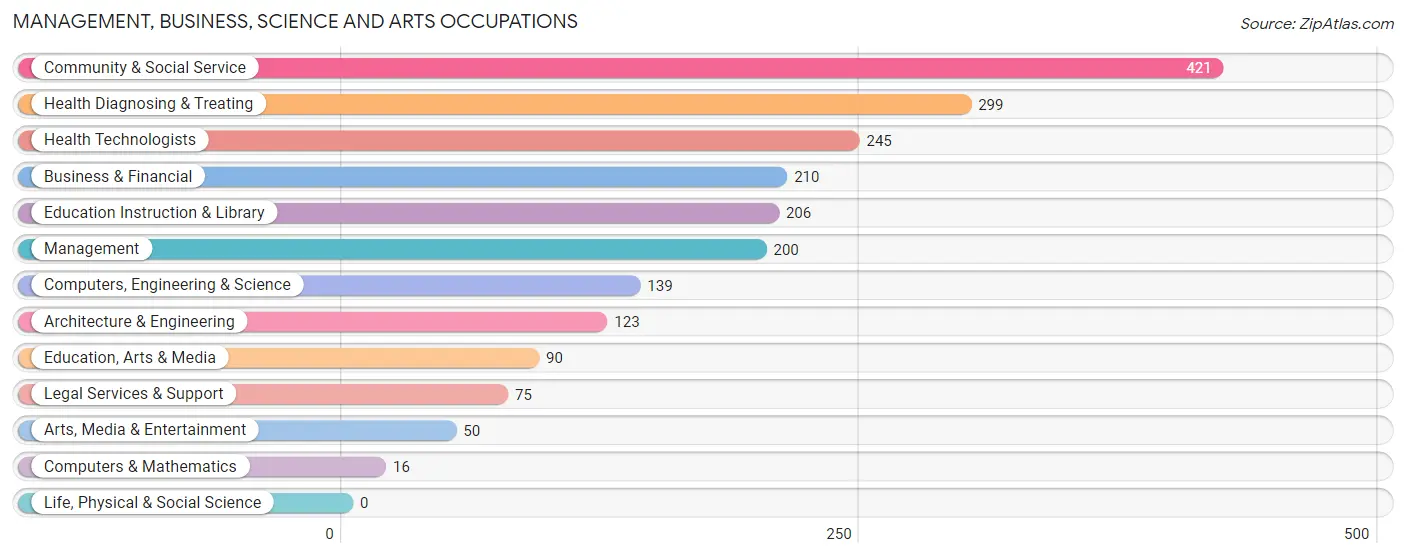
Management, Business, Science and Arts Occupations
The most common Management, Business, Science and Arts occupations in Waihee Waiehu are Community & Social Service (421 | 8.3%), Health Diagnosing & Treating (299 | 5.9%), Health Technologists (245 | 4.8%), Business & Financial (210 | 4.1%), and Education Instruction & Library (206 | 4.0%).
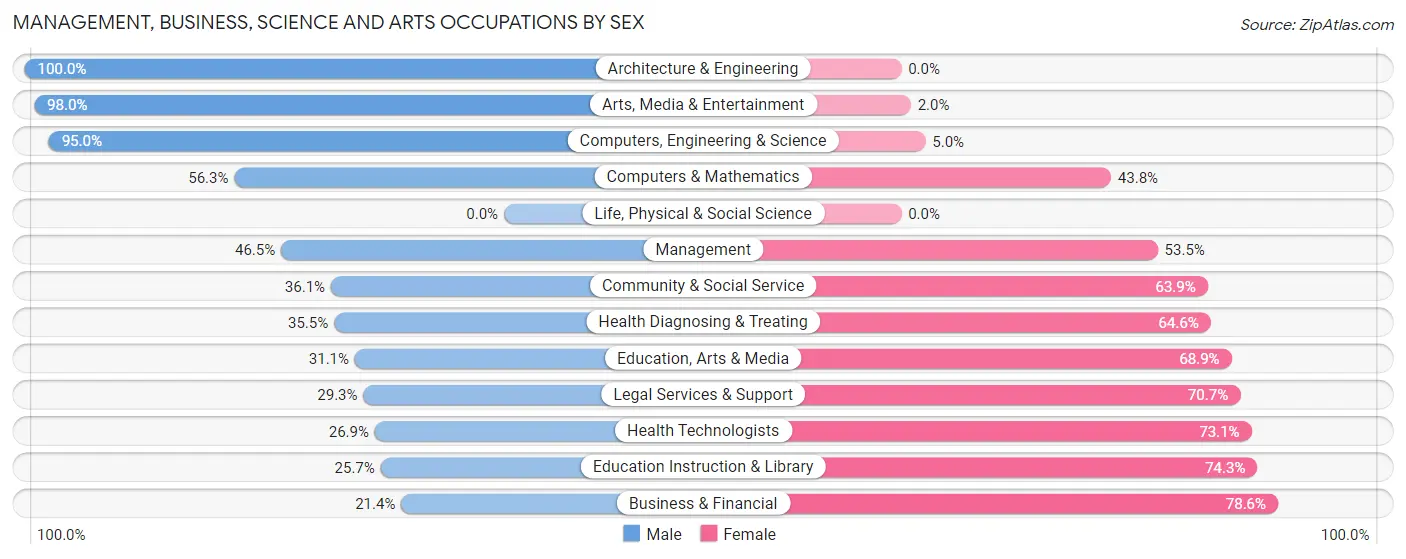
Management, Business, Science and Arts Occupations by Sex
Within the Management, Business, Science and Arts occupations in Waihee Waiehu, the most male-oriented occupations are Architecture & Engineering (100.0%), Arts, Media & Entertainment (98.0%), and Computers, Engineering & Science (95.0%), while the most female-oriented occupations are Business & Financial (78.6%), Education Instruction & Library (74.3%), and Health Technologists (73.1%).
| Occupation | Male | Female |
| Management | 93 (46.5%) | 107 (53.5%) |
| Business & Financial | 45 (21.4%) | 165 (78.6%) |
| Computers, Engineering & Science | 132 (95.0%) | 7 (5.0%) |
| Computers & Mathematics | 9 (56.2%) | 7 (43.8%) |
| Architecture & Engineering | 123 (100.0%) | 0 (0.0%) |
| Life, Physical & Social Science | 0 (0.0%) | 0 (0.0%) |
| Community & Social Service | 152 (36.1%) | 269 (63.9%) |
| Education, Arts & Media | 28 (31.1%) | 62 (68.9%) |
| Legal Services & Support | 22 (29.3%) | 53 (70.7%) |
| Education Instruction & Library | 53 (25.7%) | 153 (74.3%) |
| Arts, Media & Entertainment | 49 (98.0%) | 1 (2.0%) |
| Health Diagnosing & Treating | 106 (35.4%) | 193 (64.5%) |
| Health Technologists | 66 (26.9%) | 179 (73.1%) |
| Total (Category) | 528 (41.6%) | 741 (58.4%) |
| Total (Overall) | 2,729 (53.5%) | 2,367 (46.5%) |
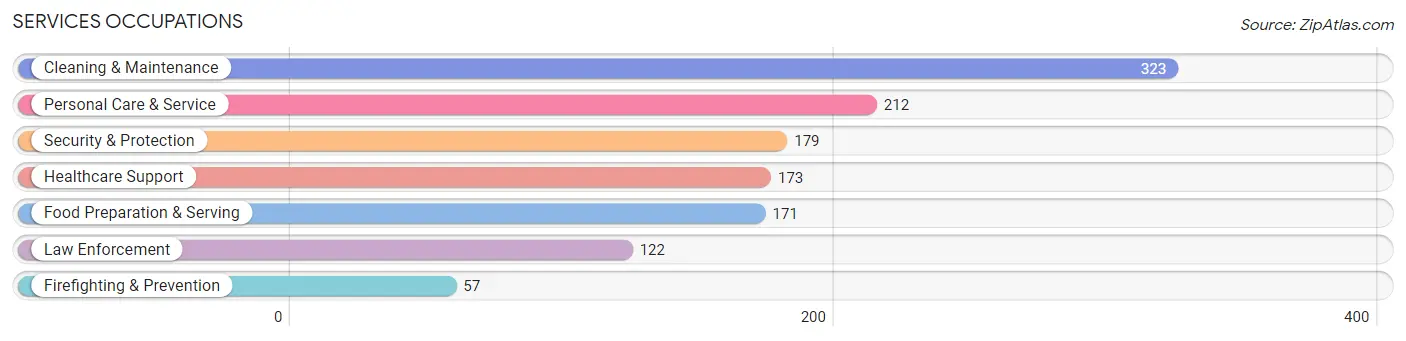
Services Occupations
The most common Services occupations in Waihee Waiehu are Cleaning & Maintenance (323 | 6.3%), Personal Care & Service (212 | 4.2%), Security & Protection (179 | 3.5%), Healthcare Support (173 | 3.4%), and Food Preparation & Serving (171 | 3.4%).
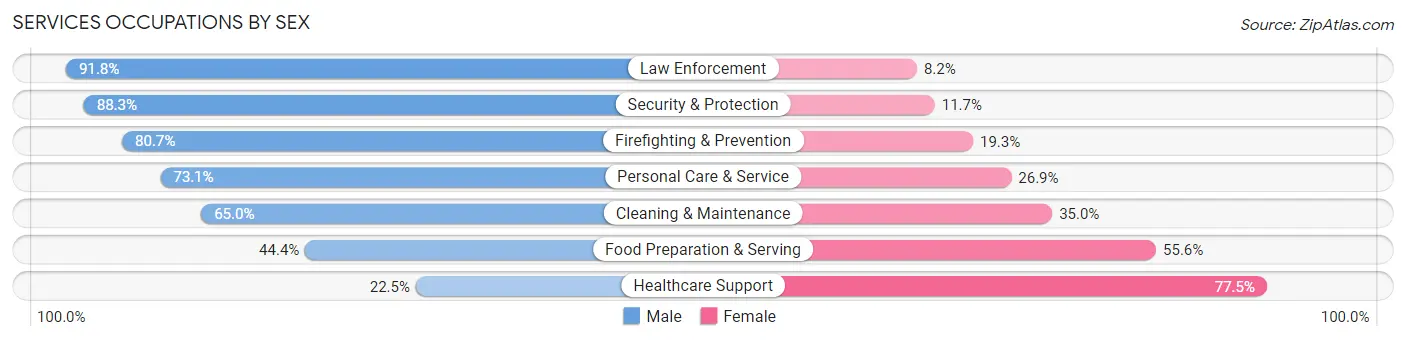
Services Occupations by Sex
Within the Services occupations in Waihee Waiehu, the most male-oriented occupations are Law Enforcement (91.8%), Security & Protection (88.3%), and Firefighting & Prevention (80.7%), while the most female-oriented occupations are Healthcare Support (77.5%), Food Preparation & Serving (55.6%), and Cleaning & Maintenance (35.0%).
| Occupation | Male | Female |
| Healthcare Support | 39 (22.5%) | 134 (77.5%) |
| Security & Protection | 158 (88.3%) | 21 (11.7%) |
| Firefighting & Prevention | 46 (80.7%) | 11 (19.3%) |
| Law Enforcement | 112 (91.8%) | 10 (8.2%) |
| Food Preparation & Serving | 76 (44.4%) | 95 (55.6%) |
| Cleaning & Maintenance | 210 (65.0%) | 113 (35.0%) |
| Personal Care & Service | 155 (73.1%) | 57 (26.9%) |
| Total (Category) | 638 (60.3%) | 420 (39.7%) |
| Total (Overall) | 2,729 (53.5%) | 2,367 (46.5%) |
Sales and Office Occupations
The most common Sales and Office occupations in Waihee Waiehu are Office & Administration (921 | 18.1%), and Sales & Related (621 | 12.2%).
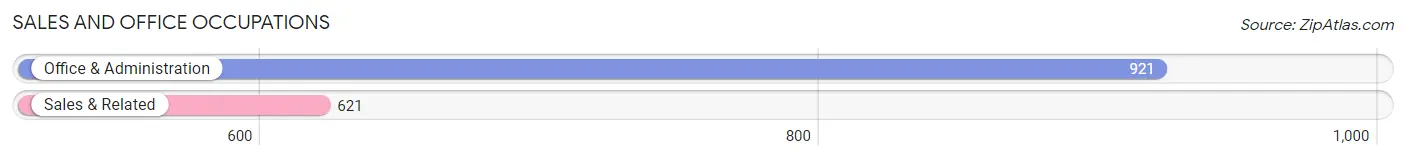
Sales and Office Occupations by Sex
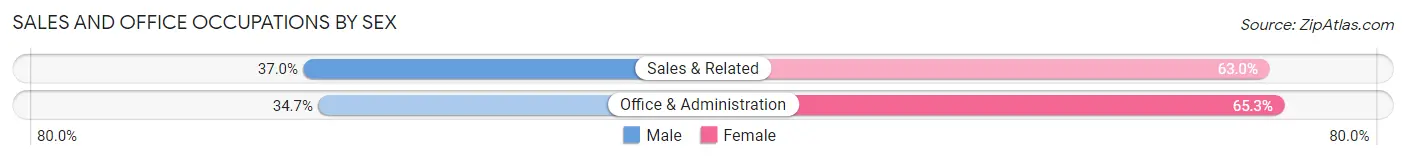
| Occupation | Male | Female |
| Sales & Related | 230 (37.0%) | 391 (63.0%) |
| Office & Administration | 320 (34.7%) | 601 (65.3%) |
| Total (Category) | 550 (35.7%) | 992 (64.3%) |
| Total (Overall) | 2,729 (53.5%) | 2,367 (46.5%) |
Natural Resources, Construction and Maintenance Occupations
The most common Natural Resources, Construction and Maintenance occupations in Waihee Waiehu are Construction & Extraction (430 | 8.4%), Installation, Maintenance & Repair (94 | 1.8%), and Farming, Fishing & Forestry (5 | 0.1%).
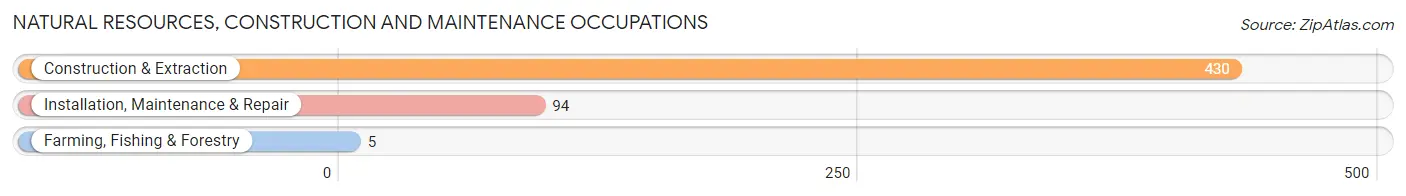
Natural Resources, Construction and Maintenance Occupations by Sex
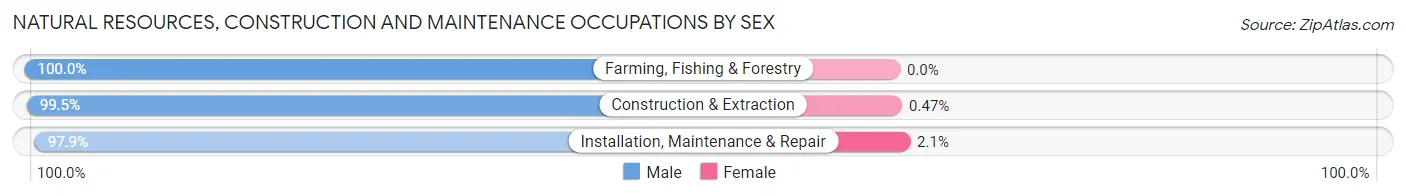
| Occupation | Male | Female |
| Farming, Fishing & Forestry | 5 (100.0%) | 0 (0.0%) |
| Construction & Extraction | 428 (99.5%) | 2 (0.5%) |
| Installation, Maintenance & Repair | 92 (97.9%) | 2 (2.1%) |
| Total (Category) | 525 (99.2%) | 4 (0.8%) |
| Total (Overall) | 2,729 (53.5%) | 2,367 (46.5%) |
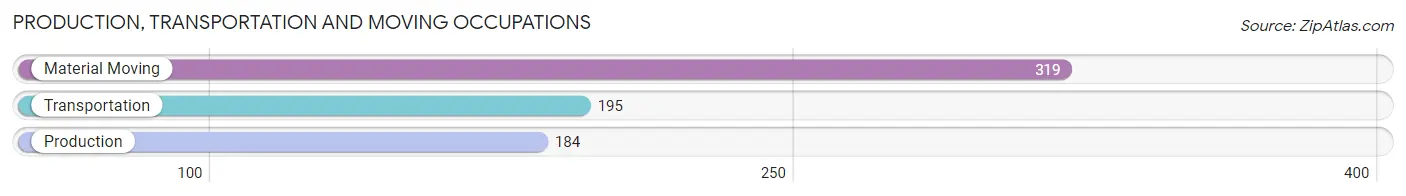
Production, Transportation and Moving Occupations
The most common Production, Transportation and Moving occupations in Waihee Waiehu are Material Moving (319 | 6.3%), Transportation (195 | 3.8%), and Production (184 | 3.6%).
Production, Transportation and Moving Occupations by Sex
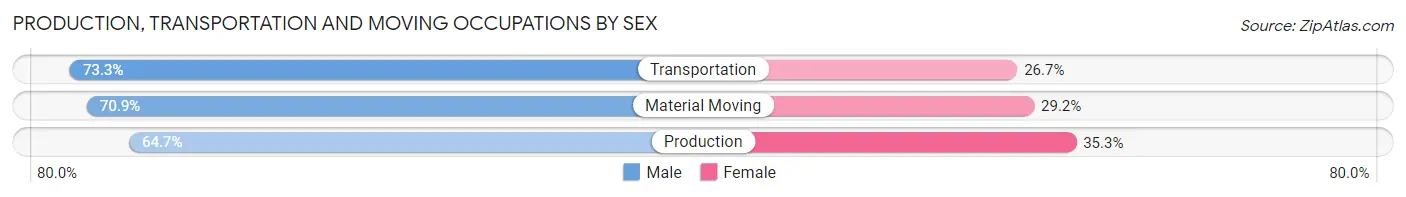
| Occupation | Male | Female |
| Production | 119 (64.7%) | 65 (35.3%) |
| Transportation | 143 (73.3%) | 52 (26.7%) |
| Material Moving | 226 (70.9%) | 93 (29.1%) |
| Total (Category) | 488 (69.9%) | 210 (30.1%) |
| Total (Overall) | 2,729 (53.5%) | 2,367 (46.5%) |
Employment Industries by Sex in Waihee Waiehu
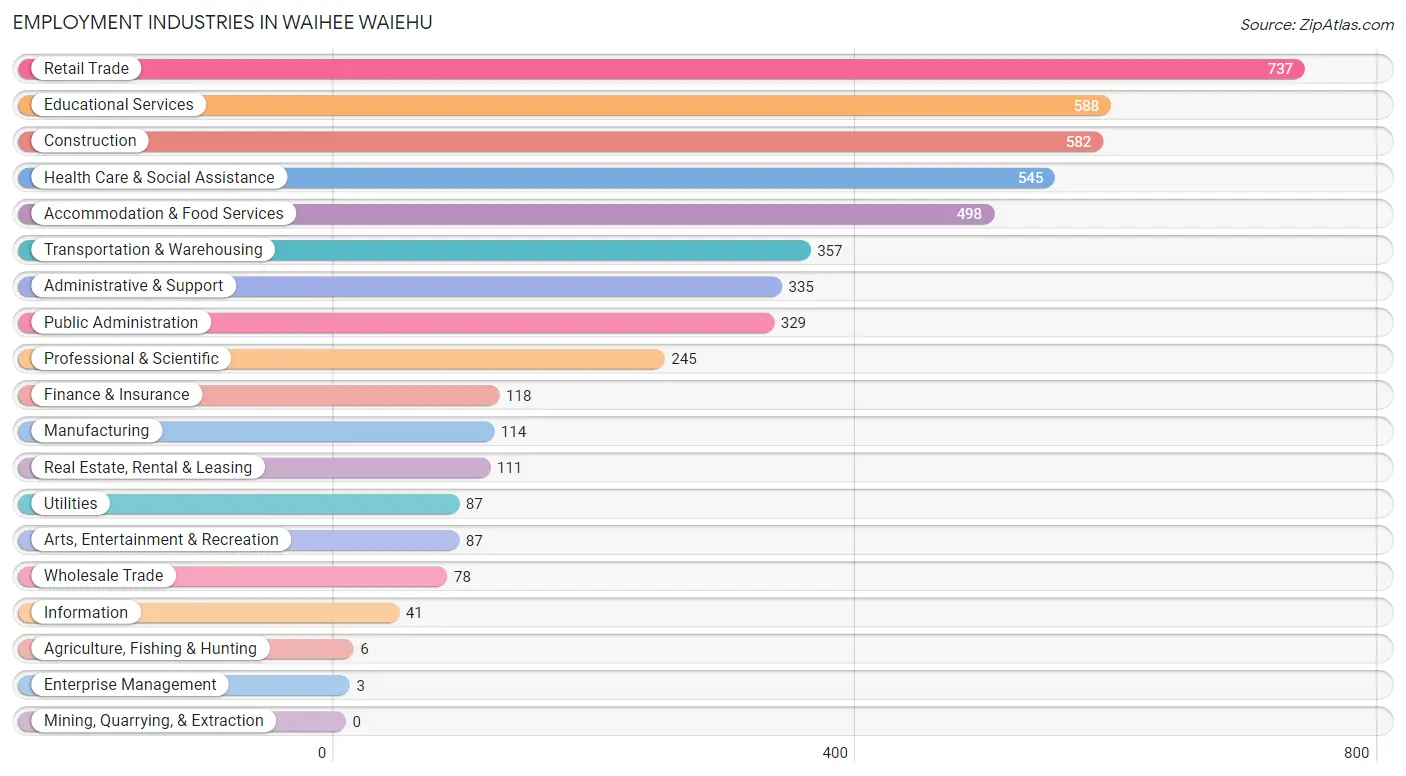
Employment Industries in Waihee Waiehu
The major employment industries in Waihee Waiehu include Retail Trade (737 | 14.5%), Educational Services (588 | 11.5%), Construction (582 | 11.4%), Health Care & Social Assistance (545 | 10.7%), and Accommodation & Food Services (498 | 9.8%).
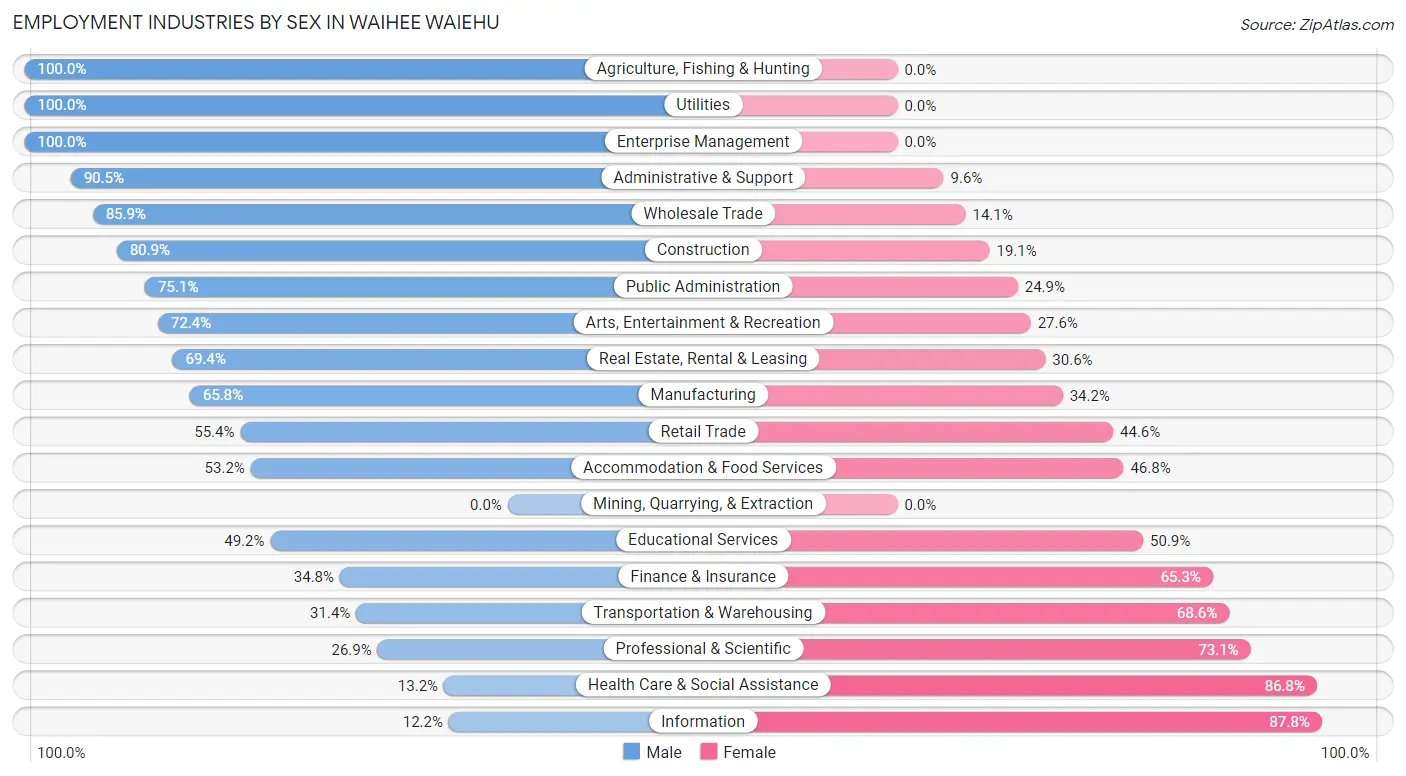
Employment Industries by Sex in Waihee Waiehu
The Waihee Waiehu industries that see more men than women are Agriculture, Fishing & Hunting (100.0%), Utilities (100.0%), and Enterprise Management (100.0%), whereas the industries that tend to have a higher number of women are Information (87.8%), Health Care & Social Assistance (86.8%), and Professional & Scientific (73.1%).
| Industry | Male | Female |
| Agriculture, Fishing & Hunting | 6 (100.0%) | 0 (0.0%) |
| Mining, Quarrying, & Extraction | 0 (0.0%) | 0 (0.0%) |
| Construction | 471 (80.9%) | 111 (19.1%) |
| Manufacturing | 75 (65.8%) | 39 (34.2%) |
| Wholesale Trade | 67 (85.9%) | 11 (14.1%) |
| Retail Trade | 408 (55.4%) | 329 (44.6%) |
| Transportation & Warehousing | 112 (31.4%) | 245 (68.6%) |
| Utilities | 87 (100.0%) | 0 (0.0%) |
| Information | 5 (12.2%) | 36 (87.8%) |
| Finance & Insurance | 41 (34.7%) | 77 (65.2%) |
| Real Estate, Rental & Leasing | 77 (69.4%) | 34 (30.6%) |
| Professional & Scientific | 66 (26.9%) | 179 (73.1%) |
| Enterprise Management | 3 (100.0%) | 0 (0.0%) |
| Administrative & Support | 303 (90.4%) | 32 (9.6%) |
| Educational Services | 289 (49.1%) | 299 (50.8%) |
| Health Care & Social Assistance | 72 (13.2%) | 473 (86.8%) |
| Arts, Entertainment & Recreation | 63 (72.4%) | 24 (27.6%) |
| Accommodation & Food Services | 265 (53.2%) | 233 (46.8%) |
| Public Administration | 247 (75.1%) | 82 (24.9%) |
| Total | 2,729 (53.5%) | 2,367 (46.5%) |
Education in Waihee Waiehu
School Enrollment in Waihee Waiehu
The most common levels of schooling among the 2,261 students in Waihee Waiehu are high school (604 | 26.7%), middle school (568 | 25.1%), and elementary school (445 | 19.7%).
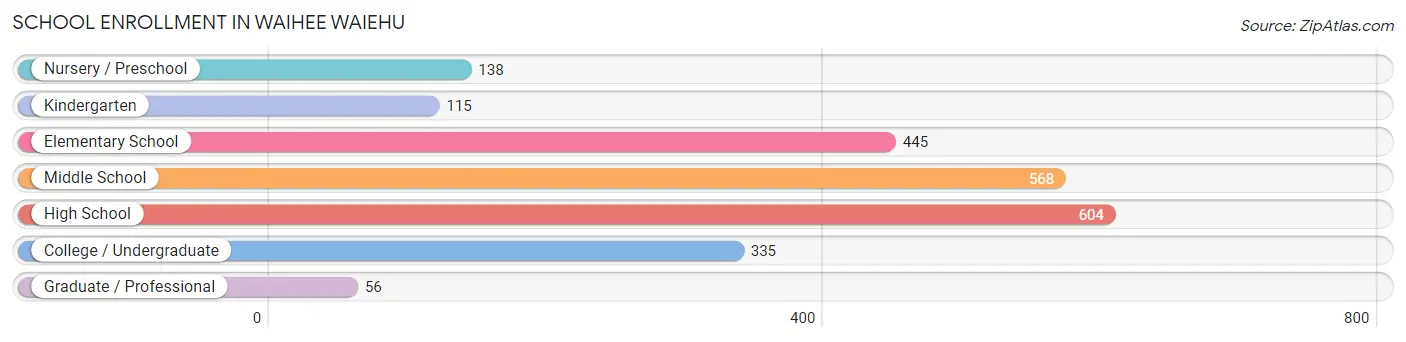
| School Level | # Students | % Students |
| Nursery / Preschool | 138 | 6.1% |
| Kindergarten | 115 | 5.1% |
| Elementary School | 445 | 19.7% |
| Middle School | 568 | 25.1% |
| High School | 604 | 26.7% |
| College / Undergraduate | 335 | 14.8% |
| Graduate / Professional | 56 | 2.5% |
| Total | 2,261 | 100.0% |
School Enrollment by Age by Funding Source in Waihee Waiehu
Out of a total of 2,261 students who are enrolled in schools in Waihee Waiehu, 359 (15.9%) attend a private institution, while the remaining 1,902 (84.1%) are enrolled in public schools. The age group of 3 to 4 year olds has the highest likelihood of being enrolled in private schools, with 34 (38.2% in the age bracket) enrolled. Conversely, the age group of 35 years and over has the lowest likelihood of being enrolled in a private school, with 151 (91.5% in the age bracket) attending a public institution.
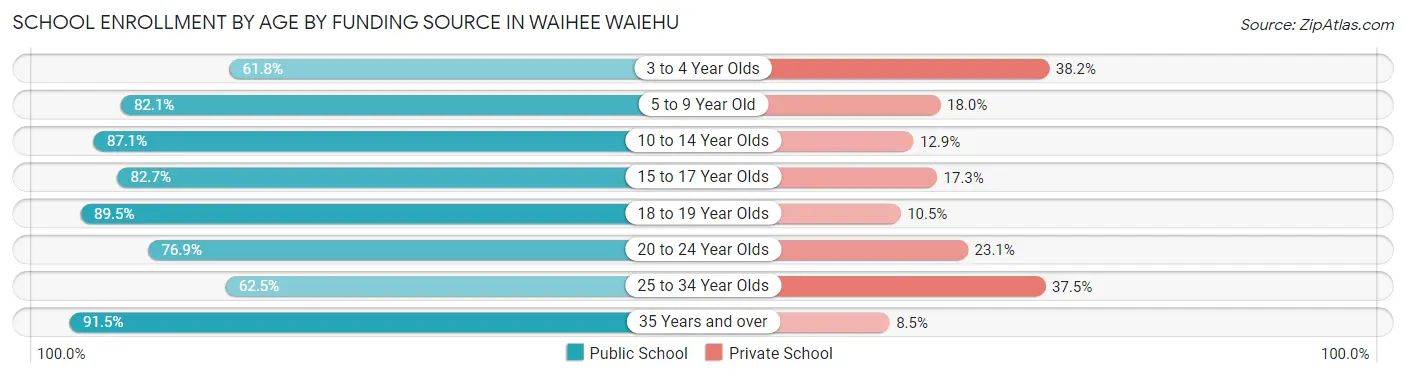
| Age Bracket | Public School | Private School |
| 3 to 4 Year Olds | 55 (61.8%) | 34 (38.2%) |
| 5 to 9 Year Old | 425 (82.1%) | 93 (17.9%) |
| 10 to 14 Year Olds | 661 (87.1%) | 98 (12.9%) |
| 15 to 17 Year Olds | 320 (82.7%) | 67 (17.3%) |
| 18 to 19 Year Olds | 204 (89.5%) | 24 (10.5%) |
| 20 to 24 Year Olds | 70 (76.9%) | 21 (23.1%) |
| 25 to 34 Year Olds | 15 (62.5%) | 9 (37.5%) |
| 35 Years and over | 151 (91.5%) | 14 (8.5%) |
| Total | 1,902 (84.1%) | 359 (15.9%) |
Educational Attainment by Field of Study in Waihee Waiehu
Business (307 | 19.5%), social sciences (207 | 13.1%), education (176 | 11.2%), literature & languages (176 | 11.2%), and visual & performing arts (153 | 9.7%) are the most common fields of study among 1,575 individuals in Waihee Waiehu who have obtained a bachelor's degree or higher.
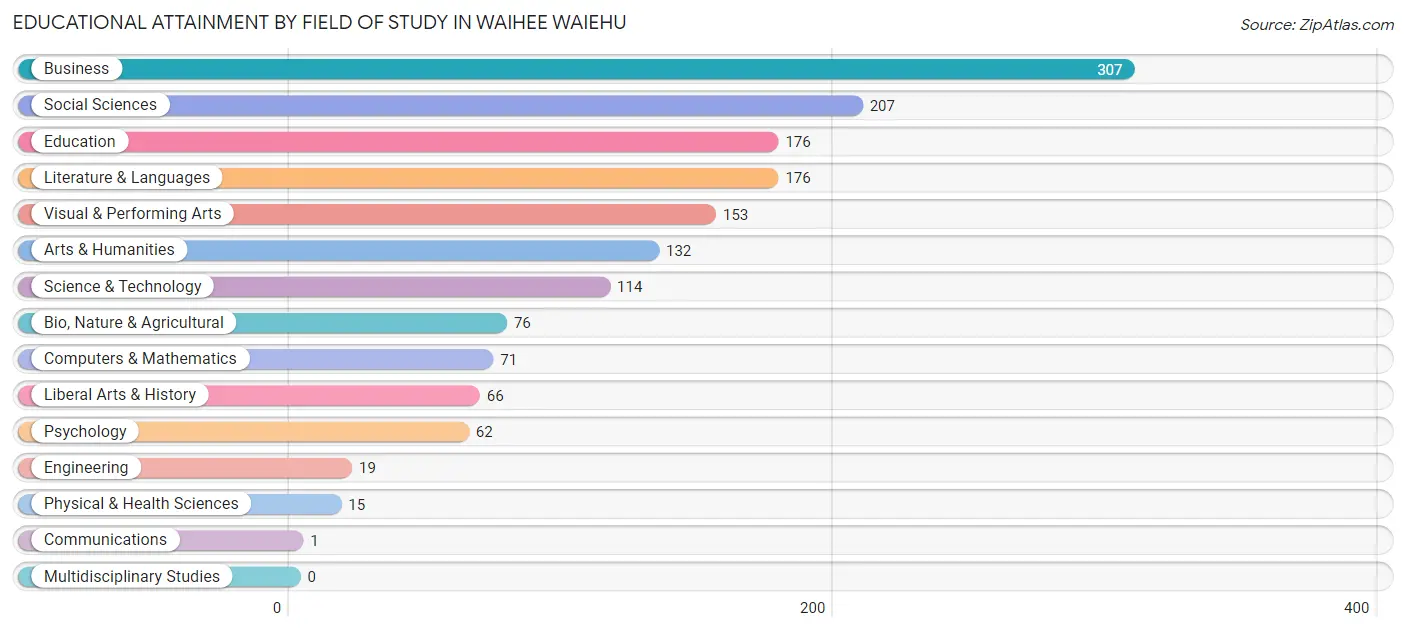
| Field of Study | # Graduates | % Graduates |
| Computers & Mathematics | 71 | 4.5% |
| Bio, Nature & Agricultural | 76 | 4.8% |
| Physical & Health Sciences | 15 | 0.9% |
| Psychology | 62 | 3.9% |
| Social Sciences | 207 | 13.1% |
| Engineering | 19 | 1.2% |
| Multidisciplinary Studies | 0 | 0.0% |
| Science & Technology | 114 | 7.2% |
| Business | 307 | 19.5% |
| Education | 176 | 11.2% |
| Literature & Languages | 176 | 11.2% |
| Liberal Arts & History | 66 | 4.2% |
| Visual & Performing Arts | 153 | 9.7% |
| Communications | 1 | 0.1% |
| Arts & Humanities | 132 | 8.4% |
| Total | 1,575 | 100.0% |
Transportation & Commute in Waihee Waiehu
Vehicle Availability by Sex in Waihee Waiehu
The most prevalent vehicle ownership categories in Waihee Waiehu are males with 3 vehicles (1,036, accounting for 37.1%) and females with 3 vehicles (839, making up 44.6%).
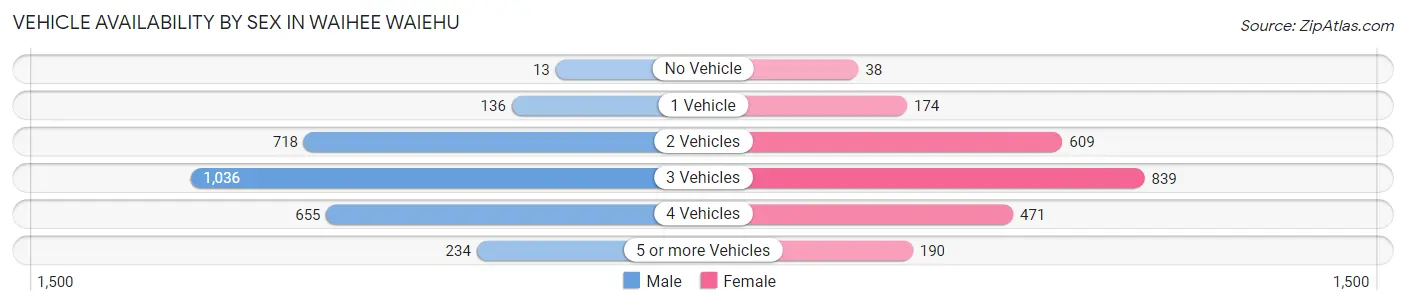
| Vehicles Available | Male | Female |
| No Vehicle | 13 (0.5%) | 38 (1.6%) |
| 1 Vehicle | 136 (4.9%) | 174 (7.5%) |
| 2 Vehicles | 718 (25.7%) | 609 (26.2%) |
| 3 Vehicles | 1,036 (37.1%) | 839 (36.1%) |
| 4 Vehicles | 655 (23.5%) | 471 (20.3%) |
| 5 or more Vehicles | 234 (8.4%) | 190 (8.2%) |
| Total | 2,792 (100.0%) | 2,321 (100.0%) |
Commute Time in Waihee Waiehu
The most frequently occuring commute durations in Waihee Waiehu are 15 to 19 minutes (1,309 commuters, 26.3%), 30 to 34 minutes (830 commuters, 16.7%), and 20 to 24 minutes (804 commuters, 16.1%).
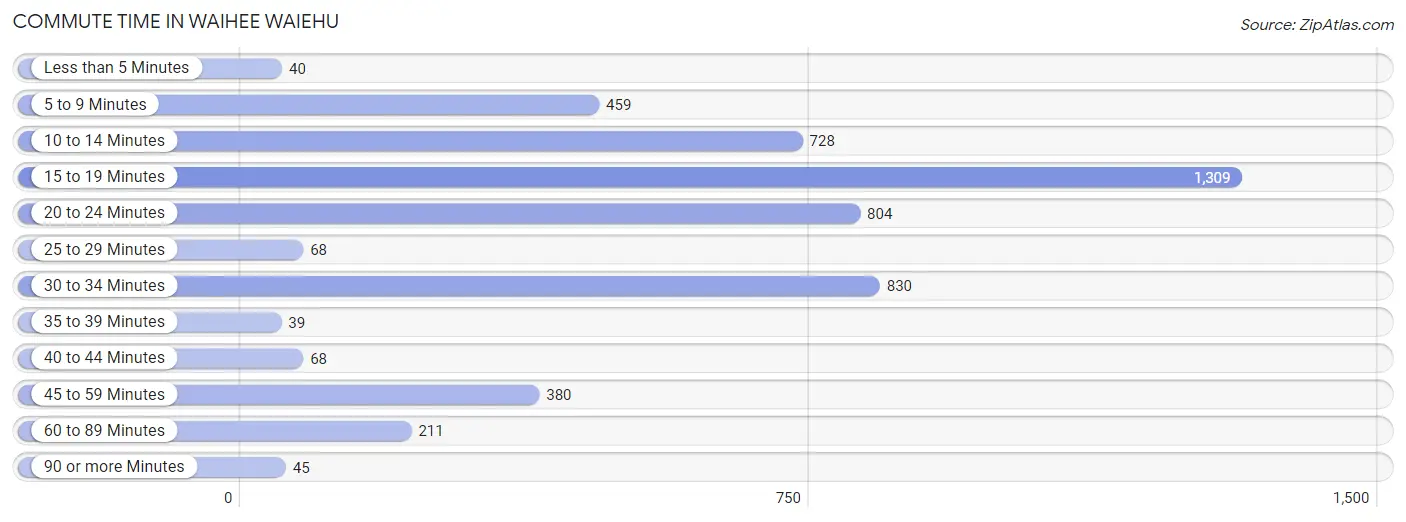
| Commute Time | # Commuters | % Commuters |
| Less than 5 Minutes | 40 | 0.8% |
| 5 to 9 Minutes | 459 | 9.2% |
| 10 to 14 Minutes | 728 | 14.6% |
| 15 to 19 Minutes | 1,309 | 26.3% |
| 20 to 24 Minutes | 804 | 16.1% |
| 25 to 29 Minutes | 68 | 1.4% |
| 30 to 34 Minutes | 830 | 16.7% |
| 35 to 39 Minutes | 39 | 0.8% |
| 40 to 44 Minutes | 68 | 1.4% |
| 45 to 59 Minutes | 380 | 7.6% |
| 60 to 89 Minutes | 211 | 4.2% |
| 90 or more Minutes | 45 | 0.9% |
Commute Time by Sex in Waihee Waiehu
The most common commute times in Waihee Waiehu are 15 to 19 minutes (807 commuters, 29.6%) for males and 15 to 19 minutes (502 commuters, 22.2%) for females.
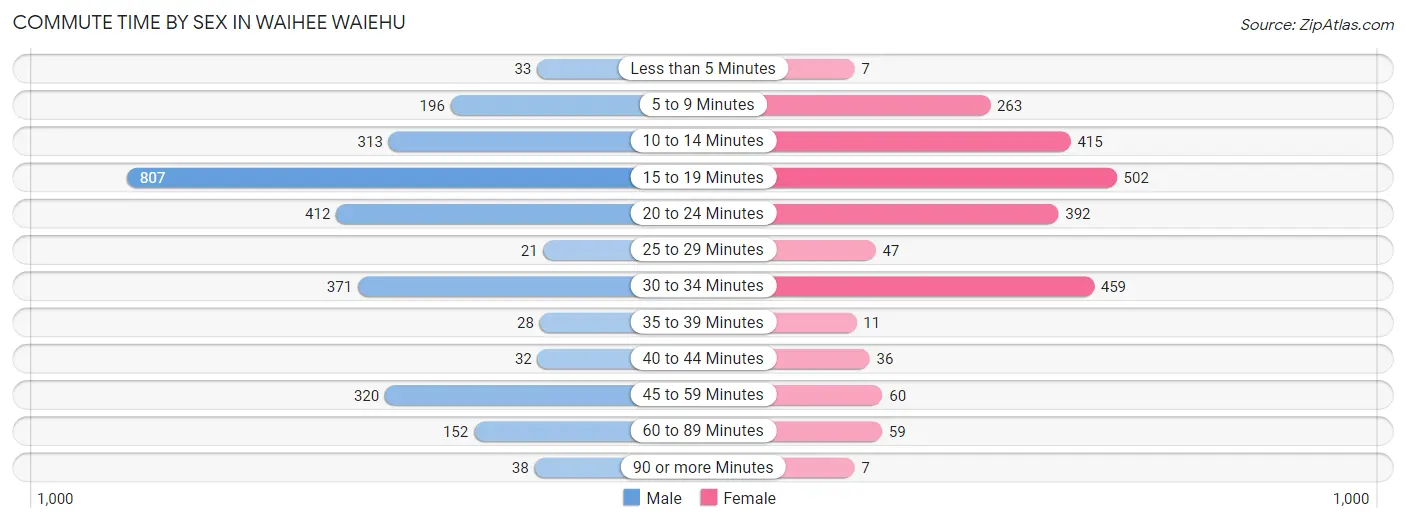
| Commute Time | Male | Female |
| Less than 5 Minutes | 33 (1.2%) | 7 (0.3%) |
| 5 to 9 Minutes | 196 (7.2%) | 263 (11.7%) |
| 10 to 14 Minutes | 313 (11.5%) | 415 (18.4%) |
| 15 to 19 Minutes | 807 (29.6%) | 502 (22.2%) |
| 20 to 24 Minutes | 412 (15.1%) | 392 (17.4%) |
| 25 to 29 Minutes | 21 (0.8%) | 47 (2.1%) |
| 30 to 34 Minutes | 371 (13.6%) | 459 (20.3%) |
| 35 to 39 Minutes | 28 (1.0%) | 11 (0.5%) |
| 40 to 44 Minutes | 32 (1.2%) | 36 (1.6%) |
| 45 to 59 Minutes | 320 (11.7%) | 60 (2.7%) |
| 60 to 89 Minutes | 152 (5.6%) | 59 (2.6%) |
| 90 or more Minutes | 38 (1.4%) | 7 (0.3%) |
Time of Departure to Work by Sex in Waihee Waiehu
The most frequent times of departure to work in Waihee Waiehu are 6:30 AM to 6:59 AM (587, 21.6%) for males and 7:00 AM to 7:29 AM (462, 20.5%) for females.
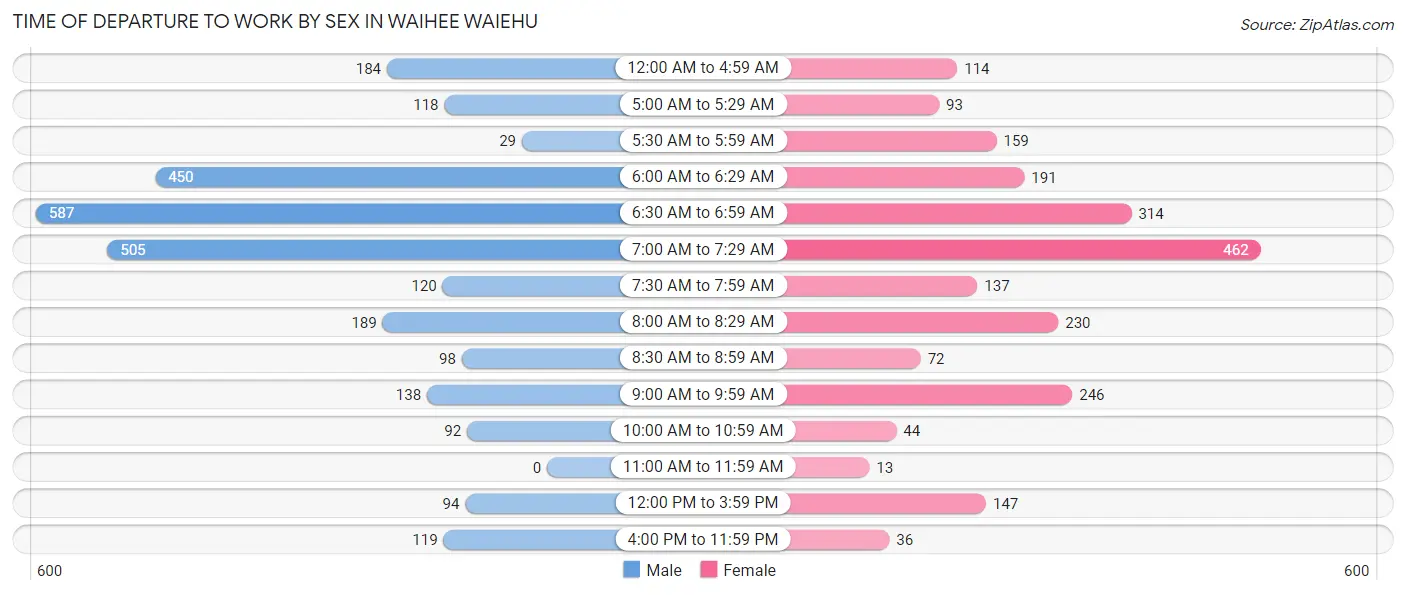
| Time of Departure | Male | Female |
| 12:00 AM to 4:59 AM | 184 (6.8%) | 114 (5.1%) |
| 5:00 AM to 5:29 AM | 118 (4.3%) | 93 (4.1%) |
| 5:30 AM to 5:59 AM | 29 (1.1%) | 159 (7.0%) |
| 6:00 AM to 6:29 AM | 450 (16.5%) | 191 (8.5%) |
| 6:30 AM to 6:59 AM | 587 (21.6%) | 314 (13.9%) |
| 7:00 AM to 7:29 AM | 505 (18.5%) | 462 (20.5%) |
| 7:30 AM to 7:59 AM | 120 (4.4%) | 137 (6.1%) |
| 8:00 AM to 8:29 AM | 189 (6.9%) | 230 (10.2%) |
| 8:30 AM to 8:59 AM | 98 (3.6%) | 72 (3.2%) |
| 9:00 AM to 9:59 AM | 138 (5.1%) | 246 (10.9%) |
| 10:00 AM to 10:59 AM | 92 (3.4%) | 44 (1.9%) |
| 11:00 AM to 11:59 AM | 0 (0.0%) | 13 (0.6%) |
| 12:00 PM to 3:59 PM | 94 (3.5%) | 147 (6.5%) |
| 4:00 PM to 11:59 PM | 119 (4.4%) | 36 (1.6%) |
| Total | 2,723 (100.0%) | 2,258 (100.0%) |
Housing Occupancy in Waihee Waiehu
Occupancy by Ownership in Waihee Waiehu
Of the total 2,641 dwellings in Waihee Waiehu, owner-occupied units account for 2,294 (86.9%), while renter-occupied units make up 347 (13.1%).
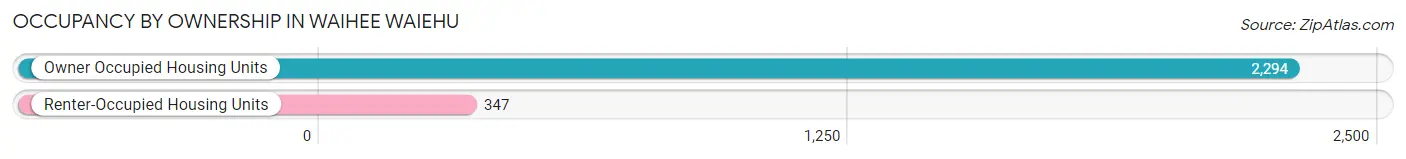
| Occupancy | # Housing Units | % Housing Units |
| Owner Occupied Housing Units | 2,294 | 86.9% |
| Renter-Occupied Housing Units | 347 | 13.1% |
| Total Occupied Housing Units | 2,641 | 100.0% |
Occupancy by Household Size in Waihee Waiehu
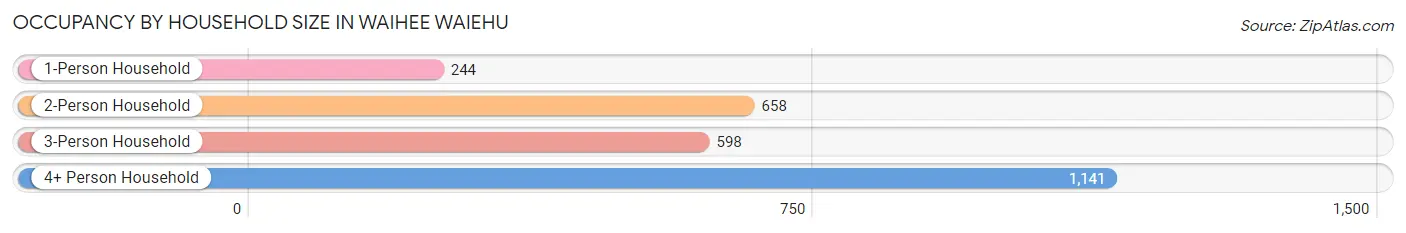
| Household Size | # Housing Units | % Housing Units |
| 1-Person Household | 244 | 9.2% |
| 2-Person Household | 658 | 24.9% |
| 3-Person Household | 598 | 22.6% |
| 4+ Person Household | 1,141 | 43.2% |
| Total Housing Units | 2,641 | 100.0% |
Occupancy by Ownership by Household Size in Waihee Waiehu
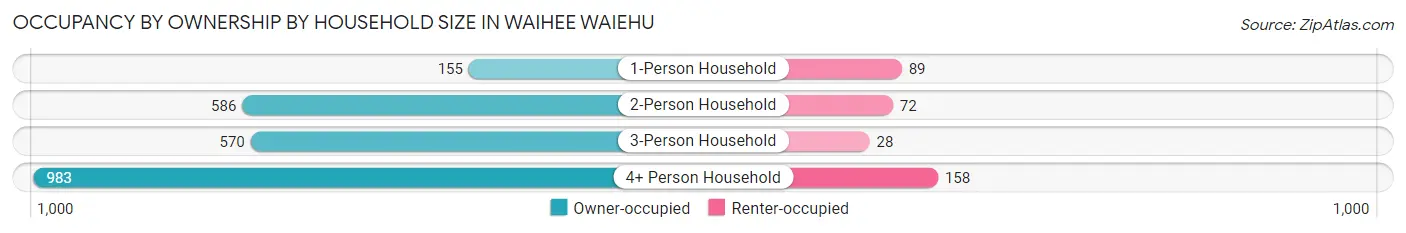
| Household Size | Owner-occupied | Renter-occupied |
| 1-Person Household | 155 (63.5%) | 89 (36.5%) |
| 2-Person Household | 586 (89.1%) | 72 (10.9%) |
| 3-Person Household | 570 (95.3%) | 28 (4.7%) |
| 4+ Person Household | 983 (86.2%) | 158 (13.9%) |
| Total Housing Units | 2,294 (86.9%) | 347 (13.1%) |
Occupancy by Educational Attainment in Waihee Waiehu
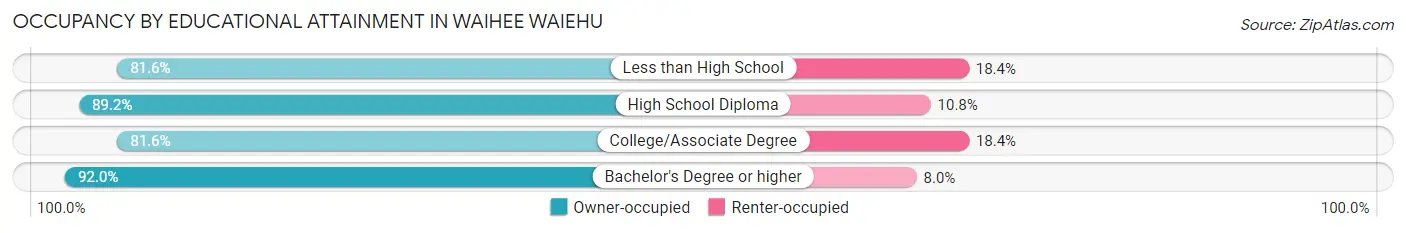
| Household Size | Owner-occupied | Renter-occupied |
| Less than High School | 40 (81.6%) | 9 (18.4%) |
| High School Diploma | 868 (89.2%) | 105 (10.8%) |
| College/Associate Degree | 812 (81.6%) | 183 (18.4%) |
| Bachelor's Degree or higher | 574 (92.0%) | 50 (8.0%) |
Occupancy by Age of Householder in Waihee Waiehu
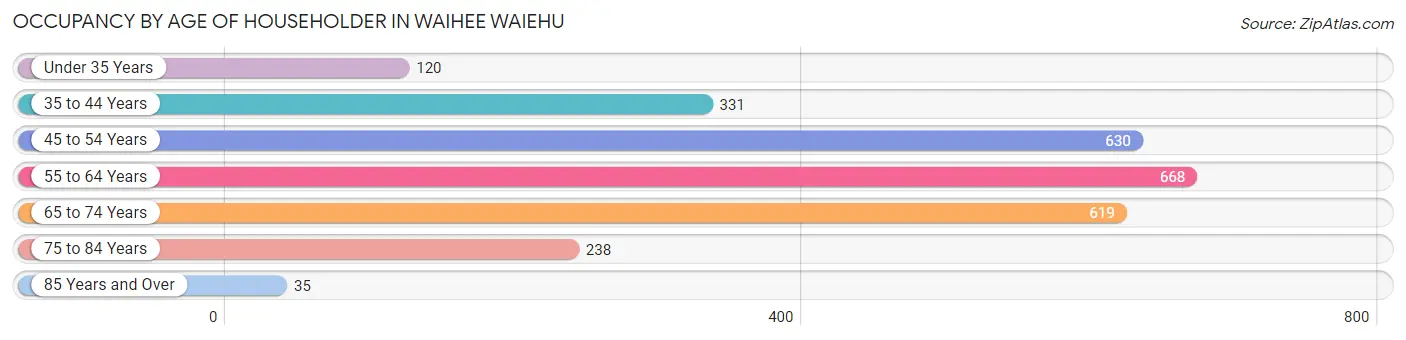
| Age Bracket | # Households | % Households |
| Under 35 Years | 120 | 4.5% |
| 35 to 44 Years | 331 | 12.5% |
| 45 to 54 Years | 630 | 23.8% |
| 55 to 64 Years | 668 | 25.3% |
| 65 to 74 Years | 619 | 23.4% |
| 75 to 84 Years | 238 | 9.0% |
| 85 Years and Over | 35 | 1.3% |
| Total | 2,641 | 100.0% |
Housing Finances in Waihee Waiehu
Median Income by Occupancy in Waihee Waiehu
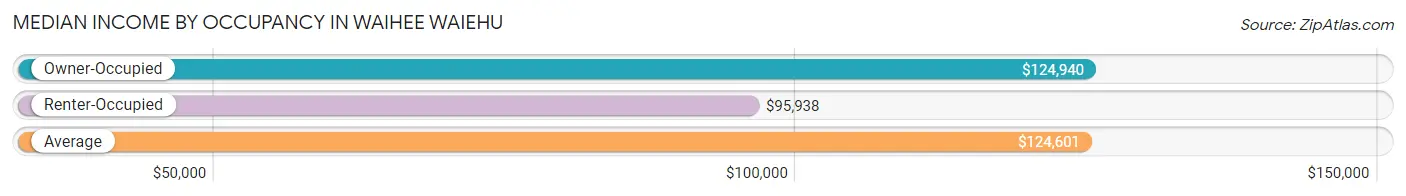
| Occupancy Type | # Households | Median Income |
| Owner-Occupied | 2,294 (86.9%) | $124,940 |
| Renter-Occupied | 347 (13.1%) | $95,938 |
| Average | 2,641 (100.0%) | $124,601 |
Occupancy by Householder Income Bracket in Waihee Waiehu
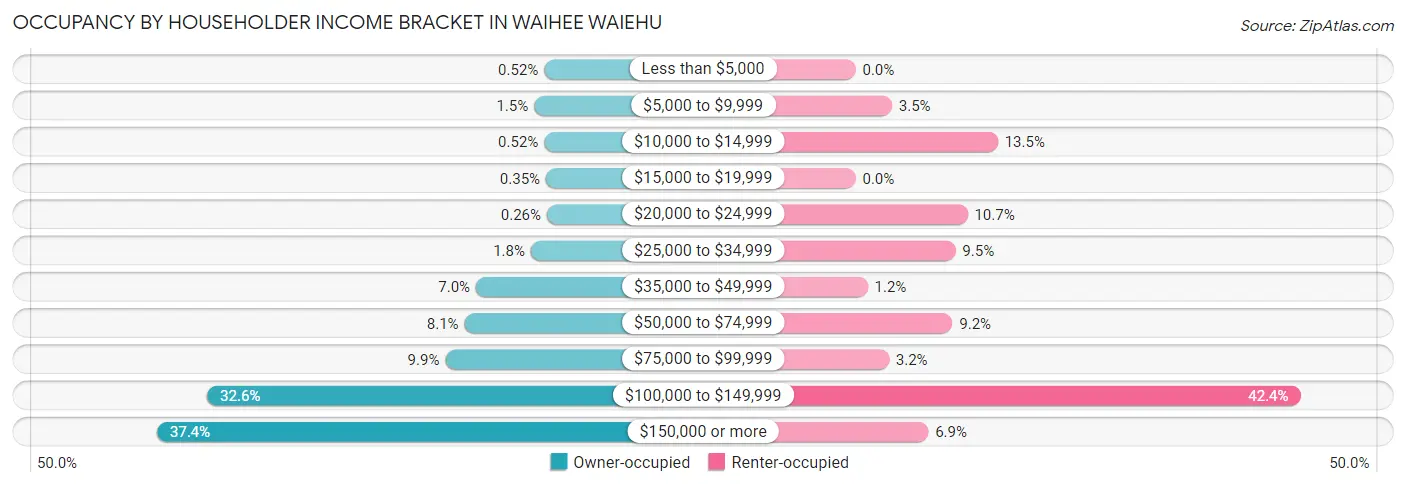
| Income Bracket | Owner-occupied | Renter-occupied |
| Less than $5,000 | 12 (0.5%) | 0 (0.0%) |
| $5,000 to $9,999 | 34 (1.5%) | 12 (3.5%) |
| $10,000 to $14,999 | 12 (0.5%) | 47 (13.5%) |
| $15,000 to $19,999 | 8 (0.4%) | 0 (0.0%) |
| $20,000 to $24,999 | 6 (0.3%) | 37 (10.7%) |
| $25,000 to $34,999 | 41 (1.8%) | 33 (9.5%) |
| $35,000 to $49,999 | 161 (7.0%) | 4 (1.1%) |
| $50,000 to $74,999 | 186 (8.1%) | 32 (9.2%) |
| $75,000 to $99,999 | 228 (9.9%) | 11 (3.2%) |
| $100,000 to $149,999 | 748 (32.6%) | 147 (42.4%) |
| $150,000 or more | 858 (37.4%) | 24 (6.9%) |
| Total | 2,294 (100.0%) | 347 (100.0%) |
Monthly Housing Cost Tiers in Waihee Waiehu
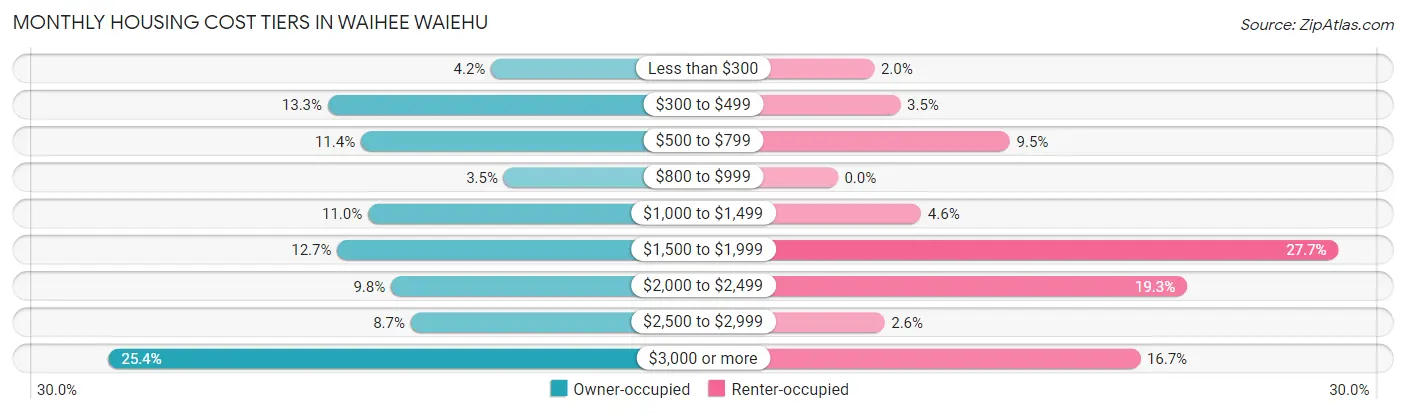
| Monthly Cost | Owner-occupied | Renter-occupied |
| Less than $300 | 97 (4.2%) | 7 (2.0%) |
| $300 to $499 | 304 (13.3%) | 12 (3.5%) |
| $500 to $799 | 262 (11.4%) | 33 (9.5%) |
| $800 to $999 | 81 (3.5%) | 0 (0.0%) |
| $1,000 to $1,499 | 253 (11.0%) | 16 (4.6%) |
| $1,500 to $1,999 | 292 (12.7%) | 96 (27.7%) |
| $2,000 to $2,499 | 224 (9.8%) | 67 (19.3%) |
| $2,500 to $2,999 | 199 (8.7%) | 9 (2.6%) |
| $3,000 or more | 582 (25.4%) | 58 (16.7%) |
| Total | 2,294 (100.0%) | 347 (100.0%) |
Physical Housing Characteristics in Waihee Waiehu
Housing Structures in Waihee Waiehu
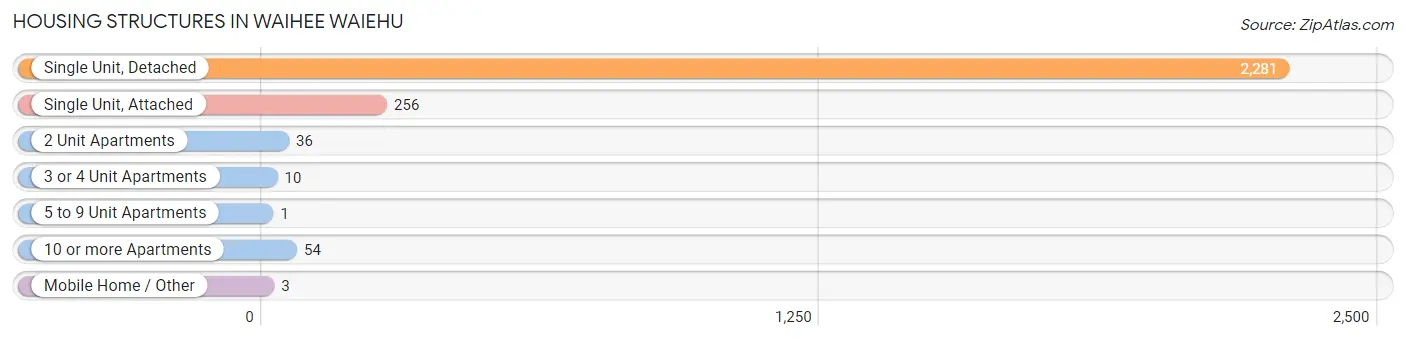
| Structure Type | # Housing Units | % Housing Units |
| Single Unit, Detached | 2,281 | 86.4% |
| Single Unit, Attached | 256 | 9.7% |
| 2 Unit Apartments | 36 | 1.4% |
| 3 or 4 Unit Apartments | 10 | 0.4% |
| 5 to 9 Unit Apartments | 1 | 0.0% |
| 10 or more Apartments | 54 | 2.0% |
| Mobile Home / Other | 3 | 0.1% |
| Total | 2,641 | 100.0% |
Housing Structures by Occupancy in Waihee Waiehu
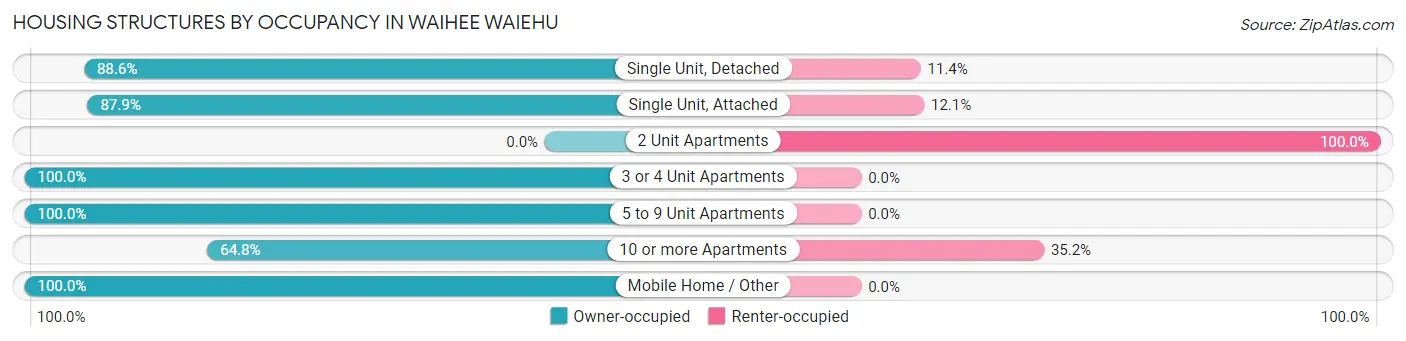
| Structure Type | Owner-occupied | Renter-occupied |
| Single Unit, Detached | 2,020 (88.6%) | 261 (11.4%) |
| Single Unit, Attached | 225 (87.9%) | 31 (12.1%) |
| 2 Unit Apartments | 0 (0.0%) | 36 (100.0%) |
| 3 or 4 Unit Apartments | 10 (100.0%) | 0 (0.0%) |
| 5 to 9 Unit Apartments | 1 (100.0%) | 0 (0.0%) |
| 10 or more Apartments | 35 (64.8%) | 19 (35.2%) |
| Mobile Home / Other | 3 (100.0%) | 0 (0.0%) |
| Total | 2,294 (86.9%) | 347 (13.1%) |
Housing Structures by Number of Rooms in Waihee Waiehu
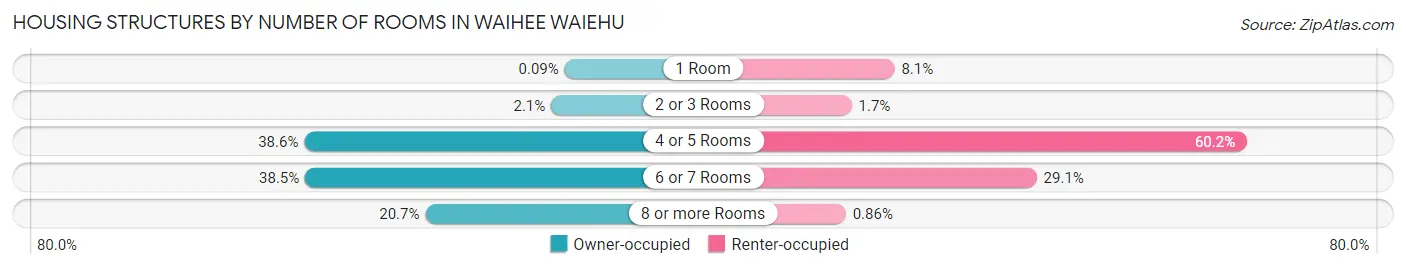
| Number of Rooms | Owner-occupied | Renter-occupied |
| 1 Room | 2 (0.1%) | 28 (8.1%) |
| 2 or 3 Rooms | 48 (2.1%) | 6 (1.7%) |
| 4 or 5 Rooms | 886 (38.6%) | 209 (60.2%) |
| 6 or 7 Rooms | 883 (38.5%) | 101 (29.1%) |
| 8 or more Rooms | 475 (20.7%) | 3 (0.9%) |
| Total | 2,294 (100.0%) | 347 (100.0%) |
Housing Structure by Heating Type in Waihee Waiehu
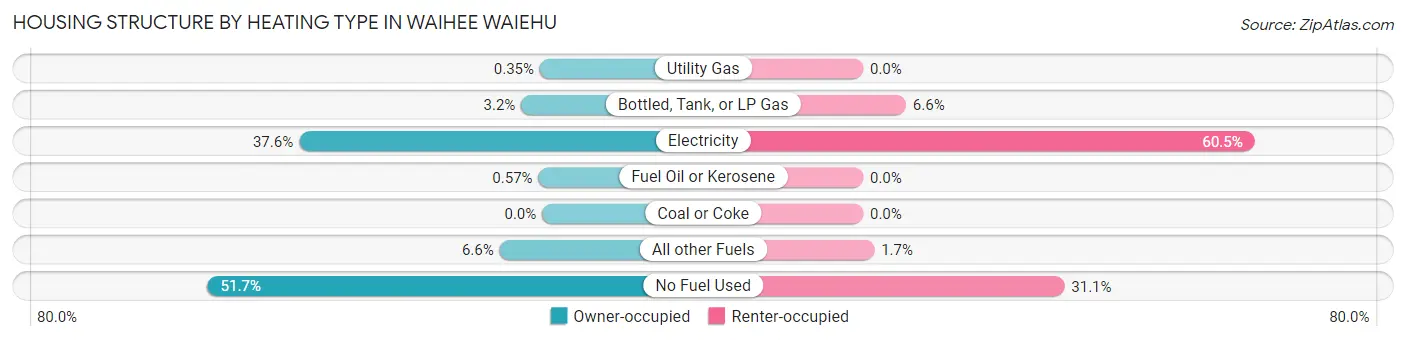
| Heating Type | Owner-occupied | Renter-occupied |
| Utility Gas | 8 (0.4%) | 0 (0.0%) |
| Bottled, Tank, or LP Gas | 74 (3.2%) | 23 (6.6%) |
| Electricity | 862 (37.6%) | 210 (60.5%) |
| Fuel Oil or Kerosene | 13 (0.6%) | 0 (0.0%) |
| Coal or Coke | 0 (0.0%) | 0 (0.0%) |
| All other Fuels | 151 (6.6%) | 6 (1.7%) |
| No Fuel Used | 1,186 (51.7%) | 108 (31.1%) |
| Total | 2,294 (100.0%) | 347 (100.0%) |
Household Vehicle Usage in Waihee Waiehu
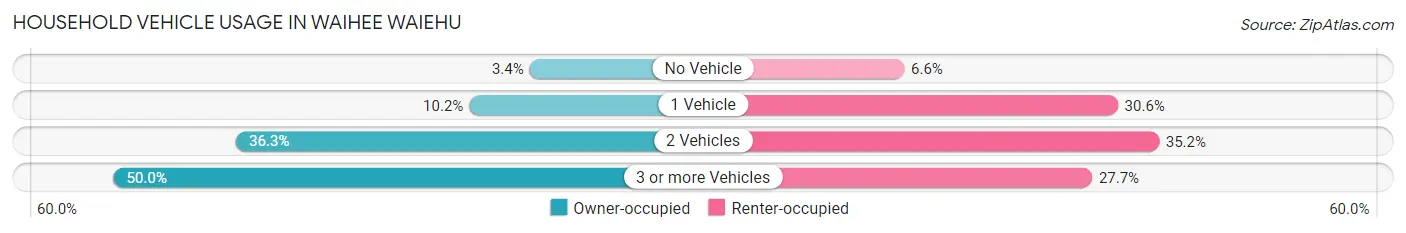
| Vehicles per Household | Owner-occupied | Renter-occupied |
| No Vehicle | 79 (3.4%) | 23 (6.6%) |
| 1 Vehicle | 234 (10.2%) | 106 (30.5%) |
| 2 Vehicles | 833 (36.3%) | 122 (35.2%) |
| 3 or more Vehicles | 1,148 (50.0%) | 96 (27.7%) |
| Total | 2,294 (100.0%) | 347 (100.0%) |
Real Estate & Mortgages in Waihee Waiehu
Real Estate and Mortgage Overview in Waihee Waiehu
| Characteristic | Without Mortgage | With Mortgage |
| Housing Units | 678 | 1,616 |
| Median Property Value | $645,100 | $695,600 |
| Median Household Income | $124,489 | $629 |
| Monthly Housing Costs | $462 | $582 |
| Real Estate Taxes | $1,317 | $128 |
Property Value by Mortgage Status in Waihee Waiehu
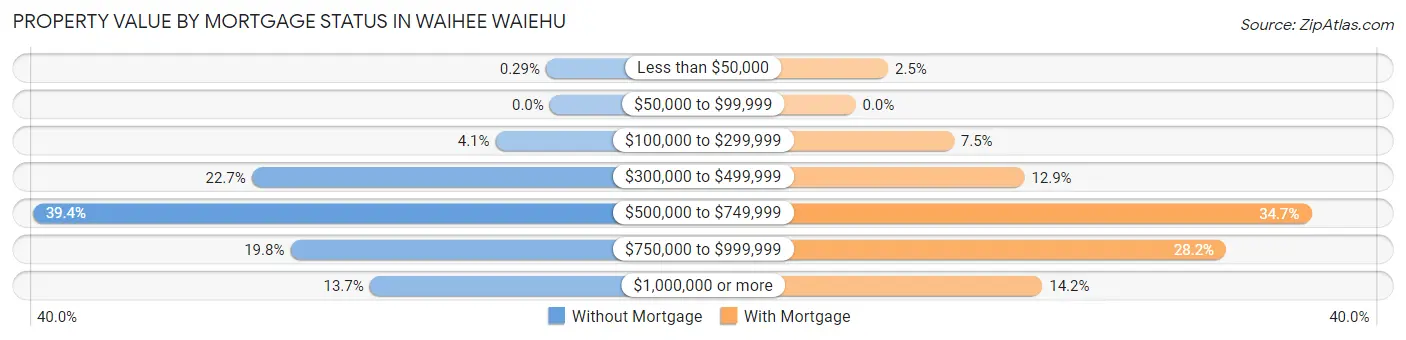
| Property Value | Without Mortgage | With Mortgage |
| Less than $50,000 | 2 (0.3%) | 40 (2.5%) |
| $50,000 to $99,999 | 0 (0.0%) | 0 (0.0%) |
| $100,000 to $299,999 | 28 (4.1%) | 121 (7.5%) |
| $300,000 to $499,999 | 154 (22.7%) | 208 (12.9%) |
| $500,000 to $749,999 | 267 (39.4%) | 561 (34.7%) |
| $750,000 to $999,999 | 134 (19.8%) | 456 (28.2%) |
| $1,000,000 or more | 93 (13.7%) | 230 (14.2%) |
| Total | 678 (100.0%) | 1,616 (100.0%) |
Household Income by Mortgage Status in Waihee Waiehu
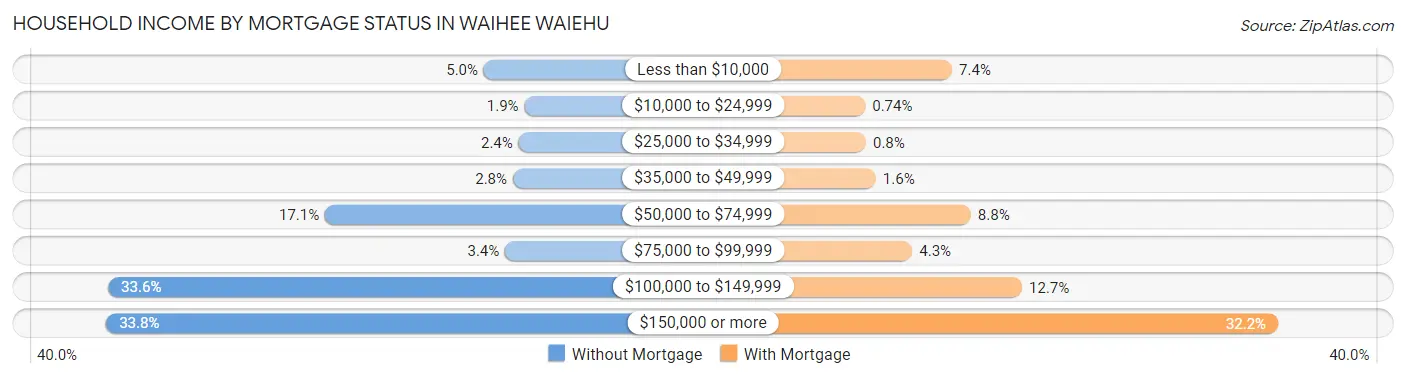
| Household Income | Without Mortgage | With Mortgage |
| Less than $10,000 | 34 (5.0%) | 119 (7.4%) |
| $10,000 to $24,999 | 13 (1.9%) | 12 (0.7%) |
| $25,000 to $34,999 | 16 (2.4%) | 13 (0.8%) |
| $35,000 to $49,999 | 19 (2.8%) | 25 (1.5%) |
| $50,000 to $74,999 | 116 (17.1%) | 142 (8.8%) |
| $75,000 to $99,999 | 23 (3.4%) | 70 (4.3%) |
| $100,000 to $149,999 | 228 (33.6%) | 205 (12.7%) |
| $150,000 or more | 229 (33.8%) | 520 (32.2%) |
| Total | 678 (100.0%) | 1,616 (100.0%) |
Property Value to Household Income Ratio in Waihee Waiehu
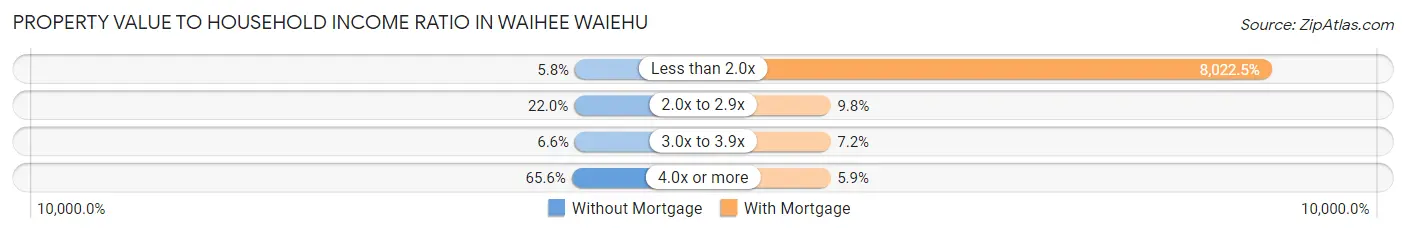
| Value-to-Income Ratio | Without Mortgage | With Mortgage |
| Less than 2.0x | 39 (5.8%) | 129,643 (8,022.5%) |
| 2.0x to 2.9x | 149 (22.0%) | 158 (9.8%) |
| 3.0x to 3.9x | 45 (6.6%) | 116 (7.2%) |
| 4.0x or more | 445 (65.6%) | 96 (5.9%) |
| Total | 678 (100.0%) | 1,616 (100.0%) |
Real Estate Taxes by Mortgage Status in Waihee Waiehu
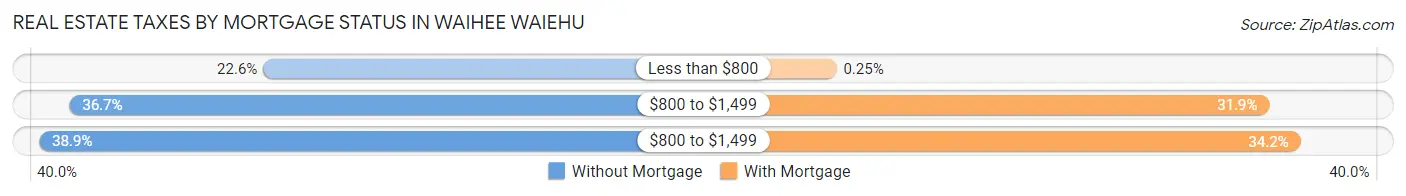
| Property Taxes | Without Mortgage | With Mortgage |
| Less than $800 | 153 (22.6%) | 4 (0.3%) |
| $800 to $1,499 | 249 (36.7%) | 515 (31.9%) |
| $800 to $1,499 | 264 (38.9%) | 552 (34.2%) |
| Total | 678 (100.0%) | 1,616 (100.0%) |
Health & Disability in Waihee Waiehu
Health Insurance Coverage by Age in Waihee Waiehu
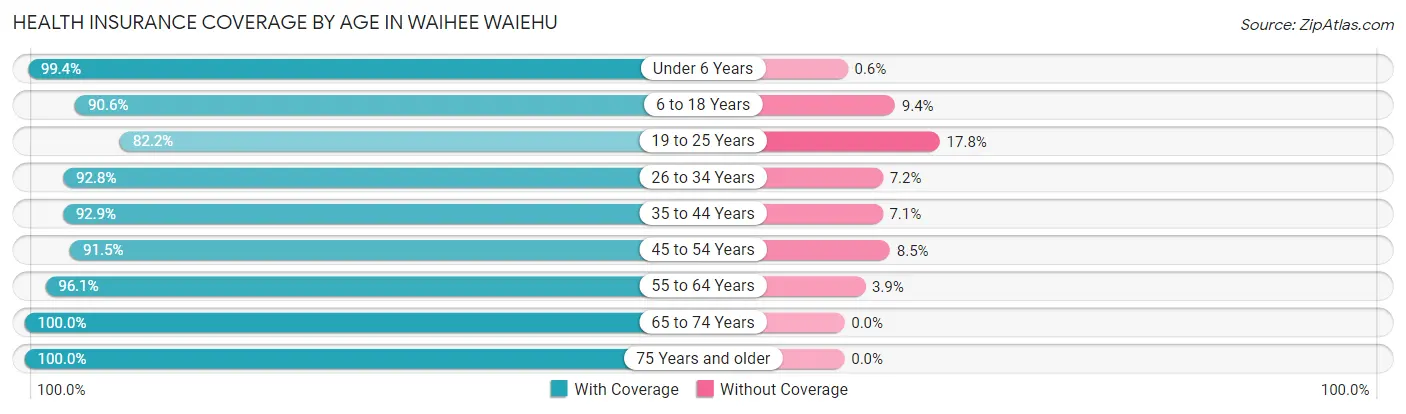
| Age Bracket | With Coverage | Without Coverage |
| Under 6 Years | 828 (99.4%) | 5 (0.6%) |
| 6 to 18 Years | 1,921 (90.6%) | 200 (9.4%) |
| 19 to 25 Years | 615 (82.2%) | 133 (17.8%) |
| 26 to 34 Years | 932 (92.8%) | 72 (7.2%) |
| 35 to 44 Years | 1,346 (92.9%) | 103 (7.1%) |
| 45 to 54 Years | 1,377 (91.5%) | 128 (8.5%) |
| 55 to 64 Years | 1,147 (96.1%) | 46 (3.9%) |
| 65 to 74 Years | 1,283 (100.0%) | 0 (0.0%) |
| 75 Years and older | 806 (100.0%) | 0 (0.0%) |
| Total | 10,255 (93.7%) | 687 (6.3%) |
Health Insurance Coverage by Citizenship Status in Waihee Waiehu
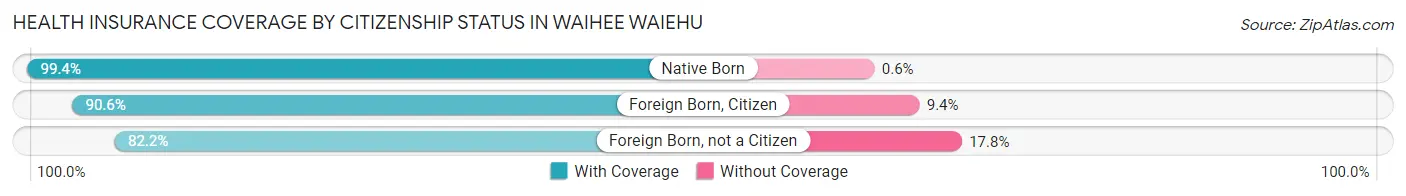
| Citizenship Status | With Coverage | Without Coverage |
| Native Born | 828 (99.4%) | 5 (0.6%) |
| Foreign Born, Citizen | 1,921 (90.6%) | 200 (9.4%) |
| Foreign Born, not a Citizen | 615 (82.2%) | 133 (17.8%) |
Health Insurance Coverage by Household Income in Waihee Waiehu
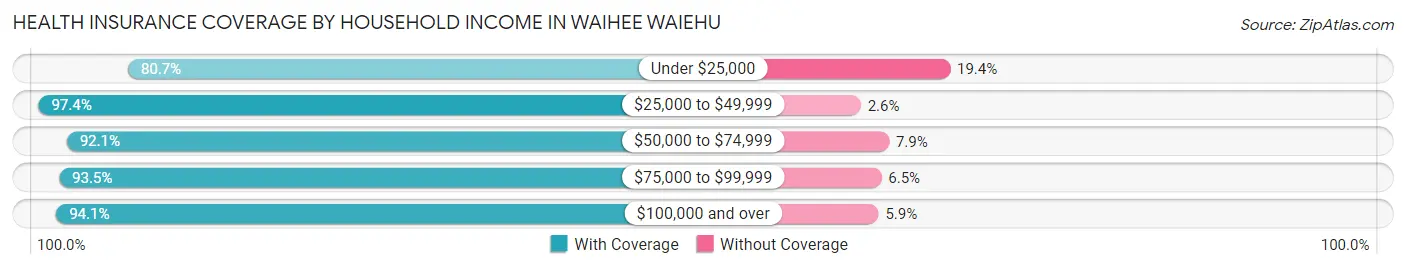
| Household Income | With Coverage | Without Coverage |
| Under $25,000 | 225 (80.6%) | 54 (19.4%) |
| $25,000 to $49,999 | 486 (97.4%) | 13 (2.6%) |
| $50,000 to $74,999 | 641 (92.1%) | 55 (7.9%) |
| $75,000 to $99,999 | 781 (93.5%) | 54 (6.5%) |
| $100,000 and over | 8,108 (94.1%) | 511 (5.9%) |
Public vs Private Health Insurance Coverage by Age in Waihee Waiehu

| Age Bracket | Public Insurance | Private Insurance |
| Under 6 | 530 (63.6%) | 472 (56.7%) |
| 6 to 18 Years | 458 (21.6%) | 1,547 (72.9%) |
| 19 to 25 Years | 128 (17.1%) | 566 (75.7%) |
| 25 to 34 Years | 222 (22.1%) | 772 (76.9%) |
| 35 to 44 Years | 185 (12.8%) | 1,210 (83.5%) |
| 45 to 54 Years | 270 (17.9%) | 1,204 (80.0%) |
| 55 to 64 Years | 236 (19.8%) | 1,007 (84.4%) |
| 65 to 74 Years | 1,243 (96.9%) | 1,041 (81.1%) |
| 75 Years and over | 806 (100.0%) | 620 (76.9%) |
| Total | 4,078 (37.3%) | 8,439 (77.1%) |
Disability Status by Sex by Age in Waihee Waiehu
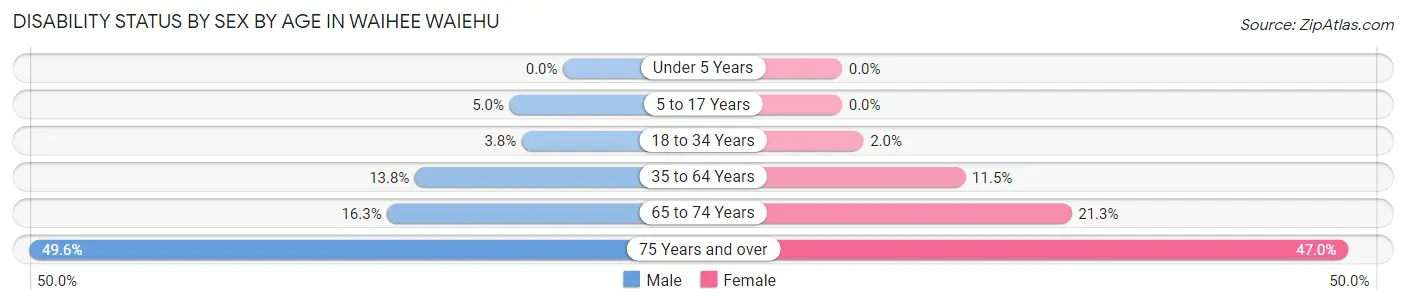
| Age Bracket | Male | Female |
| Under 5 Years | 0 (0.0%) | 0 (0.0%) |
| 5 to 17 Years | 49 (5.0%) | 0 (0.0%) |
| 18 to 34 Years | 42 (3.8%) | 17 (2.0%) |
| 35 to 64 Years | 300 (13.8%) | 225 (11.5%) |
| 65 to 74 Years | 109 (16.3%) | 131 (21.3%) |
| 75 Years and over | 176 (49.6%) | 212 (47.0%) |
Disability Class by Sex by Age in Waihee Waiehu
Disability Class: Hearing Difficulty
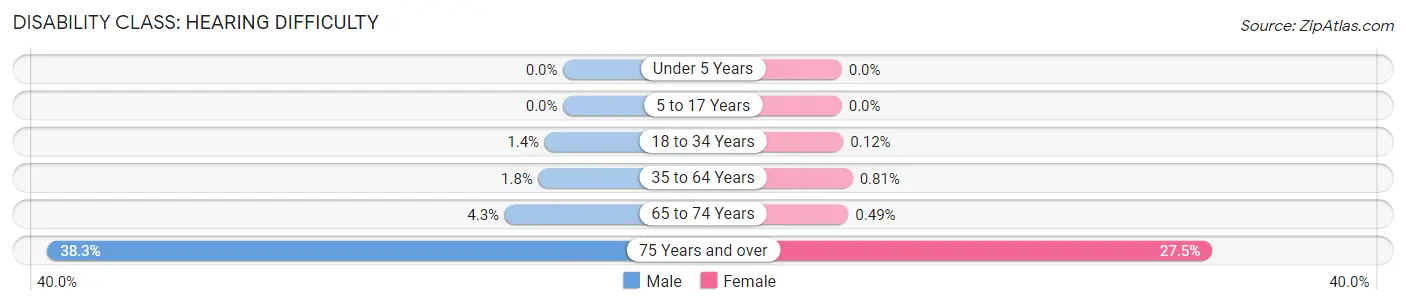
| Age Bracket | Male | Female |
| Under 5 Years | 0 (0.0%) | 0 (0.0%) |
| 5 to 17 Years | 0 (0.0%) | 0 (0.0%) |
| 18 to 34 Years | 15 (1.4%) | 1 (0.1%) |
| 35 to 64 Years | 40 (1.8%) | 16 (0.8%) |
| 65 to 74 Years | 29 (4.3%) | 3 (0.5%) |
| 75 Years and over | 136 (38.3%) | 124 (27.5%) |
Disability Class: Vision Difficulty
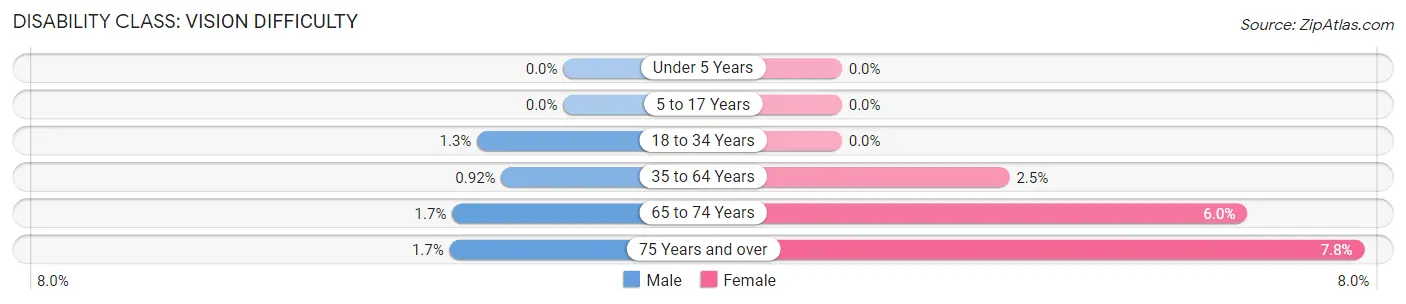
| Age Bracket | Male | Female |
| Under 5 Years | 0 (0.0%) | 0 (0.0%) |
| 5 to 17 Years | 0 (0.0%) | 0 (0.0%) |
| 18 to 34 Years | 14 (1.3%) | 0 (0.0%) |
| 35 to 64 Years | 20 (0.9%) | 49 (2.5%) |
| 65 to 74 Years | 11 (1.7%) | 37 (6.0%) |
| 75 Years and over | 6 (1.7%) | 35 (7.8%) |
Disability Class: Cognitive Difficulty
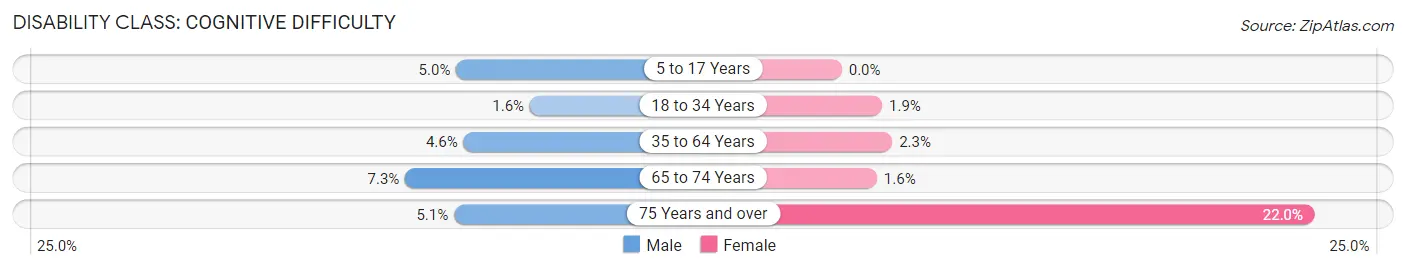
| Age Bracket | Male | Female |
| 5 to 17 Years | 49 (5.0%) | 0 (0.0%) |
| 18 to 34 Years | 17 (1.5%) | 16 (1.9%) |
| 35 to 64 Years | 101 (4.6%) | 46 (2.3%) |
| 65 to 74 Years | 49 (7.3%) | 10 (1.6%) |
| 75 Years and over | 18 (5.1%) | 99 (22.0%) |
Disability Class: Ambulatory Difficulty
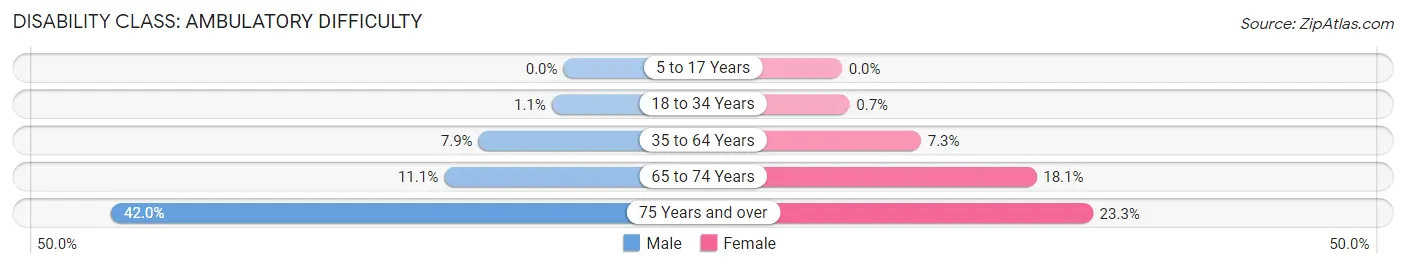
| Age Bracket | Male | Female |
| 5 to 17 Years | 0 (0.0%) | 0 (0.0%) |
| 18 to 34 Years | 12 (1.1%) | 6 (0.7%) |
| 35 to 64 Years | 172 (7.9%) | 144 (7.3%) |
| 65 to 74 Years | 74 (11.1%) | 111 (18.0%) |
| 75 Years and over | 149 (42.0%) | 105 (23.3%) |
Disability Class: Self-Care Difficulty
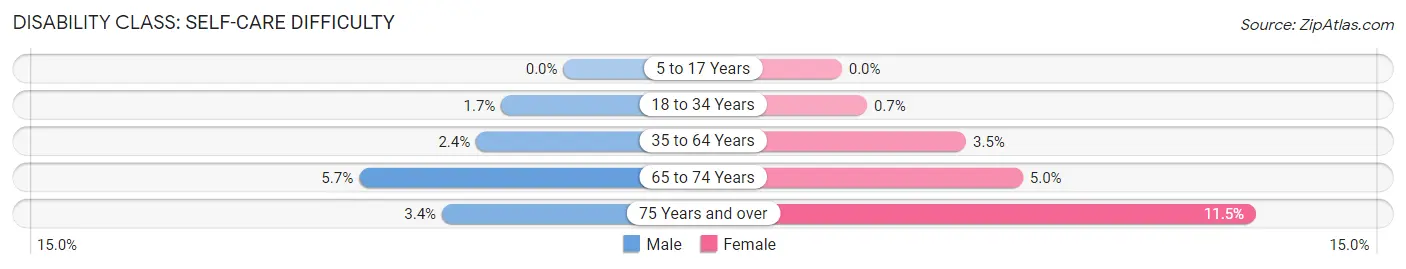
| Age Bracket | Male | Female |
| 5 to 17 Years | 0 (0.0%) | 0 (0.0%) |
| 18 to 34 Years | 19 (1.7%) | 6 (0.7%) |
| 35 to 64 Years | 53 (2.4%) | 68 (3.5%) |
| 65 to 74 Years | 38 (5.7%) | 31 (5.0%) |
| 75 Years and over | 12 (3.4%) | 52 (11.5%) |
Technology Access in Waihee Waiehu
Computing Device Access in Waihee Waiehu
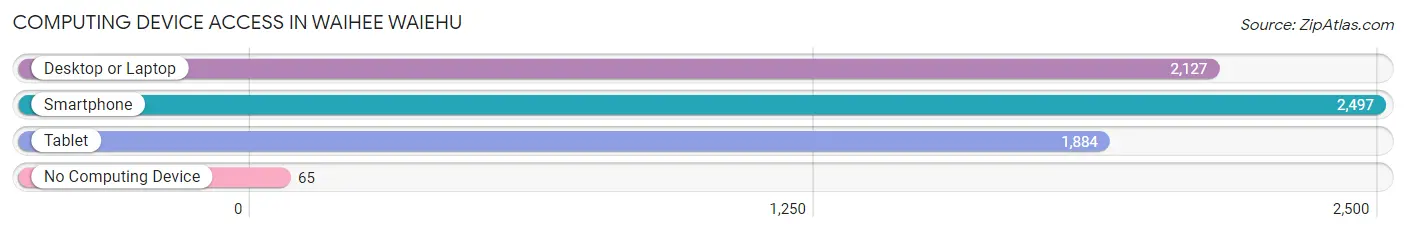
| Device Type | # Households | % Households |
| Desktop or Laptop | 2,127 | 80.5% |
| Smartphone | 2,497 | 94.6% |
| Tablet | 1,884 | 71.3% |
| No Computing Device | 65 | 2.5% |
| Total | 2,641 | 100.0% |
Internet Access in Waihee Waiehu
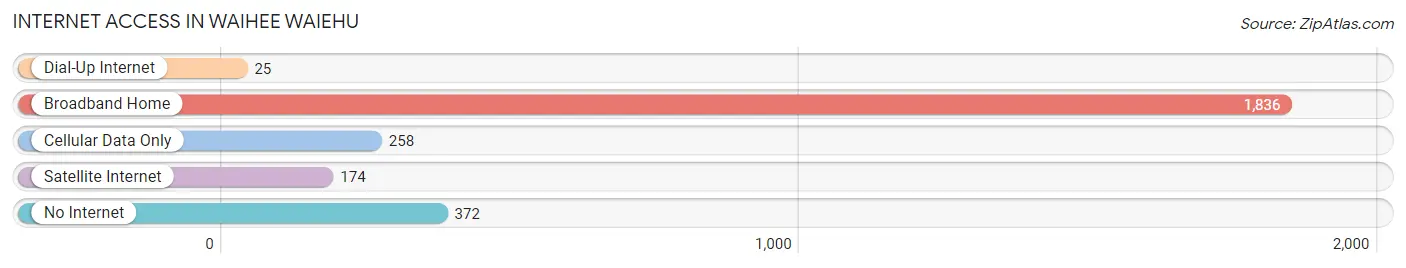
| Internet Type | # Households | % Households |
| Dial-Up Internet | 25 | 0.9% |
| Broadband Home | 1,836 | 69.5% |
| Cellular Data Only | 258 | 9.8% |
| Satellite Internet | 174 | 6.6% |
| No Internet | 372 | 14.1% |
| Total | 2,641 | 100.0% |
Waihee Waiehu Summary
Waihee Waiehu is a census-designated place (CDP) located in Maui County, Hawaii, United States. The population was 4,845 at the 2010 census. It is located on the western side of the island of Maui, and is part of the Kahului-Wailuku-Lahaina Metropolitan Statistical Area.
History
The area of Waihee Waiehu was originally inhabited by Native Hawaiians. The area was first settled by Europeans in the early 1800s, when missionaries and whalers arrived in the area. The area was then developed for sugar cane production in the late 1800s. The Waihee Sugar Mill was built in 1876 and operated until the early 1900s. The area was then used for pineapple production until the late 1960s.
Geography
Waihee Waiehu is located at 20°53'25"N 156°30'17"W (20.890278, -156.504722). It is bordered to the north by Wailuku, to the east by Waiehu, to the south by Waikapu, and to the west by the Pacific Ocean.
The total area of Waihee Waiehu is 4.2 square miles, of which 0.1 square miles is water. The terrain is mostly flat, with some rolling hills. The climate is tropical, with temperatures ranging from the mid-70s to the mid-80s.
Economy
The economy of Waihee Waiehu is largely based on tourism and agriculture. The area is home to several resorts and hotels, as well as several restaurants and shops. Agriculture is also an important part of the economy, with the area being home to several farms and ranches.
Demographics
As of the 2010 census, there were 4,845 people, 1,845 households, and 1,269 families residing in Waihee Waiehu. The population density was 1,159.3 people per square mile. The racial makeup of the CDP was 44.3% White, 0.7% African American, 0.3% Native American, 28.2% Asian, 8.2% Pacific Islander, and 17.5% from other races. Hispanic or Latino of any race were 24.2% of the population.
The median income for a household in Waihee Waiehu was $50,938, and the median income for a family was $60,938. The per capita income for the CDP was $22,938. About 8.2% of families and 11.2% of the population were below the poverty line, including 15.2% of those under age 18 and 6.2% of those age 65 or over.
Conclusion
Waihee Waiehu is a census-designated place located in Maui County, Hawaii. It has a rich history, with the area being first settled by Europeans in the early 1800s. The economy of Waihee Waiehu is largely based on tourism and agriculture, with the area being home to several resorts and hotels, as well as several farms and ranches. As of the 2010 census, the population of Waihee Waiehu was 4,845. The median income for a household in Waihee Waiehu was $50,938, and the median income for a family was $60,938.
Common Questions
What is Per Capita Income in Waihee Waiehu?
Per Capita income in Waihee Waiehu is $33,828.
What is the Median Family Income in Waihee Waiehu?
Median Family Income in Waihee Waiehu is $124,535.
What is the Median Household income in Waihee Waiehu?
Median Household Income in Waihee Waiehu is $124,601.
What is Income or Wage Gap in Waihee Waiehu?
Income or Wage Gap in Waihee Waiehu is 11.2%.
Women in Waihee Waiehu earn 88.8 cents for every dollar earned by a man.
What is Inequality or Gini Index in Waihee Waiehu?
Inequality or Gini Index in Waihee Waiehu is 0.32.
What is the Total Population of Waihee Waiehu?
Total Population of Waihee Waiehu is 11,029.
What is the Total Male Population of Waihee Waiehu?
Total Male Population of Waihee Waiehu is 5,737.
What is the Total Female Population of Waihee Waiehu?
Total Female Population of Waihee Waiehu is 5,292.
What is the Ratio of Males per 100 Females in Waihee Waiehu?
There are 108.41 Males per 100 Females in Waihee Waiehu.
What is the Ratio of Females per 100 Males in Waihee Waiehu?
There are 92.24 Females per 100 Males in Waihee Waiehu.
What is the Median Population Age in Waihee Waiehu?
Median Population Age in Waihee Waiehu is 39.1 Years.
What is the Average Family Size in Waihee Waiehu
Average Family Size in Waihee Waiehu is 4.3 People.
What is the Average Household Size in Waihee Waiehu
Average Household Size in Waihee Waiehu is 4.2 People.
How Large is the Labor Force in Waihee Waiehu?
There are 5,340 People in the Labor Forcein in Waihee Waiehu.
What is the Percentage of People in the Labor Force in Waihee Waiehu?
62.5% of People are in the Labor Force in Waihee Waiehu.
What is the Unemployment Rate in Waihee Waiehu?
Unemployment Rate in Waihee Waiehu is 3.1%.