Aspen, CO Map & Demographics
Aspen Map
Aspen Overview
$102,089
PER CAPITA INCOME
$134,609
AVG FAMILY INCOME
$94,338
AVG HOUSEHOLD INCOME
5.9%
WAGE / INCOME GAP [ % ]
94.1¢/ $1
WAGE / INCOME GAP [ $ ]
0.61
INEQUALITY / GINI INDEX
6,952
TOTAL POPULATION
3,631
MALE POPULATION
3,321
FEMALE POPULATION
109.33
MALES / 100 FEMALES
91.46
FEMALES / 100 MALES
41.3
MEDIAN AGE
2.5
AVG FAMILY SIZE
1.8
AVG HOUSEHOLD SIZE
4,693
LABOR FORCE [ PEOPLE ]
74.4%
PERCENT IN LABOR FORCE
2.4%
UNEMPLOYMENT RATE
Aspen Area Codes
Income in Aspen
Income Overview in Aspen
Per Capita Income in Aspen is $102,089, while median incomes of families and households are $134,609 and $94,338 respectively.
| Characteristic | Number | Measure |
| Per Capita Income | 6,952 | $102,089 |
| Median Family Income | 1,594 | $134,609 |
| Mean Family Income | 1,594 | $300,702 |
| Median Household Income | 3,746 | $94,338 |
| Mean Household Income | 3,746 | $188,344 |
| Income Deficit | 1,594 | $0 |
| Wage / Income Gap (%) | 6,952 | 5.92% |
| Wage / Income Gap ($) | 6,952 | 94.08¢ per $1 |
| Gini / Inequality Index | 6,952 | 0.61 |
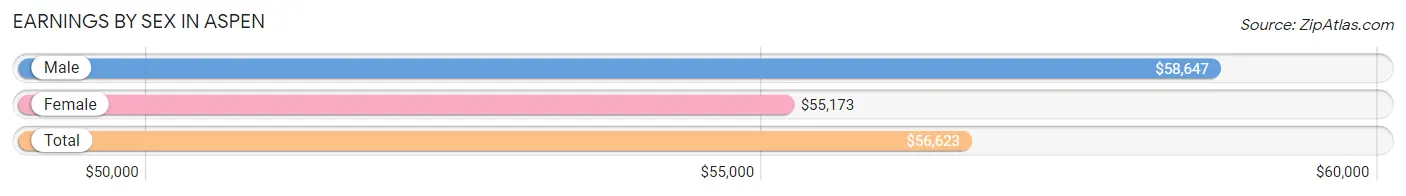
Earnings by Sex in Aspen
Average Earnings in Aspen are $56,623, $58,647 for men and $55,173 for women, a difference of 5.9%.
| Sex | Number | Average Earnings |
| Male | 2,815 (54.5%) | $58,647 |
| Female | 2,353 (45.5%) | $55,173 |
| Total | 5,168 (100.0%) | $56,623 |
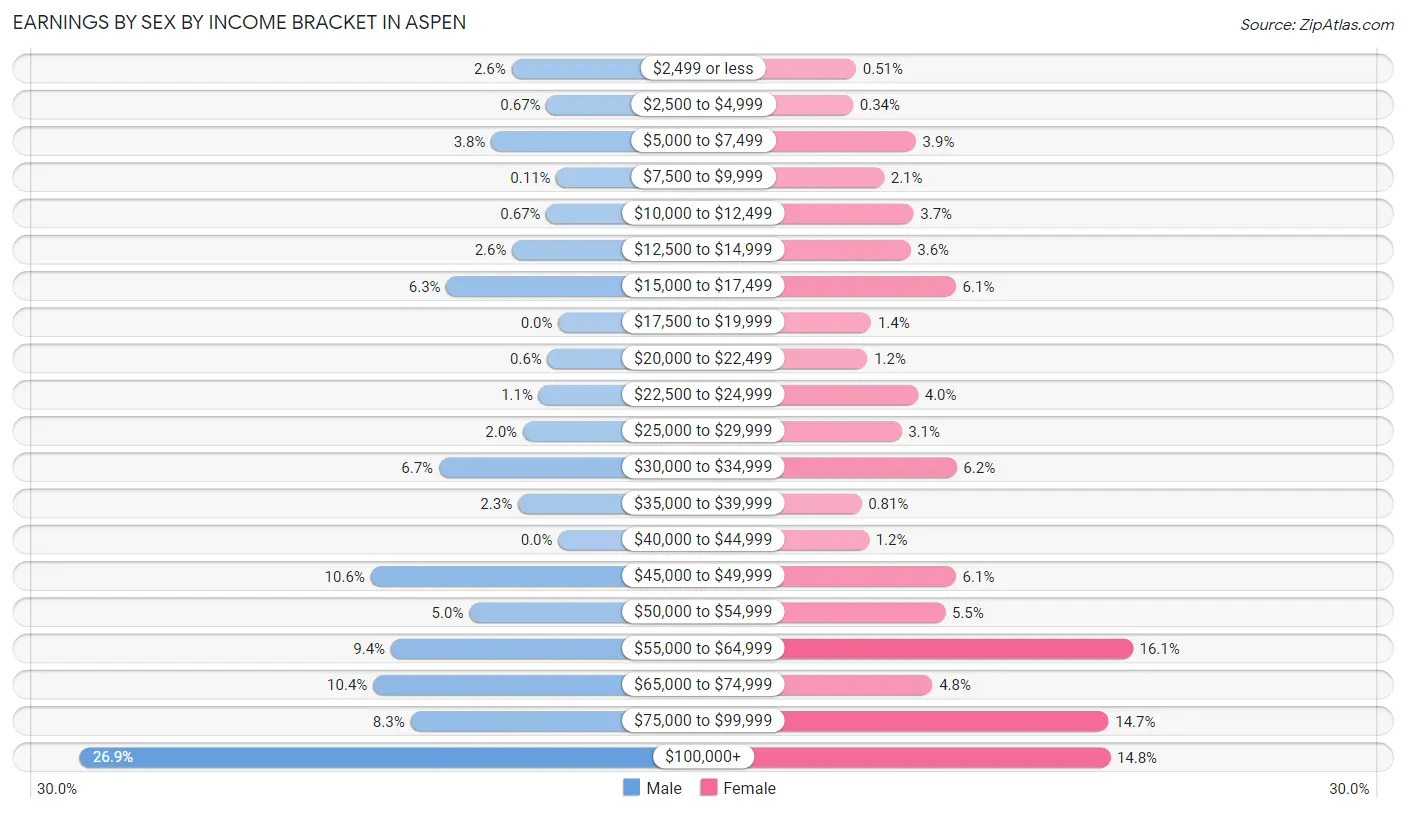
Earnings by Sex by Income Bracket in Aspen
The most common earnings brackets in Aspen are $100,000+ for men (757 | 26.9%) and $55,000 to $64,999 for women (378 | 16.1%).
| Income | Male | Female |
| $2,499 or less | 74 (2.6%) | 12 (0.5%) |
| $2,500 to $4,999 | 19 (0.7%) | 8 (0.3%) |
| $5,000 to $7,499 | 106 (3.8%) | 91 (3.9%) |
| $7,500 to $9,999 | 3 (0.1%) | 49 (2.1%) |
| $10,000 to $12,499 | 19 (0.7%) | 88 (3.7%) |
| $12,500 to $14,999 | 73 (2.6%) | 84 (3.6%) |
| $15,000 to $17,499 | 177 (6.3%) | 144 (6.1%) |
| $17,500 to $19,999 | 0 (0.0%) | 32 (1.4%) |
| $20,000 to $22,499 | 17 (0.6%) | 27 (1.1%) |
| $22,500 to $24,999 | 31 (1.1%) | 94 (4.0%) |
| $25,000 to $29,999 | 56 (2.0%) | 72 (3.1%) |
| $30,000 to $34,999 | 189 (6.7%) | 145 (6.2%) |
| $35,000 to $39,999 | 64 (2.3%) | 19 (0.8%) |
| $40,000 to $44,999 | 0 (0.0%) | 29 (1.2%) |
| $45,000 to $49,999 | 297 (10.5%) | 144 (6.1%) |
| $50,000 to $54,999 | 141 (5.0%) | 130 (5.5%) |
| $55,000 to $64,999 | 265 (9.4%) | 378 (16.1%) |
| $65,000 to $74,999 | 293 (10.4%) | 113 (4.8%) |
| $75,000 to $99,999 | 234 (8.3%) | 346 (14.7%) |
| $100,000+ | 757 (26.9%) | 348 (14.8%) |
| Total | 2,815 (100.0%) | 2,353 (100.0%) |
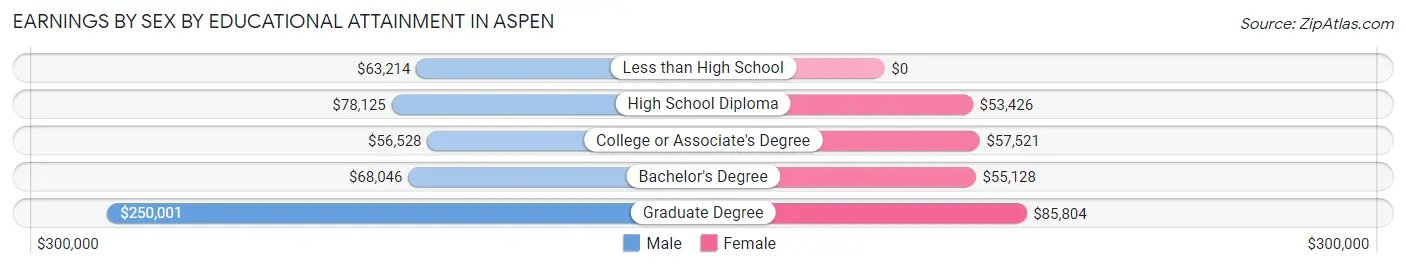
Earnings by Sex by Educational Attainment in Aspen
Average earnings in Aspen are $64,923 for men and $57,585 for women, a difference of 11.3%. Men with an educational attainment of graduate degree enjoy the highest average annual earnings of $250,001, while those with college or associate's degree education earn the least with $56,528. Women with an educational attainment of graduate degree earn the most with the average annual earnings of $85,804, while those with high school diploma education have the smallest earnings of $53,426.
| Educational Attainment | Male Income | Female Income |
| Less than High School | $63,214 | $0 |
| High School Diploma | $78,125 | $53,426 |
| College or Associate's Degree | $56,528 | $57,521 |
| Bachelor's Degree | $68,046 | $55,128 |
| Graduate Degree | $250,001 | $85,804 |
| Total | $64,923 | $57,585 |
Family Income in Aspen
Family Income Brackets in Aspen
According to the Aspen family income data, there are 615 families falling into the $200,000+ income range, which is the most common income bracket and makes up 38.6% of all families.
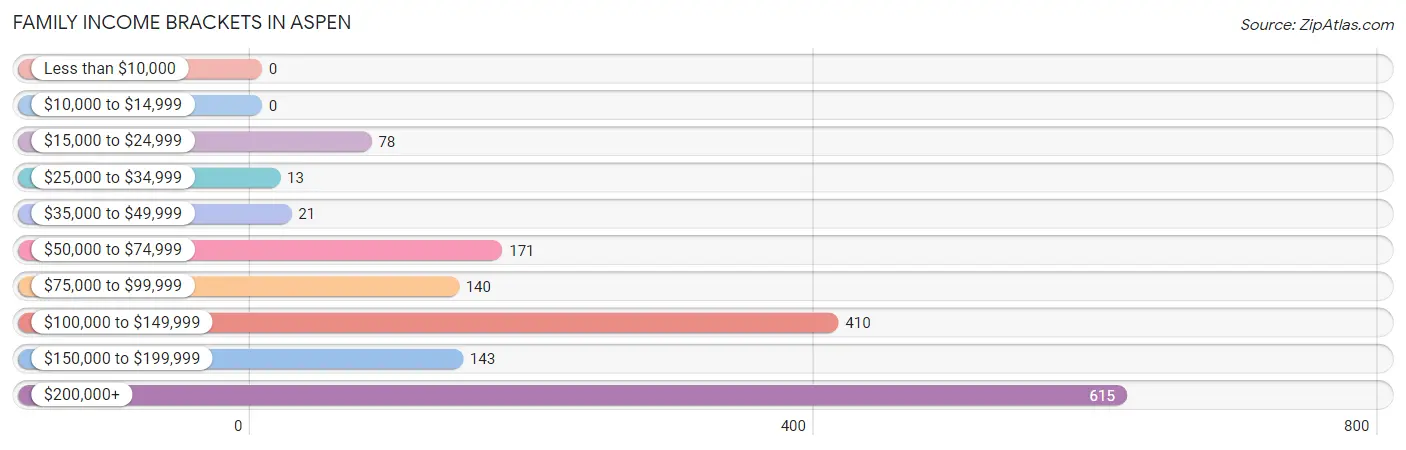
| Income Bracket | # Families | % Families |
| Less than $10,000 | 0 | 0.0% |
| $10,000 to $14,999 | 0 | 0.0% |
| $15,000 to $24,999 | 78 | 4.9% |
| $25,000 to $34,999 | 13 | 0.8% |
| $35,000 to $49,999 | 21 | 1.3% |
| $50,000 to $74,999 | 171 | 10.7% |
| $75,000 to $99,999 | 140 | 8.8% |
| $100,000 to $149,999 | 410 | 25.7% |
| $150,000 to $199,999 | 143 | 9.0% |
| $200,000+ | 615 | 38.6% |
Family Income by Famaliy Size in Aspen
4-person families (273 | 17.1%) account for the highest median family income in Aspen with $243,829 per family, while 4-person families (273 | 17.1%) have the highest median income of $60,957 per family member.
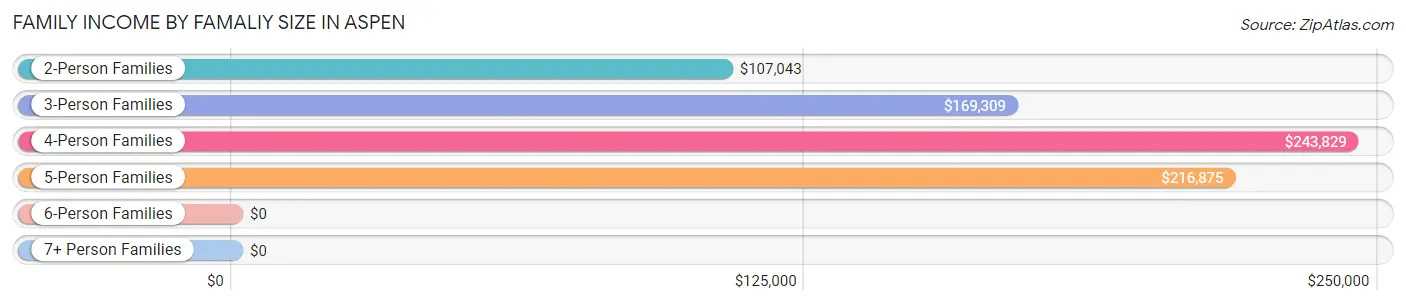
| Income Bracket | # Families | Median Income |
| 2-Person Families | 1,005 (63.0%) | $107,043 |
| 3-Person Families | 269 (16.9%) | $169,309 |
| 4-Person Families | 273 (17.1%) | $243,829 |
| 5-Person Families | 34 (2.1%) | $216,875 |
| 6-Person Families | 13 (0.8%) | $0 |
| 7+ Person Families | 0 (0.0%) | $0 |
| Total | 1,594 (100.0%) | $134,609 |
Family Income by Number of Earners in Aspen
The median family income in Aspen is $134,609, with families comprising 3+ earners (115) having the highest median family income of $169,046, while families with 1 earner (366) have the lowest median family income of $92,500, accounting for 7.2% and 23.0% of families, respectively.
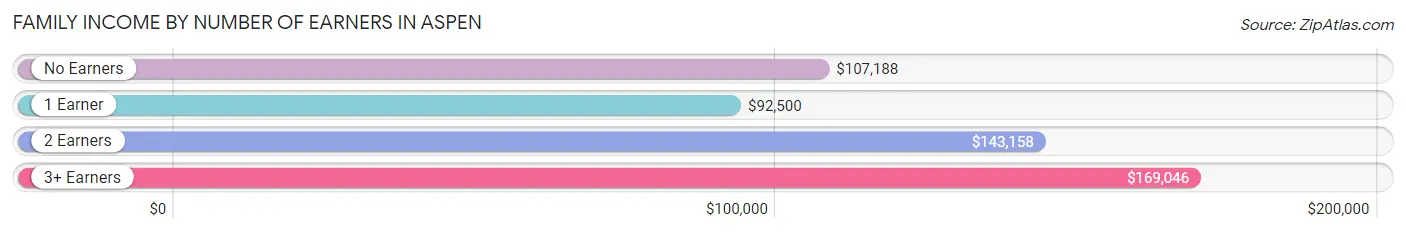
| Number of Earners | # Families | Median Income |
| No Earners | 247 (15.5%) | $107,188 |
| 1 Earner | 366 (23.0%) | $92,500 |
| 2 Earners | 866 (54.3%) | $143,158 |
| 3+ Earners | 115 (7.2%) | $169,046 |
| Total | 1,594 (100.0%) | $134,609 |
Household Income in Aspen
Household Income Brackets in Aspen
With 869 households falling in the category, the $50,000 to $74,999 income range is the most frequent in Aspen, accounting for 23.2% of all households. In contrast, only 41 households (1.1%) fall into the $10,000 to $14,999 income bracket, making it the least populous group.
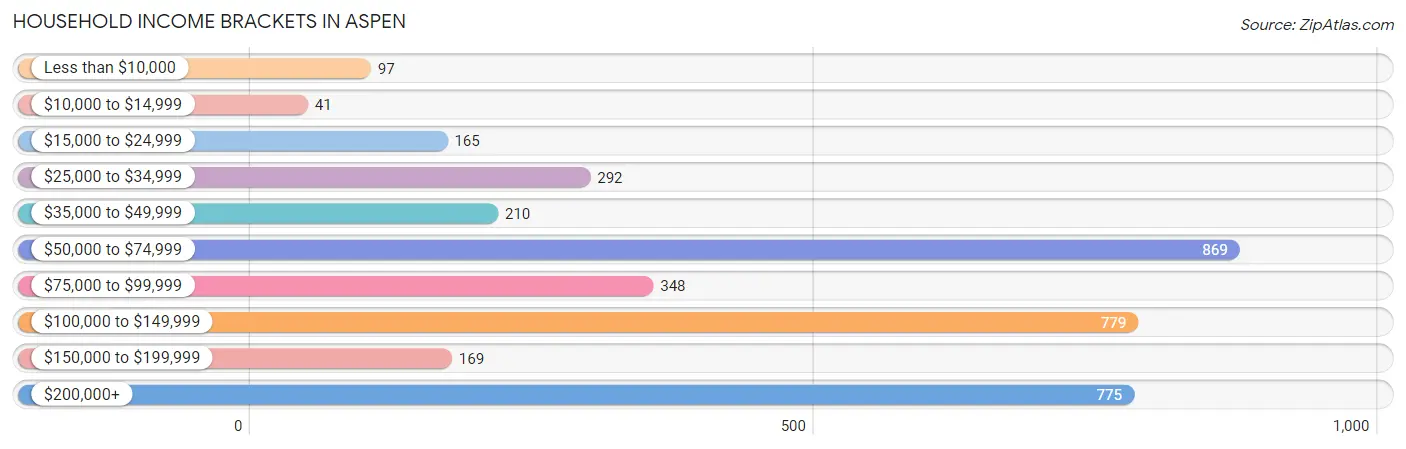
| Income Bracket | # Households | % Households |
| Less than $10,000 | 97 | 2.6% |
| $10,000 to $14,999 | 41 | 1.1% |
| $15,000 to $24,999 | 165 | 4.4% |
| $25,000 to $34,999 | 292 | 7.8% |
| $35,000 to $49,999 | 210 | 5.6% |
| $50,000 to $74,999 | 869 | 23.2% |
| $75,000 to $99,999 | 348 | 9.3% |
| $100,000 to $149,999 | 779 | 20.8% |
| $150,000 to $199,999 | 169 | 4.5% |
| $200,000+ | 775 | 20.7% |
Household Income by Householder Age in Aspen
The median household income in Aspen is $94,338, with the highest median household income of $104,914 found in the 25 to 44 years age bracket for the primary householder. A total of 1,166 households (31.1%) fall into this category. Meanwhile, the 15 to 24 years age bracket for the primary householder has the lowest median household income of $0, with 230 households (6.1%) in this group.
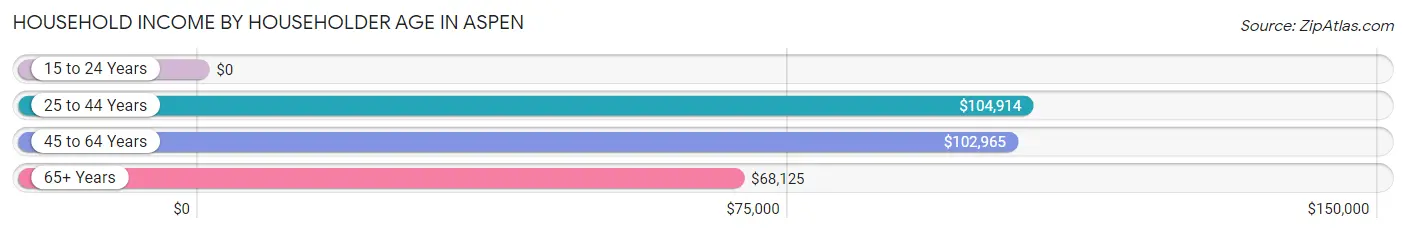
| Income Bracket | # Households | Median Income |
| 15 to 24 Years | 230 (6.1%) | $0 |
| 25 to 44 Years | 1,166 (31.1%) | $104,914 |
| 45 to 64 Years | 1,640 (43.8%) | $102,965 |
| 65+ Years | 710 (19.0%) | $68,125 |
| Total | 3,746 (100.0%) | $94,338 |
Poverty in Aspen
Income Below Poverty by Sex and Age in Aspen
With 6.5% poverty level for males and 6.4% for females among the residents of Aspen, 15 year old males and 18 to 24 year old females are the most vulnerable to poverty, with 62 males (65.3%) and 76 females (27.6%) in their respective age groups living below the poverty level.
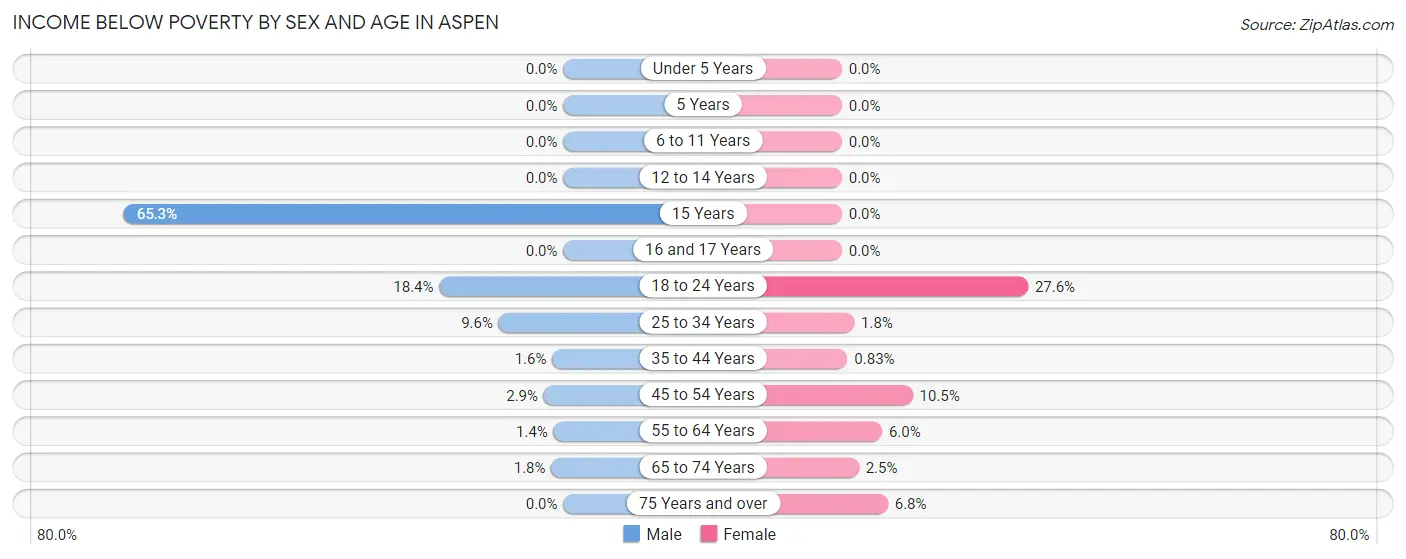
| Age Bracket | Male | Female |
| Under 5 Years | 0 (0.0%) | 0 (0.0%) |
| 5 Years | 0 (0.0%) | 0 (0.0%) |
| 6 to 11 Years | 0 (0.0%) | 0 (0.0%) |
| 12 to 14 Years | 0 (0.0%) | 0 (0.0%) |
| 15 Years | 62 (65.3%) | 0 (0.0%) |
| 16 and 17 Years | 0 (0.0%) | 0 (0.0%) |
| 18 to 24 Years | 72 (18.4%) | 76 (27.6%) |
| 25 to 34 Years | 59 (9.6%) | 11 (1.8%) |
| 35 to 44 Years | 9 (1.6%) | 4 (0.8%) |
| 45 to 54 Years | 19 (2.9%) | 64 (10.5%) |
| 55 to 64 Years | 6 (1.4%) | 36 (6.0%) |
| 65 to 74 Years | 7 (1.8%) | 6 (2.5%) |
| 75 Years and over | 0 (0.0%) | 14 (6.8%) |
| Total | 234 (6.5%) | 211 (6.4%) |
Income Above Poverty by Sex and Age in Aspen
According to the poverty statistics in Aspen, males aged under 5 years and females aged under 5 years are the age groups that are most secure financially, with 100.0% of males and 100.0% of females in these age groups living above the poverty line.
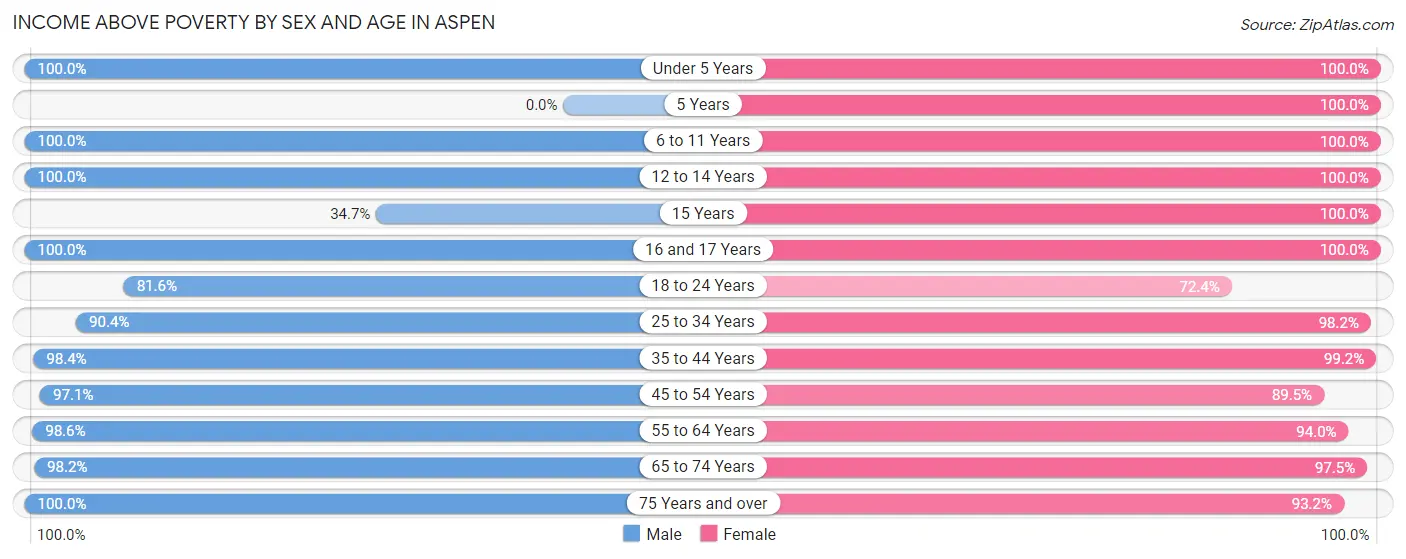
| Age Bracket | Male | Female |
| Under 5 Years | 54 (100.0%) | 96 (100.0%) |
| 5 Years | 0 (0.0%) | 8 (100.0%) |
| 6 to 11 Years | 160 (100.0%) | 109 (100.0%) |
| 12 to 14 Years | 45 (100.0%) | 60 (100.0%) |
| 15 Years | 33 (34.7%) | 17 (100.0%) |
| 16 and 17 Years | 11 (100.0%) | 10 (100.0%) |
| 18 to 24 Years | 319 (81.6%) | 199 (72.4%) |
| 25 to 34 Years | 557 (90.4%) | 590 (98.2%) |
| 35 to 44 Years | 539 (98.4%) | 480 (99.2%) |
| 45 to 54 Years | 639 (97.1%) | 545 (89.5%) |
| 55 to 64 Years | 415 (98.6%) | 567 (94.0%) |
| 65 to 74 Years | 387 (98.2%) | 233 (97.5%) |
| 75 Years and over | 201 (100.0%) | 191 (93.2%) |
| Total | 3,360 (93.5%) | 3,105 (93.6%) |
Income Below Poverty Among Married-Couple Families in Aspen
The poverty statistics for married-couple families in Aspen show that 0.4% or 6 of the total 1,380 families live below the poverty line. Families with no children have the highest poverty rate of 0.7%, comprising of 6 families. On the other hand, families with 1 or 2 children have the lowest poverty rate of 0.0%, which includes 0 families.
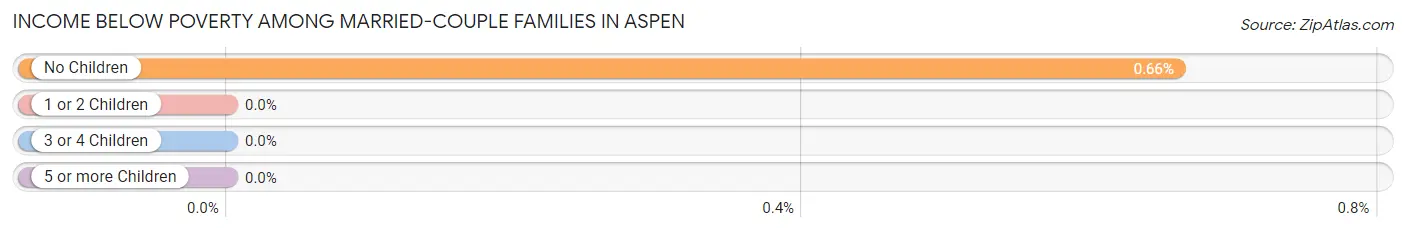
| Children | Above Poverty | Below Poverty |
| No Children | 900 (99.3%) | 6 (0.7%) |
| 1 or 2 Children | 447 (100.0%) | 0 (0.0%) |
| 3 or 4 Children | 27 (100.0%) | 0 (0.0%) |
| 5 or more Children | 0 (0.0%) | 0 (0.0%) |
| Total | 1,374 (99.6%) | 6 (0.4%) |
Income Below Poverty Among Single-Parent Households in Aspen
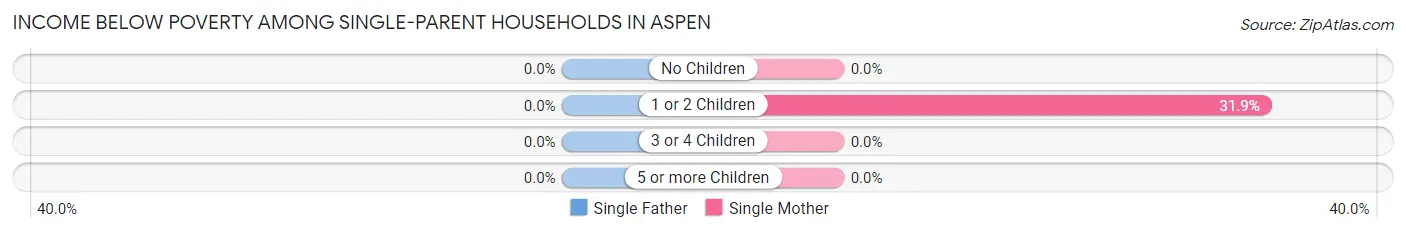
| Children | Single Father | Single Mother |
| No Children | 0 (0.0%) | 0 (0.0%) |
| 1 or 2 Children | 0 (0.0%) | 44 (31.9%) |
| 3 or 4 Children | 0 (0.0%) | 0 (0.0%) |
| 5 or more Children | 0 (0.0%) | 0 (0.0%) |
| Total | 0 (0.0%) | 44 (21.8%) |
Income Below Poverty Among Married-Couple vs Single-Parent Households in Aspen
The poverty data for Aspen shows that 6 of the married-couple family households (0.4%) and 44 of the single-parent households (20.6%) are living below the poverty level. Within the married-couple family households, those with no children have the highest poverty rate, with 6 households (0.7%) falling below the poverty line. Among the single-parent households, those with 1 or 2 children have the highest poverty rate, with 44 household (29.3%) living below poverty.
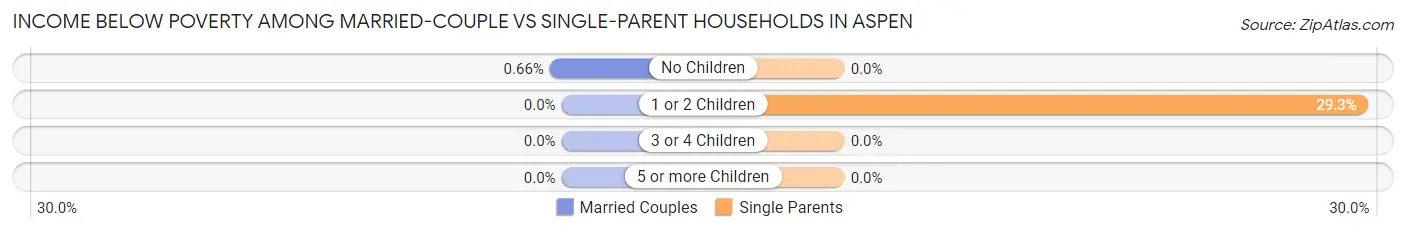
| Children | Married-Couple Families | Single-Parent Households |
| No Children | 6 (0.7%) | 0 (0.0%) |
| 1 or 2 Children | 0 (0.0%) | 44 (29.3%) |
| 3 or 4 Children | 0 (0.0%) | 0 (0.0%) |
| 5 or more Children | 0 (0.0%) | 0 (0.0%) |
| Total | 6 (0.4%) | 44 (20.6%) |
Race in Aspen
The most populous races in Aspen are White / Caucasian (5,910 | 85.0%), Hispanic or Latino (819 | 11.8%), and Two or more Races (521 | 7.5%).
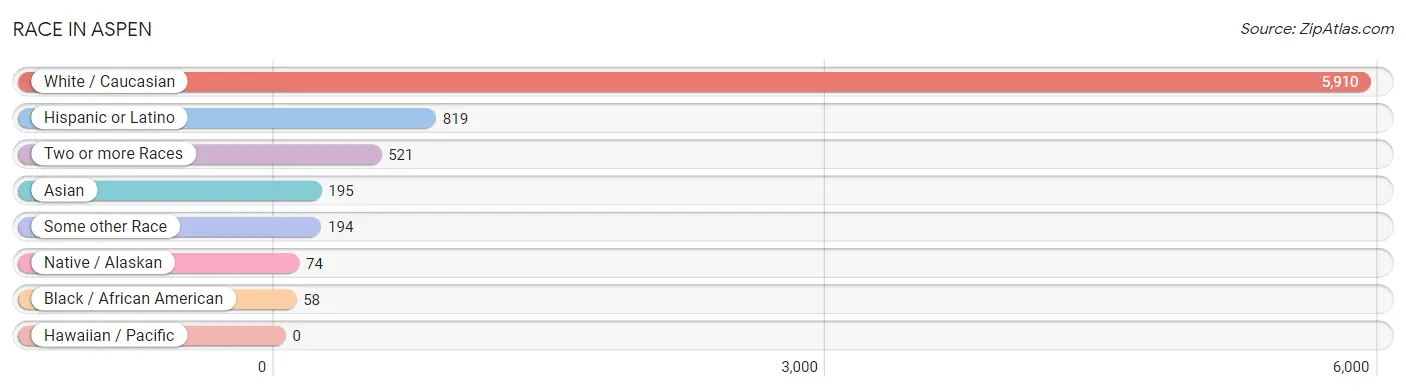
| Race | # Population | % Population |
| Asian | 195 | 2.8% |
| Black / African American | 58 | 0.8% |
| Hawaiian / Pacific | 0 | 0.0% |
| Hispanic or Latino | 819 | 11.8% |
| Native / Alaskan | 74 | 1.1% |
| White / Caucasian | 5,910 | 85.0% |
| Two or more Races | 521 | 7.5% |
| Some other Race | 194 | 2.8% |
| Total | 6,952 | 100.0% |
Ancestry in Aspen
The most populous ancestries reported in Aspen are Irish (1,036 | 14.9%), German (984 | 14.1%), English (941 | 13.5%), Italian (699 | 10.1%), and South American (345 | 5.0%), together accounting for 57.6% of all Aspen residents.
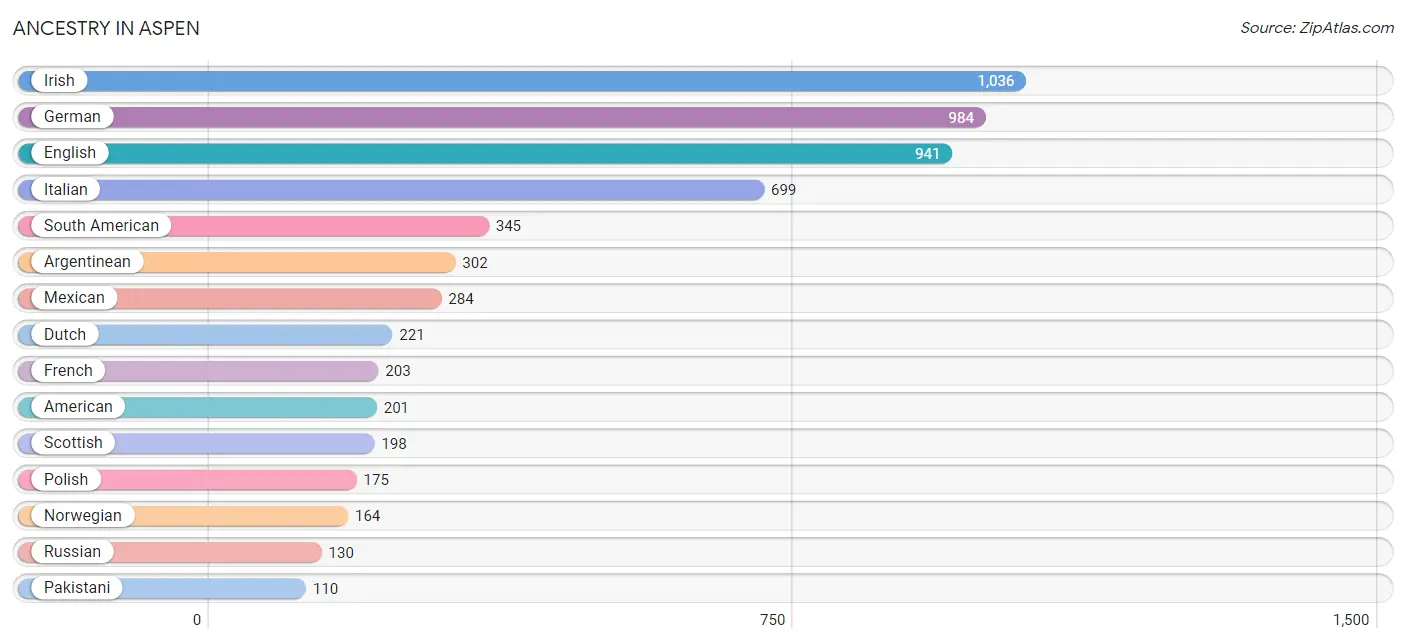
| Ancestry | # Population | % Population |
| Afghan | 14 | 0.2% |
| African | 44 | 0.6% |
| American | 201 | 2.9% |
| Arab | 40 | 0.6% |
| Argentinean | 302 | 4.3% |
| Australian | 37 | 0.5% |
| Austrian | 98 | 1.4% |
| Basque | 5 | 0.1% |
| Belgian | 7 | 0.1% |
| Bhutanese | 1 | 0.0% |
| Brazilian | 62 | 0.9% |
| British | 68 | 1.0% |
| Burmese | 70 | 1.0% |
| Canadian | 38 | 0.5% |
| Celtic | 46 | 0.7% |
| Chilean | 19 | 0.3% |
| Croatian | 8 | 0.1% |
| Cuban | 13 | 0.2% |
| Czech | 22 | 0.3% |
| Czechoslovakian | 8 | 0.1% |
| Danish | 8 | 0.1% |
| Dominican | 17 | 0.2% |
| Dutch | 221 | 3.2% |
| Eastern European | 66 | 0.9% |
| English | 941 | 13.5% |
| Ethiopian | 4 | 0.1% |
| European | 104 | 1.5% |
| Finnish | 19 | 0.3% |
| French | 203 | 2.9% |
| French Canadian | 28 | 0.4% |
| German | 984 | 14.1% |
| Greek | 42 | 0.6% |
| Hungarian | 68 | 1.0% |
| Indian (Asian) | 44 | 0.6% |
| Irish | 1,036 | 14.9% |
| Israeli | 12 | 0.2% |
| Italian | 699 | 10.1% |
| Lebanese | 40 | 0.6% |
| Lithuanian | 11 | 0.2% |
| Macedonian | 64 | 0.9% |
| Mexican | 284 | 4.1% |
| Mexican American Indian | 20 | 0.3% |
| Native Hawaiian | 1 | 0.0% |
| Norwegian | 164 | 2.4% |
| Pakistani | 110 | 1.6% |
| Peruvian | 24 | 0.4% |
| Polish | 175 | 2.5% |
| Portuguese | 19 | 0.3% |
| Puerto Rican | 108 | 1.5% |
| Russian | 130 | 1.9% |
| Scandinavian | 32 | 0.5% |
| Scotch-Irish | 10 | 0.1% |
| Scottish | 198 | 2.9% |
| Slavic | 59 | 0.9% |
| Slovak | 9 | 0.1% |
| Slovene | 28 | 0.4% |
| South American | 345 | 5.0% |
| Spaniard | 34 | 0.5% |
| Spanish | 12 | 0.2% |
| Sri Lankan | 44 | 0.6% |
| Subsaharan African | 48 | 0.7% |
| Swedish | 86 | 1.2% |
| Swiss | 36 | 0.5% |
| Thai | 35 | 0.5% |
| Ukrainian | 25 | 0.4% |
| Welsh | 44 | 0.6% |
| Yugoslavian | 19 | 0.3% | View All 67 Rows |
Immigrants in Aspen
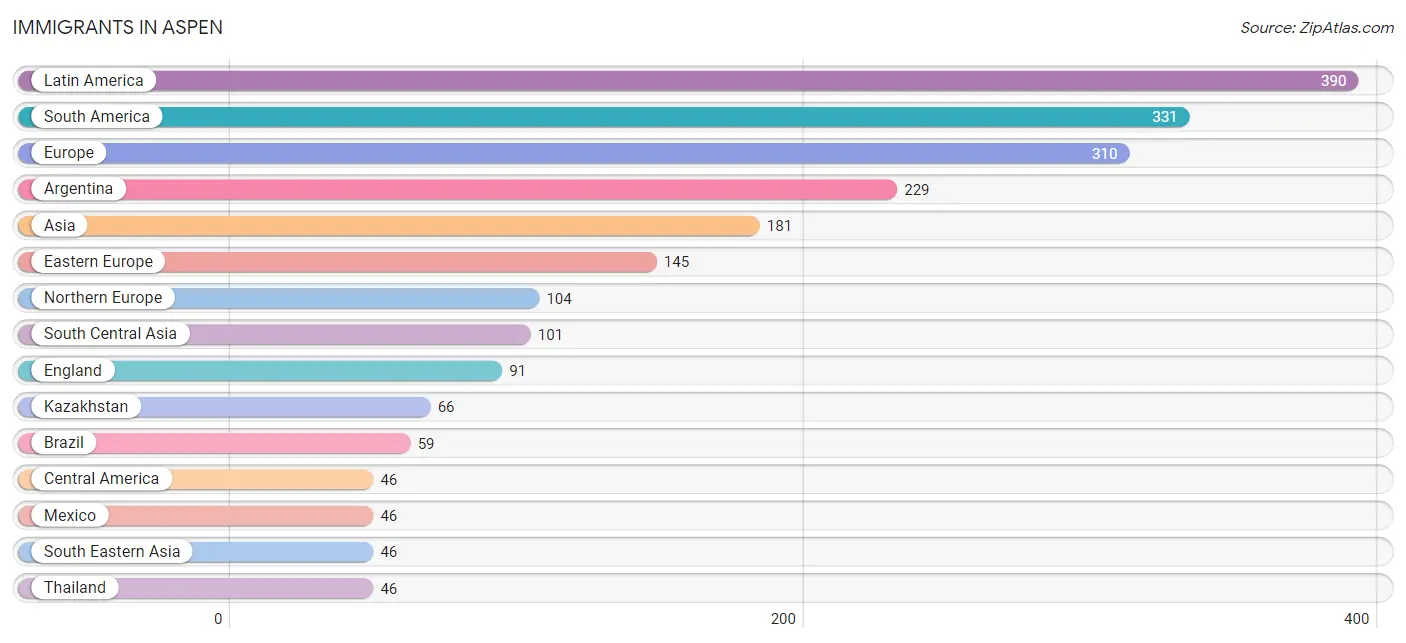
The most numerous immigrant groups reported in Aspen came from Latin America (390 | 5.6%), South America (331 | 4.8%), Europe (310 | 4.5%), Argentina (229 | 3.3%), and Asia (181 | 2.6%), together accounting for 20.7% of all Aspen residents.
| Immigration Origin | # Population | % Population |
| Africa | 21 | 0.3% |
| Argentina | 229 | 3.3% |
| Asia | 181 | 2.6% |
| Australia | 37 | 0.5% |
| Austria | 11 | 0.2% |
| Belgium | 7 | 0.1% |
| Brazil | 59 | 0.9% |
| Canada | 25 | 0.4% |
| Caribbean | 13 | 0.2% |
| Central America | 46 | 0.7% |
| Chile | 19 | 0.3% |
| China | 30 | 0.4% |
| Croatia | 8 | 0.1% |
| Cuba | 13 | 0.2% |
| Eastern Africa | 4 | 0.1% |
| Eastern Asia | 34 | 0.5% |
| Eastern Europe | 145 | 2.1% |
| England | 91 | 1.3% |
| Ethiopia | 4 | 0.1% |
| Europe | 310 | 4.5% |
| Germany | 13 | 0.2% |
| Hungary | 28 | 0.4% |
| India | 35 | 0.5% |
| Kazakhstan | 66 | 0.9% |
| Korea | 4 | 0.1% |
| Latin America | 390 | 5.6% |
| Latvia | 25 | 0.4% |
| Mexico | 46 | 0.7% |
| Northern Europe | 104 | 1.5% |
| Oceania | 37 | 0.5% |
| Peru | 24 | 0.4% |
| Portugal | 15 | 0.2% |
| Russia | 4 | 0.1% |
| South Africa | 17 | 0.2% |
| South America | 331 | 4.8% |
| South Central Asia | 101 | 1.5% |
| South Eastern Asia | 46 | 0.7% |
| Southern Europe | 15 | 0.2% |
| Sweden | 13 | 0.2% |
| Thailand | 46 | 0.7% |
| Ukraine | 16 | 0.2% |
| Western Europe | 31 | 0.4% | View All 42 Rows |
Sex and Age in Aspen
Sex and Age in Aspen
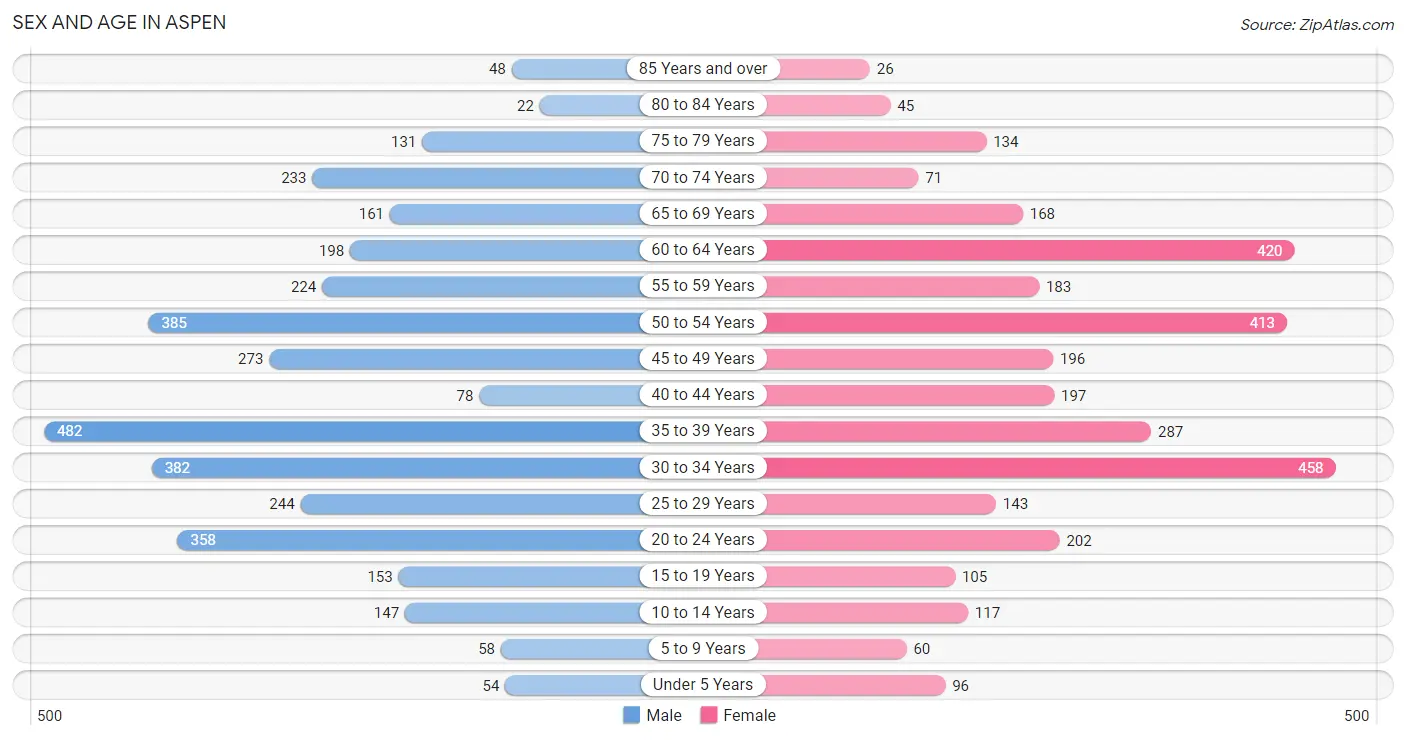
The most populous age groups in Aspen are 35 to 39 Years (482 | 13.3%) for men and 30 to 34 Years (458 | 13.8%) for women.
| Age Bracket | Male | Female |
| Under 5 Years | 54 (1.5%) | 96 (2.9%) |
| 5 to 9 Years | 58 (1.6%) | 60 (1.8%) |
| 10 to 14 Years | 147 (4.1%) | 117 (3.5%) |
| 15 to 19 Years | 153 (4.2%) | 105 (3.2%) |
| 20 to 24 Years | 358 (9.9%) | 202 (6.1%) |
| 25 to 29 Years | 244 (6.7%) | 143 (4.3%) |
| 30 to 34 Years | 382 (10.5%) | 458 (13.8%) |
| 35 to 39 Years | 482 (13.3%) | 287 (8.6%) |
| 40 to 44 Years | 78 (2.1%) | 197 (5.9%) |
| 45 to 49 Years | 273 (7.5%) | 196 (5.9%) |
| 50 to 54 Years | 385 (10.6%) | 413 (12.4%) |
| 55 to 59 Years | 224 (6.2%) | 183 (5.5%) |
| 60 to 64 Years | 198 (5.4%) | 420 (12.7%) |
| 65 to 69 Years | 161 (4.4%) | 168 (5.1%) |
| 70 to 74 Years | 233 (6.4%) | 71 (2.1%) |
| 75 to 79 Years | 131 (3.6%) | 134 (4.0%) |
| 80 to 84 Years | 22 (0.6%) | 45 (1.4%) |
| 85 Years and over | 48 (1.3%) | 26 (0.8%) |
| Total | 3,631 (100.0%) | 3,321 (100.0%) |
Families and Households in Aspen
Median Family Size in Aspen
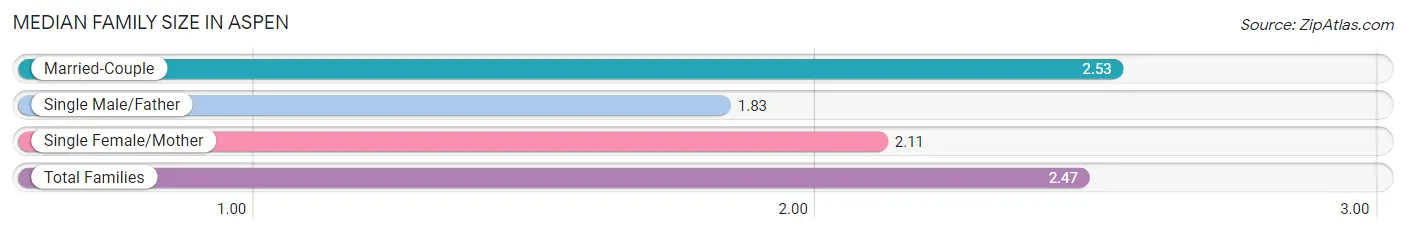
The median family size in Aspen is 2.47 persons per family, with married-couple families (1,380 | 86.6%) accounting for the largest median family size of 2.53 persons per family. On the other hand, single male/father families (12 | 0.7%) represent the smallest median family size with 1.83 persons per family.
| Family Type | # Families | Family Size |
| Married-Couple | 1,380 (86.6%) | 2.53 |
| Single Male/Father | 12 (0.7%) | 1.83 |
| Single Female/Mother | 202 (12.7%) | 2.11 |
| Total Families | 1,594 (100.0%) | 2.47 |
Median Household Size in Aspen
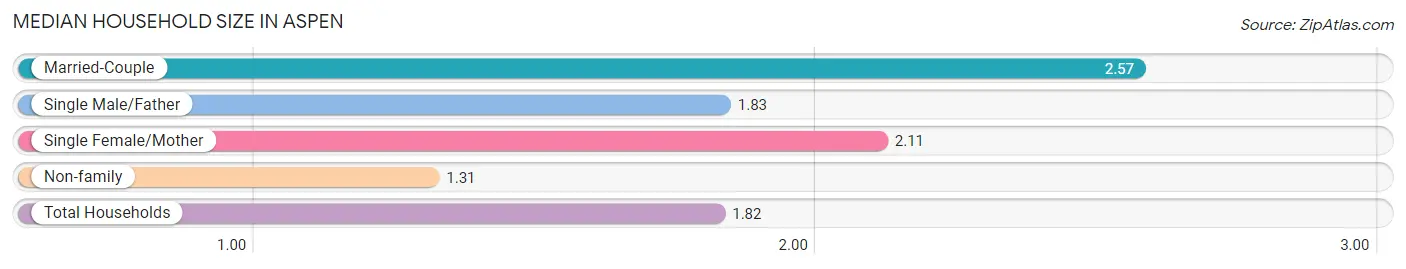
The median household size in Aspen is 1.82 persons per household, with married-couple households (1,380 | 36.8%) accounting for the largest median household size of 2.57 persons per household. non-family households (2,152 | 57.5%) represent the smallest median household size with 1.31 persons per household.
| Household Type | # Households | Household Size |
| Married-Couple | 1,380 (36.8%) | 2.57 |
| Single Male/Father | 12 (0.3%) | 1.83 |
| Single Female/Mother | 202 (5.4%) | 2.11 |
| Non-family | 2,152 (57.5%) | 1.31 |
| Total Households | 3,746 (100.0%) | 1.82 |
Household Size by Marriage Status in Aspen
Out of a total of 3,746 households in Aspen, 1,594 (42.5%) are family households, while 2,152 (57.5%) are nonfamily households. The most numerous type of family households are 2-person households, comprising 1,005, and the most common type of nonfamily households are 1-person households, comprising 1,699.
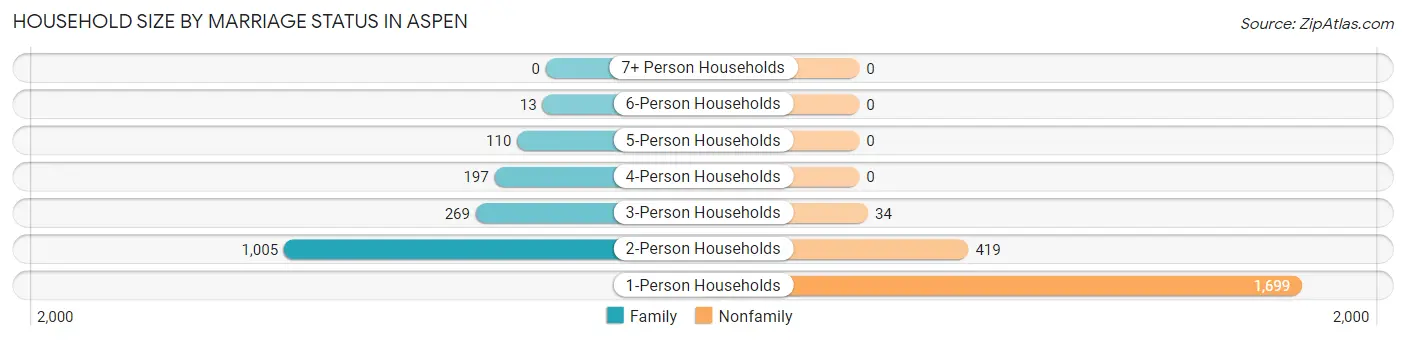
| Household Size | Family Households | Nonfamily Households |
| 1-Person Households | - | 1,699 (45.4%) |
| 2-Person Households | 1,005 (26.8%) | 419 (11.2%) |
| 3-Person Households | 269 (7.2%) | 34 (0.9%) |
| 4-Person Households | 197 (5.3%) | 0 (0.0%) |
| 5-Person Households | 110 (2.9%) | 0 (0.0%) |
| 6-Person Households | 13 (0.4%) | 0 (0.0%) |
| 7+ Person Households | 0 (0.0%) | 0 (0.0%) |
| Total | 1,594 (42.5%) | 2,152 (57.5%) |
Female Fertility in Aspen
Fertility by Age in Aspen
Average fertility rate in Aspen is 6.0 births per 1,000 women. Women in the age bracket of 20 to 34 years have the highest fertility rate with 11.0 births per 1,000 women. Women in the age bracket of 20 to 34 years acount for 100.0% of all women with births.
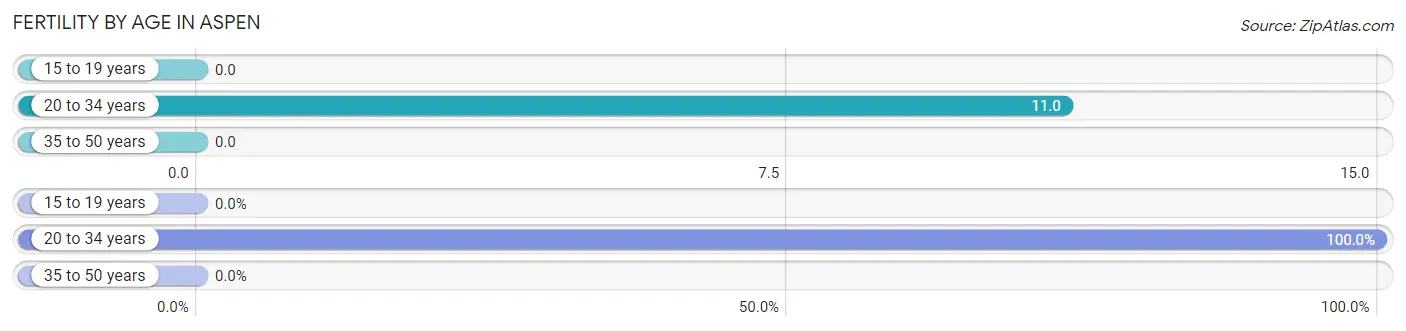
| Age Bracket | Women with Births | Births / 1,000 Women |
| 15 to 19 years | 0 (0.0%) | 0.0 |
| 20 to 34 years | 9 (100.0%) | 11.0 |
| 35 to 50 years | 0 (0.0%) | 0.0 |
| Total | 9 (100.0%) | 6.0 |
Fertility by Age by Marriage Status in Aspen
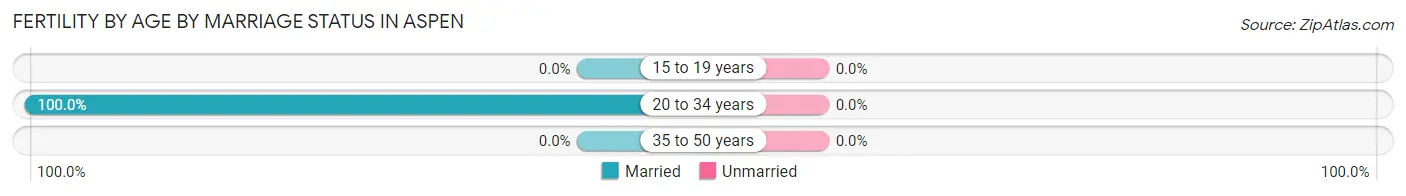
| Age Bracket | Married | Unmarried |
| 15 to 19 years | 0 (0.0%) | 0 (0.0%) |
| 20 to 34 years | 9 (100.0%) | 0 (0.0%) |
| 35 to 50 years | 0 (0.0%) | 0 (0.0%) |
| Total | 9 (100.0%) | 0 (0.0%) |
Fertility by Education in Aspen
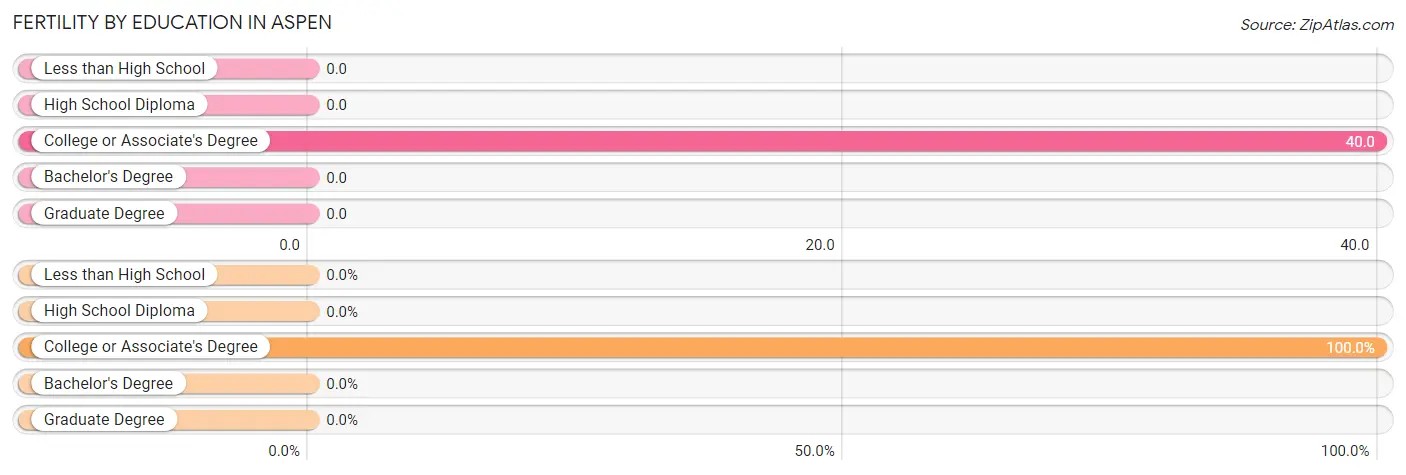
| Educational Attainment | Women with Births | Births / 1,000 Women |
| Less than High School | 0 (0.0%) | 0.0 |
| High School Diploma | 0 (0.0%) | 0.0 |
| College or Associate's Degree | 9 (100.0%) | 40.0 |
| Bachelor's Degree | 0 (0.0%) | 0.0 |
| Graduate Degree | 0 (0.0%) | 0.0 |
| Total | 9 (100.0%) | 6.0 |
Fertility by Education by Marriage Status in Aspen
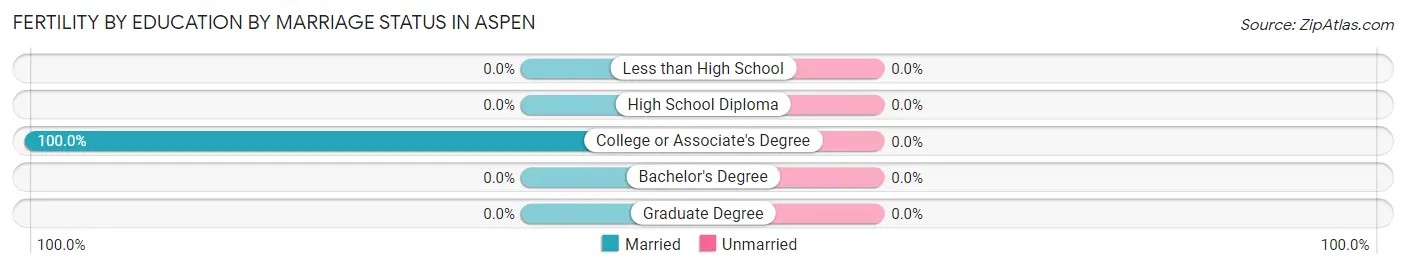
| Educational Attainment | Married | Unmarried |
| Less than High School | 0 (0.0%) | 0 (0.0%) |
| High School Diploma | 0 (0.0%) | 0 (0.0%) |
| College or Associate's Degree | 9 (100.0%) | 0 (0.0%) |
| Bachelor's Degree | 0 (0.0%) | 0 (0.0%) |
| Graduate Degree | 0 (0.0%) | 0 (0.0%) |
| Total | 9 (100.0%) | 0 (0.0%) |
Employment Characteristics in Aspen
Employment by Class of Employer in Aspen
Among the 4,552 employed individuals in Aspen, private company employees (2,845 | 62.5%), self-employed (incorporated) (634 | 13.9%), and local government employees (444 | 9.8%) make up the most common classes of employment.
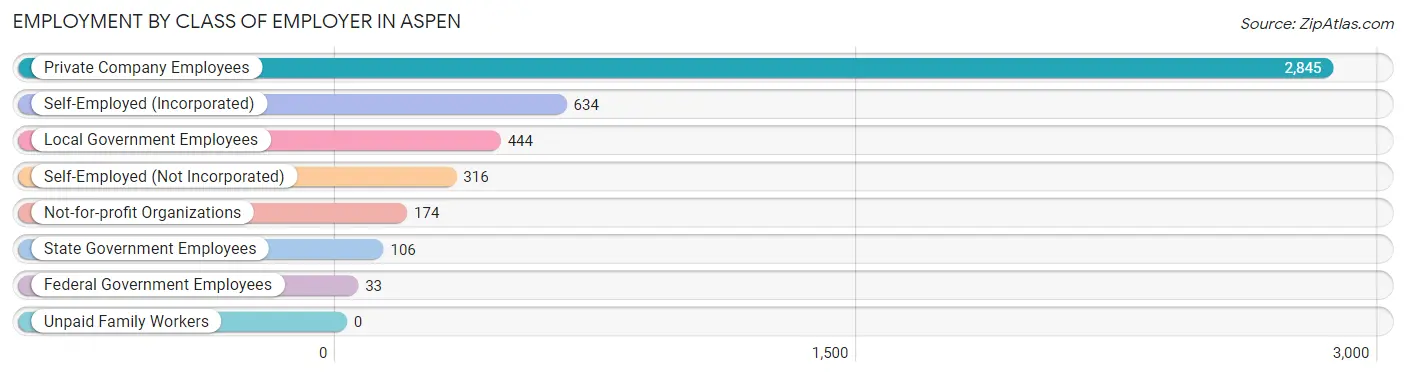
| Employer Class | # Employees | % Employees |
| Private Company Employees | 2,845 | 62.5% |
| Self-Employed (Incorporated) | 634 | 13.9% |
| Self-Employed (Not Incorporated) | 316 | 6.9% |
| Not-for-profit Organizations | 174 | 3.8% |
| Local Government Employees | 444 | 9.8% |
| State Government Employees | 106 | 2.3% |
| Federal Government Employees | 33 | 0.7% |
| Unpaid Family Workers | 0 | 0.0% |
| Total | 4,552 | 100.0% |
Employment Status by Age in Aspen
According to the labor force statistics for Aspen, out of the total population over 16 years of age (6,308), 74.4% or 4,693 individuals are in the labor force, with 2.4% or 113 of them unemployed. The age group with the highest labor force participation rate is 25 to 29 years, with 99.5% or 385 individuals in the labor force. Within the labor force, the 16 to 19 years age range has the highest percentage of unemployed individuals, with 11.1% or 1 of them being unemployed.
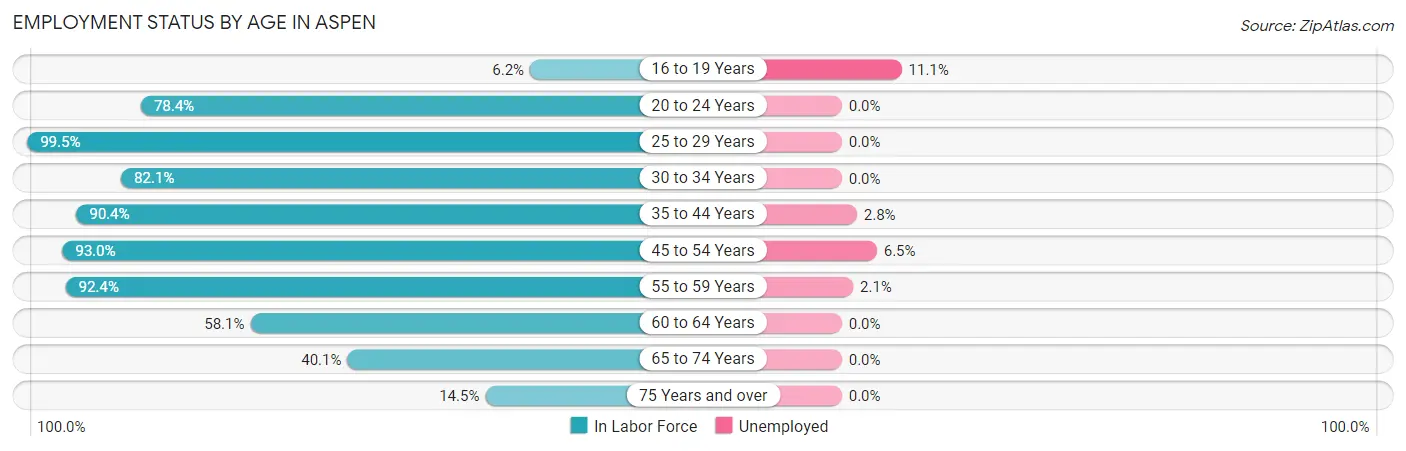
| Age Bracket | In Labor Force | Unemployed |
| 16 to 19 Years | 9 (6.2%) | 1 (11.1%) |
| 20 to 24 Years | 439 (78.4%) | 0 (0.0%) |
| 25 to 29 Years | 385 (99.5%) | 0 (0.0%) |
| 30 to 34 Years | 690 (82.1%) | 0 (0.0%) |
| 35 to 44 Years | 944 (90.4%) | 26 (2.8%) |
| 45 to 54 Years | 1,178 (93.0%) | 77 (6.5%) |
| 55 to 59 Years | 376 (92.4%) | 8 (2.1%) |
| 60 to 64 Years | 359 (58.1%) | 0 (0.0%) |
| 65 to 74 Years | 254 (40.1%) | 0 (0.0%) |
| 75 Years and over | 59 (14.5%) | 0 (0.0%) |
| Total | 4,693 (74.4%) | 113 (2.4%) |
Employment Status by Educational Attainment in Aspen
According to labor force statistics for Aspen, 86.2% of individuals (3,933) out of the total population between 25 and 64 years of age (4,563) are in the labor force, with 2.8% or 110 of them being unemployed. The group with the highest labor force participation rate are those with the educational attainment of less than high school, with 100.0% or 67 individuals in the labor force. Within the labor force, individuals with bachelor's degree or higher education have the highest percentage of unemployment, with 4.5% or 110 of them being unemployed.
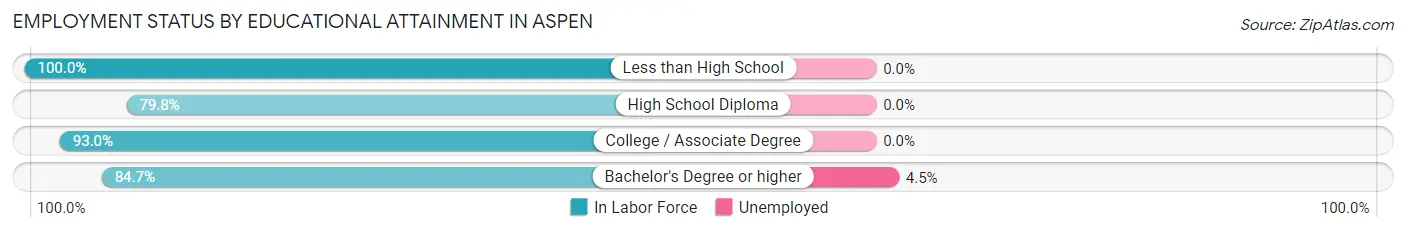
| Educational Attainment | In Labor Force | Unemployed |
| Less than High School | 67 (100.0%) | 0 (0.0%) |
| High School Diploma | 470 (79.8%) | 0 (0.0%) |
| College / Associate Degree | 957 (93.0%) | 0 (0.0%) |
| Bachelor's Degree or higher | 2,438 (84.7%) | 130 (4.5%) |
| Total | 3,933 (86.2%) | 128 (2.8%) |
Employment Occupations by Sex in Aspen
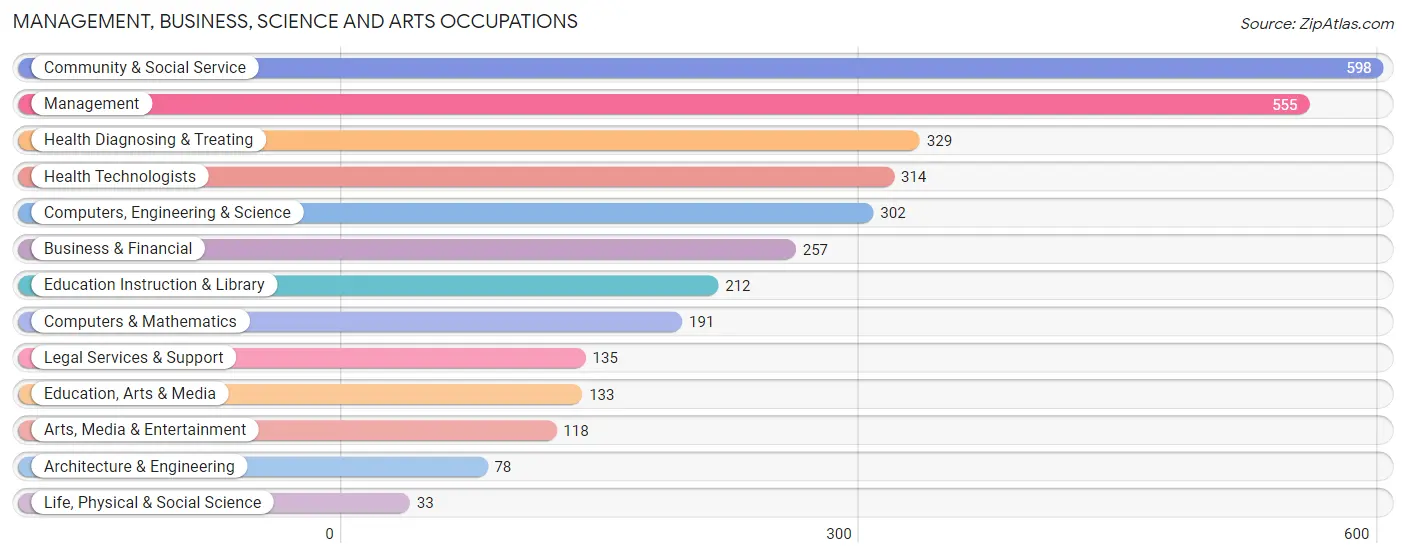
Management, Business, Science and Arts Occupations
The most common Management, Business, Science and Arts occupations in Aspen are Community & Social Service (598 | 13.1%), Management (555 | 12.1%), Health Diagnosing & Treating (329 | 7.2%), Health Technologists (314 | 6.9%), and Computers, Engineering & Science (302 | 6.6%).
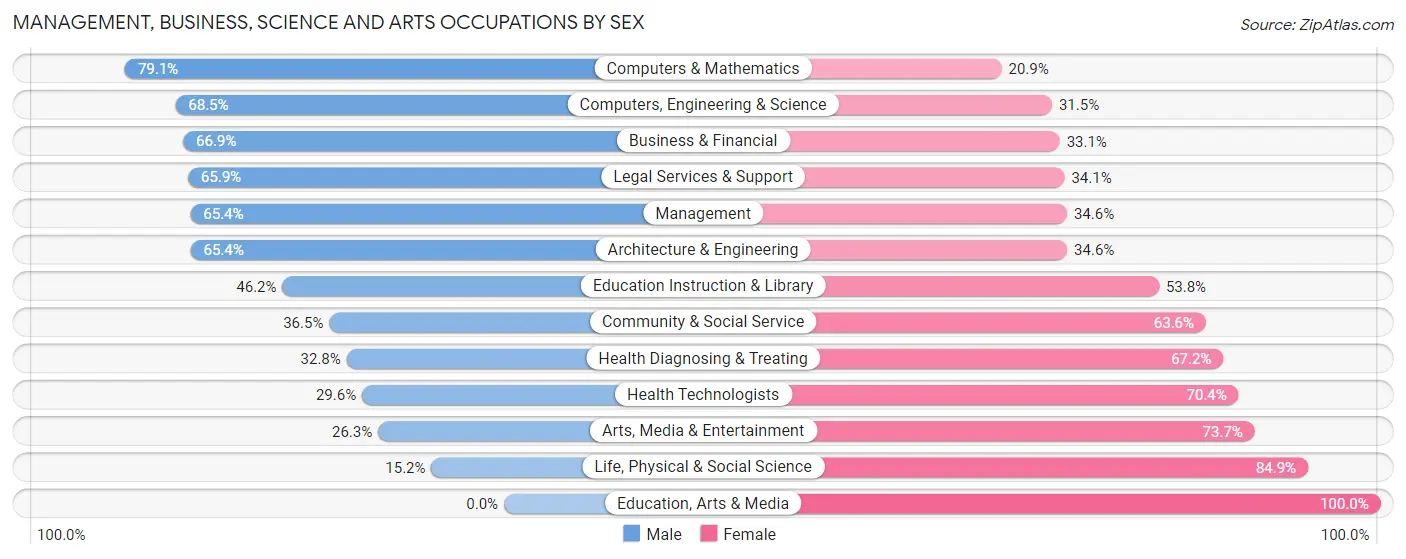
Management, Business, Science and Arts Occupations by Sex
Within the Management, Business, Science and Arts occupations in Aspen, the most male-oriented occupations are Computers & Mathematics (79.1%), Computers, Engineering & Science (68.5%), and Business & Financial (66.9%), while the most female-oriented occupations are Education, Arts & Media (100.0%), Life, Physical & Social Science (84.9%), and Arts, Media & Entertainment (73.7%).
| Occupation | Male | Female |
| Management | 363 (65.4%) | 192 (34.6%) |
| Business & Financial | 172 (66.9%) | 85 (33.1%) |
| Computers, Engineering & Science | 207 (68.5%) | 95 (31.5%) |
| Computers & Mathematics | 151 (79.1%) | 40 (20.9%) |
| Architecture & Engineering | 51 (65.4%) | 27 (34.6%) |
| Life, Physical & Social Science | 5 (15.1%) | 28 (84.9%) |
| Community & Social Service | 218 (36.4%) | 380 (63.5%) |
| Education, Arts & Media | 0 (0.0%) | 133 (100.0%) |
| Legal Services & Support | 89 (65.9%) | 46 (34.1%) |
| Education Instruction & Library | 98 (46.2%) | 114 (53.8%) |
| Arts, Media & Entertainment | 31 (26.3%) | 87 (73.7%) |
| Health Diagnosing & Treating | 108 (32.8%) | 221 (67.2%) |
| Health Technologists | 93 (29.6%) | 221 (70.4%) |
| Total (Category) | 1,068 (52.3%) | 973 (47.7%) |
| Total (Overall) | 2,407 (52.5%) | 2,175 (47.5%) |
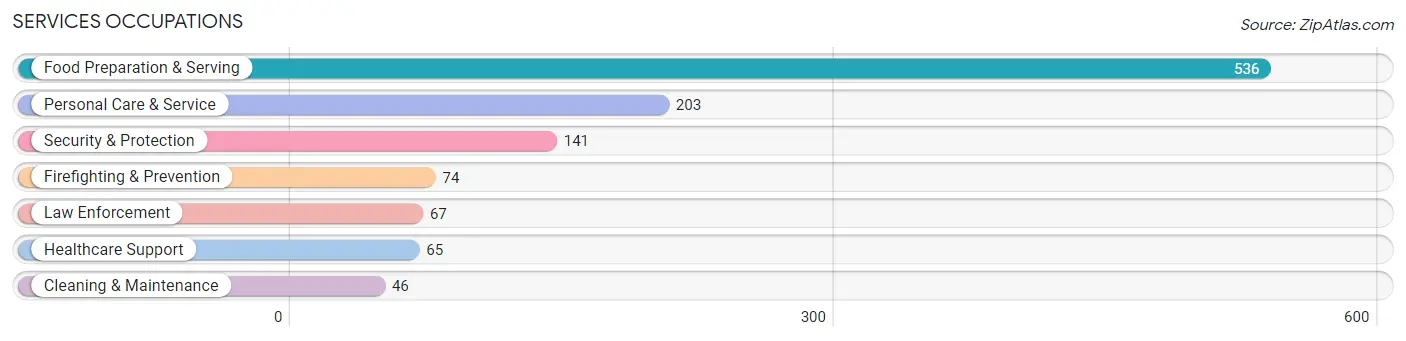
Services Occupations
The most common Services occupations in Aspen are Food Preparation & Serving (536 | 11.7%), Personal Care & Service (203 | 4.4%), Security & Protection (141 | 3.1%), Firefighting & Prevention (74 | 1.6%), and Law Enforcement (67 | 1.5%).
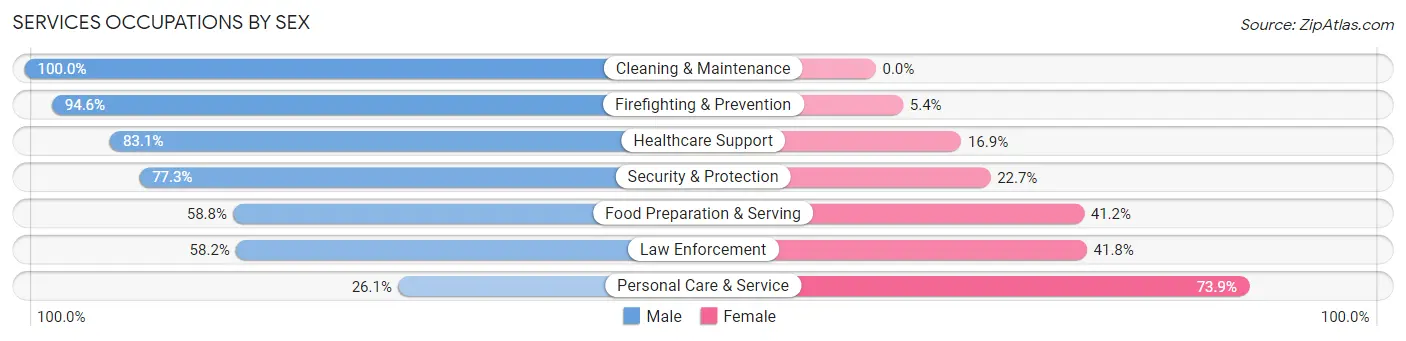
Services Occupations by Sex
Within the Services occupations in Aspen, the most male-oriented occupations are Cleaning & Maintenance (100.0%), Firefighting & Prevention (94.6%), and Healthcare Support (83.1%), while the most female-oriented occupations are Personal Care & Service (73.9%), Law Enforcement (41.8%), and Food Preparation & Serving (41.2%).
| Occupation | Male | Female |
| Healthcare Support | 54 (83.1%) | 11 (16.9%) |
| Security & Protection | 109 (77.3%) | 32 (22.7%) |
| Firefighting & Prevention | 70 (94.6%) | 4 (5.4%) |
| Law Enforcement | 39 (58.2%) | 28 (41.8%) |
| Food Preparation & Serving | 315 (58.8%) | 221 (41.2%) |
| Cleaning & Maintenance | 46 (100.0%) | 0 (0.0%) |
| Personal Care & Service | 53 (26.1%) | 150 (73.9%) |
| Total (Category) | 577 (58.2%) | 414 (41.8%) |
| Total (Overall) | 2,407 (52.5%) | 2,175 (47.5%) |
Sales and Office Occupations
The most common Sales and Office occupations in Aspen are Sales & Related (599 | 13.1%), and Office & Administration (495 | 10.8%).

Sales and Office Occupations by Sex
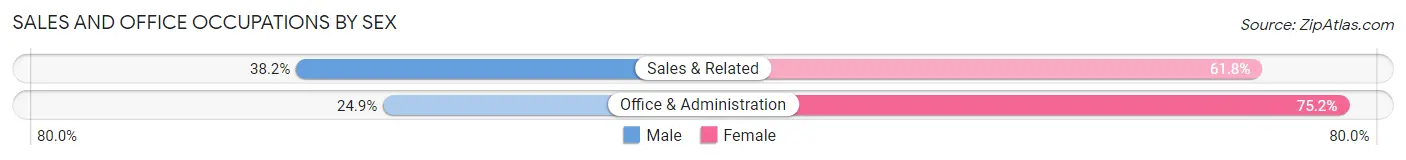
| Occupation | Male | Female |
| Sales & Related | 229 (38.2%) | 370 (61.8%) |
| Office & Administration | 123 (24.8%) | 372 (75.1%) |
| Total (Category) | 352 (32.2%) | 742 (67.8%) |
| Total (Overall) | 2,407 (52.5%) | 2,175 (47.5%) |
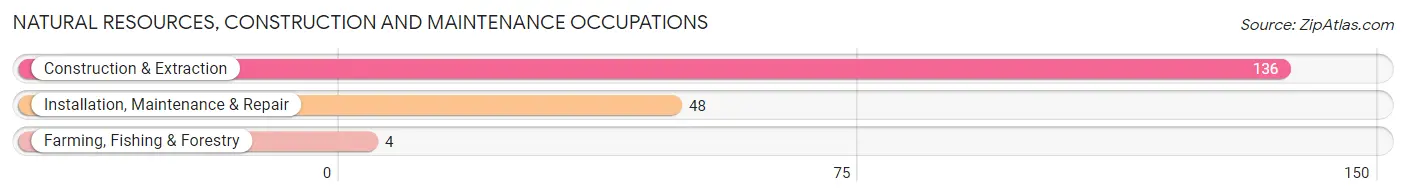
Natural Resources, Construction and Maintenance Occupations
The most common Natural Resources, Construction and Maintenance occupations in Aspen are Construction & Extraction (136 | 3.0%), Installation, Maintenance & Repair (48 | 1.1%), and Farming, Fishing & Forestry (4 | 0.1%).
Natural Resources, Construction and Maintenance Occupations by Sex
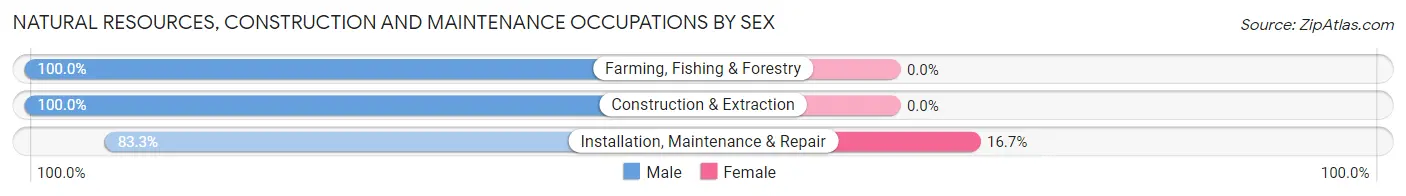
| Occupation | Male | Female |
| Farming, Fishing & Forestry | 4 (100.0%) | 0 (0.0%) |
| Construction & Extraction | 136 (100.0%) | 0 (0.0%) |
| Installation, Maintenance & Repair | 40 (83.3%) | 8 (16.7%) |
| Total (Category) | 180 (95.7%) | 8 (4.3%) |
| Total (Overall) | 2,407 (52.5%) | 2,175 (47.5%) |
Production, Transportation and Moving Occupations
The most common Production, Transportation and Moving occupations in Aspen are Transportation (207 | 4.5%), Production (38 | 0.8%), and Material Moving (23 | 0.5%).
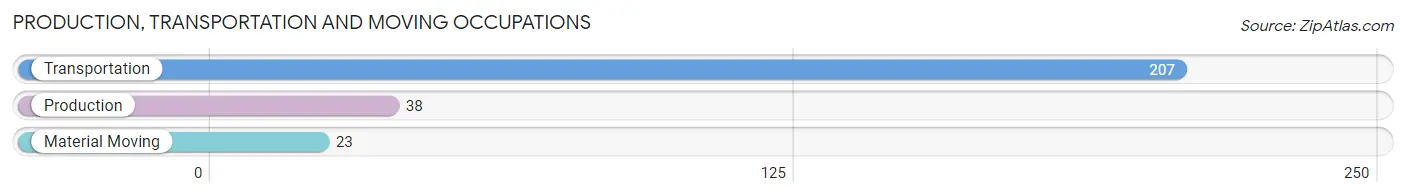
Production, Transportation and Moving Occupations by Sex
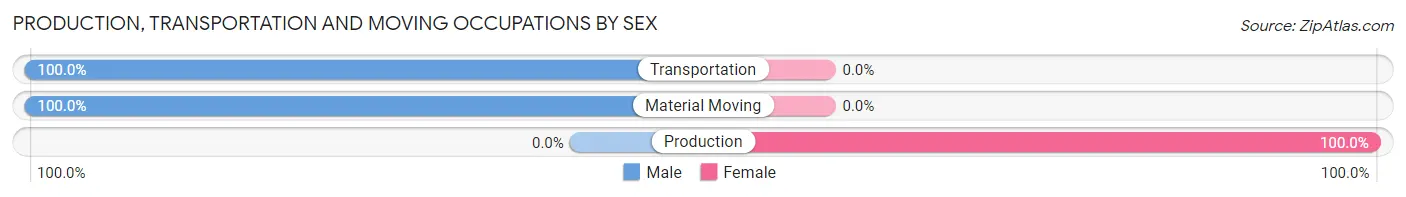
| Occupation | Male | Female |
| Production | 0 (0.0%) | 38 (100.0%) |
| Transportation | 207 (100.0%) | 0 (0.0%) |
| Material Moving | 23 (100.0%) | 0 (0.0%) |
| Total (Category) | 230 (85.8%) | 38 (14.2%) |
| Total (Overall) | 2,407 (52.5%) | 2,175 (47.5%) |
Employment Industries by Sex in Aspen
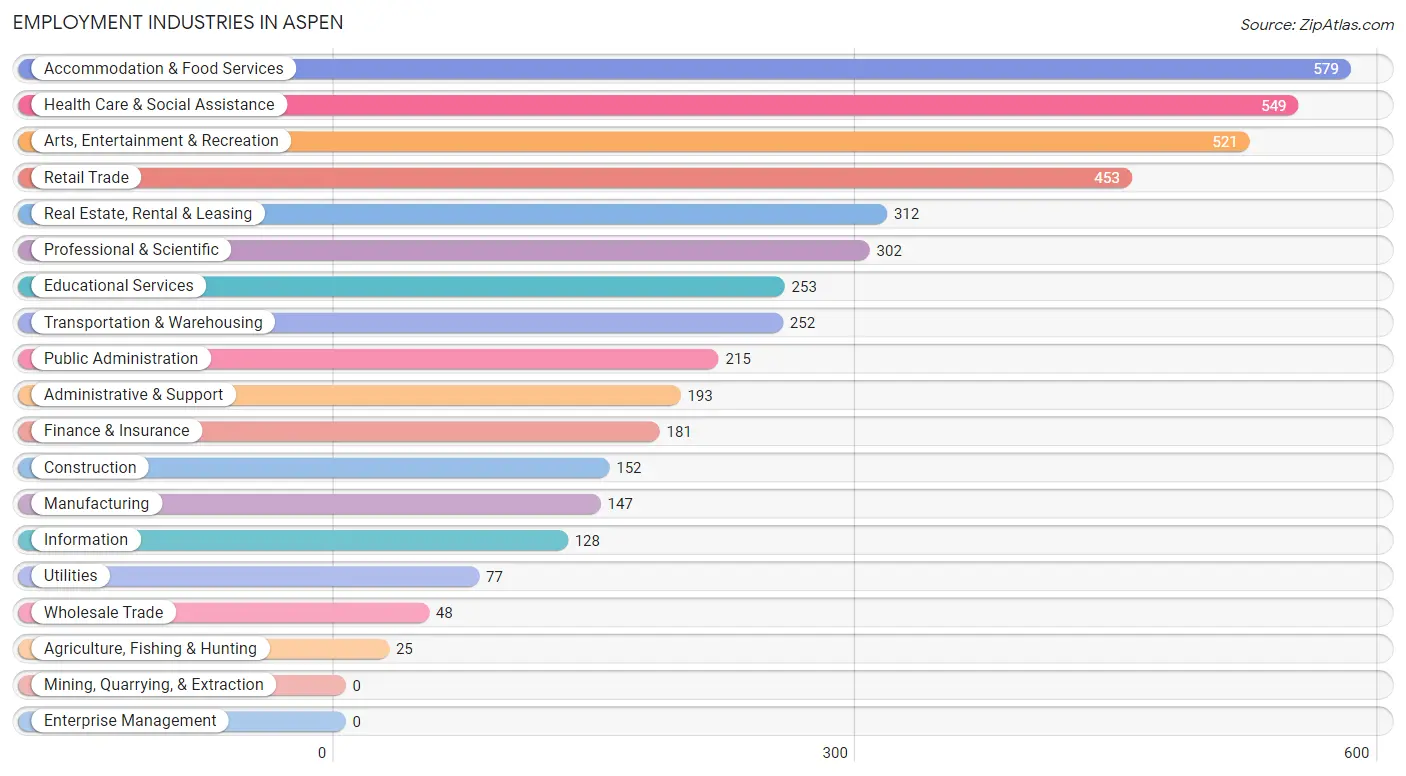
Employment Industries in Aspen
The major employment industries in Aspen include Accommodation & Food Services (579 | 12.6%), Health Care & Social Assistance (549 | 12.0%), Arts, Entertainment & Recreation (521 | 11.4%), Retail Trade (453 | 9.9%), and Real Estate, Rental & Leasing (312 | 6.8%).
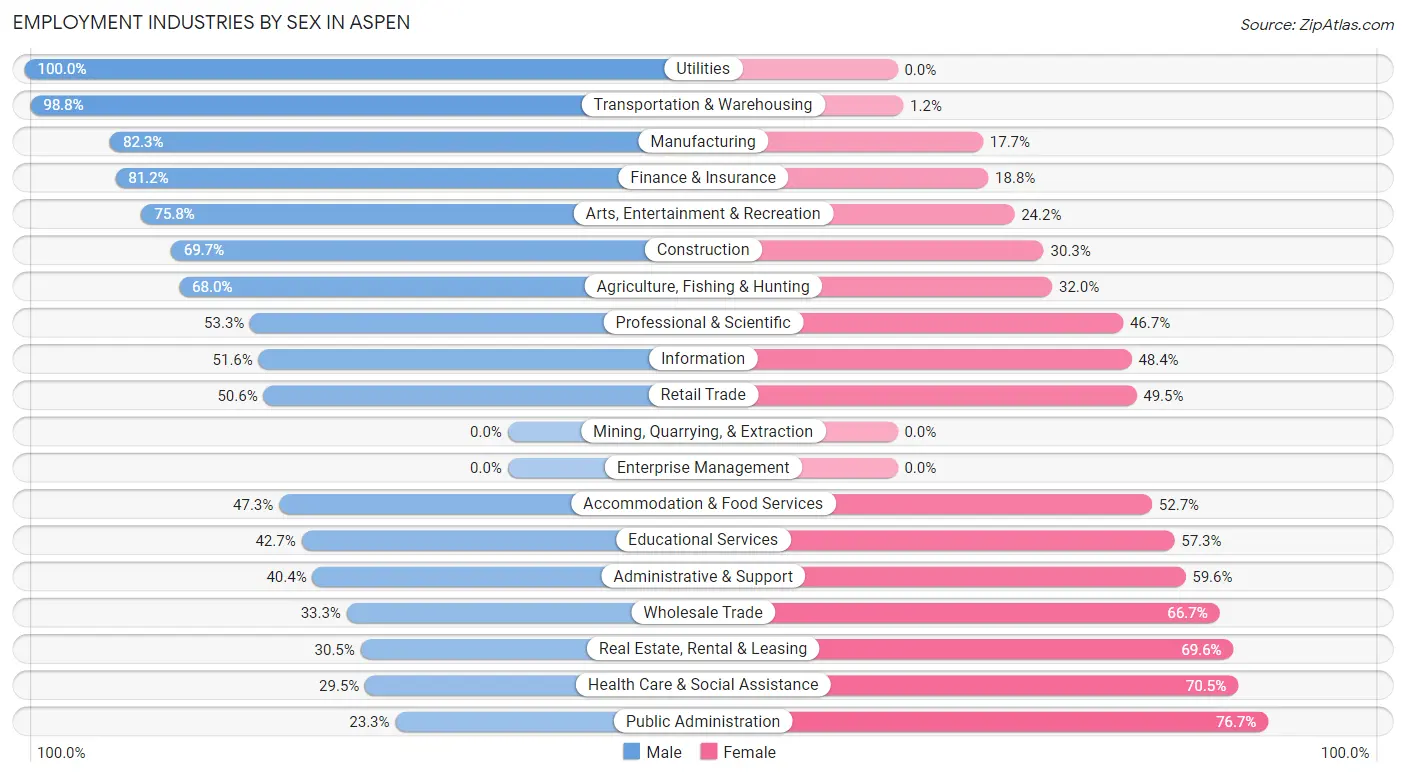
Employment Industries by Sex in Aspen
The Aspen industries that see more men than women are Utilities (100.0%), Transportation & Warehousing (98.8%), and Manufacturing (82.3%), whereas the industries that tend to have a higher number of women are Public Administration (76.7%), Health Care & Social Assistance (70.5%), and Real Estate, Rental & Leasing (69.6%).
| Industry | Male | Female |
| Agriculture, Fishing & Hunting | 17 (68.0%) | 8 (32.0%) |
| Mining, Quarrying, & Extraction | 0 (0.0%) | 0 (0.0%) |
| Construction | 106 (69.7%) | 46 (30.3%) |
| Manufacturing | 121 (82.3%) | 26 (17.7%) |
| Wholesale Trade | 16 (33.3%) | 32 (66.7%) |
| Retail Trade | 229 (50.5%) | 224 (49.4%) |
| Transportation & Warehousing | 249 (98.8%) | 3 (1.2%) |
| Utilities | 77 (100.0%) | 0 (0.0%) |
| Information | 66 (51.6%) | 62 (48.4%) |
| Finance & Insurance | 147 (81.2%) | 34 (18.8%) |
| Real Estate, Rental & Leasing | 95 (30.4%) | 217 (69.6%) |
| Professional & Scientific | 161 (53.3%) | 141 (46.7%) |
| Enterprise Management | 0 (0.0%) | 0 (0.0%) |
| Administrative & Support | 78 (40.4%) | 115 (59.6%) |
| Educational Services | 108 (42.7%) | 145 (57.3%) |
| Health Care & Social Assistance | 162 (29.5%) | 387 (70.5%) |
| Arts, Entertainment & Recreation | 395 (75.8%) | 126 (24.2%) |
| Accommodation & Food Services | 274 (47.3%) | 305 (52.7%) |
| Public Administration | 50 (23.3%) | 165 (76.7%) |
| Total | 2,407 (52.5%) | 2,175 (47.5%) |
Education in Aspen
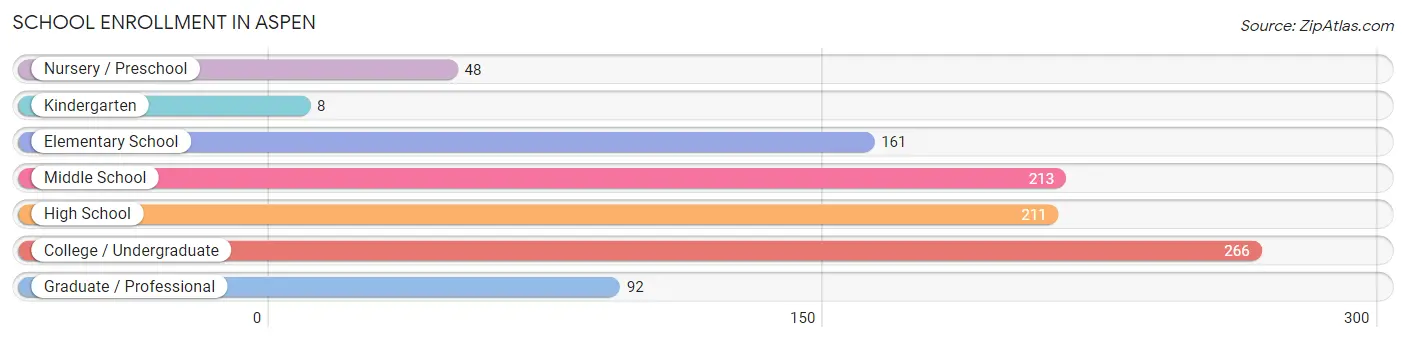
School Enrollment in Aspen
The most common levels of schooling among the 999 students in Aspen are college / undergraduate (266 | 26.6%), middle school (213 | 21.3%), and high school (211 | 21.1%).
| School Level | # Students | % Students |
| Nursery / Preschool | 48 | 4.8% |
| Kindergarten | 8 | 0.8% |
| Elementary School | 161 | 16.1% |
| Middle School | 213 | 21.3% |
| High School | 211 | 21.1% |
| College / Undergraduate | 266 | 26.6% |
| Graduate / Professional | 92 | 9.2% |
| Total | 999 | 100.0% |
School Enrollment by Age by Funding Source in Aspen
Out of a total of 999 students who are enrolled in schools in Aspen, 131 (13.1%) attend a private institution, while the remaining 868 (86.9%) are enrolled in public schools. The age group of 3 to 4 year olds has the highest likelihood of being enrolled in private schools, with 48 (100.0% in the age bracket) enrolled. Conversely, the age group of 20 to 24 year olds has the lowest likelihood of being enrolled in a private school, with 173 (99.4% in the age bracket) attending a public institution.
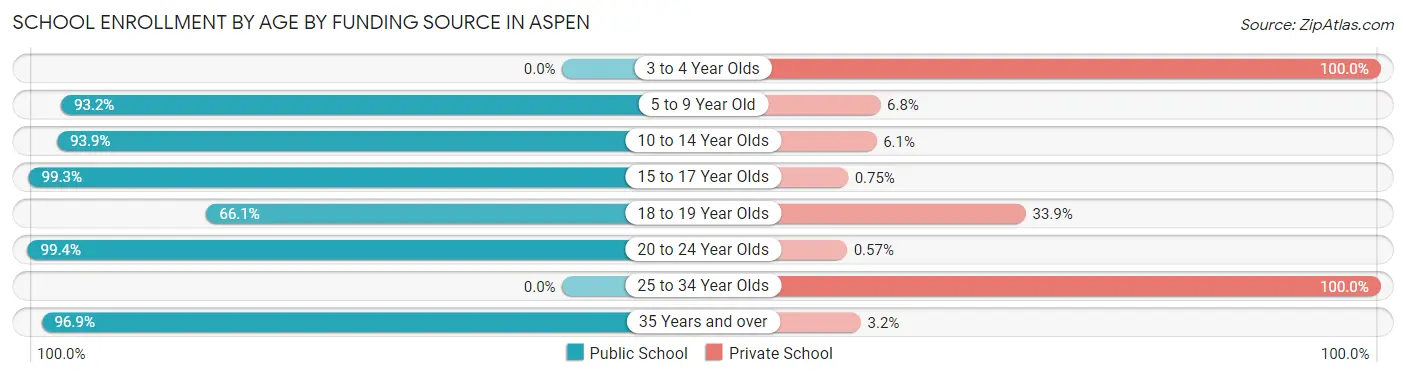
| Age Bracket | Public School | Private School |
| 3 to 4 Year Olds | 0 (0.0%) | 48 (100.0%) |
| 5 to 9 Year Old | 110 (93.2%) | 8 (6.8%) |
| 10 to 14 Year Olds | 248 (93.9%) | 16 (6.1%) |
| 15 to 17 Year Olds | 132 (99.3%) | 1 (0.7%) |
| 18 to 19 Year Olds | 82 (66.1%) | 42 (33.9%) |
| 20 to 24 Year Olds | 173 (99.4%) | 1 (0.6%) |
| 25 to 34 Year Olds | 0 (0.0%) | 11 (100.0%) |
| 35 Years and over | 123 (96.9%) | 4 (3.2%) |
| Total | 868 (86.9%) | 131 (13.1%) |
Educational Attainment by Field of Study in Aspen
Business (1,077 | 27.3%), social sciences (482 | 12.2%), arts & humanities (360 | 9.1%), education (336 | 8.5%), and liberal arts & history (273 | 6.9%) are the most common fields of study among 3,941 individuals in Aspen who have obtained a bachelor's degree or higher.
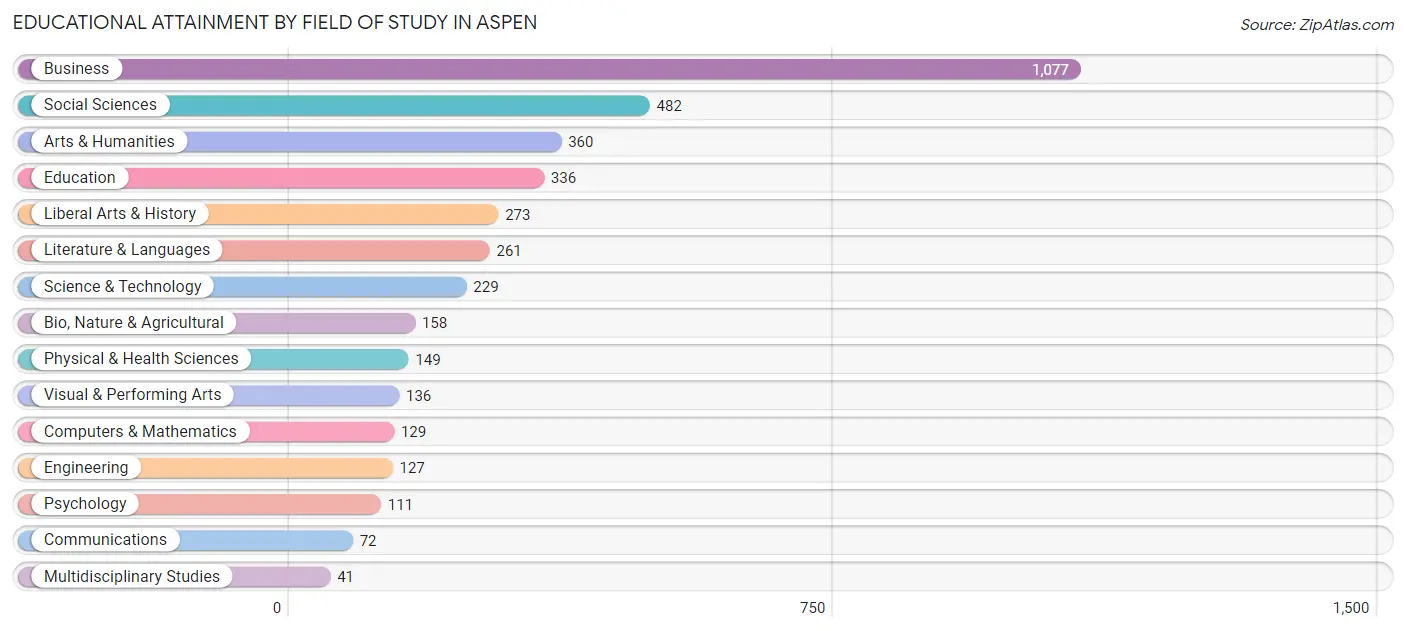
| Field of Study | # Graduates | % Graduates |
| Computers & Mathematics | 129 | 3.3% |
| Bio, Nature & Agricultural | 158 | 4.0% |
| Physical & Health Sciences | 149 | 3.8% |
| Psychology | 111 | 2.8% |
| Social Sciences | 482 | 12.2% |
| Engineering | 127 | 3.2% |
| Multidisciplinary Studies | 41 | 1.0% |
| Science & Technology | 229 | 5.8% |
| Business | 1,077 | 27.3% |
| Education | 336 | 8.5% |
| Literature & Languages | 261 | 6.6% |
| Liberal Arts & History | 273 | 6.9% |
| Visual & Performing Arts | 136 | 3.5% |
| Communications | 72 | 1.8% |
| Arts & Humanities | 360 | 9.1% |
| Total | 3,941 | 100.0% |
Transportation & Commute in Aspen
Vehicle Availability by Sex in Aspen
The most prevalent vehicle ownership categories in Aspen are males with 2 vehicles (956, accounting for 40.7%) and females with 2 vehicles (710, making up 44.3%).
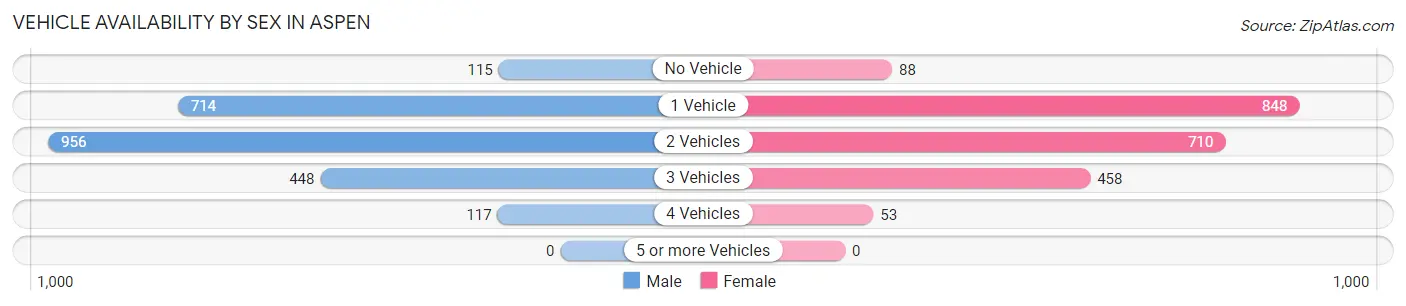
| Vehicles Available | Male | Female |
| No Vehicle | 115 (4.9%) | 88 (4.1%) |
| 1 Vehicle | 714 (30.4%) | 848 (39.3%) |
| 2 Vehicles | 956 (40.7%) | 710 (32.9%) |
| 3 Vehicles | 448 (19.1%) | 458 (21.2%) |
| 4 Vehicles | 117 (5.0%) | 53 (2.5%) |
| 5 or more Vehicles | 0 (0.0%) | 0 (0.0%) |
| Total | 2,350 (100.0%) | 2,157 (100.0%) |
Commute Time in Aspen
The most frequently occuring commute durations in Aspen are 10 to 14 minutes (1,108 commuters, 28.1%), 15 to 19 minutes (968 commuters, 24.5%), and 5 to 9 minutes (880 commuters, 22.3%).
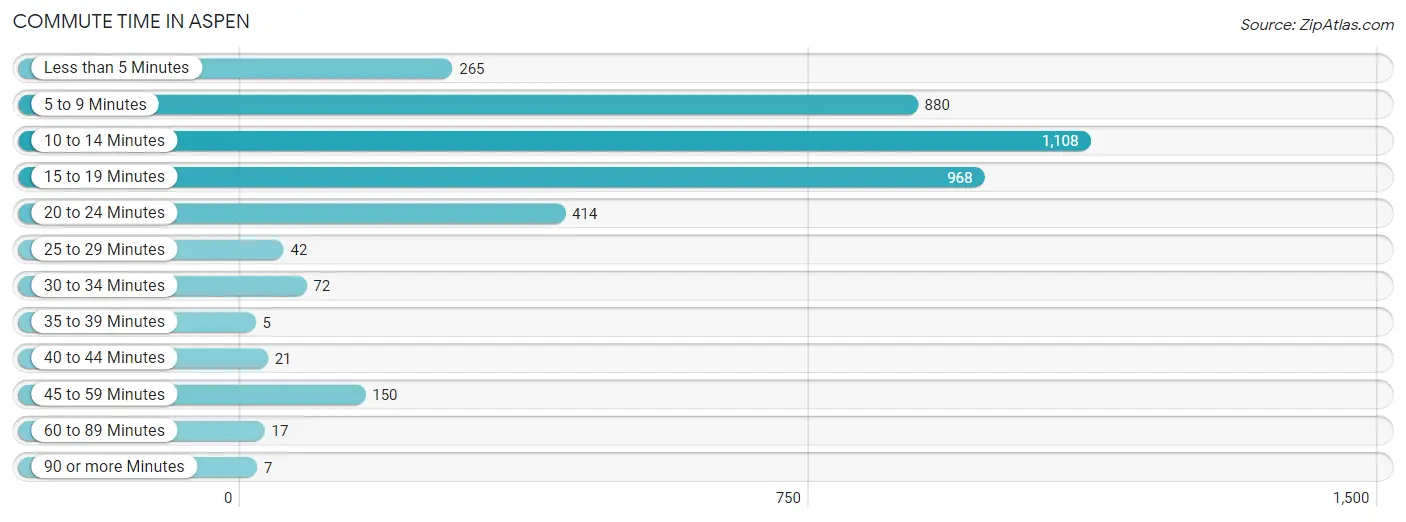
| Commute Time | # Commuters | % Commuters |
| Less than 5 Minutes | 265 | 6.7% |
| 5 to 9 Minutes | 880 | 22.3% |
| 10 to 14 Minutes | 1,108 | 28.1% |
| 15 to 19 Minutes | 968 | 24.5% |
| 20 to 24 Minutes | 414 | 10.5% |
| 25 to 29 Minutes | 42 | 1.1% |
| 30 to 34 Minutes | 72 | 1.8% |
| 35 to 39 Minutes | 5 | 0.1% |
| 40 to 44 Minutes | 21 | 0.5% |
| 45 to 59 Minutes | 150 | 3.8% |
| 60 to 89 Minutes | 17 | 0.4% |
| 90 or more Minutes | 7 | 0.2% |
Commute Time by Sex in Aspen
The most common commute times in Aspen are 10 to 14 minutes (615 commuters, 28.7%) for males and 15 to 19 minutes (591 commuters, 32.7%) for females.
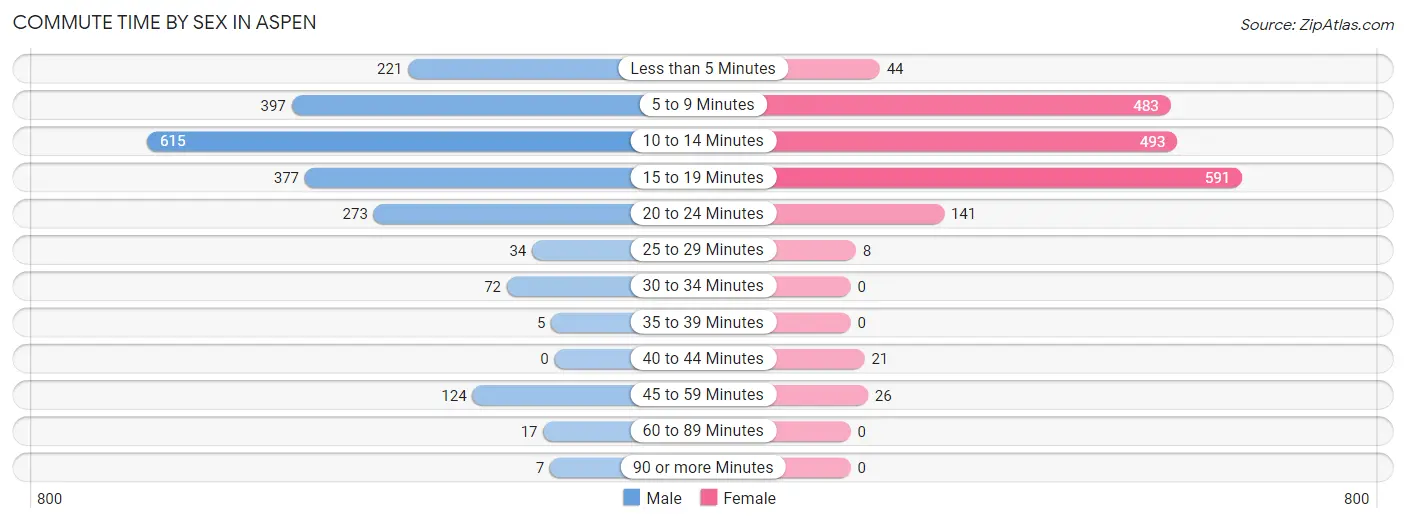
| Commute Time | Male | Female |
| Less than 5 Minutes | 221 (10.3%) | 44 (2.4%) |
| 5 to 9 Minutes | 397 (18.5%) | 483 (26.7%) |
| 10 to 14 Minutes | 615 (28.7%) | 493 (27.3%) |
| 15 to 19 Minutes | 377 (17.6%) | 591 (32.7%) |
| 20 to 24 Minutes | 273 (12.8%) | 141 (7.8%) |
| 25 to 29 Minutes | 34 (1.6%) | 8 (0.4%) |
| 30 to 34 Minutes | 72 (3.4%) | 0 (0.0%) |
| 35 to 39 Minutes | 5 (0.2%) | 0 (0.0%) |
| 40 to 44 Minutes | 0 (0.0%) | 21 (1.2%) |
| 45 to 59 Minutes | 124 (5.8%) | 26 (1.4%) |
| 60 to 89 Minutes | 17 (0.8%) | 0 (0.0%) |
| 90 or more Minutes | 7 (0.3%) | 0 (0.0%) |
Time of Departure to Work by Sex in Aspen
The most frequent times of departure to work in Aspen are 8:00 AM to 8:29 AM (359, 16.8%) for males and 9:00 AM to 9:59 AM (350, 19.4%) for females.
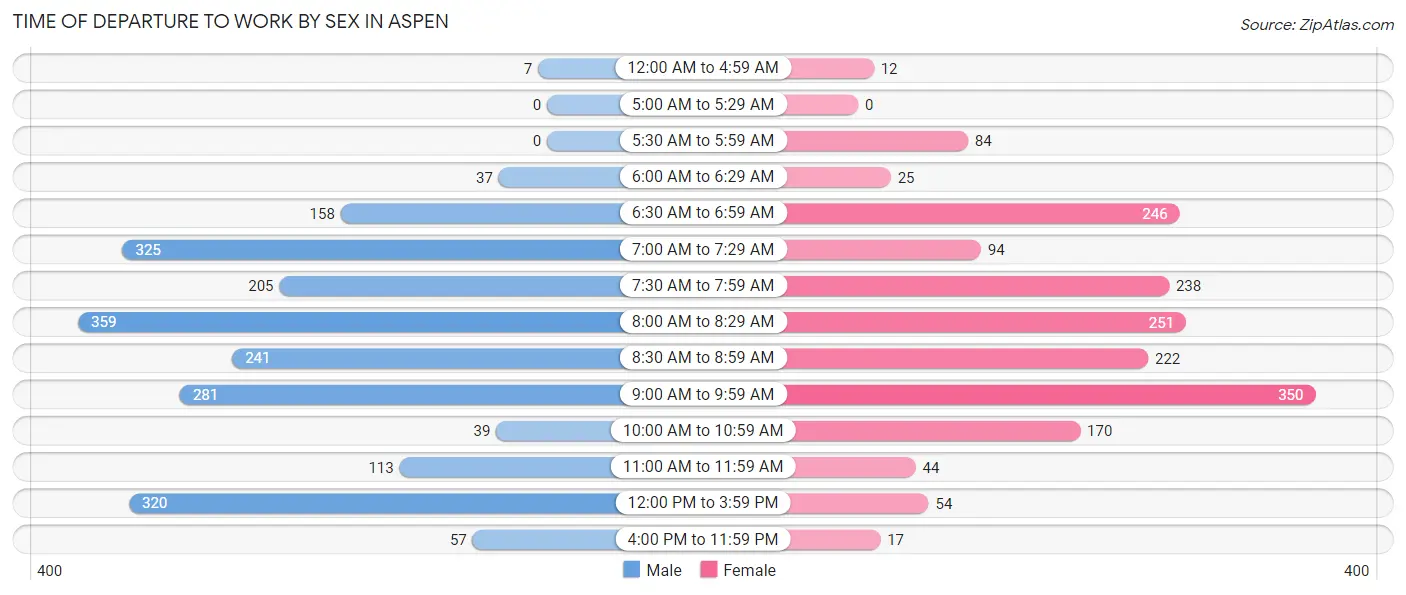
| Time of Departure | Male | Female |
| 12:00 AM to 4:59 AM | 7 (0.3%) | 12 (0.7%) |
| 5:00 AM to 5:29 AM | 0 (0.0%) | 0 (0.0%) |
| 5:30 AM to 5:59 AM | 0 (0.0%) | 84 (4.6%) |
| 6:00 AM to 6:29 AM | 37 (1.7%) | 25 (1.4%) |
| 6:30 AM to 6:59 AM | 158 (7.4%) | 246 (13.6%) |
| 7:00 AM to 7:29 AM | 325 (15.2%) | 94 (5.2%) |
| 7:30 AM to 7:59 AM | 205 (9.6%) | 238 (13.2%) |
| 8:00 AM to 8:29 AM | 359 (16.8%) | 251 (13.9%) |
| 8:30 AM to 8:59 AM | 241 (11.3%) | 222 (12.3%) |
| 9:00 AM to 9:59 AM | 281 (13.1%) | 350 (19.4%) |
| 10:00 AM to 10:59 AM | 39 (1.8%) | 170 (9.4%) |
| 11:00 AM to 11:59 AM | 113 (5.3%) | 44 (2.4%) |
| 12:00 PM to 3:59 PM | 320 (14.9%) | 54 (3.0%) |
| 4:00 PM to 11:59 PM | 57 (2.7%) | 17 (0.9%) |
| Total | 2,142 (100.0%) | 1,807 (100.0%) |
Housing Occupancy in Aspen
Occupancy by Ownership in Aspen
Of the total 3,746 dwellings in Aspen, owner-occupied units account for 2,091 (55.8%), while renter-occupied units make up 1,655 (44.2%).
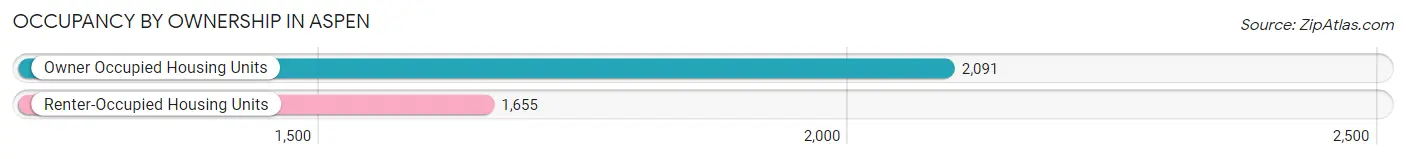
| Occupancy | # Housing Units | % Housing Units |
| Owner Occupied Housing Units | 2,091 | 55.8% |
| Renter-Occupied Housing Units | 1,655 | 44.2% |
| Total Occupied Housing Units | 3,746 | 100.0% |
Occupancy by Household Size in Aspen
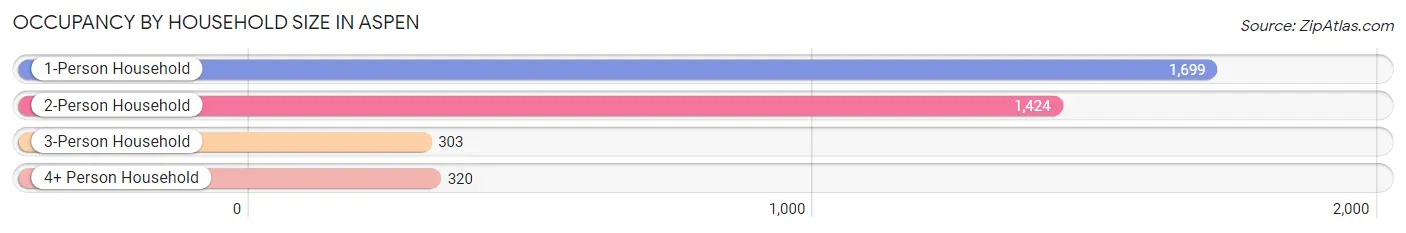
| Household Size | # Housing Units | % Housing Units |
| 1-Person Household | 1,699 | 45.4% |
| 2-Person Household | 1,424 | 38.0% |
| 3-Person Household | 303 | 8.1% |
| 4+ Person Household | 320 | 8.5% |
| Total Housing Units | 3,746 | 100.0% |
Occupancy by Ownership by Household Size in Aspen
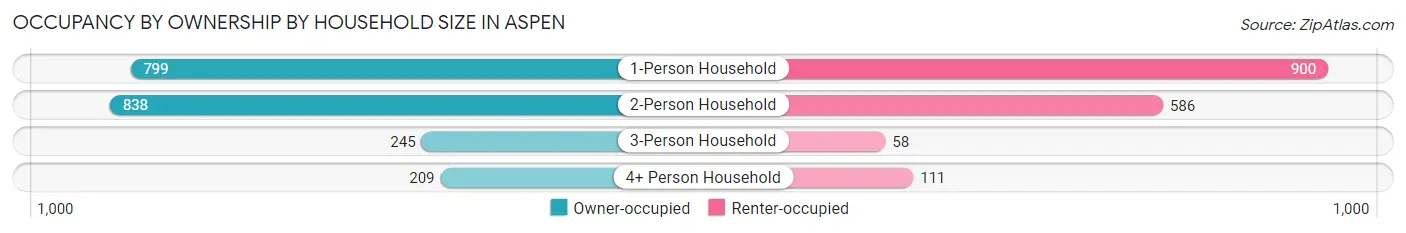
| Household Size | Owner-occupied | Renter-occupied |
| 1-Person Household | 799 (47.0%) | 900 (53.0%) |
| 2-Person Household | 838 (58.9%) | 586 (41.1%) |
| 3-Person Household | 245 (80.9%) | 58 (19.1%) |
| 4+ Person Household | 209 (65.3%) | 111 (34.7%) |
| Total Housing Units | 2,091 (55.8%) | 1,655 (44.2%) |
Occupancy by Educational Attainment in Aspen
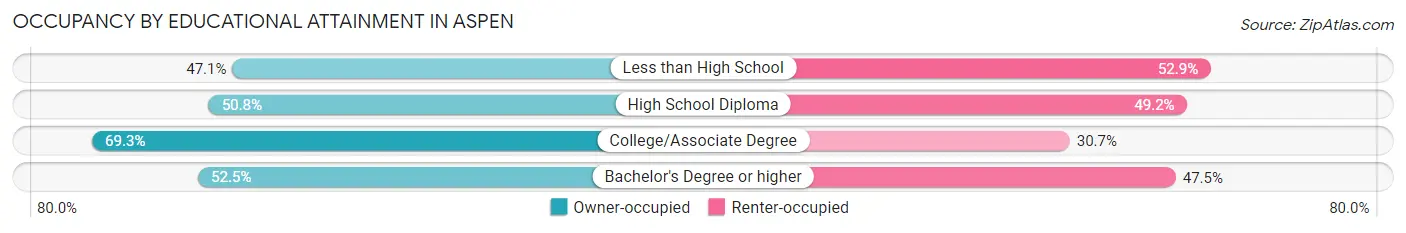
| Household Size | Owner-occupied | Renter-occupied |
| Less than High School | 8 (47.1%) | 9 (52.9%) |
| High School Diploma | 193 (50.8%) | 187 (49.2%) |
| College/Associate Degree | 546 (69.3%) | 242 (30.7%) |
| Bachelor's Degree or higher | 1,344 (52.5%) | 1,217 (47.5%) |
Occupancy by Age of Householder in Aspen
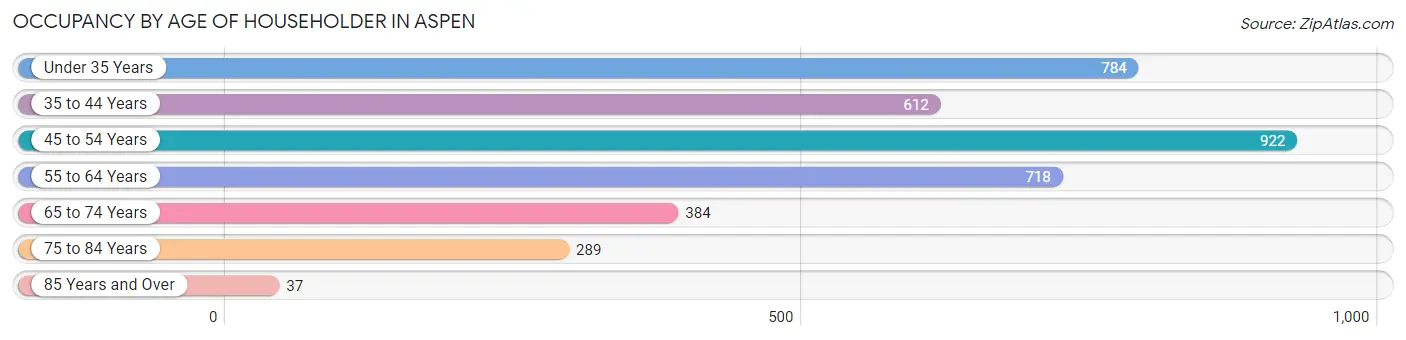
| Age Bracket | # Households | % Households |
| Under 35 Years | 784 | 20.9% |
| 35 to 44 Years | 612 | 16.3% |
| 45 to 54 Years | 922 | 24.6% |
| 55 to 64 Years | 718 | 19.2% |
| 65 to 74 Years | 384 | 10.2% |
| 75 to 84 Years | 289 | 7.7% |
| 85 Years and Over | 37 | 1.0% |
| Total | 3,746 | 100.0% |
Housing Finances in Aspen
Median Income by Occupancy in Aspen
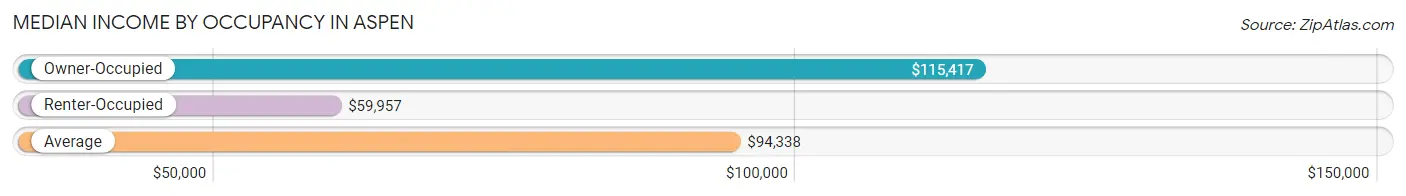
| Occupancy Type | # Households | Median Income |
| Owner-Occupied | 2,091 (55.8%) | $115,417 |
| Renter-Occupied | 1,655 (44.2%) | $59,957 |
| Average | 3,746 (100.0%) | $94,338 |
Occupancy by Householder Income Bracket in Aspen
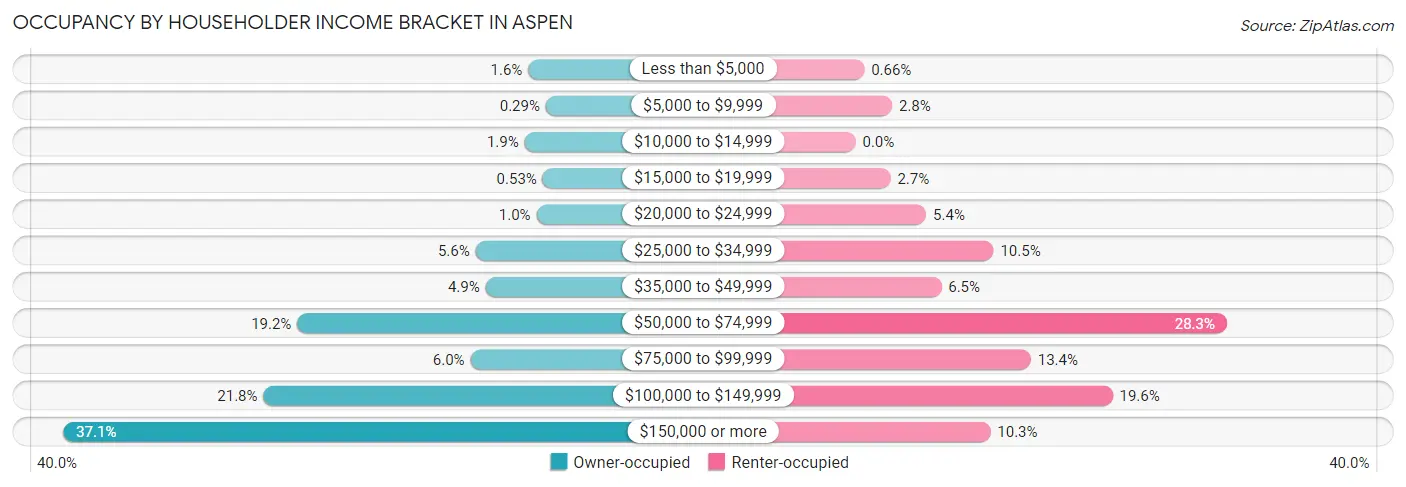
| Income Bracket | Owner-occupied | Renter-occupied |
| Less than $5,000 | 34 (1.6%) | 11 (0.7%) |
| $5,000 to $9,999 | 6 (0.3%) | 46 (2.8%) |
| $10,000 to $14,999 | 40 (1.9%) | 0 (0.0%) |
| $15,000 to $19,999 | 11 (0.5%) | 44 (2.7%) |
| $20,000 to $24,999 | 21 (1.0%) | 89 (5.4%) |
| $25,000 to $34,999 | 118 (5.6%) | 174 (10.5%) |
| $35,000 to $49,999 | 102 (4.9%) | 108 (6.5%) |
| $50,000 to $74,999 | 402 (19.2%) | 468 (28.3%) |
| $75,000 to $99,999 | 126 (6.0%) | 221 (13.4%) |
| $100,000 to $149,999 | 456 (21.8%) | 324 (19.6%) |
| $150,000 or more | 775 (37.1%) | 170 (10.3%) |
| Total | 2,091 (100.0%) | 1,655 (100.0%) |
Monthly Housing Cost Tiers in Aspen
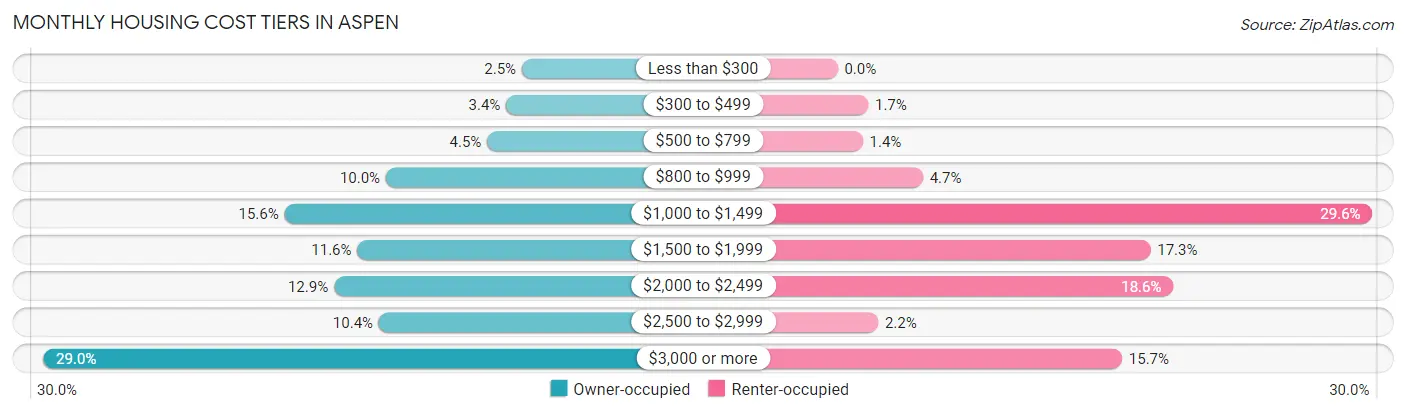
| Monthly Cost | Owner-occupied | Renter-occupied |
| Less than $300 | 53 (2.5%) | 0 (0.0%) |
| $300 to $499 | 71 (3.4%) | 28 (1.7%) |
| $500 to $799 | 93 (4.4%) | 23 (1.4%) |
| $800 to $999 | 210 (10.0%) | 78 (4.7%) |
| $1,000 to $1,499 | 327 (15.6%) | 489 (29.5%) |
| $1,500 to $1,999 | 243 (11.6%) | 286 (17.3%) |
| $2,000 to $2,499 | 270 (12.9%) | 307 (18.5%) |
| $2,500 to $2,999 | 218 (10.4%) | 37 (2.2%) |
| $3,000 or more | 606 (29.0%) | 260 (15.7%) |
| Total | 2,091 (100.0%) | 1,655 (100.0%) |
Physical Housing Characteristics in Aspen
Housing Structures in Aspen
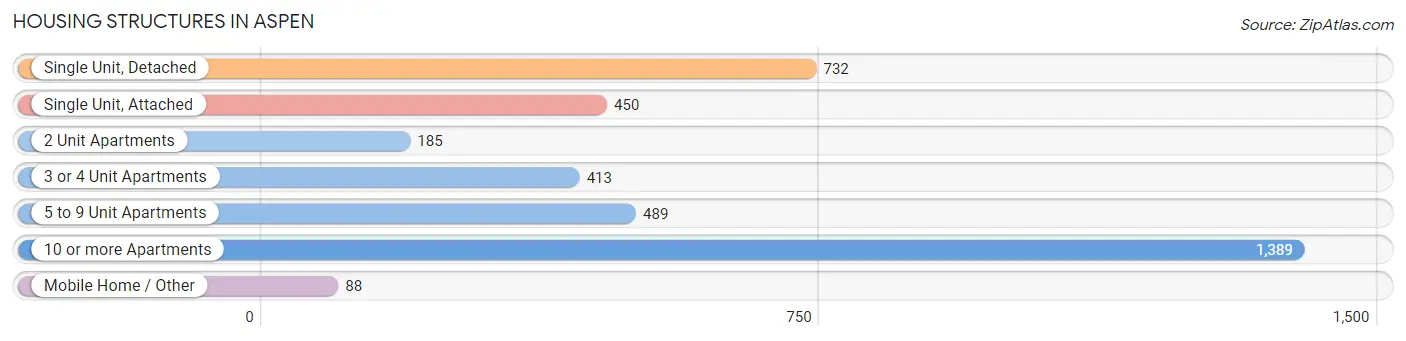
| Structure Type | # Housing Units | % Housing Units |
| Single Unit, Detached | 732 | 19.5% |
| Single Unit, Attached | 450 | 12.0% |
| 2 Unit Apartments | 185 | 4.9% |
| 3 or 4 Unit Apartments | 413 | 11.0% |
| 5 to 9 Unit Apartments | 489 | 13.1% |
| 10 or more Apartments | 1,389 | 37.1% |
| Mobile Home / Other | 88 | 2.4% |
| Total | 3,746 | 100.0% |
Housing Structures by Occupancy in Aspen
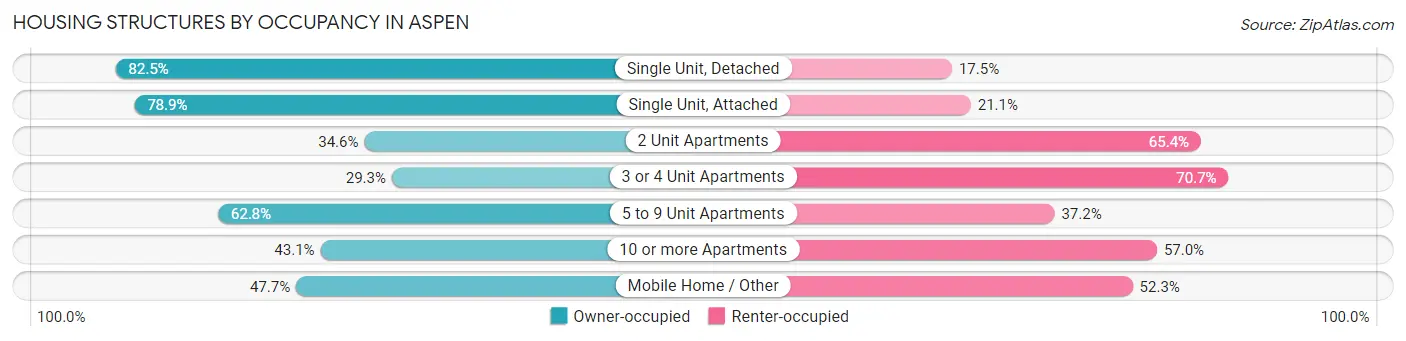
| Structure Type | Owner-occupied | Renter-occupied |
| Single Unit, Detached | 604 (82.5%) | 128 (17.5%) |
| Single Unit, Attached | 355 (78.9%) | 95 (21.1%) |
| 2 Unit Apartments | 64 (34.6%) | 121 (65.4%) |
| 3 or 4 Unit Apartments | 121 (29.3%) | 292 (70.7%) |
| 5 to 9 Unit Apartments | 307 (62.8%) | 182 (37.2%) |
| 10 or more Apartments | 598 (43.0%) | 791 (57.0%) |
| Mobile Home / Other | 42 (47.7%) | 46 (52.3%) |
| Total | 2,091 (55.8%) | 1,655 (44.2%) |
Housing Structures by Number of Rooms in Aspen
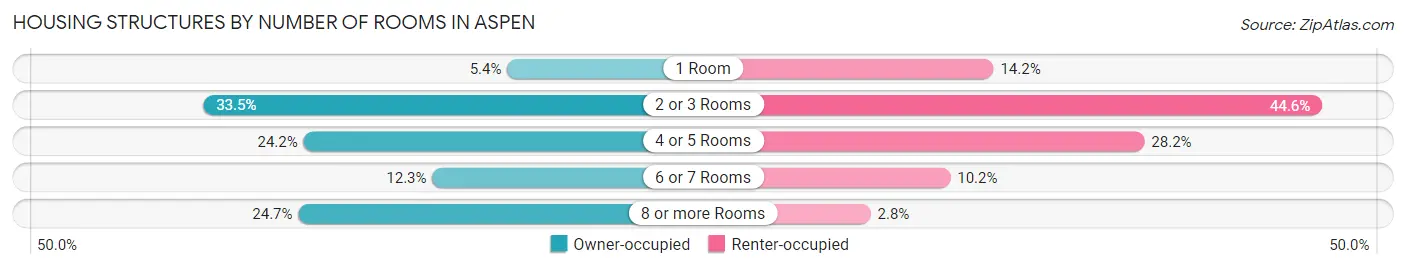
| Number of Rooms | Owner-occupied | Renter-occupied |
| 1 Room | 112 (5.4%) | 235 (14.2%) |
| 2 or 3 Rooms | 700 (33.5%) | 738 (44.6%) |
| 4 or 5 Rooms | 506 (24.2%) | 466 (28.2%) |
| 6 or 7 Rooms | 257 (12.3%) | 169 (10.2%) |
| 8 or more Rooms | 516 (24.7%) | 47 (2.8%) |
| Total | 2,091 (100.0%) | 1,655 (100.0%) |
Housing Structure by Heating Type in Aspen
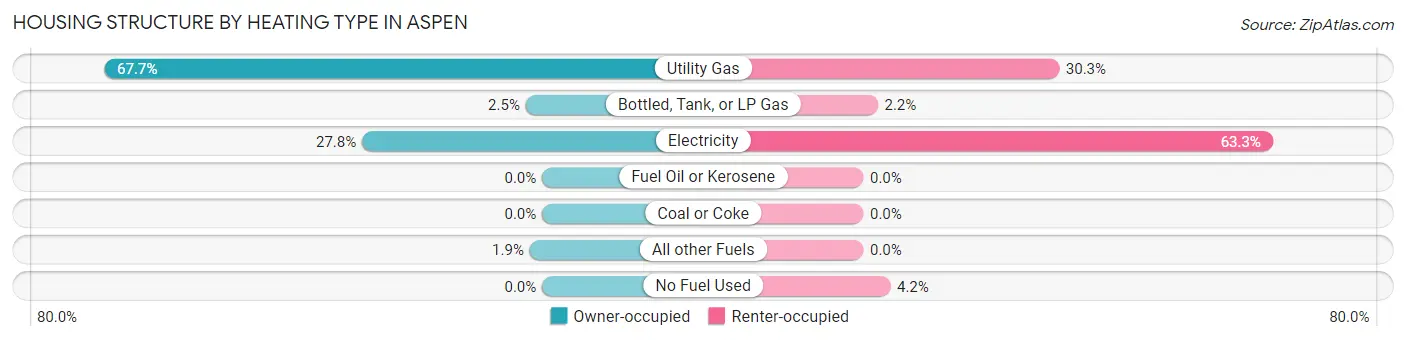
| Heating Type | Owner-occupied | Renter-occupied |
| Utility Gas | 1,416 (67.7%) | 501 (30.3%) |
| Bottled, Tank, or LP Gas | 53 (2.5%) | 37 (2.2%) |
| Electricity | 582 (27.8%) | 1,048 (63.3%) |
| Fuel Oil or Kerosene | 0 (0.0%) | 0 (0.0%) |
| Coal or Coke | 0 (0.0%) | 0 (0.0%) |
| All other Fuels | 40 (1.9%) | 0 (0.0%) |
| No Fuel Used | 0 (0.0%) | 69 (4.2%) |
| Total | 2,091 (100.0%) | 1,655 (100.0%) |
Household Vehicle Usage in Aspen
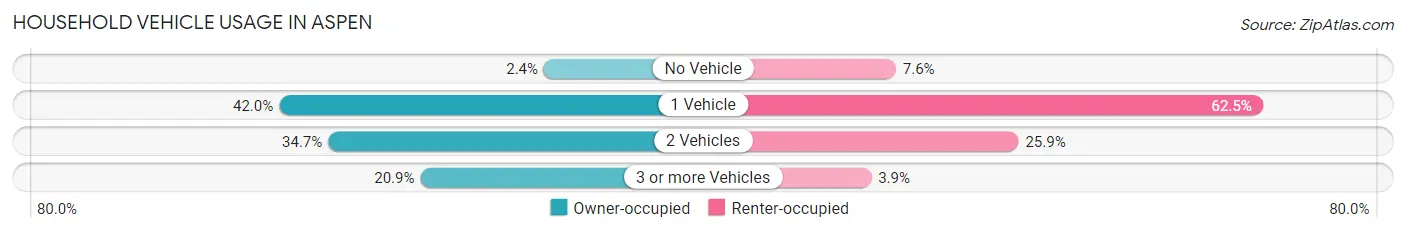
| Vehicles per Household | Owner-occupied | Renter-occupied |
| No Vehicle | 51 (2.4%) | 126 (7.6%) |
| 1 Vehicle | 878 (42.0%) | 1,035 (62.5%) |
| 2 Vehicles | 725 (34.7%) | 429 (25.9%) |
| 3 or more Vehicles | 437 (20.9%) | 65 (3.9%) |
| Total | 2,091 (100.0%) | 1,655 (100.0%) |
Real Estate & Mortgages in Aspen
Real Estate and Mortgage Overview in Aspen
| Characteristic | Without Mortgage | With Mortgage |
| Housing Units | 918 | 1,173 |
| Median Property Value | $2,000,001 | $380,900 |
| Median Household Income | $101,129 | $481 |
| Monthly Housing Costs | $1,408 | $435 |
| Real Estate Taxes | $5,675 | $54 |
Property Value by Mortgage Status in Aspen
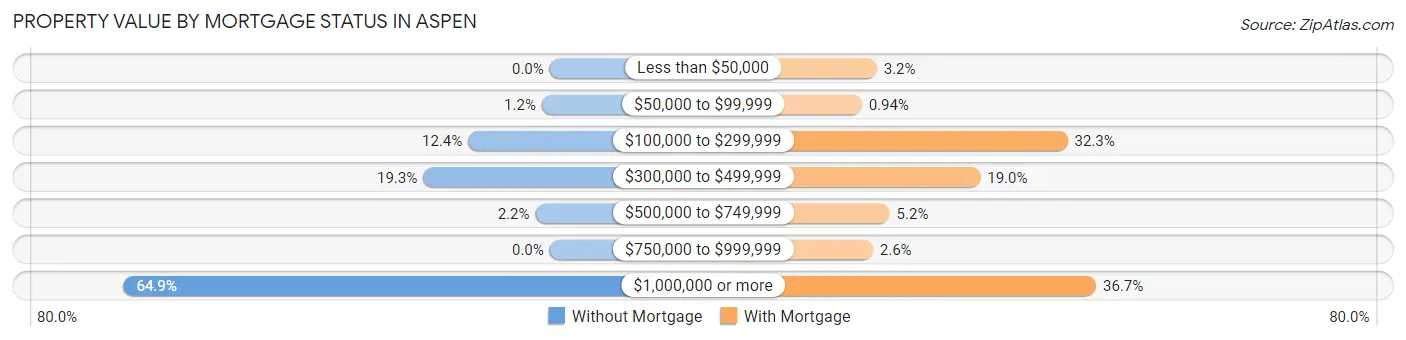
| Property Value | Without Mortgage | With Mortgage |
| Less than $50,000 | 0 (0.0%) | 38 (3.2%) |
| $50,000 to $99,999 | 11 (1.2%) | 11 (0.9%) |
| $100,000 to $299,999 | 114 (12.4%) | 379 (32.3%) |
| $300,000 to $499,999 | 177 (19.3%) | 223 (19.0%) |
| $500,000 to $749,999 | 20 (2.2%) | 61 (5.2%) |
| $750,000 to $999,999 | 0 (0.0%) | 31 (2.6%) |
| $1,000,000 or more | 596 (64.9%) | 430 (36.7%) |
| Total | 918 (100.0%) | 1,173 (100.0%) |
Household Income by Mortgage Status in Aspen
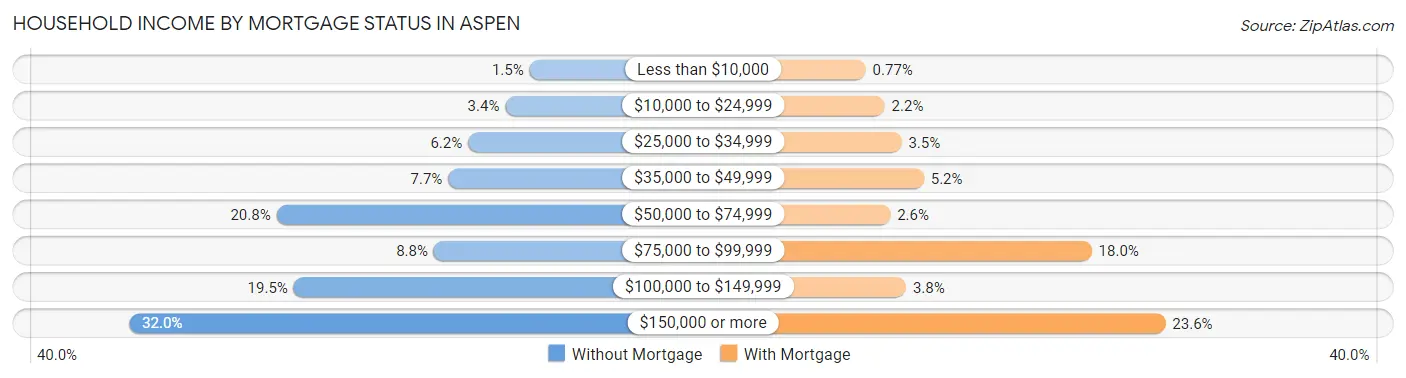
| Household Income | Without Mortgage | With Mortgage |
| Less than $10,000 | 14 (1.5%) | 9 (0.8%) |
| $10,000 to $24,999 | 31 (3.4%) | 26 (2.2%) |
| $25,000 to $34,999 | 57 (6.2%) | 41 (3.5%) |
| $35,000 to $49,999 | 71 (7.7%) | 61 (5.2%) |
| $50,000 to $74,999 | 191 (20.8%) | 31 (2.6%) |
| $75,000 to $99,999 | 81 (8.8%) | 211 (18.0%) |
| $100,000 to $149,999 | 179 (19.5%) | 45 (3.8%) |
| $150,000 or more | 294 (32.0%) | 277 (23.6%) |
| Total | 918 (100.0%) | 1,173 (100.0%) |
Property Value to Household Income Ratio in Aspen
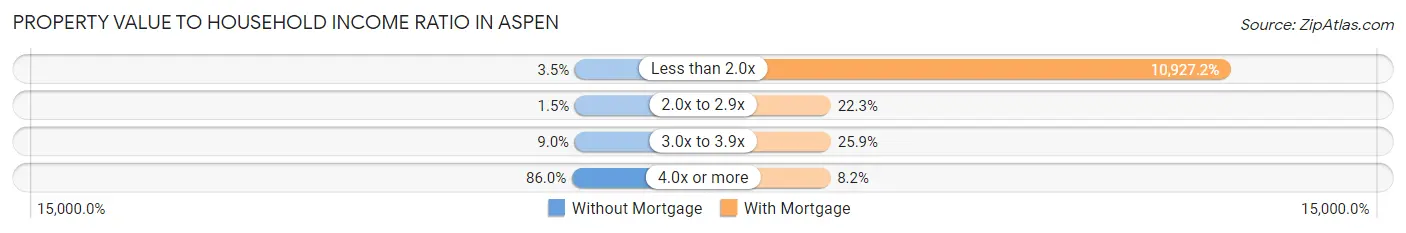
| Value-to-Income Ratio | Without Mortgage | With Mortgage |
| Less than 2.0x | 32 (3.5%) | 128,176 (10,927.2%) |
| 2.0x to 2.9x | 14 (1.5%) | 262 (22.3%) |
| 3.0x to 3.9x | 83 (9.0%) | 304 (25.9%) |
| 4.0x or more | 789 (86.0%) | 96 (8.2%) |
| Total | 918 (100.0%) | 1,173 (100.0%) |
Real Estate Taxes by Mortgage Status in Aspen
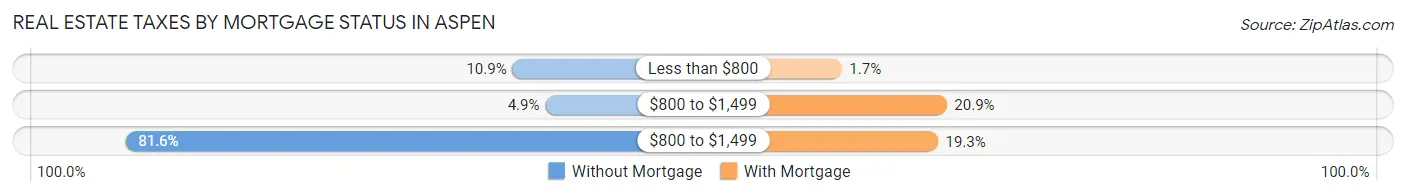
| Property Taxes | Without Mortgage | With Mortgage |
| Less than $800 | 100 (10.9%) | 20 (1.7%) |
| $800 to $1,499 | 45 (4.9%) | 245 (20.9%) |
| $800 to $1,499 | 749 (81.6%) | 226 (19.3%) |
| Total | 918 (100.0%) | 1,173 (100.0%) |
Health & Disability in Aspen
Health Insurance Coverage by Age in Aspen
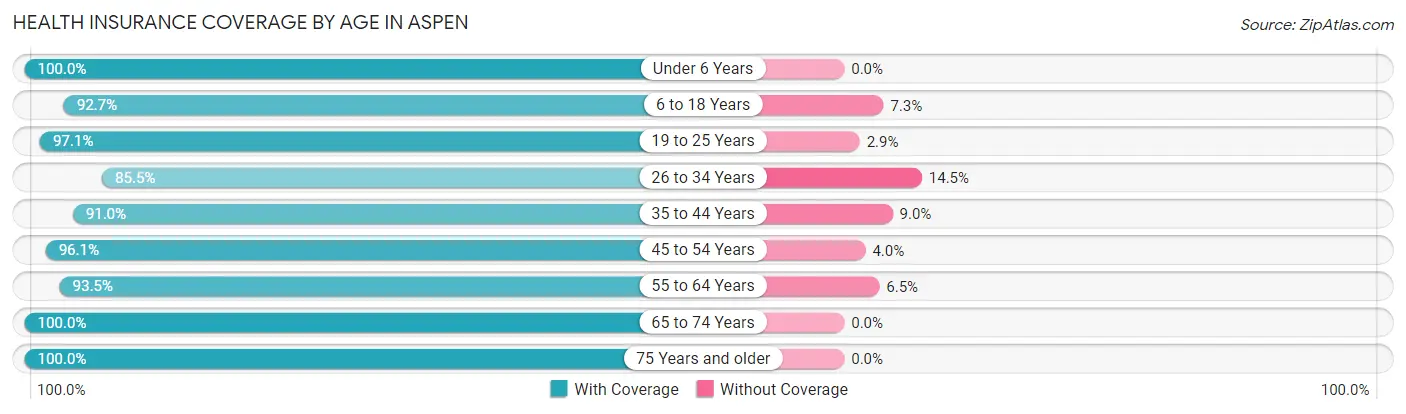
| Age Bracket | With Coverage | Without Coverage |
| Under 6 Years | 158 (100.0%) | 0 (0.0%) |
| 6 to 18 Years | 545 (92.7%) | 43 (7.3%) |
| 19 to 25 Years | 708 (97.1%) | 21 (2.9%) |
| 26 to 34 Years | 928 (85.5%) | 157 (14.5%) |
| 35 to 44 Years | 939 (91.0%) | 93 (9.0%) |
| 45 to 54 Years | 1,217 (96.1%) | 50 (4.0%) |
| 55 to 64 Years | 957 (93.5%) | 67 (6.5%) |
| 65 to 74 Years | 633 (100.0%) | 0 (0.0%) |
| 75 Years and older | 406 (100.0%) | 0 (0.0%) |
| Total | 6,491 (93.8%) | 431 (6.2%) |
Health Insurance Coverage by Citizenship Status in Aspen
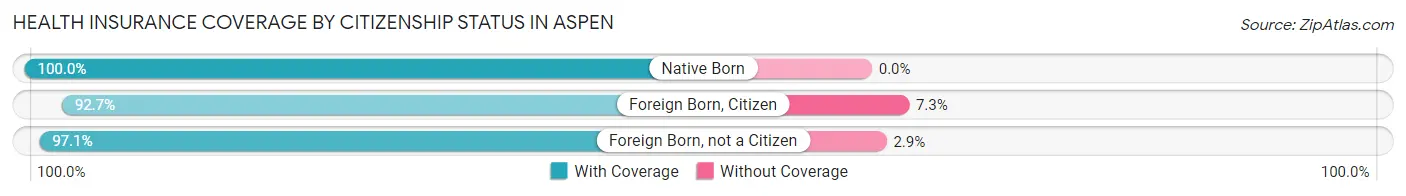
| Citizenship Status | With Coverage | Without Coverage |
| Native Born | 158 (100.0%) | 0 (0.0%) |
| Foreign Born, Citizen | 545 (92.7%) | 43 (7.3%) |
| Foreign Born, not a Citizen | 708 (97.1%) | 21 (2.9%) |
Health Insurance Coverage by Household Income in Aspen
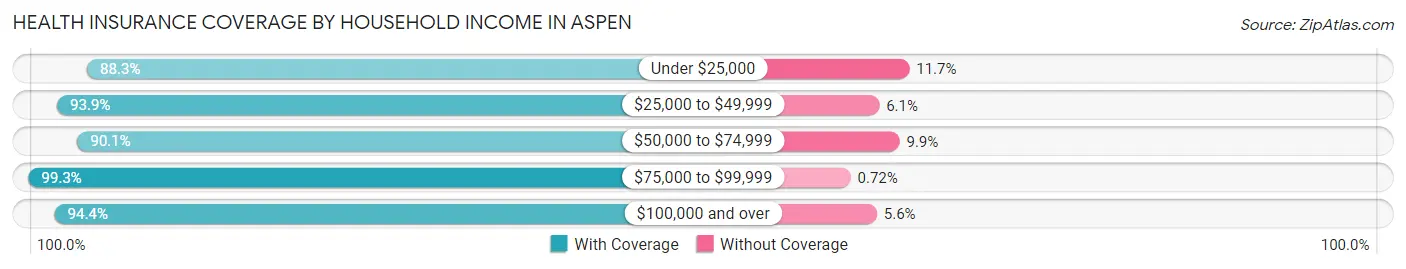
| Household Income | With Coverage | Without Coverage |
| Under $25,000 | 377 (88.3%) | 50 (11.7%) |
| $25,000 to $49,999 | 510 (93.9%) | 33 (6.1%) |
| $50,000 to $74,999 | 1,095 (90.1%) | 120 (9.9%) |
| $75,000 to $99,999 | 693 (99.3%) | 5 (0.7%) |
| $100,000 and over | 3,722 (94.4%) | 222 (5.6%) |
Public vs Private Health Insurance Coverage by Age in Aspen
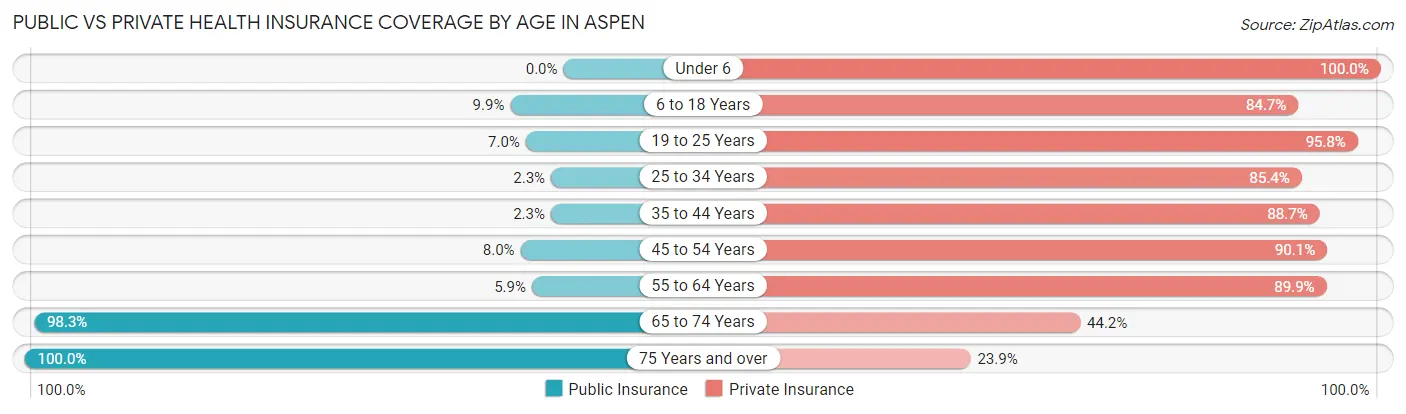
| Age Bracket | Public Insurance | Private Insurance |
| Under 6 | 0 (0.0%) | 158 (100.0%) |
| 6 to 18 Years | 58 (9.9%) | 498 (84.7%) |
| 19 to 25 Years | 51 (7.0%) | 698 (95.8%) |
| 25 to 34 Years | 25 (2.3%) | 926 (85.4%) |
| 35 to 44 Years | 24 (2.3%) | 915 (88.7%) |
| 45 to 54 Years | 101 (8.0%) | 1,141 (90.1%) |
| 55 to 64 Years | 60 (5.9%) | 921 (89.9%) |
| 65 to 74 Years | 622 (98.3%) | 280 (44.2%) |
| 75 Years and over | 406 (100.0%) | 97 (23.9%) |
| Total | 1,347 (19.5%) | 5,634 (81.4%) |
Disability Status by Sex by Age in Aspen
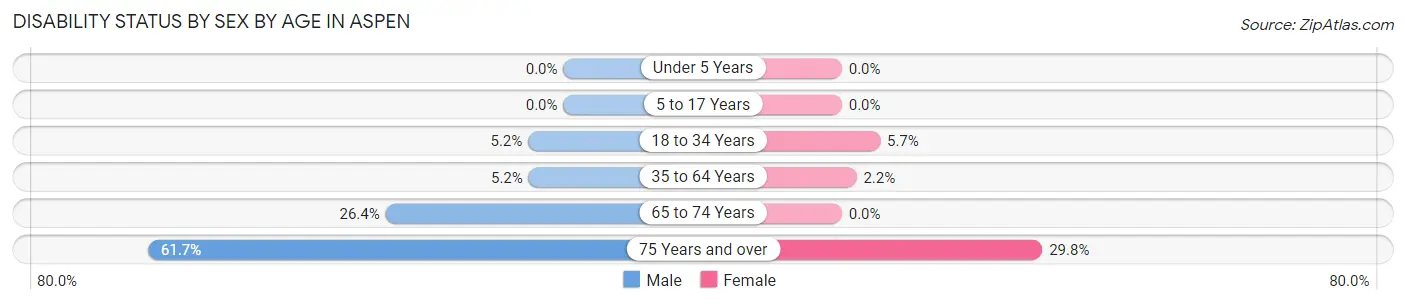
| Age Bracket | Male | Female |
| Under 5 Years | 0 (0.0%) | 0 (0.0%) |
| 5 to 17 Years | 0 (0.0%) | 0 (0.0%) |
| 18 to 34 Years | 53 (5.2%) | 50 (5.7%) |
| 35 to 64 Years | 84 (5.2%) | 37 (2.2%) |
| 65 to 74 Years | 104 (26.4%) | 0 (0.0%) |
| 75 Years and over | 124 (61.7%) | 61 (29.8%) |
Disability Class by Sex by Age in Aspen
Disability Class: Hearing Difficulty
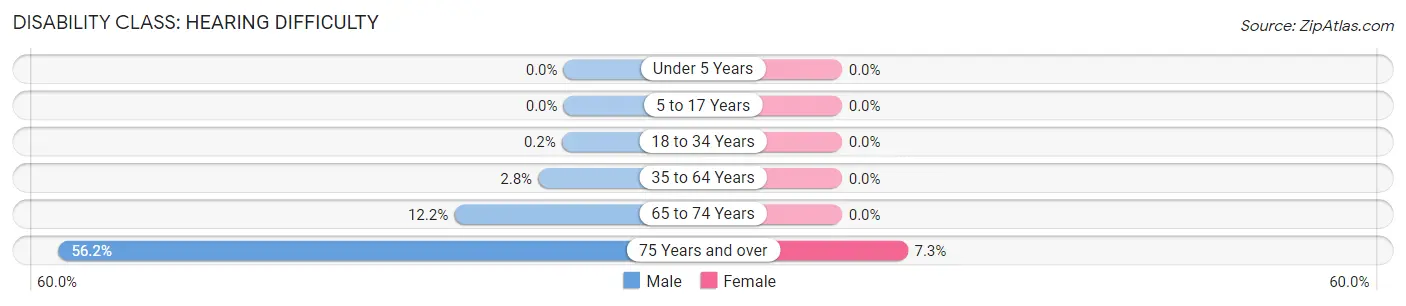
| Age Bracket | Male | Female |
| Under 5 Years | 0 (0.0%) | 0 (0.0%) |
| 5 to 17 Years | 0 (0.0%) | 0 (0.0%) |
| 18 to 34 Years | 2 (0.2%) | 0 (0.0%) |
| 35 to 64 Years | 46 (2.8%) | 0 (0.0%) |
| 65 to 74 Years | 48 (12.2%) | 0 (0.0%) |
| 75 Years and over | 113 (56.2%) | 15 (7.3%) |
Disability Class: Vision Difficulty
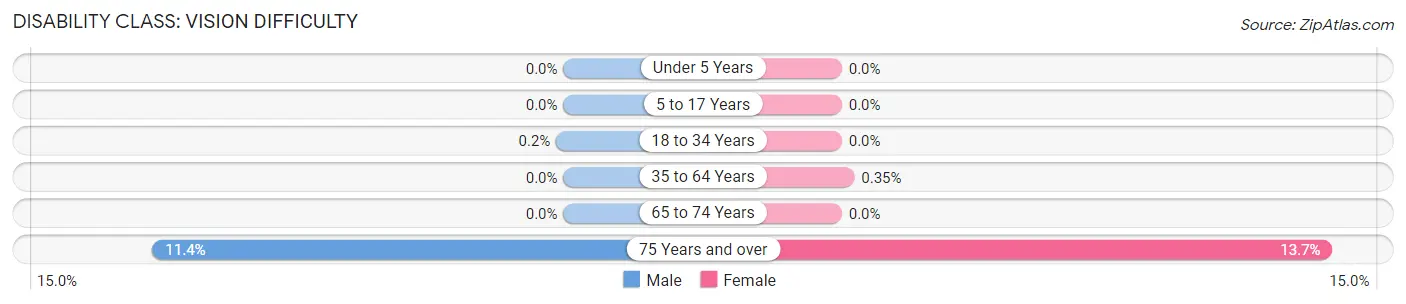
| Age Bracket | Male | Female |
| Under 5 Years | 0 (0.0%) | 0 (0.0%) |
| 5 to 17 Years | 0 (0.0%) | 0 (0.0%) |
| 18 to 34 Years | 2 (0.2%) | 0 (0.0%) |
| 35 to 64 Years | 0 (0.0%) | 6 (0.4%) |
| 65 to 74 Years | 0 (0.0%) | 0 (0.0%) |
| 75 Years and over | 23 (11.4%) | 28 (13.7%) |
Disability Class: Cognitive Difficulty
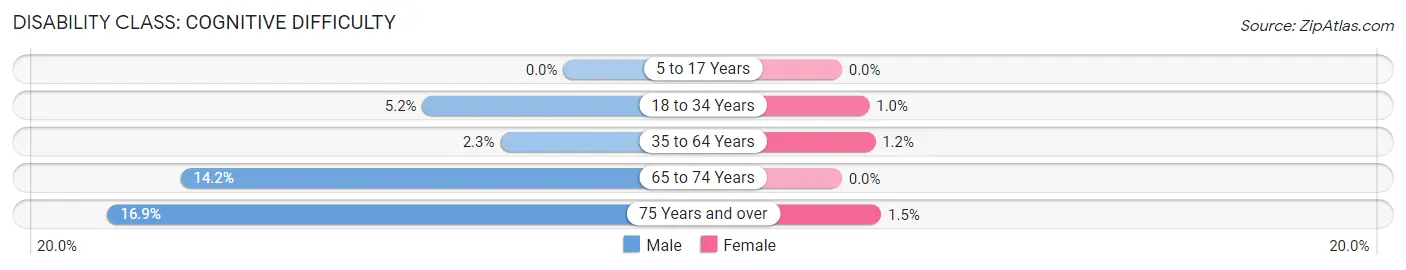
| Age Bracket | Male | Female |
| 5 to 17 Years | 0 (0.0%) | 0 (0.0%) |
| 18 to 34 Years | 53 (5.2%) | 9 (1.0%) |
| 35 to 64 Years | 38 (2.3%) | 21 (1.2%) |
| 65 to 74 Years | 56 (14.2%) | 0 (0.0%) |
| 75 Years and over | 34 (16.9%) | 3 (1.5%) |
Disability Class: Ambulatory Difficulty
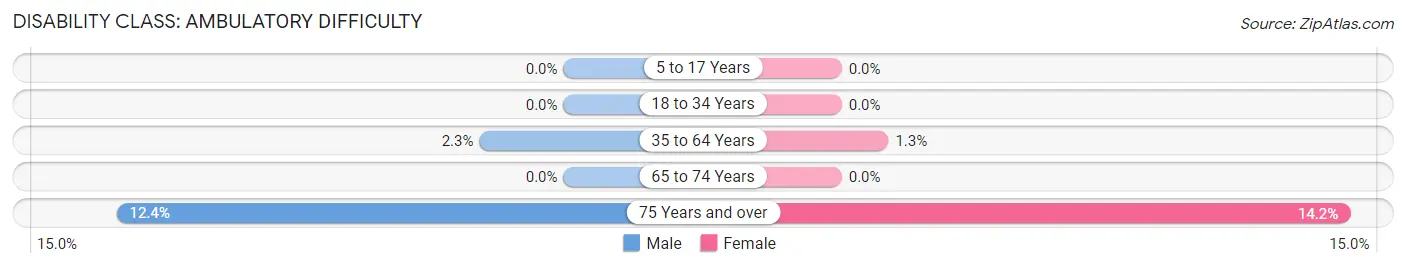
| Age Bracket | Male | Female |
| 5 to 17 Years | 0 (0.0%) | 0 (0.0%) |
| 18 to 34 Years | 0 (0.0%) | 0 (0.0%) |
| 35 to 64 Years | 38 (2.3%) | 22 (1.3%) |
| 65 to 74 Years | 0 (0.0%) | 0 (0.0%) |
| 75 Years and over | 25 (12.4%) | 29 (14.1%) |
Disability Class: Self-Care Difficulty
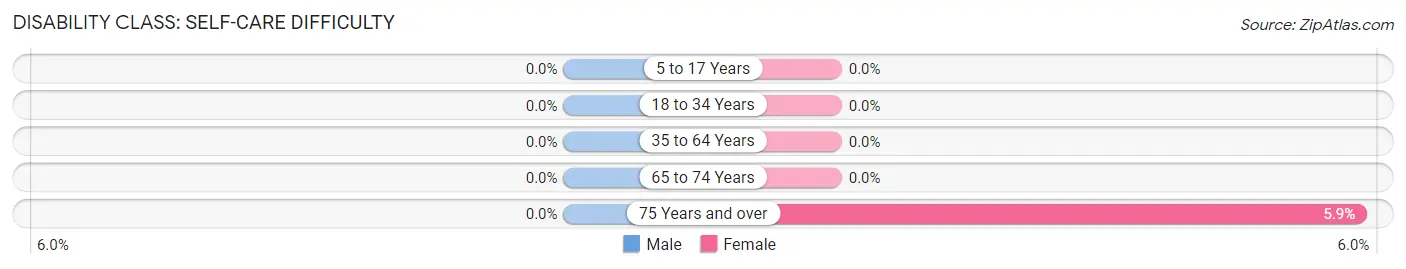
| Age Bracket | Male | Female |
| 5 to 17 Years | 0 (0.0%) | 0 (0.0%) |
| 18 to 34 Years | 0 (0.0%) | 0 (0.0%) |
| 35 to 64 Years | 0 (0.0%) | 0 (0.0%) |
| 65 to 74 Years | 0 (0.0%) | 0 (0.0%) |
| 75 Years and over | 0 (0.0%) | 12 (5.9%) |
Technology Access in Aspen
Computing Device Access in Aspen
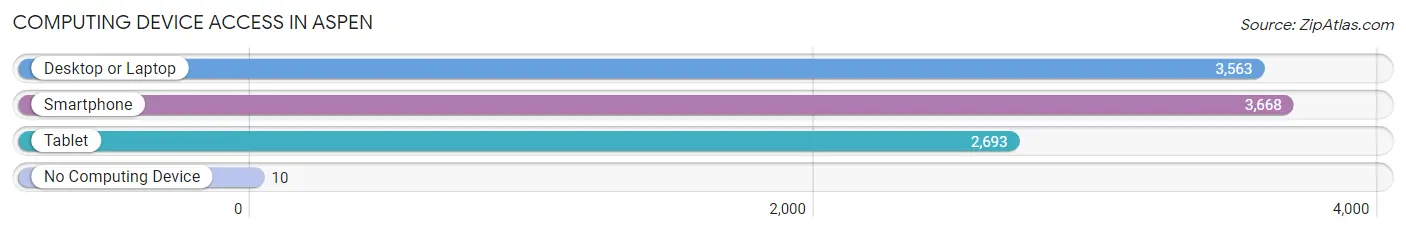
| Device Type | # Households | % Households |
| Desktop or Laptop | 3,563 | 95.1% |
| Smartphone | 3,668 | 97.9% |
| Tablet | 2,693 | 71.9% |
| No Computing Device | 10 | 0.3% |
| Total | 3,746 | 100.0% |
Internet Access in Aspen
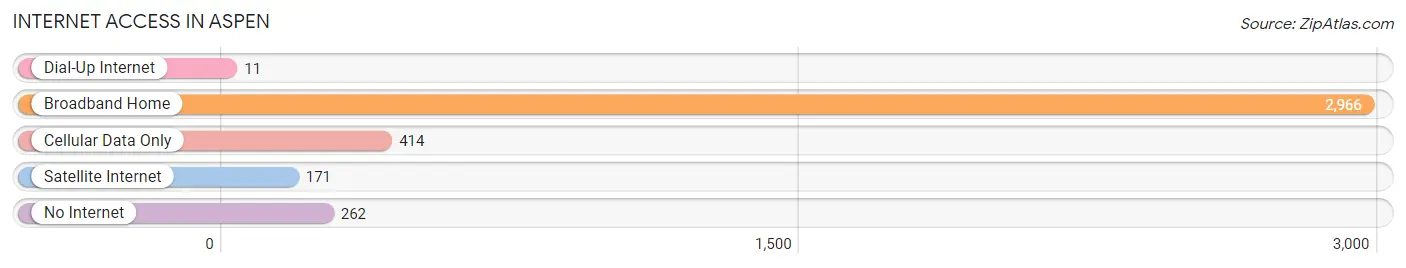
| Internet Type | # Households | % Households |
| Dial-Up Internet | 11 | 0.3% |
| Broadband Home | 2,966 | 79.2% |
| Cellular Data Only | 414 | 11.1% |
| Satellite Internet | 171 | 4.6% |
| No Internet | 262 | 7.0% |
| Total | 3,746 | 100.0% |
Aspen Summary
Aspen, Colorado is a small mountain town located in the Rocky Mountains of the United States. It is situated in the Roaring Fork Valley, at an elevation of 8,000 feet, and is surrounded by the White River National Forest. Aspen is known for its stunning natural beauty, outdoor recreation opportunities, and vibrant cultural scene.
History
The area that is now Aspen was first inhabited by the Ute Indians, who used the area for hunting and gathering. In the late 1800s, prospectors discovered silver in the area, and the town of Aspen was founded in 1879. The town quickly grew, and by the early 1900s, it was one of the largest silver-mining towns in the United States. The silver boom ended in the early 1900s, and the town went into decline. In the 1940s, the town was revitalized by the development of ski resorts, and Aspen became a popular destination for skiing and other outdoor activities.
Geography
Aspen is located in the Rocky Mountains of Colorado, in the Roaring Fork Valley. The town is situated at an elevation of 8,000 feet, and is surrounded by the White River National Forest. The town is located near several ski resorts, including Aspen Mountain, Snowmass, and Buttermilk. The town is also close to several other outdoor recreation areas, including the Maroon Bells-Snowmass Wilderness, the Maroon Creek Valley, and the Hunter-Fryingpan Wilderness.
Economy
Aspen’s economy is largely based on tourism and outdoor recreation. The town is home to several ski resorts, which attract visitors from around the world. The town is also home to several luxury hotels, restaurants, and shops, which cater to the wealthy visitors who come to the area. In addition, the town is home to several art galleries, museums, and other cultural attractions.
Demographics
As of the 2010 census, the population of Aspen was 6,658. The town has a median age of 39.7 years, and the median household income is $90,837. The town is predominantly white, with 87.3% of the population identifying as white. The town also has a large Hispanic population, with 11.3% of the population identifying as Hispanic or Latino.
Aspen is a small mountain town with a rich history, stunning natural beauty, and vibrant cultural scene. The town is home to several ski resorts, luxury hotels, and other attractions, which attract visitors from around the world. The town is also home to a diverse population, with a median age of 39.7 years and a median household income of $90,837. Aspen is a popular destination for outdoor recreation and cultural activities, and is a great place to live and visit.
Common Questions
What is Per Capita Income in Aspen?
Per Capita income in Aspen is $102,089.
What is the Median Family Income in Aspen?
Median Family Income in Aspen is $134,609.
What is the Median Household income in Aspen?
Median Household Income in Aspen is $94,338.
What is Income or Wage Gap in Aspen?
Income or Wage Gap in Aspen is 5.9%.
Women in Aspen earn 94.1 cents for every dollar earned by a man.
What is Inequality or Gini Index in Aspen?
Inequality or Gini Index in Aspen is 0.61.
What is the Total Population of Aspen?
Total Population of Aspen is 6,952.
What is the Total Male Population of Aspen?
Total Male Population of Aspen is 3,631.
What is the Total Female Population of Aspen?
Total Female Population of Aspen is 3,321.
What is the Ratio of Males per 100 Females in Aspen?
There are 109.33 Males per 100 Females in Aspen.
What is the Ratio of Females per 100 Males in Aspen?
There are 91.46 Females per 100 Males in Aspen.
What is the Median Population Age in Aspen?
Median Population Age in Aspen is 41.3 Years.
What is the Average Family Size in Aspen
Average Family Size in Aspen is 2.5 People.
What is the Average Household Size in Aspen
Average Household Size in Aspen is 1.8 People.
How Large is the Labor Force in Aspen?
There are 4,693 People in the Labor Forcein in Aspen.
What is the Percentage of People in the Labor Force in Aspen?
74.4% of People are in the Labor Force in Aspen.
What is the Unemployment Rate in Aspen?
Unemployment Rate in Aspen is 2.4%.