Lowry Crossing, TX Map & Demographics
Lowry Crossing Map
Lowry Crossing Overview
$43,072
PER CAPITA INCOME
$108,333
AVG FAMILY INCOME
$108,000
AVG HOUSEHOLD INCOME
27.4%
WAGE / INCOME GAP [ % ]
72.6¢/ $1
WAGE / INCOME GAP [ $ ]
0.33
INEQUALITY / GINI INDEX
1,885
TOTAL POPULATION
1,000
MALE POPULATION
885
FEMALE POPULATION
112.99
MALES / 100 FEMALES
88.50
FEMALES / 100 MALES
44.0
MEDIAN AGE
3.2
AVG FAMILY SIZE
3.0
AVG HOUSEHOLD SIZE
1,055
LABOR FORCE [ PEOPLE ]
66.5%
PERCENT IN LABOR FORCE
3.7%
UNEMPLOYMENT RATE
Income in Lowry Crossing
Income Overview in Lowry Crossing
Per Capita Income in Lowry Crossing is $43,072, while median incomes of families and households are $108,333 and $108,000 respectively.
| Characteristic | Number | Measure |
| Per Capita Income | 1,885 | $43,072 |
| Median Family Income | 538 | $108,333 |
| Mean Family Income | 538 | $121,441 |
| Median Household Income | 638 | $108,000 |
| Mean Household Income | 638 | $120,754 |
| Income Deficit | 538 | $0 |
| Wage / Income Gap (%) | 1,885 | 27.35% |
| Wage / Income Gap ($) | 1,885 | 72.65¢ per $1 |
| Gini / Inequality Index | 1,885 | 0.33 |
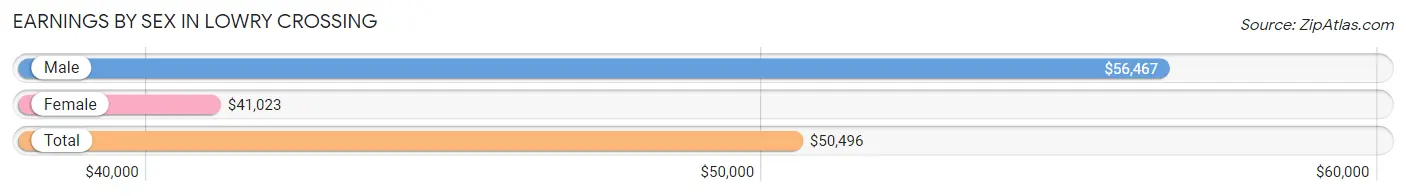
Earnings by Sex in Lowry Crossing
Average Earnings in Lowry Crossing are $50,496, $56,467 for men and $41,023 for women, a difference of 27.4%.
| Sex | Number | Average Earnings |
| Male | 639 (57.6%) | $56,467 |
| Female | 470 (42.4%) | $41,023 |
| Total | 1,109 (100.0%) | $50,496 |
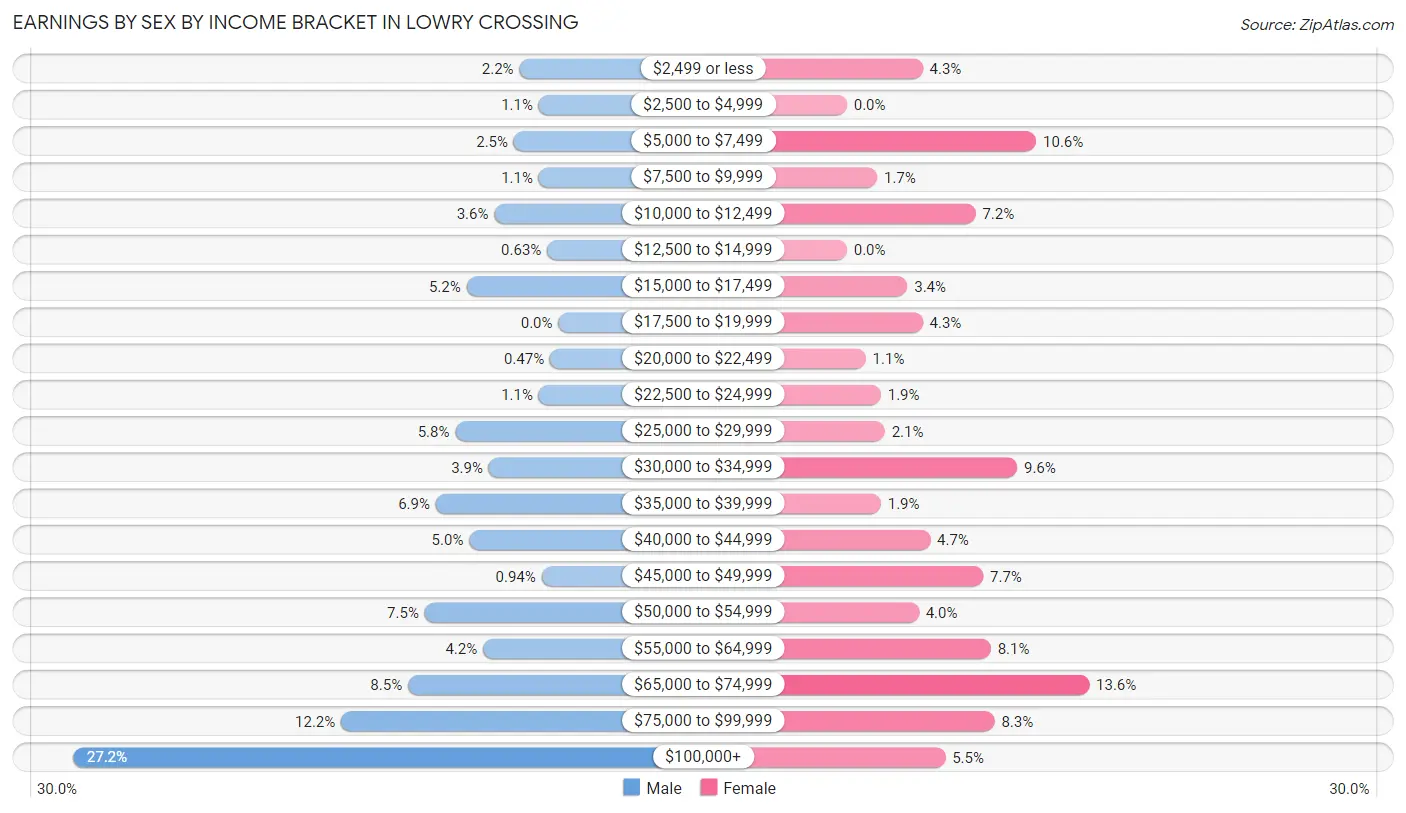
Earnings by Sex by Income Bracket in Lowry Crossing
The most common earnings brackets in Lowry Crossing are $100,000+ for men (174 | 27.2%) and $65,000 to $74,999 for women (64 | 13.6%).
| Income | Male | Female |
| $2,499 or less | 14 (2.2%) | 20 (4.3%) |
| $2,500 to $4,999 | 7 (1.1%) | 0 (0.0%) |
| $5,000 to $7,499 | 16 (2.5%) | 50 (10.6%) |
| $7,500 to $9,999 | 7 (1.1%) | 8 (1.7%) |
| $10,000 to $12,499 | 23 (3.6%) | 34 (7.2%) |
| $12,500 to $14,999 | 4 (0.6%) | 0 (0.0%) |
| $15,000 to $17,499 | 33 (5.2%) | 16 (3.4%) |
| $17,500 to $19,999 | 0 (0.0%) | 20 (4.3%) |
| $20,000 to $22,499 | 3 (0.5%) | 5 (1.1%) |
| $22,500 to $24,999 | 7 (1.1%) | 9 (1.9%) |
| $25,000 to $29,999 | 37 (5.8%) | 10 (2.1%) |
| $30,000 to $34,999 | 25 (3.9%) | 45 (9.6%) |
| $35,000 to $39,999 | 44 (6.9%) | 9 (1.9%) |
| $40,000 to $44,999 | 32 (5.0%) | 22 (4.7%) |
| $45,000 to $49,999 | 6 (0.9%) | 36 (7.7%) |
| $50,000 to $54,999 | 48 (7.5%) | 19 (4.0%) |
| $55,000 to $64,999 | 27 (4.2%) | 38 (8.1%) |
| $65,000 to $74,999 | 54 (8.5%) | 64 (13.6%) |
| $75,000 to $99,999 | 78 (12.2%) | 39 (8.3%) |
| $100,000+ | 174 (27.2%) | 26 (5.5%) |
| Total | 639 (100.0%) | 470 (100.0%) |
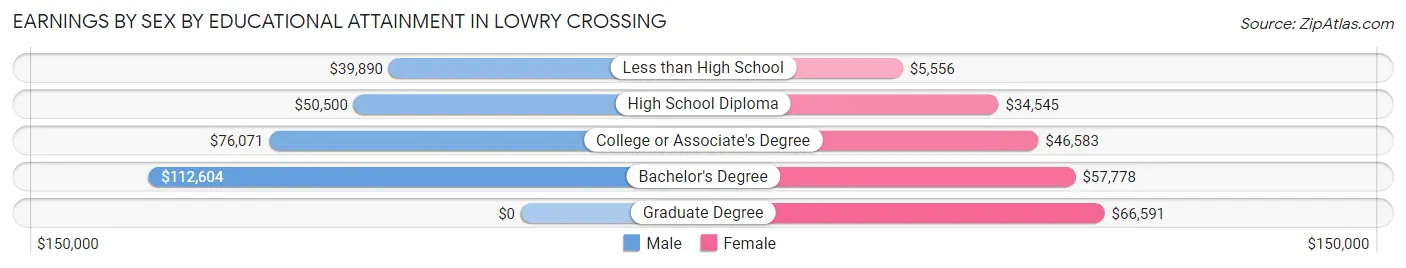
Earnings by Sex by Educational Attainment in Lowry Crossing
Average earnings in Lowry Crossing are $70,313 for men and $48,603 for women, a difference of 30.9%. Men with an educational attainment of bachelor's degree enjoy the highest average annual earnings of $112,604, while those with less than high school education earn the least with $39,890. Women with an educational attainment of graduate degree earn the most with the average annual earnings of $66,591, while those with less than high school education have the smallest earnings of $5,556.
| Educational Attainment | Male Income | Female Income |
| Less than High School | $39,890 | $5,556 |
| High School Diploma | $50,500 | $34,545 |
| College or Associate's Degree | $76,071 | $46,583 |
| Bachelor's Degree | $112,604 | $57,778 |
| Graduate Degree | - | - |
| Total | $70,313 | $48,603 |
Family Income in Lowry Crossing
Family Income Brackets in Lowry Crossing
According to the Lowry Crossing family income data, there are 129 families falling into the $150,000 to $199,999 income range, which is the most common income bracket and makes up 24.0% of all families.
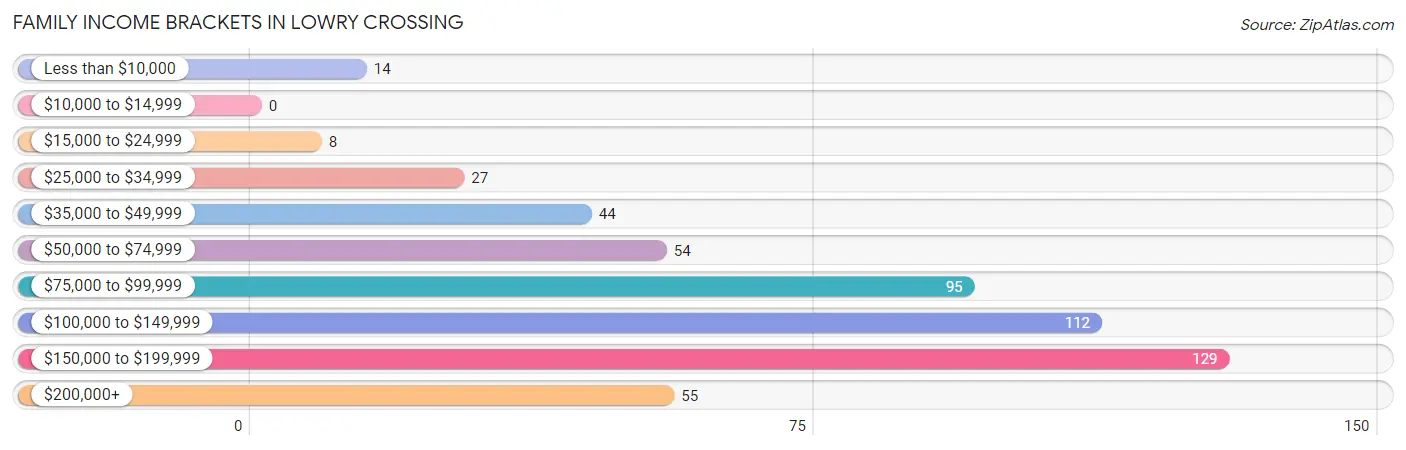
| Income Bracket | # Families | % Families |
| Less than $10,000 | 14 | 2.6% |
| $10,000 to $14,999 | 0 | 0.0% |
| $15,000 to $24,999 | 8 | 1.5% |
| $25,000 to $34,999 | 27 | 5.0% |
| $35,000 to $49,999 | 44 | 8.2% |
| $50,000 to $74,999 | 54 | 10.0% |
| $75,000 to $99,999 | 95 | 17.7% |
| $100,000 to $149,999 | 112 | 20.8% |
| $150,000 to $199,999 | 129 | 24.0% |
| $200,000+ | 55 | 10.2% |
Family Income by Famaliy Size in Lowry Crossing
3-person families (138 | 25.7%) account for the highest median family income in Lowry Crossing with $115,833 per family, while 2-person families (224 | 41.6%) have the highest median income of $50,312 per family member.
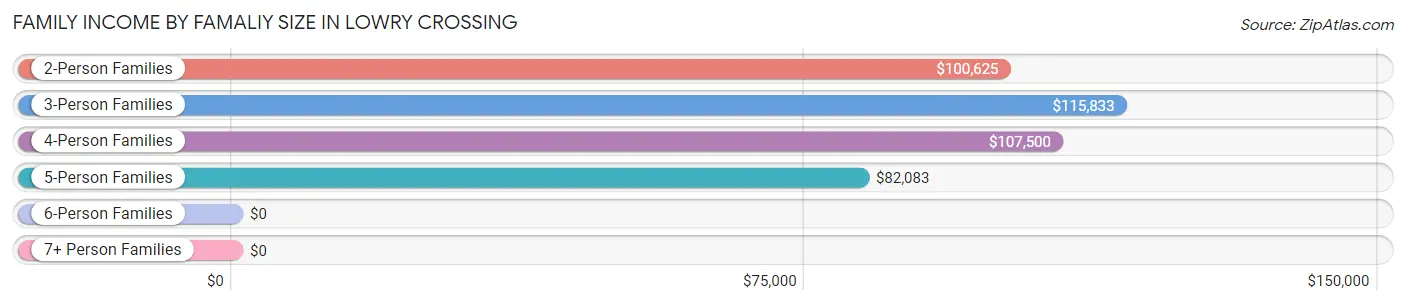
| Income Bracket | # Families | Median Income |
| 2-Person Families | 224 (41.6%) | $100,625 |
| 3-Person Families | 138 (25.7%) | $115,833 |
| 4-Person Families | 128 (23.8%) | $107,500 |
| 5-Person Families | 25 (4.6%) | $82,083 |
| 6-Person Families | 15 (2.8%) | $0 |
| 7+ Person Families | 8 (1.5%) | $0 |
| Total | 538 (100.0%) | $108,333 |
Family Income by Number of Earners in Lowry Crossing
The median family income in Lowry Crossing is $108,333, with families comprising 2 earners (215) having the highest median family income of $151,806, while families with no earners (71) have the lowest median family income of $54,750, accounting for 40.0% and 13.2% of families, respectively.
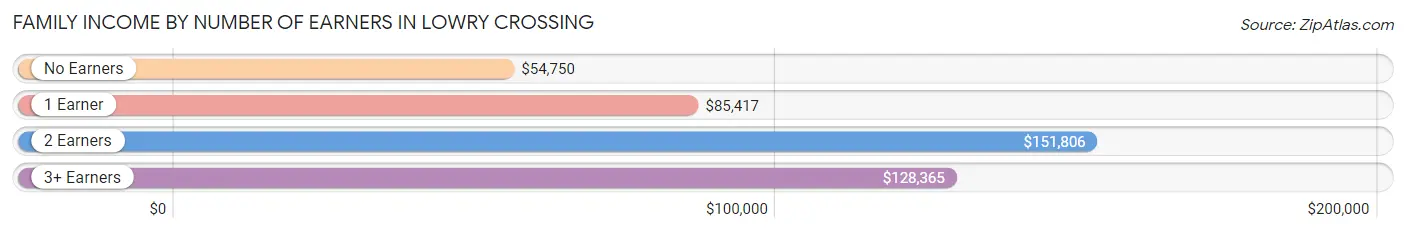
| Number of Earners | # Families | Median Income |
| No Earners | 71 (13.2%) | $54,750 |
| 1 Earner | 157 (29.2%) | $85,417 |
| 2 Earners | 215 (40.0%) | $151,806 |
| 3+ Earners | 95 (17.7%) | $128,365 |
| Total | 538 (100.0%) | $108,333 |
Household Income in Lowry Crossing
Household Income Brackets in Lowry Crossing
With 145 households falling in the category, the $150,000 to $199,999 income range is the most frequent in Lowry Crossing, accounting for 22.7% of all households.
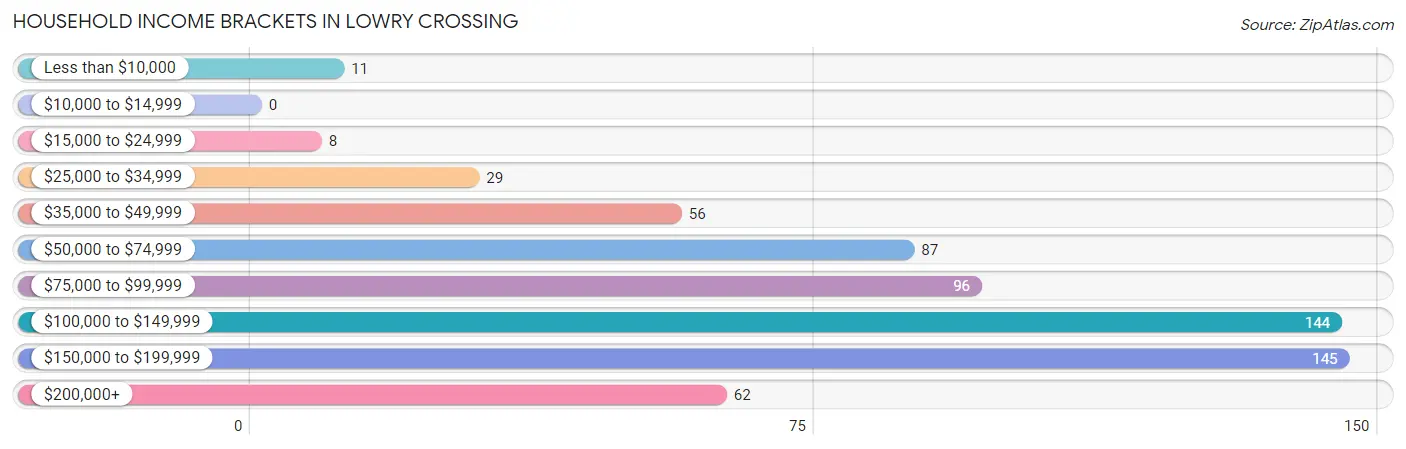
| Income Bracket | # Households | % Households |
| Less than $10,000 | 11 | 1.7% |
| $10,000 to $14,999 | 0 | 0.0% |
| $15,000 to $24,999 | 8 | 1.3% |
| $25,000 to $34,999 | 29 | 4.5% |
| $35,000 to $49,999 | 56 | 8.8% |
| $50,000 to $74,999 | 87 | 13.6% |
| $75,000 to $99,999 | 96 | 15.0% |
| $100,000 to $149,999 | 144 | 22.6% |
| $150,000 to $199,999 | 145 | 22.7% |
| $200,000+ | 62 | 9.7% |
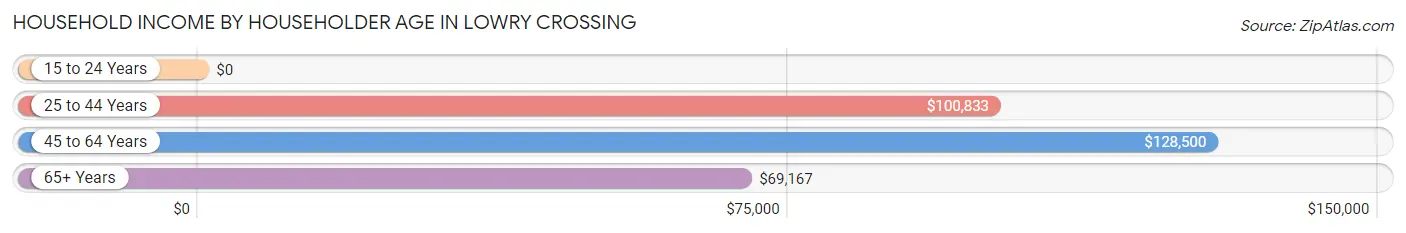
Household Income by Householder Age in Lowry Crossing
The median household income in Lowry Crossing is $108,000, with the highest median household income of $128,500 found in the 45 to 64 years age bracket for the primary householder. A total of 296 households (46.4%) fall into this category.
| Income Bracket | # Households | Median Income |
| 15 to 24 Years | 0 (0.0%) | $0 |
| 25 to 44 Years | 176 (27.6%) | $100,833 |
| 45 to 64 Years | 296 (46.4%) | $128,500 |
| 65+ Years | 166 (26.0%) | $69,167 |
| Total | 638 (100.0%) | $108,000 |
Poverty in Lowry Crossing
Income Below Poverty by Sex and Age in Lowry Crossing
With 3.3% poverty level for males and 9.9% for females among the residents of Lowry Crossing, 65 to 74 year old males and 12 to 14 year old females are the most vulnerable to poverty, with 14 males (14.9%) and 18 females (54.5%) in their respective age groups living below the poverty level.
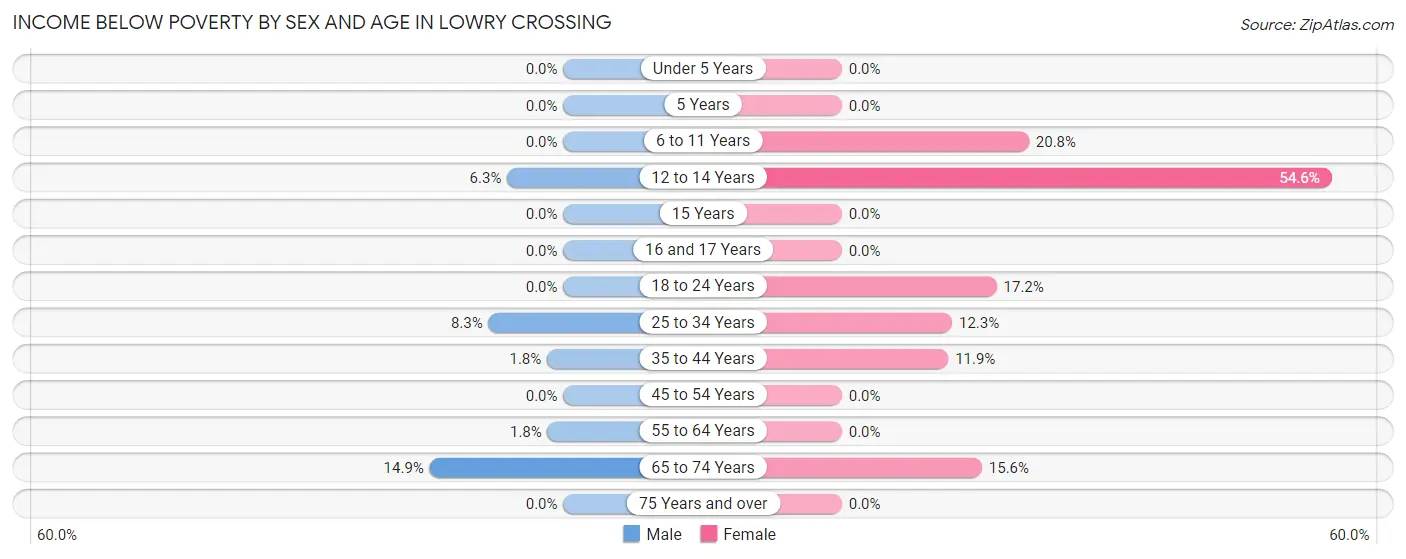
| Age Bracket | Male | Female |
| Under 5 Years | 0 (0.0%) | 0 (0.0%) |
| 5 Years | 0 (0.0%) | 0 (0.0%) |
| 6 to 11 Years | 0 (0.0%) | 15 (20.8%) |
| 12 to 14 Years | 4 (6.2%) | 18 (54.5%) |
| 15 Years | 0 (0.0%) | 0 (0.0%) |
| 16 and 17 Years | 0 (0.0%) | 0 (0.0%) |
| 18 to 24 Years | 0 (0.0%) | 15 (17.2%) |
| 25 to 34 Years | 9 (8.3%) | 7 (12.3%) |
| 35 to 44 Years | 3 (1.8%) | 16 (11.8%) |
| 45 to 54 Years | 0 (0.0%) | 0 (0.0%) |
| 55 to 64 Years | 3 (1.8%) | 0 (0.0%) |
| 65 to 74 Years | 14 (14.9%) | 17 (15.6%) |
| 75 Years and over | 0 (0.0%) | 0 (0.0%) |
| Total | 33 (3.3%) | 88 (9.9%) |
Income Above Poverty by Sex and Age in Lowry Crossing
According to the poverty statistics in Lowry Crossing, males aged under 5 years and females aged under 5 years are the age groups that are most secure financially, with 100.0% of males and 100.0% of females in these age groups living above the poverty line.
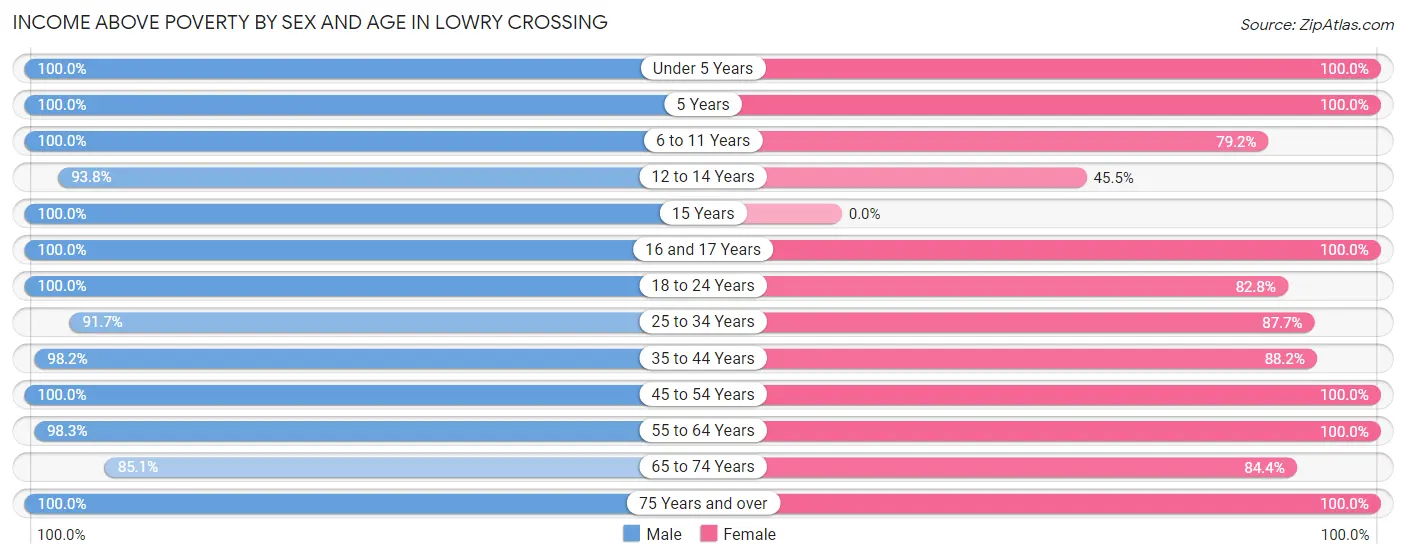
| Age Bracket | Male | Female |
| Under 5 Years | 45 (100.0%) | 33 (100.0%) |
| 5 Years | 8 (100.0%) | 3 (100.0%) |
| 6 to 11 Years | 25 (100.0%) | 57 (79.2%) |
| 12 to 14 Years | 60 (93.8%) | 15 (45.5%) |
| 15 Years | 16 (100.0%) | 0 (0.0%) |
| 16 and 17 Years | 26 (100.0%) | 16 (100.0%) |
| 18 to 24 Years | 71 (100.0%) | 72 (82.8%) |
| 25 to 34 Years | 99 (91.7%) | 50 (87.7%) |
| 35 to 44 Years | 163 (98.2%) | 119 (88.1%) |
| 45 to 54 Years | 144 (100.0%) | 105 (100.0%) |
| 55 to 64 Years | 168 (98.3%) | 179 (100.0%) |
| 65 to 74 Years | 80 (85.1%) | 92 (84.4%) |
| 75 Years and over | 62 (100.0%) | 56 (100.0%) |
| Total | 967 (96.7%) | 797 (90.1%) |
Income Below Poverty Among Married-Couple Families in Lowry Crossing
The poverty statistics for married-couple families in Lowry Crossing show that 3.7% or 17 of the total 465 families live below the poverty line. Families with no children have the highest poverty rate of 4.7%, comprising of 14 families. On the other hand, families with 3 or 4 children have the lowest poverty rate of 0.0%, which includes 0 families.
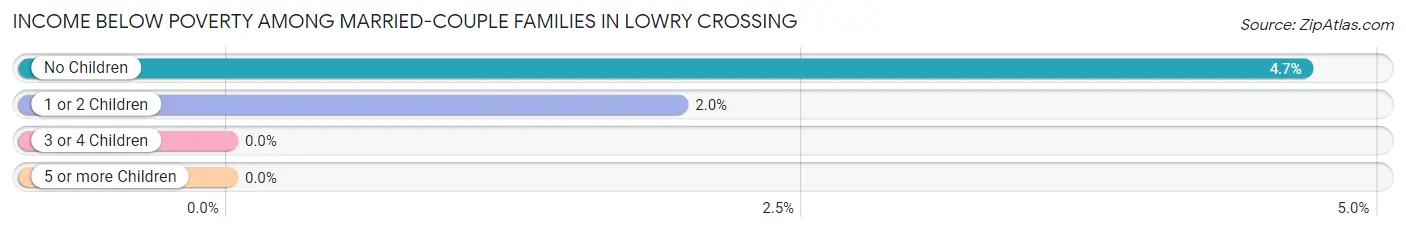
| Children | Above Poverty | Below Poverty |
| No Children | 285 (95.3%) | 14 (4.7%) |
| 1 or 2 Children | 150 (98.0%) | 3 (2.0%) |
| 3 or 4 Children | 5 (100.0%) | 0 (0.0%) |
| 5 or more Children | 8 (100.0%) | 0 (0.0%) |
| Total | 448 (96.3%) | 17 (3.7%) |
Income Below Poverty Among Single-Parent Households in Lowry Crossing
According to the poverty data in Lowry Crossing, 7.9% or 3 single-father households and 37.1% or 13 single-mother households are living below the poverty line. Among single-father households, those with no children have the highest poverty rate, with 3 households (21.4%) experiencing poverty. Likewise, among single-mother households, those with 1 or 2 children have the highest poverty rate, with 13 households (65.0%) falling below the poverty line.
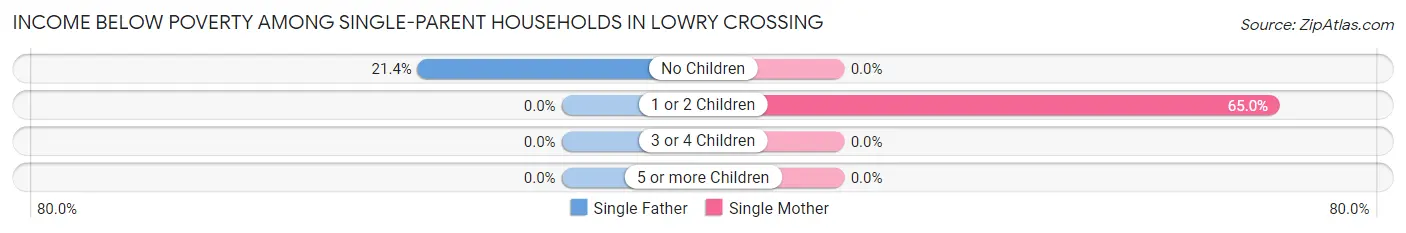
| Children | Single Father | Single Mother |
| No Children | 3 (21.4%) | 0 (0.0%) |
| 1 or 2 Children | 0 (0.0%) | 13 (65.0%) |
| 3 or 4 Children | 0 (0.0%) | 0 (0.0%) |
| 5 or more Children | 0 (0.0%) | 0 (0.0%) |
| Total | 3 (7.9%) | 13 (37.1%) |
Income Below Poverty Among Married-Couple vs Single-Parent Households in Lowry Crossing
The poverty data for Lowry Crossing shows that 17 of the married-couple family households (3.7%) and 16 of the single-parent households (21.9%) are living below the poverty level. Within the married-couple family households, those with no children have the highest poverty rate, with 14 households (4.7%) falling below the poverty line. Among the single-parent households, those with 1 or 2 children have the highest poverty rate, with 13 household (29.5%) living below poverty.
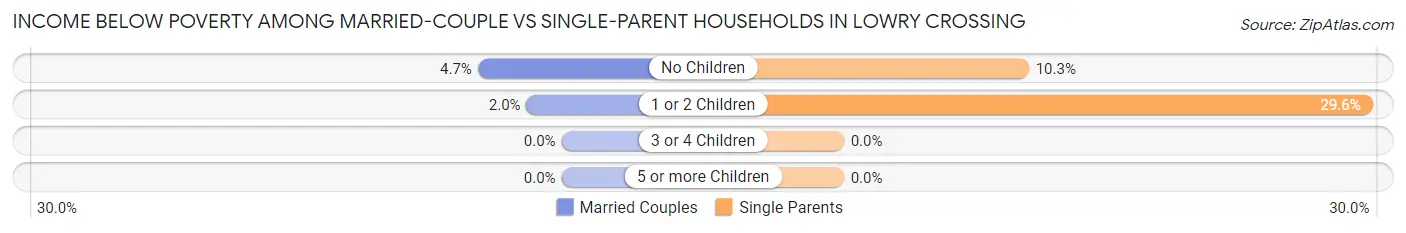
| Children | Married-Couple Families | Single-Parent Households |
| No Children | 14 (4.7%) | 3 (10.3%) |
| 1 or 2 Children | 3 (2.0%) | 13 (29.5%) |
| 3 or 4 Children | 0 (0.0%) | 0 (0.0%) |
| 5 or more Children | 0 (0.0%) | 0 (0.0%) |
| Total | 17 (3.7%) | 16 (21.9%) |
Race in Lowry Crossing
The most populous races in Lowry Crossing are White / Caucasian (1,718 | 91.1%), Hispanic or Latino (445 | 23.6%), and Two or more Races (65 | 3.5%).
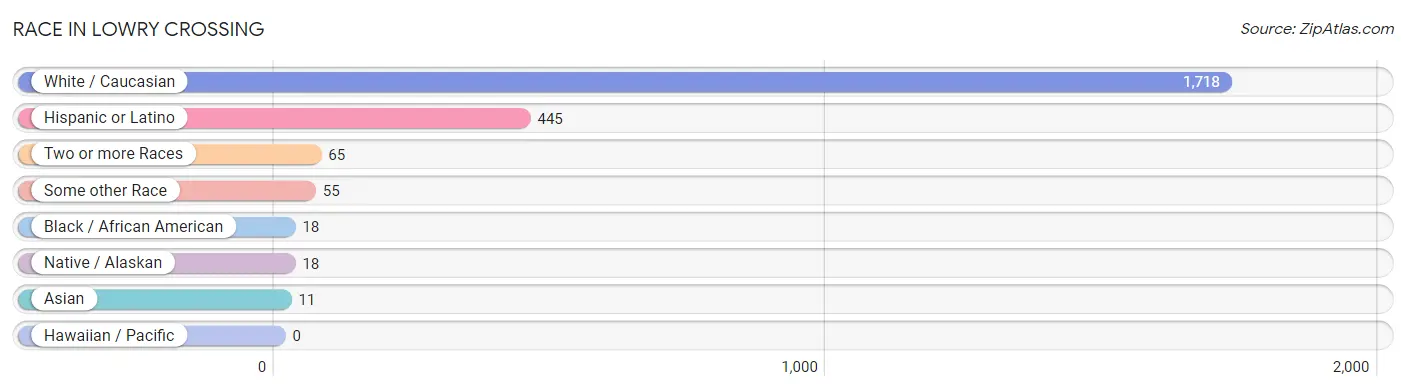
| Race | # Population | % Population |
| Asian | 11 | 0.6% |
| Black / African American | 18 | 0.9% |
| Hawaiian / Pacific | 0 | 0.0% |
| Hispanic or Latino | 445 | 23.6% |
| Native / Alaskan | 18 | 0.9% |
| White / Caucasian | 1,718 | 91.1% |
| Two or more Races | 65 | 3.5% |
| Some other Race | 55 | 2.9% |
| Total | 1,885 | 100.0% |
Ancestry in Lowry Crossing
The most populous ancestries reported in Lowry Crossing are Mexican (347 | 18.4%), American (341 | 18.1%), German (222 | 11.8%), English (195 | 10.3%), and Irish (106 | 5.6%), together accounting for 64.2% of all Lowry Crossing residents.
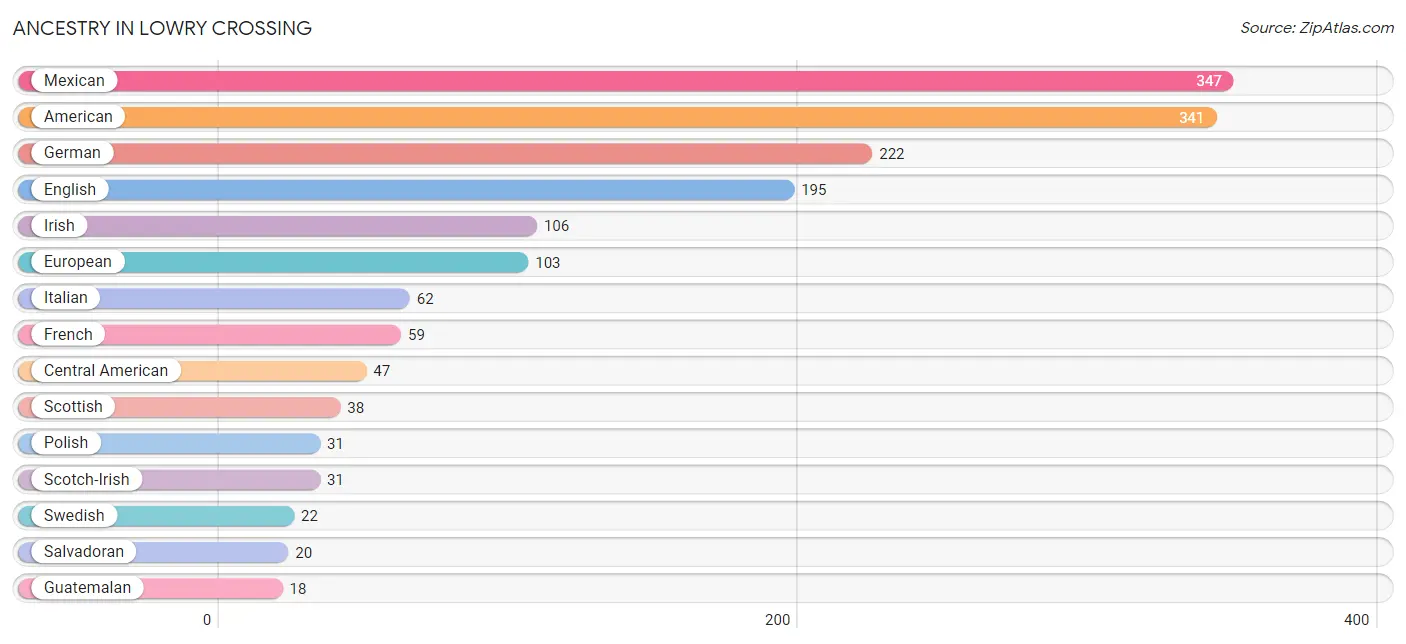
| Ancestry | # Population | % Population |
| American | 341 | 18.1% |
| Apache | 1 | 0.1% |
| Arab | 12 | 0.6% |
| Austrian | 2 | 0.1% |
| Bhutanese | 1 | 0.1% |
| Brazilian | 7 | 0.4% |
| British | 12 | 0.6% |
| Burmese | 3 | 0.2% |
| Central American | 47 | 2.5% |
| Cherokee | 4 | 0.2% |
| Choctaw | 1 | 0.1% |
| Czech | 7 | 0.4% |
| Danish | 5 | 0.3% |
| Dutch | 13 | 0.7% |
| Eastern European | 10 | 0.5% |
| English | 195 | 10.3% |
| European | 103 | 5.5% |
| Finnish | 3 | 0.2% |
| French | 59 | 3.1% |
| French Canadian | 12 | 0.6% |
| German | 222 | 11.8% |
| Greek | 6 | 0.3% |
| Guatemalan | 18 | 0.9% |
| Hungarian | 3 | 0.2% |
| Iranian | 7 | 0.4% |
| Irish | 106 | 5.6% |
| Iroquois | 1 | 0.1% |
| Italian | 62 | 3.3% |
| Korean | 8 | 0.4% |
| Mexican | 347 | 18.4% |
| Mexican American Indian | 17 | 0.9% |
| Northern European | 3 | 0.2% |
| Norwegian | 14 | 0.7% |
| Palestinian | 9 | 0.5% |
| Panamanian | 9 | 0.5% |
| Pennsylvania German | 8 | 0.4% |
| Polish | 31 | 1.6% |
| Puerto Rican | 5 | 0.3% |
| Russian | 6 | 0.3% |
| Salvadoran | 20 | 1.1% |
| Scandinavian | 3 | 0.2% |
| Scotch-Irish | 31 | 1.6% |
| Scottish | 38 | 2.0% |
| Slovak | 6 | 0.3% |
| South American | 4 | 0.2% |
| Spaniard | 2 | 0.1% |
| Swedish | 22 | 1.2% |
| Swiss | 3 | 0.2% |
| Syrian | 3 | 0.2% |
| Venezuelan | 4 | 0.2% |
| Welsh | 3 | 0.2% | View All 51 Rows |
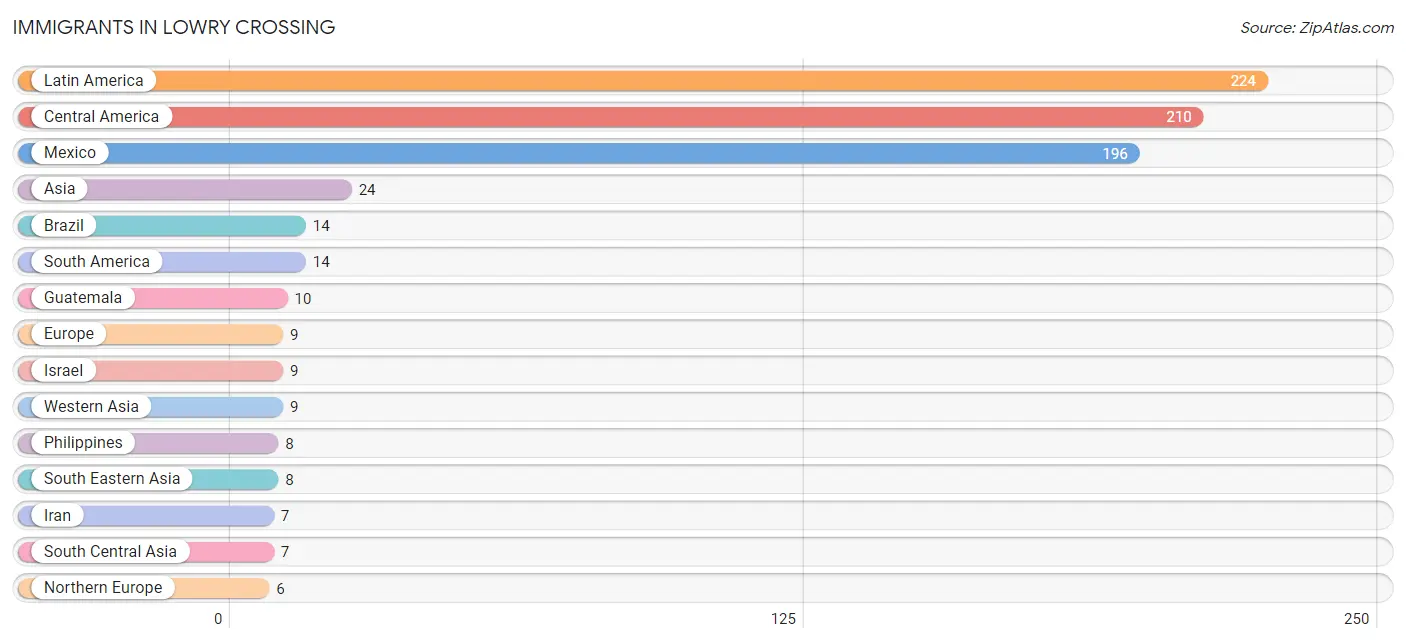
Immigrants in Lowry Crossing
The most numerous immigrant groups reported in Lowry Crossing came from Latin America (224 | 11.9%), Central America (210 | 11.1%), Mexico (196 | 10.4%), Asia (24 | 1.3%), and Brazil (14 | 0.7%), together accounting for 35.4% of all Lowry Crossing residents.
| Immigration Origin | # Population | % Population |
| Asia | 24 | 1.3% |
| Brazil | 14 | 0.7% |
| Canada | 4 | 0.2% |
| Central America | 210 | 11.1% |
| Europe | 9 | 0.5% |
| Guatemala | 10 | 0.5% |
| Iran | 7 | 0.4% |
| Israel | 9 | 0.5% |
| Latin America | 224 | 11.9% |
| Mexico | 196 | 10.4% |
| Netherlands | 3 | 0.2% |
| Northern Europe | 6 | 0.3% |
| Panama | 4 | 0.2% |
| Philippines | 8 | 0.4% |
| South America | 14 | 0.7% |
| South Central Asia | 7 | 0.4% |
| South Eastern Asia | 8 | 0.4% |
| Sweden | 6 | 0.3% |
| Western Asia | 9 | 0.5% |
| Western Europe | 3 | 0.2% | View All 20 Rows |
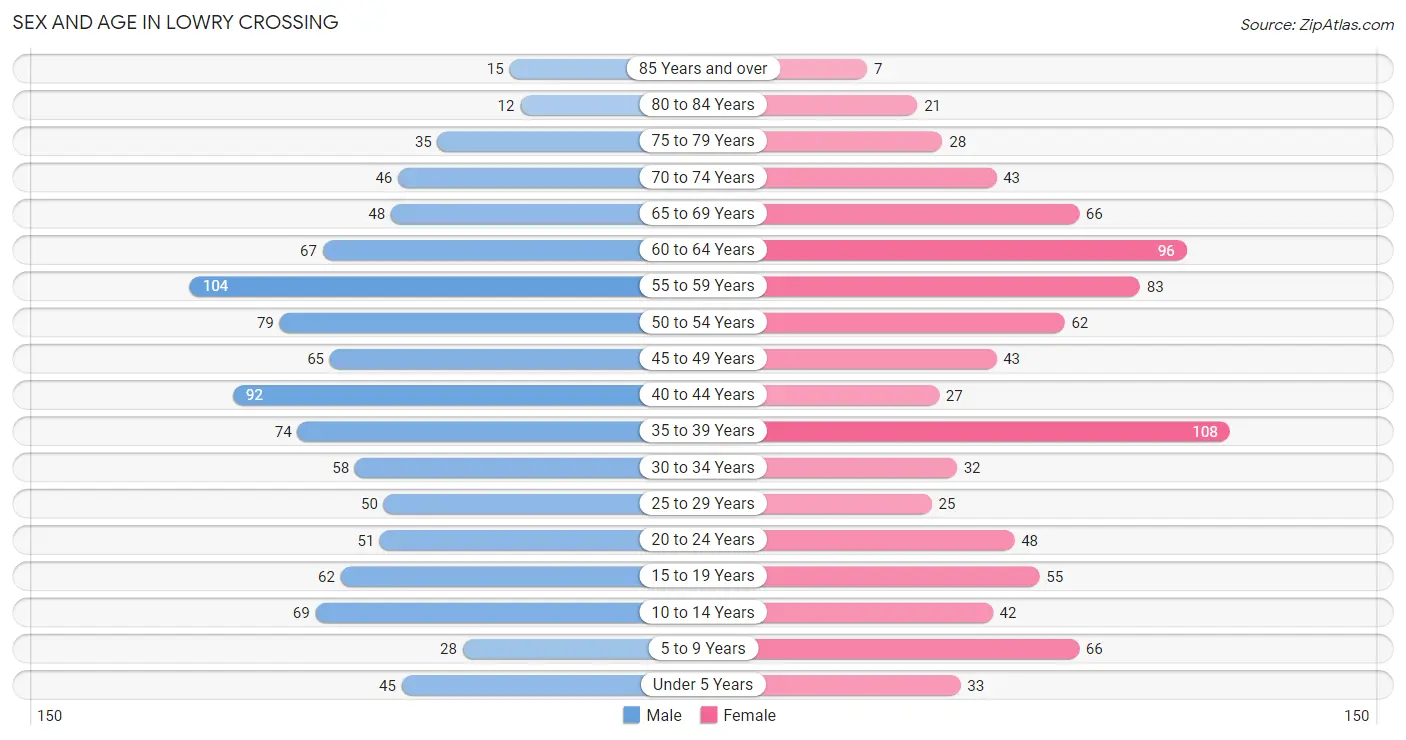
Sex and Age in Lowry Crossing
Sex and Age in Lowry Crossing
The most populous age groups in Lowry Crossing are 55 to 59 Years (104 | 10.4%) for men and 35 to 39 Years (108 | 12.2%) for women.
| Age Bracket | Male | Female |
| Under 5 Years | 45 (4.5%) | 33 (3.7%) |
| 5 to 9 Years | 28 (2.8%) | 66 (7.5%) |
| 10 to 14 Years | 69 (6.9%) | 42 (4.8%) |
| 15 to 19 Years | 62 (6.2%) | 55 (6.2%) |
| 20 to 24 Years | 51 (5.1%) | 48 (5.4%) |
| 25 to 29 Years | 50 (5.0%) | 25 (2.8%) |
| 30 to 34 Years | 58 (5.8%) | 32 (3.6%) |
| 35 to 39 Years | 74 (7.4%) | 108 (12.2%) |
| 40 to 44 Years | 92 (9.2%) | 27 (3.0%) |
| 45 to 49 Years | 65 (6.5%) | 43 (4.9%) |
| 50 to 54 Years | 79 (7.9%) | 62 (7.0%) |
| 55 to 59 Years | 104 (10.4%) | 83 (9.4%) |
| 60 to 64 Years | 67 (6.7%) | 96 (10.8%) |
| 65 to 69 Years | 48 (4.8%) | 66 (7.5%) |
| 70 to 74 Years | 46 (4.6%) | 43 (4.9%) |
| 75 to 79 Years | 35 (3.5%) | 28 (3.2%) |
| 80 to 84 Years | 12 (1.2%) | 21 (2.4%) |
| 85 Years and over | 15 (1.5%) | 7 (0.8%) |
| Total | 1,000 (100.0%) | 885 (100.0%) |
Families and Households in Lowry Crossing
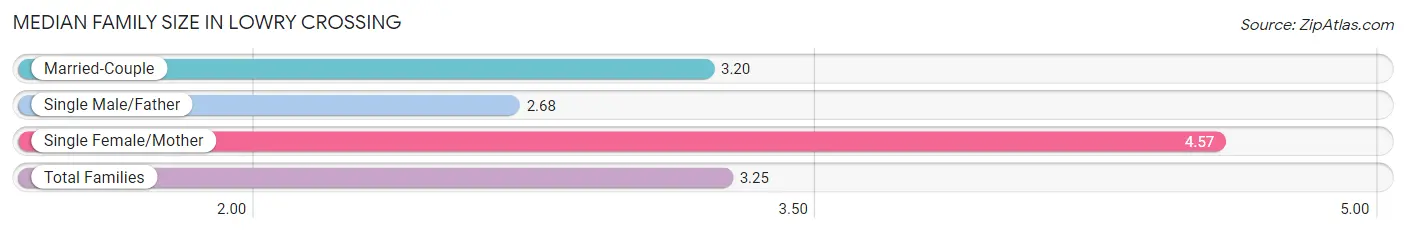
Median Family Size in Lowry Crossing
The median family size in Lowry Crossing is 3.25 persons per family, with single female/mother families (35 | 6.5%) accounting for the largest median family size of 4.57 persons per family. On the other hand, single male/father families (38 | 7.1%) represent the smallest median family size with 2.68 persons per family.
| Family Type | # Families | Family Size |
| Married-Couple | 465 (86.4%) | 3.20 |
| Single Male/Father | 38 (7.1%) | 2.68 |
| Single Female/Mother | 35 (6.5%) | 4.57 |
| Total Families | 538 (100.0%) | 3.25 |
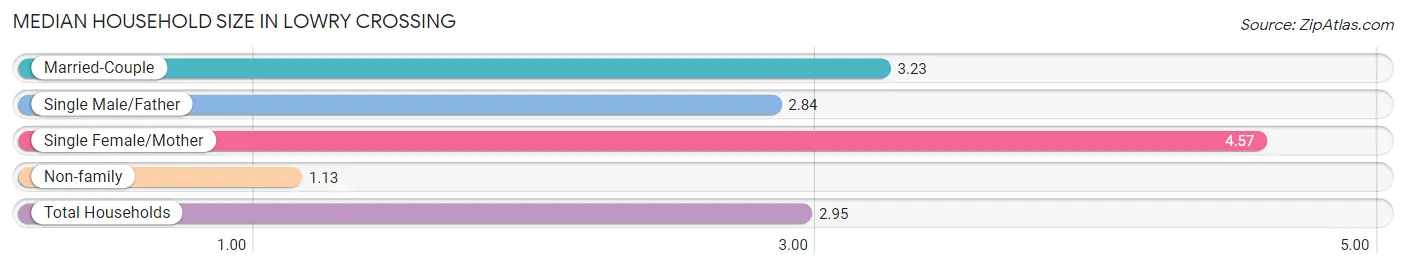
Median Household Size in Lowry Crossing
The median household size in Lowry Crossing is 2.95 persons per household, with single female/mother households (35 | 5.5%) accounting for the largest median household size of 4.57 persons per household. non-family households (100 | 15.7%) represent the smallest median household size with 1.13 persons per household.
| Household Type | # Households | Household Size |
| Married-Couple | 465 (72.9%) | 3.23 |
| Single Male/Father | 38 (6.0%) | 2.84 |
| Single Female/Mother | 35 (5.5%) | 4.57 |
| Non-family | 100 (15.7%) | 1.13 |
| Total Households | 638 (100.0%) | 2.95 |
Household Size by Marriage Status in Lowry Crossing
Out of a total of 638 households in Lowry Crossing, 538 (84.3%) are family households, while 100 (15.7%) are nonfamily households. The most numerous type of family households are 2-person households, comprising 215, and the most common type of nonfamily households are 1-person households, comprising 86.
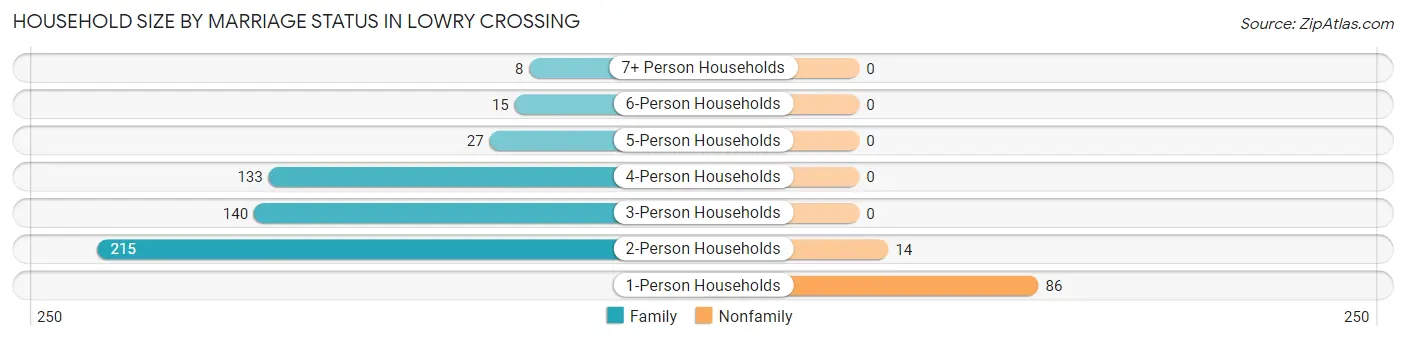
| Household Size | Family Households | Nonfamily Households |
| 1-Person Households | - | 86 (13.5%) |
| 2-Person Households | 215 (33.7%) | 14 (2.2%) |
| 3-Person Households | 140 (21.9%) | 0 (0.0%) |
| 4-Person Households | 133 (20.8%) | 0 (0.0%) |
| 5-Person Households | 27 (4.2%) | 0 (0.0%) |
| 6-Person Households | 15 (2.4%) | 0 (0.0%) |
| 7+ Person Households | 8 (1.3%) | 0 (0.0%) |
| Total | 538 (84.3%) | 100 (15.7%) |
Female Fertility in Lowry Crossing
Fertility by Age in Lowry Crossing
Average fertility rate in Lowry Crossing is 29.0 births per 1,000 women. Women in the age bracket of 20 to 34 years have the highest fertility rate with 95.0 births per 1,000 women. Women in the age bracket of 20 to 34 years acount for 100.0% of all women with births.
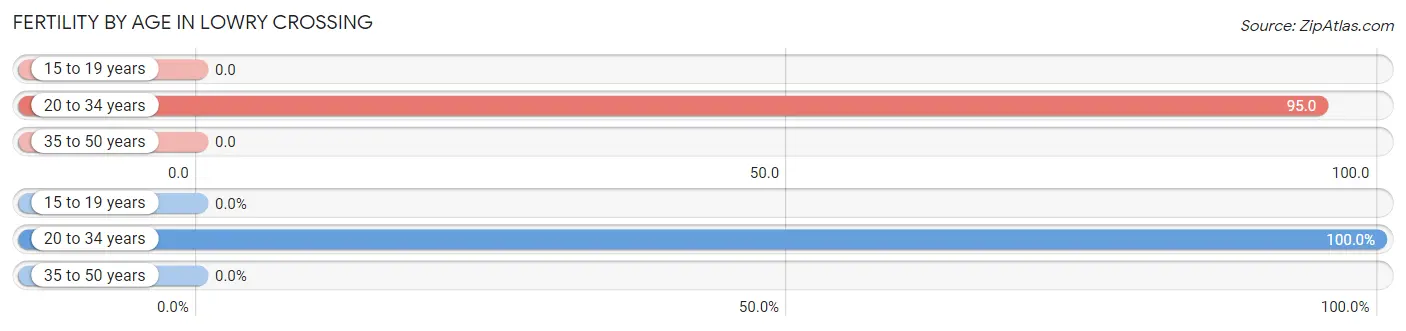
| Age Bracket | Women with Births | Births / 1,000 Women |
| 15 to 19 years | 0 (0.0%) | 0.0 |
| 20 to 34 years | 10 (100.0%) | 95.0 |
| 35 to 50 years | 0 (0.0%) | 0.0 |
| Total | 10 (100.0%) | 29.0 |
Fertility by Age by Marriage Status in Lowry Crossing
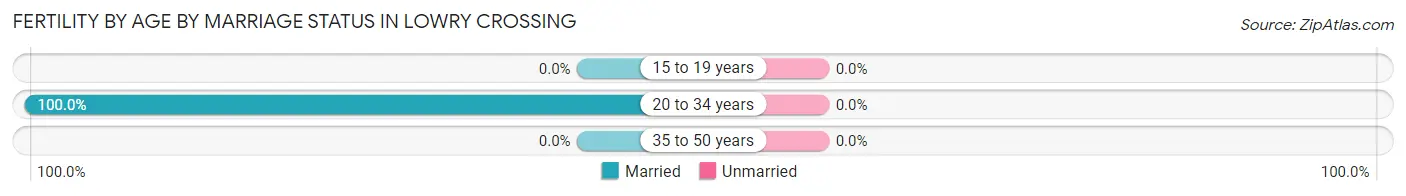
| Age Bracket | Married | Unmarried |
| 15 to 19 years | 0 (0.0%) | 0 (0.0%) |
| 20 to 34 years | 10 (100.0%) | 0 (0.0%) |
| 35 to 50 years | 0 (0.0%) | 0 (0.0%) |
| Total | 10 (100.0%) | 0 (0.0%) |
Fertility by Education in Lowry Crossing
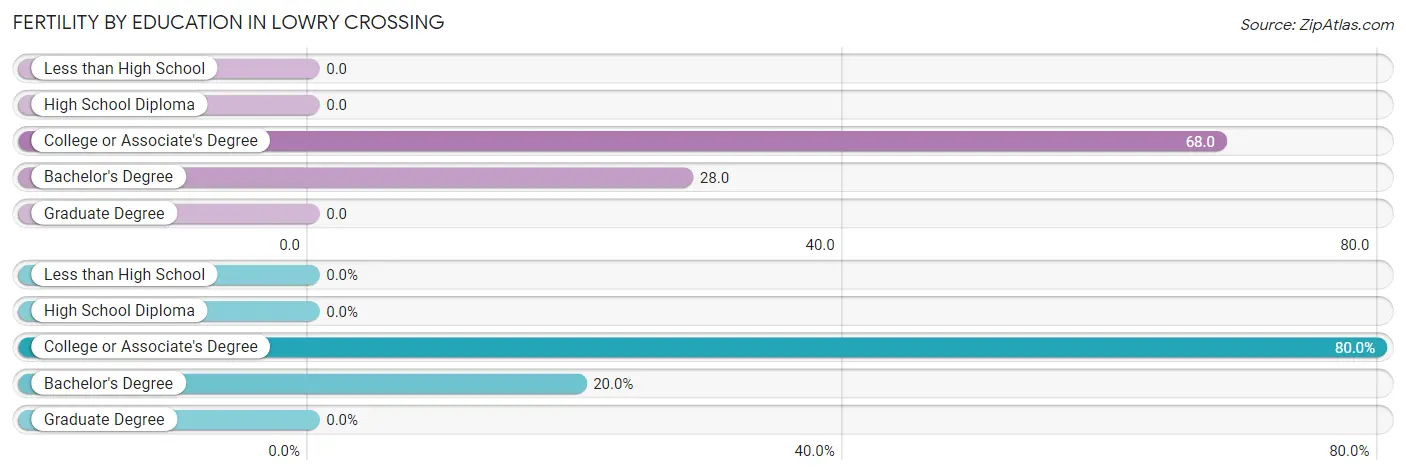
| Educational Attainment | Women with Births | Births / 1,000 Women |
| Less than High School | 0 (0.0%) | 0.0 |
| High School Diploma | 0 (0.0%) | 0.0 |
| College or Associate's Degree | 8 (80.0%) | 68.0 |
| Bachelor's Degree | 2 (20.0%) | 28.0 |
| Graduate Degree | 0 (0.0%) | 0.0 |
| Total | 10 (100.0%) | 29.0 |
Fertility by Education by Marriage Status in Lowry Crossing
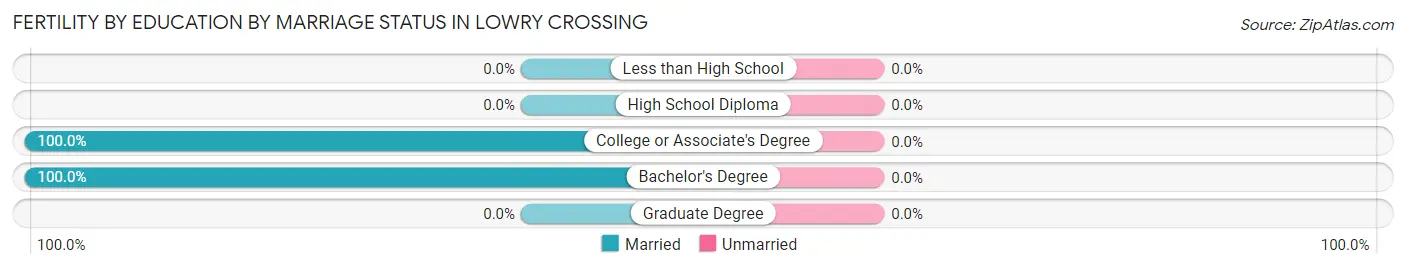
| Educational Attainment | Married | Unmarried |
| Less than High School | 0 (0.0%) | 0 (0.0%) |
| High School Diploma | 0 (0.0%) | 0 (0.0%) |
| College or Associate's Degree | 8 (100.0%) | 0 (0.0%) |
| Bachelor's Degree | 2 (100.0%) | 0 (0.0%) |
| Graduate Degree | 0 (0.0%) | 0 (0.0%) |
| Total | 10 (100.0%) | 0 (0.0%) |
Employment Characteristics in Lowry Crossing
Employment by Class of Employer in Lowry Crossing
Among the 1,000 employed individuals in Lowry Crossing, private company employees (708 | 70.8%), self-employed (not incorporated) (107 | 10.7%), and local government employees (102 | 10.2%) make up the most common classes of employment.
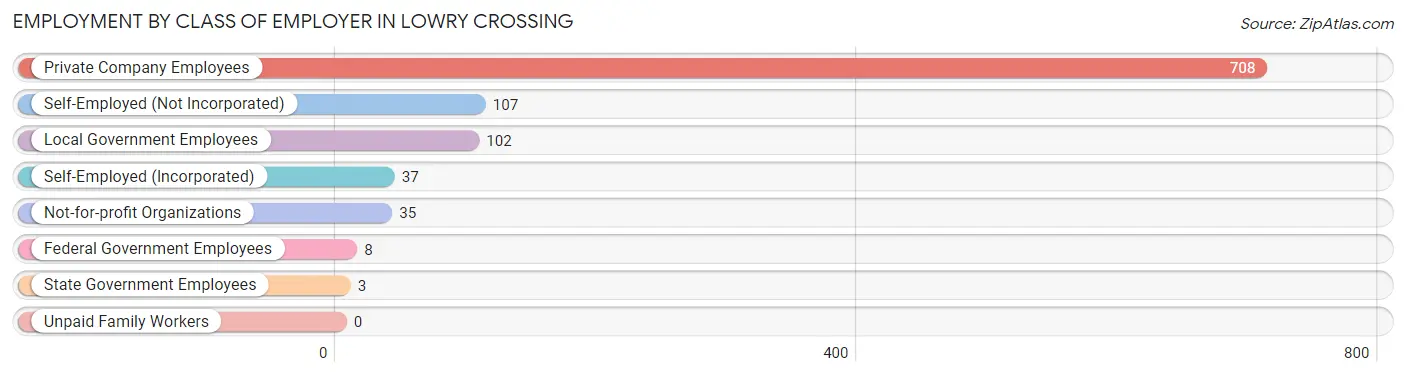
| Employer Class | # Employees | % Employees |
| Private Company Employees | 708 | 70.8% |
| Self-Employed (Incorporated) | 37 | 3.7% |
| Self-Employed (Not Incorporated) | 107 | 10.7% |
| Not-for-profit Organizations | 35 | 3.5% |
| Local Government Employees | 102 | 10.2% |
| State Government Employees | 3 | 0.3% |
| Federal Government Employees | 8 | 0.8% |
| Unpaid Family Workers | 0 | 0.0% |
| Total | 1,000 | 100.0% |
Employment Status by Age in Lowry Crossing
According to the labor force statistics for Lowry Crossing, out of the total population over 16 years of age (1,586), 66.5% or 1,055 individuals are in the labor force, with 3.7% or 39 of them unemployed. The age group with the highest labor force participation rate is 20 to 24 years, with 94.9% or 94 individuals in the labor force. Within the labor force, the 60 to 64 years age range has the highest percentage of unemployed individuals, with 14.5% or 18 of them being unemployed.
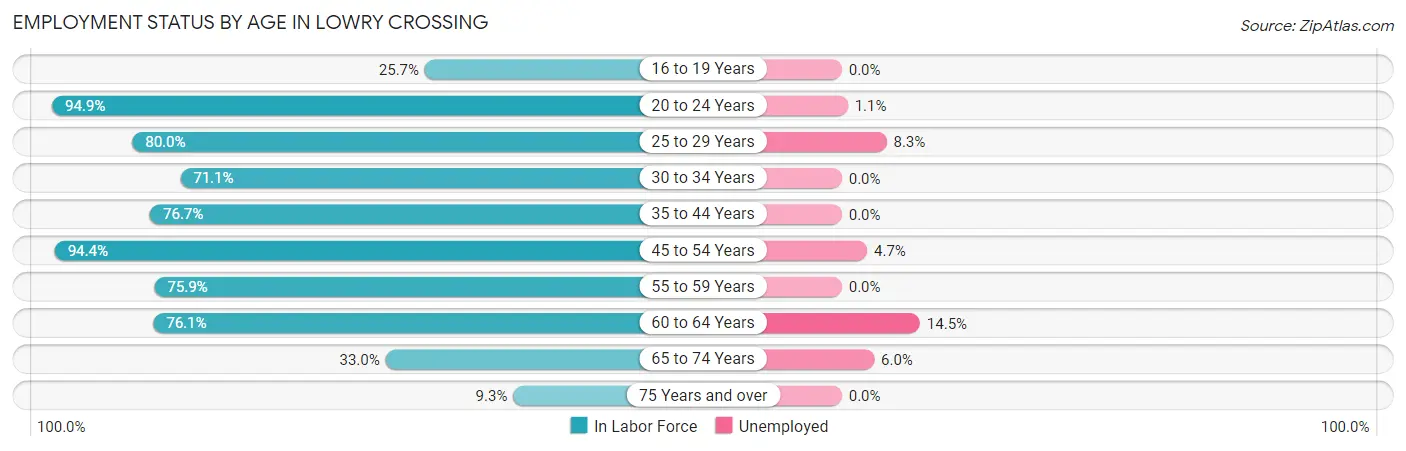
| Age Bracket | In Labor Force | Unemployed |
| 16 to 19 Years | 26 (25.7%) | 0 (0.0%) |
| 20 to 24 Years | 94 (94.9%) | 1 (1.1%) |
| 25 to 29 Years | 60 (80.0%) | 5 (8.3%) |
| 30 to 34 Years | 64 (71.1%) | 0 (0.0%) |
| 35 to 44 Years | 231 (76.7%) | 0 (0.0%) |
| 45 to 54 Years | 235 (94.4%) | 11 (4.7%) |
| 55 to 59 Years | 142 (75.9%) | 0 (0.0%) |
| 60 to 64 Years | 124 (76.1%) | 18 (14.5%) |
| 65 to 74 Years | 67 (33.0%) | 4 (6.0%) |
| 75 Years and over | 11 (9.3%) | 0 (0.0%) |
| Total | 1,055 (66.5%) | 39 (3.7%) |
Employment Status by Educational Attainment in Lowry Crossing
According to labor force statistics for Lowry Crossing, 80.4% of individuals (856) out of the total population between 25 and 64 years of age (1,065) are in the labor force, with 4.0% or 34 of them being unemployed. The group with the highest labor force participation rate are those with the educational attainment of high school diploma, with 86.8% or 184 individuals in the labor force. Within the labor force, individuals with less than high school education have the highest percentage of unemployment, with 15.1% or 18 of them being unemployed.
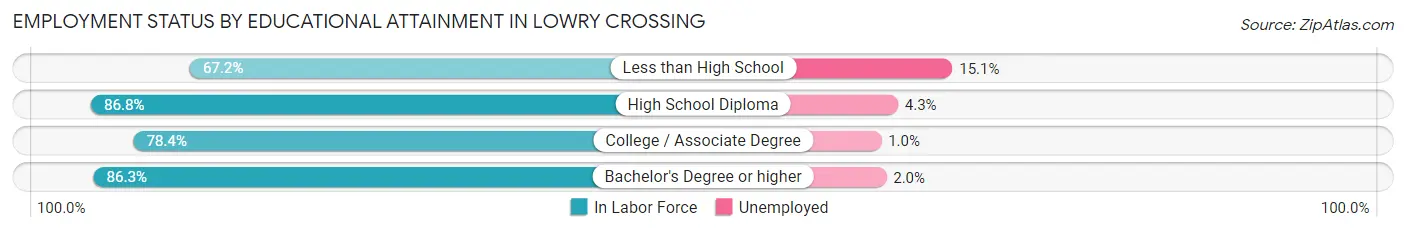
| Educational Attainment | In Labor Force | Unemployed |
| Less than High School | 119 (67.2%) | 27 (15.1%) |
| High School Diploma | 184 (86.8%) | 9 (4.3%) |
| College / Associate Degree | 302 (78.4%) | 4 (1.0%) |
| Bachelor's Degree or higher | 251 (86.3%) | 6 (2.0%) |
| Total | 856 (80.4%) | 43 (4.0%) |
Employment Occupations by Sex in Lowry Crossing
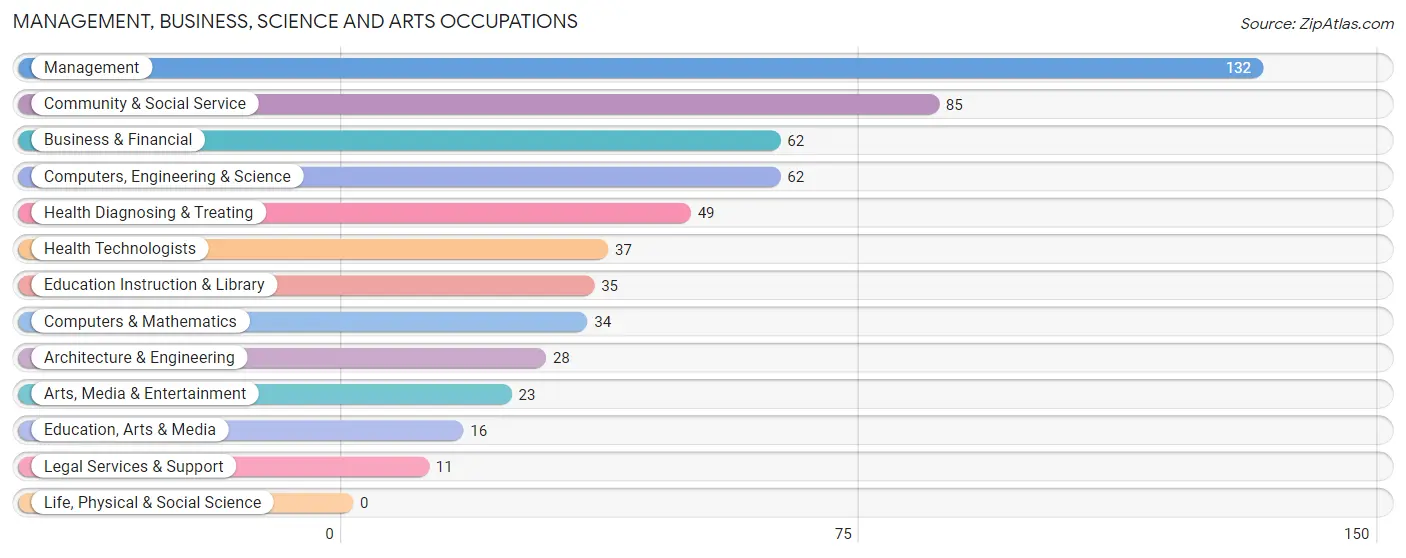
Management, Business, Science and Arts Occupations
The most common Management, Business, Science and Arts occupations in Lowry Crossing are Management (132 | 13.0%), Community & Social Service (85 | 8.4%), Business & Financial (62 | 6.1%), Computers, Engineering & Science (62 | 6.1%), and Health Diagnosing & Treating (49 | 4.8%).
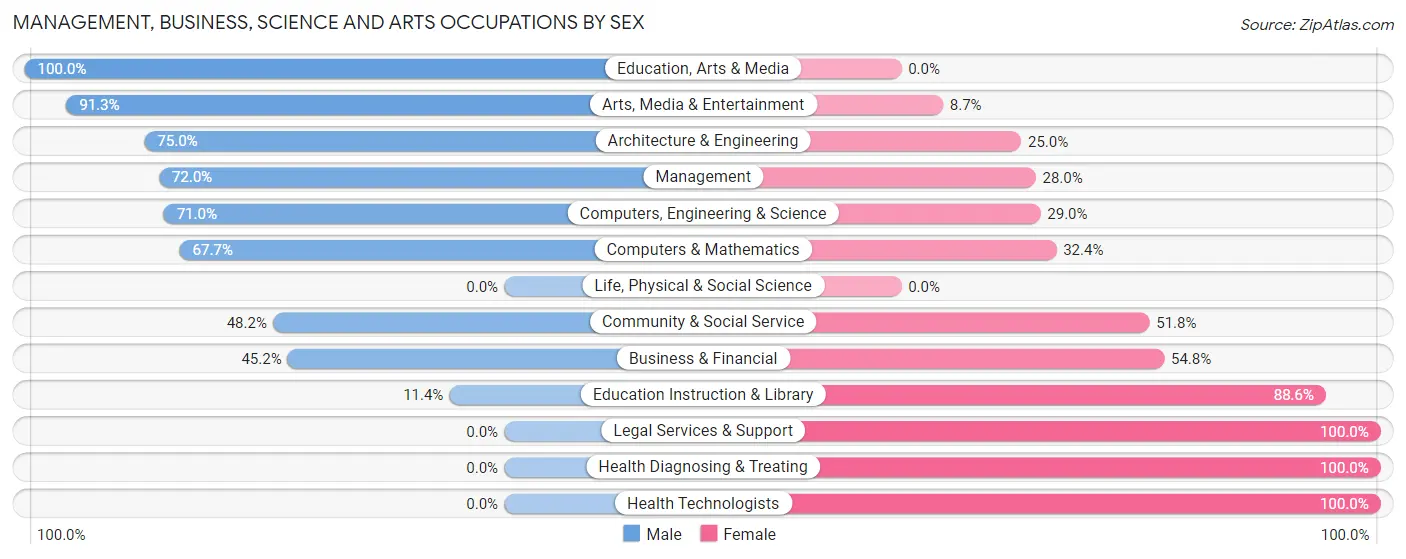
Management, Business, Science and Arts Occupations by Sex
Within the Management, Business, Science and Arts occupations in Lowry Crossing, the most male-oriented occupations are Education, Arts & Media (100.0%), Arts, Media & Entertainment (91.3%), and Architecture & Engineering (75.0%), while the most female-oriented occupations are Legal Services & Support (100.0%), Health Diagnosing & Treating (100.0%), and Health Technologists (100.0%).
| Occupation | Male | Female |
| Management | 95 (72.0%) | 37 (28.0%) |
| Business & Financial | 28 (45.2%) | 34 (54.8%) |
| Computers, Engineering & Science | 44 (71.0%) | 18 (29.0%) |
| Computers & Mathematics | 23 (67.6%) | 11 (32.4%) |
| Architecture & Engineering | 21 (75.0%) | 7 (25.0%) |
| Life, Physical & Social Science | 0 (0.0%) | 0 (0.0%) |
| Community & Social Service | 41 (48.2%) | 44 (51.8%) |
| Education, Arts & Media | 16 (100.0%) | 0 (0.0%) |
| Legal Services & Support | 0 (0.0%) | 11 (100.0%) |
| Education Instruction & Library | 4 (11.4%) | 31 (88.6%) |
| Arts, Media & Entertainment | 21 (91.3%) | 2 (8.7%) |
| Health Diagnosing & Treating | 0 (0.0%) | 49 (100.0%) |
| Health Technologists | 0 (0.0%) | 37 (100.0%) |
| Total (Category) | 208 (53.3%) | 182 (46.7%) |
| Total (Overall) | 595 (58.6%) | 420 (41.4%) |
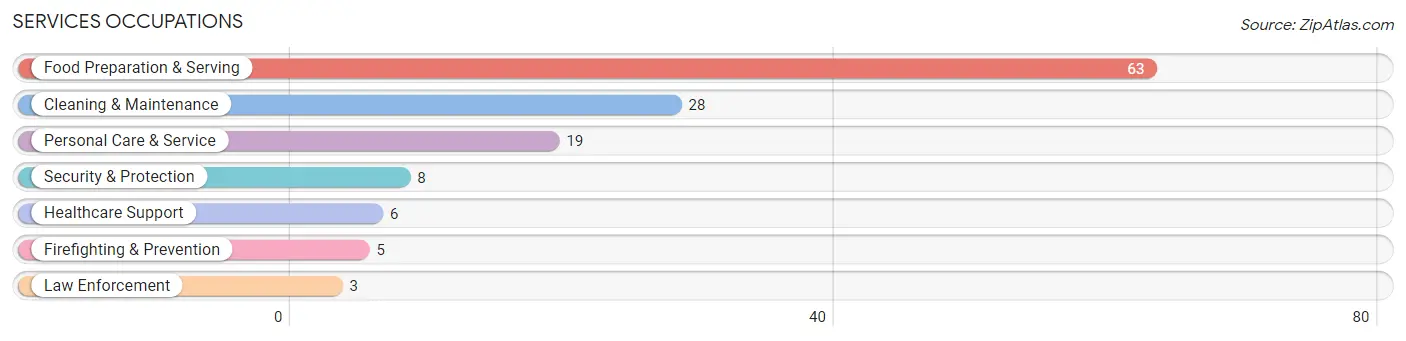
Services Occupations
The most common Services occupations in Lowry Crossing are Food Preparation & Serving (63 | 6.2%), Cleaning & Maintenance (28 | 2.8%), Personal Care & Service (19 | 1.9%), Security & Protection (8 | 0.8%), and Healthcare Support (6 | 0.6%).
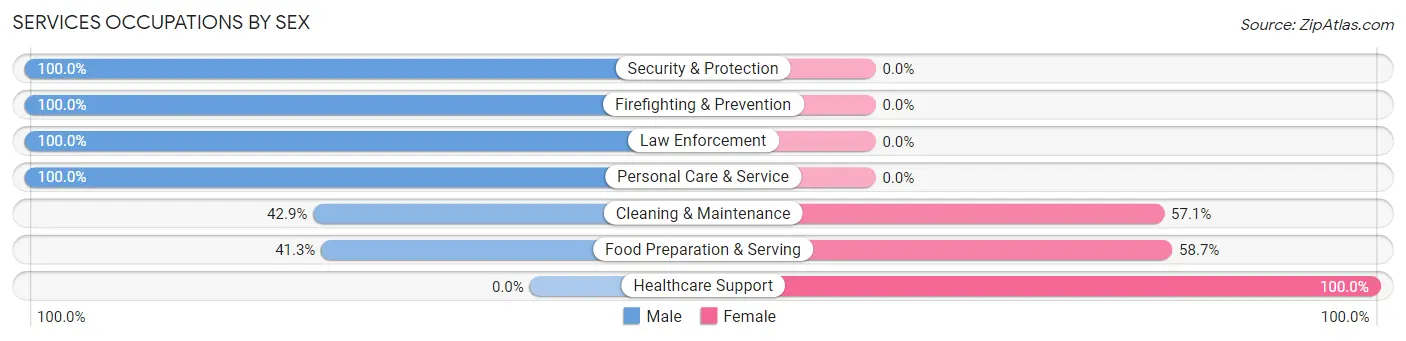
Services Occupations by Sex
Within the Services occupations in Lowry Crossing, the most male-oriented occupations are Security & Protection (100.0%), Firefighting & Prevention (100.0%), and Law Enforcement (100.0%), while the most female-oriented occupations are Healthcare Support (100.0%), Food Preparation & Serving (58.7%), and Cleaning & Maintenance (57.1%).
| Occupation | Male | Female |
| Healthcare Support | 0 (0.0%) | 6 (100.0%) |
| Security & Protection | 8 (100.0%) | 0 (0.0%) |
| Firefighting & Prevention | 5 (100.0%) | 0 (0.0%) |
| Law Enforcement | 3 (100.0%) | 0 (0.0%) |
| Food Preparation & Serving | 26 (41.3%) | 37 (58.7%) |
| Cleaning & Maintenance | 12 (42.9%) | 16 (57.1%) |
| Personal Care & Service | 19 (100.0%) | 0 (0.0%) |
| Total (Category) | 65 (52.4%) | 59 (47.6%) |
| Total (Overall) | 595 (58.6%) | 420 (41.4%) |
Sales and Office Occupations
The most common Sales and Office occupations in Lowry Crossing are Sales & Related (125 | 12.3%), and Office & Administration (103 | 10.2%).
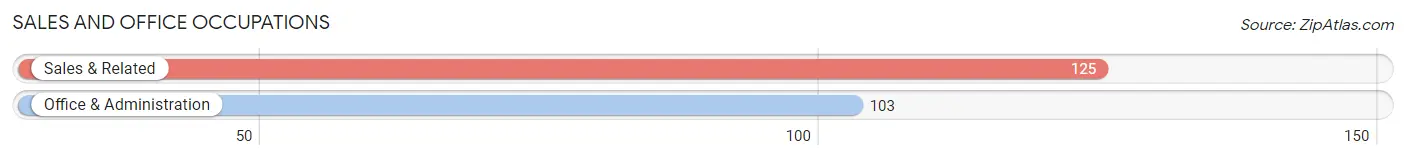
Sales and Office Occupations by Sex
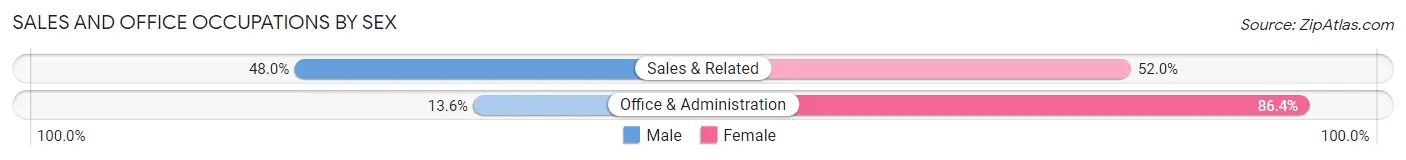
| Occupation | Male | Female |
| Sales & Related | 60 (48.0%) | 65 (52.0%) |
| Office & Administration | 14 (13.6%) | 89 (86.4%) |
| Total (Category) | 74 (32.5%) | 154 (67.5%) |
| Total (Overall) | 595 (58.6%) | 420 (41.4%) |
Natural Resources, Construction and Maintenance Occupations
The most common Natural Resources, Construction and Maintenance occupations in Lowry Crossing are Construction & Extraction (82 | 8.1%), and Installation, Maintenance & Repair (71 | 7.0%).
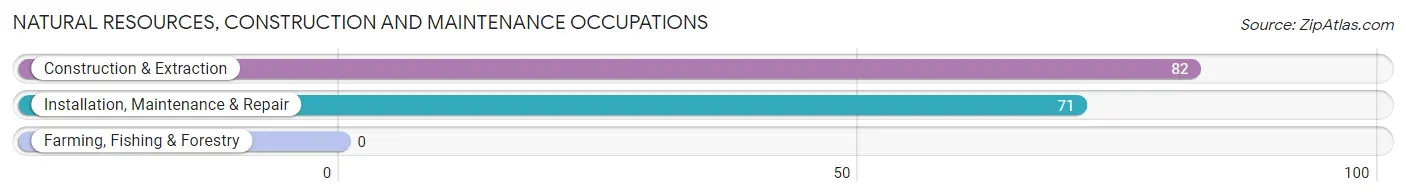
Natural Resources, Construction and Maintenance Occupations by Sex
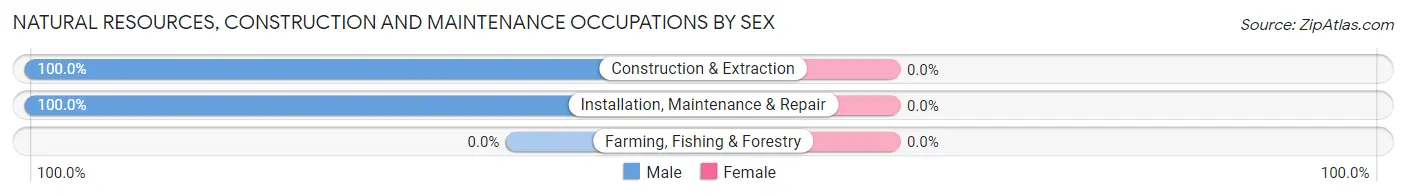
| Occupation | Male | Female |
| Farming, Fishing & Forestry | 0 (0.0%) | 0 (0.0%) |
| Construction & Extraction | 82 (100.0%) | 0 (0.0%) |
| Installation, Maintenance & Repair | 71 (100.0%) | 0 (0.0%) |
| Total (Category) | 153 (100.0%) | 0 (0.0%) |
| Total (Overall) | 595 (58.6%) | 420 (41.4%) |
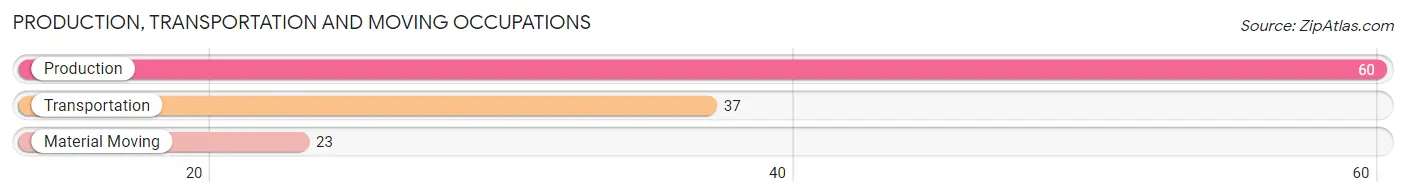
Production, Transportation and Moving Occupations
The most common Production, Transportation and Moving occupations in Lowry Crossing are Production (60 | 5.9%), Transportation (37 | 3.6%), and Material Moving (23 | 2.3%).
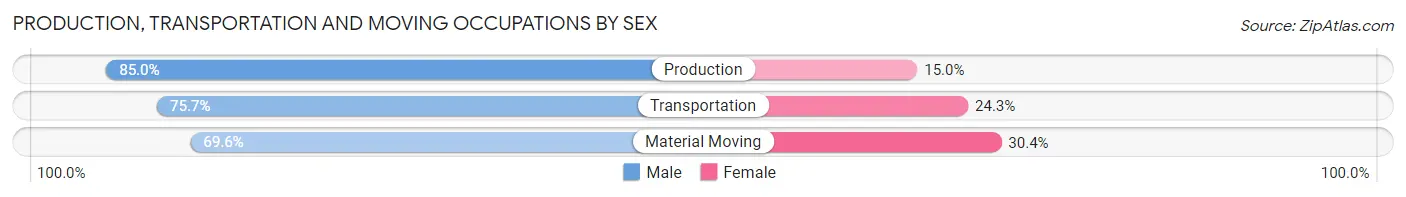
Production, Transportation and Moving Occupations by Sex
| Occupation | Male | Female |
| Production | 51 (85.0%) | 9 (15.0%) |
| Transportation | 28 (75.7%) | 9 (24.3%) |
| Material Moving | 16 (69.6%) | 7 (30.4%) |
| Total (Category) | 95 (79.2%) | 25 (20.8%) |
| Total (Overall) | 595 (58.6%) | 420 (41.4%) |
Employment Industries by Sex in Lowry Crossing
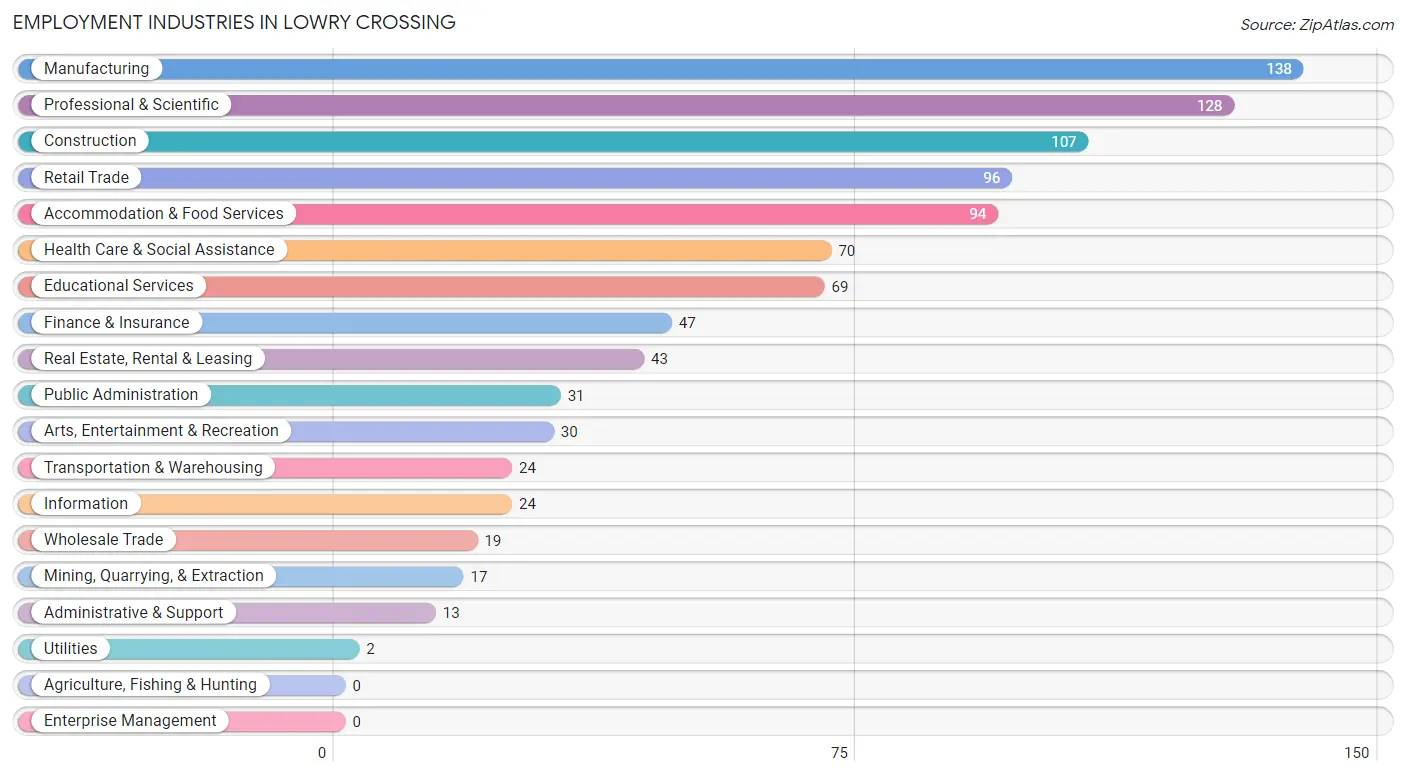
Employment Industries in Lowry Crossing
The major employment industries in Lowry Crossing include Manufacturing (138 | 13.6%), Professional & Scientific (128 | 12.6%), Construction (107 | 10.5%), Retail Trade (96 | 9.5%), and Accommodation & Food Services (94 | 9.3%).
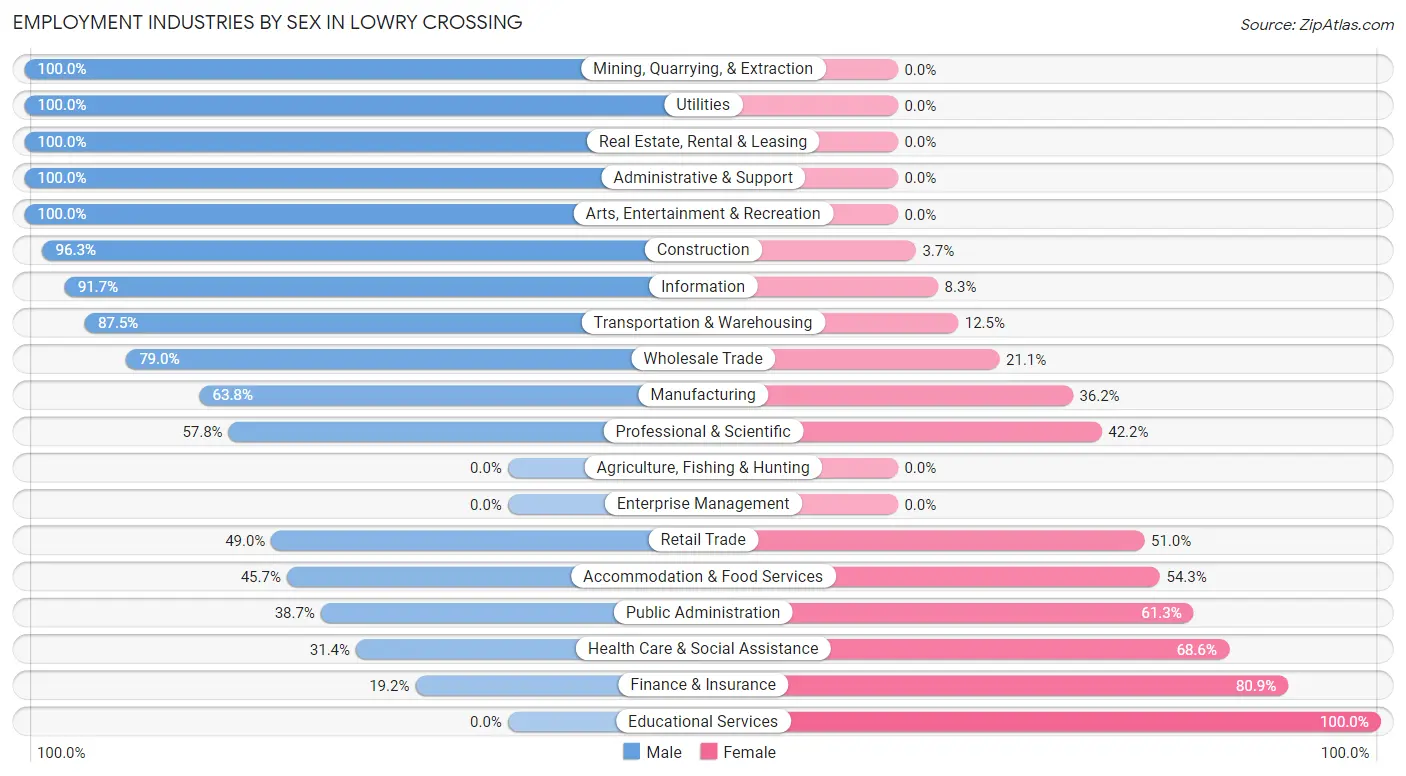
Employment Industries by Sex in Lowry Crossing
The Lowry Crossing industries that see more men than women are Mining, Quarrying, & Extraction (100.0%), Utilities (100.0%), and Real Estate, Rental & Leasing (100.0%), whereas the industries that tend to have a higher number of women are Educational Services (100.0%), Finance & Insurance (80.8%), and Health Care & Social Assistance (68.6%).
| Industry | Male | Female |
| Agriculture, Fishing & Hunting | 0 (0.0%) | 0 (0.0%) |
| Mining, Quarrying, & Extraction | 17 (100.0%) | 0 (0.0%) |
| Construction | 103 (96.3%) | 4 (3.7%) |
| Manufacturing | 88 (63.8%) | 50 (36.2%) |
| Wholesale Trade | 15 (78.9%) | 4 (21.0%) |
| Retail Trade | 47 (49.0%) | 49 (51.0%) |
| Transportation & Warehousing | 21 (87.5%) | 3 (12.5%) |
| Utilities | 2 (100.0%) | 0 (0.0%) |
| Information | 22 (91.7%) | 2 (8.3%) |
| Finance & Insurance | 9 (19.2%) | 38 (80.8%) |
| Real Estate, Rental & Leasing | 43 (100.0%) | 0 (0.0%) |
| Professional & Scientific | 74 (57.8%) | 54 (42.2%) |
| Enterprise Management | 0 (0.0%) | 0 (0.0%) |
| Administrative & Support | 13 (100.0%) | 0 (0.0%) |
| Educational Services | 0 (0.0%) | 69 (100.0%) |
| Health Care & Social Assistance | 22 (31.4%) | 48 (68.6%) |
| Arts, Entertainment & Recreation | 30 (100.0%) | 0 (0.0%) |
| Accommodation & Food Services | 43 (45.7%) | 51 (54.3%) |
| Public Administration | 12 (38.7%) | 19 (61.3%) |
| Total | 595 (58.6%) | 420 (41.4%) |
Education in Lowry Crossing
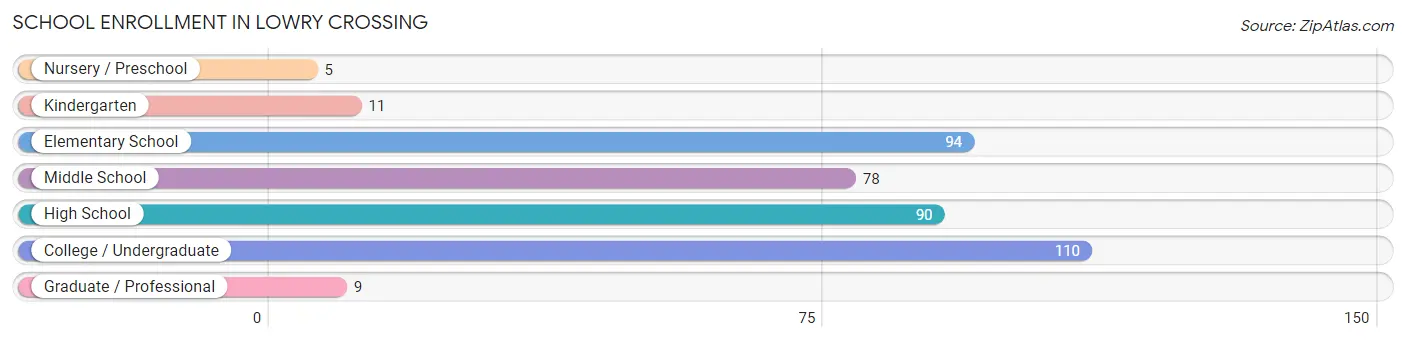
School Enrollment in Lowry Crossing
The most common levels of schooling among the 397 students in Lowry Crossing are college / undergraduate (110 | 27.7%), elementary school (94 | 23.7%), and high school (90 | 22.7%).
| School Level | # Students | % Students |
| Nursery / Preschool | 5 | 1.3% |
| Kindergarten | 11 | 2.8% |
| Elementary School | 94 | 23.7% |
| Middle School | 78 | 19.7% |
| High School | 90 | 22.7% |
| College / Undergraduate | 110 | 27.7% |
| Graduate / Professional | 9 | 2.3% |
| Total | 397 | 100.0% |
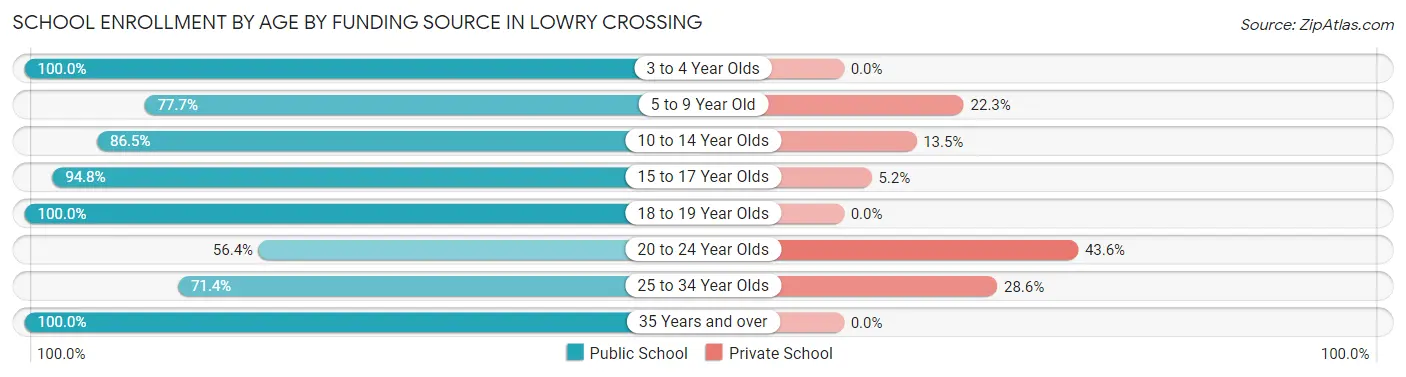
School Enrollment by Age by Funding Source in Lowry Crossing
Out of a total of 397 students who are enrolled in schools in Lowry Crossing, 67 (16.9%) attend a private institution, while the remaining 330 (83.1%) are enrolled in public schools. The age group of 20 to 24 year olds has the highest likelihood of being enrolled in private schools, with 24 (43.6% in the age bracket) enrolled. Conversely, the age group of 3 to 4 year olds has the lowest likelihood of being enrolled in a private school, with 5 (100.0% in the age bracket) attending a public institution.
| Age Bracket | Public School | Private School |
| 3 to 4 Year Olds | 5 (100.0%) | 0 (0.0%) |
| 5 to 9 Year Old | 73 (77.7%) | 21 (22.3%) |
| 10 to 14 Year Olds | 96 (86.5%) | 15 (13.5%) |
| 15 to 17 Year Olds | 55 (94.8%) | 3 (5.2%) |
| 18 to 19 Year Olds | 44 (100.0%) | 0 (0.0%) |
| 20 to 24 Year Olds | 31 (56.4%) | 24 (43.6%) |
| 25 to 34 Year Olds | 10 (71.4%) | 4 (28.6%) |
| 35 Years and over | 16 (100.0%) | 0 (0.0%) |
| Total | 330 (83.1%) | 67 (16.9%) |
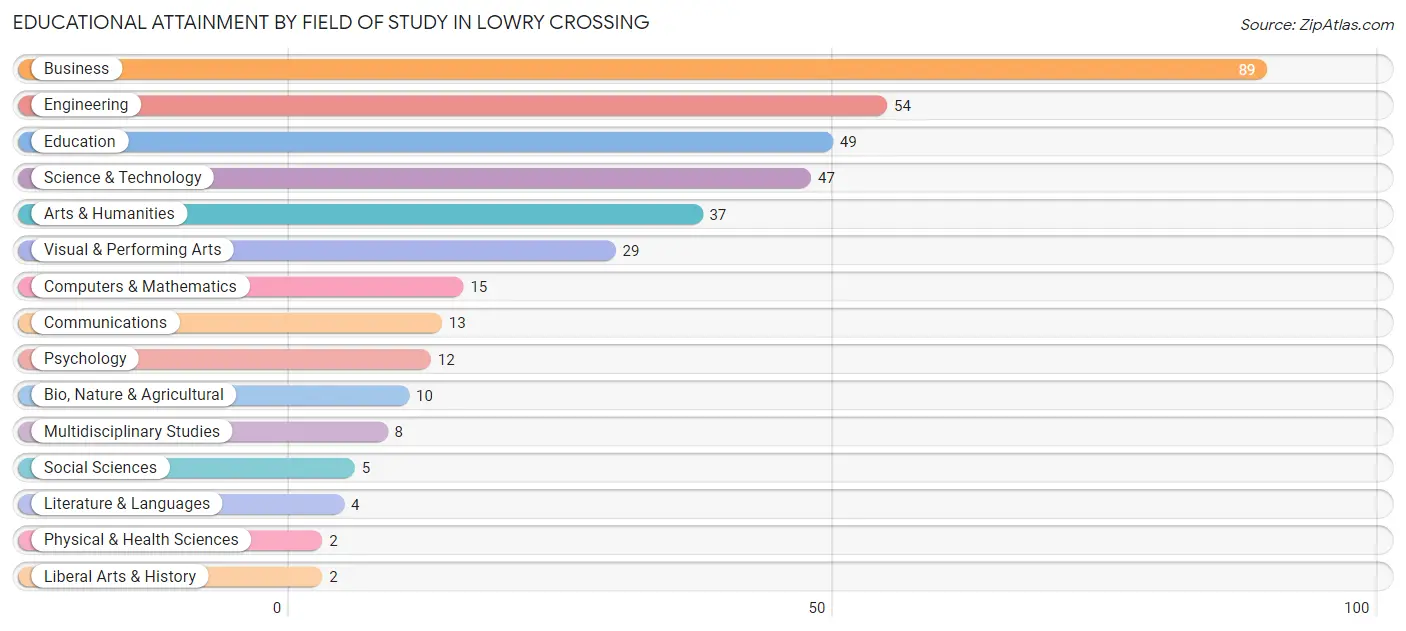
Educational Attainment by Field of Study in Lowry Crossing
Business (89 | 23.7%), engineering (54 | 14.4%), education (49 | 13.0%), science & technology (47 | 12.5%), and arts & humanities (37 | 9.8%) are the most common fields of study among 376 individuals in Lowry Crossing who have obtained a bachelor's degree or higher.
| Field of Study | # Graduates | % Graduates |
| Computers & Mathematics | 15 | 4.0% |
| Bio, Nature & Agricultural | 10 | 2.7% |
| Physical & Health Sciences | 2 | 0.5% |
| Psychology | 12 | 3.2% |
| Social Sciences | 5 | 1.3% |
| Engineering | 54 | 14.4% |
| Multidisciplinary Studies | 8 | 2.1% |
| Science & Technology | 47 | 12.5% |
| Business | 89 | 23.7% |
| Education | 49 | 13.0% |
| Literature & Languages | 4 | 1.1% |
| Liberal Arts & History | 2 | 0.5% |
| Visual & Performing Arts | 29 | 7.7% |
| Communications | 13 | 3.5% |
| Arts & Humanities | 37 | 9.8% |
| Total | 376 | 100.0% |
Transportation & Commute in Lowry Crossing
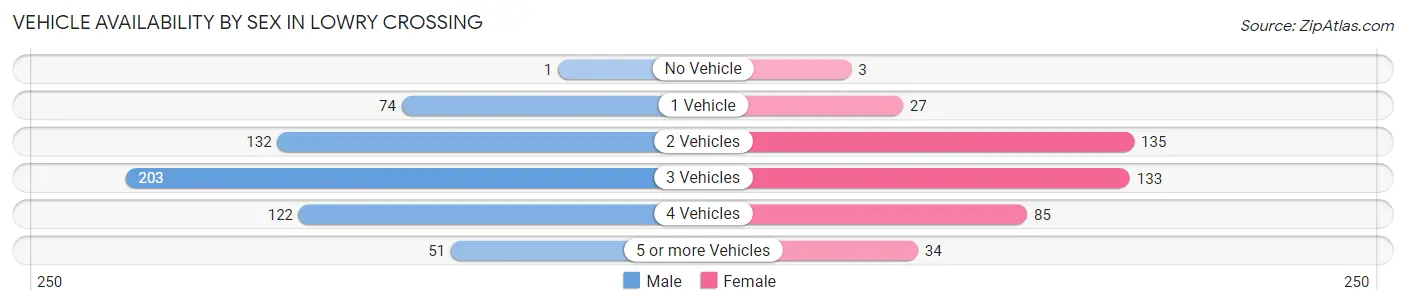
Vehicle Availability by Sex in Lowry Crossing
The most prevalent vehicle ownership categories in Lowry Crossing are males with 3 vehicles (203, accounting for 34.8%) and females with 3 vehicles (133, making up 48.7%).
| Vehicles Available | Male | Female |
| No Vehicle | 1 (0.2%) | 3 (0.7%) |
| 1 Vehicle | 74 (12.7%) | 27 (6.5%) |
| 2 Vehicles | 132 (22.6%) | 135 (32.4%) |
| 3 Vehicles | 203 (34.8%) | 133 (31.9%) |
| 4 Vehicles | 122 (20.9%) | 85 (20.4%) |
| 5 or more Vehicles | 51 (8.7%) | 34 (8.2%) |
| Total | 583 (100.0%) | 417 (100.0%) |
Commute Time in Lowry Crossing
The most frequently occuring commute durations in Lowry Crossing are 15 to 19 minutes (234 commuters, 25.7%), 30 to 34 minutes (134 commuters, 14.7%), and 45 to 59 minutes (109 commuters, 12.0%).
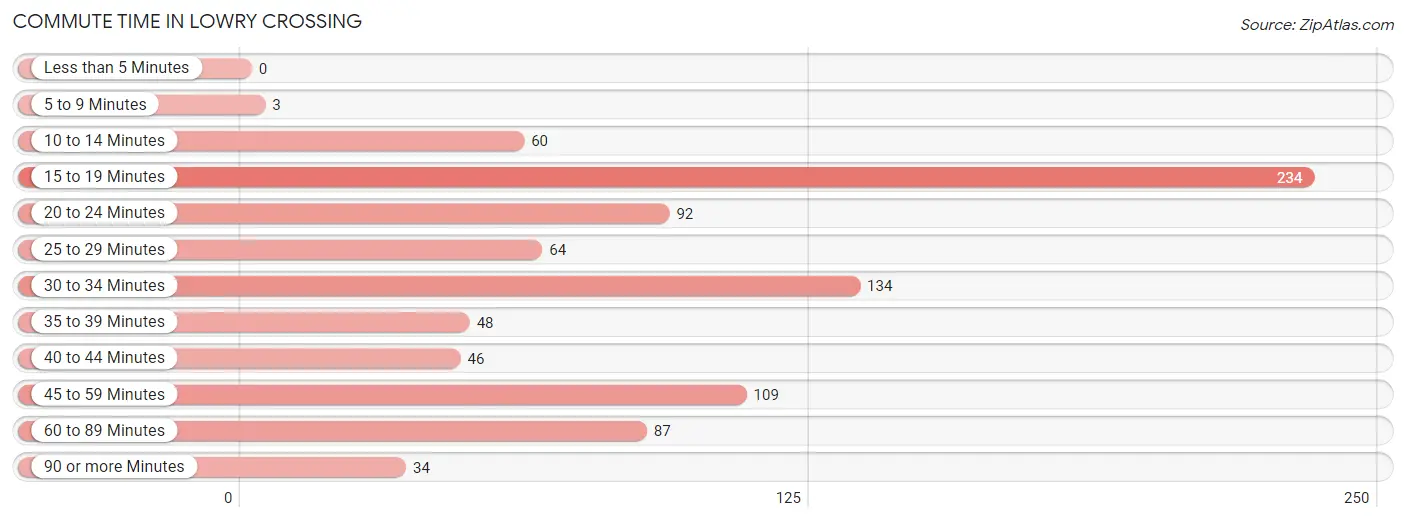
| Commute Time | # Commuters | % Commuters |
| Less than 5 Minutes | 0 | 0.0% |
| 5 to 9 Minutes | 3 | 0.3% |
| 10 to 14 Minutes | 60 | 6.6% |
| 15 to 19 Minutes | 234 | 25.7% |
| 20 to 24 Minutes | 92 | 10.1% |
| 25 to 29 Minutes | 64 | 7.0% |
| 30 to 34 Minutes | 134 | 14.7% |
| 35 to 39 Minutes | 48 | 5.3% |
| 40 to 44 Minutes | 46 | 5.1% |
| 45 to 59 Minutes | 109 | 12.0% |
| 60 to 89 Minutes | 87 | 9.6% |
| 90 or more Minutes | 34 | 3.7% |
Commute Time by Sex in Lowry Crossing
The most common commute times in Lowry Crossing are 60 to 89 minutes (79 commuters, 15.0%) for males and 15 to 19 minutes (173 commuters, 45.2%) for females.
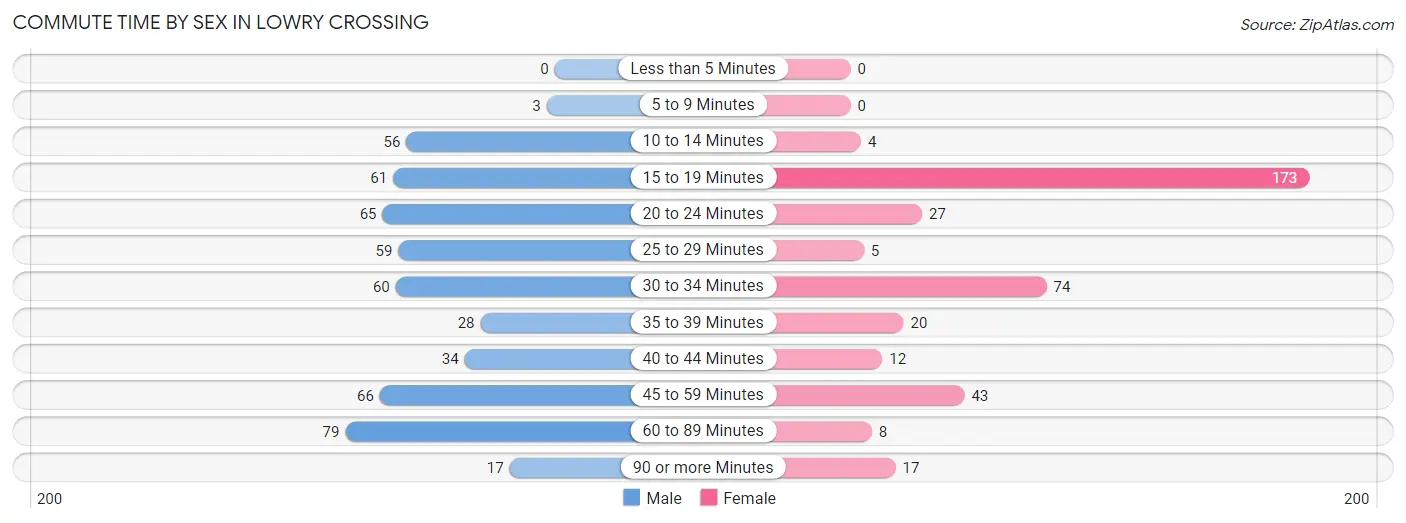
| Commute Time | Male | Female |
| Less than 5 Minutes | 0 (0.0%) | 0 (0.0%) |
| 5 to 9 Minutes | 3 (0.6%) | 0 (0.0%) |
| 10 to 14 Minutes | 56 (10.6%) | 4 (1.0%) |
| 15 to 19 Minutes | 61 (11.6%) | 173 (45.2%) |
| 20 to 24 Minutes | 65 (12.3%) | 27 (7.0%) |
| 25 to 29 Minutes | 59 (11.2%) | 5 (1.3%) |
| 30 to 34 Minutes | 60 (11.4%) | 74 (19.3%) |
| 35 to 39 Minutes | 28 (5.3%) | 20 (5.2%) |
| 40 to 44 Minutes | 34 (6.4%) | 12 (3.1%) |
| 45 to 59 Minutes | 66 (12.5%) | 43 (11.2%) |
| 60 to 89 Minutes | 79 (15.0%) | 8 (2.1%) |
| 90 or more Minutes | 17 (3.2%) | 17 (4.4%) |
Time of Departure to Work by Sex in Lowry Crossing
The most frequent times of departure to work in Lowry Crossing are 6:00 AM to 6:29 AM (137, 26.0%) for males and 7:00 AM to 7:29 AM (86, 22.5%) for females.
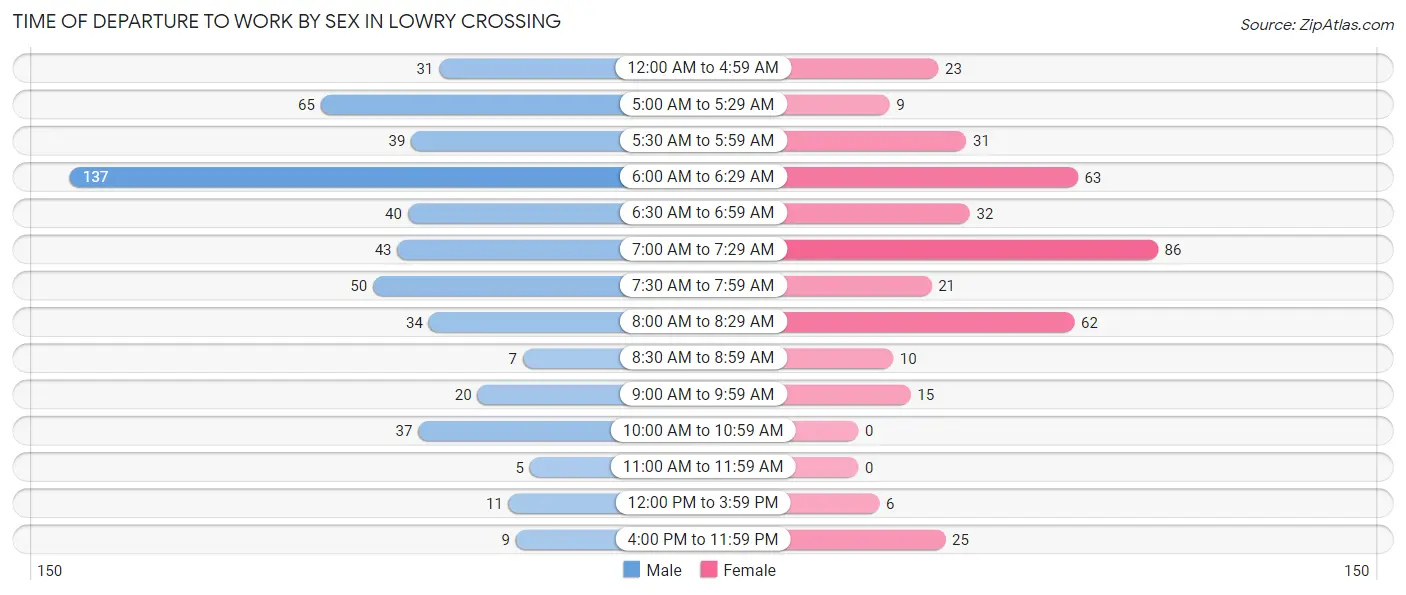
| Time of Departure | Male | Female |
| 12:00 AM to 4:59 AM | 31 (5.9%) | 23 (6.0%) |
| 5:00 AM to 5:29 AM | 65 (12.3%) | 9 (2.4%) |
| 5:30 AM to 5:59 AM | 39 (7.4%) | 31 (8.1%) |
| 6:00 AM to 6:29 AM | 137 (26.0%) | 63 (16.5%) |
| 6:30 AM to 6:59 AM | 40 (7.6%) | 32 (8.4%) |
| 7:00 AM to 7:29 AM | 43 (8.1%) | 86 (22.5%) |
| 7:30 AM to 7:59 AM | 50 (9.5%) | 21 (5.5%) |
| 8:00 AM to 8:29 AM | 34 (6.4%) | 62 (16.2%) |
| 8:30 AM to 8:59 AM | 7 (1.3%) | 10 (2.6%) |
| 9:00 AM to 9:59 AM | 20 (3.8%) | 15 (3.9%) |
| 10:00 AM to 10:59 AM | 37 (7.0%) | 0 (0.0%) |
| 11:00 AM to 11:59 AM | 5 (0.9%) | 0 (0.0%) |
| 12:00 PM to 3:59 PM | 11 (2.1%) | 6 (1.6%) |
| 4:00 PM to 11:59 PM | 9 (1.7%) | 25 (6.5%) |
| Total | 528 (100.0%) | 383 (100.0%) |
Housing Occupancy in Lowry Crossing
Occupancy by Ownership in Lowry Crossing
Of the total 638 dwellings in Lowry Crossing, owner-occupied units account for 624 (97.8%), while renter-occupied units make up 14 (2.2%).
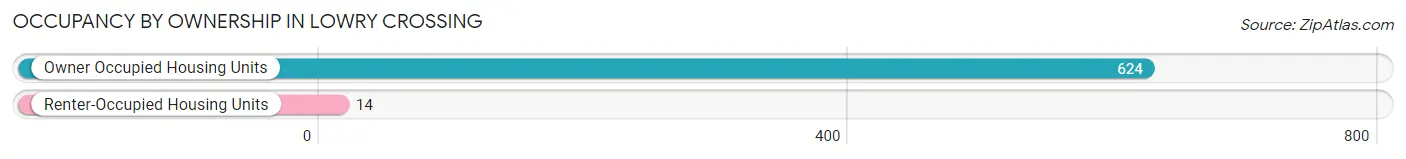
| Occupancy | # Housing Units | % Housing Units |
| Owner Occupied Housing Units | 624 | 97.8% |
| Renter-Occupied Housing Units | 14 | 2.2% |
| Total Occupied Housing Units | 638 | 100.0% |
Occupancy by Household Size in Lowry Crossing
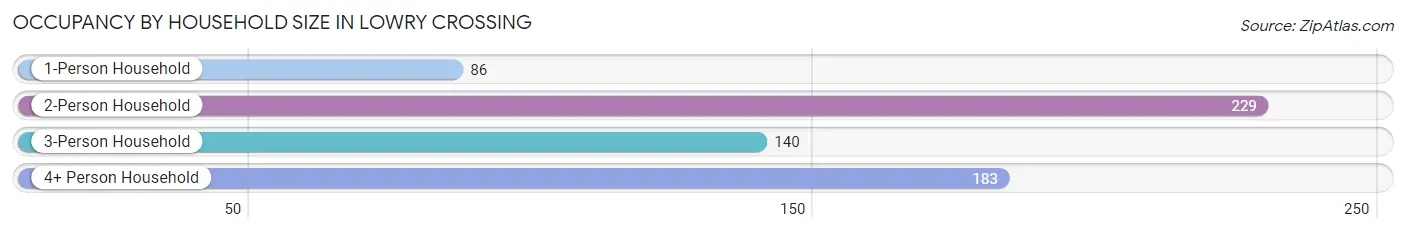
| Household Size | # Housing Units | % Housing Units |
| 1-Person Household | 86 | 13.5% |
| 2-Person Household | 229 | 35.9% |
| 3-Person Household | 140 | 21.9% |
| 4+ Person Household | 183 | 28.7% |
| Total Housing Units | 638 | 100.0% |
Occupancy by Ownership by Household Size in Lowry Crossing
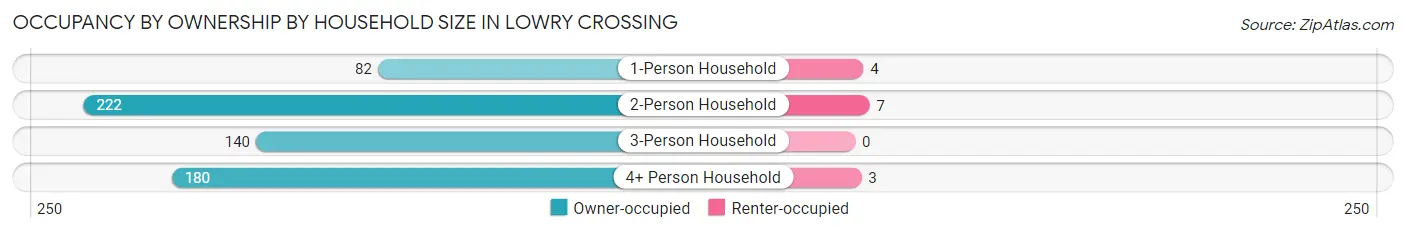
| Household Size | Owner-occupied | Renter-occupied |
| 1-Person Household | 82 (95.4%) | 4 (4.6%) |
| 2-Person Household | 222 (96.9%) | 7 (3.1%) |
| 3-Person Household | 140 (100.0%) | 0 (0.0%) |
| 4+ Person Household | 180 (98.4%) | 3 (1.6%) |
| Total Housing Units | 624 (97.8%) | 14 (2.2%) |
Occupancy by Educational Attainment in Lowry Crossing
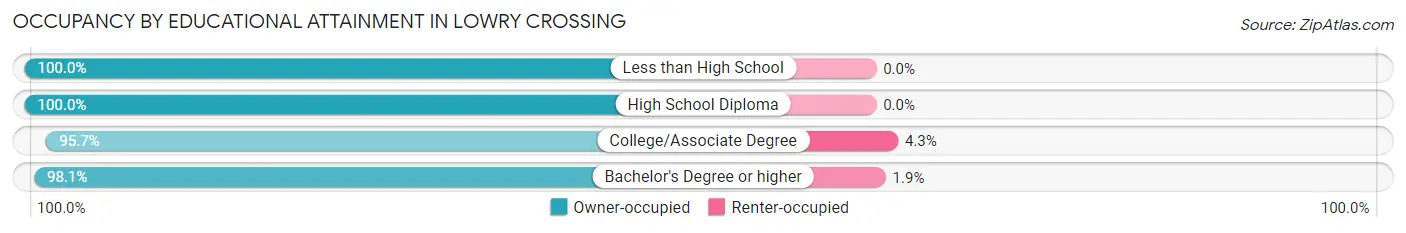
| Household Size | Owner-occupied | Renter-occupied |
| Less than High School | 80 (100.0%) | 0 (0.0%) |
| High School Diploma | 114 (100.0%) | 0 (0.0%) |
| College/Associate Degree | 221 (95.7%) | 10 (4.3%) |
| Bachelor's Degree or higher | 209 (98.1%) | 4 (1.9%) |
Occupancy by Age of Householder in Lowry Crossing
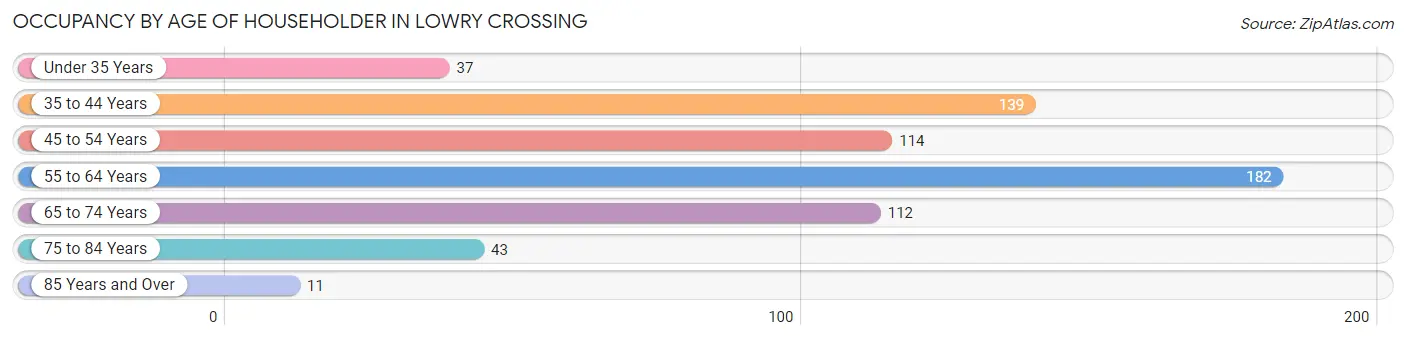
| Age Bracket | # Households | % Households |
| Under 35 Years | 37 | 5.8% |
| 35 to 44 Years | 139 | 21.8% |
| 45 to 54 Years | 114 | 17.9% |
| 55 to 64 Years | 182 | 28.5% |
| 65 to 74 Years | 112 | 17.5% |
| 75 to 84 Years | 43 | 6.7% |
| 85 Years and Over | 11 | 1.7% |
| Total | 638 | 100.0% |
Housing Finances in Lowry Crossing
Median Income by Occupancy in Lowry Crossing
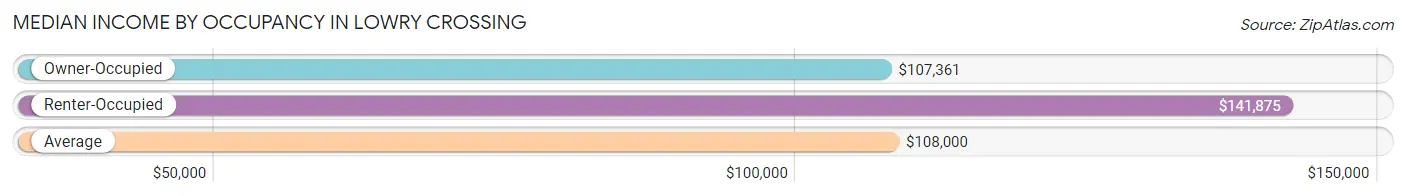
| Occupancy Type | # Households | Median Income |
| Owner-Occupied | 624 (97.8%) | $107,361 |
| Renter-Occupied | 14 (2.2%) | $141,875 |
| Average | 638 (100.0%) | $108,000 |
Occupancy by Householder Income Bracket in Lowry Crossing
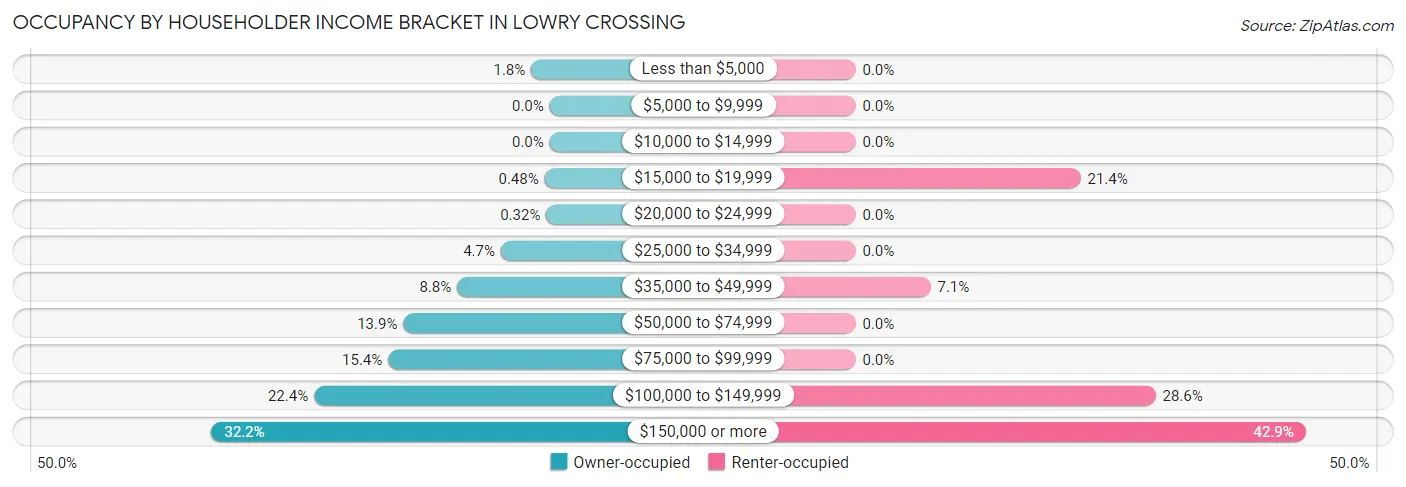
| Income Bracket | Owner-occupied | Renter-occupied |
| Less than $5,000 | 11 (1.8%) | 0 (0.0%) |
| $5,000 to $9,999 | 0 (0.0%) | 0 (0.0%) |
| $10,000 to $14,999 | 0 (0.0%) | 0 (0.0%) |
| $15,000 to $19,999 | 3 (0.5%) | 3 (21.4%) |
| $20,000 to $24,999 | 2 (0.3%) | 0 (0.0%) |
| $25,000 to $34,999 | 29 (4.6%) | 0 (0.0%) |
| $35,000 to $49,999 | 55 (8.8%) | 1 (7.1%) |
| $50,000 to $74,999 | 87 (13.9%) | 0 (0.0%) |
| $75,000 to $99,999 | 96 (15.4%) | 0 (0.0%) |
| $100,000 to $149,999 | 140 (22.4%) | 4 (28.6%) |
| $150,000 or more | 201 (32.2%) | 6 (42.9%) |
| Total | 624 (100.0%) | 14 (100.0%) |
Monthly Housing Cost Tiers in Lowry Crossing
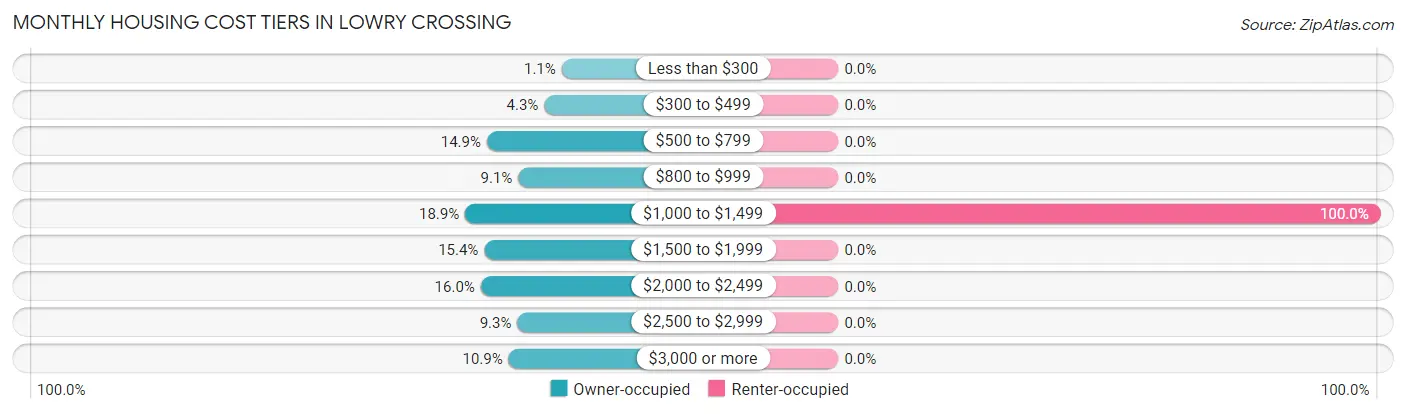
| Monthly Cost | Owner-occupied | Renter-occupied |
| Less than $300 | 7 (1.1%) | 0 (0.0%) |
| $300 to $499 | 27 (4.3%) | 0 (0.0%) |
| $500 to $799 | 93 (14.9%) | 0 (0.0%) |
| $800 to $999 | 57 (9.1%) | 0 (0.0%) |
| $1,000 to $1,499 | 118 (18.9%) | 14 (100.0%) |
| $1,500 to $1,999 | 96 (15.4%) | 0 (0.0%) |
| $2,000 to $2,499 | 100 (16.0%) | 0 (0.0%) |
| $2,500 to $2,999 | 58 (9.3%) | 0 (0.0%) |
| $3,000 or more | 68 (10.9%) | 0 (0.0%) |
| Total | 624 (100.0%) | 14 (100.0%) |
Physical Housing Characteristics in Lowry Crossing
Housing Structures in Lowry Crossing
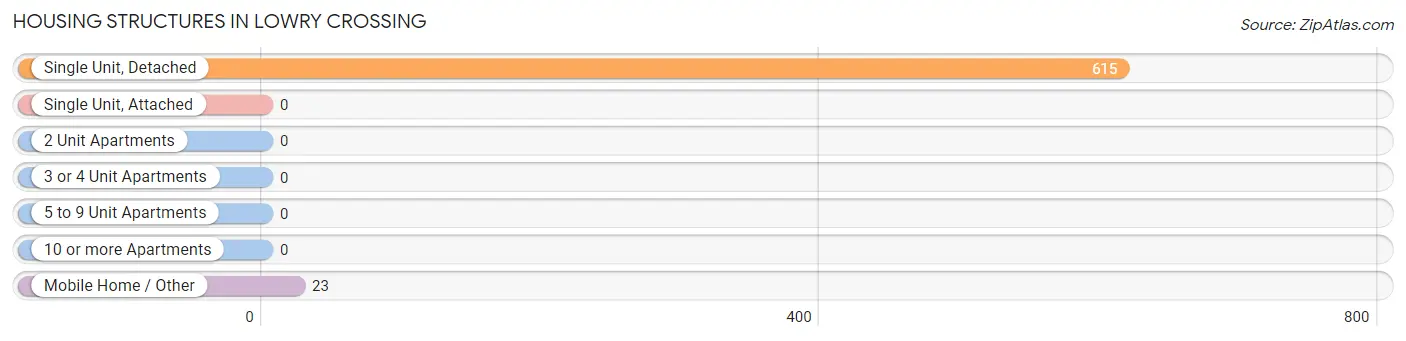
| Structure Type | # Housing Units | % Housing Units |
| Single Unit, Detached | 615 | 96.4% |
| Single Unit, Attached | 0 | 0.0% |
| 2 Unit Apartments | 0 | 0.0% |
| 3 or 4 Unit Apartments | 0 | 0.0% |
| 5 to 9 Unit Apartments | 0 | 0.0% |
| 10 or more Apartments | 0 | 0.0% |
| Mobile Home / Other | 23 | 3.6% |
| Total | 638 | 100.0% |
Housing Structures by Occupancy in Lowry Crossing
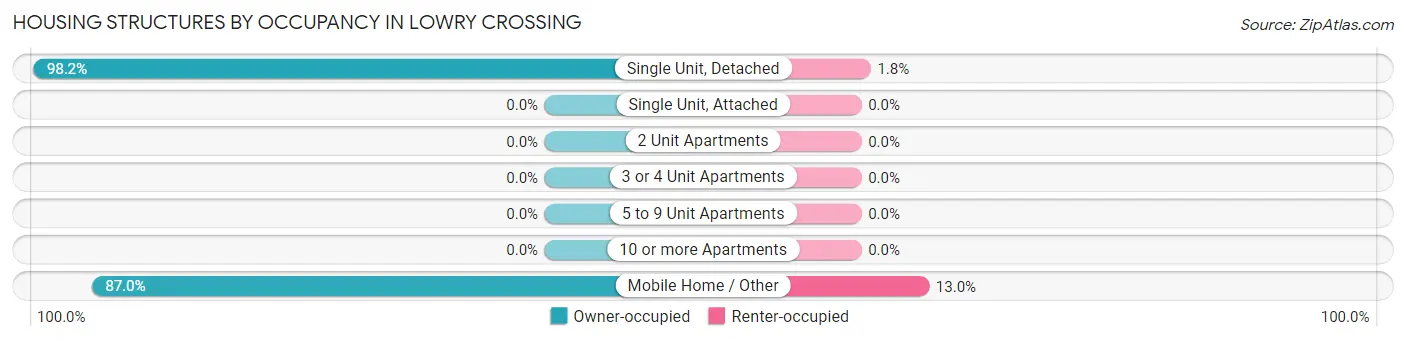
| Structure Type | Owner-occupied | Renter-occupied |
| Single Unit, Detached | 604 (98.2%) | 11 (1.8%) |
| Single Unit, Attached | 0 (0.0%) | 0 (0.0%) |
| 2 Unit Apartments | 0 (0.0%) | 0 (0.0%) |
| 3 or 4 Unit Apartments | 0 (0.0%) | 0 (0.0%) |
| 5 to 9 Unit Apartments | 0 (0.0%) | 0 (0.0%) |
| 10 or more Apartments | 0 (0.0%) | 0 (0.0%) |
| Mobile Home / Other | 20 (87.0%) | 3 (13.0%) |
| Total | 624 (97.8%) | 14 (2.2%) |
Housing Structures by Number of Rooms in Lowry Crossing
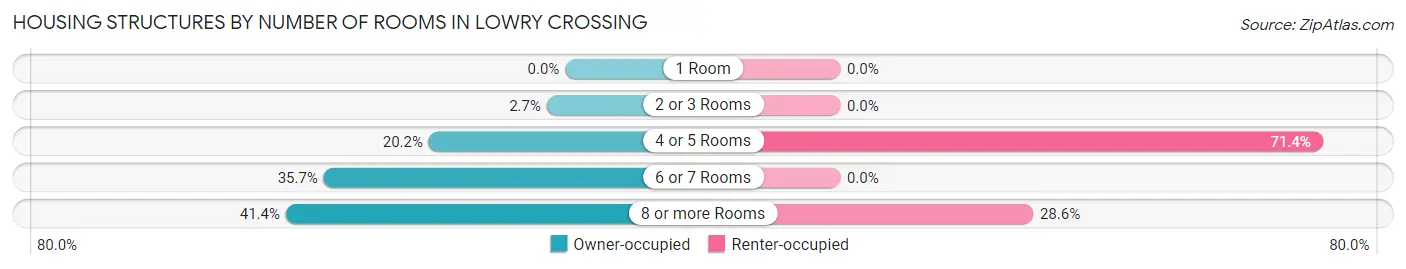
| Number of Rooms | Owner-occupied | Renter-occupied |
| 1 Room | 0 (0.0%) | 0 (0.0%) |
| 2 or 3 Rooms | 17 (2.7%) | 0 (0.0%) |
| 4 or 5 Rooms | 126 (20.2%) | 10 (71.4%) |
| 6 or 7 Rooms | 223 (35.7%) | 0 (0.0%) |
| 8 or more Rooms | 258 (41.3%) | 4 (28.6%) |
| Total | 624 (100.0%) | 14 (100.0%) |
Housing Structure by Heating Type in Lowry Crossing
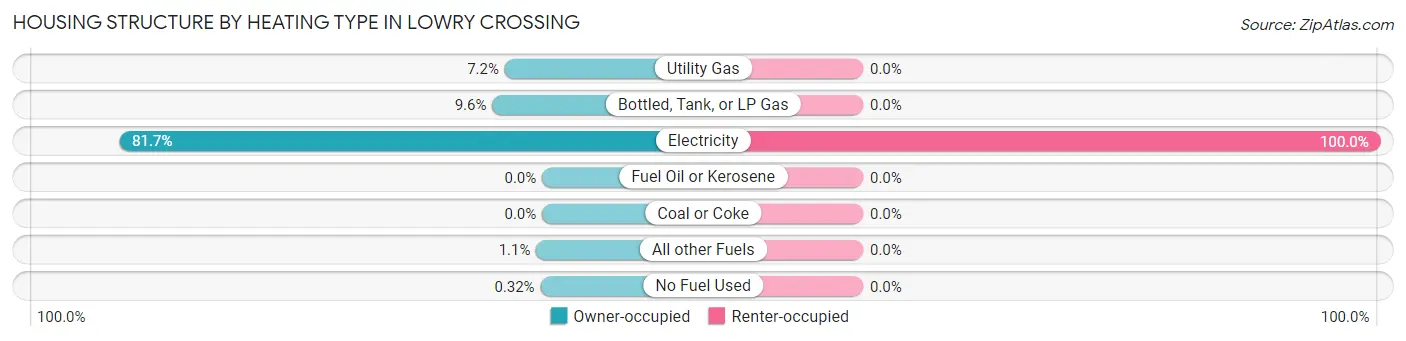
| Heating Type | Owner-occupied | Renter-occupied |
| Utility Gas | 45 (7.2%) | 0 (0.0%) |
| Bottled, Tank, or LP Gas | 60 (9.6%) | 0 (0.0%) |
| Electricity | 510 (81.7%) | 14 (100.0%) |
| Fuel Oil or Kerosene | 0 (0.0%) | 0 (0.0%) |
| Coal or Coke | 0 (0.0%) | 0 (0.0%) |
| All other Fuels | 7 (1.1%) | 0 (0.0%) |
| No Fuel Used | 2 (0.3%) | 0 (0.0%) |
| Total | 624 (100.0%) | 14 (100.0%) |
Household Vehicle Usage in Lowry Crossing
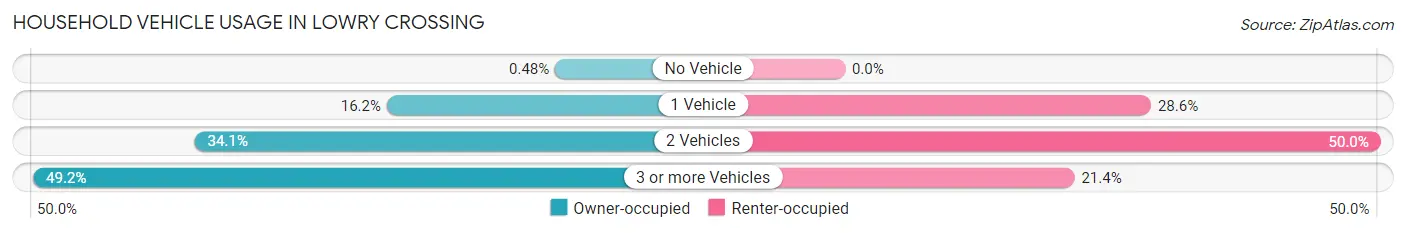
| Vehicles per Household | Owner-occupied | Renter-occupied |
| No Vehicle | 3 (0.5%) | 0 (0.0%) |
| 1 Vehicle | 101 (16.2%) | 4 (28.6%) |
| 2 Vehicles | 213 (34.1%) | 7 (50.0%) |
| 3 or more Vehicles | 307 (49.2%) | 3 (21.4%) |
| Total | 624 (100.0%) | 14 (100.0%) |
Real Estate & Mortgages in Lowry Crossing
Real Estate and Mortgage Overview in Lowry Crossing
| Characteristic | Without Mortgage | With Mortgage |
| Housing Units | 231 | 393 |
| Median Property Value | $313,000 | $331,700 |
| Median Household Income | $106,375 | $144 |
| Monthly Housing Costs | $820 | $68 |
| Real Estate Taxes | $3,671 | $5 |
Property Value by Mortgage Status in Lowry Crossing
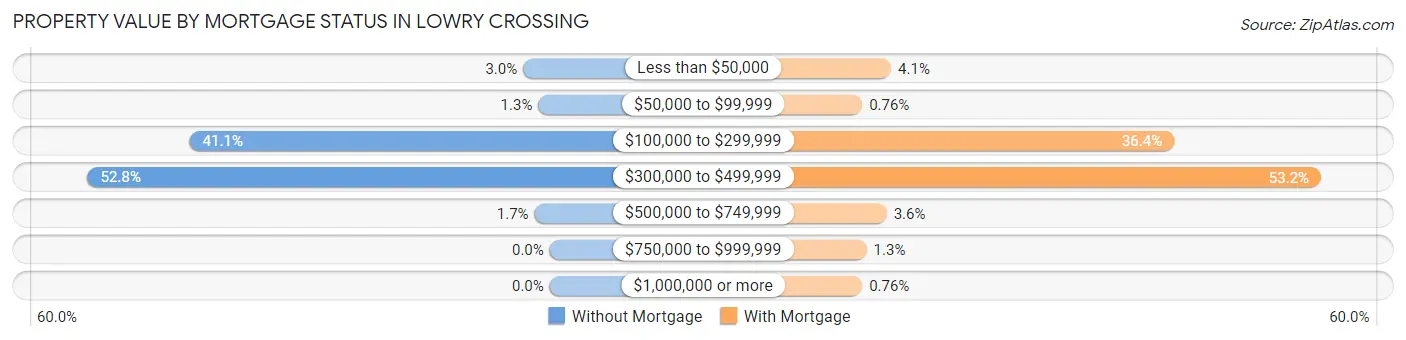
| Property Value | Without Mortgage | With Mortgage |
| Less than $50,000 | 7 (3.0%) | 16 (4.1%) |
| $50,000 to $99,999 | 3 (1.3%) | 3 (0.8%) |
| $100,000 to $299,999 | 95 (41.1%) | 143 (36.4%) |
| $300,000 to $499,999 | 122 (52.8%) | 209 (53.2%) |
| $500,000 to $749,999 | 4 (1.7%) | 14 (3.6%) |
| $750,000 to $999,999 | 0 (0.0%) | 5 (1.3%) |
| $1,000,000 or more | 0 (0.0%) | 3 (0.8%) |
| Total | 231 (100.0%) | 393 (100.0%) |
Household Income by Mortgage Status in Lowry Crossing
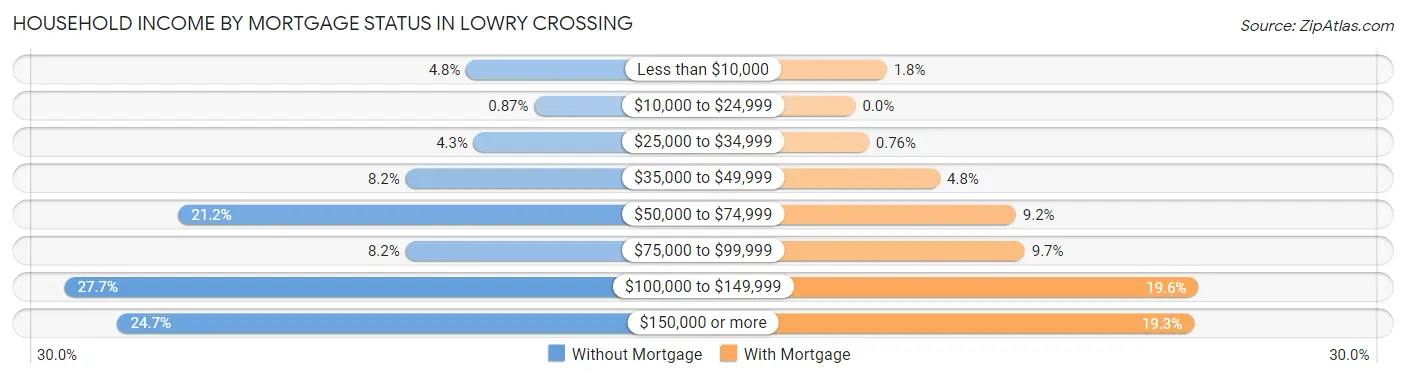
| Household Income | Without Mortgage | With Mortgage |
| Less than $10,000 | 11 (4.8%) | 7 (1.8%) |
| $10,000 to $24,999 | 2 (0.9%) | 0 (0.0%) |
| $25,000 to $34,999 | 10 (4.3%) | 3 (0.8%) |
| $35,000 to $49,999 | 19 (8.2%) | 19 (4.8%) |
| $50,000 to $74,999 | 49 (21.2%) | 36 (9.2%) |
| $75,000 to $99,999 | 19 (8.2%) | 38 (9.7%) |
| $100,000 to $149,999 | 64 (27.7%) | 77 (19.6%) |
| $150,000 or more | 57 (24.7%) | 76 (19.3%) |
| Total | 231 (100.0%) | 393 (100.0%) |
Property Value to Household Income Ratio in Lowry Crossing
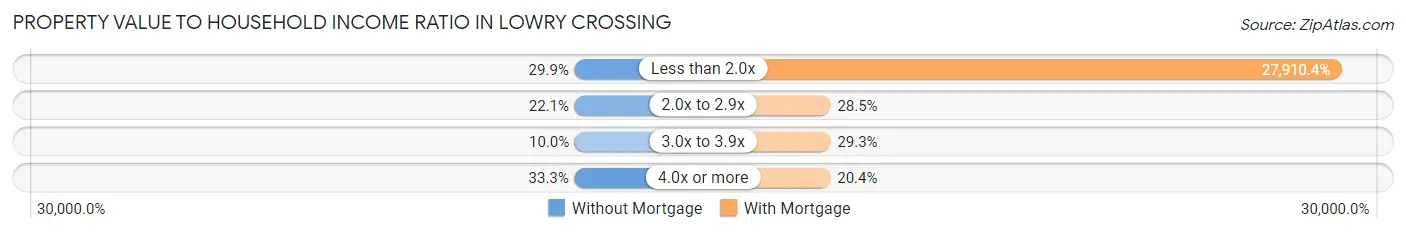
| Value-to-Income Ratio | Without Mortgage | With Mortgage |
| Less than 2.0x | 69 (29.9%) | 109,688 (27,910.4%) |
| 2.0x to 2.9x | 51 (22.1%) | 112 (28.5%) |
| 3.0x to 3.9x | 23 (10.0%) | 115 (29.3%) |
| 4.0x or more | 77 (33.3%) | 80 (20.4%) |
| Total | 231 (100.0%) | 393 (100.0%) |
Real Estate Taxes by Mortgage Status in Lowry Crossing
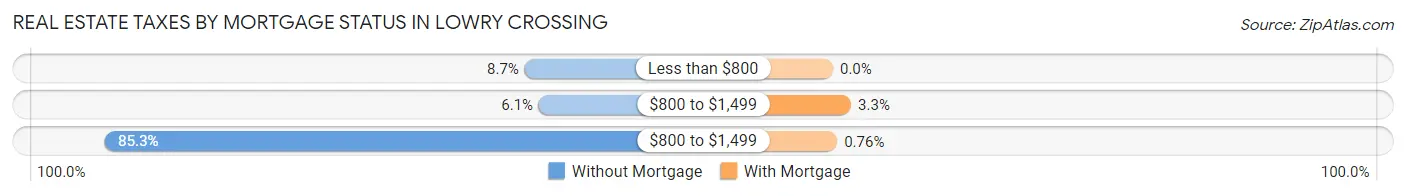
| Property Taxes | Without Mortgage | With Mortgage |
| Less than $800 | 20 (8.7%) | 0 (0.0%) |
| $800 to $1,499 | 14 (6.1%) | 13 (3.3%) |
| $800 to $1,499 | 197 (85.3%) | 3 (0.8%) |
| Total | 231 (100.0%) | 393 (100.0%) |
Health & Disability in Lowry Crossing
Health Insurance Coverage by Age in Lowry Crossing
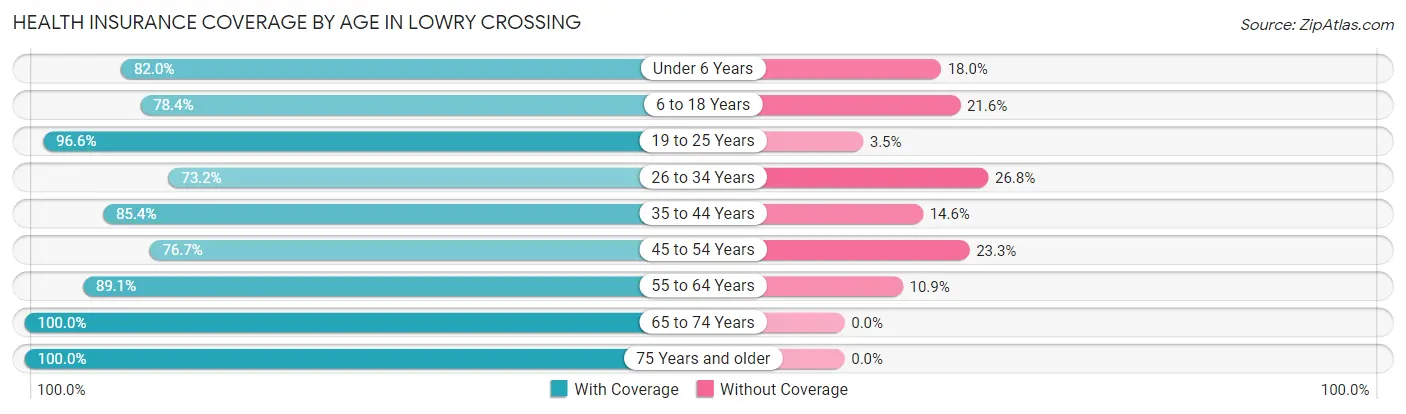
| Age Bracket | With Coverage | Without Coverage |
| Under 6 Years | 73 (82.0%) | 16 (18.0%) |
| 6 to 18 Years | 240 (78.4%) | 66 (21.6%) |
| 19 to 25 Years | 112 (96.6%) | 4 (3.5%) |
| 26 to 34 Years | 112 (73.2%) | 41 (26.8%) |
| 35 to 44 Years | 257 (85.4%) | 44 (14.6%) |
| 45 to 54 Years | 191 (76.7%) | 58 (23.3%) |
| 55 to 64 Years | 312 (89.1%) | 38 (10.9%) |
| 65 to 74 Years | 203 (100.0%) | 0 (0.0%) |
| 75 Years and older | 118 (100.0%) | 0 (0.0%) |
| Total | 1,618 (85.8%) | 267 (14.2%) |
Health Insurance Coverage by Citizenship Status in Lowry Crossing
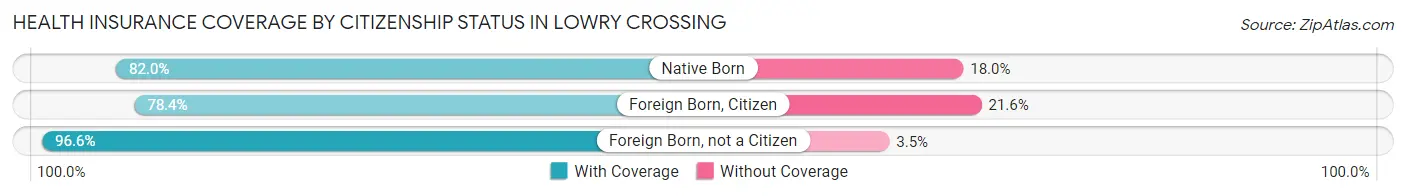
| Citizenship Status | With Coverage | Without Coverage |
| Native Born | 73 (82.0%) | 16 (18.0%) |
| Foreign Born, Citizen | 240 (78.4%) | 66 (21.6%) |
| Foreign Born, not a Citizen | 112 (96.6%) | 4 (3.5%) |
Health Insurance Coverage by Household Income in Lowry Crossing
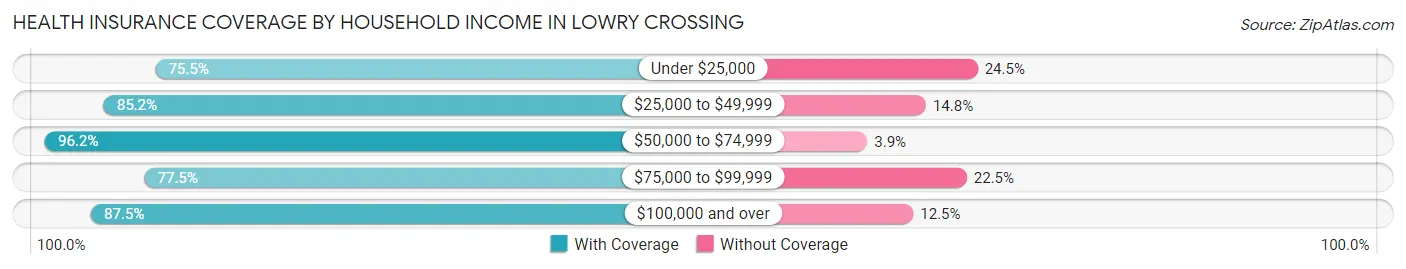
| Household Income | With Coverage | Without Coverage |
| Under $25,000 | 40 (75.5%) | 13 (24.5%) |
| $25,000 to $49,999 | 218 (85.2%) | 38 (14.8%) |
| $50,000 to $74,999 | 150 (96.2%) | 6 (3.8%) |
| $75,000 to $99,999 | 255 (77.5%) | 74 (22.5%) |
| $100,000 and over | 955 (87.5%) | 136 (12.5%) |
Public vs Private Health Insurance Coverage by Age in Lowry Crossing
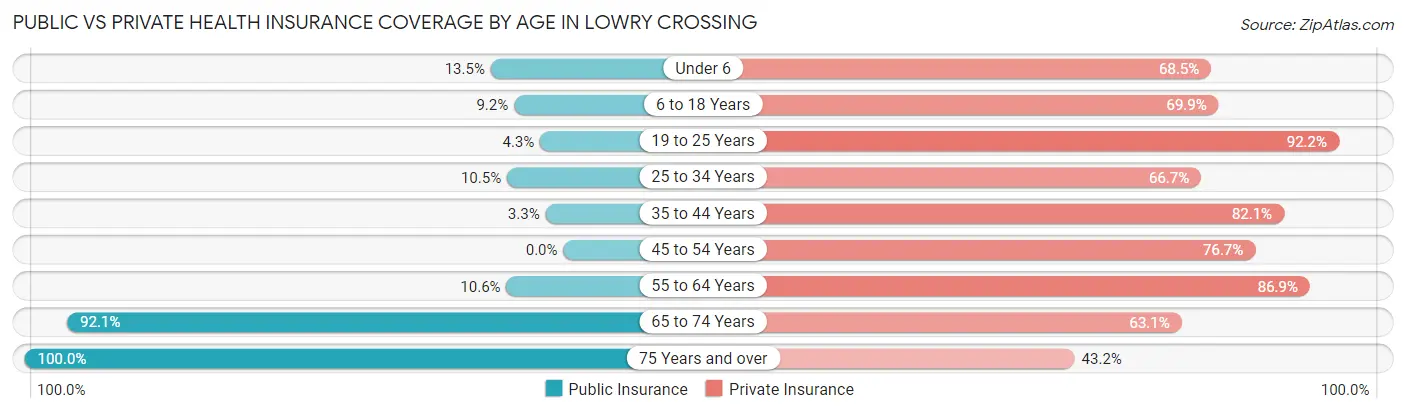
| Age Bracket | Public Insurance | Private Insurance |
| Under 6 | 12 (13.5%) | 61 (68.5%) |
| 6 to 18 Years | 28 (9.1%) | 214 (69.9%) |
| 19 to 25 Years | 5 (4.3%) | 107 (92.2%) |
| 25 to 34 Years | 16 (10.5%) | 102 (66.7%) |
| 35 to 44 Years | 10 (3.3%) | 247 (82.1%) |
| 45 to 54 Years | 0 (0.0%) | 191 (76.7%) |
| 55 to 64 Years | 37 (10.6%) | 304 (86.9%) |
| 65 to 74 Years | 187 (92.1%) | 128 (63.0%) |
| 75 Years and over | 118 (100.0%) | 51 (43.2%) |
| Total | 413 (21.9%) | 1,405 (74.5%) |
Disability Status by Sex by Age in Lowry Crossing
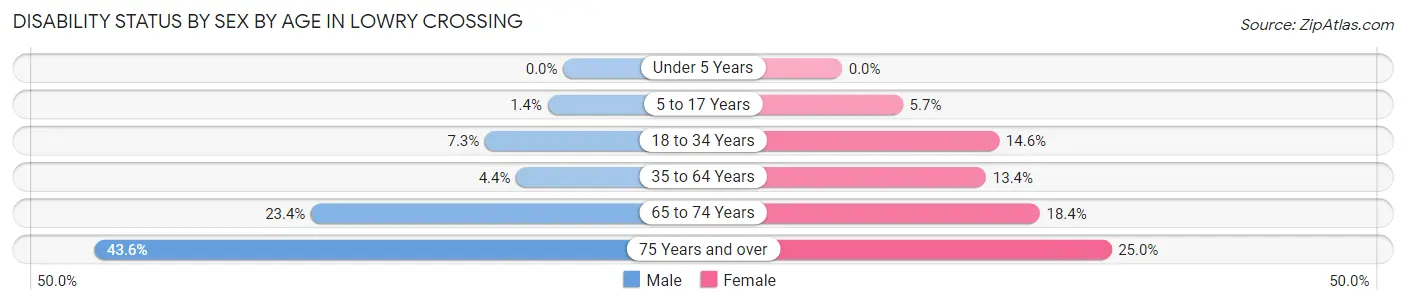
| Age Bracket | Male | Female |
| Under 5 Years | 0 (0.0%) | 0 (0.0%) |
| 5 to 17 Years | 2 (1.4%) | 7 (5.7%) |
| 18 to 34 Years | 13 (7.3%) | 21 (14.6%) |
| 35 to 64 Years | 21 (4.4%) | 56 (13.4%) |
| 65 to 74 Years | 22 (23.4%) | 20 (18.3%) |
| 75 Years and over | 27 (43.5%) | 14 (25.0%) |
Disability Class by Sex by Age in Lowry Crossing
Disability Class: Hearing Difficulty
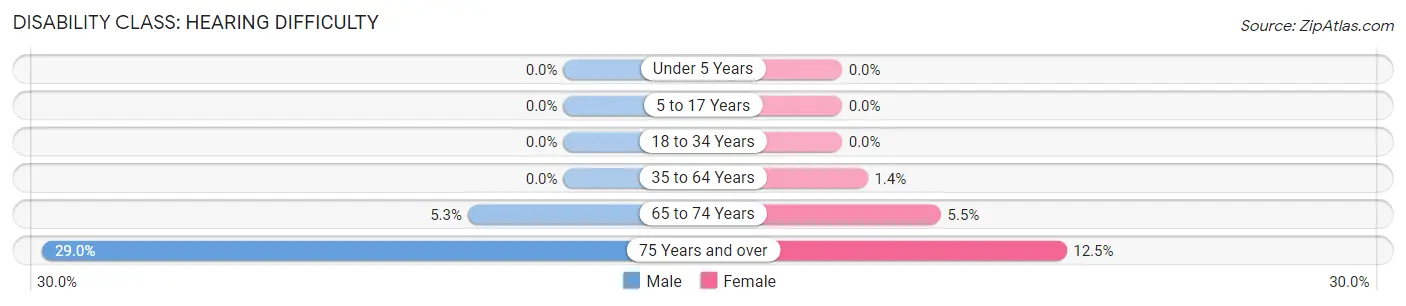
| Age Bracket | Male | Female |
| Under 5 Years | 0 (0.0%) | 0 (0.0%) |
| 5 to 17 Years | 0 (0.0%) | 0 (0.0%) |
| 18 to 34 Years | 0 (0.0%) | 0 (0.0%) |
| 35 to 64 Years | 0 (0.0%) | 6 (1.4%) |
| 65 to 74 Years | 5 (5.3%) | 6 (5.5%) |
| 75 Years and over | 18 (29.0%) | 7 (12.5%) |
Disability Class: Vision Difficulty
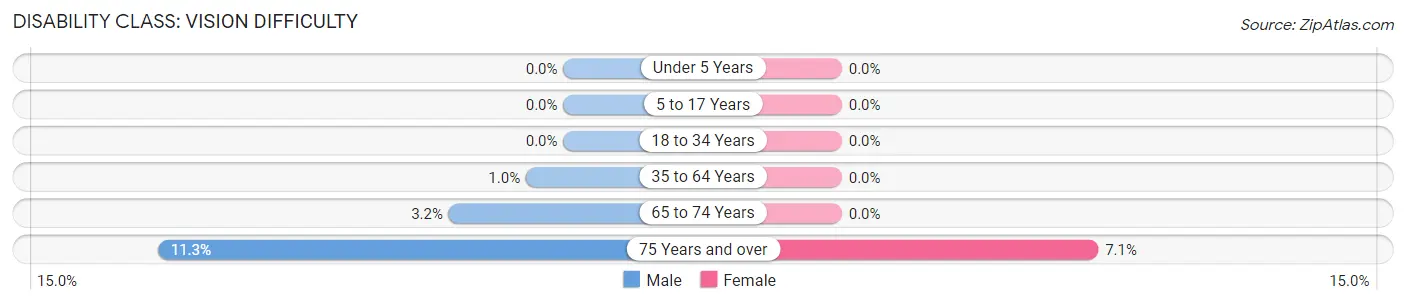
| Age Bracket | Male | Female |
| Under 5 Years | 0 (0.0%) | 0 (0.0%) |
| 5 to 17 Years | 0 (0.0%) | 0 (0.0%) |
| 18 to 34 Years | 0 (0.0%) | 0 (0.0%) |
| 35 to 64 Years | 5 (1.0%) | 0 (0.0%) |
| 65 to 74 Years | 3 (3.2%) | 0 (0.0%) |
| 75 Years and over | 7 (11.3%) | 4 (7.1%) |
Disability Class: Cognitive Difficulty
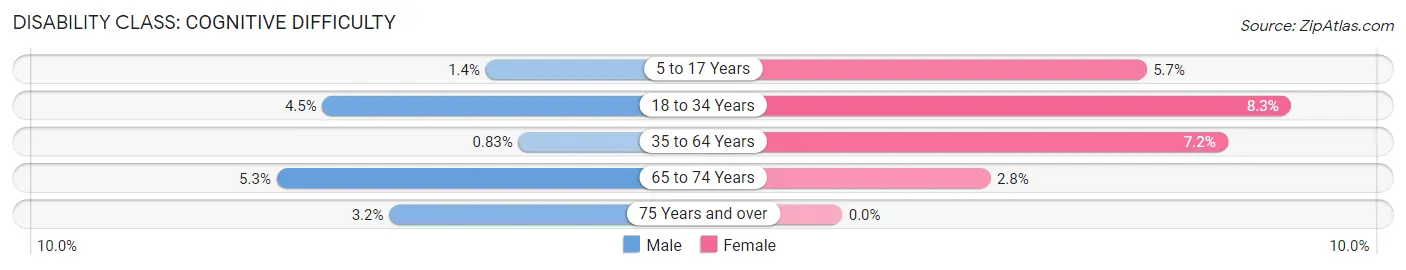
| Age Bracket | Male | Female |
| 5 to 17 Years | 2 (1.4%) | 7 (5.7%) |
| 18 to 34 Years | 8 (4.5%) | 12 (8.3%) |
| 35 to 64 Years | 4 (0.8%) | 30 (7.2%) |
| 65 to 74 Years | 5 (5.3%) | 3 (2.8%) |
| 75 Years and over | 2 (3.2%) | 0 (0.0%) |
Disability Class: Ambulatory Difficulty
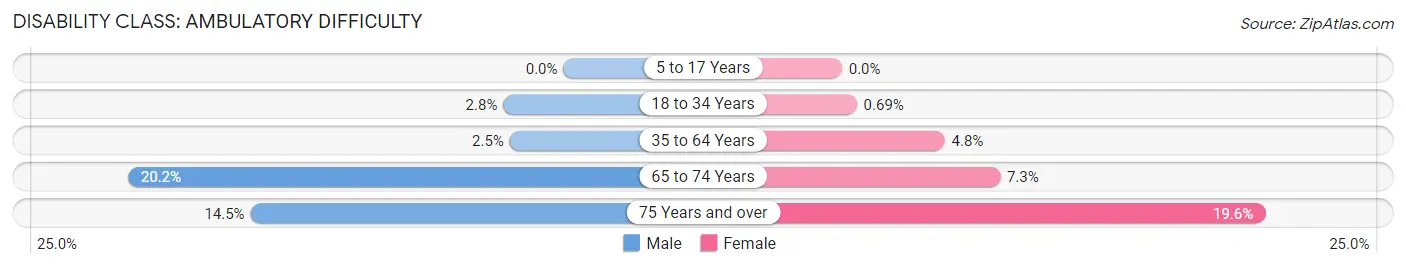
| Age Bracket | Male | Female |
| 5 to 17 Years | 0 (0.0%) | 0 (0.0%) |
| 18 to 34 Years | 5 (2.8%) | 1 (0.7%) |
| 35 to 64 Years | 12 (2.5%) | 20 (4.8%) |
| 65 to 74 Years | 19 (20.2%) | 8 (7.3%) |
| 75 Years and over | 9 (14.5%) | 11 (19.6%) |
Disability Class: Self-Care Difficulty
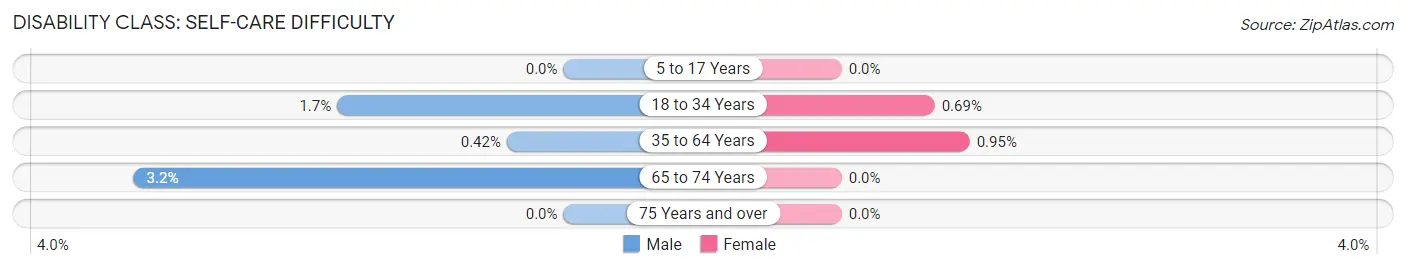
| Age Bracket | Male | Female |
| 5 to 17 Years | 0 (0.0%) | 0 (0.0%) |
| 18 to 34 Years | 3 (1.7%) | 1 (0.7%) |
| 35 to 64 Years | 2 (0.4%) | 4 (0.9%) |
| 65 to 74 Years | 3 (3.2%) | 0 (0.0%) |
| 75 Years and over | 0 (0.0%) | 0 (0.0%) |
Technology Access in Lowry Crossing
Computing Device Access in Lowry Crossing
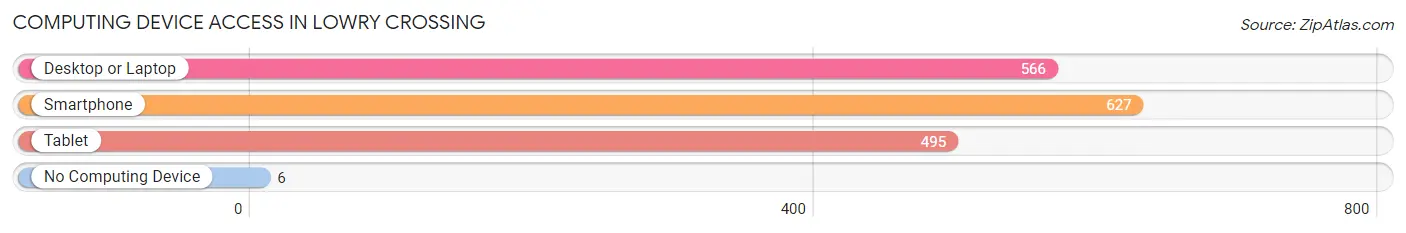
| Device Type | # Households | % Households |
| Desktop or Laptop | 566 | 88.7% |
| Smartphone | 627 | 98.3% |
| Tablet | 495 | 77.6% |
| No Computing Device | 6 | 0.9% |
| Total | 638 | 100.0% |
Internet Access in Lowry Crossing
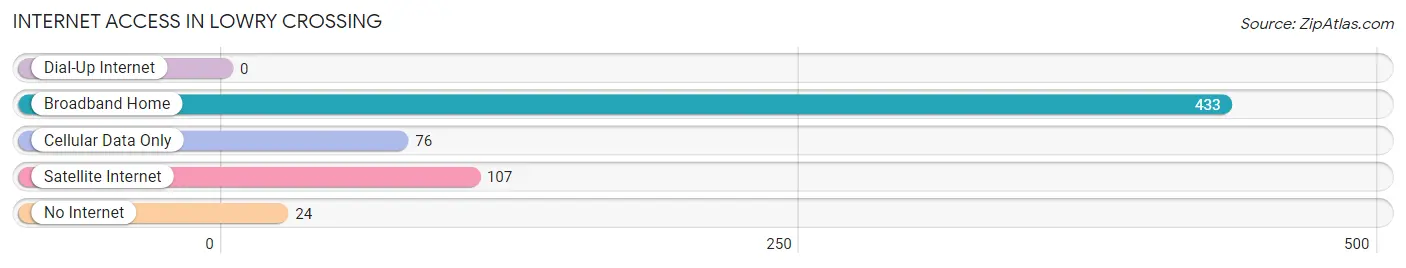
| Internet Type | # Households | % Households |
| Dial-Up Internet | 0 | 0.0% |
| Broadband Home | 433 | 67.9% |
| Cellular Data Only | 76 | 11.9% |
| Satellite Internet | 107 | 16.8% |
| No Internet | 24 | 3.8% |
| Total | 638 | 100.0% |
Lowry Crossing Summary
Lowry Crossing is a small unincorporated community located in Collin County, Texas, United States. It is situated about 25 miles northeast of Dallas and is part of the Dallas-Fort Worth metropolitan area. The population of Lowry Crossing was estimated to be around 1,000 in 2020.
History
Lowry Crossing was founded in the late 1800s by a man named William Lowry. He was a farmer and rancher who moved to the area from Tennessee. He purchased land in the area and began to build a small community. The town was named after him and was originally known as Lowry's Crossing.
The town grew slowly over the years and by the early 1900s, it had a population of around 200 people. The town was mostly made up of farmers and ranchers who raised cattle and grew crops. The town also had a few stores, a post office, and a school.
In the 1950s, the town began to grow rapidly as more people moved to the area. The population increased to around 500 people by the 1960s. The town also began to attract more businesses, including a grocery store, a gas station, and a few restaurants.
Geography
Lowry Crossing is located in Collin County, Texas, about 25 miles northeast of Dallas. It is situated in the rolling hills of the Blackland Prairie region of Texas. The town is surrounded by farmland and is located near the Trinity River.
The climate in Lowry Crossing is hot and humid in the summer and mild in the winter. The average temperature in the summer is around 90 degrees Fahrenheit and the average temperature in the winter is around 50 degrees Fahrenheit.
Economy
The economy of Lowry Crossing is largely based on agriculture. The town is surrounded by farmland and many of the residents are involved in farming and ranching. The town also has a few small businesses, including a grocery store, a gas station, and a few restaurants.
Demographics
The population of Lowry Crossing was estimated to be around 1,000 in 2020. The town is mostly made up of white residents, with a small percentage of African American and Hispanic residents. The median household income in Lowry Crossing is around $50,000 and the median home value is around $150,000.
Conclusion
Lowry Crossing is a small unincorporated community located in Collin County, Texas. It was founded in the late 1800s by William Lowry and has grown to a population of around 1,000 in 2020. The town is mostly made up of white residents and is surrounded by farmland. The economy of Lowry Crossing is largely based on agriculture and the town also has a few small businesses.
Common Questions
What is Per Capita Income in Lowry Crossing?
Per Capita income in Lowry Crossing is $43,072.
What is the Median Family Income in Lowry Crossing?
Median Family Income in Lowry Crossing is $108,333.
What is the Median Household income in Lowry Crossing?
Median Household Income in Lowry Crossing is $108,000.
What is Income or Wage Gap in Lowry Crossing?
Income or Wage Gap in Lowry Crossing is 27.4%.
Women in Lowry Crossing earn 72.6 cents for every dollar earned by a man.
What is Inequality or Gini Index in Lowry Crossing?
Inequality or Gini Index in Lowry Crossing is 0.33.
What is the Total Population of Lowry Crossing?
Total Population of Lowry Crossing is 1,885.
What is the Total Male Population of Lowry Crossing?
Total Male Population of Lowry Crossing is 1,000.
What is the Total Female Population of Lowry Crossing?
Total Female Population of Lowry Crossing is 885.
What is the Ratio of Males per 100 Females in Lowry Crossing?
There are 112.99 Males per 100 Females in Lowry Crossing.
What is the Ratio of Females per 100 Males in Lowry Crossing?
There are 88.50 Females per 100 Males in Lowry Crossing.
What is the Median Population Age in Lowry Crossing?
Median Population Age in Lowry Crossing is 44.0 Years.
What is the Average Family Size in Lowry Crossing
Average Family Size in Lowry Crossing is 3.2 People.
What is the Average Household Size in Lowry Crossing
Average Household Size in Lowry Crossing is 3.0 People.
How Large is the Labor Force in Lowry Crossing?
There are 1,055 People in the Labor Forcein in Lowry Crossing.
What is the Percentage of People in the Labor Force in Lowry Crossing?
66.5% of People are in the Labor Force in Lowry Crossing.
What is the Unemployment Rate in Lowry Crossing?
Unemployment Rate in Lowry Crossing is 3.7%.