Yoakum, TX Map & Demographics
Yoakum Map
Yoakum Overview
$24,567
PER CAPITA INCOME
$57,925
AVG FAMILY INCOME
$44,627
AVG HOUSEHOLD INCOME
21.9%
WAGE / INCOME GAP [ % ]
78.1¢/ $1
WAGE / INCOME GAP [ $ ]
0.42
INEQUALITY / GINI INDEX
5,841
TOTAL POPULATION
2,899
MALE POPULATION
2,942
FEMALE POPULATION
98.54
MALES / 100 FEMALES
101.48
FEMALES / 100 MALES
36.2
MEDIAN AGE
3.2
AVG FAMILY SIZE
2.6
AVG HOUSEHOLD SIZE
2,596
LABOR FORCE [ PEOPLE ]
58.1%
PERCENT IN LABOR FORCE
0.5%
UNEMPLOYMENT RATE
Yoakum Zip Codes
Yoakum Area Codes
Income in Yoakum
Income Overview in Yoakum
Per Capita Income in Yoakum is $24,567, while median incomes of families and households are $57,925 and $44,627 respectively.
| Characteristic | Number | Measure |
| Per Capita Income | 5,841 | $24,567 |
| Median Family Income | 1,476 | $57,925 |
| Mean Family Income | 1,476 | $72,502 |
| Median Household Income | 2,173 | $44,627 |
| Mean Household Income | 2,173 | $62,539 |
| Income Deficit | 1,476 | $0 |
| Wage / Income Gap (%) | 5,841 | 21.86% |
| Wage / Income Gap ($) | 5,841 | 78.14¢ per $1 |
| Gini / Inequality Index | 5,841 | 0.42 |
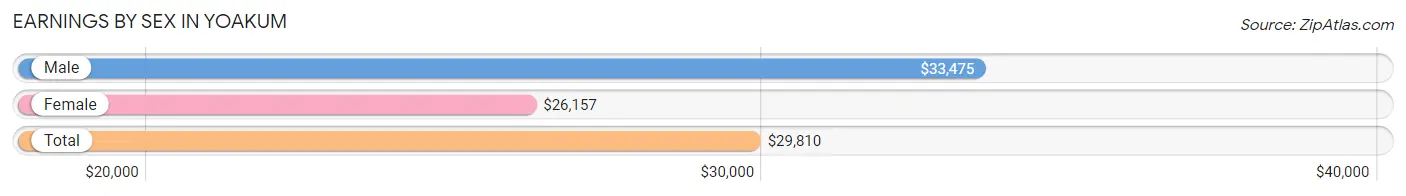
Earnings by Sex in Yoakum
Average Earnings in Yoakum are $29,810, $33,475 for men and $26,157 for women, a difference of 21.9%.
| Sex | Number | Average Earnings |
| Male | 1,461 (54.7%) | $33,475 |
| Female | 1,209 (45.3%) | $26,157 |
| Total | 2,670 (100.0%) | $29,810 |
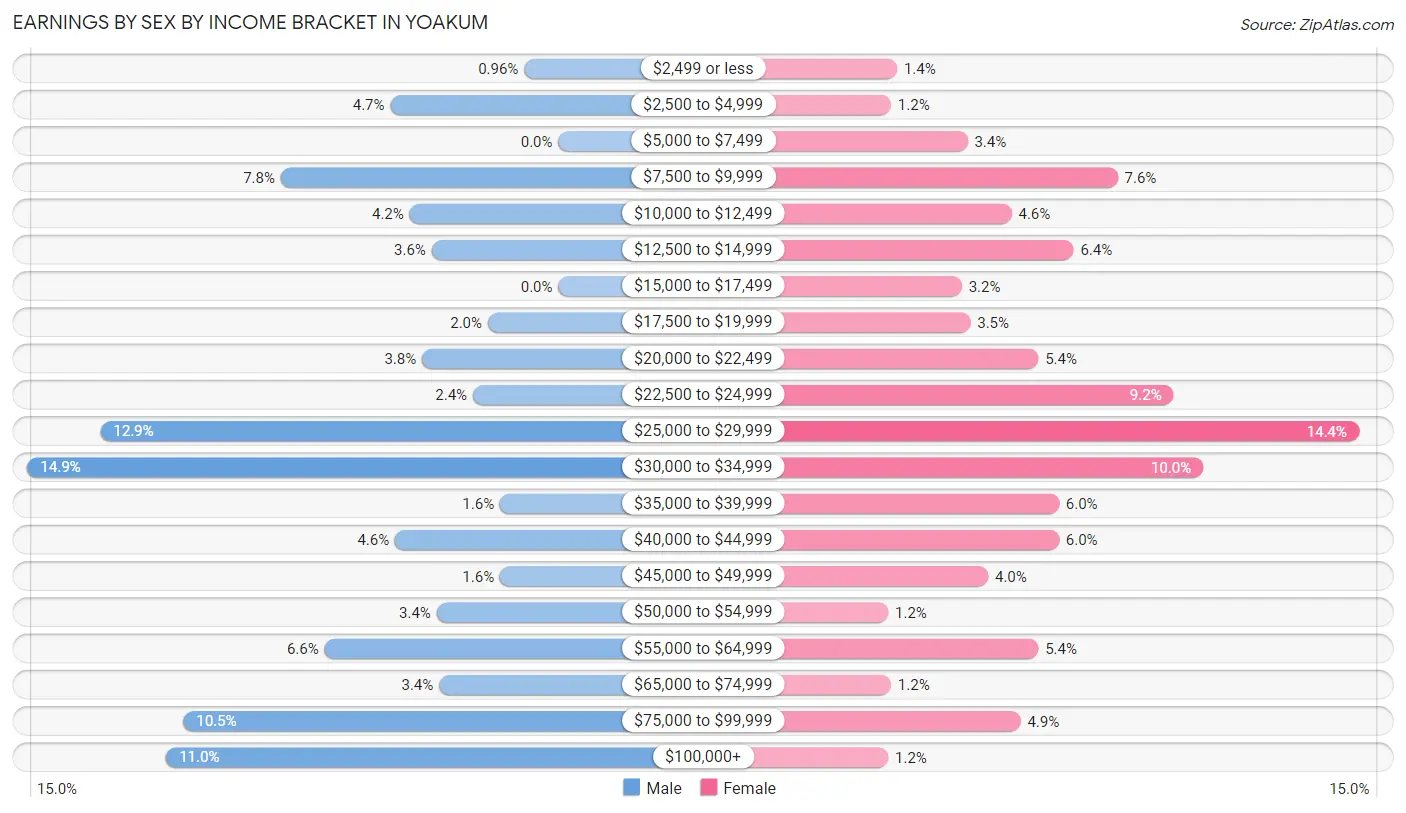
Earnings by Sex by Income Bracket in Yoakum
The most common earnings brackets in Yoakum are $30,000 to $34,999 for men (218 | 14.9%) and $25,000 to $29,999 for women (174 | 14.4%).
| Income | Male | Female |
| $2,499 or less | 14 (1.0%) | 17 (1.4%) |
| $2,500 to $4,999 | 69 (4.7%) | 15 (1.2%) |
| $5,000 to $7,499 | 0 (0.0%) | 41 (3.4%) |
| $7,500 to $9,999 | 114 (7.8%) | 92 (7.6%) |
| $10,000 to $12,499 | 61 (4.2%) | 56 (4.6%) |
| $12,500 to $14,999 | 52 (3.6%) | 77 (6.4%) |
| $15,000 to $17,499 | 0 (0.0%) | 39 (3.2%) |
| $17,500 to $19,999 | 29 (2.0%) | 42 (3.5%) |
| $20,000 to $22,499 | 56 (3.8%) | 65 (5.4%) |
| $22,500 to $24,999 | 35 (2.4%) | 111 (9.2%) |
| $25,000 to $29,999 | 188 (12.9%) | 174 (14.4%) |
| $30,000 to $34,999 | 218 (14.9%) | 121 (10.0%) |
| $35,000 to $39,999 | 24 (1.6%) | 72 (6.0%) |
| $40,000 to $44,999 | 67 (4.6%) | 72 (6.0%) |
| $45,000 to $49,999 | 24 (1.6%) | 48 (4.0%) |
| $50,000 to $54,999 | 50 (3.4%) | 14 (1.2%) |
| $55,000 to $64,999 | 96 (6.6%) | 65 (5.4%) |
| $65,000 to $74,999 | 49 (3.4%) | 15 (1.2%) |
| $75,000 to $99,999 | 154 (10.5%) | 59 (4.9%) |
| $100,000+ | 161 (11.0%) | 14 (1.2%) |
| Total | 1,461 (100.0%) | 1,209 (100.0%) |
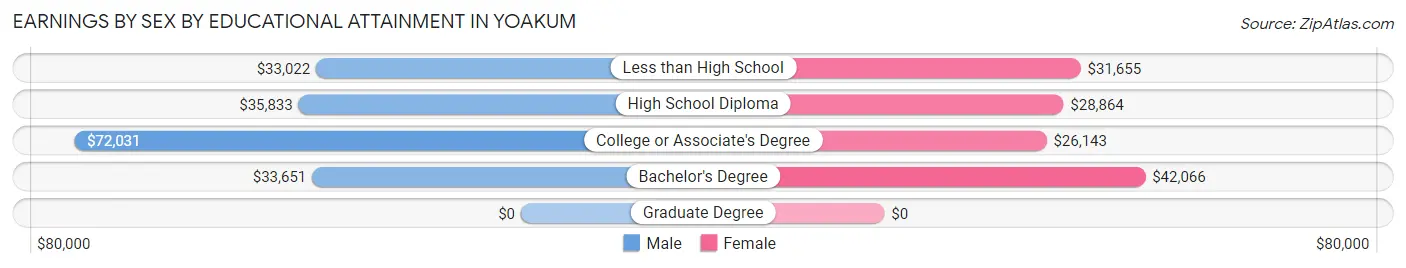
Earnings by Sex by Educational Attainment in Yoakum
Average earnings in Yoakum are $37,083 for men and $30,719 for women, a difference of 17.2%. Men with an educational attainment of college or associate's degree enjoy the highest average annual earnings of $72,031, while those with less than high school education earn the least with $33,022. Women with an educational attainment of bachelor's degree earn the most with the average annual earnings of $42,066, while those with college or associate's degree education have the smallest earnings of $26,143.
| Educational Attainment | Male Income | Female Income |
| Less than High School | $33,022 | $31,655 |
| High School Diploma | $35,833 | $28,864 |
| College or Associate's Degree | $72,031 | $26,143 |
| Bachelor's Degree | $33,651 | $42,066 |
| Graduate Degree | - | - |
| Total | $37,083 | $30,719 |
Family Income in Yoakum
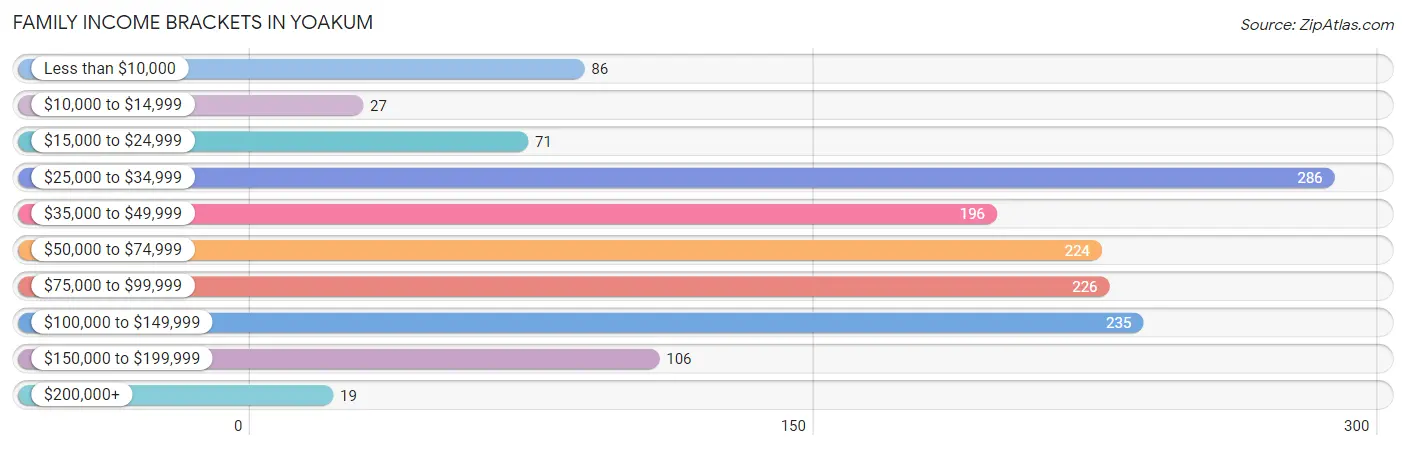
Family Income Brackets in Yoakum
According to the Yoakum family income data, there are 286 families falling into the $25,000 to $34,999 income range, which is the most common income bracket and makes up 19.4% of all families. Conversely, the $200,000+ income bracket is the least frequent group with only 19 families (1.3%) belonging to this category.
| Income Bracket | # Families | % Families |
| Less than $10,000 | 86 | 5.8% |
| $10,000 to $14,999 | 27 | 1.8% |
| $15,000 to $24,999 | 71 | 4.8% |
| $25,000 to $34,999 | 286 | 19.4% |
| $35,000 to $49,999 | 196 | 13.3% |
| $50,000 to $74,999 | 224 | 15.2% |
| $75,000 to $99,999 | 226 | 15.3% |
| $100,000 to $149,999 | 235 | 15.9% |
| $150,000 to $199,999 | 106 | 7.2% |
| $200,000+ | 19 | 1.3% |
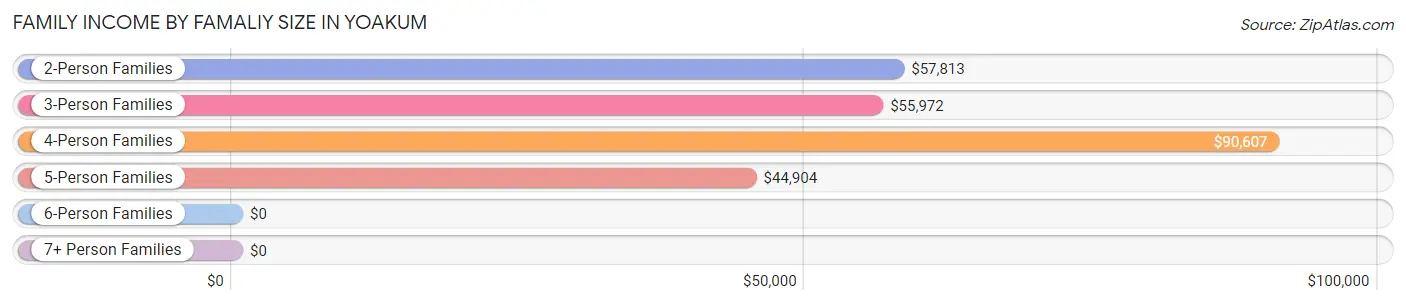
Family Income by Famaliy Size in Yoakum
4-person families (337 | 22.8%) account for the highest median family income in Yoakum with $90,607 per family, while 2-person families (732 | 49.6%) have the highest median income of $28,906 per family member.
| Income Bracket | # Families | Median Income |
| 2-Person Families | 732 (49.6%) | $57,813 |
| 3-Person Families | 253 (17.1%) | $55,972 |
| 4-Person Families | 337 (22.8%) | $90,607 |
| 5-Person Families | 117 (7.9%) | $44,904 |
| 6-Person Families | 37 (2.5%) | $0 |
| 7+ Person Families | 0 (0.0%) | $0 |
| Total | 1,476 (100.0%) | $57,925 |
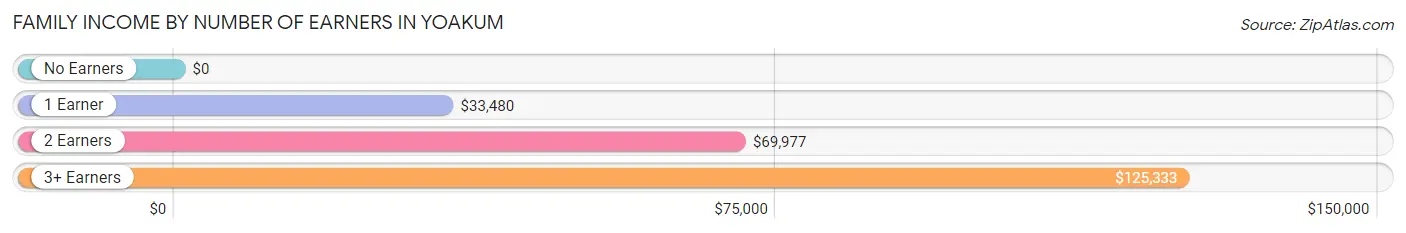
Family Income by Number of Earners in Yoakum
| Number of Earners | # Families | Median Income |
| No Earners | 203 (13.8%) | $0 |
| 1 Earner | 626 (42.4%) | $33,480 |
| 2 Earners | 555 (37.6%) | $69,977 |
| 3+ Earners | 92 (6.2%) | $125,333 |
| Total | 1,476 (100.0%) | $57,925 |
Household Income in Yoakum
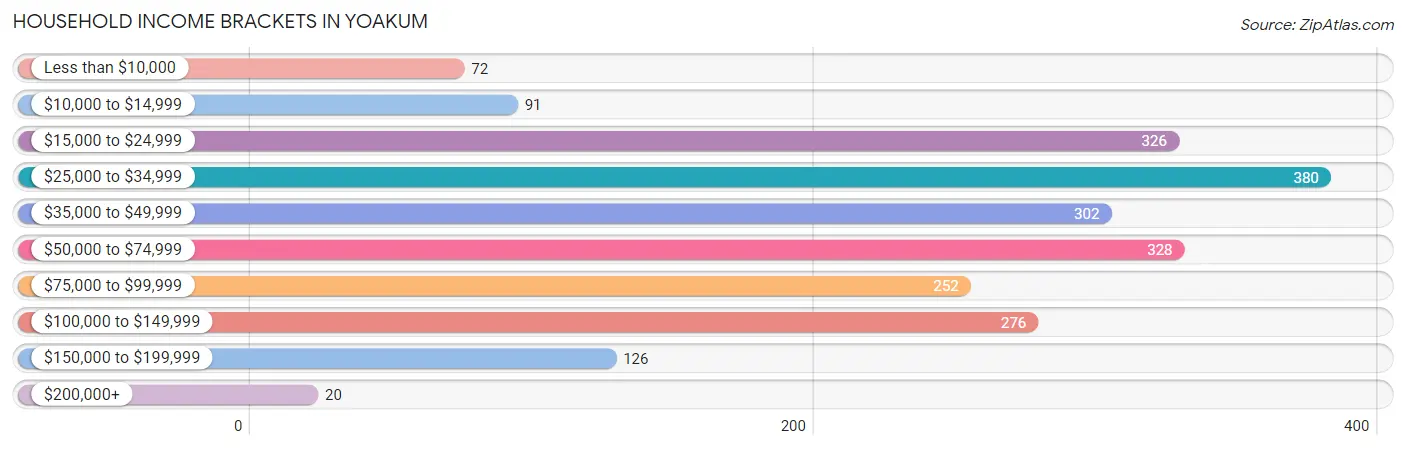
Household Income Brackets in Yoakum
With 380 households falling in the category, the $25,000 to $34,999 income range is the most frequent in Yoakum, accounting for 17.5% of all households. In contrast, only 20 households (0.9%) fall into the $200,000+ income bracket, making it the least populous group.
| Income Bracket | # Households | % Households |
| Less than $10,000 | 72 | 3.3% |
| $10,000 to $14,999 | 91 | 4.2% |
| $15,000 to $24,999 | 326 | 15.0% |
| $25,000 to $34,999 | 380 | 17.5% |
| $35,000 to $49,999 | 302 | 13.9% |
| $50,000 to $74,999 | 328 | 15.1% |
| $75,000 to $99,999 | 252 | 11.6% |
| $100,000 to $149,999 | 276 | 12.7% |
| $150,000 to $199,999 | 126 | 5.8% |
| $200,000+ | 20 | 0.9% |
Household Income by Householder Age in Yoakum
The median household income in Yoakum is $44,627, with the highest median household income of $68,750 found in the 45 to 64 years age bracket for the primary householder. A total of 578 households (26.6%) fall into this category. Meanwhile, the 15 to 24 years age bracket for the primary householder has the lowest median household income of $26,847, with 163 households (7.5%) in this group.
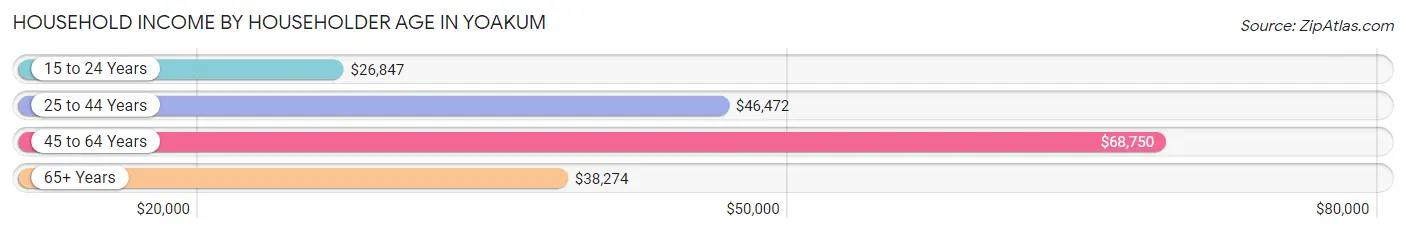
| Income Bracket | # Households | Median Income |
| 15 to 24 Years | 163 (7.5%) | $26,847 |
| 25 to 44 Years | 783 (36.0%) | $46,472 |
| 45 to 64 Years | 578 (26.6%) | $68,750 |
| 65+ Years | 649 (29.9%) | $38,274 |
| Total | 2,173 (100.0%) | $44,627 |
Poverty in Yoakum
Income Below Poverty by Sex and Age in Yoakum
With 12.1% poverty level for males and 16.2% for females among the residents of Yoakum, 15 year old males and 6 to 11 year old females are the most vulnerable to poverty, with 18 males (41.9%) and 81 females (45.0%) in their respective age groups living below the poverty level.
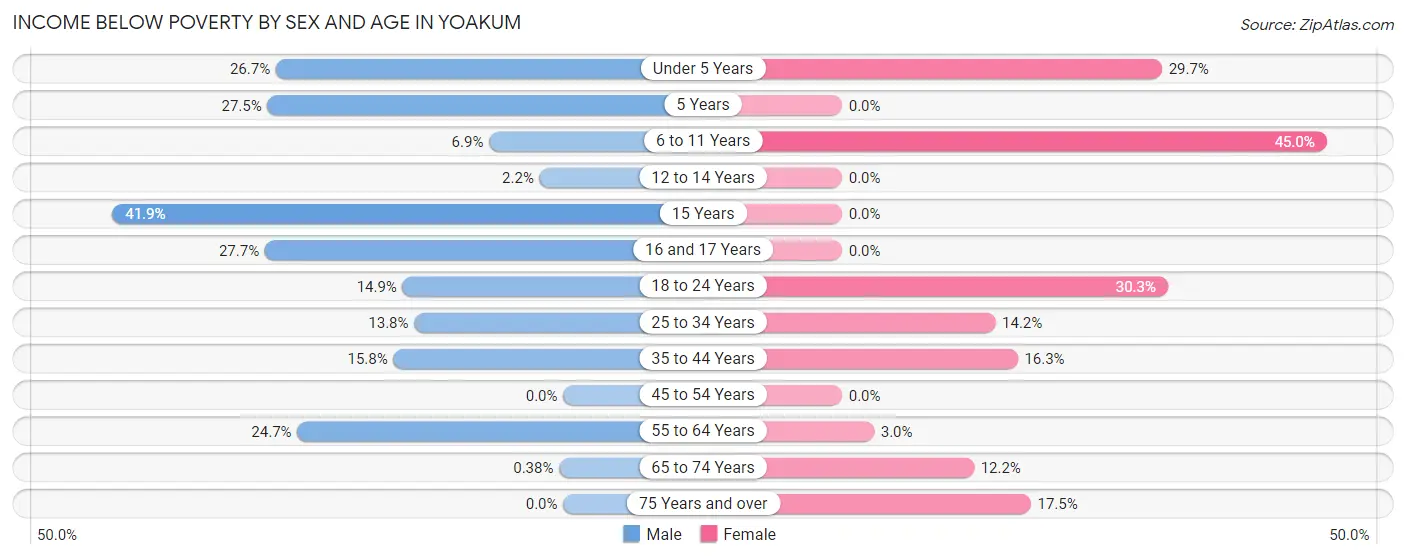
| Age Bracket | Male | Female |
| Under 5 Years | 44 (26.7%) | 76 (29.7%) |
| 5 Years | 14 (27.5%) | 0 (0.0%) |
| 6 to 11 Years | 22 (6.9%) | 81 (45.0%) |
| 12 to 14 Years | 4 (2.2%) | 0 (0.0%) |
| 15 Years | 18 (41.9%) | 0 (0.0%) |
| 16 and 17 Years | 18 (27.7%) | 0 (0.0%) |
| 18 to 24 Years | 41 (14.9%) | 111 (30.2%) |
| 25 to 34 Years | 52 (13.8%) | 40 (14.2%) |
| 35 to 44 Years | 75 (15.8%) | 60 (16.3%) |
| 45 to 54 Years | 0 (0.0%) | 0 (0.0%) |
| 55 to 64 Years | 57 (24.7%) | 11 (3.0%) |
| 65 to 74 Years | 1 (0.4%) | 36 (12.2%) |
| 75 Years and over | 0 (0.0%) | 41 (17.5%) |
| Total | 346 (12.1%) | 456 (16.2%) |
Income Above Poverty by Sex and Age in Yoakum
According to the poverty statistics in Yoakum, males aged 45 to 54 years and females aged 5 years are the age groups that are most secure financially, with 100.0% of males and 100.0% of females in these age groups living above the poverty line.
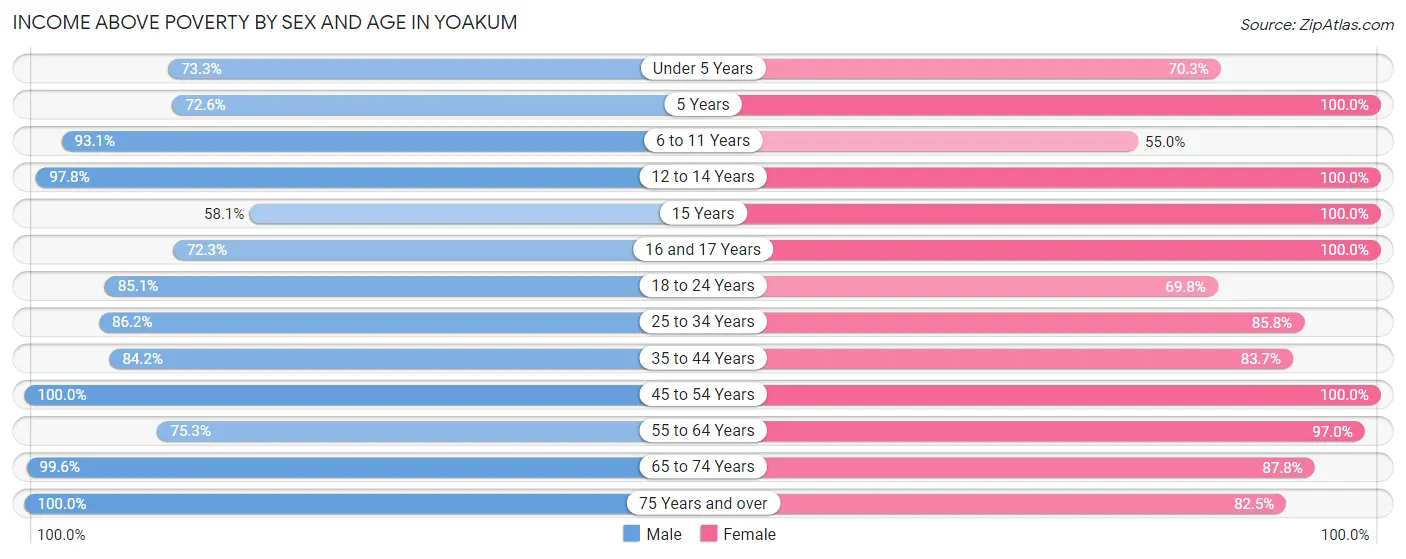
| Age Bracket | Male | Female |
| Under 5 Years | 121 (73.3%) | 180 (70.3%) |
| 5 Years | 37 (72.6%) | 63 (100.0%) |
| 6 to 11 Years | 298 (93.1%) | 99 (55.0%) |
| 12 to 14 Years | 179 (97.8%) | 52 (100.0%) |
| 15 Years | 25 (58.1%) | 59 (100.0%) |
| 16 and 17 Years | 47 (72.3%) | 86 (100.0%) |
| 18 to 24 Years | 234 (85.1%) | 256 (69.8%) |
| 25 to 34 Years | 324 (86.2%) | 241 (85.8%) |
| 35 to 44 Years | 401 (84.2%) | 308 (83.7%) |
| 45 to 54 Years | 273 (100.0%) | 200 (100.0%) |
| 55 to 64 Years | 174 (75.3%) | 359 (97.0%) |
| 65 to 74 Years | 265 (99.6%) | 258 (87.8%) |
| 75 Years and over | 126 (100.0%) | 193 (82.5%) |
| Total | 2,504 (87.9%) | 2,354 (83.8%) |
Income Below Poverty Among Married-Couple Families in Yoakum
The poverty statistics for married-couple families in Yoakum show that 10.2% or 95 of the total 934 families live below the poverty line. Families with 3 or 4 children have the highest poverty rate of 51.5%, comprising of 68 families. On the other hand, families with no children have the lowest poverty rate of 0.3%, which includes 1 families.
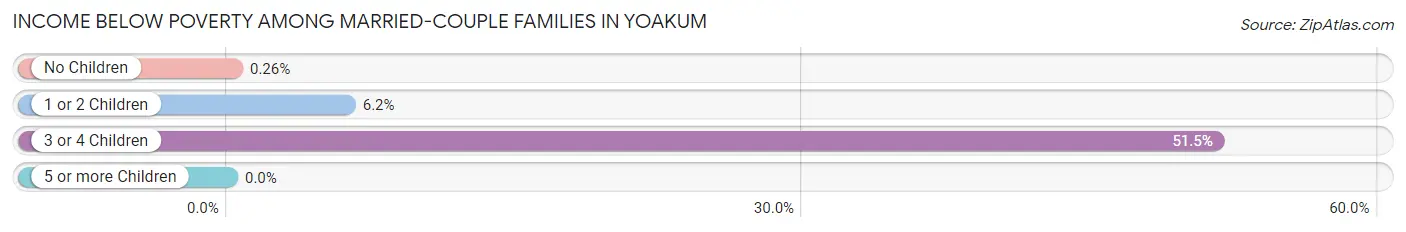
| Children | Above Poverty | Below Poverty |
| No Children | 378 (99.7%) | 1 (0.3%) |
| 1 or 2 Children | 397 (93.9%) | 26 (6.1%) |
| 3 or 4 Children | 64 (48.5%) | 68 (51.5%) |
| 5 or more Children | 0 (0.0%) | 0 (0.0%) |
| Total | 839 (89.8%) | 95 (10.2%) |
Income Below Poverty Among Single-Parent Households in Yoakum
According to the poverty data in Yoakum, 16.2% or 17 single-father households and 18.1% or 79 single-mother households are living below the poverty line. Among single-father households, those with 1 or 2 children have the highest poverty rate, with 17 households (21.5%) experiencing poverty. Likewise, among single-mother households, those with 3 or 4 children have the highest poverty rate, with 20 households (76.9%) falling below the poverty line.
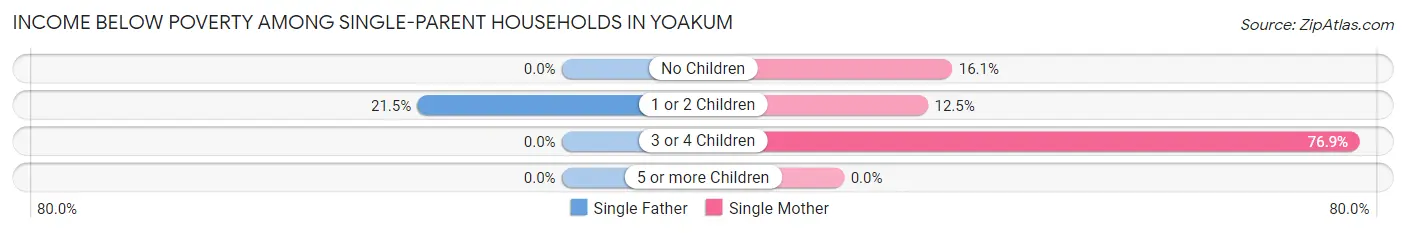
| Children | Single Father | Single Mother |
| No Children | 0 (0.0%) | 34 (16.1%) |
| 1 or 2 Children | 17 (21.5%) | 25 (12.5%) |
| 3 or 4 Children | 0 (0.0%) | 20 (76.9%) |
| 5 or more Children | 0 (0.0%) | 0 (0.0%) |
| Total | 17 (16.2%) | 79 (18.1%) |
Income Below Poverty Among Married-Couple vs Single-Parent Households in Yoakum
The poverty data for Yoakum shows that 95 of the married-couple family households (10.2%) and 96 of the single-parent households (17.7%) are living below the poverty level. Within the married-couple family households, those with 3 or 4 children have the highest poverty rate, with 68 households (51.5%) falling below the poverty line. Among the single-parent households, those with 3 or 4 children have the highest poverty rate, with 20 household (76.9%) living below poverty.
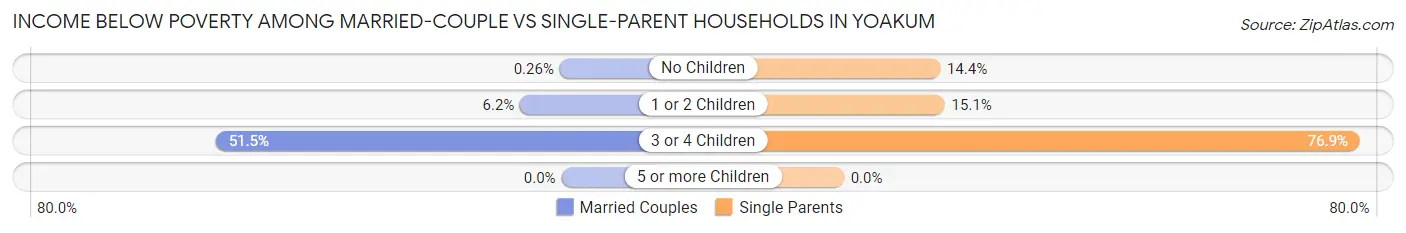
| Children | Married-Couple Families | Single-Parent Households |
| No Children | 1 (0.3%) | 34 (14.3%) |
| 1 or 2 Children | 26 (6.1%) | 42 (15.0%) |
| 3 or 4 Children | 68 (51.5%) | 20 (76.9%) |
| 5 or more Children | 0 (0.0%) | 0 (0.0%) |
| Total | 95 (10.2%) | 96 (17.7%) |
Race in Yoakum
The most populous races in Yoakum are White / Caucasian (3,190 | 54.6%), Hispanic or Latino (2,942 | 50.4%), and Some other Race (1,860 | 31.8%).
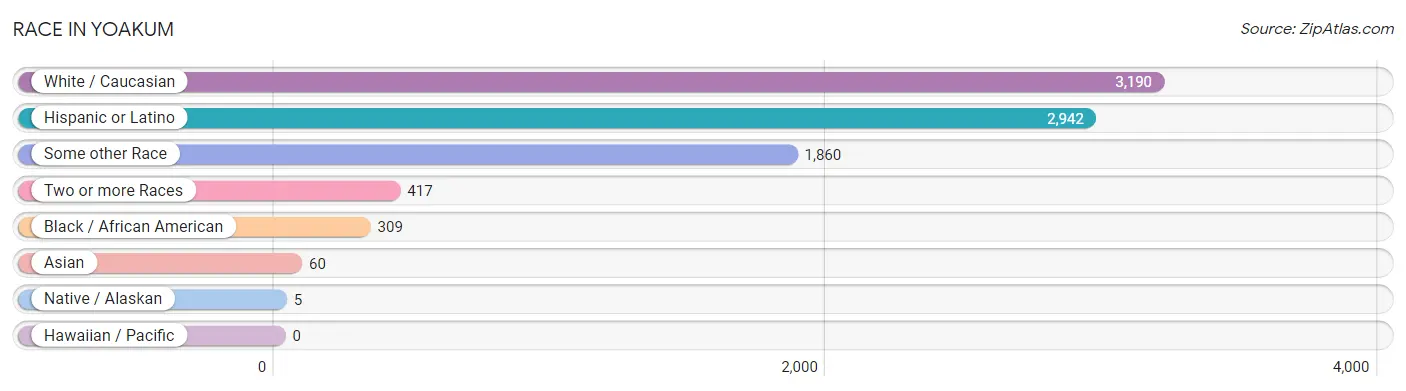
| Race | # Population | % Population |
| Asian | 60 | 1.0% |
| Black / African American | 309 | 5.3% |
| Hawaiian / Pacific | 0 | 0.0% |
| Hispanic or Latino | 2,942 | 50.4% |
| Native / Alaskan | 5 | 0.1% |
| White / Caucasian | 3,190 | 54.6% |
| Two or more Races | 417 | 7.1% |
| Some other Race | 1,860 | 31.8% |
| Total | 5,841 | 100.0% |
Ancestry in Yoakum
The most populous ancestries reported in Yoakum are Mexican (2,843 | 48.7%), Czech (881 | 15.1%), German (755 | 12.9%), Irish (390 | 6.7%), and Polish (202 | 3.5%), together accounting for 86.8% of all Yoakum residents.
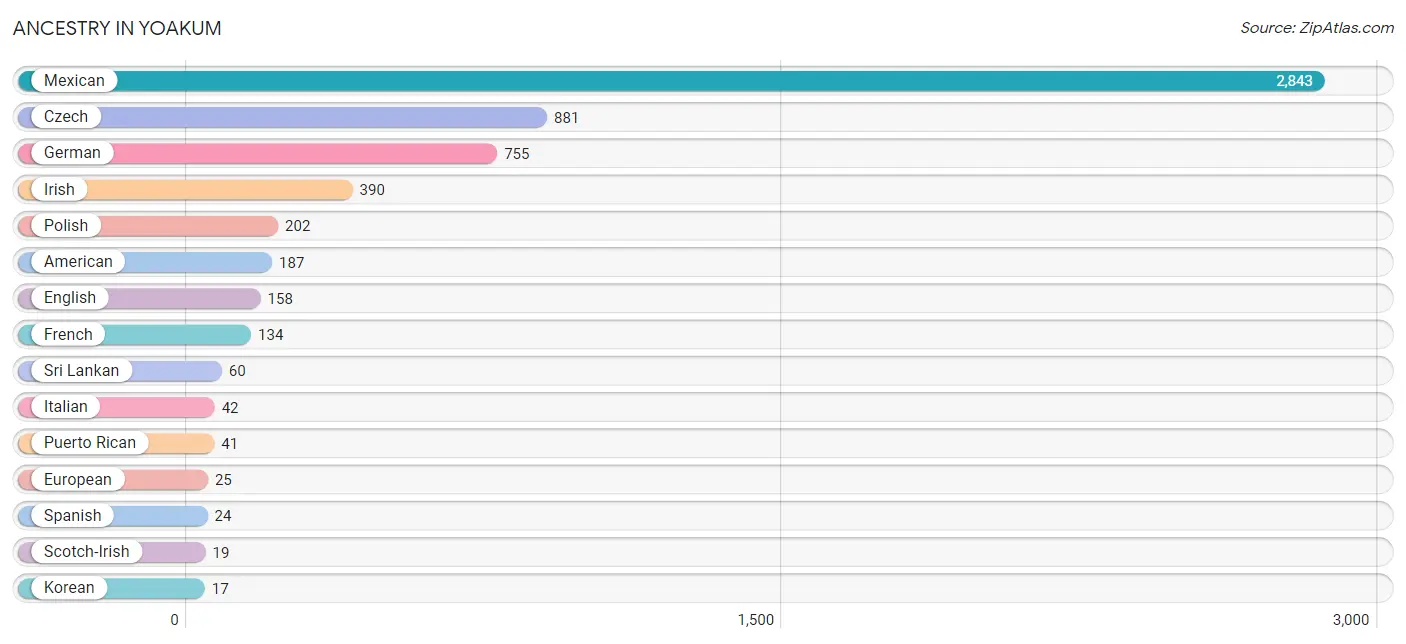
| Ancestry | # Population | % Population |
| American | 187 | 3.2% |
| British | 1 | 0.0% |
| Canadian | 6 | 0.1% |
| Choctaw | 16 | 0.3% |
| Czech | 881 | 15.1% |
| Dutch | 16 | 0.3% |
| English | 158 | 2.7% |
| European | 25 | 0.4% |
| French | 134 | 2.3% |
| German | 755 | 12.9% |
| Indian (Asian) | 1 | 0.0% |
| Irish | 390 | 6.7% |
| Italian | 42 | 0.7% |
| Korean | 17 | 0.3% |
| Mexican | 2,843 | 48.7% |
| Polish | 202 | 3.5% |
| Puerto Rican | 41 | 0.7% |
| Scotch-Irish | 19 | 0.3% |
| Spanish | 24 | 0.4% |
| Spanish American | 12 | 0.2% |
| Sri Lankan | 60 | 1.0% |
| Welsh | 16 | 0.3% | View All 22 Rows |
Immigrants in Yoakum
The most numerous immigrant groups reported in Yoakum came from Central America (613 | 10.5%), Latin America (613 | 10.5%), Mexico (613 | 10.5%), Asia (23 | 0.4%), and South Eastern Asia (23 | 0.4%), together accounting for 32.3% of all Yoakum residents.
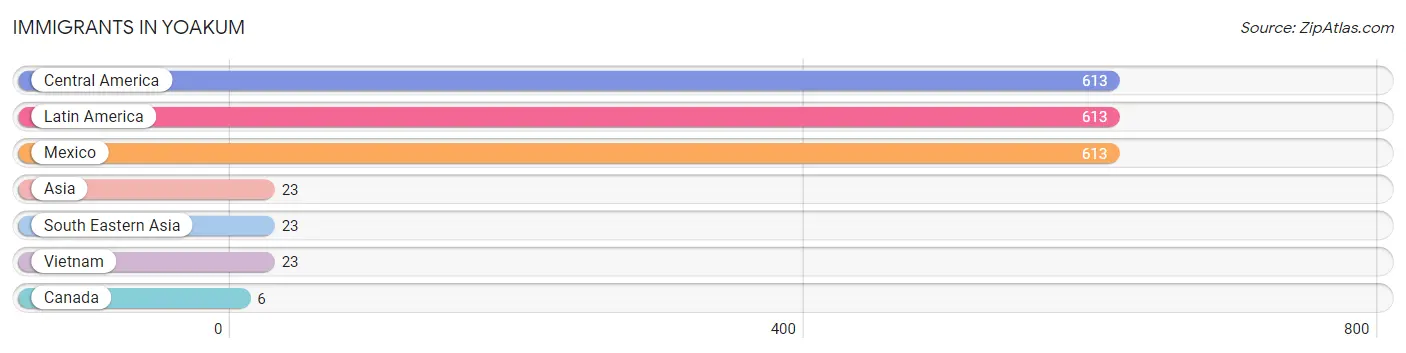
| Immigration Origin | # Population | % Population |
| Asia | 23 | 0.4% |
| Canada | 6 | 0.1% |
| Central America | 613 | 10.5% |
| Latin America | 613 | 10.5% |
| Mexico | 613 | 10.5% |
| South Eastern Asia | 23 | 0.4% |
| Vietnam | 23 | 0.4% | View All 7 Rows |
Sex and Age in Yoakum
Sex and Age in Yoakum
The most populous age groups in Yoakum are 10 to 14 Years (317 | 10.9%) for men and 15 to 19 Years (292 | 9.9%) for women.
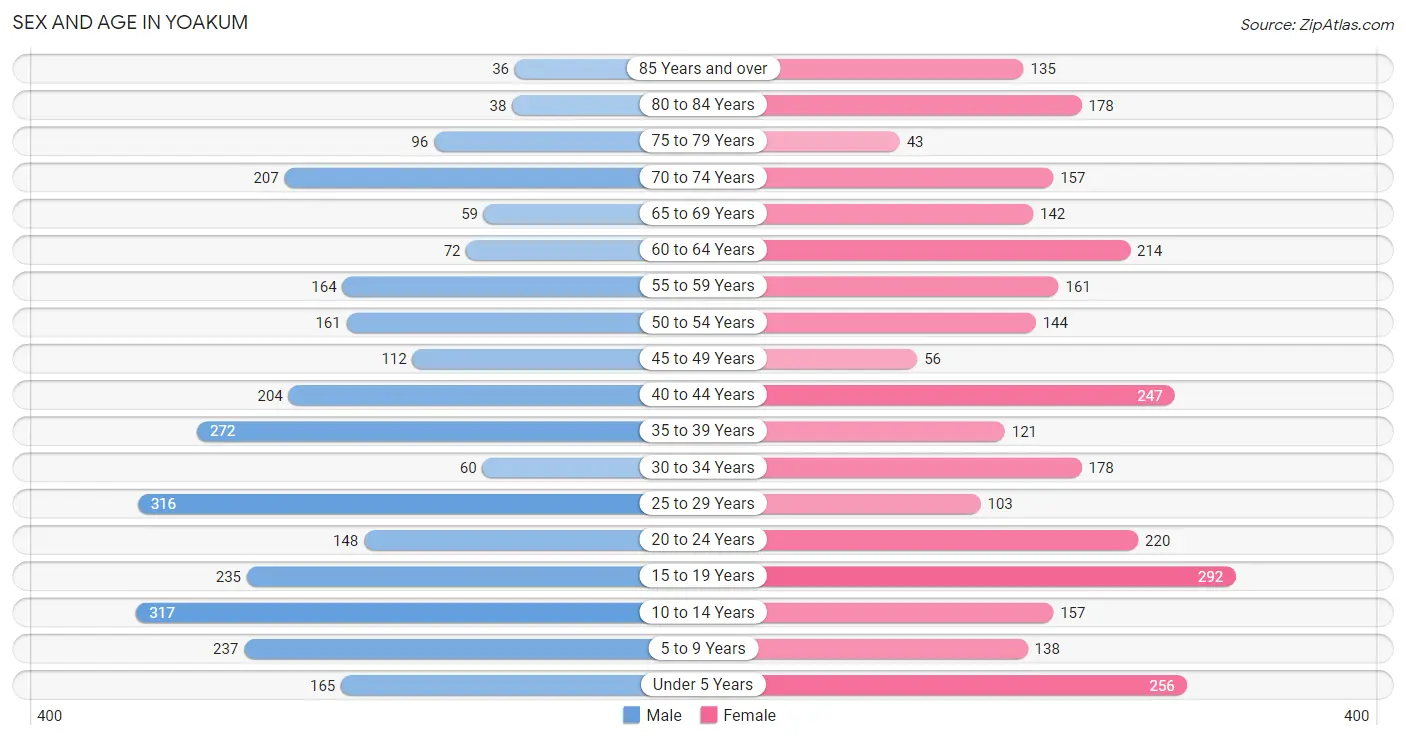
| Age Bracket | Male | Female |
| Under 5 Years | 165 (5.7%) | 256 (8.7%) |
| 5 to 9 Years | 237 (8.2%) | 138 (4.7%) |
| 10 to 14 Years | 317 (10.9%) | 157 (5.3%) |
| 15 to 19 Years | 235 (8.1%) | 292 (9.9%) |
| 20 to 24 Years | 148 (5.1%) | 220 (7.5%) |
| 25 to 29 Years | 316 (10.9%) | 103 (3.5%) |
| 30 to 34 Years | 60 (2.1%) | 178 (6.0%) |
| 35 to 39 Years | 272 (9.4%) | 121 (4.1%) |
| 40 to 44 Years | 204 (7.0%) | 247 (8.4%) |
| 45 to 49 Years | 112 (3.9%) | 56 (1.9%) |
| 50 to 54 Years | 161 (5.6%) | 144 (4.9%) |
| 55 to 59 Years | 164 (5.7%) | 161 (5.5%) |
| 60 to 64 Years | 72 (2.5%) | 214 (7.3%) |
| 65 to 69 Years | 59 (2.0%) | 142 (4.8%) |
| 70 to 74 Years | 207 (7.1%) | 157 (5.3%) |
| 75 to 79 Years | 96 (3.3%) | 43 (1.5%) |
| 80 to 84 Years | 38 (1.3%) | 178 (6.0%) |
| 85 Years and over | 36 (1.2%) | 135 (4.6%) |
| Total | 2,899 (100.0%) | 2,942 (100.0%) |
Families and Households in Yoakum
Median Family Size in Yoakum
The median family size in Yoakum is 3.21 persons per family, with married-couple families (934 | 63.3%) accounting for the largest median family size of 3.4 persons per family. On the other hand, single male/father families (105 | 7.1%) represent the smallest median family size with 2.42 persons per family.
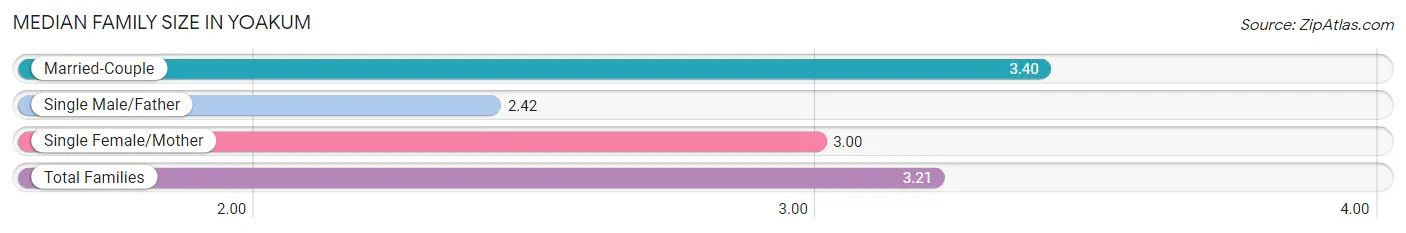
| Family Type | # Families | Family Size |
| Married-Couple | 934 (63.3%) | 3.40 |
| Single Male/Father | 105 (7.1%) | 2.42 |
| Single Female/Mother | 437 (29.6%) | 3.00 |
| Total Families | 1,476 (100.0%) | 3.21 |
Median Household Size in Yoakum
The median household size in Yoakum is 2.60 persons per household, with married-couple households (934 | 43.0%) accounting for the largest median household size of 3.4 persons per household. non-family households (697 | 32.1%) represent the smallest median household size with 1.03 persons per household.
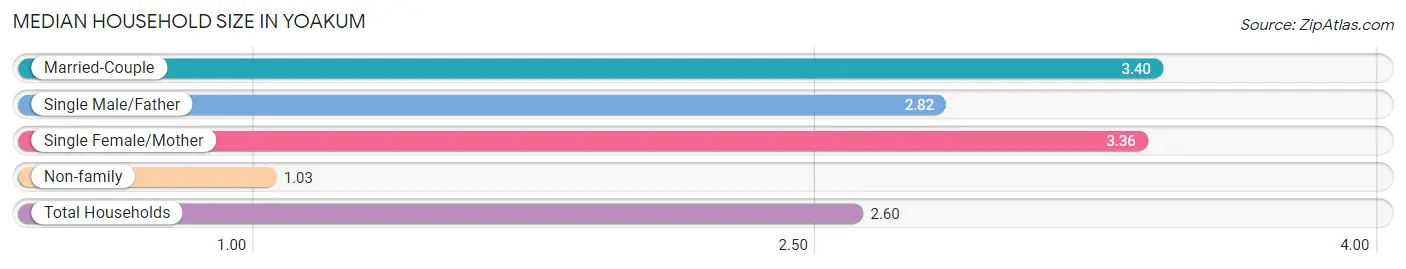
| Household Type | # Households | Household Size |
| Married-Couple | 934 (43.0%) | 3.40 |
| Single Male/Father | 105 (4.8%) | 2.82 |
| Single Female/Mother | 437 (20.1%) | 3.36 |
| Non-family | 697 (32.1%) | 1.03 |
| Total Households | 2,173 (100.0%) | 2.60 |
Household Size by Marriage Status in Yoakum
Out of a total of 2,173 households in Yoakum, 1,476 (67.9%) are family households, while 697 (32.1%) are nonfamily households. The most numerous type of family households are 2-person households, comprising 579, and the most common type of nonfamily households are 1-person households, comprising 678.
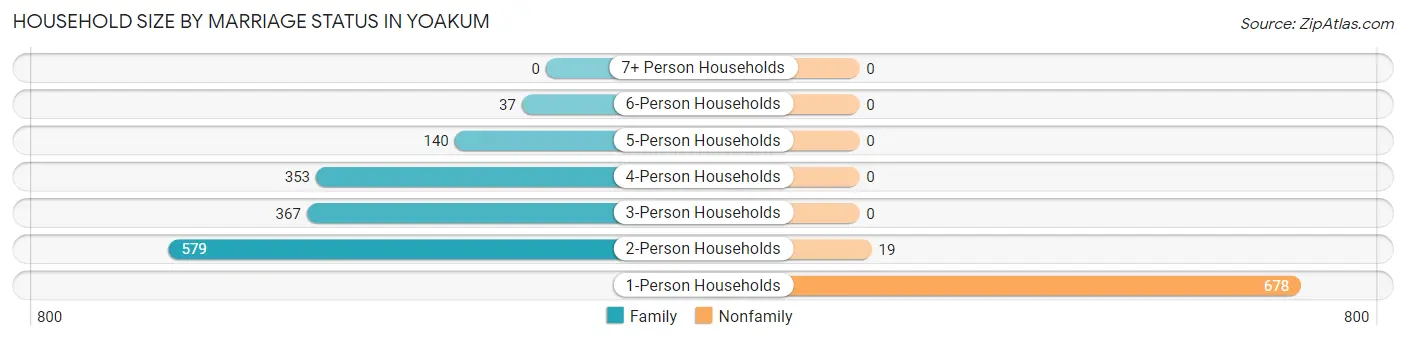
| Household Size | Family Households | Nonfamily Households |
| 1-Person Households | - | 678 (31.2%) |
| 2-Person Households | 579 (26.7%) | 19 (0.9%) |
| 3-Person Households | 367 (16.9%) | 0 (0.0%) |
| 4-Person Households | 353 (16.2%) | 0 (0.0%) |
| 5-Person Households | 140 (6.4%) | 0 (0.0%) |
| 6-Person Households | 37 (1.7%) | 0 (0.0%) |
| 7+ Person Households | 0 (0.0%) | 0 (0.0%) |
| Total | 1,476 (67.9%) | 697 (32.1%) |
Female Fertility in Yoakum
Fertility by Age in Yoakum
Average fertility rate in Yoakum is 34.0 births per 1,000 women. Women in the age bracket of 20 to 34 years have the highest fertility rate with 84.0 births per 1,000 women. Women in the age bracket of 20 to 34 years acount for 100.0% of all women with births.
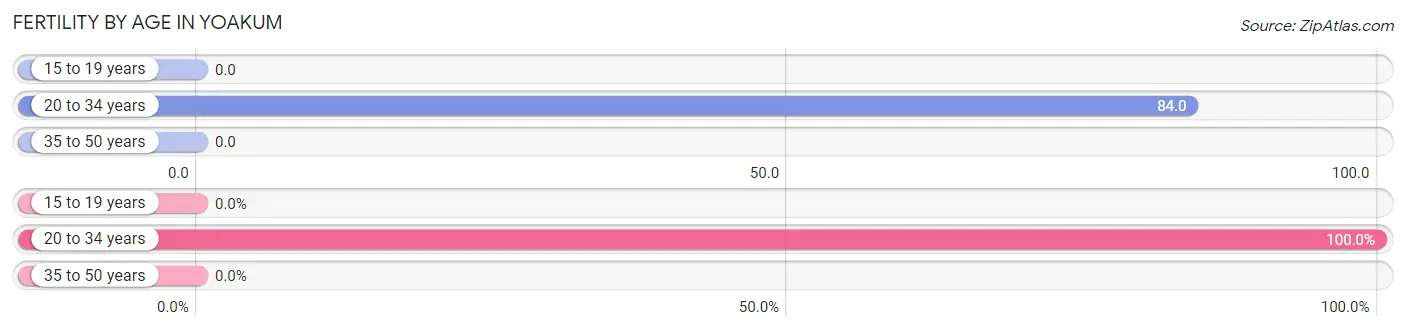
| Age Bracket | Women with Births | Births / 1,000 Women |
| 15 to 19 years | 0 (0.0%) | 0.0 |
| 20 to 34 years | 42 (100.0%) | 84.0 |
| 35 to 50 years | 0 (0.0%) | 0.0 |
| Total | 42 (100.0%) | 34.0 |
Fertility by Age by Marriage Status in Yoakum
81.0% of women with births (42) in Yoakum are married. The highest percentage of unmarried women with births falls into 20 to 34 years age bracket with 19.1% of them unmarried at the time of birth, while the lowest percentage of unmarried women with births belong to 20 to 34 years age bracket with 19.1% of them unmarried.
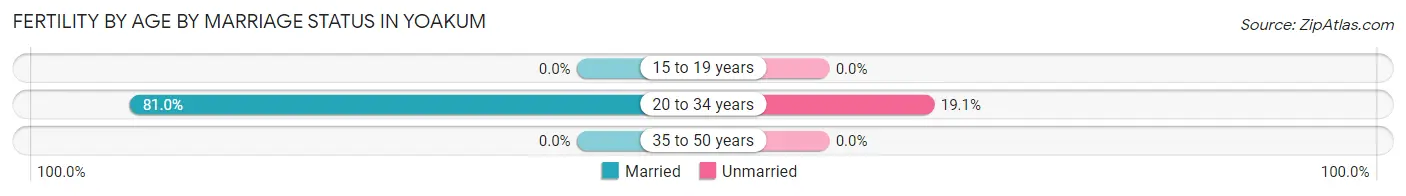
| Age Bracket | Married | Unmarried |
| 15 to 19 years | 0 (0.0%) | 0 (0.0%) |
| 20 to 34 years | 34 (80.9%) | 8 (19.1%) |
| 35 to 50 years | 0 (0.0%) | 0 (0.0%) |
| Total | 34 (80.9%) | 8 (19.1%) |
Fertility by Education in Yoakum
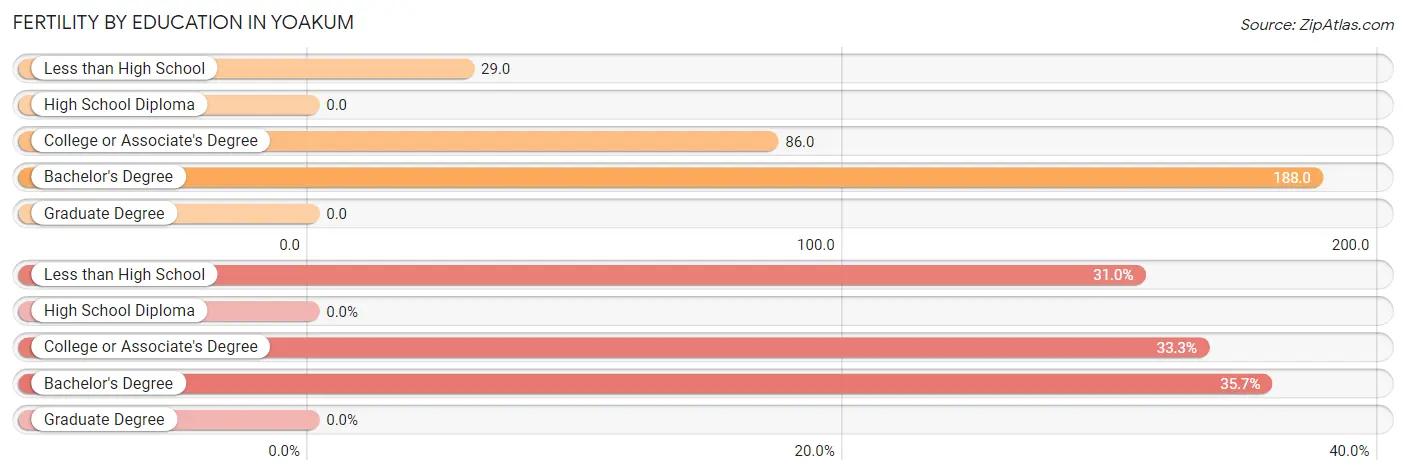
| Educational Attainment | Women with Births | Births / 1,000 Women |
| Less than High School | 13 (30.9%) | 29.0 |
| High School Diploma | 0 (0.0%) | 0.0 |
| College or Associate's Degree | 14 (33.3%) | 86.0 |
| Bachelor's Degree | 15 (35.7%) | 188.0 |
| Graduate Degree | 0 (0.0%) | 0.0 |
| Total | 42 (100.0%) | 34.0 |
Fertility by Education by Marriage Status in Yoakum
19.1% of women with births in Yoakum are unmarried. Women with the educational attainment of less than high school are most likely to be married with 100.0% of them married at childbirth, while women with the educational attainment of college or associate's degree are least likely to be married with 57.1% of them unmarried at childbirth.
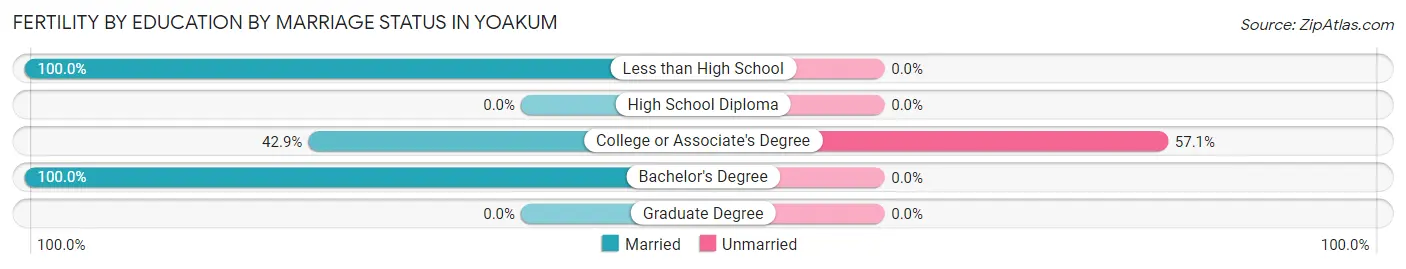
| Educational Attainment | Married | Unmarried |
| Less than High School | 13 (100.0%) | 0 (0.0%) |
| High School Diploma | 0 (0.0%) | 0 (0.0%) |
| College or Associate's Degree | 6 (42.9%) | 8 (57.1%) |
| Bachelor's Degree | 15 (100.0%) | 0 (0.0%) |
| Graduate Degree | 0 (0.0%) | 0 (0.0%) |
| Total | 34 (80.9%) | 8 (19.1%) |
Employment Characteristics in Yoakum
Employment by Class of Employer in Yoakum
Among the 2,541 employed individuals in Yoakum, private company employees (1,857 | 73.1%), local government employees (164 | 6.5%), and self-employed (not incorporated) (148 | 5.8%) make up the most common classes of employment.
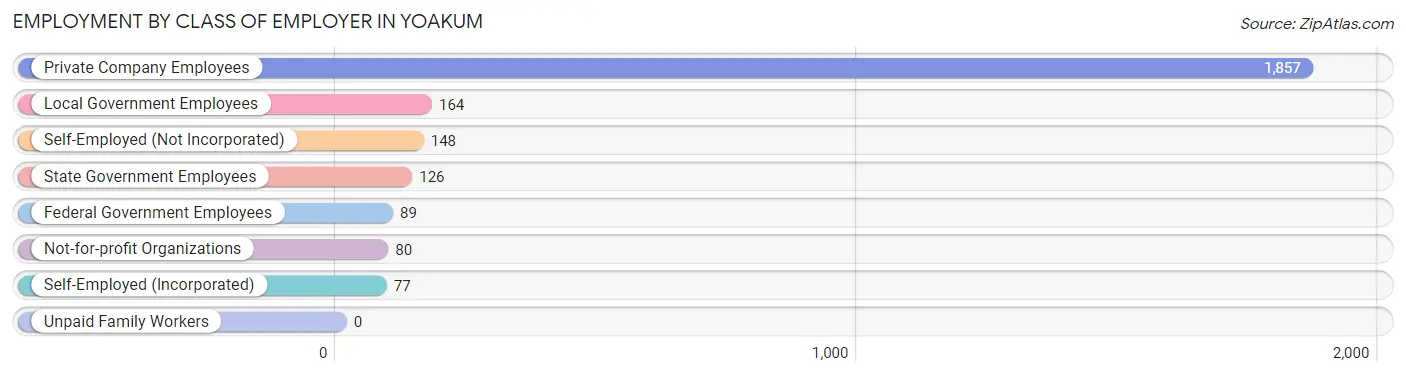
| Employer Class | # Employees | % Employees |
| Private Company Employees | 1,857 | 73.1% |
| Self-Employed (Incorporated) | 77 | 3.0% |
| Self-Employed (Not Incorporated) | 148 | 5.8% |
| Not-for-profit Organizations | 80 | 3.2% |
| Local Government Employees | 164 | 6.5% |
| State Government Employees | 126 | 5.0% |
| Federal Government Employees | 89 | 3.5% |
| Unpaid Family Workers | 0 | 0.0% |
| Total | 2,541 | 100.0% |
Employment Status by Age in Yoakum
According to the labor force statistics for Yoakum, out of the total population over 16 years of age (4,469), 58.1% or 2,596 individuals are in the labor force, with 0.5% or 13 of them unemployed. The age group with the highest labor force participation rate is 45 to 54 years, with 84.1% or 398 individuals in the labor force. Within the labor force, the 30 to 34 years age range has the highest percentage of unemployed individuals, with 6.5% or 9 of them being unemployed.
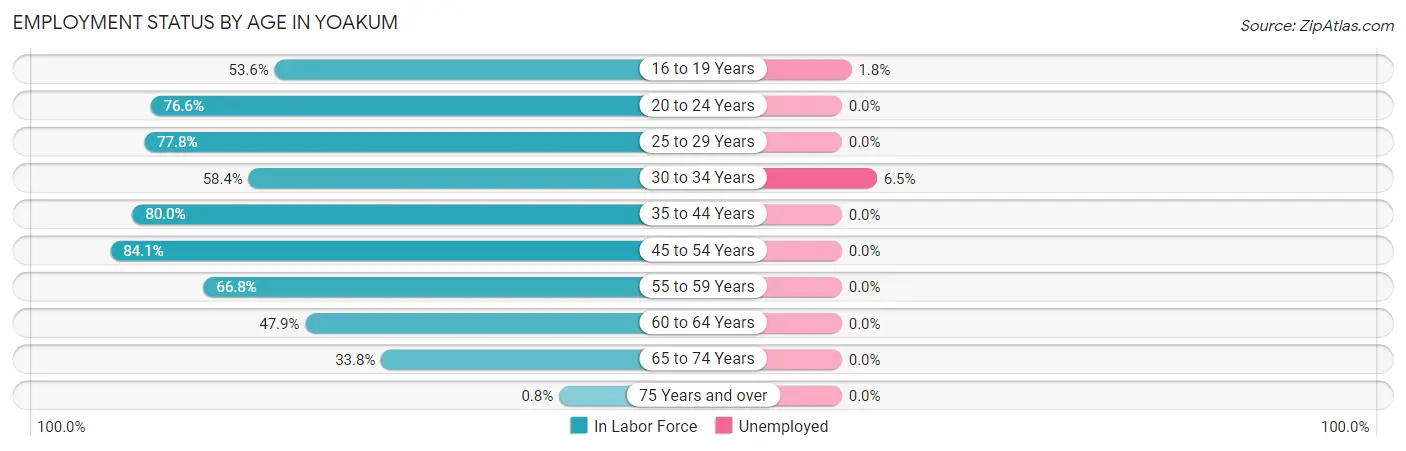
| Age Bracket | In Labor Force | Unemployed |
| 16 to 19 Years | 228 (53.6%) | 4 (1.8%) |
| 20 to 24 Years | 282 (76.6%) | 0 (0.0%) |
| 25 to 29 Years | 326 (77.8%) | 0 (0.0%) |
| 30 to 34 Years | 139 (58.4%) | 9 (6.5%) |
| 35 to 44 Years | 675 (80.0%) | 0 (0.0%) |
| 45 to 54 Years | 398 (84.1%) | 0 (0.0%) |
| 55 to 59 Years | 217 (66.8%) | 0 (0.0%) |
| 60 to 64 Years | 137 (47.9%) | 0 (0.0%) |
| 65 to 74 Years | 191 (33.8%) | 0 (0.0%) |
| 75 Years and over | 4 (0.8%) | 0 (0.0%) |
| Total | 2,596 (58.1%) | 13 (0.5%) |
Employment Status by Educational Attainment in Yoakum
According to labor force statistics for Yoakum, 73.2% of individuals (1,892) out of the total population between 25 and 64 years of age (2,585) are in the labor force, with 0.5% or 9 of them being unemployed. The group with the highest labor force participation rate are those with the educational attainment of college / associate degree, with 80.3% or 449 individuals in the labor force. Within the labor force, individuals with high school diploma education have the highest percentage of unemployment, with 1.4% or 9 of them being unemployed.
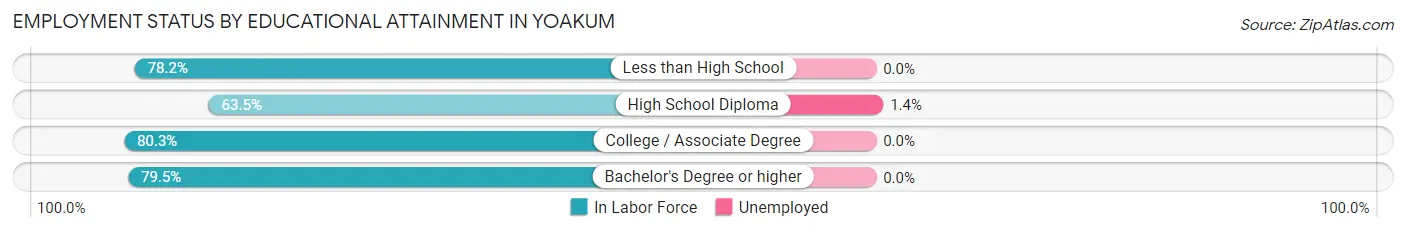
| Educational Attainment | In Labor Force | Unemployed |
| Less than High School | 575 (78.2%) | 0 (0.0%) |
| High School Diploma | 627 (63.5%) | 14 (1.4%) |
| College / Associate Degree | 449 (80.3%) | 0 (0.0%) |
| Bachelor's Degree or higher | 241 (79.5%) | 0 (0.0%) |
| Total | 1,892 (73.2%) | 13 (0.5%) |
Employment Occupations by Sex in Yoakum
Management, Business, Science and Arts Occupations
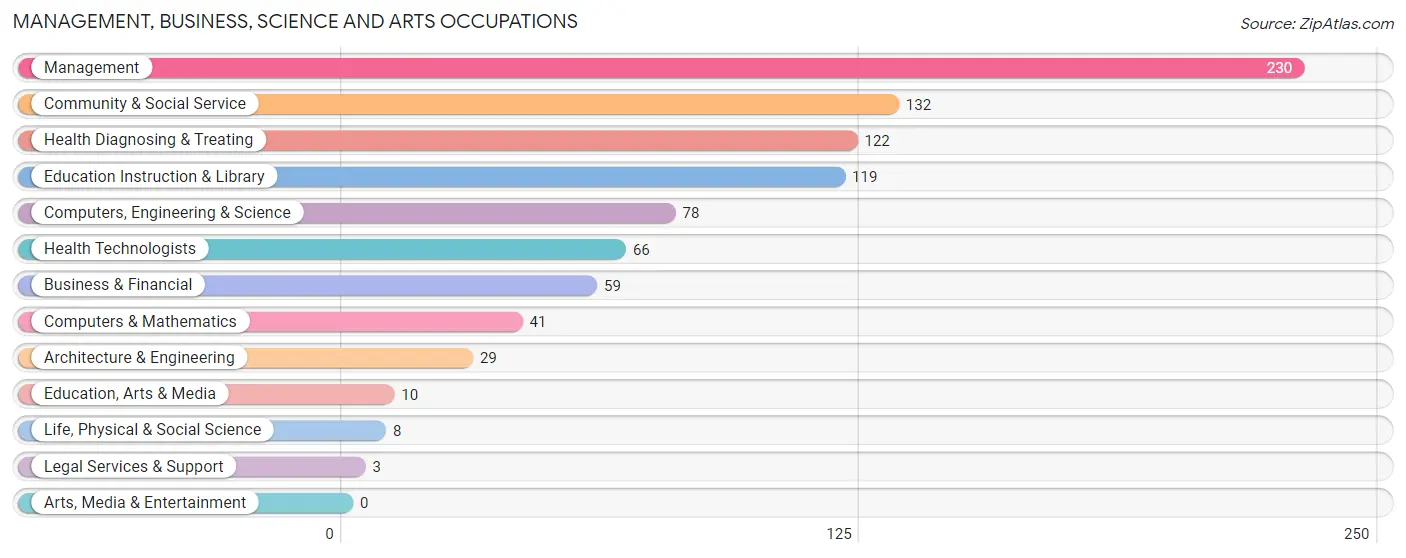
The most common Management, Business, Science and Arts occupations in Yoakum are Management (230 | 8.9%), Community & Social Service (132 | 5.1%), Health Diagnosing & Treating (122 | 4.7%), Education Instruction & Library (119 | 4.6%), and Computers, Engineering & Science (78 | 3.0%).
Management, Business, Science and Arts Occupations by Sex
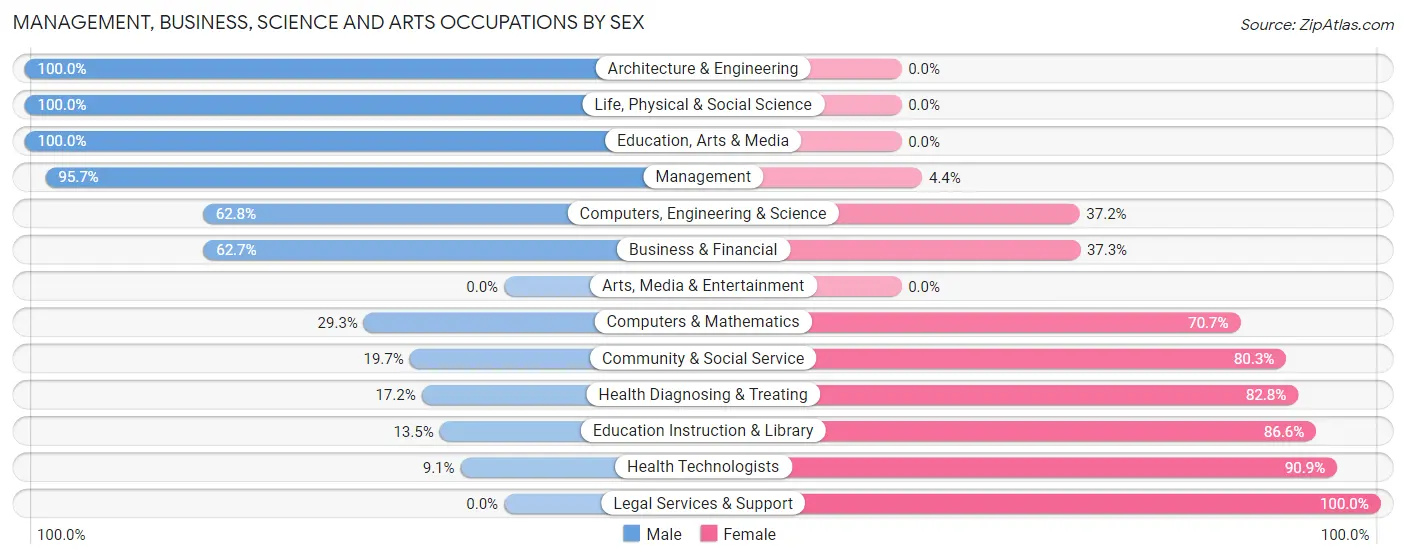
Within the Management, Business, Science and Arts occupations in Yoakum, the most male-oriented occupations are Architecture & Engineering (100.0%), Life, Physical & Social Science (100.0%), and Education, Arts & Media (100.0%), while the most female-oriented occupations are Legal Services & Support (100.0%), Health Technologists (90.9%), and Education Instruction & Library (86.6%).
| Occupation | Male | Female |
| Management | 220 (95.7%) | 10 (4.3%) |
| Business & Financial | 37 (62.7%) | 22 (37.3%) |
| Computers, Engineering & Science | 49 (62.8%) | 29 (37.2%) |
| Computers & Mathematics | 12 (29.3%) | 29 (70.7%) |
| Architecture & Engineering | 29 (100.0%) | 0 (0.0%) |
| Life, Physical & Social Science | 8 (100.0%) | 0 (0.0%) |
| Community & Social Service | 26 (19.7%) | 106 (80.3%) |
| Education, Arts & Media | 10 (100.0%) | 0 (0.0%) |
| Legal Services & Support | 0 (0.0%) | 3 (100.0%) |
| Education Instruction & Library | 16 (13.5%) | 103 (86.6%) |
| Arts, Media & Entertainment | 0 (0.0%) | 0 (0.0%) |
| Health Diagnosing & Treating | 21 (17.2%) | 101 (82.8%) |
| Health Technologists | 6 (9.1%) | 60 (90.9%) |
| Total (Category) | 353 (56.8%) | 268 (43.2%) |
| Total (Overall) | 1,399 (54.1%) | 1,185 (45.9%) |
Services Occupations
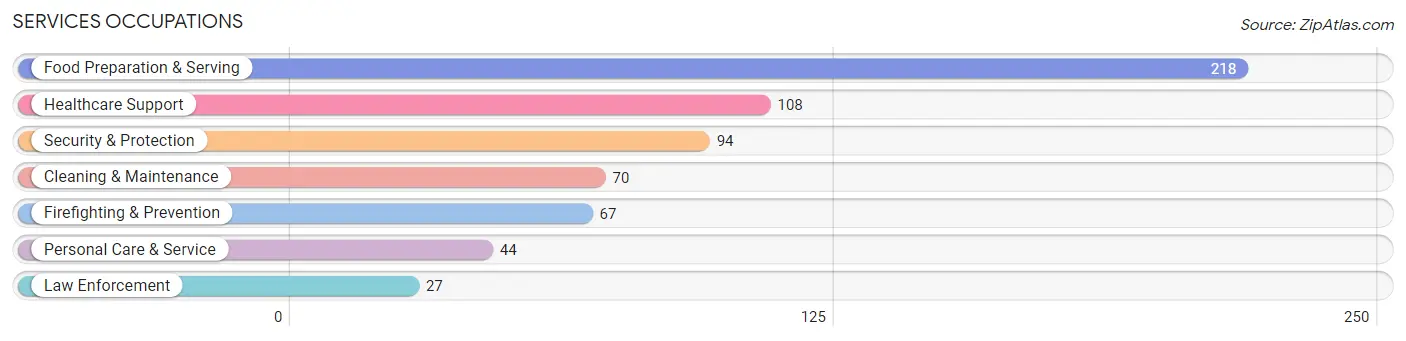
The most common Services occupations in Yoakum are Food Preparation & Serving (218 | 8.4%), Healthcare Support (108 | 4.2%), Security & Protection (94 | 3.6%), Cleaning & Maintenance (70 | 2.7%), and Firefighting & Prevention (67 | 2.6%).
Services Occupations by Sex
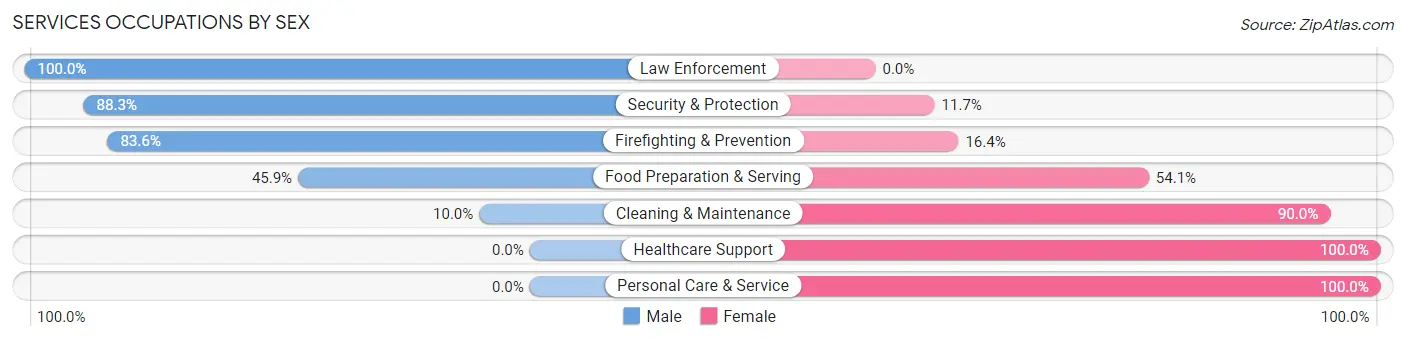
Within the Services occupations in Yoakum, the most male-oriented occupations are Law Enforcement (100.0%), Security & Protection (88.3%), and Firefighting & Prevention (83.6%), while the most female-oriented occupations are Healthcare Support (100.0%), Personal Care & Service (100.0%), and Cleaning & Maintenance (90.0%).
| Occupation | Male | Female |
| Healthcare Support | 0 (0.0%) | 108 (100.0%) |
| Security & Protection | 83 (88.3%) | 11 (11.7%) |
| Firefighting & Prevention | 56 (83.6%) | 11 (16.4%) |
| Law Enforcement | 27 (100.0%) | 0 (0.0%) |
| Food Preparation & Serving | 100 (45.9%) | 118 (54.1%) |
| Cleaning & Maintenance | 7 (10.0%) | 63 (90.0%) |
| Personal Care & Service | 0 (0.0%) | 44 (100.0%) |
| Total (Category) | 190 (35.6%) | 344 (64.4%) |
| Total (Overall) | 1,399 (54.1%) | 1,185 (45.9%) |
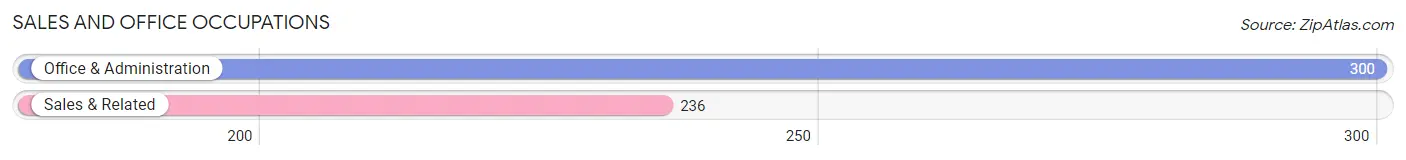
Sales and Office Occupations
The most common Sales and Office occupations in Yoakum are Office & Administration (300 | 11.6%), and Sales & Related (236 | 9.1%).
Sales and Office Occupations by Sex
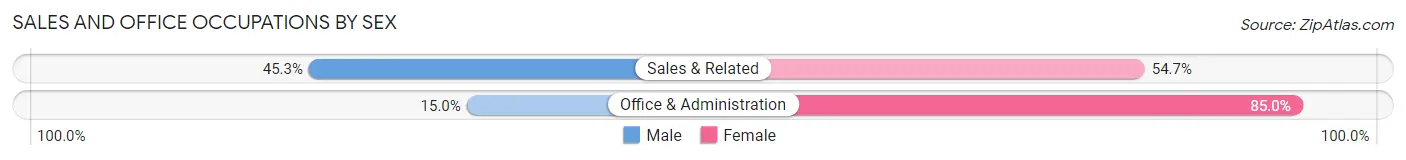
| Occupation | Male | Female |
| Sales & Related | 107 (45.3%) | 129 (54.7%) |
| Office & Administration | 45 (15.0%) | 255 (85.0%) |
| Total (Category) | 152 (28.4%) | 384 (71.6%) |
| Total (Overall) | 1,399 (54.1%) | 1,185 (45.9%) |
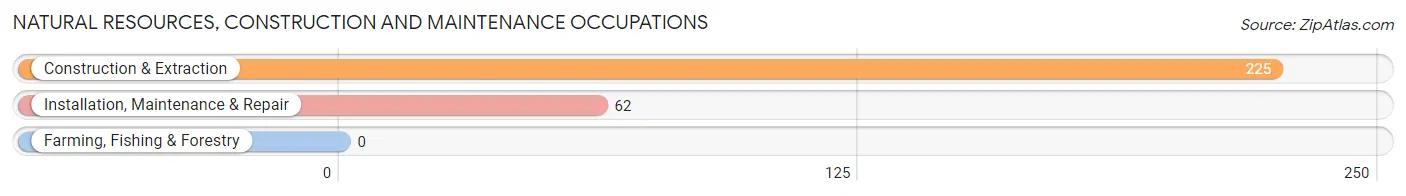
Natural Resources, Construction and Maintenance Occupations
The most common Natural Resources, Construction and Maintenance occupations in Yoakum are Construction & Extraction (225 | 8.7%), and Installation, Maintenance & Repair (62 | 2.4%).
Natural Resources, Construction and Maintenance Occupations by Sex
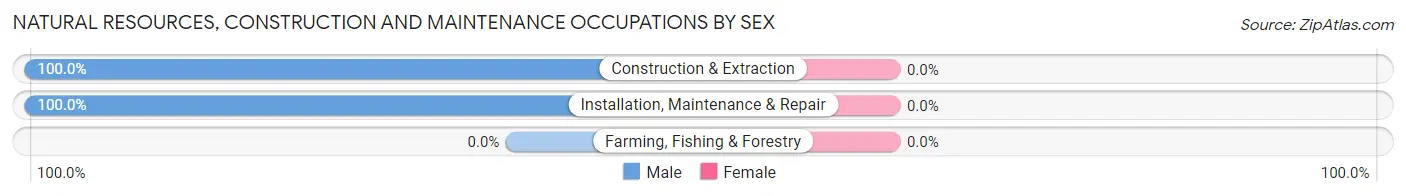
| Occupation | Male | Female |
| Farming, Fishing & Forestry | 0 (0.0%) | 0 (0.0%) |
| Construction & Extraction | 225 (100.0%) | 0 (0.0%) |
| Installation, Maintenance & Repair | 62 (100.0%) | 0 (0.0%) |
| Total (Category) | 287 (100.0%) | 0 (0.0%) |
| Total (Overall) | 1,399 (54.1%) | 1,185 (45.9%) |
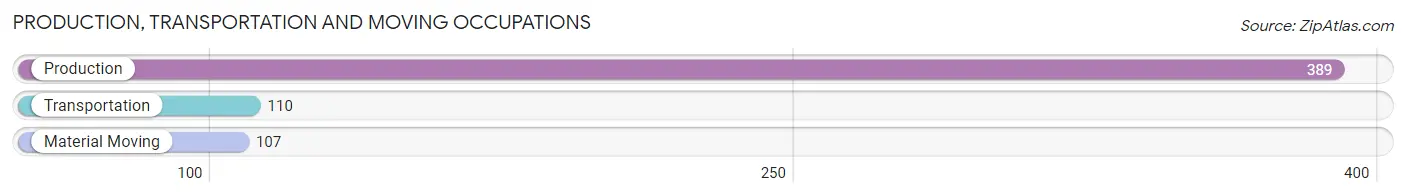
Production, Transportation and Moving Occupations
The most common Production, Transportation and Moving occupations in Yoakum are Production (389 | 15.0%), Transportation (110 | 4.3%), and Material Moving (107 | 4.1%).
Production, Transportation and Moving Occupations by Sex
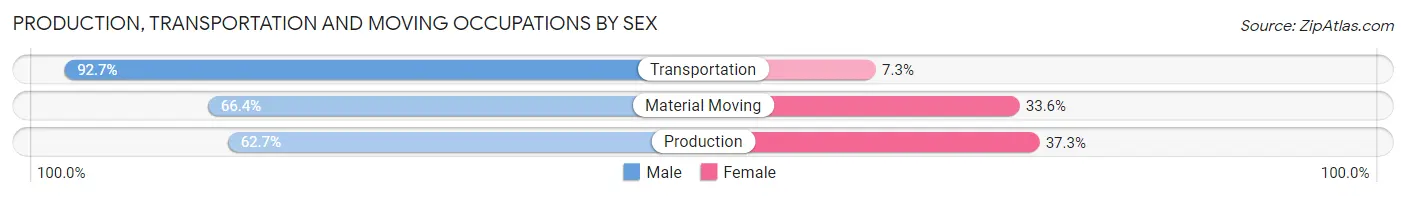
| Occupation | Male | Female |
| Production | 244 (62.7%) | 145 (37.3%) |
| Transportation | 102 (92.7%) | 8 (7.3%) |
| Material Moving | 71 (66.4%) | 36 (33.6%) |
| Total (Category) | 417 (68.8%) | 189 (31.2%) |
| Total (Overall) | 1,399 (54.1%) | 1,185 (45.9%) |
Employment Industries by Sex in Yoakum
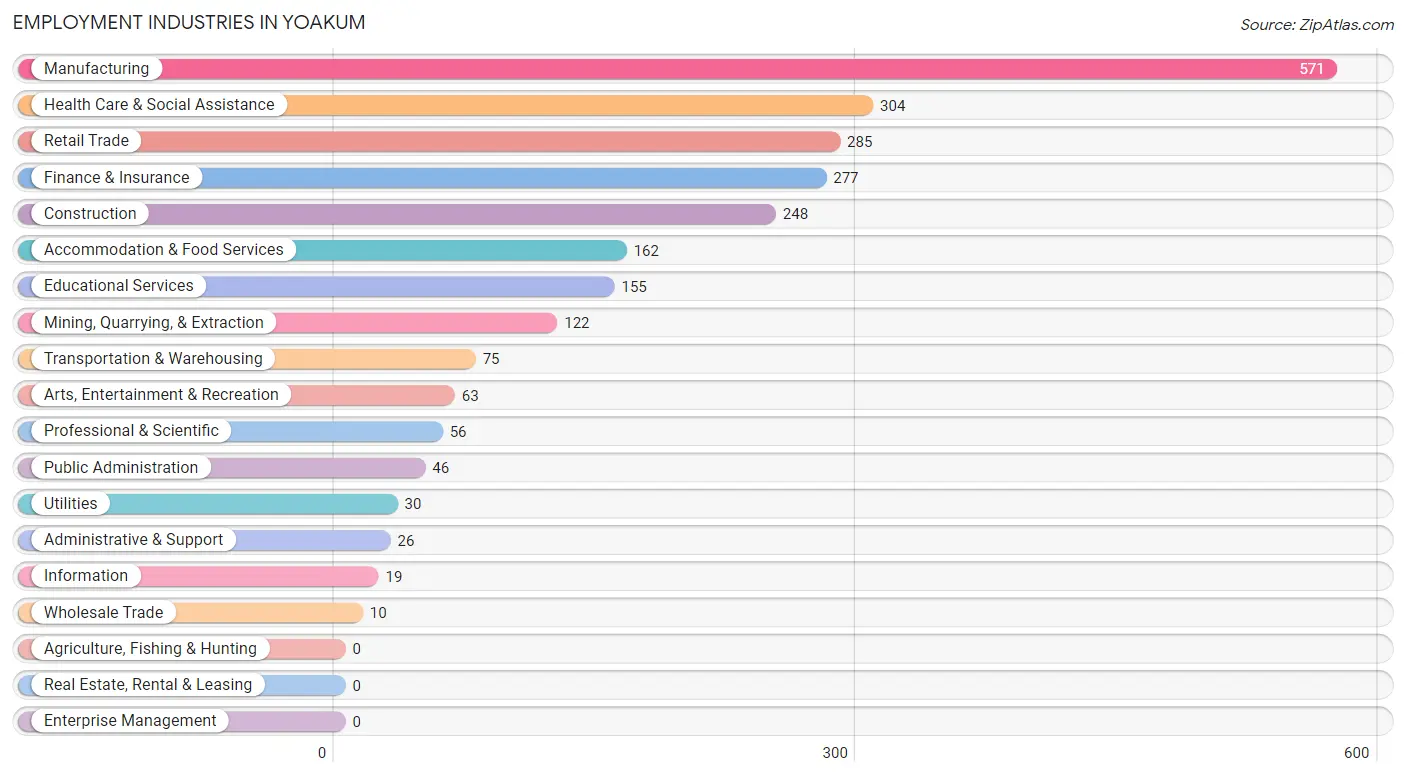
Employment Industries in Yoakum
The major employment industries in Yoakum include Manufacturing (571 | 22.1%), Health Care & Social Assistance (304 | 11.8%), Retail Trade (285 | 11.0%), Finance & Insurance (277 | 10.7%), and Construction (248 | 9.6%).
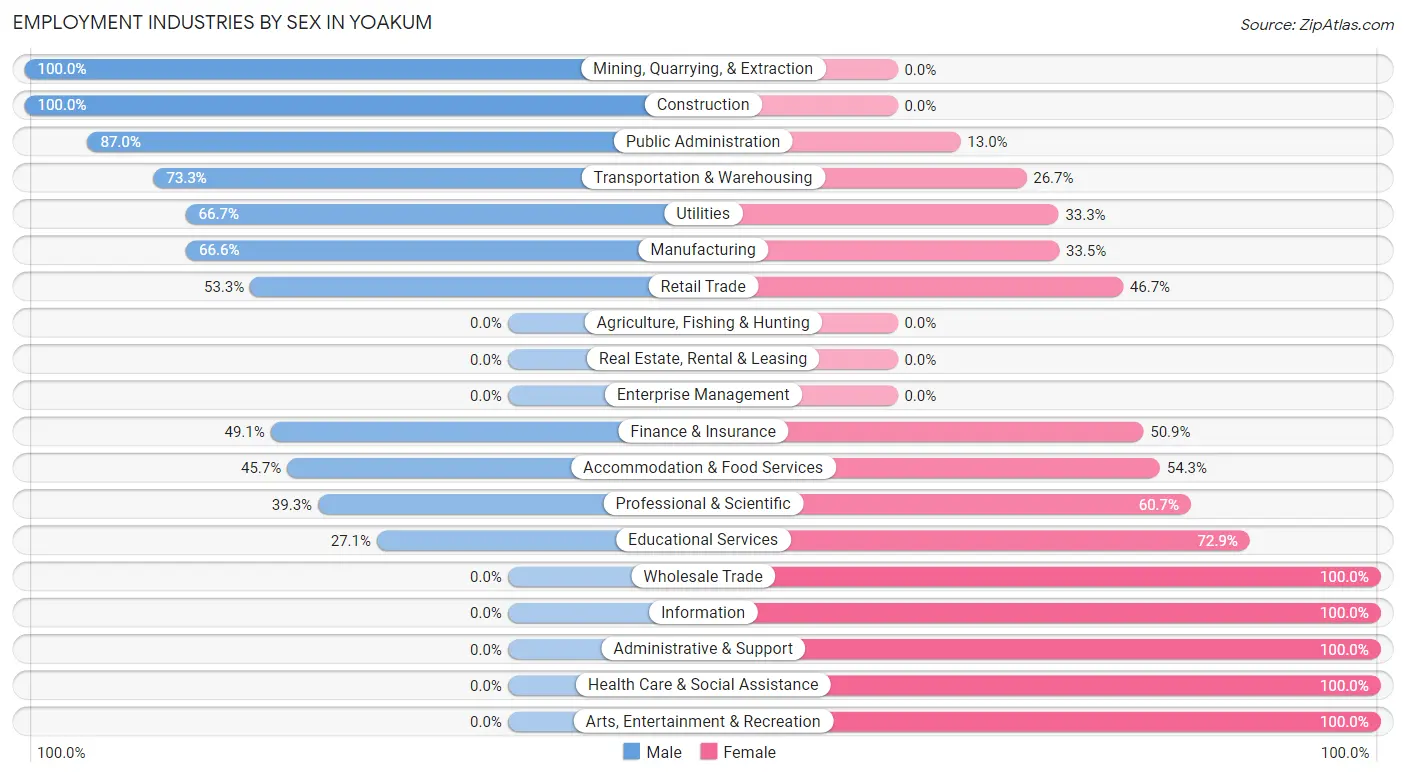
Employment Industries by Sex in Yoakum
The Yoakum industries that see more men than women are Mining, Quarrying, & Extraction (100.0%), Construction (100.0%), and Public Administration (87.0%), whereas the industries that tend to have a higher number of women are Wholesale Trade (100.0%), Information (100.0%), and Administrative & Support (100.0%).
| Industry | Male | Female |
| Agriculture, Fishing & Hunting | 0 (0.0%) | 0 (0.0%) |
| Mining, Quarrying, & Extraction | 122 (100.0%) | 0 (0.0%) |
| Construction | 248 (100.0%) | 0 (0.0%) |
| Manufacturing | 380 (66.5%) | 191 (33.5%) |
| Wholesale Trade | 0 (0.0%) | 10 (100.0%) |
| Retail Trade | 152 (53.3%) | 133 (46.7%) |
| Transportation & Warehousing | 55 (73.3%) | 20 (26.7%) |
| Utilities | 20 (66.7%) | 10 (33.3%) |
| Information | 0 (0.0%) | 19 (100.0%) |
| Finance & Insurance | 136 (49.1%) | 141 (50.9%) |
| Real Estate, Rental & Leasing | 0 (0.0%) | 0 (0.0%) |
| Professional & Scientific | 22 (39.3%) | 34 (60.7%) |
| Enterprise Management | 0 (0.0%) | 0 (0.0%) |
| Administrative & Support | 0 (0.0%) | 26 (100.0%) |
| Educational Services | 42 (27.1%) | 113 (72.9%) |
| Health Care & Social Assistance | 0 (0.0%) | 304 (100.0%) |
| Arts, Entertainment & Recreation | 0 (0.0%) | 63 (100.0%) |
| Accommodation & Food Services | 74 (45.7%) | 88 (54.3%) |
| Public Administration | 40 (87.0%) | 6 (13.0%) |
| Total | 1,399 (54.1%) | 1,185 (45.9%) |
Education in Yoakum
School Enrollment in Yoakum
The most common levels of schooling among the 1,347 students in Yoakum are middle school (468 | 34.7%), high school (350 | 26.0%), and elementary school (210 | 15.6%).
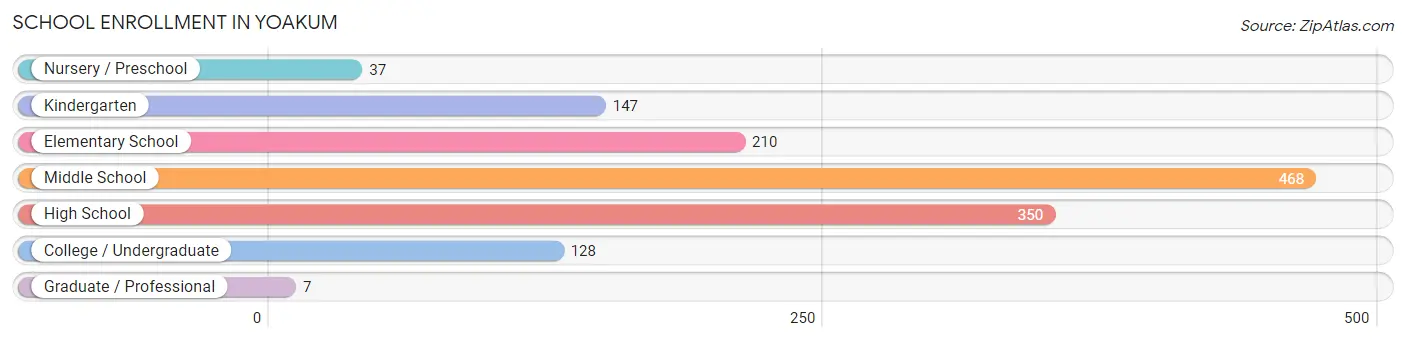
| School Level | # Students | % Students |
| Nursery / Preschool | 37 | 2.8% |
| Kindergarten | 147 | 10.9% |
| Elementary School | 210 | 15.6% |
| Middle School | 468 | 34.7% |
| High School | 350 | 26.0% |
| College / Undergraduate | 128 | 9.5% |
| Graduate / Professional | 7 | 0.5% |
| Total | 1,347 | 100.0% |
School Enrollment by Age by Funding Source in Yoakum
Out of a total of 1,347 students who are enrolled in schools in Yoakum, 44 (3.3%) attend a private institution, while the remaining 1,303 (96.7%) are enrolled in public schools. The age group of 20 to 24 year olds has the highest likelihood of being enrolled in private schools, with 17 (37.8% in the age bracket) enrolled. Conversely, the age group of 10 to 14 year olds has the lowest likelihood of being enrolled in a private school, with 474 (100.0% in the age bracket) attending a public institution.
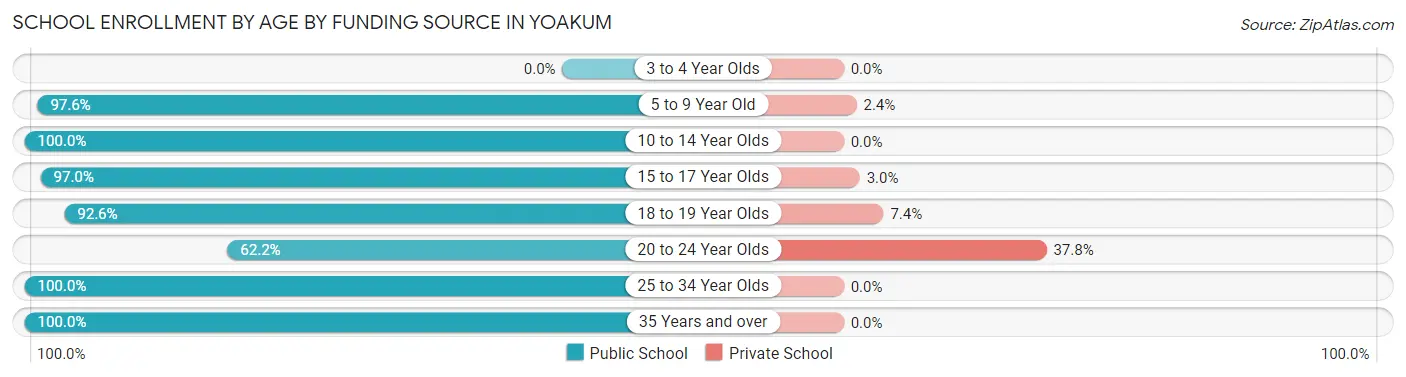
| Age Bracket | Public School | Private School |
| 3 to 4 Year Olds | 0 (0.0%) | 0 (0.0%) |
| 5 to 9 Year Old | 366 (97.6%) | 9 (2.4%) |
| 10 to 14 Year Olds | 474 (100.0%) | 0 (0.0%) |
| 15 to 17 Year Olds | 195 (97.0%) | 6 (3.0%) |
| 18 to 19 Year Olds | 150 (92.6%) | 12 (7.4%) |
| 20 to 24 Year Olds | 28 (62.2%) | 17 (37.8%) |
| 25 to 34 Year Olds | 28 (100.0%) | 0 (0.0%) |
| 35 Years and over | 62 (100.0%) | 0 (0.0%) |
| Total | 1,303 (96.7%) | 44 (3.3%) |
Educational Attainment by Field of Study in Yoakum
Education (171 | 36.5%), business (113 | 24.1%), communications (61 | 13.0%), science & technology (42 | 9.0%), and bio, nature & agricultural (28 | 6.0%) are the most common fields of study among 469 individuals in Yoakum who have obtained a bachelor's degree or higher.
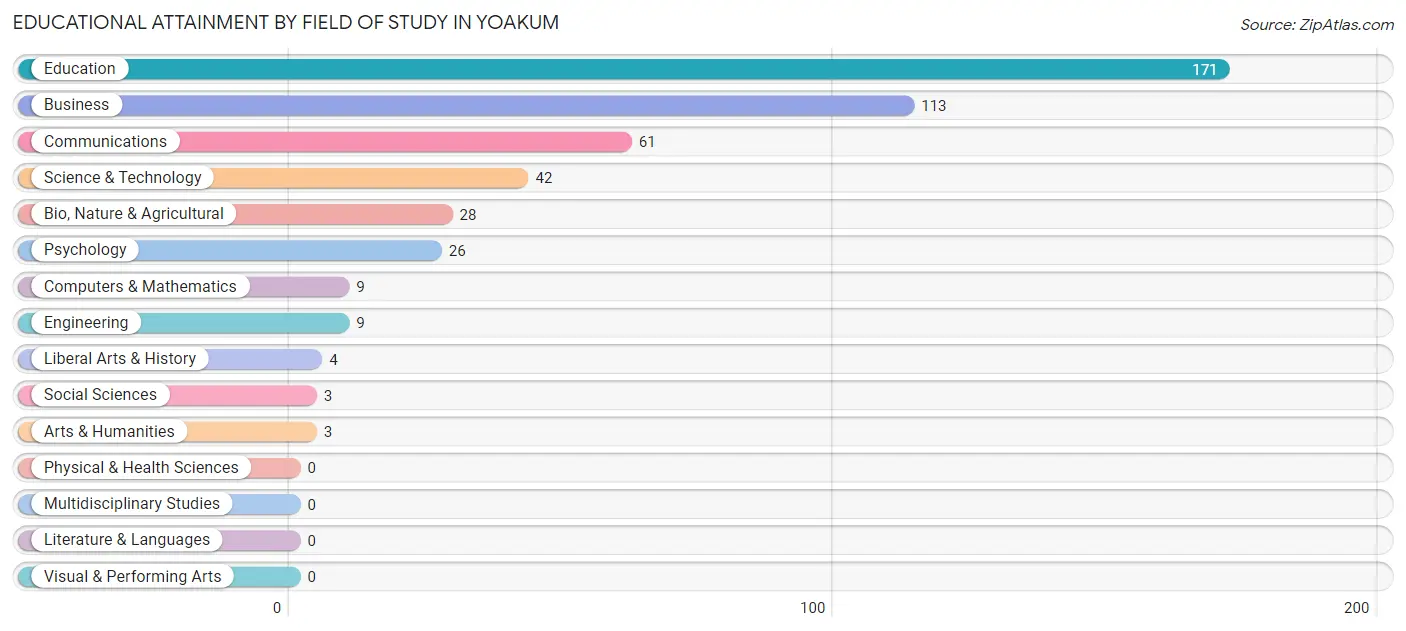
| Field of Study | # Graduates | % Graduates |
| Computers & Mathematics | 9 | 1.9% |
| Bio, Nature & Agricultural | 28 | 6.0% |
| Physical & Health Sciences | 0 | 0.0% |
| Psychology | 26 | 5.5% |
| Social Sciences | 3 | 0.6% |
| Engineering | 9 | 1.9% |
| Multidisciplinary Studies | 0 | 0.0% |
| Science & Technology | 42 | 9.0% |
| Business | 113 | 24.1% |
| Education | 171 | 36.5% |
| Literature & Languages | 0 | 0.0% |
| Liberal Arts & History | 4 | 0.9% |
| Visual & Performing Arts | 0 | 0.0% |
| Communications | 61 | 13.0% |
| Arts & Humanities | 3 | 0.6% |
| Total | 469 | 100.0% |
Transportation & Commute in Yoakum
Vehicle Availability by Sex in Yoakum
The most prevalent vehicle ownership categories in Yoakum are males with 2 vehicles (568, accounting for 40.6%) and females with 2 vehicles (474, making up 49.7%).
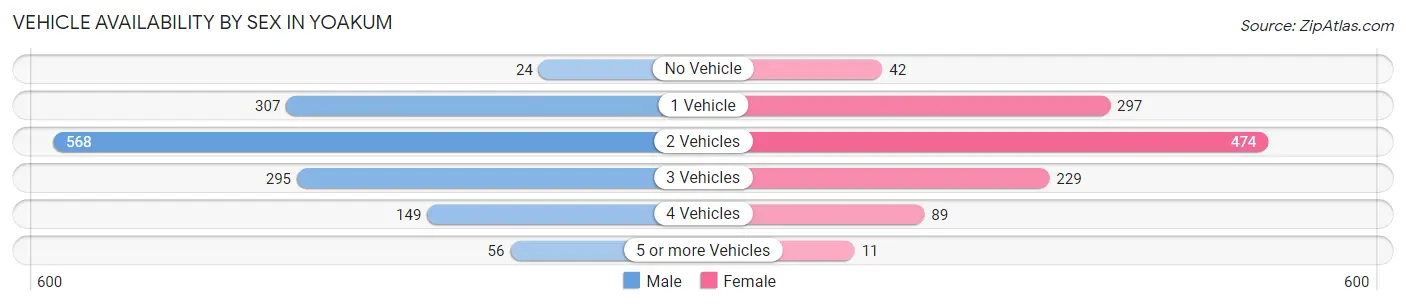
| Vehicles Available | Male | Female |
| No Vehicle | 24 (1.7%) | 42 (3.7%) |
| 1 Vehicle | 307 (21.9%) | 297 (26.0%) |
| 2 Vehicles | 568 (40.6%) | 474 (41.5%) |
| 3 Vehicles | 295 (21.1%) | 229 (20.1%) |
| 4 Vehicles | 149 (10.6%) | 89 (7.8%) |
| 5 or more Vehicles | 56 (4.0%) | 11 (1.0%) |
| Total | 1,399 (100.0%) | 1,142 (100.0%) |
Commute Time in Yoakum
The most frequently occuring commute durations in Yoakum are 5 to 9 minutes (1,076 commuters, 44.3%), less than 5 minutes (360 commuters, 14.8%), and 15 to 19 minutes (284 commuters, 11.7%).
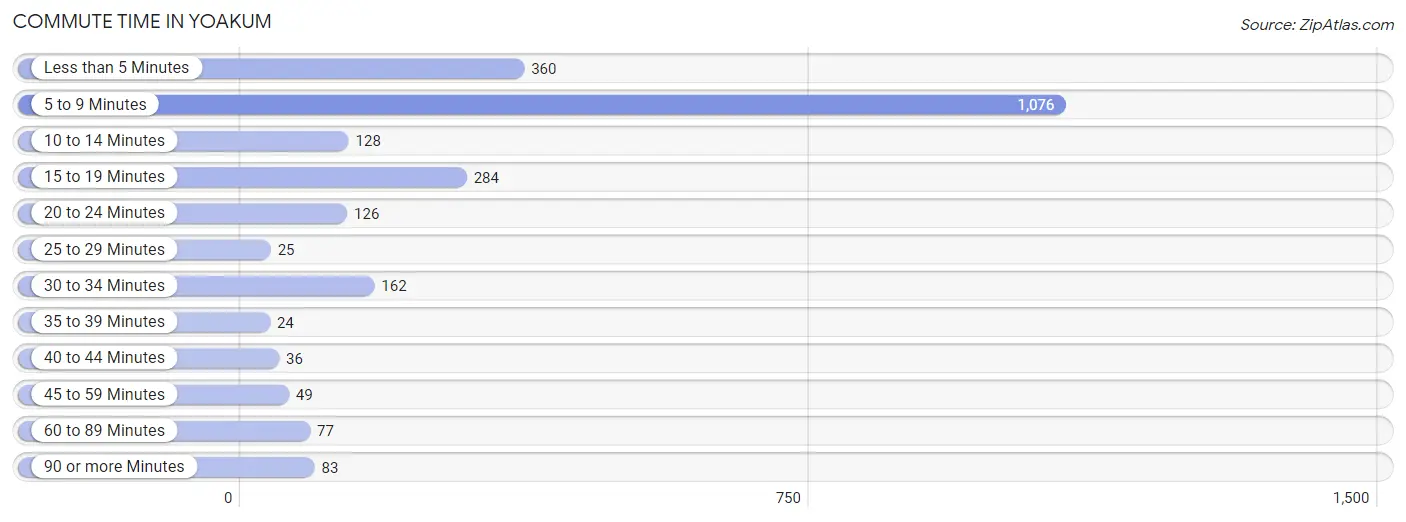
| Commute Time | # Commuters | % Commuters |
| Less than 5 Minutes | 360 | 14.8% |
| 5 to 9 Minutes | 1,076 | 44.3% |
| 10 to 14 Minutes | 128 | 5.3% |
| 15 to 19 Minutes | 284 | 11.7% |
| 20 to 24 Minutes | 126 | 5.2% |
| 25 to 29 Minutes | 25 | 1.0% |
| 30 to 34 Minutes | 162 | 6.7% |
| 35 to 39 Minutes | 24 | 1.0% |
| 40 to 44 Minutes | 36 | 1.5% |
| 45 to 59 Minutes | 49 | 2.0% |
| 60 to 89 Minutes | 77 | 3.2% |
| 90 or more Minutes | 83 | 3.4% |
Commute Time by Sex in Yoakum
The most common commute times in Yoakum are 5 to 9 minutes (562 commuters, 43.1%) for males and 5 to 9 minutes (514 commuters, 45.7%) for females.
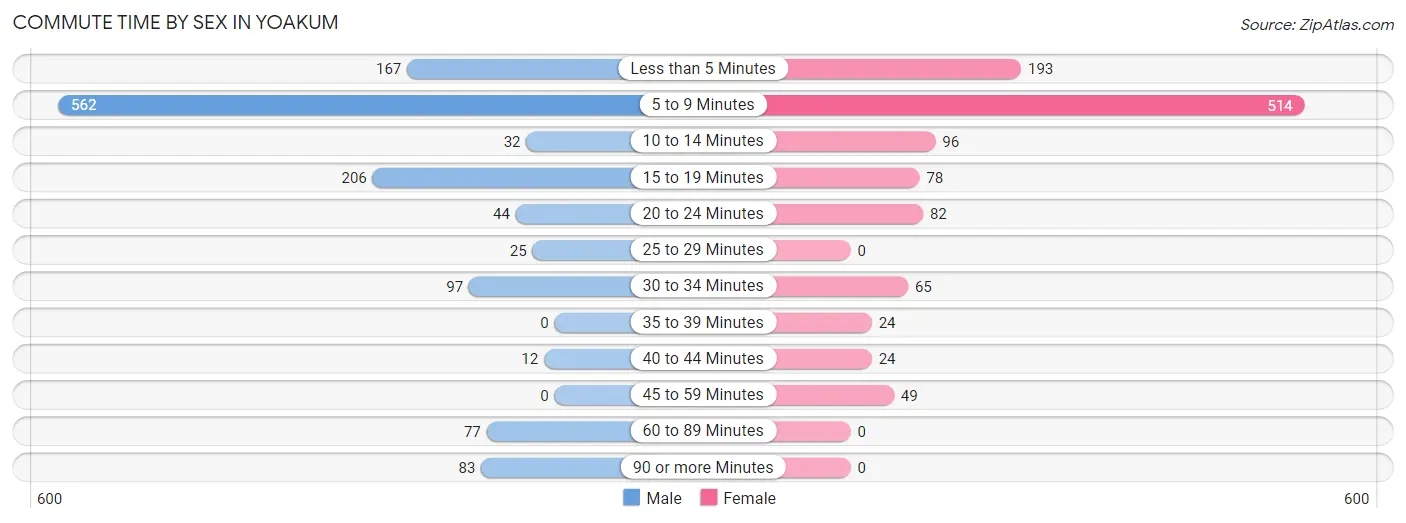
| Commute Time | Male | Female |
| Less than 5 Minutes | 167 (12.8%) | 193 (17.2%) |
| 5 to 9 Minutes | 562 (43.1%) | 514 (45.7%) |
| 10 to 14 Minutes | 32 (2.5%) | 96 (8.5%) |
| 15 to 19 Minutes | 206 (15.8%) | 78 (6.9%) |
| 20 to 24 Minutes | 44 (3.4%) | 82 (7.3%) |
| 25 to 29 Minutes | 25 (1.9%) | 0 (0.0%) |
| 30 to 34 Minutes | 97 (7.4%) | 65 (5.8%) |
| 35 to 39 Minutes | 0 (0.0%) | 24 (2.1%) |
| 40 to 44 Minutes | 12 (0.9%) | 24 (2.1%) |
| 45 to 59 Minutes | 0 (0.0%) | 49 (4.4%) |
| 60 to 89 Minutes | 77 (5.9%) | 0 (0.0%) |
| 90 or more Minutes | 83 (6.4%) | 0 (0.0%) |
Time of Departure to Work by Sex in Yoakum
The most frequent times of departure to work in Yoakum are 7:00 AM to 7:29 AM (315, 24.1%) for males and 7:30 AM to 7:59 AM (210, 18.7%) for females.
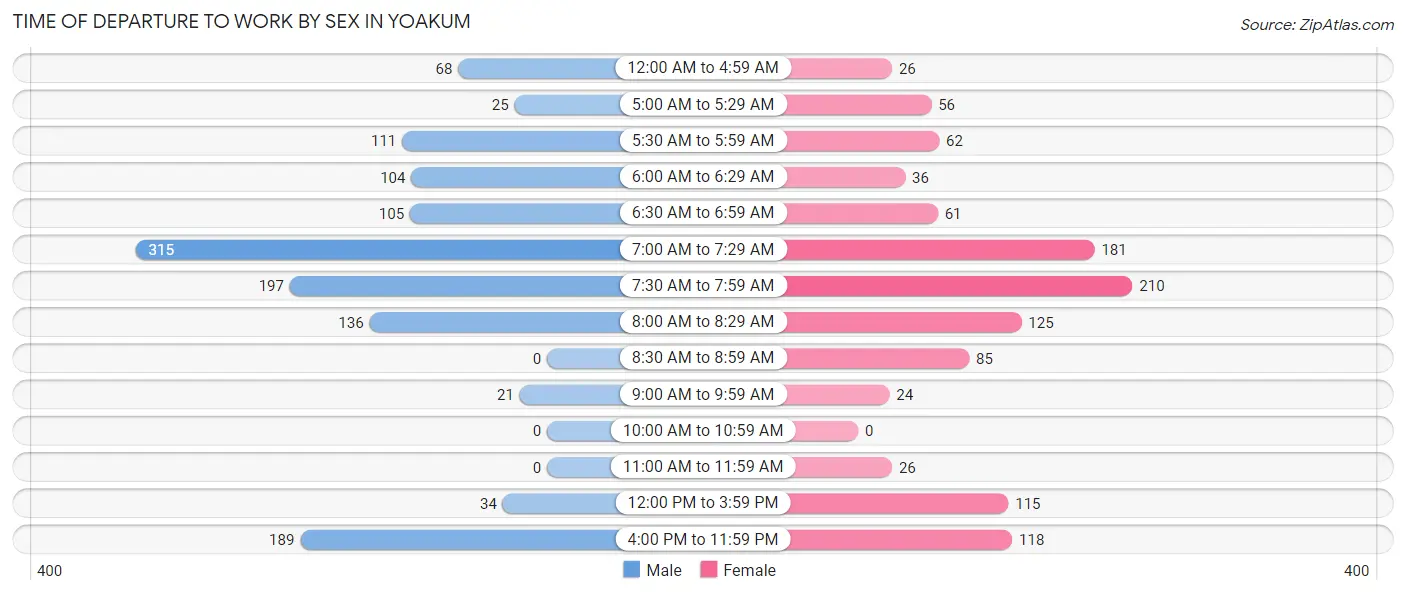
| Time of Departure | Male | Female |
| 12:00 AM to 4:59 AM | 68 (5.2%) | 26 (2.3%) |
| 5:00 AM to 5:29 AM | 25 (1.9%) | 56 (5.0%) |
| 5:30 AM to 5:59 AM | 111 (8.5%) | 62 (5.5%) |
| 6:00 AM to 6:29 AM | 104 (8.0%) | 36 (3.2%) |
| 6:30 AM to 6:59 AM | 105 (8.1%) | 61 (5.4%) |
| 7:00 AM to 7:29 AM | 315 (24.1%) | 181 (16.1%) |
| 7:30 AM to 7:59 AM | 197 (15.1%) | 210 (18.7%) |
| 8:00 AM to 8:29 AM | 136 (10.4%) | 125 (11.1%) |
| 8:30 AM to 8:59 AM | 0 (0.0%) | 85 (7.6%) |
| 9:00 AM to 9:59 AM | 21 (1.6%) | 24 (2.1%) |
| 10:00 AM to 10:59 AM | 0 (0.0%) | 0 (0.0%) |
| 11:00 AM to 11:59 AM | 0 (0.0%) | 26 (2.3%) |
| 12:00 PM to 3:59 PM | 34 (2.6%) | 115 (10.2%) |
| 4:00 PM to 11:59 PM | 189 (14.5%) | 118 (10.5%) |
| Total | 1,305 (100.0%) | 1,125 (100.0%) |
Housing Occupancy in Yoakum
Occupancy by Ownership in Yoakum
Of the total 2,173 dwellings in Yoakum, owner-occupied units account for 1,477 (68.0%), while renter-occupied units make up 696 (32.0%).
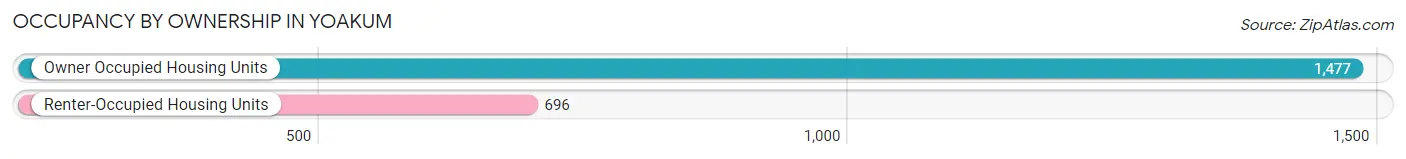
| Occupancy | # Housing Units | % Housing Units |
| Owner Occupied Housing Units | 1,477 | 68.0% |
| Renter-Occupied Housing Units | 696 | 32.0% |
| Total Occupied Housing Units | 2,173 | 100.0% |
Occupancy by Household Size in Yoakum
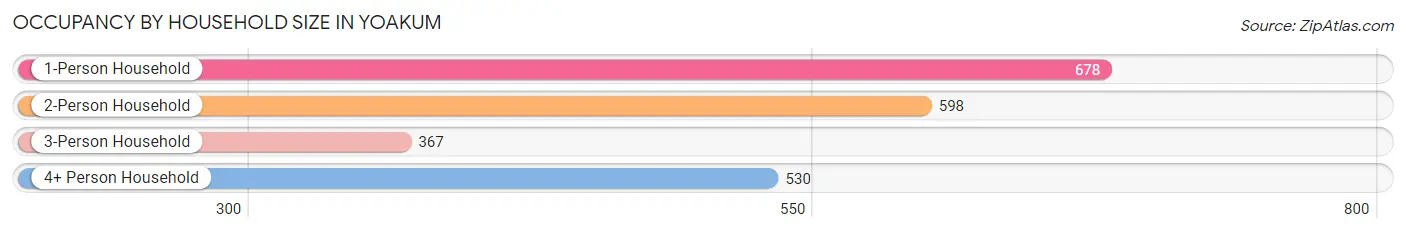
| Household Size | # Housing Units | % Housing Units |
| 1-Person Household | 678 | 31.2% |
| 2-Person Household | 598 | 27.5% |
| 3-Person Household | 367 | 16.9% |
| 4+ Person Household | 530 | 24.4% |
| Total Housing Units | 2,173 | 100.0% |
Occupancy by Ownership by Household Size in Yoakum
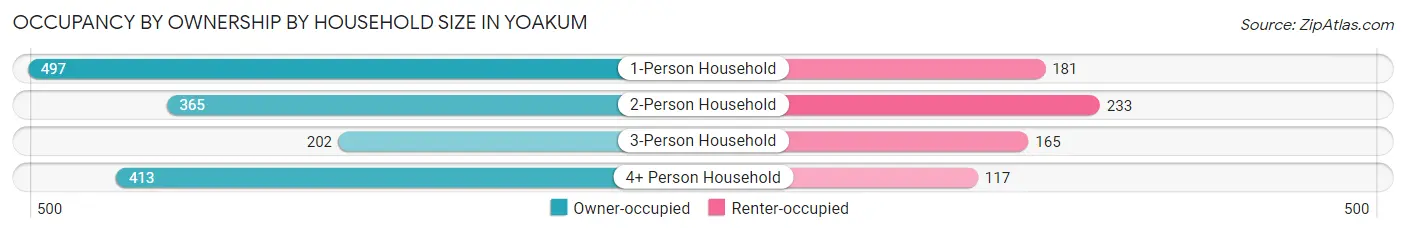
| Household Size | Owner-occupied | Renter-occupied |
| 1-Person Household | 497 (73.3%) | 181 (26.7%) |
| 2-Person Household | 365 (61.0%) | 233 (39.0%) |
| 3-Person Household | 202 (55.0%) | 165 (45.0%) |
| 4+ Person Household | 413 (77.9%) | 117 (22.1%) |
| Total Housing Units | 1,477 (68.0%) | 696 (32.0%) |
Occupancy by Educational Attainment in Yoakum
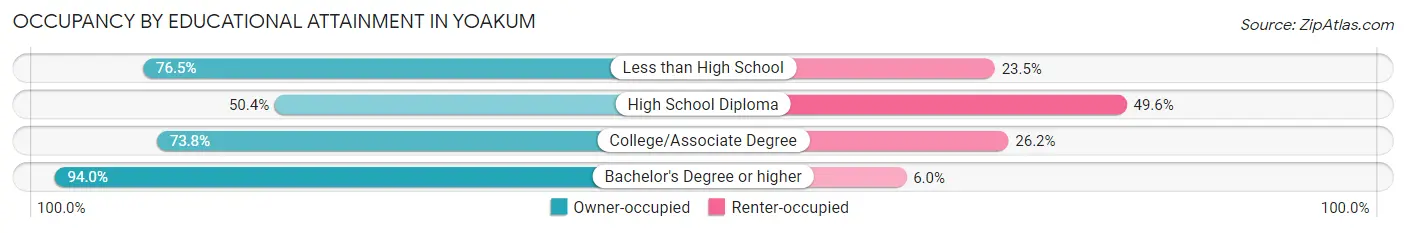
| Household Size | Owner-occupied | Renter-occupied |
| Less than High School | 358 (76.5%) | 110 (23.5%) |
| High School Diploma | 423 (50.4%) | 417 (49.6%) |
| College/Associate Degree | 428 (73.8%) | 152 (26.2%) |
| Bachelor's Degree or higher | 268 (94.0%) | 17 (6.0%) |
Occupancy by Age of Householder in Yoakum
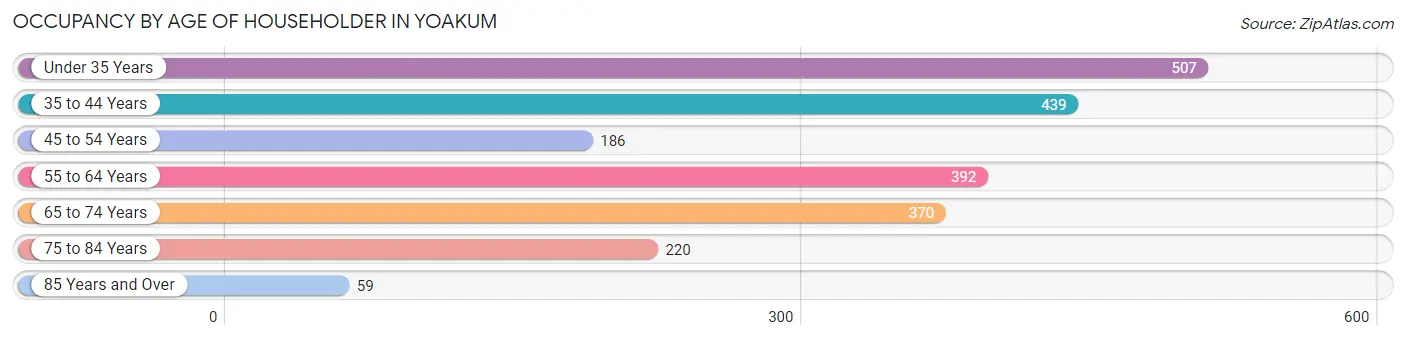
| Age Bracket | # Households | % Households |
| Under 35 Years | 507 | 23.3% |
| 35 to 44 Years | 439 | 20.2% |
| 45 to 54 Years | 186 | 8.6% |
| 55 to 64 Years | 392 | 18.0% |
| 65 to 74 Years | 370 | 17.0% |
| 75 to 84 Years | 220 | 10.1% |
| 85 Years and Over | 59 | 2.7% |
| Total | 2,173 | 100.0% |
Housing Finances in Yoakum
Median Income by Occupancy in Yoakum
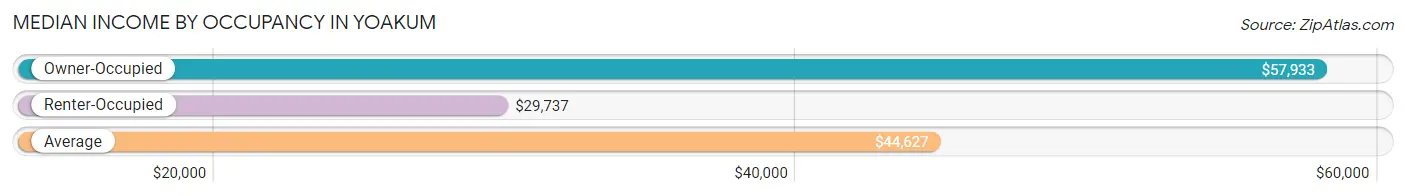
| Occupancy Type | # Households | Median Income |
| Owner-Occupied | 1,477 (68.0%) | $57,933 |
| Renter-Occupied | 696 (32.0%) | $29,737 |
| Average | 2,173 (100.0%) | $44,627 |
Occupancy by Householder Income Bracket in Yoakum
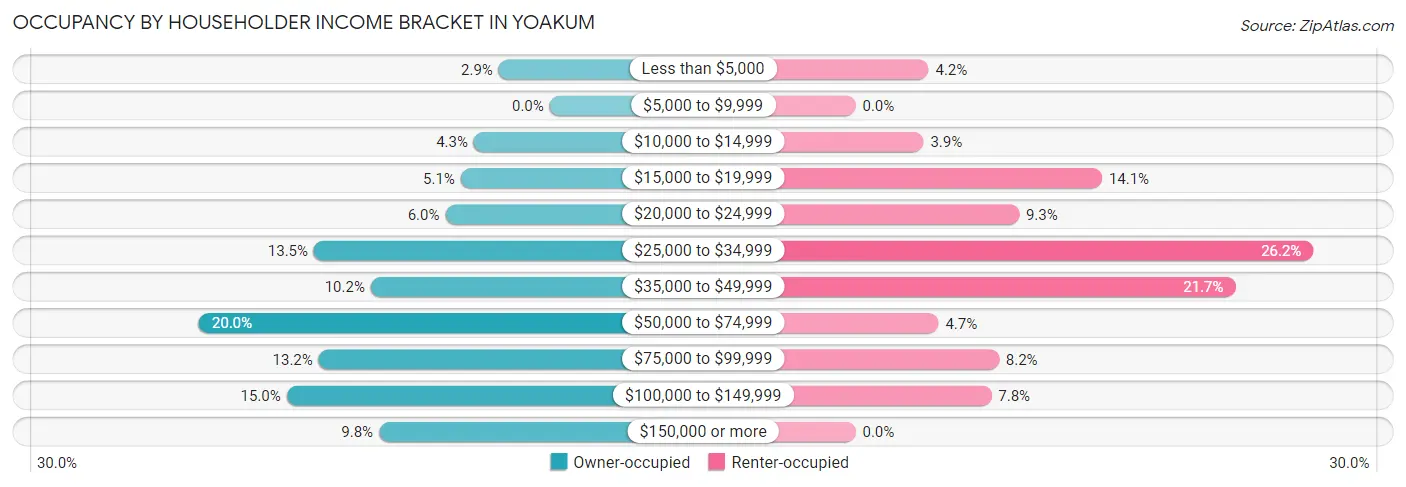
| Income Bracket | Owner-occupied | Renter-occupied |
| Less than $5,000 | 43 (2.9%) | 29 (4.2%) |
| $5,000 to $9,999 | 0 (0.0%) | 0 (0.0%) |
| $10,000 to $14,999 | 64 (4.3%) | 27 (3.9%) |
| $15,000 to $19,999 | 75 (5.1%) | 98 (14.1%) |
| $20,000 to $24,999 | 88 (6.0%) | 65 (9.3%) |
| $25,000 to $34,999 | 199 (13.5%) | 182 (26.2%) |
| $35,000 to $49,999 | 151 (10.2%) | 151 (21.7%) |
| $50,000 to $74,999 | 296 (20.0%) | 33 (4.7%) |
| $75,000 to $99,999 | 195 (13.2%) | 57 (8.2%) |
| $100,000 to $149,999 | 222 (15.0%) | 54 (7.8%) |
| $150,000 or more | 144 (9.8%) | 0 (0.0%) |
| Total | 1,477 (100.0%) | 696 (100.0%) |
Monthly Housing Cost Tiers in Yoakum
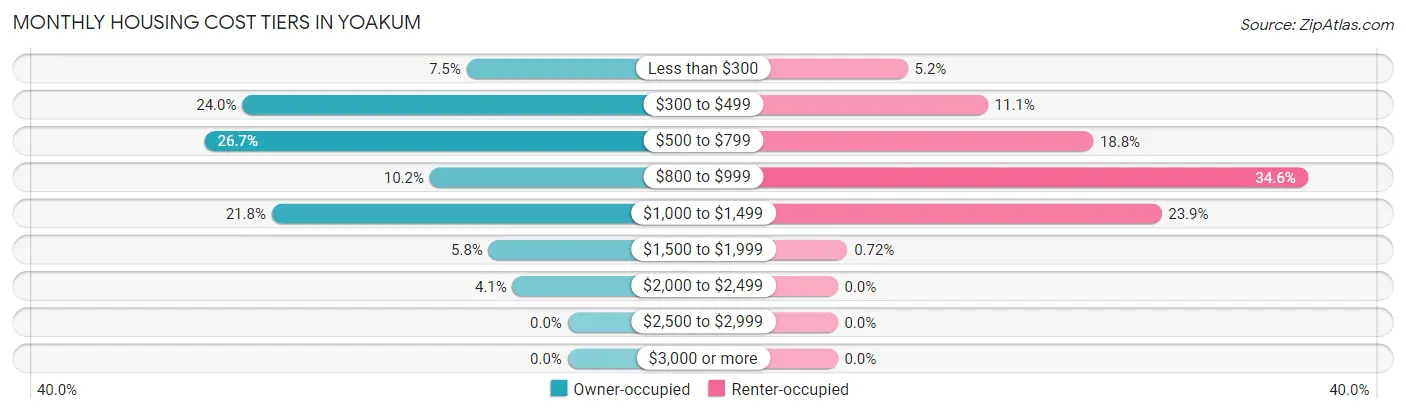
| Monthly Cost | Owner-occupied | Renter-occupied |
| Less than $300 | 110 (7.4%) | 36 (5.2%) |
| $300 to $499 | 354 (24.0%) | 77 (11.1%) |
| $500 to $799 | 395 (26.7%) | 131 (18.8%) |
| $800 to $999 | 150 (10.2%) | 241 (34.6%) |
| $1,000 to $1,499 | 322 (21.8%) | 166 (23.8%) |
| $1,500 to $1,999 | 86 (5.8%) | 5 (0.7%) |
| $2,000 to $2,499 | 60 (4.1%) | 0 (0.0%) |
| $2,500 to $2,999 | 0 (0.0%) | 0 (0.0%) |
| $3,000 or more | 0 (0.0%) | 0 (0.0%) |
| Total | 1,477 (100.0%) | 696 (100.0%) |
Physical Housing Characteristics in Yoakum
Housing Structures in Yoakum
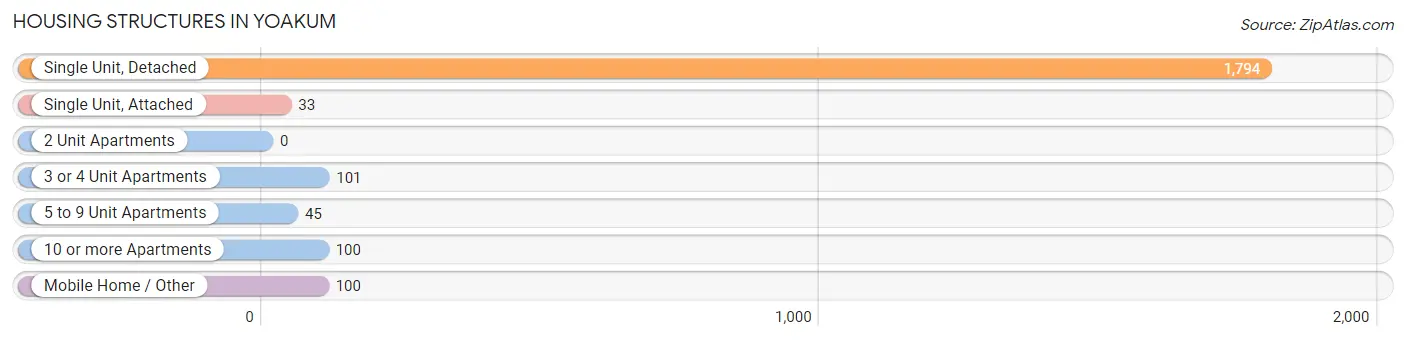
| Structure Type | # Housing Units | % Housing Units |
| Single Unit, Detached | 1,794 | 82.6% |
| Single Unit, Attached | 33 | 1.5% |
| 2 Unit Apartments | 0 | 0.0% |
| 3 or 4 Unit Apartments | 101 | 4.6% |
| 5 to 9 Unit Apartments | 45 | 2.1% |
| 10 or more Apartments | 100 | 4.6% |
| Mobile Home / Other | 100 | 4.6% |
| Total | 2,173 | 100.0% |
Housing Structures by Occupancy in Yoakum
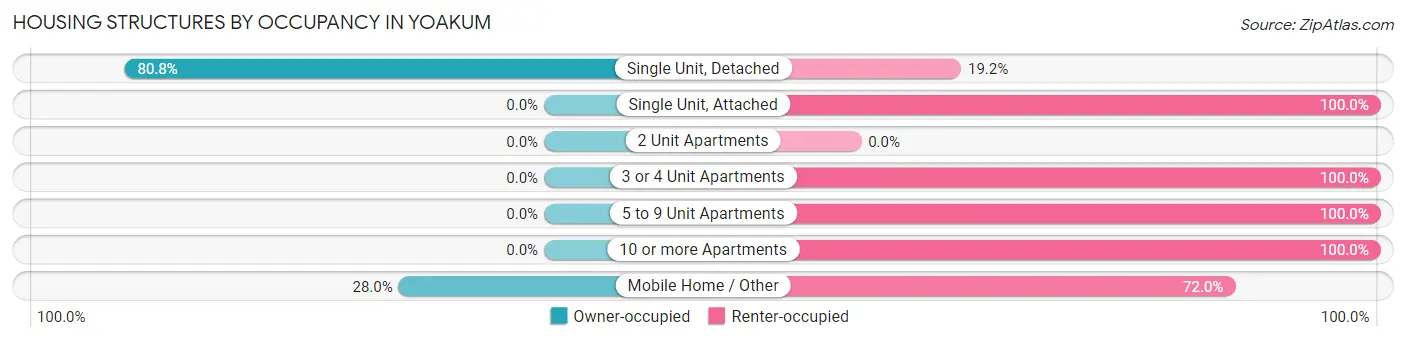
| Structure Type | Owner-occupied | Renter-occupied |
| Single Unit, Detached | 1,449 (80.8%) | 345 (19.2%) |
| Single Unit, Attached | 0 (0.0%) | 33 (100.0%) |
| 2 Unit Apartments | 0 (0.0%) | 0 (0.0%) |
| 3 or 4 Unit Apartments | 0 (0.0%) | 101 (100.0%) |
| 5 to 9 Unit Apartments | 0 (0.0%) | 45 (100.0%) |
| 10 or more Apartments | 0 (0.0%) | 100 (100.0%) |
| Mobile Home / Other | 28 (28.0%) | 72 (72.0%) |
| Total | 1,477 (68.0%) | 696 (32.0%) |
Housing Structures by Number of Rooms in Yoakum
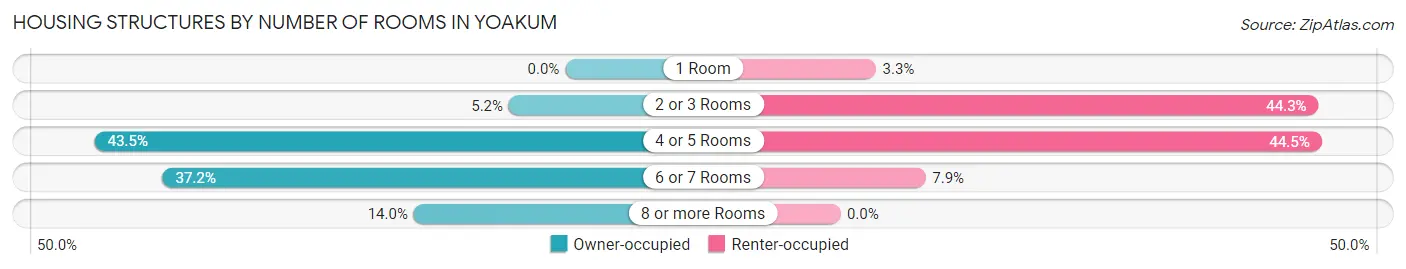
| Number of Rooms | Owner-occupied | Renter-occupied |
| 1 Room | 0 (0.0%) | 23 (3.3%) |
| 2 or 3 Rooms | 77 (5.2%) | 308 (44.3%) |
| 4 or 5 Rooms | 643 (43.5%) | 310 (44.5%) |
| 6 or 7 Rooms | 550 (37.2%) | 55 (7.9%) |
| 8 or more Rooms | 207 (14.0%) | 0 (0.0%) |
| Total | 1,477 (100.0%) | 696 (100.0%) |
Housing Structure by Heating Type in Yoakum
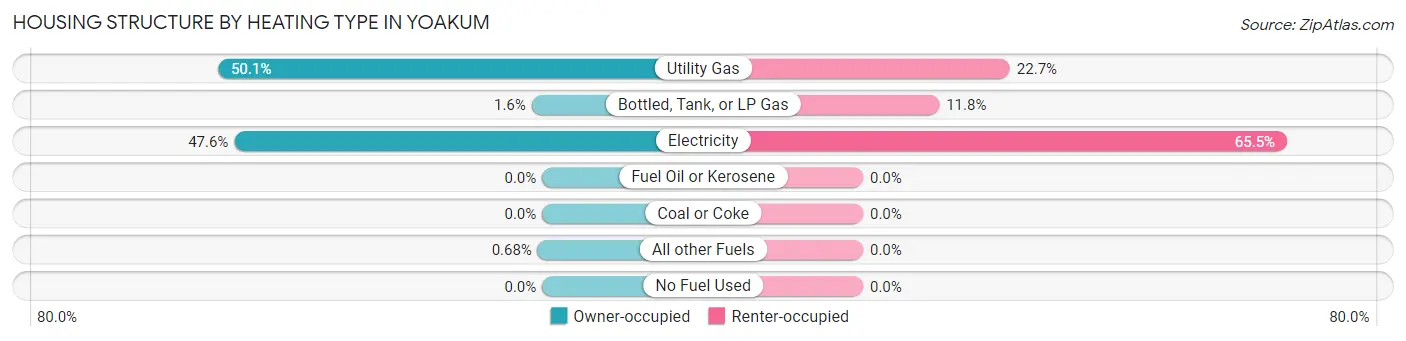
| Heating Type | Owner-occupied | Renter-occupied |
| Utility Gas | 740 (50.1%) | 158 (22.7%) |
| Bottled, Tank, or LP Gas | 24 (1.6%) | 82 (11.8%) |
| Electricity | 703 (47.6%) | 456 (65.5%) |
| Fuel Oil or Kerosene | 0 (0.0%) | 0 (0.0%) |
| Coal or Coke | 0 (0.0%) | 0 (0.0%) |
| All other Fuels | 10 (0.7%) | 0 (0.0%) |
| No Fuel Used | 0 (0.0%) | 0 (0.0%) |
| Total | 1,477 (100.0%) | 696 (100.0%) |
Household Vehicle Usage in Yoakum
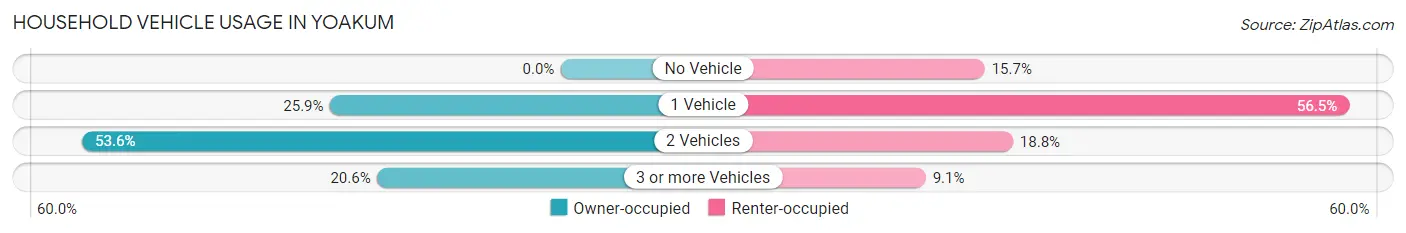
| Vehicles per Household | Owner-occupied | Renter-occupied |
| No Vehicle | 0 (0.0%) | 109 (15.7%) |
| 1 Vehicle | 382 (25.9%) | 393 (56.5%) |
| 2 Vehicles | 791 (53.5%) | 131 (18.8%) |
| 3 or more Vehicles | 304 (20.6%) | 63 (9.0%) |
| Total | 1,477 (100.0%) | 696 (100.0%) |
Real Estate & Mortgages in Yoakum
Real Estate and Mortgage Overview in Yoakum
| Characteristic | Without Mortgage | With Mortgage |
| Housing Units | 954 | 523 |
| Median Property Value | $111,100 | $170,300 |
| Median Household Income | $51,471 | $66 |
| Monthly Housing Costs | $508 | $0 |
| Real Estate Taxes | $1,432 | $30 |
Property Value by Mortgage Status in Yoakum
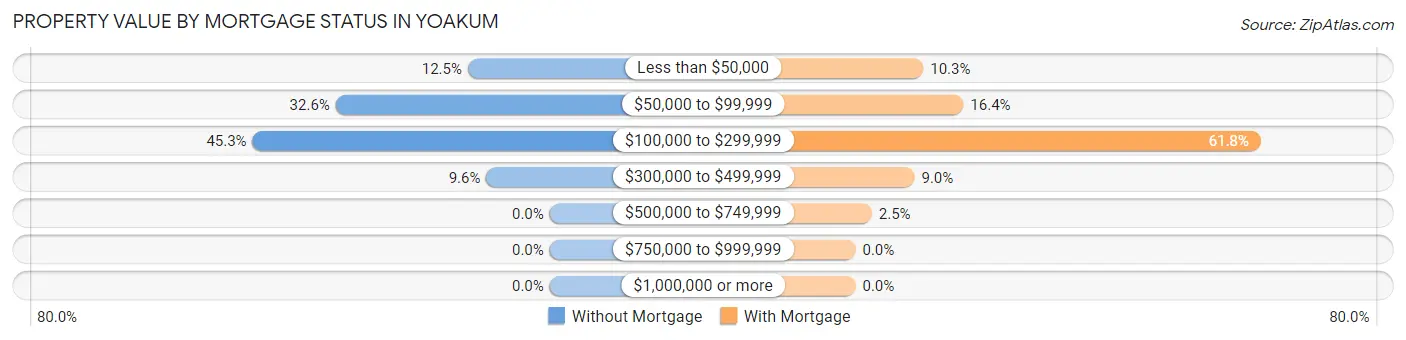
| Property Value | Without Mortgage | With Mortgage |
| Less than $50,000 | 119 (12.5%) | 54 (10.3%) |
| $50,000 to $99,999 | 311 (32.6%) | 86 (16.4%) |
| $100,000 to $299,999 | 432 (45.3%) | 323 (61.8%) |
| $300,000 to $499,999 | 92 (9.6%) | 47 (9.0%) |
| $500,000 to $749,999 | 0 (0.0%) | 13 (2.5%) |
| $750,000 to $999,999 | 0 (0.0%) | 0 (0.0%) |
| $1,000,000 or more | 0 (0.0%) | 0 (0.0%) |
| Total | 954 (100.0%) | 523 (100.0%) |
Household Income by Mortgage Status in Yoakum
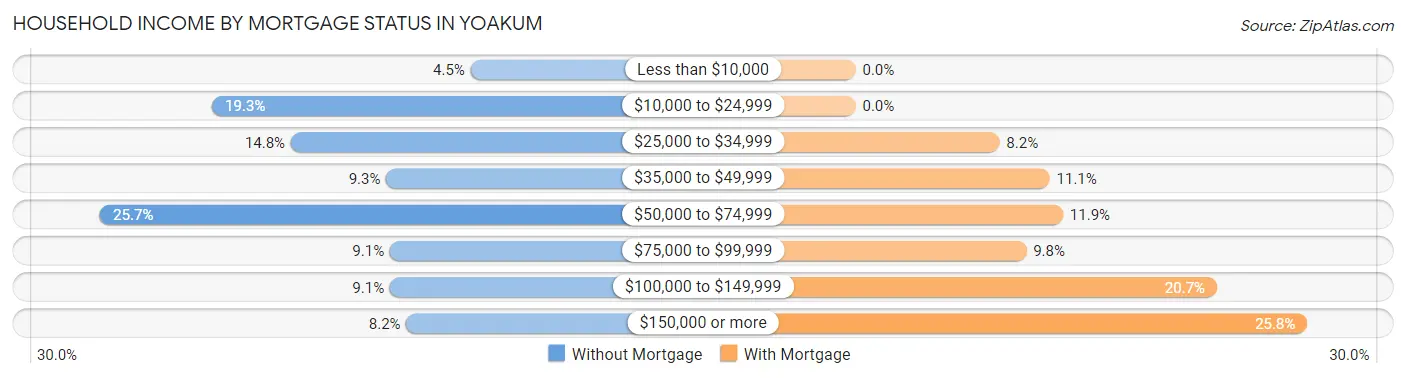
| Household Income | Without Mortgage | With Mortgage |
| Less than $10,000 | 43 (4.5%) | 0 (0.0%) |
| $10,000 to $24,999 | 184 (19.3%) | 0 (0.0%) |
| $25,000 to $34,999 | 141 (14.8%) | 43 (8.2%) |
| $35,000 to $49,999 | 89 (9.3%) | 58 (11.1%) |
| $50,000 to $74,999 | 245 (25.7%) | 62 (11.8%) |
| $75,000 to $99,999 | 87 (9.1%) | 51 (9.8%) |
| $100,000 to $149,999 | 87 (9.1%) | 108 (20.6%) |
| $150,000 or more | 78 (8.2%) | 135 (25.8%) |
| Total | 954 (100.0%) | 523 (100.0%) |
Property Value to Household Income Ratio in Yoakum
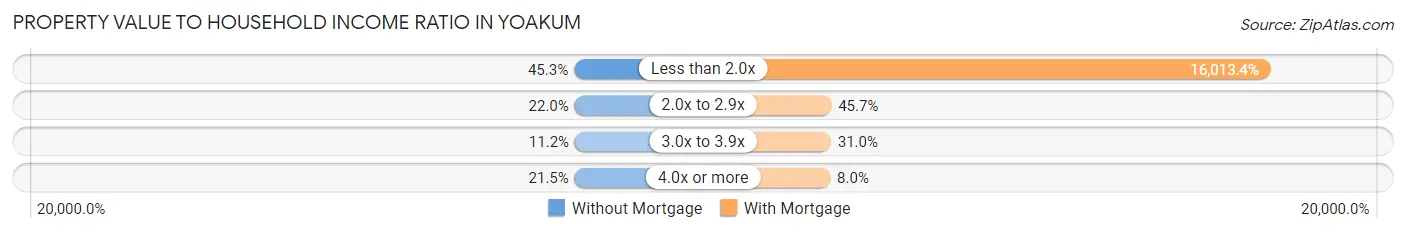
| Value-to-Income Ratio | Without Mortgage | With Mortgage |
| Less than 2.0x | 432 (45.3%) | 83,750 (16,013.4%) |
| 2.0x to 2.9x | 210 (22.0%) | 239 (45.7%) |
| 3.0x to 3.9x | 107 (11.2%) | 162 (31.0%) |
| 4.0x or more | 205 (21.5%) | 42 (8.0%) |
| Total | 954 (100.0%) | 523 (100.0%) |
Real Estate Taxes by Mortgage Status in Yoakum
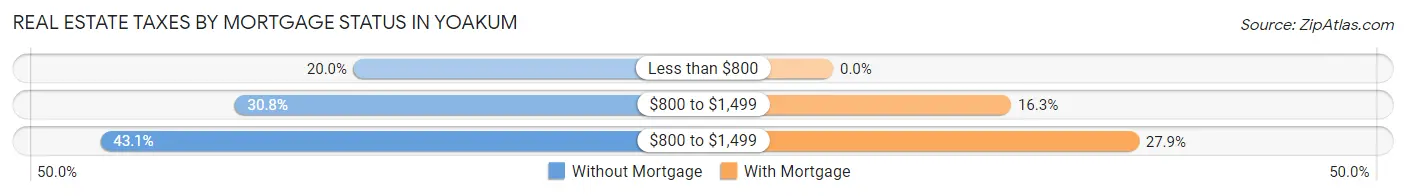
| Property Taxes | Without Mortgage | With Mortgage |
| Less than $800 | 191 (20.0%) | 0 (0.0%) |
| $800 to $1,499 | 294 (30.8%) | 85 (16.3%) |
| $800 to $1,499 | 411 (43.1%) | 146 (27.9%) |
| Total | 954 (100.0%) | 523 (100.0%) |
Health & Disability in Yoakum
Health Insurance Coverage by Age in Yoakum
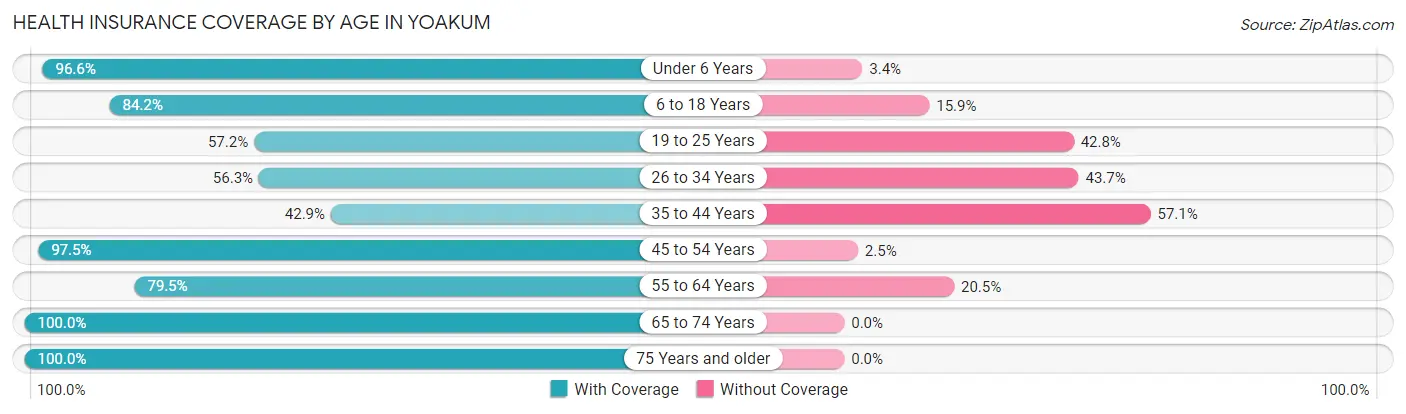
| Age Bracket | With Coverage | Without Coverage |
| Under 6 Years | 517 (96.6%) | 18 (3.4%) |
| 6 to 18 Years | 929 (84.2%) | 175 (15.9%) |
| 19 to 25 Years | 305 (57.2%) | 228 (42.8%) |
| 26 to 34 Years | 366 (56.3%) | 284 (43.7%) |
| 35 to 44 Years | 362 (42.9%) | 482 (57.1%) |
| 45 to 54 Years | 461 (97.5%) | 12 (2.5%) |
| 55 to 64 Years | 478 (79.5%) | 123 (20.5%) |
| 65 to 74 Years | 560 (100.0%) | 0 (0.0%) |
| 75 Years and older | 360 (100.0%) | 0 (0.0%) |
| Total | 4,338 (76.6%) | 1,322 (23.4%) |
Health Insurance Coverage by Citizenship Status in Yoakum
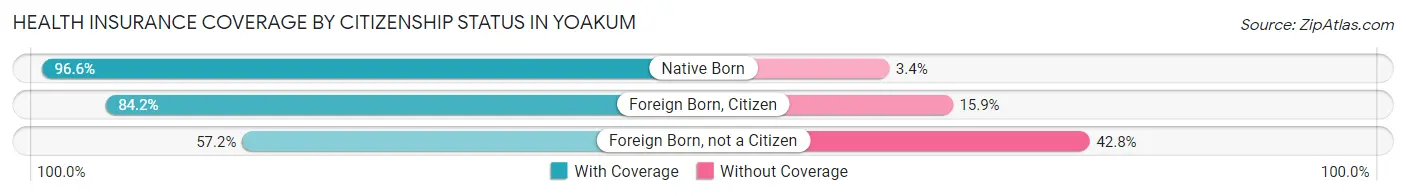
| Citizenship Status | With Coverage | Without Coverage |
| Native Born | 517 (96.6%) | 18 (3.4%) |
| Foreign Born, Citizen | 929 (84.2%) | 175 (15.9%) |
| Foreign Born, not a Citizen | 305 (57.2%) | 228 (42.8%) |
Health Insurance Coverage by Household Income in Yoakum
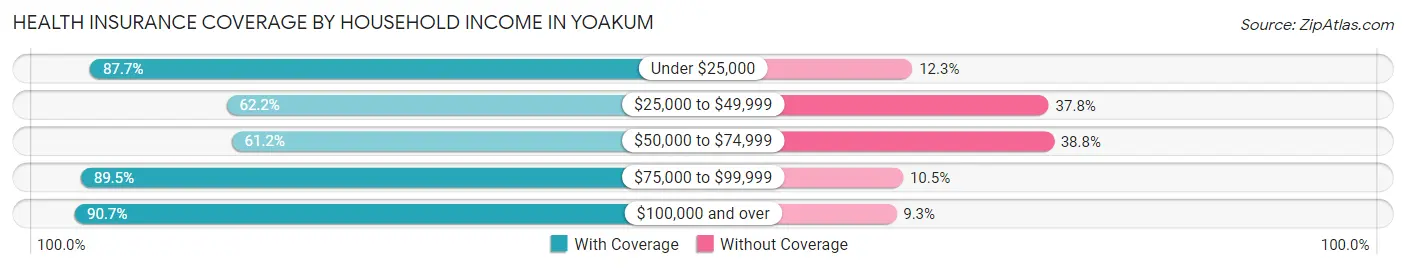
| Household Income | With Coverage | Without Coverage |
| Under $25,000 | 680 (87.7%) | 95 (12.3%) |
| $25,000 to $49,999 | 1,108 (62.2%) | 674 (37.8%) |
| $50,000 to $74,999 | 529 (61.2%) | 335 (38.8%) |
| $75,000 to $99,999 | 748 (89.5%) | 88 (10.5%) |
| $100,000 and over | 1,273 (90.7%) | 130 (9.3%) |
Public vs Private Health Insurance Coverage by Age in Yoakum
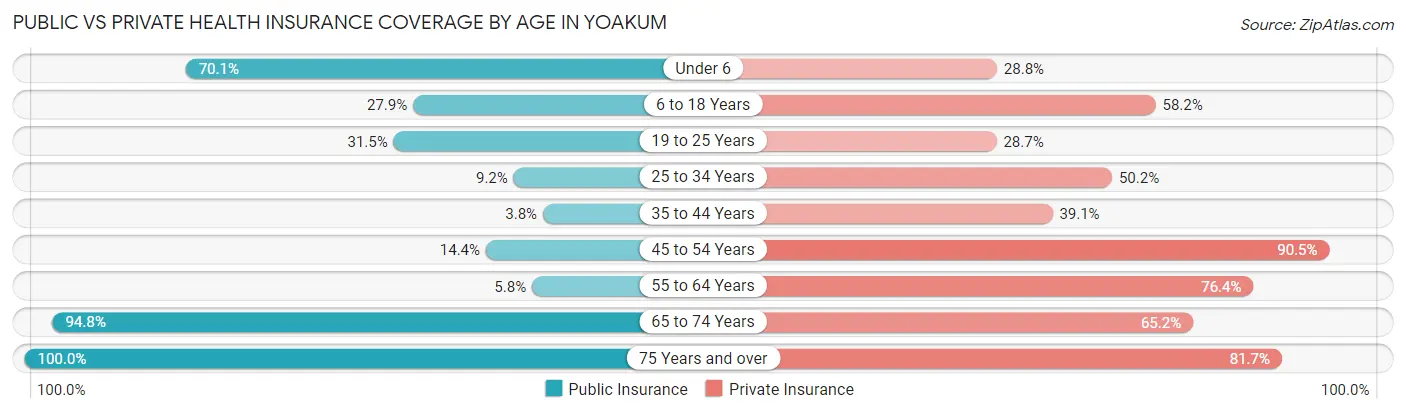
| Age Bracket | Public Insurance | Private Insurance |
| Under 6 | 375 (70.1%) | 154 (28.8%) |
| 6 to 18 Years | 308 (27.9%) | 643 (58.2%) |
| 19 to 25 Years | 168 (31.5%) | 153 (28.7%) |
| 25 to 34 Years | 60 (9.2%) | 326 (50.1%) |
| 35 to 44 Years | 32 (3.8%) | 330 (39.1%) |
| 45 to 54 Years | 68 (14.4%) | 428 (90.5%) |
| 55 to 64 Years | 35 (5.8%) | 459 (76.4%) |
| 65 to 74 Years | 531 (94.8%) | 365 (65.2%) |
| 75 Years and over | 360 (100.0%) | 294 (81.7%) |
| Total | 1,937 (34.2%) | 3,152 (55.7%) |
Disability Status by Sex by Age in Yoakum
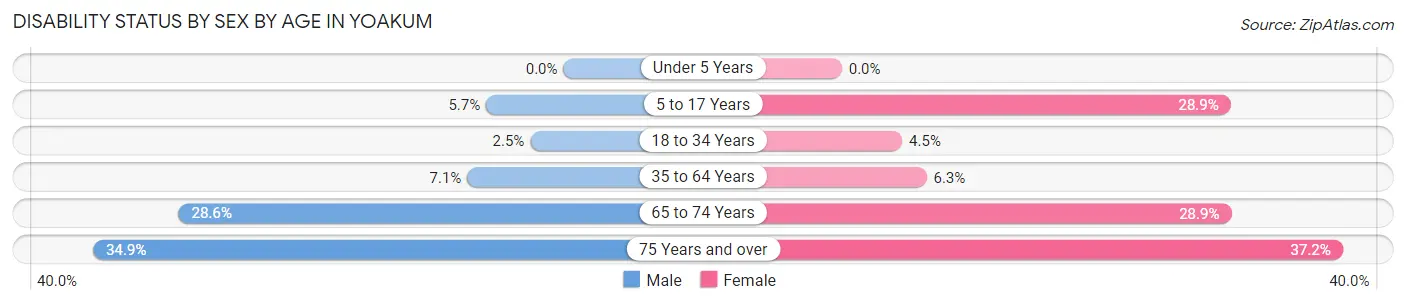
| Age Bracket | Male | Female |
| Under 5 Years | 0 (0.0%) | 0 (0.0%) |
| 5 to 17 Years | 38 (5.7%) | 127 (28.9%) |
| 18 to 34 Years | 16 (2.5%) | 29 (4.5%) |
| 35 to 64 Years | 70 (7.1%) | 59 (6.3%) |
| 65 to 74 Years | 76 (28.6%) | 85 (28.9%) |
| 75 Years and over | 44 (34.9%) | 87 (37.2%) |
Disability Class by Sex by Age in Yoakum
Disability Class: Hearing Difficulty
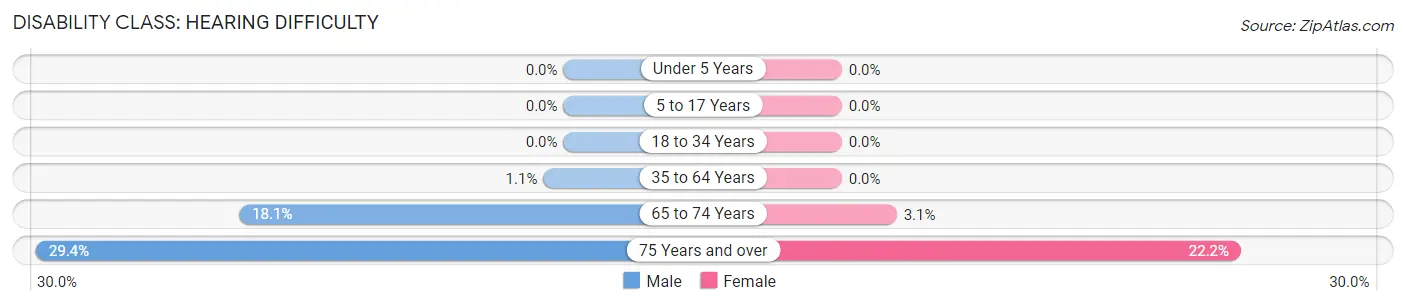
| Age Bracket | Male | Female |
| Under 5 Years | 0 (0.0%) | 0 (0.0%) |
| 5 to 17 Years | 0 (0.0%) | 0 (0.0%) |
| 18 to 34 Years | 0 (0.0%) | 0 (0.0%) |
| 35 to 64 Years | 11 (1.1%) | 0 (0.0%) |
| 65 to 74 Years | 48 (18.0%) | 9 (3.1%) |
| 75 Years and over | 37 (29.4%) | 52 (22.2%) |
Disability Class: Vision Difficulty
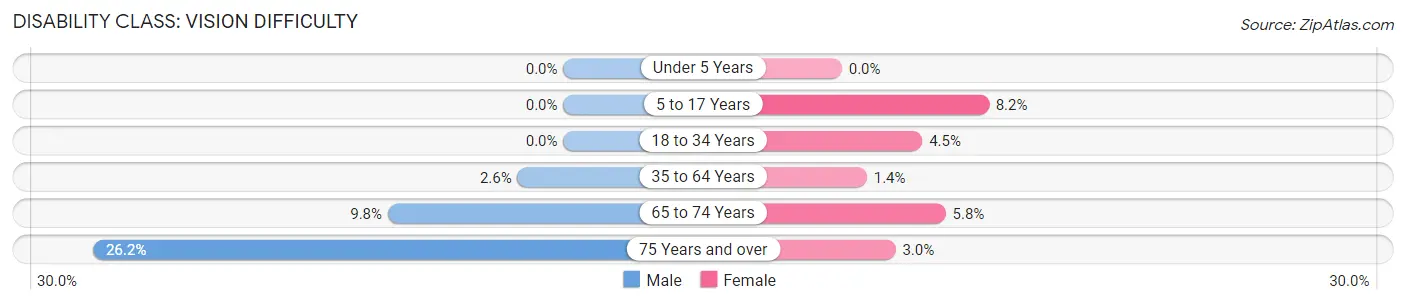
| Age Bracket | Male | Female |
| Under 5 Years | 0 (0.0%) | 0 (0.0%) |
| 5 to 17 Years | 0 (0.0%) | 36 (8.2%) |
| 18 to 34 Years | 0 (0.0%) | 29 (4.5%) |
| 35 to 64 Years | 25 (2.5%) | 13 (1.4%) |
| 65 to 74 Years | 26 (9.8%) | 17 (5.8%) |
| 75 Years and over | 33 (26.2%) | 7 (3.0%) |
Disability Class: Cognitive Difficulty
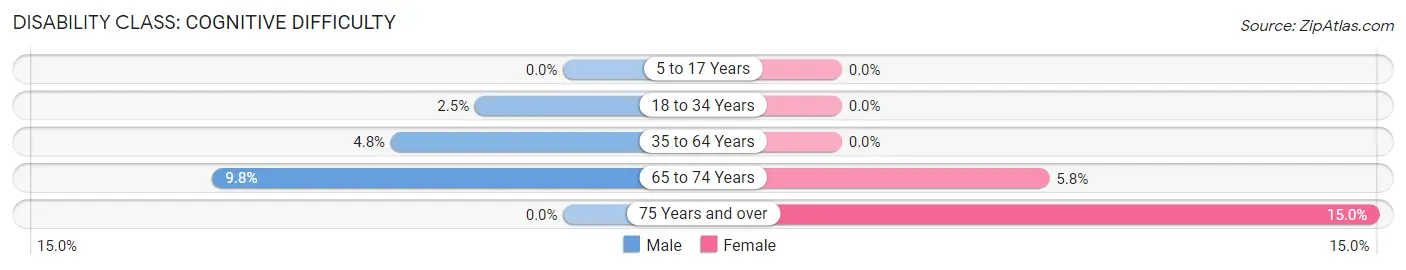
| Age Bracket | Male | Female |
| 5 to 17 Years | 0 (0.0%) | 0 (0.0%) |
| 18 to 34 Years | 16 (2.5%) | 0 (0.0%) |
| 35 to 64 Years | 47 (4.8%) | 0 (0.0%) |
| 65 to 74 Years | 26 (9.8%) | 17 (5.8%) |
| 75 Years and over | 0 (0.0%) | 35 (15.0%) |
Disability Class: Ambulatory Difficulty
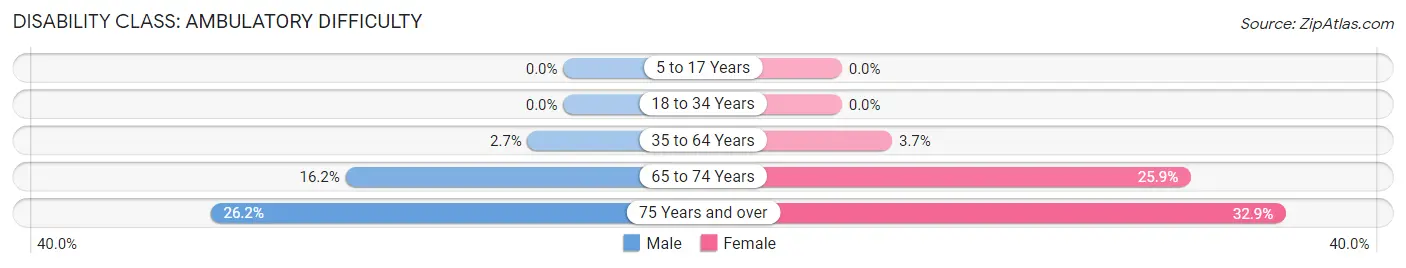
| Age Bracket | Male | Female |
| 5 to 17 Years | 0 (0.0%) | 0 (0.0%) |
| 18 to 34 Years | 0 (0.0%) | 0 (0.0%) |
| 35 to 64 Years | 26 (2.6%) | 35 (3.7%) |
| 65 to 74 Years | 43 (16.2%) | 76 (25.9%) |
| 75 Years and over | 33 (26.2%) | 77 (32.9%) |
Disability Class: Self-Care Difficulty
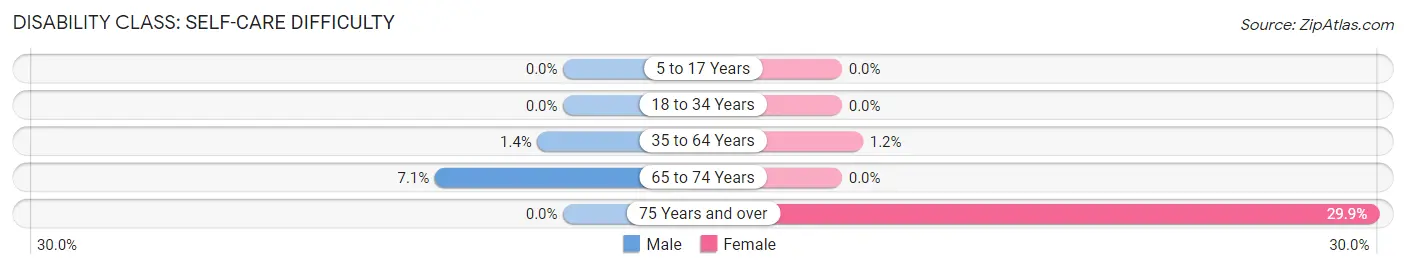
| Age Bracket | Male | Female |
| 5 to 17 Years | 0 (0.0%) | 0 (0.0%) |
| 18 to 34 Years | 0 (0.0%) | 0 (0.0%) |
| 35 to 64 Years | 14 (1.4%) | 11 (1.2%) |
| 65 to 74 Years | 19 (7.1%) | 0 (0.0%) |
| 75 Years and over | 0 (0.0%) | 70 (29.9%) |
Technology Access in Yoakum
Computing Device Access in Yoakum
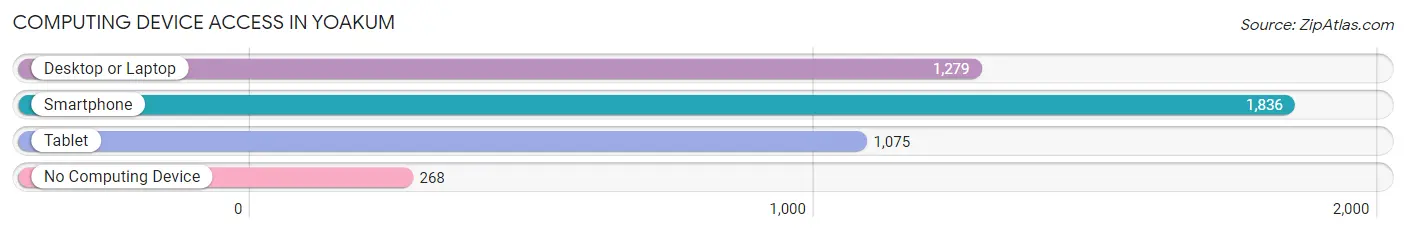
| Device Type | # Households | % Households |
| Desktop or Laptop | 1,279 | 58.9% |
| Smartphone | 1,836 | 84.5% |
| Tablet | 1,075 | 49.5% |
| No Computing Device | 268 | 12.3% |
| Total | 2,173 | 100.0% |
Internet Access in Yoakum
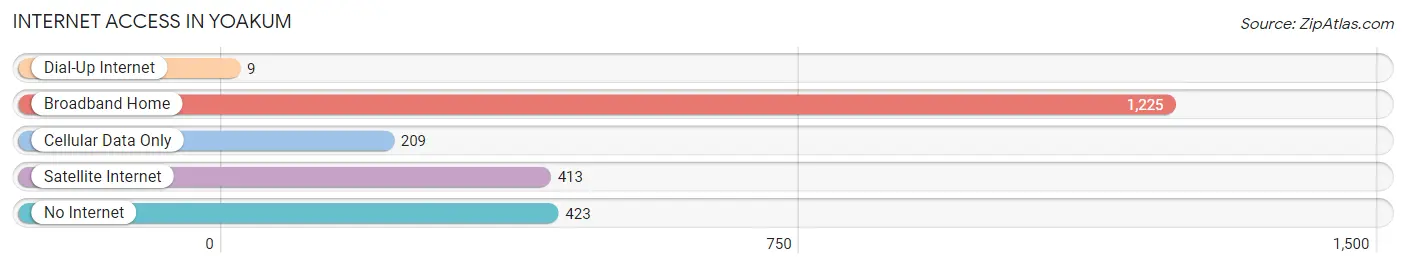
| Internet Type | # Households | % Households |
| Dial-Up Internet | 9 | 0.4% |
| Broadband Home | 1,225 | 56.4% |
| Cellular Data Only | 209 | 9.6% |
| Satellite Internet | 413 | 19.0% |
| No Internet | 423 | 19.5% |
| Total | 2,173 | 100.0% |
Yoakum Summary
Yoakum, Texas is a small city located in Lavaca County, Texas. It is situated about halfway between Houston and San Antonio, and is part of the Victoria Metropolitan Statistical Area. The city has a population of 5,715 as of the 2010 census, and is the county seat of Lavaca County.
History
Yoakum was founded in 1887 by the Yoakum Land and Town Company, which was formed by a group of investors from Galveston. The town was named after Henry Yoakum, a prominent Galveston businessman. The town was originally intended to be a stop on the San Antonio and Aransas Pass Railway, but the railroad bypassed the town and instead went through nearby Hallettsville. Despite this setback, the town continued to grow and by 1890, it had a population of 1,000.
In the early 1900s, Yoakum experienced a period of growth and prosperity. The town was home to several businesses, including a cotton gin, a lumber mill, and a brick factory. The town also had a number of churches, schools, and a hospital.
In the 1920s, Yoakum began to decline as the railroad bypassed the town and the Great Depression hit. The population dropped to just over 1,000 by 1940. However, the town began to experience a resurgence in the 1950s and 1960s, as the economy improved and the population grew to over 5,000.
Geography
Yoakum is located in Lavaca County, Texas, about halfway between Houston and San Antonio. The city is situated at the intersection of U.S. Highway 77 and State Highway 111. The city covers an area of 4.2 square miles, and has a population of 5,715 as of the 2010 census.
The climate in Yoakum is classified as humid subtropical, with hot summers and mild winters. The average annual temperature is 68°F, and the average annual precipitation is 33 inches.
Economy
Yoakum’s economy is largely based on agriculture and manufacturing. The city is home to several large agricultural operations, including a cotton gin, a feed mill, and a dairy. The city is also home to several manufacturing companies, including a furniture factory, a plastics factory, and a metal fabrication plant.
The city is also home to several retail stores, restaurants, and other businesses. The city is served by the Yoakum Independent School District, which has three elementary schools, one middle school, and one high school.
Demographics
As of the 2010 census, Yoakum had a population of 5,715. The racial makeup of the city was 79.3% White, 0.7% African American, 0.3% Native American, 0.2% Asian, 0.1% Pacific Islander, 17.3% from other races, and 2.2% from two or more races. Hispanic or Latino of any race were 37.2% of the population.
The median income for a household in Yoakum was $31,250, and the median income for a family was $37,500. The per capita income for the city was $15,945. About 18.2% of the population was below the poverty line.
Yoakum is a small city with a rich history and a diverse population. The city is home to several businesses and industries, and is served by the Yoakum Independent School District. The city has a population of 5,715 as of the 2010 census, and is the county seat of Lavaca County.
Common Questions
What is Per Capita Income in Yoakum?
Per Capita income in Yoakum is $24,567.
What is the Median Family Income in Yoakum?
Median Family Income in Yoakum is $57,925.
What is the Median Household income in Yoakum?
Median Household Income in Yoakum is $44,627.
What is Income or Wage Gap in Yoakum?
Income or Wage Gap in Yoakum is 21.9%.
Women in Yoakum earn 78.1 cents for every dollar earned by a man.
What is Inequality or Gini Index in Yoakum?
Inequality or Gini Index in Yoakum is 0.42.
What is the Total Population of Yoakum?
Total Population of Yoakum is 5,841.
What is the Total Male Population of Yoakum?
Total Male Population of Yoakum is 2,899.
What is the Total Female Population of Yoakum?
Total Female Population of Yoakum is 2,942.
What is the Ratio of Males per 100 Females in Yoakum?
There are 98.54 Males per 100 Females in Yoakum.
What is the Ratio of Females per 100 Males in Yoakum?
There are 101.48 Females per 100 Males in Yoakum.
What is the Median Population Age in Yoakum?
Median Population Age in Yoakum is 36.2 Years.
What is the Average Family Size in Yoakum
Average Family Size in Yoakum is 3.2 People.
What is the Average Household Size in Yoakum
Average Household Size in Yoakum is 2.6 People.
How Large is the Labor Force in Yoakum?
There are 2,596 People in the Labor Forcein in Yoakum.
What is the Percentage of People in the Labor Force in Yoakum?
58.1% of People are in the Labor Force in Yoakum.
What is the Unemployment Rate in Yoakum?
Unemployment Rate in Yoakum is 0.5%.