La Cienega, NM Map & Demographics
La Cienega Map
La Cienega Overview
$32,613
PER CAPITA INCOME
$74,672
AVG FAMILY INCOME
$72,959
AVG HOUSEHOLD INCOME
28.7%
WAGE / INCOME GAP [ % ]
71.3¢/ $1
WAGE / INCOME GAP [ $ ]
0.41
INEQUALITY / GINI INDEX
3,948
TOTAL POPULATION
1,898
MALE POPULATION
2,050
FEMALE POPULATION
92.59
MALES / 100 FEMALES
108.01
FEMALES / 100 MALES
37.4
MEDIAN AGE
3.4
AVG FAMILY SIZE
3.0
AVG HOUSEHOLD SIZE
2,284
LABOR FORCE [ PEOPLE ]
72.7%
PERCENT IN LABOR FORCE
6.0%
UNEMPLOYMENT RATE
Income in La Cienega
Income Overview in La Cienega
Per Capita Income in La Cienega is $32,613, while median incomes of families and households are $74,672 and $72,959 respectively.
| Characteristic | Number | Measure |
| Per Capita Income | 3,948 | $32,613 |
| Median Family Income | 1,019 | $74,672 |
| Mean Family Income | 1,019 | $98,905 |
| Median Household Income | 1,321 | $72,959 |
| Mean Household Income | 1,321 | $95,927 |
| Income Deficit | 1,019 | $0 |
| Wage / Income Gap (%) | 3,948 | 28.66% |
| Wage / Income Gap ($) | 3,948 | 71.34¢ per $1 |
| Gini / Inequality Index | 3,948 | 0.41 |
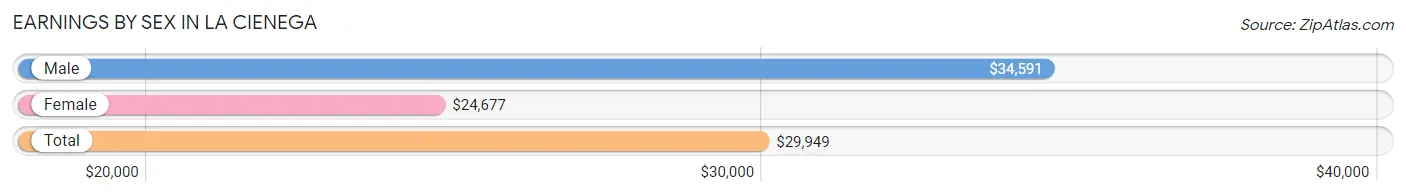
Earnings by Sex in La Cienega
Average Earnings in La Cienega are $29,949, $34,591 for men and $24,677 for women, a difference of 28.7%.
| Sex | Number | Average Earnings |
| Male | 1,215 (53.8%) | $34,591 |
| Female | 1,044 (46.2%) | $24,677 |
| Total | 2,259 (100.0%) | $29,949 |
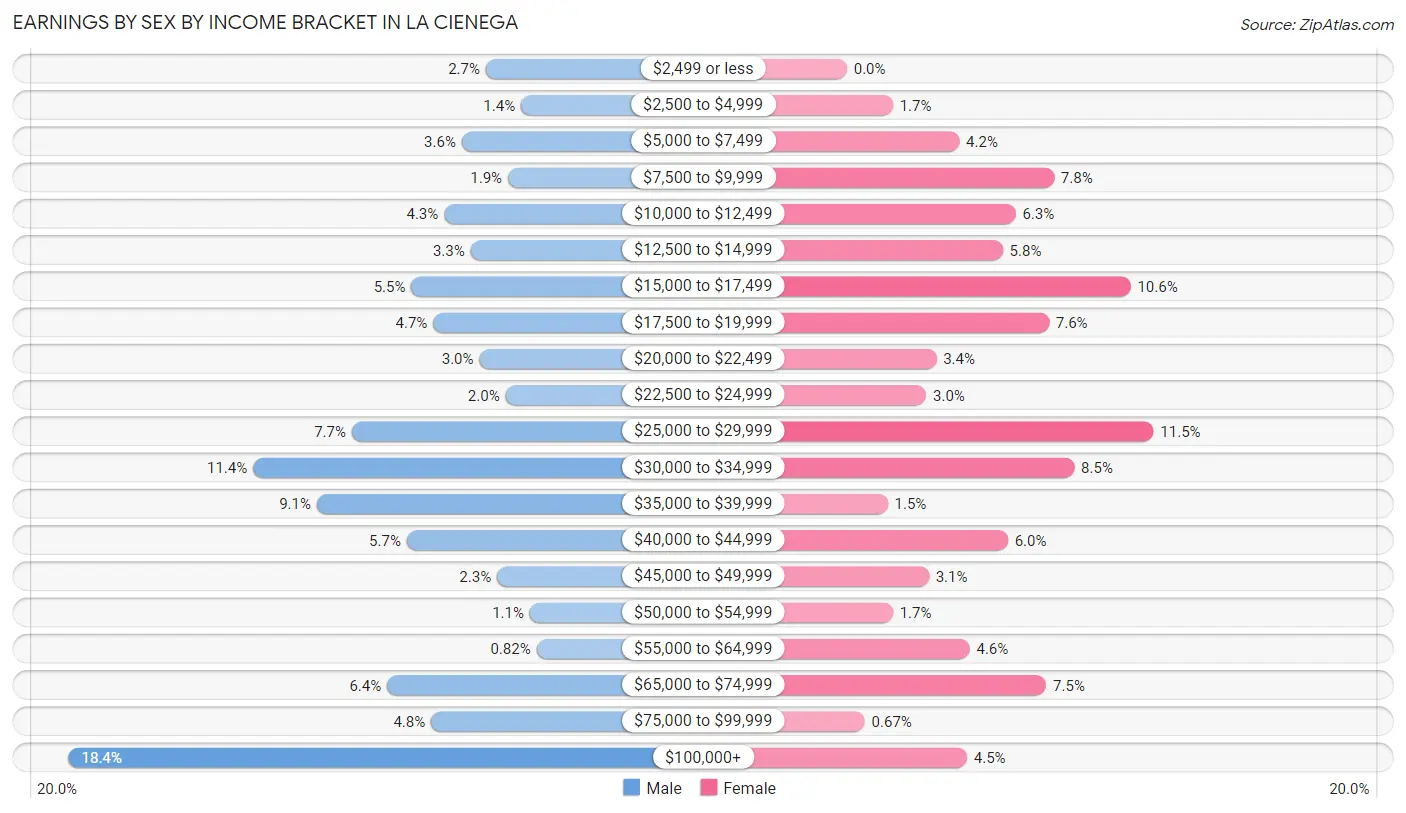
Earnings by Sex by Income Bracket in La Cienega
The most common earnings brackets in La Cienega are $100,000+ for men (223 | 18.3%) and $25,000 to $29,999 for women (120 | 11.5%).
| Income | Male | Female |
| $2,499 or less | 33 (2.7%) | 0 (0.0%) |
| $2,500 to $4,999 | 17 (1.4%) | 18 (1.7%) |
| $5,000 to $7,499 | 44 (3.6%) | 44 (4.2%) |
| $7,500 to $9,999 | 23 (1.9%) | 81 (7.8%) |
| $10,000 to $12,499 | 52 (4.3%) | 66 (6.3%) |
| $12,500 to $14,999 | 40 (3.3%) | 61 (5.8%) |
| $15,000 to $17,499 | 67 (5.5%) | 111 (10.6%) |
| $17,500 to $19,999 | 57 (4.7%) | 79 (7.6%) |
| $20,000 to $22,499 | 36 (3.0%) | 35 (3.4%) |
| $22,500 to $24,999 | 24 (2.0%) | 31 (3.0%) |
| $25,000 to $29,999 | 94 (7.7%) | 120 (11.5%) |
| $30,000 to $34,999 | 139 (11.4%) | 89 (8.5%) |
| $35,000 to $39,999 | 110 (9.0%) | 16 (1.5%) |
| $40,000 to $44,999 | 69 (5.7%) | 63 (6.0%) |
| $45,000 to $49,999 | 28 (2.3%) | 32 (3.1%) |
| $50,000 to $54,999 | 13 (1.1%) | 18 (1.7%) |
| $55,000 to $64,999 | 10 (0.8%) | 48 (4.6%) |
| $65,000 to $74,999 | 78 (6.4%) | 78 (7.5%) |
| $75,000 to $99,999 | 58 (4.8%) | 7 (0.7%) |
| $100,000+ | 223 (18.3%) | 47 (4.5%) |
| Total | 1,215 (100.0%) | 1,044 (100.0%) |
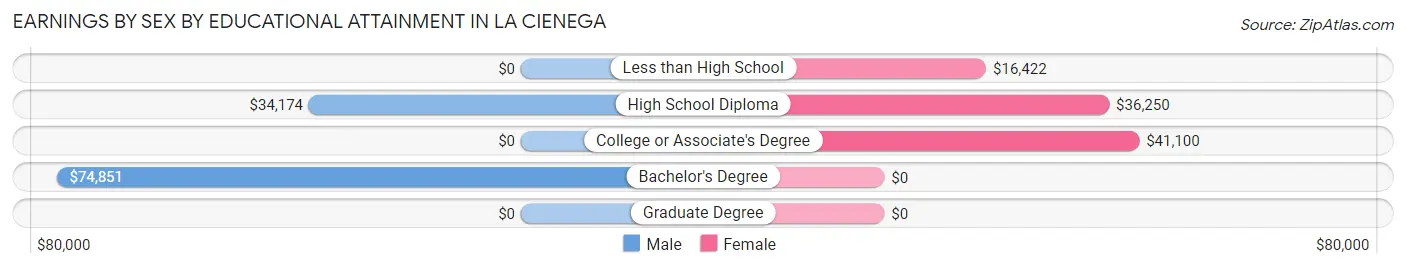
Earnings by Sex by Educational Attainment in La Cienega
Average earnings in La Cienega are $38,770 for men and $25,341 for women, a difference of 34.6%. Men with an educational attainment of bachelor's degree enjoy the highest average annual earnings of $74,851, while those with high school diploma education earn the least with $34,174. Women with an educational attainment of college or associate's degree earn the most with the average annual earnings of $41,100, while those with less than high school education have the smallest earnings of $16,422.
| Educational Attainment | Male Income | Female Income |
| Less than High School | - | - |
| High School Diploma | $34,174 | $36,250 |
| College or Associate's Degree | - | - |
| Bachelor's Degree | $74,851 | $0 |
| Graduate Degree | - | - |
| Total | $38,770 | $25,341 |
Family Income in La Cienega
Family Income Brackets in La Cienega
According to the La Cienega family income data, there are 242 families falling into the $50,000 to $74,999 income range, which is the most common income bracket and makes up 23.7% of all families.
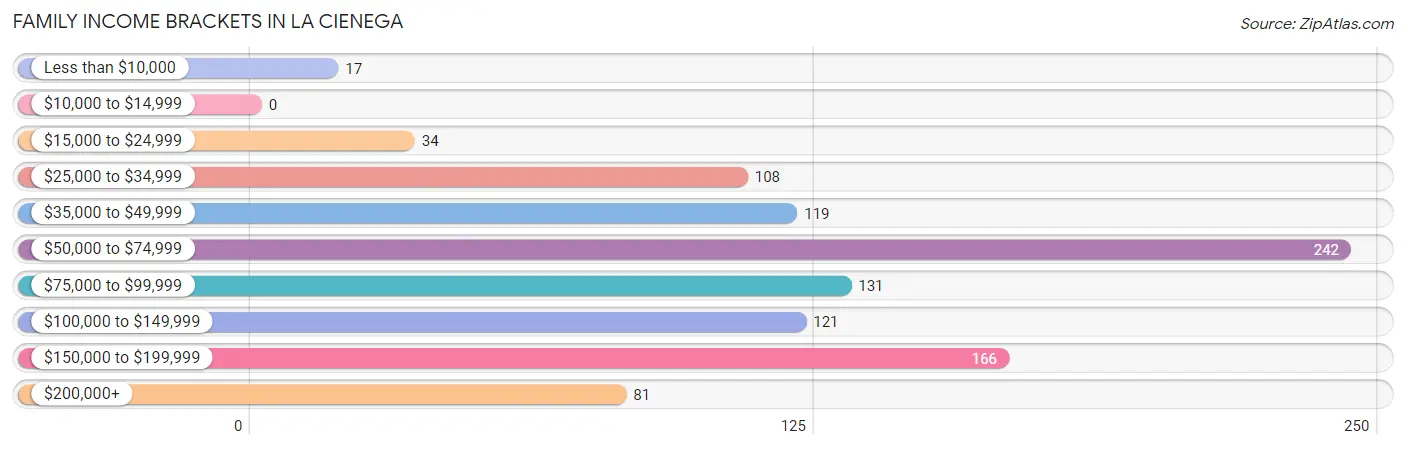
| Income Bracket | # Families | % Families |
| Less than $10,000 | 17 | 1.7% |
| $10,000 to $14,999 | 0 | 0.0% |
| $15,000 to $24,999 | 34 | 3.3% |
| $25,000 to $34,999 | 108 | 10.6% |
| $35,000 to $49,999 | 119 | 11.7% |
| $50,000 to $74,999 | 242 | 23.7% |
| $75,000 to $99,999 | 131 | 12.9% |
| $100,000 to $149,999 | 121 | 11.9% |
| $150,000 to $199,999 | 166 | 16.3% |
| $200,000+ | 81 | 7.9% |
Family Income by Famaliy Size in La Cienega
5-person families (132 | 13.0%) account for the highest median family income in La Cienega with $148,611 per family, while 2-person families (397 | 39.0%) have the highest median income of $30,625 per family member.
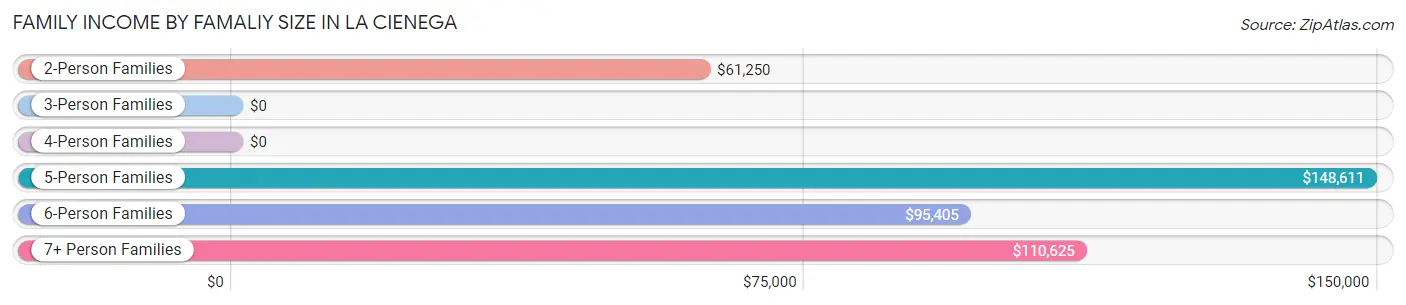
| Income Bracket | # Families | Median Income |
| 2-Person Families | 397 (39.0%) | $61,250 |
| 3-Person Families | 303 (29.7%) | $0 |
| 4-Person Families | 65 (6.4%) | $0 |
| 5-Person Families | 132 (13.0%) | $148,611 |
| 6-Person Families | 88 (8.6%) | $95,405 |
| 7+ Person Families | 34 (3.3%) | $110,625 |
| Total | 1,019 (100.0%) | $74,672 |
Family Income by Number of Earners in La Cienega
The median family income in La Cienega is $74,672, with families comprising 3+ earners (125) having the highest median family income of $111,719, while families with 1 earner (264) have the lowest median family income of $56,429, accounting for 12.3% and 25.9% of families, respectively.
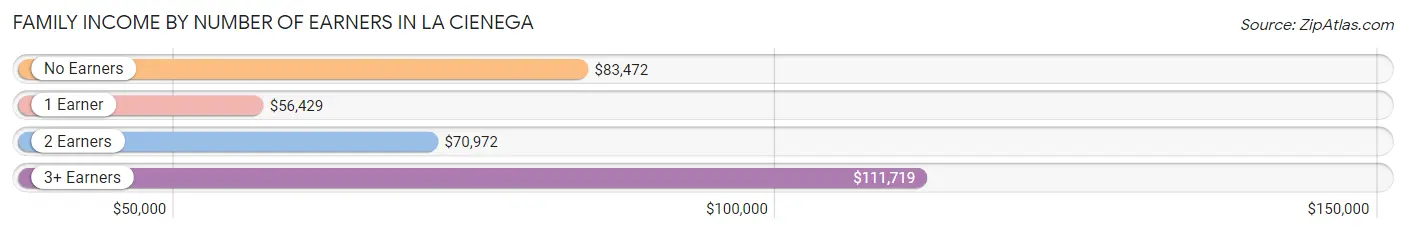
| Number of Earners | # Families | Median Income |
| No Earners | 75 (7.4%) | $83,472 |
| 1 Earner | 264 (25.9%) | $56,429 |
| 2 Earners | 555 (54.5%) | $70,972 |
| 3+ Earners | 125 (12.3%) | $111,719 |
| Total | 1,019 (100.0%) | $74,672 |
Household Income in La Cienega
Household Income Brackets in La Cienega
With 259 households falling in the category, the $50,000 to $74,999 income range is the most frequent in La Cienega, accounting for 19.6% of all households. In contrast, only 29 households (2.2%) fall into the $10,000 to $14,999 income bracket, making it the least populous group.
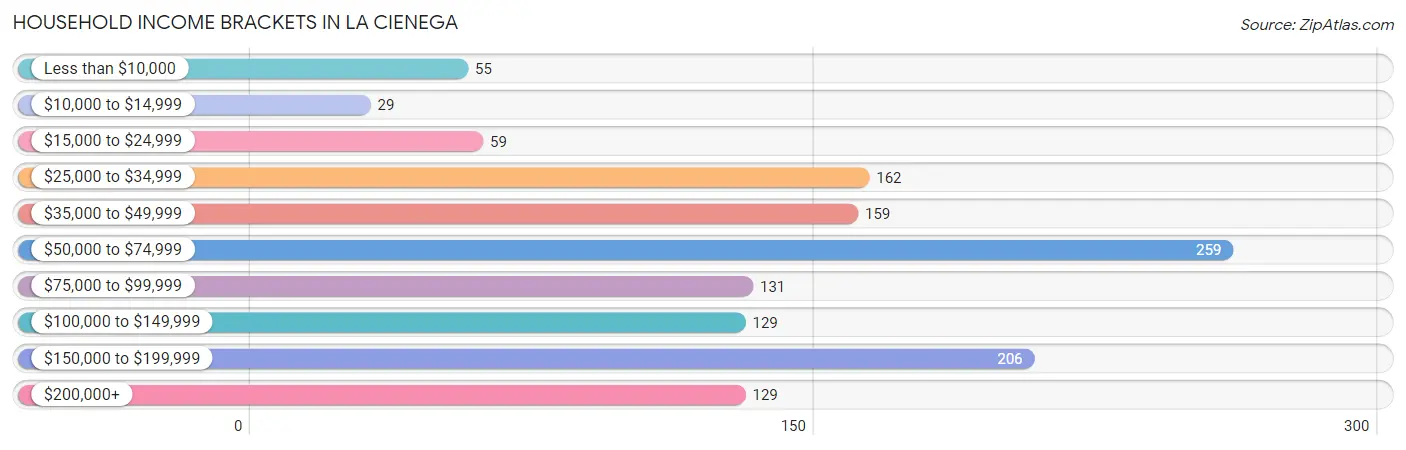
| Income Bracket | # Households | % Households |
| Less than $10,000 | 55 | 4.2% |
| $10,000 to $14,999 | 29 | 2.2% |
| $15,000 to $24,999 | 59 | 4.5% |
| $25,000 to $34,999 | 162 | 12.3% |
| $35,000 to $49,999 | 159 | 12.0% |
| $50,000 to $74,999 | 259 | 19.6% |
| $75,000 to $99,999 | 131 | 9.9% |
| $100,000 to $149,999 | 129 | 9.8% |
| $150,000 to $199,999 | 206 | 15.6% |
| $200,000+ | 129 | 9.8% |
Household Income by Householder Age in La Cienega
The median household income in La Cienega is $72,959, with the highest median household income of $74,241 found in the 45 to 64 years age bracket for the primary householder. A total of 676 households (51.2%) fall into this category. Meanwhile, the 15 to 24 years age bracket for the primary householder has the lowest median household income of $0, with 40 households (3.0%) in this group.
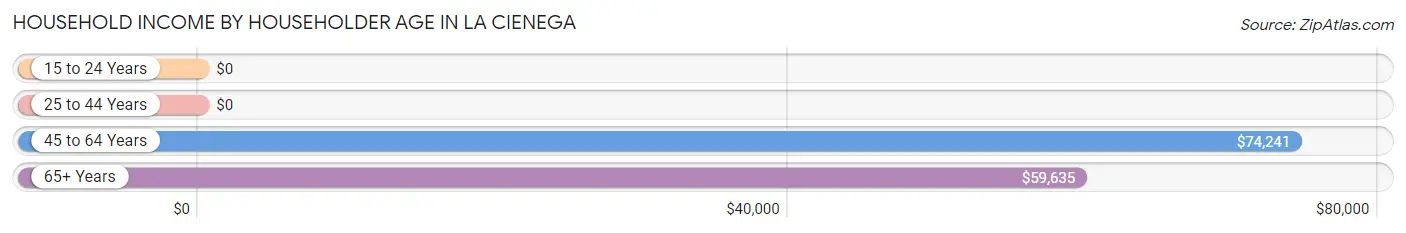
| Income Bracket | # Households | Median Income |
| 15 to 24 Years | 40 (3.0%) | $0 |
| 25 to 44 Years | 368 (27.9%) | $0 |
| 45 to 64 Years | 676 (51.2%) | $74,241 |
| 65+ Years | 237 (17.9%) | $59,635 |
| Total | 1,321 (100.0%) | $72,959 |
Poverty in La Cienega
Income Below Poverty by Sex and Age in La Cienega
With 5.7% poverty level for males and 5.1% for females among the residents of La Cienega, 35 to 44 year old males and 65 to 74 year old females are the most vulnerable to poverty, with 48 males (14.7%) and 23 females (15.9%) in their respective age groups living below the poverty level.
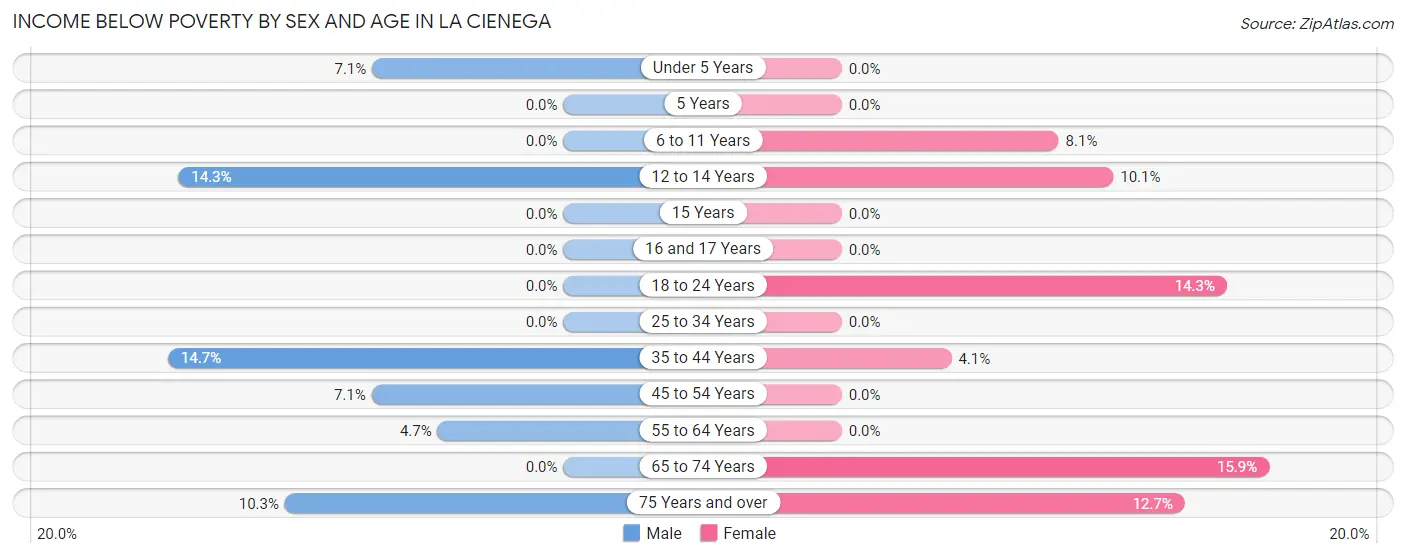
| Age Bracket | Male | Female |
| Under 5 Years | 11 (7.1%) | 0 (0.0%) |
| 5 Years | 0 (0.0%) | 0 (0.0%) |
| 6 to 11 Years | 0 (0.0%) | 12 (8.1%) |
| 12 to 14 Years | 8 (14.3%) | 12 (10.1%) |
| 15 Years | 0 (0.0%) | 0 (0.0%) |
| 16 and 17 Years | 0 (0.0%) | 0 (0.0%) |
| 18 to 24 Years | 0 (0.0%) | 39 (14.3%) |
| 25 to 34 Years | 0 (0.0%) | 0 (0.0%) |
| 35 to 44 Years | 48 (14.7%) | 11 (4.1%) |
| 45 to 54 Years | 22 (7.1%) | 0 (0.0%) |
| 55 to 64 Years | 14 (4.7%) | 0 (0.0%) |
| 65 to 74 Years | 0 (0.0%) | 23 (15.9%) |
| 75 Years and over | 6 (10.3%) | 7 (12.7%) |
| Total | 109 (5.7%) | 104 (5.1%) |
Income Above Poverty by Sex and Age in La Cienega
According to the poverty statistics in La Cienega, males aged 5 years and females aged under 5 years are the age groups that are most secure financially, with 100.0% of males and 100.0% of females in these age groups living above the poverty line.
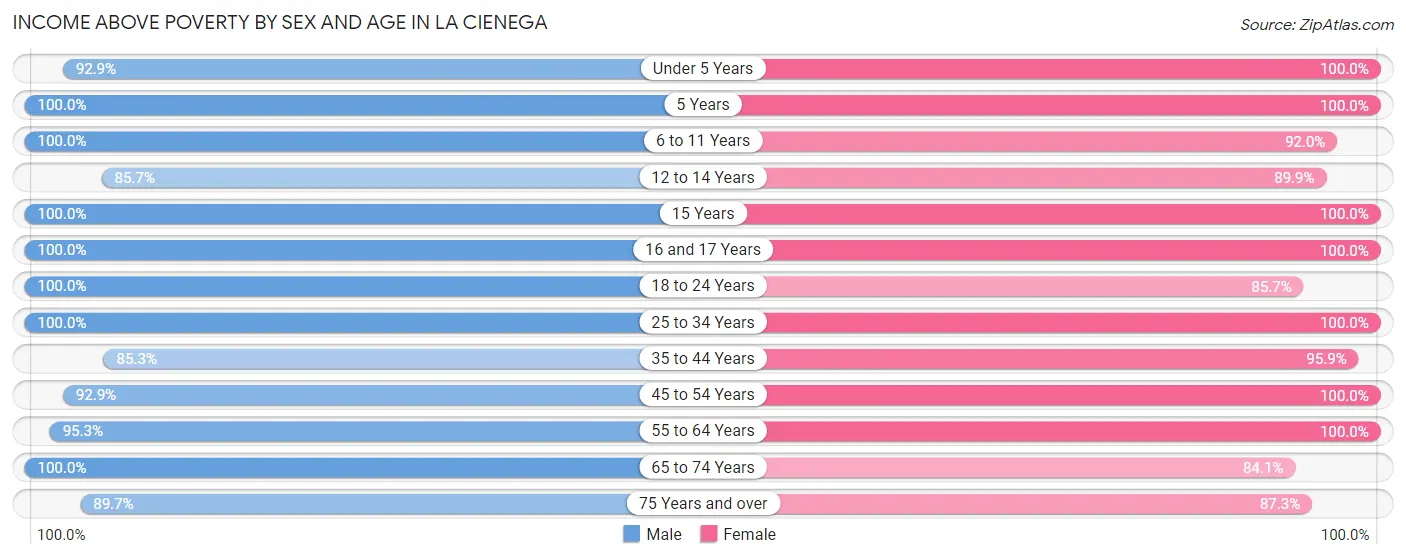
| Age Bracket | Male | Female |
| Under 5 Years | 144 (92.9%) | 49 (100.0%) |
| 5 Years | 1 (100.0%) | 20 (100.0%) |
| 6 to 11 Years | 131 (100.0%) | 137 (91.9%) |
| 12 to 14 Years | 48 (85.7%) | 107 (89.9%) |
| 15 Years | 19 (100.0%) | 108 (100.0%) |
| 16 and 17 Years | 58 (100.0%) | 28 (100.0%) |
| 18 to 24 Years | 166 (100.0%) | 234 (85.7%) |
| 25 to 34 Years | 149 (100.0%) | 185 (100.0%) |
| 35 to 44 Years | 279 (85.3%) | 259 (95.9%) |
| 45 to 54 Years | 287 (92.9%) | 234 (100.0%) |
| 55 to 64 Years | 286 (95.3%) | 415 (100.0%) |
| 65 to 74 Years | 169 (100.0%) | 122 (84.1%) |
| 75 Years and over | 52 (89.7%) | 48 (87.3%) |
| Total | 1,789 (94.3%) | 1,946 (94.9%) |
Income Below Poverty Among Married-Couple Families in La Cienega
The poverty statistics for married-couple families in La Cienega show that 2.5% or 17 of the total 675 families live below the poverty line. Families with 3 or 4 children have the highest poverty rate of 9.2%, comprising of 11 families. On the other hand, families with 1 or 2 children have the lowest poverty rate of 0.0%, which includes 0 families.
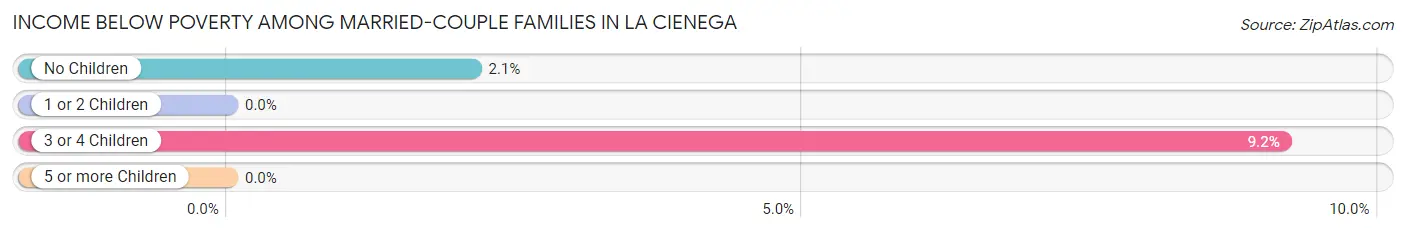
| Children | Above Poverty | Below Poverty |
| No Children | 277 (97.9%) | 6 (2.1%) |
| 1 or 2 Children | 272 (100.0%) | 0 (0.0%) |
| 3 or 4 Children | 109 (90.8%) | 11 (9.2%) |
| 5 or more Children | 0 (0.0%) | 0 (0.0%) |
| Total | 658 (97.5%) | 17 (2.5%) |
Income Below Poverty Among Single-Parent Households in La Cienega
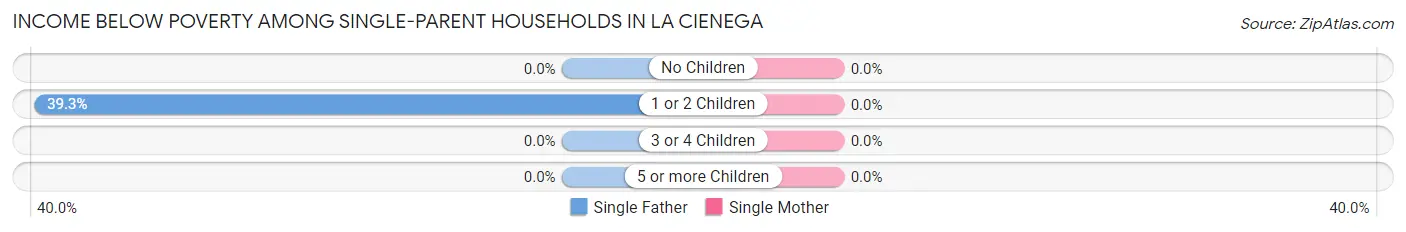
| Children | Single Father | Single Mother |
| No Children | 0 (0.0%) | 0 (0.0%) |
| 1 or 2 Children | 11 (39.3%) | 0 (0.0%) |
| 3 or 4 Children | 0 (0.0%) | 0 (0.0%) |
| 5 or more Children | 0 (0.0%) | 0 (0.0%) |
| Total | 11 (8.6%) | 0 (0.0%) |
Income Below Poverty Among Married-Couple vs Single-Parent Households in La Cienega
The poverty data for La Cienega shows that 17 of the married-couple family households (2.5%) and 11 of the single-parent households (3.2%) are living below the poverty level. Within the married-couple family households, those with 3 or 4 children have the highest poverty rate, with 11 households (9.2%) falling below the poverty line. Among the single-parent households, those with 1 or 2 children have the highest poverty rate, with 11 household (5.8%) living below poverty.
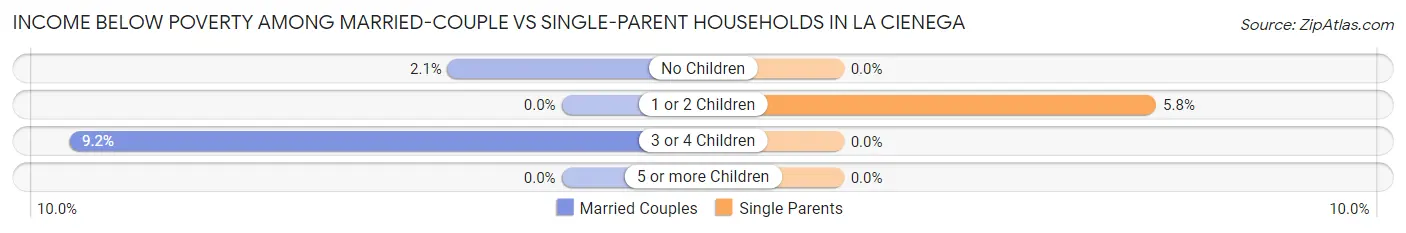
| Children | Married-Couple Families | Single-Parent Households |
| No Children | 6 (2.1%) | 0 (0.0%) |
| 1 or 2 Children | 0 (0.0%) | 11 (5.8%) |
| 3 or 4 Children | 11 (9.2%) | 0 (0.0%) |
| 5 or more Children | 0 (0.0%) | 0 (0.0%) |
| Total | 17 (2.5%) | 11 (3.2%) |
Race in La Cienega
The most populous races in La Cienega are Hispanic or Latino (3,113 | 78.8%), White / Caucasian (2,323 | 58.8%), and Two or more Races (914 | 23.2%).
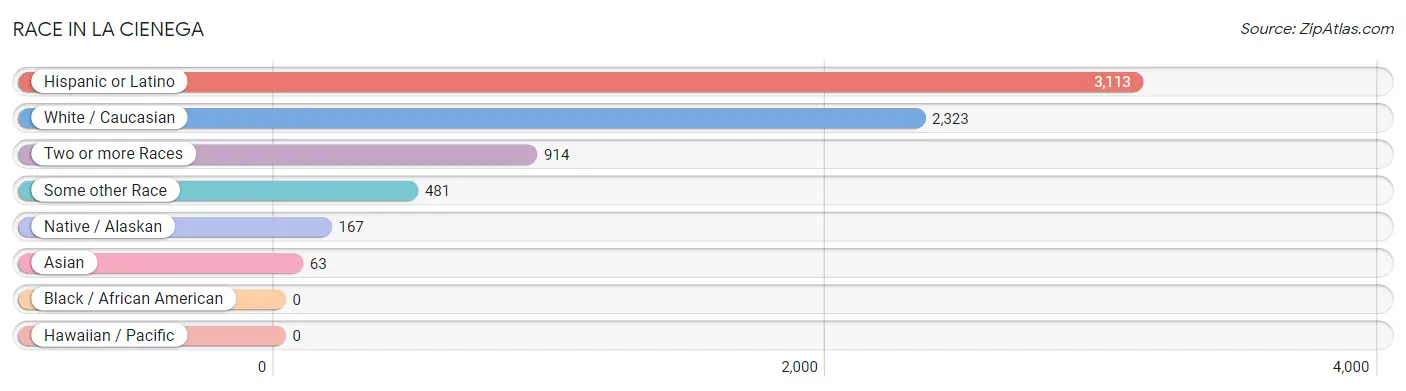
| Race | # Population | % Population |
| Asian | 63 | 1.6% |
| Black / African American | 0 | 0.0% |
| Hawaiian / Pacific | 0 | 0.0% |
| Hispanic or Latino | 3,113 | 78.8% |
| Native / Alaskan | 167 | 4.2% |
| White / Caucasian | 2,323 | 58.8% |
| Two or more Races | 914 | 23.2% |
| Some other Race | 481 | 12.2% |
| Total | 3,948 | 100.0% |
Ancestry in La Cienega
The most populous ancestries reported in La Cienega are Mexican (1,727 | 43.7%), Spanish (477 | 12.1%), Central American (373 | 9.5%), Spaniard (261 | 6.6%), and Salvadoran (191 | 4.8%), together accounting for 76.7% of all La Cienega residents.
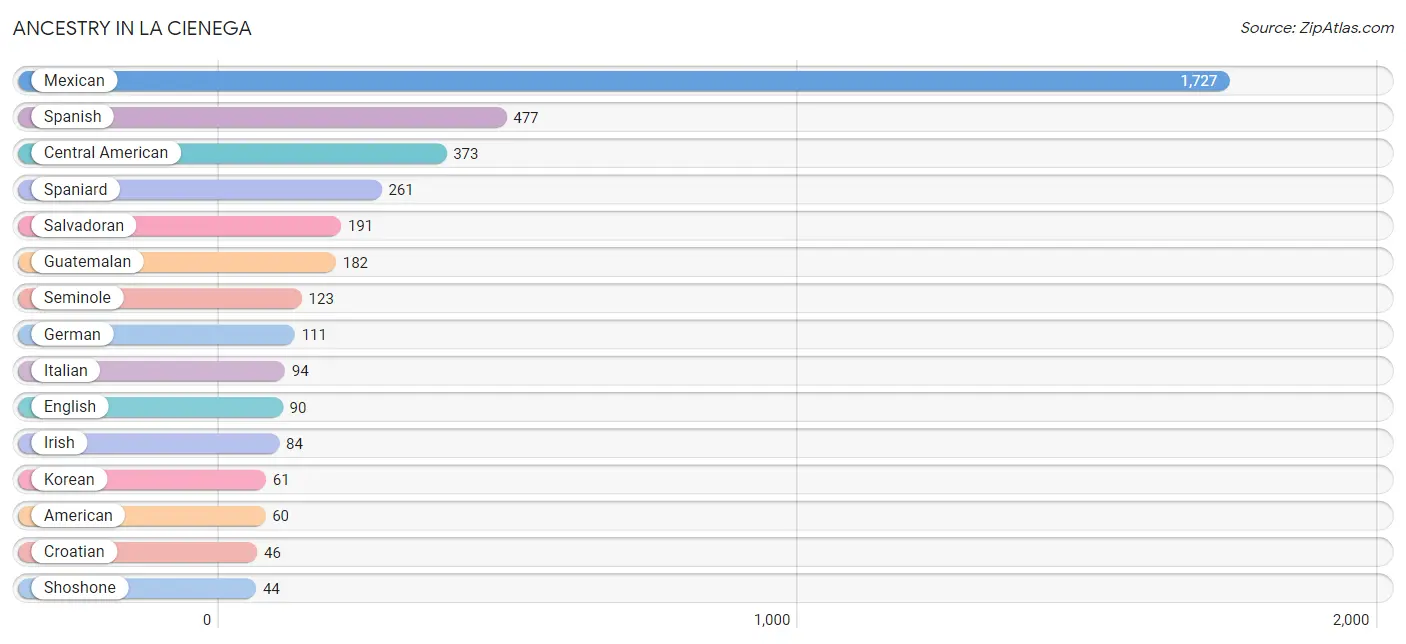
| Ancestry | # Population | % Population |
| Alaska Native | 11 | 0.3% |
| American | 60 | 1.5% |
| Apache | 21 | 0.5% |
| Austrian | 6 | 0.2% |
| Bhutanese | 26 | 0.7% |
| British | 12 | 0.3% |
| Burmese | 24 | 0.6% |
| Central American | 373 | 9.5% |
| Colombian | 30 | 0.8% |
| Croatian | 46 | 1.2% |
| Czech | 11 | 0.3% |
| Dutch | 16 | 0.4% |
| Eastern European | 11 | 0.3% |
| English | 90 | 2.3% |
| European | 36 | 0.9% |
| Finnish | 20 | 0.5% |
| French | 12 | 0.3% |
| German | 111 | 2.8% |
| Greek | 11 | 0.3% |
| Guatemalan | 182 | 4.6% |
| Irish | 84 | 2.1% |
| Italian | 94 | 2.4% |
| Korean | 61 | 1.5% |
| Mexican | 1,727 | 43.7% |
| Northern European | 9 | 0.2% |
| Norwegian | 33 | 0.8% |
| Pennsylvania German | 11 | 0.3% |
| Polish | 11 | 0.3% |
| Portuguese | 16 | 0.4% |
| Puerto Rican | 2 | 0.1% |
| Russian | 32 | 0.8% |
| Salvadoran | 191 | 4.8% |
| Scandinavian | 18 | 0.5% |
| Scottish | 30 | 0.8% |
| Seminole | 123 | 3.1% |
| Shoshone | 44 | 1.1% |
| Slovak | 6 | 0.2% |
| South American | 30 | 0.8% |
| Spaniard | 261 | 6.6% |
| Spanish | 477 | 12.1% |
| Swedish | 10 | 0.3% | View All 41 Rows |
Immigrants in La Cienega
The most numerous immigrant groups reported in La Cienega came from Central America (1,009 | 25.6%), Latin America (1,009 | 25.6%), Mexico (632 | 16.0%), El Salvador (236 | 6.0%), and Guatemala (141 | 3.6%), together accounting for 76.7% of all La Cienega residents.
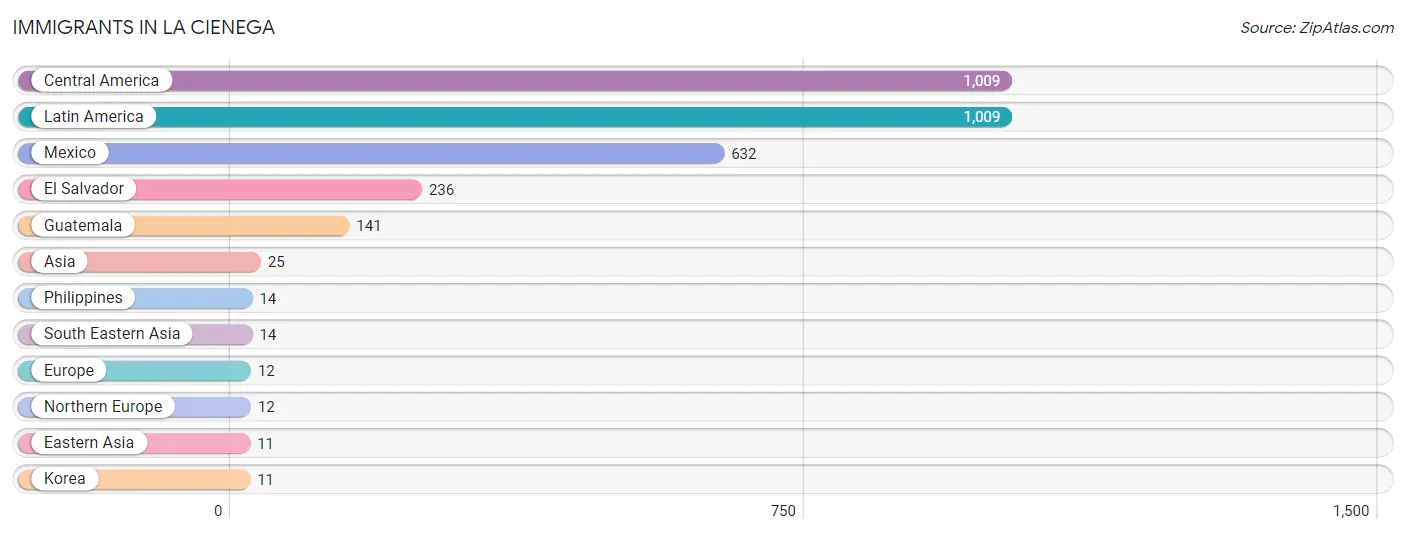
| Immigration Origin | # Population | % Population |
| Asia | 25 | 0.6% |
| Central America | 1,009 | 25.6% |
| Eastern Asia | 11 | 0.3% |
| El Salvador | 236 | 6.0% |
| Europe | 12 | 0.3% |
| Guatemala | 141 | 3.6% |
| Korea | 11 | 0.3% |
| Latin America | 1,009 | 25.6% |
| Mexico | 632 | 16.0% |
| Northern Europe | 12 | 0.3% |
| Philippines | 14 | 0.4% |
| South Eastern Asia | 14 | 0.4% | View All 12 Rows |
Sex and Age in La Cienega
Sex and Age in La Cienega
The most populous age groups in La Cienega are 35 to 39 Years (222 | 11.7%) for men and 60 to 64 Years (285 | 13.9%) for women.
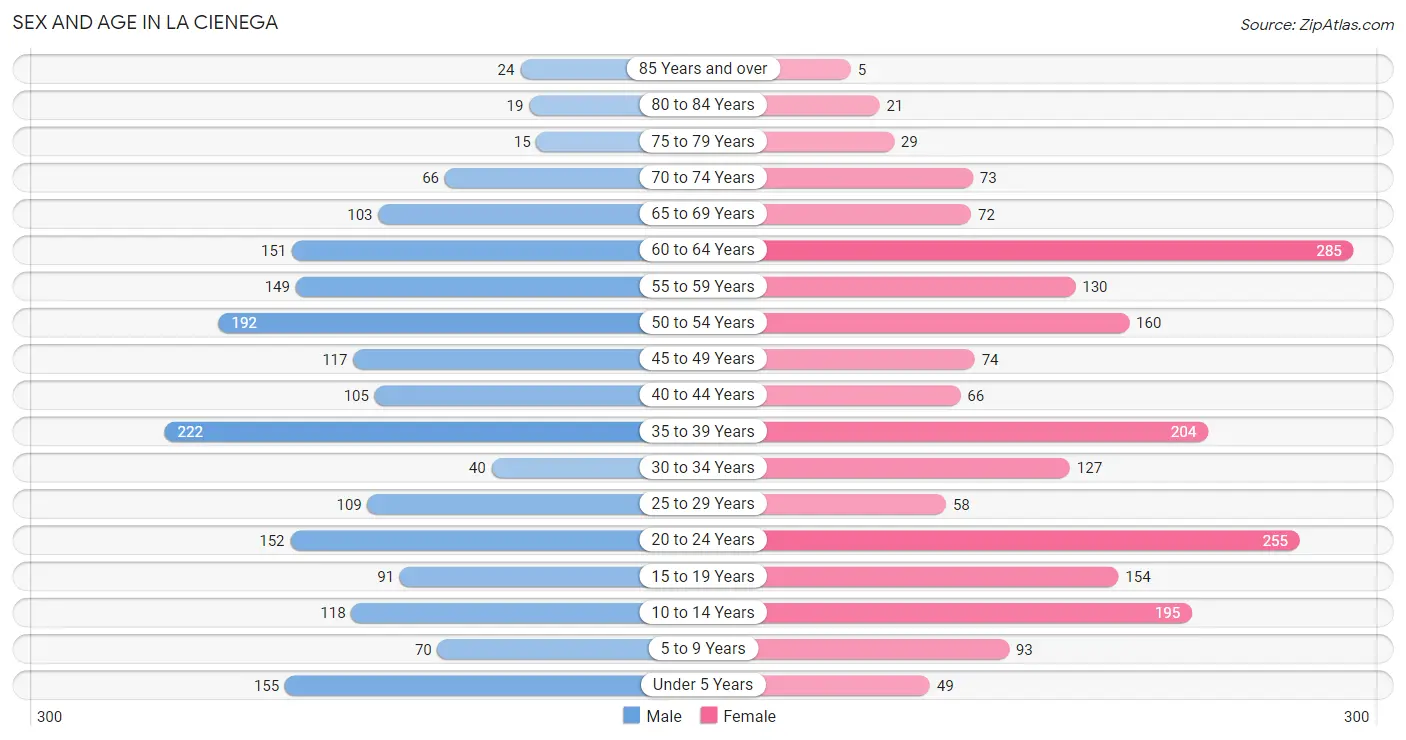
| Age Bracket | Male | Female |
| Under 5 Years | 155 (8.2%) | 49 (2.4%) |
| 5 to 9 Years | 70 (3.7%) | 93 (4.5%) |
| 10 to 14 Years | 118 (6.2%) | 195 (9.5%) |
| 15 to 19 Years | 91 (4.8%) | 154 (7.5%) |
| 20 to 24 Years | 152 (8.0%) | 255 (12.4%) |
| 25 to 29 Years | 109 (5.7%) | 58 (2.8%) |
| 30 to 34 Years | 40 (2.1%) | 127 (6.2%) |
| 35 to 39 Years | 222 (11.7%) | 204 (10.0%) |
| 40 to 44 Years | 105 (5.5%) | 66 (3.2%) |
| 45 to 49 Years | 117 (6.2%) | 74 (3.6%) |
| 50 to 54 Years | 192 (10.1%) | 160 (7.8%) |
| 55 to 59 Years | 149 (7.9%) | 130 (6.3%) |
| 60 to 64 Years | 151 (8.0%) | 285 (13.9%) |
| 65 to 69 Years | 103 (5.4%) | 72 (3.5%) |
| 70 to 74 Years | 66 (3.5%) | 73 (3.6%) |
| 75 to 79 Years | 15 (0.8%) | 29 (1.4%) |
| 80 to 84 Years | 19 (1.0%) | 21 (1.0%) |
| 85 Years and over | 24 (1.3%) | 5 (0.2%) |
| Total | 1,898 (100.0%) | 2,050 (100.0%) |
Families and Households in La Cienega
Median Family Size in La Cienega
The median family size in La Cienega is 3.44 persons per family, with single female/mother families (216 | 21.2%) accounting for the largest median family size of 3.68 persons per family. On the other hand, single male/father families (128 | 12.6%) represent the smallest median family size with 2.74 persons per family.
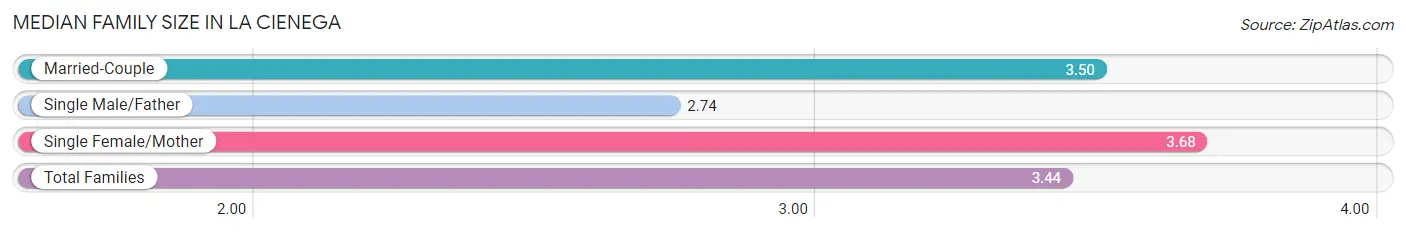
| Family Type | # Families | Family Size |
| Married-Couple | 675 (66.2%) | 3.50 |
| Single Male/Father | 128 (12.6%) | 2.74 |
| Single Female/Mother | 216 (21.2%) | 3.68 |
| Total Families | 1,019 (100.0%) | 3.44 |
Median Household Size in La Cienega
The median household size in La Cienega is 2.99 persons per household, with single female/mother households (216 | 16.4%) accounting for the largest median household size of 3.9 persons per household. non-family households (302 | 22.9%) represent the smallest median household size with 1.26 persons per household.
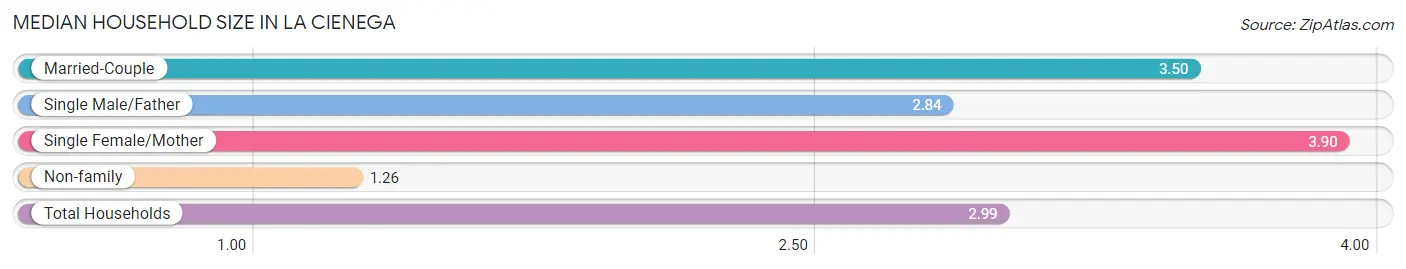
| Household Type | # Households | Household Size |
| Married-Couple | 675 (51.1%) | 3.50 |
| Single Male/Father | 128 (9.7%) | 2.84 |
| Single Female/Mother | 216 (16.4%) | 3.90 |
| Non-family | 302 (22.9%) | 1.26 |
| Total Households | 1,321 (100.0%) | 2.99 |
Household Size by Marriage Status in La Cienega
Out of a total of 1,321 households in La Cienega, 1,019 (77.1%) are family households, while 302 (22.9%) are nonfamily households. The most numerous type of family households are 2-person households, comprising 354, and the most common type of nonfamily households are 1-person households, comprising 222.
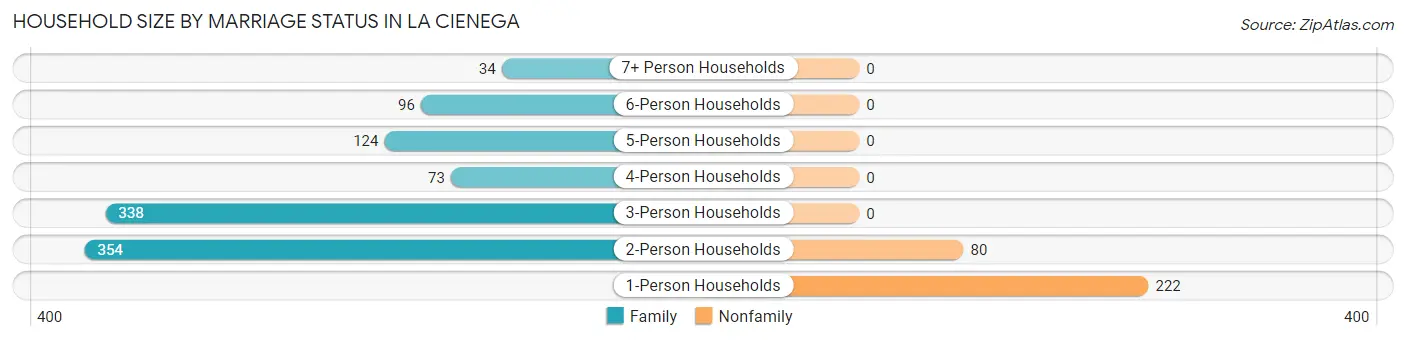
| Household Size | Family Households | Nonfamily Households |
| 1-Person Households | - | 222 (16.8%) |
| 2-Person Households | 354 (26.8%) | 80 (6.1%) |
| 3-Person Households | 338 (25.6%) | 0 (0.0%) |
| 4-Person Households | 73 (5.5%) | 0 (0.0%) |
| 5-Person Households | 124 (9.4%) | 0 (0.0%) |
| 6-Person Households | 96 (7.3%) | 0 (0.0%) |
| 7+ Person Households | 34 (2.6%) | 0 (0.0%) |
| Total | 1,019 (77.1%) | 302 (22.9%) |
Female Fertility in La Cienega
Fertility by Age in La Cienega
Average fertility rate in La Cienega is 125.0 births per 1,000 women. Women in the age bracket of 20 to 34 years have the highest fertility rate with 273.0 births per 1,000 women. Women in the age bracket of 20 to 34 years acount for 96.0% of all women with births.
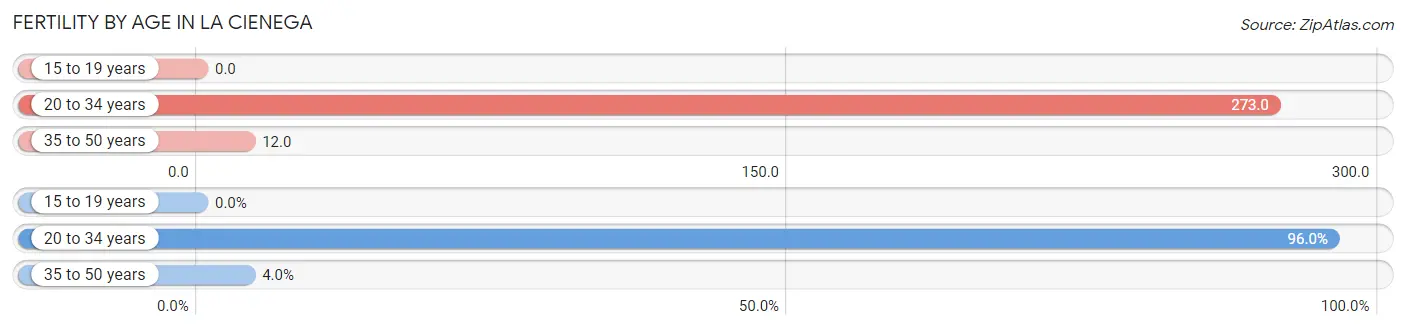
| Age Bracket | Women with Births | Births / 1,000 Women |
| 15 to 19 years | 0 (0.0%) | 0.0 |
| 20 to 34 years | 120 (96.0%) | 273.0 |
| 35 to 50 years | 5 (4.0%) | 12.0 |
| Total | 125 (100.0%) | 125.0 |
Fertility by Age by Marriage Status in La Cienega
13.6% of women with births (125) in La Cienega are married. The highest percentage of unmarried women with births falls into 20 to 34 years age bracket with 90.0% of them unmarried at the time of birth, while the lowest percentage of unmarried women with births belong to 35 to 50 years age bracket with 0.0% of them unmarried.
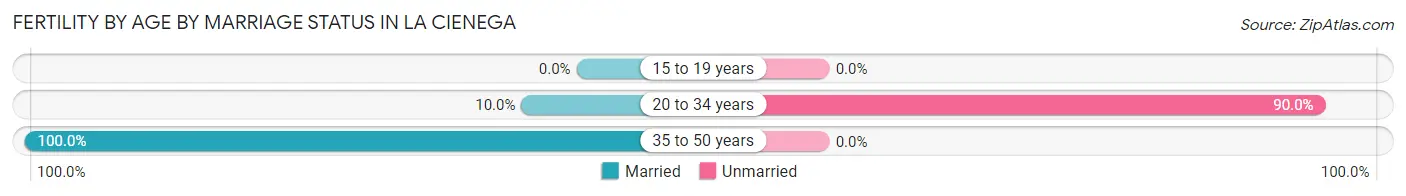
| Age Bracket | Married | Unmarried |
| 15 to 19 years | 0 (0.0%) | 0 (0.0%) |
| 20 to 34 years | 12 (10.0%) | 108 (90.0%) |
| 35 to 50 years | 5 (100.0%) | 0 (0.0%) |
| Total | 17 (13.6%) | 108 (86.4%) |
Fertility by Education in La Cienega
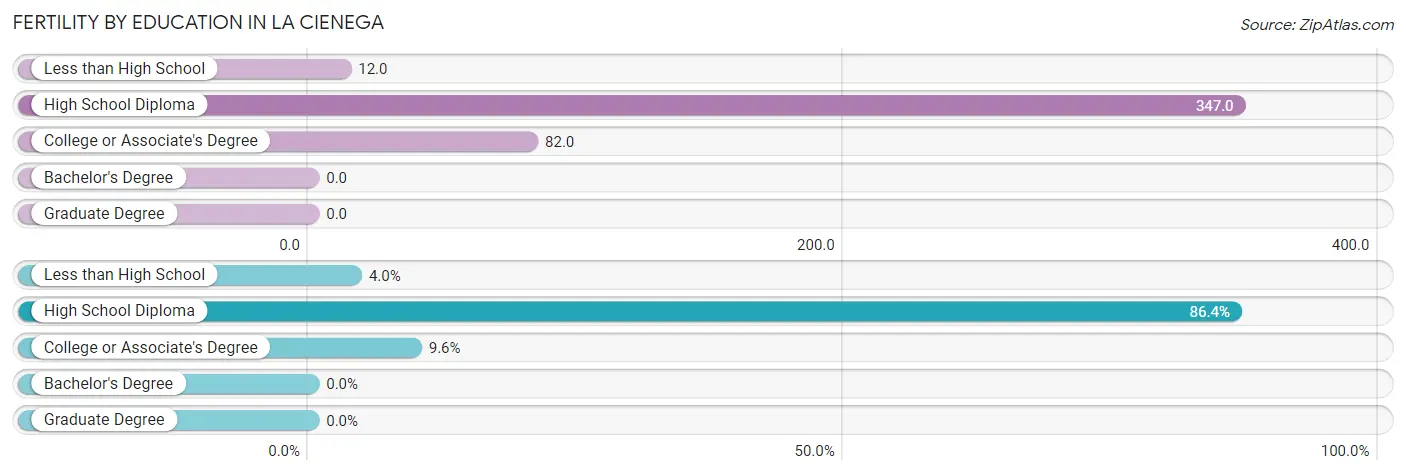
| Educational Attainment | Women with Births | Births / 1,000 Women |
| Less than High School | 5 (4.0%) | 12.0 |
| High School Diploma | 108 (86.4%) | 347.0 |
| College or Associate's Degree | 12 (9.6%) | 82.0 |
| Bachelor's Degree | 0 (0.0%) | 0.0 |
| Graduate Degree | 0 (0.0%) | 0.0 |
| Total | 125 (100.0%) | 125.0 |
Fertility by Education by Marriage Status in La Cienega
86.4% of women with births in La Cienega are unmarried. Women with the educational attainment of less than high school are most likely to be married with 100.0% of them married at childbirth, while women with the educational attainment of high school diploma are least likely to be married with 100.0% of them unmarried at childbirth.
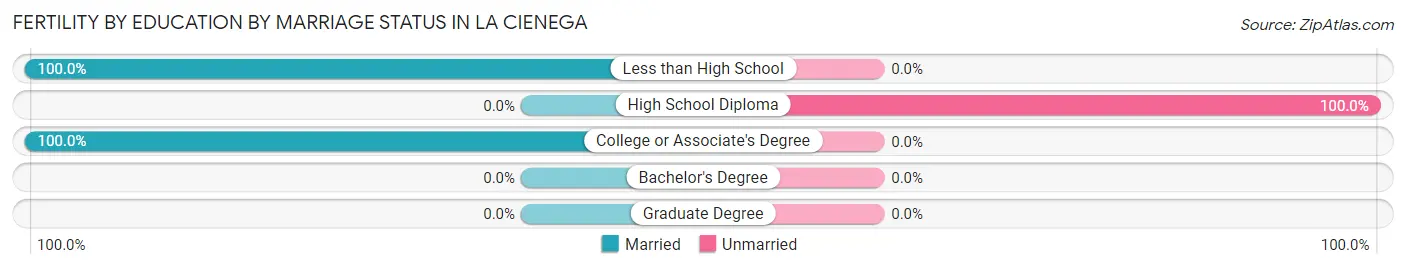
| Educational Attainment | Married | Unmarried |
| Less than High School | 5 (100.0%) | 0 (0.0%) |
| High School Diploma | 0 (0.0%) | 108 (100.0%) |
| College or Associate's Degree | 12 (100.0%) | 0 (0.0%) |
| Bachelor's Degree | 0 (0.0%) | 0 (0.0%) |
| Graduate Degree | 0 (0.0%) | 0 (0.0%) |
| Total | 17 (13.6%) | 108 (86.4%) |
Employment Characteristics in La Cienega
Employment by Class of Employer in La Cienega
Among the 2,125 employed individuals in La Cienega, private company employees (1,282 | 60.3%), self-employed (not incorporated) (378 | 17.8%), and state government employees (250 | 11.8%) make up the most common classes of employment.
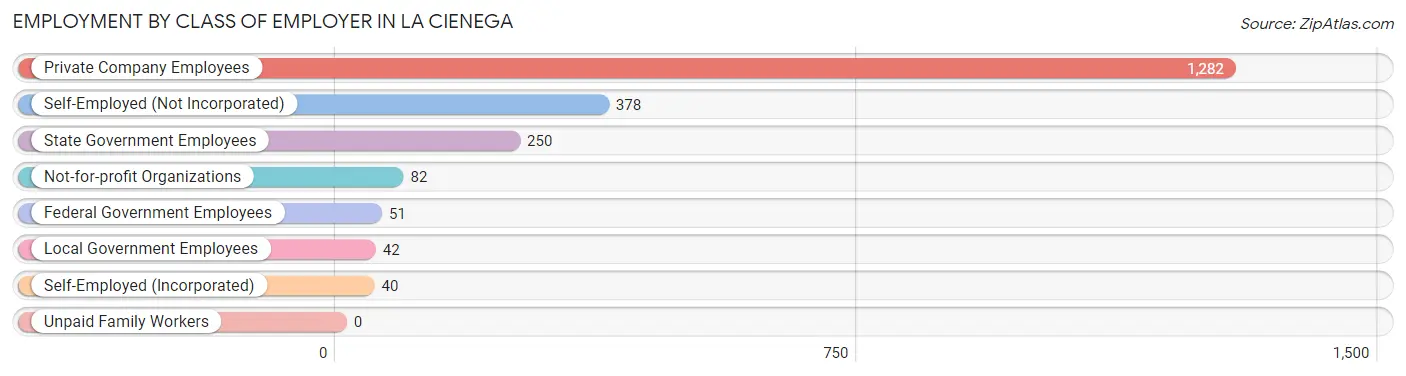
| Employer Class | # Employees | % Employees |
| Private Company Employees | 1,282 | 60.3% |
| Self-Employed (Incorporated) | 40 | 1.9% |
| Self-Employed (Not Incorporated) | 378 | 17.8% |
| Not-for-profit Organizations | 82 | 3.9% |
| Local Government Employees | 42 | 2.0% |
| State Government Employees | 250 | 11.8% |
| Federal Government Employees | 51 | 2.4% |
| Unpaid Family Workers | 0 | 0.0% |
| Total | 2,125 | 100.0% |
Employment Status by Age in La Cienega
According to the labor force statistics for La Cienega, out of the total population over 16 years of age (3,141), 72.7% or 2,284 individuals are in the labor force, with 6.0% or 137 of them unemployed. The age group with the highest labor force participation rate is 25 to 29 years, with 93.4% or 156 individuals in the labor force. Within the labor force, the 25 to 29 years age range has the highest percentage of unemployed individuals, with 38.5% or 60 of them being unemployed.
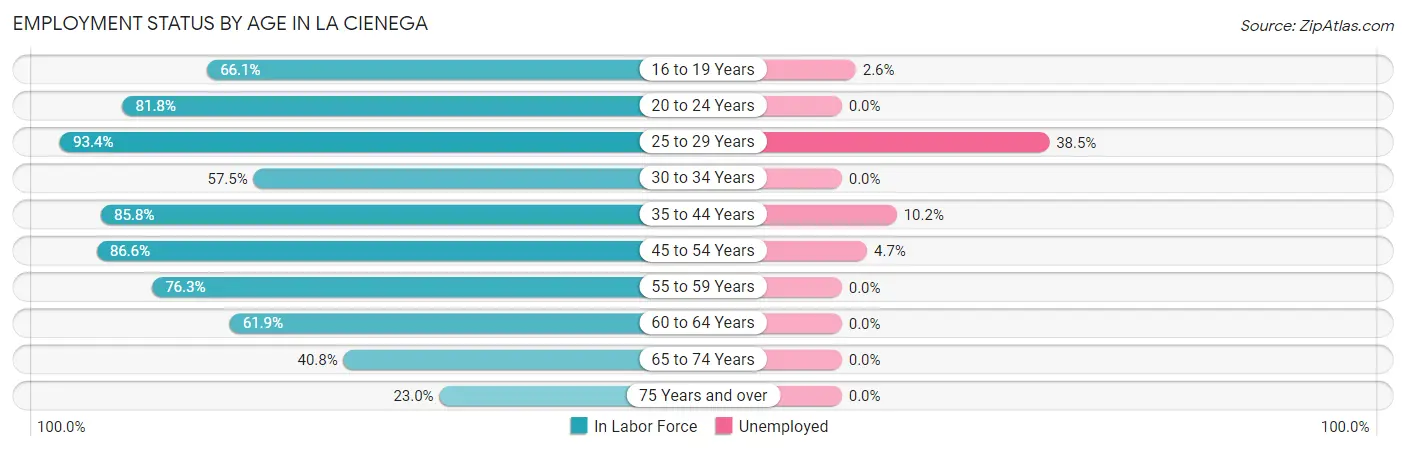
| Age Bracket | In Labor Force | Unemployed |
| 16 to 19 Years | 78 (66.1%) | 2 (2.6%) |
| 20 to 24 Years | 333 (81.8%) | 0 (0.0%) |
| 25 to 29 Years | 156 (93.4%) | 60 (38.5%) |
| 30 to 34 Years | 96 (57.5%) | 0 (0.0%) |
| 35 to 44 Years | 512 (85.8%) | 52 (10.2%) |
| 45 to 54 Years | 470 (86.6%) | 22 (4.7%) |
| 55 to 59 Years | 213 (76.3%) | 0 (0.0%) |
| 60 to 64 Years | 270 (61.9%) | 0 (0.0%) |
| 65 to 74 Years | 128 (40.8%) | 0 (0.0%) |
| 75 Years and over | 26 (23.0%) | 0 (0.0%) |
| Total | 2,284 (72.7%) | 137 (6.0%) |
Employment Status by Educational Attainment in La Cienega
According to labor force statistics for La Cienega, 78.4% of individuals (1,716) out of the total population between 25 and 64 years of age (2,189) are in the labor force, with 7.8% or 134 of them being unemployed. The group with the highest labor force participation rate are those with the educational attainment of bachelor's degree or higher, with 89.3% or 392 individuals in the labor force. Within the labor force, individuals with less than high school education have the highest percentage of unemployment, with 12.8% or 52 of them being unemployed.
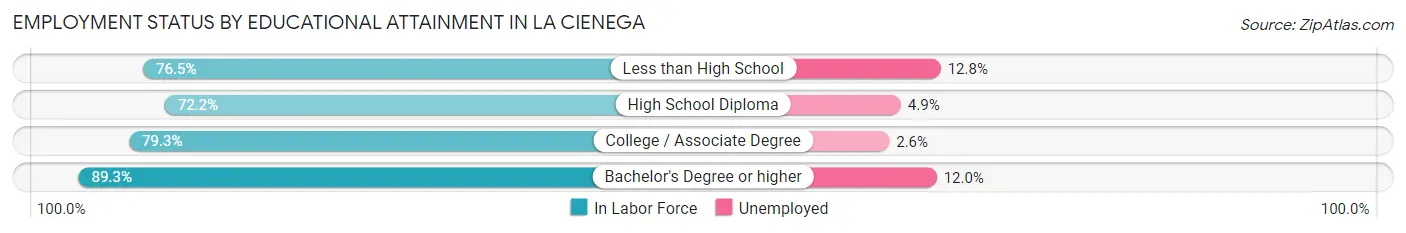
| Educational Attainment | In Labor Force | Unemployed |
| Less than High School | 407 (76.5%) | 68 (12.8%) |
| High School Diploma | 488 (72.2%) | 33 (4.9%) |
| College / Associate Degree | 430 (79.3%) | 14 (2.6%) |
| Bachelor's Degree or higher | 392 (89.3%) | 53 (12.0%) |
| Total | 1,716 (78.4%) | 171 (7.8%) |
Employment Occupations by Sex in La Cienega
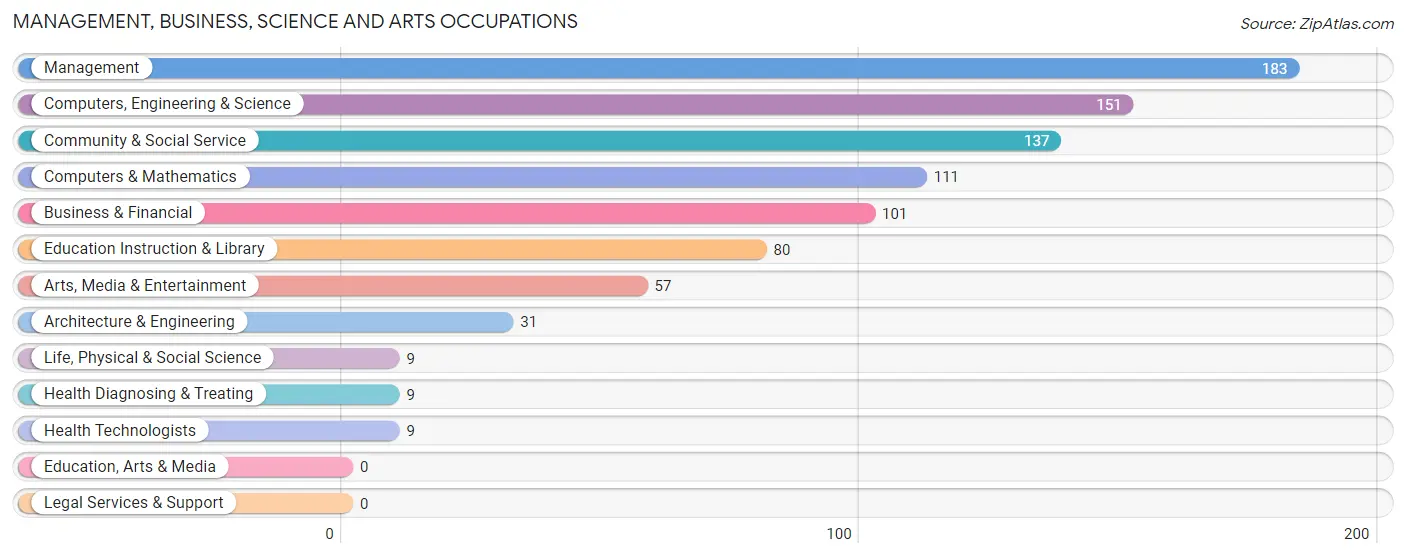
Management, Business, Science and Arts Occupations
The most common Management, Business, Science and Arts occupations in La Cienega are Management (183 | 8.5%), Computers, Engineering & Science (151 | 7.0%), Community & Social Service (137 | 6.4%), Computers & Mathematics (111 | 5.2%), and Business & Financial (101 | 4.7%).
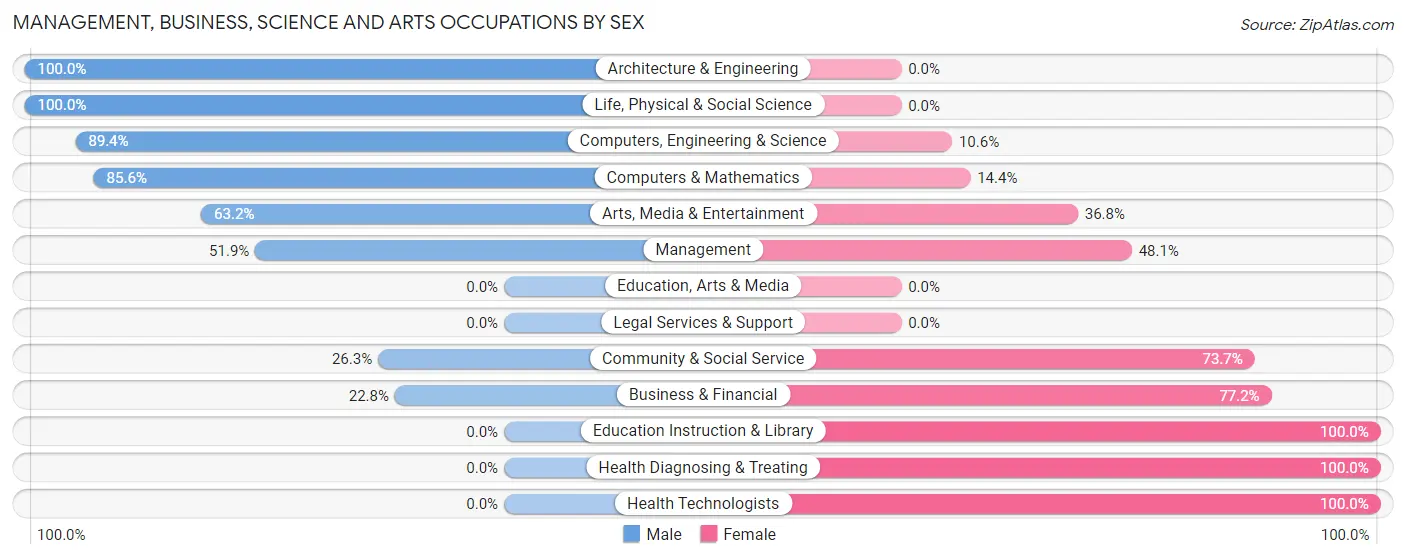
Management, Business, Science and Arts Occupations by Sex
Within the Management, Business, Science and Arts occupations in La Cienega, the most male-oriented occupations are Architecture & Engineering (100.0%), Life, Physical & Social Science (100.0%), and Computers, Engineering & Science (89.4%), while the most female-oriented occupations are Education Instruction & Library (100.0%), Health Diagnosing & Treating (100.0%), and Health Technologists (100.0%).
| Occupation | Male | Female |
| Management | 95 (51.9%) | 88 (48.1%) |
| Business & Financial | 23 (22.8%) | 78 (77.2%) |
| Computers, Engineering & Science | 135 (89.4%) | 16 (10.6%) |
| Computers & Mathematics | 95 (85.6%) | 16 (14.4%) |
| Architecture & Engineering | 31 (100.0%) | 0 (0.0%) |
| Life, Physical & Social Science | 9 (100.0%) | 0 (0.0%) |
| Community & Social Service | 36 (26.3%) | 101 (73.7%) |
| Education, Arts & Media | 0 (0.0%) | 0 (0.0%) |
| Legal Services & Support | 0 (0.0%) | 0 (0.0%) |
| Education Instruction & Library | 0 (0.0%) | 80 (100.0%) |
| Arts, Media & Entertainment | 36 (63.2%) | 21 (36.8%) |
| Health Diagnosing & Treating | 0 (0.0%) | 9 (100.0%) |
| Health Technologists | 0 (0.0%) | 9 (100.0%) |
| Total (Category) | 289 (49.7%) | 292 (50.3%) |
| Total (Overall) | 1,149 (53.5%) | 997 (46.5%) |
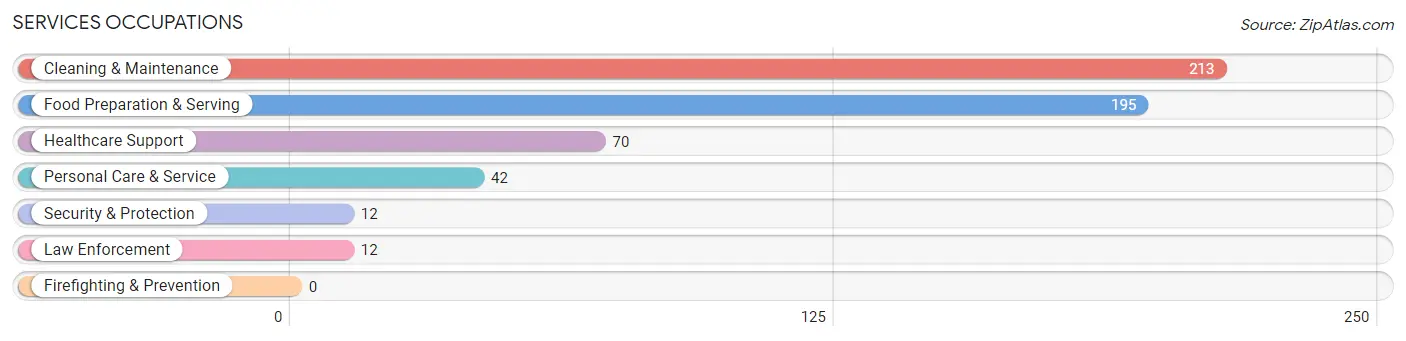
Services Occupations
The most common Services occupations in La Cienega are Cleaning & Maintenance (213 | 9.9%), Food Preparation & Serving (195 | 9.1%), Healthcare Support (70 | 3.3%), Personal Care & Service (42 | 2.0%), and Security & Protection (12 | 0.6%).
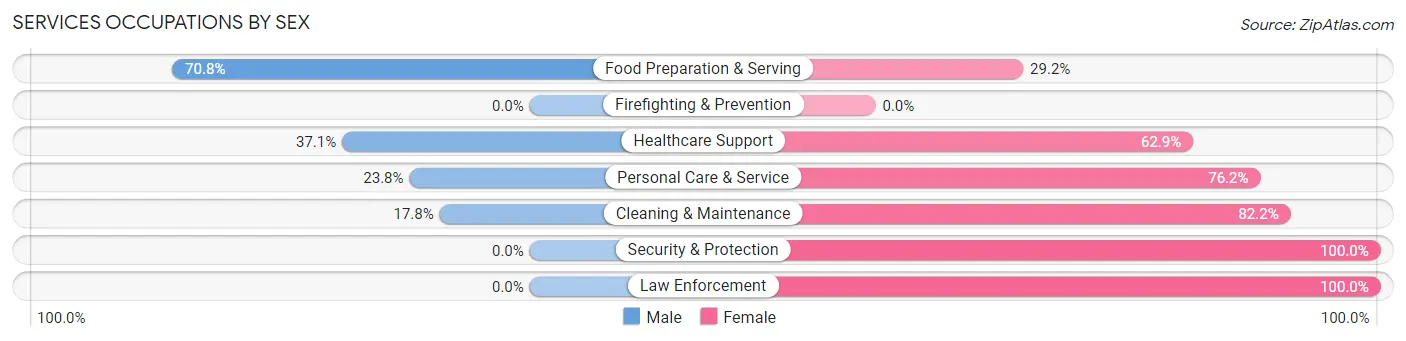
Services Occupations by Sex
Within the Services occupations in La Cienega, the most male-oriented occupations are Food Preparation & Serving (70.8%), Healthcare Support (37.1%), and Personal Care & Service (23.8%), while the most female-oriented occupations are Security & Protection (100.0%), Law Enforcement (100.0%), and Cleaning & Maintenance (82.2%).
| Occupation | Male | Female |
| Healthcare Support | 26 (37.1%) | 44 (62.9%) |
| Security & Protection | 0 (0.0%) | 12 (100.0%) |
| Firefighting & Prevention | 0 (0.0%) | 0 (0.0%) |
| Law Enforcement | 0 (0.0%) | 12 (100.0%) |
| Food Preparation & Serving | 138 (70.8%) | 57 (29.2%) |
| Cleaning & Maintenance | 38 (17.8%) | 175 (82.2%) |
| Personal Care & Service | 10 (23.8%) | 32 (76.2%) |
| Total (Category) | 212 (39.9%) | 320 (60.2%) |
| Total (Overall) | 1,149 (53.5%) | 997 (46.5%) |
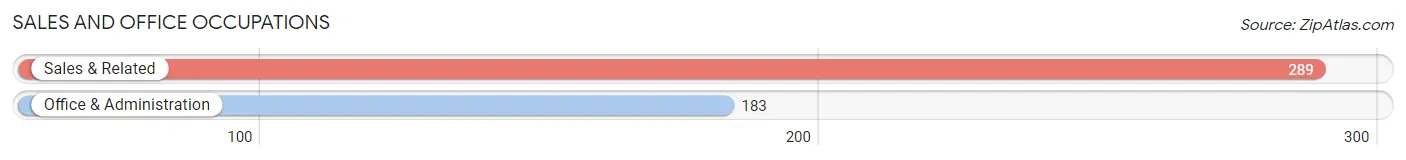
Sales and Office Occupations
The most common Sales and Office occupations in La Cienega are Sales & Related (289 | 13.5%), and Office & Administration (183 | 8.5%).
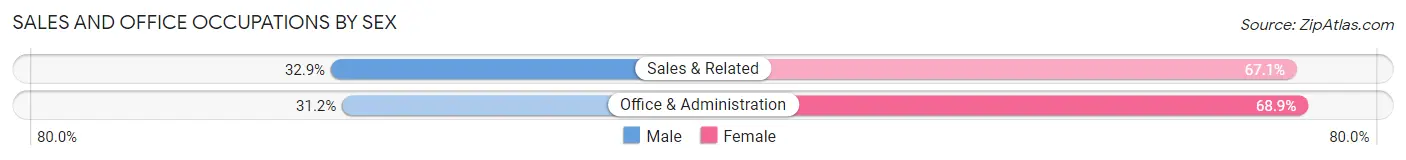
Sales and Office Occupations by Sex
| Occupation | Male | Female |
| Sales & Related | 95 (32.9%) | 194 (67.1%) |
| Office & Administration | 57 (31.1%) | 126 (68.9%) |
| Total (Category) | 152 (32.2%) | 320 (67.8%) |
| Total (Overall) | 1,149 (53.5%) | 997 (46.5%) |
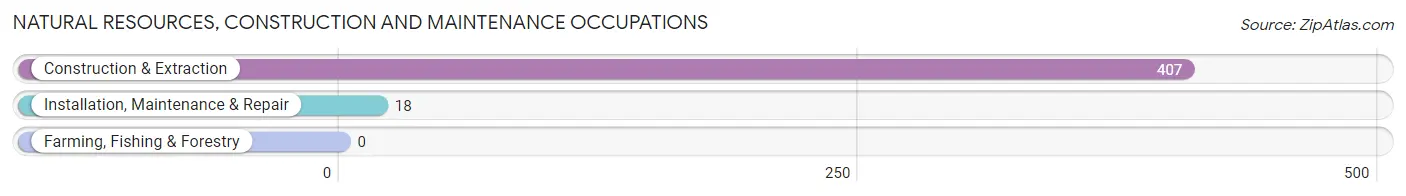
Natural Resources, Construction and Maintenance Occupations
The most common Natural Resources, Construction and Maintenance occupations in La Cienega are Construction & Extraction (407 | 19.0%), and Installation, Maintenance & Repair (18 | 0.8%).
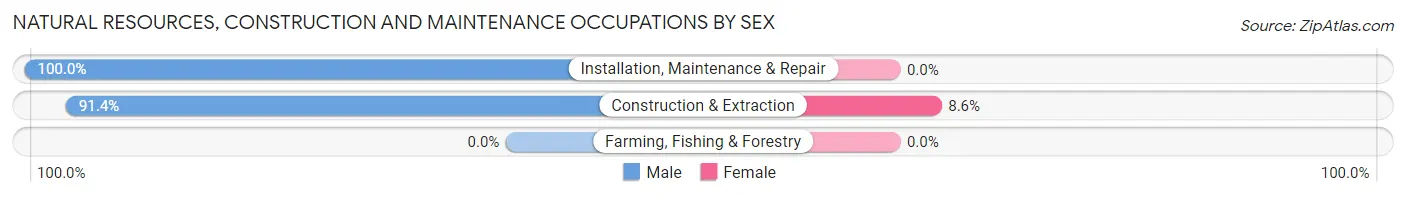
Natural Resources, Construction and Maintenance Occupations by Sex
| Occupation | Male | Female |
| Farming, Fishing & Forestry | 0 (0.0%) | 0 (0.0%) |
| Construction & Extraction | 372 (91.4%) | 35 (8.6%) |
| Installation, Maintenance & Repair | 18 (100.0%) | 0 (0.0%) |
| Total (Category) | 390 (91.8%) | 35 (8.2%) |
| Total (Overall) | 1,149 (53.5%) | 997 (46.5%) |
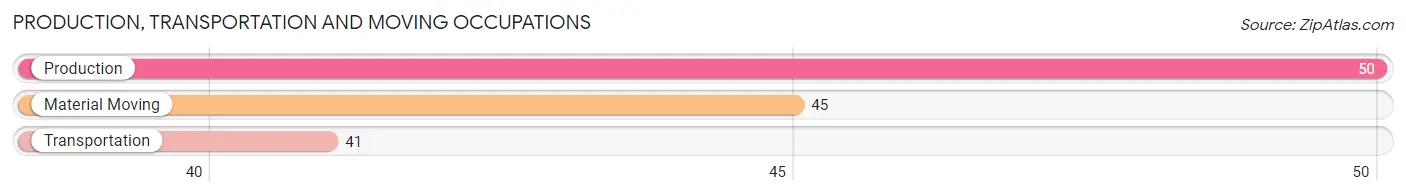
Production, Transportation and Moving Occupations
The most common Production, Transportation and Moving occupations in La Cienega are Production (50 | 2.3%), Material Moving (45 | 2.1%), and Transportation (41 | 1.9%).
Production, Transportation and Moving Occupations by Sex
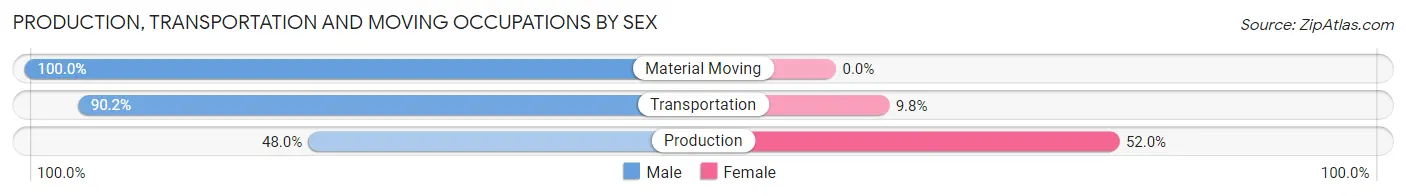
| Occupation | Male | Female |
| Production | 24 (48.0%) | 26 (52.0%) |
| Transportation | 37 (90.2%) | 4 (9.8%) |
| Material Moving | 45 (100.0%) | 0 (0.0%) |
| Total (Category) | 106 (77.9%) | 30 (22.1%) |
| Total (Overall) | 1,149 (53.5%) | 997 (46.5%) |
Employment Industries by Sex in La Cienega
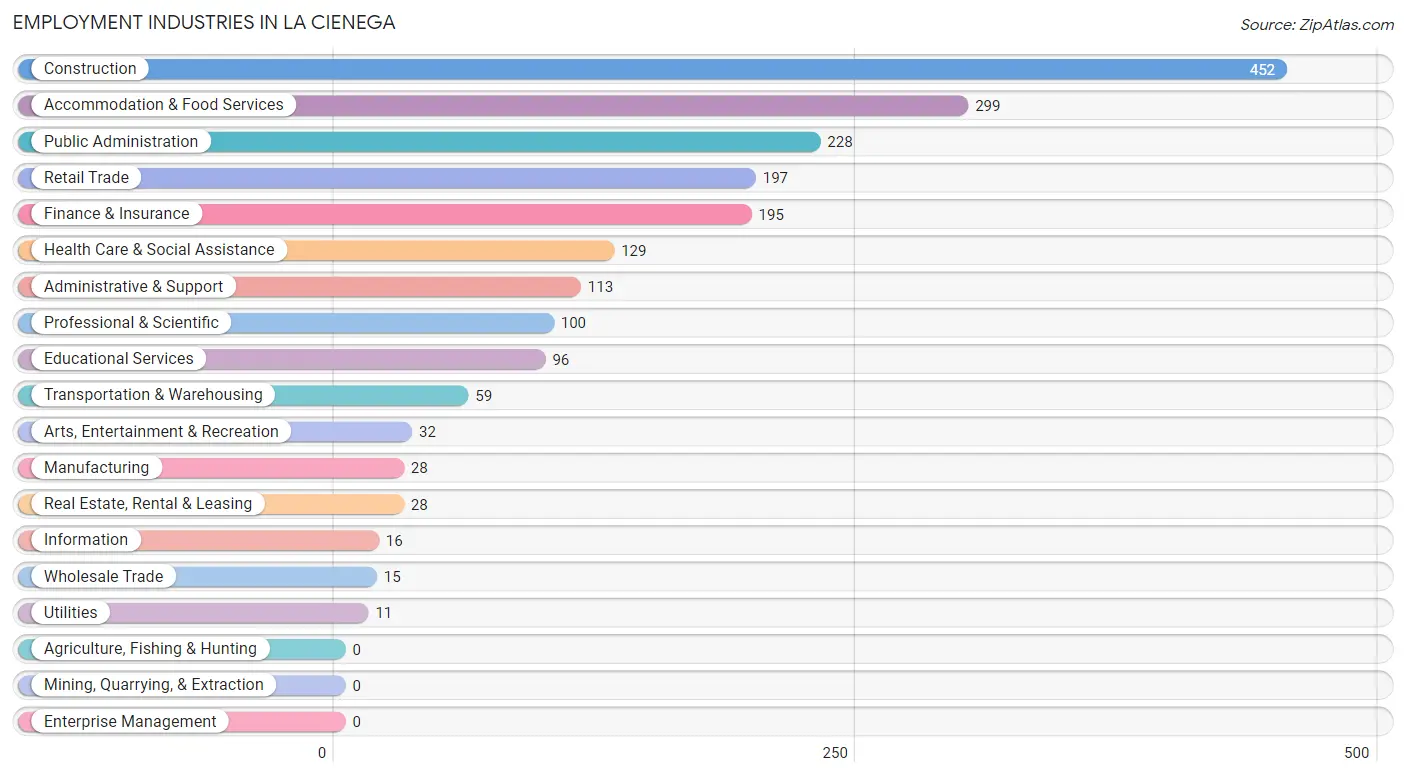
Employment Industries in La Cienega
The major employment industries in La Cienega include Construction (452 | 21.1%), Accommodation & Food Services (299 | 13.9%), Public Administration (228 | 10.6%), Retail Trade (197 | 9.2%), and Finance & Insurance (195 | 9.1%).
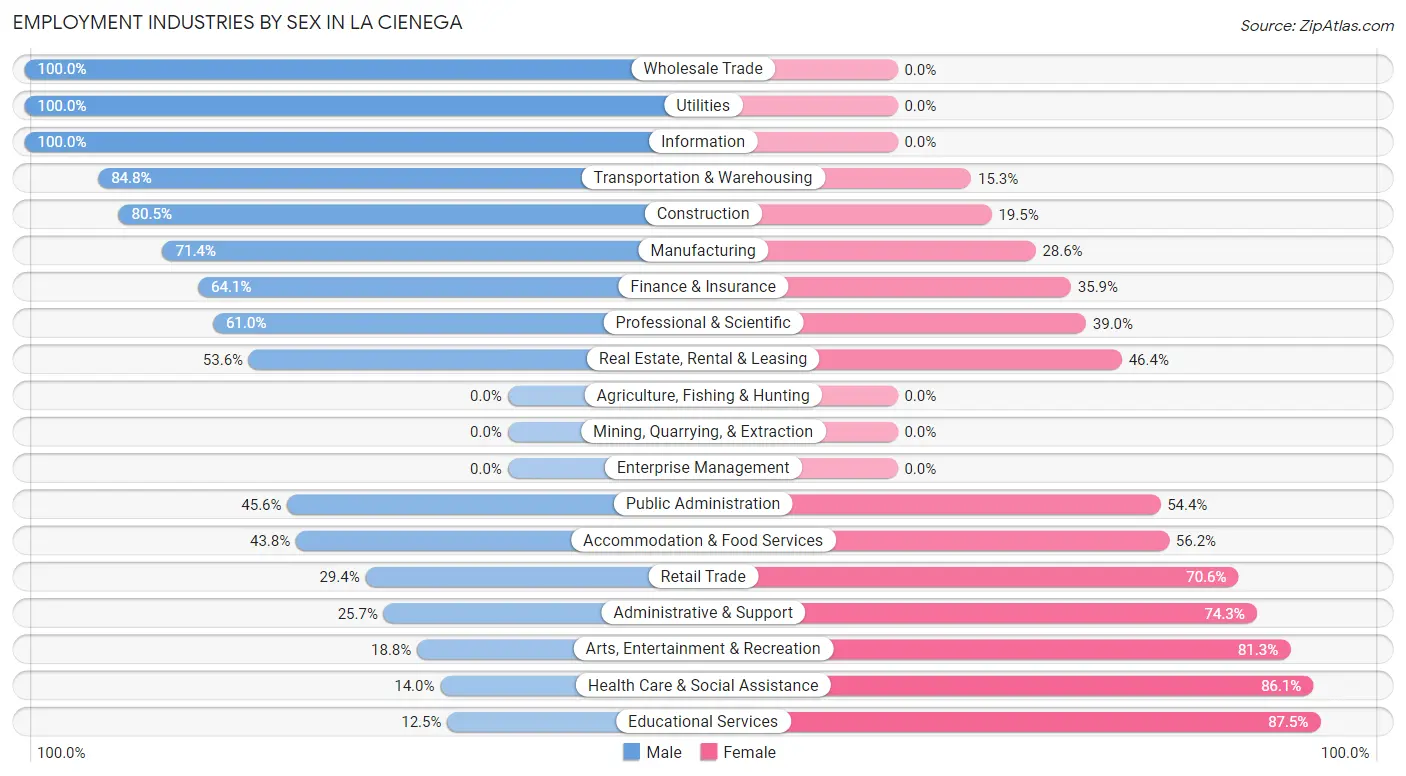
Employment Industries by Sex in La Cienega
The La Cienega industries that see more men than women are Wholesale Trade (100.0%), Utilities (100.0%), and Information (100.0%), whereas the industries that tend to have a higher number of women are Educational Services (87.5%), Health Care & Social Assistance (86.1%), and Arts, Entertainment & Recreation (81.2%).
| Industry | Male | Female |
| Agriculture, Fishing & Hunting | 0 (0.0%) | 0 (0.0%) |
| Mining, Quarrying, & Extraction | 0 (0.0%) | 0 (0.0%) |
| Construction | 364 (80.5%) | 88 (19.5%) |
| Manufacturing | 20 (71.4%) | 8 (28.6%) |
| Wholesale Trade | 15 (100.0%) | 0 (0.0%) |
| Retail Trade | 58 (29.4%) | 139 (70.6%) |
| Transportation & Warehousing | 50 (84.8%) | 9 (15.2%) |
| Utilities | 11 (100.0%) | 0 (0.0%) |
| Information | 16 (100.0%) | 0 (0.0%) |
| Finance & Insurance | 125 (64.1%) | 70 (35.9%) |
| Real Estate, Rental & Leasing | 15 (53.6%) | 13 (46.4%) |
| Professional & Scientific | 61 (61.0%) | 39 (39.0%) |
| Enterprise Management | 0 (0.0%) | 0 (0.0%) |
| Administrative & Support | 29 (25.7%) | 84 (74.3%) |
| Educational Services | 12 (12.5%) | 84 (87.5%) |
| Health Care & Social Assistance | 18 (14.0%) | 111 (86.1%) |
| Arts, Entertainment & Recreation | 6 (18.8%) | 26 (81.2%) |
| Accommodation & Food Services | 131 (43.8%) | 168 (56.2%) |
| Public Administration | 104 (45.6%) | 124 (54.4%) |
| Total | 1,149 (53.5%) | 997 (46.5%) |
Education in La Cienega
School Enrollment in La Cienega
The most common levels of schooling among the 815 students in La Cienega are middle school (413 | 50.7%), elementary school (126 | 15.5%), and high school (123 | 15.1%).
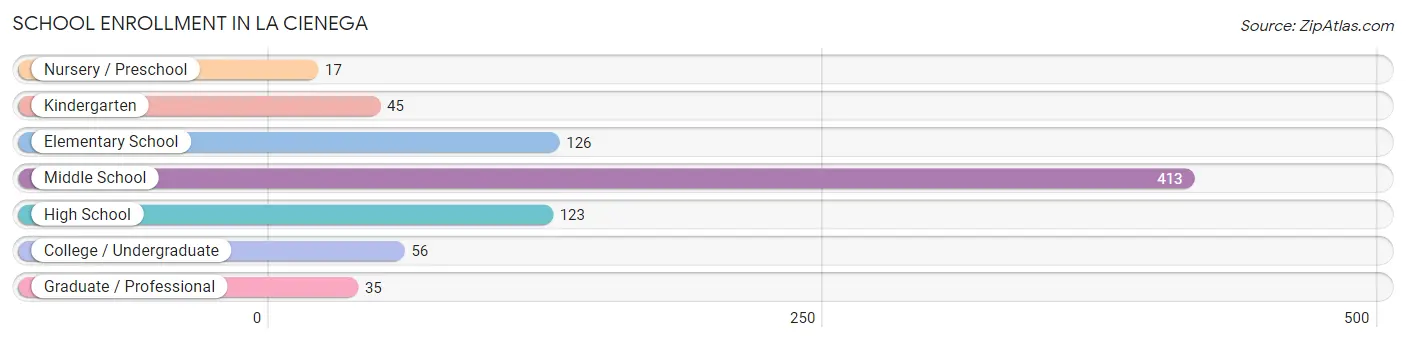
| School Level | # Students | % Students |
| Nursery / Preschool | 17 | 2.1% |
| Kindergarten | 45 | 5.5% |
| Elementary School | 126 | 15.5% |
| Middle School | 413 | 50.7% |
| High School | 123 | 15.1% |
| College / Undergraduate | 56 | 6.9% |
| Graduate / Professional | 35 | 4.3% |
| Total | 815 | 100.0% |
School Enrollment by Age by Funding Source in La Cienega
Out of a total of 815 students who are enrolled in schools in La Cienega, 42 (5.2%) attend a private institution, while the remaining 773 (94.8%) are enrolled in public schools. The age group of 5 to 9 year old has the highest likelihood of being enrolled in private schools, with 15 (9.2% in the age bracket) enrolled. Conversely, the age group of 3 to 4 year olds has the lowest likelihood of being enrolled in a private school, with 10 (100.0% in the age bracket) attending a public institution.
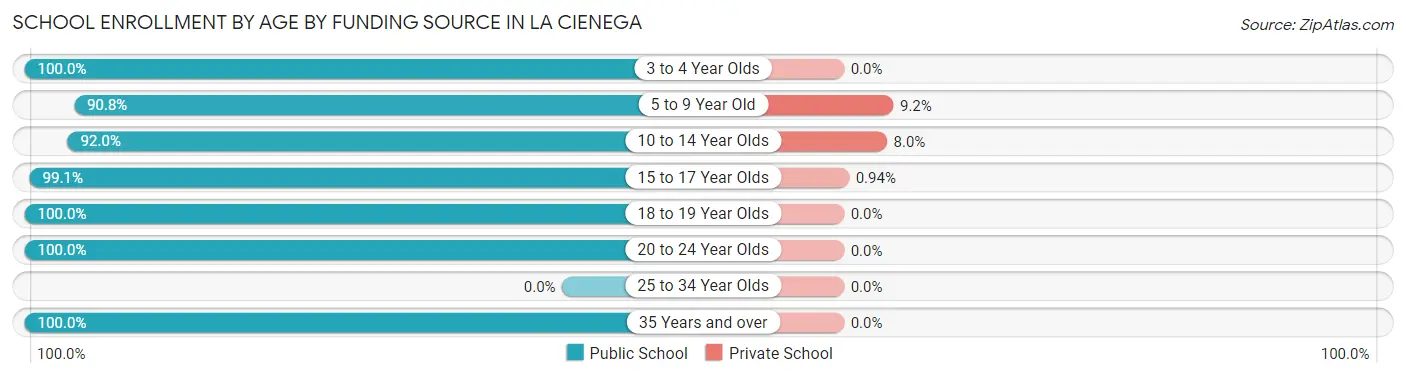
| Age Bracket | Public School | Private School |
| 3 to 4 Year Olds | 10 (100.0%) | 0 (0.0%) |
| 5 to 9 Year Old | 148 (90.8%) | 15 (9.2%) |
| 10 to 14 Year Olds | 288 (92.0%) | 25 (8.0%) |
| 15 to 17 Year Olds | 211 (99.1%) | 2 (0.9%) |
| 18 to 19 Year Olds | 32 (100.0%) | 0 (0.0%) |
| 20 to 24 Year Olds | 30 (100.0%) | 0 (0.0%) |
| 25 to 34 Year Olds | 0 (0.0%) | 0 (0.0%) |
| 35 Years and over | 54 (100.0%) | 0 (0.0%) |
| Total | 773 (94.8%) | 42 (5.2%) |
Educational Attainment by Field of Study in La Cienega
Liberal arts & history (131 | 18.6%), business (122 | 17.3%), computers & mathematics (116 | 16.5%), education (87 | 12.4%), and literature & languages (58 | 8.2%) are the most common fields of study among 704 individuals in La Cienega who have obtained a bachelor's degree or higher.
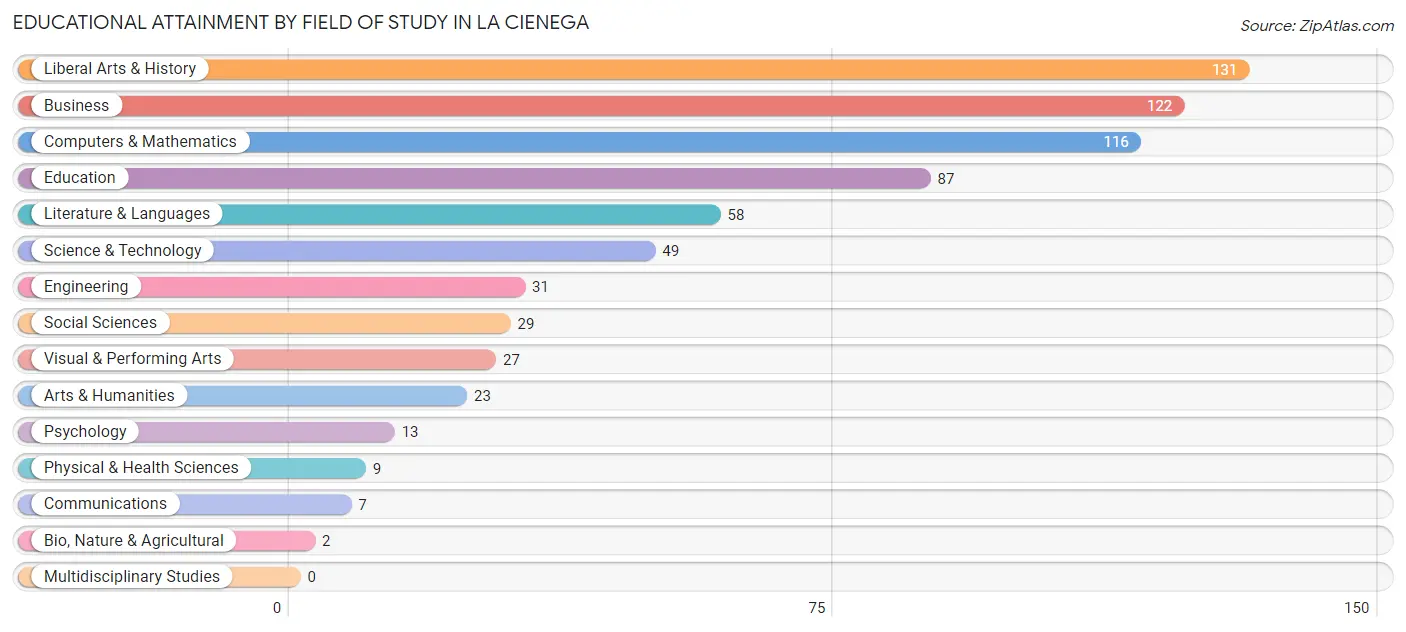
| Field of Study | # Graduates | % Graduates |
| Computers & Mathematics | 116 | 16.5% |
| Bio, Nature & Agricultural | 2 | 0.3% |
| Physical & Health Sciences | 9 | 1.3% |
| Psychology | 13 | 1.8% |
| Social Sciences | 29 | 4.1% |
| Engineering | 31 | 4.4% |
| Multidisciplinary Studies | 0 | 0.0% |
| Science & Technology | 49 | 7.0% |
| Business | 122 | 17.3% |
| Education | 87 | 12.4% |
| Literature & Languages | 58 | 8.2% |
| Liberal Arts & History | 131 | 18.6% |
| Visual & Performing Arts | 27 | 3.8% |
| Communications | 7 | 1.0% |
| Arts & Humanities | 23 | 3.3% |
| Total | 704 | 100.0% |
Transportation & Commute in La Cienega
Vehicle Availability by Sex in La Cienega
The most prevalent vehicle ownership categories in La Cienega are males with 3 vehicles (503, accounting for 43.8%) and females with 3 vehicles (339, making up 51.5%).
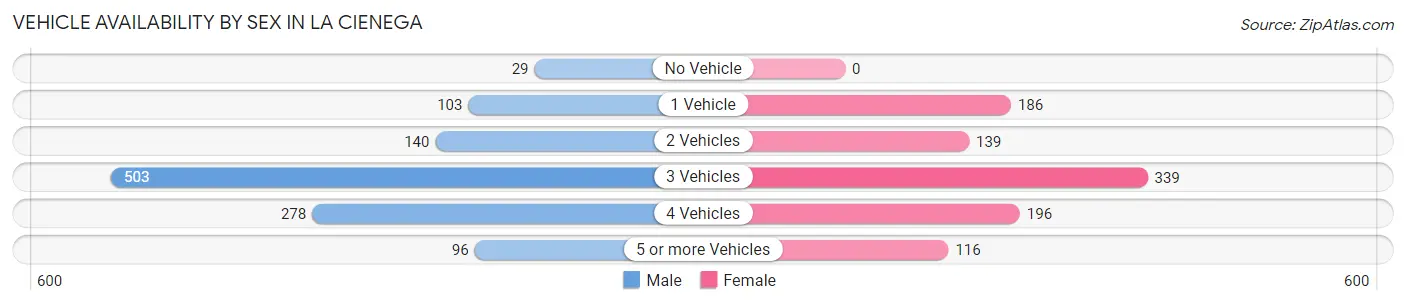
| Vehicles Available | Male | Female |
| No Vehicle | 29 (2.5%) | 0 (0.0%) |
| 1 Vehicle | 103 (9.0%) | 186 (19.1%) |
| 2 Vehicles | 140 (12.2%) | 139 (14.2%) |
| 3 Vehicles | 503 (43.8%) | 339 (34.7%) |
| 4 Vehicles | 278 (24.2%) | 196 (20.1%) |
| 5 or more Vehicles | 96 (8.4%) | 116 (11.9%) |
| Total | 1,149 (100.0%) | 976 (100.0%) |
Commute Time in La Cienega
The most frequently occuring commute durations in La Cienega are 30 to 34 minutes (609 commuters, 30.6%), 20 to 24 minutes (495 commuters, 24.9%), and 15 to 19 minutes (274 commuters, 13.8%).
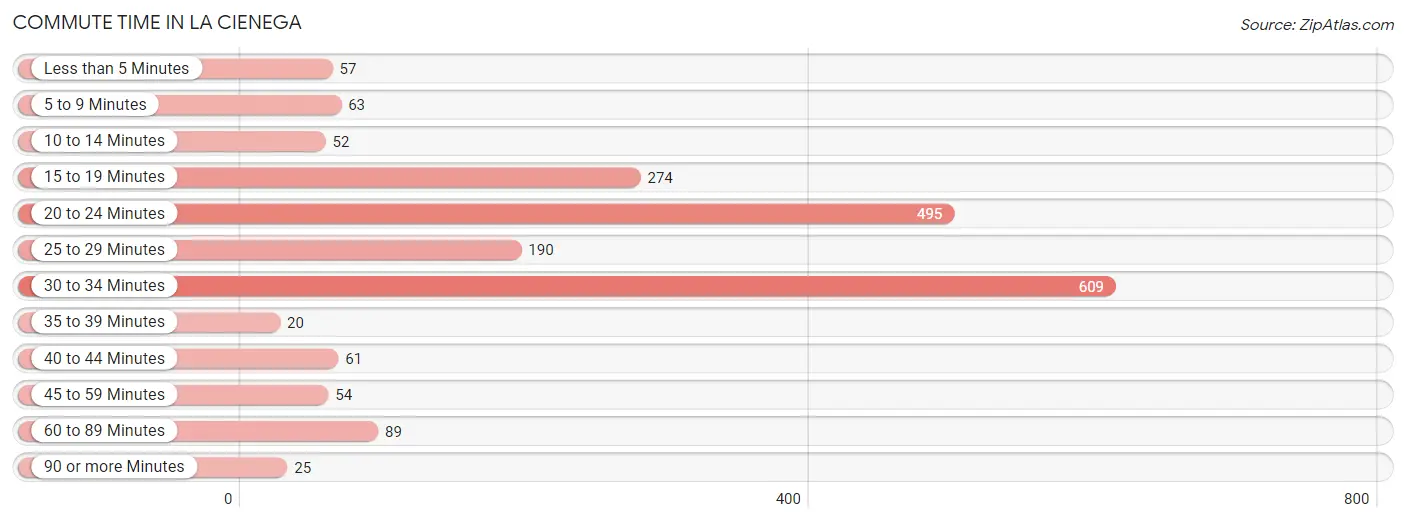
| Commute Time | # Commuters | % Commuters |
| Less than 5 Minutes | 57 | 2.9% |
| 5 to 9 Minutes | 63 | 3.2% |
| 10 to 14 Minutes | 52 | 2.6% |
| 15 to 19 Minutes | 274 | 13.8% |
| 20 to 24 Minutes | 495 | 24.9% |
| 25 to 29 Minutes | 190 | 9.6% |
| 30 to 34 Minutes | 609 | 30.6% |
| 35 to 39 Minutes | 20 | 1.0% |
| 40 to 44 Minutes | 61 | 3.1% |
| 45 to 59 Minutes | 54 | 2.7% |
| 60 to 89 Minutes | 89 | 4.5% |
| 90 or more Minutes | 25 | 1.3% |
Commute Time by Sex in La Cienega
The most common commute times in La Cienega are 20 to 24 minutes (372 commuters, 34.4%) for males and 30 to 34 minutes (384 commuters, 42.3%) for females.
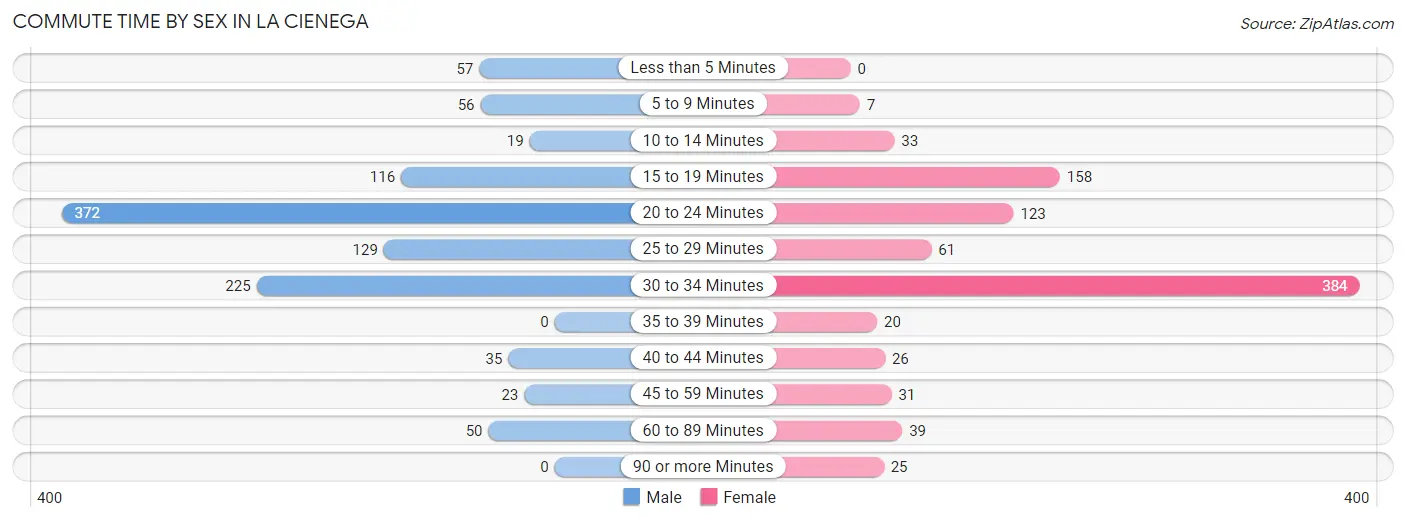
| Commute Time | Male | Female |
| Less than 5 Minutes | 57 (5.3%) | 0 (0.0%) |
| 5 to 9 Minutes | 56 (5.2%) | 7 (0.8%) |
| 10 to 14 Minutes | 19 (1.8%) | 33 (3.6%) |
| 15 to 19 Minutes | 116 (10.7%) | 158 (17.4%) |
| 20 to 24 Minutes | 372 (34.4%) | 123 (13.6%) |
| 25 to 29 Minutes | 129 (11.9%) | 61 (6.7%) |
| 30 to 34 Minutes | 225 (20.8%) | 384 (42.3%) |
| 35 to 39 Minutes | 0 (0.0%) | 20 (2.2%) |
| 40 to 44 Minutes | 35 (3.2%) | 26 (2.9%) |
| 45 to 59 Minutes | 23 (2.1%) | 31 (3.4%) |
| 60 to 89 Minutes | 50 (4.6%) | 39 (4.3%) |
| 90 or more Minutes | 0 (0.0%) | 25 (2.8%) |
Time of Departure to Work by Sex in La Cienega
The most frequent times of departure to work in La Cienega are 7:30 AM to 7:59 AM (336, 31.0%) for males and 9:00 AM to 9:59 AM (193, 21.3%) for females.
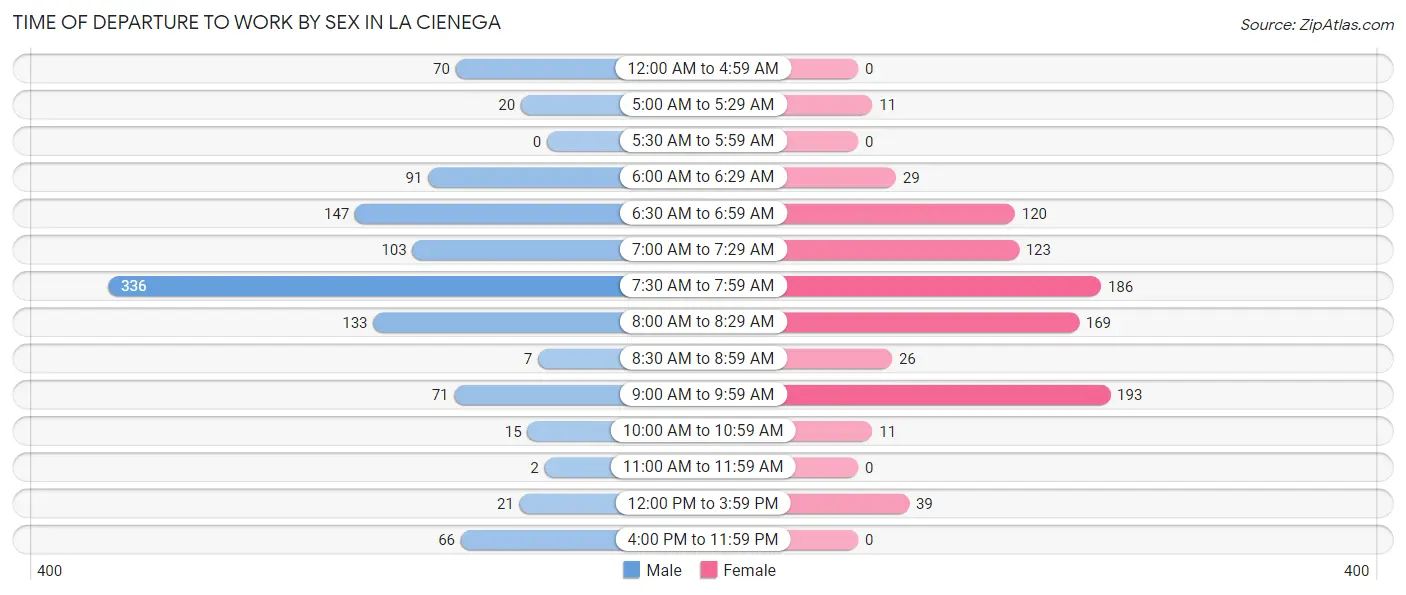
| Time of Departure | Male | Female |
| 12:00 AM to 4:59 AM | 70 (6.5%) | 0 (0.0%) |
| 5:00 AM to 5:29 AM | 20 (1.8%) | 11 (1.2%) |
| 5:30 AM to 5:59 AM | 0 (0.0%) | 0 (0.0%) |
| 6:00 AM to 6:29 AM | 91 (8.4%) | 29 (3.2%) |
| 6:30 AM to 6:59 AM | 147 (13.6%) | 120 (13.2%) |
| 7:00 AM to 7:29 AM | 103 (9.5%) | 123 (13.6%) |
| 7:30 AM to 7:59 AM | 336 (31.0%) | 186 (20.5%) |
| 8:00 AM to 8:29 AM | 133 (12.3%) | 169 (18.6%) |
| 8:30 AM to 8:59 AM | 7 (0.6%) | 26 (2.9%) |
| 9:00 AM to 9:59 AM | 71 (6.6%) | 193 (21.3%) |
| 10:00 AM to 10:59 AM | 15 (1.4%) | 11 (1.2%) |
| 11:00 AM to 11:59 AM | 2 (0.2%) | 0 (0.0%) |
| 12:00 PM to 3:59 PM | 21 (1.9%) | 39 (4.3%) |
| 4:00 PM to 11:59 PM | 66 (6.1%) | 0 (0.0%) |
| Total | 1,082 (100.0%) | 907 (100.0%) |
Housing Occupancy in La Cienega
Occupancy by Ownership in La Cienega
Of the total 1,321 dwellings in La Cienega, owner-occupied units account for 1,085 (82.1%), while renter-occupied units make up 236 (17.9%).
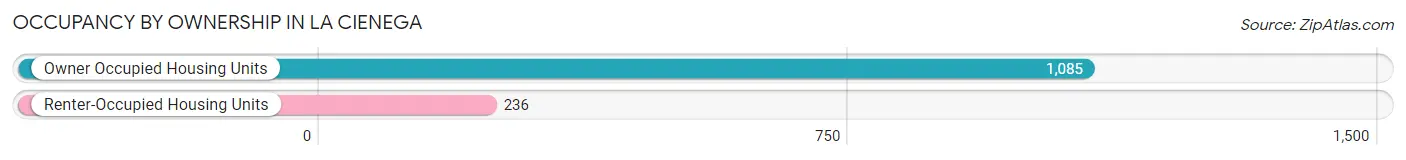
| Occupancy | # Housing Units | % Housing Units |
| Owner Occupied Housing Units | 1,085 | 82.1% |
| Renter-Occupied Housing Units | 236 | 17.9% |
| Total Occupied Housing Units | 1,321 | 100.0% |
Occupancy by Household Size in La Cienega
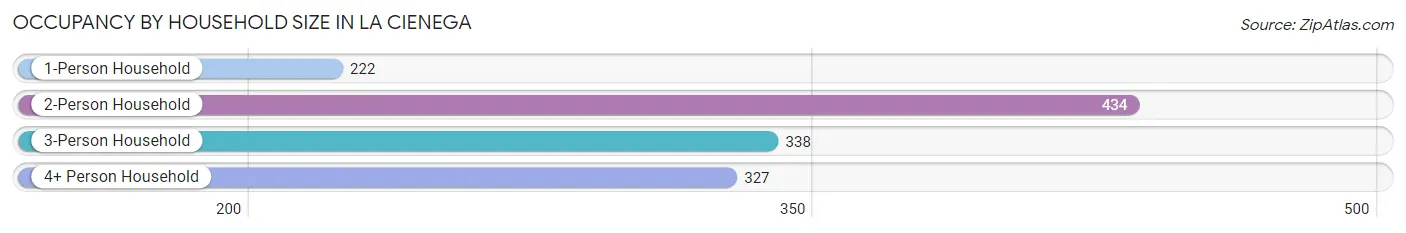
| Household Size | # Housing Units | % Housing Units |
| 1-Person Household | 222 | 16.8% |
| 2-Person Household | 434 | 32.9% |
| 3-Person Household | 338 | 25.6% |
| 4+ Person Household | 327 | 24.7% |
| Total Housing Units | 1,321 | 100.0% |
Occupancy by Ownership by Household Size in La Cienega
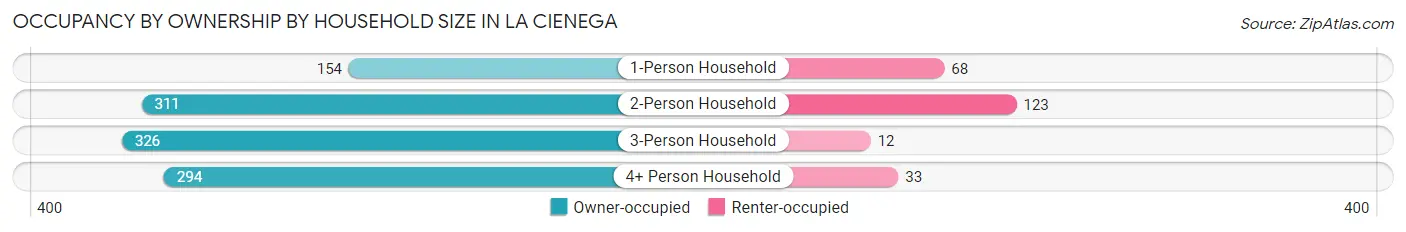
| Household Size | Owner-occupied | Renter-occupied |
| 1-Person Household | 154 (69.4%) | 68 (30.6%) |
| 2-Person Household | 311 (71.7%) | 123 (28.3%) |
| 3-Person Household | 326 (96.5%) | 12 (3.5%) |
| 4+ Person Household | 294 (89.9%) | 33 (10.1%) |
| Total Housing Units | 1,085 (82.1%) | 236 (17.9%) |
Occupancy by Educational Attainment in La Cienega
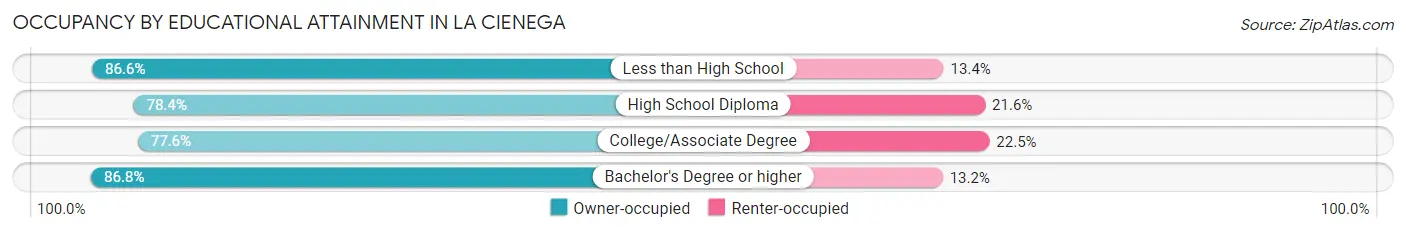
| Household Size | Owner-occupied | Renter-occupied |
| Less than High School | 343 (86.6%) | 53 (13.4%) |
| High School Diploma | 272 (78.4%) | 75 (21.6%) |
| College/Associate Degree | 266 (77.5%) | 77 (22.5%) |
| Bachelor's Degree or higher | 204 (86.8%) | 31 (13.2%) |
Occupancy by Age of Householder in La Cienega
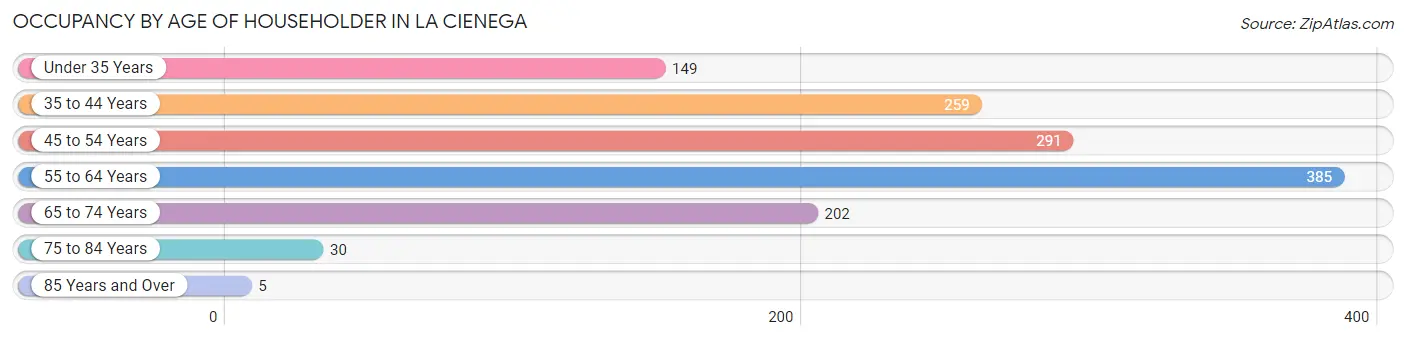
| Age Bracket | # Households | % Households |
| Under 35 Years | 149 | 11.3% |
| 35 to 44 Years | 259 | 19.6% |
| 45 to 54 Years | 291 | 22.0% |
| 55 to 64 Years | 385 | 29.1% |
| 65 to 74 Years | 202 | 15.3% |
| 75 to 84 Years | 30 | 2.3% |
| 85 Years and Over | 5 | 0.4% |
| Total | 1,321 | 100.0% |
Housing Finances in La Cienega
Median Income by Occupancy in La Cienega
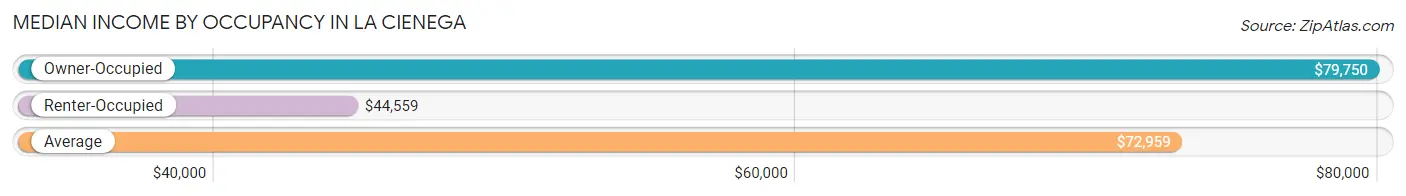
| Occupancy Type | # Households | Median Income |
| Owner-Occupied | 1,085 (82.1%) | $79,750 |
| Renter-Occupied | 236 (17.9%) | $44,559 |
| Average | 1,321 (100.0%) | $72,959 |
Occupancy by Householder Income Bracket in La Cienega
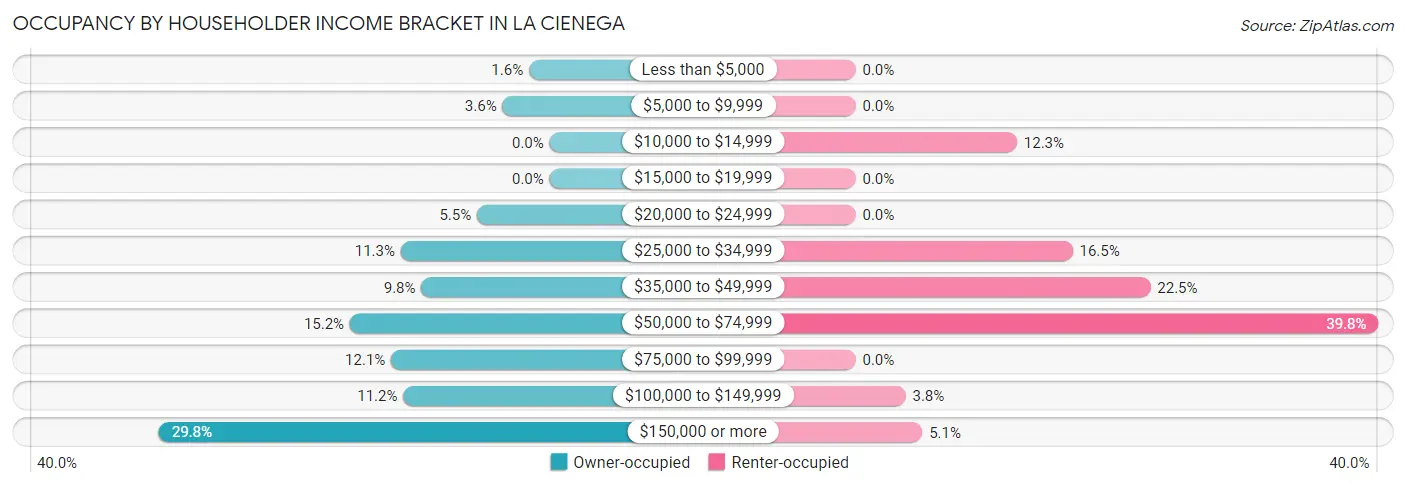
| Income Bracket | Owner-occupied | Renter-occupied |
| Less than $5,000 | 17 (1.6%) | 0 (0.0%) |
| $5,000 to $9,999 | 39 (3.6%) | 0 (0.0%) |
| $10,000 to $14,999 | 0 (0.0%) | 29 (12.3%) |
| $15,000 to $19,999 | 0 (0.0%) | 0 (0.0%) |
| $20,000 to $24,999 | 60 (5.5%) | 0 (0.0%) |
| $25,000 to $34,999 | 123 (11.3%) | 39 (16.5%) |
| $35,000 to $49,999 | 106 (9.8%) | 53 (22.5%) |
| $50,000 to $74,999 | 165 (15.2%) | 94 (39.8%) |
| $75,000 to $99,999 | 131 (12.1%) | 0 (0.0%) |
| $100,000 to $149,999 | 121 (11.2%) | 9 (3.8%) |
| $150,000 or more | 323 (29.8%) | 12 (5.1%) |
| Total | 1,085 (100.0%) | 236 (100.0%) |
Monthly Housing Cost Tiers in La Cienega
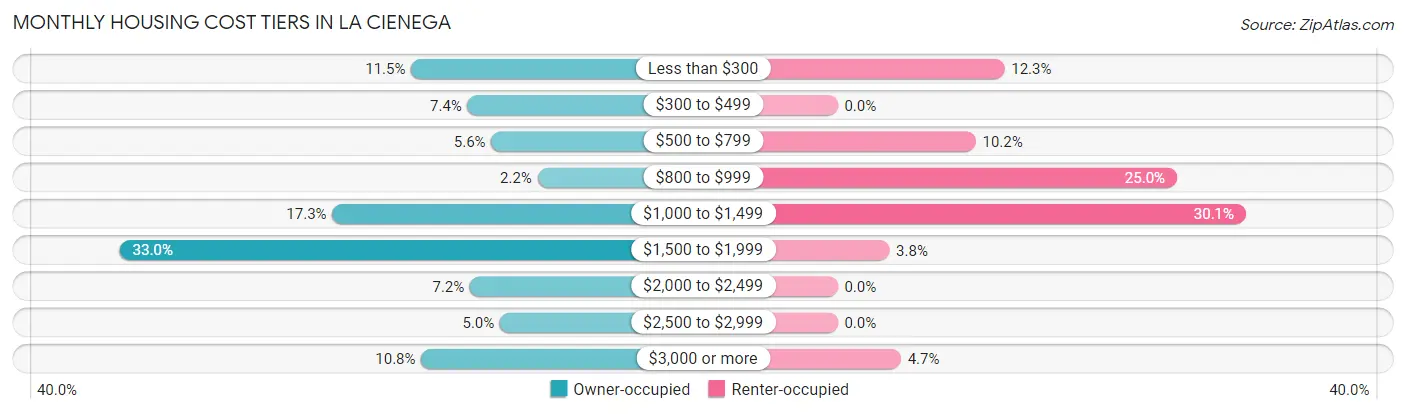
| Monthly Cost | Owner-occupied | Renter-occupied |
| Less than $300 | 125 (11.5%) | 29 (12.3%) |
| $300 to $499 | 80 (7.4%) | 0 (0.0%) |
| $500 to $799 | 61 (5.6%) | 24 (10.2%) |
| $800 to $999 | 24 (2.2%) | 59 (25.0%) |
| $1,000 to $1,499 | 188 (17.3%) | 71 (30.1%) |
| $1,500 to $1,999 | 358 (33.0%) | 9 (3.8%) |
| $2,000 to $2,499 | 78 (7.2%) | 0 (0.0%) |
| $2,500 to $2,999 | 54 (5.0%) | 0 (0.0%) |
| $3,000 or more | 117 (10.8%) | 11 (4.7%) |
| Total | 1,085 (100.0%) | 236 (100.0%) |
Physical Housing Characteristics in La Cienega
Housing Structures in La Cienega
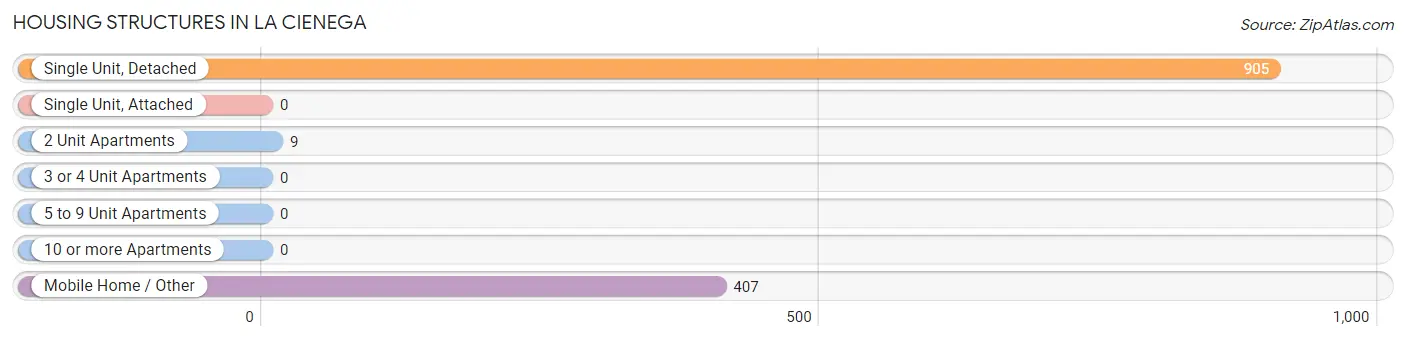
| Structure Type | # Housing Units | % Housing Units |
| Single Unit, Detached | 905 | 68.5% |
| Single Unit, Attached | 0 | 0.0% |
| 2 Unit Apartments | 9 | 0.7% |
| 3 or 4 Unit Apartments | 0 | 0.0% |
| 5 to 9 Unit Apartments | 0 | 0.0% |
| 10 or more Apartments | 0 | 0.0% |
| Mobile Home / Other | 407 | 30.8% |
| Total | 1,321 | 100.0% |
Housing Structures by Occupancy in La Cienega
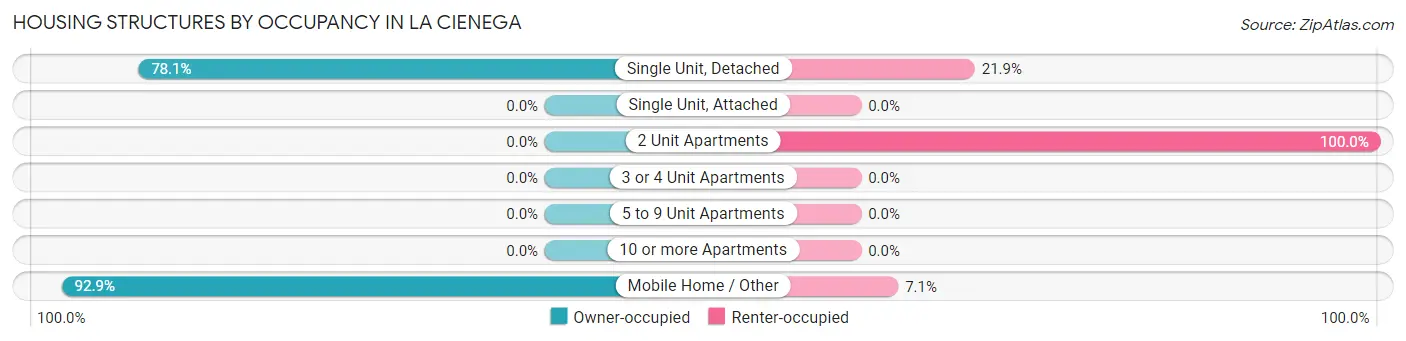
| Structure Type | Owner-occupied | Renter-occupied |
| Single Unit, Detached | 707 (78.1%) | 198 (21.9%) |
| Single Unit, Attached | 0 (0.0%) | 0 (0.0%) |
| 2 Unit Apartments | 0 (0.0%) | 9 (100.0%) |
| 3 or 4 Unit Apartments | 0 (0.0%) | 0 (0.0%) |
| 5 to 9 Unit Apartments | 0 (0.0%) | 0 (0.0%) |
| 10 or more Apartments | 0 (0.0%) | 0 (0.0%) |
| Mobile Home / Other | 378 (92.9%) | 29 (7.1%) |
| Total | 1,085 (82.1%) | 236 (17.9%) |
Housing Structures by Number of Rooms in La Cienega
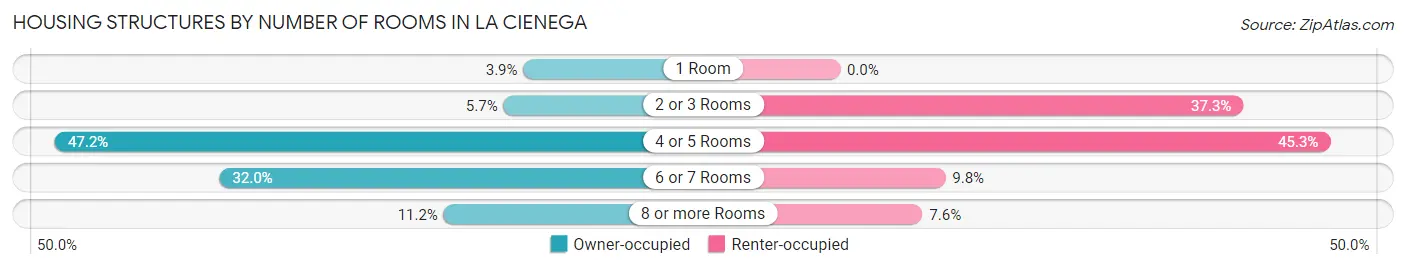
| Number of Rooms | Owner-occupied | Renter-occupied |
| 1 Room | 42 (3.9%) | 0 (0.0%) |
| 2 or 3 Rooms | 62 (5.7%) | 88 (37.3%) |
| 4 or 5 Rooms | 512 (47.2%) | 107 (45.3%) |
| 6 or 7 Rooms | 347 (32.0%) | 23 (9.8%) |
| 8 or more Rooms | 122 (11.2%) | 18 (7.6%) |
| Total | 1,085 (100.0%) | 236 (100.0%) |
Housing Structure by Heating Type in La Cienega
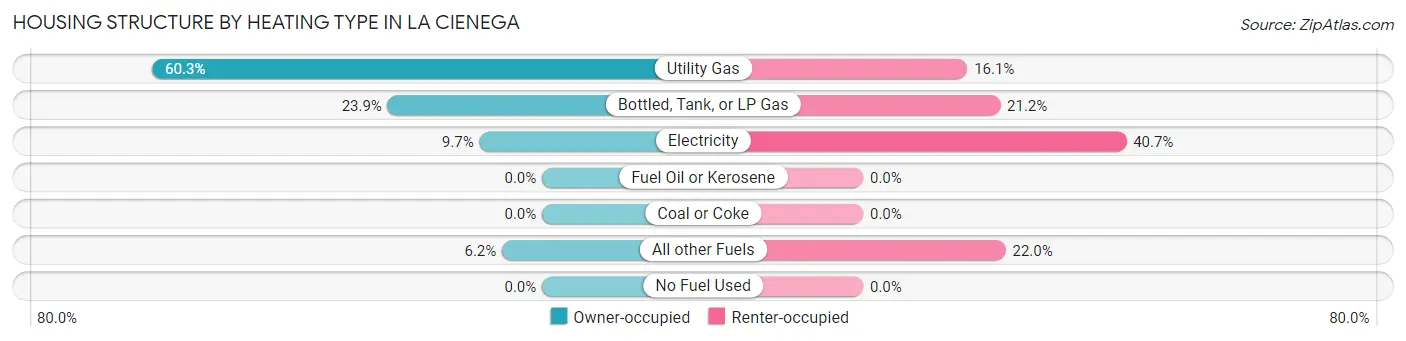
| Heating Type | Owner-occupied | Renter-occupied |
| Utility Gas | 654 (60.3%) | 38 (16.1%) |
| Bottled, Tank, or LP Gas | 259 (23.9%) | 50 (21.2%) |
| Electricity | 105 (9.7%) | 96 (40.7%) |
| Fuel Oil or Kerosene | 0 (0.0%) | 0 (0.0%) |
| Coal or Coke | 0 (0.0%) | 0 (0.0%) |
| All other Fuels | 67 (6.2%) | 52 (22.0%) |
| No Fuel Used | 0 (0.0%) | 0 (0.0%) |
| Total | 1,085 (100.0%) | 236 (100.0%) |
Household Vehicle Usage in La Cienega
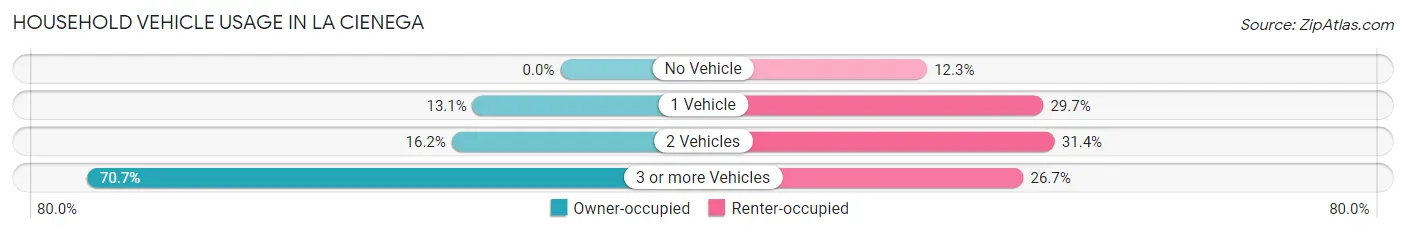
| Vehicles per Household | Owner-occupied | Renter-occupied |
| No Vehicle | 0 (0.0%) | 29 (12.3%) |
| 1 Vehicle | 142 (13.1%) | 70 (29.7%) |
| 2 Vehicles | 176 (16.2%) | 74 (31.4%) |
| 3 or more Vehicles | 767 (70.7%) | 63 (26.7%) |
| Total | 1,085 (100.0%) | 236 (100.0%) |
Real Estate & Mortgages in La Cienega
Real Estate and Mortgage Overview in La Cienega
| Characteristic | Without Mortgage | With Mortgage |
| Housing Units | 329 | 756 |
| Median Property Value | $226,000 | $413,700 |
| Median Household Income | $73,033 | $285 |
| Monthly Housing Costs | $397 | $117 |
| Real Estate Taxes | $1,351 | $27 |
Property Value by Mortgage Status in La Cienega
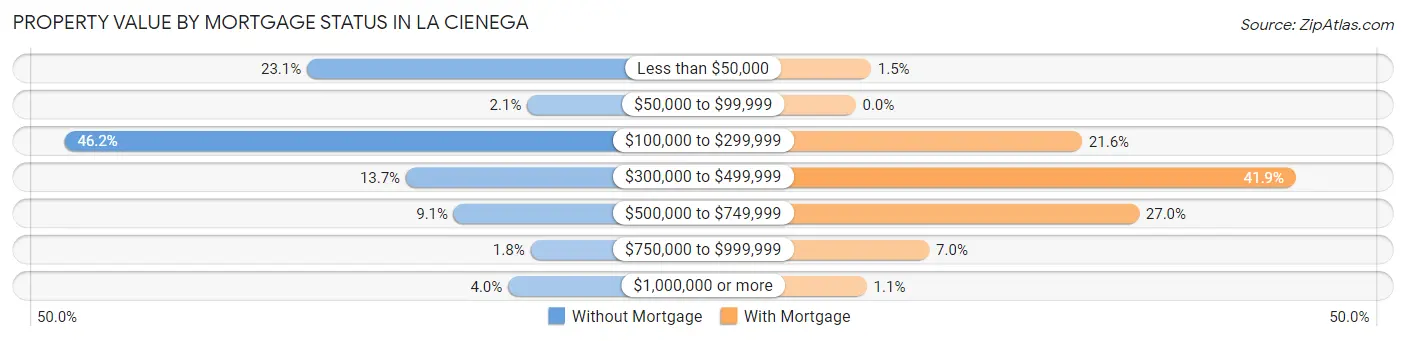
| Property Value | Without Mortgage | With Mortgage |
| Less than $50,000 | 76 (23.1%) | 11 (1.5%) |
| $50,000 to $99,999 | 7 (2.1%) | 0 (0.0%) |
| $100,000 to $299,999 | 152 (46.2%) | 163 (21.6%) |
| $300,000 to $499,999 | 45 (13.7%) | 317 (41.9%) |
| $500,000 to $749,999 | 30 (9.1%) | 204 (27.0%) |
| $750,000 to $999,999 | 6 (1.8%) | 53 (7.0%) |
| $1,000,000 or more | 13 (4.0%) | 8 (1.1%) |
| Total | 329 (100.0%) | 756 (100.0%) |
Household Income by Mortgage Status in La Cienega
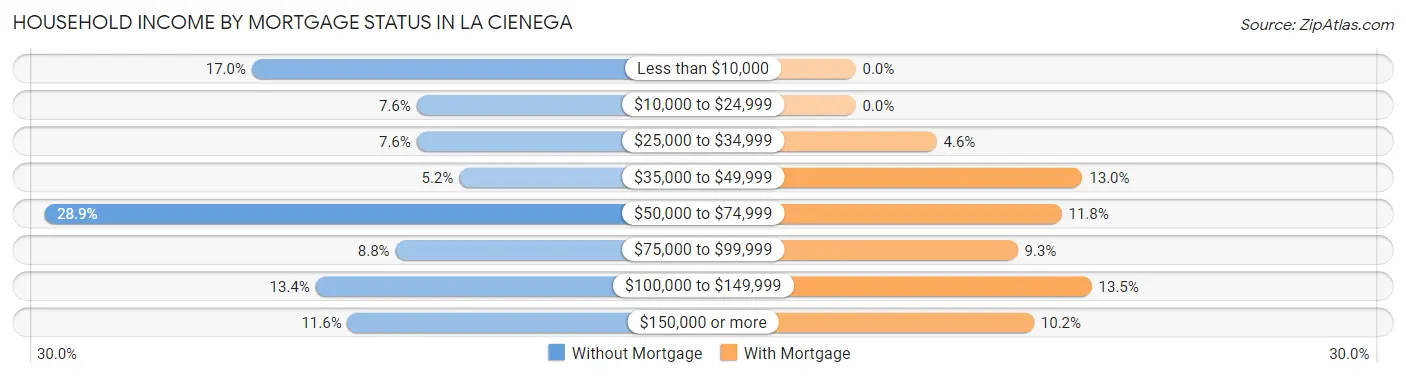
| Household Income | Without Mortgage | With Mortgage |
| Less than $10,000 | 56 (17.0%) | 0 (0.0%) |
| $10,000 to $24,999 | 25 (7.6%) | 0 (0.0%) |
| $25,000 to $34,999 | 25 (7.6%) | 35 (4.6%) |
| $35,000 to $49,999 | 17 (5.2%) | 98 (13.0%) |
| $50,000 to $74,999 | 95 (28.9%) | 89 (11.8%) |
| $75,000 to $99,999 | 29 (8.8%) | 70 (9.3%) |
| $100,000 to $149,999 | 44 (13.4%) | 102 (13.5%) |
| $150,000 or more | 38 (11.6%) | 77 (10.2%) |
| Total | 329 (100.0%) | 756 (100.0%) |
Property Value to Household Income Ratio in La Cienega
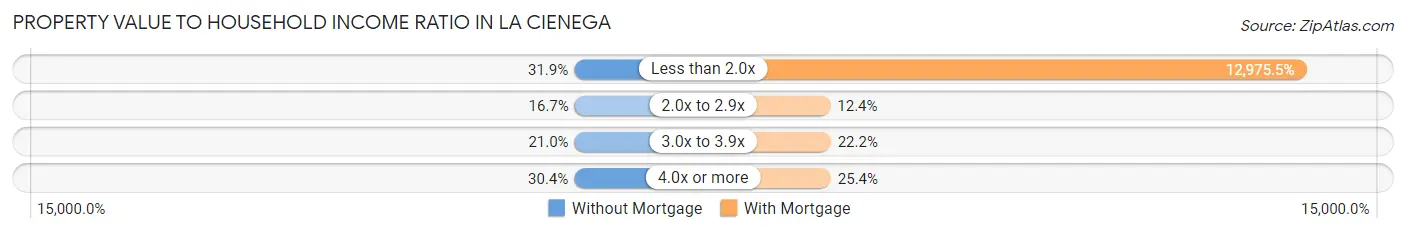
| Value-to-Income Ratio | Without Mortgage | With Mortgage |
| Less than 2.0x | 105 (31.9%) | 98,095 (12,975.5%) |
| 2.0x to 2.9x | 55 (16.7%) | 94 (12.4%) |
| 3.0x to 3.9x | 69 (21.0%) | 168 (22.2%) |
| 4.0x or more | 100 (30.4%) | 192 (25.4%) |
| Total | 329 (100.0%) | 756 (100.0%) |
Real Estate Taxes by Mortgage Status in La Cienega
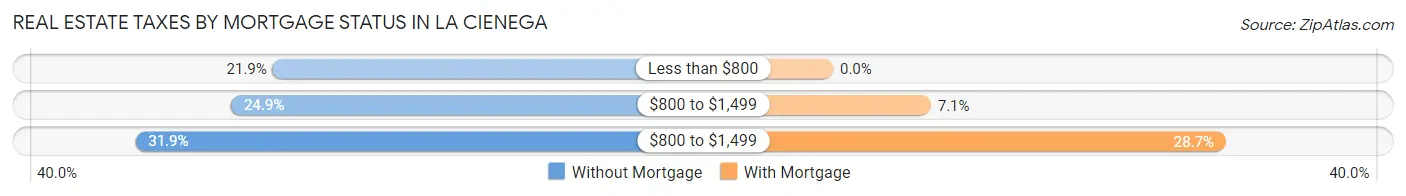
| Property Taxes | Without Mortgage | With Mortgage |
| Less than $800 | 72 (21.9%) | 0 (0.0%) |
| $800 to $1,499 | 82 (24.9%) | 54 (7.1%) |
| $800 to $1,499 | 105 (31.9%) | 217 (28.7%) |
| Total | 329 (100.0%) | 756 (100.0%) |
Health & Disability in La Cienega
Health Insurance Coverage by Age in La Cienega
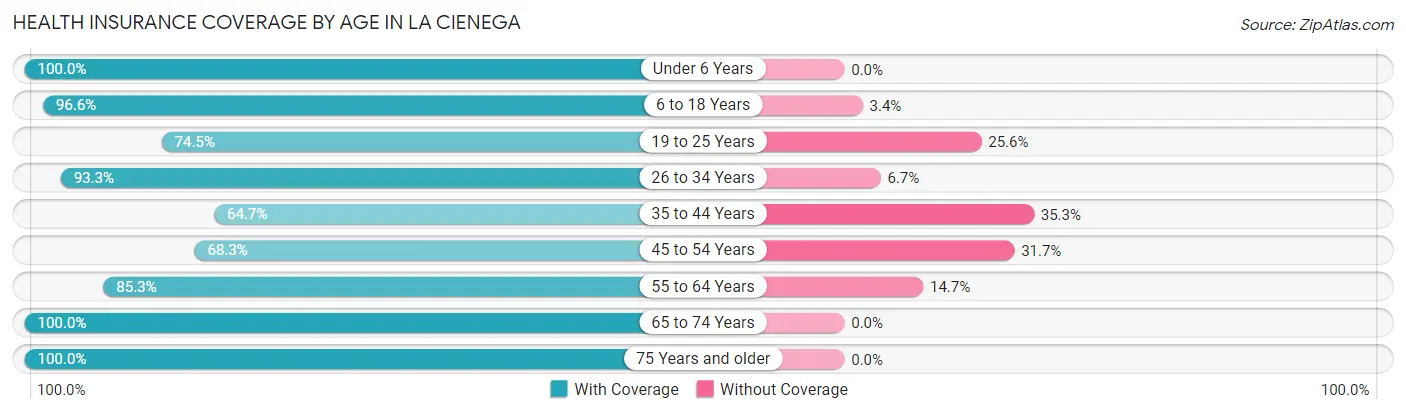
| Age Bracket | With Coverage | Without Coverage |
| Under 6 Years | 225 (100.0%) | 0 (0.0%) |
| 6 to 18 Years | 650 (96.6%) | 23 (3.4%) |
| 19 to 25 Years | 373 (74.5%) | 128 (25.6%) |
| 26 to 34 Years | 249 (93.3%) | 18 (6.7%) |
| 35 to 44 Years | 386 (64.7%) | 211 (35.3%) |
| 45 to 54 Years | 371 (68.3%) | 172 (31.7%) |
| 55 to 64 Years | 610 (85.3%) | 105 (14.7%) |
| 65 to 74 Years | 314 (100.0%) | 0 (0.0%) |
| 75 Years and older | 113 (100.0%) | 0 (0.0%) |
| Total | 3,291 (83.4%) | 657 (16.6%) |
Health Insurance Coverage by Citizenship Status in La Cienega
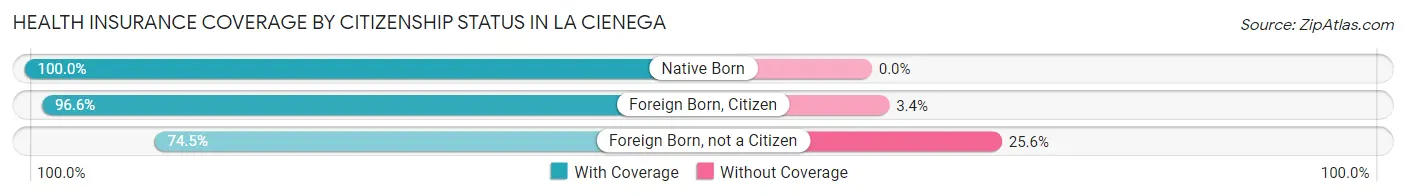
| Citizenship Status | With Coverage | Without Coverage |
| Native Born | 225 (100.0%) | 0 (0.0%) |
| Foreign Born, Citizen | 650 (96.6%) | 23 (3.4%) |
| Foreign Born, not a Citizen | 373 (74.5%) | 128 (25.6%) |
Health Insurance Coverage by Household Income in La Cienega
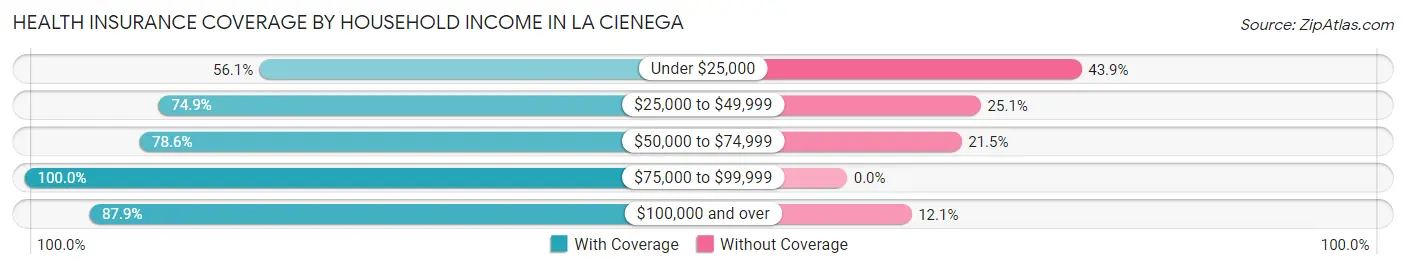
| Household Income | With Coverage | Without Coverage |
| Under $25,000 | 120 (56.1%) | 94 (43.9%) |
| $25,000 to $49,999 | 675 (74.9%) | 226 (25.1%) |
| $50,000 to $74,999 | 564 (78.5%) | 154 (21.4%) |
| $75,000 to $99,999 | 599 (100.0%) | 0 (0.0%) |
| $100,000 and over | 1,333 (87.9%) | 183 (12.1%) |
Public vs Private Health Insurance Coverage by Age in La Cienega
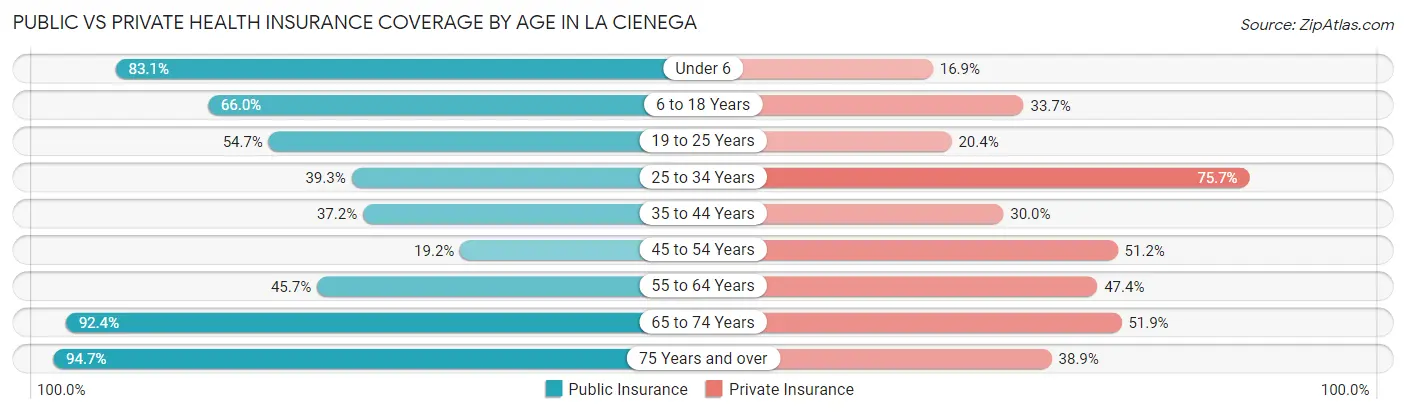
| Age Bracket | Public Insurance | Private Insurance |
| Under 6 | 187 (83.1%) | 38 (16.9%) |
| 6 to 18 Years | 444 (66.0%) | 227 (33.7%) |
| 19 to 25 Years | 274 (54.7%) | 102 (20.4%) |
| 25 to 34 Years | 105 (39.3%) | 202 (75.7%) |
| 35 to 44 Years | 222 (37.2%) | 179 (30.0%) |
| 45 to 54 Years | 104 (19.2%) | 278 (51.2%) |
| 55 to 64 Years | 327 (45.7%) | 339 (47.4%) |
| 65 to 74 Years | 290 (92.4%) | 163 (51.9%) |
| 75 Years and over | 107 (94.7%) | 44 (38.9%) |
| Total | 2,060 (52.2%) | 1,572 (39.8%) |
Disability Status by Sex by Age in La Cienega
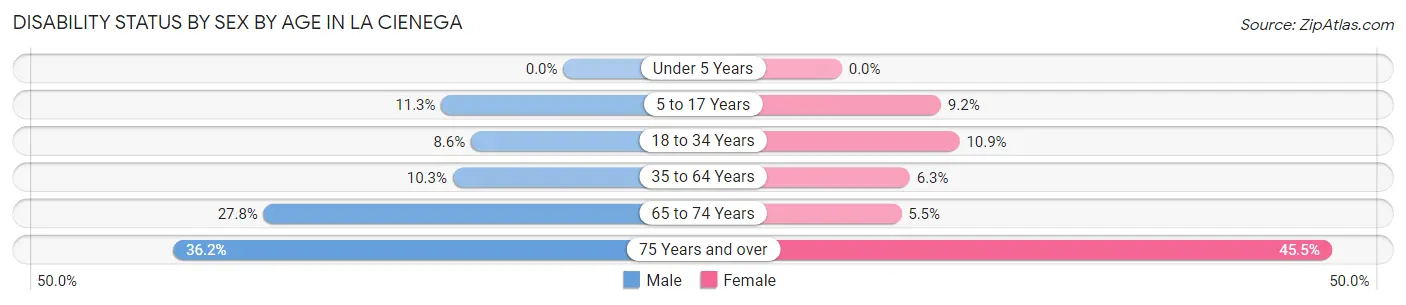
| Age Bracket | Male | Female |
| Under 5 Years | 0 (0.0%) | 0 (0.0%) |
| 5 to 17 Years | 30 (11.3%) | 39 (9.2%) |
| 18 to 34 Years | 27 (8.6%) | 50 (10.9%) |
| 35 to 64 Years | 96 (10.3%) | 58 (6.3%) |
| 65 to 74 Years | 47 (27.8%) | 8 (5.5%) |
| 75 Years and over | 21 (36.2%) | 25 (45.5%) |
Disability Class by Sex by Age in La Cienega
Disability Class: Hearing Difficulty
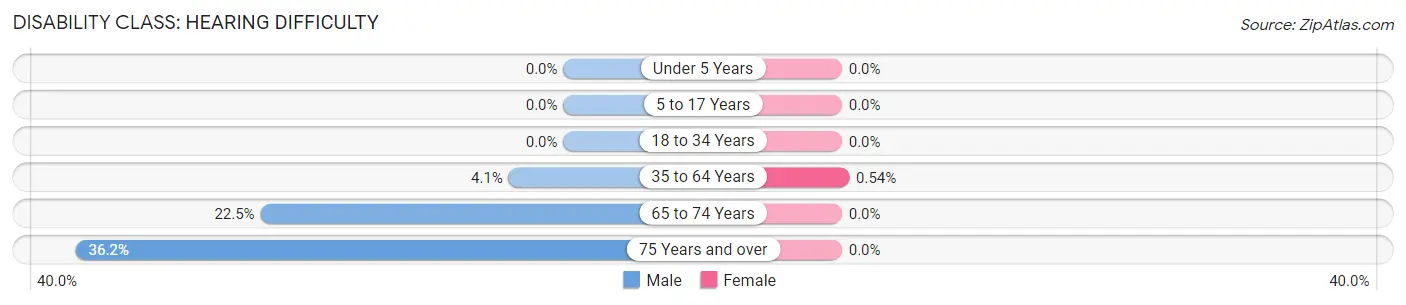
| Age Bracket | Male | Female |
| Under 5 Years | 0 (0.0%) | 0 (0.0%) |
| 5 to 17 Years | 0 (0.0%) | 0 (0.0%) |
| 18 to 34 Years | 0 (0.0%) | 0 (0.0%) |
| 35 to 64 Years | 38 (4.1%) | 5 (0.5%) |
| 65 to 74 Years | 38 (22.5%) | 0 (0.0%) |
| 75 Years and over | 21 (36.2%) | 0 (0.0%) |
Disability Class: Vision Difficulty
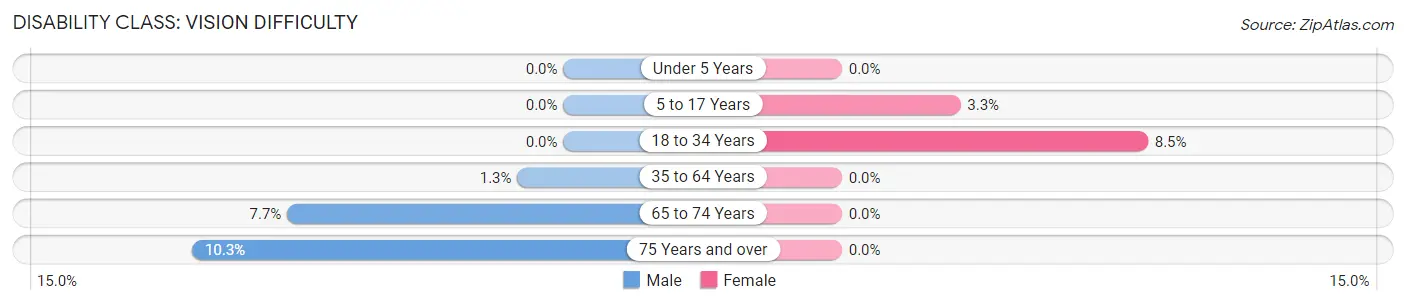
| Age Bracket | Male | Female |
| Under 5 Years | 0 (0.0%) | 0 (0.0%) |
| 5 to 17 Years | 0 (0.0%) | 14 (3.3%) |
| 18 to 34 Years | 0 (0.0%) | 39 (8.5%) |
| 35 to 64 Years | 12 (1.3%) | 0 (0.0%) |
| 65 to 74 Years | 13 (7.7%) | 0 (0.0%) |
| 75 Years and over | 6 (10.3%) | 0 (0.0%) |
Disability Class: Cognitive Difficulty
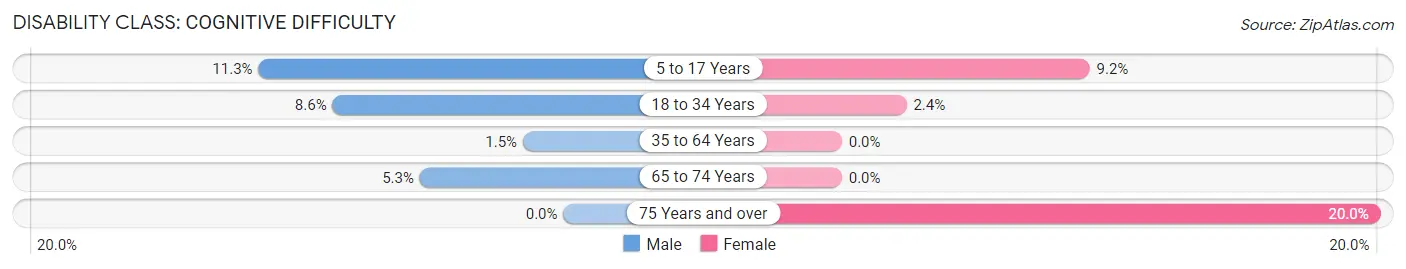
| Age Bracket | Male | Female |
| 5 to 17 Years | 30 (11.3%) | 39 (9.2%) |
| 18 to 34 Years | 27 (8.6%) | 11 (2.4%) |
| 35 to 64 Years | 14 (1.5%) | 0 (0.0%) |
| 65 to 74 Years | 9 (5.3%) | 0 (0.0%) |
| 75 Years and over | 0 (0.0%) | 11 (20.0%) |
Disability Class: Ambulatory Difficulty
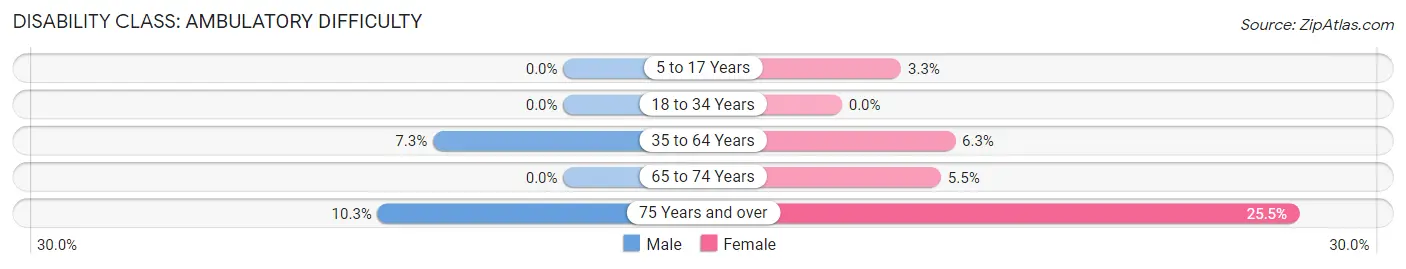
| Age Bracket | Male | Female |
| 5 to 17 Years | 0 (0.0%) | 14 (3.3%) |
| 18 to 34 Years | 0 (0.0%) | 0 (0.0%) |
| 35 to 64 Years | 68 (7.3%) | 58 (6.3%) |
| 65 to 74 Years | 0 (0.0%) | 8 (5.5%) |
| 75 Years and over | 6 (10.3%) | 14 (25.5%) |
Disability Class: Self-Care Difficulty
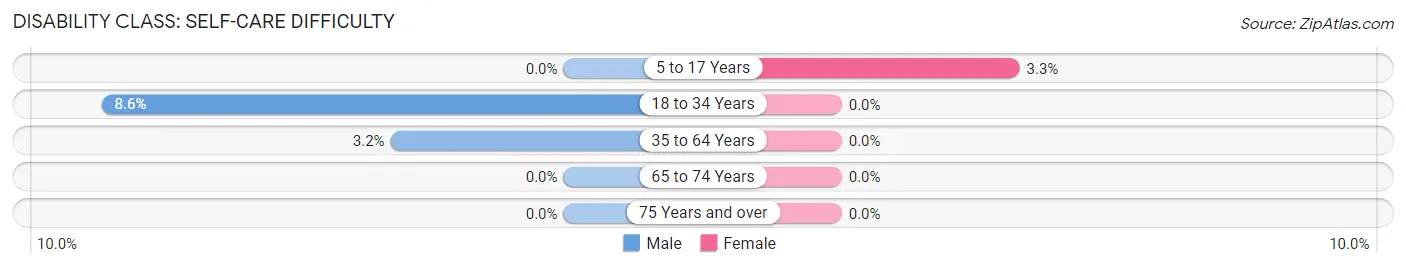
| Age Bracket | Male | Female |
| 5 to 17 Years | 0 (0.0%) | 14 (3.3%) |
| 18 to 34 Years | 27 (8.6%) | 0 (0.0%) |
| 35 to 64 Years | 30 (3.2%) | 0 (0.0%) |
| 65 to 74 Years | 0 (0.0%) | 0 (0.0%) |
| 75 Years and over | 0 (0.0%) | 0 (0.0%) |
Technology Access in La Cienega
Computing Device Access in La Cienega
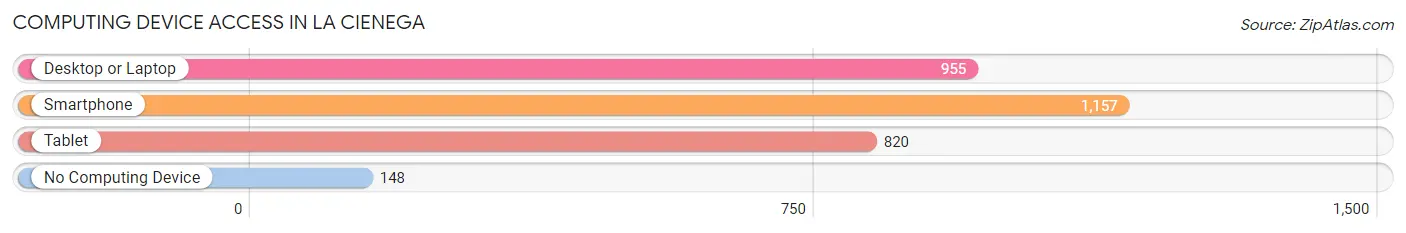
| Device Type | # Households | % Households |
| Desktop or Laptop | 955 | 72.3% |
| Smartphone | 1,157 | 87.6% |
| Tablet | 820 | 62.1% |
| No Computing Device | 148 | 11.2% |
| Total | 1,321 | 100.0% |
Internet Access in La Cienega
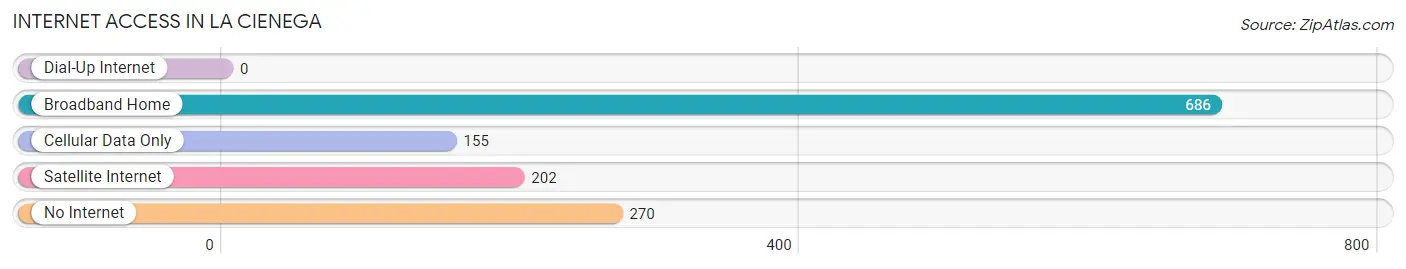
| Internet Type | # Households | % Households |
| Dial-Up Internet | 0 | 0.0% |
| Broadband Home | 686 | 51.9% |
| Cellular Data Only | 155 | 11.7% |
| Satellite Internet | 202 | 15.3% |
| No Internet | 270 | 20.4% |
| Total | 1,321 | 100.0% |
La Cienega Summary
La Cienega is a small unincorporated community located in Santa Fe County, New Mexico. It is situated in the foothills of the Sangre de Cristo Mountains, approximately 20 miles south of Santa Fe. The area is known for its rich history, diverse geography, and vibrant economy.
History
The area now known as La Cienega has been inhabited for centuries. The first known inhabitants were the Pueblo Indians, who lived in the area for thousands of years before the arrival of the Spanish in the 16th century. The Spanish established a mission in the area in 1610, and the area was later settled by Spanish colonists. The area was part of the Spanish province of New Mexico until 1821, when Mexico gained independence from Spain. After the Mexican-American War in 1848, the area became part of the United States.
In the late 19th century, the area was settled by a number of Anglo-American families, who established farms and ranches in the area. The community of La Cienega was established in the early 20th century, and the area has remained largely unchanged since then.
Geography
La Cienega is located in the foothills of the Sangre de Cristo Mountains, approximately 20 miles south of Santa Fe. The area is characterized by rolling hills, open grasslands, and pine forests. The area is also home to a number of small streams and rivers, including the Rio Grande.
The climate in La Cienega is semi-arid, with hot summers and cold winters. The average annual temperature is approximately 55 degrees Fahrenheit, and the average annual precipitation is approximately 12 inches.
Economy
The economy of La Cienega is largely based on agriculture and ranching. The area is home to a number of small farms and ranches, which produce a variety of crops and livestock. The area is also home to a number of small businesses, including restaurants, stores, and other services.
Demographics
As of the 2010 census, the population of La Cienega was 1,845. The population is largely Hispanic, with a small number of Anglo-American and Native American residents. The median household income in La Cienega is approximately $35,000, and the median home value is approximately $150,000.
La Cienega is a small, rural community with a rich history, diverse geography, and vibrant economy. The area is home to a number of small farms and ranches, as well as a variety of small businesses. The population is largely Hispanic, with a small number of Anglo-American and Native American residents. The area is known for its semi-arid climate, rolling hills, and pine forests.
Common Questions
What is Per Capita Income in La Cienega?
Per Capita income in La Cienega is $32,613.
What is the Median Family Income in La Cienega?
Median Family Income in La Cienega is $74,672.
What is the Median Household income in La Cienega?
Median Household Income in La Cienega is $72,959.
What is Income or Wage Gap in La Cienega?
Income or Wage Gap in La Cienega is 28.7%.
Women in La Cienega earn 71.3 cents for every dollar earned by a man.
What is Inequality or Gini Index in La Cienega?
Inequality or Gini Index in La Cienega is 0.41.
What is the Total Population of La Cienega?
Total Population of La Cienega is 3,948.
What is the Total Male Population of La Cienega?
Total Male Population of La Cienega is 1,898.
What is the Total Female Population of La Cienega?
Total Female Population of La Cienega is 2,050.
What is the Ratio of Males per 100 Females in La Cienega?
There are 92.59 Males per 100 Females in La Cienega.
What is the Ratio of Females per 100 Males in La Cienega?
There are 108.01 Females per 100 Males in La Cienega.
What is the Median Population Age in La Cienega?
Median Population Age in La Cienega is 37.4 Years.
What is the Average Family Size in La Cienega
Average Family Size in La Cienega is 3.4 People.
What is the Average Household Size in La Cienega
Average Household Size in La Cienega is 3.0 People.
How Large is the Labor Force in La Cienega?
There are 2,284 People in the Labor Forcein in La Cienega.
What is the Percentage of People in the Labor Force in La Cienega?
72.7% of People are in the Labor Force in La Cienega.
What is the Unemployment Rate in La Cienega?
Unemployment Rate in La Cienega is 6.0%.