Mooresville, IN Map & Demographics
Mooresville Map
Mooresville Overview
$35,108
PER CAPITA INCOME
$79,799
AVG FAMILY INCOME
$68,089
AVG HOUSEHOLD INCOME
34.3%
WAGE / INCOME GAP [ % ]
65.7¢/ $1
WAGE / INCOME GAP [ $ ]
0.42
INEQUALITY / GINI INDEX
9,525
TOTAL POPULATION
4,822
MALE POPULATION
4,703
FEMALE POPULATION
102.53
MALES / 100 FEMALES
97.53
FEMALES / 100 MALES
42.6
MEDIAN AGE
2.9
AVG FAMILY SIZE
2.4
AVG HOUSEHOLD SIZE
4,790
LABOR FORCE [ PEOPLE ]
60.8%
PERCENT IN LABOR FORCE
1.7%
UNEMPLOYMENT RATE
Mooresville Zip Codes
Mooresville Area Codes
Income in Mooresville
Income Overview in Mooresville
Per Capita Income in Mooresville is $35,108, while median incomes of families and households are $79,799 and $68,089 respectively.
| Characteristic | Number | Measure |
| Per Capita Income | 9,525 | $35,108 |
| Median Family Income | 2,565 | $79,799 |
| Mean Family Income | 2,565 | $95,905 |
| Median Household Income | 3,789 | $68,089 |
| Mean Household Income | 3,789 | $83,875 |
| Income Deficit | 2,565 | $0 |
| Wage / Income Gap (%) | 9,525 | 34.34% |
| Wage / Income Gap ($) | 9,525 | 65.66¢ per $1 |
| Gini / Inequality Index | 9,525 | 0.42 |
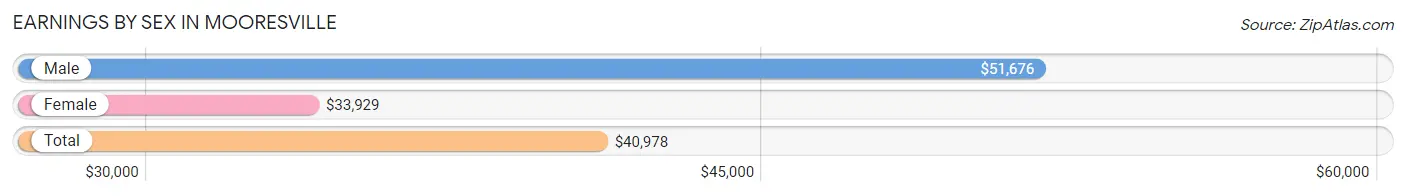
Earnings by Sex in Mooresville
Average Earnings in Mooresville are $40,978, $51,676 for men and $33,929 for women, a difference of 34.3%.
| Sex | Number | Average Earnings |
| Male | 2,665 (53.3%) | $51,676 |
| Female | 2,334 (46.7%) | $33,929 |
| Total | 4,999 (100.0%) | $40,978 |
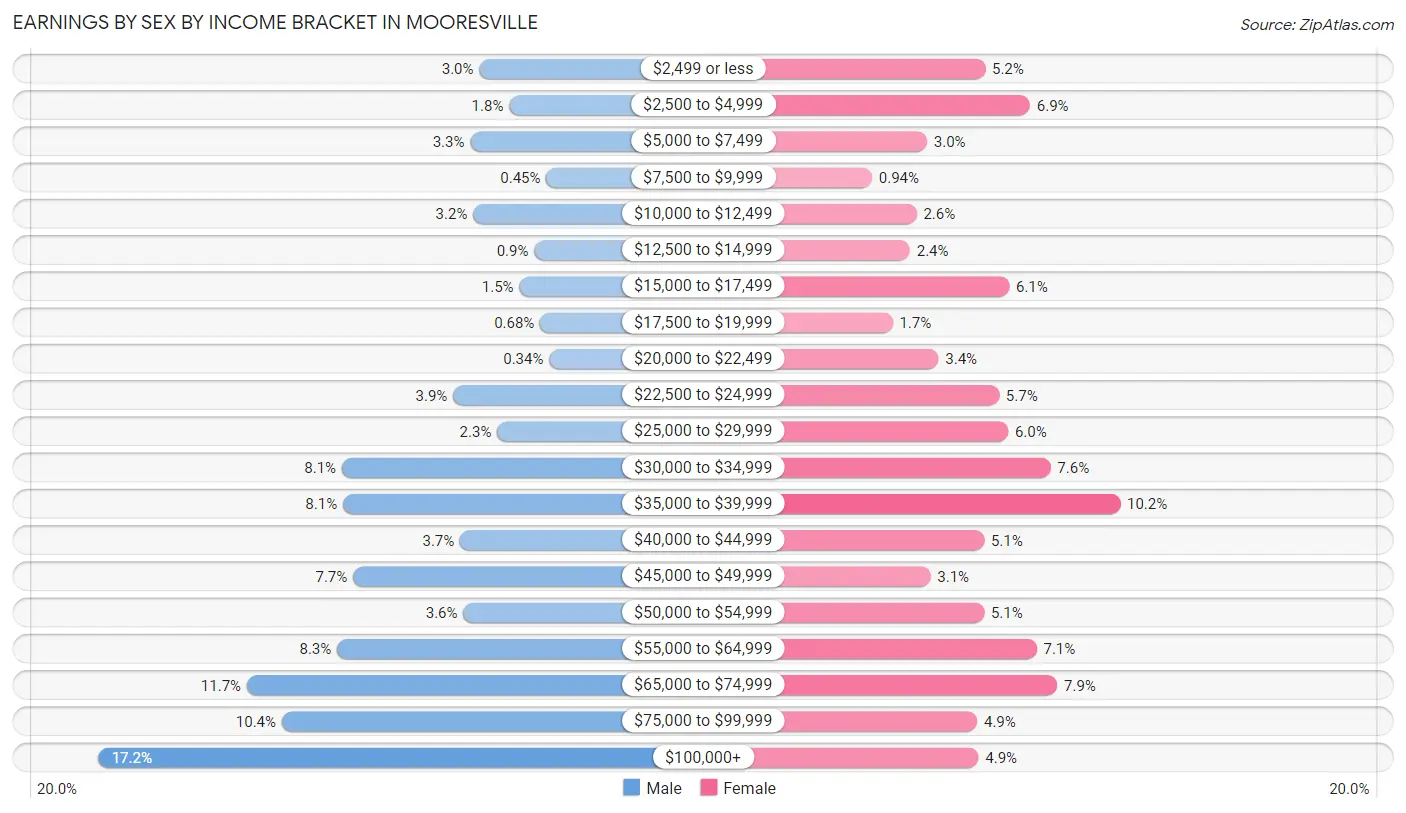
Earnings by Sex by Income Bracket in Mooresville
The most common earnings brackets in Mooresville are $100,000+ for men (459 | 17.2%) and $35,000 to $39,999 for women (239 | 10.2%).
| Income | Male | Female |
| $2,499 or less | 79 (3.0%) | 121 (5.2%) |
| $2,500 to $4,999 | 49 (1.8%) | 160 (6.9%) |
| $5,000 to $7,499 | 88 (3.3%) | 70 (3.0%) |
| $7,500 to $9,999 | 12 (0.4%) | 22 (0.9%) |
| $10,000 to $12,499 | 85 (3.2%) | 61 (2.6%) |
| $12,500 to $14,999 | 24 (0.9%) | 55 (2.4%) |
| $15,000 to $17,499 | 39 (1.5%) | 142 (6.1%) |
| $17,500 to $19,999 | 18 (0.7%) | 40 (1.7%) |
| $20,000 to $22,499 | 9 (0.3%) | 80 (3.4%) |
| $22,500 to $24,999 | 105 (3.9%) | 133 (5.7%) |
| $25,000 to $29,999 | 61 (2.3%) | 141 (6.0%) |
| $30,000 to $34,999 | 216 (8.1%) | 178 (7.6%) |
| $35,000 to $39,999 | 215 (8.1%) | 239 (10.2%) |
| $40,000 to $44,999 | 98 (3.7%) | 120 (5.1%) |
| $45,000 to $49,999 | 205 (7.7%) | 73 (3.1%) |
| $50,000 to $54,999 | 95 (3.6%) | 120 (5.1%) |
| $55,000 to $64,999 | 221 (8.3%) | 166 (7.1%) |
| $65,000 to $74,999 | 311 (11.7%) | 184 (7.9%) |
| $75,000 to $99,999 | 276 (10.4%) | 114 (4.9%) |
| $100,000+ | 459 (17.2%) | 115 (4.9%) |
| Total | 2,665 (100.0%) | 2,334 (100.0%) |
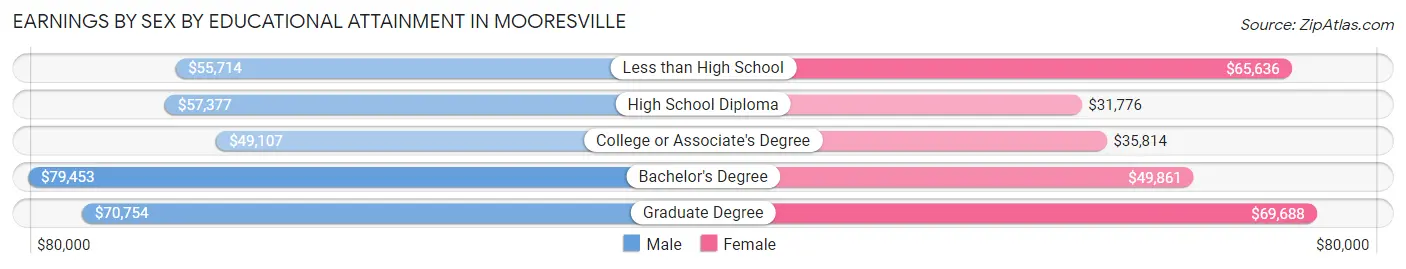
Earnings by Sex by Educational Attainment in Mooresville
Average earnings in Mooresville are $57,290 for men and $36,774 for women, a difference of 35.8%. Men with an educational attainment of bachelor's degree enjoy the highest average annual earnings of $79,453, while those with college or associate's degree education earn the least with $49,107. Women with an educational attainment of graduate degree earn the most with the average annual earnings of $69,688, while those with high school diploma education have the smallest earnings of $31,776.
| Educational Attainment | Male Income | Female Income |
| Less than High School | $55,714 | $65,636 |
| High School Diploma | $57,377 | $31,776 |
| College or Associate's Degree | $49,107 | $35,814 |
| Bachelor's Degree | $79,453 | $49,861 |
| Graduate Degree | $70,754 | $69,688 |
| Total | $57,290 | $36,774 |
Family Income in Mooresville
Family Income Brackets in Mooresville
According to the Mooresville family income data, there are 546 families falling into the $50,000 to $74,999 income range, which is the most common income bracket and makes up 21.3% of all families. Conversely, the $15,000 to $24,999 income bracket is the least frequent group with only 41 families (1.6%) belonging to this category.
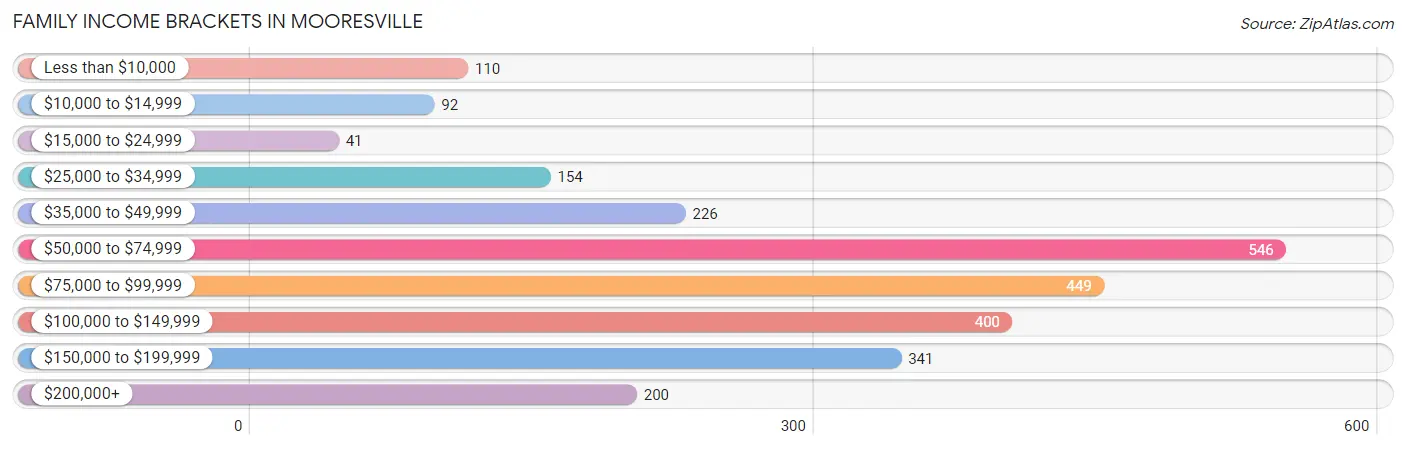
| Income Bracket | # Families | % Families |
| Less than $10,000 | 110 | 4.3% |
| $10,000 to $14,999 | 92 | 3.6% |
| $15,000 to $24,999 | 41 | 1.6% |
| $25,000 to $34,999 | 154 | 6.0% |
| $35,000 to $49,999 | 226 | 8.8% |
| $50,000 to $74,999 | 546 | 21.3% |
| $75,000 to $99,999 | 449 | 17.5% |
| $100,000 to $149,999 | 400 | 15.6% |
| $150,000 to $199,999 | 341 | 13.3% |
| $200,000+ | 200 | 7.8% |
Family Income by Famaliy Size in Mooresville
5-person families (96 | 3.7%) account for the highest median family income in Mooresville with $107,143 per family, while 2-person families (1,306 | 50.9%) have the highest median income of $36,944 per family member.
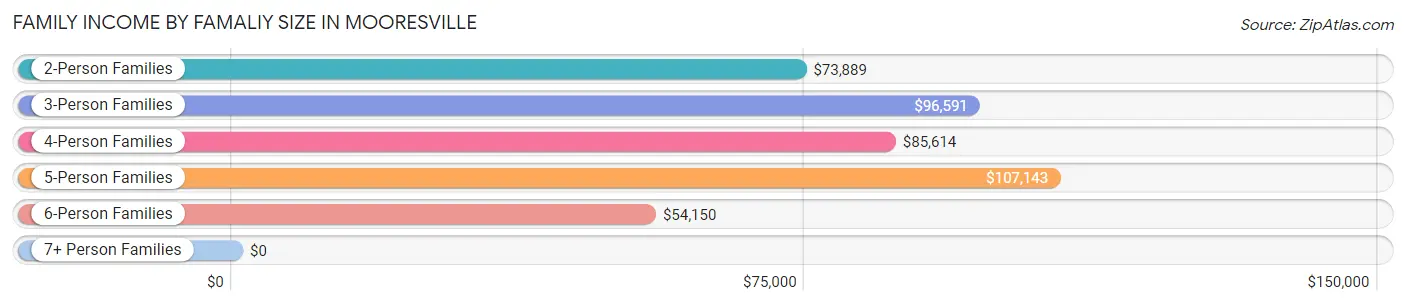
| Income Bracket | # Families | Median Income |
| 2-Person Families | 1,306 (50.9%) | $73,889 |
| 3-Person Families | 604 (23.5%) | $96,591 |
| 4-Person Families | 500 (19.5%) | $85,614 |
| 5-Person Families | 96 (3.7%) | $107,143 |
| 6-Person Families | 33 (1.3%) | $54,150 |
| 7+ Person Families | 26 (1.0%) | $0 |
| Total | 2,565 (100.0%) | $79,799 |
Family Income by Number of Earners in Mooresville
The median family income in Mooresville is $79,799, with families comprising 3+ earners (299) having the highest median family income of $174,398, while families with 1 earner (698) have the lowest median family income of $49,048, accounting for 11.7% and 27.2% of families, respectively.
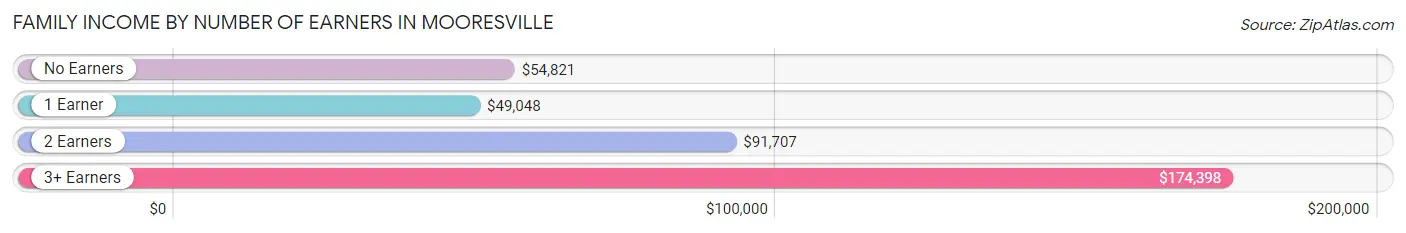
| Number of Earners | # Families | Median Income |
| No Earners | 416 (16.2%) | $54,821 |
| 1 Earner | 698 (27.2%) | $49,048 |
| 2 Earners | 1,152 (44.9%) | $91,707 |
| 3+ Earners | 299 (11.7%) | $174,398 |
| Total | 2,565 (100.0%) | $79,799 |
Household Income in Mooresville
Household Income Brackets in Mooresville
With 746 households falling in the category, the $50,000 to $74,999 income range is the most frequent in Mooresville, accounting for 19.7% of all households. In contrast, only 167 households (4.4%) fall into the less than $10,000 income bracket, making it the least populous group.
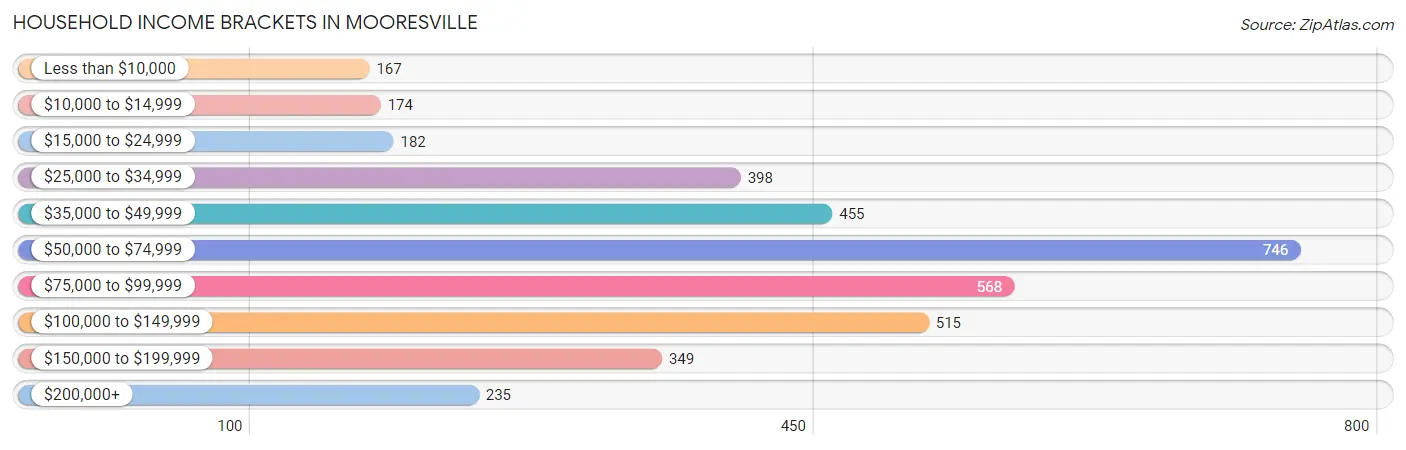
| Income Bracket | # Households | % Households |
| Less than $10,000 | 167 | 4.4% |
| $10,000 to $14,999 | 174 | 4.6% |
| $15,000 to $24,999 | 182 | 4.8% |
| $25,000 to $34,999 | 398 | 10.5% |
| $35,000 to $49,999 | 455 | 12.0% |
| $50,000 to $74,999 | 746 | 19.7% |
| $75,000 to $99,999 | 568 | 15.0% |
| $100,000 to $149,999 | 515 | 13.6% |
| $150,000 to $199,999 | 349 | 9.2% |
| $200,000+ | 235 | 6.2% |
Household Income by Householder Age in Mooresville
The median household income in Mooresville is $68,089, with the highest median household income of $87,100 found in the 45 to 64 years age bracket for the primary householder. A total of 1,478 households (39.0%) fall into this category. Meanwhile, the 15 to 24 years age bracket for the primary householder has the lowest median household income of $37,330, with 155 households (4.1%) in this group.
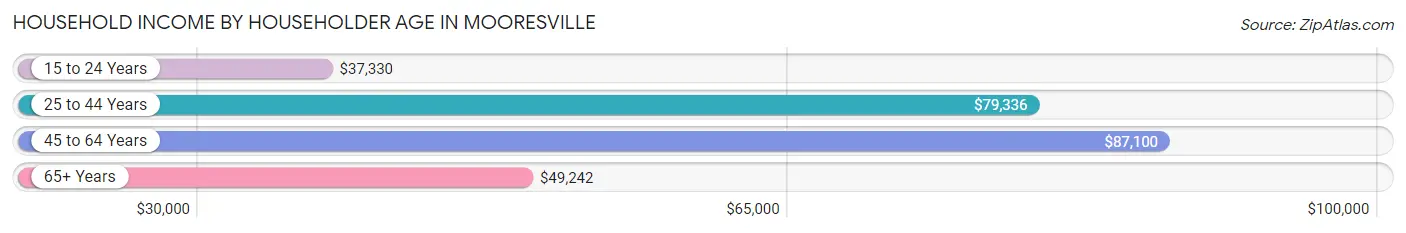
| Income Bracket | # Households | Median Income |
| 15 to 24 Years | 155 (4.1%) | $37,330 |
| 25 to 44 Years | 1,060 (28.0%) | $79,336 |
| 45 to 64 Years | 1,478 (39.0%) | $87,100 |
| 65+ Years | 1,096 (28.9%) | $49,242 |
| Total | 3,789 (100.0%) | $68,089 |
Poverty in Mooresville
Income Below Poverty by Sex and Age in Mooresville
With 12.6% poverty level for males and 11.9% for females among the residents of Mooresville, 15 year old males and 16 and 17 year old females are the most vulnerable to poverty, with 72 males (78.3%) and 43 females (42.6%) in their respective age groups living below the poverty level.
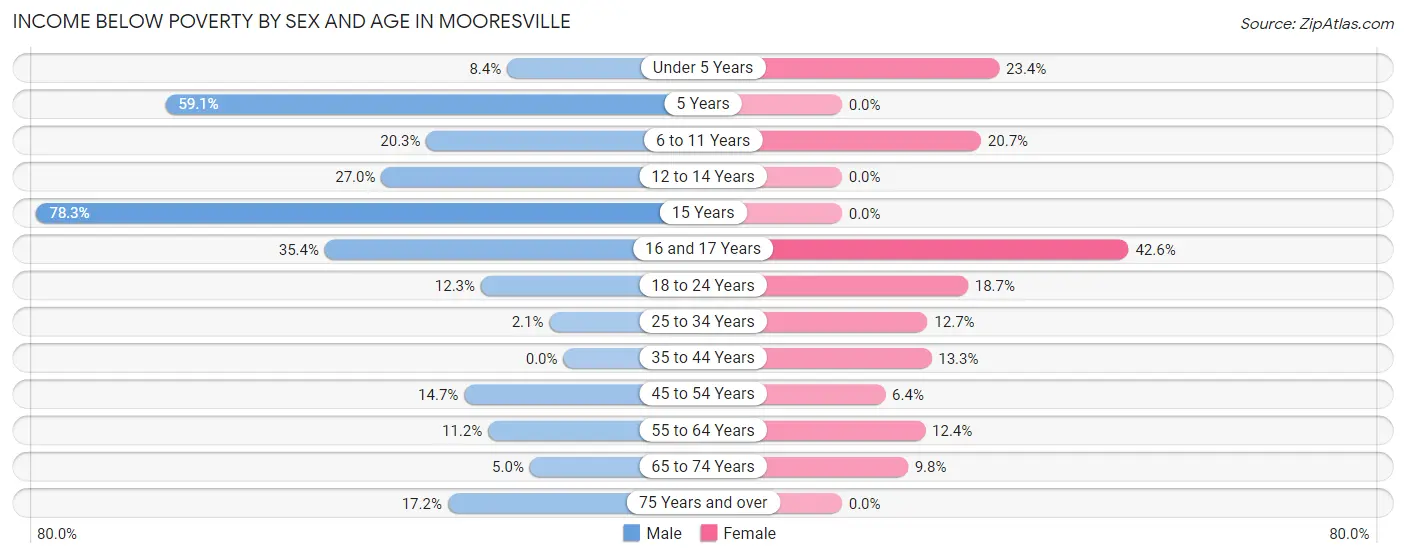
| Age Bracket | Male | Female |
| Under 5 Years | 29 (8.4%) | 32 (23.4%) |
| 5 Years | 26 (59.1%) | 0 (0.0%) |
| 6 to 11 Years | 60 (20.3%) | 56 (20.7%) |
| 12 to 14 Years | 60 (27.0%) | 0 (0.0%) |
| 15 Years | 72 (78.3%) | 0 (0.0%) |
| 16 and 17 Years | 34 (35.4%) | 43 (42.6%) |
| 18 to 24 Years | 56 (12.2%) | 81 (18.7%) |
| 25 to 34 Years | 15 (2.1%) | 74 (12.7%) |
| 35 to 44 Years | 0 (0.0%) | 57 (13.3%) |
| 45 to 54 Years | 81 (14.7%) | 42 (6.4%) |
| 55 to 64 Years | 87 (11.2%) | 83 (12.4%) |
| 65 to 74 Years | 18 (5.0%) | 56 (9.8%) |
| 75 Years and over | 51 (17.2%) | 0 (0.0%) |
| Total | 589 (12.6%) | 524 (11.9%) |
Income Above Poverty by Sex and Age in Mooresville
According to the poverty statistics in Mooresville, males aged 35 to 44 years and females aged 5 years are the age groups that are most secure financially, with 100.0% of males and 100.0% of females in these age groups living above the poverty line.
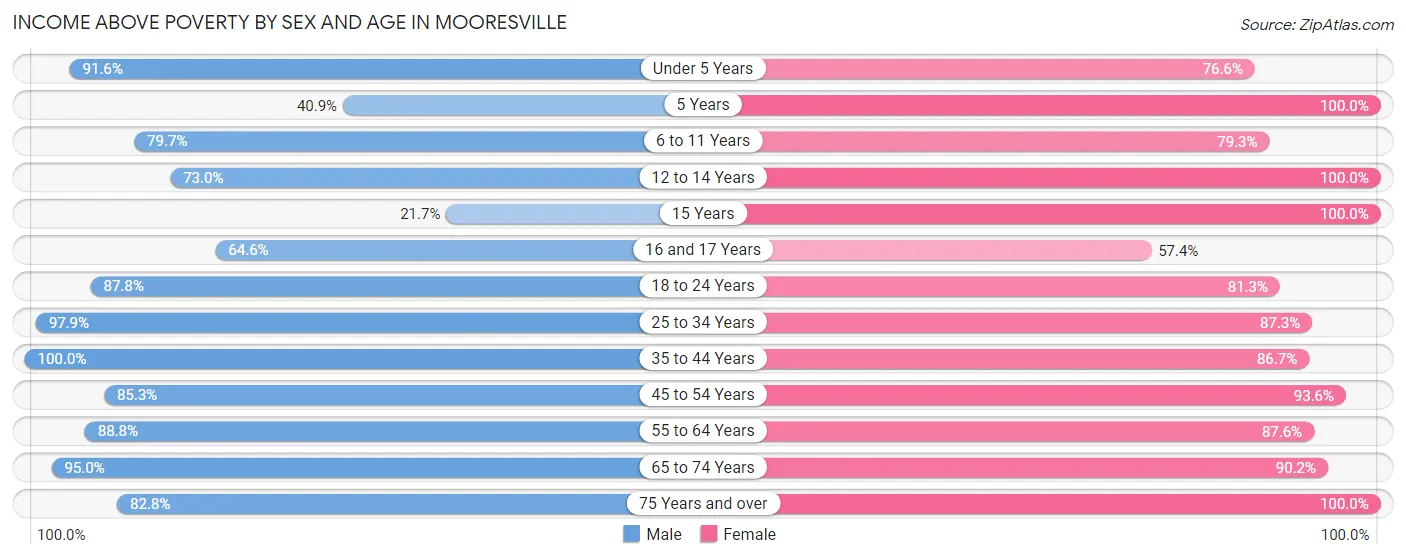
| Age Bracket | Male | Female |
| Under 5 Years | 318 (91.6%) | 105 (76.6%) |
| 5 Years | 18 (40.9%) | 53 (100.0%) |
| 6 to 11 Years | 235 (79.7%) | 215 (79.3%) |
| 12 to 14 Years | 162 (73.0%) | 77 (100.0%) |
| 15 Years | 20 (21.7%) | 25 (100.0%) |
| 16 and 17 Years | 62 (64.6%) | 58 (57.4%) |
| 18 to 24 Years | 401 (87.7%) | 352 (81.3%) |
| 25 to 34 Years | 701 (97.9%) | 508 (87.3%) |
| 35 to 44 Years | 407 (100.0%) | 372 (86.7%) |
| 45 to 54 Years | 469 (85.3%) | 610 (93.6%) |
| 55 to 64 Years | 691 (88.8%) | 588 (87.6%) |
| 65 to 74 Years | 343 (95.0%) | 516 (90.2%) |
| 75 Years and over | 246 (82.8%) | 405 (100.0%) |
| Total | 4,073 (87.4%) | 3,884 (88.1%) |
Income Below Poverty Among Married-Couple Families in Mooresville
The poverty statistics for married-couple families in Mooresville show that 1.4% or 25 of the total 1,811 families live below the poverty line. Families with no children have the highest poverty rate of 2.1%, comprising of 25 families. On the other hand, families with 1 or 2 children have the lowest poverty rate of 0.0%, which includes 0 families.
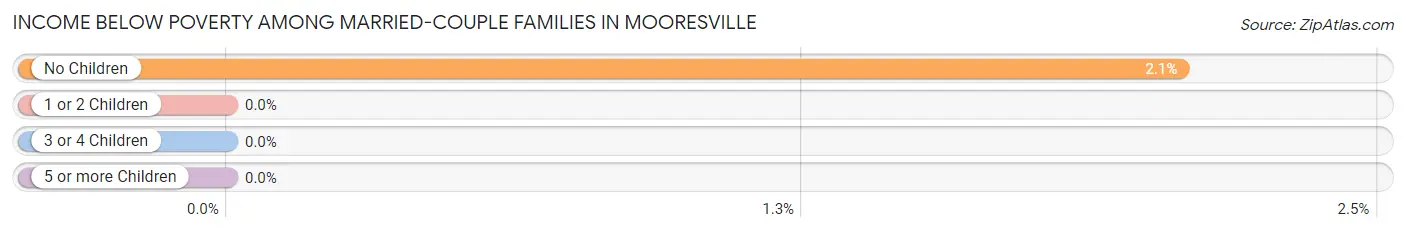
| Children | Above Poverty | Below Poverty |
| No Children | 1,183 (97.9%) | 25 (2.1%) |
| 1 or 2 Children | 579 (100.0%) | 0 (0.0%) |
| 3 or 4 Children | 24 (100.0%) | 0 (0.0%) |
| 5 or more Children | 0 (0.0%) | 0 (0.0%) |
| Total | 1,786 (98.6%) | 25 (1.4%) |
Income Below Poverty Among Single-Parent Households in Mooresville
According to the poverty data in Mooresville, 23.5% or 20 single-father households and 33.5% or 224 single-mother households are living below the poverty line. Among single-father households, those with 1 or 2 children have the highest poverty rate, with 8 households (29.6%) experiencing poverty. Likewise, among single-mother households, those with 5 or more children have the highest poverty rate, with 21 households (100.0%) falling below the poverty line.
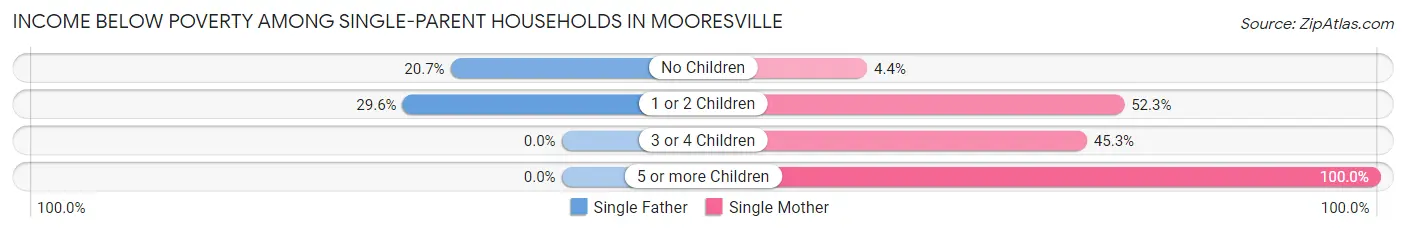
| Children | Single Father | Single Mother |
| No Children | 12 (20.7%) | 12 (4.4%) |
| 1 or 2 Children | 8 (29.6%) | 162 (52.3%) |
| 3 or 4 Children | 0 (0.0%) | 29 (45.3%) |
| 5 or more Children | 0 (0.0%) | 21 (100.0%) |
| Total | 20 (23.5%) | 224 (33.5%) |
Income Below Poverty Among Married-Couple vs Single-Parent Households in Mooresville
The poverty data for Mooresville shows that 25 of the married-couple family households (1.4%) and 244 of the single-parent households (32.4%) are living below the poverty level. Within the married-couple family households, those with no children have the highest poverty rate, with 25 households (2.1%) falling below the poverty line. Among the single-parent households, those with 5 or more children have the highest poverty rate, with 21 household (100.0%) living below poverty.
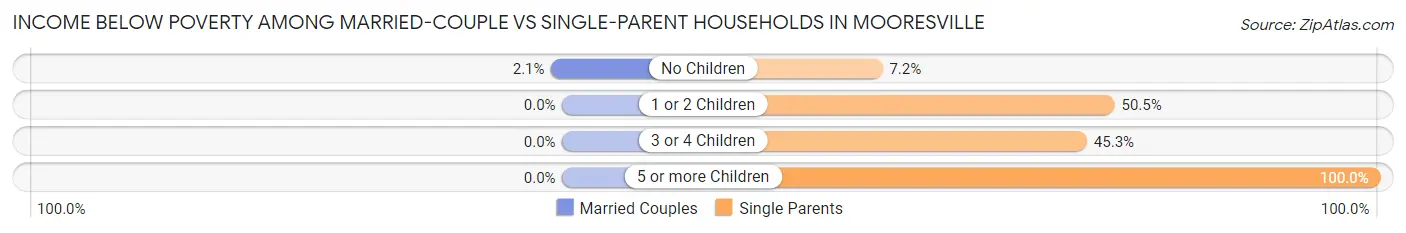
| Children | Married-Couple Families | Single-Parent Households |
| No Children | 25 (2.1%) | 24 (7.2%) |
| 1 or 2 Children | 0 (0.0%) | 170 (50.4%) |
| 3 or 4 Children | 0 (0.0%) | 29 (45.3%) |
| 5 or more Children | 0 (0.0%) | 21 (100.0%) |
| Total | 25 (1.4%) | 244 (32.4%) |
Race in Mooresville
The most populous races in Mooresville are White / Caucasian (9,121 | 95.8%), Two or more Races (244 | 2.6%), and Hispanic or Latino (164 | 1.7%).
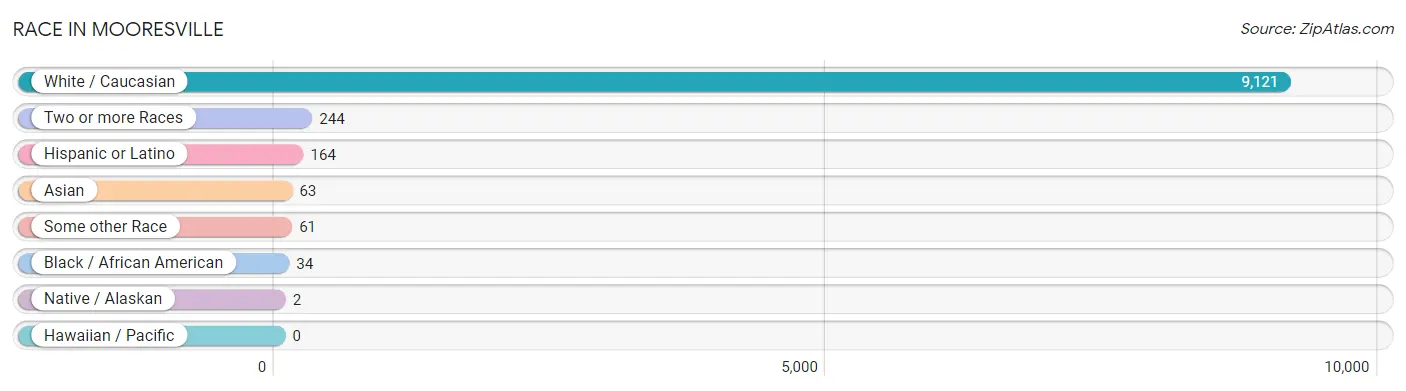
| Race | # Population | % Population |
| Asian | 63 | 0.7% |
| Black / African American | 34 | 0.4% |
| Hawaiian / Pacific | 0 | 0.0% |
| Hispanic or Latino | 164 | 1.7% |
| Native / Alaskan | 2 | 0.0% |
| White / Caucasian | 9,121 | 95.8% |
| Two or more Races | 244 | 2.6% |
| Some other Race | 61 | 0.6% |
| Total | 9,525 | 100.0% |
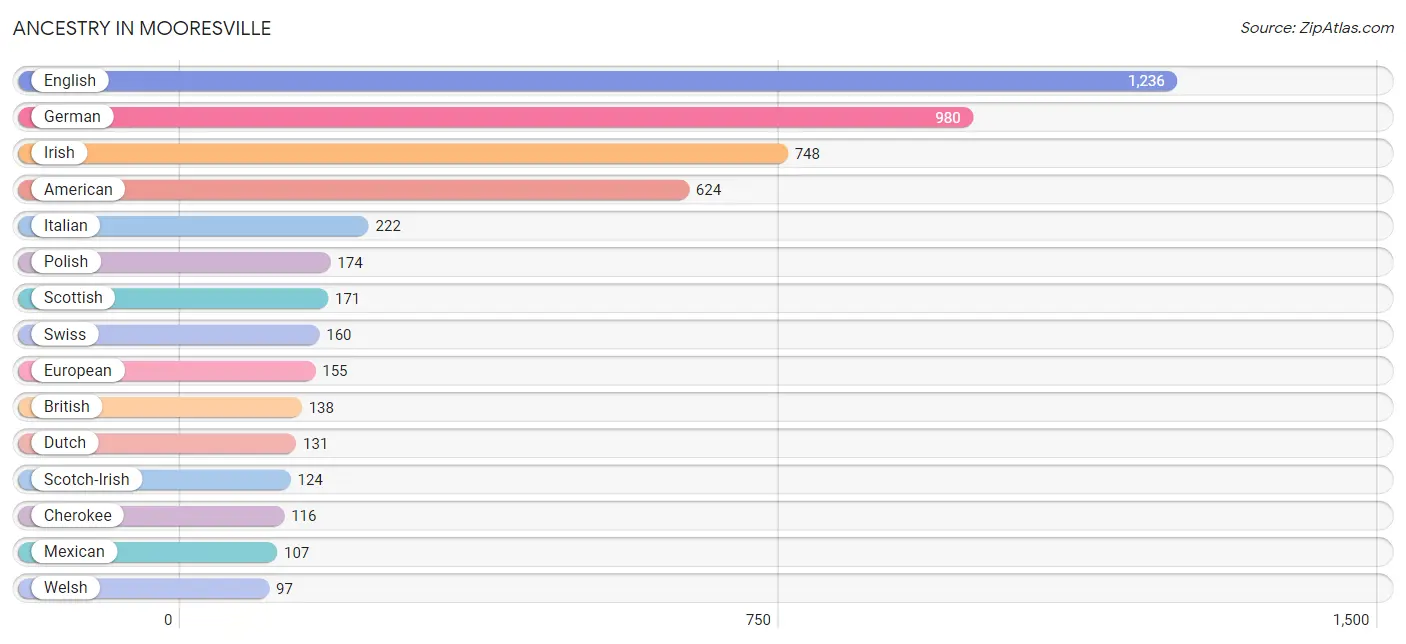
Ancestry in Mooresville
The most populous ancestries reported in Mooresville are English (1,236 | 13.0%), German (980 | 10.3%), Irish (748 | 7.9%), American (624 | 6.6%), and Italian (222 | 2.3%), together accounting for 40.0% of all Mooresville residents.
| Ancestry | # Population | % Population |
| American | 624 | 6.6% |
| Bhutanese | 46 | 0.5% |
| Blackfeet | 12 | 0.1% |
| British | 138 | 1.5% |
| Burmese | 52 | 0.5% |
| Cherokee | 116 | 1.2% |
| Creek | 10 | 0.1% |
| Cuban | 47 | 0.5% |
| Dutch | 131 | 1.4% |
| Dutch West Indian | 9 | 0.1% |
| English | 1,236 | 13.0% |
| European | 155 | 1.6% |
| French | 57 | 0.6% |
| German | 980 | 10.3% |
| Greek | 9 | 0.1% |
| Hungarian | 8 | 0.1% |
| Indian (Asian) | 23 | 0.2% |
| Irish | 748 | 7.9% |
| Italian | 222 | 2.3% |
| Korean | 14 | 0.2% |
| Mexican | 107 | 1.1% |
| Nigerian | 16 | 0.2% |
| Northern European | 21 | 0.2% |
| Norwegian | 10 | 0.1% |
| Polish | 174 | 1.8% |
| Puerto Rican | 10 | 0.1% |
| Russian | 20 | 0.2% |
| Scandinavian | 28 | 0.3% |
| Scotch-Irish | 124 | 1.3% |
| Scottish | 171 | 1.8% |
| Sioux | 26 | 0.3% |
| Subsaharan African | 16 | 0.2% |
| Swedish | 90 | 0.9% |
| Swiss | 160 | 1.7% |
| Welsh | 97 | 1.0% | View All 35 Rows |
Immigrants in Mooresville
The most numerous immigrant groups reported in Mooresville came from Central America (61 | 0.6%), Latin America (61 | 0.6%), Asia (57 | 0.6%), Eastern Asia (57 | 0.6%), and Mexico (37 | 0.4%), together accounting for 2.9% of all Mooresville residents.
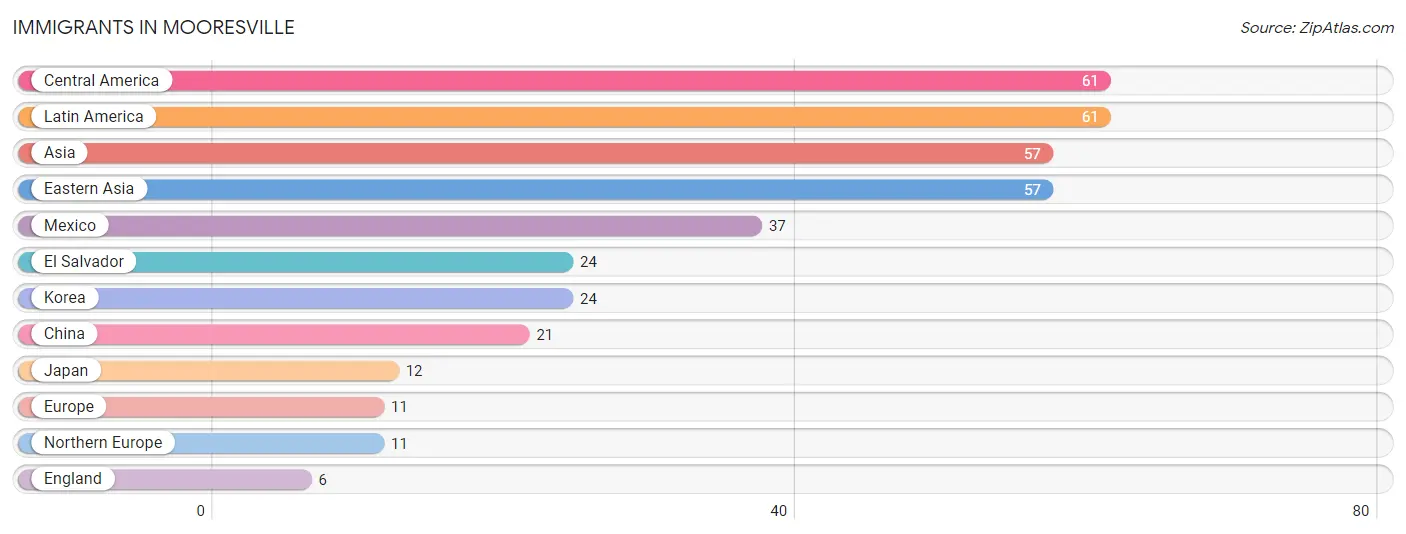
| Immigration Origin | # Population | % Population |
| Asia | 57 | 0.6% |
| Central America | 61 | 0.6% |
| China | 21 | 0.2% |
| Eastern Asia | 57 | 0.6% |
| El Salvador | 24 | 0.3% |
| England | 6 | 0.1% |
| Europe | 11 | 0.1% |
| Japan | 12 | 0.1% |
| Korea | 24 | 0.3% |
| Latin America | 61 | 0.6% |
| Mexico | 37 | 0.4% |
| Northern Europe | 11 | 0.1% | View All 12 Rows |
Sex and Age in Mooresville
Sex and Age in Mooresville
The most populous age groups in Mooresville are 55 to 59 Years (460 | 9.5%) for men and 20 to 24 Years (377 | 8.0%) for women.
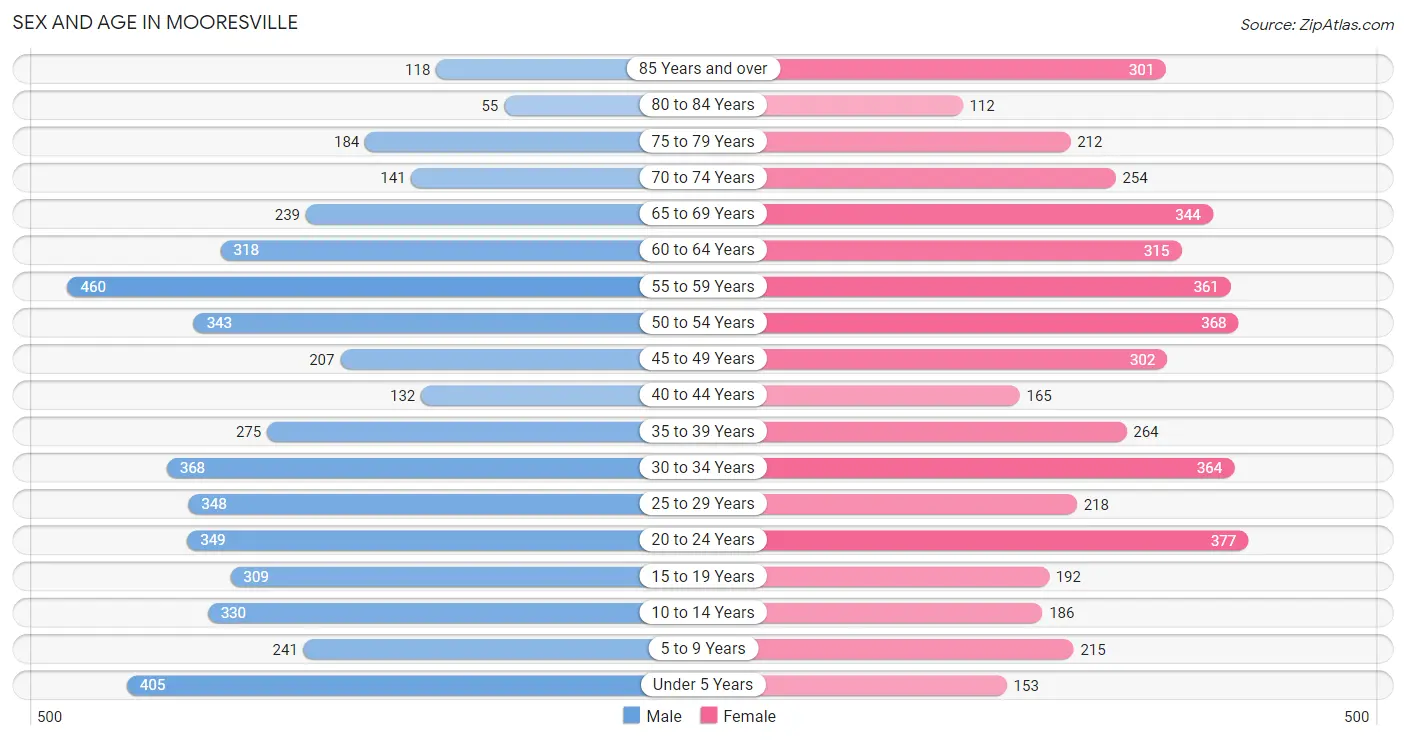
| Age Bracket | Male | Female |
| Under 5 Years | 405 (8.4%) | 153 (3.3%) |
| 5 to 9 Years | 241 (5.0%) | 215 (4.6%) |
| 10 to 14 Years | 330 (6.8%) | 186 (4.0%) |
| 15 to 19 Years | 309 (6.4%) | 192 (4.1%) |
| 20 to 24 Years | 349 (7.2%) | 377 (8.0%) |
| 25 to 29 Years | 348 (7.2%) | 218 (4.6%) |
| 30 to 34 Years | 368 (7.6%) | 364 (7.7%) |
| 35 to 39 Years | 275 (5.7%) | 264 (5.6%) |
| 40 to 44 Years | 132 (2.7%) | 165 (3.5%) |
| 45 to 49 Years | 207 (4.3%) | 302 (6.4%) |
| 50 to 54 Years | 343 (7.1%) | 368 (7.8%) |
| 55 to 59 Years | 460 (9.5%) | 361 (7.7%) |
| 60 to 64 Years | 318 (6.6%) | 315 (6.7%) |
| 65 to 69 Years | 239 (5.0%) | 344 (7.3%) |
| 70 to 74 Years | 141 (2.9%) | 254 (5.4%) |
| 75 to 79 Years | 184 (3.8%) | 212 (4.5%) |
| 80 to 84 Years | 55 (1.1%) | 112 (2.4%) |
| 85 Years and over | 118 (2.5%) | 301 (6.4%) |
| Total | 4,822 (100.0%) | 4,703 (100.0%) |
Families and Households in Mooresville
Median Family Size in Mooresville
The median family size in Mooresville is 2.92 persons per family, with married-couple families (1,811 | 70.6%) accounting for the largest median family size of 2.97 persons per family. On the other hand, single male/father families (85 | 3.3%) represent the smallest median family size with 2.47 persons per family.
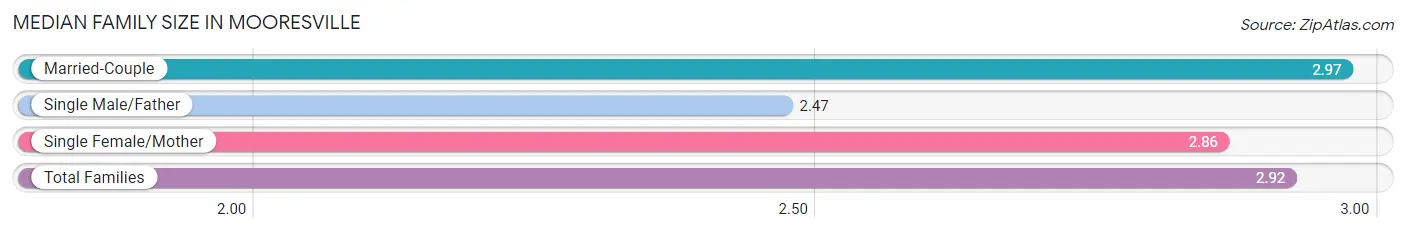
| Family Type | # Families | Family Size |
| Married-Couple | 1,811 (70.6%) | 2.97 |
| Single Male/Father | 85 (3.3%) | 2.47 |
| Single Female/Mother | 669 (26.1%) | 2.86 |
| Total Families | 2,565 (100.0%) | 2.92 |
Median Household Size in Mooresville
The median household size in Mooresville is 2.42 persons per household, with single female/mother households (669 | 17.7%) accounting for the largest median household size of 3.08 persons per household. non-family households (1,224 | 32.3%) represent the smallest median household size with 1.15 persons per household.
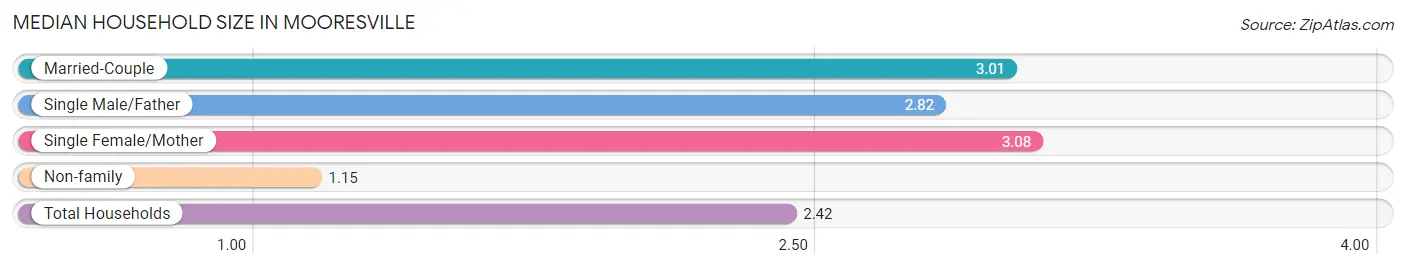
| Household Type | # Households | Household Size |
| Married-Couple | 1,811 (47.8%) | 3.01 |
| Single Male/Father | 85 (2.2%) | 2.82 |
| Single Female/Mother | 669 (17.7%) | 3.08 |
| Non-family | 1,224 (32.3%) | 1.15 |
| Total Households | 3,789 (100.0%) | 2.42 |
Household Size by Marriage Status in Mooresville
Out of a total of 3,789 households in Mooresville, 2,565 (67.7%) are family households, while 1,224 (32.3%) are nonfamily households. The most numerous type of family households are 2-person households, comprising 1,235, and the most common type of nonfamily households are 1-person households, comprising 1,086.
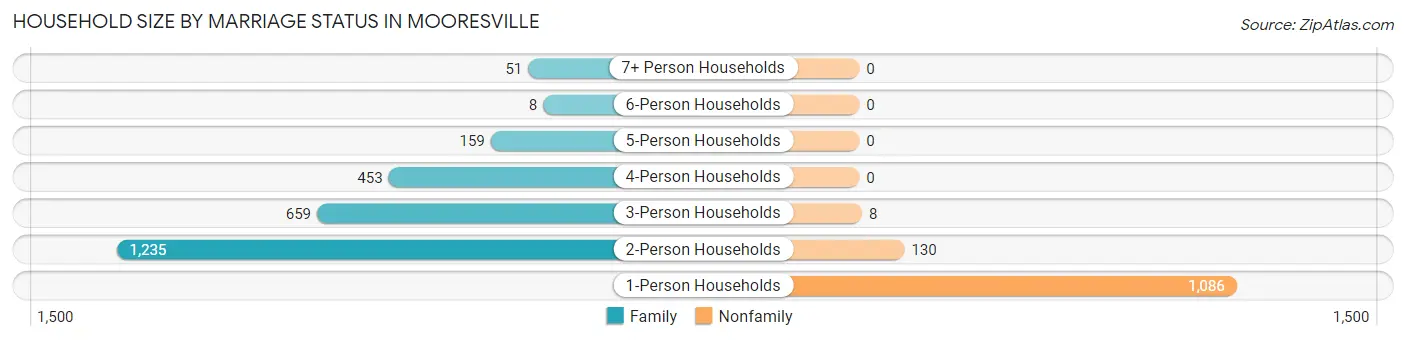
| Household Size | Family Households | Nonfamily Households |
| 1-Person Households | - | 1,086 (28.7%) |
| 2-Person Households | 1,235 (32.6%) | 130 (3.4%) |
| 3-Person Households | 659 (17.4%) | 8 (0.2%) |
| 4-Person Households | 453 (12.0%) | 0 (0.0%) |
| 5-Person Households | 159 (4.2%) | 0 (0.0%) |
| 6-Person Households | 8 (0.2%) | 0 (0.0%) |
| 7+ Person Households | 51 (1.3%) | 0 (0.0%) |
| Total | 2,565 (67.7%) | 1,224 (32.3%) |
Female Fertility in Mooresville
Fertility by Age in Mooresville
Average fertility rate in Mooresville is 37.0 births per 1,000 women. Women in the age bracket of 20 to 34 years have the highest fertility rate with 71.0 births per 1,000 women. Women in the age bracket of 20 to 34 years acount for 95.8% of all women with births.
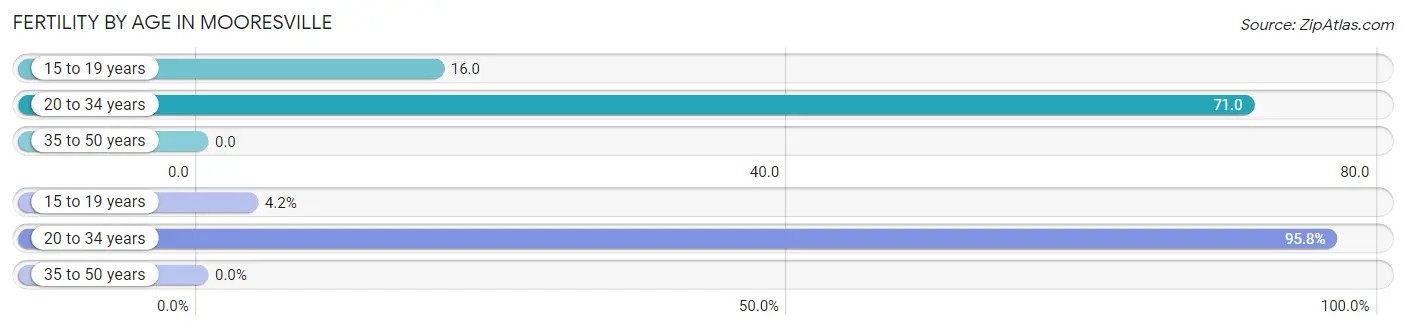
| Age Bracket | Women with Births | Births / 1,000 Women |
| 15 to 19 years | 3 (4.2%) | 16.0 |
| 20 to 34 years | 68 (95.8%) | 71.0 |
| 35 to 50 years | 0 (0.0%) | 0.0 |
| Total | 71 (100.0%) | 37.0 |
Fertility by Age by Marriage Status in Mooresville
21.1% of women with births (71) in Mooresville are married. The highest percentage of unmarried women with births falls into 15 to 19 years age bracket with 100.0% of them unmarried at the time of birth, while the lowest percentage of unmarried women with births belong to 20 to 34 years age bracket with 77.9% of them unmarried.
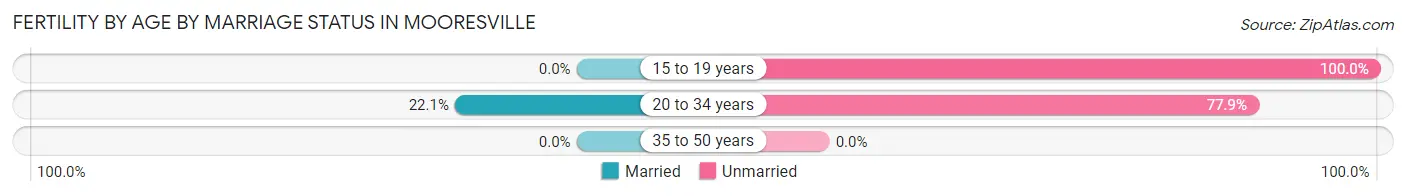
| Age Bracket | Married | Unmarried |
| 15 to 19 years | 0 (0.0%) | 3 (100.0%) |
| 20 to 34 years | 15 (22.1%) | 53 (77.9%) |
| 35 to 50 years | 0 (0.0%) | 0 (0.0%) |
| Total | 15 (21.1%) | 56 (78.9%) |
Fertility by Education in Mooresville
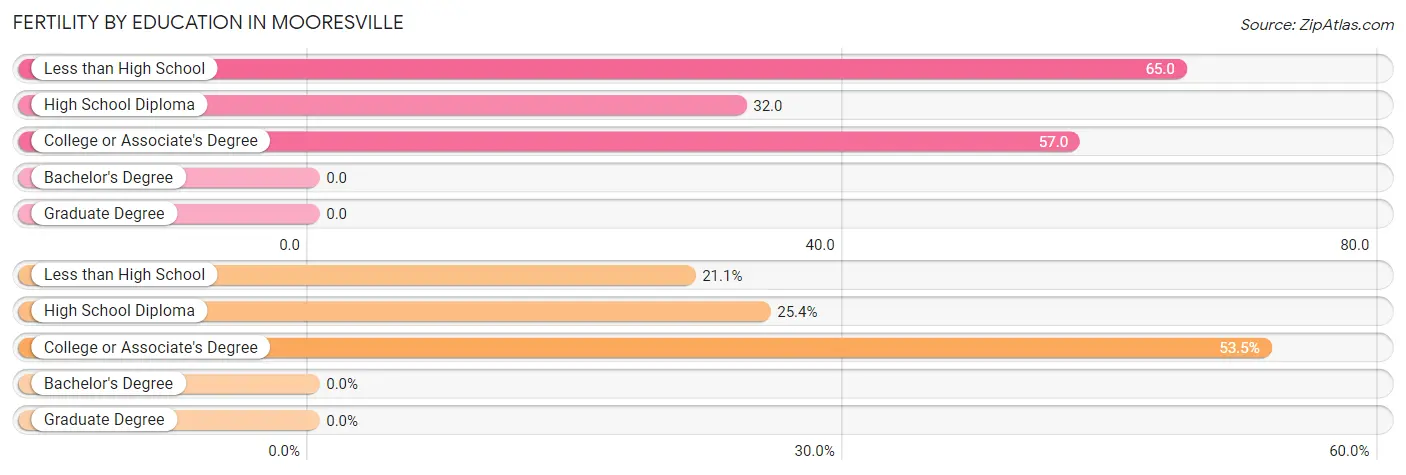
| Educational Attainment | Women with Births | Births / 1,000 Women |
| Less than High School | 15 (21.1%) | 65.0 |
| High School Diploma | 18 (25.4%) | 32.0 |
| College or Associate's Degree | 38 (53.5%) | 57.0 |
| Bachelor's Degree | 0 (0.0%) | 0.0 |
| Graduate Degree | 0 (0.0%) | 0.0 |
| Total | 71 (100.0%) | 37.0 |
Fertility by Education by Marriage Status in Mooresville
78.9% of women with births in Mooresville are unmarried. Women with the educational attainment of college or associate's degree are most likely to be married with 39.5% of them married at childbirth, while women with the educational attainment of less than high school are least likely to be married with 100.0% of them unmarried at childbirth.
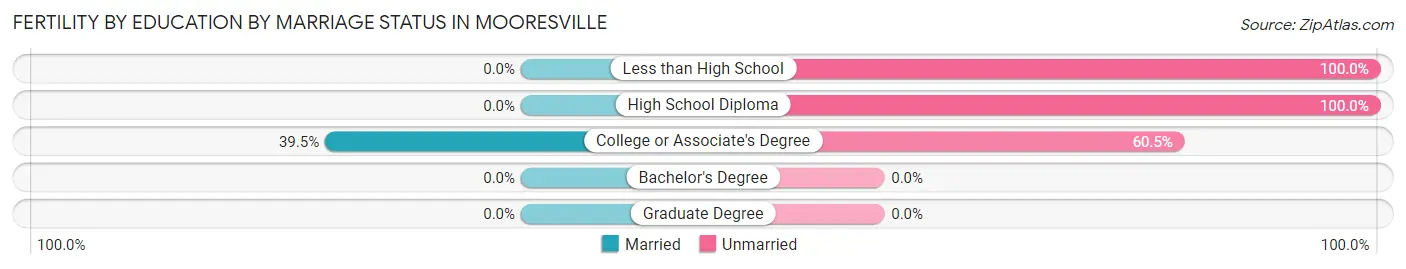
| Educational Attainment | Married | Unmarried |
| Less than High School | 0 (0.0%) | 15 (100.0%) |
| High School Diploma | 0 (0.0%) | 18 (100.0%) |
| College or Associate's Degree | 15 (39.5%) | 23 (60.5%) |
| Bachelor's Degree | 0 (0.0%) | 0 (0.0%) |
| Graduate Degree | 0 (0.0%) | 0 (0.0%) |
| Total | 15 (21.1%) | 56 (78.9%) |
Employment Characteristics in Mooresville
Employment by Class of Employer in Mooresville
Among the 4,678 employed individuals in Mooresville, private company employees (3,359 | 71.8%), not-for-profit organizations (680 | 14.5%), and local government employees (234 | 5.0%) make up the most common classes of employment.
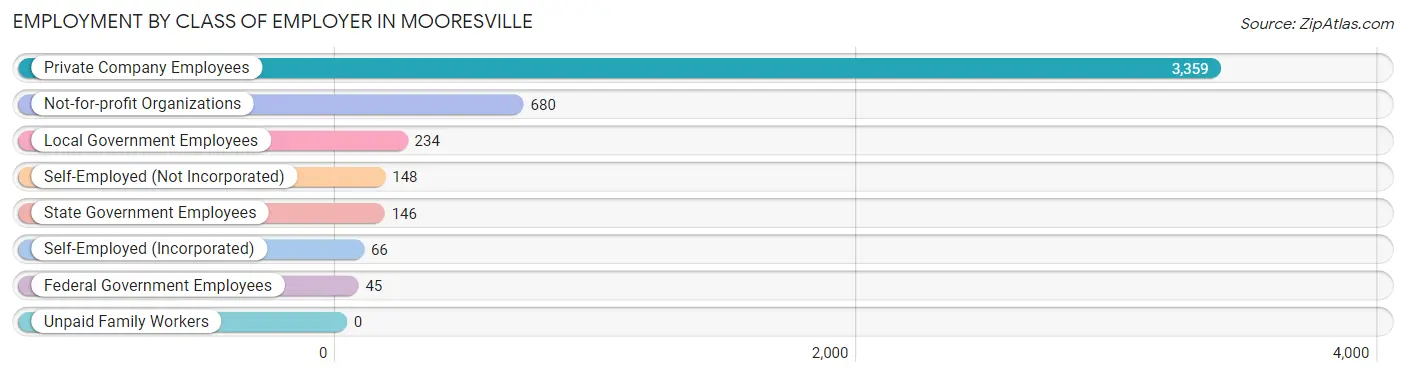
| Employer Class | # Employees | % Employees |
| Private Company Employees | 3,359 | 71.8% |
| Self-Employed (Incorporated) | 66 | 1.4% |
| Self-Employed (Not Incorporated) | 148 | 3.2% |
| Not-for-profit Organizations | 680 | 14.5% |
| Local Government Employees | 234 | 5.0% |
| State Government Employees | 146 | 3.1% |
| Federal Government Employees | 45 | 1.0% |
| Unpaid Family Workers | 0 | 0.0% |
| Total | 4,678 | 100.0% |
Employment Status by Age in Mooresville
According to the labor force statistics for Mooresville, out of the total population over 16 years of age (7,878), 60.8% or 4,790 individuals are in the labor force, with 1.7% or 81 of them unemployed. The age group with the highest labor force participation rate is 25 to 29 years, with 90.3% or 511 individuals in the labor force. Within the labor force, the 55 to 59 years age range has the highest percentage of unemployed individuals, with 5.0% or 29 of them being unemployed.
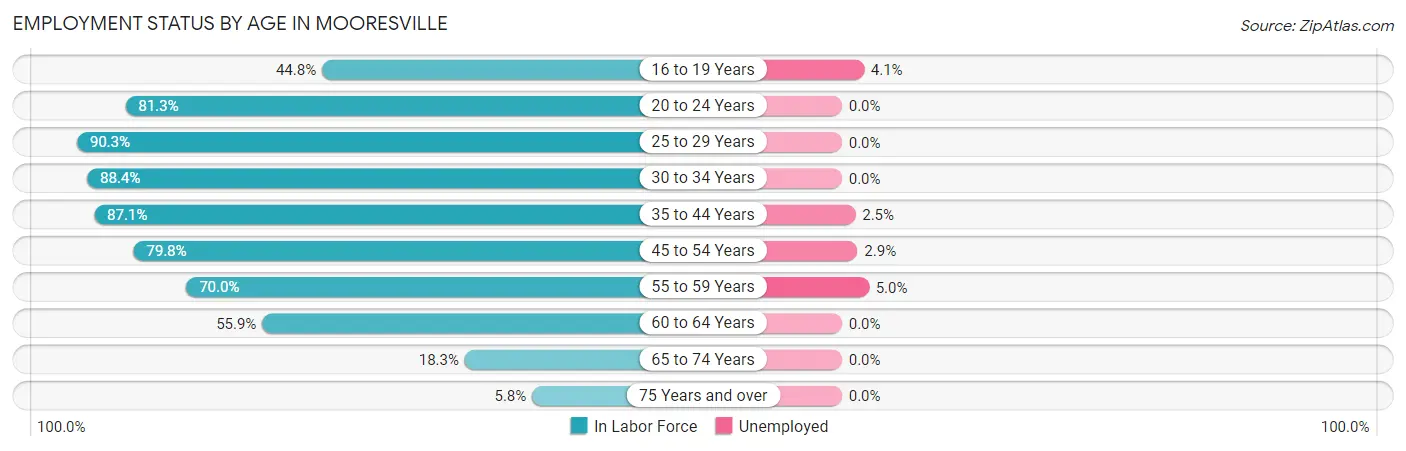
| Age Bracket | In Labor Force | Unemployed |
| 16 to 19 Years | 172 (44.8%) | 7 (4.1%) |
| 20 to 24 Years | 590 (81.3%) | 0 (0.0%) |
| 25 to 29 Years | 511 (90.3%) | 0 (0.0%) |
| 30 to 34 Years | 647 (88.4%) | 0 (0.0%) |
| 35 to 44 Years | 728 (87.1%) | 18 (2.5%) |
| 45 to 54 Years | 974 (79.8%) | 28 (2.9%) |
| 55 to 59 Years | 575 (70.0%) | 29 (5.0%) |
| 60 to 64 Years | 354 (55.9%) | 0 (0.0%) |
| 65 to 74 Years | 179 (18.3%) | 0 (0.0%) |
| 75 Years and over | 57 (5.8%) | 0 (0.0%) |
| Total | 4,790 (60.8%) | 81 (1.7%) |
Employment Status by Educational Attainment in Mooresville
According to labor force statistics for Mooresville, 78.8% of individuals (3,789) out of the total population between 25 and 64 years of age (4,808) are in the labor force, with 2.0% or 76 of them being unemployed. The group with the highest labor force participation rate are those with the educational attainment of bachelor's degree or higher, with 96.0% or 994 individuals in the labor force. Within the labor force, individuals with bachelor's degree or higher education have the highest percentage of unemployment, with 2.9% or 29 of them being unemployed.
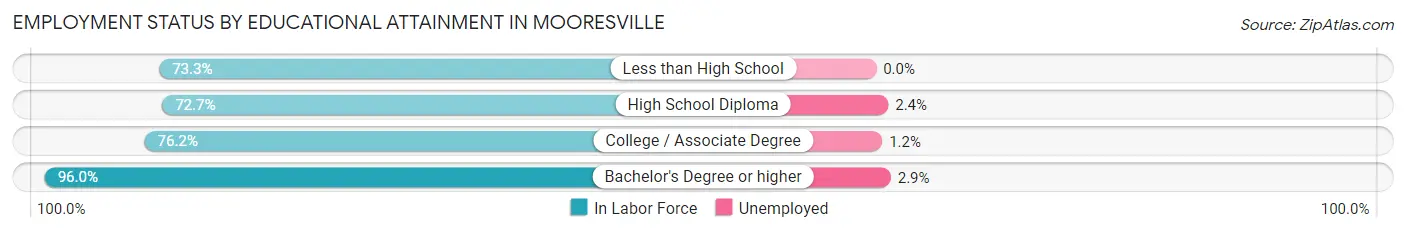
| Educational Attainment | In Labor Force | Unemployed |
| Less than High School | 337 (73.3%) | 0 (0.0%) |
| High School Diploma | 1,354 (72.7%) | 45 (2.4%) |
| College / Associate Degree | 1,106 (76.2%) | 17 (1.2%) |
| Bachelor's Degree or higher | 994 (96.0%) | 30 (2.9%) |
| Total | 3,789 (78.8%) | 96 (2.0%) |
Employment Occupations by Sex in Mooresville
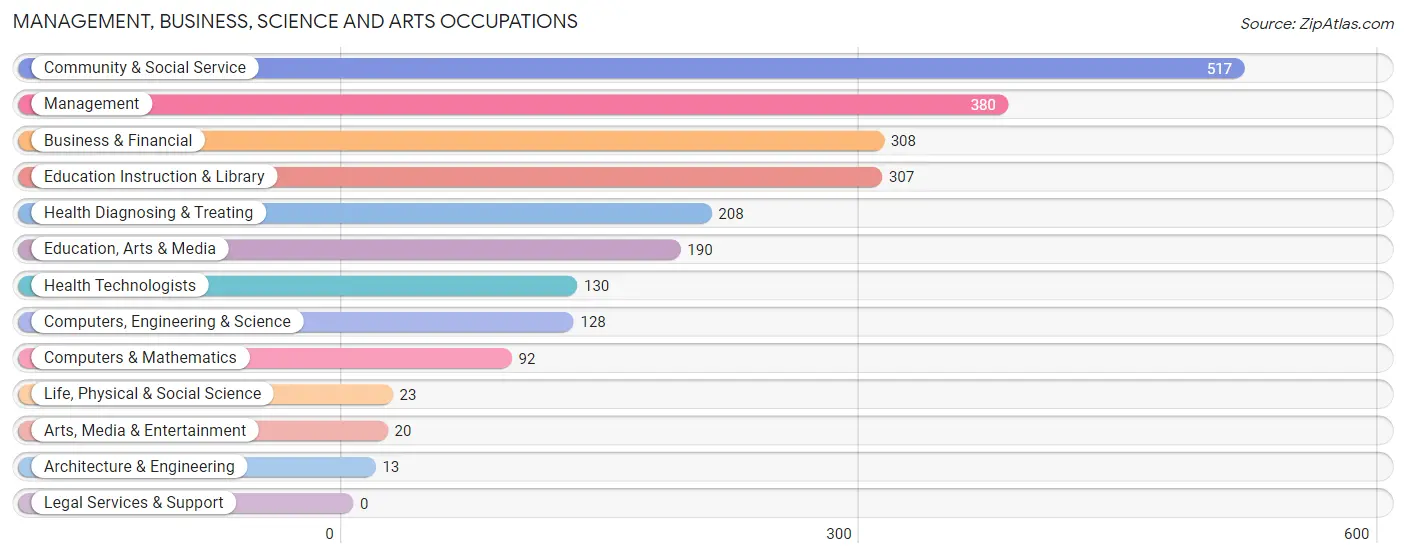
Management, Business, Science and Arts Occupations
The most common Management, Business, Science and Arts occupations in Mooresville are Community & Social Service (517 | 11.0%), Management (380 | 8.1%), Business & Financial (308 | 6.6%), Education Instruction & Library (307 | 6.5%), and Health Diagnosing & Treating (208 | 4.4%).
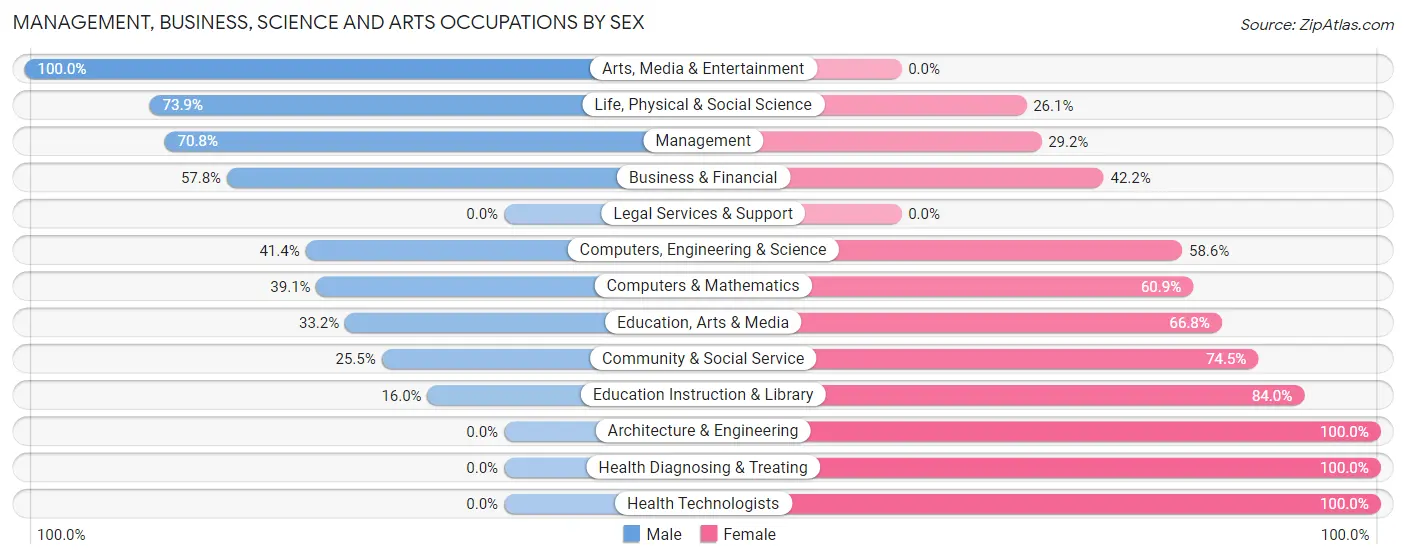
Management, Business, Science and Arts Occupations by Sex
Within the Management, Business, Science and Arts occupations in Mooresville, the most male-oriented occupations are Arts, Media & Entertainment (100.0%), Life, Physical & Social Science (73.9%), and Management (70.8%), while the most female-oriented occupations are Architecture & Engineering (100.0%), Health Diagnosing & Treating (100.0%), and Health Technologists (100.0%).
| Occupation | Male | Female |
| Management | 269 (70.8%) | 111 (29.2%) |
| Business & Financial | 178 (57.8%) | 130 (42.2%) |
| Computers, Engineering & Science | 53 (41.4%) | 75 (58.6%) |
| Computers & Mathematics | 36 (39.1%) | 56 (60.9%) |
| Architecture & Engineering | 0 (0.0%) | 13 (100.0%) |
| Life, Physical & Social Science | 17 (73.9%) | 6 (26.1%) |
| Community & Social Service | 132 (25.5%) | 385 (74.5%) |
| Education, Arts & Media | 63 (33.2%) | 127 (66.8%) |
| Legal Services & Support | 0 (0.0%) | 0 (0.0%) |
| Education Instruction & Library | 49 (16.0%) | 258 (84.0%) |
| Arts, Media & Entertainment | 20 (100.0%) | 0 (0.0%) |
| Health Diagnosing & Treating | 0 (0.0%) | 208 (100.0%) |
| Health Technologists | 0 (0.0%) | 130 (100.0%) |
| Total (Category) | 632 (41.0%) | 909 (59.0%) |
| Total (Overall) | 2,528 (53.7%) | 2,177 (46.3%) |
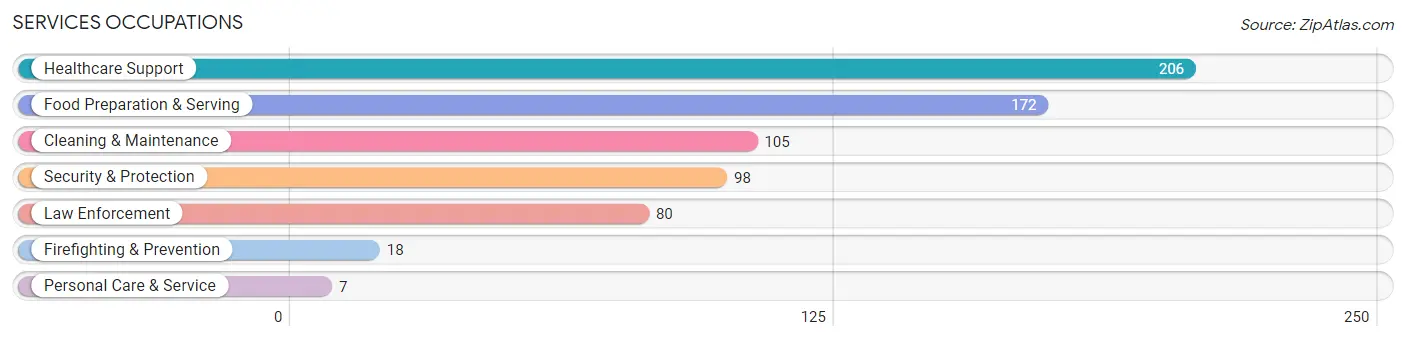
Services Occupations
The most common Services occupations in Mooresville are Healthcare Support (206 | 4.4%), Food Preparation & Serving (172 | 3.7%), Cleaning & Maintenance (105 | 2.2%), Security & Protection (98 | 2.1%), and Law Enforcement (80 | 1.7%).
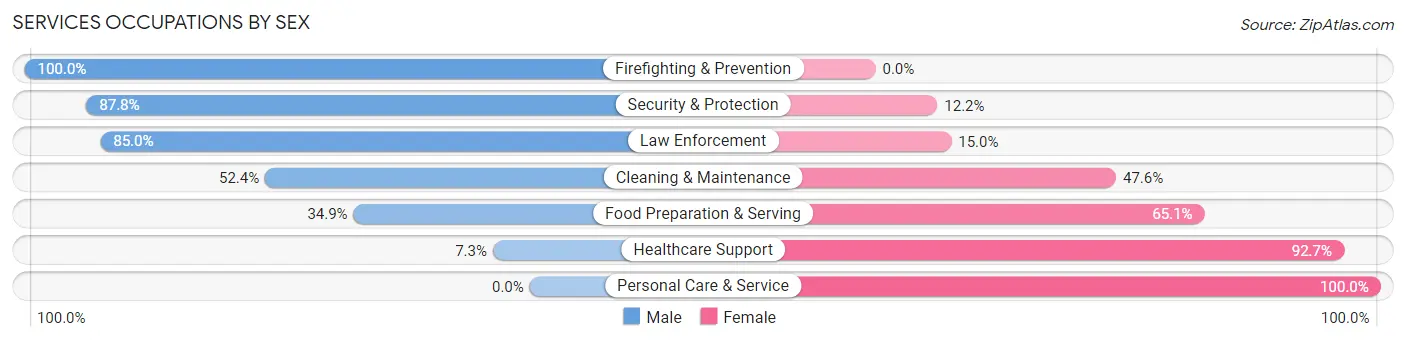
Services Occupations by Sex
Within the Services occupations in Mooresville, the most male-oriented occupations are Firefighting & Prevention (100.0%), Security & Protection (87.8%), and Law Enforcement (85.0%), while the most female-oriented occupations are Personal Care & Service (100.0%), Healthcare Support (92.7%), and Food Preparation & Serving (65.1%).
| Occupation | Male | Female |
| Healthcare Support | 15 (7.3%) | 191 (92.7%) |
| Security & Protection | 86 (87.8%) | 12 (12.2%) |
| Firefighting & Prevention | 18 (100.0%) | 0 (0.0%) |
| Law Enforcement | 68 (85.0%) | 12 (15.0%) |
| Food Preparation & Serving | 60 (34.9%) | 112 (65.1%) |
| Cleaning & Maintenance | 55 (52.4%) | 50 (47.6%) |
| Personal Care & Service | 0 (0.0%) | 7 (100.0%) |
| Total (Category) | 216 (36.7%) | 372 (63.3%) |
| Total (Overall) | 2,528 (53.7%) | 2,177 (46.3%) |
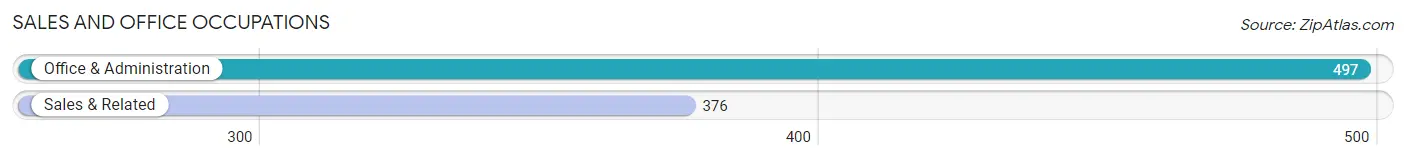
Sales and Office Occupations
The most common Sales and Office occupations in Mooresville are Office & Administration (497 | 10.6%), and Sales & Related (376 | 8.0%).
Sales and Office Occupations by Sex
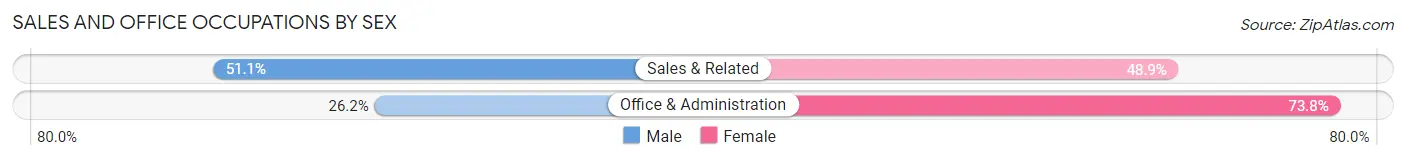
| Occupation | Male | Female |
| Sales & Related | 192 (51.1%) | 184 (48.9%) |
| Office & Administration | 130 (26.2%) | 367 (73.8%) |
| Total (Category) | 322 (36.9%) | 551 (63.1%) |
| Total (Overall) | 2,528 (53.7%) | 2,177 (46.3%) |
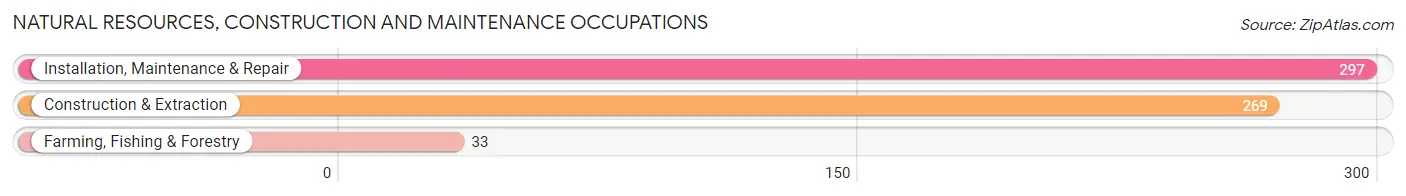
Natural Resources, Construction and Maintenance Occupations
The most common Natural Resources, Construction and Maintenance occupations in Mooresville are Installation, Maintenance & Repair (297 | 6.3%), Construction & Extraction (269 | 5.7%), and Farming, Fishing & Forestry (33 | 0.7%).
Natural Resources, Construction and Maintenance Occupations by Sex
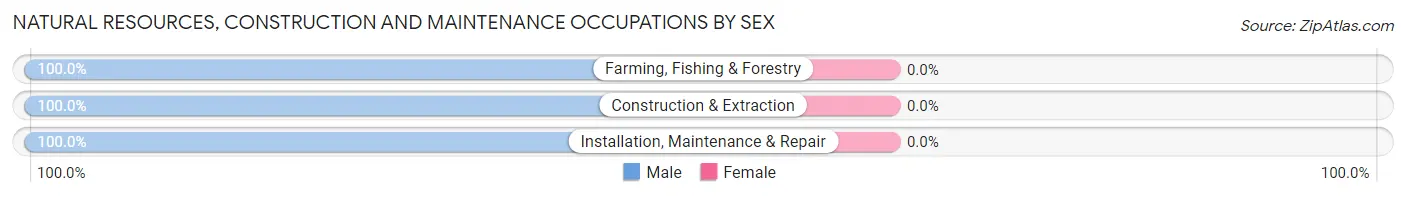
| Occupation | Male | Female |
| Farming, Fishing & Forestry | 33 (100.0%) | 0 (0.0%) |
| Construction & Extraction | 269 (100.0%) | 0 (0.0%) |
| Installation, Maintenance & Repair | 297 (100.0%) | 0 (0.0%) |
| Total (Category) | 599 (100.0%) | 0 (0.0%) |
| Total (Overall) | 2,528 (53.7%) | 2,177 (46.3%) |
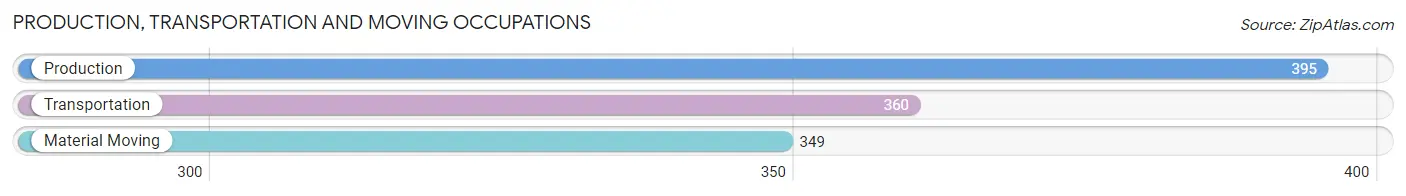
Production, Transportation and Moving Occupations
The most common Production, Transportation and Moving occupations in Mooresville are Production (395 | 8.4%), Transportation (360 | 7.6%), and Material Moving (349 | 7.4%).
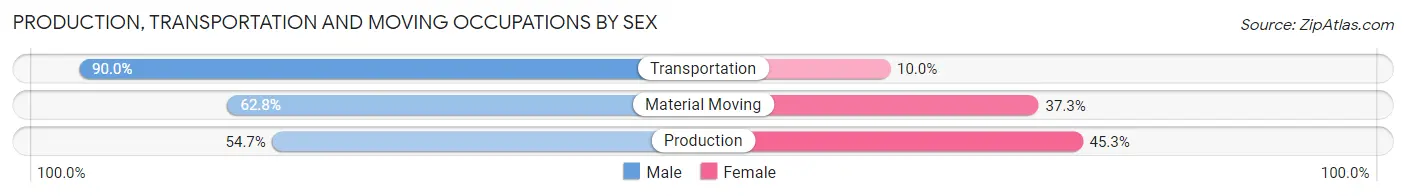
Production, Transportation and Moving Occupations by Sex
| Occupation | Male | Female |
| Production | 216 (54.7%) | 179 (45.3%) |
| Transportation | 324 (90.0%) | 36 (10.0%) |
| Material Moving | 219 (62.7%) | 130 (37.2%) |
| Total (Category) | 759 (68.8%) | 345 (31.2%) |
| Total (Overall) | 2,528 (53.7%) | 2,177 (46.3%) |
Employment Industries by Sex in Mooresville
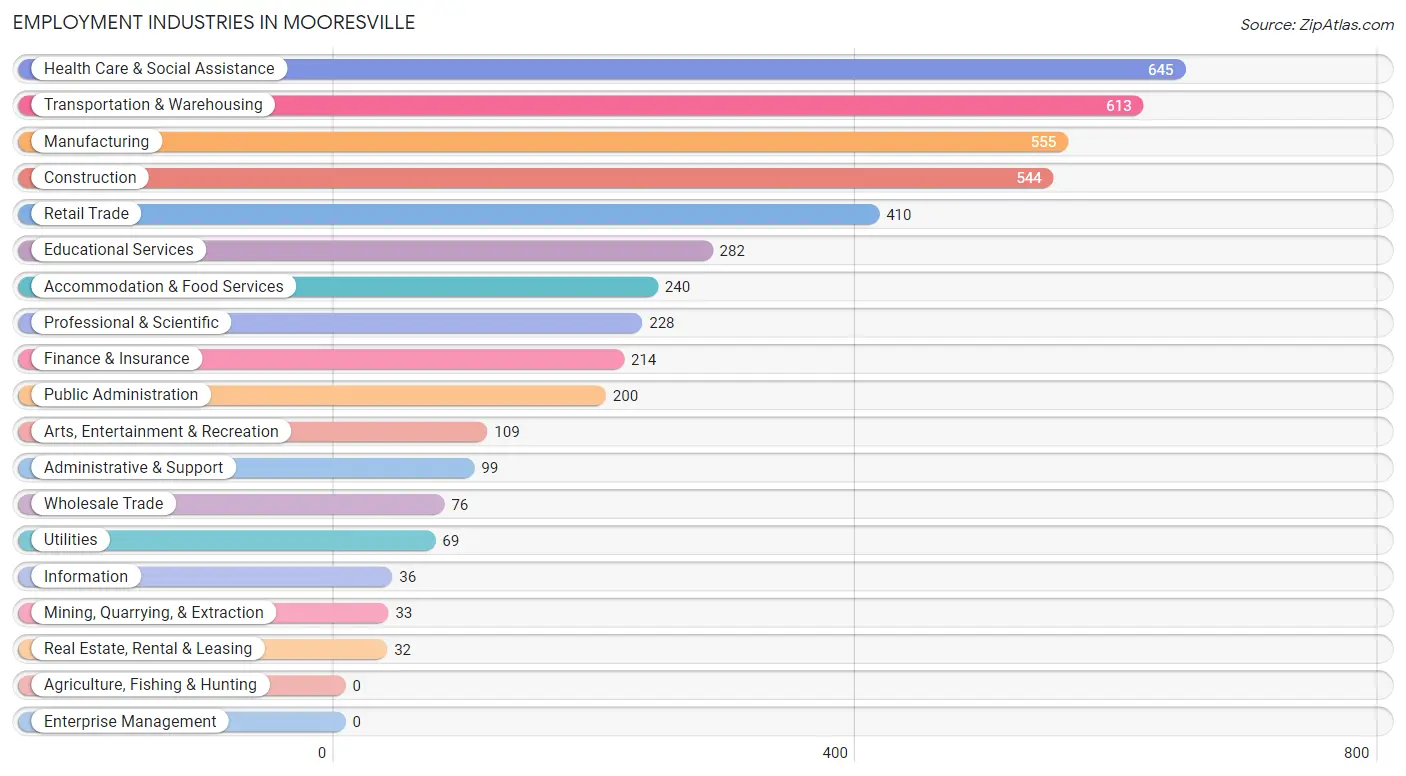
Employment Industries in Mooresville
The major employment industries in Mooresville include Health Care & Social Assistance (645 | 13.7%), Transportation & Warehousing (613 | 13.0%), Manufacturing (555 | 11.8%), Construction (544 | 11.6%), and Retail Trade (410 | 8.7%).
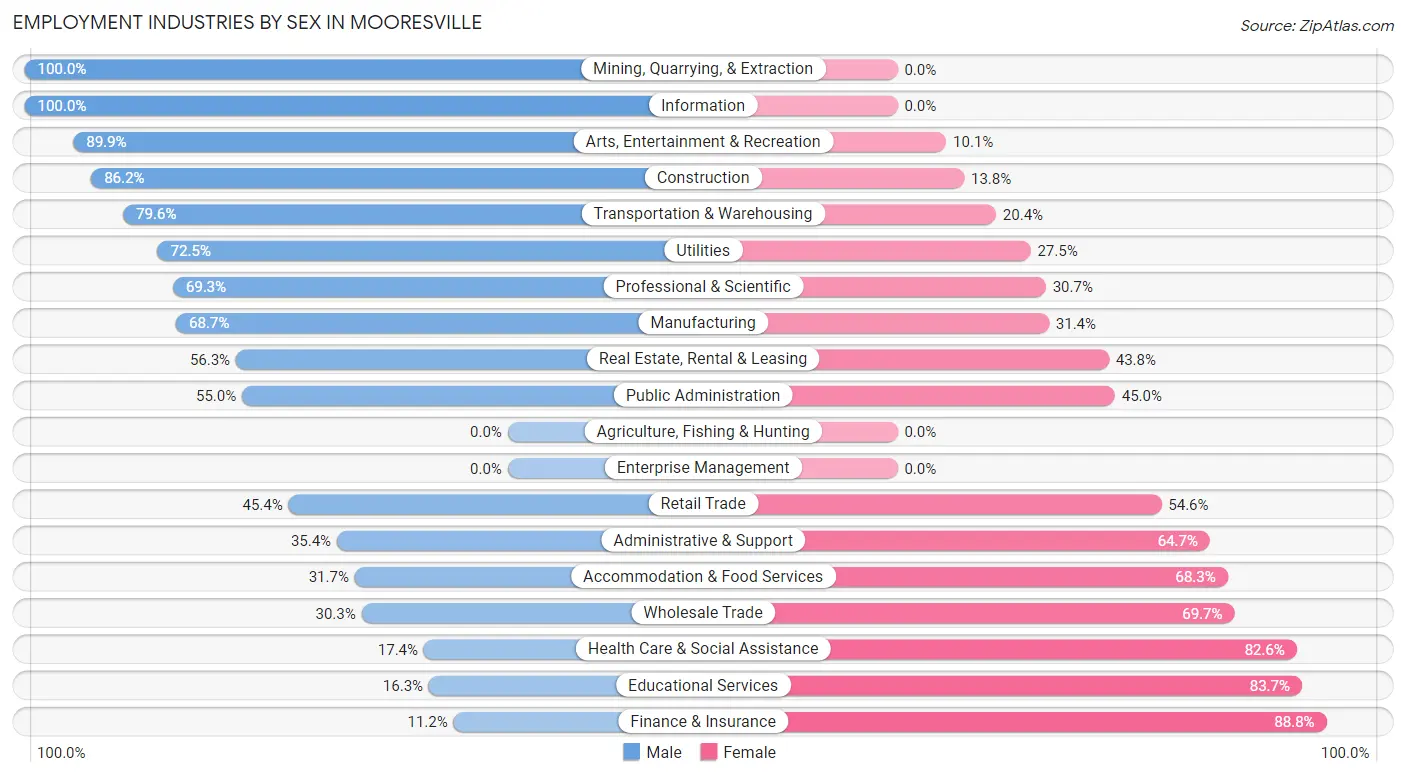
Employment Industries by Sex in Mooresville
The Mooresville industries that see more men than women are Mining, Quarrying, & Extraction (100.0%), Information (100.0%), and Arts, Entertainment & Recreation (89.9%), whereas the industries that tend to have a higher number of women are Finance & Insurance (88.8%), Educational Services (83.7%), and Health Care & Social Assistance (82.6%).
| Industry | Male | Female |
| Agriculture, Fishing & Hunting | 0 (0.0%) | 0 (0.0%) |
| Mining, Quarrying, & Extraction | 33 (100.0%) | 0 (0.0%) |
| Construction | 469 (86.2%) | 75 (13.8%) |
| Manufacturing | 381 (68.6%) | 174 (31.4%) |
| Wholesale Trade | 23 (30.3%) | 53 (69.7%) |
| Retail Trade | 186 (45.4%) | 224 (54.6%) |
| Transportation & Warehousing | 488 (79.6%) | 125 (20.4%) |
| Utilities | 50 (72.5%) | 19 (27.5%) |
| Information | 36 (100.0%) | 0 (0.0%) |
| Finance & Insurance | 24 (11.2%) | 190 (88.8%) |
| Real Estate, Rental & Leasing | 18 (56.2%) | 14 (43.8%) |
| Professional & Scientific | 158 (69.3%) | 70 (30.7%) |
| Enterprise Management | 0 (0.0%) | 0 (0.0%) |
| Administrative & Support | 35 (35.3%) | 64 (64.6%) |
| Educational Services | 46 (16.3%) | 236 (83.7%) |
| Health Care & Social Assistance | 112 (17.4%) | 533 (82.6%) |
| Arts, Entertainment & Recreation | 98 (89.9%) | 11 (10.1%) |
| Accommodation & Food Services | 76 (31.7%) | 164 (68.3%) |
| Public Administration | 110 (55.0%) | 90 (45.0%) |
| Total | 2,528 (53.7%) | 2,177 (46.3%) |
Education in Mooresville
School Enrollment in Mooresville
The most common levels of schooling among the 1,977 students in Mooresville are high school (531 | 26.9%), elementary school (401 | 20.3%), and middle school (337 | 17.1%).
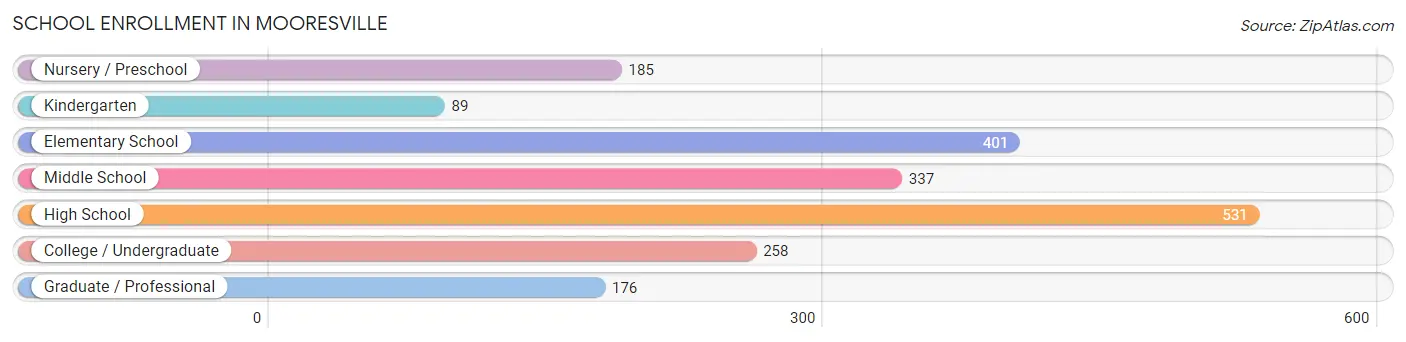
| School Level | # Students | % Students |
| Nursery / Preschool | 185 | 9.4% |
| Kindergarten | 89 | 4.5% |
| Elementary School | 401 | 20.3% |
| Middle School | 337 | 17.1% |
| High School | 531 | 26.9% |
| College / Undergraduate | 258 | 13.1% |
| Graduate / Professional | 176 | 8.9% |
| Total | 1,977 | 100.0% |
School Enrollment by Age by Funding Source in Mooresville
Out of a total of 1,977 students who are enrolled in schools in Mooresville, 358 (18.1%) attend a private institution, while the remaining 1,619 (81.9%) are enrolled in public schools. The age group of 3 to 4 year olds has the highest likelihood of being enrolled in private schools, with 107 (76.4% in the age bracket) enrolled. Conversely, the age group of 10 to 14 year olds has the lowest likelihood of being enrolled in a private school, with 505 (97.9% in the age bracket) attending a public institution.
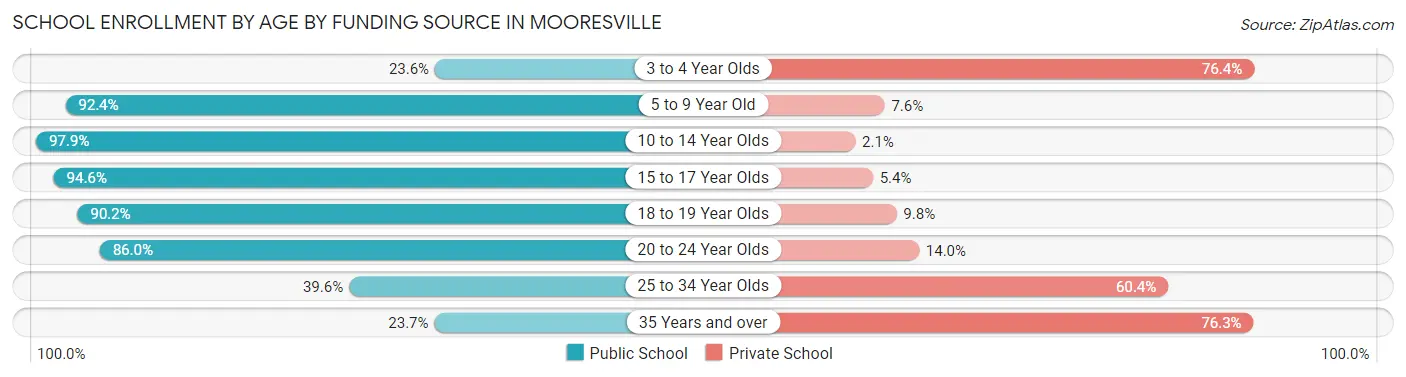
| Age Bracket | Public School | Private School |
| 3 to 4 Year Olds | 33 (23.6%) | 107 (76.4%) |
| 5 to 9 Year Old | 401 (92.4%) | 33 (7.6%) |
| 10 to 14 Year Olds | 505 (97.9%) | 11 (2.1%) |
| 15 to 17 Year Olds | 297 (94.6%) | 17 (5.4%) |
| 18 to 19 Year Olds | 147 (90.2%) | 16 (9.8%) |
| 20 to 24 Year Olds | 172 (86.0%) | 28 (14.0%) |
| 25 to 34 Year Olds | 38 (39.6%) | 58 (60.4%) |
| 35 Years and over | 27 (23.7%) | 87 (76.3%) |
| Total | 1,619 (81.9%) | 358 (18.1%) |
Educational Attainment by Field of Study in Mooresville
Education (304 | 19.0%), science & technology (253 | 15.8%), business (226 | 14.1%), liberal arts & history (155 | 9.7%), and visual & performing arts (118 | 7.4%) are the most common fields of study among 1,597 individuals in Mooresville who have obtained a bachelor's degree or higher.
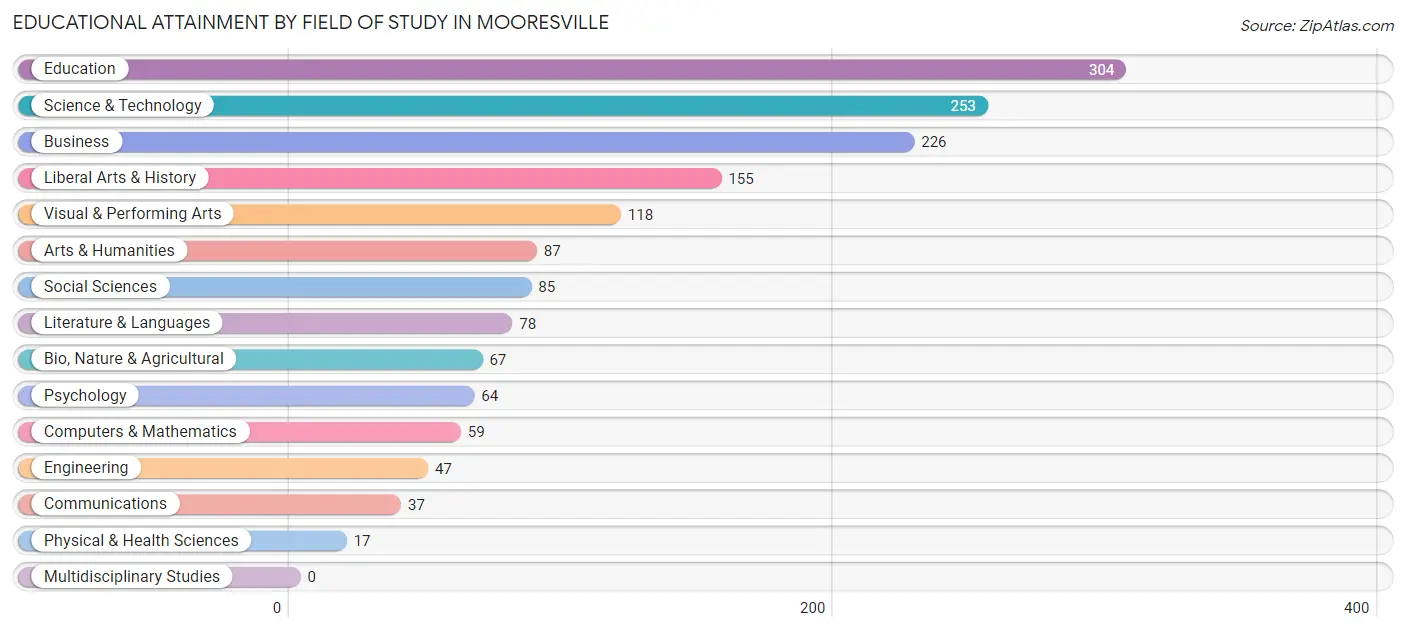
| Field of Study | # Graduates | % Graduates |
| Computers & Mathematics | 59 | 3.7% |
| Bio, Nature & Agricultural | 67 | 4.2% |
| Physical & Health Sciences | 17 | 1.1% |
| Psychology | 64 | 4.0% |
| Social Sciences | 85 | 5.3% |
| Engineering | 47 | 2.9% |
| Multidisciplinary Studies | 0 | 0.0% |
| Science & Technology | 253 | 15.8% |
| Business | 226 | 14.1% |
| Education | 304 | 19.0% |
| Literature & Languages | 78 | 4.9% |
| Liberal Arts & History | 155 | 9.7% |
| Visual & Performing Arts | 118 | 7.4% |
| Communications | 37 | 2.3% |
| Arts & Humanities | 87 | 5.4% |
| Total | 1,597 | 100.0% |
Transportation & Commute in Mooresville
Vehicle Availability by Sex in Mooresville
The most prevalent vehicle ownership categories in Mooresville are males with 2 vehicles (1,013, accounting for 40.5%) and females with 2 vehicles (1,011, making up 46.7%).
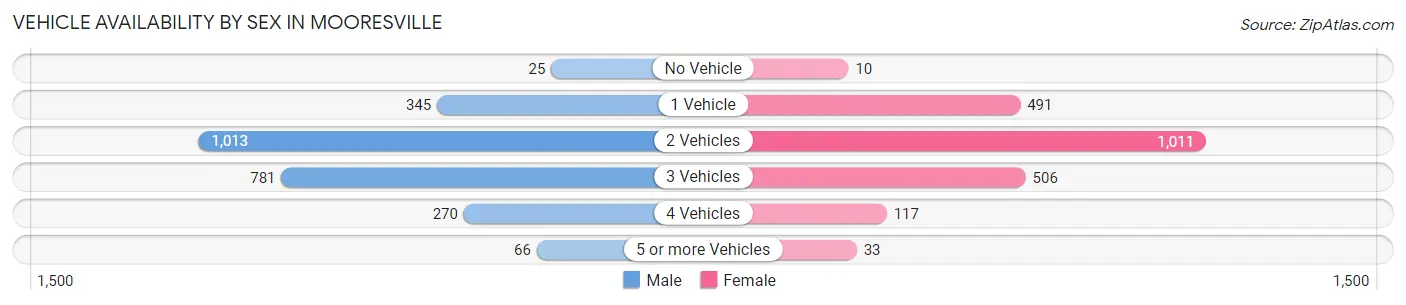
| Vehicles Available | Male | Female |
| No Vehicle | 25 (1.0%) | 10 (0.5%) |
| 1 Vehicle | 345 (13.8%) | 491 (22.7%) |
| 2 Vehicles | 1,013 (40.5%) | 1,011 (46.6%) |
| 3 Vehicles | 781 (31.2%) | 506 (23.3%) |
| 4 Vehicles | 270 (10.8%) | 117 (5.4%) |
| 5 or more Vehicles | 66 (2.6%) | 33 (1.5%) |
| Total | 2,500 (100.0%) | 2,168 (100.0%) |
Commute Time in Mooresville
The most frequently occuring commute durations in Mooresville are 5 to 9 minutes (705 commuters, 16.4%), 30 to 34 minutes (704 commuters, 16.4%), and 45 to 59 minutes (484 commuters, 11.3%).
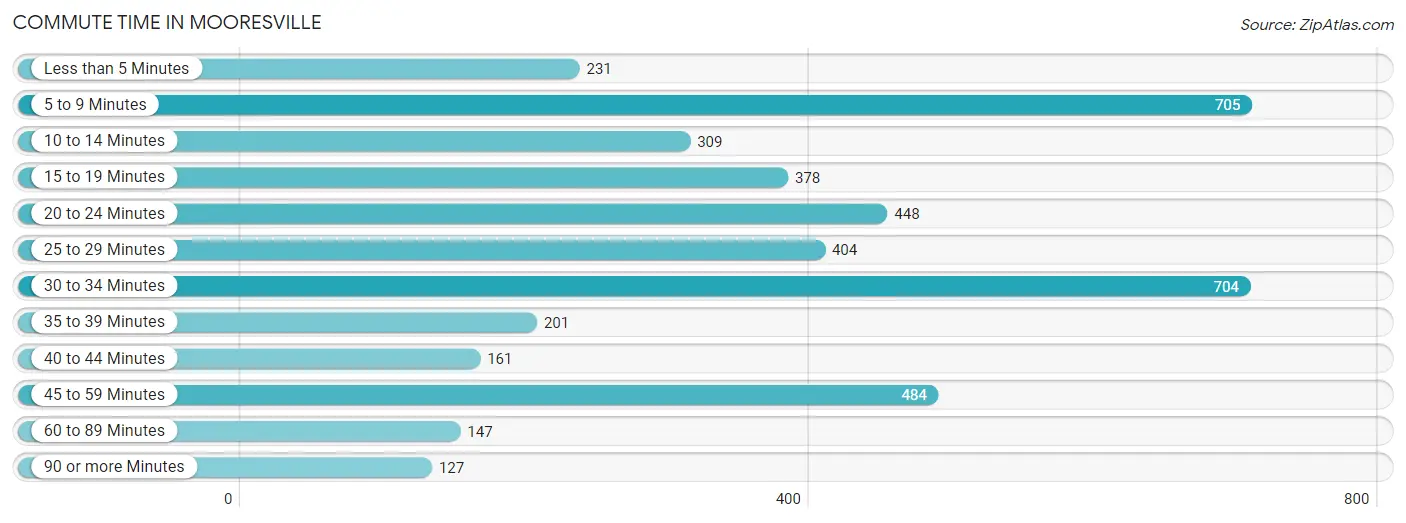
| Commute Time | # Commuters | % Commuters |
| Less than 5 Minutes | 231 | 5.4% |
| 5 to 9 Minutes | 705 | 16.4% |
| 10 to 14 Minutes | 309 | 7.2% |
| 15 to 19 Minutes | 378 | 8.8% |
| 20 to 24 Minutes | 448 | 10.4% |
| 25 to 29 Minutes | 404 | 9.4% |
| 30 to 34 Minutes | 704 | 16.4% |
| 35 to 39 Minutes | 201 | 4.7% |
| 40 to 44 Minutes | 161 | 3.7% |
| 45 to 59 Minutes | 484 | 11.3% |
| 60 to 89 Minutes | 147 | 3.4% |
| 90 or more Minutes | 127 | 2.9% |
Commute Time by Sex in Mooresville
The most common commute times in Mooresville are 30 to 34 minutes (465 commuters, 20.0%) for males and 5 to 9 minutes (348 commuters, 17.6%) for females.
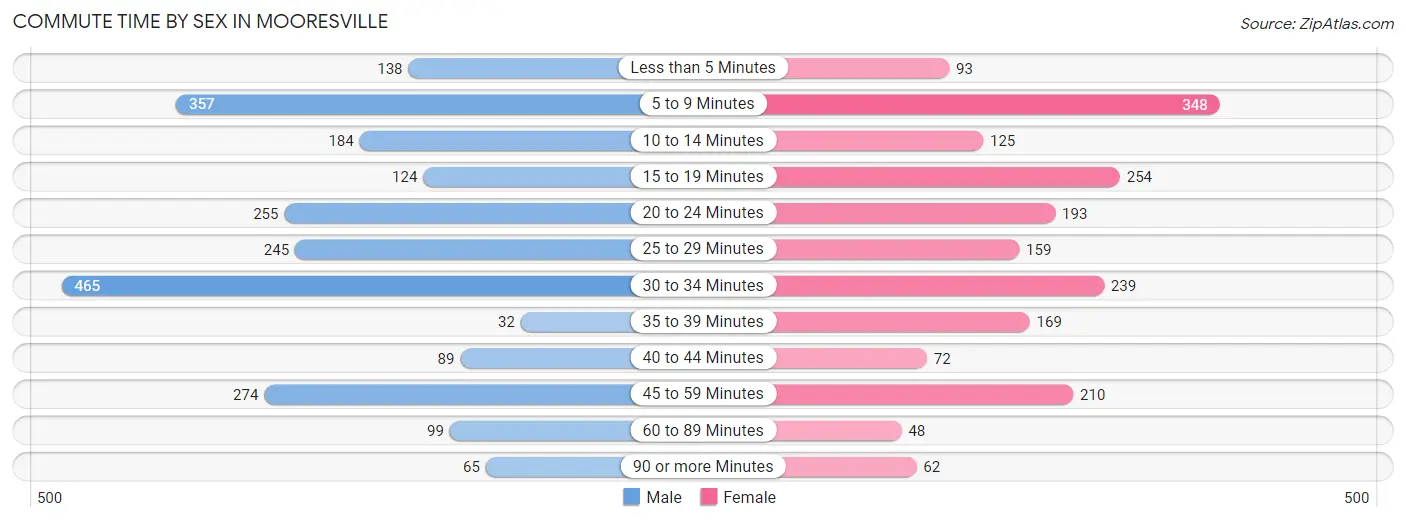
| Commute Time | Male | Female |
| Less than 5 Minutes | 138 (5.9%) | 93 (4.7%) |
| 5 to 9 Minutes | 357 (15.3%) | 348 (17.6%) |
| 10 to 14 Minutes | 184 (7.9%) | 125 (6.3%) |
| 15 to 19 Minutes | 124 (5.3%) | 254 (12.9%) |
| 20 to 24 Minutes | 255 (11.0%) | 193 (9.8%) |
| 25 to 29 Minutes | 245 (10.5%) | 159 (8.1%) |
| 30 to 34 Minutes | 465 (20.0%) | 239 (12.1%) |
| 35 to 39 Minutes | 32 (1.4%) | 169 (8.6%) |
| 40 to 44 Minutes | 89 (3.8%) | 72 (3.6%) |
| 45 to 59 Minutes | 274 (11.8%) | 210 (10.6%) |
| 60 to 89 Minutes | 99 (4.3%) | 48 (2.4%) |
| 90 or more Minutes | 65 (2.8%) | 62 (3.1%) |
Time of Departure to Work by Sex in Mooresville
The most frequent times of departure to work in Mooresville are 6:00 AM to 6:29 AM (431, 18.5%) for males and 7:00 AM to 7:29 AM (385, 19.5%) for females.
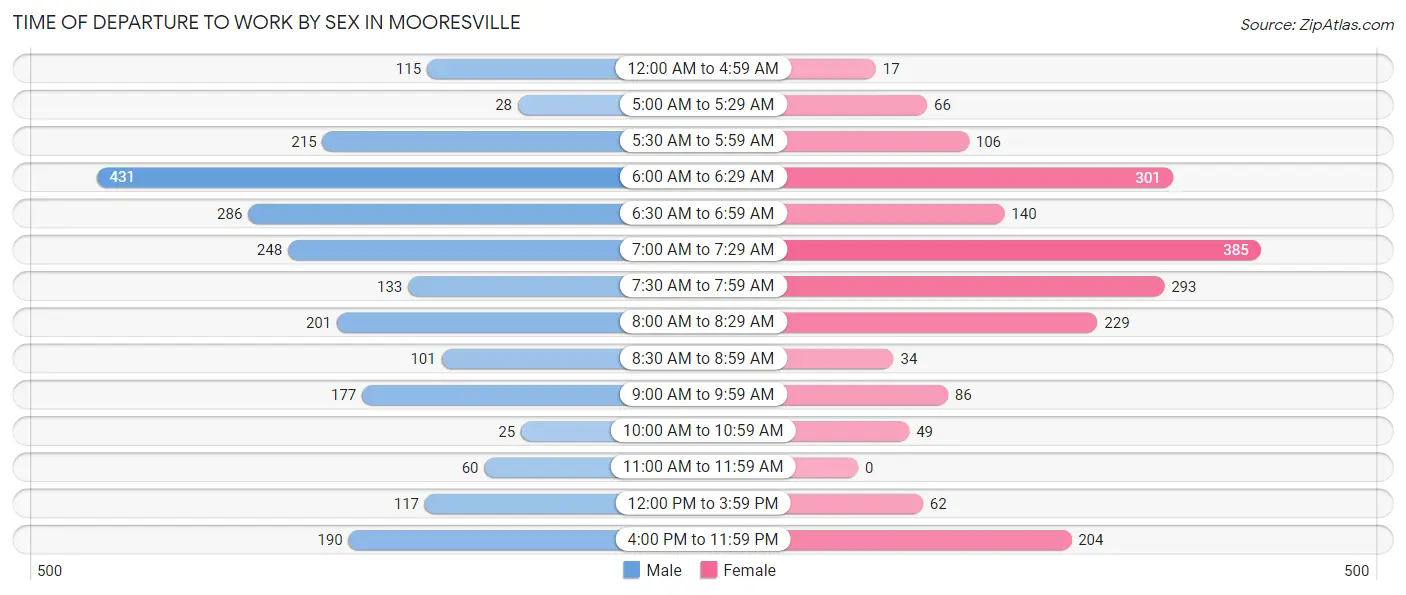
| Time of Departure | Male | Female |
| 12:00 AM to 4:59 AM | 115 (4.9%) | 17 (0.9%) |
| 5:00 AM to 5:29 AM | 28 (1.2%) | 66 (3.4%) |
| 5:30 AM to 5:59 AM | 215 (9.2%) | 106 (5.4%) |
| 6:00 AM to 6:29 AM | 431 (18.5%) | 301 (15.3%) |
| 6:30 AM to 6:59 AM | 286 (12.3%) | 140 (7.1%) |
| 7:00 AM to 7:29 AM | 248 (10.7%) | 385 (19.5%) |
| 7:30 AM to 7:59 AM | 133 (5.7%) | 293 (14.9%) |
| 8:00 AM to 8:29 AM | 201 (8.6%) | 229 (11.6%) |
| 8:30 AM to 8:59 AM | 101 (4.3%) | 34 (1.7%) |
| 9:00 AM to 9:59 AM | 177 (7.6%) | 86 (4.4%) |
| 10:00 AM to 10:59 AM | 25 (1.1%) | 49 (2.5%) |
| 11:00 AM to 11:59 AM | 60 (2.6%) | 0 (0.0%) |
| 12:00 PM to 3:59 PM | 117 (5.0%) | 62 (3.1%) |
| 4:00 PM to 11:59 PM | 190 (8.2%) | 204 (10.3%) |
| Total | 2,327 (100.0%) | 1,972 (100.0%) |
Housing Occupancy in Mooresville
Occupancy by Ownership in Mooresville
Of the total 3,789 dwellings in Mooresville, owner-occupied units account for 2,569 (67.8%), while renter-occupied units make up 1,220 (32.2%).
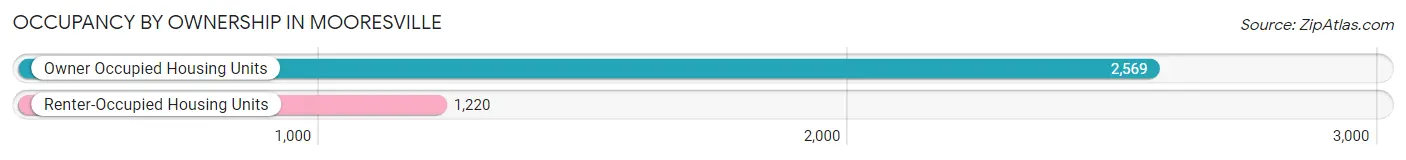
| Occupancy | # Housing Units | % Housing Units |
| Owner Occupied Housing Units | 2,569 | 67.8% |
| Renter-Occupied Housing Units | 1,220 | 32.2% |
| Total Occupied Housing Units | 3,789 | 100.0% |
Occupancy by Household Size in Mooresville
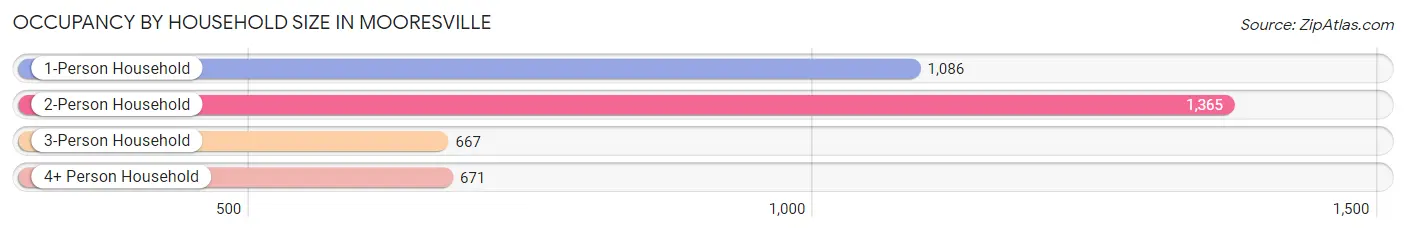
| Household Size | # Housing Units | % Housing Units |
| 1-Person Household | 1,086 | 28.7% |
| 2-Person Household | 1,365 | 36.0% |
| 3-Person Household | 667 | 17.6% |
| 4+ Person Household | 671 | 17.7% |
| Total Housing Units | 3,789 | 100.0% |
Occupancy by Ownership by Household Size in Mooresville
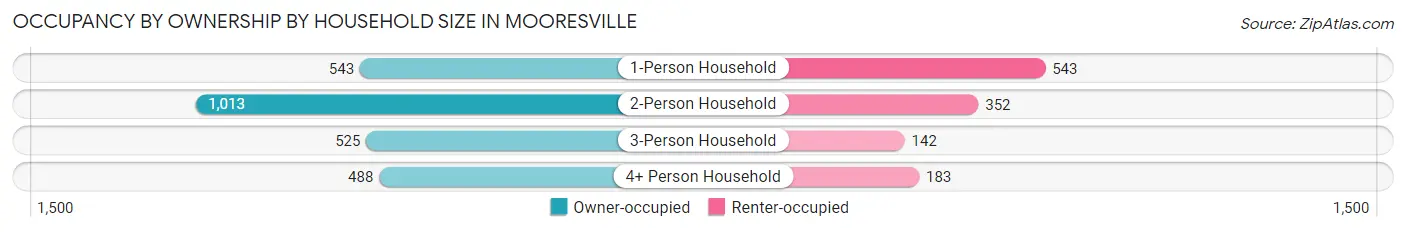
| Household Size | Owner-occupied | Renter-occupied |
| 1-Person Household | 543 (50.0%) | 543 (50.0%) |
| 2-Person Household | 1,013 (74.2%) | 352 (25.8%) |
| 3-Person Household | 525 (78.7%) | 142 (21.3%) |
| 4+ Person Household | 488 (72.7%) | 183 (27.3%) |
| Total Housing Units | 2,569 (67.8%) | 1,220 (32.2%) |
Occupancy by Educational Attainment in Mooresville
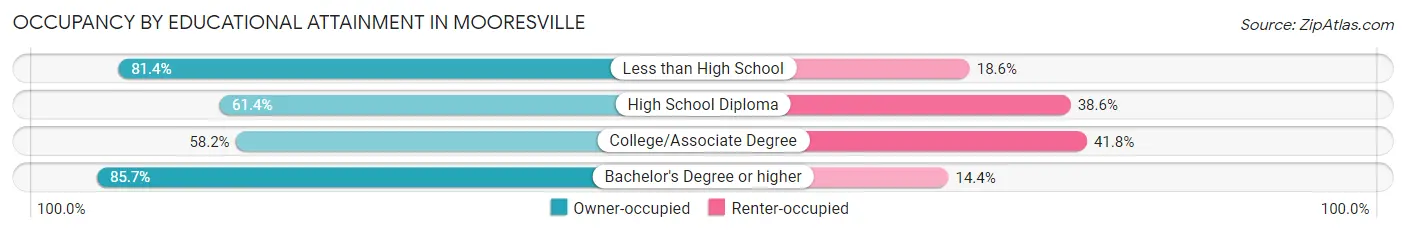
| Household Size | Owner-occupied | Renter-occupied |
| Less than High School | 228 (81.4%) | 52 (18.6%) |
| High School Diploma | 882 (61.4%) | 554 (38.6%) |
| College/Associate Degree | 671 (58.2%) | 482 (41.8%) |
| Bachelor's Degree or higher | 788 (85.7%) | 132 (14.3%) |
Occupancy by Age of Householder in Mooresville
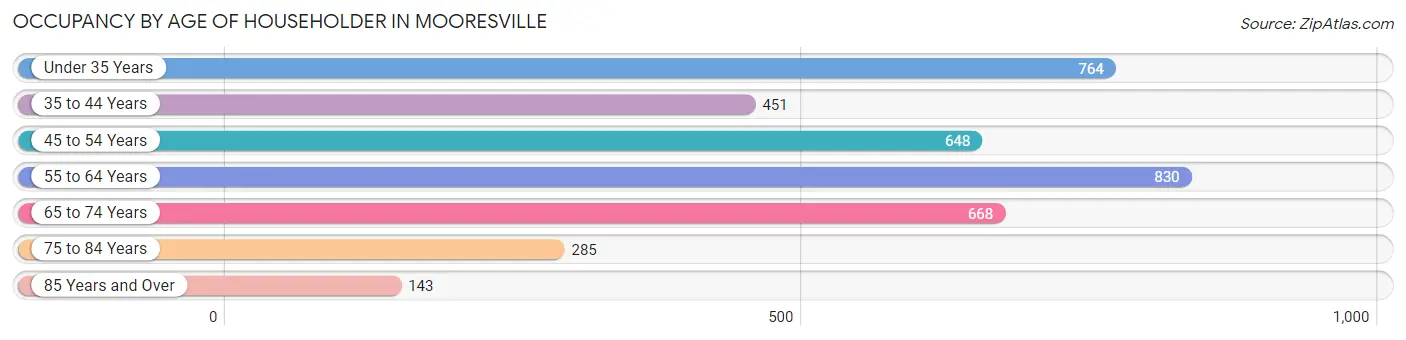
| Age Bracket | # Households | % Households |
| Under 35 Years | 764 | 20.2% |
| 35 to 44 Years | 451 | 11.9% |
| 45 to 54 Years | 648 | 17.1% |
| 55 to 64 Years | 830 | 21.9% |
| 65 to 74 Years | 668 | 17.6% |
| 75 to 84 Years | 285 | 7.5% |
| 85 Years and Over | 143 | 3.8% |
| Total | 3,789 | 100.0% |
Housing Finances in Mooresville
Median Income by Occupancy in Mooresville
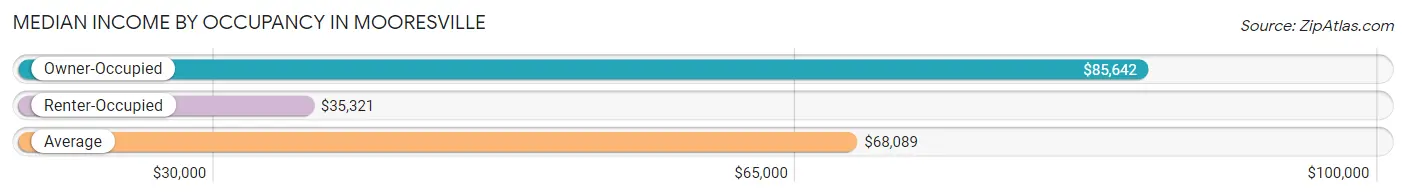
| Occupancy Type | # Households | Median Income |
| Owner-Occupied | 2,569 (67.8%) | $85,642 |
| Renter-Occupied | 1,220 (32.2%) | $35,321 |
| Average | 3,789 (100.0%) | $68,089 |
Occupancy by Householder Income Bracket in Mooresville
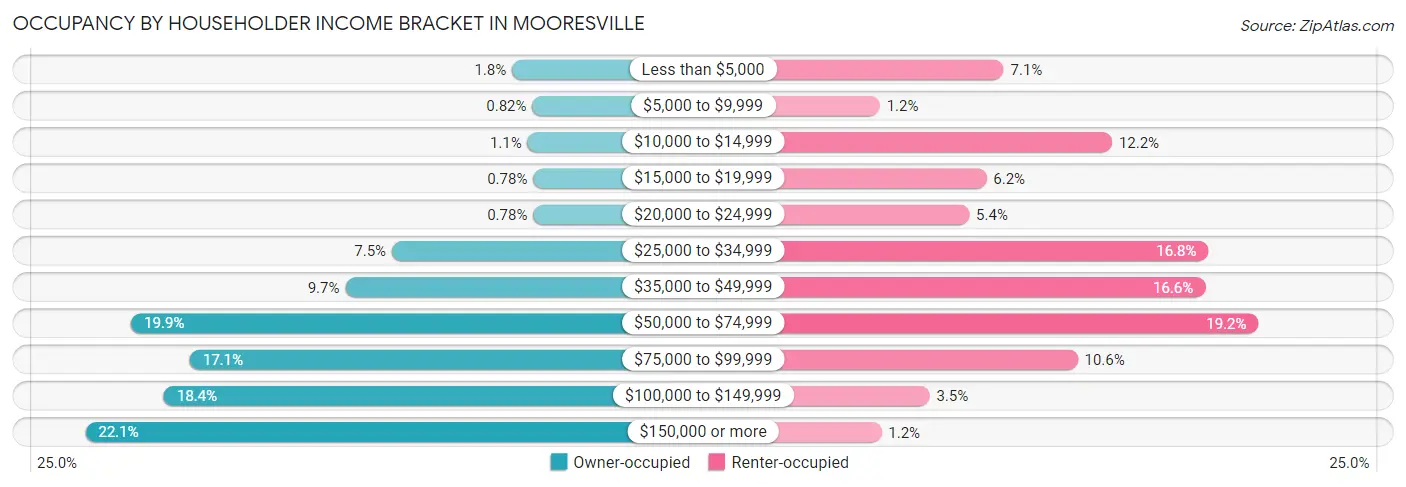
| Income Bracket | Owner-occupied | Renter-occupied |
| Less than $5,000 | 46 (1.8%) | 86 (7.0%) |
| $5,000 to $9,999 | 21 (0.8%) | 14 (1.1%) |
| $10,000 to $14,999 | 27 (1.1%) | 149 (12.2%) |
| $15,000 to $19,999 | 20 (0.8%) | 76 (6.2%) |
| $20,000 to $24,999 | 20 (0.8%) | 66 (5.4%) |
| $25,000 to $34,999 | 193 (7.5%) | 205 (16.8%) |
| $35,000 to $49,999 | 250 (9.7%) | 203 (16.6%) |
| $50,000 to $74,999 | 512 (19.9%) | 234 (19.2%) |
| $75,000 to $99,999 | 440 (17.1%) | 129 (10.6%) |
| $100,000 to $149,999 | 472 (18.4%) | 43 (3.5%) |
| $150,000 or more | 568 (22.1%) | 15 (1.2%) |
| Total | 2,569 (100.0%) | 1,220 (100.0%) |
Monthly Housing Cost Tiers in Mooresville
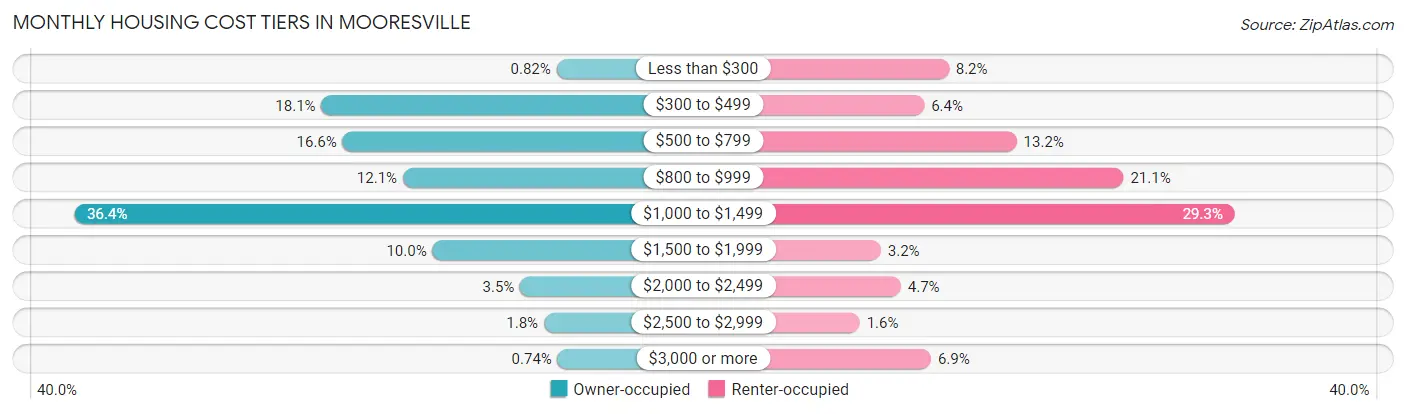
| Monthly Cost | Owner-occupied | Renter-occupied |
| Less than $300 | 21 (0.8%) | 100 (8.2%) |
| $300 to $499 | 466 (18.1%) | 78 (6.4%) |
| $500 to $799 | 426 (16.6%) | 161 (13.2%) |
| $800 to $999 | 312 (12.1%) | 257 (21.1%) |
| $1,000 to $1,499 | 934 (36.4%) | 357 (29.3%) |
| $1,500 to $1,999 | 256 (10.0%) | 39 (3.2%) |
| $2,000 to $2,499 | 90 (3.5%) | 57 (4.7%) |
| $2,500 to $2,999 | 45 (1.8%) | 20 (1.6%) |
| $3,000 or more | 19 (0.7%) | 84 (6.9%) |
| Total | 2,569 (100.0%) | 1,220 (100.0%) |
Physical Housing Characteristics in Mooresville
Housing Structures in Mooresville
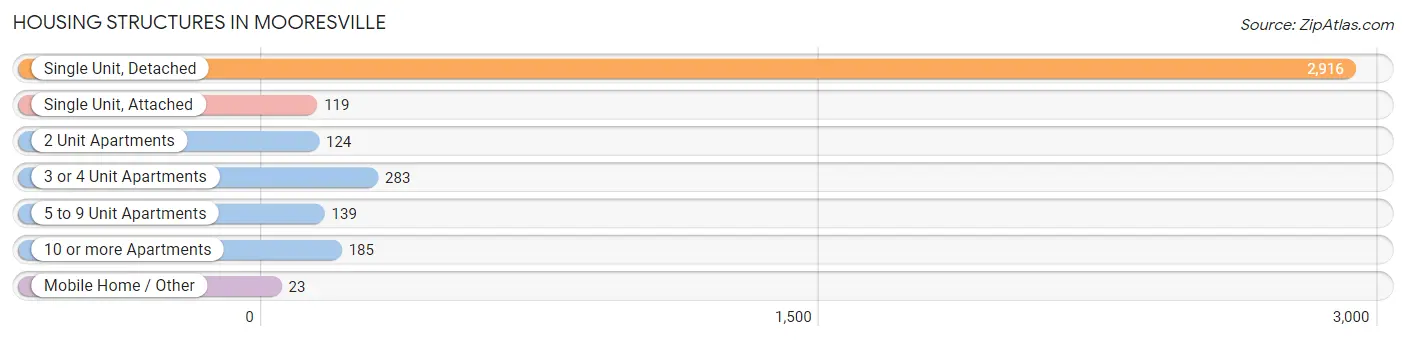
| Structure Type | # Housing Units | % Housing Units |
| Single Unit, Detached | 2,916 | 77.0% |
| Single Unit, Attached | 119 | 3.1% |
| 2 Unit Apartments | 124 | 3.3% |
| 3 or 4 Unit Apartments | 283 | 7.5% |
| 5 to 9 Unit Apartments | 139 | 3.7% |
| 10 or more Apartments | 185 | 4.9% |
| Mobile Home / Other | 23 | 0.6% |
| Total | 3,789 | 100.0% |
Housing Structures by Occupancy in Mooresville
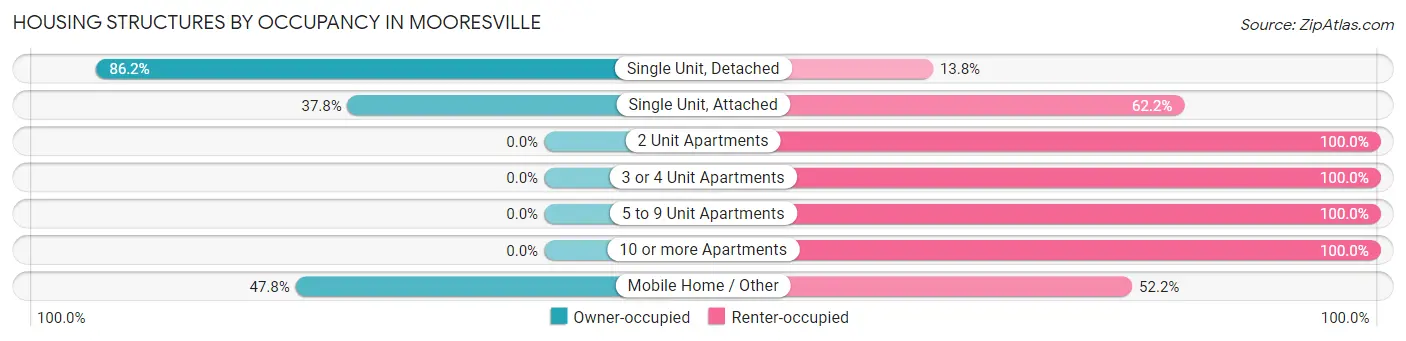
| Structure Type | Owner-occupied | Renter-occupied |
| Single Unit, Detached | 2,513 (86.2%) | 403 (13.8%) |
| Single Unit, Attached | 45 (37.8%) | 74 (62.2%) |
| 2 Unit Apartments | 0 (0.0%) | 124 (100.0%) |
| 3 or 4 Unit Apartments | 0 (0.0%) | 283 (100.0%) |
| 5 to 9 Unit Apartments | 0 (0.0%) | 139 (100.0%) |
| 10 or more Apartments | 0 (0.0%) | 185 (100.0%) |
| Mobile Home / Other | 11 (47.8%) | 12 (52.2%) |
| Total | 2,569 (67.8%) | 1,220 (32.2%) |
Housing Structures by Number of Rooms in Mooresville
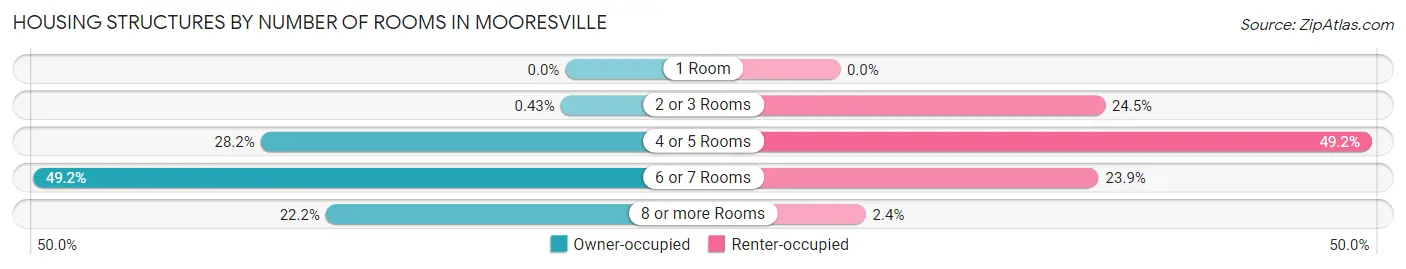
| Number of Rooms | Owner-occupied | Renter-occupied |
| 1 Room | 0 (0.0%) | 0 (0.0%) |
| 2 or 3 Rooms | 11 (0.4%) | 299 (24.5%) |
| 4 or 5 Rooms | 724 (28.2%) | 600 (49.2%) |
| 6 or 7 Rooms | 1,265 (49.2%) | 292 (23.9%) |
| 8 or more Rooms | 569 (22.2%) | 29 (2.4%) |
| Total | 2,569 (100.0%) | 1,220 (100.0%) |
Housing Structure by Heating Type in Mooresville
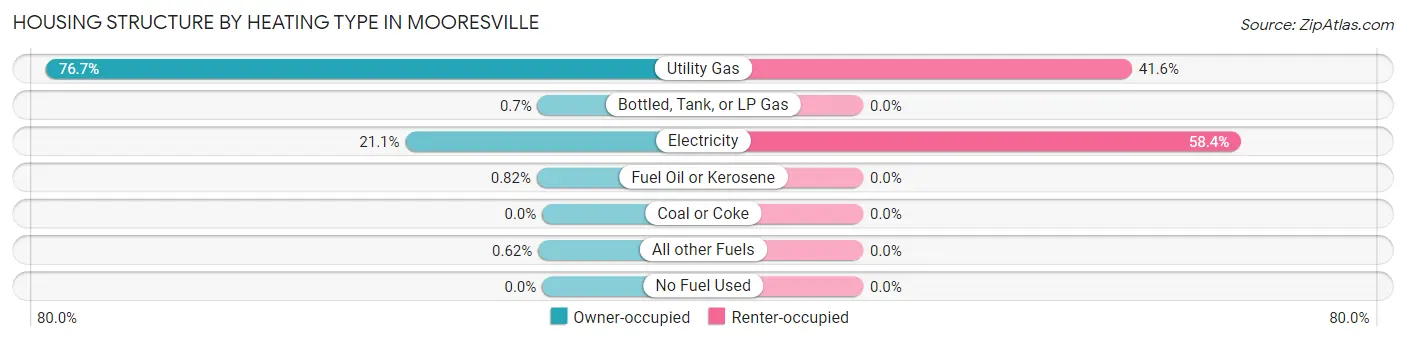
| Heating Type | Owner-occupied | Renter-occupied |
| Utility Gas | 1,971 (76.7%) | 507 (41.6%) |
| Bottled, Tank, or LP Gas | 18 (0.7%) | 0 (0.0%) |
| Electricity | 543 (21.1%) | 713 (58.4%) |
| Fuel Oil or Kerosene | 21 (0.8%) | 0 (0.0%) |
| Coal or Coke | 0 (0.0%) | 0 (0.0%) |
| All other Fuels | 16 (0.6%) | 0 (0.0%) |
| No Fuel Used | 0 (0.0%) | 0 (0.0%) |
| Total | 2,569 (100.0%) | 1,220 (100.0%) |
Household Vehicle Usage in Mooresville
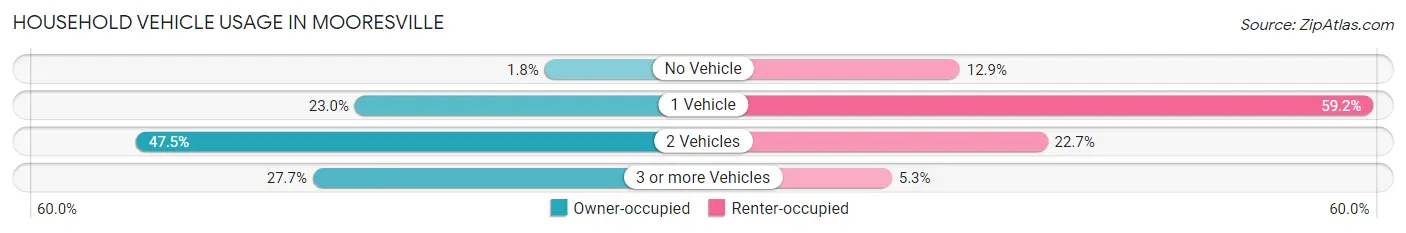
| Vehicles per Household | Owner-occupied | Renter-occupied |
| No Vehicle | 45 (1.8%) | 157 (12.9%) |
| 1 Vehicle | 591 (23.0%) | 722 (59.2%) |
| 2 Vehicles | 1,221 (47.5%) | 277 (22.7%) |
| 3 or more Vehicles | 712 (27.7%) | 64 (5.2%) |
| Total | 2,569 (100.0%) | 1,220 (100.0%) |
Real Estate & Mortgages in Mooresville
Real Estate and Mortgage Overview in Mooresville
| Characteristic | Without Mortgage | With Mortgage |
| Housing Units | 671 | 1,898 |
| Median Property Value | $179,300 | $178,300 |
| Median Household Income | $68,601 | $461 |
| Monthly Housing Costs | $463 | $19 |
| Real Estate Taxes | $943 | $7 |
Property Value by Mortgage Status in Mooresville
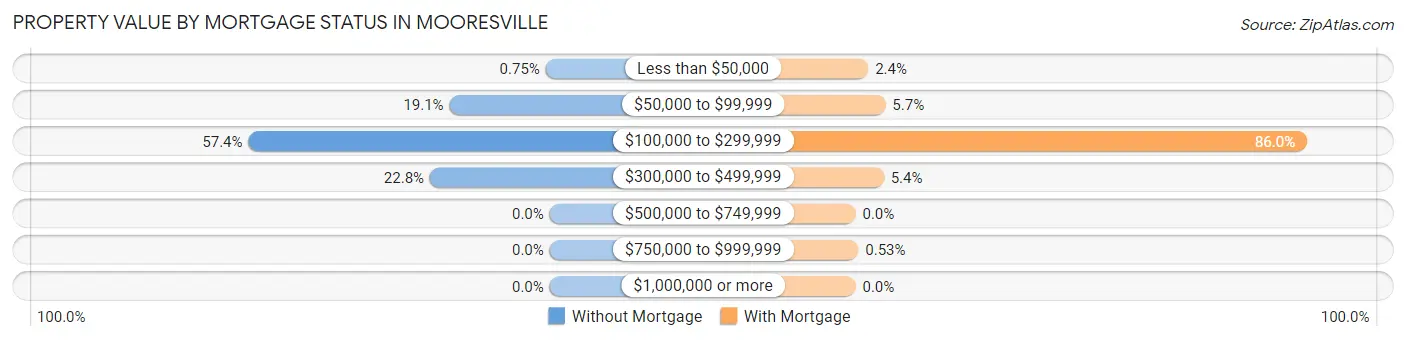
| Property Value | Without Mortgage | With Mortgage |
| Less than $50,000 | 5 (0.7%) | 46 (2.4%) |
| $50,000 to $99,999 | 128 (19.1%) | 108 (5.7%) |
| $100,000 to $299,999 | 385 (57.4%) | 1,632 (86.0%) |
| $300,000 to $499,999 | 153 (22.8%) | 102 (5.4%) |
| $500,000 to $749,999 | 0 (0.0%) | 0 (0.0%) |
| $750,000 to $999,999 | 0 (0.0%) | 10 (0.5%) |
| $1,000,000 or more | 0 (0.0%) | 0 (0.0%) |
| Total | 671 (100.0%) | 1,898 (100.0%) |
Household Income by Mortgage Status in Mooresville
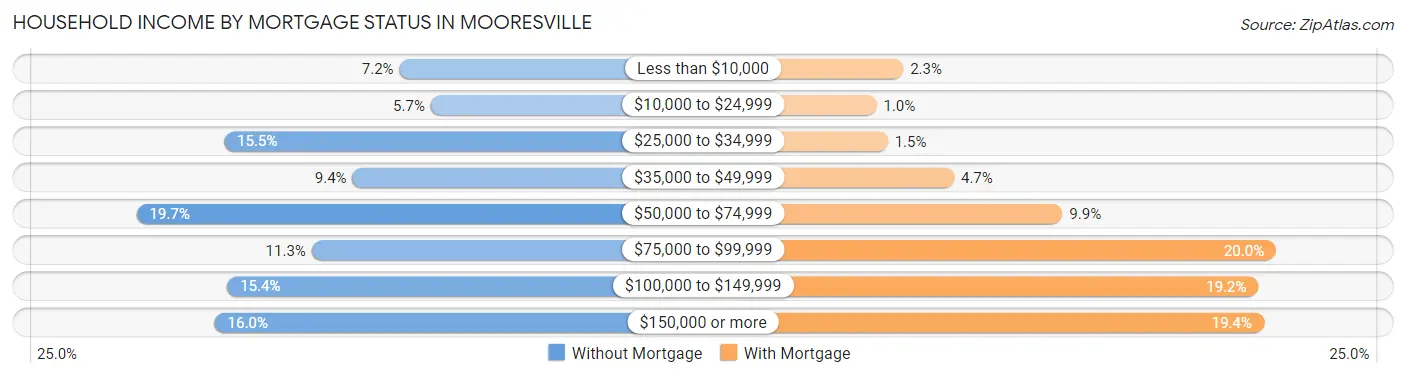
| Household Income | Without Mortgage | With Mortgage |
| Less than $10,000 | 48 (7.1%) | 43 (2.3%) |
| $10,000 to $24,999 | 38 (5.7%) | 19 (1.0%) |
| $25,000 to $34,999 | 104 (15.5%) | 29 (1.5%) |
| $35,000 to $49,999 | 63 (9.4%) | 89 (4.7%) |
| $50,000 to $74,999 | 132 (19.7%) | 187 (9.9%) |
| $75,000 to $99,999 | 76 (11.3%) | 380 (20.0%) |
| $100,000 to $149,999 | 103 (15.3%) | 364 (19.2%) |
| $150,000 or more | 107 (16.0%) | 369 (19.4%) |
| Total | 671 (100.0%) | 1,898 (100.0%) |
Property Value to Household Income Ratio in Mooresville
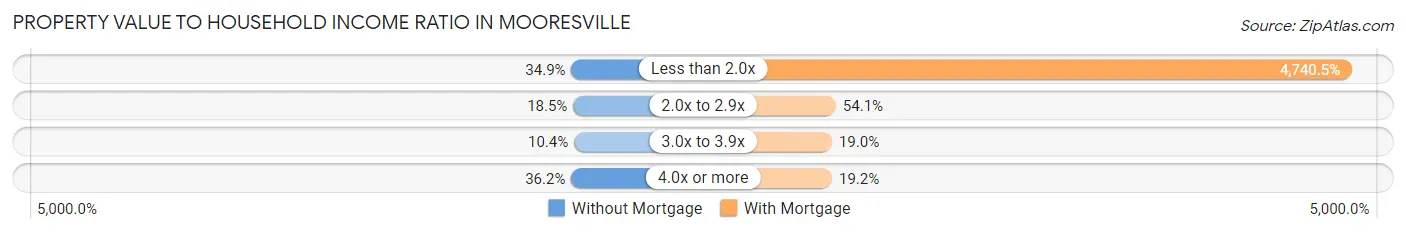
| Value-to-Income Ratio | Without Mortgage | With Mortgage |
| Less than 2.0x | 234 (34.9%) | 89,975 (4,740.5%) |
| 2.0x to 2.9x | 124 (18.5%) | 1,027 (54.1%) |
| 3.0x to 3.9x | 70 (10.4%) | 360 (19.0%) |
| 4.0x or more | 243 (36.2%) | 364 (19.2%) |
| Total | 671 (100.0%) | 1,898 (100.0%) |
Real Estate Taxes by Mortgage Status in Mooresville
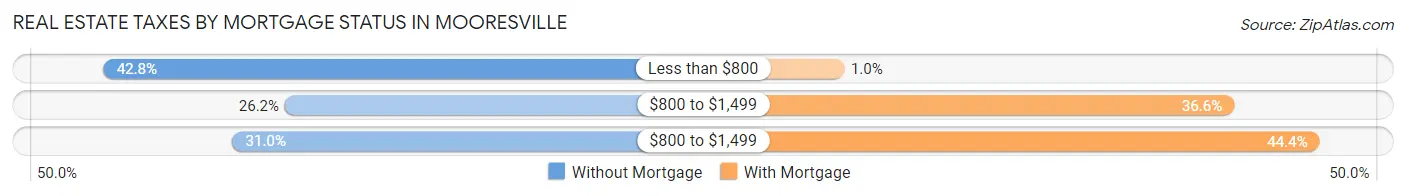
| Property Taxes | Without Mortgage | With Mortgage |
| Less than $800 | 287 (42.8%) | 19 (1.0%) |
| $800 to $1,499 | 176 (26.2%) | 695 (36.6%) |
| $800 to $1,499 | 208 (31.0%) | 843 (44.4%) |
| Total | 671 (100.0%) | 1,898 (100.0%) |
Health & Disability in Mooresville
Health Insurance Coverage by Age in Mooresville
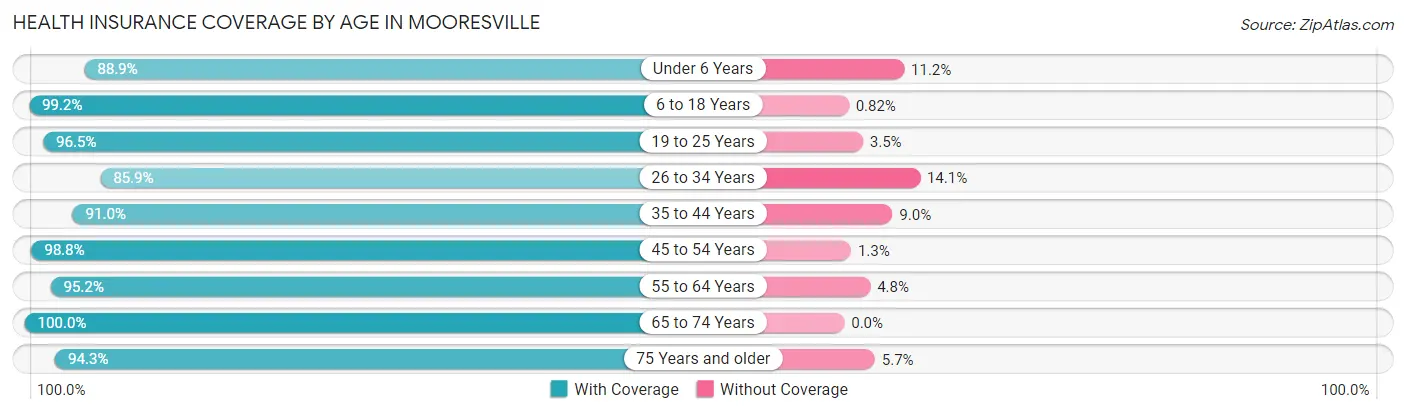
| Age Bracket | With Coverage | Without Coverage |
| Under 6 Years | 582 (88.8%) | 73 (11.2%) |
| 6 to 18 Years | 1,325 (99.2%) | 11 (0.8%) |
| 19 to 25 Years | 864 (96.5%) | 31 (3.5%) |
| 26 to 34 Years | 1,004 (85.9%) | 165 (14.1%) |
| 35 to 44 Years | 761 (91.0%) | 75 (9.0%) |
| 45 to 54 Years | 1,187 (98.8%) | 15 (1.3%) |
| 55 to 64 Years | 1,379 (95.2%) | 70 (4.8%) |
| 65 to 74 Years | 933 (100.0%) | 0 (0.0%) |
| 75 Years and older | 662 (94.3%) | 40 (5.7%) |
| Total | 8,697 (94.8%) | 480 (5.2%) |
Health Insurance Coverage by Citizenship Status in Mooresville
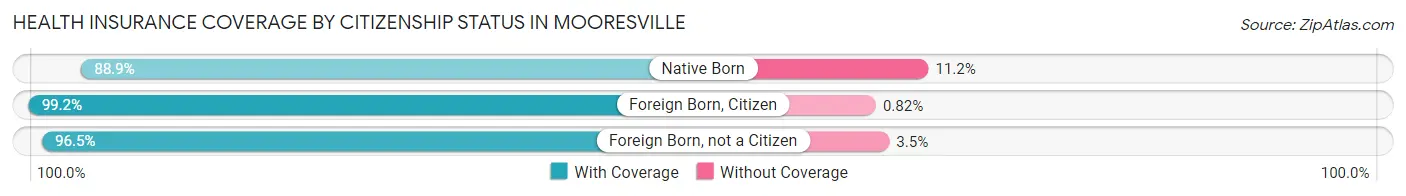
| Citizenship Status | With Coverage | Without Coverage |
| Native Born | 582 (88.8%) | 73 (11.2%) |
| Foreign Born, Citizen | 1,325 (99.2%) | 11 (0.8%) |
| Foreign Born, not a Citizen | 864 (96.5%) | 31 (3.5%) |
Health Insurance Coverage by Household Income in Mooresville
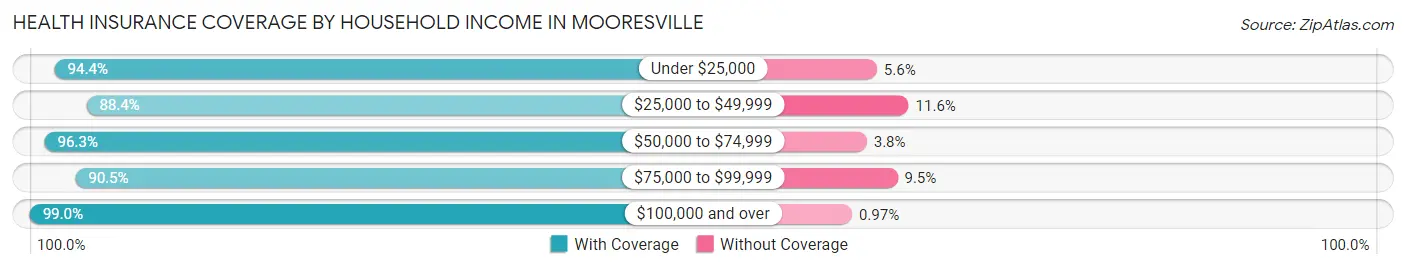
| Household Income | With Coverage | Without Coverage |
| Under $25,000 | 870 (94.4%) | 52 (5.6%) |
| $25,000 to $49,999 | 1,305 (88.4%) | 171 (11.6%) |
| $50,000 to $74,999 | 1,796 (96.3%) | 70 (3.7%) |
| $75,000 to $99,999 | 1,429 (90.5%) | 150 (9.5%) |
| $100,000 and over | 3,279 (99.0%) | 32 (1.0%) |
Public vs Private Health Insurance Coverage by Age in Mooresville
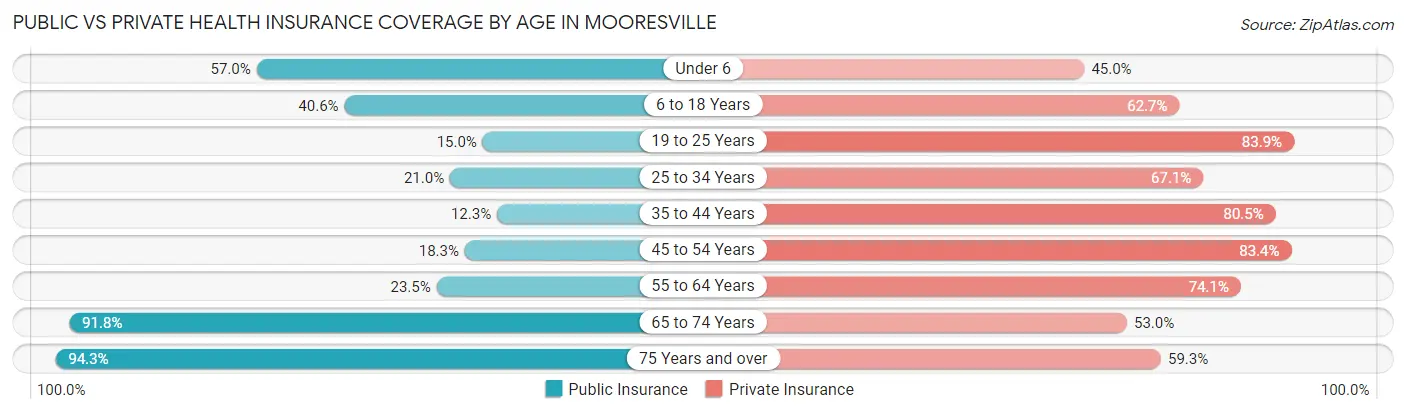
| Age Bracket | Public Insurance | Private Insurance |
| Under 6 | 373 (57.0%) | 295 (45.0%) |
| 6 to 18 Years | 543 (40.6%) | 837 (62.6%) |
| 19 to 25 Years | 134 (15.0%) | 751 (83.9%) |
| 25 to 34 Years | 246 (21.0%) | 784 (67.1%) |
| 35 to 44 Years | 103 (12.3%) | 673 (80.5%) |
| 45 to 54 Years | 220 (18.3%) | 1,003 (83.4%) |
| 55 to 64 Years | 341 (23.5%) | 1,073 (74.1%) |
| 65 to 74 Years | 856 (91.7%) | 494 (52.9%) |
| 75 Years and over | 662 (94.3%) | 416 (59.3%) |
| Total | 3,478 (37.9%) | 6,326 (68.9%) |
Disability Status by Sex by Age in Mooresville
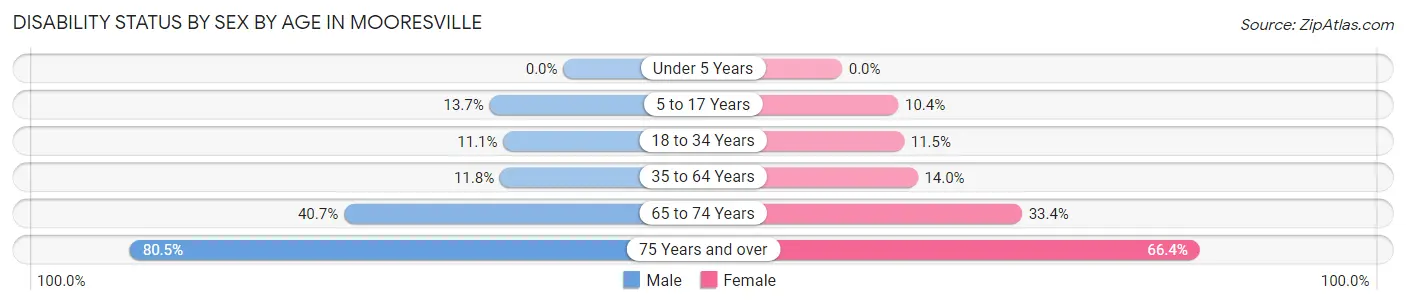
| Age Bracket | Male | Female |
| Under 5 Years | 0 (0.0%) | 0 (0.0%) |
| 5 to 17 Years | 104 (13.7%) | 55 (10.4%) |
| 18 to 34 Years | 132 (11.1%) | 118 (11.5%) |
| 35 to 64 Years | 204 (11.8%) | 246 (14.0%) |
| 65 to 74 Years | 147 (40.7%) | 191 (33.4%) |
| 75 Years and over | 239 (80.5%) | 269 (66.4%) |
Disability Class by Sex by Age in Mooresville
Disability Class: Hearing Difficulty
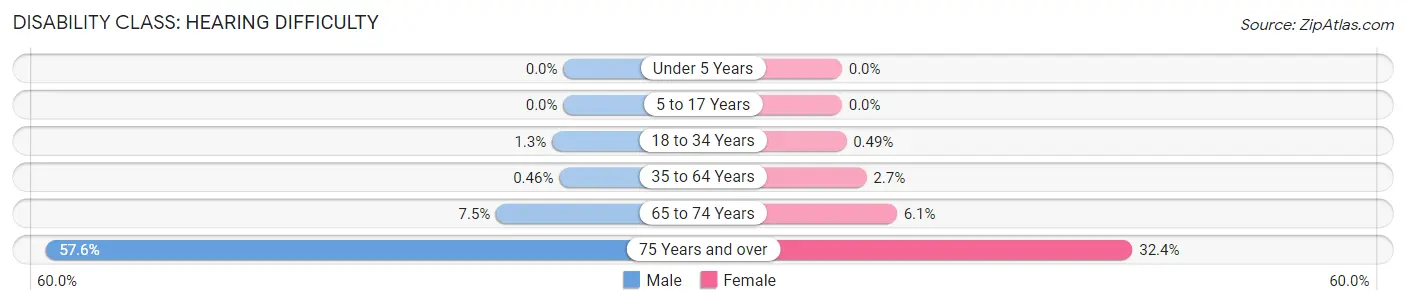
| Age Bracket | Male | Female |
| Under 5 Years | 0 (0.0%) | 0 (0.0%) |
| 5 to 17 Years | 0 (0.0%) | 0 (0.0%) |
| 18 to 34 Years | 15 (1.3%) | 5 (0.5%) |
| 35 to 64 Years | 8 (0.5%) | 48 (2.7%) |
| 65 to 74 Years | 27 (7.5%) | 35 (6.1%) |
| 75 Years and over | 171 (57.6%) | 131 (32.4%) |
Disability Class: Vision Difficulty
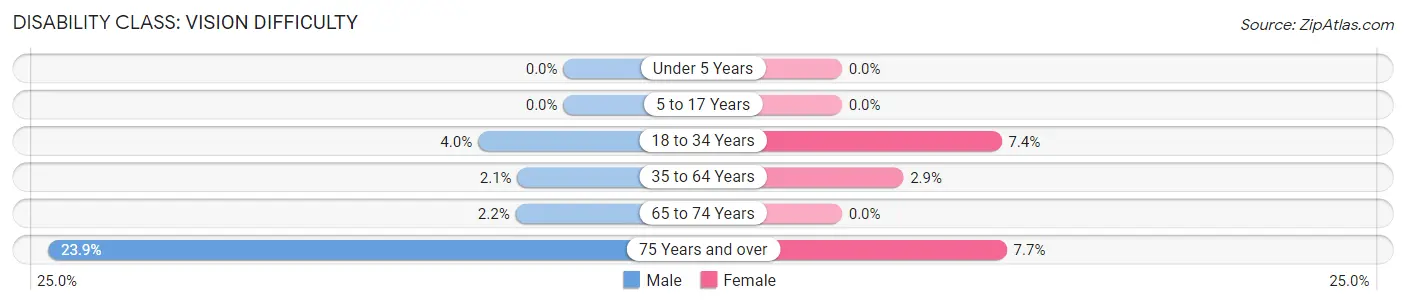
| Age Bracket | Male | Female |
| Under 5 Years | 0 (0.0%) | 0 (0.0%) |
| 5 to 17 Years | 0 (0.0%) | 0 (0.0%) |
| 18 to 34 Years | 47 (4.0%) | 76 (7.4%) |
| 35 to 64 Years | 37 (2.1%) | 50 (2.9%) |
| 65 to 74 Years | 8 (2.2%) | 0 (0.0%) |
| 75 Years and over | 71 (23.9%) | 31 (7.6%) |
Disability Class: Cognitive Difficulty
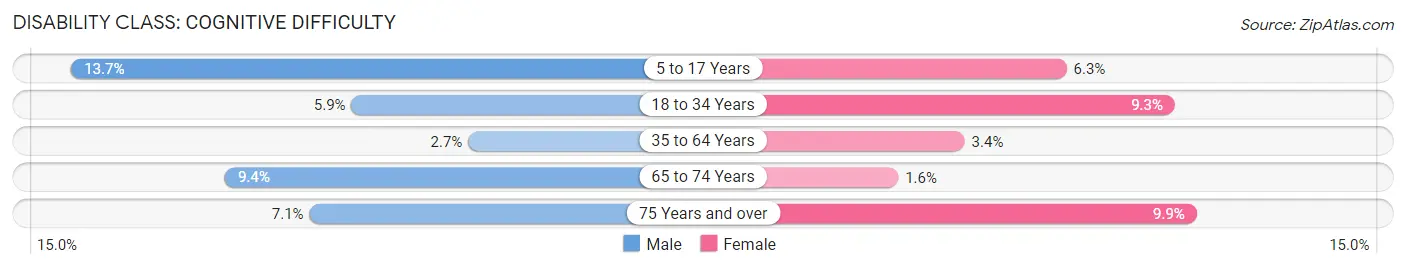
| Age Bracket | Male | Female |
| 5 to 17 Years | 104 (13.7%) | 33 (6.3%) |
| 18 to 34 Years | 70 (5.9%) | 95 (9.3%) |
| 35 to 64 Years | 46 (2.6%) | 60 (3.4%) |
| 65 to 74 Years | 34 (9.4%) | 9 (1.6%) |
| 75 Years and over | 21 (7.1%) | 40 (9.9%) |
Disability Class: Ambulatory Difficulty
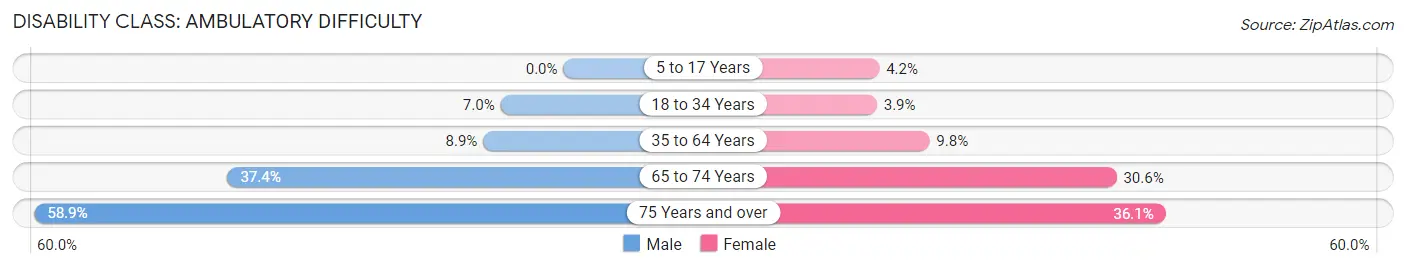
| Age Bracket | Male | Female |
| 5 to 17 Years | 0 (0.0%) | 22 (4.2%) |
| 18 to 34 Years | 83 (7.0%) | 40 (3.9%) |
| 35 to 64 Years | 155 (8.9%) | 171 (9.8%) |
| 65 to 74 Years | 135 (37.4%) | 175 (30.6%) |
| 75 Years and over | 175 (58.9%) | 146 (36.0%) |
Disability Class: Self-Care Difficulty
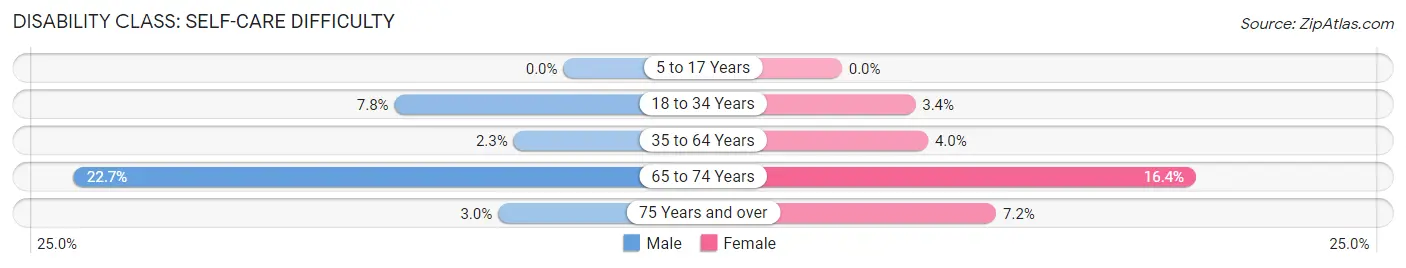
| Age Bracket | Male | Female |
| 5 to 17 Years | 0 (0.0%) | 0 (0.0%) |
| 18 to 34 Years | 93 (7.8%) | 35 (3.4%) |
| 35 to 64 Years | 40 (2.3%) | 70 (4.0%) |
| 65 to 74 Years | 82 (22.7%) | 94 (16.4%) |
| 75 Years and over | 9 (3.0%) | 29 (7.2%) |
Technology Access in Mooresville
Computing Device Access in Mooresville
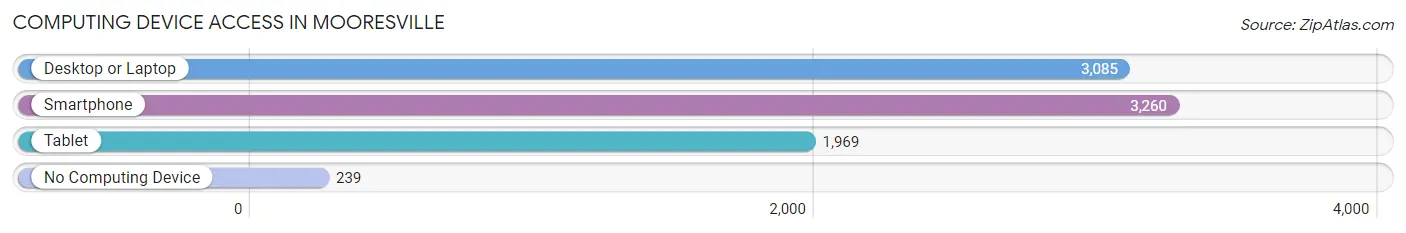
| Device Type | # Households | % Households |
| Desktop or Laptop | 3,085 | 81.4% |
| Smartphone | 3,260 | 86.0% |
| Tablet | 1,969 | 52.0% |
| No Computing Device | 239 | 6.3% |
| Total | 3,789 | 100.0% |
Internet Access in Mooresville
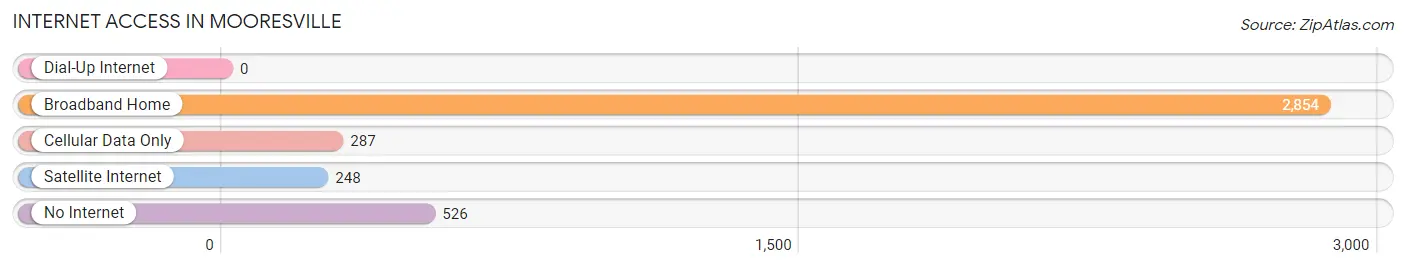
| Internet Type | # Households | % Households |
| Dial-Up Internet | 0 | 0.0% |
| Broadband Home | 2,854 | 75.3% |
| Cellular Data Only | 287 | 7.6% |
| Satellite Internet | 248 | 6.6% |
| No Internet | 526 | 13.9% |
| Total | 3,789 | 100.0% |
Mooresville Summary
Mooresville, Indiana is a small town located in Morgan County, Indiana, about 20 miles southwest of Indianapolis. The town has a population of about 9,000 people and is known for its historic downtown area, which is listed on the National Register of Historic Places. The town is also home to a number of small businesses, including a winery, a brewery, and a distillery.
Geography
Mooresville is located in the central part of Morgan County, Indiana, about 20 miles southwest of Indianapolis. The town is situated on the White River, which flows through the town and provides a scenic backdrop for the downtown area. The town is surrounded by rolling hills and farmland, and is located in the Central Till Plains region of Indiana.
The town has a total area of 4.2 square miles, all of which is land. The town is located at an elevation of 830 feet above sea level. The climate in Mooresville is classified as humid continental, with hot summers and cold winters.
Economy
Mooresville’s economy is largely based on small businesses and agriculture. The town is home to a number of small businesses, including a winery, a brewery, and a distillery. The town is also home to a number of manufacturing companies, including a plastics manufacturer and a metal fabrication company.
Agriculture is also an important part of the local economy. The town is home to a number of farms, which produce a variety of crops, including corn, soybeans, and wheat. The town is also home to a number of livestock farms, which produce beef, pork, and poultry.
Demographics
As of the 2010 census, Mooresville had a population of 9,326 people. The racial makeup of the town was 94.3% White, 1.3% African American, 0.3% Native American, 0.7% Asian, 0.1% Pacific Islander, 1.2% from other races, and 2.3% from two or more races. Hispanic or Latino of any race were 3.2% of the population.
The median household income in Mooresville was $50,945, and the median family income was $60,945. The per capita income for the town was $25,945. About 8.3% of families and 10.2% of the population were below the poverty line, including 14.2% of those under age 18 and 6.2% of those age 65 or over.
History
Mooresville was founded in 1824 by Samuel Moore, who purchased the land from the federal government. The town was originally known as Moore’s Settlement, and was later renamed Mooresville. The town was incorporated in 1837, and the first post office was established in 1838.
The town grew slowly in the 19th century, and by the early 20th century, it had become a popular tourist destination. The town was home to a number of resorts, including the Mooresville Hotel, which was built in 1891. The town also had a number of other attractions, including a racetrack, a golf course, and a movie theater.
In the late 20th century, Mooresville began to experience a resurgence in popularity. The downtown area was listed on the National Register of Historic Places in 1978, and the town has since become a popular destination for tourists and locals alike. The town is home to a number of small businesses, including a winery, a brewery, and a distillery. The town is also home to a number of manufacturing companies, and is a popular destination for outdoor recreation.
Common Questions
What is Per Capita Income in Mooresville?
Per Capita income in Mooresville is $35,108.
What is the Median Family Income in Mooresville?
Median Family Income in Mooresville is $79,799.
What is the Median Household income in Mooresville?
Median Household Income in Mooresville is $68,089.
What is Income or Wage Gap in Mooresville?
Income or Wage Gap in Mooresville is 34.3%.
Women in Mooresville earn 65.7 cents for every dollar earned by a man.
What is Inequality or Gini Index in Mooresville?
Inequality or Gini Index in Mooresville is 0.42.
What is the Total Population of Mooresville?
Total Population of Mooresville is 9,525.
What is the Total Male Population of Mooresville?
Total Male Population of Mooresville is 4,822.
What is the Total Female Population of Mooresville?
Total Female Population of Mooresville is 4,703.
What is the Ratio of Males per 100 Females in Mooresville?
There are 102.53 Males per 100 Females in Mooresville.
What is the Ratio of Females per 100 Males in Mooresville?
There are 97.53 Females per 100 Males in Mooresville.
What is the Median Population Age in Mooresville?
Median Population Age in Mooresville is 42.6 Years.
What is the Average Family Size in Mooresville
Average Family Size in Mooresville is 2.9 People.
What is the Average Household Size in Mooresville
Average Household Size in Mooresville is 2.4 People.
How Large is the Labor Force in Mooresville?
There are 4,790 People in the Labor Forcein in Mooresville.
What is the Percentage of People in the Labor Force in Mooresville?
60.8% of People are in the Labor Force in Mooresville.
What is the Unemployment Rate in Mooresville?
Unemployment Rate in Mooresville is 1.7%.