Belding, MI Map & Demographics
Belding Map
Belding Overview
$23,720
PER CAPITA INCOME
$62,424
AVG FAMILY INCOME
$52,083
AVG HOUSEHOLD INCOME
27.8%
WAGE / INCOME GAP [ % ]
72.2¢/ $1
WAGE / INCOME GAP [ $ ]
$11,812
FAMILY INCOME DEFICIT
0.38
INEQUALITY / GINI INDEX
5,942
TOTAL POPULATION
2,933
MALE POPULATION
3,009
FEMALE POPULATION
97.47
MALES / 100 FEMALES
102.59
FEMALES / 100 MALES
36.8
MEDIAN AGE
3.3
AVG FAMILY SIZE
2.7
AVG HOUSEHOLD SIZE
2,914
LABOR FORCE [ PEOPLE ]
61.1%
PERCENT IN LABOR FORCE
8.0%
UNEMPLOYMENT RATE
Belding Zip Codes
Belding Area Codes
Income in Belding
Income Overview in Belding
Per Capita Income in Belding is $23,720, while median incomes of families and households are $62,424 and $52,083 respectively.
| Characteristic | Number | Measure |
| Per Capita Income | 5,942 | $23,720 |
| Median Family Income | 1,390 | $62,424 |
| Mean Family Income | 1,390 | $66,444 |
| Median Household Income | 2,148 | $52,083 |
| Mean Household Income | 2,148 | $58,097 |
| Income Deficit | 1,390 | $11,812 |
| Wage / Income Gap (%) | 5,942 | 27.78% |
| Wage / Income Gap ($) | 5,942 | 72.22¢ per $1 |
| Gini / Inequality Index | 5,942 | 0.38 |
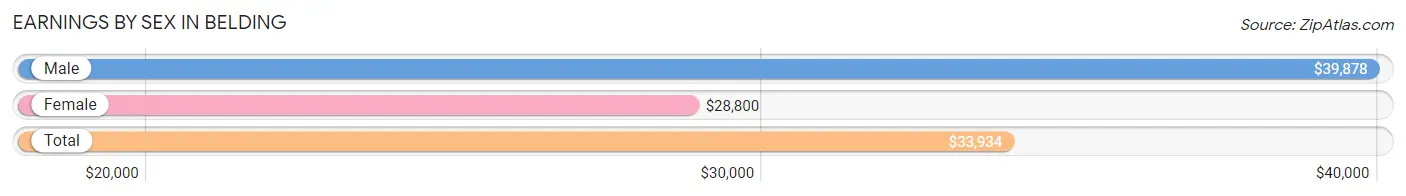
Earnings by Sex in Belding
Average Earnings in Belding are $33,934, $39,878 for men and $28,800 for women, a difference of 27.8%.
| Sex | Number | Average Earnings |
| Male | 1,704 (57.6%) | $39,878 |
| Female | 1,254 (42.4%) | $28,800 |
| Total | 2,958 (100.0%) | $33,934 |
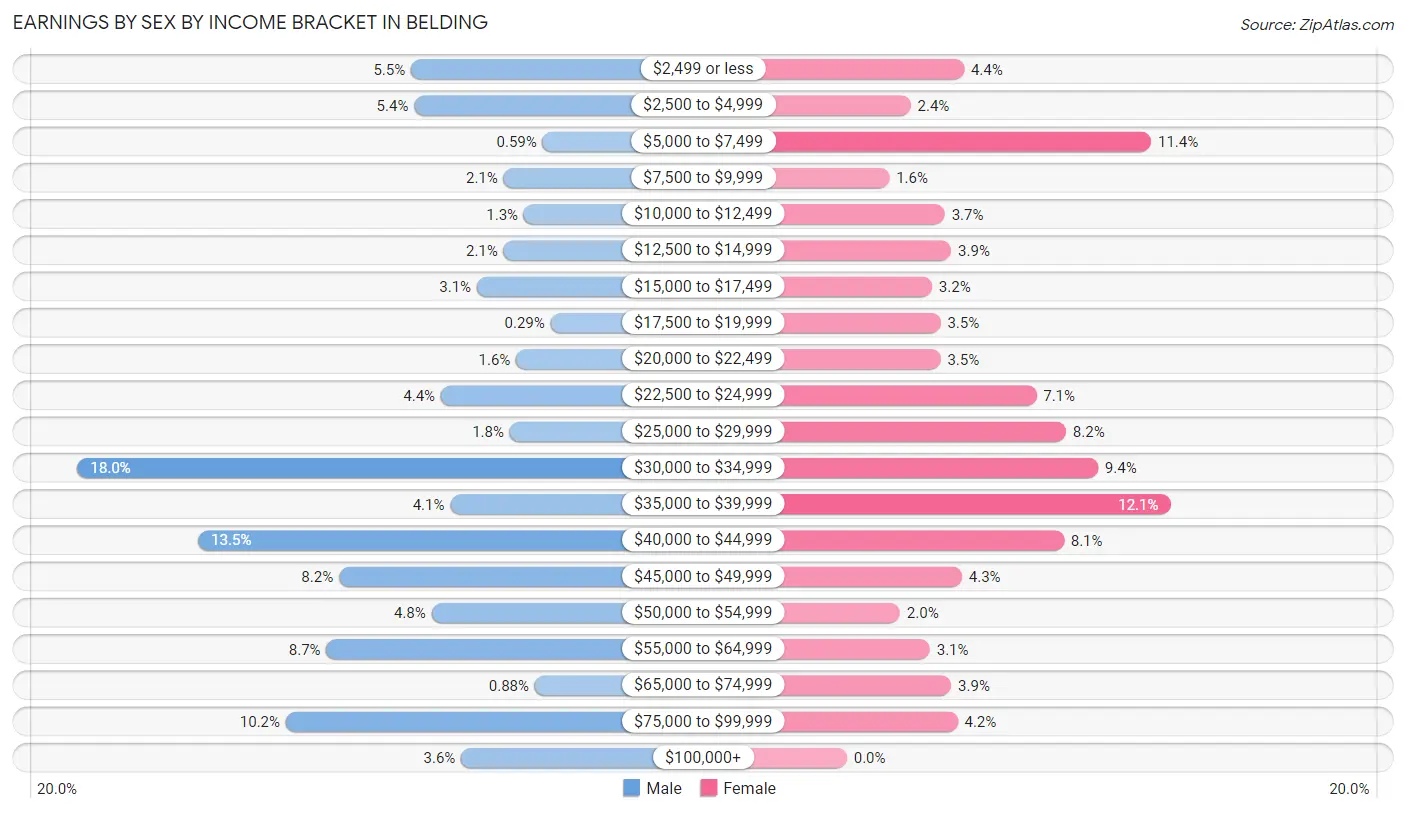
Earnings by Sex by Income Bracket in Belding
The most common earnings brackets in Belding are $30,000 to $34,999 for men (307 | 18.0%) and $35,000 to $39,999 for women (152 | 12.1%).
| Income | Male | Female |
| $2,499 or less | 94 (5.5%) | 55 (4.4%) |
| $2,500 to $4,999 | 92 (5.4%) | 30 (2.4%) |
| $5,000 to $7,499 | 10 (0.6%) | 143 (11.4%) |
| $7,500 to $9,999 | 35 (2.1%) | 20 (1.6%) |
| $10,000 to $12,499 | 22 (1.3%) | 46 (3.7%) |
| $12,500 to $14,999 | 35 (2.1%) | 49 (3.9%) |
| $15,000 to $17,499 | 52 (3.0%) | 40 (3.2%) |
| $17,500 to $19,999 | 5 (0.3%) | 44 (3.5%) |
| $20,000 to $22,499 | 27 (1.6%) | 44 (3.5%) |
| $22,500 to $24,999 | 75 (4.4%) | 89 (7.1%) |
| $25,000 to $29,999 | 31 (1.8%) | 103 (8.2%) |
| $30,000 to $34,999 | 307 (18.0%) | 118 (9.4%) |
| $35,000 to $39,999 | 69 (4.1%) | 152 (12.1%) |
| $40,000 to $44,999 | 230 (13.5%) | 102 (8.1%) |
| $45,000 to $49,999 | 140 (8.2%) | 54 (4.3%) |
| $50,000 to $54,999 | 81 (4.8%) | 25 (2.0%) |
| $55,000 to $64,999 | 148 (8.7%) | 39 (3.1%) |
| $65,000 to $74,999 | 15 (0.9%) | 49 (3.9%) |
| $75,000 to $99,999 | 174 (10.2%) | 52 (4.2%) |
| $100,000+ | 62 (3.6%) | 0 (0.0%) |
| Total | 1,704 (100.0%) | 1,254 (100.0%) |
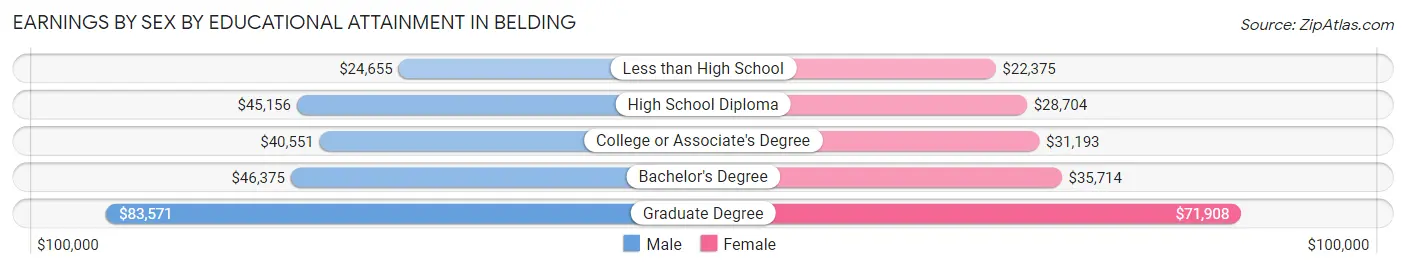
Earnings by Sex by Educational Attainment in Belding
Average earnings in Belding are $42,233 for men and $31,900 for women, a difference of 24.5%. Men with an educational attainment of graduate degree enjoy the highest average annual earnings of $83,571, while those with less than high school education earn the least with $24,655. Women with an educational attainment of graduate degree earn the most with the average annual earnings of $71,908, while those with less than high school education have the smallest earnings of $22,375.
| Educational Attainment | Male Income | Female Income |
| Less than High School | $24,655 | $22,375 |
| High School Diploma | $45,156 | $28,704 |
| College or Associate's Degree | $40,551 | $31,193 |
| Bachelor's Degree | $46,375 | $35,714 |
| Graduate Degree | $83,571 | $71,908 |
| Total | $42,233 | $31,900 |
Family Income in Belding
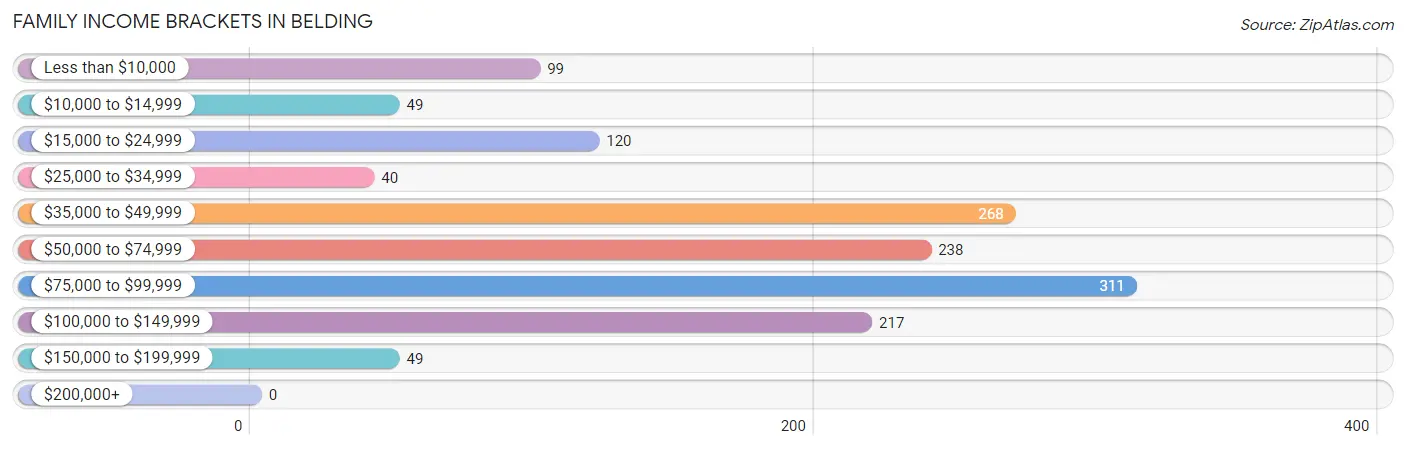
Family Income Brackets in Belding
According to the Belding family income data, there are 311 families falling into the $75,000 to $99,999 income range, which is the most common income bracket and makes up 22.4% of all families.
| Income Bracket | # Families | % Families |
| Less than $10,000 | 99 | 7.1% |
| $10,000 to $14,999 | 49 | 3.5% |
| $15,000 to $24,999 | 120 | 8.6% |
| $25,000 to $34,999 | 40 | 2.9% |
| $35,000 to $49,999 | 268 | 19.3% |
| $50,000 to $74,999 | 238 | 17.1% |
| $75,000 to $99,999 | 311 | 22.4% |
| $100,000 to $149,999 | 217 | 15.6% |
| $150,000 to $199,999 | 49 | 3.5% |
| $200,000+ | 0 | 0.0% |
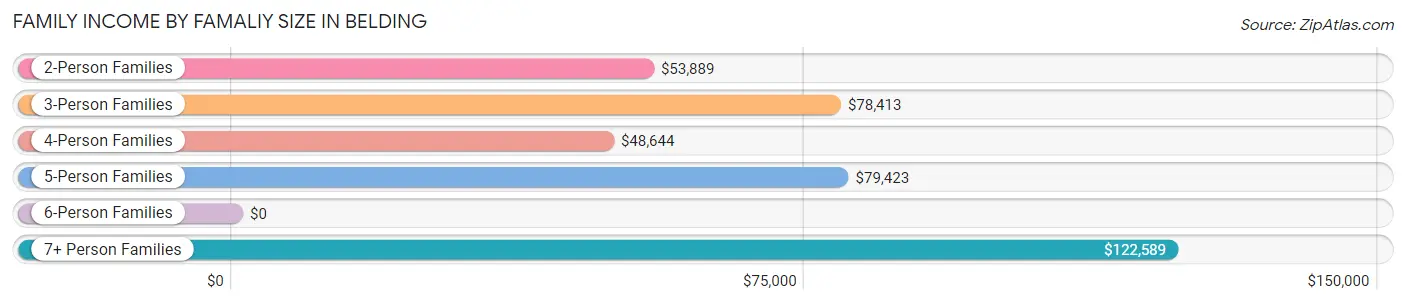
Family Income by Famaliy Size in Belding
7+ person families (39 | 2.8%) account for the highest median family income in Belding with $122,589 per family, while 2-person families (642 | 46.2%) have the highest median income of $26,944 per family member.
| Income Bracket | # Families | Median Income |
| 2-Person Families | 642 (46.2%) | $53,889 |
| 3-Person Families | 381 (27.4%) | $78,413 |
| 4-Person Families | 211 (15.2%) | $48,644 |
| 5-Person Families | 108 (7.8%) | $79,423 |
| 6-Person Families | 9 (0.6%) | $0 |
| 7+ Person Families | 39 (2.8%) | $122,589 |
| Total | 1,390 (100.0%) | $62,424 |
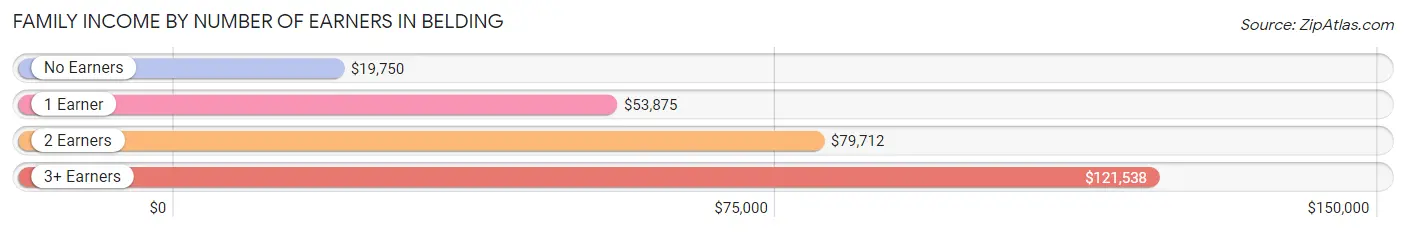
Family Income by Number of Earners in Belding
The median family income in Belding is $62,424, with families comprising 3+ earners (100) having the highest median family income of $121,538, while families with no earners (258) have the lowest median family income of $19,750, accounting for 7.2% and 18.6% of families, respectively.
| Number of Earners | # Families | Median Income |
| No Earners | 258 (18.6%) | $19,750 |
| 1 Earner | 447 (32.2%) | $53,875 |
| 2 Earners | 585 (42.1%) | $79,712 |
| 3+ Earners | 100 (7.2%) | $121,538 |
| Total | 1,390 (100.0%) | $62,424 |
Household Income in Belding
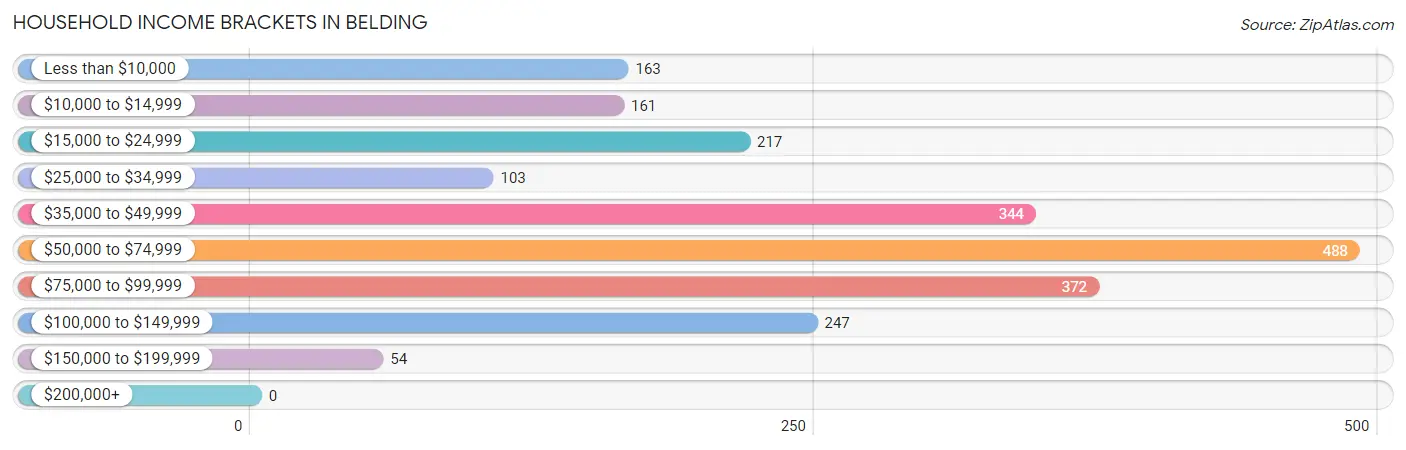
Household Income Brackets in Belding
With 488 households falling in the category, the $50,000 to $74,999 income range is the most frequent in Belding, accounting for 22.7% of all households.
| Income Bracket | # Households | % Households |
| Less than $10,000 | 163 | 7.6% |
| $10,000 to $14,999 | 161 | 7.5% |
| $15,000 to $24,999 | 217 | 10.1% |
| $25,000 to $34,999 | 103 | 4.8% |
| $35,000 to $49,999 | 344 | 16.0% |
| $50,000 to $74,999 | 488 | 22.7% |
| $75,000 to $99,999 | 372 | 17.3% |
| $100,000 to $149,999 | 247 | 11.5% |
| $150,000 to $199,999 | 54 | 2.5% |
| $200,000+ | 0 | 0.0% |
Household Income by Householder Age in Belding
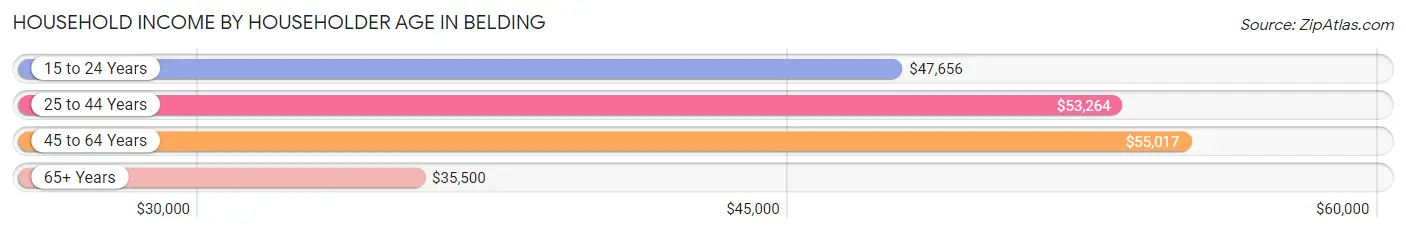
The median household income in Belding is $52,083, with the highest median household income of $55,017 found in the 45 to 64 years age bracket for the primary householder. A total of 785 households (36.5%) fall into this category. Meanwhile, the 65+ years age bracket for the primary householder has the lowest median household income of $35,500, with 548 households (25.5%) in this group.
| Income Bracket | # Households | Median Income |
| 15 to 24 Years | 100 (4.7%) | $47,656 |
| 25 to 44 Years | 715 (33.3%) | $53,264 |
| 45 to 64 Years | 785 (36.5%) | $55,017 |
| 65+ Years | 548 (25.5%) | $35,500 |
| Total | 2,148 (100.0%) | $52,083 |
Poverty in Belding
Income Below Poverty by Sex and Age in Belding
With 12.5% poverty level for males and 24.5% for females among the residents of Belding, 15 year old males and 75 year old and over females are the most vulnerable to poverty, with 26 males (61.9%) and 101 females (43.7%) in their respective age groups living below the poverty level.
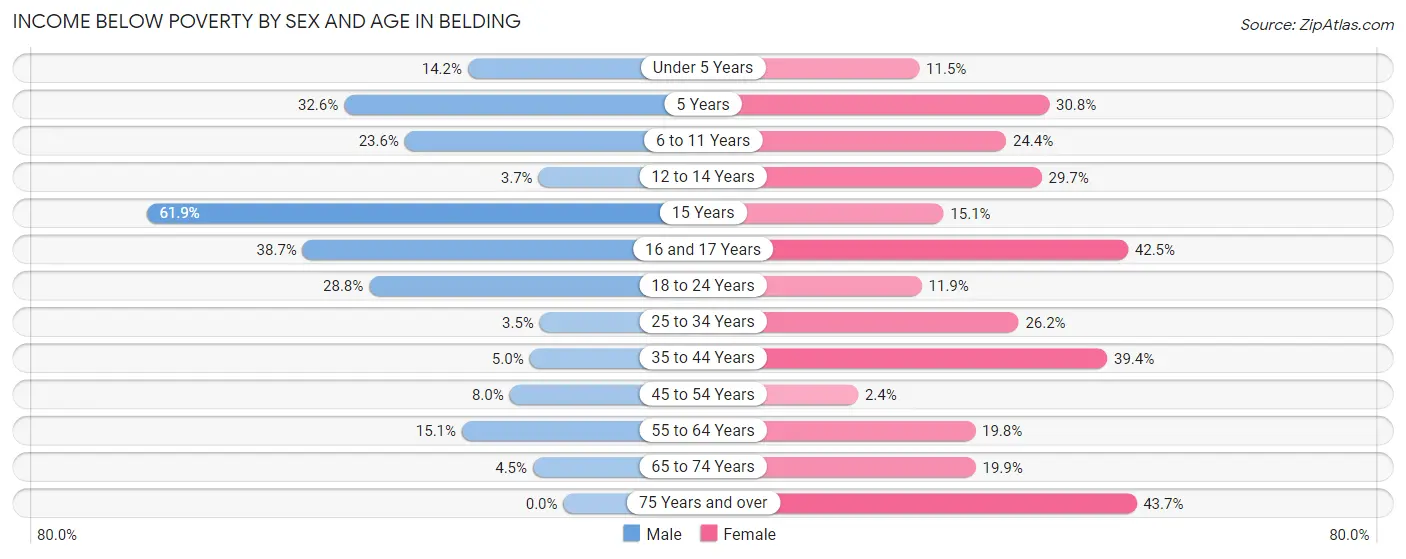
| Age Bracket | Male | Female |
| Under 5 Years | 22 (14.2%) | 17 (11.5%) |
| 5 Years | 14 (32.6%) | 8 (30.8%) |
| 6 to 11 Years | 49 (23.6%) | 60 (24.4%) |
| 12 to 14 Years | 4 (3.7%) | 27 (29.7%) |
| 15 Years | 26 (61.9%) | 8 (15.1%) |
| 16 and 17 Years | 36 (38.7%) | 48 (42.5%) |
| 18 to 24 Years | 77 (28.8%) | 25 (11.8%) |
| 25 to 34 Years | 15 (3.5%) | 107 (26.2%) |
| 35 to 44 Years | 25 (5.0%) | 180 (39.4%) |
| 45 to 54 Years | 31 (8.0%) | 7 (2.4%) |
| 55 to 64 Years | 44 (15.1%) | 77 (19.8%) |
| 65 to 74 Years | 11 (4.5%) | 57 (19.9%) |
| 75 Years and over | 0 (0.0%) | 101 (43.7%) |
| Total | 354 (12.5%) | 722 (24.5%) |
Income Above Poverty by Sex and Age in Belding
According to the poverty statistics in Belding, males aged 75 years and over and females aged 45 to 54 years are the age groups that are most secure financially, with 100.0% of males and 97.6% of females in these age groups living above the poverty line.
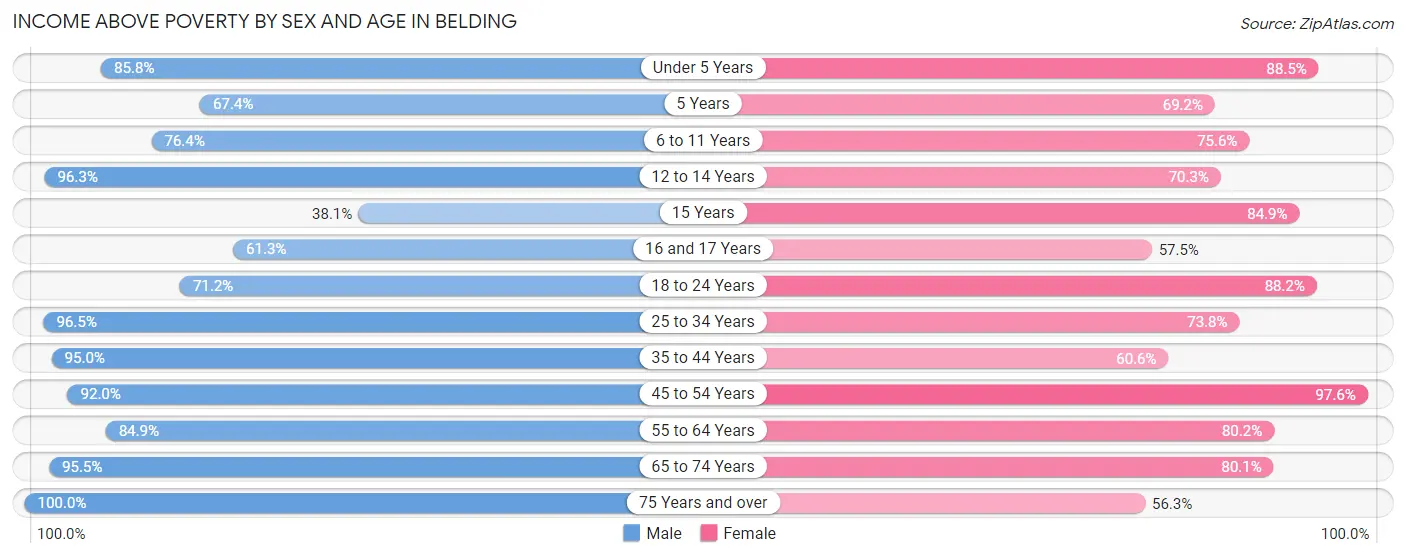
| Age Bracket | Male | Female |
| Under 5 Years | 133 (85.8%) | 131 (88.5%) |
| 5 Years | 29 (67.4%) | 18 (69.2%) |
| 6 to 11 Years | 159 (76.4%) | 186 (75.6%) |
| 12 to 14 Years | 104 (96.3%) | 64 (70.3%) |
| 15 Years | 16 (38.1%) | 45 (84.9%) |
| 16 and 17 Years | 57 (61.3%) | 65 (57.5%) |
| 18 to 24 Years | 190 (71.2%) | 186 (88.1%) |
| 25 to 34 Years | 412 (96.5%) | 301 (73.8%) |
| 35 to 44 Years | 472 (95.0%) | 277 (60.6%) |
| 45 to 54 Years | 357 (92.0%) | 285 (97.6%) |
| 55 to 64 Years | 248 (84.9%) | 312 (80.2%) |
| 65 to 74 Years | 232 (95.5%) | 230 (80.1%) |
| 75 Years and over | 72 (100.0%) | 130 (56.3%) |
| Total | 2,481 (87.5%) | 2,230 (75.5%) |
Income Below Poverty Among Married-Couple Families in Belding
The poverty statistics for married-couple families in Belding show that 1.6% or 15 of the total 936 families live below the poverty line. Families with 3 or 4 children have the highest poverty rate of 8.7%, comprising of 4 families. On the other hand, families with 1 or 2 children have the lowest poverty rate of 0.0%, which includes 0 families.
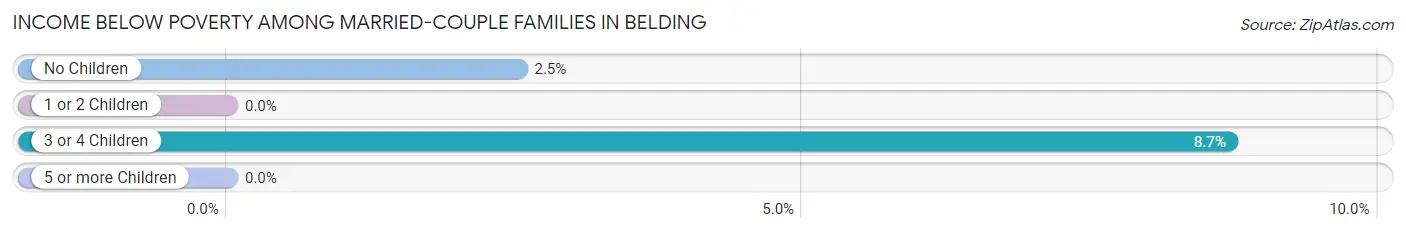
| Children | Above Poverty | Below Poverty |
| No Children | 426 (97.5%) | 11 (2.5%) |
| 1 or 2 Children | 433 (100.0%) | 0 (0.0%) |
| 3 or 4 Children | 42 (91.3%) | 4 (8.7%) |
| 5 or more Children | 20 (100.0%) | 0 (0.0%) |
| Total | 921 (98.4%) | 15 (1.6%) |
Income Below Poverty Among Single-Parent Households in Belding
According to the poverty data in Belding, 32.4% or 46 single-father households and 49.0% or 153 single-mother households are living below the poverty line. Among single-father households, those with 3 or 4 children have the highest poverty rate, with 9 households (60.0%) experiencing poverty. Likewise, among single-mother households, those with 3 or 4 children have the highest poverty rate, with 50 households (87.7%) falling below the poverty line.
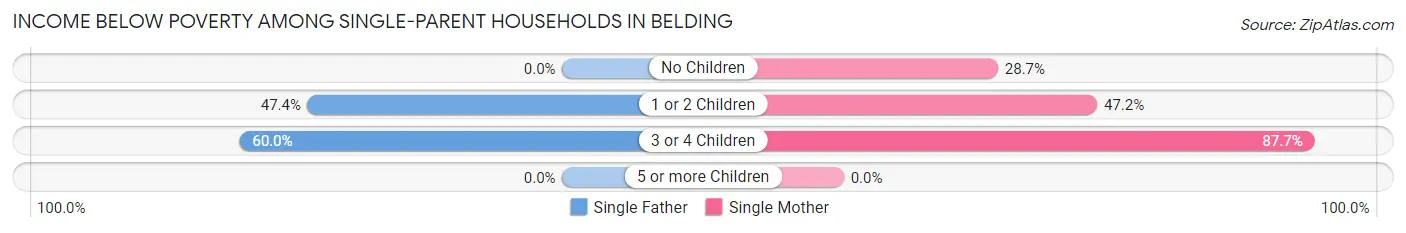
| Children | Single Father | Single Mother |
| No Children | 0 (0.0%) | 27 (28.7%) |
| 1 or 2 Children | 37 (47.4%) | 76 (47.2%) |
| 3 or 4 Children | 9 (60.0%) | 50 (87.7%) |
| 5 or more Children | 0 (0.0%) | 0 (0.0%) |
| Total | 46 (32.4%) | 153 (49.0%) |
Income Below Poverty Among Married-Couple vs Single-Parent Households in Belding
The poverty data for Belding shows that 15 of the married-couple family households (1.6%) and 199 of the single-parent households (43.8%) are living below the poverty level. Within the married-couple family households, those with 3 or 4 children have the highest poverty rate, with 4 households (8.7%) falling below the poverty line. Among the single-parent households, those with 3 or 4 children have the highest poverty rate, with 59 household (81.9%) living below poverty.
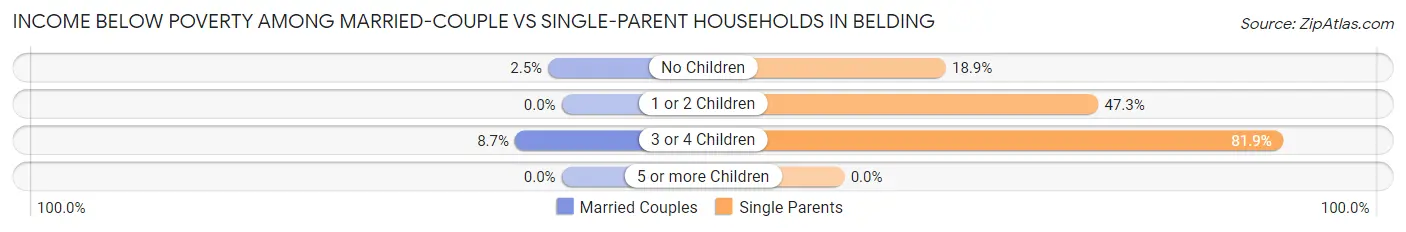
| Children | Married-Couple Families | Single-Parent Households |
| No Children | 11 (2.5%) | 27 (18.9%) |
| 1 or 2 Children | 0 (0.0%) | 113 (47.3%) |
| 3 or 4 Children | 4 (8.7%) | 59 (81.9%) |
| 5 or more Children | 0 (0.0%) | 0 (0.0%) |
| Total | 15 (1.6%) | 199 (43.8%) |
Race in Belding
The most populous races in Belding are White / Caucasian (5,260 | 88.5%), Two or more Races (428 | 7.2%), and Hispanic or Latino (291 | 4.9%).
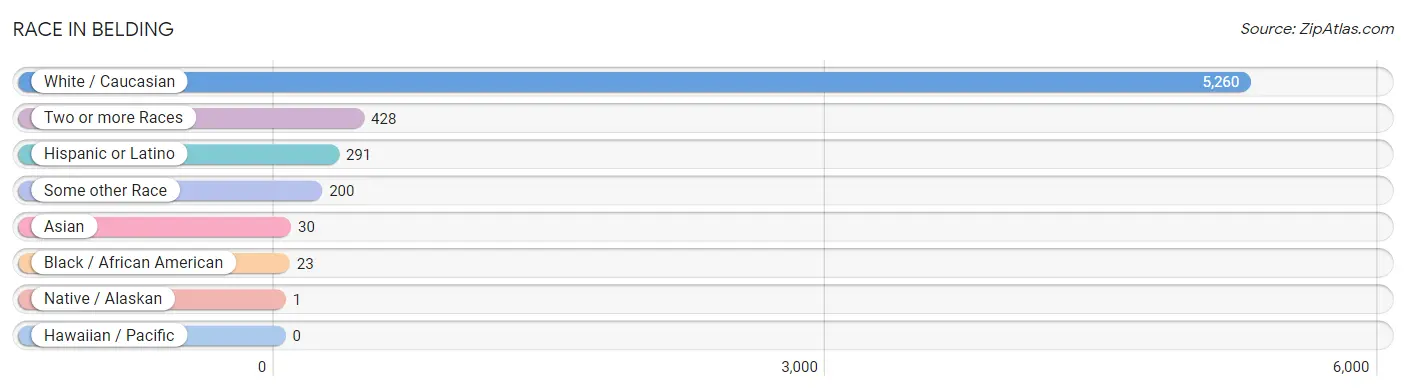
| Race | # Population | % Population |
| Asian | 30 | 0.5% |
| Black / African American | 23 | 0.4% |
| Hawaiian / Pacific | 0 | 0.0% |
| Hispanic or Latino | 291 | 4.9% |
| Native / Alaskan | 1 | 0.0% |
| White / Caucasian | 5,260 | 88.5% |
| Two or more Races | 428 | 7.2% |
| Some other Race | 200 | 3.4% |
| Total | 5,942 | 100.0% |
Ancestry in Belding
The most populous ancestries reported in Belding are German (1,793 | 30.2%), Irish (837 | 14.1%), English (751 | 12.6%), Dutch (382 | 6.4%), and American (376 | 6.3%), together accounting for 69.7% of all Belding residents.
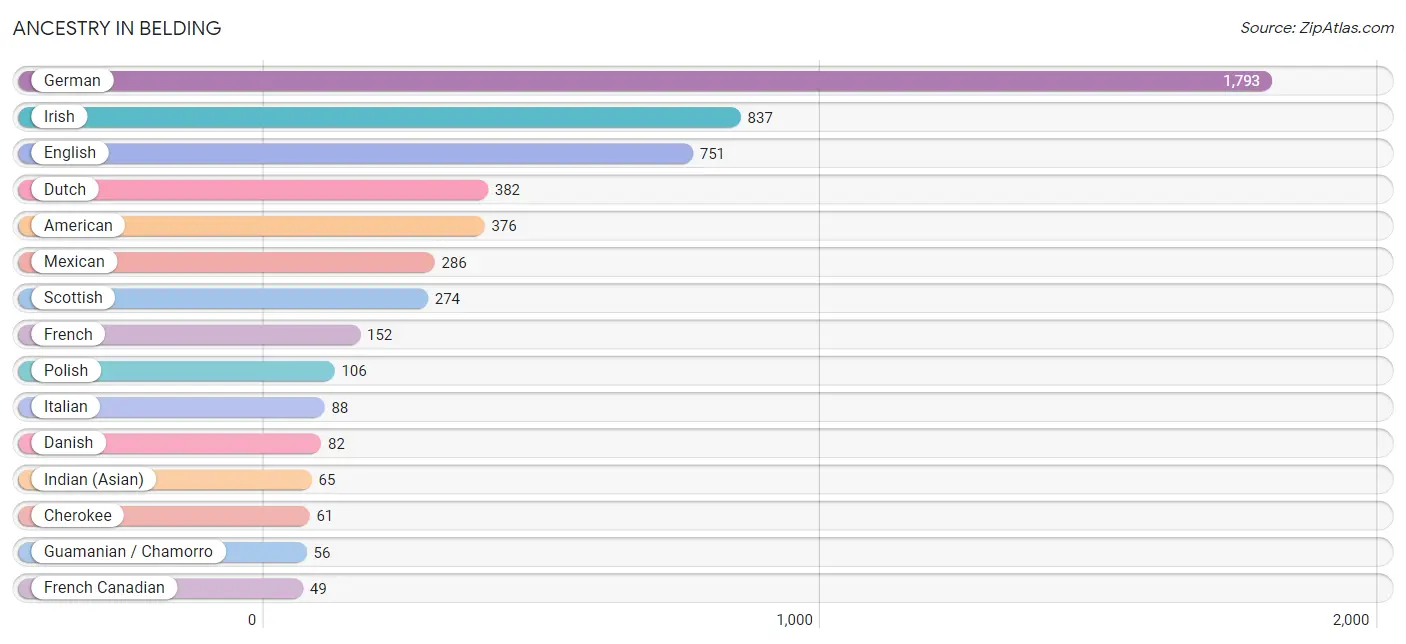
| Ancestry | # Population | % Population |
| American | 376 | 6.3% |
| Arab | 9 | 0.2% |
| Armenian | 12 | 0.2% |
| British | 6 | 0.1% |
| Celtic | 8 | 0.1% |
| Cherokee | 61 | 1.0% |
| Chippewa | 10 | 0.2% |
| Czech | 11 | 0.2% |
| Danish | 82 | 1.4% |
| Dutch | 382 | 6.4% |
| Eastern European | 20 | 0.3% |
| English | 751 | 12.6% |
| European | 13 | 0.2% |
| Finnish | 20 | 0.3% |
| French | 152 | 2.6% |
| French Canadian | 49 | 0.8% |
| German | 1,793 | 30.2% |
| Guamanian / Chamorro | 56 | 0.9% |
| Hungarian | 18 | 0.3% |
| Indian (Asian) | 65 | 1.1% |
| Irish | 837 | 14.1% |
| Italian | 88 | 1.5% |
| Korean | 33 | 0.6% |
| Lebanese | 9 | 0.2% |
| Lithuanian | 37 | 0.6% |
| Mexican | 286 | 4.8% |
| Norwegian | 13 | 0.2% |
| Ottawa | 24 | 0.4% |
| Polish | 106 | 1.8% |
| Puerto Rican | 4 | 0.1% |
| Russian | 45 | 0.8% |
| Scandinavian | 8 | 0.1% |
| Scotch-Irish | 23 | 0.4% |
| Scottish | 274 | 4.6% |
| Swedish | 42 | 0.7% |
| Welsh | 26 | 0.4% | View All 36 Rows |
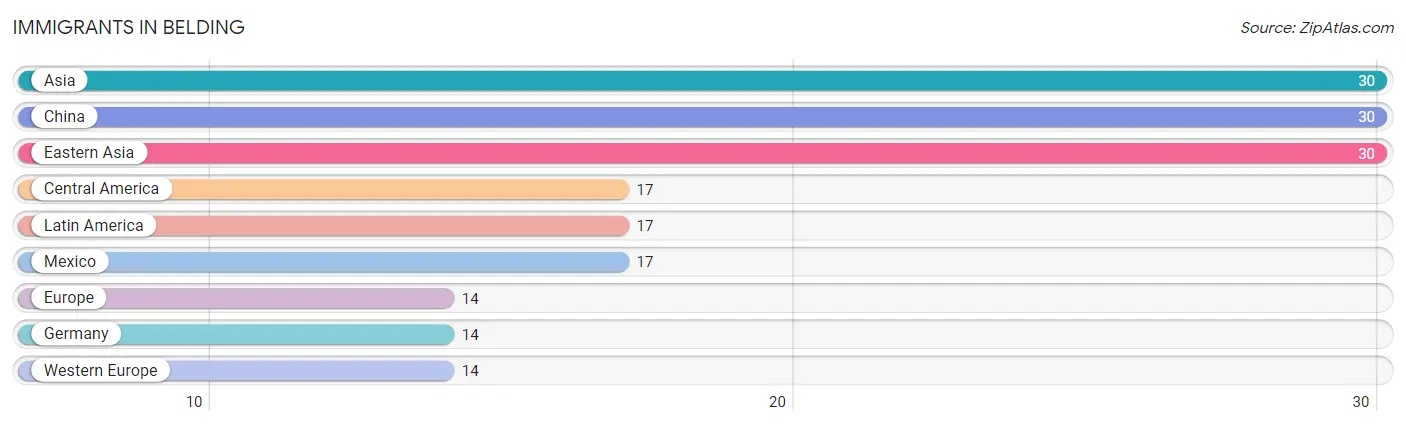
Immigrants in Belding
The most numerous immigrant groups reported in Belding came from Asia (30 | 0.5%), China (30 | 0.5%), Eastern Asia (30 | 0.5%), Central America (17 | 0.3%), and Latin America (17 | 0.3%), together accounting for 2.1% of all Belding residents.
| Immigration Origin | # Population | % Population |
| Asia | 30 | 0.5% |
| Central America | 17 | 0.3% |
| China | 30 | 0.5% |
| Eastern Asia | 30 | 0.5% |
| Europe | 14 | 0.2% |
| Germany | 14 | 0.2% |
| Latin America | 17 | 0.3% |
| Mexico | 17 | 0.3% |
| Western Europe | 14 | 0.2% | View All 9 Rows |
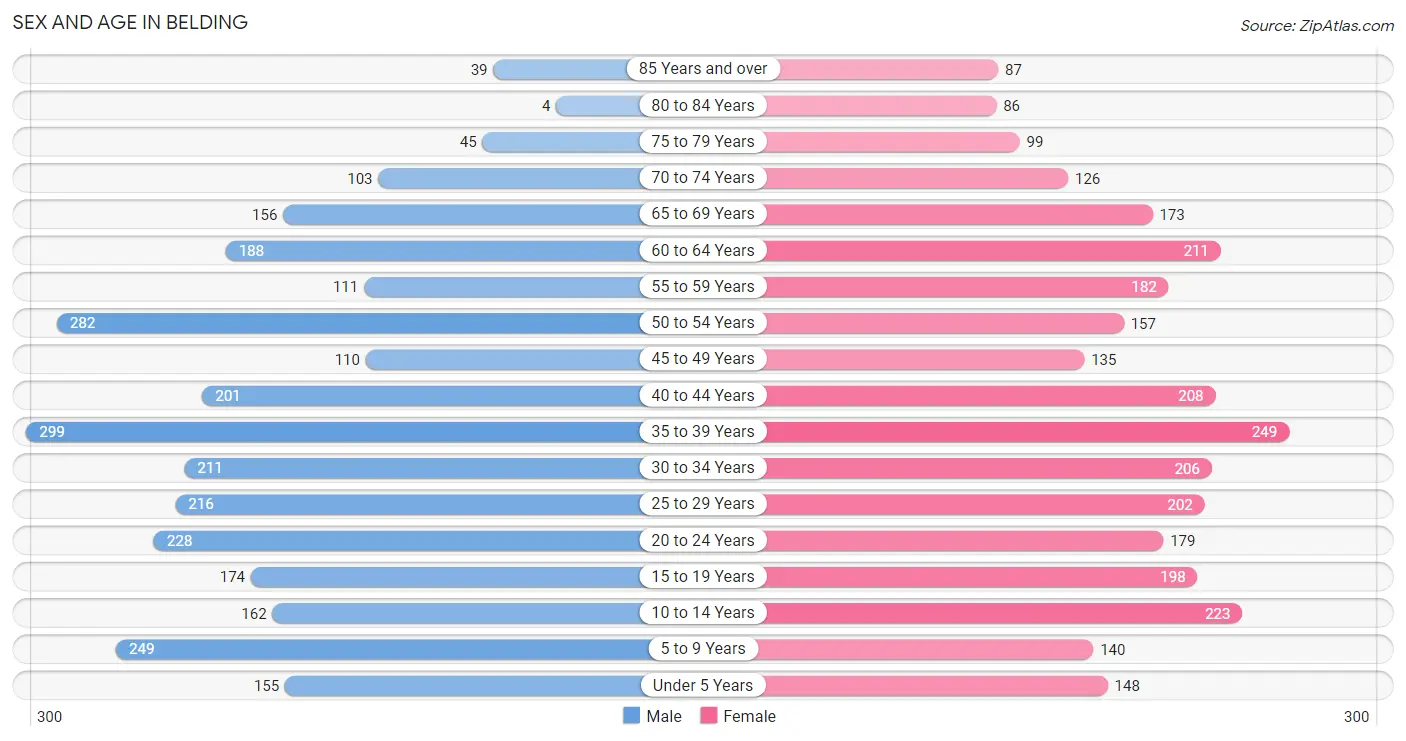
Sex and Age in Belding
Sex and Age in Belding
The most populous age groups in Belding are 35 to 39 Years (299 | 10.2%) for men and 35 to 39 Years (249 | 8.3%) for women.
| Age Bracket | Male | Female |
| Under 5 Years | 155 (5.3%) | 148 (4.9%) |
| 5 to 9 Years | 249 (8.5%) | 140 (4.6%) |
| 10 to 14 Years | 162 (5.5%) | 223 (7.4%) |
| 15 to 19 Years | 174 (5.9%) | 198 (6.6%) |
| 20 to 24 Years | 228 (7.8%) | 179 (5.9%) |
| 25 to 29 Years | 216 (7.4%) | 202 (6.7%) |
| 30 to 34 Years | 211 (7.2%) | 206 (6.9%) |
| 35 to 39 Years | 299 (10.2%) | 249 (8.3%) |
| 40 to 44 Years | 201 (6.9%) | 208 (6.9%) |
| 45 to 49 Years | 110 (3.7%) | 135 (4.5%) |
| 50 to 54 Years | 282 (9.6%) | 157 (5.2%) |
| 55 to 59 Years | 111 (3.8%) | 182 (6.0%) |
| 60 to 64 Years | 188 (6.4%) | 211 (7.0%) |
| 65 to 69 Years | 156 (5.3%) | 173 (5.8%) |
| 70 to 74 Years | 103 (3.5%) | 126 (4.2%) |
| 75 to 79 Years | 45 (1.5%) | 99 (3.3%) |
| 80 to 84 Years | 4 (0.1%) | 86 (2.9%) |
| 85 Years and over | 39 (1.3%) | 87 (2.9%) |
| Total | 2,933 (100.0%) | 3,009 (100.0%) |
Families and Households in Belding
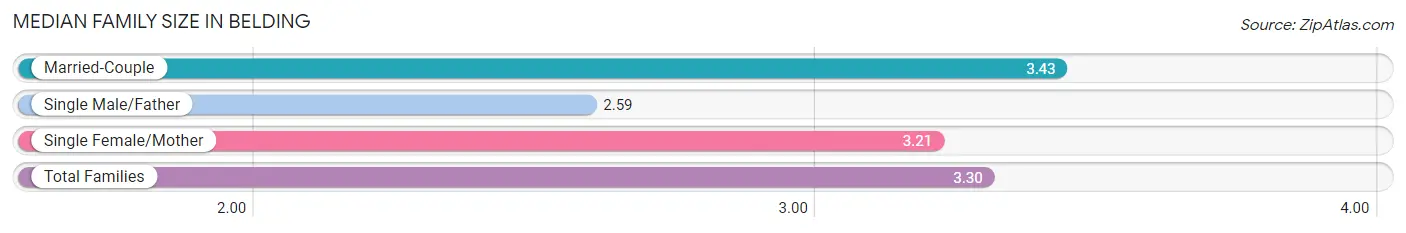
Median Family Size in Belding
The median family size in Belding is 3.30 persons per family, with married-couple families (936 | 67.3%) accounting for the largest median family size of 3.43 persons per family. On the other hand, single male/father families (142 | 10.2%) represent the smallest median family size with 2.59 persons per family.
| Family Type | # Families | Family Size |
| Married-Couple | 936 (67.3%) | 3.43 |
| Single Male/Father | 142 (10.2%) | 2.59 |
| Single Female/Mother | 312 (22.5%) | 3.21 |
| Total Families | 1,390 (100.0%) | 3.30 |
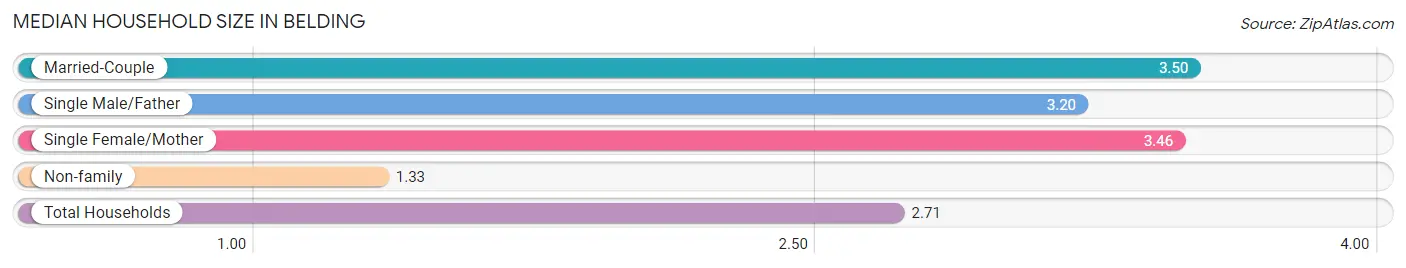
Median Household Size in Belding
The median household size in Belding is 2.71 persons per household, with married-couple households (936 | 43.6%) accounting for the largest median household size of 3.5 persons per household. non-family households (758 | 35.3%) represent the smallest median household size with 1.33 persons per household.
| Household Type | # Households | Household Size |
| Married-Couple | 936 (43.6%) | 3.50 |
| Single Male/Father | 142 (6.6%) | 3.20 |
| Single Female/Mother | 312 (14.5%) | 3.46 |
| Non-family | 758 (35.3%) | 1.33 |
| Total Households | 2,148 (100.0%) | 2.71 |
Household Size by Marriage Status in Belding
Out of a total of 2,148 households in Belding, 1,390 (64.7%) are family households, while 758 (35.3%) are nonfamily households. The most numerous type of family households are 2-person households, comprising 555, and the most common type of nonfamily households are 1-person households, comprising 617.
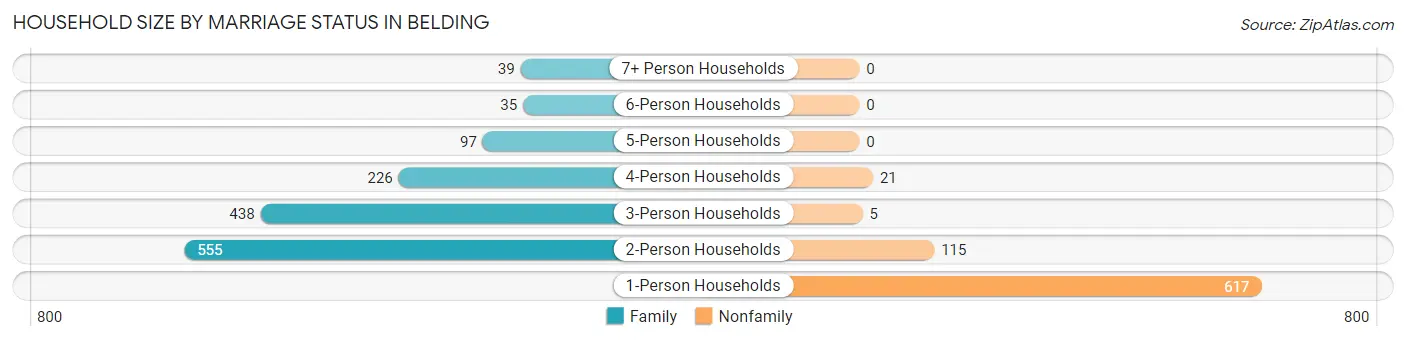
| Household Size | Family Households | Nonfamily Households |
| 1-Person Households | - | 617 (28.7%) |
| 2-Person Households | 555 (25.8%) | 115 (5.3%) |
| 3-Person Households | 438 (20.4%) | 5 (0.2%) |
| 4-Person Households | 226 (10.5%) | 21 (1.0%) |
| 5-Person Households | 97 (4.5%) | 0 (0.0%) |
| 6-Person Households | 35 (1.6%) | 0 (0.0%) |
| 7+ Person Households | 39 (1.8%) | 0 (0.0%) |
| Total | 1,390 (64.7%) | 758 (35.3%) |
Female Fertility in Belding
Fertility by Age in Belding
Average fertility rate in Belding is 64.0 births per 1,000 women. Women in the age bracket of 20 to 34 years have the highest fertility rate with 152.0 births per 1,000 women. Women in the age bracket of 20 to 34 years acount for 100.0% of all women with births.
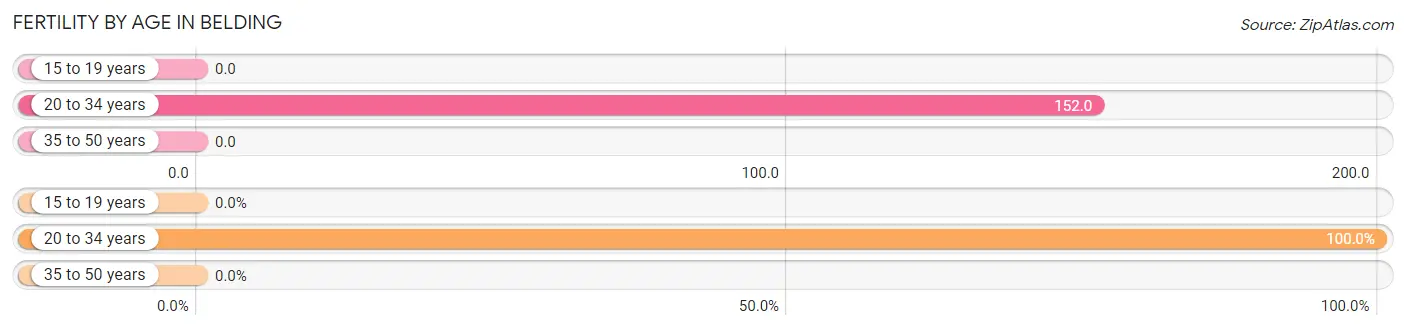
| Age Bracket | Women with Births | Births / 1,000 Women |
| 15 to 19 years | 0 (0.0%) | 0.0 |
| 20 to 34 years | 89 (100.0%) | 152.0 |
| 35 to 50 years | 0 (0.0%) | 0.0 |
| Total | 89 (100.0%) | 64.0 |
Fertility by Age by Marriage Status in Belding
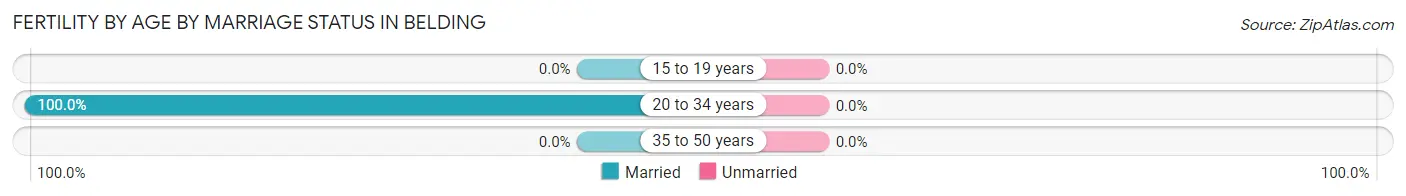
| Age Bracket | Married | Unmarried |
| 15 to 19 years | 0 (0.0%) | 0 (0.0%) |
| 20 to 34 years | 89 (100.0%) | 0 (0.0%) |
| 35 to 50 years | 0 (0.0%) | 0 (0.0%) |
| Total | 89 (100.0%) | 0 (0.0%) |
Fertility by Education in Belding
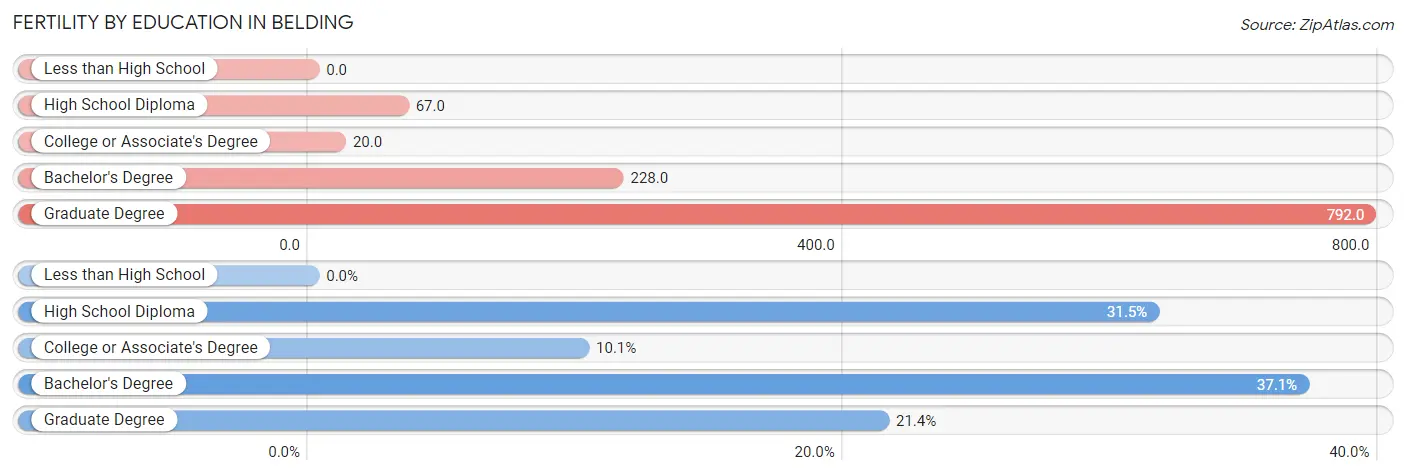
| Educational Attainment | Women with Births | Births / 1,000 Women |
| Less than High School | 0 (0.0%) | 0.0 |
| High School Diploma | 28 (31.5%) | 67.0 |
| College or Associate's Degree | 9 (10.1%) | 20.0 |
| Bachelor's Degree | 33 (37.1%) | 228.0 |
| Graduate Degree | 19 (21.3%) | 792.0 |
| Total | 89 (100.0%) | 64.0 |
Fertility by Education by Marriage Status in Belding
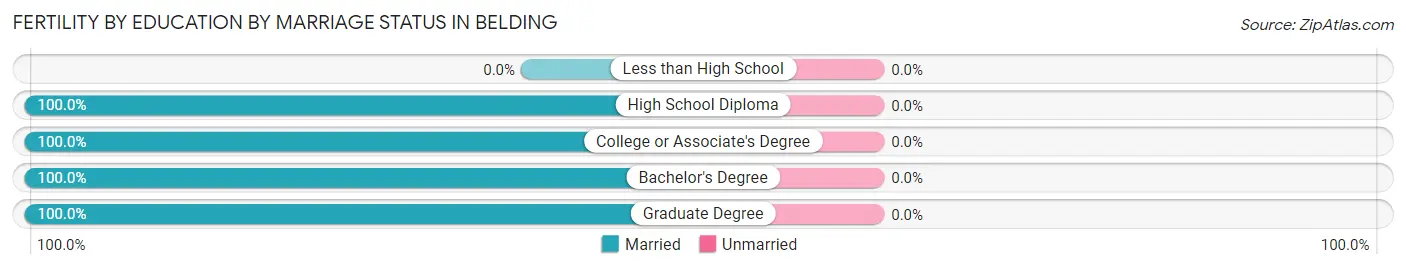
| Educational Attainment | Married | Unmarried |
| Less than High School | 0 (0.0%) | 0 (0.0%) |
| High School Diploma | 28 (100.0%) | 0 (0.0%) |
| College or Associate's Degree | 9 (100.0%) | 0 (0.0%) |
| Bachelor's Degree | 33 (100.0%) | 0 (0.0%) |
| Graduate Degree | 19 (100.0%) | 0 (0.0%) |
| Total | 89 (100.0%) | 0 (0.0%) |
Employment Characteristics in Belding
Employment by Class of Employer in Belding
Among the 2,575 employed individuals in Belding, private company employees (2,034 | 79.0%), not-for-profit organizations (191 | 7.4%), and local government employees (162 | 6.3%) make up the most common classes of employment.
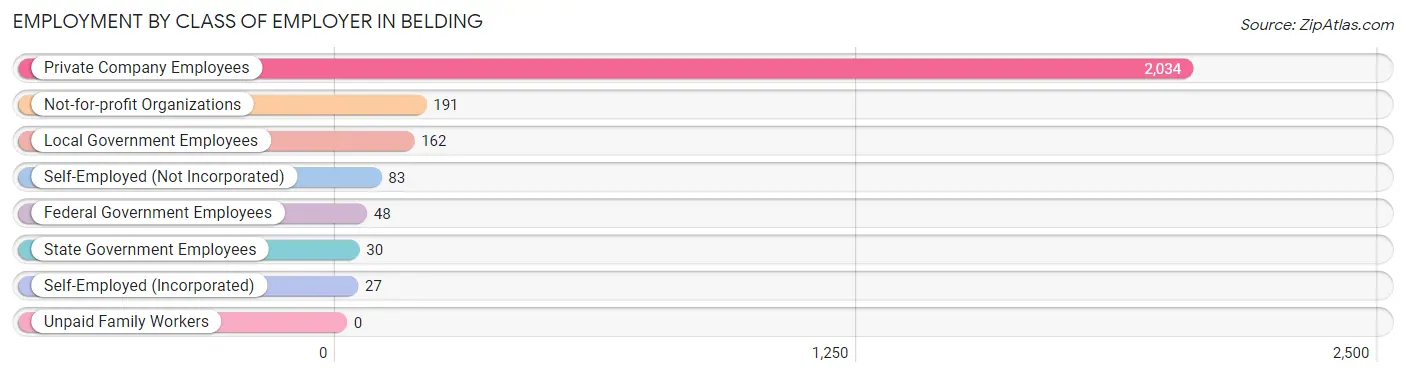
| Employer Class | # Employees | % Employees |
| Private Company Employees | 2,034 | 79.0% |
| Self-Employed (Incorporated) | 27 | 1.1% |
| Self-Employed (Not Incorporated) | 83 | 3.2% |
| Not-for-profit Organizations | 191 | 7.4% |
| Local Government Employees | 162 | 6.3% |
| State Government Employees | 30 | 1.2% |
| Federal Government Employees | 48 | 1.9% |
| Unpaid Family Workers | 0 | 0.0% |
| Total | 2,575 | 100.0% |
Employment Status by Age in Belding
According to the labor force statistics for Belding, out of the total population over 16 years of age (4,770), 61.1% or 2,914 individuals are in the labor force, with 8.0% or 233 of them unemployed. The age group with the highest labor force participation rate is 30 to 34 years, with 94.0% or 392 individuals in the labor force. Within the labor force, the 30 to 34 years age range has the highest percentage of unemployed individuals, with 14.9% or 58 of them being unemployed.
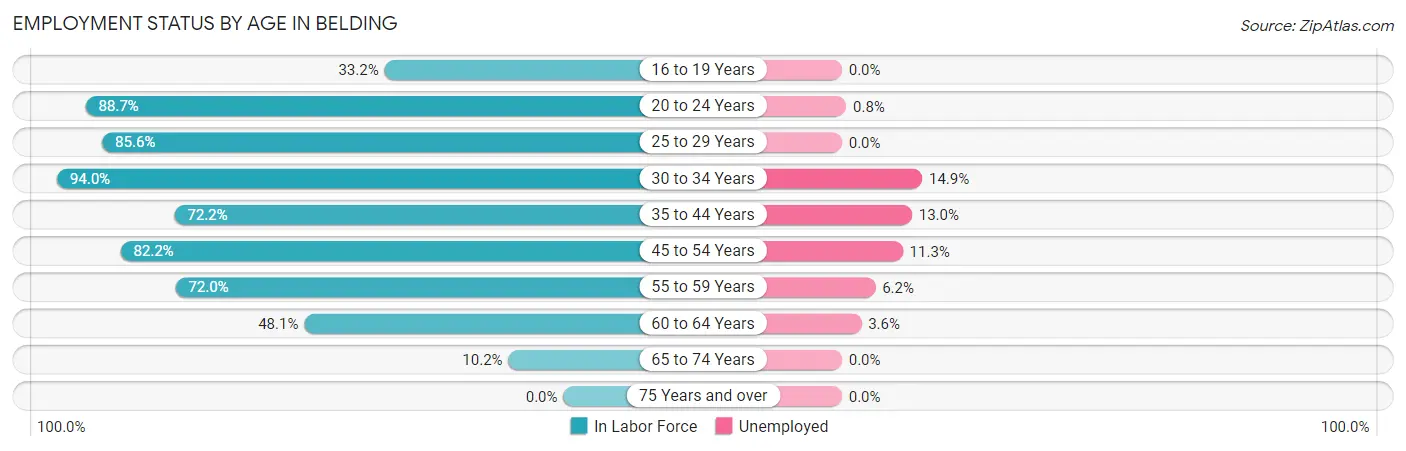
| Age Bracket | In Labor Force | Unemployed |
| 16 to 19 Years | 92 (33.2%) | 0 (0.0%) |
| 20 to 24 Years | 361 (88.7%) | 3 (0.8%) |
| 25 to 29 Years | 358 (85.6%) | 0 (0.0%) |
| 30 to 34 Years | 392 (94.0%) | 58 (14.9%) |
| 35 to 44 Years | 691 (72.2%) | 90 (13.0%) |
| 45 to 54 Years | 562 (82.2%) | 64 (11.3%) |
| 55 to 59 Years | 211 (72.0%) | 13 (6.2%) |
| 60 to 64 Years | 192 (48.1%) | 7 (3.6%) |
| 65 to 74 Years | 57 (10.2%) | 0 (0.0%) |
| 75 Years and over | 0 (0.0%) | 0 (0.0%) |
| Total | 2,914 (61.1%) | 233 (8.0%) |
Employment Status by Educational Attainment in Belding
According to labor force statistics for Belding, 75.9% of individuals (2,405) out of the total population between 25 and 64 years of age (3,168) are in the labor force, with 9.6% or 231 of them being unemployed. The group with the highest labor force participation rate are those with the educational attainment of bachelor's degree or higher, with 85.7% or 390 individuals in the labor force. Within the labor force, individuals with less than high school education have the highest percentage of unemployment, with 22.9% or 38 of them being unemployed.
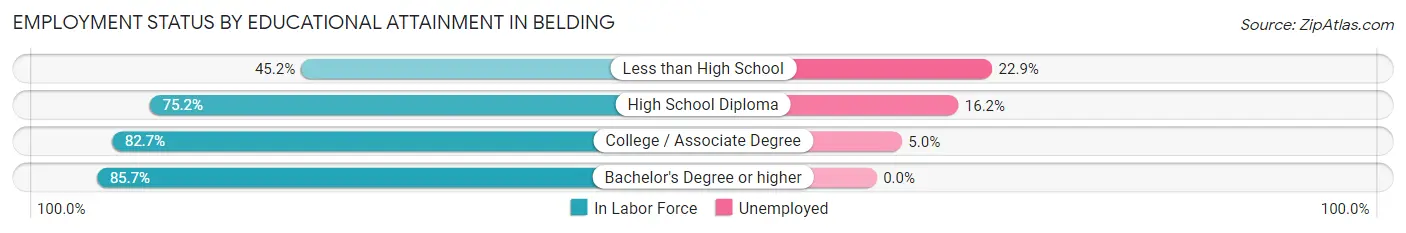
| Educational Attainment | In Labor Force | Unemployed |
| Less than High School | 166 (45.2%) | 84 (22.9%) |
| High School Diploma | 902 (75.2%) | 194 (16.2%) |
| College / Associate Degree | 949 (82.7%) | 57 (5.0%) |
| Bachelor's Degree or higher | 390 (85.7%) | 0 (0.0%) |
| Total | 2,405 (75.9%) | 304 (9.6%) |
Employment Occupations by Sex in Belding
Management, Business, Science and Arts Occupations
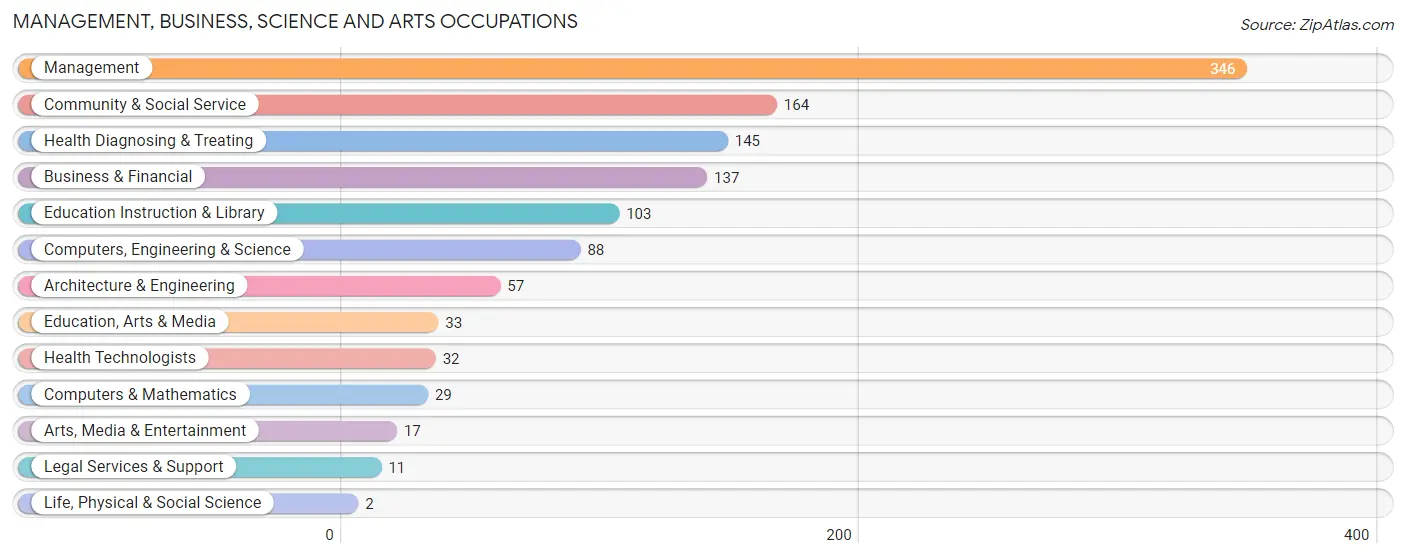
The most common Management, Business, Science and Arts occupations in Belding are Management (346 | 13.0%), Community & Social Service (164 | 6.2%), Health Diagnosing & Treating (145 | 5.5%), Business & Financial (137 | 5.1%), and Education Instruction & Library (103 | 3.9%).
Management, Business, Science and Arts Occupations by Sex
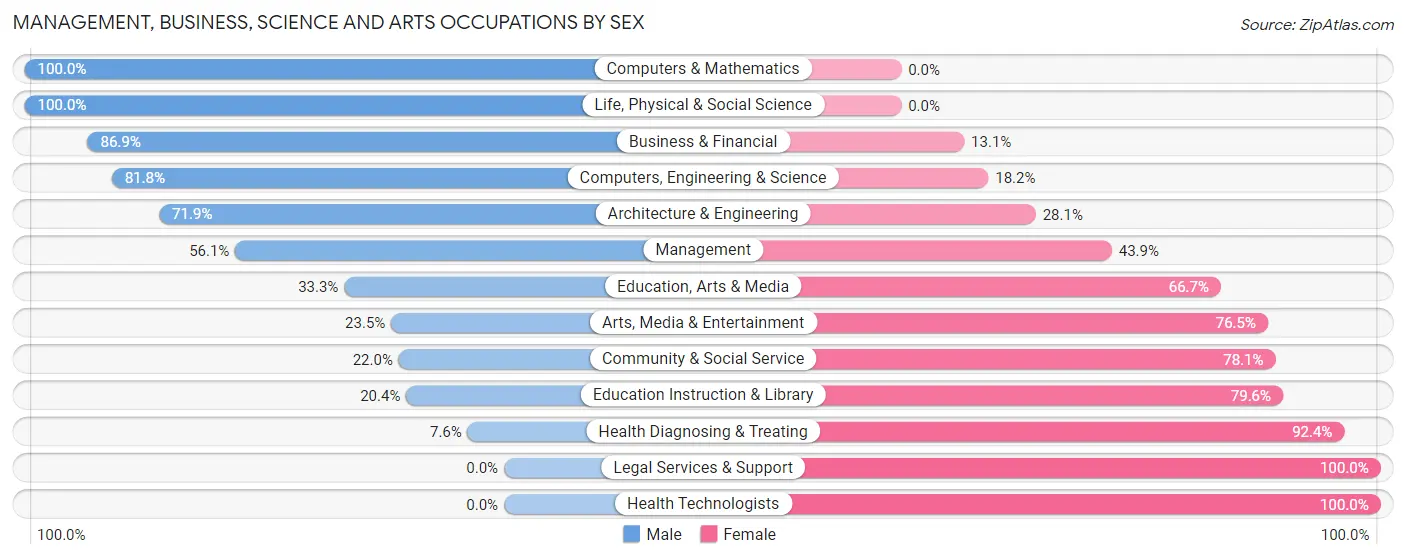
Within the Management, Business, Science and Arts occupations in Belding, the most male-oriented occupations are Computers & Mathematics (100.0%), Life, Physical & Social Science (100.0%), and Business & Financial (86.9%), while the most female-oriented occupations are Legal Services & Support (100.0%), Health Technologists (100.0%), and Health Diagnosing & Treating (92.4%).
| Occupation | Male | Female |
| Management | 194 (56.1%) | 152 (43.9%) |
| Business & Financial | 119 (86.9%) | 18 (13.1%) |
| Computers, Engineering & Science | 72 (81.8%) | 16 (18.2%) |
| Computers & Mathematics | 29 (100.0%) | 0 (0.0%) |
| Architecture & Engineering | 41 (71.9%) | 16 (28.1%) |
| Life, Physical & Social Science | 2 (100.0%) | 0 (0.0%) |
| Community & Social Service | 36 (22.0%) | 128 (78.0%) |
| Education, Arts & Media | 11 (33.3%) | 22 (66.7%) |
| Legal Services & Support | 0 (0.0%) | 11 (100.0%) |
| Education Instruction & Library | 21 (20.4%) | 82 (79.6%) |
| Arts, Media & Entertainment | 4 (23.5%) | 13 (76.5%) |
| Health Diagnosing & Treating | 11 (7.6%) | 134 (92.4%) |
| Health Technologists | 0 (0.0%) | 32 (100.0%) |
| Total (Category) | 432 (49.1%) | 448 (50.9%) |
| Total (Overall) | 1,514 (57.0%) | 1,144 (43.0%) |
Services Occupations
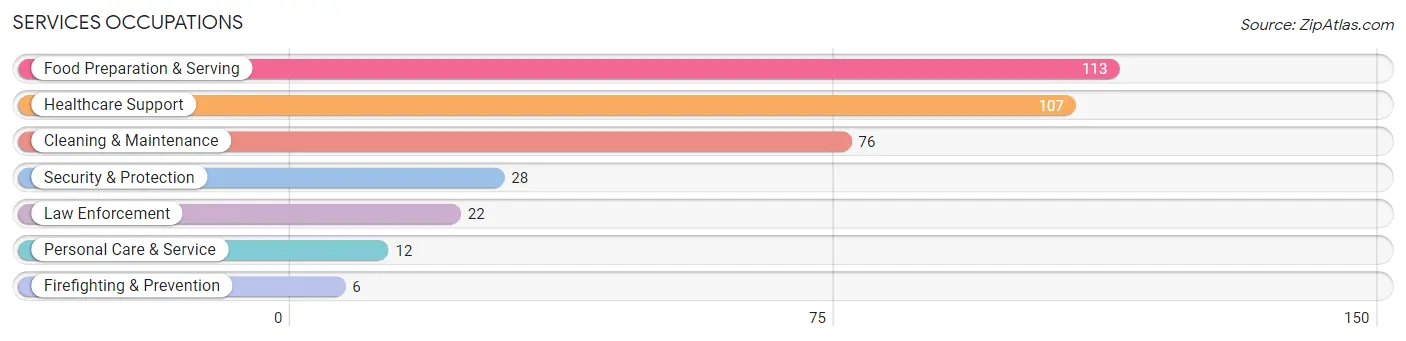
The most common Services occupations in Belding are Food Preparation & Serving (113 | 4.3%), Healthcare Support (107 | 4.0%), Cleaning & Maintenance (76 | 2.9%), Security & Protection (28 | 1.1%), and Law Enforcement (22 | 0.8%).
Services Occupations by Sex
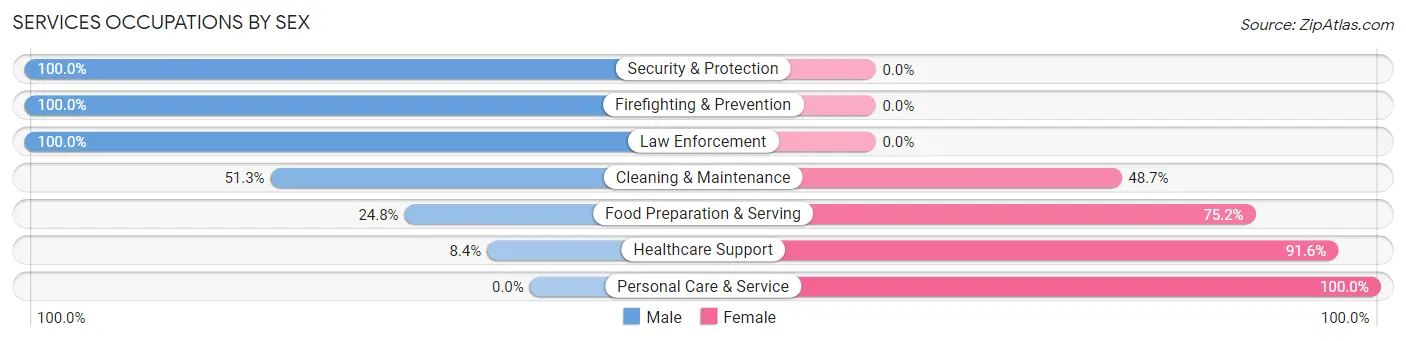
Within the Services occupations in Belding, the most male-oriented occupations are Security & Protection (100.0%), Firefighting & Prevention (100.0%), and Law Enforcement (100.0%), while the most female-oriented occupations are Personal Care & Service (100.0%), Healthcare Support (91.6%), and Food Preparation & Serving (75.2%).
| Occupation | Male | Female |
| Healthcare Support | 9 (8.4%) | 98 (91.6%) |
| Security & Protection | 28 (100.0%) | 0 (0.0%) |
| Firefighting & Prevention | 6 (100.0%) | 0 (0.0%) |
| Law Enforcement | 22 (100.0%) | 0 (0.0%) |
| Food Preparation & Serving | 28 (24.8%) | 85 (75.2%) |
| Cleaning & Maintenance | 39 (51.3%) | 37 (48.7%) |
| Personal Care & Service | 0 (0.0%) | 12 (100.0%) |
| Total (Category) | 104 (30.9%) | 232 (69.1%) |
| Total (Overall) | 1,514 (57.0%) | 1,144 (43.0%) |
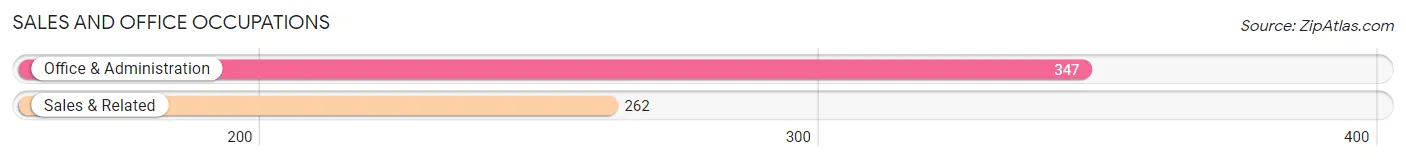
Sales and Office Occupations
The most common Sales and Office occupations in Belding are Office & Administration (347 | 13.1%), and Sales & Related (262 | 9.9%).
Sales and Office Occupations by Sex
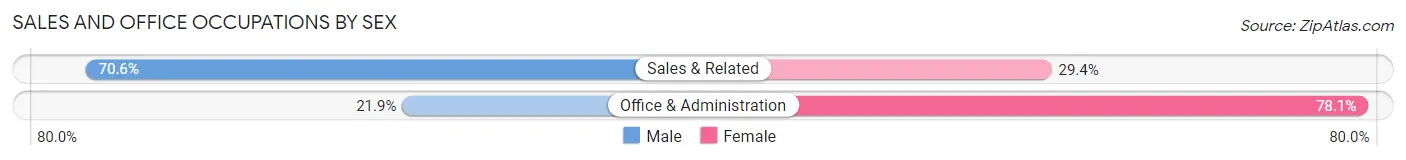
| Occupation | Male | Female |
| Sales & Related | 185 (70.6%) | 77 (29.4%) |
| Office & Administration | 76 (21.9%) | 271 (78.1%) |
| Total (Category) | 261 (42.9%) | 348 (57.1%) |
| Total (Overall) | 1,514 (57.0%) | 1,144 (43.0%) |
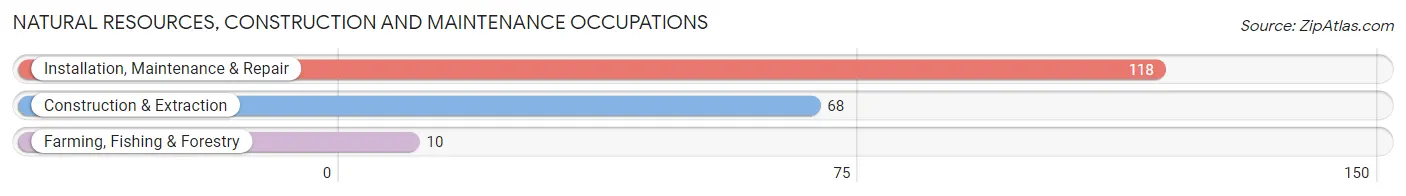
Natural Resources, Construction and Maintenance Occupations
The most common Natural Resources, Construction and Maintenance occupations in Belding are Installation, Maintenance & Repair (118 | 4.4%), Construction & Extraction (68 | 2.6%), and Farming, Fishing & Forestry (10 | 0.4%).
Natural Resources, Construction and Maintenance Occupations by Sex
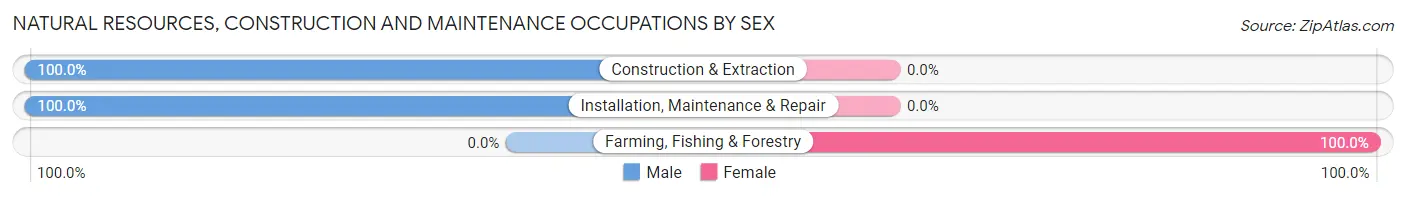
| Occupation | Male | Female |
| Farming, Fishing & Forestry | 0 (0.0%) | 10 (100.0%) |
| Construction & Extraction | 68 (100.0%) | 0 (0.0%) |
| Installation, Maintenance & Repair | 118 (100.0%) | 0 (0.0%) |
| Total (Category) | 186 (94.9%) | 10 (5.1%) |
| Total (Overall) | 1,514 (57.0%) | 1,144 (43.0%) |
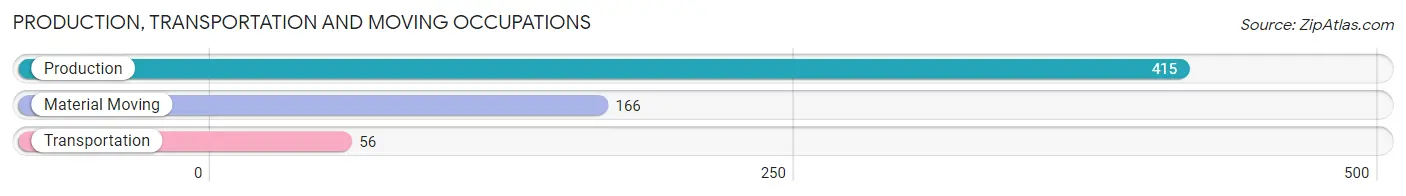
Production, Transportation and Moving Occupations
The most common Production, Transportation and Moving occupations in Belding are Production (415 | 15.6%), Material Moving (166 | 6.2%), and Transportation (56 | 2.1%).
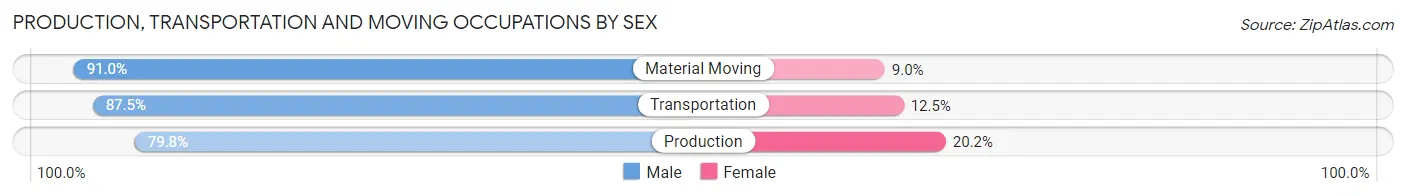
Production, Transportation and Moving Occupations by Sex
| Occupation | Male | Female |
| Production | 331 (79.8%) | 84 (20.2%) |
| Transportation | 49 (87.5%) | 7 (12.5%) |
| Material Moving | 151 (91.0%) | 15 (9.0%) |
| Total (Category) | 531 (83.4%) | 106 (16.6%) |
| Total (Overall) | 1,514 (57.0%) | 1,144 (43.0%) |
Employment Industries by Sex in Belding
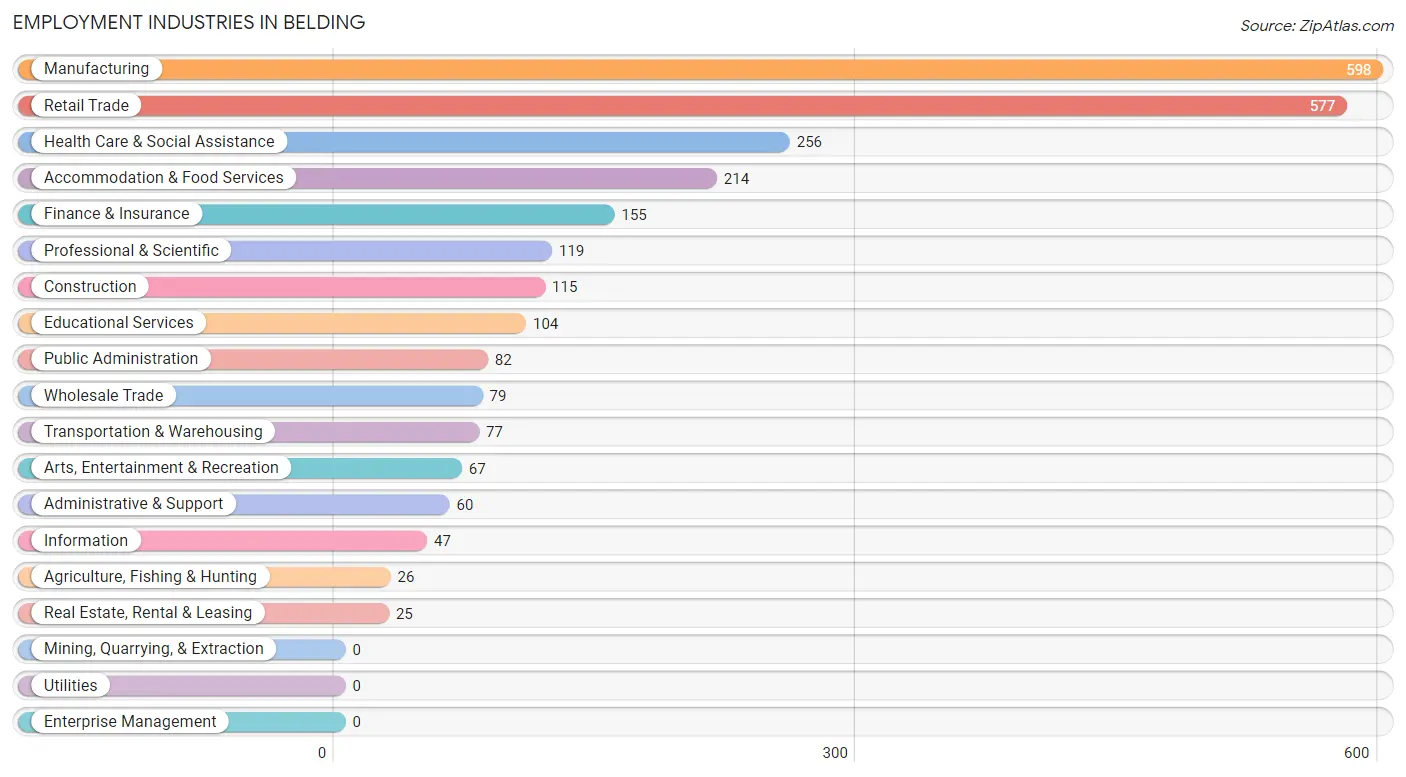
Employment Industries in Belding
The major employment industries in Belding include Manufacturing (598 | 22.5%), Retail Trade (577 | 21.7%), Health Care & Social Assistance (256 | 9.6%), Accommodation & Food Services (214 | 8.1%), and Finance & Insurance (155 | 5.8%).
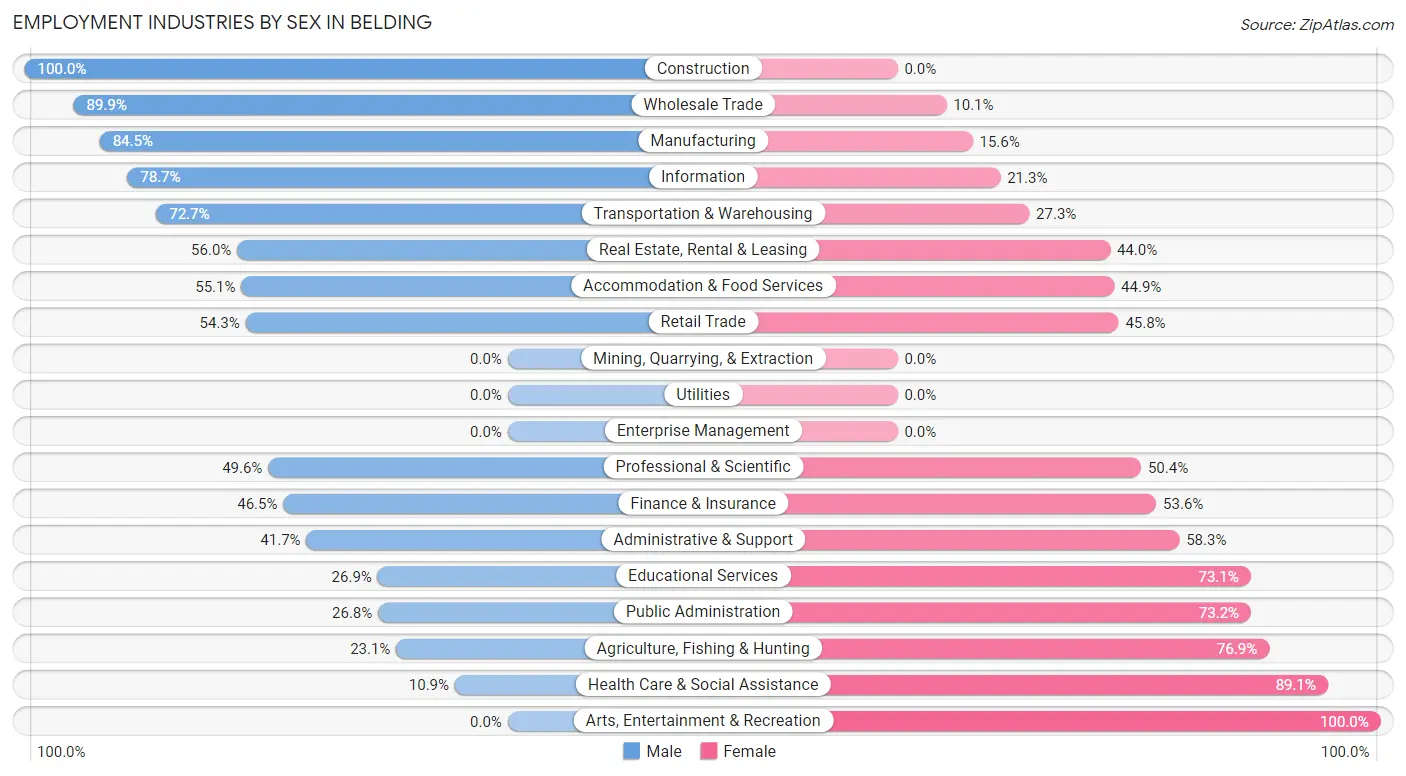
Employment Industries by Sex in Belding
The Belding industries that see more men than women are Construction (100.0%), Wholesale Trade (89.9%), and Manufacturing (84.5%), whereas the industries that tend to have a higher number of women are Arts, Entertainment & Recreation (100.0%), Health Care & Social Assistance (89.1%), and Agriculture, Fishing & Hunting (76.9%).
| Industry | Male | Female |
| Agriculture, Fishing & Hunting | 6 (23.1%) | 20 (76.9%) |
| Mining, Quarrying, & Extraction | 0 (0.0%) | 0 (0.0%) |
| Construction | 115 (100.0%) | 0 (0.0%) |
| Manufacturing | 505 (84.5%) | 93 (15.5%) |
| Wholesale Trade | 71 (89.9%) | 8 (10.1%) |
| Retail Trade | 313 (54.2%) | 264 (45.8%) |
| Transportation & Warehousing | 56 (72.7%) | 21 (27.3%) |
| Utilities | 0 (0.0%) | 0 (0.0%) |
| Information | 37 (78.7%) | 10 (21.3%) |
| Finance & Insurance | 72 (46.5%) | 83 (53.5%) |
| Real Estate, Rental & Leasing | 14 (56.0%) | 11 (44.0%) |
| Professional & Scientific | 59 (49.6%) | 60 (50.4%) |
| Enterprise Management | 0 (0.0%) | 0 (0.0%) |
| Administrative & Support | 25 (41.7%) | 35 (58.3%) |
| Educational Services | 28 (26.9%) | 76 (73.1%) |
| Health Care & Social Assistance | 28 (10.9%) | 228 (89.1%) |
| Arts, Entertainment & Recreation | 0 (0.0%) | 67 (100.0%) |
| Accommodation & Food Services | 118 (55.1%) | 96 (44.9%) |
| Public Administration | 22 (26.8%) | 60 (73.2%) |
| Total | 1,514 (57.0%) | 1,144 (43.0%) |
Education in Belding
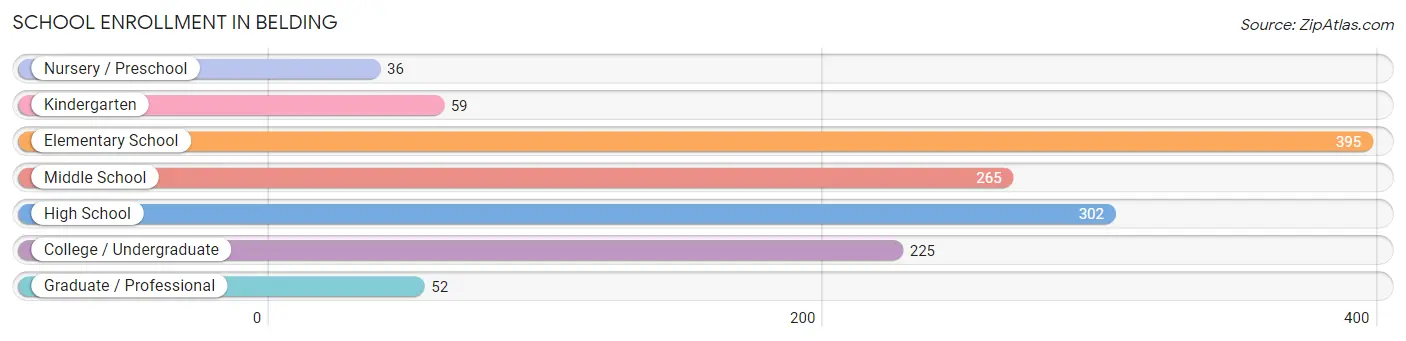
School Enrollment in Belding
The most common levels of schooling among the 1,334 students in Belding are elementary school (395 | 29.6%), high school (302 | 22.6%), and middle school (265 | 19.9%).
| School Level | # Students | % Students |
| Nursery / Preschool | 36 | 2.7% |
| Kindergarten | 59 | 4.4% |
| Elementary School | 395 | 29.6% |
| Middle School | 265 | 19.9% |
| High School | 302 | 22.6% |
| College / Undergraduate | 225 | 16.9% |
| Graduate / Professional | 52 | 3.9% |
| Total | 1,334 | 100.0% |
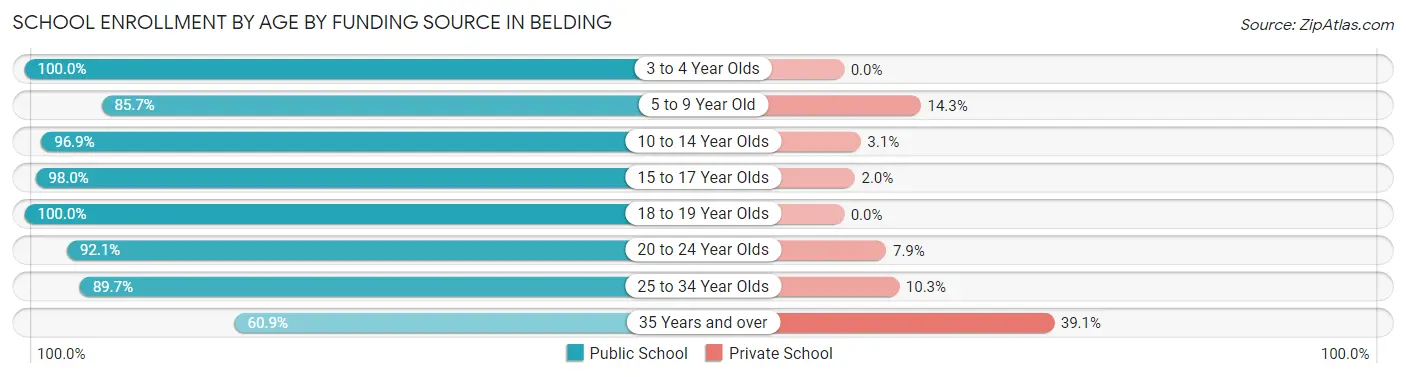
School Enrollment by Age by Funding Source in Belding
Out of a total of 1,334 students who are enrolled in schools in Belding, 108 (8.1%) attend a private institution, while the remaining 1,226 (91.9%) are enrolled in public schools. The age group of 35 years and over has the highest likelihood of being enrolled in private schools, with 18 (39.1% in the age bracket) enrolled. Conversely, the age group of 3 to 4 year olds has the lowest likelihood of being enrolled in a private school, with 24 (100.0% in the age bracket) attending a public institution.
| Age Bracket | Public School | Private School |
| 3 to 4 Year Olds | 24 (100.0%) | 0 (0.0%) |
| 5 to 9 Year Old | 317 (85.7%) | 53 (14.3%) |
| 10 to 14 Year Olds | 373 (96.9%) | 12 (3.1%) |
| 15 to 17 Year Olds | 242 (98.0%) | 5 (2.0%) |
| 18 to 19 Year Olds | 41 (100.0%) | 0 (0.0%) |
| 20 to 24 Year Olds | 105 (92.1%) | 9 (7.9%) |
| 25 to 34 Year Olds | 96 (89.7%) | 11 (10.3%) |
| 35 Years and over | 28 (60.9%) | 18 (39.1%) |
| Total | 1,226 (91.9%) | 108 (8.1%) |
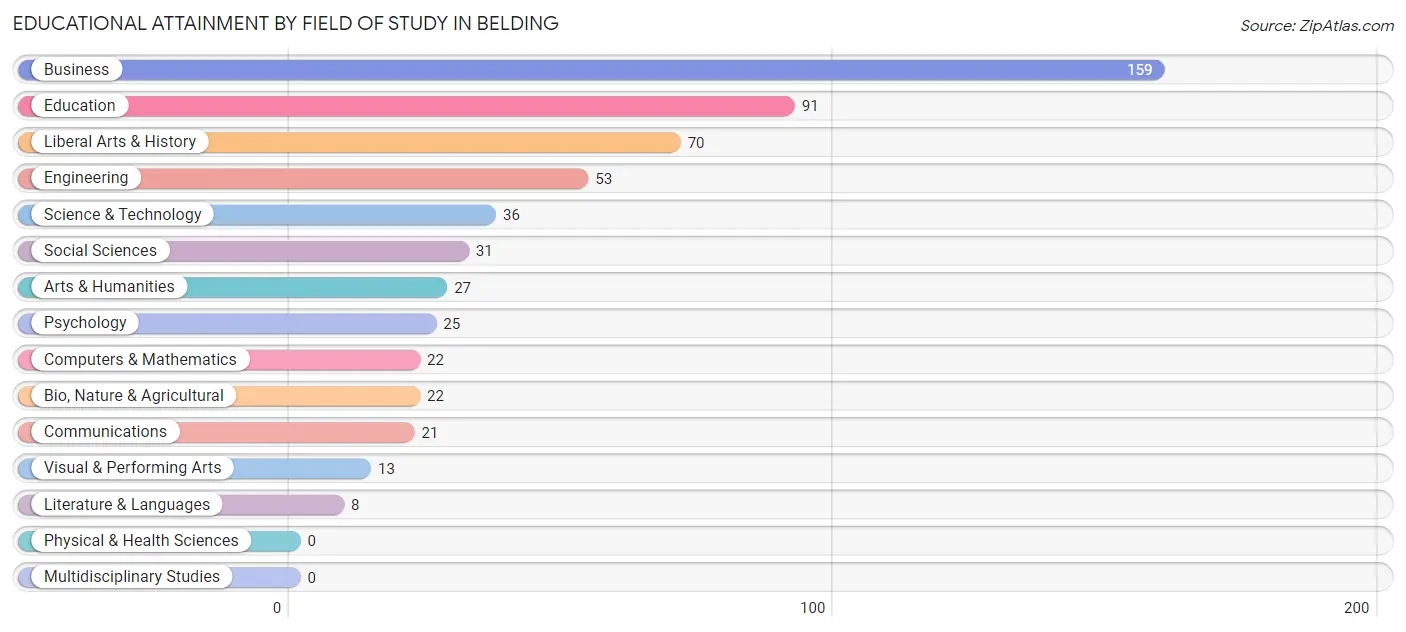
Educational Attainment by Field of Study in Belding
Business (159 | 27.5%), education (91 | 15.7%), liberal arts & history (70 | 12.1%), engineering (53 | 9.2%), and science & technology (36 | 6.2%) are the most common fields of study among 578 individuals in Belding who have obtained a bachelor's degree or higher.
| Field of Study | # Graduates | % Graduates |
| Computers & Mathematics | 22 | 3.8% |
| Bio, Nature & Agricultural | 22 | 3.8% |
| Physical & Health Sciences | 0 | 0.0% |
| Psychology | 25 | 4.3% |
| Social Sciences | 31 | 5.4% |
| Engineering | 53 | 9.2% |
| Multidisciplinary Studies | 0 | 0.0% |
| Science & Technology | 36 | 6.2% |
| Business | 159 | 27.5% |
| Education | 91 | 15.7% |
| Literature & Languages | 8 | 1.4% |
| Liberal Arts & History | 70 | 12.1% |
| Visual & Performing Arts | 13 | 2.2% |
| Communications | 21 | 3.6% |
| Arts & Humanities | 27 | 4.7% |
| Total | 578 | 100.0% |
Transportation & Commute in Belding
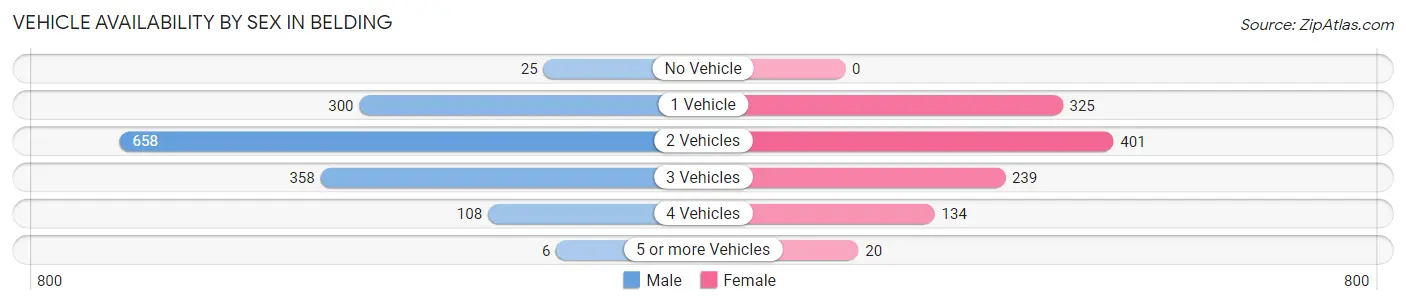
Vehicle Availability by Sex in Belding
The most prevalent vehicle ownership categories in Belding are males with 2 vehicles (658, accounting for 45.2%) and females with 2 vehicles (401, making up 58.8%).
| Vehicles Available | Male | Female |
| No Vehicle | 25 (1.7%) | 0 (0.0%) |
| 1 Vehicle | 300 (20.6%) | 325 (29.0%) |
| 2 Vehicles | 658 (45.2%) | 401 (35.8%) |
| 3 Vehicles | 358 (24.6%) | 239 (21.4%) |
| 4 Vehicles | 108 (7.4%) | 134 (12.0%) |
| 5 or more Vehicles | 6 (0.4%) | 20 (1.8%) |
| Total | 1,455 (100.0%) | 1,119 (100.0%) |
Commute Time in Belding
The most frequently occuring commute durations in Belding are 45 to 59 minutes (562 commuters, 22.0%), 5 to 9 minutes (369 commuters, 14.4%), and 20 to 24 minutes (301 commuters, 11.8%).
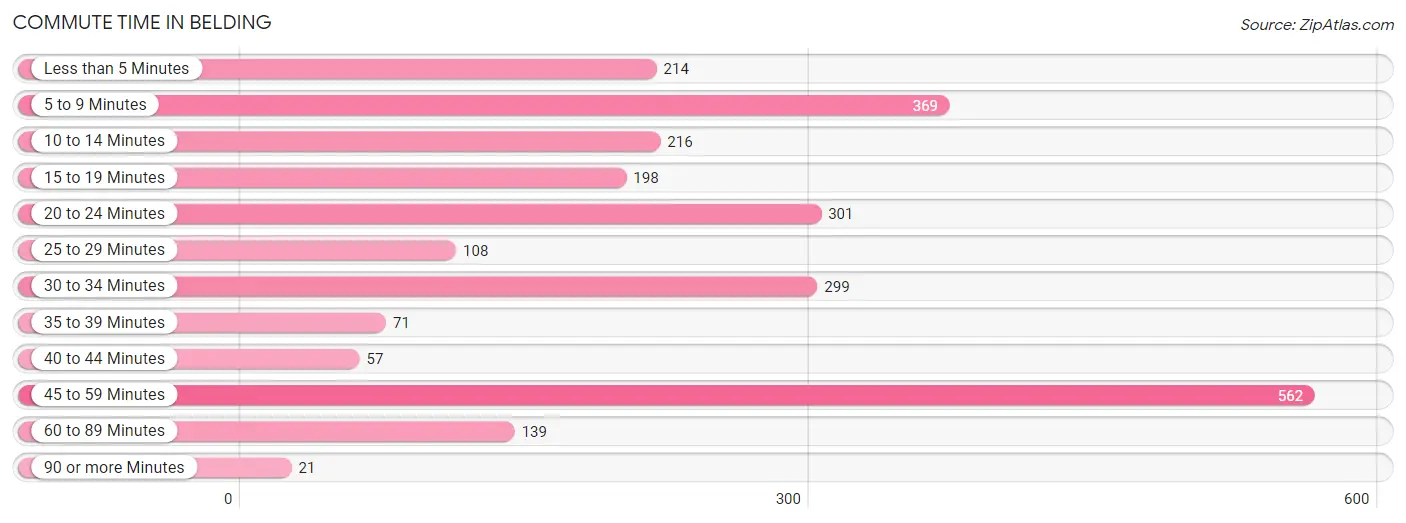
| Commute Time | # Commuters | % Commuters |
| Less than 5 Minutes | 214 | 8.4% |
| 5 to 9 Minutes | 369 | 14.4% |
| 10 to 14 Minutes | 216 | 8.5% |
| 15 to 19 Minutes | 198 | 7.7% |
| 20 to 24 Minutes | 301 | 11.8% |
| 25 to 29 Minutes | 108 | 4.2% |
| 30 to 34 Minutes | 299 | 11.7% |
| 35 to 39 Minutes | 71 | 2.8% |
| 40 to 44 Minutes | 57 | 2.2% |
| 45 to 59 Minutes | 562 | 22.0% |
| 60 to 89 Minutes | 139 | 5.4% |
| 90 or more Minutes | 21 | 0.8% |
Commute Time by Sex in Belding
The most common commute times in Belding are 45 to 59 minutes (428 commuters, 29.4%) for males and 30 to 34 minutes (185 commuters, 16.8%) for females.
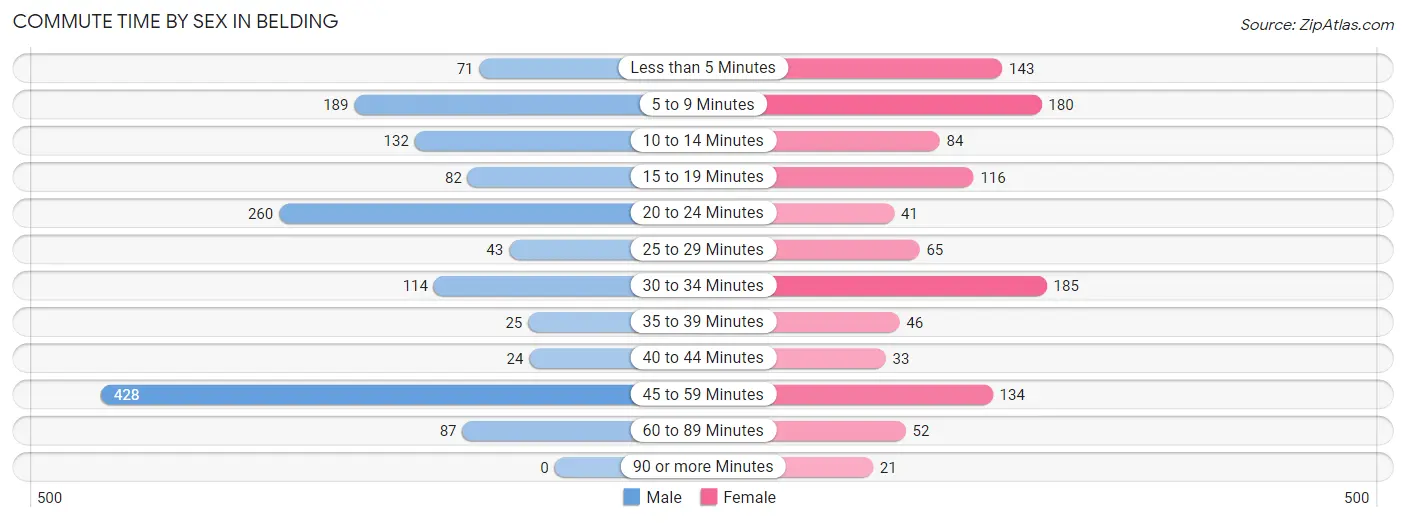
| Commute Time | Male | Female |
| Less than 5 Minutes | 71 (4.9%) | 143 (13.0%) |
| 5 to 9 Minutes | 189 (13.0%) | 180 (16.4%) |
| 10 to 14 Minutes | 132 (9.1%) | 84 (7.6%) |
| 15 to 19 Minutes | 82 (5.6%) | 116 (10.5%) |
| 20 to 24 Minutes | 260 (17.9%) | 41 (3.7%) |
| 25 to 29 Minutes | 43 (3.0%) | 65 (5.9%) |
| 30 to 34 Minutes | 114 (7.8%) | 185 (16.8%) |
| 35 to 39 Minutes | 25 (1.7%) | 46 (4.2%) |
| 40 to 44 Minutes | 24 (1.7%) | 33 (3.0%) |
| 45 to 59 Minutes | 428 (29.4%) | 134 (12.2%) |
| 60 to 89 Minutes | 87 (6.0%) | 52 (4.7%) |
| 90 or more Minutes | 0 (0.0%) | 21 (1.9%) |
Time of Departure to Work by Sex in Belding
The most frequent times of departure to work in Belding are 7:00 AM to 7:29 AM (339, 23.3%) for males and 7:00 AM to 7:29 AM (162, 14.7%) for females.
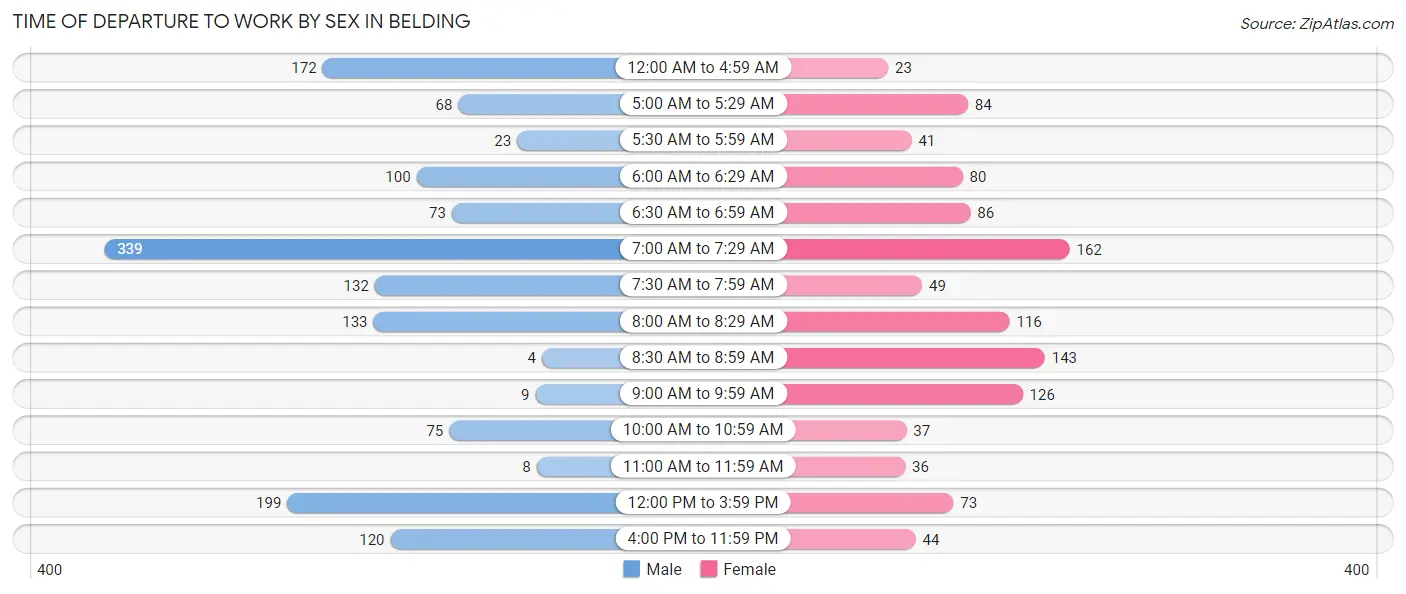
| Time of Departure | Male | Female |
| 12:00 AM to 4:59 AM | 172 (11.8%) | 23 (2.1%) |
| 5:00 AM to 5:29 AM | 68 (4.7%) | 84 (7.6%) |
| 5:30 AM to 5:59 AM | 23 (1.6%) | 41 (3.7%) |
| 6:00 AM to 6:29 AM | 100 (6.9%) | 80 (7.3%) |
| 6:30 AM to 6:59 AM | 73 (5.0%) | 86 (7.8%) |
| 7:00 AM to 7:29 AM | 339 (23.3%) | 162 (14.7%) |
| 7:30 AM to 7:59 AM | 132 (9.1%) | 49 (4.4%) |
| 8:00 AM to 8:29 AM | 133 (9.1%) | 116 (10.5%) |
| 8:30 AM to 8:59 AM | 4 (0.3%) | 143 (13.0%) |
| 9:00 AM to 9:59 AM | 9 (0.6%) | 126 (11.5%) |
| 10:00 AM to 10:59 AM | 75 (5.1%) | 37 (3.4%) |
| 11:00 AM to 11:59 AM | 8 (0.5%) | 36 (3.3%) |
| 12:00 PM to 3:59 PM | 199 (13.7%) | 73 (6.6%) |
| 4:00 PM to 11:59 PM | 120 (8.3%) | 44 (4.0%) |
| Total | 1,455 (100.0%) | 1,100 (100.0%) |
Housing Occupancy in Belding
Occupancy by Ownership in Belding
Of the total 2,148 dwellings in Belding, owner-occupied units account for 1,375 (64.0%), while renter-occupied units make up 773 (36.0%).
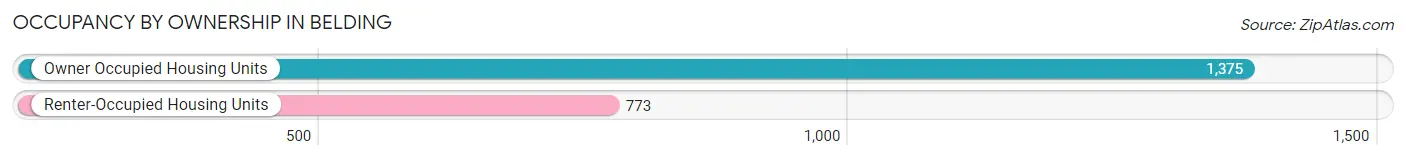
| Occupancy | # Housing Units | % Housing Units |
| Owner Occupied Housing Units | 1,375 | 64.0% |
| Renter-Occupied Housing Units | 773 | 36.0% |
| Total Occupied Housing Units | 2,148 | 100.0% |
Occupancy by Household Size in Belding
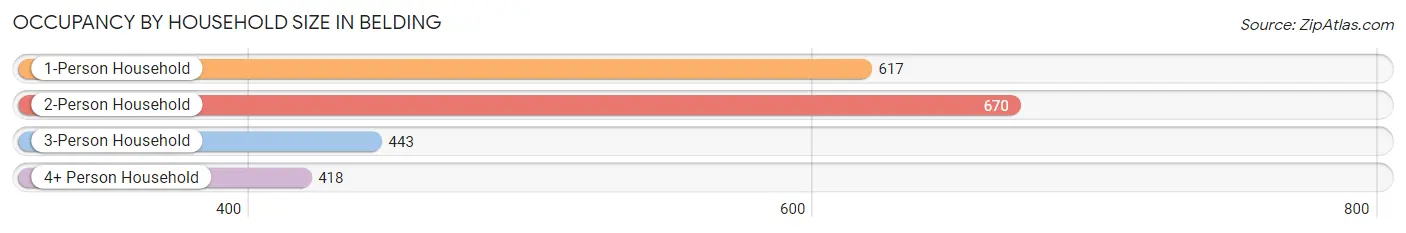
| Household Size | # Housing Units | % Housing Units |
| 1-Person Household | 617 | 28.7% |
| 2-Person Household | 670 | 31.2% |
| 3-Person Household | 443 | 20.6% |
| 4+ Person Household | 418 | 19.5% |
| Total Housing Units | 2,148 | 100.0% |
Occupancy by Ownership by Household Size in Belding
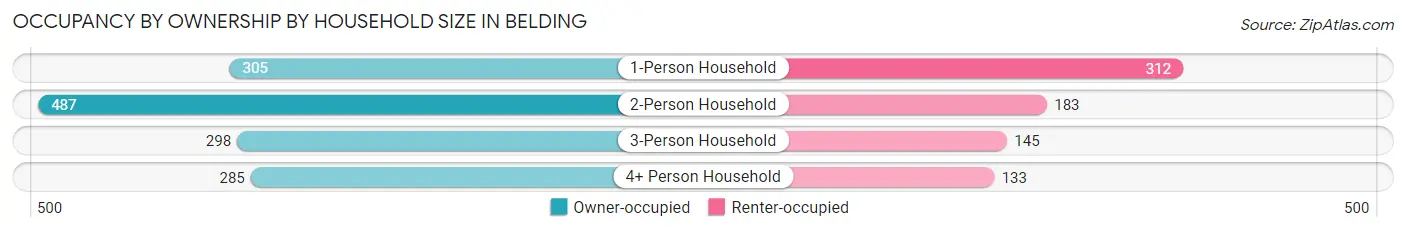
| Household Size | Owner-occupied | Renter-occupied |
| 1-Person Household | 305 (49.4%) | 312 (50.6%) |
| 2-Person Household | 487 (72.7%) | 183 (27.3%) |
| 3-Person Household | 298 (67.3%) | 145 (32.7%) |
| 4+ Person Household | 285 (68.2%) | 133 (31.8%) |
| Total Housing Units | 1,375 (64.0%) | 773 (36.0%) |
Occupancy by Educational Attainment in Belding
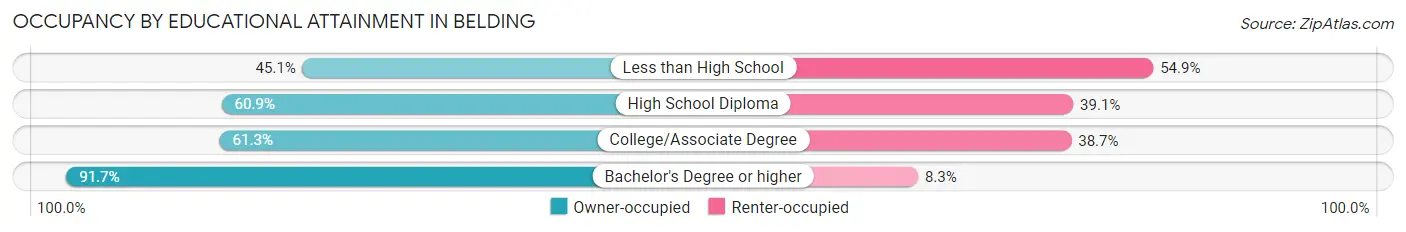
| Household Size | Owner-occupied | Renter-occupied |
| Less than High School | 96 (45.1%) | 117 (54.9%) |
| High School Diploma | 479 (60.9%) | 307 (39.1%) |
| College/Associate Degree | 512 (61.3%) | 323 (38.7%) |
| Bachelor's Degree or higher | 288 (91.7%) | 26 (8.3%) |
Occupancy by Age of Householder in Belding
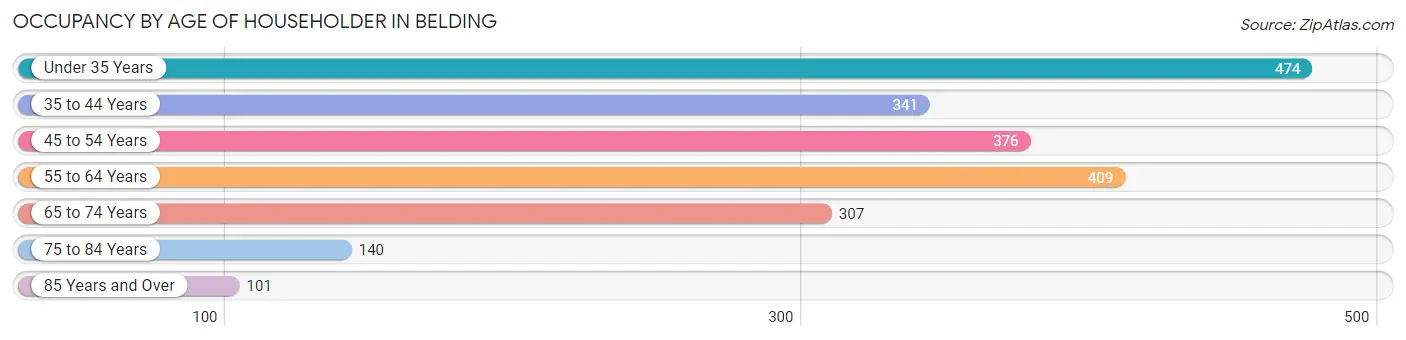
| Age Bracket | # Households | % Households |
| Under 35 Years | 474 | 22.1% |
| 35 to 44 Years | 341 | 15.9% |
| 45 to 54 Years | 376 | 17.5% |
| 55 to 64 Years | 409 | 19.0% |
| 65 to 74 Years | 307 | 14.3% |
| 75 to 84 Years | 140 | 6.5% |
| 85 Years and Over | 101 | 4.7% |
| Total | 2,148 | 100.0% |
Housing Finances in Belding
Median Income by Occupancy in Belding
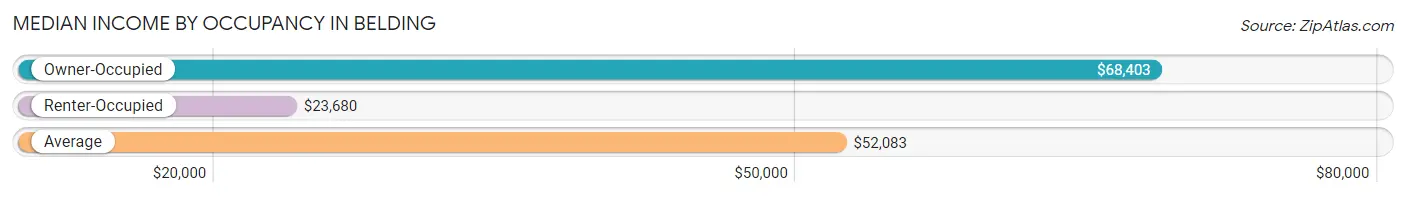
| Occupancy Type | # Households | Median Income |
| Owner-Occupied | 1,375 (64.0%) | $68,403 |
| Renter-Occupied | 773 (36.0%) | $23,680 |
| Average | 2,148 (100.0%) | $52,083 |
Occupancy by Householder Income Bracket in Belding
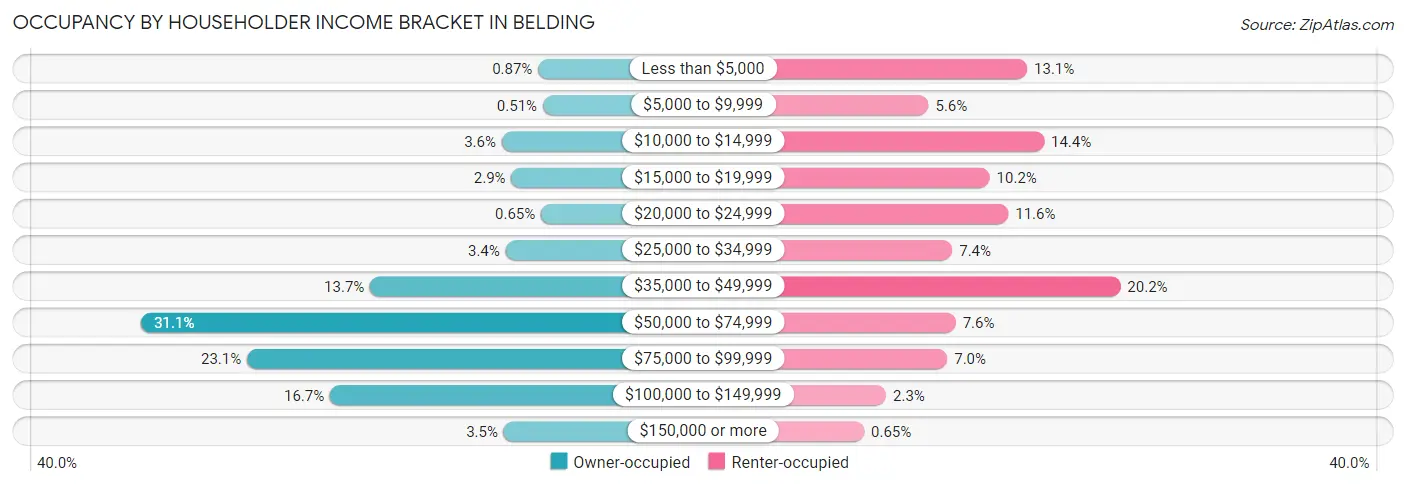
| Income Bracket | Owner-occupied | Renter-occupied |
| Less than $5,000 | 12 (0.9%) | 101 (13.1%) |
| $5,000 to $9,999 | 7 (0.5%) | 43 (5.6%) |
| $10,000 to $14,999 | 50 (3.6%) | 111 (14.4%) |
| $15,000 to $19,999 | 40 (2.9%) | 79 (10.2%) |
| $20,000 to $24,999 | 9 (0.6%) | 90 (11.6%) |
| $25,000 to $34,999 | 46 (3.4%) | 57 (7.4%) |
| $35,000 to $49,999 | 188 (13.7%) | 156 (20.2%) |
| $50,000 to $74,999 | 428 (31.1%) | 59 (7.6%) |
| $75,000 to $99,999 | 317 (23.1%) | 54 (7.0%) |
| $100,000 to $149,999 | 230 (16.7%) | 18 (2.3%) |
| $150,000 or more | 48 (3.5%) | 5 (0.6%) |
| Total | 1,375 (100.0%) | 773 (100.0%) |
Monthly Housing Cost Tiers in Belding
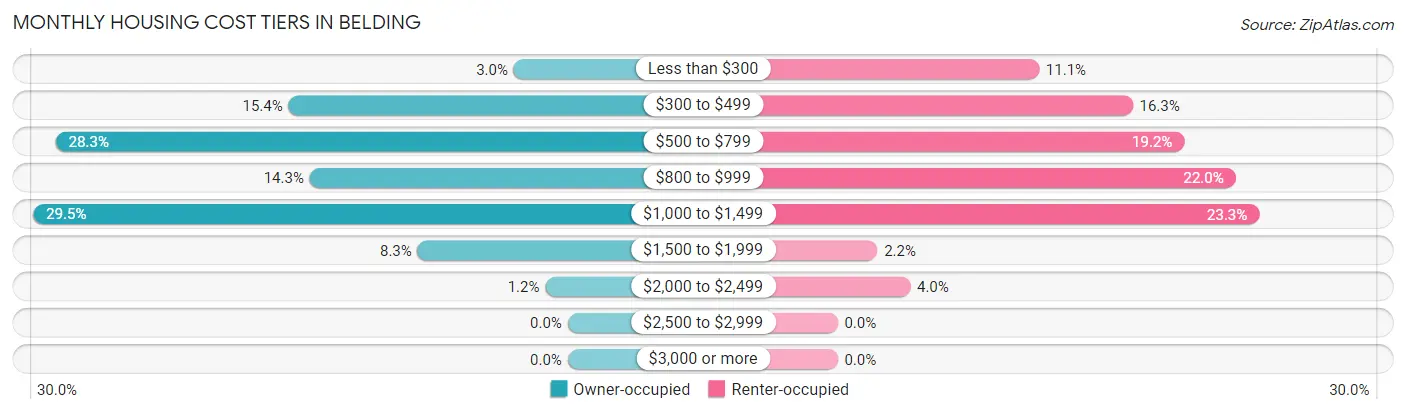
| Monthly Cost | Owner-occupied | Renter-occupied |
| Less than $300 | 41 (3.0%) | 86 (11.1%) |
| $300 to $499 | 212 (15.4%) | 126 (16.3%) |
| $500 to $799 | 389 (28.3%) | 148 (19.2%) |
| $800 to $999 | 196 (14.2%) | 170 (22.0%) |
| $1,000 to $1,499 | 406 (29.5%) | 180 (23.3%) |
| $1,500 to $1,999 | 114 (8.3%) | 17 (2.2%) |
| $2,000 to $2,499 | 17 (1.2%) | 31 (4.0%) |
| $2,500 to $2,999 | 0 (0.0%) | 0 (0.0%) |
| $3,000 or more | 0 (0.0%) | 0 (0.0%) |
| Total | 1,375 (100.0%) | 773 (100.0%) |
Physical Housing Characteristics in Belding
Housing Structures in Belding
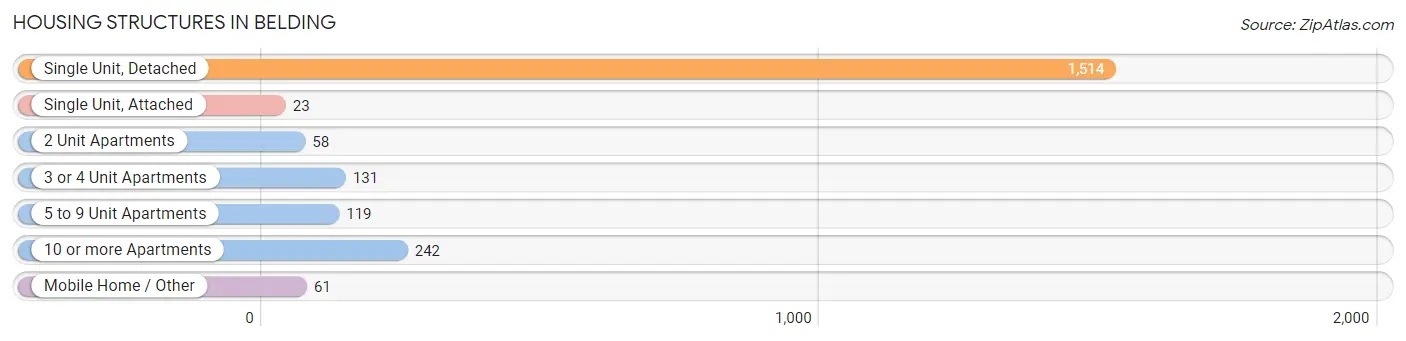
| Structure Type | # Housing Units | % Housing Units |
| Single Unit, Detached | 1,514 | 70.5% |
| Single Unit, Attached | 23 | 1.1% |
| 2 Unit Apartments | 58 | 2.7% |
| 3 or 4 Unit Apartments | 131 | 6.1% |
| 5 to 9 Unit Apartments | 119 | 5.5% |
| 10 or more Apartments | 242 | 11.3% |
| Mobile Home / Other | 61 | 2.8% |
| Total | 2,148 | 100.0% |
Housing Structures by Occupancy in Belding
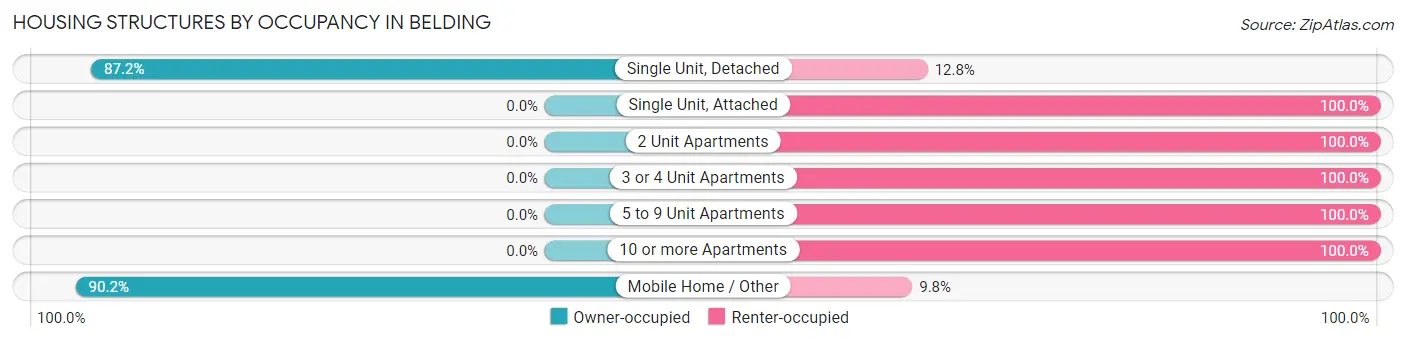
| Structure Type | Owner-occupied | Renter-occupied |
| Single Unit, Detached | 1,320 (87.2%) | 194 (12.8%) |
| Single Unit, Attached | 0 (0.0%) | 23 (100.0%) |
| 2 Unit Apartments | 0 (0.0%) | 58 (100.0%) |
| 3 or 4 Unit Apartments | 0 (0.0%) | 131 (100.0%) |
| 5 to 9 Unit Apartments | 0 (0.0%) | 119 (100.0%) |
| 10 or more Apartments | 0 (0.0%) | 242 (100.0%) |
| Mobile Home / Other | 55 (90.2%) | 6 (9.8%) |
| Total | 1,375 (64.0%) | 773 (36.0%) |
Housing Structures by Number of Rooms in Belding
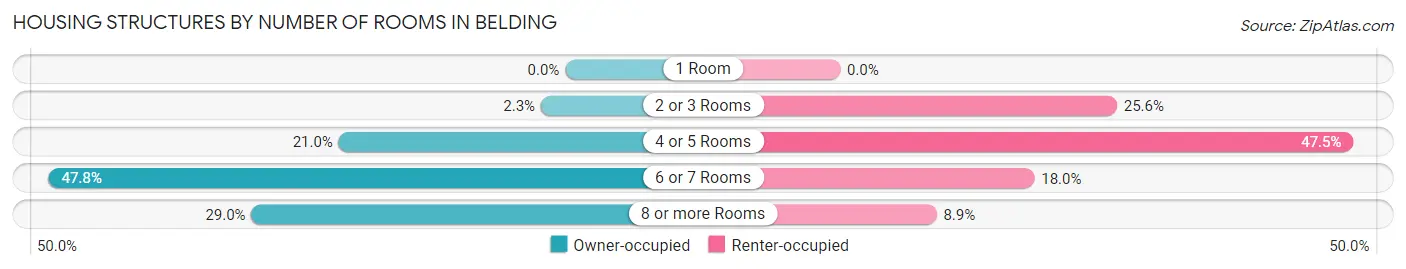
| Number of Rooms | Owner-occupied | Renter-occupied |
| 1 Room | 0 (0.0%) | 0 (0.0%) |
| 2 or 3 Rooms | 31 (2.2%) | 198 (25.6%) |
| 4 or 5 Rooms | 288 (20.9%) | 367 (47.5%) |
| 6 or 7 Rooms | 657 (47.8%) | 139 (18.0%) |
| 8 or more Rooms | 399 (29.0%) | 69 (8.9%) |
| Total | 1,375 (100.0%) | 773 (100.0%) |
Housing Structure by Heating Type in Belding
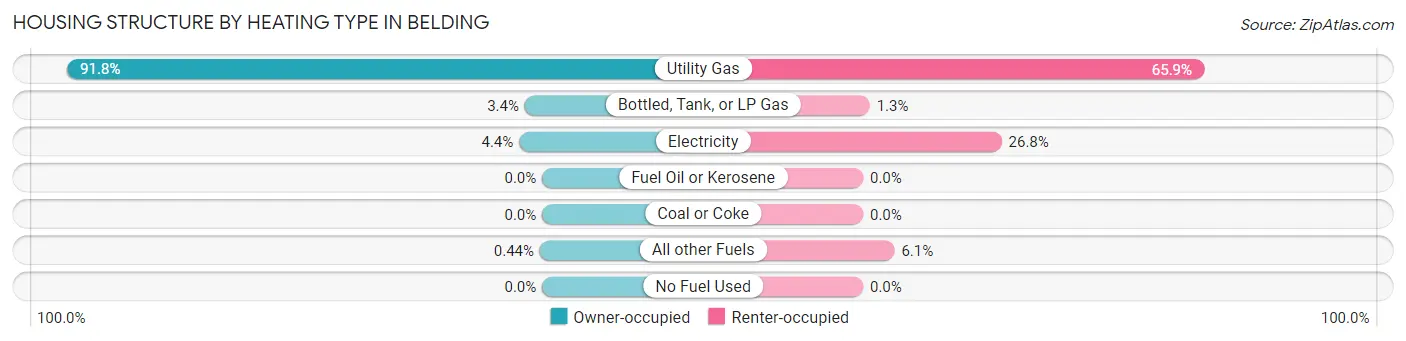
| Heating Type | Owner-occupied | Renter-occupied |
| Utility Gas | 1,262 (91.8%) | 509 (65.8%) |
| Bottled, Tank, or LP Gas | 46 (3.4%) | 10 (1.3%) |
| Electricity | 61 (4.4%) | 207 (26.8%) |
| Fuel Oil or Kerosene | 0 (0.0%) | 0 (0.0%) |
| Coal or Coke | 0 (0.0%) | 0 (0.0%) |
| All other Fuels | 6 (0.4%) | 47 (6.1%) |
| No Fuel Used | 0 (0.0%) | 0 (0.0%) |
| Total | 1,375 (100.0%) | 773 (100.0%) |
Household Vehicle Usage in Belding
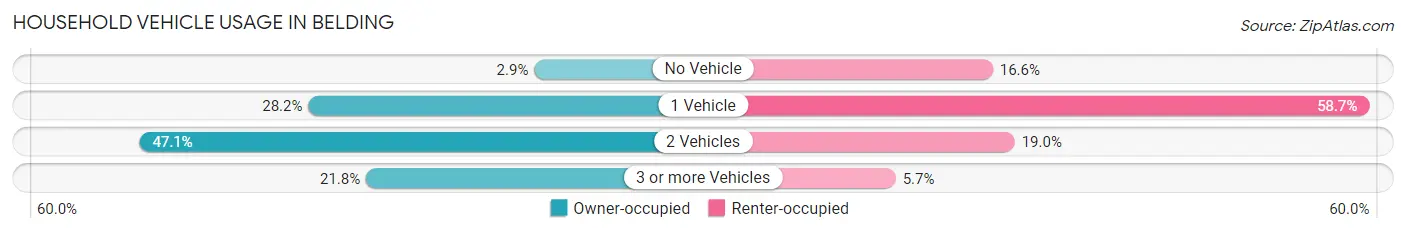
| Vehicles per Household | Owner-occupied | Renter-occupied |
| No Vehicle | 40 (2.9%) | 128 (16.6%) |
| 1 Vehicle | 388 (28.2%) | 454 (58.7%) |
| 2 Vehicles | 648 (47.1%) | 147 (19.0%) |
| 3 or more Vehicles | 299 (21.7%) | 44 (5.7%) |
| Total | 1,375 (100.0%) | 773 (100.0%) |
Real Estate & Mortgages in Belding
Real Estate and Mortgage Overview in Belding
| Characteristic | Without Mortgage | With Mortgage |
| Housing Units | 560 | 815 |
| Median Property Value | $123,700 | $133,100 |
| Median Household Income | $70,761 | $19 |
| Monthly Housing Costs | $521 | $0 |
| Real Estate Taxes | $1,710 | $14 |
Property Value by Mortgage Status in Belding
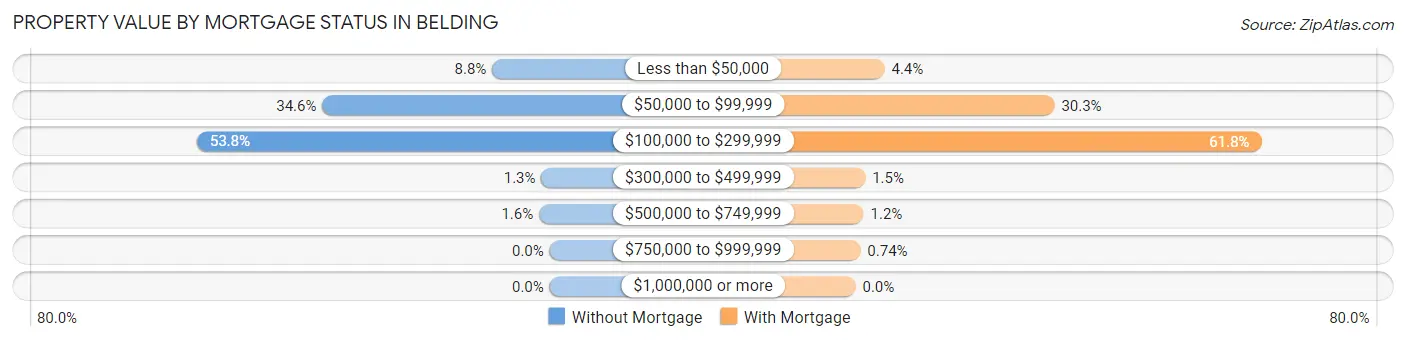
| Property Value | Without Mortgage | With Mortgage |
| Less than $50,000 | 49 (8.7%) | 36 (4.4%) |
| $50,000 to $99,999 | 194 (34.6%) | 247 (30.3%) |
| $100,000 to $299,999 | 301 (53.7%) | 504 (61.8%) |
| $300,000 to $499,999 | 7 (1.3%) | 12 (1.5%) |
| $500,000 to $749,999 | 9 (1.6%) | 10 (1.2%) |
| $750,000 to $999,999 | 0 (0.0%) | 6 (0.7%) |
| $1,000,000 or more | 0 (0.0%) | 0 (0.0%) |
| Total | 560 (100.0%) | 815 (100.0%) |
Household Income by Mortgage Status in Belding
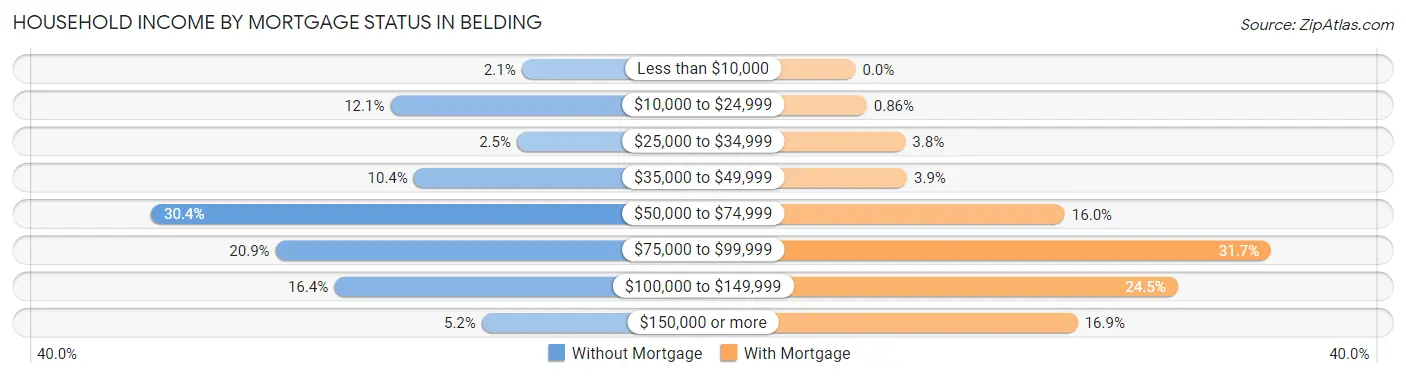
| Household Income | Without Mortgage | With Mortgage |
| Less than $10,000 | 12 (2.1%) | 0 (0.0%) |
| $10,000 to $24,999 | 68 (12.1%) | 7 (0.9%) |
| $25,000 to $34,999 | 14 (2.5%) | 31 (3.8%) |
| $35,000 to $49,999 | 58 (10.4%) | 32 (3.9%) |
| $50,000 to $74,999 | 170 (30.4%) | 130 (16.0%) |
| $75,000 to $99,999 | 117 (20.9%) | 258 (31.7%) |
| $100,000 to $149,999 | 92 (16.4%) | 200 (24.5%) |
| $150,000 or more | 29 (5.2%) | 138 (16.9%) |
| Total | 560 (100.0%) | 815 (100.0%) |
Property Value to Household Income Ratio in Belding
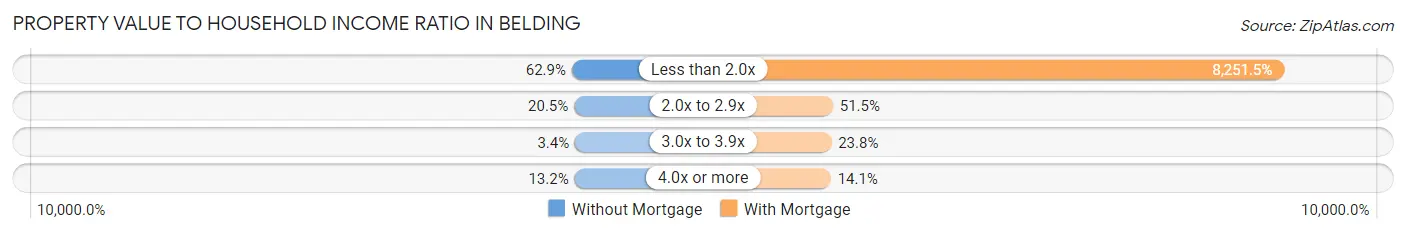
| Value-to-Income Ratio | Without Mortgage | With Mortgage |
| Less than 2.0x | 352 (62.9%) | 67,250 (8,251.5%) |
| 2.0x to 2.9x | 115 (20.5%) | 420 (51.5%) |
| 3.0x to 3.9x | 19 (3.4%) | 194 (23.8%) |
| 4.0x or more | 74 (13.2%) | 115 (14.1%) |
| Total | 560 (100.0%) | 815 (100.0%) |
Real Estate Taxes by Mortgage Status in Belding
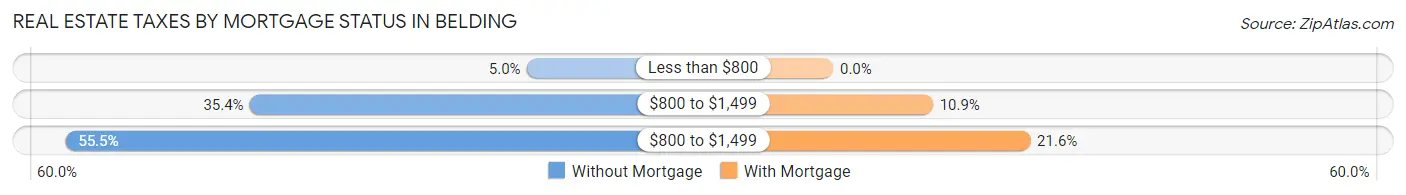
| Property Taxes | Without Mortgage | With Mortgage |
| Less than $800 | 28 (5.0%) | 0 (0.0%) |
| $800 to $1,499 | 198 (35.4%) | 89 (10.9%) |
| $800 to $1,499 | 311 (55.5%) | 176 (21.6%) |
| Total | 560 (100.0%) | 815 (100.0%) |
Health & Disability in Belding
Health Insurance Coverage by Age in Belding
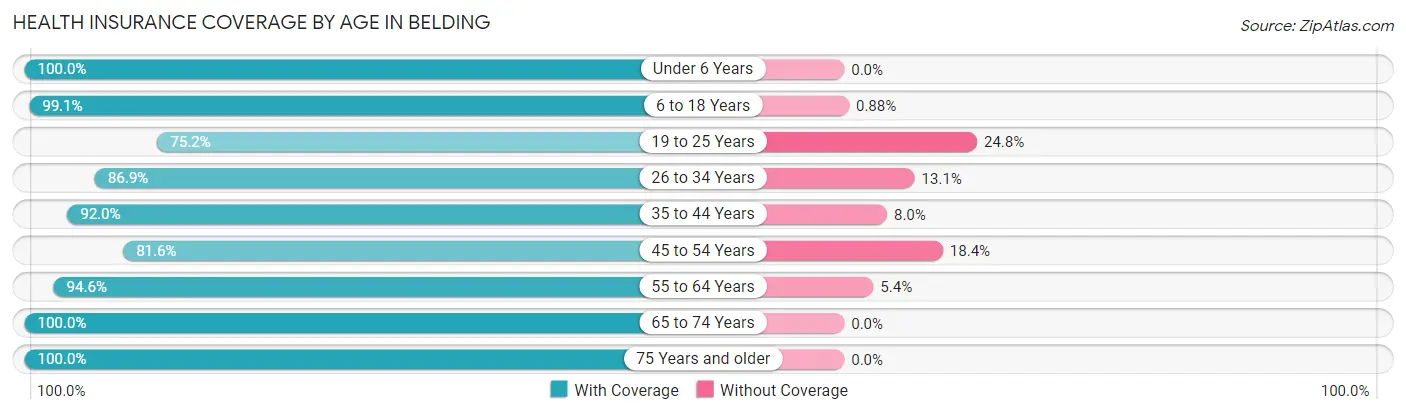
| Age Bracket | With Coverage | Without Coverage |
| Under 6 Years | 372 (100.0%) | 0 (0.0%) |
| 6 to 18 Years | 1,019 (99.1%) | 9 (0.9%) |
| 19 to 25 Years | 398 (75.2%) | 131 (24.8%) |
| 26 to 34 Years | 649 (86.9%) | 98 (13.1%) |
| 35 to 44 Years | 878 (92.0%) | 76 (8.0%) |
| 45 to 54 Years | 546 (81.6%) | 123 (18.4%) |
| 55 to 64 Years | 644 (94.6%) | 37 (5.4%) |
| 65 to 74 Years | 530 (100.0%) | 0 (0.0%) |
| 75 Years and older | 303 (100.0%) | 0 (0.0%) |
| Total | 5,339 (91.8%) | 474 (8.2%) |
Health Insurance Coverage by Citizenship Status in Belding
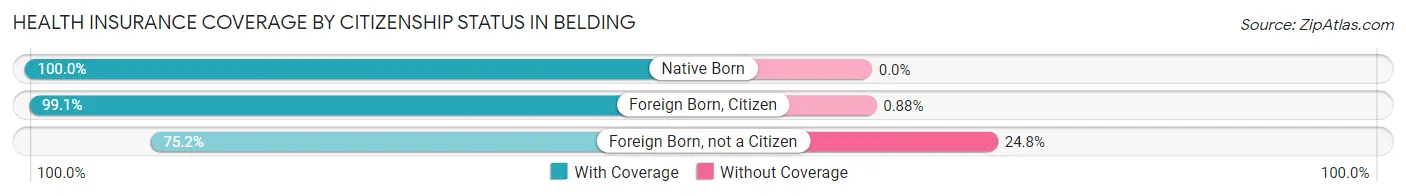
| Citizenship Status | With Coverage | Without Coverage |
| Native Born | 372 (100.0%) | 0 (0.0%) |
| Foreign Born, Citizen | 1,019 (99.1%) | 9 (0.9%) |
| Foreign Born, not a Citizen | 398 (75.2%) | 131 (24.8%) |
Health Insurance Coverage by Household Income in Belding
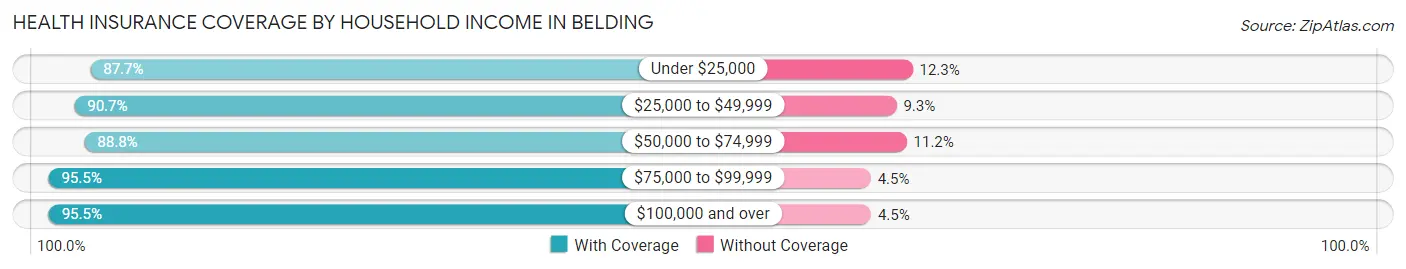
| Household Income | With Coverage | Without Coverage |
| Under $25,000 | 826 (87.7%) | 116 (12.3%) |
| $25,000 to $49,999 | 1,179 (90.7%) | 121 (9.3%) |
| $50,000 to $74,999 | 1,022 (88.8%) | 129 (11.2%) |
| $75,000 to $99,999 | 1,129 (95.5%) | 53 (4.5%) |
| $100,000 and over | 1,160 (95.5%) | 55 (4.5%) |
Public vs Private Health Insurance Coverage by Age in Belding
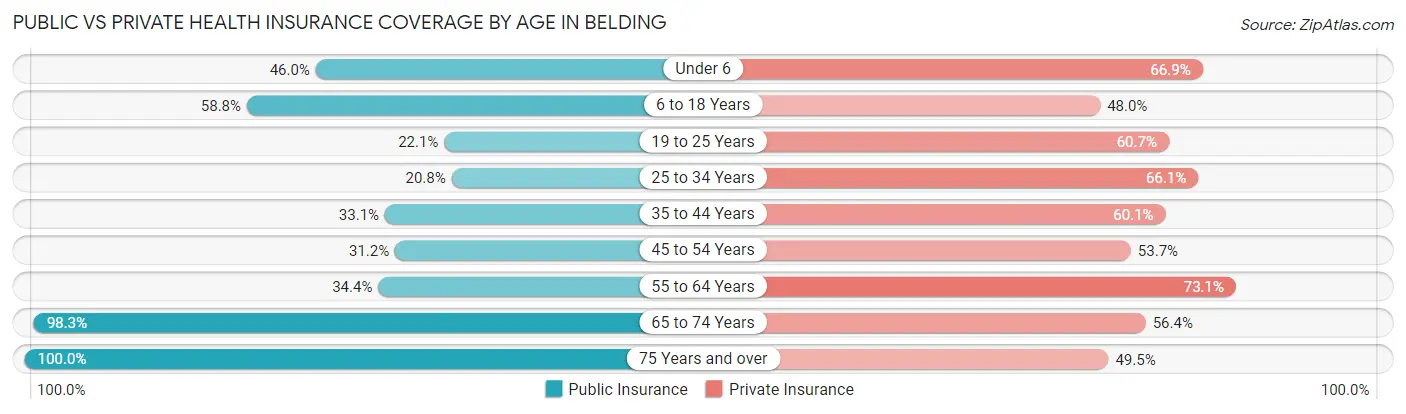
| Age Bracket | Public Insurance | Private Insurance |
| Under 6 | 171 (46.0%) | 249 (66.9%) |
| 6 to 18 Years | 604 (58.8%) | 493 (48.0%) |
| 19 to 25 Years | 117 (22.1%) | 321 (60.7%) |
| 25 to 34 Years | 155 (20.7%) | 494 (66.1%) |
| 35 to 44 Years | 316 (33.1%) | 573 (60.1%) |
| 45 to 54 Years | 209 (31.2%) | 359 (53.7%) |
| 55 to 64 Years | 234 (34.4%) | 498 (73.1%) |
| 65 to 74 Years | 521 (98.3%) | 299 (56.4%) |
| 75 Years and over | 303 (100.0%) | 150 (49.5%) |
| Total | 2,630 (45.2%) | 3,436 (59.1%) |
Disability Status by Sex by Age in Belding
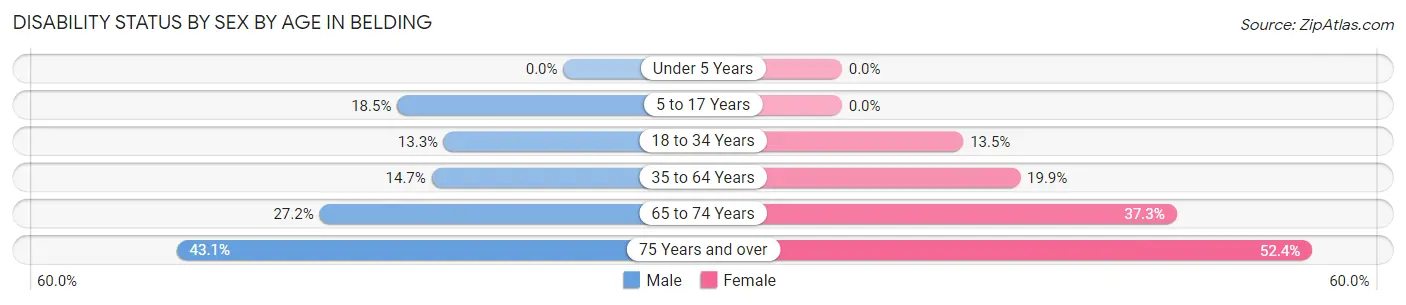
| Age Bracket | Male | Female |
| Under 5 Years | 0 (0.0%) | 0 (0.0%) |
| 5 to 17 Years | 101 (18.5%) | 0 (0.0%) |
| 18 to 34 Years | 91 (13.3%) | 83 (13.5%) |
| 35 to 64 Years | 171 (14.7%) | 226 (19.9%) |
| 65 to 74 Years | 66 (27.2%) | 107 (37.3%) |
| 75 Years and over | 31 (43.1%) | 121 (52.4%) |
Disability Class by Sex by Age in Belding
Disability Class: Hearing Difficulty
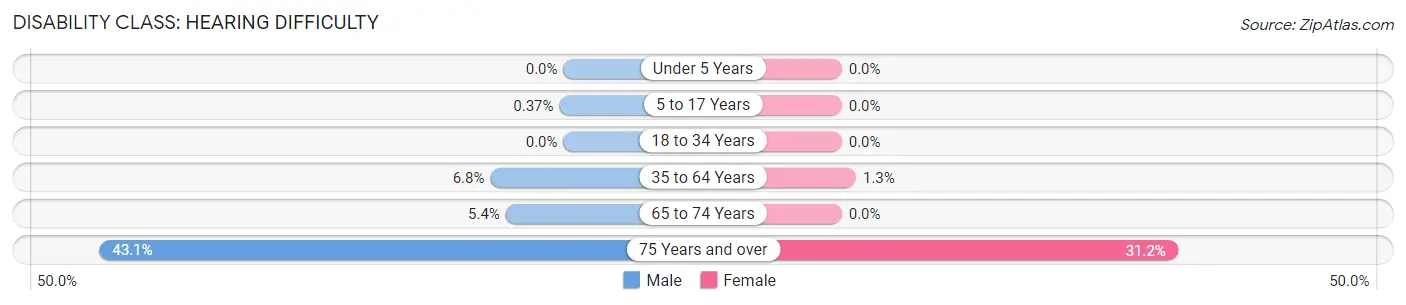
| Age Bracket | Male | Female |
| Under 5 Years | 0 (0.0%) | 0 (0.0%) |
| 5 to 17 Years | 2 (0.4%) | 0 (0.0%) |
| 18 to 34 Years | 0 (0.0%) | 0 (0.0%) |
| 35 to 64 Years | 79 (6.8%) | 15 (1.3%) |
| 65 to 74 Years | 13 (5.3%) | 0 (0.0%) |
| 75 Years and over | 31 (43.1%) | 72 (31.2%) |
Disability Class: Vision Difficulty
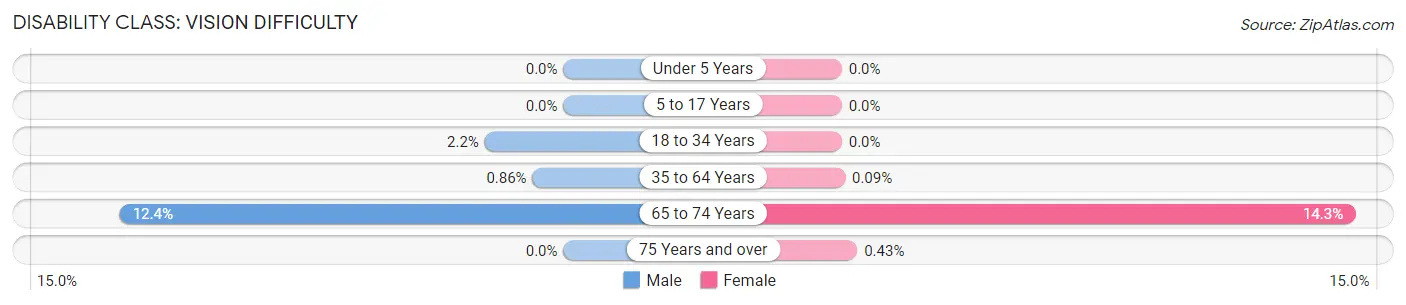
| Age Bracket | Male | Female |
| Under 5 Years | 0 (0.0%) | 0 (0.0%) |
| 5 to 17 Years | 0 (0.0%) | 0 (0.0%) |
| 18 to 34 Years | 15 (2.2%) | 0 (0.0%) |
| 35 to 64 Years | 10 (0.9%) | 1 (0.1%) |
| 65 to 74 Years | 30 (12.3%) | 41 (14.3%) |
| 75 Years and over | 0 (0.0%) | 1 (0.4%) |
Disability Class: Cognitive Difficulty
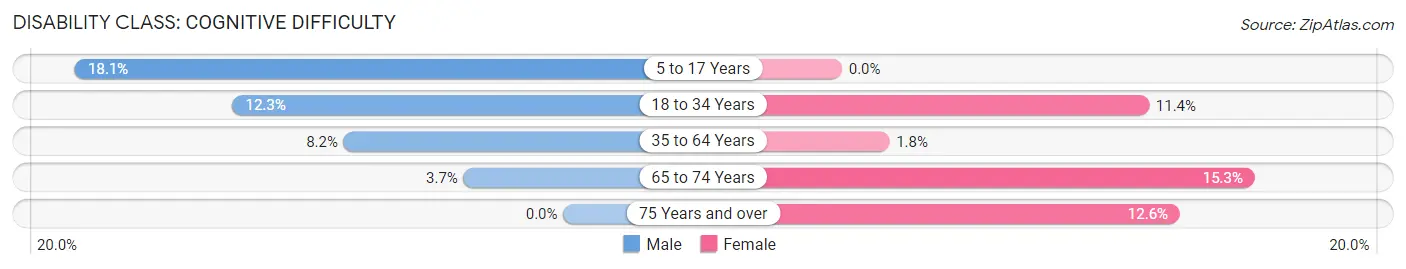
| Age Bracket | Male | Female |
| 5 to 17 Years | 99 (18.1%) | 0 (0.0%) |
| 18 to 34 Years | 84 (12.3%) | 70 (11.4%) |
| 35 to 64 Years | 95 (8.2%) | 20 (1.8%) |
| 65 to 74 Years | 9 (3.7%) | 44 (15.3%) |
| 75 Years and over | 0 (0.0%) | 29 (12.6%) |
Disability Class: Ambulatory Difficulty
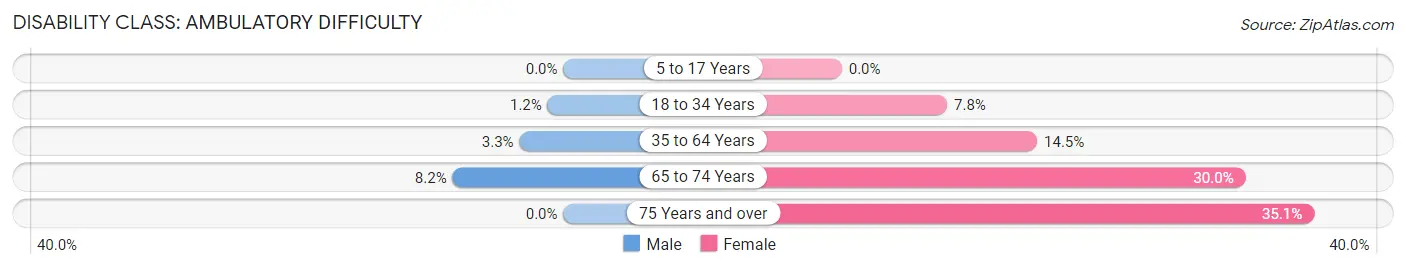
| Age Bracket | Male | Female |
| 5 to 17 Years | 0 (0.0%) | 0 (0.0%) |
| 18 to 34 Years | 8 (1.2%) | 48 (7.8%) |
| 35 to 64 Years | 38 (3.3%) | 165 (14.5%) |
| 65 to 74 Years | 20 (8.2%) | 86 (30.0%) |
| 75 Years and over | 0 (0.0%) | 81 (35.1%) |
Disability Class: Self-Care Difficulty
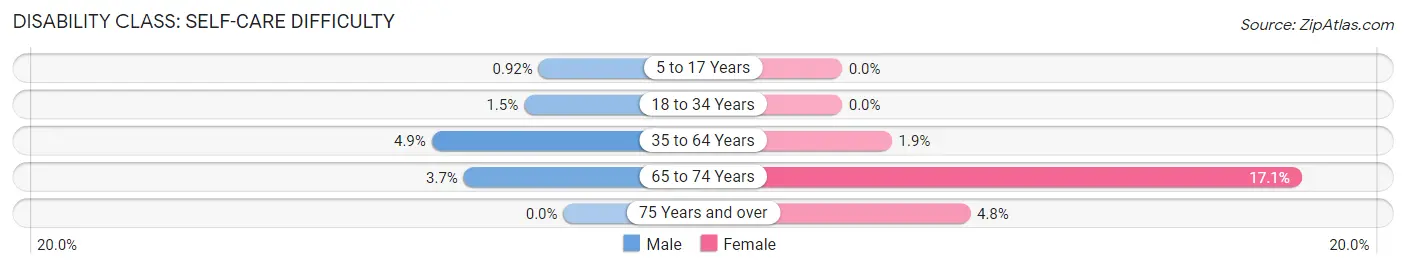
| Age Bracket | Male | Female |
| 5 to 17 Years | 5 (0.9%) | 0 (0.0%) |
| 18 to 34 Years | 10 (1.5%) | 0 (0.0%) |
| 35 to 64 Years | 57 (4.9%) | 21 (1.8%) |
| 65 to 74 Years | 9 (3.7%) | 49 (17.1%) |
| 75 Years and over | 0 (0.0%) | 11 (4.8%) |
Technology Access in Belding
Computing Device Access in Belding
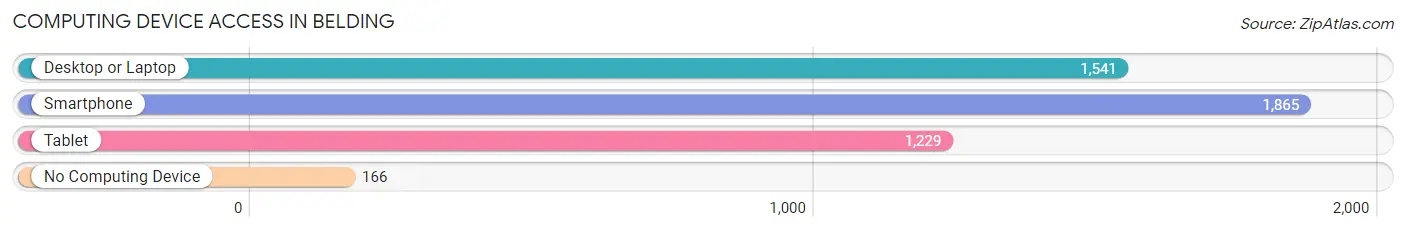
| Device Type | # Households | % Households |
| Desktop or Laptop | 1,541 | 71.7% |
| Smartphone | 1,865 | 86.8% |
| Tablet | 1,229 | 57.2% |
| No Computing Device | 166 | 7.7% |
| Total | 2,148 | 100.0% |
Internet Access in Belding
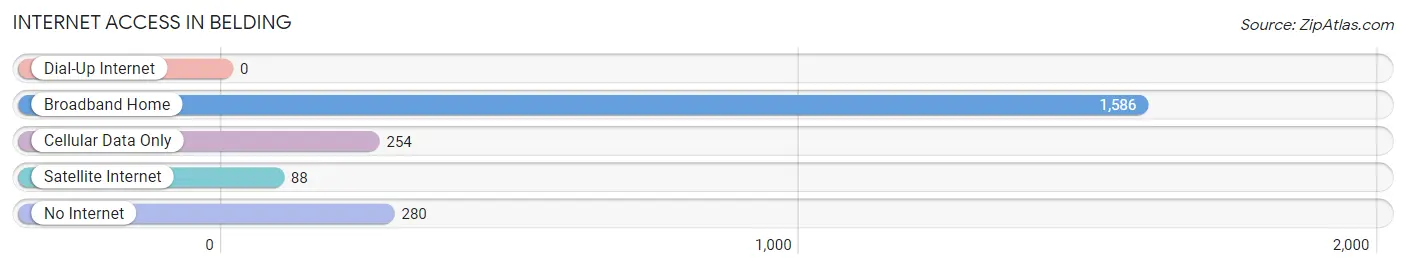
| Internet Type | # Households | % Households |
| Dial-Up Internet | 0 | 0.0% |
| Broadband Home | 1,586 | 73.8% |
| Cellular Data Only | 254 | 11.8% |
| Satellite Internet | 88 | 4.1% |
| No Internet | 280 | 13.0% |
| Total | 2,148 | 100.0% |
Belding Summary
Belding is a city located in Ionia County, Michigan, United States. It is situated in the Grand River Valley, approximately 30 miles east of Grand Rapids. The population was 5,757 at the 2010 census.
History
Belding was founded in 1871 by brothers George and Charles Belding, who were from New York. The brothers purchased a large tract of land in the area and began to develop it. They built a sawmill, a grist mill, and a woolen mill, and the town quickly grew. The Belding brothers also established a post office in 1871, and the town was officially incorporated in 1891.
The Belding brothers were instrumental in the development of the town, and their legacy is still evident today. The Belding Brothers Company was the largest employer in the area for many years, and the company's woolen mill was the largest in the world at one time. The company was eventually sold to the American Woolen Company in 1929.
Geography
Belding is located at 42°53′45″N 85°14′45″W (42.895833, -85.245833). According to the United States Census Bureau, the city has a total area of 4.17 square miles (10.78 km2), of which 4.14 square miles (10.71 km2) is land and 0.03 square miles (0.07 km2) is water.
Economy
Belding's economy is largely based on manufacturing and agriculture. The city is home to several manufacturing companies, including Belding Tool & Die, Belding Machine & Tool, and Belding Manufacturing. The city is also home to several agricultural businesses, including Belding Farms, Belding Dairy, and Belding Produce.
Belding is also home to several retail businesses, including several restaurants, a grocery store, and several specialty shops. The city is also home to several medical facilities, including a hospital, a nursing home, and several medical offices.
Demographics
As of the census of 2010, there were 5,757 people, 2,310 households, and 1,541 families residing in the city. The population density was 1,400.3 inhabitants per square mile (540.3/km2). There were 2,521 housing units at an average density of 611.3 per square mile (235.6/km2). The racial makeup of the city was 94.2% White, 0.7% African American, 0.5% Native American, 0.5% Asian, 2.2% from other races, and 1.9% from two or more races. Hispanic or Latino of any race were 5.2% of the population.
There were 2,310 households, of which 33.2% had children under the age of 18 living with them, 48.2% were married couples living together, 13.3% had a female householder with no husband present, 5.3% had a male householder with no wife present, and 33.2% were non-families. 28.2% of all households were made up of individuals, and 11.7% had someone living alone who was 65 years of age or older. The average household size was 2.48 and the average family size was 3.02.
The median age in the city was 37.7 years. 25.7% of residents were under the age of 18; 8.3% were between the ages of 18 and 24; 25.2% were from 25 to 44; 25.7% were from 45 to 64; and 14.9% were 65 years of age or older. The gender makeup of the city was 48.2% male and 51.8% female.
Belding is a diverse community with a strong sense of community and pride. The city is home to several parks, a library, and a variety of recreational activities. The city also hosts several annual events, including the Belding Summer Festival and the Belding Balloon Festival.
Common Questions
What is Per Capita Income in Belding?
Per Capita income in Belding is $23,720.
What is the Median Family Income in Belding?
Median Family Income in Belding is $62,424.
What is the Median Household income in Belding?
Median Household Income in Belding is $52,083.
What is Income or Wage Gap in Belding?
Income or Wage Gap in Belding is 27.8%.
Women in Belding earn 72.2 cents for every dollar earned by a man.
What is Family Income Deficit in Belding?
Family Income Deficit in Belding is $11,812.
Families that are below poverty line in Belding earn $11,812 less on average than the poverty threshold level.
What is Inequality or Gini Index in Belding?
Inequality or Gini Index in Belding is 0.38.
What is the Total Population of Belding?
Total Population of Belding is 5,942.
What is the Total Male Population of Belding?
Total Male Population of Belding is 2,933.
What is the Total Female Population of Belding?
Total Female Population of Belding is 3,009.
What is the Ratio of Males per 100 Females in Belding?
There are 97.47 Males per 100 Females in Belding.
What is the Ratio of Females per 100 Males in Belding?
There are 102.59 Females per 100 Males in Belding.
What is the Median Population Age in Belding?
Median Population Age in Belding is 36.8 Years.
What is the Average Family Size in Belding
Average Family Size in Belding is 3.3 People.
What is the Average Household Size in Belding
Average Household Size in Belding is 2.7 People.
How Large is the Labor Force in Belding?
There are 2,914 People in the Labor Forcein in Belding.
What is the Percentage of People in the Labor Force in Belding?
61.1% of People are in the Labor Force in Belding.
What is the Unemployment Rate in Belding?
Unemployment Rate in Belding is 8.0%.