Kent Acres, DE Map & Demographics
Kent Acres Map
Kent Acres Overview
$28,900
PER CAPITA INCOME
$68,409
AVG FAMILY INCOME
$68,162
AVG HOUSEHOLD INCOME
6.8%
WAGE / INCOME GAP [ % ]
93.2¢/ $1
WAGE / INCOME GAP [ $ ]
0.39
INEQUALITY / GINI INDEX
2,124
TOTAL POPULATION
1,095
MALE POPULATION
1,029
FEMALE POPULATION
106.41
MALES / 100 FEMALES
93.97
FEMALES / 100 MALES
29.9
MEDIAN AGE
3.6
AVG FAMILY SIZE
2.9
AVG HOUSEHOLD SIZE
971
LABOR FORCE [ PEOPLE ]
62.1%
PERCENT IN LABOR FORCE
6.8%
UNEMPLOYMENT RATE
Income in Kent Acres
Income Overview in Kent Acres
Per Capita Income in Kent Acres is $28,900, while median incomes of families and households are $68,409 and $68,162 respectively.
| Characteristic | Number | Measure |
| Per Capita Income | 2,124 | $28,900 |
| Median Family Income | 484 | $68,409 |
| Mean Family Income | 484 | $90,435 |
| Median Household Income | 721 | $68,162 |
| Mean Household Income | 721 | $82,286 |
| Income Deficit | 484 | $0 |
| Wage / Income Gap (%) | 2,124 | 6.77% |
| Wage / Income Gap ($) | 2,124 | 93.23¢ per $1 |
| Gini / Inequality Index | 2,124 | 0.39 |
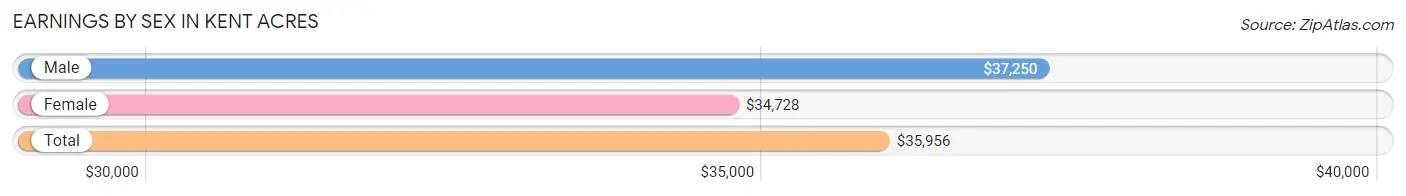
Earnings by Sex in Kent Acres
Average Earnings in Kent Acres are $35,956, $37,250 for men and $34,728 for women, a difference of 6.8%.
| Sex | Number | Average Earnings |
| Male | 598 (60.0%) | $37,250 |
| Female | 399 (40.0%) | $34,728 |
| Total | 997 (100.0%) | $35,956 |
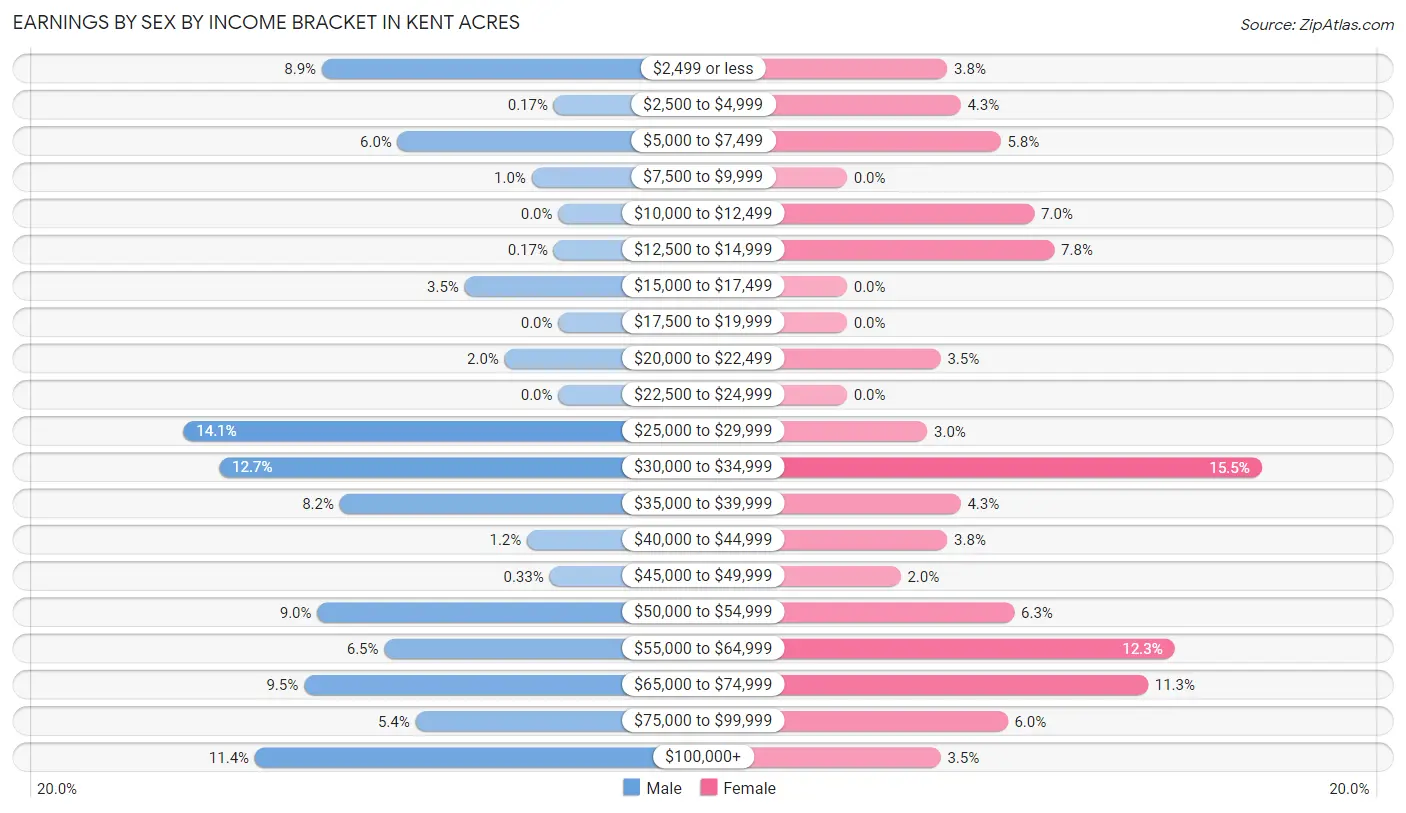
Earnings by Sex by Income Bracket in Kent Acres
The most common earnings brackets in Kent Acres are $25,000 to $29,999 for men (84 | 14.1%) and $30,000 to $34,999 for women (62 | 15.5%).
| Income | Male | Female |
| $2,499 or less | 53 (8.9%) | 15 (3.8%) |
| $2,500 to $4,999 | 1 (0.2%) | 17 (4.3%) |
| $5,000 to $7,499 | 36 (6.0%) | 23 (5.8%) |
| $7,500 to $9,999 | 6 (1.0%) | 0 (0.0%) |
| $10,000 to $12,499 | 0 (0.0%) | 28 (7.0%) |
| $12,500 to $14,999 | 1 (0.2%) | 31 (7.8%) |
| $15,000 to $17,499 | 21 (3.5%) | 0 (0.0%) |
| $17,500 to $19,999 | 0 (0.0%) | 0 (0.0%) |
| $20,000 to $22,499 | 12 (2.0%) | 14 (3.5%) |
| $22,500 to $24,999 | 0 (0.0%) | 0 (0.0%) |
| $25,000 to $29,999 | 84 (14.1%) | 12 (3.0%) |
| $30,000 to $34,999 | 76 (12.7%) | 62 (15.5%) |
| $35,000 to $39,999 | 49 (8.2%) | 17 (4.3%) |
| $40,000 to $44,999 | 7 (1.2%) | 15 (3.8%) |
| $45,000 to $49,999 | 2 (0.3%) | 8 (2.0%) |
| $50,000 to $54,999 | 54 (9.0%) | 25 (6.3%) |
| $55,000 to $64,999 | 39 (6.5%) | 49 (12.3%) |
| $65,000 to $74,999 | 57 (9.5%) | 45 (11.3%) |
| $75,000 to $99,999 | 32 (5.3%) | 24 (6.0%) |
| $100,000+ | 68 (11.4%) | 14 (3.5%) |
| Total | 598 (100.0%) | 399 (100.0%) |
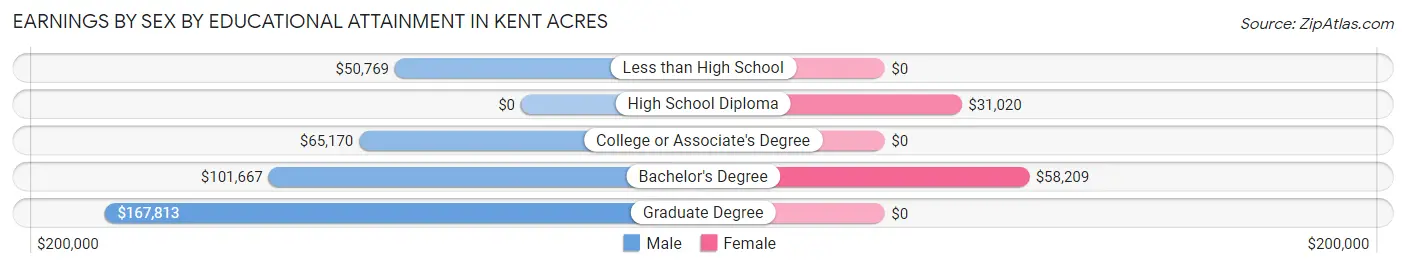
Earnings by Sex by Educational Attainment in Kent Acres
Average earnings in Kent Acres are $58,306 for men and $38,875 for women, a difference of 33.3%. Men with an educational attainment of graduate degree enjoy the highest average annual earnings of $167,813, while those with less than high school education earn the least with $50,769. Women with an educational attainment of bachelor's degree earn the most with the average annual earnings of $58,209, while those with high school diploma education have the smallest earnings of $31,020.
| Educational Attainment | Male Income | Female Income |
| Less than High School | $50,769 | $0 |
| High School Diploma | - | - |
| College or Associate's Degree | $65,170 | $0 |
| Bachelor's Degree | $101,667 | $58,209 |
| Graduate Degree | $167,813 | $0 |
| Total | $58,306 | $38,875 |
Family Income in Kent Acres
Family Income Brackets in Kent Acres
According to the Kent Acres family income data, there are 117 families falling into the $100,000 to $149,999 income range, which is the most common income bracket and makes up 24.2% of all families.
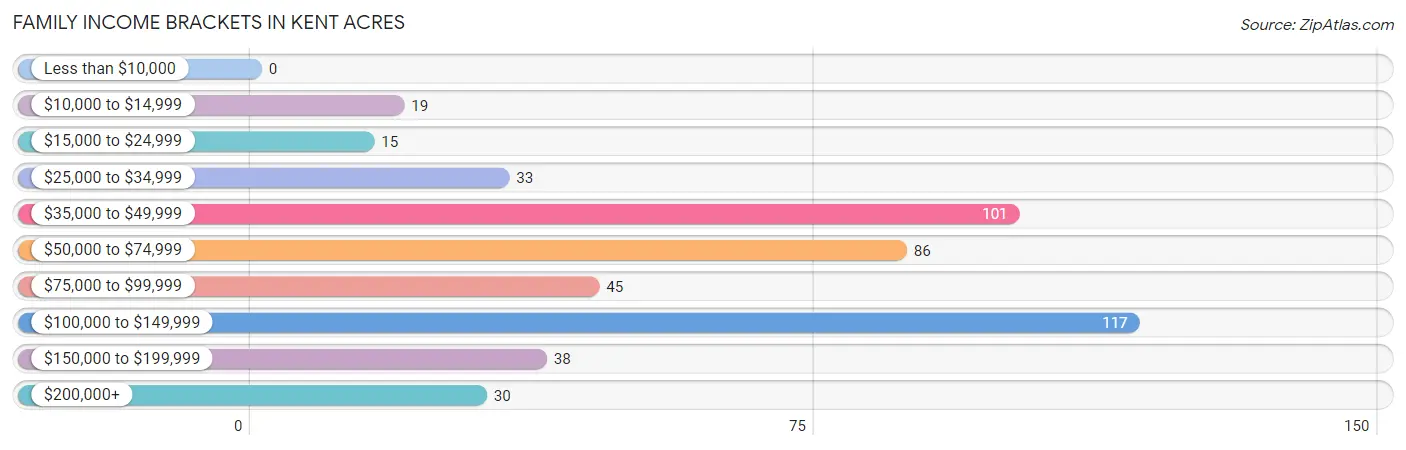
| Income Bracket | # Families | % Families |
| Less than $10,000 | 0 | 0.0% |
| $10,000 to $14,999 | 19 | 3.9% |
| $15,000 to $24,999 | 15 | 3.1% |
| $25,000 to $34,999 | 33 | 6.8% |
| $35,000 to $49,999 | 101 | 20.9% |
| $50,000 to $74,999 | 86 | 17.8% |
| $75,000 to $99,999 | 45 | 9.3% |
| $100,000 to $149,999 | 117 | 24.2% |
| $150,000 to $199,999 | 38 | 7.9% |
| $200,000+ | 30 | 6.2% |
Family Income by Famaliy Size in Kent Acres
4-person families (205 | 42.4%) account for the highest median family income in Kent Acres with $108,083 per family, while 3-person families (32 | 6.6%) have the highest median income of $35,227 per family member.
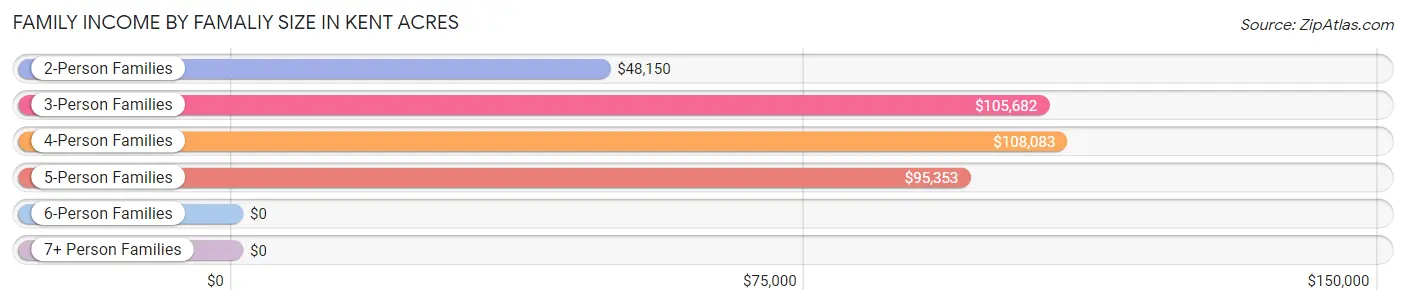
| Income Bracket | # Families | Median Income |
| 2-Person Families | 155 (32.0%) | $48,150 |
| 3-Person Families | 32 (6.6%) | $105,682 |
| 4-Person Families | 205 (42.4%) | $108,083 |
| 5-Person Families | 79 (16.3%) | $95,353 |
| 6-Person Families | 13 (2.7%) | $0 |
| 7+ Person Families | 0 (0.0%) | $0 |
| Total | 484 (100.0%) | $68,409 |
Family Income by Number of Earners in Kent Acres
The median family income in Kent Acres is $68,409, with families comprising 2 earners (152) having the highest median family income of $109,000, while families with no earners (97) have the lowest median family income of $38,463, accounting for 31.4% and 20.0% of families, respectively.
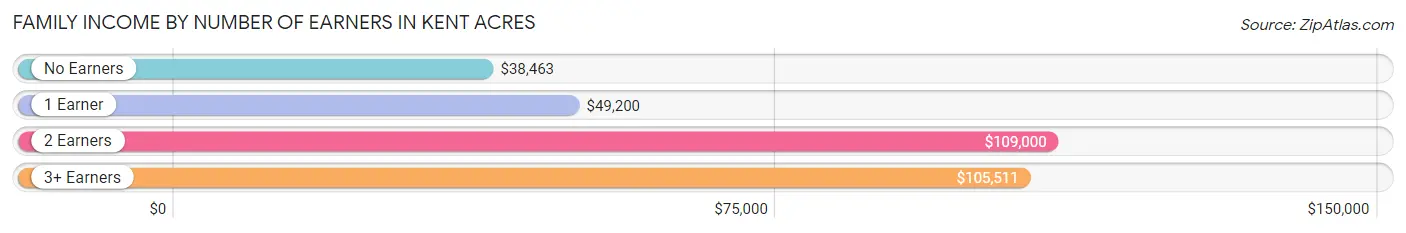
| Number of Earners | # Families | Median Income |
| No Earners | 97 (20.0%) | $38,463 |
| 1 Earner | 128 (26.5%) | $49,200 |
| 2 Earners | 152 (31.4%) | $109,000 |
| 3+ Earners | 107 (22.1%) | $105,511 |
| Total | 484 (100.0%) | $68,409 |
Household Income in Kent Acres
Household Income Brackets in Kent Acres
With 233 households falling in the category, the $100,000 to $149,999 income range is the most frequent in Kent Acres, accounting for 32.3% of all households. In contrast, only 20 households (2.8%) fall into the $10,000 to $14,999 income bracket, making it the least populous group.
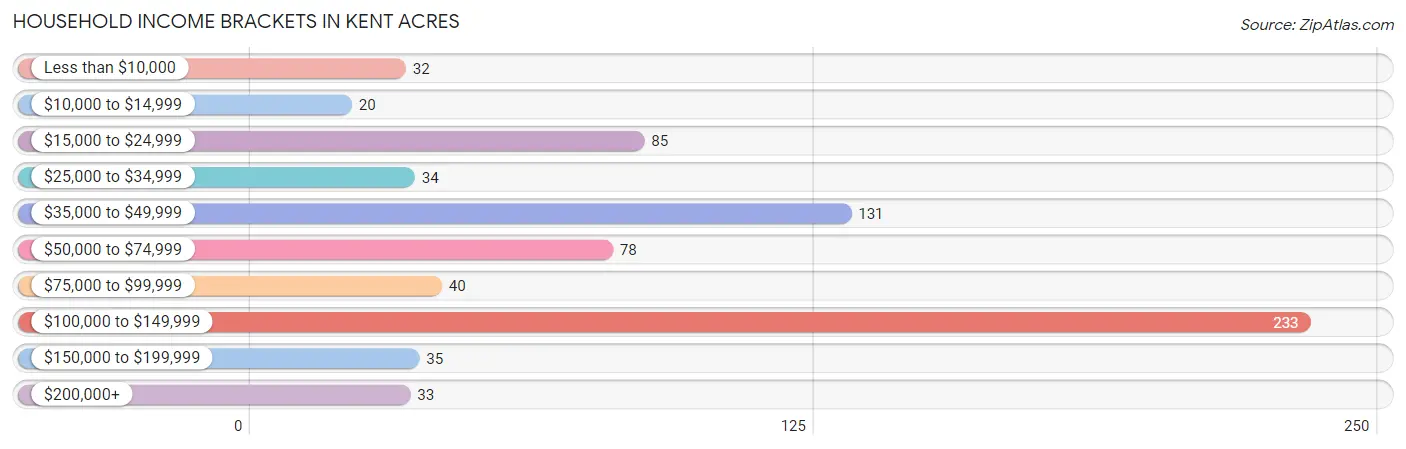
| Income Bracket | # Households | % Households |
| Less than $10,000 | 32 | 4.4% |
| $10,000 to $14,999 | 20 | 2.8% |
| $15,000 to $24,999 | 85 | 11.8% |
| $25,000 to $34,999 | 34 | 4.7% |
| $35,000 to $49,999 | 131 | 18.2% |
| $50,000 to $74,999 | 78 | 10.8% |
| $75,000 to $99,999 | 40 | 5.5% |
| $100,000 to $149,999 | 233 | 32.3% |
| $150,000 to $199,999 | 35 | 4.9% |
| $200,000+ | 33 | 4.6% |
Household Income by Householder Age in Kent Acres
The median household income in Kent Acres is $68,162, with the highest median household income of $115,395 found in the 25 to 44 years age bracket for the primary householder. A total of 208 households (28.8%) fall into this category. Meanwhile, the 15 to 24 years age bracket for the primary householder has the lowest median household income of $0, with 1 households (0.1%) in this group.
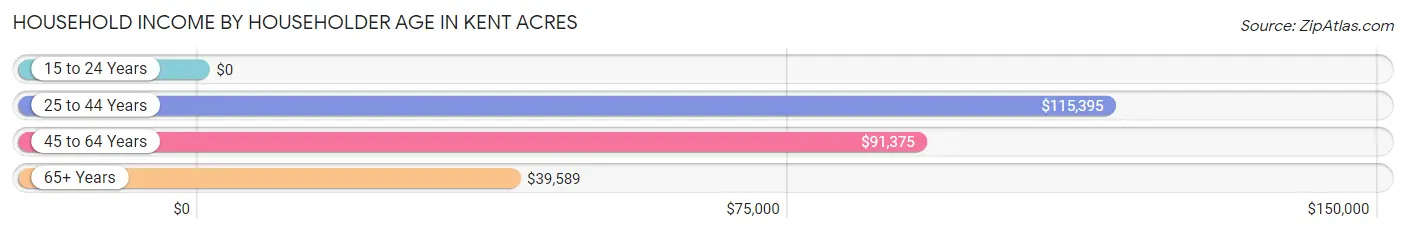
| Income Bracket | # Households | Median Income |
| 15 to 24 Years | 1 (0.1%) | $0 |
| 25 to 44 Years | 208 (28.8%) | $115,395 |
| 45 to 64 Years | 303 (42.0%) | $91,375 |
| 65+ Years | 209 (29.0%) | $39,589 |
| Total | 721 (100.0%) | $68,162 |
Poverty in Kent Acres
Income Below Poverty by Sex and Age in Kent Acres
With 16.4% poverty level for males and 15.1% for females among the residents of Kent Acres, 55 to 64 year old males and 6 to 11 year old females are the most vulnerable to poverty, with 46 males (50.5%) and 21 females (61.8%) in their respective age groups living below the poverty level.
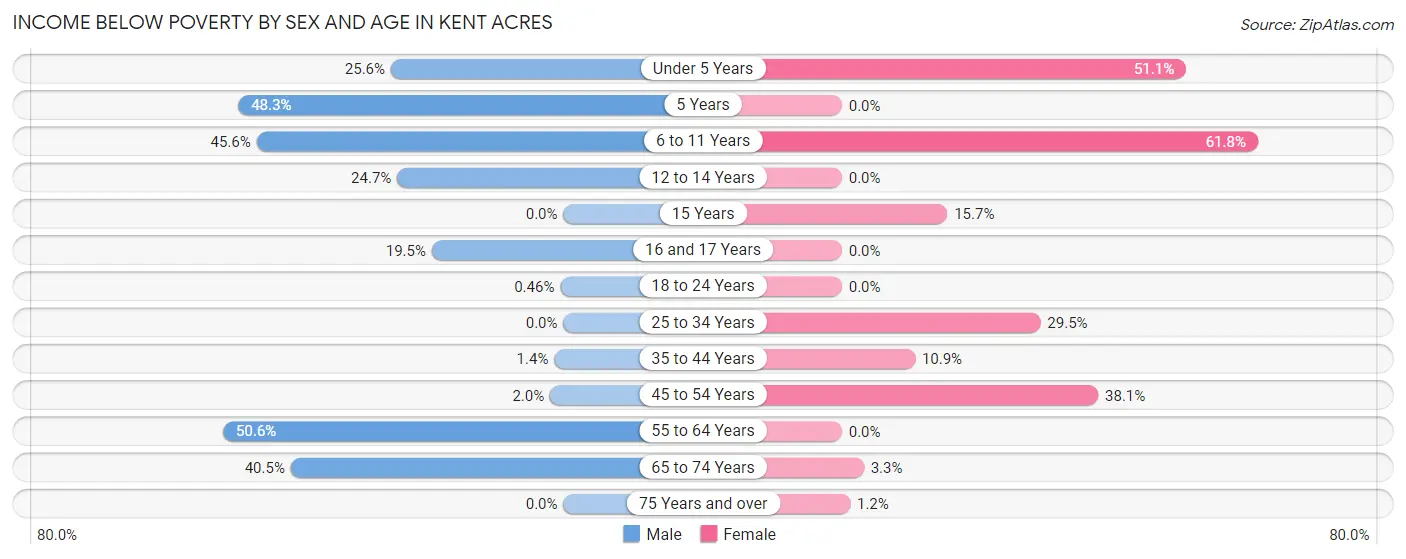
| Age Bracket | Male | Female |
| Under 5 Years | 21 (25.6%) | 23 (51.1%) |
| 5 Years | 14 (48.3%) | 0 (0.0%) |
| 6 to 11 Years | 41 (45.6%) | 21 (61.8%) |
| 12 to 14 Years | 19 (24.7%) | 0 (0.0%) |
| 15 Years | 0 (0.0%) | 13 (15.7%) |
| 16 and 17 Years | 17 (19.5%) | 0 (0.0%) |
| 18 to 24 Years | 1 (0.5%) | 0 (0.0%) |
| 25 to 34 Years | 0 (0.0%) | 23 (29.5%) |
| 35 to 44 Years | 1 (1.3%) | 19 (10.9%) |
| 45 to 54 Years | 3 (2.0%) | 51 (38.1%) |
| 55 to 64 Years | 46 (50.5%) | 0 (0.0%) |
| 65 to 74 Years | 17 (40.5%) | 4 (3.3%) |
| 75 Years and over | 0 (0.0%) | 1 (1.2%) |
| Total | 180 (16.4%) | 155 (15.1%) |
Income Above Poverty by Sex and Age in Kent Acres
According to the poverty statistics in Kent Acres, males aged 15 years and females aged 5 years are the age groups that are most secure financially, with 100.0% of males and 100.0% of females in these age groups living above the poverty line.
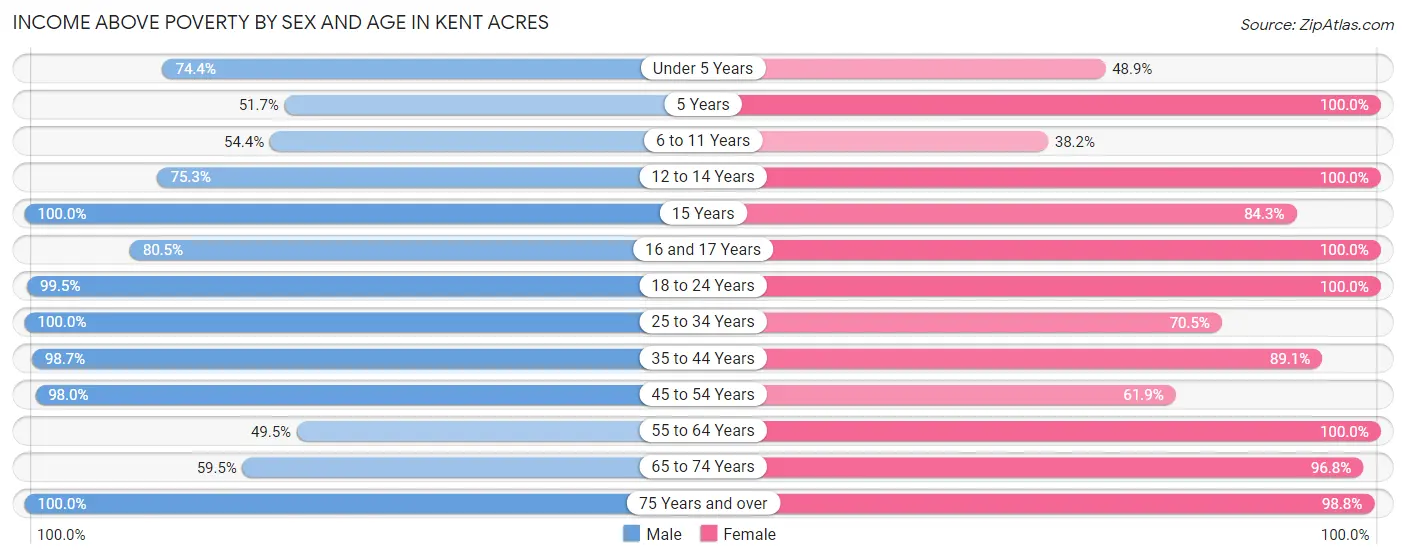
| Age Bracket | Male | Female |
| Under 5 Years | 61 (74.4%) | 22 (48.9%) |
| 5 Years | 15 (51.7%) | 31 (100.0%) |
| 6 to 11 Years | 49 (54.4%) | 13 (38.2%) |
| 12 to 14 Years | 58 (75.3%) | 72 (100.0%) |
| 15 Years | 17 (100.0%) | 70 (84.3%) |
| 16 and 17 Years | 70 (80.5%) | 8 (100.0%) |
| 18 to 24 Years | 218 (99.5%) | 98 (100.0%) |
| 25 to 34 Years | 109 (100.0%) | 55 (70.5%) |
| 35 to 44 Years | 73 (98.7%) | 156 (89.1%) |
| 45 to 54 Years | 149 (98.0%) | 83 (61.9%) |
| 55 to 64 Years | 45 (49.4%) | 66 (100.0%) |
| 65 to 74 Years | 25 (59.5%) | 119 (96.8%) |
| 75 Years and over | 26 (100.0%) | 81 (98.8%) |
| Total | 915 (83.6%) | 874 (84.9%) |
Income Below Poverty Among Married-Couple Families in Kent Acres
The poverty statistics for married-couple families in Kent Acres show that 6.2% or 15 of the total 240 families live below the poverty line. Families with 1 or 2 children have the highest poverty rate of 10.3%, comprising of 15 families. On the other hand, families with no children have the lowest poverty rate of 0.0%, which includes 0 families.
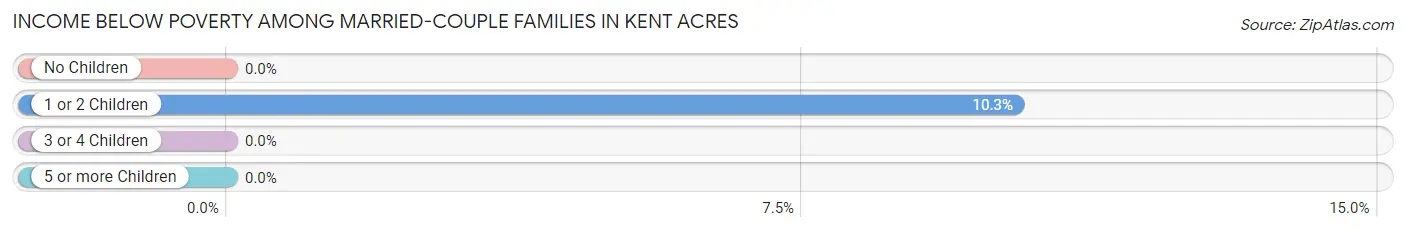
| Children | Above Poverty | Below Poverty |
| No Children | 81 (100.0%) | 0 (0.0%) |
| 1 or 2 Children | 131 (89.7%) | 15 (10.3%) |
| 3 or 4 Children | 13 (100.0%) | 0 (0.0%) |
| 5 or more Children | 0 (0.0%) | 0 (0.0%) |
| Total | 225 (93.8%) | 15 (6.2%) |
Income Below Poverty Among Single-Parent Households in Kent Acres
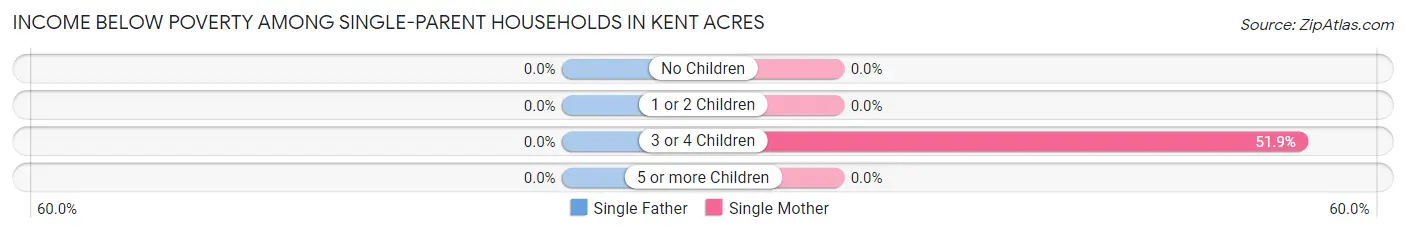
| Children | Single Father | Single Mother |
| No Children | 0 (0.0%) | 0 (0.0%) |
| 1 or 2 Children | 0 (0.0%) | 0 (0.0%) |
| 3 or 4 Children | 0 (0.0%) | 42 (51.8%) |
| 5 or more Children | 0 (0.0%) | 0 (0.0%) |
| Total | 0 (0.0%) | 42 (17.5%) |
Income Below Poverty Among Married-Couple vs Single-Parent Households in Kent Acres
The poverty data for Kent Acres shows that 15 of the married-couple family households (6.2%) and 42 of the single-parent households (17.2%) are living below the poverty level. Within the married-couple family households, those with 1 or 2 children have the highest poverty rate, with 15 households (10.3%) falling below the poverty line. Among the single-parent households, those with 3 or 4 children have the highest poverty rate, with 42 household (51.8%) living below poverty.
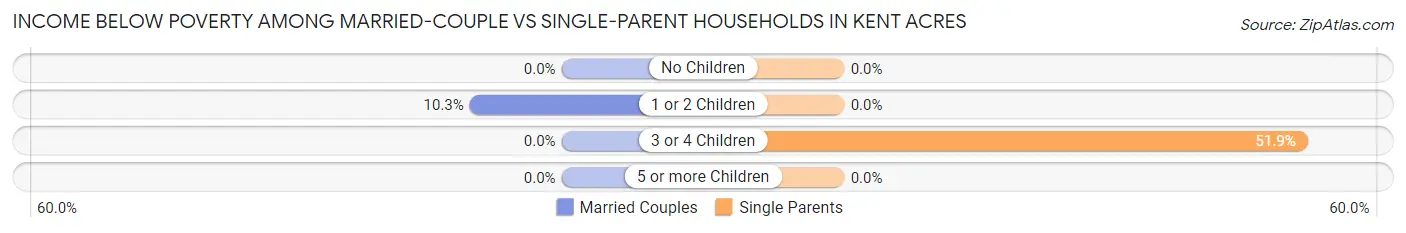
| Children | Married-Couple Families | Single-Parent Households |
| No Children | 0 (0.0%) | 0 (0.0%) |
| 1 or 2 Children | 15 (10.3%) | 0 (0.0%) |
| 3 or 4 Children | 0 (0.0%) | 42 (51.8%) |
| 5 or more Children | 0 (0.0%) | 0 (0.0%) |
| Total | 15 (6.2%) | 42 (17.2%) |
Race in Kent Acres
The most populous races in Kent Acres are White / Caucasian (843 | 39.7%), Two or more Races (672 | 31.6%), and Black / African American (512 | 24.1%).
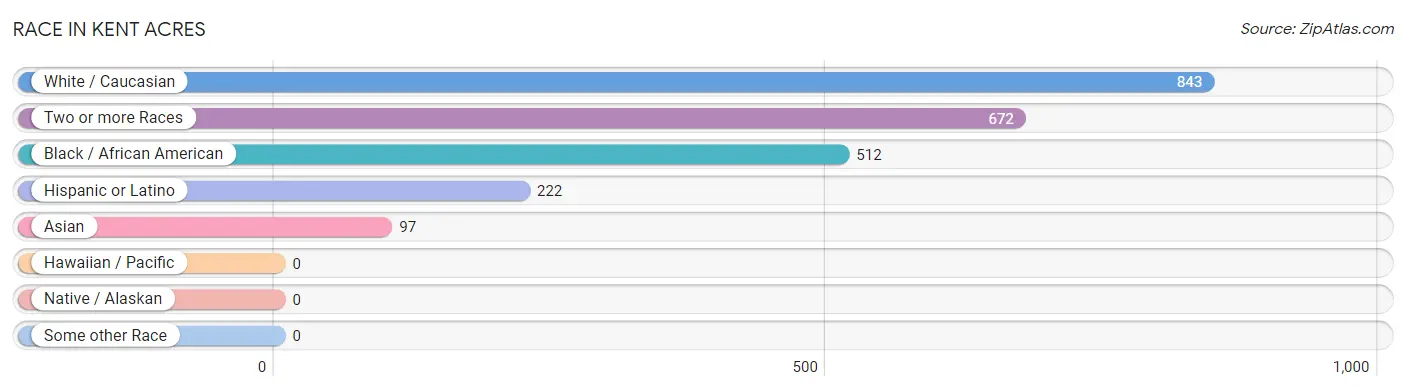
| Race | # Population | % Population |
| Asian | 97 | 4.6% |
| Black / African American | 512 | 24.1% |
| Hawaiian / Pacific | 0 | 0.0% |
| Hispanic or Latino | 222 | 10.4% |
| Native / Alaskan | 0 | 0.0% |
| White / Caucasian | 843 | 39.7% |
| Two or more Races | 672 | 31.6% |
| Some other Race | 0 | 0.0% |
| Total | 2,124 | 100.0% |
Ancestry in Kent Acres
The most populous ancestries reported in Kent Acres are German (207 | 9.8%), American (202 | 9.5%), Bhutanese (150 | 7.1%), Irish (127 | 6.0%), and Haitian (100 | 4.7%), together accounting for 37.0% of all Kent Acres residents.
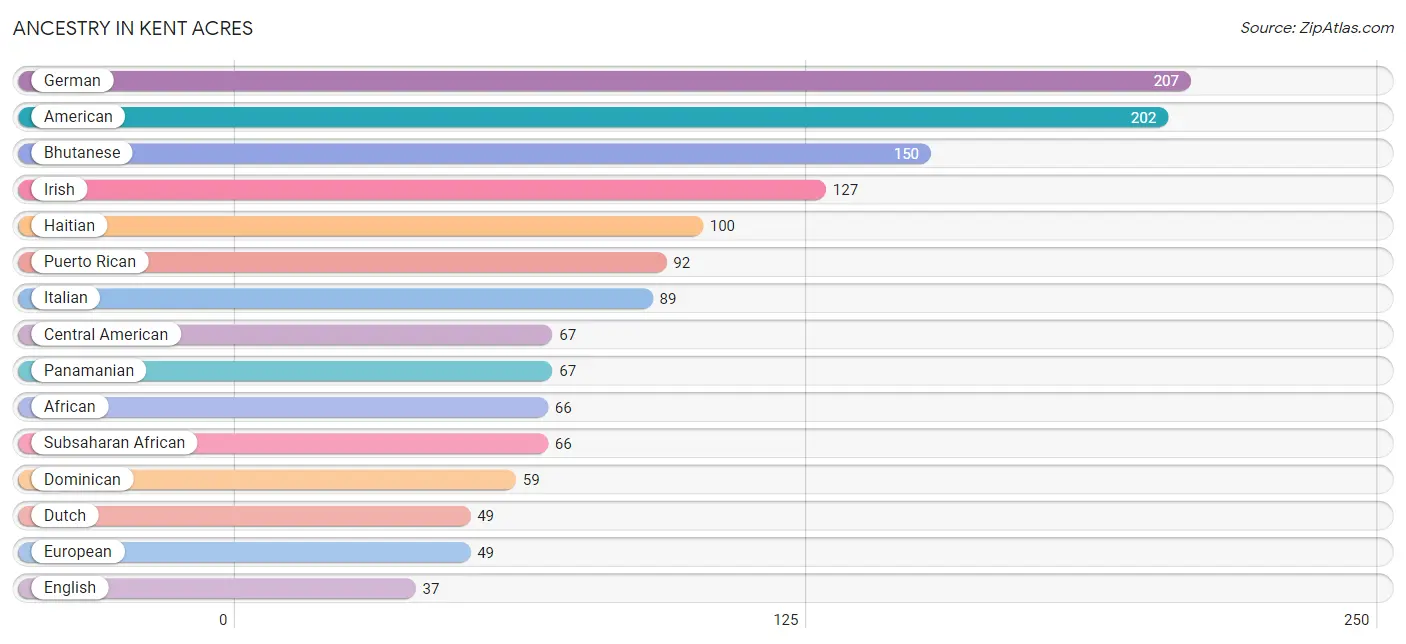
| Ancestry | # Population | % Population |
| African | 66 | 3.1% |
| American | 202 | 9.5% |
| Austrian | 24 | 1.1% |
| Bhutanese | 150 | 7.1% |
| British | 12 | 0.6% |
| Central American | 67 | 3.2% |
| Czechoslovakian | 25 | 1.2% |
| Danish | 6 | 0.3% |
| Delaware | 13 | 0.6% |
| Dominican | 59 | 2.8% |
| Dutch | 49 | 2.3% |
| English | 37 | 1.7% |
| European | 49 | 2.3% |
| Filipino | 1 | 0.1% |
| French | 8 | 0.4% |
| German | 207 | 9.8% |
| Haitian | 100 | 4.7% |
| Irish | 127 | 6.0% |
| Italian | 89 | 4.2% |
| Korean | 35 | 1.7% |
| Mexican | 4 | 0.2% |
| Norwegian | 16 | 0.7% |
| Panamanian | 67 | 3.2% |
| Polish | 28 | 1.3% |
| Puerto Rican | 92 | 4.3% |
| Scottish | 30 | 1.4% |
| Subsaharan African | 66 | 3.1% |
| Thai | 22 | 1.0% | View All 28 Rows |
Immigrants in Kent Acres
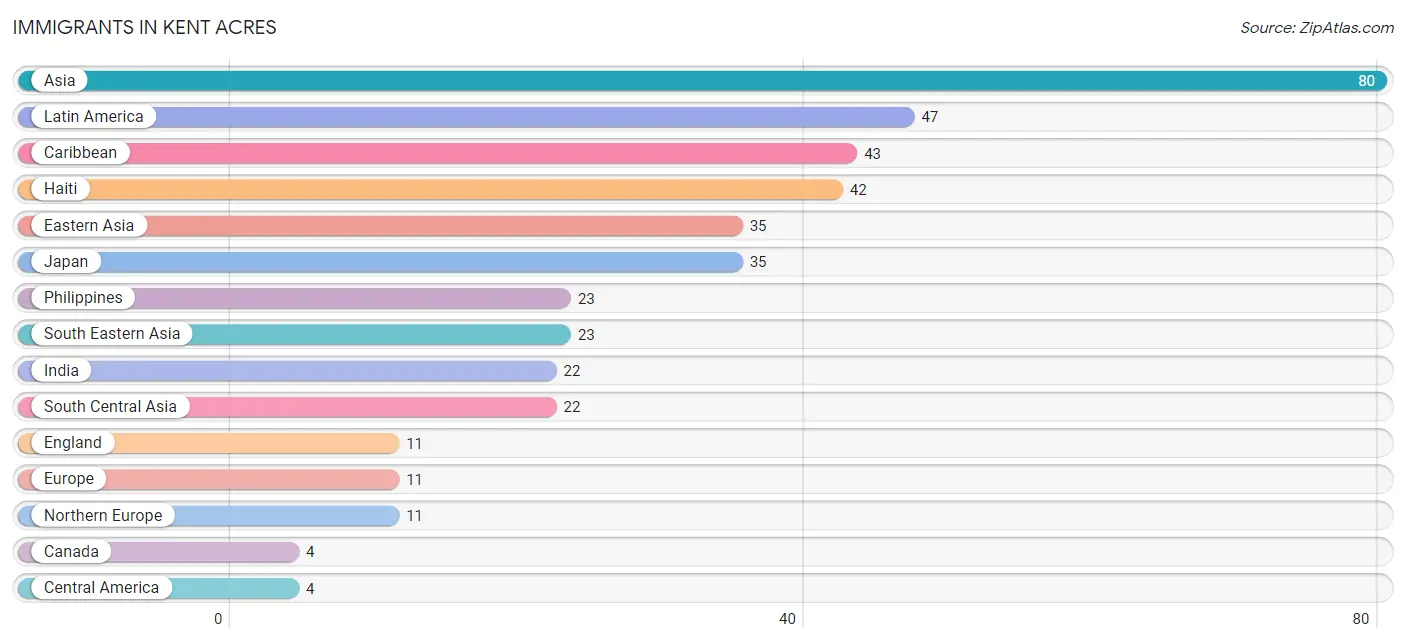
The most numerous immigrant groups reported in Kent Acres came from Asia (80 | 3.8%), Latin America (47 | 2.2%), Caribbean (43 | 2.0%), Haiti (42 | 2.0%), and Eastern Asia (35 | 1.7%), together accounting for 11.6% of all Kent Acres residents.
| Immigration Origin | # Population | % Population |
| Asia | 80 | 3.8% |
| Canada | 4 | 0.2% |
| Caribbean | 43 | 2.0% |
| Central America | 4 | 0.2% |
| Dominican Republic | 1 | 0.1% |
| Eastern Asia | 35 | 1.7% |
| England | 11 | 0.5% |
| Europe | 11 | 0.5% |
| Haiti | 42 | 2.0% |
| India | 22 | 1.0% |
| Japan | 35 | 1.7% |
| Latin America | 47 | 2.2% |
| Mexico | 4 | 0.2% |
| Northern Europe | 11 | 0.5% |
| Philippines | 23 | 1.1% |
| South Central Asia | 22 | 1.0% |
| South Eastern Asia | 23 | 1.1% | View All 17 Rows |
Sex and Age in Kent Acres
Sex and Age in Kent Acres
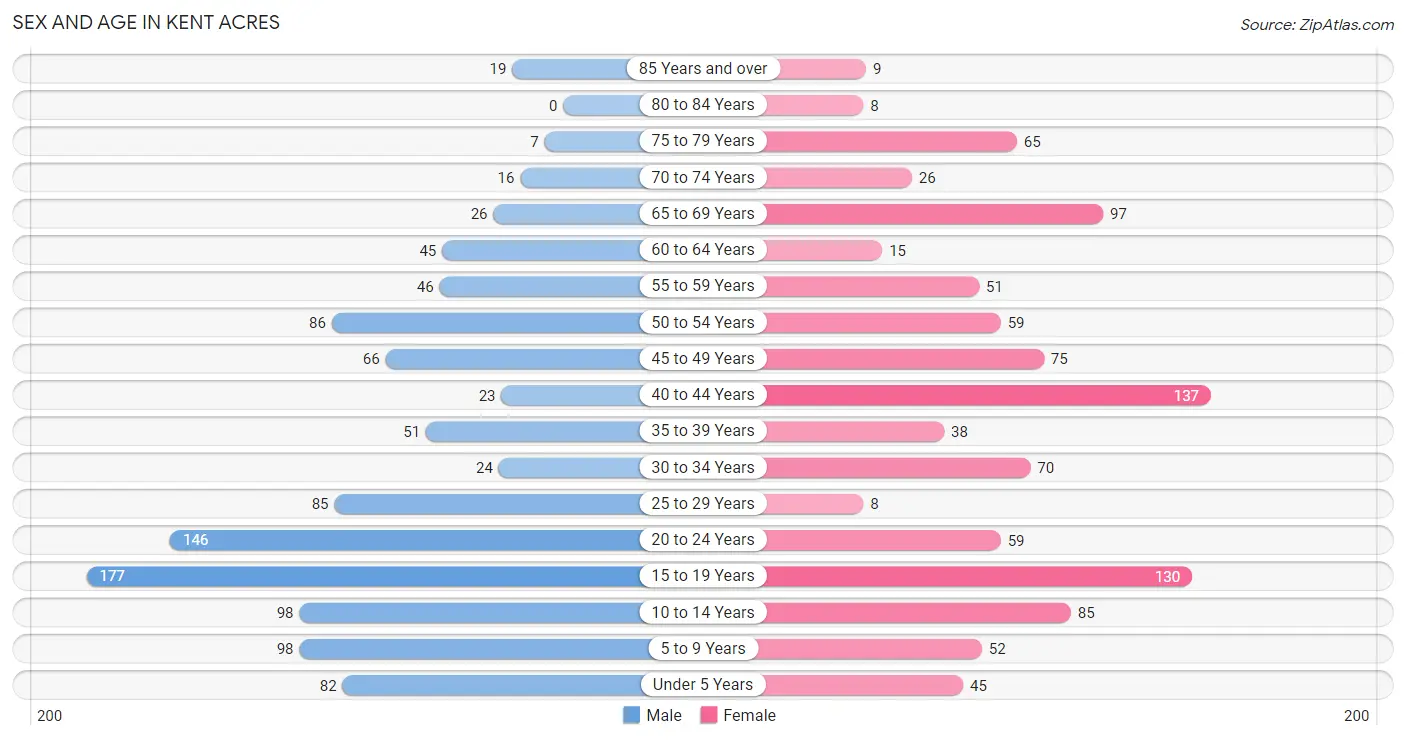
The most populous age groups in Kent Acres are 15 to 19 Years (177 | 16.2%) for men and 40 to 44 Years (137 | 13.3%) for women.
| Age Bracket | Male | Female |
| Under 5 Years | 82 (7.5%) | 45 (4.4%) |
| 5 to 9 Years | 98 (8.9%) | 52 (5.1%) |
| 10 to 14 Years | 98 (8.9%) | 85 (8.3%) |
| 15 to 19 Years | 177 (16.2%) | 130 (12.6%) |
| 20 to 24 Years | 146 (13.3%) | 59 (5.7%) |
| 25 to 29 Years | 85 (7.8%) | 8 (0.8%) |
| 30 to 34 Years | 24 (2.2%) | 70 (6.8%) |
| 35 to 39 Years | 51 (4.7%) | 38 (3.7%) |
| 40 to 44 Years | 23 (2.1%) | 137 (13.3%) |
| 45 to 49 Years | 66 (6.0%) | 75 (7.3%) |
| 50 to 54 Years | 86 (7.9%) | 59 (5.7%) |
| 55 to 59 Years | 46 (4.2%) | 51 (5.0%) |
| 60 to 64 Years | 45 (4.1%) | 15 (1.5%) |
| 65 to 69 Years | 26 (2.4%) | 97 (9.4%) |
| 70 to 74 Years | 16 (1.5%) | 26 (2.5%) |
| 75 to 79 Years | 7 (0.6%) | 65 (6.3%) |
| 80 to 84 Years | 0 (0.0%) | 8 (0.8%) |
| 85 Years and over | 19 (1.7%) | 9 (0.9%) |
| Total | 1,095 (100.0%) | 1,029 (100.0%) |
Families and Households in Kent Acres
Median Family Size in Kent Acres
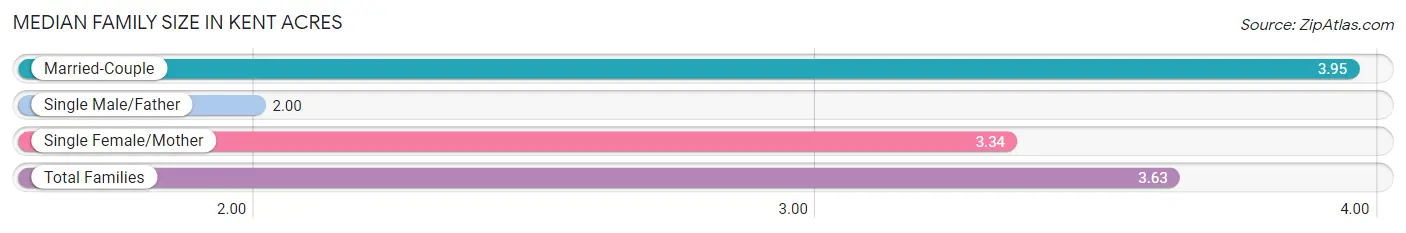
The median family size in Kent Acres is 3.63 persons per family, with married-couple families (240 | 49.6%) accounting for the largest median family size of 3.95 persons per family. On the other hand, single male/father families (4 | 0.8%) represent the smallest median family size with 2.00 persons per family.
| Family Type | # Families | Family Size |
| Married-Couple | 240 (49.6%) | 3.95 |
| Single Male/Father | 4 (0.8%) | 2.00 |
| Single Female/Mother | 240 (49.6%) | 3.34 |
| Total Families | 484 (100.0%) | 3.63 |
Median Household Size in Kent Acres
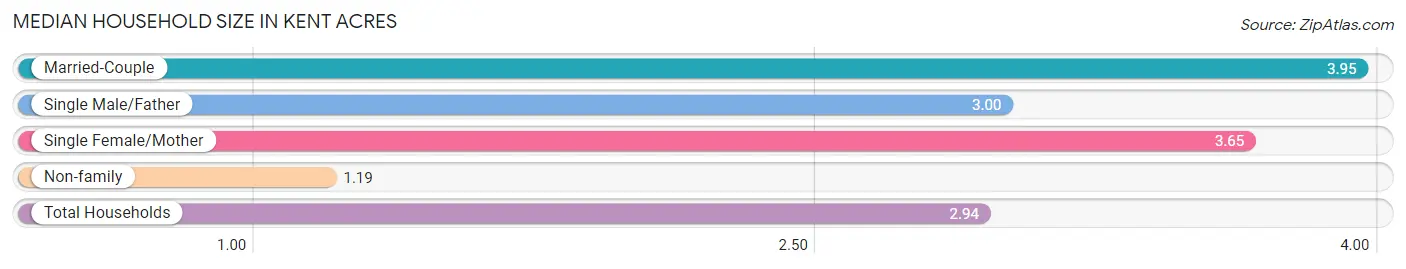
The median household size in Kent Acres is 2.94 persons per household, with married-couple households (240 | 33.3%) accounting for the largest median household size of 3.95 persons per household. non-family households (237 | 32.9%) represent the smallest median household size with 1.19 persons per household.
| Household Type | # Households | Household Size |
| Married-Couple | 240 (33.3%) | 3.95 |
| Single Male/Father | 4 (0.5%) | 3.00 |
| Single Female/Mother | 240 (33.3%) | 3.65 |
| Non-family | 237 (32.9%) | 1.19 |
| Total Households | 721 (100.0%) | 2.94 |
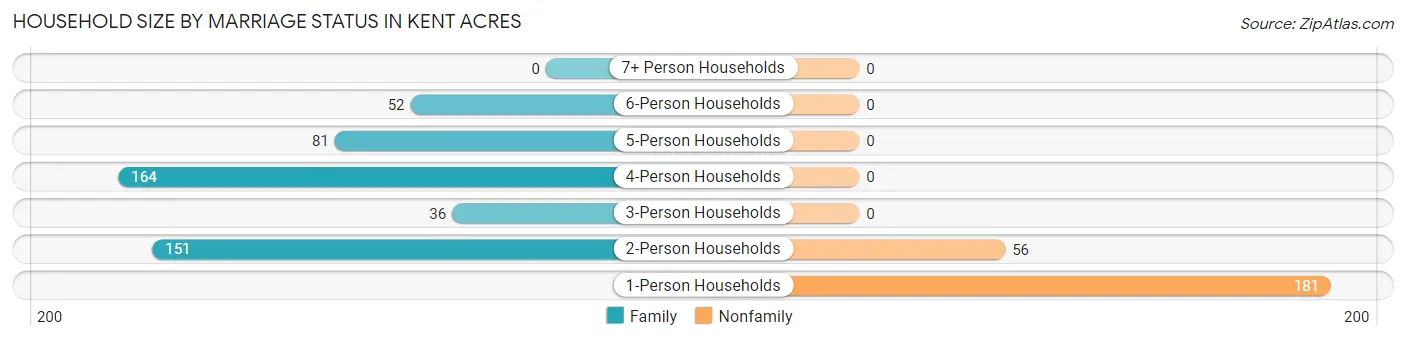
Household Size by Marriage Status in Kent Acres
Out of a total of 721 households in Kent Acres, 484 (67.1%) are family households, while 237 (32.9%) are nonfamily households. The most numerous type of family households are 4-person households, comprising 164, and the most common type of nonfamily households are 1-person households, comprising 181.
| Household Size | Family Households | Nonfamily Households |
| 1-Person Households | - | 181 (25.1%) |
| 2-Person Households | 151 (20.9%) | 56 (7.8%) |
| 3-Person Households | 36 (5.0%) | 0 (0.0%) |
| 4-Person Households | 164 (22.8%) | 0 (0.0%) |
| 5-Person Households | 81 (11.2%) | 0 (0.0%) |
| 6-Person Households | 52 (7.2%) | 0 (0.0%) |
| 7+ Person Households | 0 (0.0%) | 0 (0.0%) |
| Total | 484 (67.1%) | 237 (32.9%) |
Female Fertility in Kent Acres
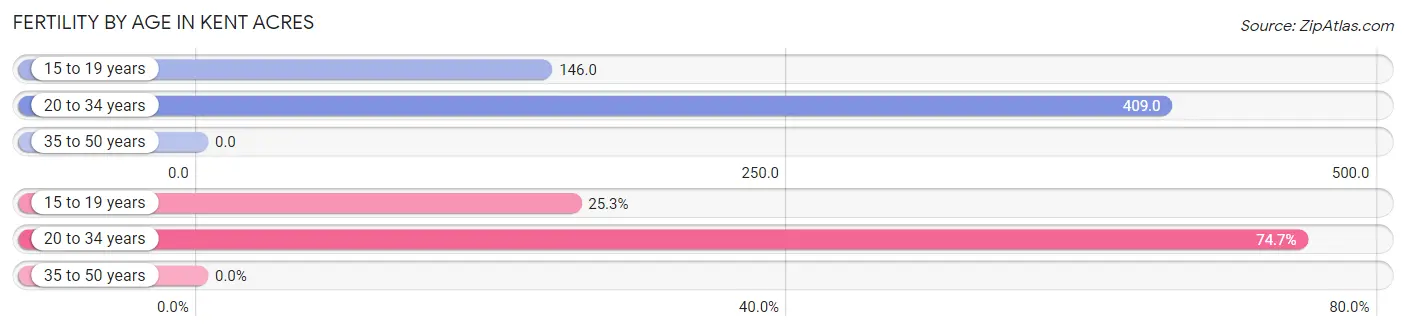
Fertility by Age in Kent Acres
Average fertility rate in Kent Acres is 142.0 births per 1,000 women. Women in the age bracket of 20 to 34 years have the highest fertility rate with 409.0 births per 1,000 women. Women in the age bracket of 20 to 34 years acount for 74.7% of all women with births.
| Age Bracket | Women with Births | Births / 1,000 Women |
| 15 to 19 years | 19 (25.3%) | 146.0 |
| 20 to 34 years | 56 (74.7%) | 409.0 |
| 35 to 50 years | 0 (0.0%) | 0.0 |
| Total | 75 (100.0%) | 142.0 |
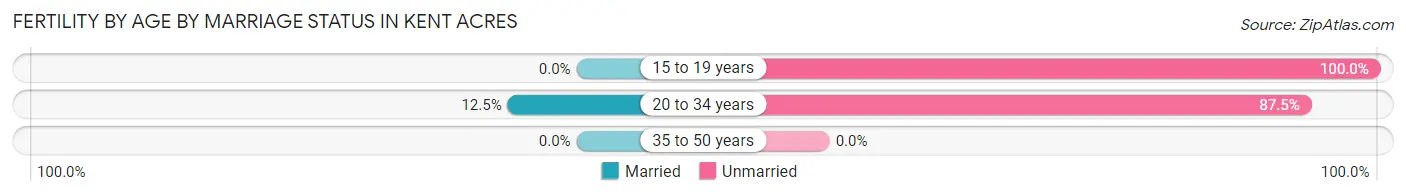
Fertility by Age by Marriage Status in Kent Acres
9.3% of women with births (75) in Kent Acres are married. The highest percentage of unmarried women with births falls into 15 to 19 years age bracket with 100.0% of them unmarried at the time of birth, while the lowest percentage of unmarried women with births belong to 20 to 34 years age bracket with 87.5% of them unmarried.
| Age Bracket | Married | Unmarried |
| 15 to 19 years | 0 (0.0%) | 19 (100.0%) |
| 20 to 34 years | 7 (12.5%) | 49 (87.5%) |
| 35 to 50 years | 0 (0.0%) | 0 (0.0%) |
| Total | 7 (9.3%) | 68 (90.7%) |
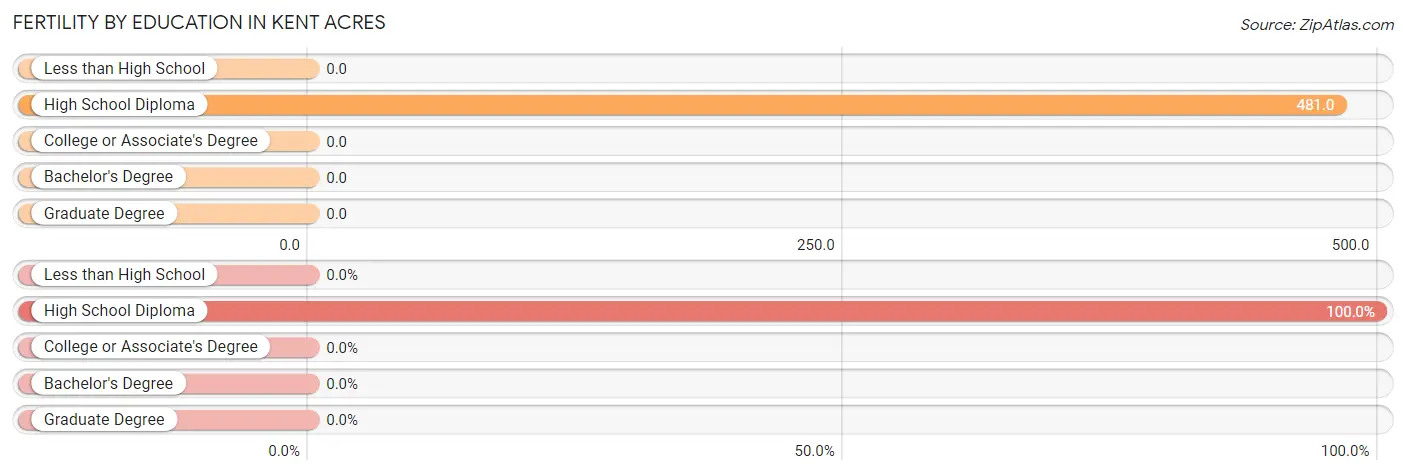
Fertility by Education in Kent Acres
| Educational Attainment | Women with Births | Births / 1,000 Women |
| Less than High School | 0 (0.0%) | 0.0 |
| High School Diploma | 75 (100.0%) | 481.0 |
| College or Associate's Degree | 0 (0.0%) | 0.0 |
| Bachelor's Degree | 0 (0.0%) | 0.0 |
| Graduate Degree | 0 (0.0%) | 0.0 |
| Total | 75 (100.0%) | 142.0 |
Fertility by Education by Marriage Status in Kent Acres
90.7% of women with births in Kent Acres are unmarried. Women with the educational attainment of high school diploma are most likely to be married with 9.3% of them married at childbirth, while women with the educational attainment of high school diploma are least likely to be married with 90.7% of them unmarried at childbirth.
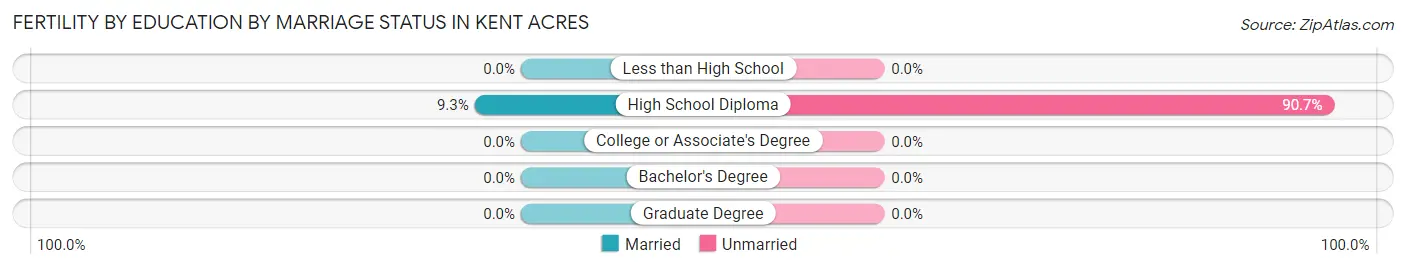
| Educational Attainment | Married | Unmarried |
| Less than High School | 0 (0.0%) | 0 (0.0%) |
| High School Diploma | 7 (9.3%) | 68 (90.7%) |
| College or Associate's Degree | 0 (0.0%) | 0 (0.0%) |
| Bachelor's Degree | 0 (0.0%) | 0 (0.0%) |
| Graduate Degree | 0 (0.0%) | 0 (0.0%) |
| Total | 7 (9.3%) | 68 (90.7%) |
Employment Characteristics in Kent Acres
Employment by Class of Employer in Kent Acres
Among the 881 employed individuals in Kent Acres, private company employees (588 | 66.7%), not-for-profit organizations (109 | 12.4%), and state government employees (101 | 11.5%) make up the most common classes of employment.
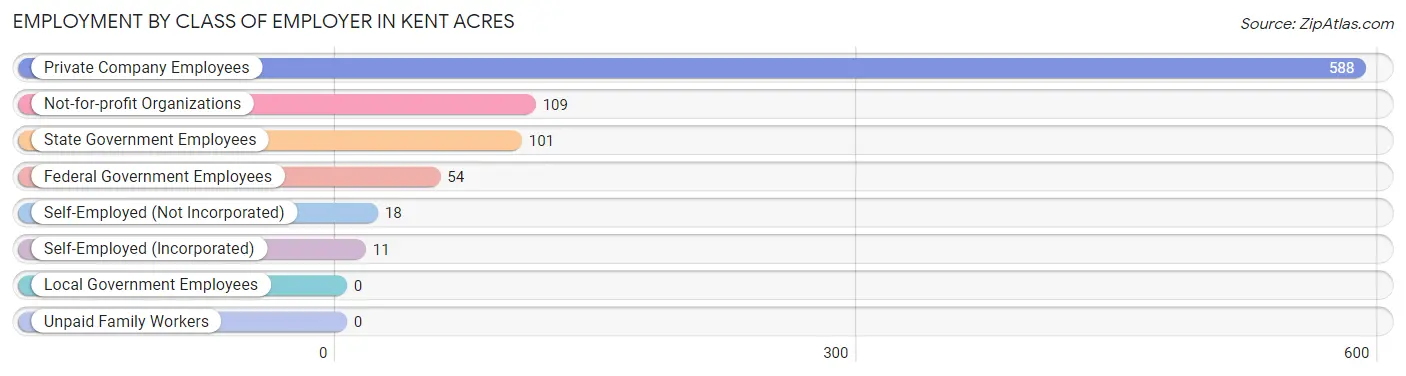
| Employer Class | # Employees | % Employees |
| Private Company Employees | 588 | 66.7% |
| Self-Employed (Incorporated) | 11 | 1.3% |
| Self-Employed (Not Incorporated) | 18 | 2.0% |
| Not-for-profit Organizations | 109 | 12.4% |
| Local Government Employees | 0 | 0.0% |
| State Government Employees | 101 | 11.5% |
| Federal Government Employees | 54 | 6.1% |
| Unpaid Family Workers | 0 | 0.0% |
| Total | 881 | 100.0% |
Employment Status by Age in Kent Acres
According to the labor force statistics for Kent Acres, out of the total population over 16 years of age (1,564), 62.1% or 971 individuals are in the labor force, with 6.8% or 66 of them unemployed. The age group with the highest labor force participation rate is 25 to 29 years, with 100.0% or 93 individuals in the labor force. Within the labor force, the 35 to 44 years age range has the highest percentage of unemployed individuals, with 24.2% or 60 of them being unemployed.
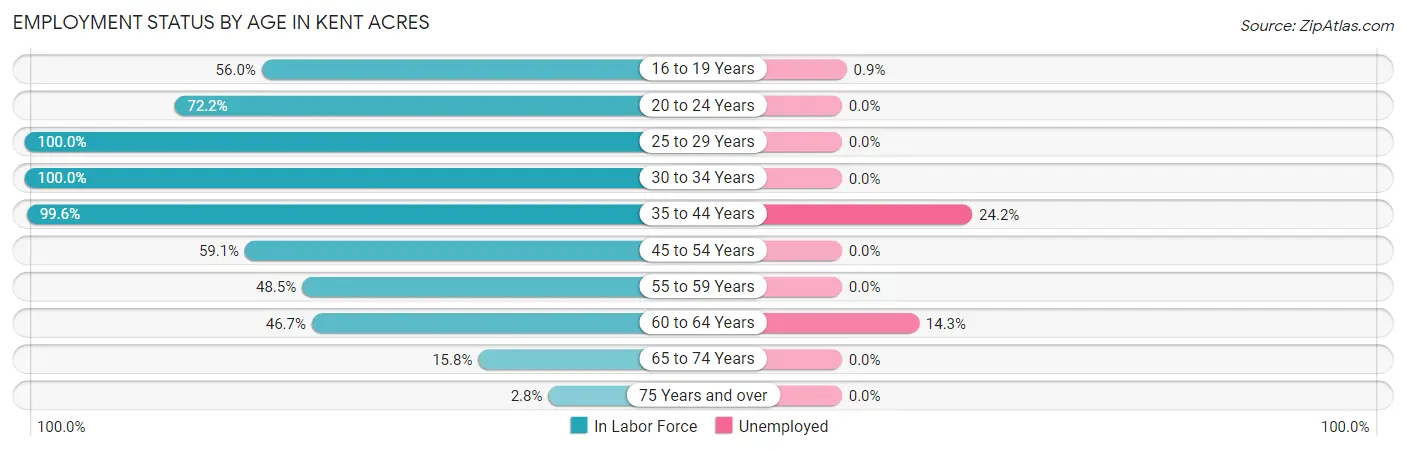
| Age Bracket | In Labor Force | Unemployed |
| 16 to 19 Years | 116 (56.0%) | 1 (0.9%) |
| 20 to 24 Years | 148 (72.2%) | 0 (0.0%) |
| 25 to 29 Years | 93 (100.0%) | 0 (0.0%) |
| 30 to 34 Years | 94 (100.0%) | 0 (0.0%) |
| 35 to 44 Years | 248 (99.6%) | 60 (24.2%) |
| 45 to 54 Years | 169 (59.1%) | 0 (0.0%) |
| 55 to 59 Years | 47 (48.5%) | 0 (0.0%) |
| 60 to 64 Years | 28 (46.7%) | 4 (14.3%) |
| 65 to 74 Years | 26 (15.8%) | 0 (0.0%) |
| 75 Years and over | 3 (2.8%) | 0 (0.0%) |
| Total | 971 (62.1%) | 66 (6.8%) |
Employment Status by Educational Attainment in Kent Acres
According to labor force statistics for Kent Acres, 77.2% of individuals (679) out of the total population between 25 and 64 years of age (879) are in the labor force, with 9.6% or 65 of them being unemployed. The group with the highest labor force participation rate are those with the educational attainment of bachelor's degree or higher, with 87.1% or 189 individuals in the labor force. Within the labor force, individuals with high school diploma education have the highest percentage of unemployment, with 32.1% or 60 of them being unemployed.
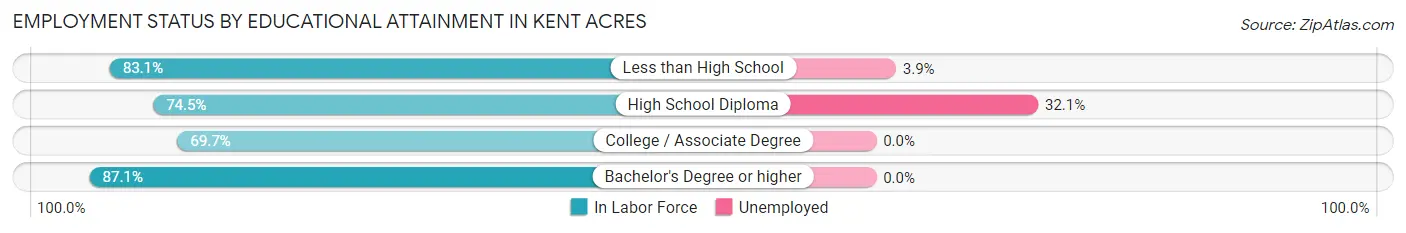
| Educational Attainment | In Labor Force | Unemployed |
| Less than High School | 103 (83.1%) | 5 (3.9%) |
| High School Diploma | 187 (74.5%) | 81 (32.1%) |
| College / Associate Degree | 200 (69.7%) | 0 (0.0%) |
| Bachelor's Degree or higher | 189 (87.1%) | 0 (0.0%) |
| Total | 679 (77.2%) | 84 (9.6%) |
Employment Occupations by Sex in Kent Acres
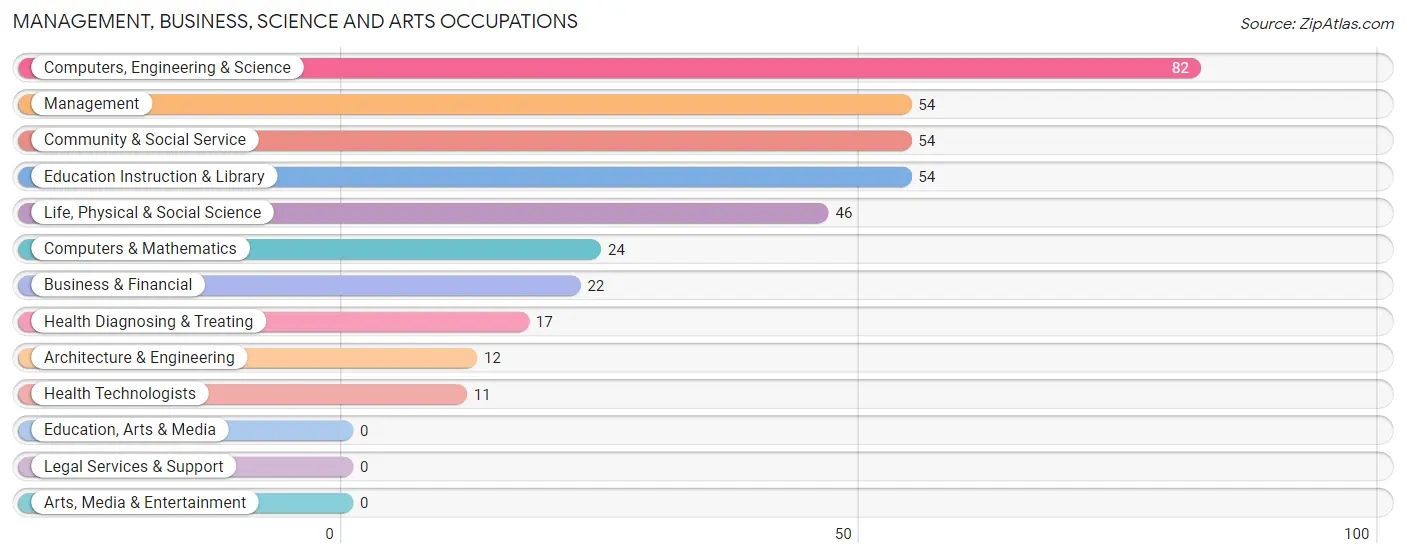
Management, Business, Science and Arts Occupations
The most common Management, Business, Science and Arts occupations in Kent Acres are Computers, Engineering & Science (82 | 9.1%), Management (54 | 6.0%), Community & Social Service (54 | 6.0%), Education Instruction & Library (54 | 6.0%), and Life, Physical & Social Science (46 | 5.1%).
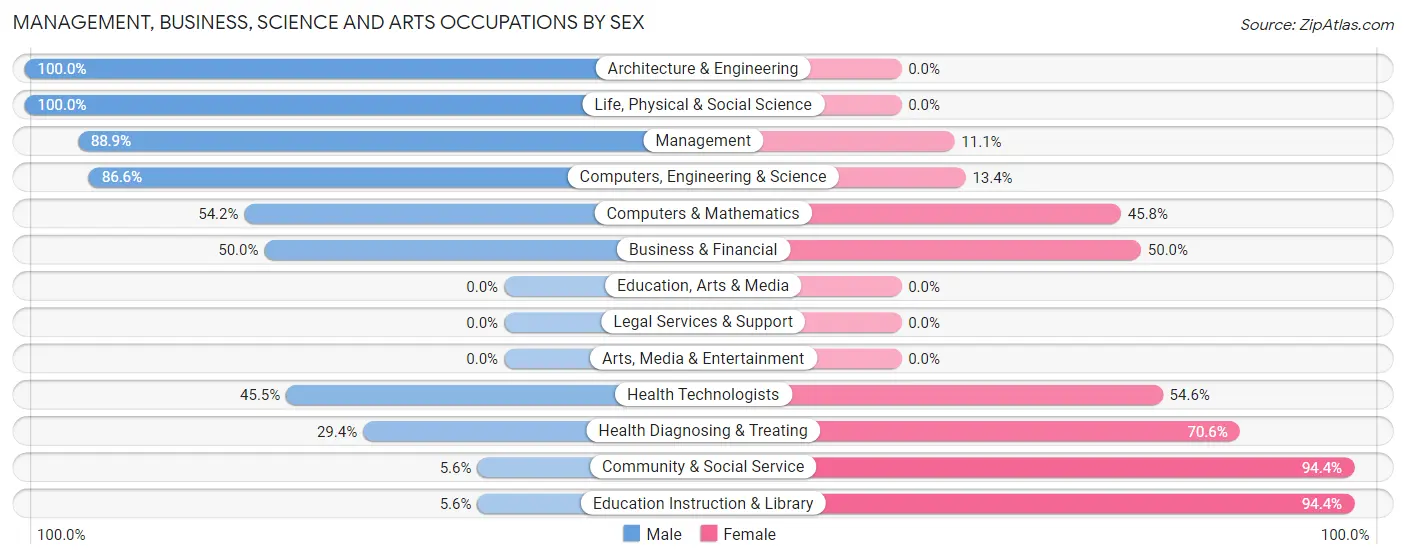
Management, Business, Science and Arts Occupations by Sex
Within the Management, Business, Science and Arts occupations in Kent Acres, the most male-oriented occupations are Architecture & Engineering (100.0%), Life, Physical & Social Science (100.0%), and Management (88.9%), while the most female-oriented occupations are Community & Social Service (94.4%), Education Instruction & Library (94.4%), and Health Diagnosing & Treating (70.6%).
| Occupation | Male | Female |
| Management | 48 (88.9%) | 6 (11.1%) |
| Business & Financial | 11 (50.0%) | 11 (50.0%) |
| Computers, Engineering & Science | 71 (86.6%) | 11 (13.4%) |
| Computers & Mathematics | 13 (54.2%) | 11 (45.8%) |
| Architecture & Engineering | 12 (100.0%) | 0 (0.0%) |
| Life, Physical & Social Science | 46 (100.0%) | 0 (0.0%) |
| Community & Social Service | 3 (5.6%) | 51 (94.4%) |
| Education, Arts & Media | 0 (0.0%) | 0 (0.0%) |
| Legal Services & Support | 0 (0.0%) | 0 (0.0%) |
| Education Instruction & Library | 3 (5.6%) | 51 (94.4%) |
| Arts, Media & Entertainment | 0 (0.0%) | 0 (0.0%) |
| Health Diagnosing & Treating | 5 (29.4%) | 12 (70.6%) |
| Health Technologists | 5 (45.5%) | 6 (54.5%) |
| Total (Category) | 138 (60.3%) | 91 (39.7%) |
| Total (Overall) | 513 (57.3%) | 383 (42.7%) |
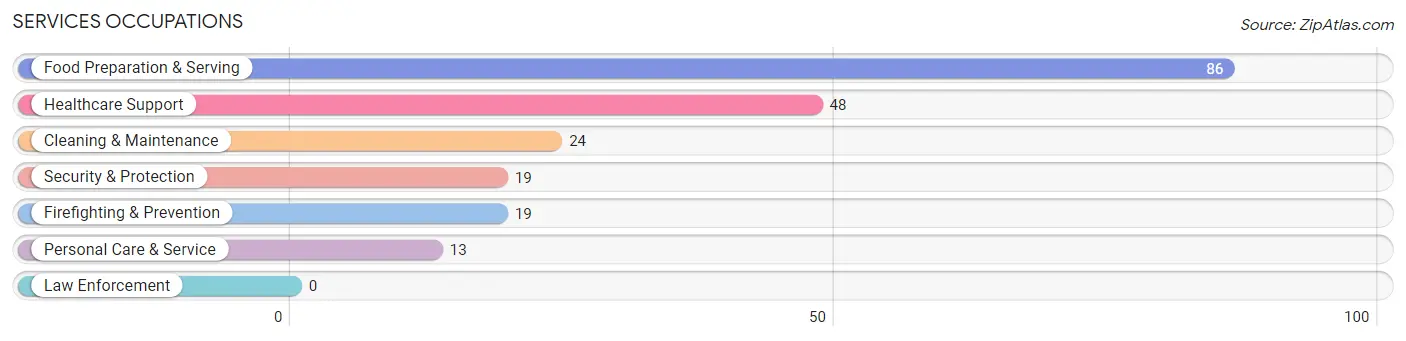
Services Occupations
The most common Services occupations in Kent Acres are Food Preparation & Serving (86 | 9.6%), Healthcare Support (48 | 5.4%), Cleaning & Maintenance (24 | 2.7%), Security & Protection (19 | 2.1%), and Firefighting & Prevention (19 | 2.1%).
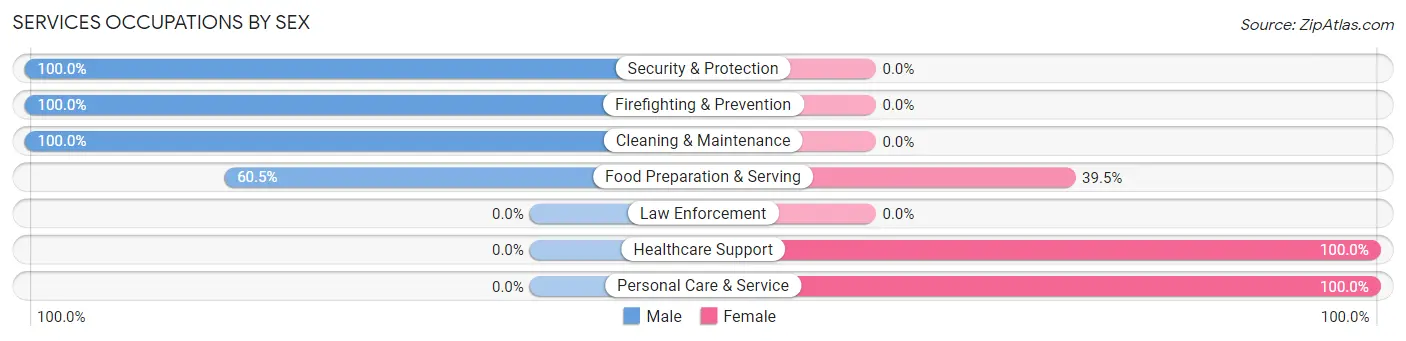
Services Occupations by Sex
Within the Services occupations in Kent Acres, the most male-oriented occupations are Security & Protection (100.0%), Firefighting & Prevention (100.0%), and Cleaning & Maintenance (100.0%), while the most female-oriented occupations are Healthcare Support (100.0%), Personal Care & Service (100.0%), and Food Preparation & Serving (39.5%).
| Occupation | Male | Female |
| Healthcare Support | 0 (0.0%) | 48 (100.0%) |
| Security & Protection | 19 (100.0%) | 0 (0.0%) |
| Firefighting & Prevention | 19 (100.0%) | 0 (0.0%) |
| Law Enforcement | 0 (0.0%) | 0 (0.0%) |
| Food Preparation & Serving | 52 (60.5%) | 34 (39.5%) |
| Cleaning & Maintenance | 24 (100.0%) | 0 (0.0%) |
| Personal Care & Service | 0 (0.0%) | 13 (100.0%) |
| Total (Category) | 95 (50.0%) | 95 (50.0%) |
| Total (Overall) | 513 (57.3%) | 383 (42.7%) |
Sales and Office Occupations
The most common Sales and Office occupations in Kent Acres are Sales & Related (137 | 15.3%), and Office & Administration (79 | 8.8%).
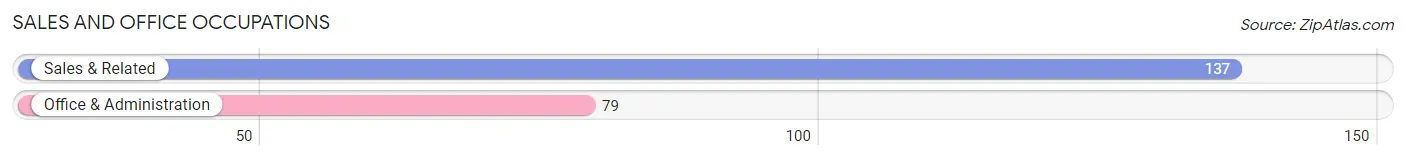
Sales and Office Occupations by Sex

| Occupation | Male | Female |
| Sales & Related | 41 (29.9%) | 96 (70.1%) |
| Office & Administration | 8 (10.1%) | 71 (89.9%) |
| Total (Category) | 49 (22.7%) | 167 (77.3%) |
| Total (Overall) | 513 (57.3%) | 383 (42.7%) |
Natural Resources, Construction and Maintenance Occupations
The most common Natural Resources, Construction and Maintenance occupations in Kent Acres are , and Installation, Maintenance & Repair (51 | 5.7%).
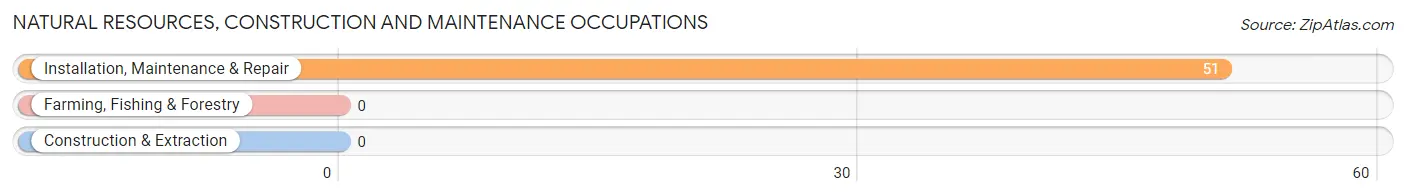
Natural Resources, Construction and Maintenance Occupations by Sex
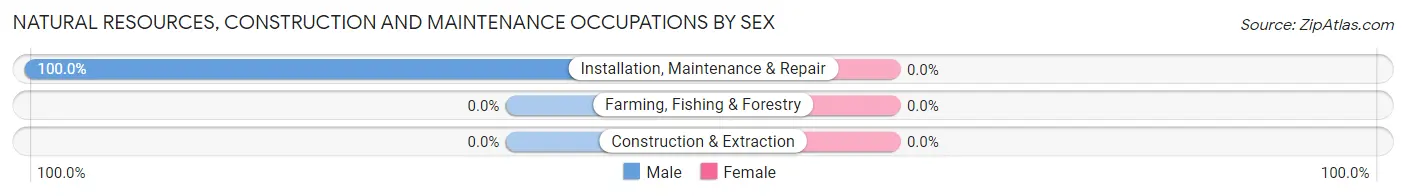
| Occupation | Male | Female |
| Farming, Fishing & Forestry | 0 (0.0%) | 0 (0.0%) |
| Construction & Extraction | 0 (0.0%) | 0 (0.0%) |
| Installation, Maintenance & Repair | 51 (100.0%) | 0 (0.0%) |
| Total (Category) | 51 (100.0%) | 0 (0.0%) |
| Total (Overall) | 513 (57.3%) | 383 (42.7%) |
Production, Transportation and Moving Occupations
The most common Production, Transportation and Moving occupations in Kent Acres are Material Moving (126 | 14.1%), Transportation (68 | 7.6%), and Production (16 | 1.8%).
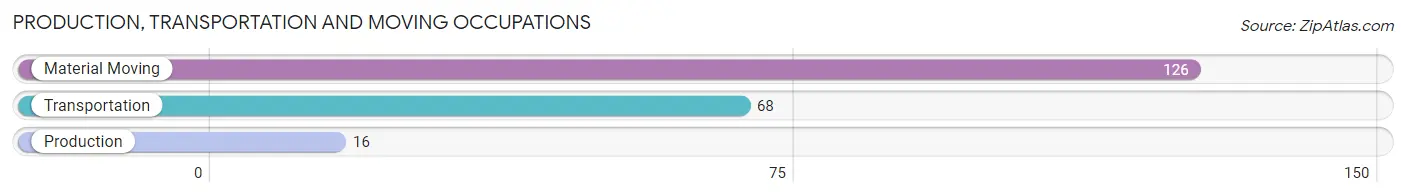
Production, Transportation and Moving Occupations by Sex
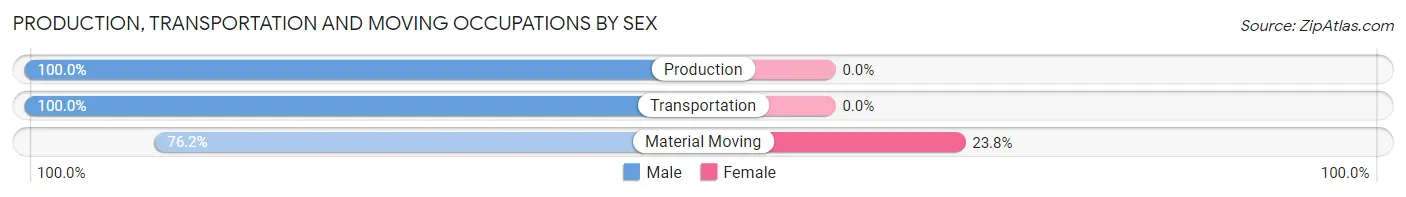
| Occupation | Male | Female |
| Production | 16 (100.0%) | 0 (0.0%) |
| Transportation | 68 (100.0%) | 0 (0.0%) |
| Material Moving | 96 (76.2%) | 30 (23.8%) |
| Total (Category) | 180 (85.7%) | 30 (14.3%) |
| Total (Overall) | 513 (57.3%) | 383 (42.7%) |
Employment Industries by Sex in Kent Acres
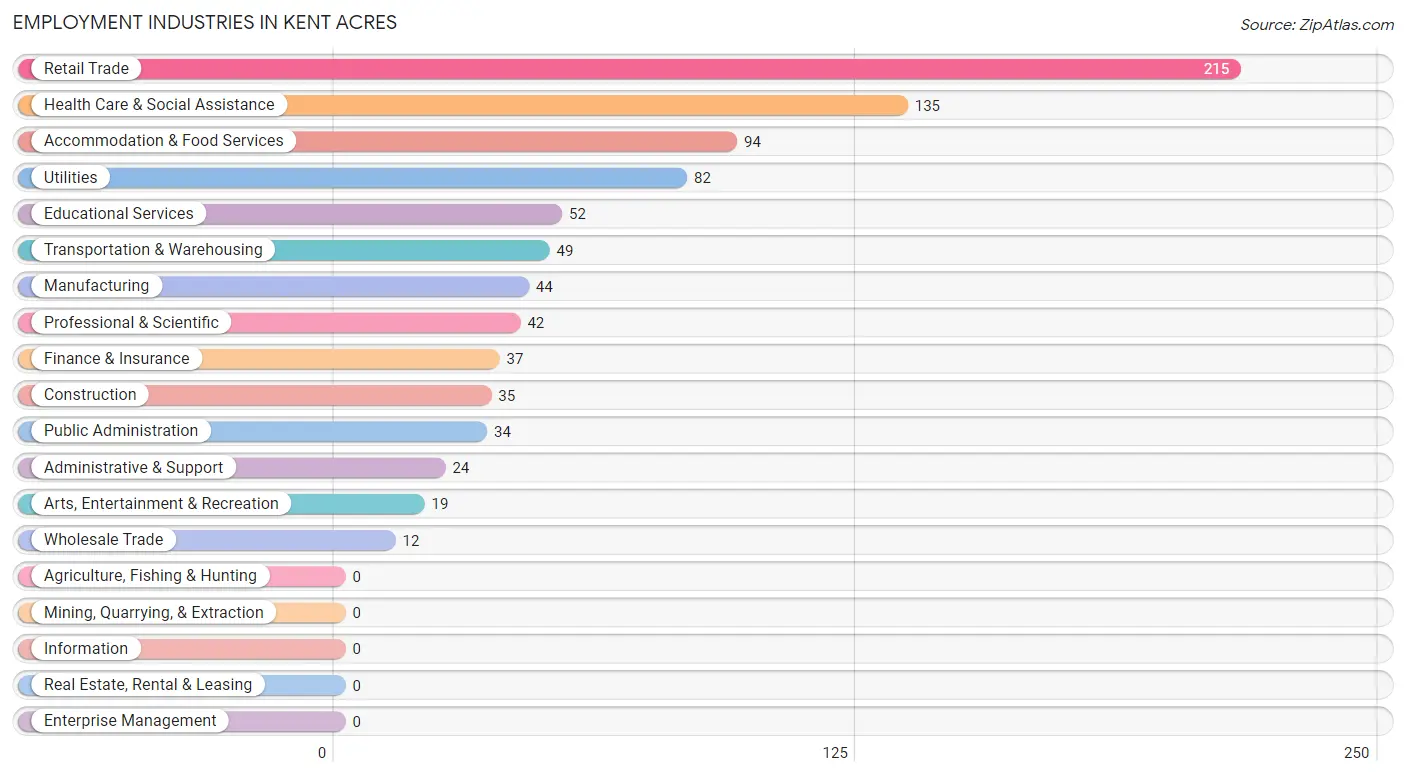
Employment Industries in Kent Acres
The major employment industries in Kent Acres include Retail Trade (215 | 24.0%), Health Care & Social Assistance (135 | 15.1%), Accommodation & Food Services (94 | 10.5%), Utilities (82 | 9.1%), and Educational Services (52 | 5.8%).
Employment Industries by Sex in Kent Acres
The Kent Acres industries that see more men than women are Construction (100.0%), Manufacturing (100.0%), and Wholesale Trade (100.0%), whereas the industries that tend to have a higher number of women are Educational Services (94.2%), Health Care & Social Assistance (91.8%), and Transportation & Warehousing (83.7%).
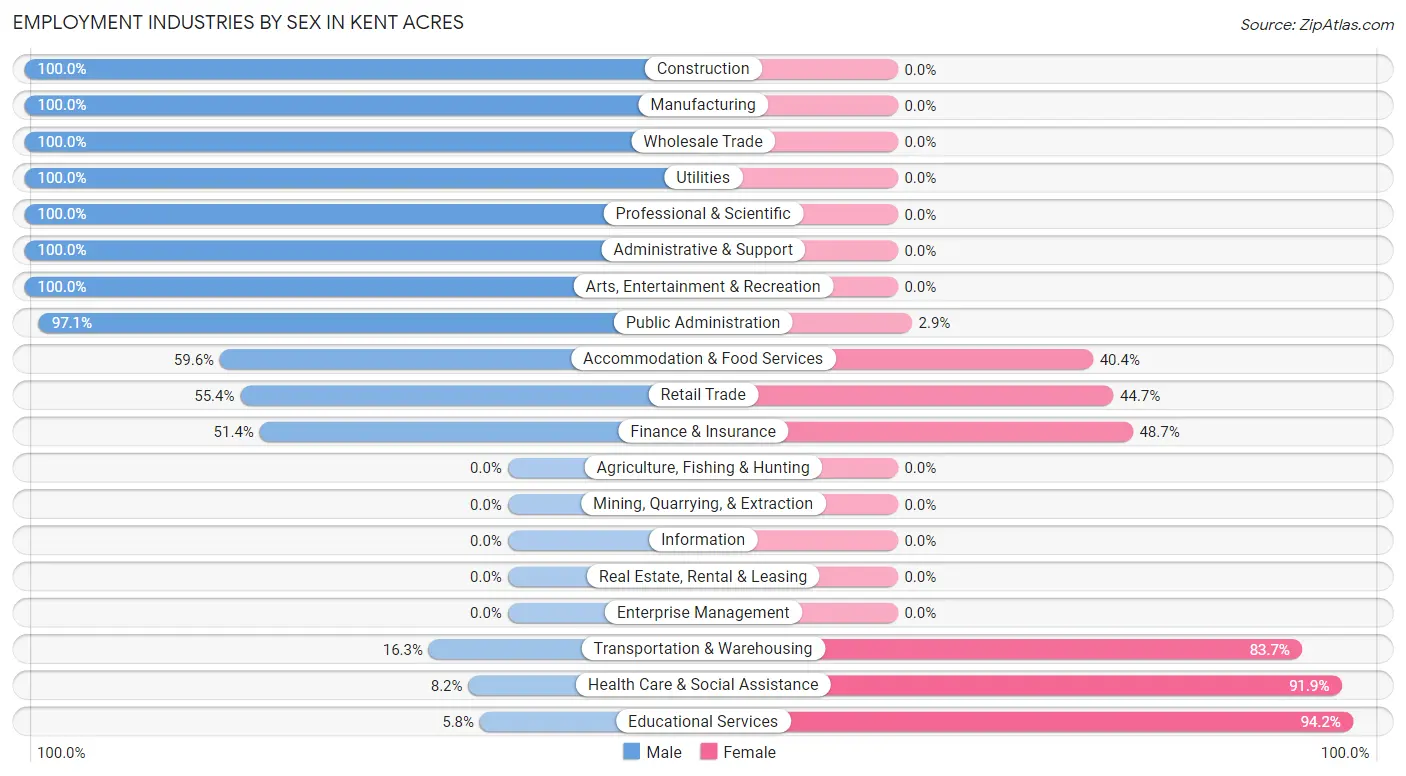
| Industry | Male | Female |
| Agriculture, Fishing & Hunting | 0 (0.0%) | 0 (0.0%) |
| Mining, Quarrying, & Extraction | 0 (0.0%) | 0 (0.0%) |
| Construction | 35 (100.0%) | 0 (0.0%) |
| Manufacturing | 44 (100.0%) | 0 (0.0%) |
| Wholesale Trade | 12 (100.0%) | 0 (0.0%) |
| Retail Trade | 119 (55.3%) | 96 (44.7%) |
| Transportation & Warehousing | 8 (16.3%) | 41 (83.7%) |
| Utilities | 82 (100.0%) | 0 (0.0%) |
| Information | 0 (0.0%) | 0 (0.0%) |
| Finance & Insurance | 19 (51.3%) | 18 (48.6%) |
| Real Estate, Rental & Leasing | 0 (0.0%) | 0 (0.0%) |
| Professional & Scientific | 42 (100.0%) | 0 (0.0%) |
| Enterprise Management | 0 (0.0%) | 0 (0.0%) |
| Administrative & Support | 24 (100.0%) | 0 (0.0%) |
| Educational Services | 3 (5.8%) | 49 (94.2%) |
| Health Care & Social Assistance | 11 (8.2%) | 124 (91.8%) |
| Arts, Entertainment & Recreation | 19 (100.0%) | 0 (0.0%) |
| Accommodation & Food Services | 56 (59.6%) | 38 (40.4%) |
| Public Administration | 33 (97.1%) | 1 (2.9%) |
| Total | 513 (57.3%) | 383 (42.7%) |
Education in Kent Acres
School Enrollment in Kent Acres
The most common levels of schooling among the 573 students in Kent Acres are high school (218 | 38.1%), middle school (144 | 25.1%), and elementary school (113 | 19.7%).
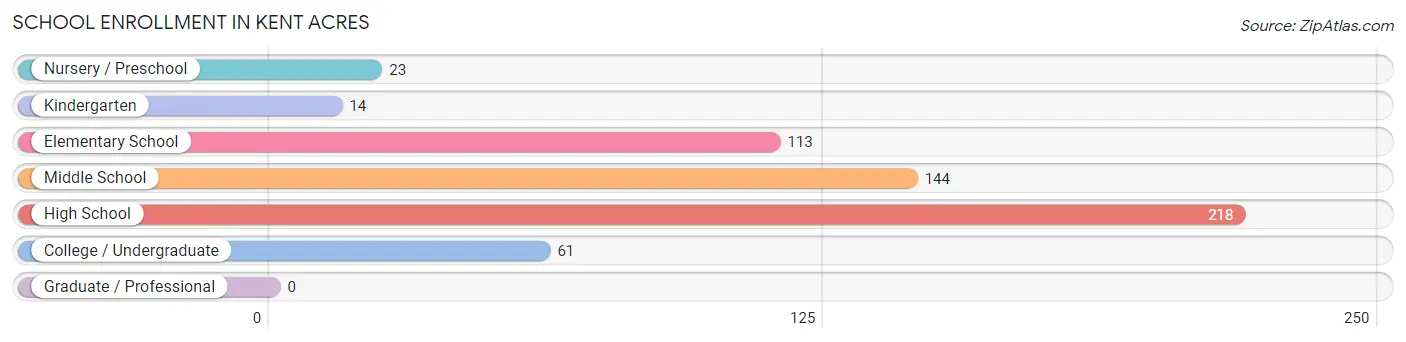
| School Level | # Students | % Students |
| Nursery / Preschool | 23 | 4.0% |
| Kindergarten | 14 | 2.4% |
| Elementary School | 113 | 19.7% |
| Middle School | 144 | 25.1% |
| High School | 218 | 38.1% |
| College / Undergraduate | 61 | 10.6% |
| Graduate / Professional | 0 | 0.0% |
| Total | 573 | 100.0% |
School Enrollment by Age by Funding Source in Kent Acres
Out of a total of 573 students who are enrolled in schools in Kent Acres, 61 (10.6%) attend a private institution, while the remaining 512 (89.4%) are enrolled in public schools. The age group of 5 to 9 year old has the highest likelihood of being enrolled in private schools, with 28 (24.6% in the age bracket) enrolled. Conversely, the age group of 3 to 4 year olds has the lowest likelihood of being enrolled in a private school, with 23 (100.0% in the age bracket) attending a public institution.
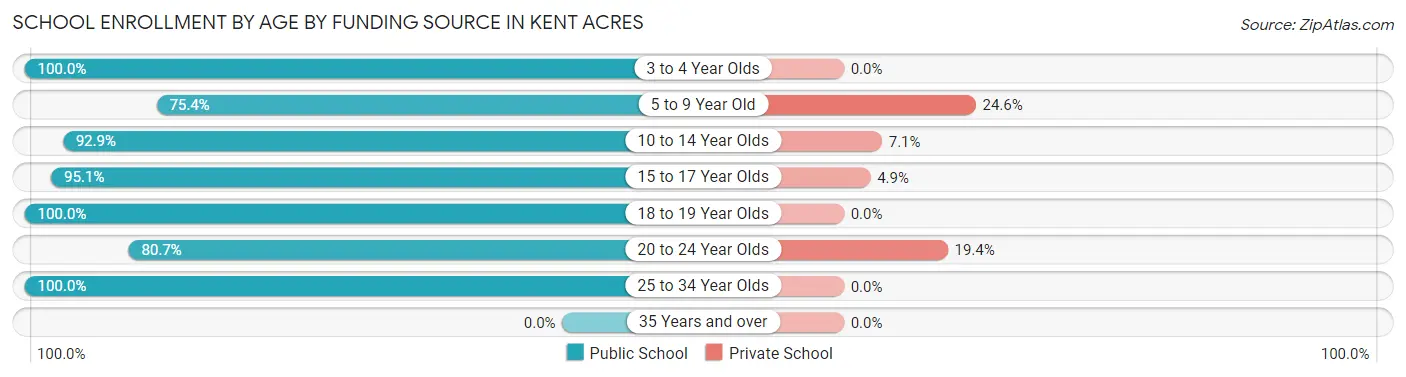
| Age Bracket | Public School | Private School |
| 3 to 4 Year Olds | 23 (100.0%) | 0 (0.0%) |
| 5 to 9 Year Old | 86 (75.4%) | 28 (24.6%) |
| 10 to 14 Year Olds | 170 (92.9%) | 13 (7.1%) |
| 15 to 17 Year Olds | 154 (95.1%) | 8 (4.9%) |
| 18 to 19 Year Olds | 22 (100.0%) | 0 (0.0%) |
| 20 to 24 Year Olds | 50 (80.6%) | 12 (19.4%) |
| 25 to 34 Year Olds | 7 (100.0%) | 0 (0.0%) |
| 35 Years and over | 0 (0.0%) | 0 (0.0%) |
| Total | 512 (89.4%) | 61 (10.6%) |
Educational Attainment by Field of Study in Kent Acres
Education (59 | 23.4%), computers & mathematics (45 | 17.9%), business (44 | 17.5%), bio, nature & agricultural (32 | 12.7%), and social sciences (17 | 6.8%) are the most common fields of study among 252 individuals in Kent Acres who have obtained a bachelor's degree or higher.
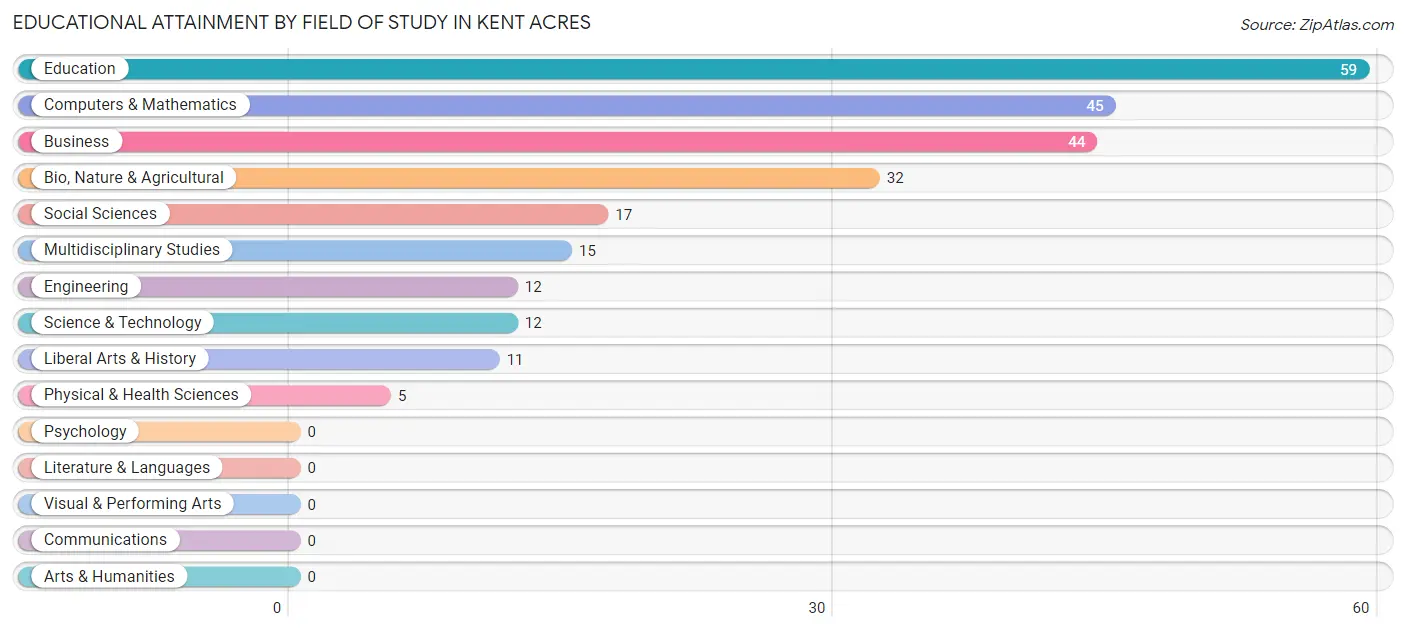
| Field of Study | # Graduates | % Graduates |
| Computers & Mathematics | 45 | 17.9% |
| Bio, Nature & Agricultural | 32 | 12.7% |
| Physical & Health Sciences | 5 | 2.0% |
| Psychology | 0 | 0.0% |
| Social Sciences | 17 | 6.8% |
| Engineering | 12 | 4.8% |
| Multidisciplinary Studies | 15 | 5.9% |
| Science & Technology | 12 | 4.8% |
| Business | 44 | 17.5% |
| Education | 59 | 23.4% |
| Literature & Languages | 0 | 0.0% |
| Liberal Arts & History | 11 | 4.4% |
| Visual & Performing Arts | 0 | 0.0% |
| Communications | 0 | 0.0% |
| Arts & Humanities | 0 | 0.0% |
| Total | 252 | 100.0% |
Transportation & Commute in Kent Acres
Vehicle Availability by Sex in Kent Acres
The most prevalent vehicle ownership categories in Kent Acres are males with 2 vehicles (219, accounting for 41.9%) and females with 2 vehicles (109, making up 61.2%).
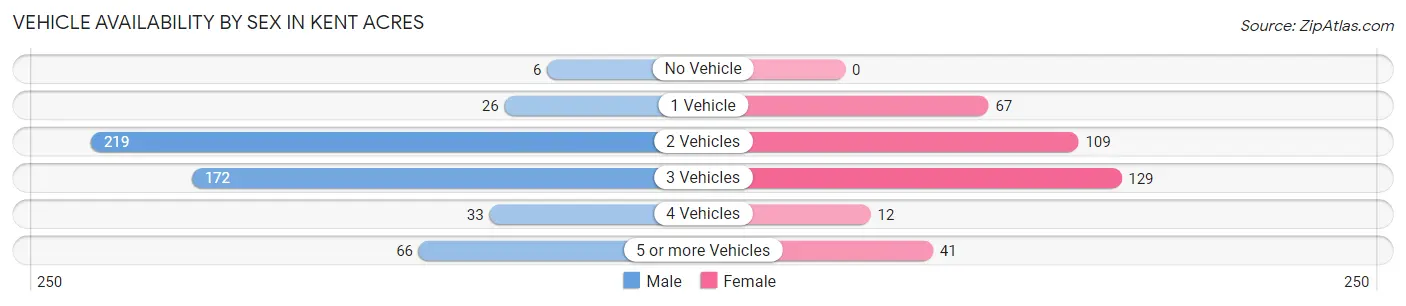
| Vehicles Available | Male | Female |
| No Vehicle | 6 (1.1%) | 0 (0.0%) |
| 1 Vehicle | 26 (5.0%) | 67 (18.7%) |
| 2 Vehicles | 219 (41.9%) | 109 (30.4%) |
| 3 Vehicles | 172 (33.0%) | 129 (36.0%) |
| 4 Vehicles | 33 (6.3%) | 12 (3.4%) |
| 5 or more Vehicles | 66 (12.6%) | 41 (11.5%) |
| Total | 522 (100.0%) | 358 (100.0%) |
Commute Time in Kent Acres
The most frequently occuring commute durations in Kent Acres are 15 to 19 minutes (181 commuters, 20.8%), 10 to 14 minutes (169 commuters, 19.5%), and 5 to 9 minutes (162 commuters, 18.7%).
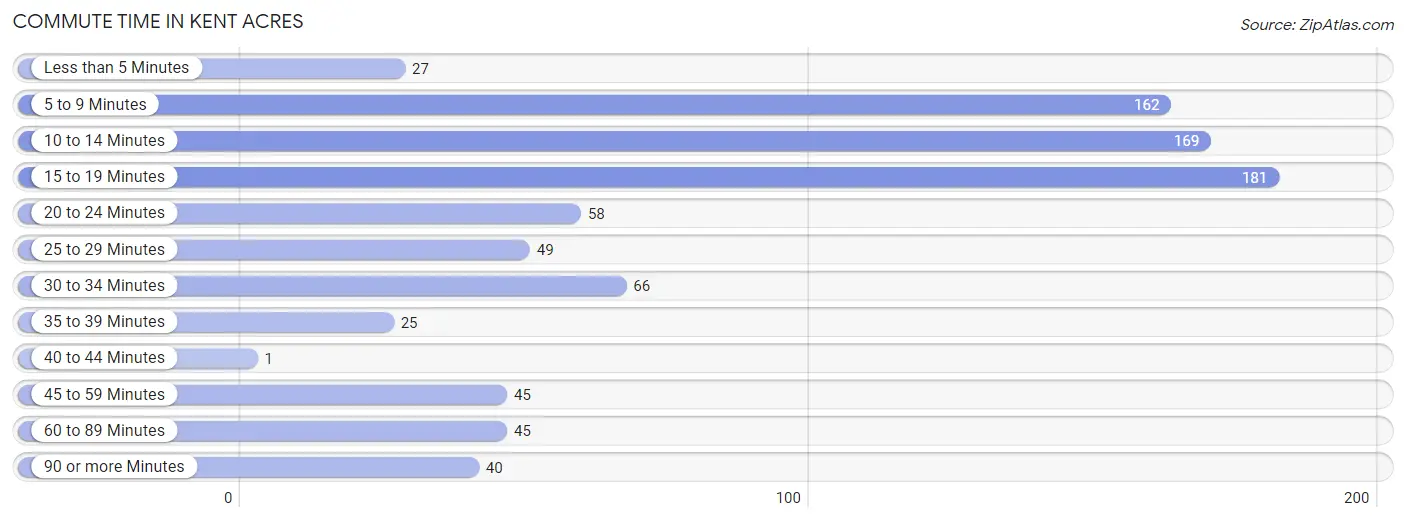
| Commute Time | # Commuters | % Commuters |
| Less than 5 Minutes | 27 | 3.1% |
| 5 to 9 Minutes | 162 | 18.7% |
| 10 to 14 Minutes | 169 | 19.5% |
| 15 to 19 Minutes | 181 | 20.8% |
| 20 to 24 Minutes | 58 | 6.7% |
| 25 to 29 Minutes | 49 | 5.7% |
| 30 to 34 Minutes | 66 | 7.6% |
| 35 to 39 Minutes | 25 | 2.9% |
| 40 to 44 Minutes | 1 | 0.1% |
| 45 to 59 Minutes | 45 | 5.2% |
| 60 to 89 Minutes | 45 | 5.2% |
| 90 or more Minutes | 40 | 4.6% |
Commute Time by Sex in Kent Acres
The most common commute times in Kent Acres are 5 to 9 minutes (123 commuters, 23.5%) for males and 15 to 19 minutes (88 commuters, 25.5%) for females.
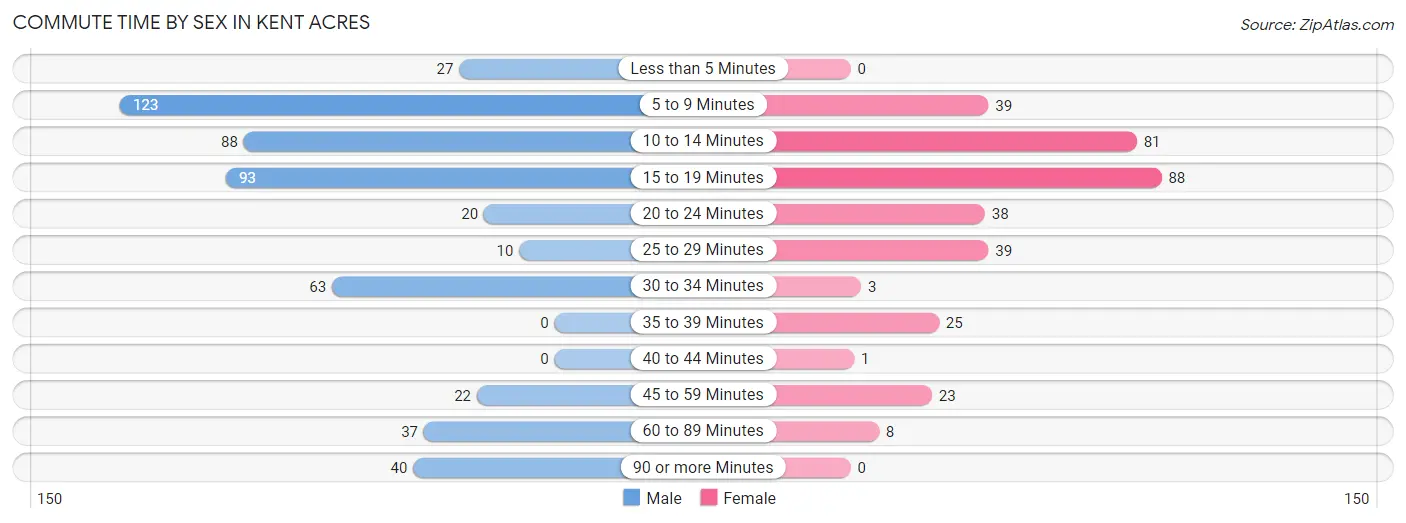
| Commute Time | Male | Female |
| Less than 5 Minutes | 27 (5.2%) | 0 (0.0%) |
| 5 to 9 Minutes | 123 (23.5%) | 39 (11.3%) |
| 10 to 14 Minutes | 88 (16.8%) | 81 (23.5%) |
| 15 to 19 Minutes | 93 (17.8%) | 88 (25.5%) |
| 20 to 24 Minutes | 20 (3.8%) | 38 (11.0%) |
| 25 to 29 Minutes | 10 (1.9%) | 39 (11.3%) |
| 30 to 34 Minutes | 63 (12.0%) | 3 (0.9%) |
| 35 to 39 Minutes | 0 (0.0%) | 25 (7.2%) |
| 40 to 44 Minutes | 0 (0.0%) | 1 (0.3%) |
| 45 to 59 Minutes | 22 (4.2%) | 23 (6.7%) |
| 60 to 89 Minutes | 37 (7.1%) | 8 (2.3%) |
| 90 or more Minutes | 40 (7.6%) | 0 (0.0%) |
Time of Departure to Work by Sex in Kent Acres
The most frequent times of departure to work in Kent Acres are 12:00 PM to 3:59 PM (118, 22.6%) for males and 8:00 AM to 8:29 AM (81, 23.5%) for females.
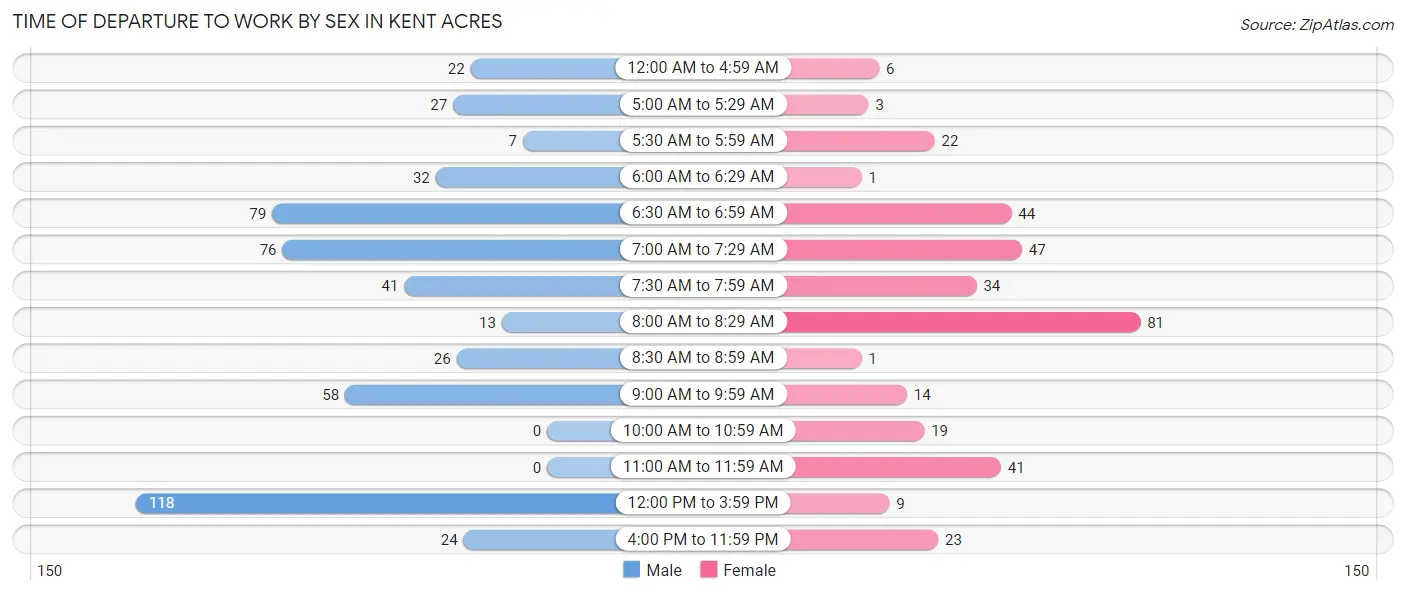
| Time of Departure | Male | Female |
| 12:00 AM to 4:59 AM | 22 (4.2%) | 6 (1.7%) |
| 5:00 AM to 5:29 AM | 27 (5.2%) | 3 (0.9%) |
| 5:30 AM to 5:59 AM | 7 (1.3%) | 22 (6.4%) |
| 6:00 AM to 6:29 AM | 32 (6.1%) | 1 (0.3%) |
| 6:30 AM to 6:59 AM | 79 (15.1%) | 44 (12.8%) |
| 7:00 AM to 7:29 AM | 76 (14.5%) | 47 (13.6%) |
| 7:30 AM to 7:59 AM | 41 (7.8%) | 34 (9.9%) |
| 8:00 AM to 8:29 AM | 13 (2.5%) | 81 (23.5%) |
| 8:30 AM to 8:59 AM | 26 (5.0%) | 1 (0.3%) |
| 9:00 AM to 9:59 AM | 58 (11.1%) | 14 (4.1%) |
| 10:00 AM to 10:59 AM | 0 (0.0%) | 19 (5.5%) |
| 11:00 AM to 11:59 AM | 0 (0.0%) | 41 (11.9%) |
| 12:00 PM to 3:59 PM | 118 (22.6%) | 9 (2.6%) |
| 4:00 PM to 11:59 PM | 24 (4.6%) | 23 (6.7%) |
| Total | 523 (100.0%) | 345 (100.0%) |
Housing Occupancy in Kent Acres
Occupancy by Ownership in Kent Acres
Of the total 721 dwellings in Kent Acres, owner-occupied units account for 565 (78.4%), while renter-occupied units make up 156 (21.6%).
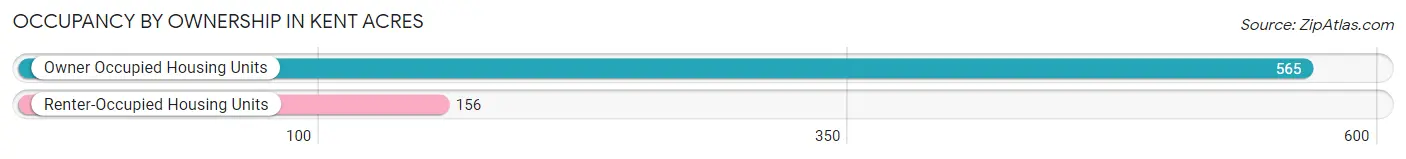
| Occupancy | # Housing Units | % Housing Units |
| Owner Occupied Housing Units | 565 | 78.4% |
| Renter-Occupied Housing Units | 156 | 21.6% |
| Total Occupied Housing Units | 721 | 100.0% |
Occupancy by Household Size in Kent Acres
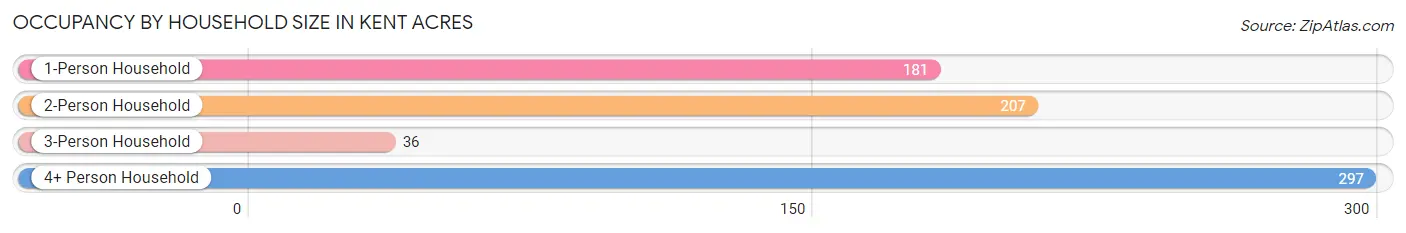
| Household Size | # Housing Units | % Housing Units |
| 1-Person Household | 181 | 25.1% |
| 2-Person Household | 207 | 28.7% |
| 3-Person Household | 36 | 5.0% |
| 4+ Person Household | 297 | 41.2% |
| Total Housing Units | 721 | 100.0% |
Occupancy by Ownership by Household Size in Kent Acres
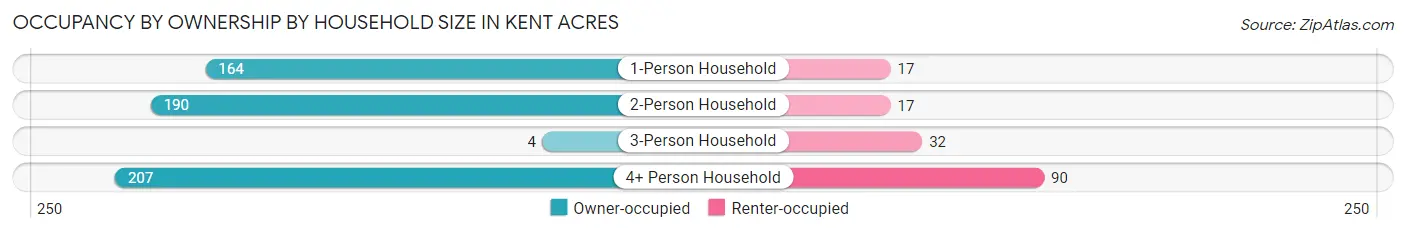
| Household Size | Owner-occupied | Renter-occupied |
| 1-Person Household | 164 (90.6%) | 17 (9.4%) |
| 2-Person Household | 190 (91.8%) | 17 (8.2%) |
| 3-Person Household | 4 (11.1%) | 32 (88.9%) |
| 4+ Person Household | 207 (69.7%) | 90 (30.3%) |
| Total Housing Units | 565 (78.4%) | 156 (21.6%) |
Occupancy by Educational Attainment in Kent Acres
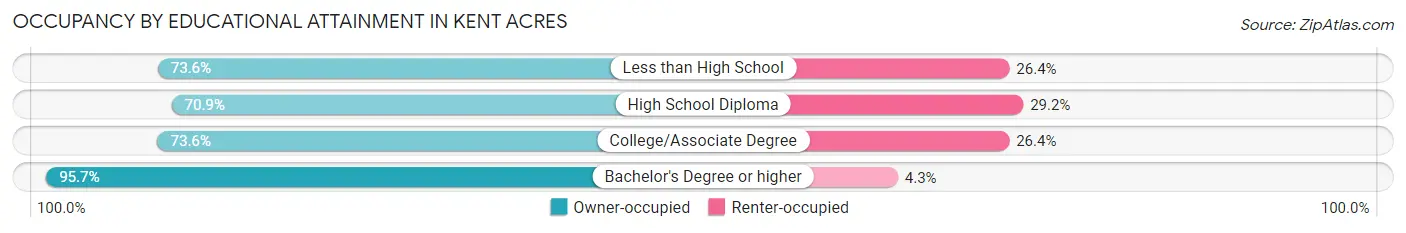
| Household Size | Owner-occupied | Renter-occupied |
| Less than High School | 39 (73.6%) | 14 (26.4%) |
| High School Diploma | 175 (70.9%) | 72 (29.1%) |
| College/Associate Degree | 173 (73.6%) | 62 (26.4%) |
| Bachelor's Degree or higher | 178 (95.7%) | 8 (4.3%) |
Occupancy by Age of Householder in Kent Acres
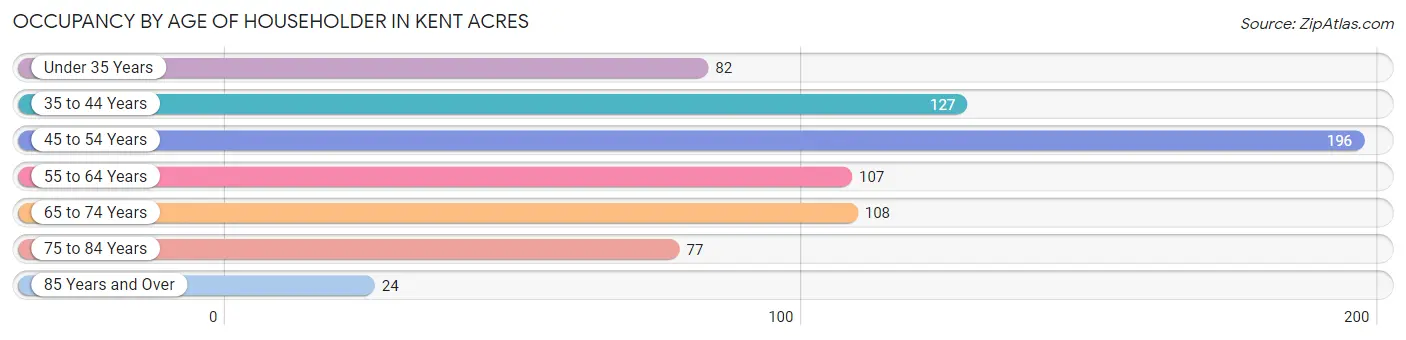
| Age Bracket | # Households | % Households |
| Under 35 Years | 82 | 11.4% |
| 35 to 44 Years | 127 | 17.6% |
| 45 to 54 Years | 196 | 27.2% |
| 55 to 64 Years | 107 | 14.8% |
| 65 to 74 Years | 108 | 15.0% |
| 75 to 84 Years | 77 | 10.7% |
| 85 Years and Over | 24 | 3.3% |
| Total | 721 | 100.0% |
Housing Finances in Kent Acres
Median Income by Occupancy in Kent Acres
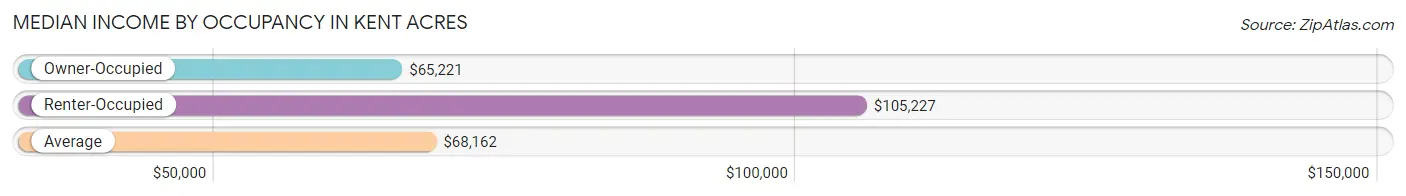
| Occupancy Type | # Households | Median Income |
| Owner-Occupied | 565 (78.4%) | $65,221 |
| Renter-Occupied | 156 (21.6%) | $105,227 |
| Average | 721 (100.0%) | $68,162 |
Occupancy by Householder Income Bracket in Kent Acres
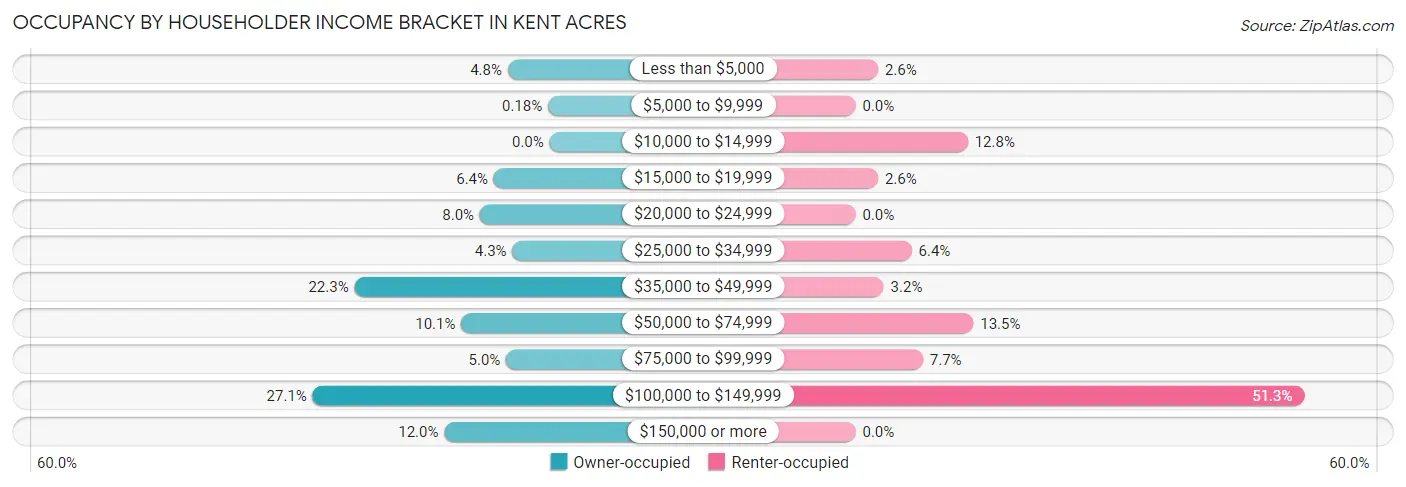
| Income Bracket | Owner-occupied | Renter-occupied |
| Less than $5,000 | 27 (4.8%) | 4 (2.6%) |
| $5,000 to $9,999 | 1 (0.2%) | 0 (0.0%) |
| $10,000 to $14,999 | 0 (0.0%) | 20 (12.8%) |
| $15,000 to $19,999 | 36 (6.4%) | 4 (2.6%) |
| $20,000 to $24,999 | 45 (8.0%) | 0 (0.0%) |
| $25,000 to $34,999 | 24 (4.3%) | 10 (6.4%) |
| $35,000 to $49,999 | 126 (22.3%) | 5 (3.2%) |
| $50,000 to $74,999 | 57 (10.1%) | 21 (13.5%) |
| $75,000 to $99,999 | 28 (5.0%) | 12 (7.7%) |
| $100,000 to $149,999 | 153 (27.1%) | 80 (51.3%) |
| $150,000 or more | 68 (12.0%) | 0 (0.0%) |
| Total | 565 (100.0%) | 156 (100.0%) |
Monthly Housing Cost Tiers in Kent Acres
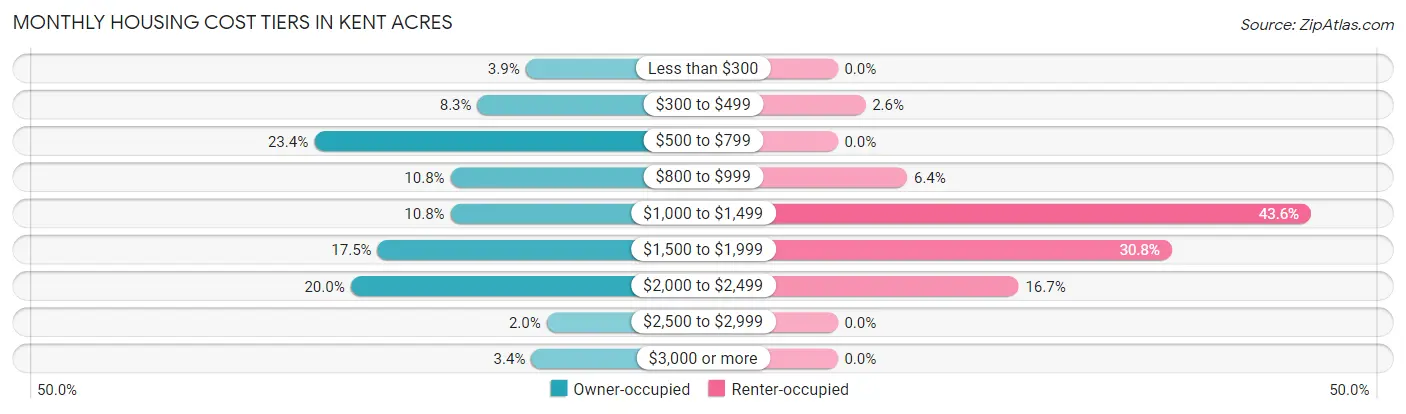
| Monthly Cost | Owner-occupied | Renter-occupied |
| Less than $300 | 22 (3.9%) | 0 (0.0%) |
| $300 to $499 | 47 (8.3%) | 4 (2.6%) |
| $500 to $799 | 132 (23.4%) | 0 (0.0%) |
| $800 to $999 | 61 (10.8%) | 10 (6.4%) |
| $1,000 to $1,499 | 61 (10.8%) | 68 (43.6%) |
| $1,500 to $1,999 | 99 (17.5%) | 48 (30.8%) |
| $2,000 to $2,499 | 113 (20.0%) | 26 (16.7%) |
| $2,500 to $2,999 | 11 (1.9%) | 0 (0.0%) |
| $3,000 or more | 19 (3.4%) | 0 (0.0%) |
| Total | 565 (100.0%) | 156 (100.0%) |
Physical Housing Characteristics in Kent Acres
Housing Structures in Kent Acres
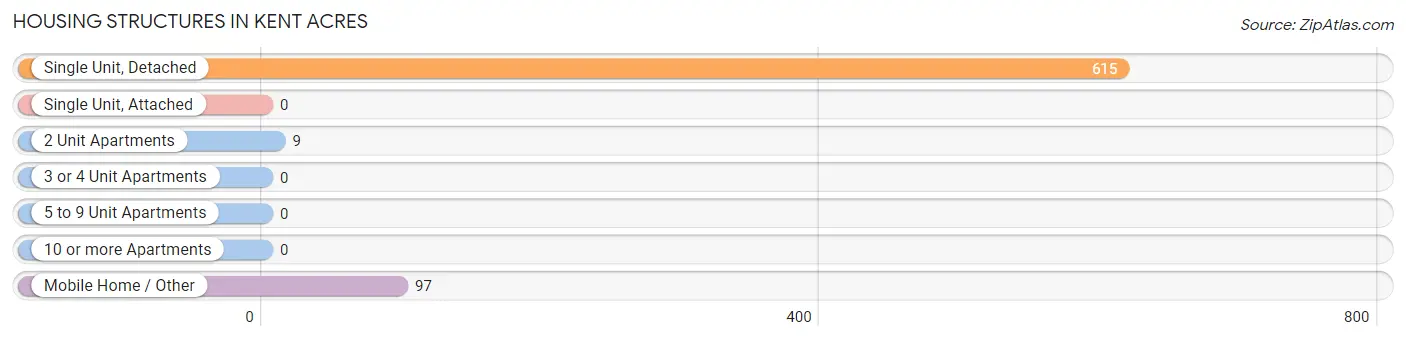
| Structure Type | # Housing Units | % Housing Units |
| Single Unit, Detached | 615 | 85.3% |
| Single Unit, Attached | 0 | 0.0% |
| 2 Unit Apartments | 9 | 1.3% |
| 3 or 4 Unit Apartments | 0 | 0.0% |
| 5 to 9 Unit Apartments | 0 | 0.0% |
| 10 or more Apartments | 0 | 0.0% |
| Mobile Home / Other | 97 | 13.5% |
| Total | 721 | 100.0% |
Housing Structures by Occupancy in Kent Acres
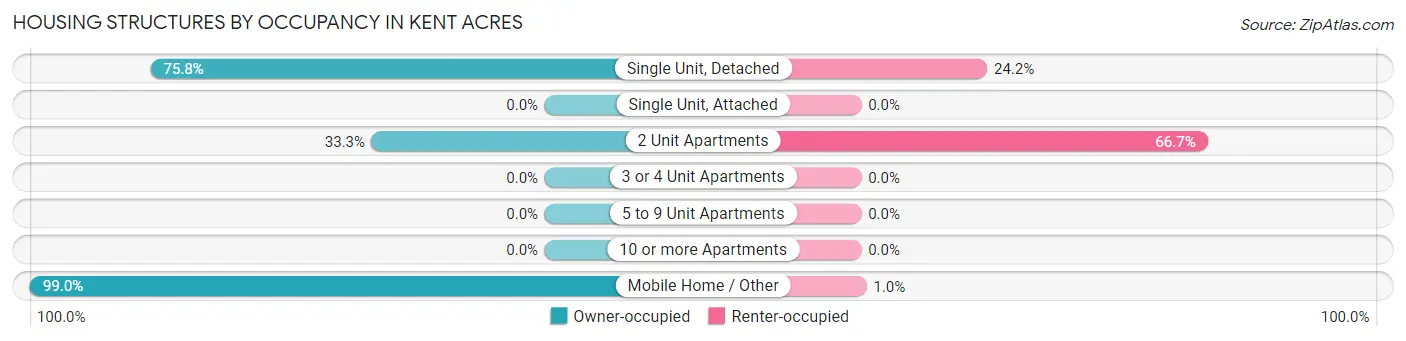
| Structure Type | Owner-occupied | Renter-occupied |
| Single Unit, Detached | 466 (75.8%) | 149 (24.2%) |
| Single Unit, Attached | 0 (0.0%) | 0 (0.0%) |
| 2 Unit Apartments | 3 (33.3%) | 6 (66.7%) |
| 3 or 4 Unit Apartments | 0 (0.0%) | 0 (0.0%) |
| 5 to 9 Unit Apartments | 0 (0.0%) | 0 (0.0%) |
| 10 or more Apartments | 0 (0.0%) | 0 (0.0%) |
| Mobile Home / Other | 96 (99.0%) | 1 (1.0%) |
| Total | 565 (78.4%) | 156 (21.6%) |
Housing Structures by Number of Rooms in Kent Acres
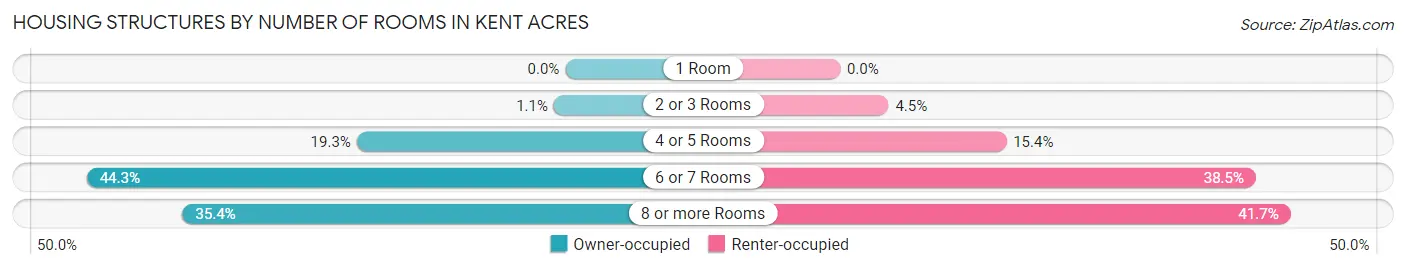
| Number of Rooms | Owner-occupied | Renter-occupied |
| 1 Room | 0 (0.0%) | 0 (0.0%) |
| 2 or 3 Rooms | 6 (1.1%) | 7 (4.5%) |
| 4 or 5 Rooms | 109 (19.3%) | 24 (15.4%) |
| 6 or 7 Rooms | 250 (44.3%) | 60 (38.5%) |
| 8 or more Rooms | 200 (35.4%) | 65 (41.7%) |
| Total | 565 (100.0%) | 156 (100.0%) |
Housing Structure by Heating Type in Kent Acres
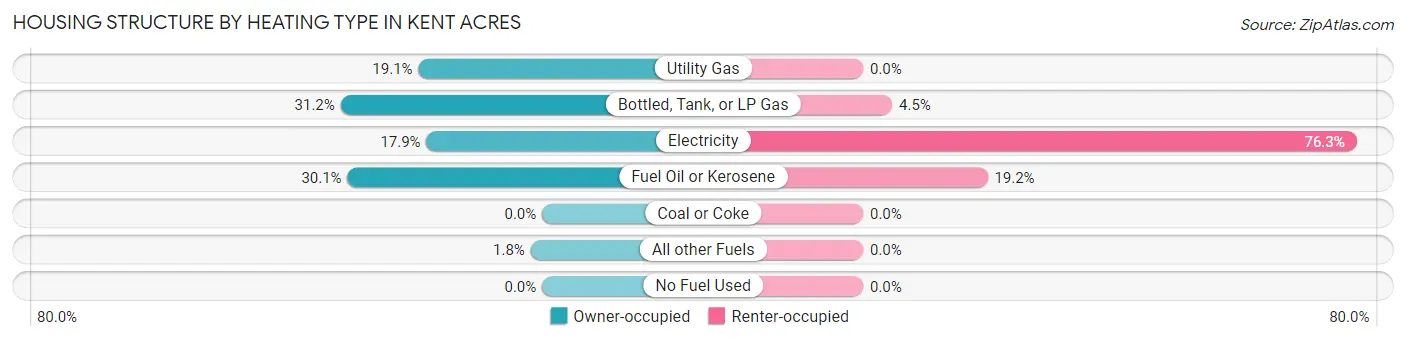
| Heating Type | Owner-occupied | Renter-occupied |
| Utility Gas | 108 (19.1%) | 0 (0.0%) |
| Bottled, Tank, or LP Gas | 176 (31.1%) | 7 (4.5%) |
| Electricity | 101 (17.9%) | 119 (76.3%) |
| Fuel Oil or Kerosene | 170 (30.1%) | 30 (19.2%) |
| Coal or Coke | 0 (0.0%) | 0 (0.0%) |
| All other Fuels | 10 (1.8%) | 0 (0.0%) |
| No Fuel Used | 0 (0.0%) | 0 (0.0%) |
| Total | 565 (100.0%) | 156 (100.0%) |
Household Vehicle Usage in Kent Acres
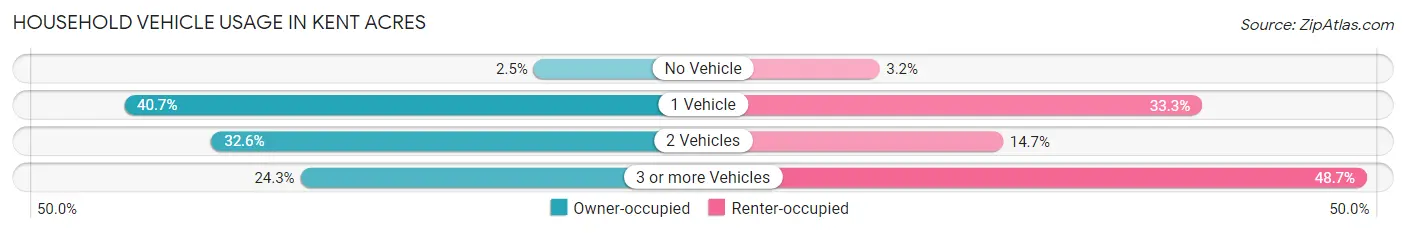
| Vehicles per Household | Owner-occupied | Renter-occupied |
| No Vehicle | 14 (2.5%) | 5 (3.2%) |
| 1 Vehicle | 230 (40.7%) | 52 (33.3%) |
| 2 Vehicles | 184 (32.6%) | 23 (14.7%) |
| 3 or more Vehicles | 137 (24.2%) | 76 (48.7%) |
| Total | 565 (100.0%) | 156 (100.0%) |
Real Estate & Mortgages in Kent Acres
Real Estate and Mortgage Overview in Kent Acres
| Characteristic | Without Mortgage | With Mortgage |
| Housing Units | 207 | 358 |
| Median Property Value | - | - |
| Median Household Income | $48,750 | $56 |
| Monthly Housing Costs | $613 | $19 |
| Real Estate Taxes | - | - |
Property Value by Mortgage Status in Kent Acres
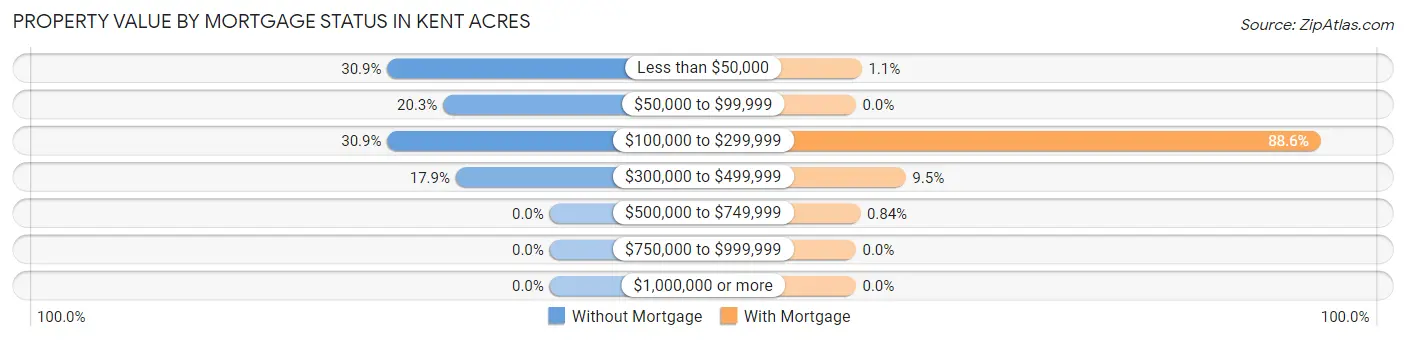
| Property Value | Without Mortgage | With Mortgage |
| Less than $50,000 | 64 (30.9%) | 4 (1.1%) |
| $50,000 to $99,999 | 42 (20.3%) | 0 (0.0%) |
| $100,000 to $299,999 | 64 (30.9%) | 317 (88.5%) |
| $300,000 to $499,999 | 37 (17.9%) | 34 (9.5%) |
| $500,000 to $749,999 | 0 (0.0%) | 3 (0.8%) |
| $750,000 to $999,999 | 0 (0.0%) | 0 (0.0%) |
| $1,000,000 or more | 0 (0.0%) | 0 (0.0%) |
| Total | 207 (100.0%) | 358 (100.0%) |
Household Income by Mortgage Status in Kent Acres
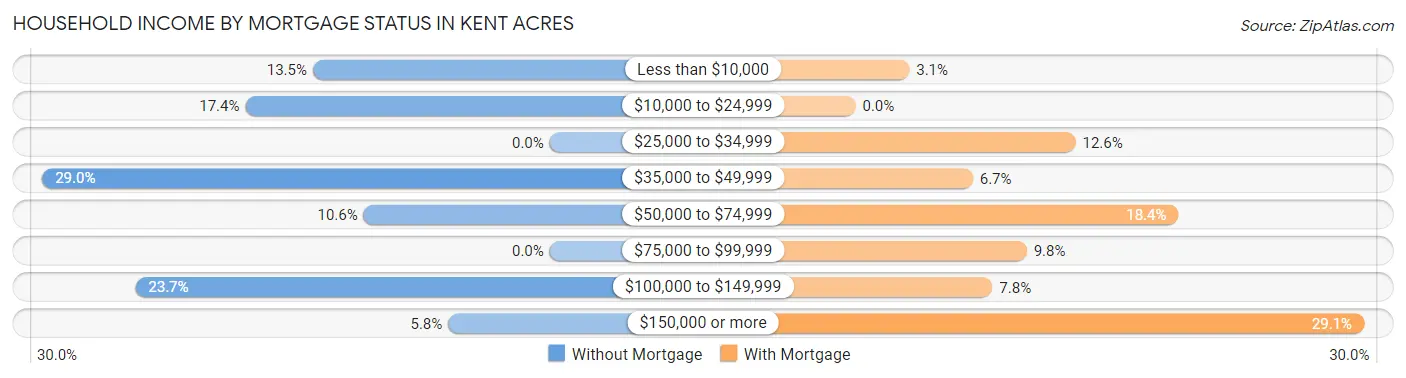
| Household Income | Without Mortgage | With Mortgage |
| Less than $10,000 | 28 (13.5%) | 11 (3.1%) |
| $10,000 to $24,999 | 36 (17.4%) | 0 (0.0%) |
| $25,000 to $34,999 | 0 (0.0%) | 45 (12.6%) |
| $35,000 to $49,999 | 60 (29.0%) | 24 (6.7%) |
| $50,000 to $74,999 | 22 (10.6%) | 66 (18.4%) |
| $75,000 to $99,999 | 0 (0.0%) | 35 (9.8%) |
| $100,000 to $149,999 | 49 (23.7%) | 28 (7.8%) |
| $150,000 or more | 12 (5.8%) | 104 (29.0%) |
| Total | 207 (100.0%) | 358 (100.0%) |
Property Value to Household Income Ratio in Kent Acres
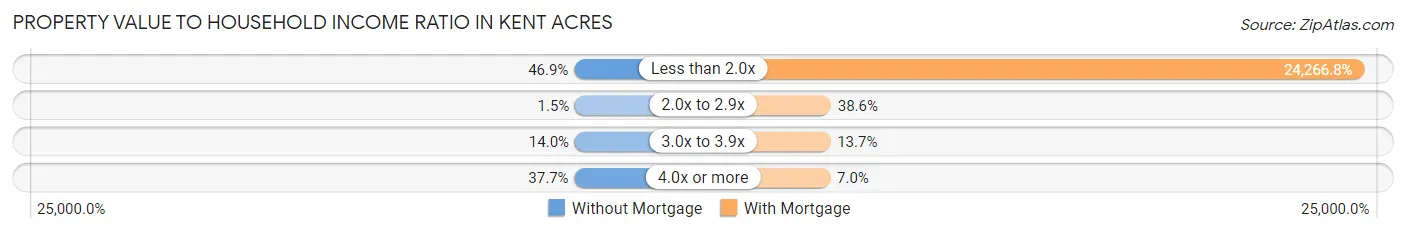
| Value-to-Income Ratio | Without Mortgage | With Mortgage |
| Less than 2.0x | 97 (46.9%) | 86,875 (24,266.8%) |
| 2.0x to 2.9x | 3 (1.5%) | 138 (38.6%) |
| 3.0x to 3.9x | 29 (14.0%) | 49 (13.7%) |
| 4.0x or more | 78 (37.7%) | 25 (7.0%) |
| Total | 207 (100.0%) | 358 (100.0%) |
Real Estate Taxes by Mortgage Status in Kent Acres
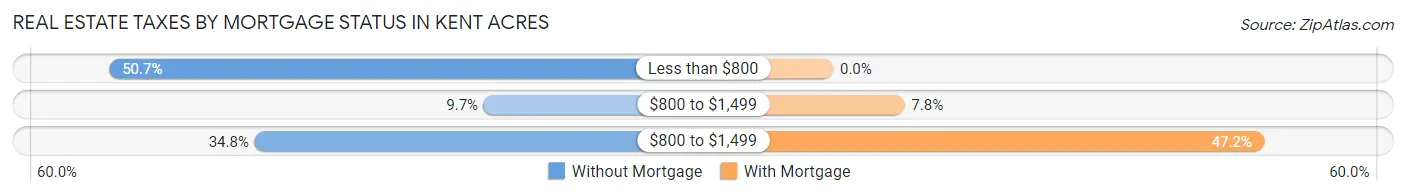
| Property Taxes | Without Mortgage | With Mortgage |
| Less than $800 | 105 (50.7%) | 0 (0.0%) |
| $800 to $1,499 | 20 (9.7%) | 28 (7.8%) |
| $800 to $1,499 | 72 (34.8%) | 169 (47.2%) |
| Total | 207 (100.0%) | 358 (100.0%) |
Health & Disability in Kent Acres
Health Insurance Coverage by Age in Kent Acres
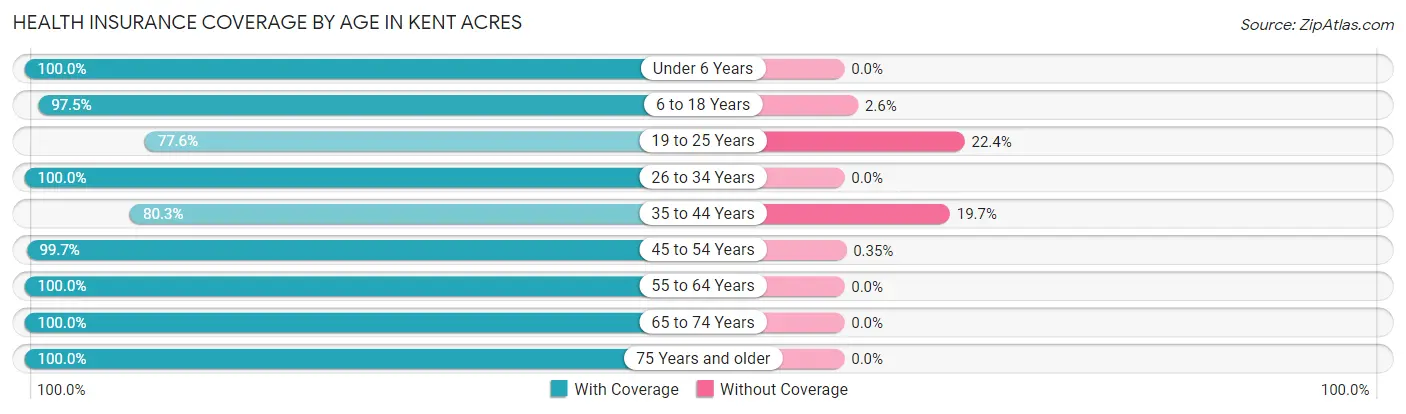
| Age Bracket | With Coverage | Without Coverage |
| Under 6 Years | 187 (100.0%) | 0 (0.0%) |
| 6 to 18 Years | 497 (97.5%) | 13 (2.5%) |
| 19 to 25 Years | 218 (77.6%) | 63 (22.4%) |
| 26 to 34 Years | 170 (100.0%) | 0 (0.0%) |
| 35 to 44 Years | 200 (80.3%) | 49 (19.7%) |
| 45 to 54 Years | 285 (99.7%) | 1 (0.4%) |
| 55 to 64 Years | 157 (100.0%) | 0 (0.0%) |
| 65 to 74 Years | 165 (100.0%) | 0 (0.0%) |
| 75 Years and older | 108 (100.0%) | 0 (0.0%) |
| Total | 1,987 (94.0%) | 126 (6.0%) |
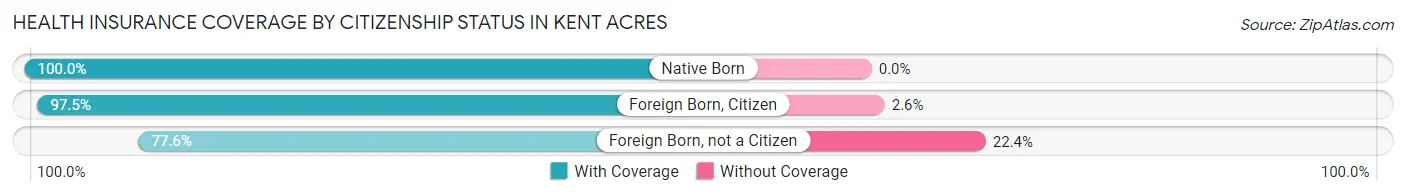
Health Insurance Coverage by Citizenship Status in Kent Acres
| Citizenship Status | With Coverage | Without Coverage |
| Native Born | 187 (100.0%) | 0 (0.0%) |
| Foreign Born, Citizen | 497 (97.5%) | 13 (2.5%) |
| Foreign Born, not a Citizen | 218 (77.6%) | 63 (22.4%) |
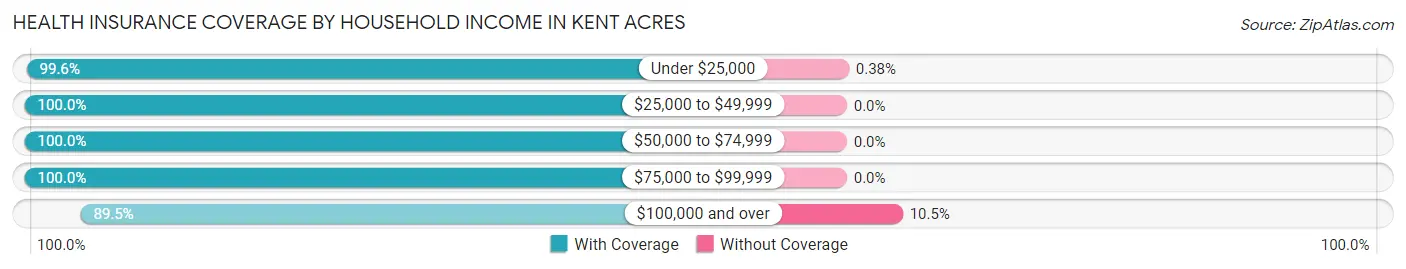
Health Insurance Coverage by Household Income in Kent Acres
| Household Income | With Coverage | Without Coverage |
| Under $25,000 | 264 (99.6%) | 1 (0.4%) |
| $25,000 to $49,999 | 351 (100.0%) | 0 (0.0%) |
| $50,000 to $74,999 | 236 (100.0%) | 0 (0.0%) |
| $75,000 to $99,999 | 62 (100.0%) | 0 (0.0%) |
| $100,000 and over | 1,069 (89.5%) | 125 (10.5%) |
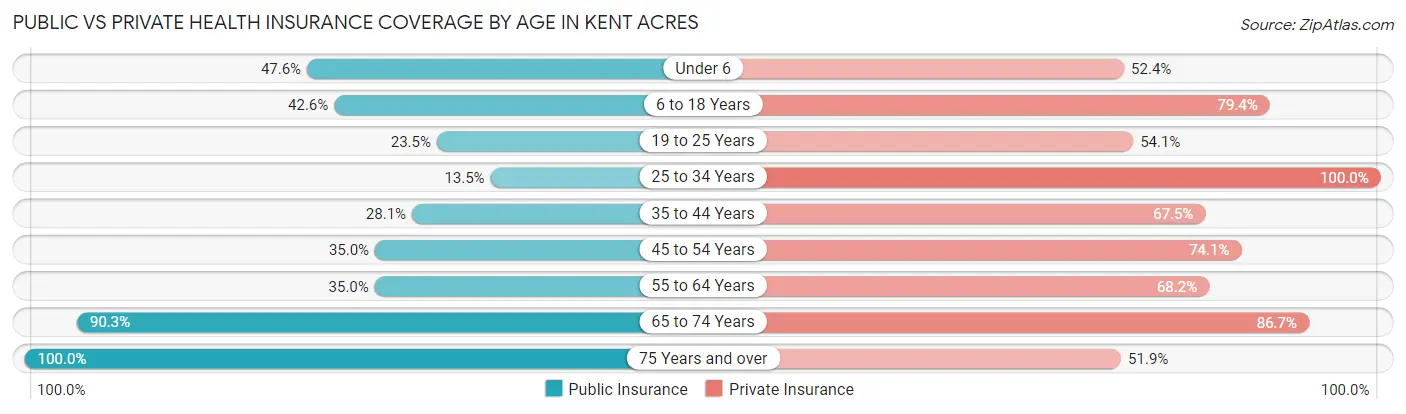
Public vs Private Health Insurance Coverage by Age in Kent Acres
| Age Bracket | Public Insurance | Private Insurance |
| Under 6 | 89 (47.6%) | 98 (52.4%) |
| 6 to 18 Years | 217 (42.5%) | 405 (79.4%) |
| 19 to 25 Years | 66 (23.5%) | 152 (54.1%) |
| 25 to 34 Years | 23 (13.5%) | 170 (100.0%) |
| 35 to 44 Years | 70 (28.1%) | 168 (67.5%) |
| 45 to 54 Years | 100 (35.0%) | 212 (74.1%) |
| 55 to 64 Years | 55 (35.0%) | 107 (68.1%) |
| 65 to 74 Years | 149 (90.3%) | 143 (86.7%) |
| 75 Years and over | 108 (100.0%) | 56 (51.8%) |
| Total | 877 (41.5%) | 1,511 (71.5%) |
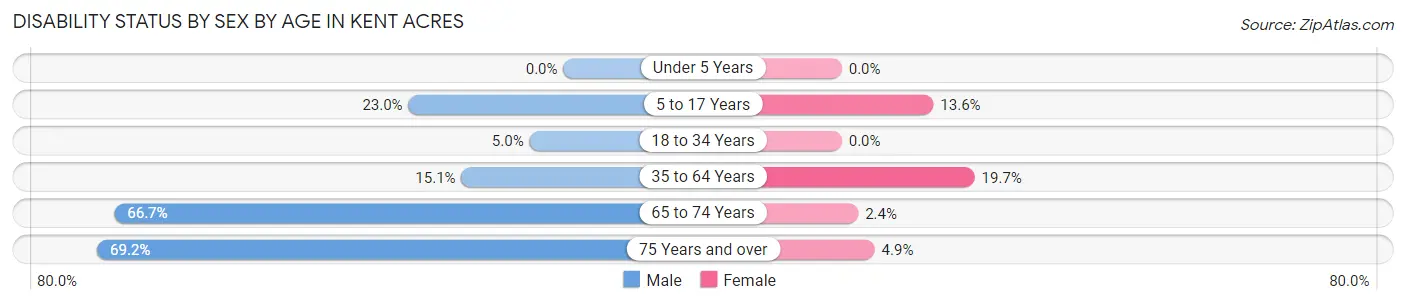
Disability Status by Sex by Age in Kent Acres
| Age Bracket | Male | Female |
| Under 5 Years | 0 (0.0%) | 0 (0.0%) |
| 5 to 17 Years | 69 (23.0%) | 31 (13.6%) |
| 18 to 34 Years | 16 (5.0%) | 0 (0.0%) |
| 35 to 64 Years | 48 (15.1%) | 74 (19.7%) |
| 65 to 74 Years | 28 (66.7%) | 3 (2.4%) |
| 75 Years and over | 18 (69.2%) | 4 (4.9%) |
Disability Class by Sex by Age in Kent Acres
Disability Class: Hearing Difficulty
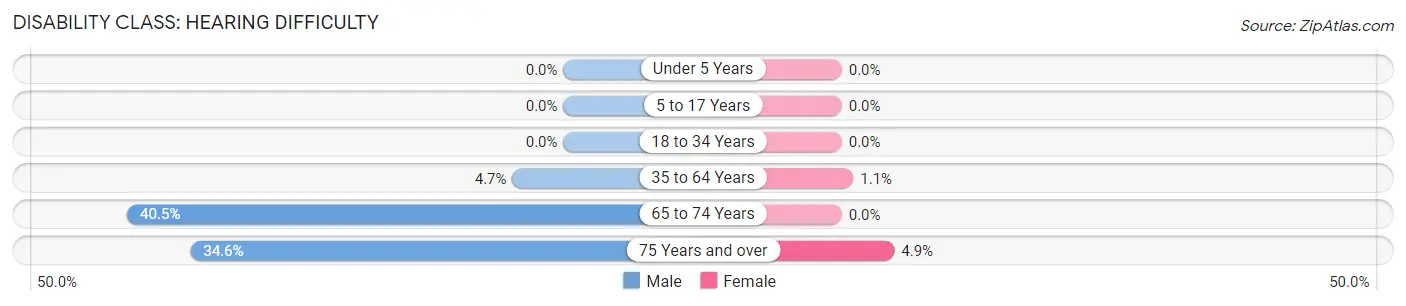
| Age Bracket | Male | Female |
| Under 5 Years | 0 (0.0%) | 0 (0.0%) |
| 5 to 17 Years | 0 (0.0%) | 0 (0.0%) |
| 18 to 34 Years | 0 (0.0%) | 0 (0.0%) |
| 35 to 64 Years | 15 (4.7%) | 4 (1.1%) |
| 65 to 74 Years | 17 (40.5%) | 0 (0.0%) |
| 75 Years and over | 9 (34.6%) | 4 (4.9%) |
Disability Class: Vision Difficulty
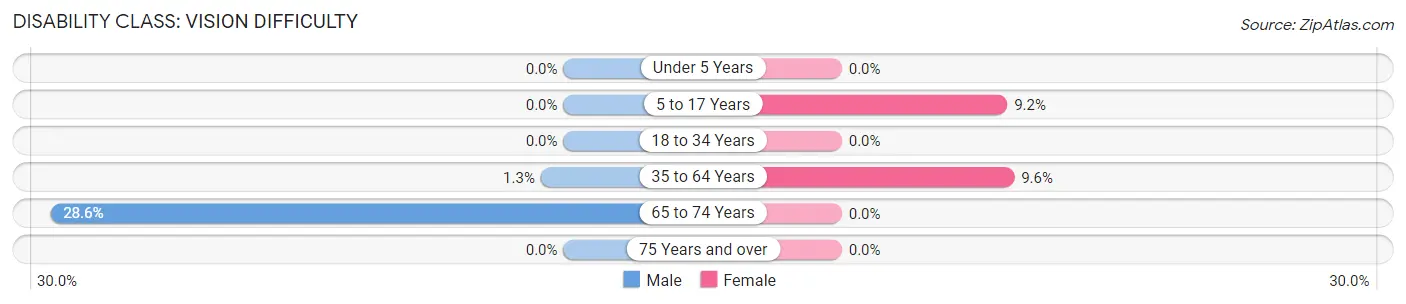
| Age Bracket | Male | Female |
| Under 5 Years | 0 (0.0%) | 0 (0.0%) |
| 5 to 17 Years | 0 (0.0%) | 21 (9.2%) |
| 18 to 34 Years | 0 (0.0%) | 0 (0.0%) |
| 35 to 64 Years | 4 (1.3%) | 36 (9.6%) |
| 65 to 74 Years | 12 (28.6%) | 0 (0.0%) |
| 75 Years and over | 0 (0.0%) | 0 (0.0%) |
Disability Class: Cognitive Difficulty
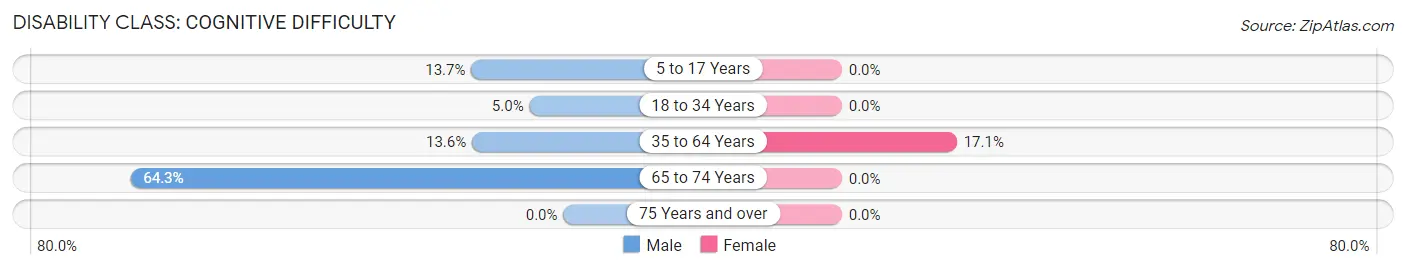
| Age Bracket | Male | Female |
| 5 to 17 Years | 41 (13.7%) | 0 (0.0%) |
| 18 to 34 Years | 16 (5.0%) | 0 (0.0%) |
| 35 to 64 Years | 43 (13.6%) | 64 (17.1%) |
| 65 to 74 Years | 27 (64.3%) | 0 (0.0%) |
| 75 Years and over | 0 (0.0%) | 0 (0.0%) |
Disability Class: Ambulatory Difficulty
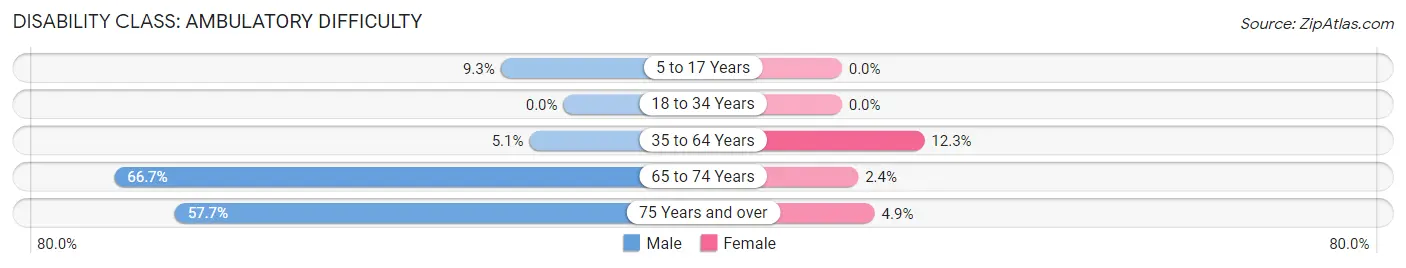
| Age Bracket | Male | Female |
| 5 to 17 Years | 28 (9.3%) | 0 (0.0%) |
| 18 to 34 Years | 0 (0.0%) | 0 (0.0%) |
| 35 to 64 Years | 16 (5.1%) | 46 (12.3%) |
| 65 to 74 Years | 28 (66.7%) | 3 (2.4%) |
| 75 Years and over | 15 (57.7%) | 4 (4.9%) |
Disability Class: Self-Care Difficulty
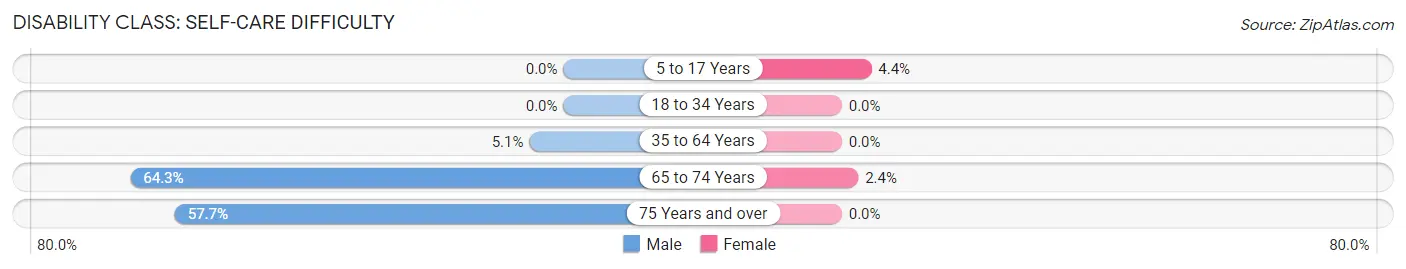
| Age Bracket | Male | Female |
| 5 to 17 Years | 0 (0.0%) | 10 (4.4%) |
| 18 to 34 Years | 0 (0.0%) | 0 (0.0%) |
| 35 to 64 Years | 16 (5.1%) | 0 (0.0%) |
| 65 to 74 Years | 27 (64.3%) | 3 (2.4%) |
| 75 Years and over | 15 (57.7%) | 0 (0.0%) |
Technology Access in Kent Acres
Computing Device Access in Kent Acres
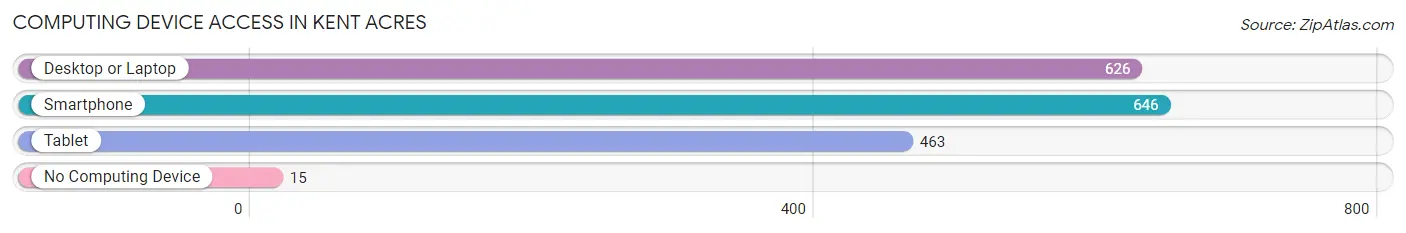
| Device Type | # Households | % Households |
| Desktop or Laptop | 626 | 86.8% |
| Smartphone | 646 | 89.6% |
| Tablet | 463 | 64.2% |
| No Computing Device | 15 | 2.1% |
| Total | 721 | 100.0% |
Internet Access in Kent Acres
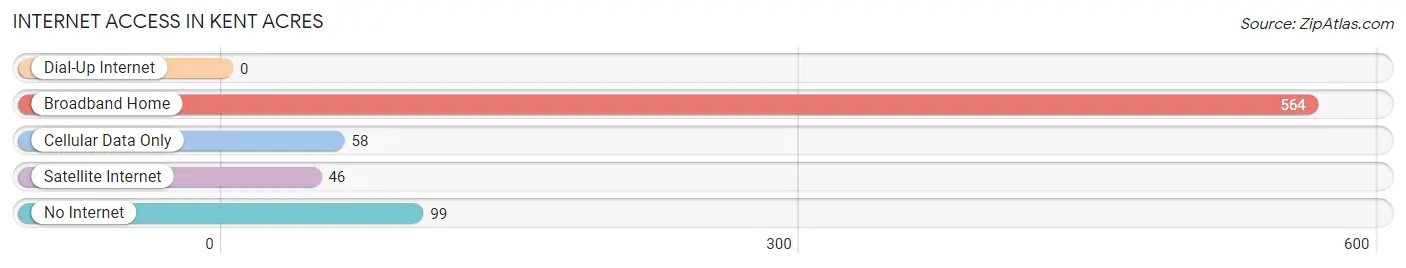
| Internet Type | # Households | % Households |
| Dial-Up Internet | 0 | 0.0% |
| Broadband Home | 564 | 78.2% |
| Cellular Data Only | 58 | 8.0% |
| Satellite Internet | 46 | 6.4% |
| No Internet | 99 | 13.7% |
| Total | 721 | 100.0% |
Kent Acres Summary
Kent Acres is a small unincorporated community located in Kent County, Delaware. It is situated in the northern part of the state, just south of the Maryland border. The community is bordered by the towns of Camden, Wyoming, and Dover. The population of Kent Acres was estimated to be 1,845 in the 2010 census.
Geography
Kent Acres is located in the northern part of Kent County, Delaware. It is situated between the towns of Camden, Wyoming, and Dover. The community is located on the Delmarva Peninsula, which is bordered by the Chesapeake Bay to the east and the Atlantic Ocean to the south. The area is mostly flat, with some rolling hills in the northern part of the community. The climate is humid subtropical, with hot, humid summers and mild winters.
Economy
The economy of Kent Acres is largely based on agriculture and tourism. The area is home to several farms, which produce a variety of crops, including corn, soybeans, wheat, and hay. The area is also home to several wineries, which produce a variety of wines. Tourism is also an important part of the economy, with visitors coming to the area to enjoy the beaches, fishing, and other outdoor activities.
Demographics
According to the 2010 census, the population of Kent Acres was 1,845. The racial makeup of the community was 94.3% White, 2.2% African American, 0.7% Native American, 0.7% Asian, 0.2% Pacific Islander, and 1.9% from other races. The median household income was $50,938, and the median family income was $60,938. The per capita income was $25,938.
History
The area that is now Kent Acres was first settled in the late 1700s by English and Dutch settlers. The area was originally part of Kent County, which was established in 1682. The area was primarily agricultural, with the main crops being corn, wheat, and hay. In the late 1800s, the area began to develop as a resort community, with several hotels and resorts being built in the area. The area continued to grow and develop throughout the 20th century, and today it is a thriving community with a variety of businesses and services.
Common Questions
What is Per Capita Income in Kent Acres?
Per Capita income in Kent Acres is $28,900.
What is the Median Family Income in Kent Acres?
Median Family Income in Kent Acres is $68,409.
What is the Median Household income in Kent Acres?
Median Household Income in Kent Acres is $68,162.
What is Income or Wage Gap in Kent Acres?
Income or Wage Gap in Kent Acres is 6.8%.
Women in Kent Acres earn 93.2 cents for every dollar earned by a man.
What is Inequality or Gini Index in Kent Acres?
Inequality or Gini Index in Kent Acres is 0.39.
What is the Total Population of Kent Acres?
Total Population of Kent Acres is 2,124.
What is the Total Male Population of Kent Acres?
Total Male Population of Kent Acres is 1,095.
What is the Total Female Population of Kent Acres?
Total Female Population of Kent Acres is 1,029.
What is the Ratio of Males per 100 Females in Kent Acres?
There are 106.41 Males per 100 Females in Kent Acres.
What is the Ratio of Females per 100 Males in Kent Acres?
There are 93.97 Females per 100 Males in Kent Acres.
What is the Median Population Age in Kent Acres?
Median Population Age in Kent Acres is 29.9 Years.
What is the Average Family Size in Kent Acres
Average Family Size in Kent Acres is 3.6 People.
What is the Average Household Size in Kent Acres
Average Household Size in Kent Acres is 2.9 People.
How Large is the Labor Force in Kent Acres?
There are 971 People in the Labor Forcein in Kent Acres.
What is the Percentage of People in the Labor Force in Kent Acres?
62.1% of People are in the Labor Force in Kent Acres.
What is the Unemployment Rate in Kent Acres?
Unemployment Rate in Kent Acres is 6.8%.