Sweetwater, FL Map & Demographics
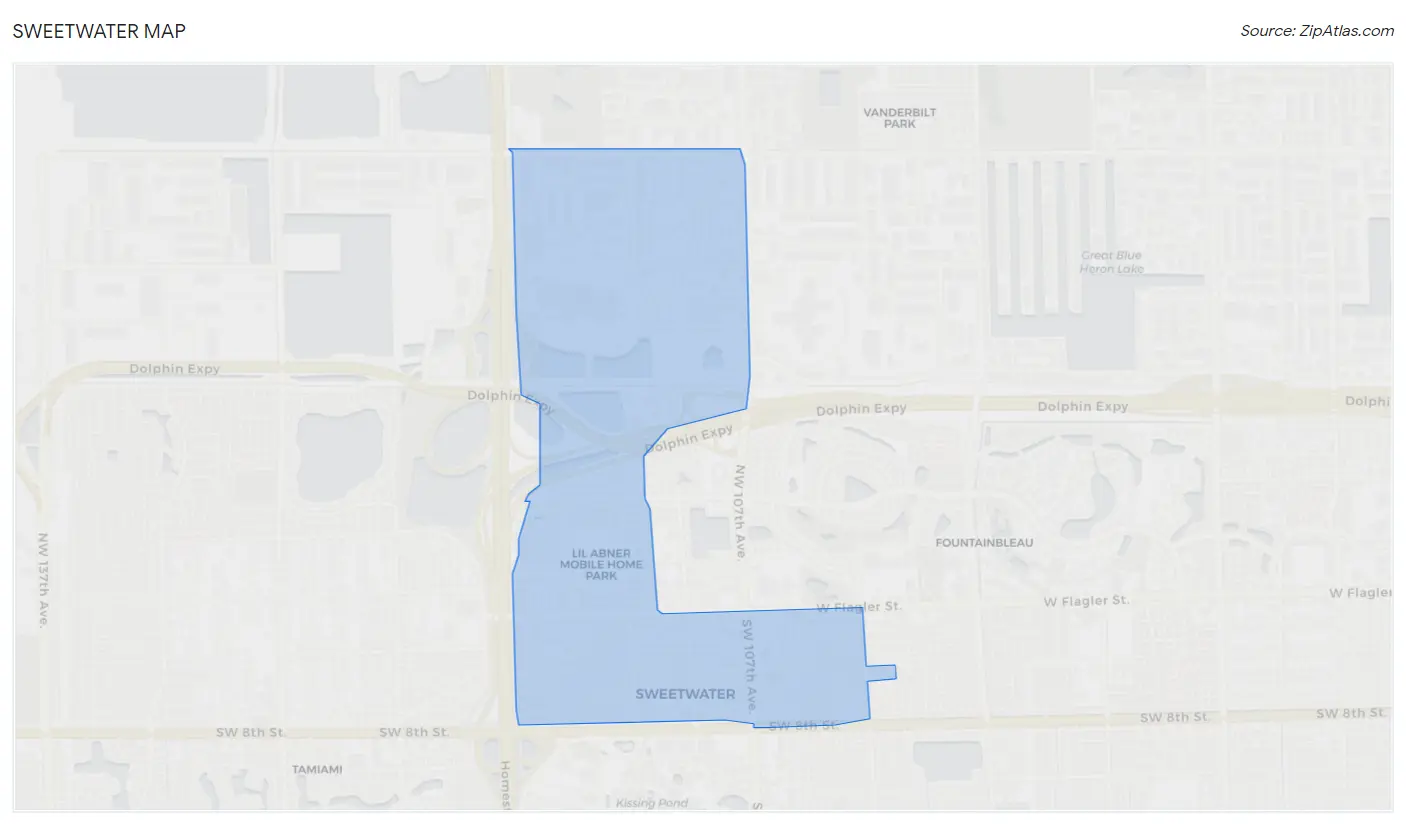
Sweetwater Map
Sweetwater Overview
$21,743
PER CAPITA INCOME
$57,752
AVG FAMILY INCOME
$53,159
AVG HOUSEHOLD INCOME
29.2%
WAGE / INCOME GAP [ % ]
70.8¢/ $1
WAGE / INCOME GAP [ $ ]
$10,632
FAMILY INCOME DEFICIT
0.41
INEQUALITY / GINI INDEX
19,399
TOTAL POPULATION
9,885
MALE POPULATION
9,514
FEMALE POPULATION
103.90
MALES / 100 FEMALES
96.25
FEMALES / 100 MALES
41.6
MEDIAN AGE
3.5
AVG FAMILY SIZE
3.1
AVG HOUSEHOLD SIZE
10,446
LABOR FORCE [ PEOPLE ]
63.5%
PERCENT IN LABOR FORCE
4.8%
UNEMPLOYMENT RATE
Income in Sweetwater
Income Overview in Sweetwater
Per Capita Income in Sweetwater is $21,743, while median incomes of families and households are $57,752 and $53,159 respectively.
| Characteristic | Number | Measure |
| Per Capita Income | 19,399 | $21,743 |
| Median Family Income | 4,639 | $57,752 |
| Mean Family Income | 4,639 | $67,374 |
| Median Household Income | 6,312 | $53,159 |
| Mean Household Income | 6,312 | $62,548 |
| Income Deficit | 4,639 | $10,632 |
| Wage / Income Gap (%) | 19,399 | 29.21% |
| Wage / Income Gap ($) | 19,399 | 70.79¢ per $1 |
| Gini / Inequality Index | 19,399 | 0.41 |
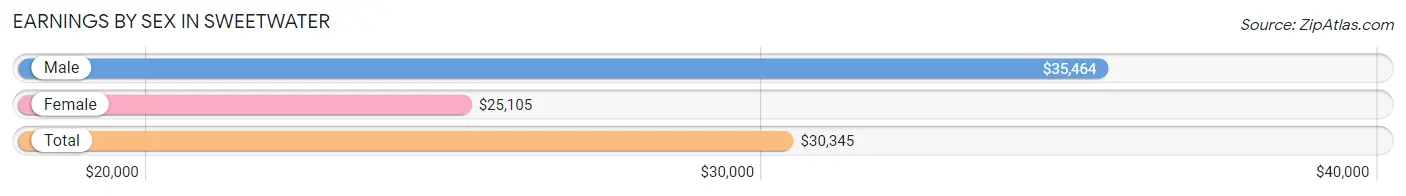
Earnings by Sex in Sweetwater
Average Earnings in Sweetwater are $30,345, $35,464 for men and $25,105 for women, a difference of 29.2%.
| Sex | Number | Average Earnings |
| Male | 5,842 (56.2%) | $35,464 |
| Female | 4,544 (43.8%) | $25,105 |
| Total | 10,386 (100.0%) | $30,345 |
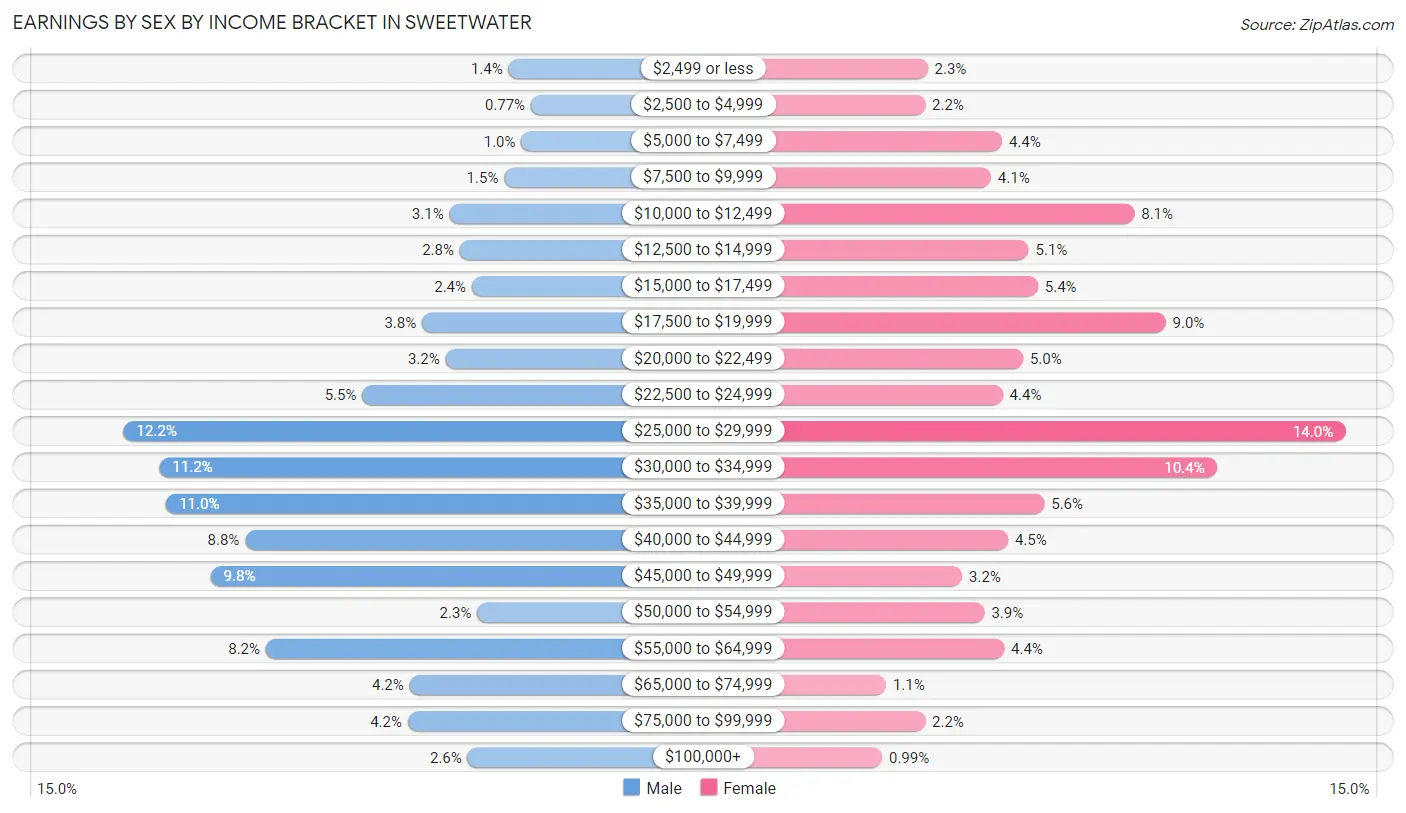
Earnings by Sex by Income Bracket in Sweetwater
The most common earnings brackets in Sweetwater are $25,000 to $29,999 for men (714 | 12.2%) and $25,000 to $29,999 for women (636 | 14.0%).
| Income | Male | Female |
| $2,499 or less | 82 (1.4%) | 103 (2.3%) |
| $2,500 to $4,999 | 45 (0.8%) | 100 (2.2%) |
| $5,000 to $7,499 | 61 (1.0%) | 198 (4.4%) |
| $7,500 to $9,999 | 89 (1.5%) | 184 (4.1%) |
| $10,000 to $12,499 | 179 (3.1%) | 367 (8.1%) |
| $12,500 to $14,999 | 162 (2.8%) | 232 (5.1%) |
| $15,000 to $17,499 | 142 (2.4%) | 244 (5.4%) |
| $17,500 to $19,999 | 224 (3.8%) | 407 (9.0%) |
| $20,000 to $22,499 | 185 (3.2%) | 225 (5.0%) |
| $22,500 to $24,999 | 322 (5.5%) | 199 (4.4%) |
| $25,000 to $29,999 | 714 (12.2%) | 636 (14.0%) |
| $30,000 to $34,999 | 655 (11.2%) | 472 (10.4%) |
| $35,000 to $39,999 | 644 (11.0%) | 252 (5.6%) |
| $40,000 to $44,999 | 514 (8.8%) | 206 (4.5%) |
| $45,000 to $49,999 | 571 (9.8%) | 147 (3.2%) |
| $50,000 to $54,999 | 133 (2.3%) | 176 (3.9%) |
| $55,000 to $64,999 | 480 (8.2%) | 201 (4.4%) |
| $65,000 to $74,999 | 244 (4.2%) | 50 (1.1%) |
| $75,000 to $99,999 | 247 (4.2%) | 100 (2.2%) |
| $100,000+ | 149 (2.5%) | 45 (1.0%) |
| Total | 5,842 (100.0%) | 4,544 (100.0%) |
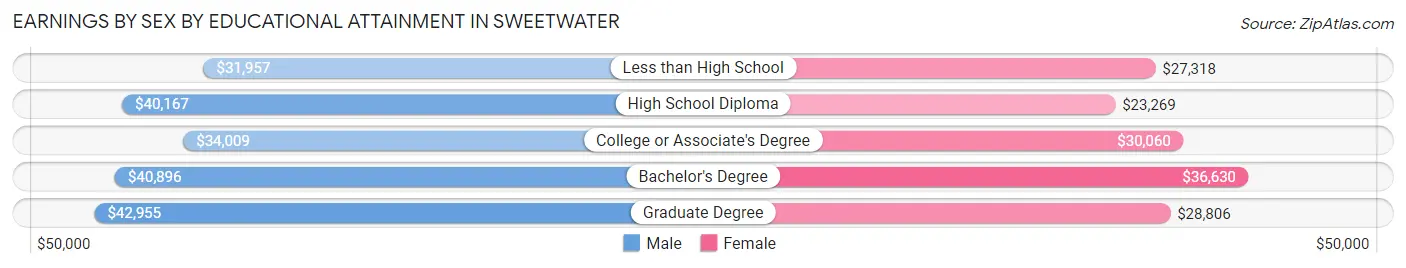
Earnings by Sex by Educational Attainment in Sweetwater
Average earnings in Sweetwater are $36,870 for men and $26,312 for women, a difference of 28.6%. Men with an educational attainment of graduate degree enjoy the highest average annual earnings of $42,955, while those with less than high school education earn the least with $31,957. Women with an educational attainment of bachelor's degree earn the most with the average annual earnings of $36,630, while those with high school diploma education have the smallest earnings of $23,269.
| Educational Attainment | Male Income | Female Income |
| Less than High School | $31,957 | $27,318 |
| High School Diploma | $40,167 | $23,269 |
| College or Associate's Degree | $34,009 | $30,060 |
| Bachelor's Degree | $40,896 | $36,630 |
| Graduate Degree | $42,955 | $28,806 |
| Total | $36,870 | $26,312 |
Family Income in Sweetwater
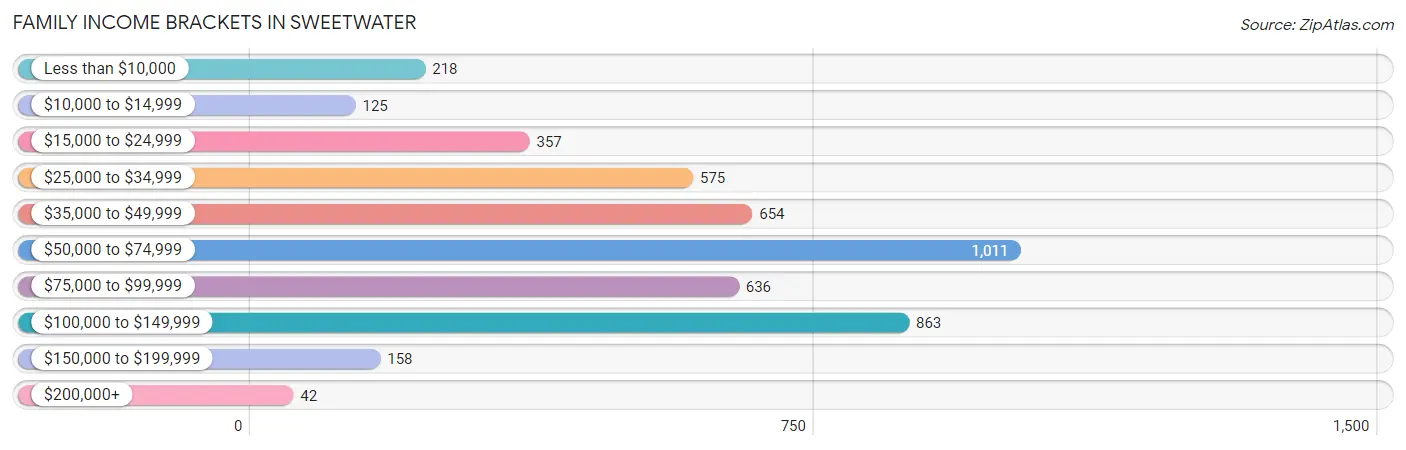
Family Income Brackets in Sweetwater
According to the Sweetwater family income data, there are 1,011 families falling into the $50,000 to $74,999 income range, which is the most common income bracket and makes up 21.8% of all families. Conversely, the $200,000+ income bracket is the least frequent group with only 42 families (0.9%) belonging to this category.
| Income Bracket | # Families | % Families |
| Less than $10,000 | 218 | 4.7% |
| $10,000 to $14,999 | 125 | 2.7% |
| $15,000 to $24,999 | 357 | 7.7% |
| $25,000 to $34,999 | 575 | 12.4% |
| $35,000 to $49,999 | 654 | 14.1% |
| $50,000 to $74,999 | 1,011 | 21.8% |
| $75,000 to $99,999 | 636 | 13.7% |
| $100,000 to $149,999 | 863 | 18.6% |
| $150,000 to $199,999 | 158 | 3.4% |
| $200,000+ | 42 | 0.9% |
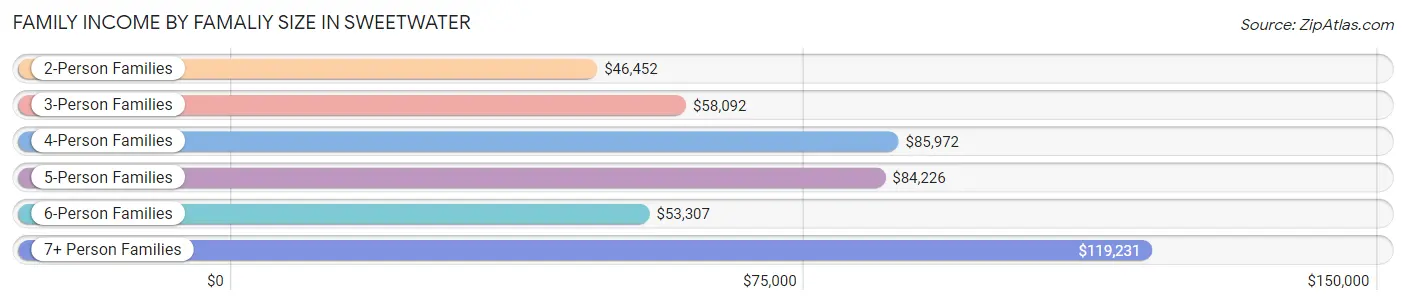
Family Income by Famaliy Size in Sweetwater
7+ person families (62 | 1.3%) account for the highest median family income in Sweetwater with $119,231 per family, while 2-person families (1,518 | 32.7%) have the highest median income of $23,226 per family member.
| Income Bracket | # Families | Median Income |
| 2-Person Families | 1,518 (32.7%) | $46,452 |
| 3-Person Families | 1,585 (34.2%) | $58,092 |
| 4-Person Families | 950 (20.5%) | $85,972 |
| 5-Person Families | 285 (6.1%) | $84,226 |
| 6-Person Families | 239 (5.1%) | $53,307 |
| 7+ Person Families | 62 (1.3%) | $119,231 |
| Total | 4,639 (100.0%) | $57,752 |
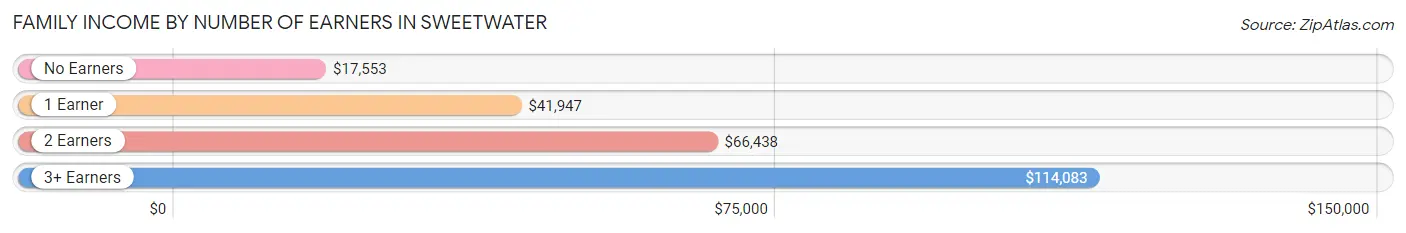
Family Income by Number of Earners in Sweetwater
The median family income in Sweetwater is $57,752, with families comprising 3+ earners (809) having the highest median family income of $114,083, while families with no earners (612) have the lowest median family income of $17,553, accounting for 17.4% and 13.2% of families, respectively.
| Number of Earners | # Families | Median Income |
| No Earners | 612 (13.2%) | $17,553 |
| 1 Earner | 1,432 (30.9%) | $41,947 |
| 2 Earners | 1,786 (38.5%) | $66,438 |
| 3+ Earners | 809 (17.4%) | $114,083 |
| Total | 4,639 (100.0%) | $57,752 |
Household Income in Sweetwater
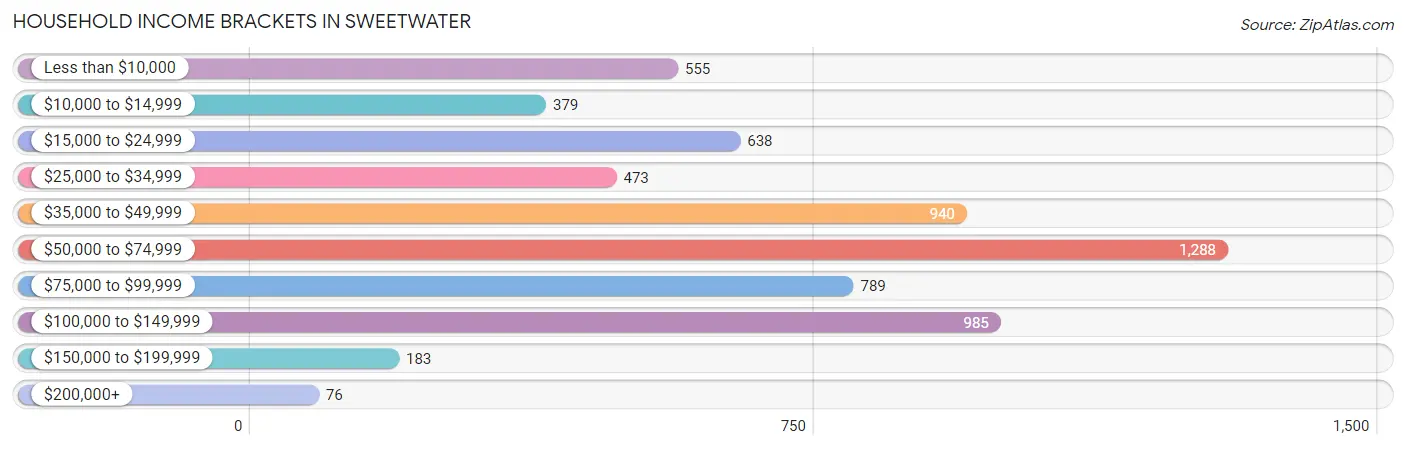
Household Income Brackets in Sweetwater
With 1,288 households falling in the category, the $50,000 to $74,999 income range is the most frequent in Sweetwater, accounting for 20.4% of all households. In contrast, only 76 households (1.2%) fall into the $200,000+ income bracket, making it the least populous group.
| Income Bracket | # Households | % Households |
| Less than $10,000 | 555 | 8.8% |
| $10,000 to $14,999 | 379 | 6.0% |
| $15,000 to $24,999 | 638 | 10.1% |
| $25,000 to $34,999 | 473 | 7.5% |
| $35,000 to $49,999 | 940 | 14.9% |
| $50,000 to $74,999 | 1,288 | 20.4% |
| $75,000 to $99,999 | 789 | 12.5% |
| $100,000 to $149,999 | 985 | 15.6% |
| $150,000 to $199,999 | 183 | 2.9% |
| $200,000+ | 76 | 1.2% |
Household Income by Householder Age in Sweetwater
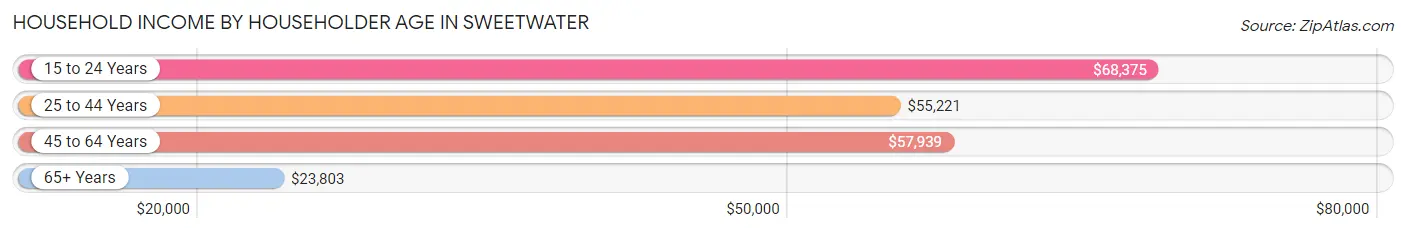
The median household income in Sweetwater is $53,159, with the highest median household income of $68,375 found in the 15 to 24 years age bracket for the primary householder. A total of 267 households (4.2%) fall into this category. Meanwhile, the 65+ years age bracket for the primary householder has the lowest median household income of $23,803, with 1,522 households (24.1%) in this group.
| Income Bracket | # Households | Median Income |
| 15 to 24 Years | 267 (4.2%) | $68,375 |
| 25 to 44 Years | 1,731 (27.4%) | $55,221 |
| 45 to 64 Years | 2,792 (44.2%) | $57,939 |
| 65+ Years | 1,522 (24.1%) | $23,803 |
| Total | 6,312 (100.0%) | $53,159 |
Poverty in Sweetwater
Income Below Poverty by Sex and Age in Sweetwater
With 12.9% poverty level for males and 18.6% for females among the residents of Sweetwater, 5 year old males and 65 to 74 year old females are the most vulnerable to poverty, with 14 males (38.9%) and 297 females (40.2%) in their respective age groups living below the poverty level.
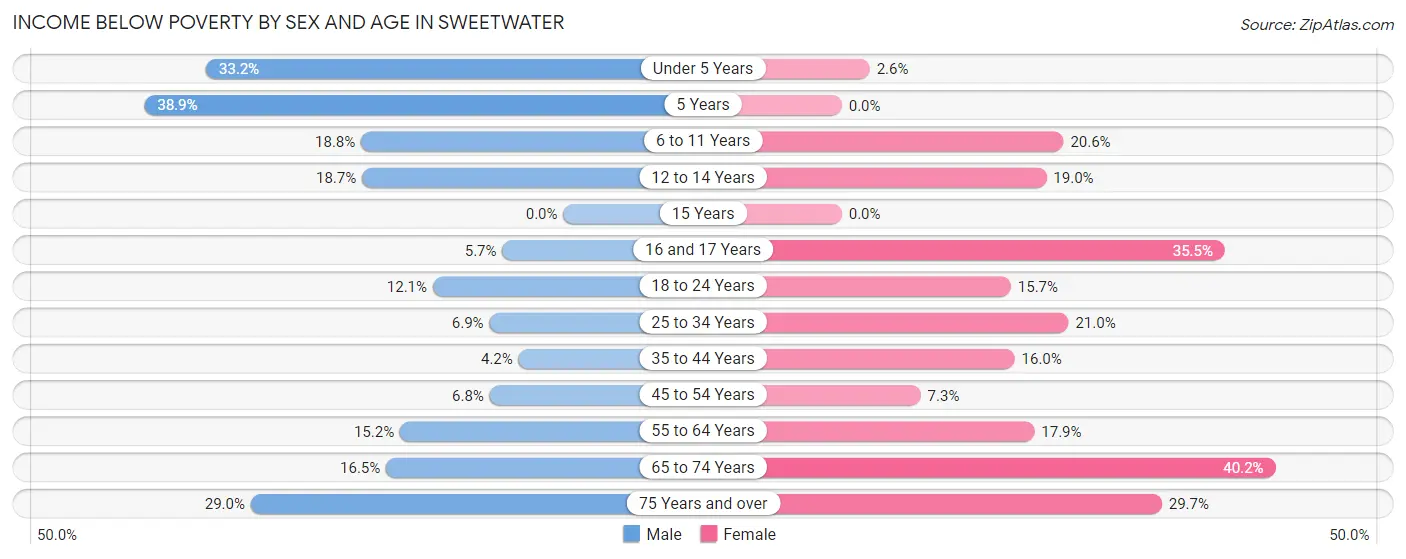
| Age Bracket | Male | Female |
| Under 5 Years | 205 (33.2%) | 10 (2.6%) |
| 5 Years | 14 (38.9%) | 0 (0.0%) |
| 6 to 11 Years | 131 (18.8%) | 87 (20.6%) |
| 12 to 14 Years | 51 (18.7%) | 60 (19.0%) |
| 15 Years | 0 (0.0%) | 0 (0.0%) |
| 16 and 17 Years | 9 (5.7%) | 59 (35.5%) |
| 18 to 24 Years | 117 (12.1%) | 174 (15.7%) |
| 25 to 34 Years | 96 (6.9%) | 243 (21.0%) |
| 35 to 44 Years | 57 (4.2%) | 200 (16.0%) |
| 45 to 54 Years | 119 (6.8%) | 102 (7.3%) |
| 55 to 64 Years | 180 (15.2%) | 292 (17.9%) |
| 65 to 74 Years | 127 (16.5%) | 297 (40.2%) |
| 75 Years and over | 170 (29.0%) | 245 (29.7%) |
| Total | 1,276 (12.9%) | 1,769 (18.6%) |
Income Above Poverty by Sex and Age in Sweetwater
According to the poverty statistics in Sweetwater, males aged 15 years and females aged 5 years are the age groups that are most secure financially, with 100.0% of males and 100.0% of females in these age groups living above the poverty line.
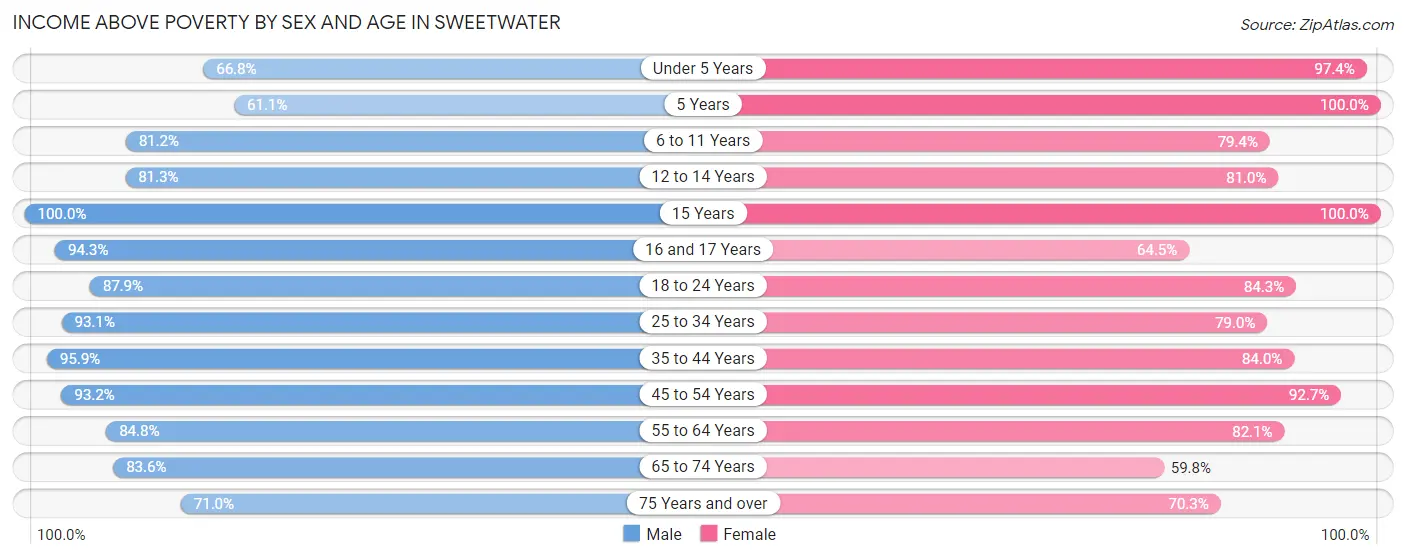
| Age Bracket | Male | Female |
| Under 5 Years | 413 (66.8%) | 376 (97.4%) |
| 5 Years | 22 (61.1%) | 61 (100.0%) |
| 6 to 11 Years | 567 (81.2%) | 336 (79.4%) |
| 12 to 14 Years | 222 (81.3%) | 256 (81.0%) |
| 15 Years | 60 (100.0%) | 61 (100.0%) |
| 16 and 17 Years | 150 (94.3%) | 107 (64.5%) |
| 18 to 24 Years | 849 (87.9%) | 935 (84.3%) |
| 25 to 34 Years | 1,303 (93.1%) | 912 (79.0%) |
| 35 to 44 Years | 1,318 (95.9%) | 1,047 (84.0%) |
| 45 to 54 Years | 1,620 (93.2%) | 1,291 (92.7%) |
| 55 to 64 Years | 1,007 (84.8%) | 1,342 (82.1%) |
| 65 to 74 Years | 645 (83.6%) | 441 (59.8%) |
| 75 Years and over | 416 (71.0%) | 580 (70.3%) |
| Total | 8,592 (87.1%) | 7,745 (81.4%) |
Income Below Poverty Among Married-Couple Families in Sweetwater
The poverty statistics for married-couple families in Sweetwater show that 9.2% or 241 of the total 2,629 families live below the poverty line. Families with 1 or 2 children have the highest poverty rate of 12.9%, comprising of 134 families. On the other hand, families with 3 or 4 children have the lowest poverty rate of 0.0%, which includes 0 families.
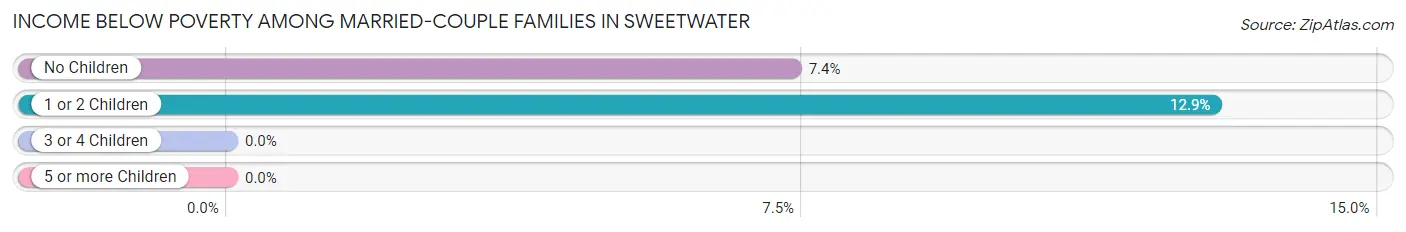
| Children | Above Poverty | Below Poverty |
| No Children | 1,346 (92.6%) | 107 (7.4%) |
| 1 or 2 Children | 909 (87.2%) | 134 (12.9%) |
| 3 or 4 Children | 120 (100.0%) | 0 (0.0%) |
| 5 or more Children | 13 (100.0%) | 0 (0.0%) |
| Total | 2,388 (90.8%) | 241 (9.2%) |
Income Below Poverty Among Single-Parent Households in Sweetwater
According to the poverty data in Sweetwater, 4.4% or 28 single-father households and 18.1% or 250 single-mother households are living below the poverty line. Among single-father households, those with 1 or 2 children have the highest poverty rate, with 13 households (6.8%) experiencing poverty. Likewise, among single-mother households, those with 3 or 4 children have the highest poverty rate, with 8 households (100.0%) falling below the poverty line.
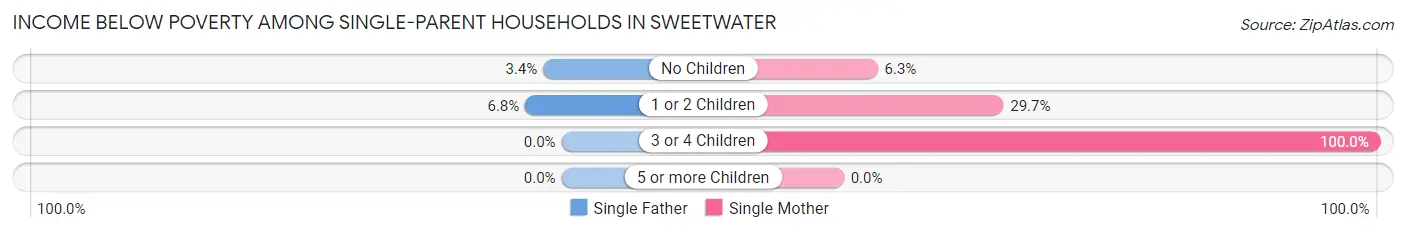
| Children | Single Father | Single Mother |
| No Children | 15 (3.4%) | 44 (6.3%) |
| 1 or 2 Children | 13 (6.8%) | 198 (29.7%) |
| 3 or 4 Children | 0 (0.0%) | 8 (100.0%) |
| 5 or more Children | 0 (0.0%) | 0 (0.0%) |
| Total | 28 (4.4%) | 250 (18.1%) |
Income Below Poverty Among Married-Couple vs Single-Parent Households in Sweetwater
The poverty data for Sweetwater shows that 241 of the married-couple family households (9.2%) and 278 of the single-parent households (13.8%) are living below the poverty level. Within the married-couple family households, those with 1 or 2 children have the highest poverty rate, with 134 households (12.9%) falling below the poverty line. Among the single-parent households, those with 3 or 4 children have the highest poverty rate, with 8 household (100.0%) living below poverty.
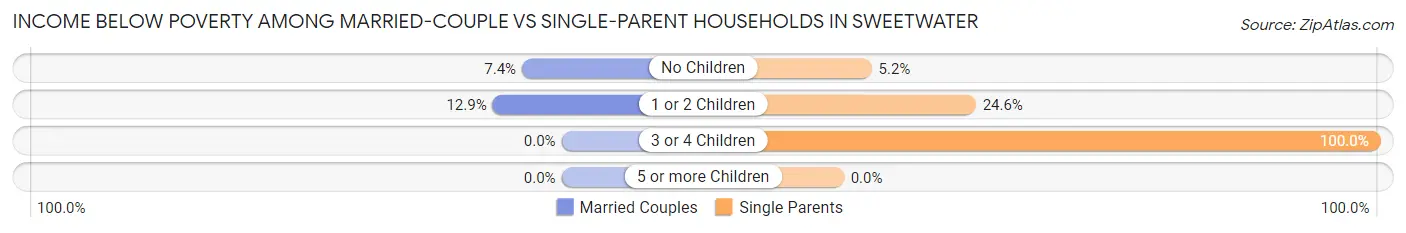
| Children | Married-Couple Families | Single-Parent Households |
| No Children | 107 (7.4%) | 59 (5.2%) |
| 1 or 2 Children | 134 (12.9%) | 211 (24.6%) |
| 3 or 4 Children | 0 (0.0%) | 8 (100.0%) |
| 5 or more Children | 0 (0.0%) | 0 (0.0%) |
| Total | 241 (9.2%) | 278 (13.8%) |
Race in Sweetwater
The most populous races in Sweetwater are Hispanic or Latino (18,500 | 95.4%), White / Caucasian (10,188 | 52.5%), and Two or more Races (7,725 | 39.8%).
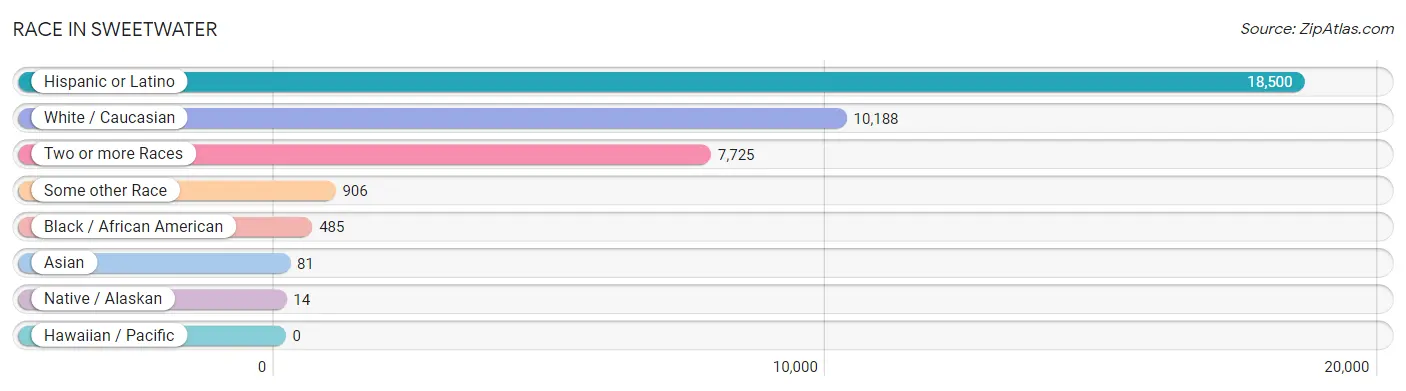
| Race | # Population | % Population |
| Asian | 81 | 0.4% |
| Black / African American | 485 | 2.5% |
| Hawaiian / Pacific | 0 | 0.0% |
| Hispanic or Latino | 18,500 | 95.4% |
| Native / Alaskan | 14 | 0.1% |
| White / Caucasian | 10,188 | 52.5% |
| Two or more Races | 7,725 | 39.8% |
| Some other Race | 906 | 4.7% |
| Total | 19,399 | 100.0% |
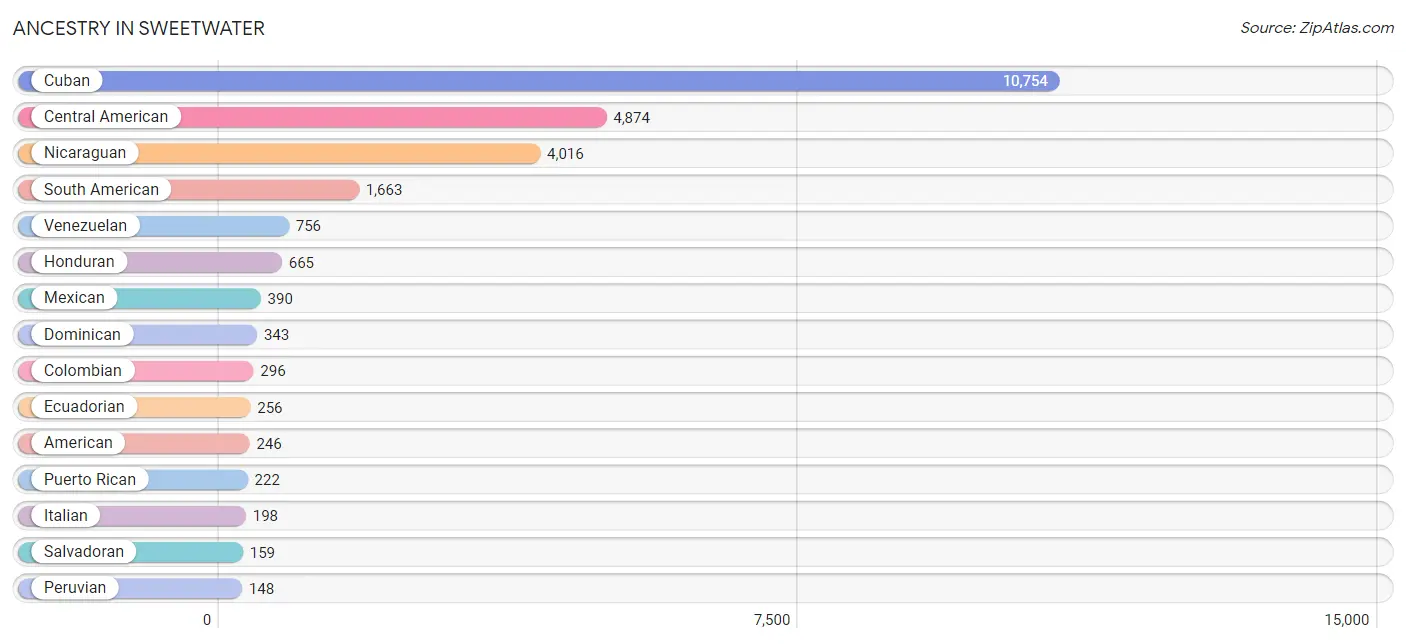
Ancestry in Sweetwater
The most populous ancestries reported in Sweetwater are Cuban (10,754 | 55.4%), Central American (4,874 | 25.1%), Nicaraguan (4,016 | 20.7%), South American (1,663 | 8.6%), and Venezuelan (756 | 3.9%), together accounting for 113.7% of all Sweetwater residents.
| Ancestry | # Population | % Population |
| American | 246 | 1.3% |
| Apache | 14 | 0.1% |
| Arab | 13 | 0.1% |
| Argentinean | 126 | 0.6% |
| Basque | 28 | 0.1% |
| Bolivian | 46 | 0.2% |
| Canadian | 10 | 0.1% |
| Central American | 4,874 | 25.1% |
| Central American Indian | 5 | 0.0% |
| Chilean | 18 | 0.1% |
| Colombian | 296 | 1.5% |
| Costa Rican | 6 | 0.0% |
| Cuban | 10,754 | 55.4% |
| Dominican | 343 | 1.8% |
| Dutch | 29 | 0.2% |
| Ecuadorian | 256 | 1.3% |
| French | 27 | 0.1% |
| German | 32 | 0.2% |
| Guatemalan | 28 | 0.1% |
| Honduran | 665 | 3.4% |
| Indian (Asian) | 98 | 0.5% |
| Italian | 198 | 1.0% |
| Jamaican | 45 | 0.2% |
| Mexican | 390 | 2.0% |
| Navajo | 22 | 0.1% |
| Nicaraguan | 4,016 | 20.7% |
| Peruvian | 148 | 0.8% |
| Polish | 2 | 0.0% |
| Portuguese | 63 | 0.3% |
| Puerto Rican | 222 | 1.1% |
| Russian | 74 | 0.4% |
| Salvadoran | 159 | 0.8% |
| Scottish | 2 | 0.0% |
| South American | 1,663 | 8.6% |
| Spaniard | 26 | 0.1% |
| Sri Lankan | 14 | 0.1% |
| Uruguayan | 17 | 0.1% |
| Venezuelan | 756 | 3.9% |
| West Indian | 13 | 0.1% | View All 39 Rows |
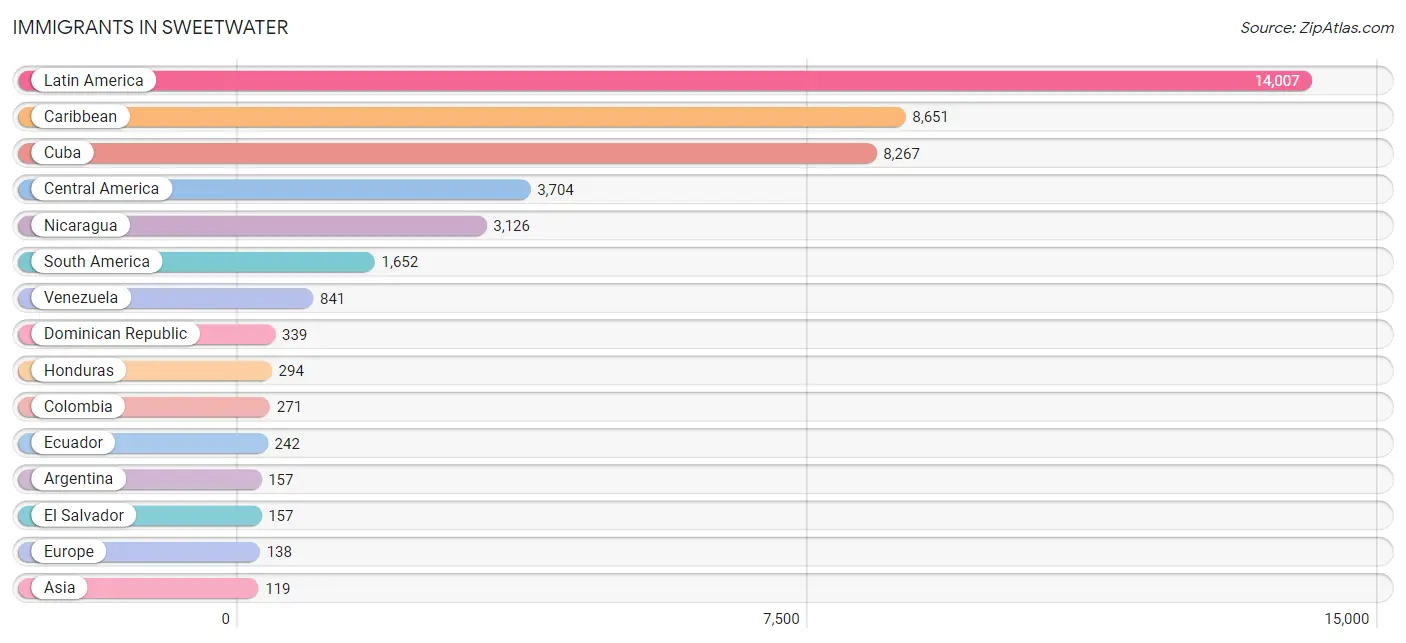
Immigrants in Sweetwater
The most numerous immigrant groups reported in Sweetwater came from Latin America (14,007 | 72.2%), Caribbean (8,651 | 44.6%), Cuba (8,267 | 42.6%), Central America (3,704 | 19.1%), and Nicaragua (3,126 | 16.1%), together accounting for 194.6% of all Sweetwater residents.
| Immigration Origin | # Population | % Population |
| Africa | 18 | 0.1% |
| Argentina | 157 | 0.8% |
| Asia | 119 | 0.6% |
| Bolivia | 15 | 0.1% |
| Canada | 24 | 0.1% |
| Caribbean | 8,651 | 44.6% |
| Central America | 3,704 | 19.1% |
| Chile | 18 | 0.1% |
| China | 45 | 0.2% |
| Colombia | 271 | 1.4% |
| Cuba | 8,267 | 42.6% |
| Dominican Republic | 339 | 1.8% |
| Eastern Asia | 45 | 0.2% |
| Eastern Europe | 74 | 0.4% |
| Ecuador | 242 | 1.3% |
| El Salvador | 157 | 0.8% |
| Europe | 138 | 0.7% |
| Guatemala | 28 | 0.1% |
| Honduras | 294 | 1.5% |
| India | 61 | 0.3% |
| Italy | 23 | 0.1% |
| Jamaica | 45 | 0.2% |
| Kuwait | 13 | 0.1% |
| Latin America | 14,007 | 72.2% |
| Mexico | 99 | 0.5% |
| Netherlands | 15 | 0.1% |
| Nicaragua | 3,126 | 16.1% |
| Peru | 91 | 0.5% |
| Russia | 74 | 0.4% |
| South America | 1,652 | 8.5% |
| South Central Asia | 61 | 0.3% |
| Southern Europe | 49 | 0.3% |
| Spain | 26 | 0.1% |
| Uruguay | 17 | 0.1% |
| Venezuela | 841 | 4.3% |
| Western Asia | 13 | 0.1% |
| Western Europe | 15 | 0.1% | View All 37 Rows |
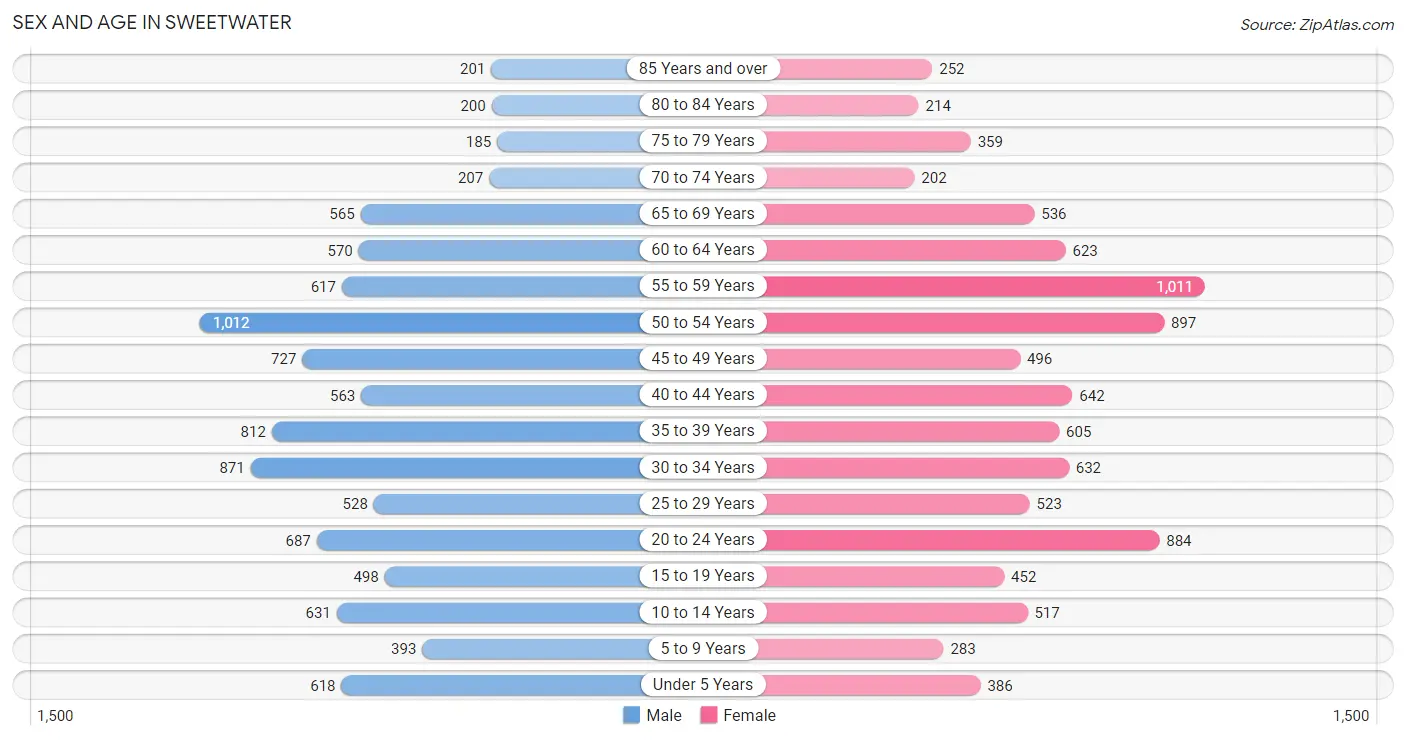
Sex and Age in Sweetwater
Sex and Age in Sweetwater
The most populous age groups in Sweetwater are 50 to 54 Years (1,012 | 10.2%) for men and 55 to 59 Years (1,011 | 10.6%) for women.
| Age Bracket | Male | Female |
| Under 5 Years | 618 (6.2%) | 386 (4.1%) |
| 5 to 9 Years | 393 (4.0%) | 283 (3.0%) |
| 10 to 14 Years | 631 (6.4%) | 517 (5.4%) |
| 15 to 19 Years | 498 (5.0%) | 452 (4.8%) |
| 20 to 24 Years | 687 (7.0%) | 884 (9.3%) |
| 25 to 29 Years | 528 (5.3%) | 523 (5.5%) |
| 30 to 34 Years | 871 (8.8%) | 632 (6.6%) |
| 35 to 39 Years | 812 (8.2%) | 605 (6.4%) |
| 40 to 44 Years | 563 (5.7%) | 642 (6.8%) |
| 45 to 49 Years | 727 (7.3%) | 496 (5.2%) |
| 50 to 54 Years | 1,012 (10.2%) | 897 (9.4%) |
| 55 to 59 Years | 617 (6.2%) | 1,011 (10.6%) |
| 60 to 64 Years | 570 (5.8%) | 623 (6.6%) |
| 65 to 69 Years | 565 (5.7%) | 536 (5.6%) |
| 70 to 74 Years | 207 (2.1%) | 202 (2.1%) |
| 75 to 79 Years | 185 (1.9%) | 359 (3.8%) |
| 80 to 84 Years | 200 (2.0%) | 214 (2.2%) |
| 85 Years and over | 201 (2.0%) | 252 (2.6%) |
| Total | 9,885 (100.0%) | 9,514 (100.0%) |
Families and Households in Sweetwater
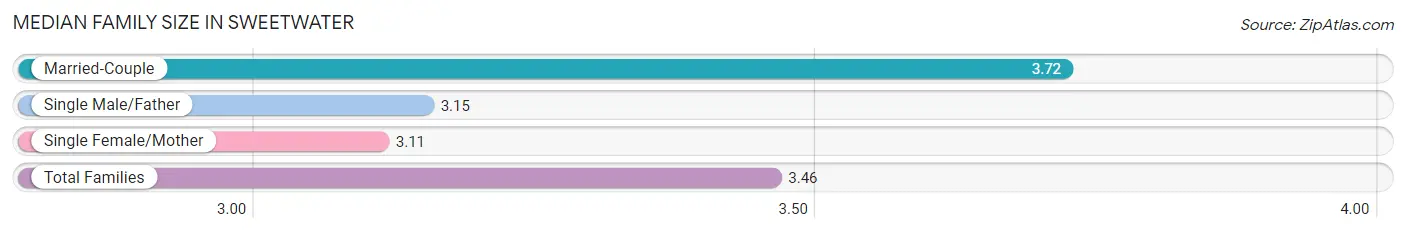
Median Family Size in Sweetwater
The median family size in Sweetwater is 3.46 persons per family, with married-couple families (2,629 | 56.7%) accounting for the largest median family size of 3.72 persons per family. On the other hand, single female/mother families (1,380 | 29.7%) represent the smallest median family size with 3.11 persons per family.
| Family Type | # Families | Family Size |
| Married-Couple | 2,629 (56.7%) | 3.72 |
| Single Male/Father | 630 (13.6%) | 3.15 |
| Single Female/Mother | 1,380 (29.7%) | 3.11 |
| Total Families | 4,639 (100.0%) | 3.46 |
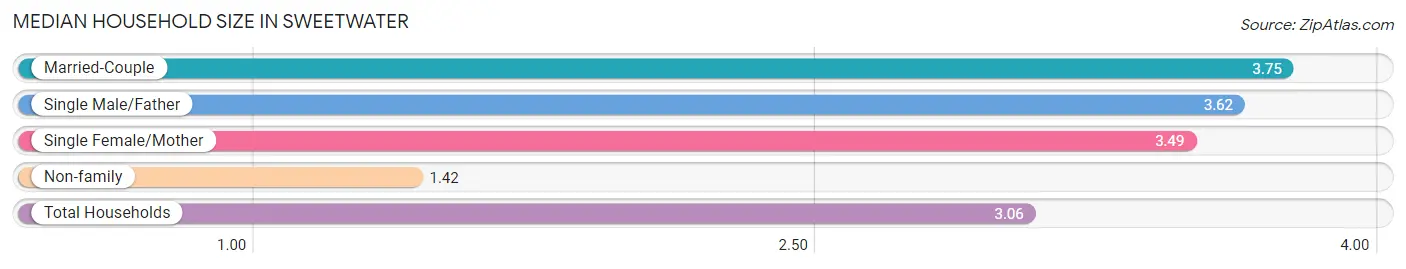
Median Household Size in Sweetwater
The median household size in Sweetwater is 3.06 persons per household, with married-couple households (2,629 | 41.6%) accounting for the largest median household size of 3.75 persons per household. non-family households (1,673 | 26.5%) represent the smallest median household size with 1.42 persons per household.
| Household Type | # Households | Household Size |
| Married-Couple | 2,629 (41.6%) | 3.75 |
| Single Male/Father | 630 (10.0%) | 3.62 |
| Single Female/Mother | 1,380 (21.9%) | 3.49 |
| Non-family | 1,673 (26.5%) | 1.42 |
| Total Households | 6,312 (100.0%) | 3.06 |
Household Size by Marriage Status in Sweetwater
Out of a total of 6,312 households in Sweetwater, 4,639 (73.5%) are family households, while 1,673 (26.5%) are nonfamily households. The most numerous type of family households are 3-person households, comprising 1,461, and the most common type of nonfamily households are 1-person households, comprising 1,165.
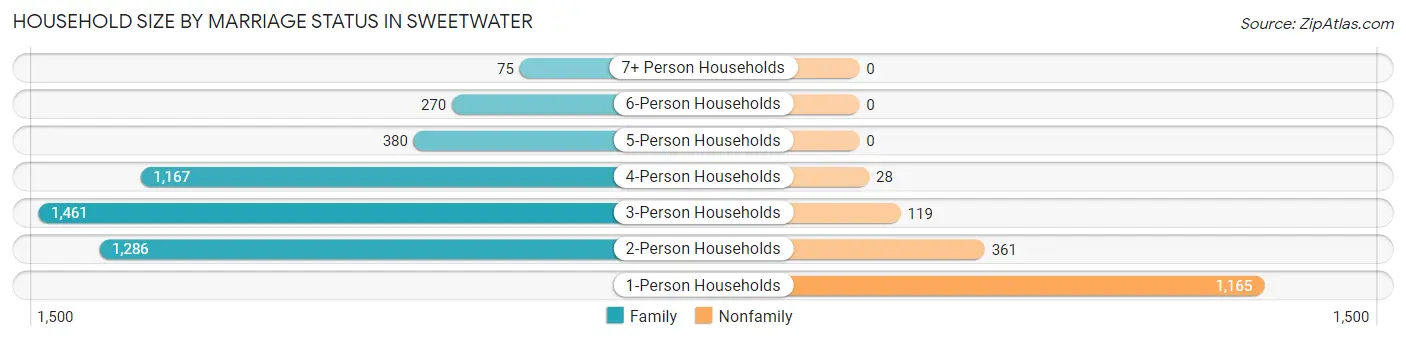
| Household Size | Family Households | Nonfamily Households |
| 1-Person Households | - | 1,165 (18.5%) |
| 2-Person Households | 1,286 (20.4%) | 361 (5.7%) |
| 3-Person Households | 1,461 (23.2%) | 119 (1.9%) |
| 4-Person Households | 1,167 (18.5%) | 28 (0.4%) |
| 5-Person Households | 380 (6.0%) | 0 (0.0%) |
| 6-Person Households | 270 (4.3%) | 0 (0.0%) |
| 7+ Person Households | 75 (1.2%) | 0 (0.0%) |
| Total | 4,639 (73.5%) | 1,673 (26.5%) |
Female Fertility in Sweetwater
Fertility by Age in Sweetwater
Average fertility rate in Sweetwater is 58.0 births per 1,000 women. Women in the age bracket of 20 to 34 years have the highest fertility rate with 66.0 births per 1,000 women. Women in the age bracket of 20 to 34 years acount for 51.7% of all women with births.
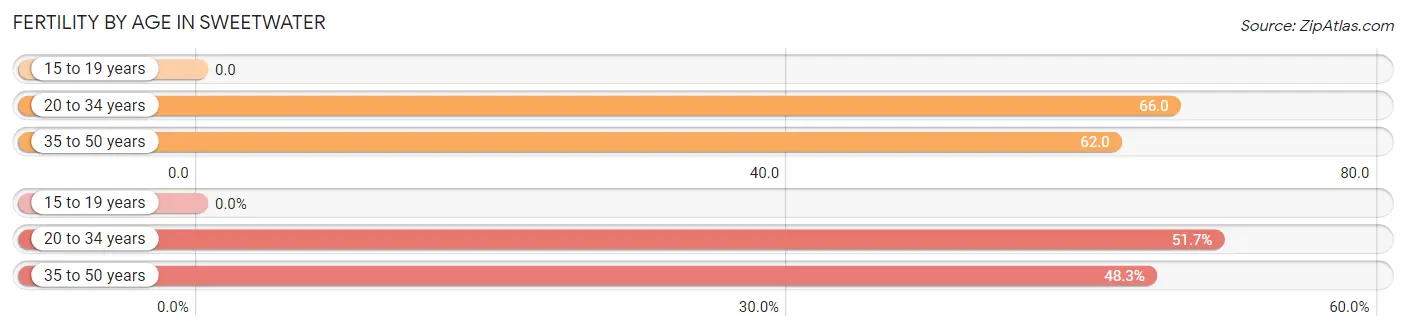
| Age Bracket | Women with Births | Births / 1,000 Women |
| 15 to 19 years | 0 (0.0%) | 0.0 |
| 20 to 34 years | 135 (51.7%) | 66.0 |
| 35 to 50 years | 126 (48.3%) | 62.0 |
| Total | 261 (100.0%) | 58.0 |
Fertility by Age by Marriage Status in Sweetwater
49.0% of women with births (261) in Sweetwater are married. The highest percentage of unmarried women with births falls into 20 to 34 years age bracket with 57.8% of them unmarried at the time of birth, while the lowest percentage of unmarried women with births belong to 35 to 50 years age bracket with 43.6% of them unmarried.
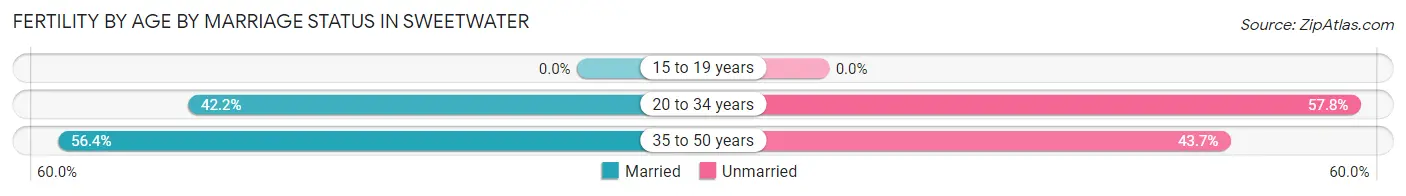
| Age Bracket | Married | Unmarried |
| 15 to 19 years | 0 (0.0%) | 0 (0.0%) |
| 20 to 34 years | 57 (42.2%) | 78 (57.8%) |
| 35 to 50 years | 71 (56.4%) | 55 (43.6%) |
| Total | 128 (49.0%) | 133 (51.0%) |
Fertility by Education in Sweetwater
Average fertility rate in Sweetwater is 58.0 births per 1,000 women. Women with the education attainment of graduate degree have the highest fertility rate of 133.0 births per 1,000 women, while women with the education attainment of high school diploma have the lowest fertility at 10.0 births per 1,000 women. Women with the education attainment of college or associate's degree represent 31.4% of all women with births.
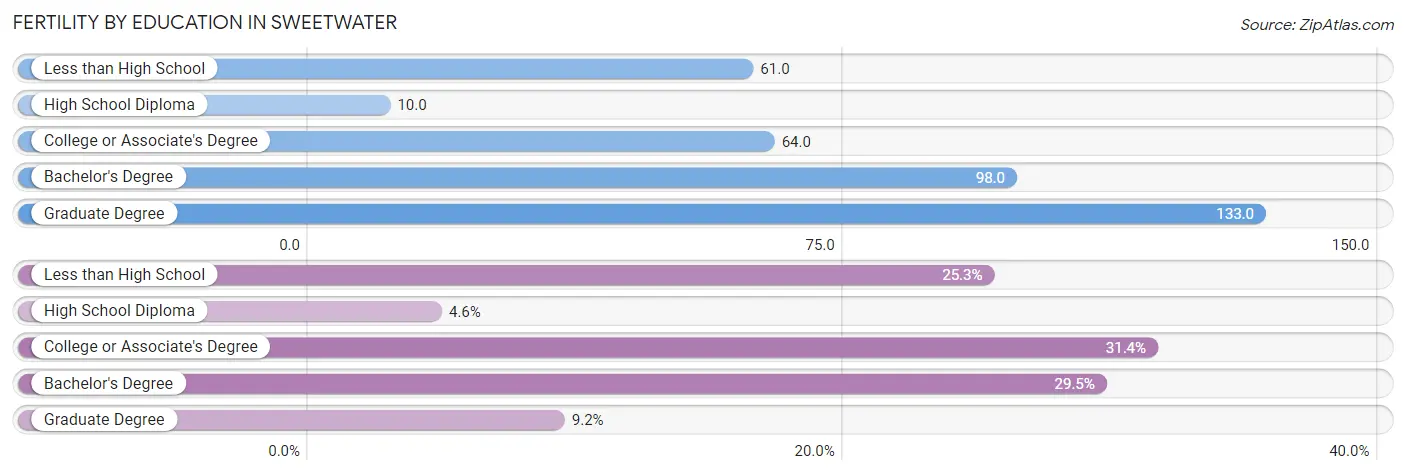
| Educational Attainment | Women with Births | Births / 1,000 Women |
| Less than High School | 66 (25.3%) | 61.0 |
| High School Diploma | 12 (4.6%) | 10.0 |
| College or Associate's Degree | 82 (31.4%) | 64.0 |
| Bachelor's Degree | 77 (29.5%) | 98.0 |
| Graduate Degree | 24 (9.2%) | 133.0 |
| Total | 261 (100.0%) | 58.0 |
Fertility by Education by Marriage Status in Sweetwater
51.0% of women with births in Sweetwater are unmarried. Women with the educational attainment of bachelor's degree are most likely to be married with 84.4% of them married at childbirth, while women with the educational attainment of graduate degree are least likely to be married with 100.0% of them unmarried at childbirth.
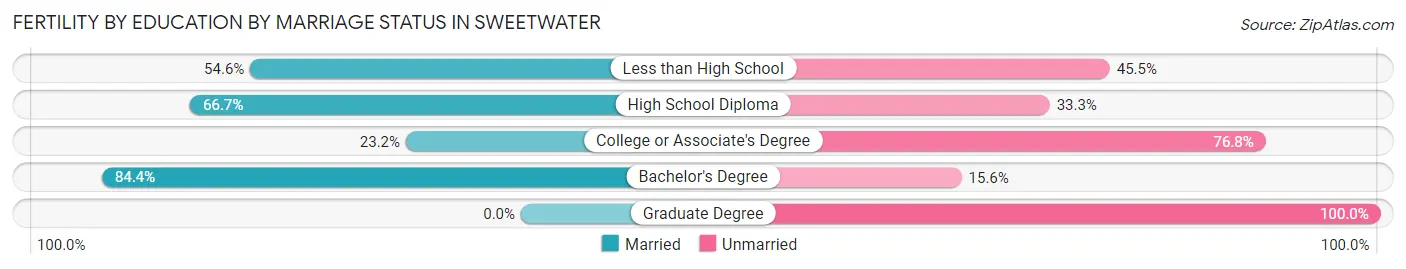
| Educational Attainment | Married | Unmarried |
| Less than High School | 36 (54.5%) | 30 (45.5%) |
| High School Diploma | 8 (66.7%) | 4 (33.3%) |
| College or Associate's Degree | 19 (23.2%) | 63 (76.8%) |
| Bachelor's Degree | 65 (84.4%) | 12 (15.6%) |
| Graduate Degree | 0 (0.0%) | 24 (100.0%) |
| Total | 128 (49.0%) | 133 (51.0%) |
Employment Characteristics in Sweetwater
Employment by Class of Employer in Sweetwater
Among the 9,837 employed individuals in Sweetwater, private company employees (8,255 | 83.9%), self-employed (not incorporated) (754 | 7.7%), and not-for-profit organizations (327 | 3.3%) make up the most common classes of employment.
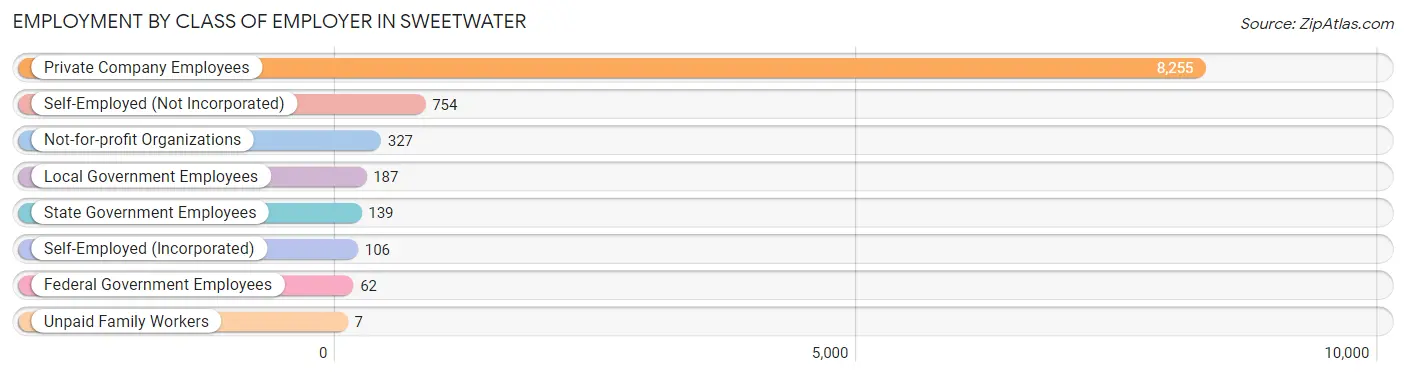
| Employer Class | # Employees | % Employees |
| Private Company Employees | 8,255 | 83.9% |
| Self-Employed (Incorporated) | 106 | 1.1% |
| Self-Employed (Not Incorporated) | 754 | 7.7% |
| Not-for-profit Organizations | 327 | 3.3% |
| Local Government Employees | 187 | 1.9% |
| State Government Employees | 139 | 1.4% |
| Federal Government Employees | 62 | 0.6% |
| Unpaid Family Workers | 7 | 0.1% |
| Total | 9,837 | 100.0% |
Employment Status by Age in Sweetwater
According to the labor force statistics for Sweetwater, out of the total population over 16 years of age (16,450), 63.5% or 10,446 individuals are in the labor force, with 4.8% or 501 of them unemployed. The age group with the highest labor force participation rate is 45 to 54 years, with 86.5% or 2,709 individuals in the labor force. Within the labor force, the 75 years and over age range has the highest percentage of unemployed individuals, with 17.5% or 10 of them being unemployed.
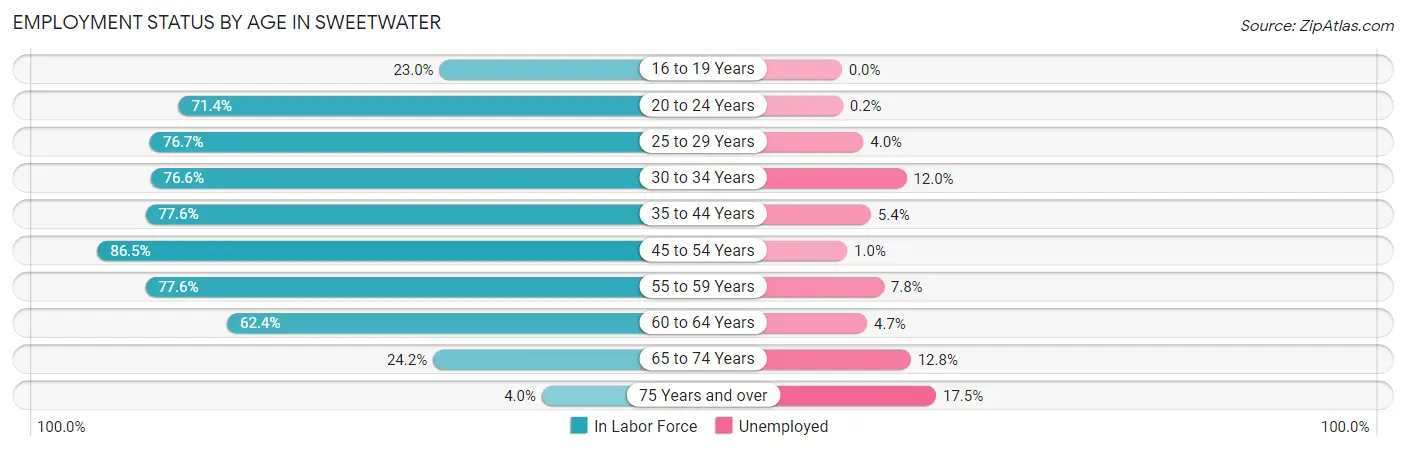
| Age Bracket | In Labor Force | Unemployed |
| 16 to 19 Years | 191 (23.0%) | 0 (0.0%) |
| 20 to 24 Years | 1,122 (71.4%) | 2 (0.2%) |
| 25 to 29 Years | 806 (76.7%) | 32 (4.0%) |
| 30 to 34 Years | 1,151 (76.6%) | 138 (12.0%) |
| 35 to 44 Years | 2,035 (77.6%) | 110 (5.4%) |
| 45 to 54 Years | 2,709 (86.5%) | 27 (1.0%) |
| 55 to 59 Years | 1,263 (77.6%) | 99 (7.8%) |
| 60 to 64 Years | 744 (62.4%) | 35 (4.7%) |
| 65 to 74 Years | 365 (24.2%) | 47 (12.8%) |
| 75 Years and over | 56 (4.0%) | 10 (17.5%) |
| Total | 10,446 (63.5%) | 501 (4.8%) |
Employment Status by Educational Attainment in Sweetwater
According to labor force statistics for Sweetwater, 78.2% of individuals (8,703) out of the total population between 25 and 64 years of age (11,129) are in the labor force, with 5.1% or 444 of them being unemployed. The group with the highest labor force participation rate are those with the educational attainment of high school diploma, with 82.3% or 2,406 individuals in the labor force. Within the labor force, individuals with college / associate degree education have the highest percentage of unemployment, with 6.0% or 100 of them being unemployed.
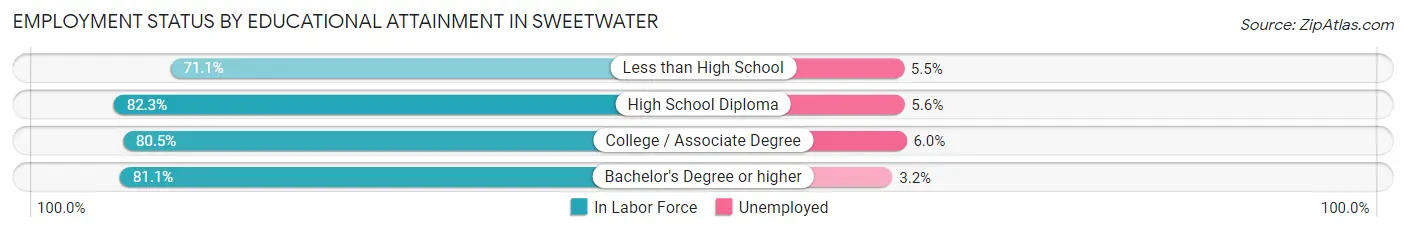
| Educational Attainment | In Labor Force | Unemployed |
| Less than High School | 2,410 (71.1%) | 186 (5.5%) |
| High School Diploma | 2,406 (82.3%) | 164 (5.6%) |
| College / Associate Degree | 1,661 (80.5%) | 124 (6.0%) |
| Bachelor's Degree or higher | 2,233 (81.1%) | 88 (3.2%) |
| Total | 8,703 (78.2%) | 568 (5.1%) |
Employment Occupations by Sex in Sweetwater
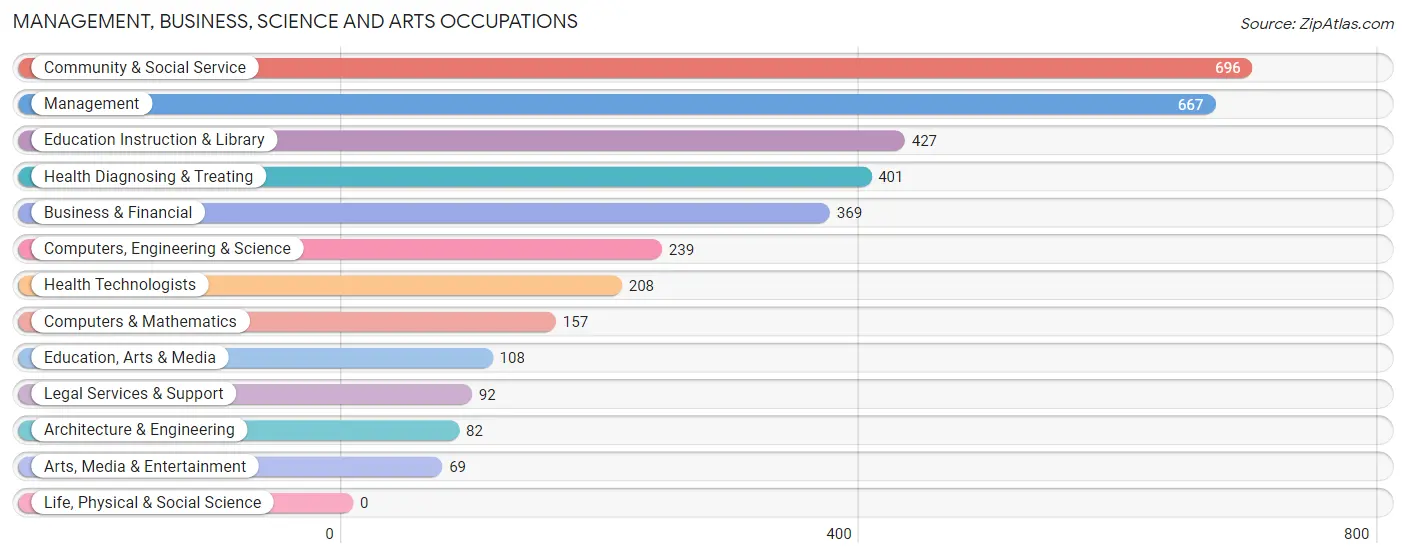
Management, Business, Science and Arts Occupations
The most common Management, Business, Science and Arts occupations in Sweetwater are Community & Social Service (696 | 7.0%), Management (667 | 6.7%), Education Instruction & Library (427 | 4.3%), Health Diagnosing & Treating (401 | 4.0%), and Business & Financial (369 | 3.7%).
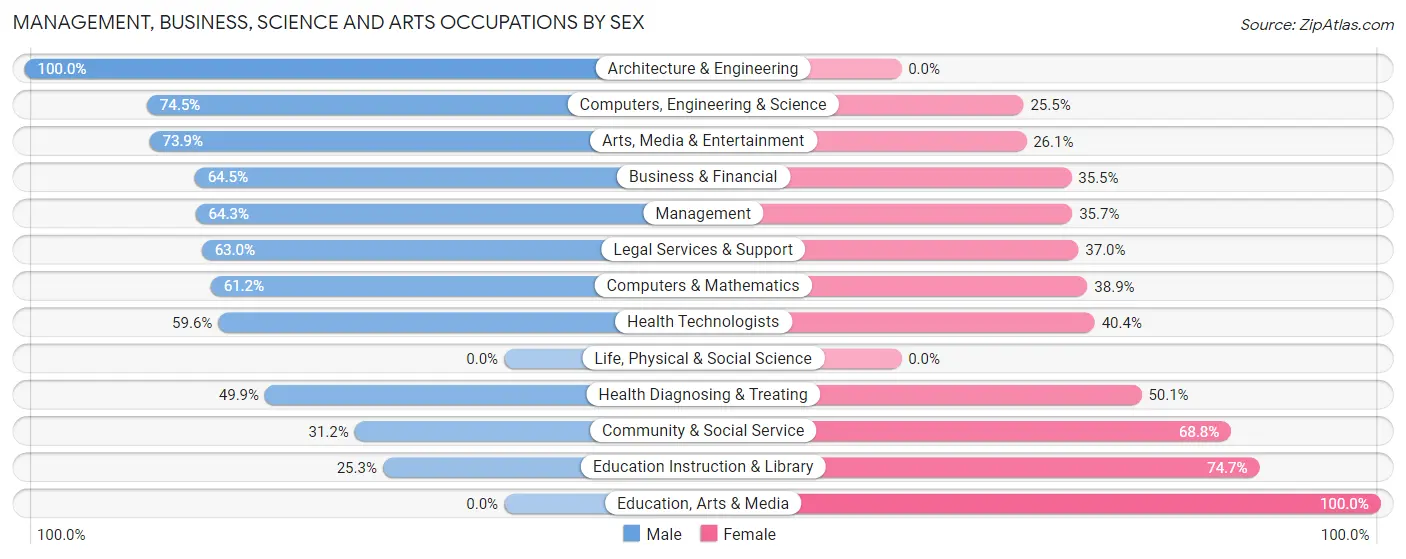
Management, Business, Science and Arts Occupations by Sex
Within the Management, Business, Science and Arts occupations in Sweetwater, the most male-oriented occupations are Architecture & Engineering (100.0%), Computers, Engineering & Science (74.5%), and Arts, Media & Entertainment (73.9%), while the most female-oriented occupations are Education, Arts & Media (100.0%), Education Instruction & Library (74.7%), and Community & Social Service (68.8%).
| Occupation | Male | Female |
| Management | 429 (64.3%) | 238 (35.7%) |
| Business & Financial | 238 (64.5%) | 131 (35.5%) |
| Computers, Engineering & Science | 178 (74.5%) | 61 (25.5%) |
| Computers & Mathematics | 96 (61.2%) | 61 (38.9%) |
| Architecture & Engineering | 82 (100.0%) | 0 (0.0%) |
| Life, Physical & Social Science | 0 (0.0%) | 0 (0.0%) |
| Community & Social Service | 217 (31.2%) | 479 (68.8%) |
| Education, Arts & Media | 0 (0.0%) | 108 (100.0%) |
| Legal Services & Support | 58 (63.0%) | 34 (37.0%) |
| Education Instruction & Library | 108 (25.3%) | 319 (74.7%) |
| Arts, Media & Entertainment | 51 (73.9%) | 18 (26.1%) |
| Health Diagnosing & Treating | 200 (49.9%) | 201 (50.1%) |
| Health Technologists | 124 (59.6%) | 84 (40.4%) |
| Total (Category) | 1,262 (53.2%) | 1,110 (46.8%) |
| Total (Overall) | 5,725 (57.6%) | 4,218 (42.4%) |
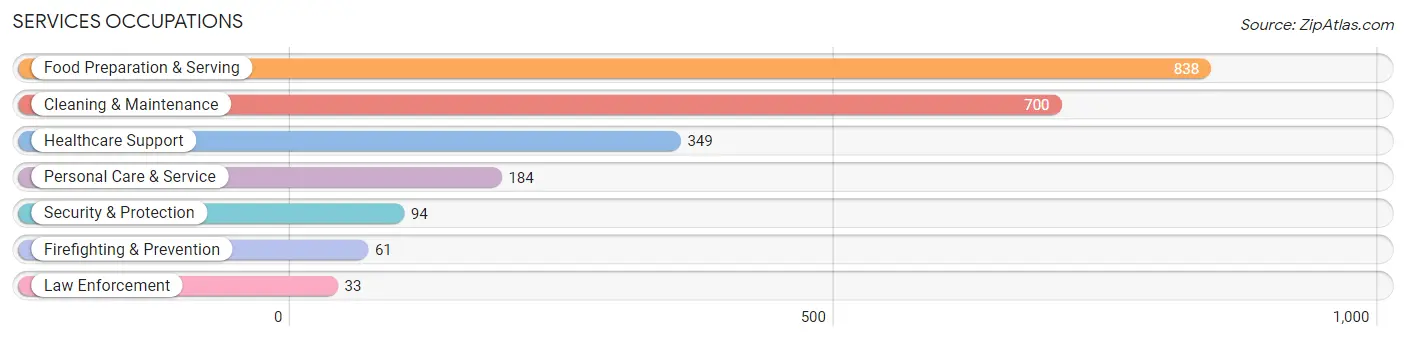
Services Occupations
The most common Services occupations in Sweetwater are Food Preparation & Serving (838 | 8.4%), Cleaning & Maintenance (700 | 7.0%), Healthcare Support (349 | 3.5%), Personal Care & Service (184 | 1.8%), and Security & Protection (94 | 0.9%).
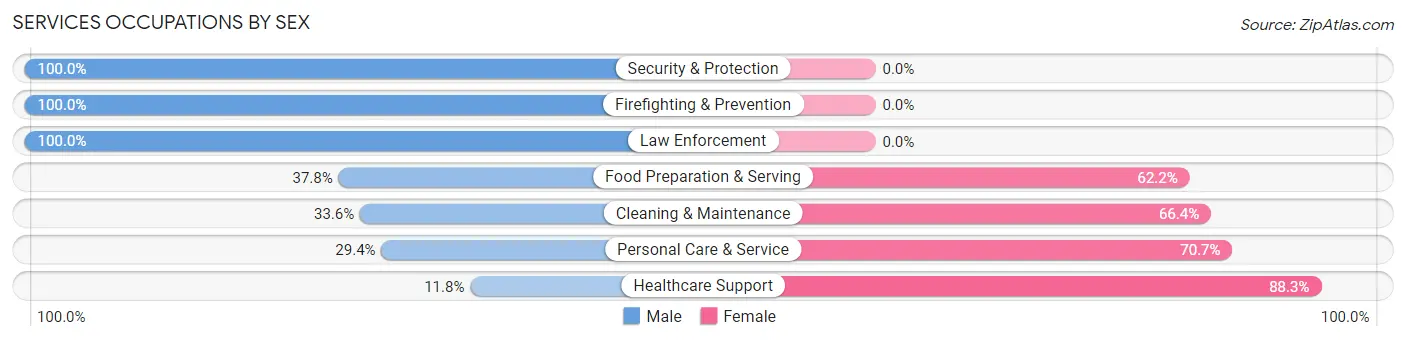
Services Occupations by Sex
Within the Services occupations in Sweetwater, the most male-oriented occupations are Security & Protection (100.0%), Firefighting & Prevention (100.0%), and Law Enforcement (100.0%), while the most female-oriented occupations are Healthcare Support (88.2%), Personal Care & Service (70.7%), and Cleaning & Maintenance (66.4%).
| Occupation | Male | Female |
| Healthcare Support | 41 (11.7%) | 308 (88.2%) |
| Security & Protection | 94 (100.0%) | 0 (0.0%) |
| Firefighting & Prevention | 61 (100.0%) | 0 (0.0%) |
| Law Enforcement | 33 (100.0%) | 0 (0.0%) |
| Food Preparation & Serving | 317 (37.8%) | 521 (62.2%) |
| Cleaning & Maintenance | 235 (33.6%) | 465 (66.4%) |
| Personal Care & Service | 54 (29.3%) | 130 (70.7%) |
| Total (Category) | 741 (34.2%) | 1,424 (65.8%) |
| Total (Overall) | 5,725 (57.6%) | 4,218 (42.4%) |
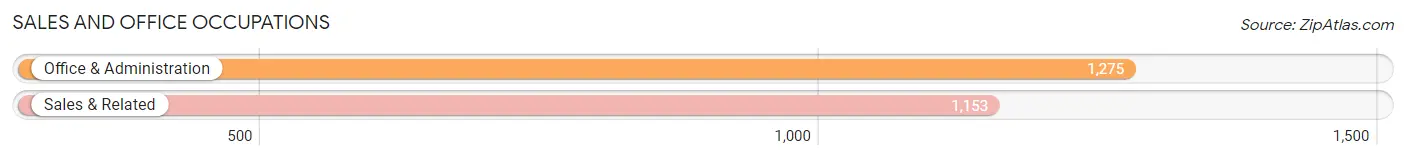
Sales and Office Occupations
The most common Sales and Office occupations in Sweetwater are Office & Administration (1,275 | 12.8%), and Sales & Related (1,153 | 11.6%).
Sales and Office Occupations by Sex
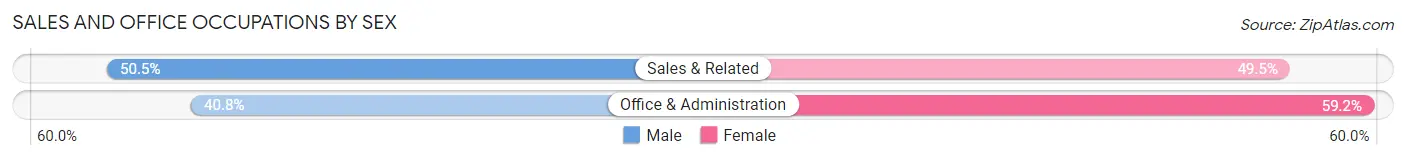
| Occupation | Male | Female |
| Sales & Related | 582 (50.5%) | 571 (49.5%) |
| Office & Administration | 520 (40.8%) | 755 (59.2%) |
| Total (Category) | 1,102 (45.4%) | 1,326 (54.6%) |
| Total (Overall) | 5,725 (57.6%) | 4,218 (42.4%) |
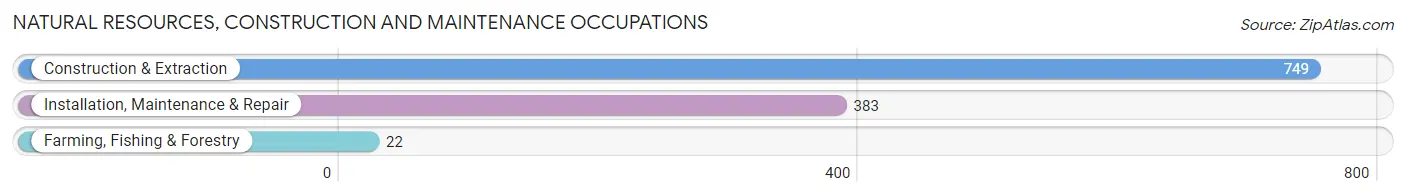
Natural Resources, Construction and Maintenance Occupations
The most common Natural Resources, Construction and Maintenance occupations in Sweetwater are Construction & Extraction (749 | 7.5%), Installation, Maintenance & Repair (383 | 3.8%), and Farming, Fishing & Forestry (22 | 0.2%).
Natural Resources, Construction and Maintenance Occupations by Sex
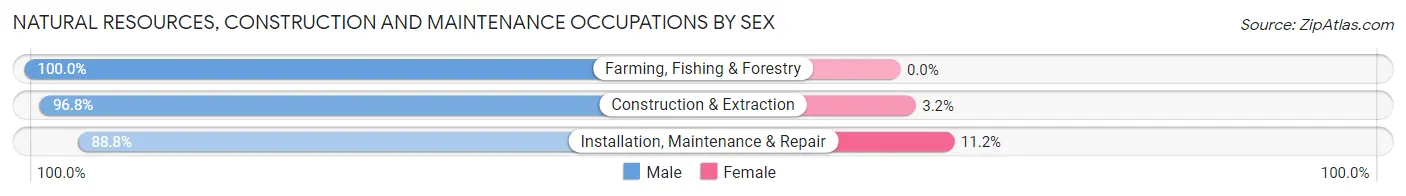
| Occupation | Male | Female |
| Farming, Fishing & Forestry | 22 (100.0%) | 0 (0.0%) |
| Construction & Extraction | 725 (96.8%) | 24 (3.2%) |
| Installation, Maintenance & Repair | 340 (88.8%) | 43 (11.2%) |
| Total (Category) | 1,087 (94.2%) | 67 (5.8%) |
| Total (Overall) | 5,725 (57.6%) | 4,218 (42.4%) |
Production, Transportation and Moving Occupations
The most common Production, Transportation and Moving occupations in Sweetwater are Transportation (812 | 8.2%), Production (516 | 5.2%), and Material Moving (496 | 5.0%).
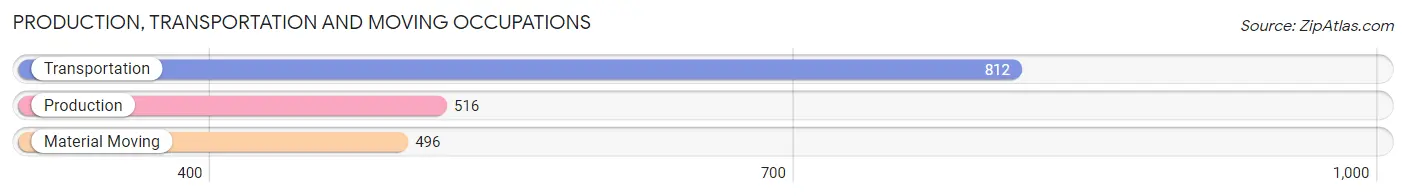
Production, Transportation and Moving Occupations by Sex
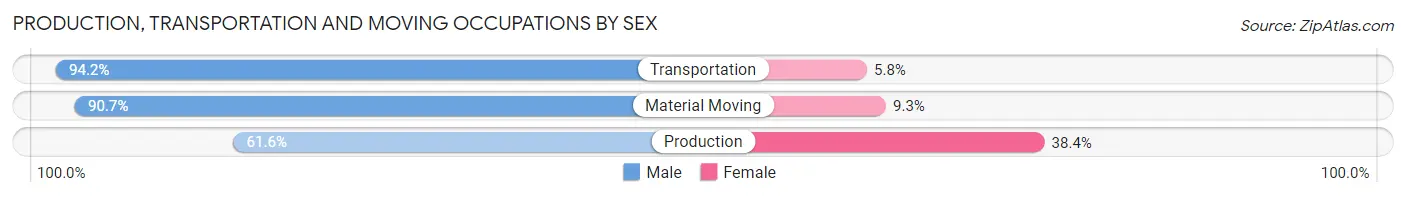
| Occupation | Male | Female |
| Production | 318 (61.6%) | 198 (38.4%) |
| Transportation | 765 (94.2%) | 47 (5.8%) |
| Material Moving | 450 (90.7%) | 46 (9.3%) |
| Total (Category) | 1,533 (84.1%) | 291 (16.0%) |
| Total (Overall) | 5,725 (57.6%) | 4,218 (42.4%) |
Employment Industries by Sex in Sweetwater
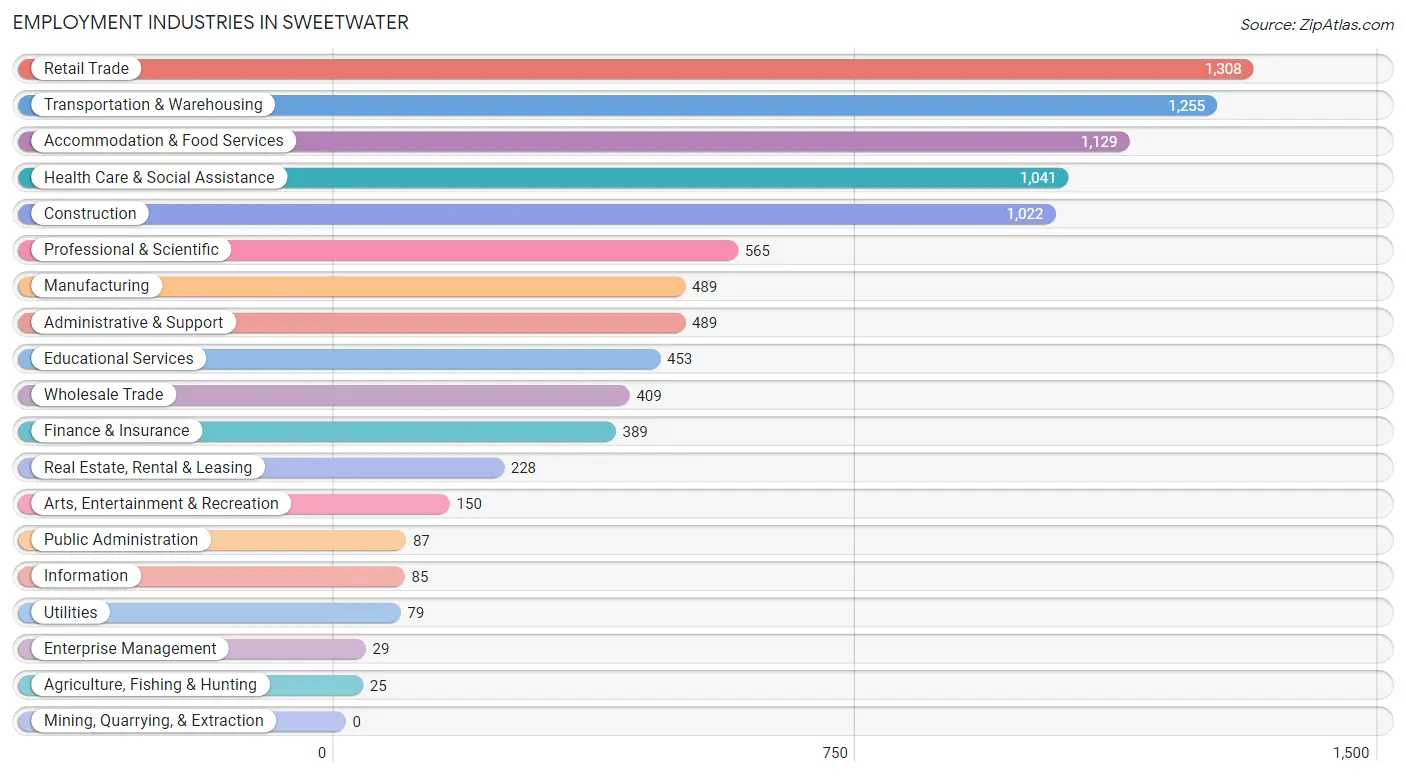
Employment Industries in Sweetwater
The major employment industries in Sweetwater include Retail Trade (1,308 | 13.2%), Transportation & Warehousing (1,255 | 12.6%), Accommodation & Food Services (1,129 | 11.4%), Health Care & Social Assistance (1,041 | 10.5%), and Construction (1,022 | 10.3%).
Employment Industries by Sex in Sweetwater
The Sweetwater industries that see more men than women are Agriculture, Fishing & Hunting (100.0%), Enterprise Management (100.0%), and Construction (94.4%), whereas the industries that tend to have a higher number of women are Health Care & Social Assistance (69.6%), Educational Services (66.9%), and Administrative & Support (60.1%).
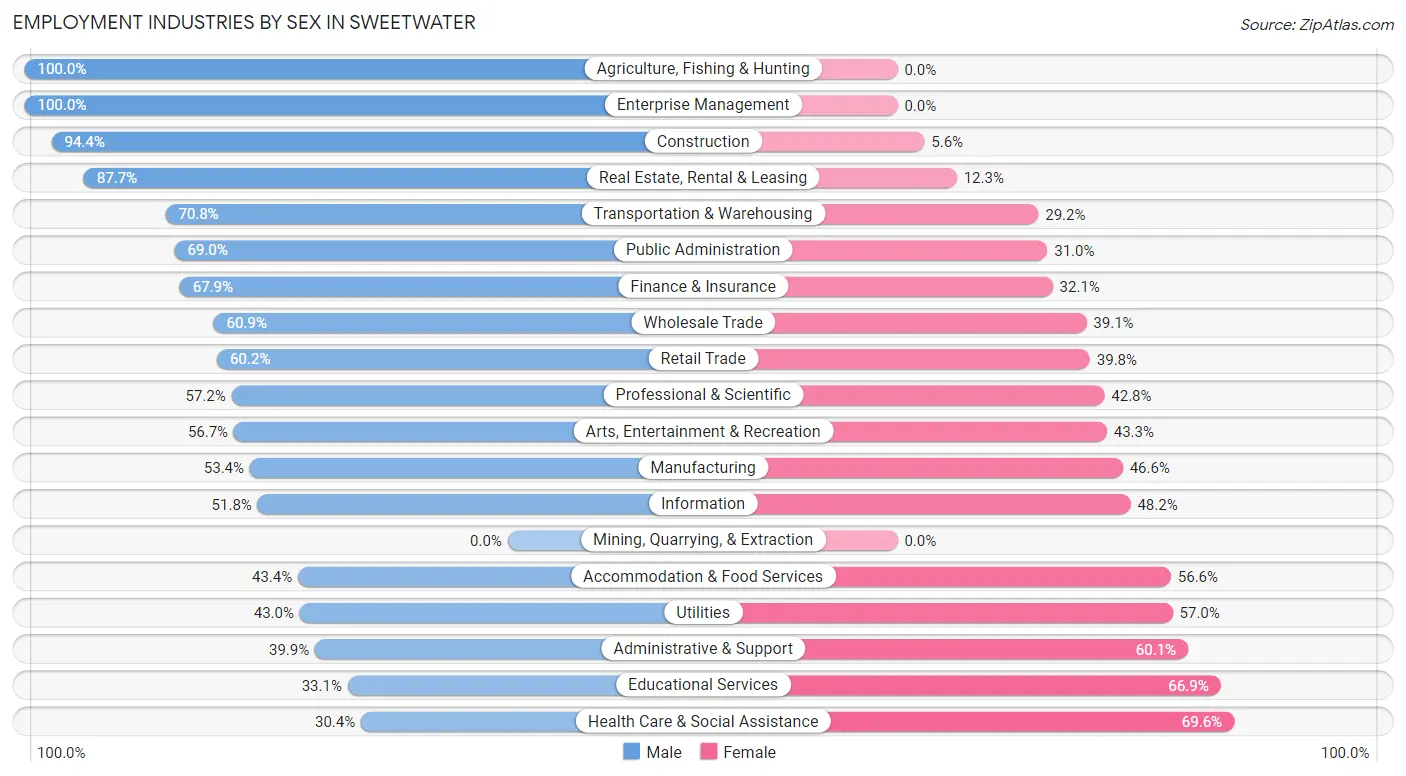
| Industry | Male | Female |
| Agriculture, Fishing & Hunting | 25 (100.0%) | 0 (0.0%) |
| Mining, Quarrying, & Extraction | 0 (0.0%) | 0 (0.0%) |
| Construction | 965 (94.4%) | 57 (5.6%) |
| Manufacturing | 261 (53.4%) | 228 (46.6%) |
| Wholesale Trade | 249 (60.9%) | 160 (39.1%) |
| Retail Trade | 787 (60.2%) | 521 (39.8%) |
| Transportation & Warehousing | 889 (70.8%) | 366 (29.2%) |
| Utilities | 34 (43.0%) | 45 (57.0%) |
| Information | 44 (51.8%) | 41 (48.2%) |
| Finance & Insurance | 264 (67.9%) | 125 (32.1%) |
| Real Estate, Rental & Leasing | 200 (87.7%) | 28 (12.3%) |
| Professional & Scientific | 323 (57.2%) | 242 (42.8%) |
| Enterprise Management | 29 (100.0%) | 0 (0.0%) |
| Administrative & Support | 195 (39.9%) | 294 (60.1%) |
| Educational Services | 150 (33.1%) | 303 (66.9%) |
| Health Care & Social Assistance | 316 (30.4%) | 725 (69.6%) |
| Arts, Entertainment & Recreation | 85 (56.7%) | 65 (43.3%) |
| Accommodation & Food Services | 490 (43.4%) | 639 (56.6%) |
| Public Administration | 60 (69.0%) | 27 (31.0%) |
| Total | 5,725 (57.6%) | 4,218 (42.4%) |
Education in Sweetwater
School Enrollment in Sweetwater
The most common levels of schooling among the 4,073 students in Sweetwater are college / undergraduate (1,251 | 30.7%), middle school (925 | 22.7%), and high school (683 | 16.8%).
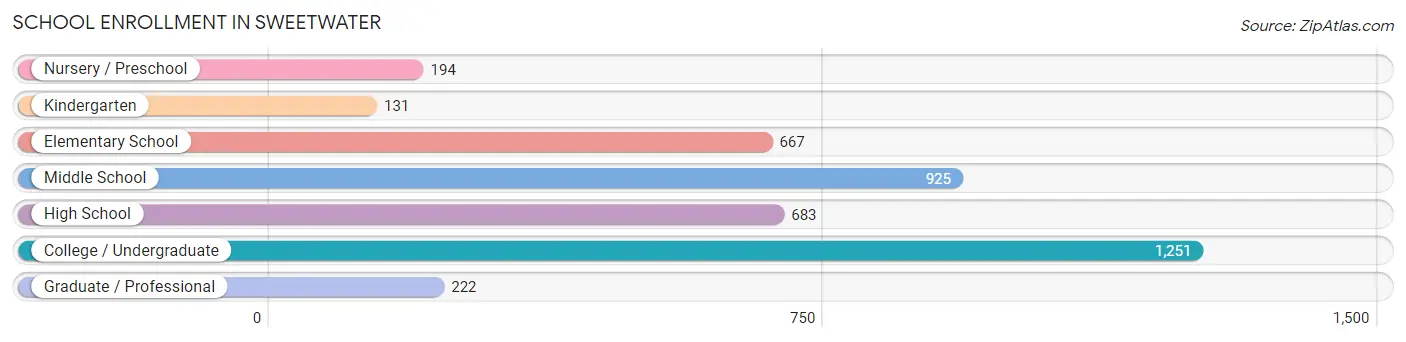
| School Level | # Students | % Students |
| Nursery / Preschool | 194 | 4.8% |
| Kindergarten | 131 | 3.2% |
| Elementary School | 667 | 16.4% |
| Middle School | 925 | 22.7% |
| High School | 683 | 16.8% |
| College / Undergraduate | 1,251 | 30.7% |
| Graduate / Professional | 222 | 5.4% |
| Total | 4,073 | 100.0% |
School Enrollment by Age by Funding Source in Sweetwater
Out of a total of 4,073 students who are enrolled in schools in Sweetwater, 485 (11.9%) attend a private institution, while the remaining 3,588 (88.1%) are enrolled in public schools. The age group of 25 to 34 year olds has the highest likelihood of being enrolled in private schools, with 195 (48.0% in the age bracket) enrolled. Conversely, the age group of 15 to 17 year olds has the lowest likelihood of being enrolled in a private school, with 442 (99.1% in the age bracket) attending a public institution.
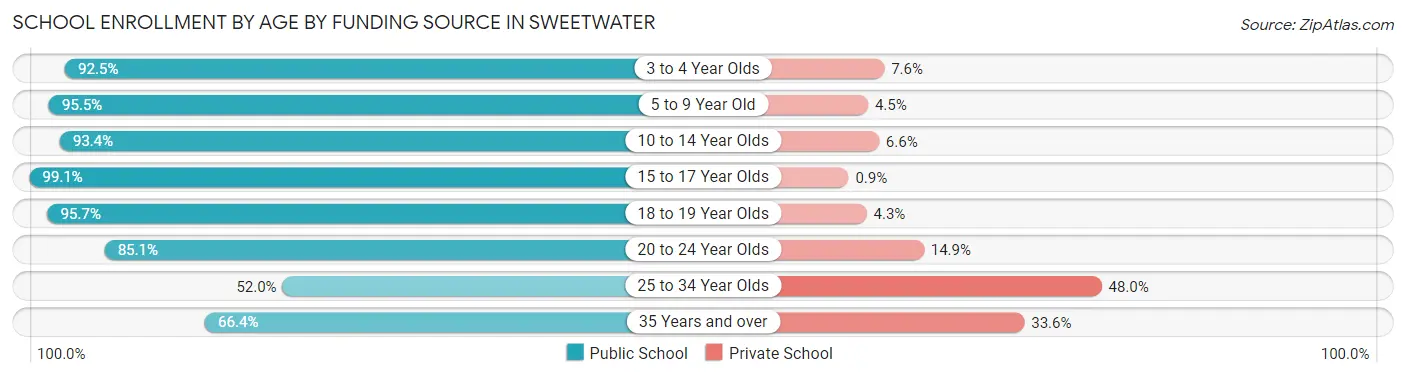
| Age Bracket | Public School | Private School |
| 3 to 4 Year Olds | 196 (92.4%) | 16 (7.5%) |
| 5 to 9 Year Old | 632 (95.5%) | 30 (4.5%) |
| 10 to 14 Year Olds | 1,039 (93.4%) | 73 (6.6%) |
| 15 to 17 Year Olds | 442 (99.1%) | 4 (0.9%) |
| 18 to 19 Year Olds | 336 (95.7%) | 15 (4.3%) |
| 20 to 24 Year Olds | 661 (85.1%) | 116 (14.9%) |
| 25 to 34 Year Olds | 211 (52.0%) | 195 (48.0%) |
| 35 Years and over | 71 (66.4%) | 36 (33.6%) |
| Total | 3,588 (88.1%) | 485 (11.9%) |
Educational Attainment by Field of Study in Sweetwater
Business (771 | 23.5%), engineering (636 | 19.4%), education (628 | 19.1%), science & technology (395 | 12.0%), and psychology (246 | 7.5%) are the most common fields of study among 3,282 individuals in Sweetwater who have obtained a bachelor's degree or higher.
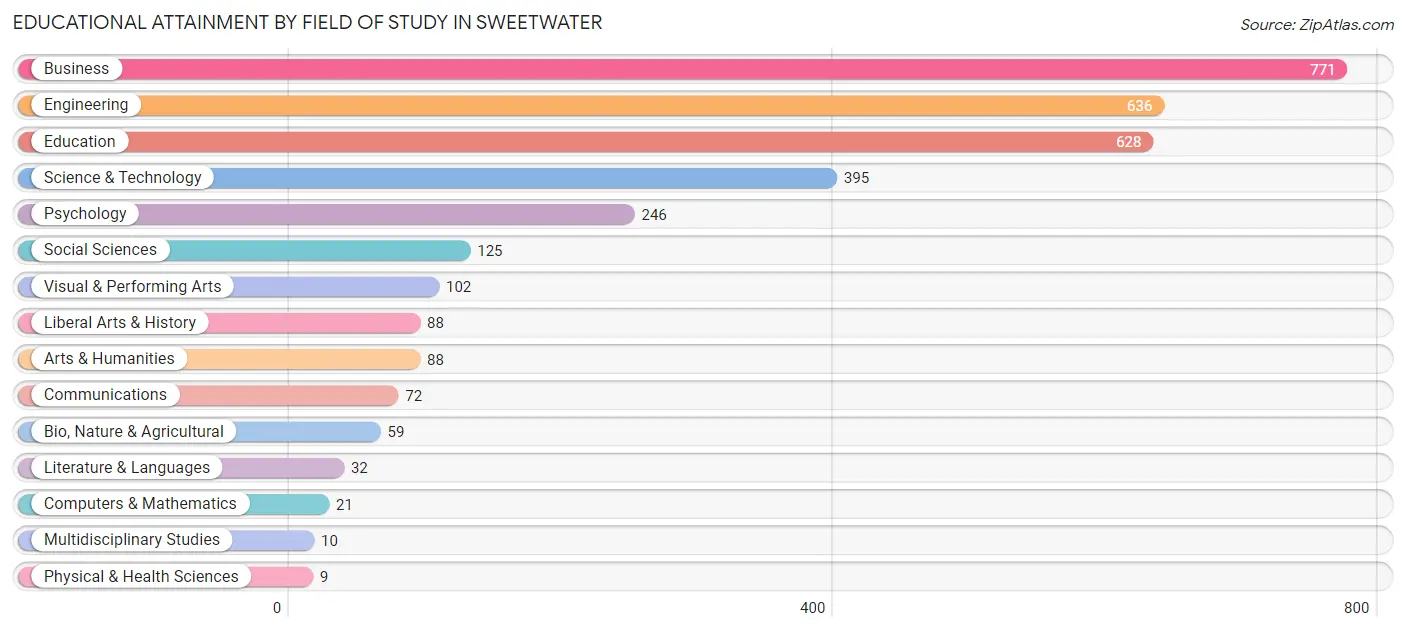
| Field of Study | # Graduates | % Graduates |
| Computers & Mathematics | 21 | 0.6% |
| Bio, Nature & Agricultural | 59 | 1.8% |
| Physical & Health Sciences | 9 | 0.3% |
| Psychology | 246 | 7.5% |
| Social Sciences | 125 | 3.8% |
| Engineering | 636 | 19.4% |
| Multidisciplinary Studies | 10 | 0.3% |
| Science & Technology | 395 | 12.0% |
| Business | 771 | 23.5% |
| Education | 628 | 19.1% |
| Literature & Languages | 32 | 1.0% |
| Liberal Arts & History | 88 | 2.7% |
| Visual & Performing Arts | 102 | 3.1% |
| Communications | 72 | 2.2% |
| Arts & Humanities | 88 | 2.7% |
| Total | 3,282 | 100.0% |
Transportation & Commute in Sweetwater
Vehicle Availability by Sex in Sweetwater
The most prevalent vehicle ownership categories in Sweetwater are males with 2 vehicles (2,592, accounting for 46.0%) and females with 2 vehicles (1,634, making up 61.8%).
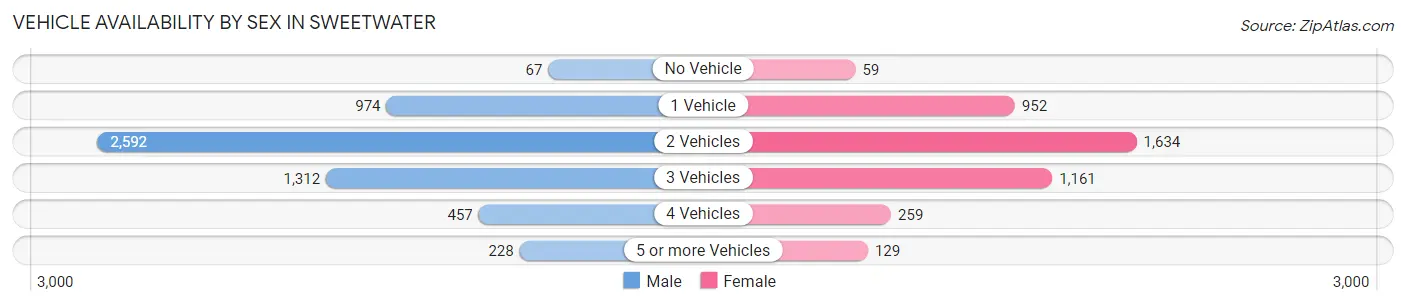
| Vehicles Available | Male | Female |
| No Vehicle | 67 (1.2%) | 59 (1.4%) |
| 1 Vehicle | 974 (17.3%) | 952 (22.7%) |
| 2 Vehicles | 2,592 (46.0%) | 1,634 (39.0%) |
| 3 Vehicles | 1,312 (23.3%) | 1,161 (27.7%) |
| 4 Vehicles | 457 (8.1%) | 259 (6.2%) |
| 5 or more Vehicles | 228 (4.1%) | 129 (3.1%) |
| Total | 5,630 (100.0%) | 4,194 (100.0%) |
Commute Time in Sweetwater
The most frequently occuring commute durations in Sweetwater are 30 to 34 minutes (1,950 commuters, 20.8%), 20 to 24 minutes (1,716 commuters, 18.3%), and 15 to 19 minutes (1,465 commuters, 15.6%).
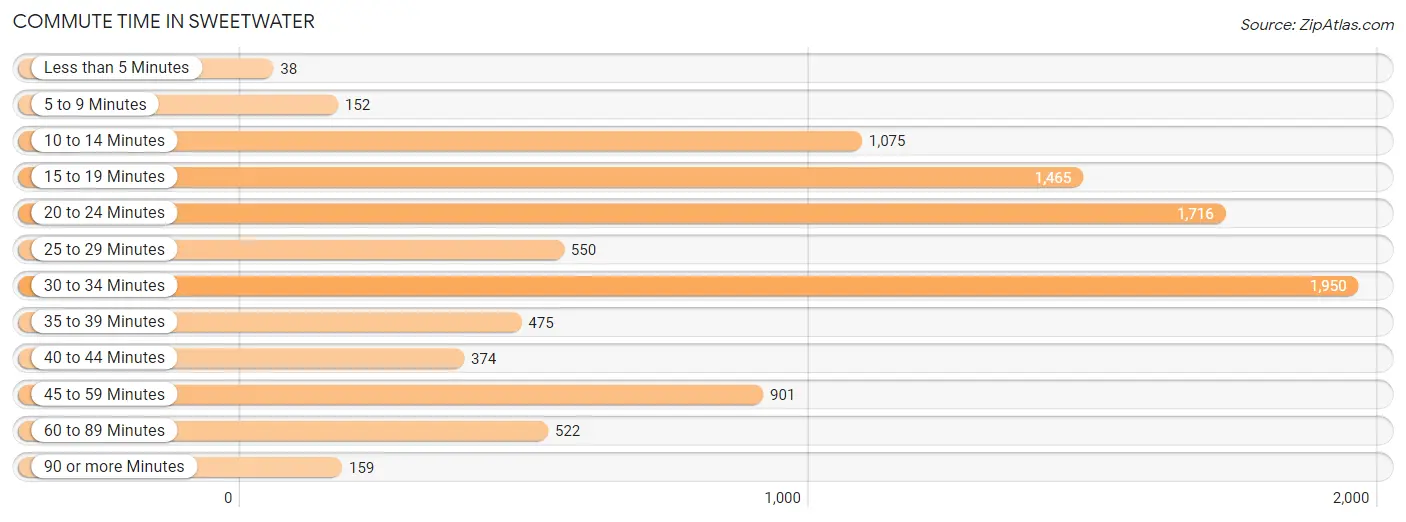
| Commute Time | # Commuters | % Commuters |
| Less than 5 Minutes | 38 | 0.4% |
| 5 to 9 Minutes | 152 | 1.6% |
| 10 to 14 Minutes | 1,075 | 11.5% |
| 15 to 19 Minutes | 1,465 | 15.6% |
| 20 to 24 Minutes | 1,716 | 18.3% |
| 25 to 29 Minutes | 550 | 5.9% |
| 30 to 34 Minutes | 1,950 | 20.8% |
| 35 to 39 Minutes | 475 | 5.1% |
| 40 to 44 Minutes | 374 | 4.0% |
| 45 to 59 Minutes | 901 | 9.6% |
| 60 to 89 Minutes | 522 | 5.6% |
| 90 or more Minutes | 159 | 1.7% |
Commute Time by Sex in Sweetwater
The most common commute times in Sweetwater are 30 to 34 minutes (1,119 commuters, 20.8%) for males and 30 to 34 minutes (831 commuters, 20.8%) for females.
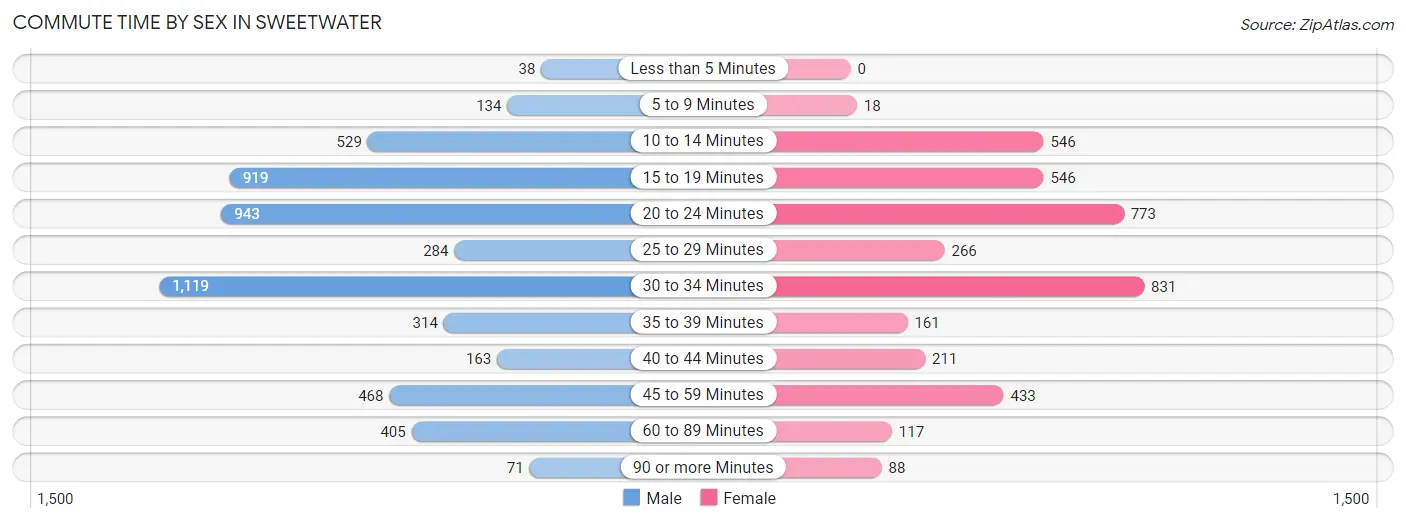
| Commute Time | Male | Female |
| Less than 5 Minutes | 38 (0.7%) | 0 (0.0%) |
| 5 to 9 Minutes | 134 (2.5%) | 18 (0.4%) |
| 10 to 14 Minutes | 529 (9.8%) | 546 (13.7%) |
| 15 to 19 Minutes | 919 (17.1%) | 546 (13.7%) |
| 20 to 24 Minutes | 943 (17.5%) | 773 (19.4%) |
| 25 to 29 Minutes | 284 (5.3%) | 266 (6.7%) |
| 30 to 34 Minutes | 1,119 (20.8%) | 831 (20.8%) |
| 35 to 39 Minutes | 314 (5.8%) | 161 (4.0%) |
| 40 to 44 Minutes | 163 (3.0%) | 211 (5.3%) |
| 45 to 59 Minutes | 468 (8.7%) | 433 (10.8%) |
| 60 to 89 Minutes | 405 (7.5%) | 117 (2.9%) |
| 90 or more Minutes | 71 (1.3%) | 88 (2.2%) |
Time of Departure to Work by Sex in Sweetwater
The most frequent times of departure to work in Sweetwater are 7:00 AM to 7:29 AM (1,140, 21.2%) for males and 8:00 AM to 8:29 AM (749, 18.8%) for females.
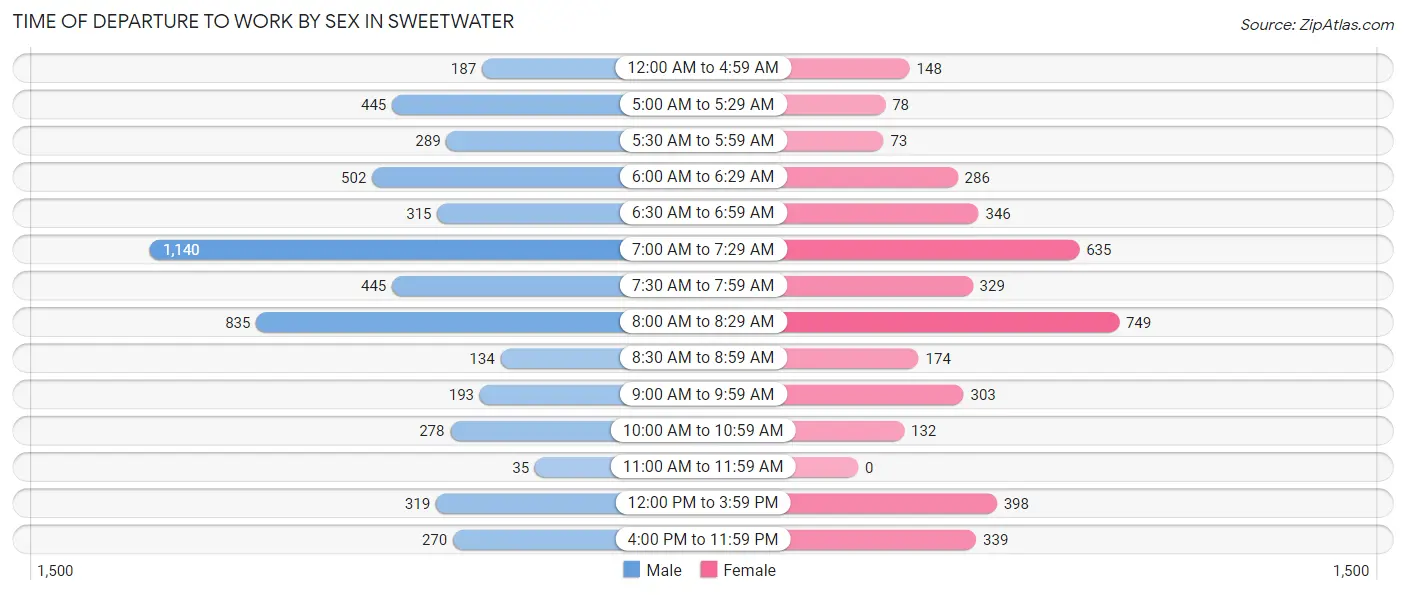
| Time of Departure | Male | Female |
| 12:00 AM to 4:59 AM | 187 (3.5%) | 148 (3.7%) |
| 5:00 AM to 5:29 AM | 445 (8.3%) | 78 (1.9%) |
| 5:30 AM to 5:59 AM | 289 (5.4%) | 73 (1.8%) |
| 6:00 AM to 6:29 AM | 502 (9.3%) | 286 (7.2%) |
| 6:30 AM to 6:59 AM | 315 (5.9%) | 346 (8.7%) |
| 7:00 AM to 7:29 AM | 1,140 (21.2%) | 635 (15.9%) |
| 7:30 AM to 7:59 AM | 445 (8.3%) | 329 (8.3%) |
| 8:00 AM to 8:29 AM | 835 (15.5%) | 749 (18.8%) |
| 8:30 AM to 8:59 AM | 134 (2.5%) | 174 (4.4%) |
| 9:00 AM to 9:59 AM | 193 (3.6%) | 303 (7.6%) |
| 10:00 AM to 10:59 AM | 278 (5.2%) | 132 (3.3%) |
| 11:00 AM to 11:59 AM | 35 (0.6%) | 0 (0.0%) |
| 12:00 PM to 3:59 PM | 319 (5.9%) | 398 (10.0%) |
| 4:00 PM to 11:59 PM | 270 (5.0%) | 339 (8.5%) |
| Total | 5,387 (100.0%) | 3,990 (100.0%) |
Housing Occupancy in Sweetwater
Occupancy by Ownership in Sweetwater
Of the total 6,312 dwellings in Sweetwater, owner-occupied units account for 2,562 (40.6%), while renter-occupied units make up 3,750 (59.4%).
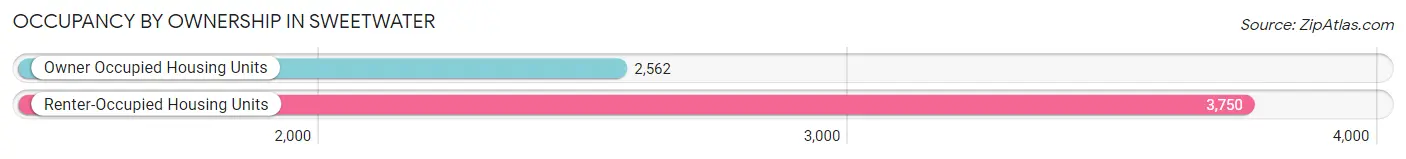
| Occupancy | # Housing Units | % Housing Units |
| Owner Occupied Housing Units | 2,562 | 40.6% |
| Renter-Occupied Housing Units | 3,750 | 59.4% |
| Total Occupied Housing Units | 6,312 | 100.0% |
Occupancy by Household Size in Sweetwater
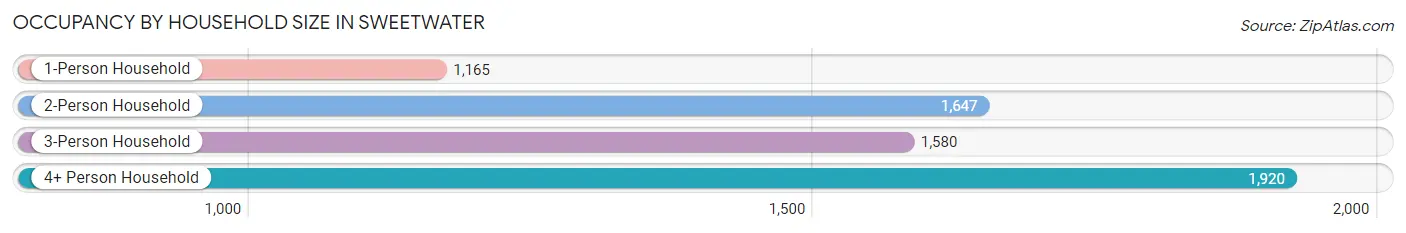
| Household Size | # Housing Units | % Housing Units |
| 1-Person Household | 1,165 | 18.5% |
| 2-Person Household | 1,647 | 26.1% |
| 3-Person Household | 1,580 | 25.0% |
| 4+ Person Household | 1,920 | 30.4% |
| Total Housing Units | 6,312 | 100.0% |
Occupancy by Ownership by Household Size in Sweetwater
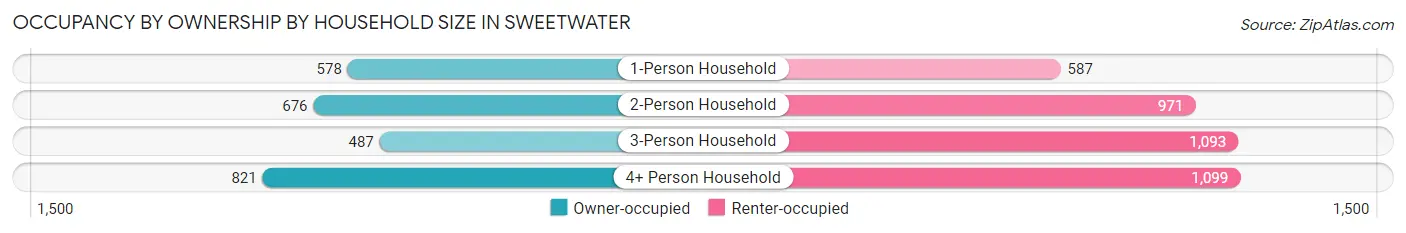
| Household Size | Owner-occupied | Renter-occupied |
| 1-Person Household | 578 (49.6%) | 587 (50.4%) |
| 2-Person Household | 676 (41.0%) | 971 (59.0%) |
| 3-Person Household | 487 (30.8%) | 1,093 (69.2%) |
| 4+ Person Household | 821 (42.8%) | 1,099 (57.2%) |
| Total Housing Units | 2,562 (40.6%) | 3,750 (59.4%) |
Occupancy by Educational Attainment in Sweetwater
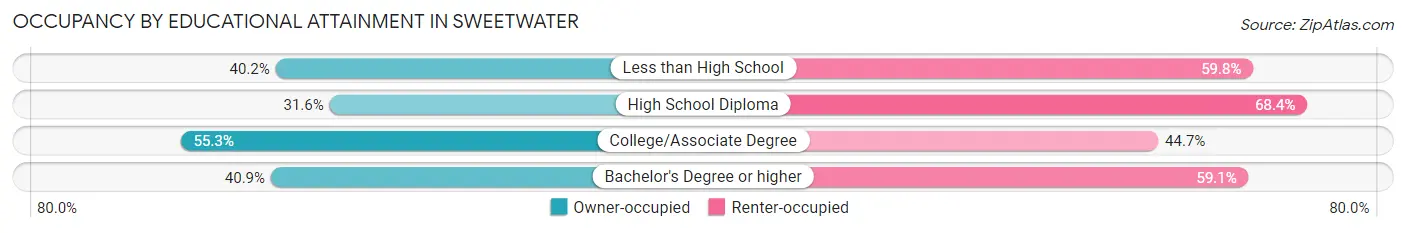
| Household Size | Owner-occupied | Renter-occupied |
| Less than High School | 878 (40.2%) | 1,306 (59.8%) |
| High School Diploma | 500 (31.6%) | 1,081 (68.4%) |
| College/Associate Degree | 545 (55.3%) | 441 (44.7%) |
| Bachelor's Degree or higher | 639 (40.9%) | 922 (59.1%) |
Occupancy by Age of Householder in Sweetwater
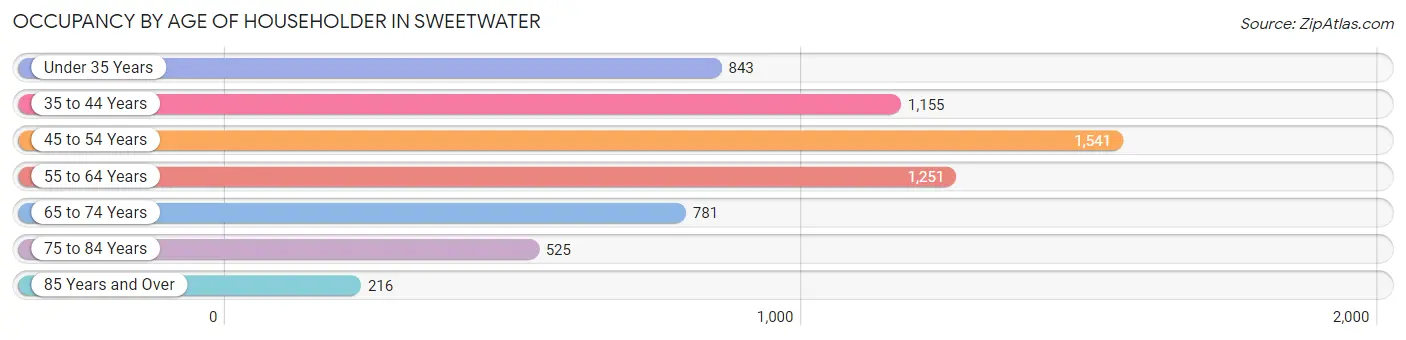
| Age Bracket | # Households | % Households |
| Under 35 Years | 843 | 13.4% |
| 35 to 44 Years | 1,155 | 18.3% |
| 45 to 54 Years | 1,541 | 24.4% |
| 55 to 64 Years | 1,251 | 19.8% |
| 65 to 74 Years | 781 | 12.4% |
| 75 to 84 Years | 525 | 8.3% |
| 85 Years and Over | 216 | 3.4% |
| Total | 6,312 | 100.0% |
Housing Finances in Sweetwater
Median Income by Occupancy in Sweetwater
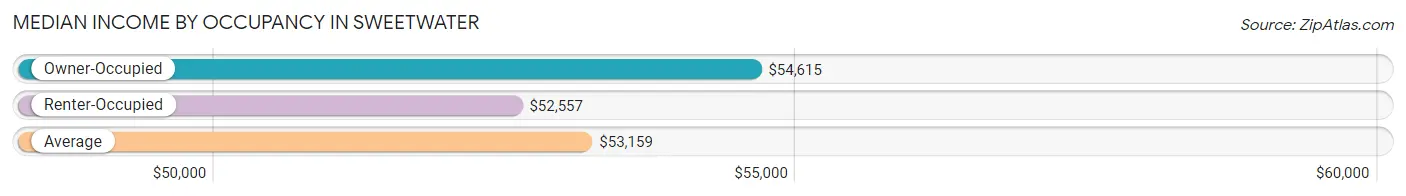
| Occupancy Type | # Households | Median Income |
| Owner-Occupied | 2,562 (40.6%) | $54,615 |
| Renter-Occupied | 3,750 (59.4%) | $52,557 |
| Average | 6,312 (100.0%) | $53,159 |
Occupancy by Householder Income Bracket in Sweetwater
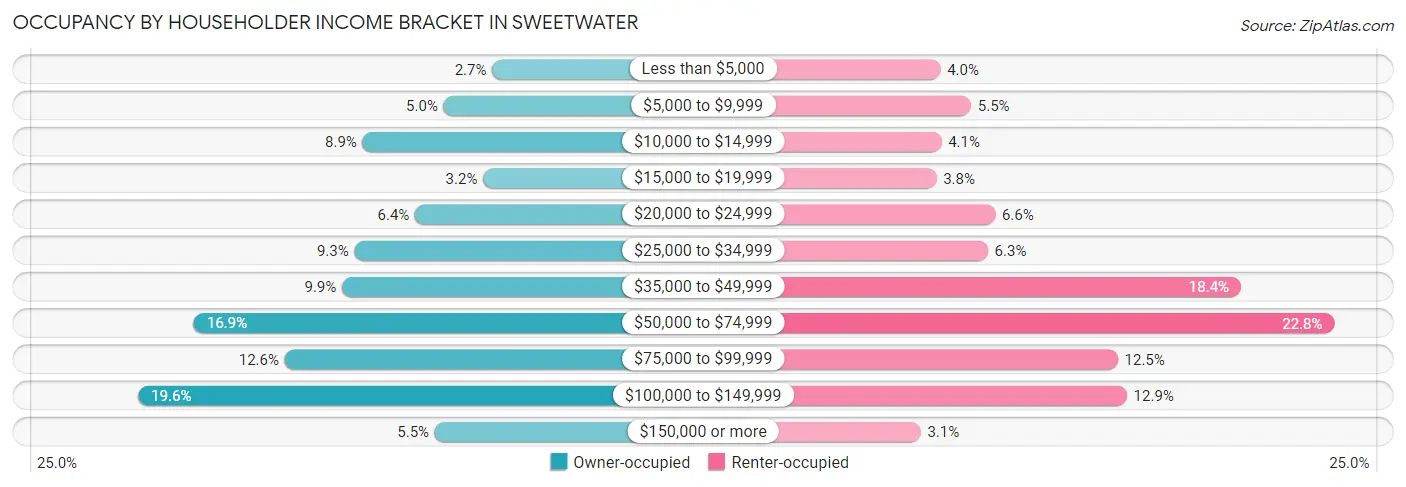
| Income Bracket | Owner-occupied | Renter-occupied |
| Less than $5,000 | 70 (2.7%) | 151 (4.0%) |
| $5,000 to $9,999 | 129 (5.0%) | 206 (5.5%) |
| $10,000 to $14,999 | 228 (8.9%) | 153 (4.1%) |
| $15,000 to $19,999 | 81 (3.2%) | 144 (3.8%) |
| $20,000 to $24,999 | 164 (6.4%) | 249 (6.6%) |
| $25,000 to $34,999 | 238 (9.3%) | 236 (6.3%) |
| $35,000 to $49,999 | 253 (9.9%) | 688 (18.3%) |
| $50,000 to $74,999 | 434 (16.9%) | 855 (22.8%) |
| $75,000 to $99,999 | 323 (12.6%) | 468 (12.5%) |
| $100,000 to $149,999 | 502 (19.6%) | 484 (12.9%) |
| $150,000 or more | 140 (5.5%) | 116 (3.1%) |
| Total | 2,562 (100.0%) | 3,750 (100.0%) |
Monthly Housing Cost Tiers in Sweetwater
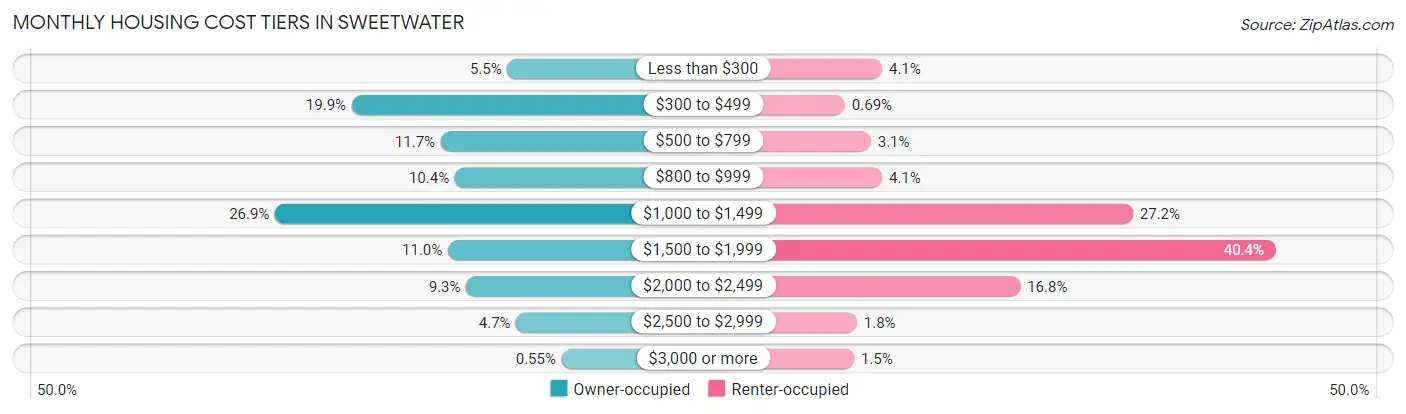
| Monthly Cost | Owner-occupied | Renter-occupied |
| Less than $300 | 142 (5.5%) | 154 (4.1%) |
| $300 to $499 | 509 (19.9%) | 26 (0.7%) |
| $500 to $799 | 299 (11.7%) | 115 (3.1%) |
| $800 to $999 | 266 (10.4%) | 154 (4.1%) |
| $1,000 to $1,499 | 690 (26.9%) | 1,020 (27.2%) |
| $1,500 to $1,999 | 282 (11.0%) | 1,513 (40.4%) |
| $2,000 to $2,499 | 239 (9.3%) | 631 (16.8%) |
| $2,500 to $2,999 | 121 (4.7%) | 67 (1.8%) |
| $3,000 or more | 14 (0.5%) | 57 (1.5%) |
| Total | 2,562 (100.0%) | 3,750 (100.0%) |
Physical Housing Characteristics in Sweetwater
Housing Structures in Sweetwater
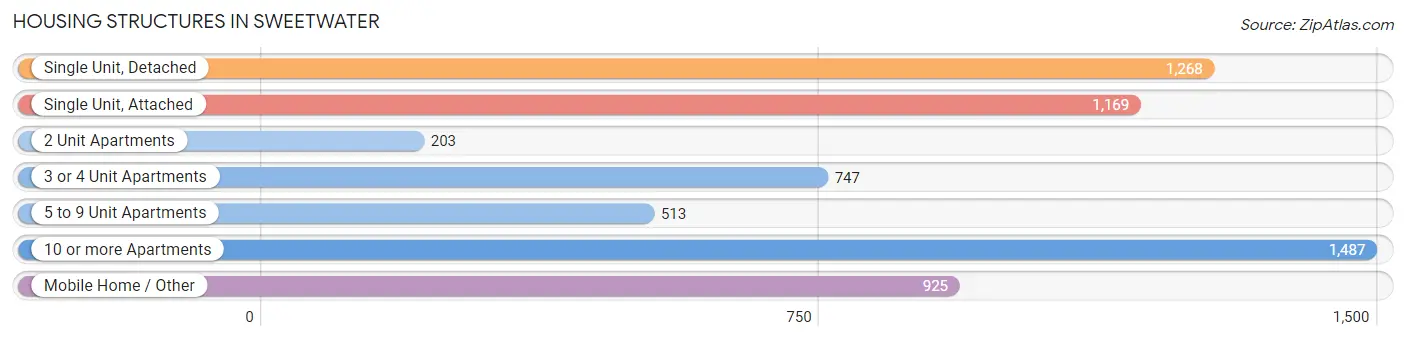
| Structure Type | # Housing Units | % Housing Units |
| Single Unit, Detached | 1,268 | 20.1% |
| Single Unit, Attached | 1,169 | 18.5% |
| 2 Unit Apartments | 203 | 3.2% |
| 3 or 4 Unit Apartments | 747 | 11.8% |
| 5 to 9 Unit Apartments | 513 | 8.1% |
| 10 or more Apartments | 1,487 | 23.6% |
| Mobile Home / Other | 925 | 14.6% |
| Total | 6,312 | 100.0% |
Housing Structures by Occupancy in Sweetwater
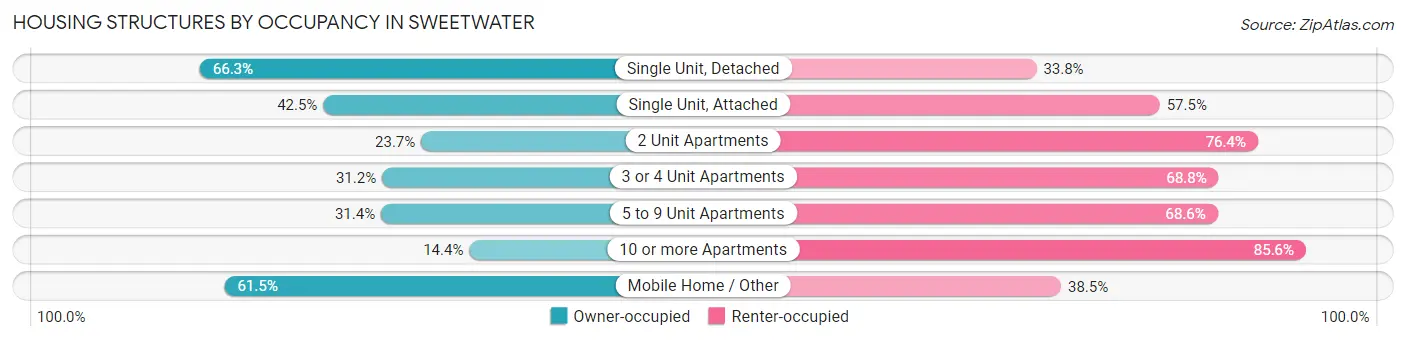
| Structure Type | Owner-occupied | Renter-occupied |
| Single Unit, Detached | 840 (66.2%) | 428 (33.8%) |
| Single Unit, Attached | 497 (42.5%) | 672 (57.5%) |
| 2 Unit Apartments | 48 (23.6%) | 155 (76.3%) |
| 3 or 4 Unit Apartments | 233 (31.2%) | 514 (68.8%) |
| 5 to 9 Unit Apartments | 161 (31.4%) | 352 (68.6%) |
| 10 or more Apartments | 214 (14.4%) | 1,273 (85.6%) |
| Mobile Home / Other | 569 (61.5%) | 356 (38.5%) |
| Total | 2,562 (40.6%) | 3,750 (59.4%) |
Housing Structures by Number of Rooms in Sweetwater
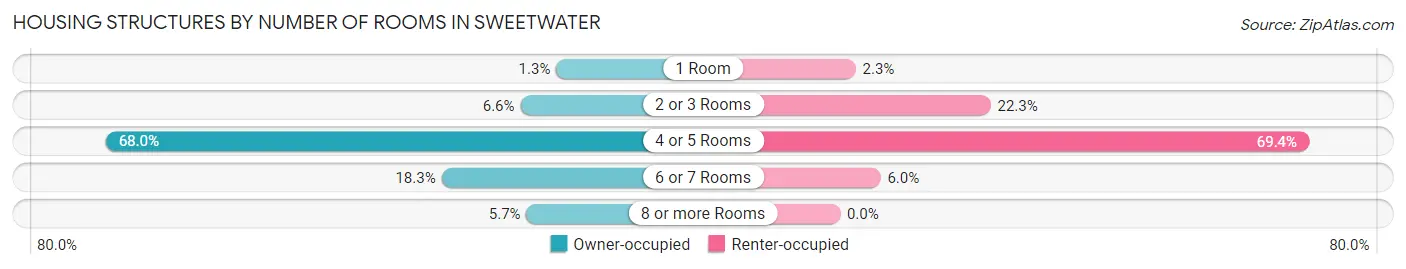
| Number of Rooms | Owner-occupied | Renter-occupied |
| 1 Room | 34 (1.3%) | 87 (2.3%) |
| 2 or 3 Rooms | 170 (6.6%) | 836 (22.3%) |
| 4 or 5 Rooms | 1,742 (68.0%) | 2,602 (69.4%) |
| 6 or 7 Rooms | 469 (18.3%) | 225 (6.0%) |
| 8 or more Rooms | 147 (5.7%) | 0 (0.0%) |
| Total | 2,562 (100.0%) | 3,750 (100.0%) |
Housing Structure by Heating Type in Sweetwater
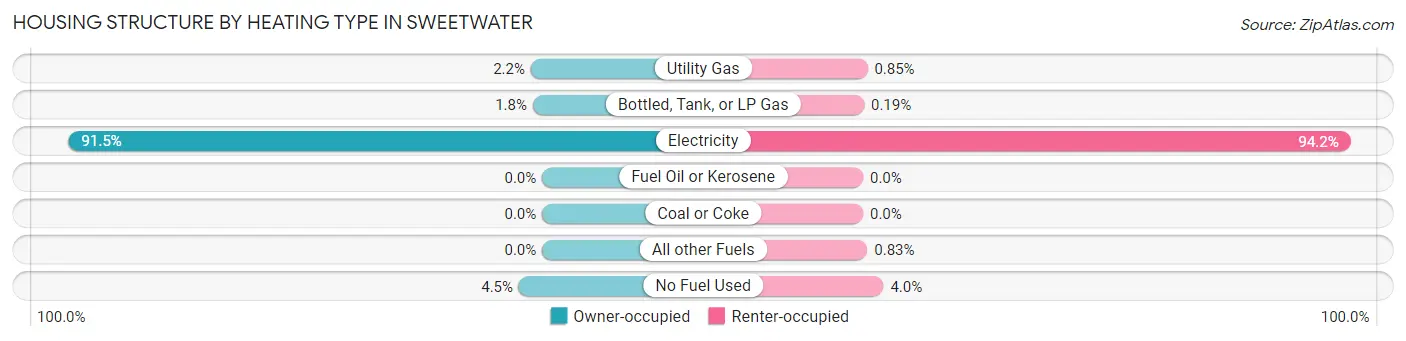
| Heating Type | Owner-occupied | Renter-occupied |
| Utility Gas | 56 (2.2%) | 32 (0.9%) |
| Bottled, Tank, or LP Gas | 46 (1.8%) | 7 (0.2%) |
| Electricity | 2,345 (91.5%) | 3,532 (94.2%) |
| Fuel Oil or Kerosene | 0 (0.0%) | 0 (0.0%) |
| Coal or Coke | 0 (0.0%) | 0 (0.0%) |
| All other Fuels | 0 (0.0%) | 31 (0.8%) |
| No Fuel Used | 115 (4.5%) | 148 (4.0%) |
| Total | 2,562 (100.0%) | 3,750 (100.0%) |
Household Vehicle Usage in Sweetwater
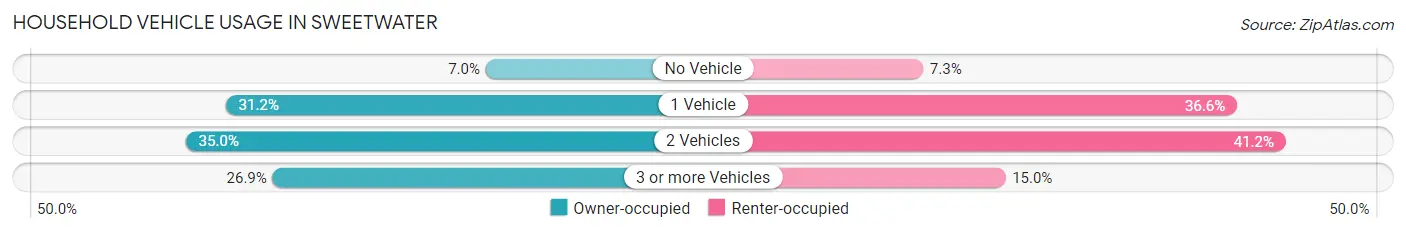
| Vehicles per Household | Owner-occupied | Renter-occupied |
| No Vehicle | 178 (7.0%) | 273 (7.3%) |
| 1 Vehicle | 800 (31.2%) | 1,373 (36.6%) |
| 2 Vehicles | 896 (35.0%) | 1,543 (41.1%) |
| 3 or more Vehicles | 688 (26.9%) | 561 (15.0%) |
| Total | 2,562 (100.0%) | 3,750 (100.0%) |
Real Estate & Mortgages in Sweetwater
Real Estate and Mortgage Overview in Sweetwater
| Characteristic | Without Mortgage | With Mortgage |
| Housing Units | 1,217 | 1,345 |
| Median Property Value | $136,800 | $265,800 |
| Median Household Income | $49,539 | $62 |
| Monthly Housing Costs | $501 | $14 |
| Real Estate Taxes | $1,606 | $73 |
Property Value by Mortgage Status in Sweetwater
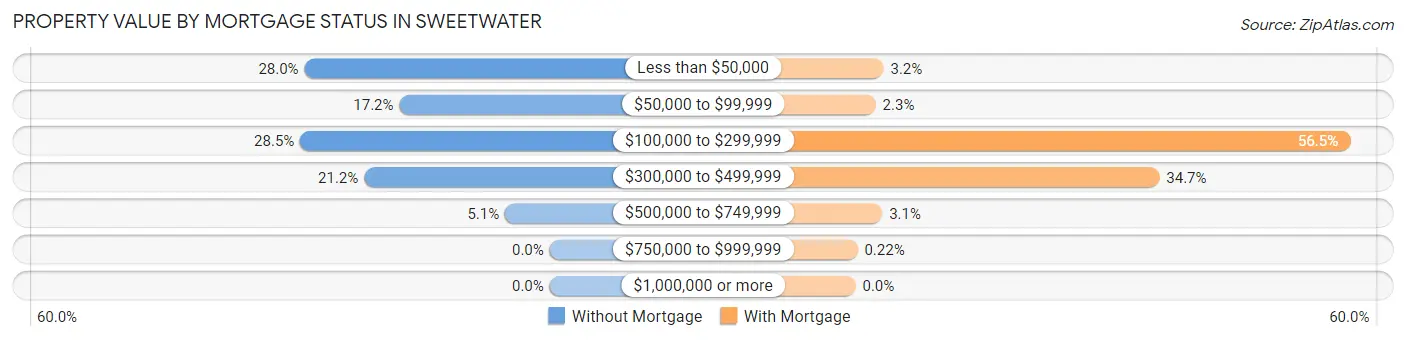
| Property Value | Without Mortgage | With Mortgage |
| Less than $50,000 | 341 (28.0%) | 43 (3.2%) |
| $50,000 to $99,999 | 209 (17.2%) | 31 (2.3%) |
| $100,000 to $299,999 | 347 (28.5%) | 760 (56.5%) |
| $300,000 to $499,999 | 258 (21.2%) | 467 (34.7%) |
| $500,000 to $749,999 | 62 (5.1%) | 41 (3.0%) |
| $750,000 to $999,999 | 0 (0.0%) | 3 (0.2%) |
| $1,000,000 or more | 0 (0.0%) | 0 (0.0%) |
| Total | 1,217 (100.0%) | 1,345 (100.0%) |
Household Income by Mortgage Status in Sweetwater
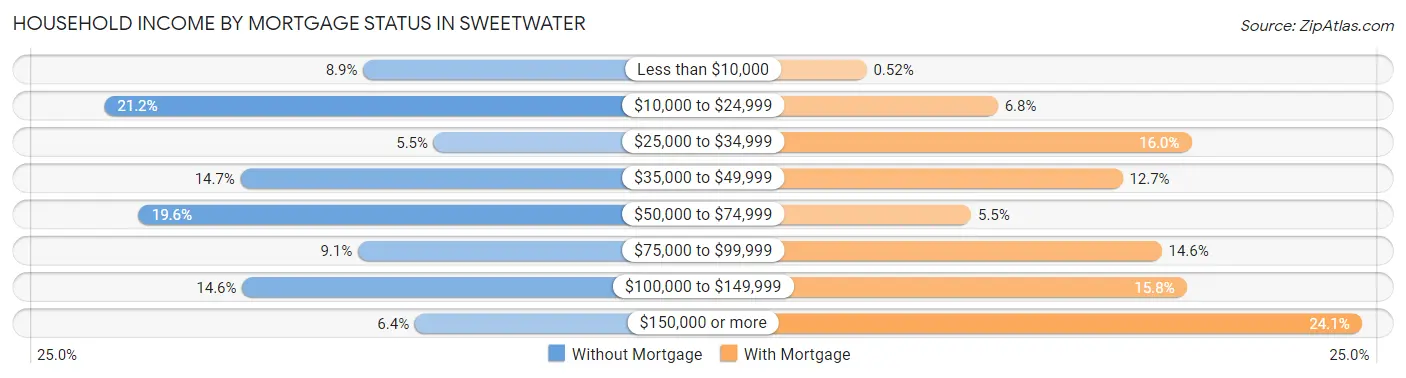
| Household Income | Without Mortgage | With Mortgage |
| Less than $10,000 | 108 (8.9%) | 7 (0.5%) |
| $10,000 to $24,999 | 258 (21.2%) | 91 (6.8%) |
| $25,000 to $34,999 | 67 (5.5%) | 215 (16.0%) |
| $35,000 to $49,999 | 179 (14.7%) | 171 (12.7%) |
| $50,000 to $74,999 | 238 (19.6%) | 74 (5.5%) |
| $75,000 to $99,999 | 111 (9.1%) | 196 (14.6%) |
| $100,000 to $149,999 | 178 (14.6%) | 212 (15.8%) |
| $150,000 or more | 78 (6.4%) | 324 (24.1%) |
| Total | 1,217 (100.0%) | 1,345 (100.0%) |
Property Value to Household Income Ratio in Sweetwater
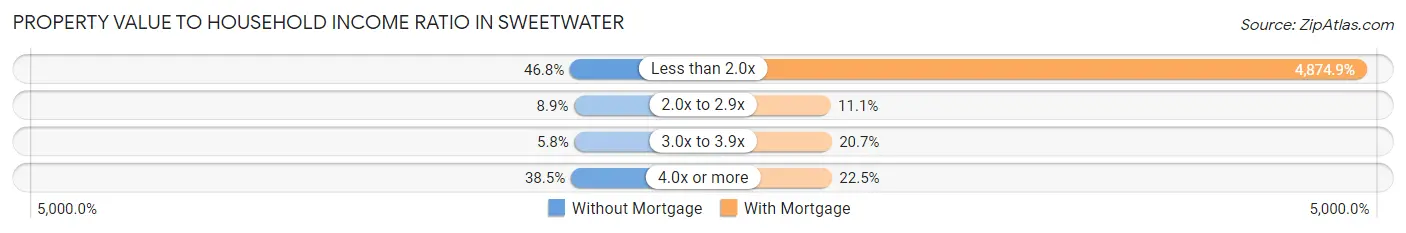
| Value-to-Income Ratio | Without Mortgage | With Mortgage |
| Less than 2.0x | 570 (46.8%) | 65,568 (4,874.9%) |
| 2.0x to 2.9x | 108 (8.9%) | 149 (11.1%) |
| 3.0x to 3.9x | 71 (5.8%) | 279 (20.7%) |
| 4.0x or more | 468 (38.5%) | 303 (22.5%) |
| Total | 1,217 (100.0%) | 1,345 (100.0%) |
Real Estate Taxes by Mortgage Status in Sweetwater
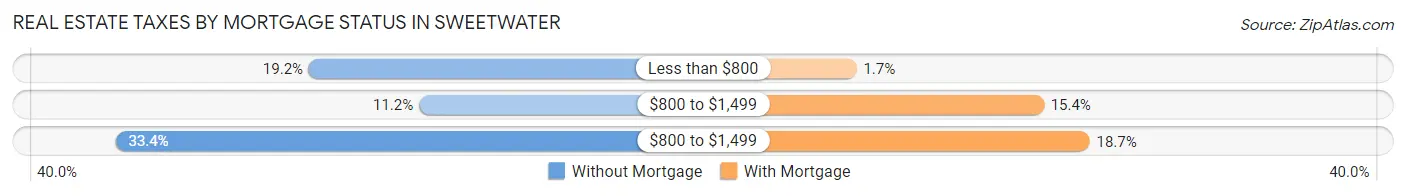
| Property Taxes | Without Mortgage | With Mortgage |
| Less than $800 | 234 (19.2%) | 23 (1.7%) |
| $800 to $1,499 | 136 (11.2%) | 207 (15.4%) |
| $800 to $1,499 | 406 (33.4%) | 252 (18.7%) |
| Total | 1,217 (100.0%) | 1,345 (100.0%) |
Health & Disability in Sweetwater
Health Insurance Coverage by Age in Sweetwater
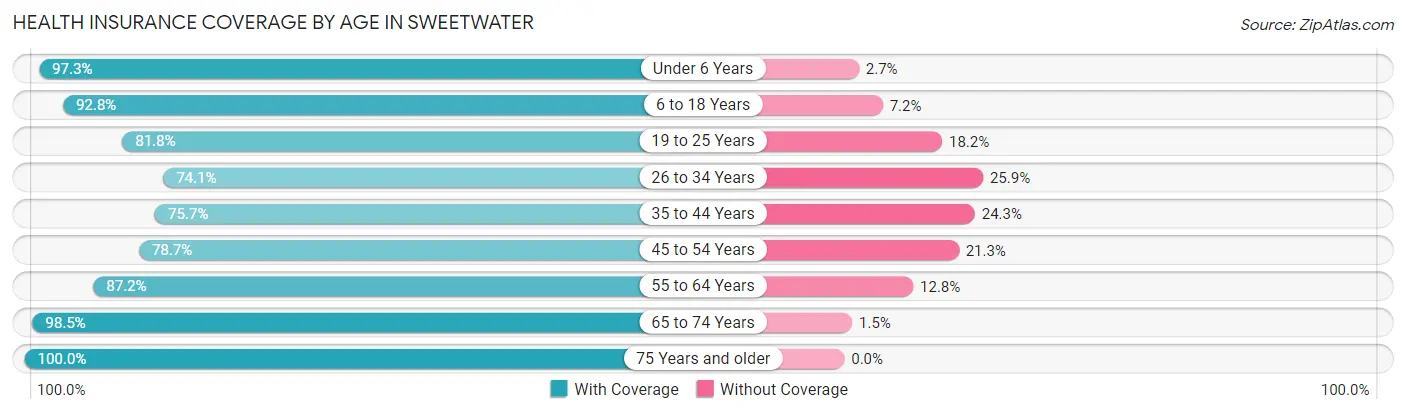
| Age Bracket | With Coverage | Without Coverage |
| Under 6 Years | 1,071 (97.3%) | 30 (2.7%) |
| 6 to 18 Years | 2,257 (92.8%) | 174 (7.2%) |
| 19 to 25 Years | 1,655 (81.8%) | 369 (18.2%) |
| 26 to 34 Years | 1,740 (74.1%) | 607 (25.9%) |
| 35 to 44 Years | 1,984 (75.7%) | 638 (24.3%) |
| 45 to 54 Years | 2,464 (78.7%) | 668 (21.3%) |
| 55 to 64 Years | 2,459 (87.2%) | 362 (12.8%) |
| 65 to 74 Years | 1,488 (98.5%) | 22 (1.5%) |
| 75 Years and older | 1,411 (100.0%) | 0 (0.0%) |
| Total | 16,529 (85.2%) | 2,870 (14.8%) |
Health Insurance Coverage by Citizenship Status in Sweetwater
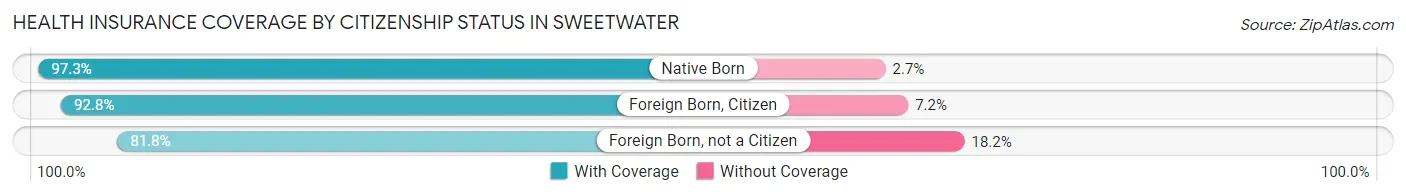
| Citizenship Status | With Coverage | Without Coverage |
| Native Born | 1,071 (97.3%) | 30 (2.7%) |
| Foreign Born, Citizen | 2,257 (92.8%) | 174 (7.2%) |
| Foreign Born, not a Citizen | 1,655 (81.8%) | 369 (18.2%) |
Health Insurance Coverage by Household Income in Sweetwater
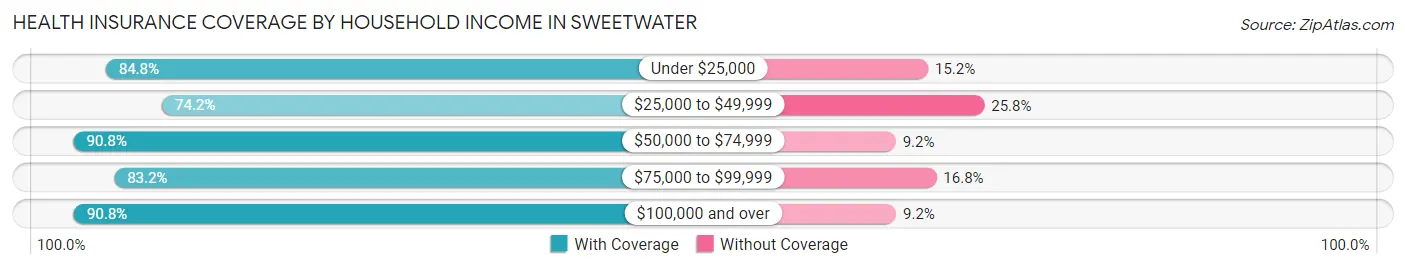
| Household Income | With Coverage | Without Coverage |
| Under $25,000 | 2,523 (84.8%) | 453 (15.2%) |
| $25,000 to $49,999 | 2,946 (74.2%) | 1,022 (25.8%) |
| $50,000 to $74,999 | 3,685 (90.8%) | 372 (9.2%) |
| $75,000 to $99,999 | 2,687 (83.2%) | 542 (16.8%) |
| $100,000 and over | 4,627 (90.8%) | 471 (9.2%) |
Public vs Private Health Insurance Coverage by Age in Sweetwater
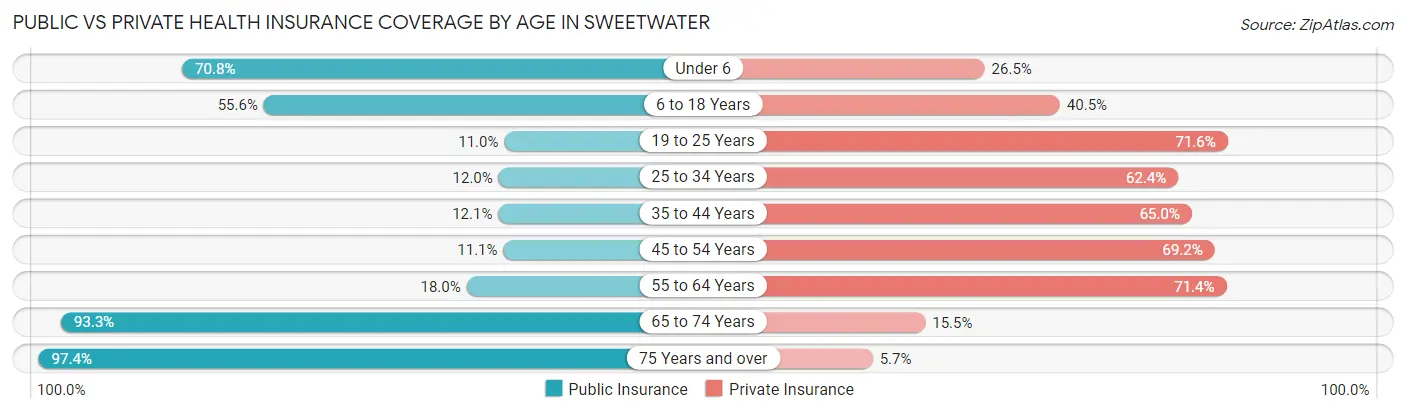
| Age Bracket | Public Insurance | Private Insurance |
| Under 6 | 779 (70.8%) | 292 (26.5%) |
| 6 to 18 Years | 1,352 (55.6%) | 984 (40.5%) |
| 19 to 25 Years | 222 (11.0%) | 1,449 (71.6%) |
| 25 to 34 Years | 282 (12.0%) | 1,465 (62.4%) |
| 35 to 44 Years | 317 (12.1%) | 1,703 (64.9%) |
| 45 to 54 Years | 349 (11.1%) | 2,167 (69.2%) |
| 55 to 64 Years | 507 (18.0%) | 2,013 (71.4%) |
| 65 to 74 Years | 1,408 (93.2%) | 234 (15.5%) |
| 75 Years and over | 1,374 (97.4%) | 81 (5.7%) |
| Total | 6,590 (34.0%) | 10,388 (53.5%) |
Disability Status by Sex by Age in Sweetwater
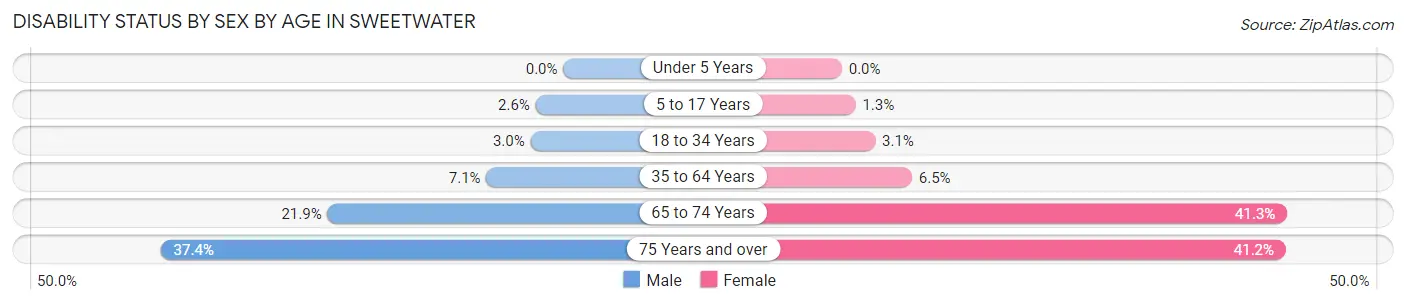
| Age Bracket | Male | Female |
| Under 5 Years | 0 (0.0%) | 0 (0.0%) |
| 5 to 17 Years | 32 (2.6%) | 13 (1.3%) |
| 18 to 34 Years | 72 (3.0%) | 70 (3.1%) |
| 35 to 64 Years | 307 (7.1%) | 278 (6.5%) |
| 65 to 74 Years | 169 (21.9%) | 305 (41.3%) |
| 75 Years and over | 219 (37.4%) | 340 (41.2%) |
Disability Class by Sex by Age in Sweetwater
Disability Class: Hearing Difficulty
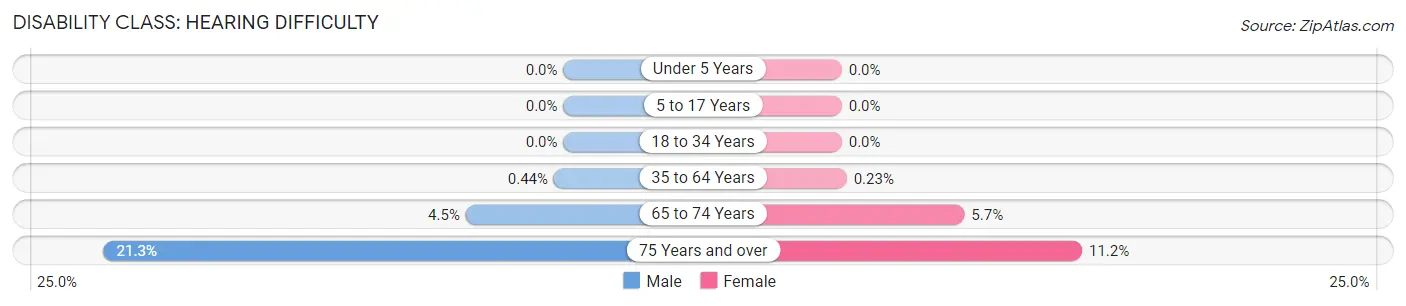
| Age Bracket | Male | Female |
| Under 5 Years | 0 (0.0%) | 0 (0.0%) |
| 5 to 17 Years | 0 (0.0%) | 0 (0.0%) |
| 18 to 34 Years | 0 (0.0%) | 0 (0.0%) |
| 35 to 64 Years | 19 (0.4%) | 10 (0.2%) |
| 65 to 74 Years | 35 (4.5%) | 42 (5.7%) |
| 75 Years and over | 125 (21.3%) | 92 (11.2%) |
Disability Class: Vision Difficulty
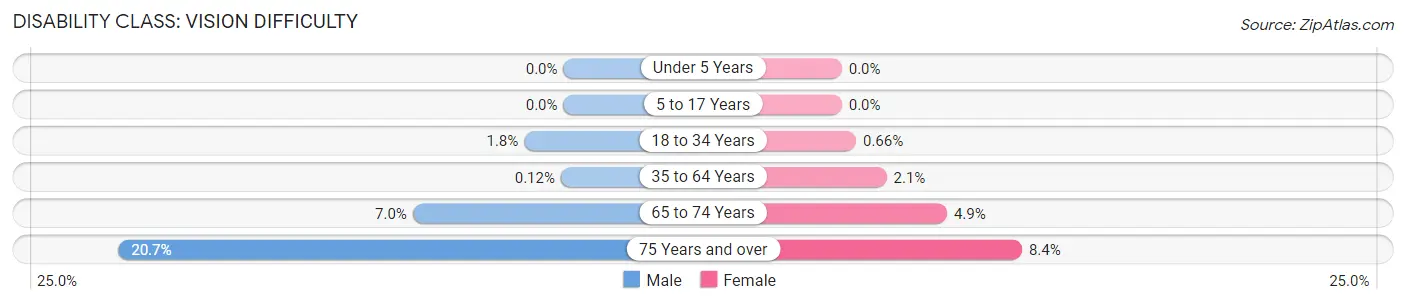
| Age Bracket | Male | Female |
| Under 5 Years | 0 (0.0%) | 0 (0.0%) |
| 5 to 17 Years | 0 (0.0%) | 0 (0.0%) |
| 18 to 34 Years | 43 (1.8%) | 15 (0.7%) |
| 35 to 64 Years | 5 (0.1%) | 89 (2.1%) |
| 65 to 74 Years | 54 (7.0%) | 36 (4.9%) |
| 75 Years and over | 121 (20.6%) | 69 (8.4%) |
Disability Class: Cognitive Difficulty
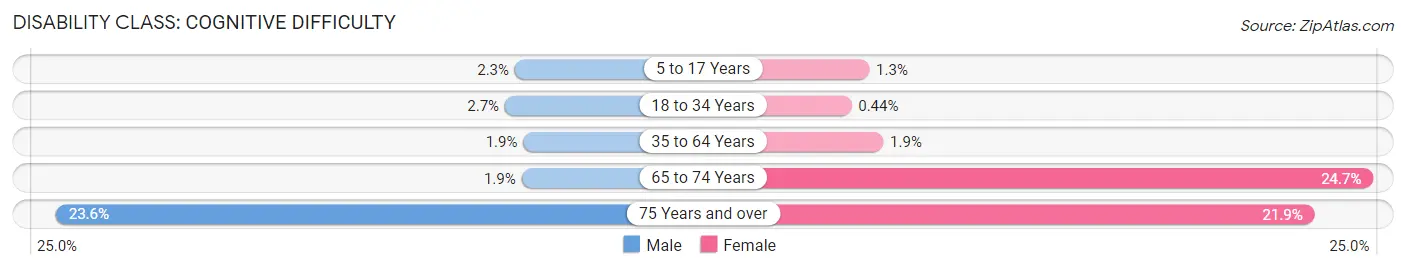
| Age Bracket | Male | Female |
| 5 to 17 Years | 28 (2.2%) | 13 (1.3%) |
| 18 to 34 Years | 64 (2.7%) | 10 (0.4%) |
| 35 to 64 Years | 80 (1.9%) | 82 (1.9%) |
| 65 to 74 Years | 15 (1.9%) | 182 (24.7%) |
| 75 Years and over | 138 (23.5%) | 181 (21.9%) |
Disability Class: Ambulatory Difficulty
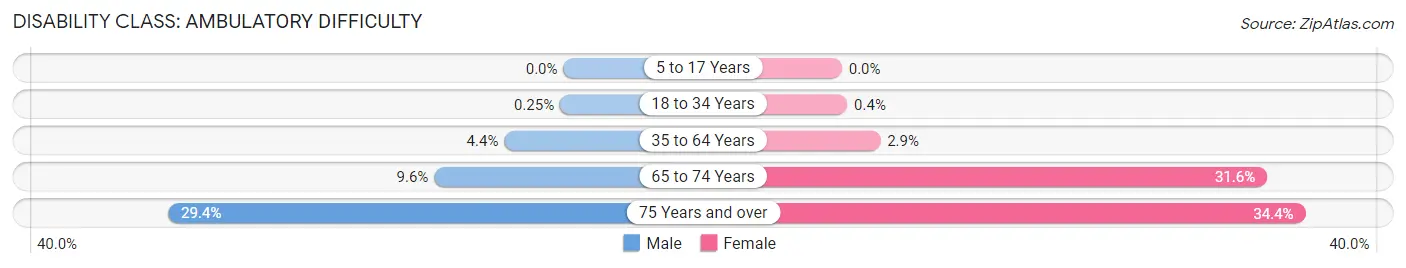
| Age Bracket | Male | Female |
| 5 to 17 Years | 0 (0.0%) | 0 (0.0%) |
| 18 to 34 Years | 6 (0.3%) | 9 (0.4%) |
| 35 to 64 Years | 189 (4.4%) | 122 (2.9%) |
| 65 to 74 Years | 74 (9.6%) | 233 (31.6%) |
| 75 Years and over | 172 (29.3%) | 284 (34.4%) |
Disability Class: Self-Care Difficulty
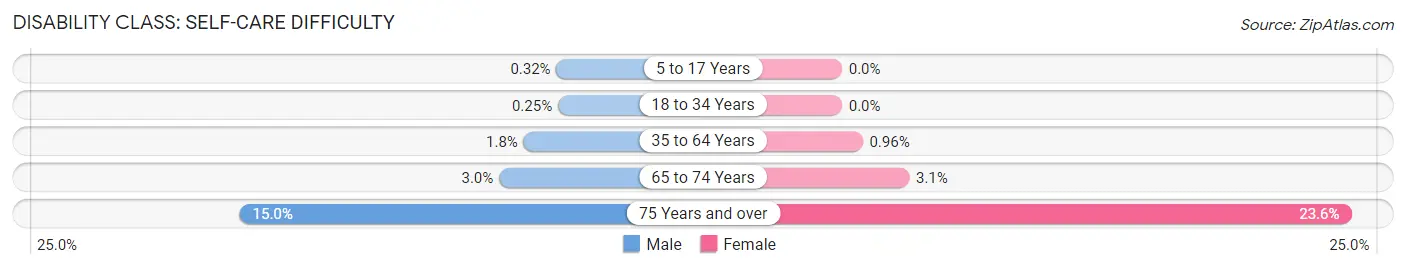
| Age Bracket | Male | Female |
| 5 to 17 Years | 4 (0.3%) | 0 (0.0%) |
| 18 to 34 Years | 6 (0.3%) | 0 (0.0%) |
| 35 to 64 Years | 79 (1.8%) | 41 (1.0%) |
| 65 to 74 Years | 23 (3.0%) | 23 (3.1%) |
| 75 Years and over | 88 (15.0%) | 195 (23.6%) |
Technology Access in Sweetwater
Computing Device Access in Sweetwater
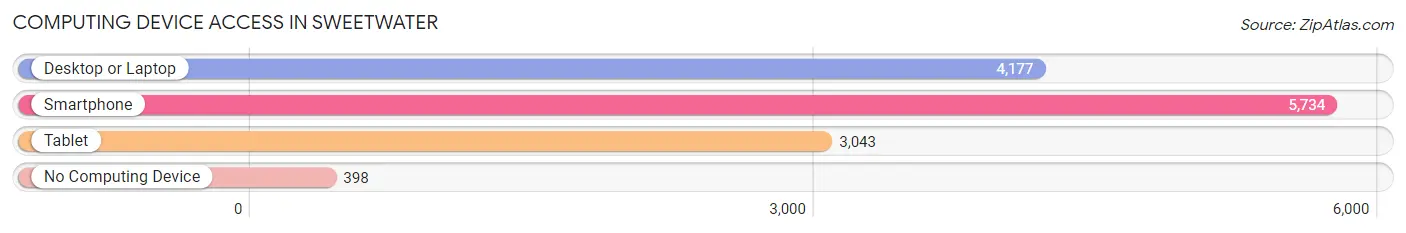
| Device Type | # Households | % Households |
| Desktop or Laptop | 4,177 | 66.2% |
| Smartphone | 5,734 | 90.8% |
| Tablet | 3,043 | 48.2% |
| No Computing Device | 398 | 6.3% |
| Total | 6,312 | 100.0% |
Internet Access in Sweetwater
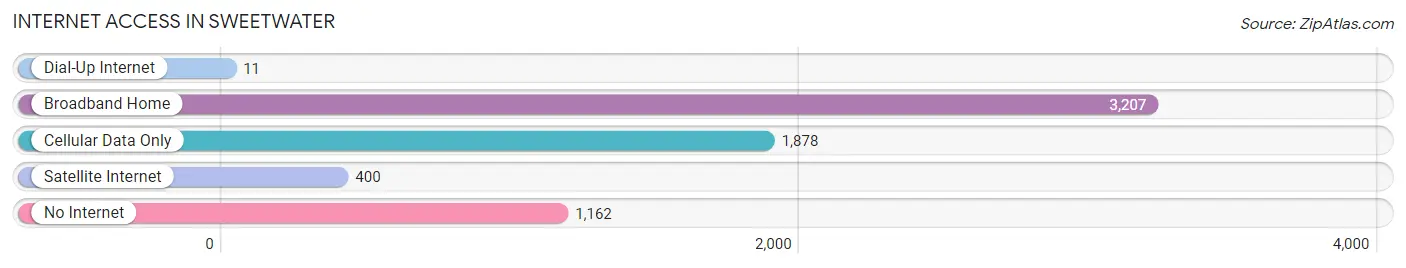
| Internet Type | # Households | % Households |
| Dial-Up Internet | 11 | 0.2% |
| Broadband Home | 3,207 | 50.8% |
| Cellular Data Only | 1,878 | 29.7% |
| Satellite Internet | 400 | 6.3% |
| No Internet | 1,162 | 18.4% |
| Total | 6,312 | 100.0% |
Sweetwater Summary
History
The city of Sweetwater, Florida is located in Miami-Dade County and is part of the Miami metropolitan area. The city was founded in 1941 and was originally known as West Miami. The city was renamed Sweetwater in 1945 after the Sweetwater Canal, which was built in the area in the late 19th century. The canal was named after the Sweetwater Creek, which was named by early settlers who found the water to be sweet and refreshing.
The city of Sweetwater was incorporated in 1947 and has since grown to become a vibrant and diverse community. The city is home to a variety of businesses, including retail stores, restaurants, and professional services. Sweetwater is also home to a number of parks and recreational facilities, including the Sweetwater Country Club, which offers golf, tennis, and swimming.
Geography
Sweetwater is located in Miami-Dade County, Florida, and is part of the Miami metropolitan area. The city is situated on the western edge of the county, just south of the Miami International Airport. The city covers an area of approximately 4.5 square miles and is bordered by the cities of West Miami, Hialeah, and Miami Lakes.
The city of Sweetwater is located in a subtropical climate, with hot and humid summers and mild winters. The average temperature in the summer months is around 90 degrees Fahrenheit, while the average temperature in the winter months is around 70 degrees Fahrenheit. The city receives an average of 60 inches of rain per year.
Economy
The economy of Sweetwater is largely driven by the retail and service industries. The city is home to a variety of retail stores, restaurants, and professional services. Sweetwater is also home to a number of parks and recreational facilities, including the Sweetwater Country Club, which offers golf, tennis, and swimming.
The city is also home to a number of manufacturing and industrial businesses, including a Coca-Cola bottling plant and a Nestle plant. The city is also home to a number of government offices, including the Miami-Dade County Courthouse and the Miami-Dade County Public Schools.
Demographics
As of the 2010 census, the population of Sweetwater was 14,226. The population is largely Hispanic, with over 70% of the population identifying as Hispanic or Latino. The median household income in Sweetwater is $35,845, and the median age is 37.
The city of Sweetwater is served by the Miami-Dade County Public Schools system. The city is also home to a number of private schools, including the Sweetwater Christian Academy and the Sweetwater Montessori School.
Conclusion
Sweetwater, Florida is a vibrant and diverse city located in Miami-Dade County. The city is home to a variety of businesses, parks, and recreational facilities, and is largely driven by the retail and service industries. The population of Sweetwater is largely Hispanic, with over 70% of the population identifying as Hispanic or Latino. The city is served by the Miami-Dade County Public Schools system and is home to a number of private schools. Sweetwater is an attractive city for those looking for a diverse and vibrant community.
Common Questions
What is Per Capita Income in Sweetwater?
Per Capita income in Sweetwater is $21,743.
What is the Median Family Income in Sweetwater?
Median Family Income in Sweetwater is $57,752.
What is the Median Household income in Sweetwater?
Median Household Income in Sweetwater is $53,159.
What is Income or Wage Gap in Sweetwater?
Income or Wage Gap in Sweetwater is 29.2%.
Women in Sweetwater earn 70.8 cents for every dollar earned by a man.
What is Family Income Deficit in Sweetwater?
Family Income Deficit in Sweetwater is $10,632.
Families that are below poverty line in Sweetwater earn $10,632 less on average than the poverty threshold level.
What is Inequality or Gini Index in Sweetwater?
Inequality or Gini Index in Sweetwater is 0.41.
What is the Total Population of Sweetwater?
Total Population of Sweetwater is 19,399.
What is the Total Male Population of Sweetwater?
Total Male Population of Sweetwater is 9,885.
What is the Total Female Population of Sweetwater?
Total Female Population of Sweetwater is 9,514.
What is the Ratio of Males per 100 Females in Sweetwater?
There are 103.90 Males per 100 Females in Sweetwater.
What is the Ratio of Females per 100 Males in Sweetwater?
There are 96.25 Females per 100 Males in Sweetwater.
What is the Median Population Age in Sweetwater?
Median Population Age in Sweetwater is 41.6 Years.
What is the Average Family Size in Sweetwater
Average Family Size in Sweetwater is 3.5 People.
What is the Average Household Size in Sweetwater
Average Household Size in Sweetwater is 3.1 People.
How Large is the Labor Force in Sweetwater?
There are 10,446 People in the Labor Forcein in Sweetwater.
What is the Percentage of People in the Labor Force in Sweetwater?
63.5% of People are in the Labor Force in Sweetwater.
What is the Unemployment Rate in Sweetwater?
Unemployment Rate in Sweetwater is 4.8%.