Tama, IA Map & Demographics
Tama Map
Tama Overview
$24,944
PER CAPITA INCOME
$65,469
AVG FAMILY INCOME
$59,129
AVG HOUSEHOLD INCOME
36.4%
WAGE / INCOME GAP [ % ]
63.6¢/ $1
WAGE / INCOME GAP [ $ ]
0.41
INEQUALITY / GINI INDEX
3,073
TOTAL POPULATION
1,595
MALE POPULATION
1,478
FEMALE POPULATION
107.92
MALES / 100 FEMALES
92.66
FEMALES / 100 MALES
31.3
MEDIAN AGE
3.2
AVG FAMILY SIZE
2.8
AVG HOUSEHOLD SIZE
1,390
LABOR FORCE [ PEOPLE ]
64.0%
PERCENT IN LABOR FORCE
7.7%
UNEMPLOYMENT RATE
Tama Zip Codes
Income in Tama
Income Overview in Tama
Per Capita Income in Tama is $24,944, while median incomes of families and households are $65,469 and $59,129 respectively.
| Characteristic | Number | Measure |
| Per Capita Income | 3,073 | $24,944 |
| Median Family Income | 773 | $65,469 |
| Mean Family Income | 773 | $73,828 |
| Median Household Income | 1,068 | $59,129 |
| Mean Household Income | 1,068 | $69,590 |
| Income Deficit | 773 | $0 |
| Wage / Income Gap (%) | 3,073 | 36.36% |
| Wage / Income Gap ($) | 3,073 | 63.64¢ per $1 |
| Gini / Inequality Index | 3,073 | 0.41 |
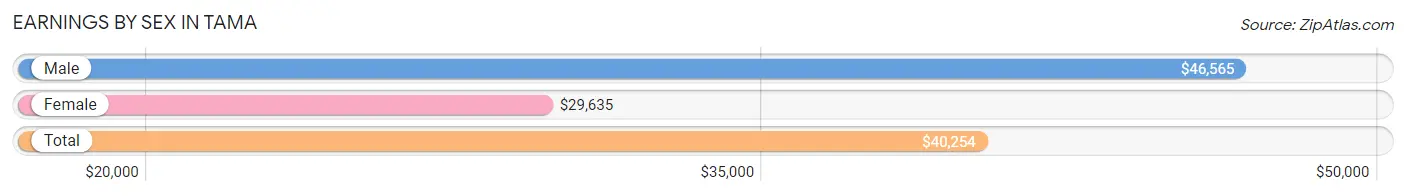
Earnings by Sex in Tama
Average Earnings in Tama are $40,254, $46,565 for men and $29,635 for women, a difference of 36.4%.
| Sex | Number | Average Earnings |
| Male | 829 (59.3%) | $46,565 |
| Female | 569 (40.7%) | $29,635 |
| Total | 1,398 (100.0%) | $40,254 |
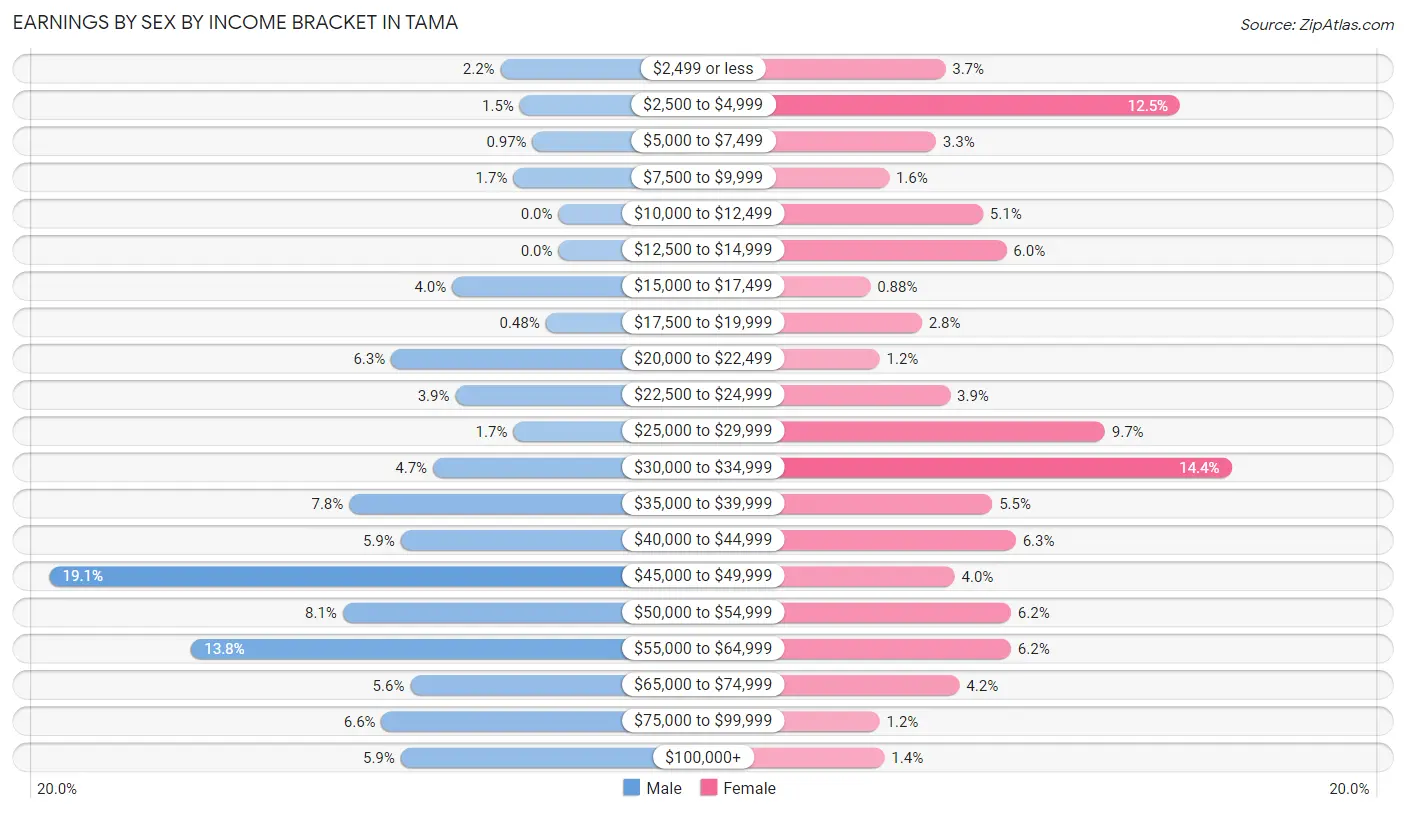
Earnings by Sex by Income Bracket in Tama
The most common earnings brackets in Tama are $45,000 to $49,999 for men (158 | 19.1%) and $30,000 to $34,999 for women (82 | 14.4%).
| Income | Male | Female |
| $2,499 or less | 18 (2.2%) | 21 (3.7%) |
| $2,500 to $4,999 | 12 (1.5%) | 71 (12.5%) |
| $5,000 to $7,499 | 8 (1.0%) | 19 (3.3%) |
| $7,500 to $9,999 | 14 (1.7%) | 9 (1.6%) |
| $10,000 to $12,499 | 0 (0.0%) | 29 (5.1%) |
| $12,500 to $14,999 | 0 (0.0%) | 34 (6.0%) |
| $15,000 to $17,499 | 33 (4.0%) | 5 (0.9%) |
| $17,500 to $19,999 | 4 (0.5%) | 16 (2.8%) |
| $20,000 to $22,499 | 52 (6.3%) | 7 (1.2%) |
| $22,500 to $24,999 | 32 (3.9%) | 22 (3.9%) |
| $25,000 to $29,999 | 14 (1.7%) | 55 (9.7%) |
| $30,000 to $34,999 | 39 (4.7%) | 82 (14.4%) |
| $35,000 to $39,999 | 65 (7.8%) | 31 (5.4%) |
| $40,000 to $44,999 | 49 (5.9%) | 36 (6.3%) |
| $45,000 to $49,999 | 158 (19.1%) | 23 (4.0%) |
| $50,000 to $54,999 | 67 (8.1%) | 35 (6.1%) |
| $55,000 to $64,999 | 114 (13.8%) | 35 (6.1%) |
| $65,000 to $74,999 | 46 (5.6%) | 24 (4.2%) |
| $75,000 to $99,999 | 55 (6.6%) | 7 (1.2%) |
| $100,000+ | 49 (5.9%) | 8 (1.4%) |
| Total | 829 (100.0%) | 569 (100.0%) |
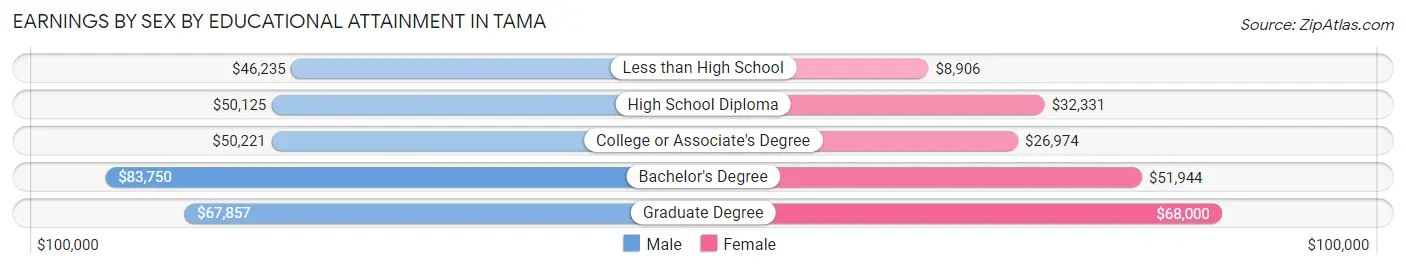
Earnings by Sex by Educational Attainment in Tama
Average earnings in Tama are $47,237 for men and $31,636 for women, a difference of 33.0%. Men with an educational attainment of bachelor's degree enjoy the highest average annual earnings of $83,750, while those with less than high school education earn the least with $46,235. Women with an educational attainment of graduate degree earn the most with the average annual earnings of $68,000, while those with less than high school education have the smallest earnings of $8,906.
| Educational Attainment | Male Income | Female Income |
| Less than High School | $46,235 | $8,906 |
| High School Diploma | $50,125 | $32,331 |
| College or Associate's Degree | $50,221 | $26,974 |
| Bachelor's Degree | $83,750 | $51,944 |
| Graduate Degree | $67,857 | $68,000 |
| Total | $47,237 | $31,636 |
Family Income in Tama
Family Income Brackets in Tama
According to the Tama family income data, there are 167 families falling into the $50,000 to $74,999 income range, which is the most common income bracket and makes up 21.6% of all families. Conversely, the $25,000 to $34,999 income bracket is the least frequent group with only 4 families (0.5%) belonging to this category.
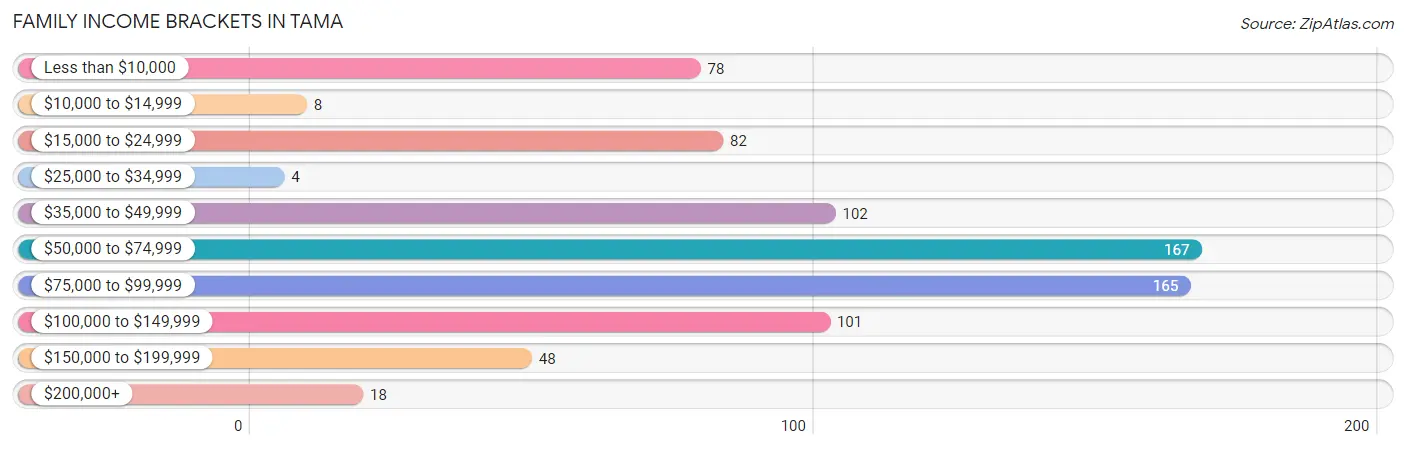
| Income Bracket | # Families | % Families |
| Less than $10,000 | 78 | 10.1% |
| $10,000 to $14,999 | 8 | 1.0% |
| $15,000 to $24,999 | 82 | 10.6% |
| $25,000 to $34,999 | 4 | 0.5% |
| $35,000 to $49,999 | 102 | 13.2% |
| $50,000 to $74,999 | 167 | 21.6% |
| $75,000 to $99,999 | 165 | 21.3% |
| $100,000 to $149,999 | 101 | 13.1% |
| $150,000 to $199,999 | 48 | 6.2% |
| $200,000+ | 18 | 2.3% |
Family Income by Famaliy Size in Tama
4-person families (131 | 17.0%) account for the highest median family income in Tama with $73,068 per family, while 2-person families (364 | 47.1%) have the highest median income of $34,500 per family member.
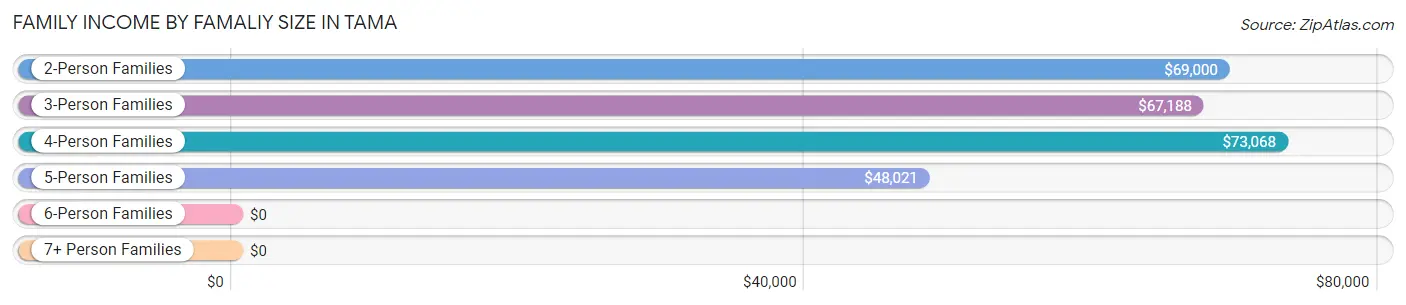
| Income Bracket | # Families | Median Income |
| 2-Person Families | 364 (47.1%) | $69,000 |
| 3-Person Families | 122 (15.8%) | $67,188 |
| 4-Person Families | 131 (17.0%) | $73,068 |
| 5-Person Families | 127 (16.4%) | $48,021 |
| 6-Person Families | 21 (2.7%) | $0 |
| 7+ Person Families | 8 (1.0%) | $0 |
| Total | 773 (100.0%) | $65,469 |
Family Income by Number of Earners in Tama
The median family income in Tama is $65,469, with families comprising 3+ earners (40) having the highest median family income of $101,875, while families with no earners (95) have the lowest median family income of $37,639, accounting for 5.2% and 12.3% of families, respectively.
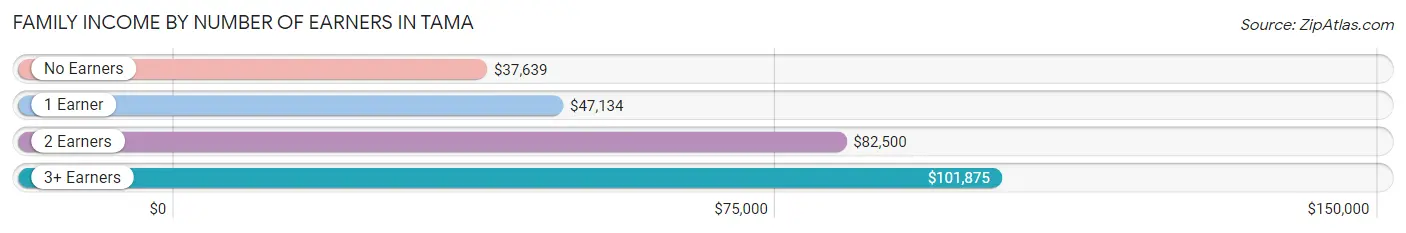
| Number of Earners | # Families | Median Income |
| No Earners | 95 (12.3%) | $37,639 |
| 1 Earner | 356 (46.1%) | $47,134 |
| 2 Earners | 282 (36.5%) | $82,500 |
| 3+ Earners | 40 (5.2%) | $101,875 |
| Total | 773 (100.0%) | $65,469 |
Household Income in Tama
Household Income Brackets in Tama
With 247 households falling in the category, the $50,000 to $74,999 income range is the most frequent in Tama, accounting for 23.1% of all households. In contrast, only 18 households (1.7%) fall into the $200,000+ income bracket, making it the least populous group.
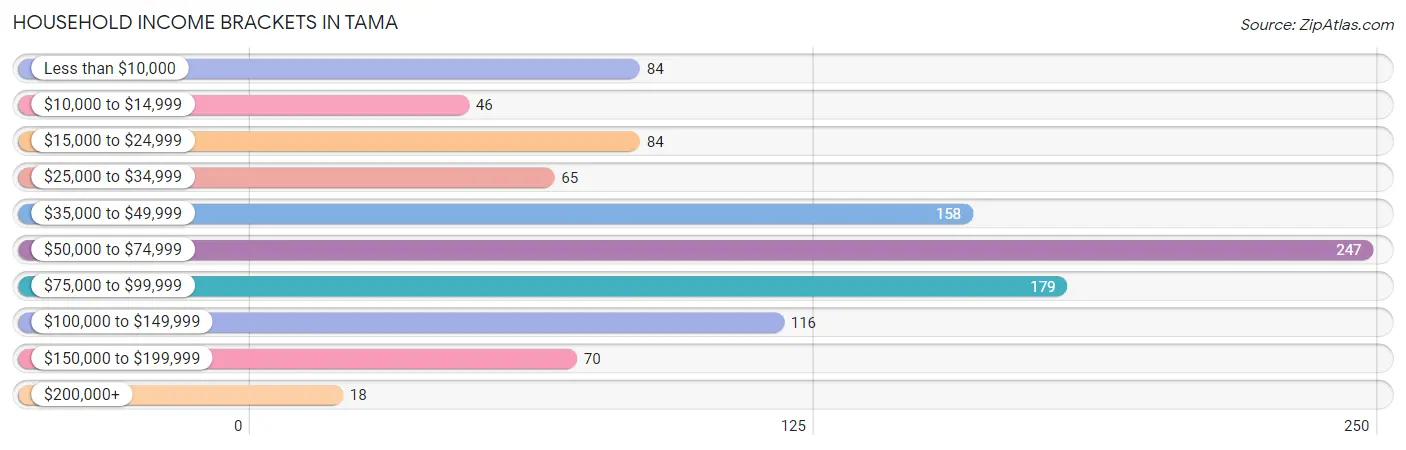
| Income Bracket | # Households | % Households |
| Less than $10,000 | 84 | 7.9% |
| $10,000 to $14,999 | 46 | 4.3% |
| $15,000 to $24,999 | 84 | 7.9% |
| $25,000 to $34,999 | 65 | 6.1% |
| $35,000 to $49,999 | 158 | 14.8% |
| $50,000 to $74,999 | 247 | 23.1% |
| $75,000 to $99,999 | 179 | 16.8% |
| $100,000 to $149,999 | 116 | 10.9% |
| $150,000 to $199,999 | 70 | 6.6% |
| $200,000+ | 18 | 1.7% |
Household Income by Householder Age in Tama
The median household income in Tama is $59,129, with the highest median household income of $69,750 found in the 45 to 64 years age bracket for the primary householder. A total of 291 households (27.3%) fall into this category. Meanwhile, the 65+ years age bracket for the primary householder has the lowest median household income of $36,094, with 265 households (24.8%) in this group.
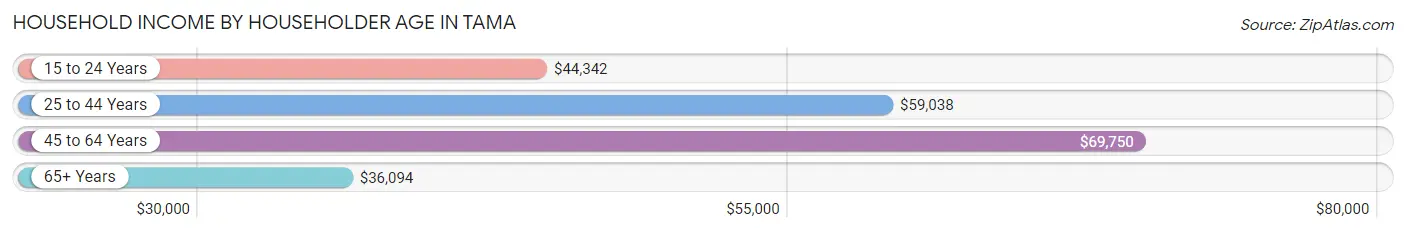
| Income Bracket | # Households | Median Income |
| 15 to 24 Years | 54 (5.1%) | $44,342 |
| 25 to 44 Years | 458 (42.9%) | $59,038 |
| 45 to 64 Years | 291 (27.3%) | $69,750 |
| 65+ Years | 265 (24.8%) | $36,094 |
| Total | 1,068 (100.0%) | $59,129 |
Poverty in Tama
Income Below Poverty by Sex and Age in Tama
With 17.4% poverty level for males and 25.4% for females among the residents of Tama, 6 to 11 year old males and 18 to 24 year old females are the most vulnerable to poverty, with 93 males (47.0%) and 69 females (71.1%) in their respective age groups living below the poverty level.
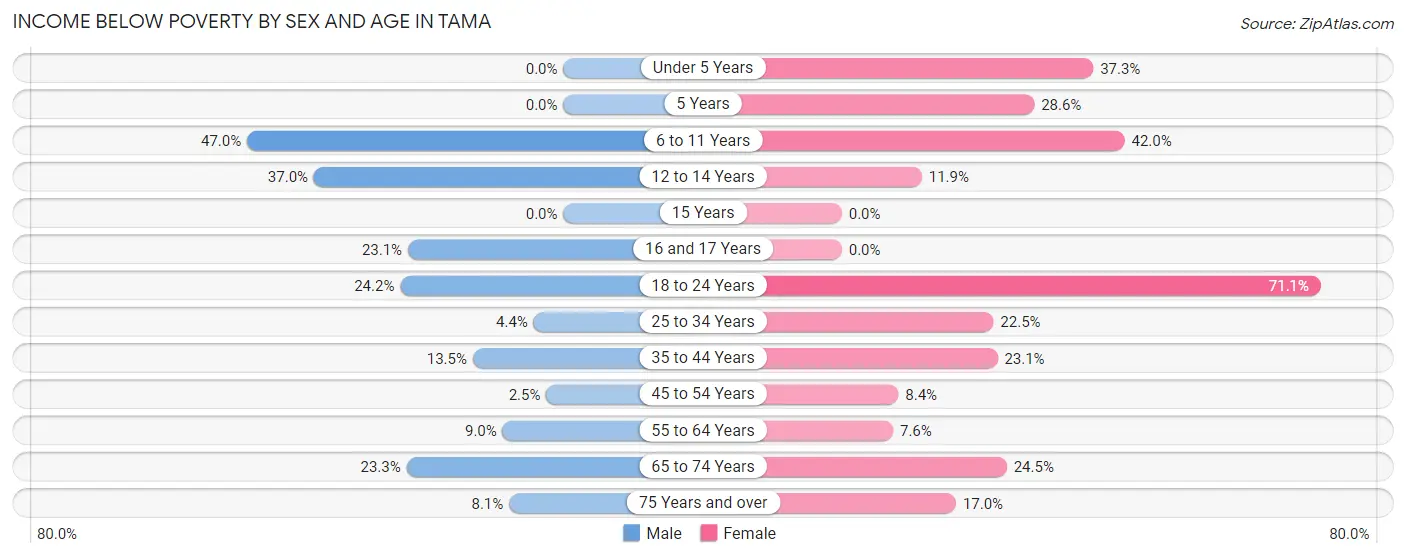
| Age Bracket | Male | Female |
| Under 5 Years | 0 (0.0%) | 28 (37.3%) |
| 5 Years | 0 (0.0%) | 12 (28.6%) |
| 6 to 11 Years | 93 (47.0%) | 76 (42.0%) |
| 12 to 14 Years | 50 (37.0%) | 12 (11.9%) |
| 15 Years | 0 (0.0%) | 0 (0.0%) |
| 16 and 17 Years | 15 (23.1%) | 0 (0.0%) |
| 18 to 24 Years | 31 (24.2%) | 69 (71.1%) |
| 25 to 34 Years | 11 (4.4%) | 52 (22.5%) |
| 35 to 44 Years | 23 (13.5%) | 55 (23.1%) |
| 45 to 54 Years | 4 (2.5%) | 10 (8.4%) |
| 55 to 64 Years | 11 (9.0%) | 7 (7.6%) |
| 65 to 74 Years | 27 (23.3%) | 24 (24.5%) |
| 75 Years and over | 7 (8.1%) | 20 (17.0%) |
| Total | 272 (17.4%) | 365 (25.4%) |
Income Above Poverty by Sex and Age in Tama
According to the poverty statistics in Tama, males aged under 5 years and females aged 15 years are the age groups that are most secure financially, with 100.0% of males and 100.0% of females in these age groups living above the poverty line.
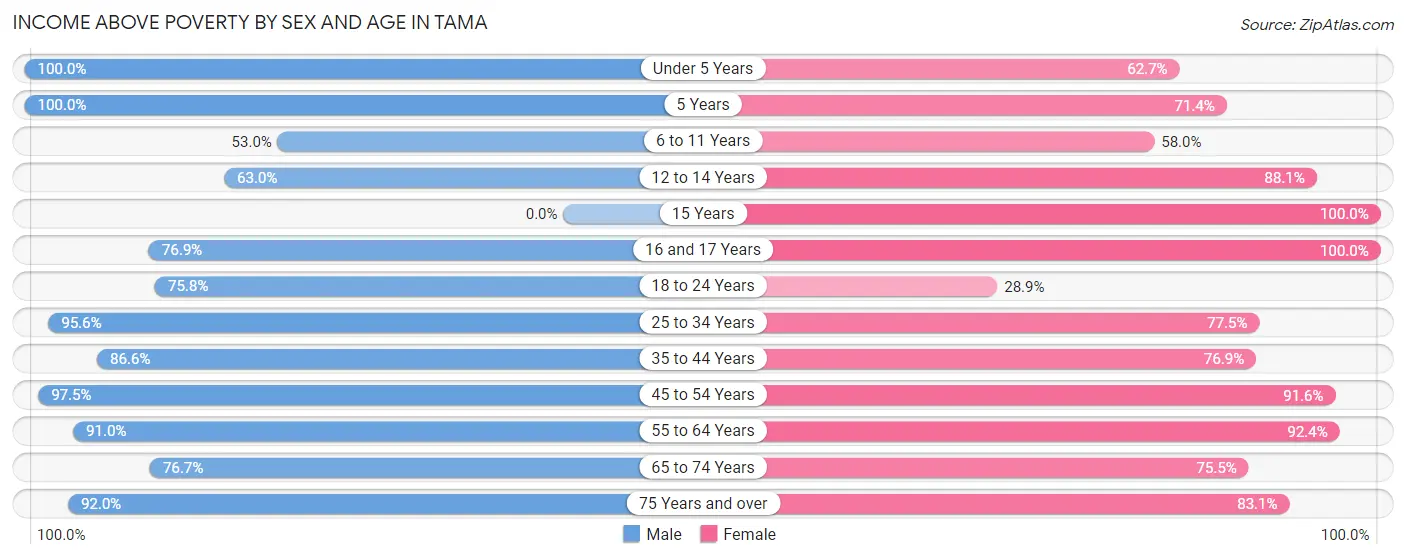
| Age Bracket | Male | Female |
| Under 5 Years | 113 (100.0%) | 47 (62.7%) |
| 5 Years | 19 (100.0%) | 30 (71.4%) |
| 6 to 11 Years | 105 (53.0%) | 105 (58.0%) |
| 12 to 14 Years | 85 (63.0%) | 89 (88.1%) |
| 15 Years | 0 (0.0%) | 19 (100.0%) |
| 16 and 17 Years | 50 (76.9%) | 24 (100.0%) |
| 18 to 24 Years | 97 (75.8%) | 28 (28.9%) |
| 25 to 34 Years | 239 (95.6%) | 179 (77.5%) |
| 35 to 44 Years | 148 (86.6%) | 183 (76.9%) |
| 45 to 54 Years | 154 (97.5%) | 109 (91.6%) |
| 55 to 64 Years | 111 (91.0%) | 85 (92.4%) |
| 65 to 74 Years | 89 (76.7%) | 74 (75.5%) |
| 75 Years and over | 80 (91.9%) | 98 (83.1%) |
| Total | 1,290 (82.6%) | 1,070 (74.6%) |
Income Below Poverty Among Married-Couple Families in Tama
The poverty statistics for married-couple families in Tama show that 4.0% or 21 of the total 521 families live below the poverty line. Families with no children have the highest poverty rate of 7.5%, comprising of 21 families. On the other hand, families with 1 or 2 children have the lowest poverty rate of 0.0%, which includes 0 families.
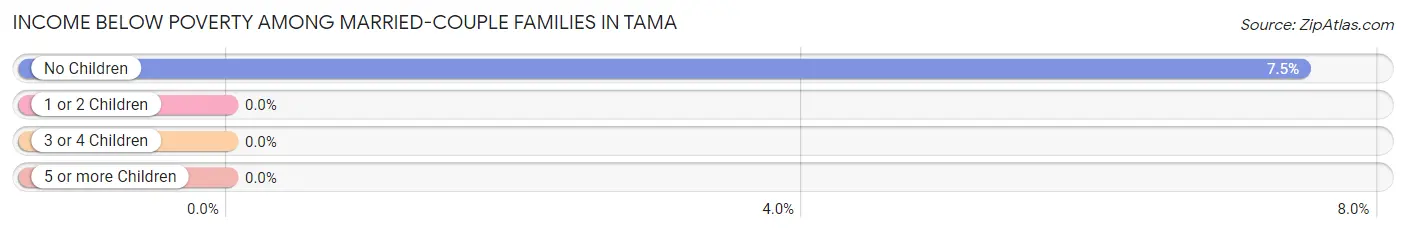
| Children | Above Poverty | Below Poverty |
| No Children | 260 (92.5%) | 21 (7.5%) |
| 1 or 2 Children | 160 (100.0%) | 0 (0.0%) |
| 3 or 4 Children | 73 (100.0%) | 0 (0.0%) |
| 5 or more Children | 7 (100.0%) | 0 (0.0%) |
| Total | 500 (96.0%) | 21 (4.0%) |
Income Below Poverty Among Single-Parent Households in Tama
According to the poverty data in Tama, 42.4% or 42 single-father households and 54.2% or 83 single-mother households are living below the poverty line. Among single-father households, those with 3 or 4 children have the highest poverty rate, with 19 households (90.5%) experiencing poverty. Likewise, among single-mother households, those with 1 or 2 children have the highest poverty rate, with 58 households (62.4%) falling below the poverty line.
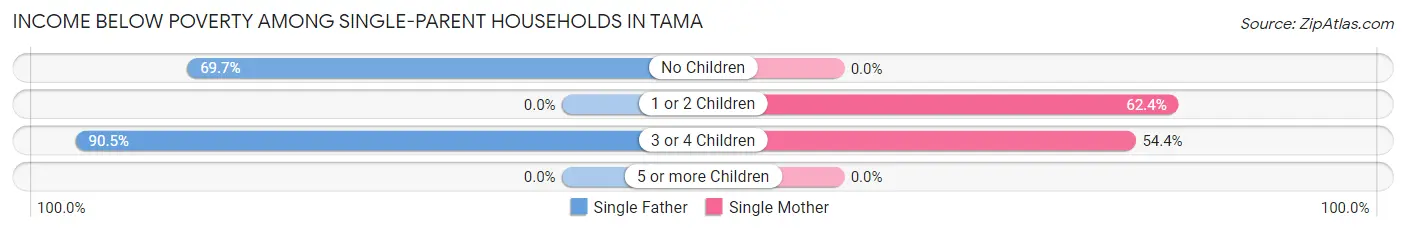
| Children | Single Father | Single Mother |
| No Children | 23 (69.7%) | 0 (0.0%) |
| 1 or 2 Children | 0 (0.0%) | 58 (62.4%) |
| 3 or 4 Children | 19 (90.5%) | 25 (54.3%) |
| 5 or more Children | 0 (0.0%) | 0 (0.0%) |
| Total | 42 (42.4%) | 83 (54.2%) |
Income Below Poverty Among Married-Couple vs Single-Parent Households in Tama
The poverty data for Tama shows that 21 of the married-couple family households (4.0%) and 125 of the single-parent households (49.6%) are living below the poverty level. Within the married-couple family households, those with no children have the highest poverty rate, with 21 households (7.5%) falling below the poverty line. Among the single-parent households, those with 3 or 4 children have the highest poverty rate, with 44 household (65.7%) living below poverty.
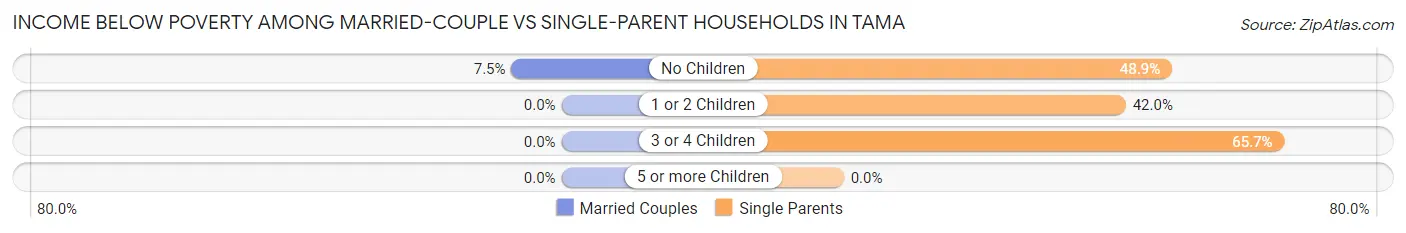
| Children | Married-Couple Families | Single-Parent Households |
| No Children | 21 (7.5%) | 23 (48.9%) |
| 1 or 2 Children | 0 (0.0%) | 58 (42.0%) |
| 3 or 4 Children | 0 (0.0%) | 44 (65.7%) |
| 5 or more Children | 0 (0.0%) | 0 (0.0%) |
| Total | 21 (4.0%) | 125 (49.6%) |
Race in Tama
The most populous races in Tama are White / Caucasian (1,999 | 65.0%), Hispanic or Latino (1,180 | 38.4%), and Two or more Races (499 | 16.2%).
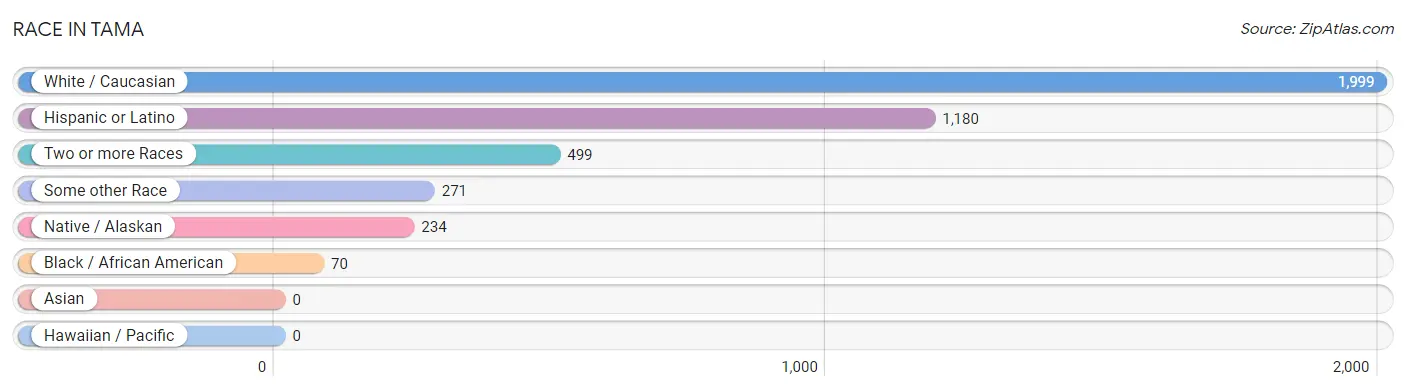
| Race | # Population | % Population |
| Asian | 0 | 0.0% |
| Black / African American | 70 | 2.3% |
| Hawaiian / Pacific | 0 | 0.0% |
| Hispanic or Latino | 1,180 | 38.4% |
| Native / Alaskan | 234 | 7.6% |
| White / Caucasian | 1,999 | 65.0% |
| Two or more Races | 499 | 16.2% |
| Some other Race | 271 | 8.8% |
| Total | 3,073 | 100.0% |
Ancestry in Tama
The most populous ancestries reported in Tama are Mexican (955 | 31.1%), German (490 | 16.0%), Irish (320 | 10.4%), Central American (205 | 6.7%), and Guatemalan (205 | 6.7%), together accounting for 70.8% of all Tama residents.
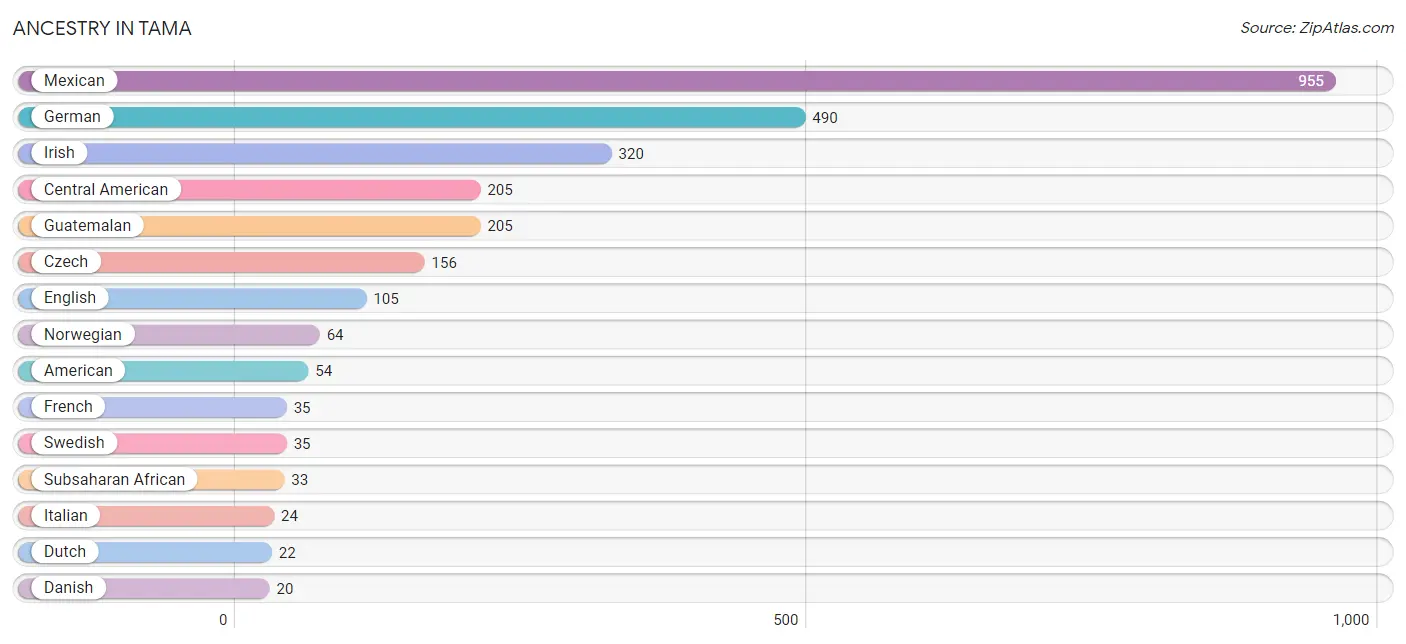
| Ancestry | # Population | % Population |
| American | 54 | 1.8% |
| Celtic | 4 | 0.1% |
| Central American | 205 | 6.7% |
| Croatian | 4 | 0.1% |
| Czech | 156 | 5.1% |
| Danish | 20 | 0.6% |
| Dutch | 22 | 0.7% |
| English | 105 | 3.4% |
| European | 2 | 0.1% |
| French | 35 | 1.1% |
| German | 490 | 16.0% |
| Guatemalan | 205 | 6.7% |
| Irish | 320 | 10.4% |
| Italian | 24 | 0.8% |
| Lithuanian | 6 | 0.2% |
| Mexican | 955 | 31.1% |
| Norwegian | 64 | 2.1% |
| Pima | 12 | 0.4% |
| Polish | 14 | 0.5% |
| Puerto Rican | 14 | 0.5% |
| Scotch-Irish | 13 | 0.4% |
| Scottish | 14 | 0.5% |
| Sioux | 6 | 0.2% |
| Subsaharan African | 33 | 1.1% |
| Swedish | 35 | 1.1% |
| Welsh | 3 | 0.1% | View All 26 Rows |
Immigrants in Tama
The most numerous immigrant groups reported in Tama came from Central America (534 | 17.4%), Latin America (534 | 17.4%), Mexico (420 | 13.7%), Guatemala (93 | 3.0%), and Africa (52 | 1.7%), together accounting for 53.2% of all Tama residents.
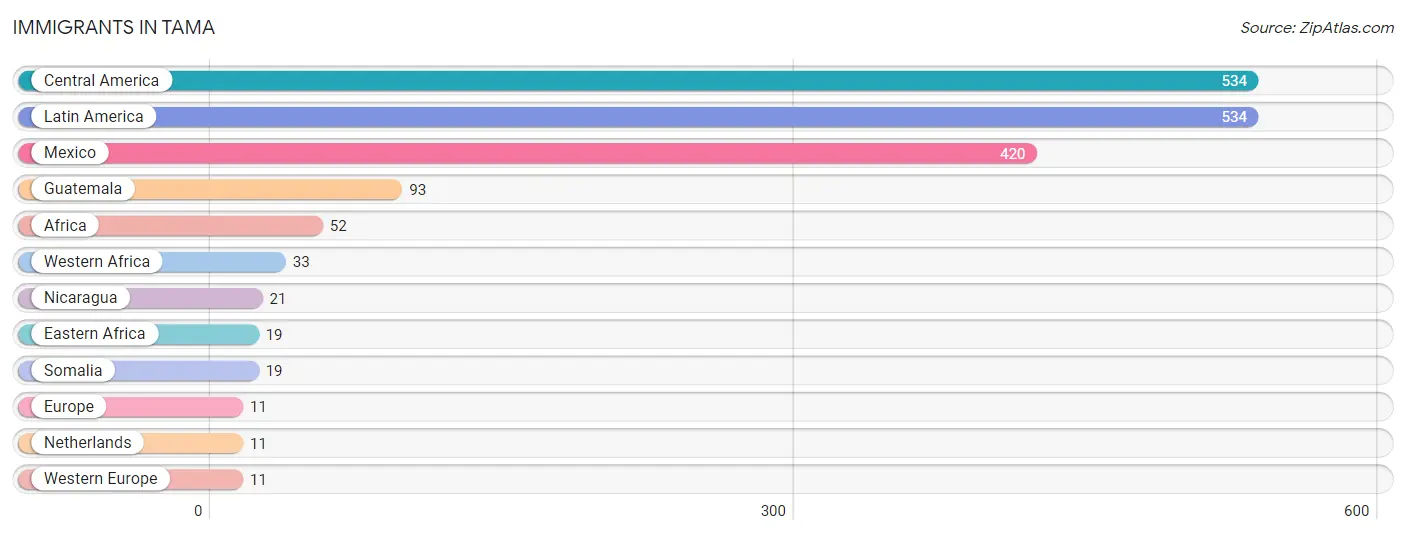
| Immigration Origin | # Population | % Population |
| Africa | 52 | 1.7% |
| Central America | 534 | 17.4% |
| Eastern Africa | 19 | 0.6% |
| Europe | 11 | 0.4% |
| Guatemala | 93 | 3.0% |
| Latin America | 534 | 17.4% |
| Mexico | 420 | 13.7% |
| Netherlands | 11 | 0.4% |
| Nicaragua | 21 | 0.7% |
| Somalia | 19 | 0.6% |
| Western Africa | 33 | 1.1% |
| Western Europe | 11 | 0.4% | View All 12 Rows |
Sex and Age in Tama
Sex and Age in Tama
The most populous age groups in Tama are 10 to 14 Years (226 | 14.2%) for men and 10 to 14 Years (203 | 13.7%) for women.
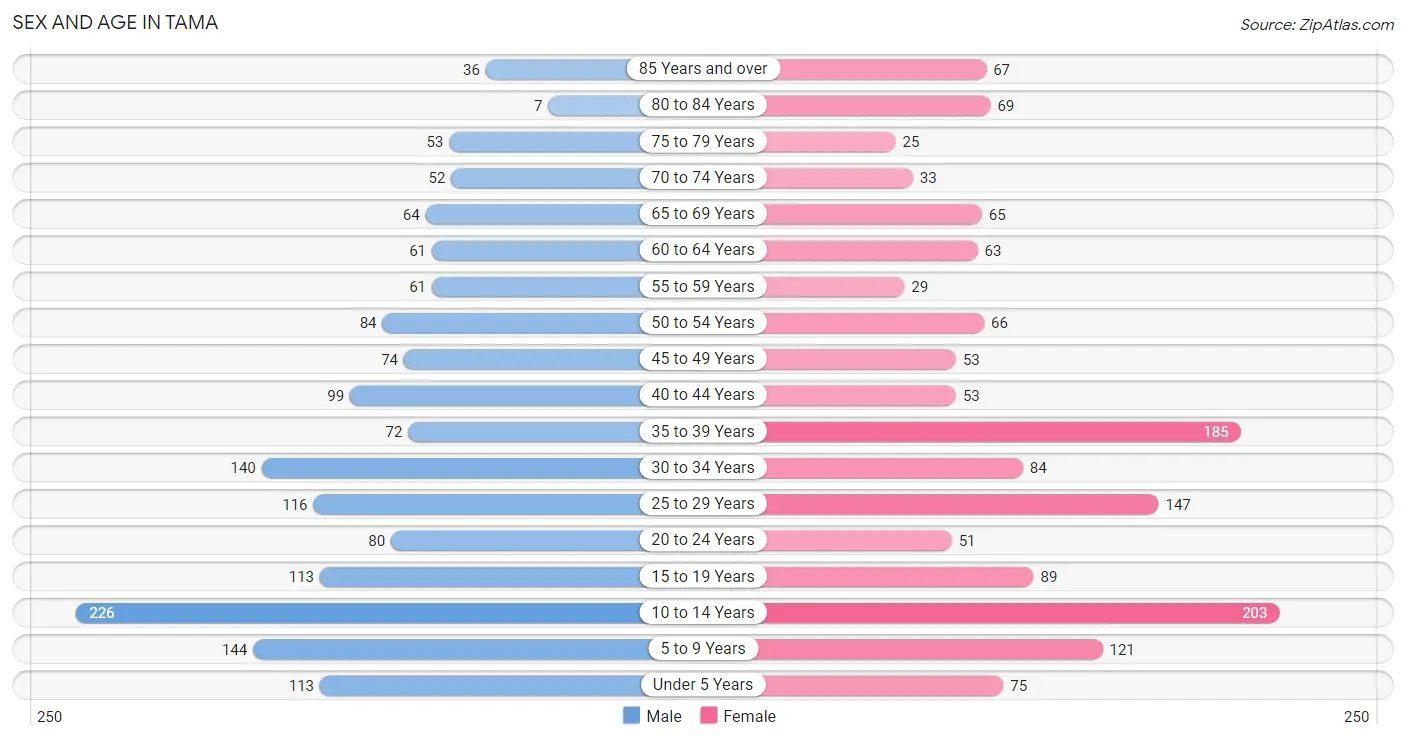
| Age Bracket | Male | Female |
| Under 5 Years | 113 (7.1%) | 75 (5.1%) |
| 5 to 9 Years | 144 (9.0%) | 121 (8.2%) |
| 10 to 14 Years | 226 (14.2%) | 203 (13.7%) |
| 15 to 19 Years | 113 (7.1%) | 89 (6.0%) |
| 20 to 24 Years | 80 (5.0%) | 51 (3.5%) |
| 25 to 29 Years | 116 (7.3%) | 147 (10.0%) |
| 30 to 34 Years | 140 (8.8%) | 84 (5.7%) |
| 35 to 39 Years | 72 (4.5%) | 185 (12.5%) |
| 40 to 44 Years | 99 (6.2%) | 53 (3.6%) |
| 45 to 49 Years | 74 (4.6%) | 53 (3.6%) |
| 50 to 54 Years | 84 (5.3%) | 66 (4.5%) |
| 55 to 59 Years | 61 (3.8%) | 29 (2.0%) |
| 60 to 64 Years | 61 (3.8%) | 63 (4.3%) |
| 65 to 69 Years | 64 (4.0%) | 65 (4.4%) |
| 70 to 74 Years | 52 (3.3%) | 33 (2.2%) |
| 75 to 79 Years | 53 (3.3%) | 25 (1.7%) |
| 80 to 84 Years | 7 (0.4%) | 69 (4.7%) |
| 85 Years and over | 36 (2.3%) | 67 (4.5%) |
| Total | 1,595 (100.0%) | 1,478 (100.0%) |
Families and Households in Tama
Median Family Size in Tama
The median family size in Tama is 3.23 persons per family, with single male/father families (99 | 12.8%) accounting for the largest median family size of 3.85 persons per family. On the other hand, married-couple families (521 | 67.4%) represent the smallest median family size with 3.08 persons per family.
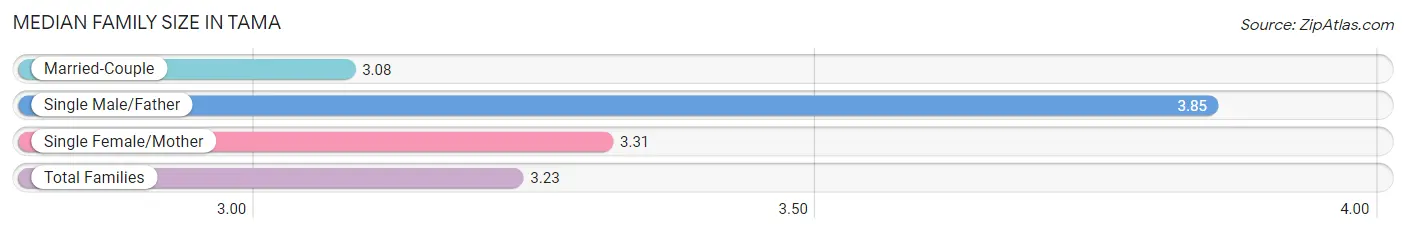
| Family Type | # Families | Family Size |
| Married-Couple | 521 (67.4%) | 3.08 |
| Single Male/Father | 99 (12.8%) | 3.85 |
| Single Female/Mother | 153 (19.8%) | 3.31 |
| Total Families | 773 (100.0%) | 3.23 |
Median Household Size in Tama
The median household size in Tama is 2.82 persons per household, with single male/father households (99 | 9.3%) accounting for the largest median household size of 4.8 persons per household. non-family households (295 | 27.6%) represent the smallest median household size with 1.36 persons per household.
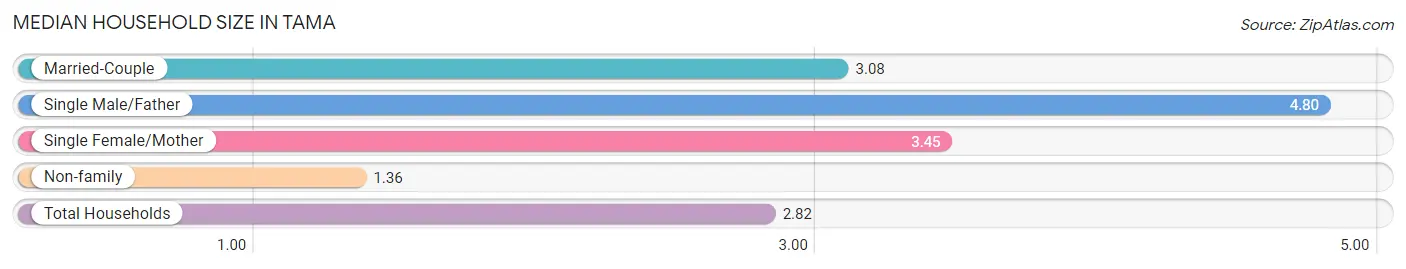
| Household Type | # Households | Household Size |
| Married-Couple | 521 (48.8%) | 3.08 |
| Single Male/Father | 99 (9.3%) | 4.80 |
| Single Female/Mother | 153 (14.3%) | 3.45 |
| Non-family | 295 (27.6%) | 1.36 |
| Total Households | 1,068 (100.0%) | 2.82 |
Household Size by Marriage Status in Tama
Out of a total of 1,068 households in Tama, 773 (72.4%) are family households, while 295 (27.6%) are nonfamily households. The most numerous type of family households are 2-person households, comprising 296, and the most common type of nonfamily households are 1-person households, comprising 230.
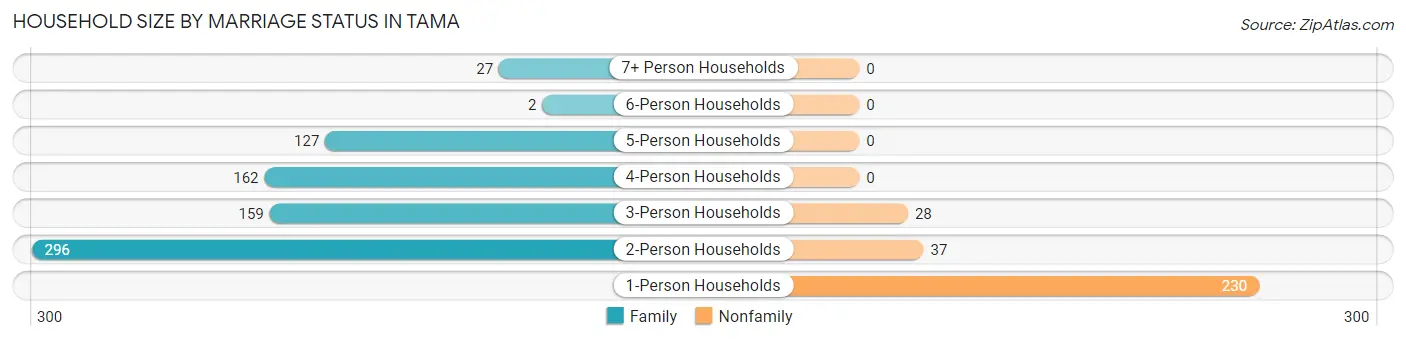
| Household Size | Family Households | Nonfamily Households |
| 1-Person Households | - | 230 (21.5%) |
| 2-Person Households | 296 (27.7%) | 37 (3.5%) |
| 3-Person Households | 159 (14.9%) | 28 (2.6%) |
| 4-Person Households | 162 (15.2%) | 0 (0.0%) |
| 5-Person Households | 127 (11.9%) | 0 (0.0%) |
| 6-Person Households | 2 (0.2%) | 0 (0.0%) |
| 7+ Person Households | 27 (2.5%) | 0 (0.0%) |
| Total | 773 (72.4%) | 295 (27.6%) |
Female Fertility in Tama
Fertility by Age in Tama
Average fertility rate in Tama is 106.0 births per 1,000 women. Women in the age bracket of 20 to 34 years have the highest fertility rate with 234.0 births per 1,000 women. Women in the age bracket of 20 to 34 years acount for 91.7% of all women with births.
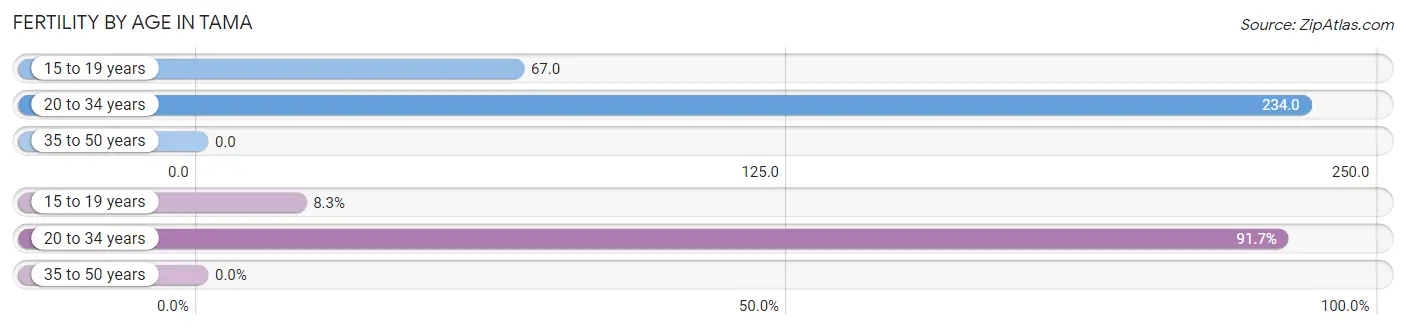
| Age Bracket | Women with Births | Births / 1,000 Women |
| 15 to 19 years | 6 (8.3%) | 67.0 |
| 20 to 34 years | 66 (91.7%) | 234.0 |
| 35 to 50 years | 0 (0.0%) | 0.0 |
| Total | 72 (100.0%) | 106.0 |
Fertility by Age by Marriage Status in Tama
79.2% of women with births (72) in Tama are married. The highest percentage of unmarried women with births falls into 15 to 19 years age bracket with 100.0% of them unmarried at the time of birth, while the lowest percentage of unmarried women with births belong to 20 to 34 years age bracket with 13.6% of them unmarried.
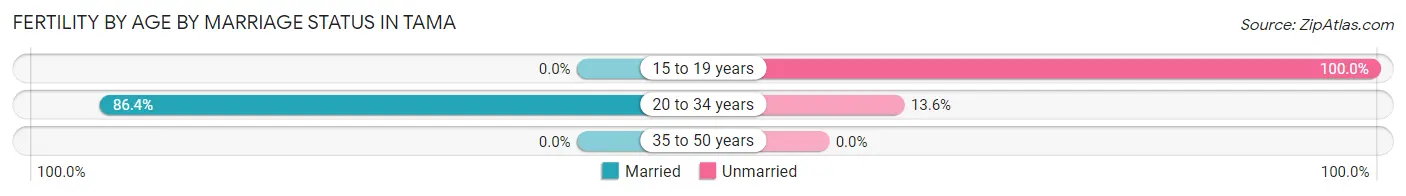
| Age Bracket | Married | Unmarried |
| 15 to 19 years | 0 (0.0%) | 6 (100.0%) |
| 20 to 34 years | 57 (86.4%) | 9 (13.6%) |
| 35 to 50 years | 0 (0.0%) | 0 (0.0%) |
| Total | 57 (79.2%) | 15 (20.8%) |
Fertility by Education in Tama
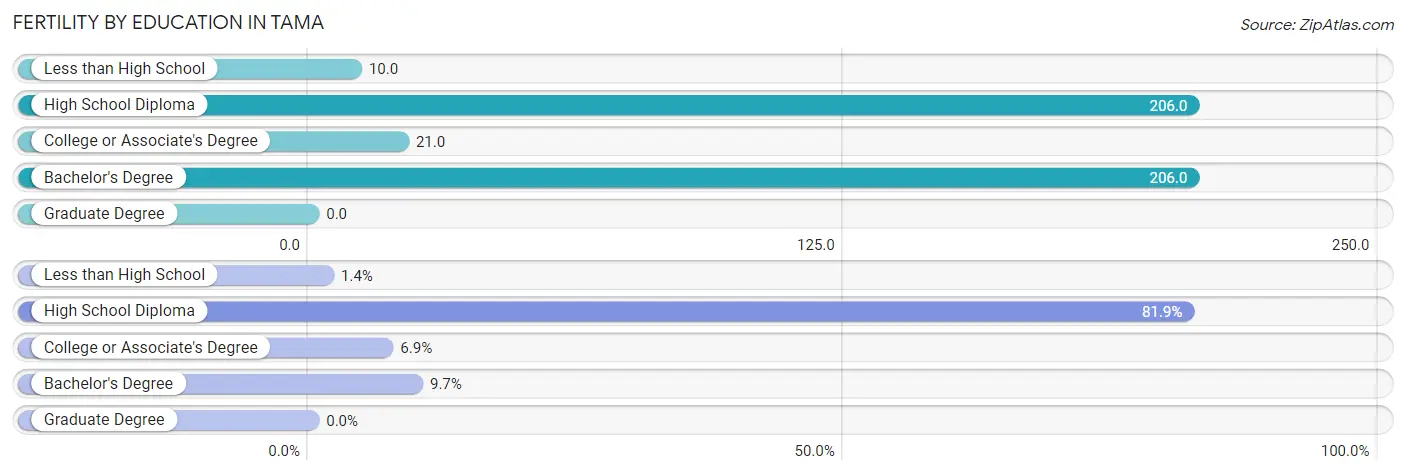
| Educational Attainment | Women with Births | Births / 1,000 Women |
| Less than High School | 1 (1.4%) | 10.0 |
| High School Diploma | 59 (81.9%) | 206.0 |
| College or Associate's Degree | 5 (6.9%) | 21.0 |
| Bachelor's Degree | 7 (9.7%) | 206.0 |
| Graduate Degree | 0 (0.0%) | 0.0 |
| Total | 72 (100.0%) | 106.0 |
Fertility by Education by Marriage Status in Tama
20.8% of women with births in Tama are unmarried. Women with the educational attainment of college or associate's degree are most likely to be married with 100.0% of them married at childbirth, while women with the educational attainment of less than high school are least likely to be married with 100.0% of them unmarried at childbirth.
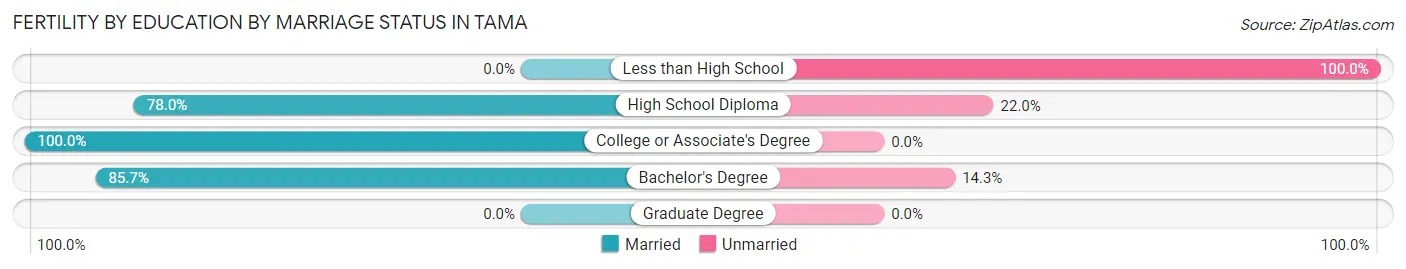
| Educational Attainment | Married | Unmarried |
| Less than High School | 0 (0.0%) | 1 (100.0%) |
| High School Diploma | 46 (78.0%) | 13 (22.0%) |
| College or Associate's Degree | 5 (100.0%) | 0 (0.0%) |
| Bachelor's Degree | 6 (85.7%) | 1 (14.3%) |
| Graduate Degree | 0 (0.0%) | 0 (0.0%) |
| Total | 57 (79.2%) | 15 (20.8%) |
Employment Characteristics in Tama
Employment by Class of Employer in Tama
Among the 1,262 employed individuals in Tama, private company employees (1,021 | 80.9%), local government employees (109 | 8.6%), and not-for-profit organizations (54 | 4.3%) make up the most common classes of employment.
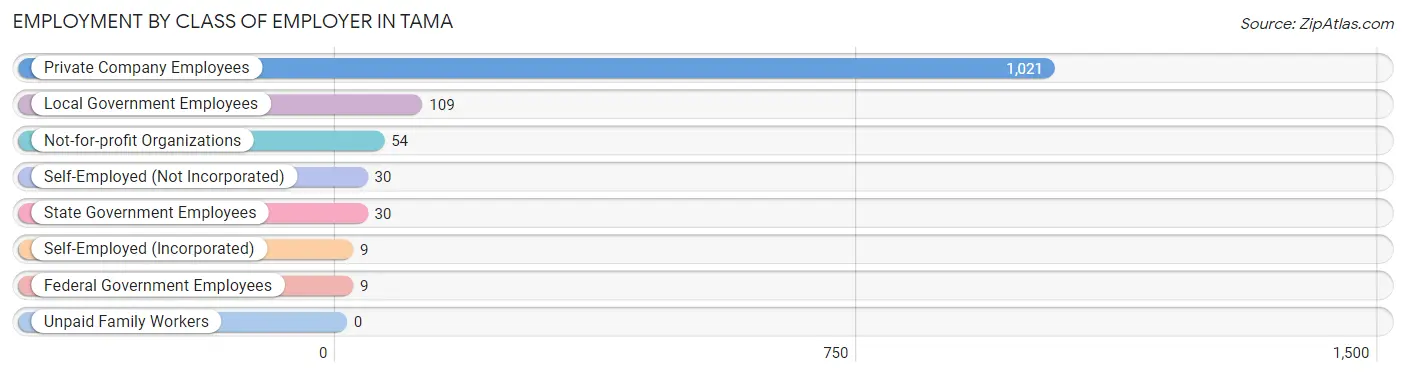
| Employer Class | # Employees | % Employees |
| Private Company Employees | 1,021 | 80.9% |
| Self-Employed (Incorporated) | 9 | 0.7% |
| Self-Employed (Not Incorporated) | 30 | 2.4% |
| Not-for-profit Organizations | 54 | 4.3% |
| Local Government Employees | 109 | 8.6% |
| State Government Employees | 30 | 2.4% |
| Federal Government Employees | 9 | 0.7% |
| Unpaid Family Workers | 0 | 0.0% |
| Total | 1,262 | 100.0% |
Employment Status by Age in Tama
According to the labor force statistics for Tama, out of the total population over 16 years of age (2,172), 64.0% or 1,390 individuals are in the labor force, with 7.7% or 107 of them unemployed. The age group with the highest labor force participation rate is 30 to 34 years, with 92.0% or 206 individuals in the labor force. Within the labor force, the 65 to 74 years age range has the highest percentage of unemployed individuals, with 19.0% or 16 of them being unemployed.
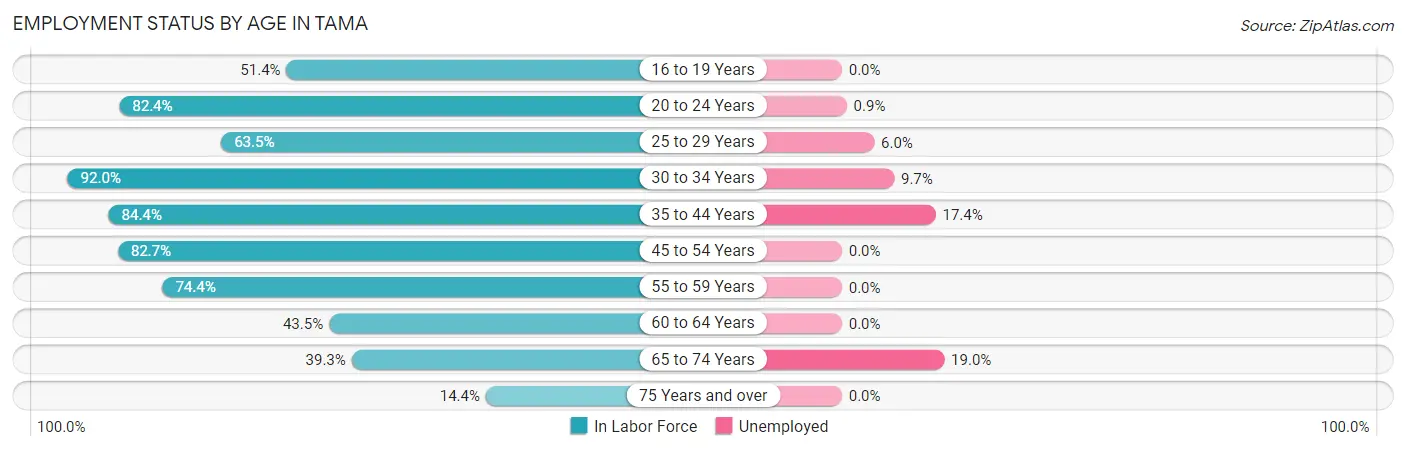
| Age Bracket | In Labor Force | Unemployed |
| 16 to 19 Years | 94 (51.4%) | 0 (0.0%) |
| 20 to 24 Years | 108 (82.4%) | 1 (0.9%) |
| 25 to 29 Years | 167 (63.5%) | 10 (6.0%) |
| 30 to 34 Years | 206 (92.0%) | 20 (9.7%) |
| 35 to 44 Years | 345 (84.4%) | 60 (17.4%) |
| 45 to 54 Years | 229 (82.7%) | 0 (0.0%) |
| 55 to 59 Years | 67 (74.4%) | 0 (0.0%) |
| 60 to 64 Years | 54 (43.5%) | 0 (0.0%) |
| 65 to 74 Years | 84 (39.3%) | 16 (19.0%) |
| 75 Years and over | 37 (14.4%) | 0 (0.0%) |
| Total | 1,390 (64.0%) | 107 (7.7%) |
Employment Status by Educational Attainment in Tama
According to labor force statistics for Tama, 77.0% of individuals (1,068) out of the total population between 25 and 64 years of age (1,387) are in the labor force, with 8.4% or 90 of them being unemployed. The group with the highest labor force participation rate are those with the educational attainment of college / associate degree, with 83.1% or 334 individuals in the labor force. Within the labor force, individuals with less than high school education have the highest percentage of unemployment, with 25.7% or 61 of them being unemployed.
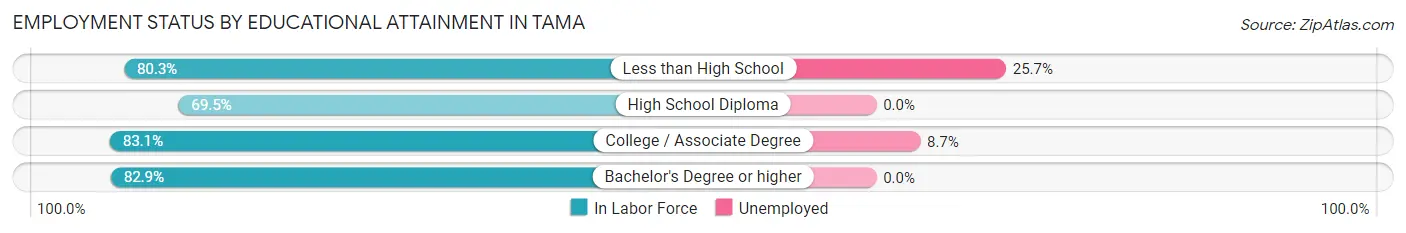
| Educational Attainment | In Labor Force | Unemployed |
| Less than High School | 237 (80.3%) | 76 (25.7%) |
| High School Diploma | 390 (69.5%) | 0 (0.0%) |
| College / Associate Degree | 334 (83.1%) | 35 (8.7%) |
| Bachelor's Degree or higher | 107 (82.9%) | 0 (0.0%) |
| Total | 1,068 (77.0%) | 117 (8.4%) |
Employment Occupations by Sex in Tama
Management, Business, Science and Arts Occupations
The most common Management, Business, Science and Arts occupations in Tama are Community & Social Service (73 | 5.7%), Health Diagnosing & Treating (72 | 5.6%), Education Instruction & Library (65 | 5.1%), Management (49 | 3.8%), and Health Technologists (38 | 3.0%).
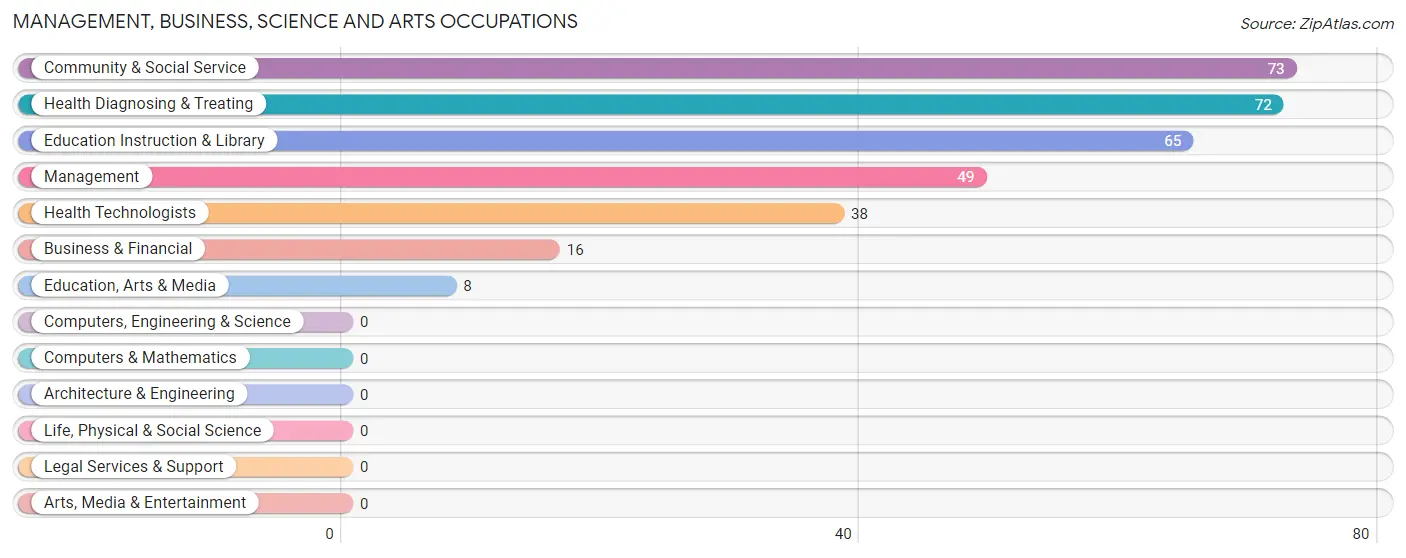
Management, Business, Science and Arts Occupations by Sex
Within the Management, Business, Science and Arts occupations in Tama, the most male-oriented occupations are Education, Arts & Media (100.0%), Management (59.2%), and Business & Financial (50.0%), while the most female-oriented occupations are Health Diagnosing & Treating (86.1%), Health Technologists (73.7%), and Education Instruction & Library (63.1%).

| Occupation | Male | Female |
| Management | 29 (59.2%) | 20 (40.8%) |
| Business & Financial | 8 (50.0%) | 8 (50.0%) |
| Computers, Engineering & Science | 0 (0.0%) | 0 (0.0%) |
| Computers & Mathematics | 0 (0.0%) | 0 (0.0%) |
| Architecture & Engineering | 0 (0.0%) | 0 (0.0%) |
| Life, Physical & Social Science | 0 (0.0%) | 0 (0.0%) |
| Community & Social Service | 32 (43.8%) | 41 (56.2%) |
| Education, Arts & Media | 8 (100.0%) | 0 (0.0%) |
| Legal Services & Support | 0 (0.0%) | 0 (0.0%) |
| Education Instruction & Library | 24 (36.9%) | 41 (63.1%) |
| Arts, Media & Entertainment | 0 (0.0%) | 0 (0.0%) |
| Health Diagnosing & Treating | 10 (13.9%) | 62 (86.1%) |
| Health Technologists | 10 (26.3%) | 28 (73.7%) |
| Total (Category) | 79 (37.6%) | 131 (62.4%) |
| Total (Overall) | 768 (59.8%) | 516 (40.2%) |
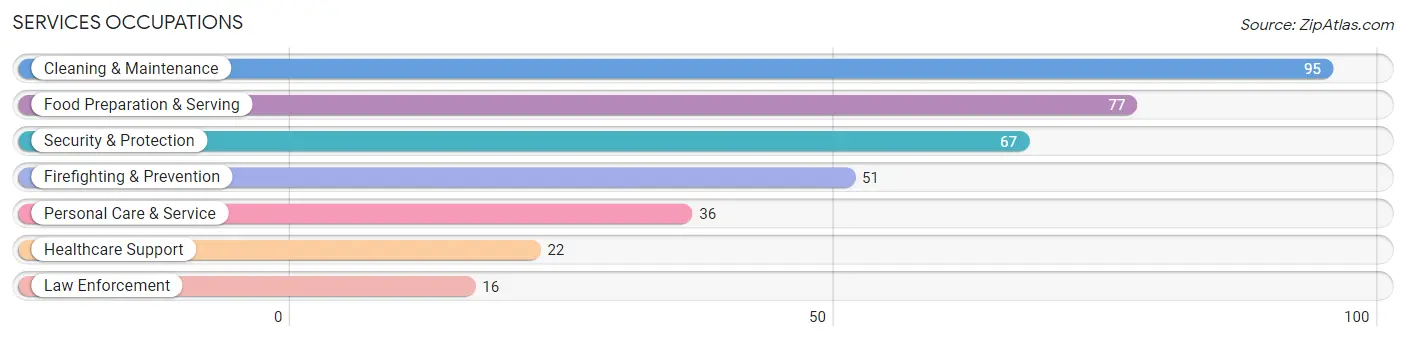
Services Occupations
The most common Services occupations in Tama are Cleaning & Maintenance (95 | 7.4%), Food Preparation & Serving (77 | 6.0%), Security & Protection (67 | 5.2%), Firefighting & Prevention (51 | 4.0%), and Personal Care & Service (36 | 2.8%).
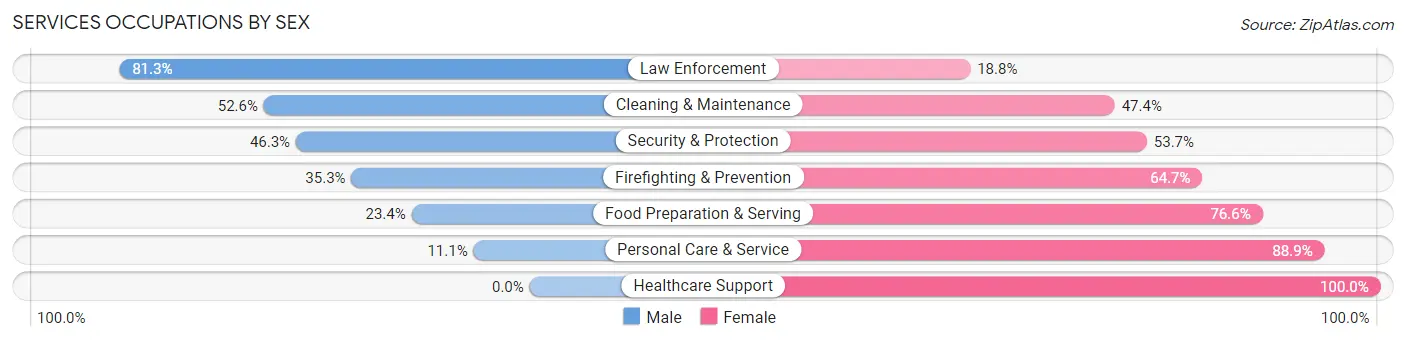
Services Occupations by Sex
Within the Services occupations in Tama, the most male-oriented occupations are Law Enforcement (81.2%), Cleaning & Maintenance (52.6%), and Security & Protection (46.3%), while the most female-oriented occupations are Healthcare Support (100.0%), Personal Care & Service (88.9%), and Food Preparation & Serving (76.6%).
| Occupation | Male | Female |
| Healthcare Support | 0 (0.0%) | 22 (100.0%) |
| Security & Protection | 31 (46.3%) | 36 (53.7%) |
| Firefighting & Prevention | 18 (35.3%) | 33 (64.7%) |
| Law Enforcement | 13 (81.2%) | 3 (18.8%) |
| Food Preparation & Serving | 18 (23.4%) | 59 (76.6%) |
| Cleaning & Maintenance | 50 (52.6%) | 45 (47.4%) |
| Personal Care & Service | 4 (11.1%) | 32 (88.9%) |
| Total (Category) | 103 (34.7%) | 194 (65.3%) |
| Total (Overall) | 768 (59.8%) | 516 (40.2%) |
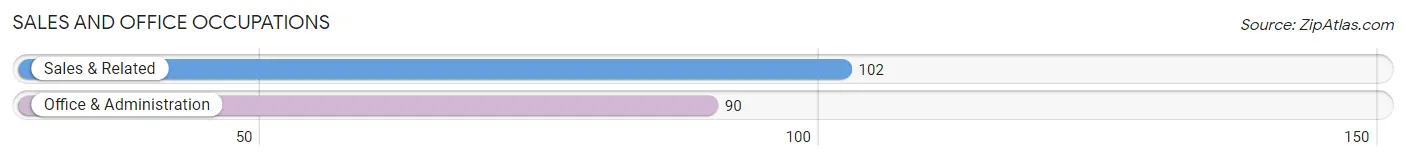
Sales and Office Occupations
The most common Sales and Office occupations in Tama are Sales & Related (102 | 7.9%), and Office & Administration (90 | 7.0%).
Sales and Office Occupations by Sex
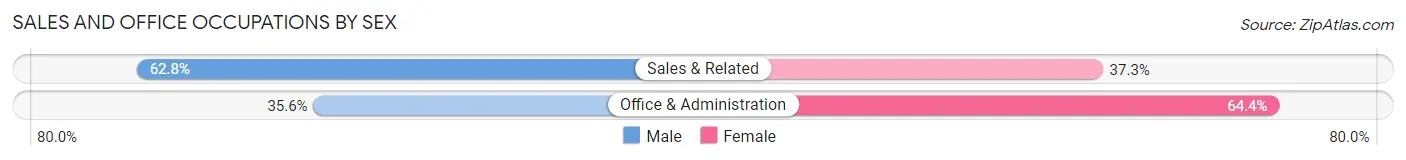
| Occupation | Male | Female |
| Sales & Related | 64 (62.7%) | 38 (37.2%) |
| Office & Administration | 32 (35.6%) | 58 (64.4%) |
| Total (Category) | 96 (50.0%) | 96 (50.0%) |
| Total (Overall) | 768 (59.8%) | 516 (40.2%) |
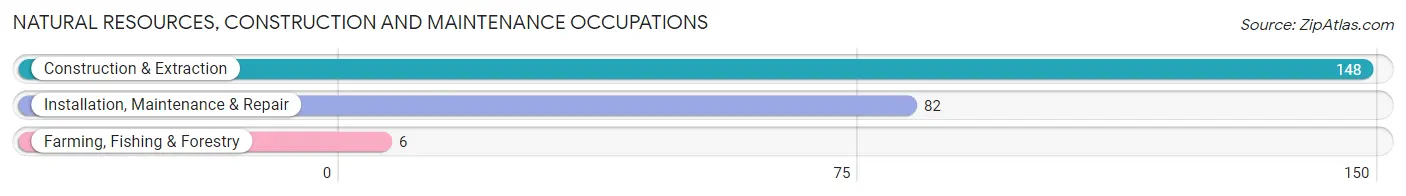
Natural Resources, Construction and Maintenance Occupations
The most common Natural Resources, Construction and Maintenance occupations in Tama are Construction & Extraction (148 | 11.5%), Installation, Maintenance & Repair (82 | 6.4%), and Farming, Fishing & Forestry (6 | 0.5%).
Natural Resources, Construction and Maintenance Occupations by Sex
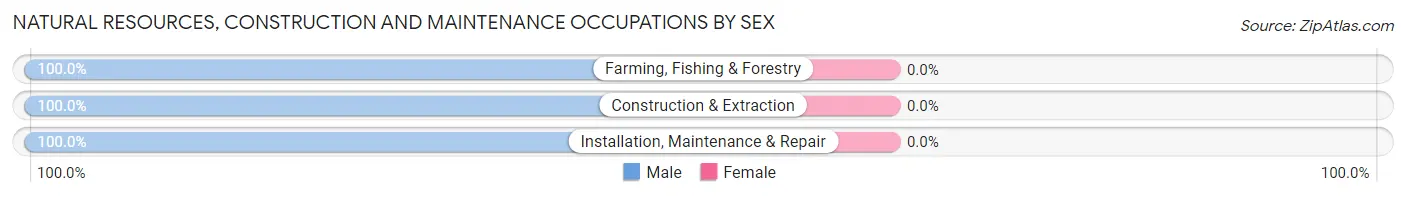
| Occupation | Male | Female |
| Farming, Fishing & Forestry | 6 (100.0%) | 0 (0.0%) |
| Construction & Extraction | 148 (100.0%) | 0 (0.0%) |
| Installation, Maintenance & Repair | 82 (100.0%) | 0 (0.0%) |
| Total (Category) | 236 (100.0%) | 0 (0.0%) |
| Total (Overall) | 768 (59.8%) | 516 (40.2%) |
Production, Transportation and Moving Occupations
The most common Production, Transportation and Moving occupations in Tama are Production (259 | 20.2%), Material Moving (47 | 3.7%), and Transportation (43 | 3.4%).
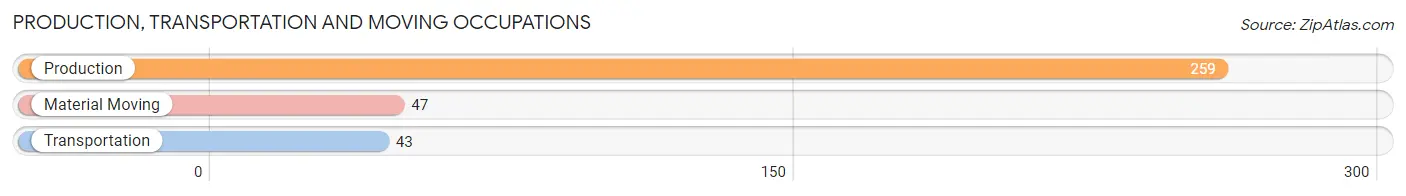
Production, Transportation and Moving Occupations by Sex
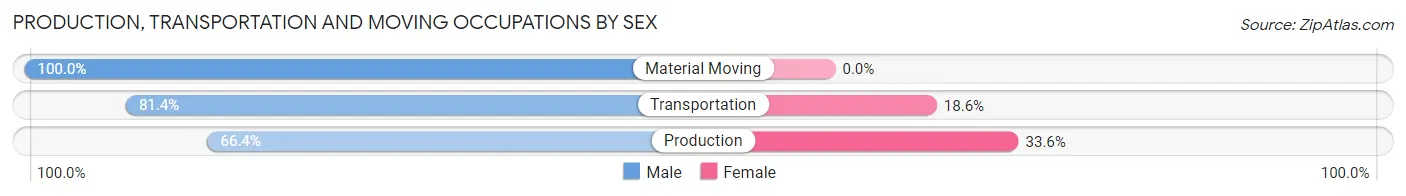
| Occupation | Male | Female |
| Production | 172 (66.4%) | 87 (33.6%) |
| Transportation | 35 (81.4%) | 8 (18.6%) |
| Material Moving | 47 (100.0%) | 0 (0.0%) |
| Total (Category) | 254 (72.8%) | 95 (27.2%) |
| Total (Overall) | 768 (59.8%) | 516 (40.2%) |
Employment Industries by Sex in Tama
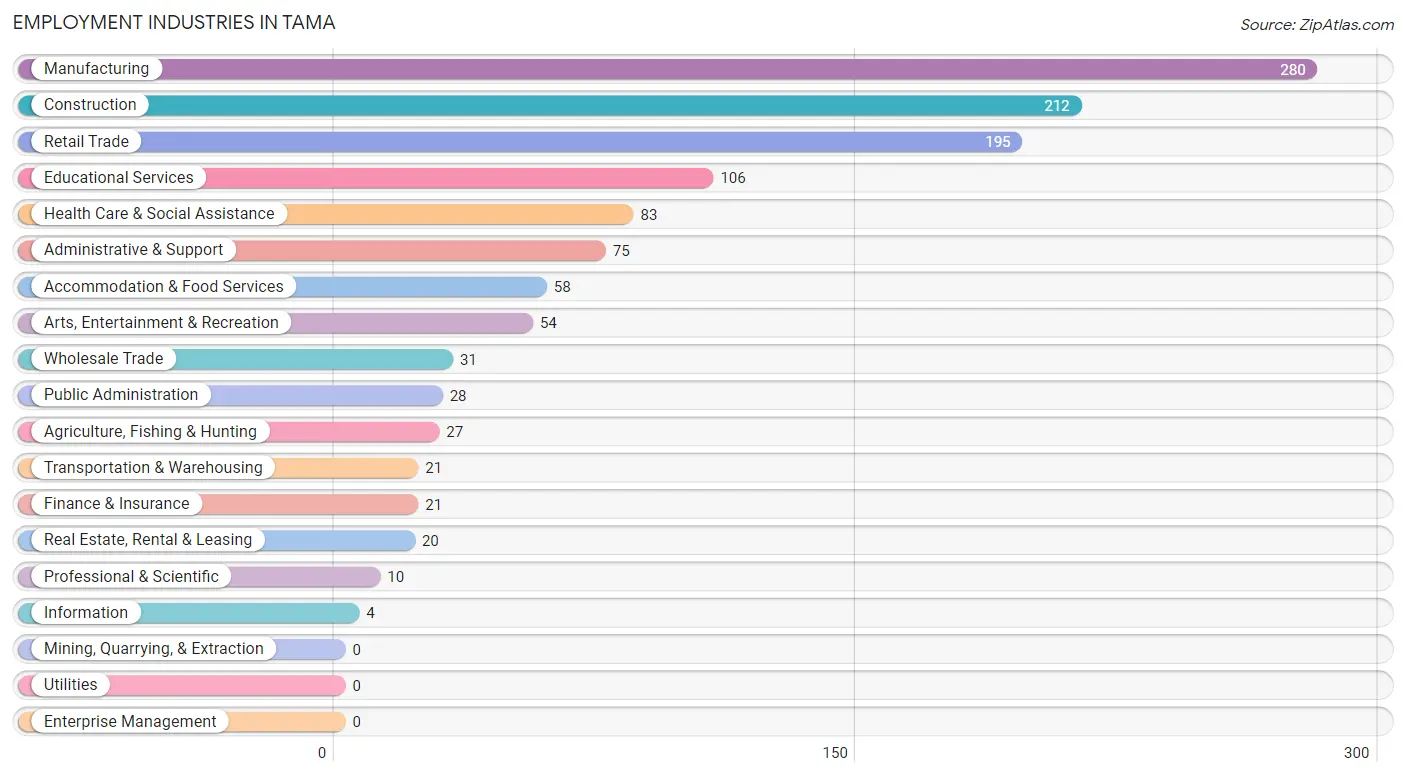
Employment Industries in Tama
The major employment industries in Tama include Manufacturing (280 | 21.8%), Construction (212 | 16.5%), Retail Trade (195 | 15.2%), Educational Services (106 | 8.3%), and Health Care & Social Assistance (83 | 6.5%).
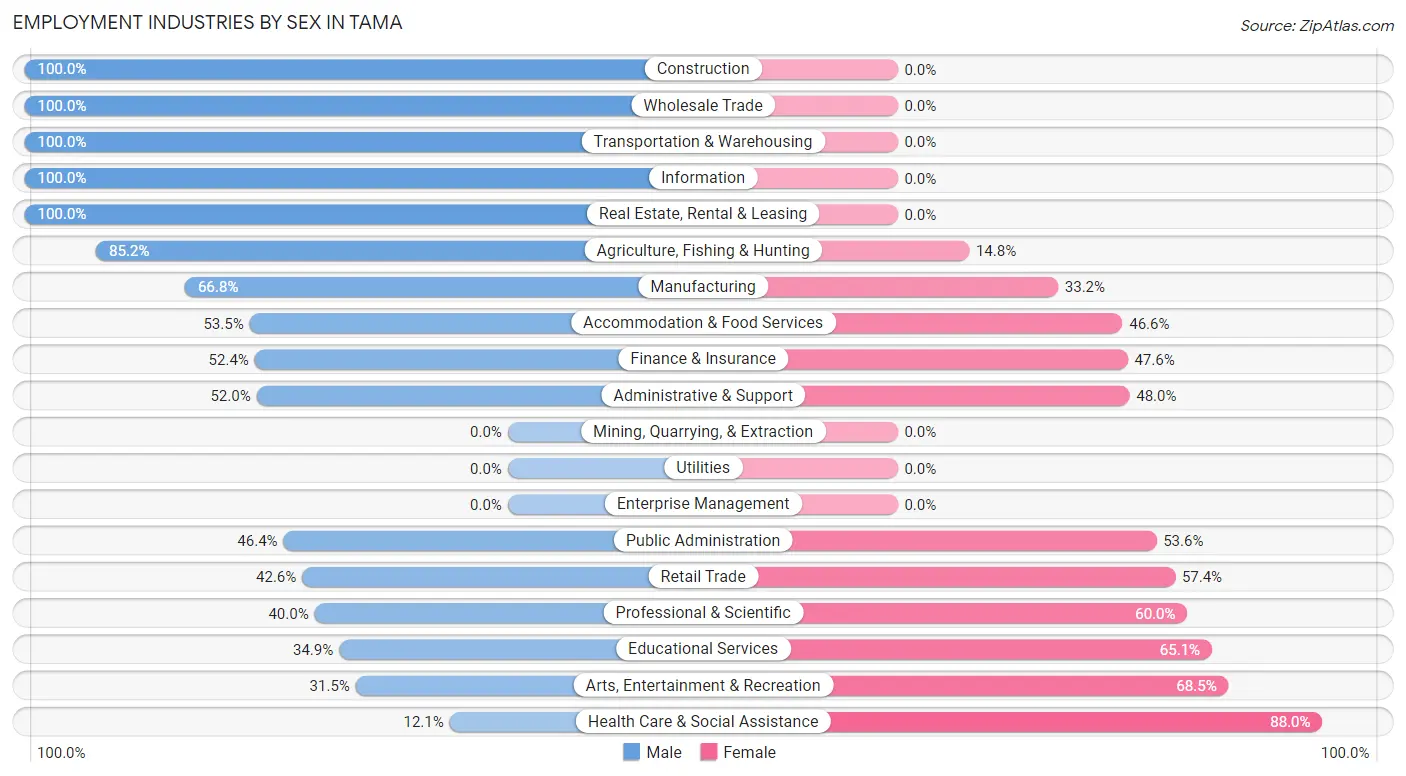
Employment Industries by Sex in Tama
The Tama industries that see more men than women are Construction (100.0%), Wholesale Trade (100.0%), and Transportation & Warehousing (100.0%), whereas the industries that tend to have a higher number of women are Health Care & Social Assistance (87.9%), Arts, Entertainment & Recreation (68.5%), and Educational Services (65.1%).
| Industry | Male | Female |
| Agriculture, Fishing & Hunting | 23 (85.2%) | 4 (14.8%) |
| Mining, Quarrying, & Extraction | 0 (0.0%) | 0 (0.0%) |
| Construction | 212 (100.0%) | 0 (0.0%) |
| Manufacturing | 187 (66.8%) | 93 (33.2%) |
| Wholesale Trade | 31 (100.0%) | 0 (0.0%) |
| Retail Trade | 83 (42.6%) | 112 (57.4%) |
| Transportation & Warehousing | 21 (100.0%) | 0 (0.0%) |
| Utilities | 0 (0.0%) | 0 (0.0%) |
| Information | 4 (100.0%) | 0 (0.0%) |
| Finance & Insurance | 11 (52.4%) | 10 (47.6%) |
| Real Estate, Rental & Leasing | 20 (100.0%) | 0 (0.0%) |
| Professional & Scientific | 4 (40.0%) | 6 (60.0%) |
| Enterprise Management | 0 (0.0%) | 0 (0.0%) |
| Administrative & Support | 39 (52.0%) | 36 (48.0%) |
| Educational Services | 37 (34.9%) | 69 (65.1%) |
| Health Care & Social Assistance | 10 (12.0%) | 73 (87.9%) |
| Arts, Entertainment & Recreation | 17 (31.5%) | 37 (68.5%) |
| Accommodation & Food Services | 31 (53.4%) | 27 (46.6%) |
| Public Administration | 13 (46.4%) | 15 (53.6%) |
| Total | 768 (59.8%) | 516 (40.2%) |
Education in Tama
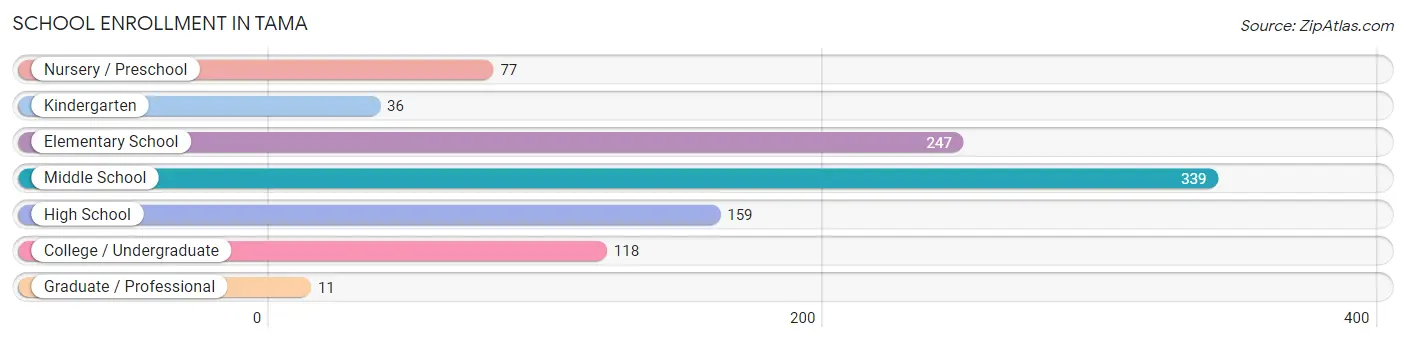
School Enrollment in Tama
The most common levels of schooling among the 987 students in Tama are middle school (339 | 34.4%), elementary school (247 | 25.0%), and high school (159 | 16.1%).
| School Level | # Students | % Students |
| Nursery / Preschool | 77 | 7.8% |
| Kindergarten | 36 | 3.6% |
| Elementary School | 247 | 25.0% |
| Middle School | 339 | 34.4% |
| High School | 159 | 16.1% |
| College / Undergraduate | 118 | 12.0% |
| Graduate / Professional | 11 | 1.1% |
| Total | 987 | 100.0% |
School Enrollment by Age by Funding Source in Tama
Out of a total of 987 students who are enrolled in schools in Tama, 134 (13.6%) attend a private institution, while the remaining 853 (86.4%) are enrolled in public schools. The age group of 25 to 34 year olds has the highest likelihood of being enrolled in private schools, with 15 (65.2% in the age bracket) enrolled. Conversely, the age group of 3 to 4 year olds has the lowest likelihood of being enrolled in a private school, with 36 (100.0% in the age bracket) attending a public institution.
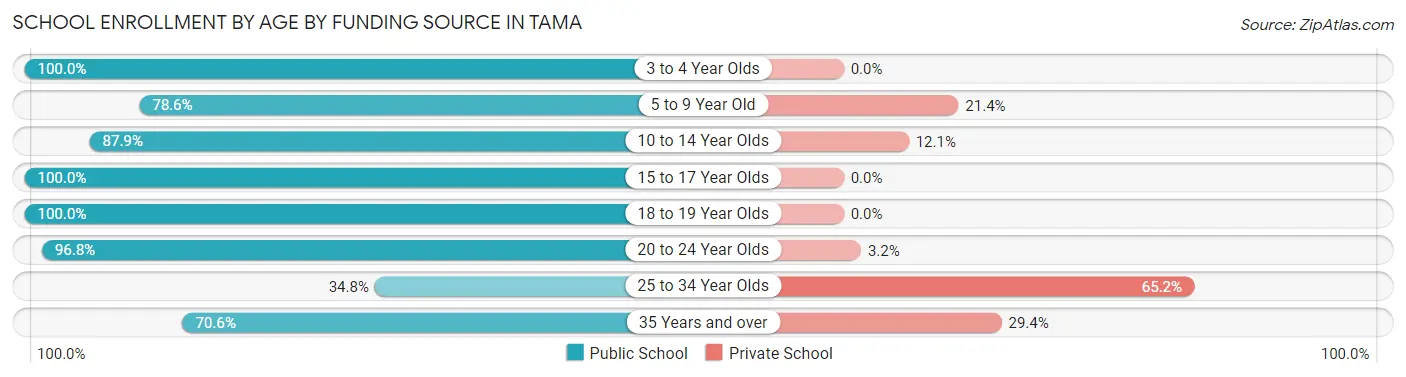
| Age Bracket | Public School | Private School |
| 3 to 4 Year Olds | 36 (100.0%) | 0 (0.0%) |
| 5 to 9 Year Old | 206 (78.6%) | 56 (21.4%) |
| 10 to 14 Year Olds | 377 (87.9%) | 52 (12.1%) |
| 15 to 17 Year Olds | 108 (100.0%) | 0 (0.0%) |
| 18 to 19 Year Olds | 64 (100.0%) | 0 (0.0%) |
| 20 to 24 Year Olds | 30 (96.8%) | 1 (3.2%) |
| 25 to 34 Year Olds | 8 (34.8%) | 15 (65.2%) |
| 35 Years and over | 24 (70.6%) | 10 (29.4%) |
| Total | 853 (86.4%) | 134 (13.6%) |
Educational Attainment by Field of Study in Tama
Education (141 | 58.3%), bio, nature & agricultural (24 | 9.9%), science & technology (20 | 8.3%), arts & humanities (20 | 8.3%), and business (15 | 6.2%) are the most common fields of study among 242 individuals in Tama who have obtained a bachelor's degree or higher.
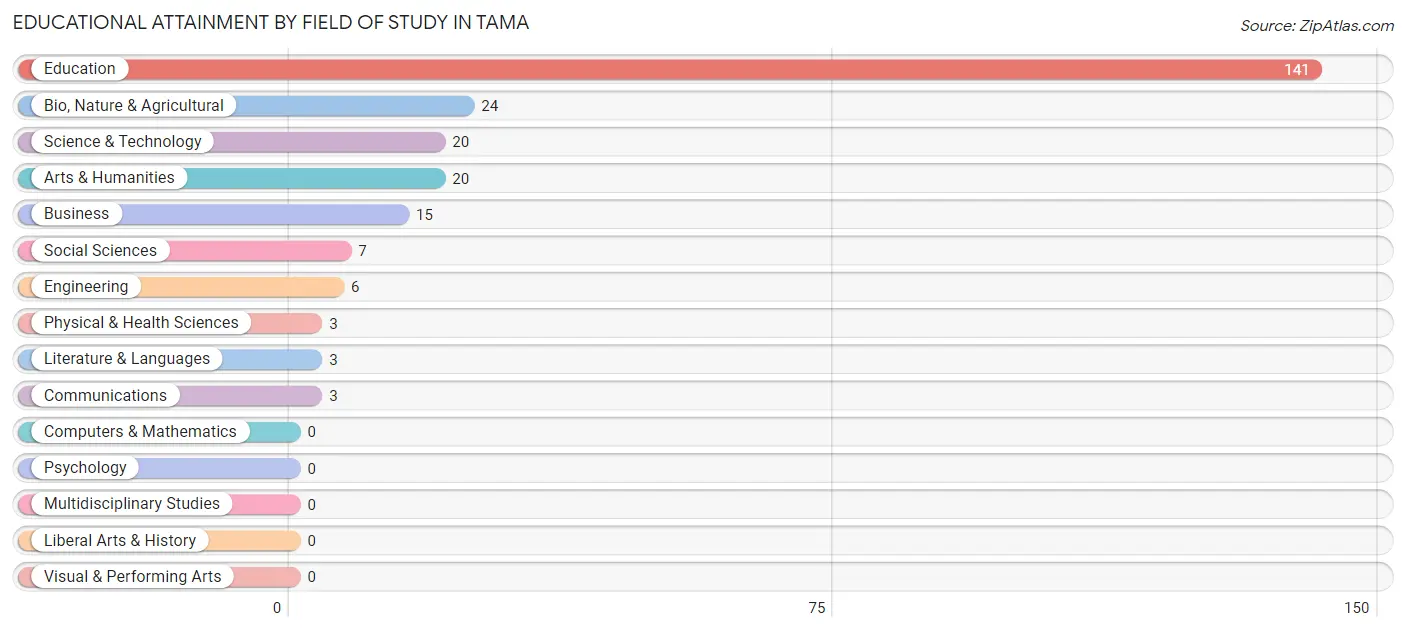
| Field of Study | # Graduates | % Graduates |
| Computers & Mathematics | 0 | 0.0% |
| Bio, Nature & Agricultural | 24 | 9.9% |
| Physical & Health Sciences | 3 | 1.2% |
| Psychology | 0 | 0.0% |
| Social Sciences | 7 | 2.9% |
| Engineering | 6 | 2.5% |
| Multidisciplinary Studies | 0 | 0.0% |
| Science & Technology | 20 | 8.3% |
| Business | 15 | 6.2% |
| Education | 141 | 58.3% |
| Literature & Languages | 3 | 1.2% |
| Liberal Arts & History | 0 | 0.0% |
| Visual & Performing Arts | 0 | 0.0% |
| Communications | 3 | 1.2% |
| Arts & Humanities | 20 | 8.3% |
| Total | 242 | 100.0% |
Transportation & Commute in Tama
Vehicle Availability by Sex in Tama
The most prevalent vehicle ownership categories in Tama are males with 2 vehicles (375, accounting for 49.1%) and females with 2 vehicles (233, making up 75.4%).
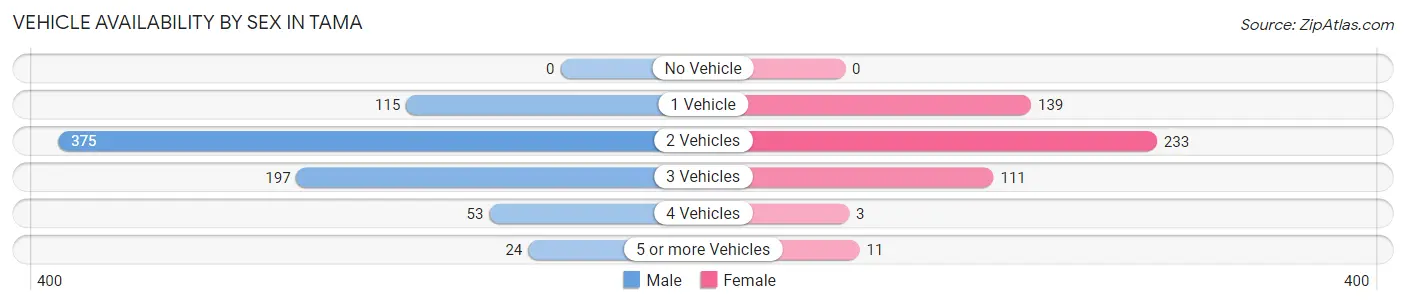
| Vehicles Available | Male | Female |
| No Vehicle | 0 (0.0%) | 0 (0.0%) |
| 1 Vehicle | 115 (15.0%) | 139 (28.0%) |
| 2 Vehicles | 375 (49.1%) | 233 (46.9%) |
| 3 Vehicles | 197 (25.8%) | 111 (22.3%) |
| 4 Vehicles | 53 (6.9%) | 3 (0.6%) |
| 5 or more Vehicles | 24 (3.1%) | 11 (2.2%) |
| Total | 764 (100.0%) | 497 (100.0%) |
Commute Time in Tama
The most frequently occuring commute durations in Tama are 5 to 9 minutes (345 commuters, 27.8%), 10 to 14 minutes (202 commuters, 16.3%), and 20 to 24 minutes (143 commuters, 11.5%).
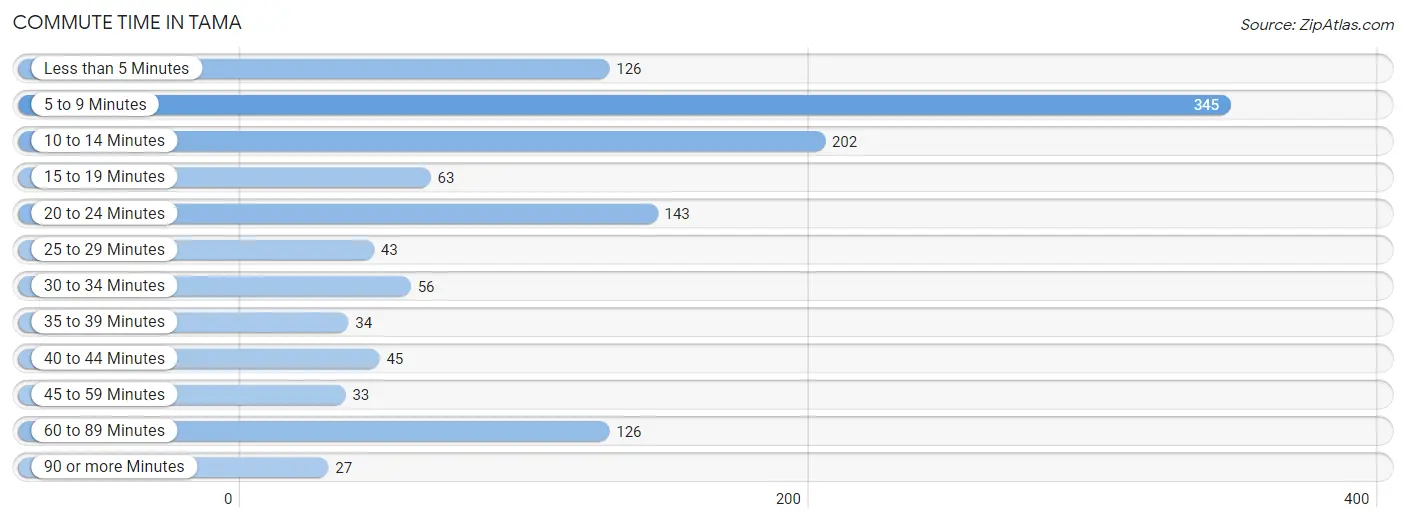
| Commute Time | # Commuters | % Commuters |
| Less than 5 Minutes | 126 | 10.1% |
| 5 to 9 Minutes | 345 | 27.8% |
| 10 to 14 Minutes | 202 | 16.3% |
| 15 to 19 Minutes | 63 | 5.1% |
| 20 to 24 Minutes | 143 | 11.5% |
| 25 to 29 Minutes | 43 | 3.5% |
| 30 to 34 Minutes | 56 | 4.5% |
| 35 to 39 Minutes | 34 | 2.7% |
| 40 to 44 Minutes | 45 | 3.6% |
| 45 to 59 Minutes | 33 | 2.6% |
| 60 to 89 Minutes | 126 | 10.1% |
| 90 or more Minutes | 27 | 2.2% |
Commute Time by Sex in Tama
The most common commute times in Tama are 5 to 9 minutes (173 commuters, 22.9%) for males and 5 to 9 minutes (172 commuters, 35.2%) for females.
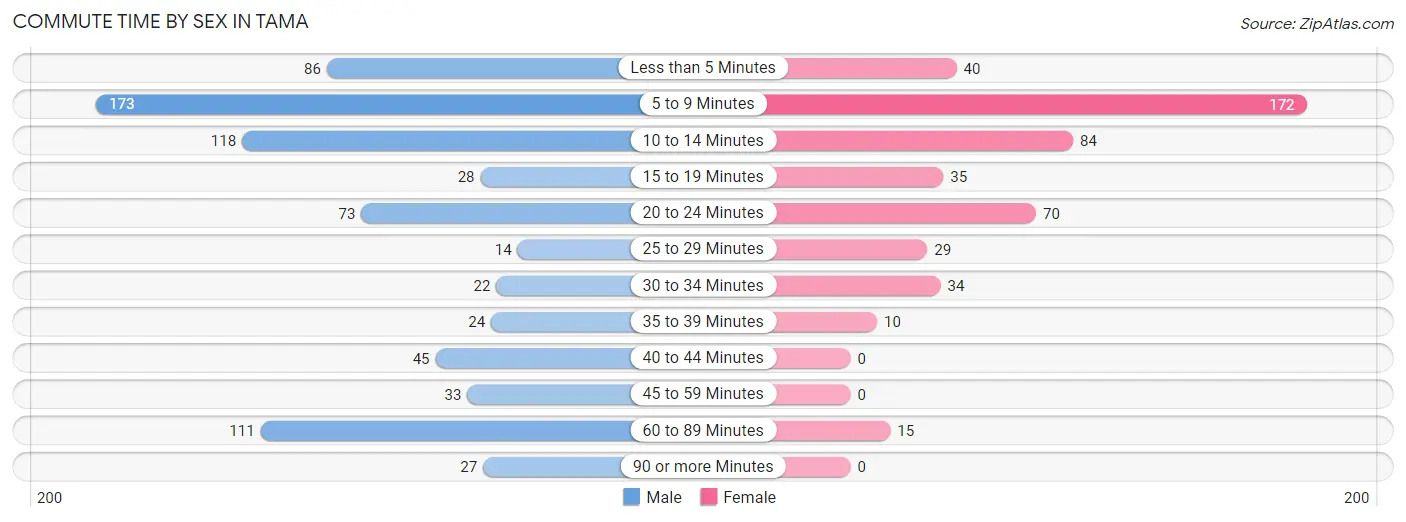
| Commute Time | Male | Female |
| Less than 5 Minutes | 86 (11.4%) | 40 (8.2%) |
| 5 to 9 Minutes | 173 (22.9%) | 172 (35.2%) |
| 10 to 14 Minutes | 118 (15.7%) | 84 (17.2%) |
| 15 to 19 Minutes | 28 (3.7%) | 35 (7.2%) |
| 20 to 24 Minutes | 73 (9.7%) | 70 (14.3%) |
| 25 to 29 Minutes | 14 (1.9%) | 29 (5.9%) |
| 30 to 34 Minutes | 22 (2.9%) | 34 (7.0%) |
| 35 to 39 Minutes | 24 (3.2%) | 10 (2.0%) |
| 40 to 44 Minutes | 45 (6.0%) | 0 (0.0%) |
| 45 to 59 Minutes | 33 (4.4%) | 0 (0.0%) |
| 60 to 89 Minutes | 111 (14.7%) | 15 (3.1%) |
| 90 or more Minutes | 27 (3.6%) | 0 (0.0%) |
Time of Departure to Work by Sex in Tama
The most frequent times of departure to work in Tama are 6:00 AM to 6:29 AM (155, 20.6%) for males and 7:30 AM to 7:59 AM (85, 17.4%) for females.
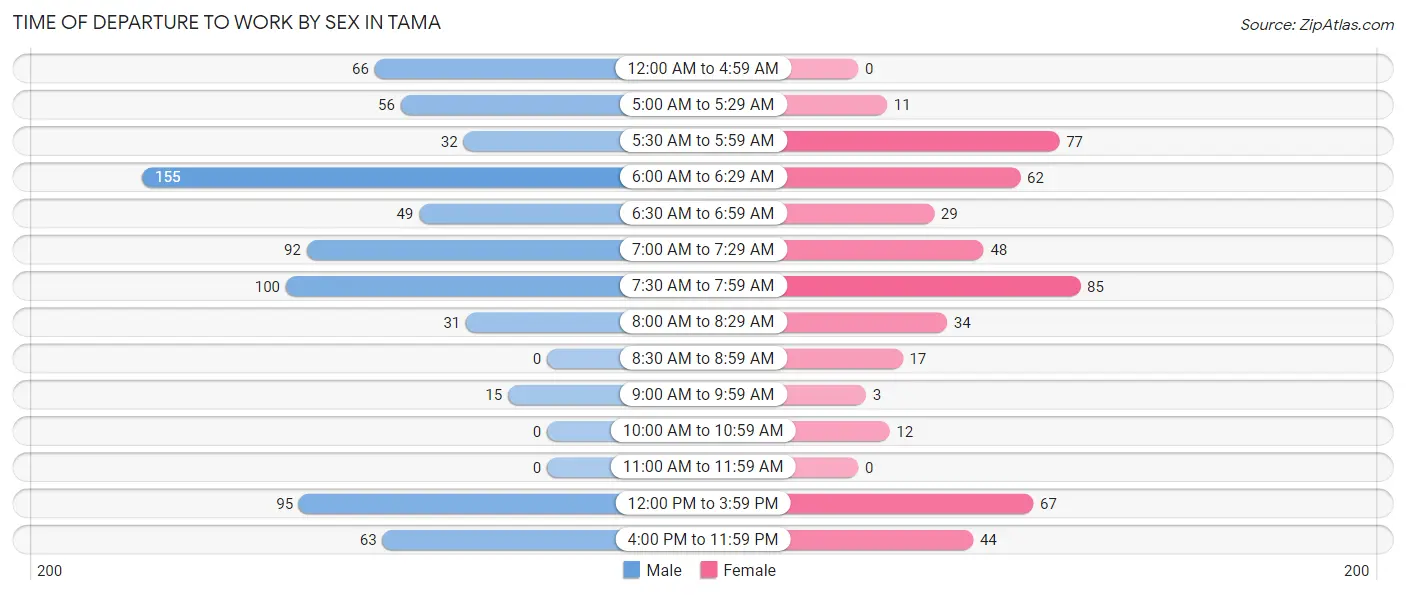
| Time of Departure | Male | Female |
| 12:00 AM to 4:59 AM | 66 (8.7%) | 0 (0.0%) |
| 5:00 AM to 5:29 AM | 56 (7.4%) | 11 (2.2%) |
| 5:30 AM to 5:59 AM | 32 (4.2%) | 77 (15.8%) |
| 6:00 AM to 6:29 AM | 155 (20.6%) | 62 (12.7%) |
| 6:30 AM to 6:59 AM | 49 (6.5%) | 29 (5.9%) |
| 7:00 AM to 7:29 AM | 92 (12.2%) | 48 (9.8%) |
| 7:30 AM to 7:59 AM | 100 (13.3%) | 85 (17.4%) |
| 8:00 AM to 8:29 AM | 31 (4.1%) | 34 (7.0%) |
| 8:30 AM to 8:59 AM | 0 (0.0%) | 17 (3.5%) |
| 9:00 AM to 9:59 AM | 15 (2.0%) | 3 (0.6%) |
| 10:00 AM to 10:59 AM | 0 (0.0%) | 12 (2.5%) |
| 11:00 AM to 11:59 AM | 0 (0.0%) | 0 (0.0%) |
| 12:00 PM to 3:59 PM | 95 (12.6%) | 67 (13.7%) |
| 4:00 PM to 11:59 PM | 63 (8.4%) | 44 (9.0%) |
| Total | 754 (100.0%) | 489 (100.0%) |
Housing Occupancy in Tama
Occupancy by Ownership in Tama
Of the total 1,068 dwellings in Tama, owner-occupied units account for 739 (69.2%), while renter-occupied units make up 329 (30.8%).
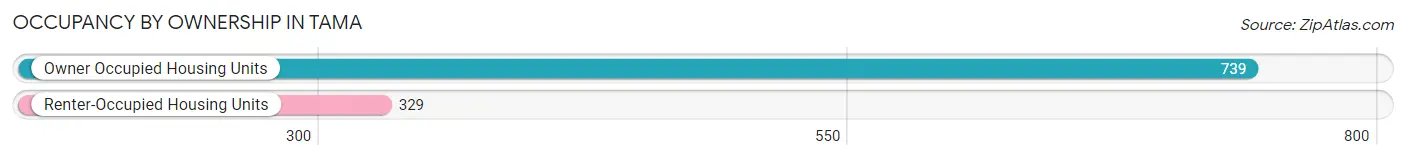
| Occupancy | # Housing Units | % Housing Units |
| Owner Occupied Housing Units | 739 | 69.2% |
| Renter-Occupied Housing Units | 329 | 30.8% |
| Total Occupied Housing Units | 1,068 | 100.0% |
Occupancy by Household Size in Tama
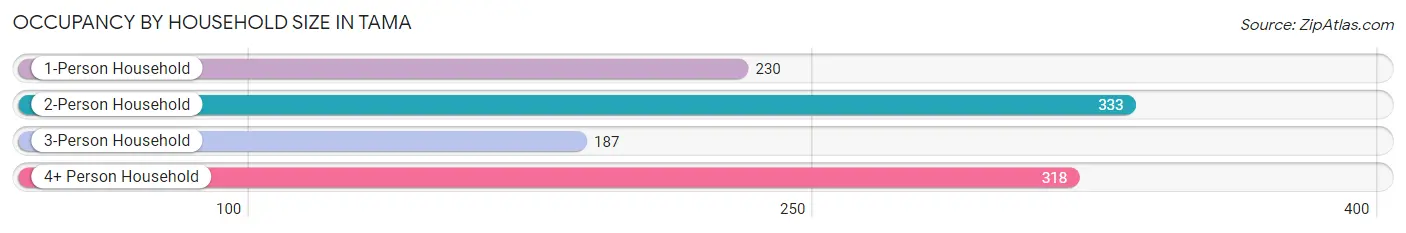
| Household Size | # Housing Units | % Housing Units |
| 1-Person Household | 230 | 21.5% |
| 2-Person Household | 333 | 31.2% |
| 3-Person Household | 187 | 17.5% |
| 4+ Person Household | 318 | 29.8% |
| Total Housing Units | 1,068 | 100.0% |
Occupancy by Ownership by Household Size in Tama
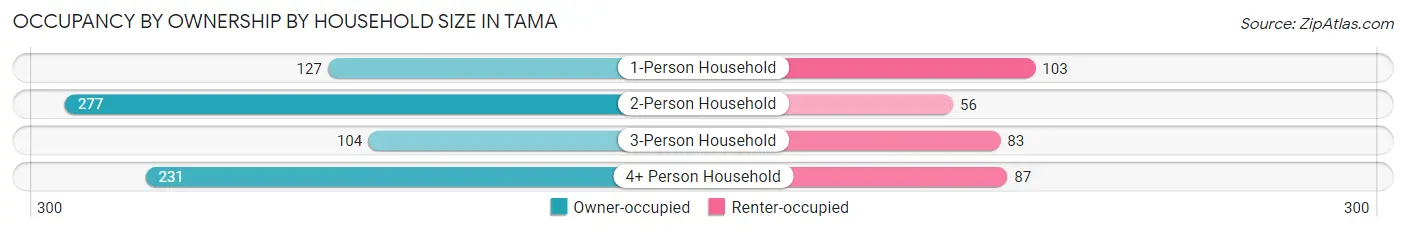
| Household Size | Owner-occupied | Renter-occupied |
| 1-Person Household | 127 (55.2%) | 103 (44.8%) |
| 2-Person Household | 277 (83.2%) | 56 (16.8%) |
| 3-Person Household | 104 (55.6%) | 83 (44.4%) |
| 4+ Person Household | 231 (72.6%) | 87 (27.4%) |
| Total Housing Units | 739 (69.2%) | 329 (30.8%) |
Occupancy by Educational Attainment in Tama
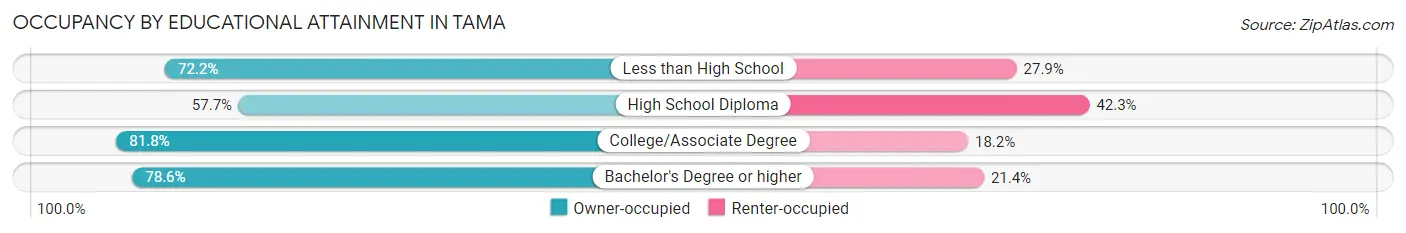
| Household Size | Owner-occupied | Renter-occupied |
| Less than High School | 114 (72.2%) | 44 (27.9%) |
| High School Diploma | 277 (57.7%) | 203 (42.3%) |
| College/Associate Degree | 256 (81.8%) | 57 (18.2%) |
| Bachelor's Degree or higher | 92 (78.6%) | 25 (21.4%) |
Occupancy by Age of Householder in Tama
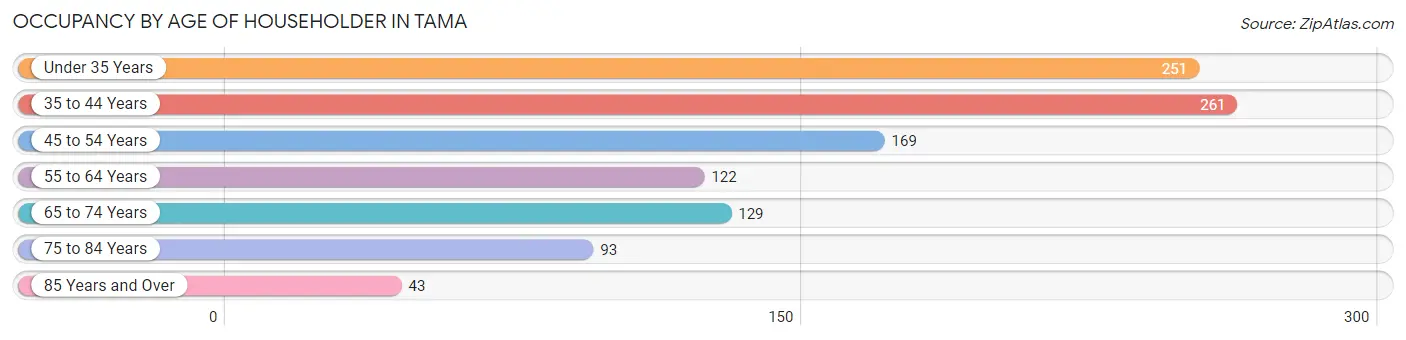
| Age Bracket | # Households | % Households |
| Under 35 Years | 251 | 23.5% |
| 35 to 44 Years | 261 | 24.4% |
| 45 to 54 Years | 169 | 15.8% |
| 55 to 64 Years | 122 | 11.4% |
| 65 to 74 Years | 129 | 12.1% |
| 75 to 84 Years | 93 | 8.7% |
| 85 Years and Over | 43 | 4.0% |
| Total | 1,068 | 100.0% |
Housing Finances in Tama
Median Income by Occupancy in Tama
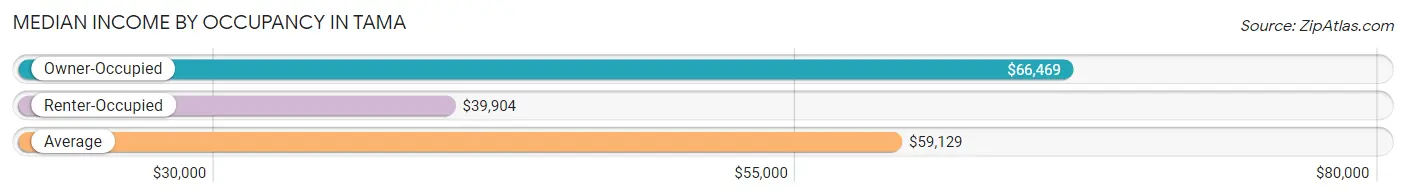
| Occupancy Type | # Households | Median Income |
| Owner-Occupied | 739 (69.2%) | $66,469 |
| Renter-Occupied | 329 (30.8%) | $39,904 |
| Average | 1,068 (100.0%) | $59,129 |
Occupancy by Householder Income Bracket in Tama
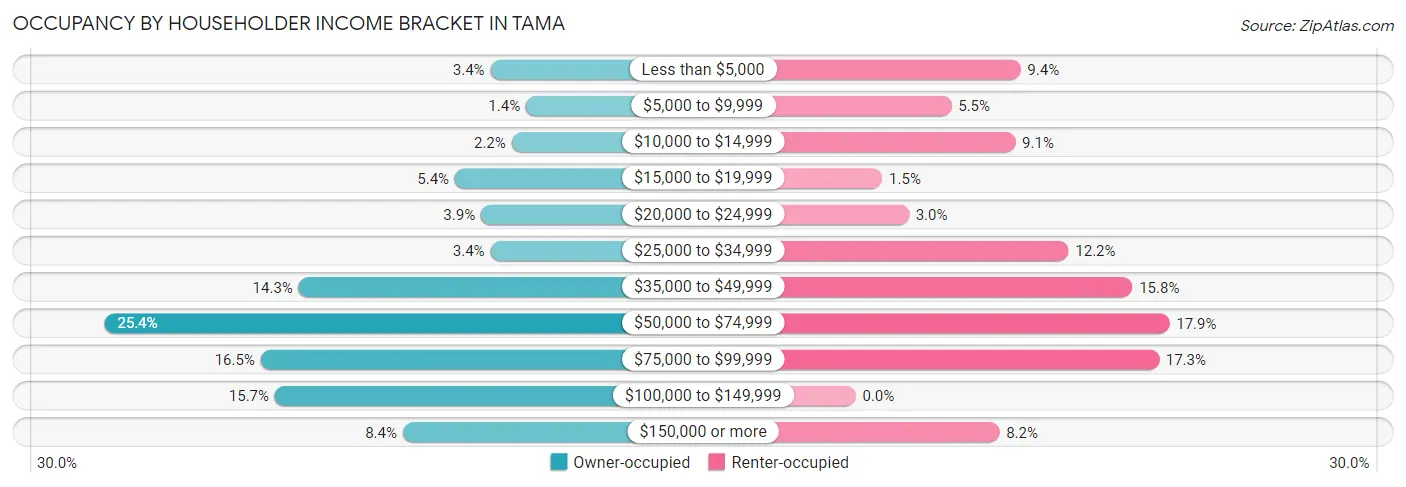
| Income Bracket | Owner-occupied | Renter-occupied |
| Less than $5,000 | 25 (3.4%) | 31 (9.4%) |
| $5,000 to $9,999 | 10 (1.3%) | 18 (5.5%) |
| $10,000 to $14,999 | 16 (2.2%) | 30 (9.1%) |
| $15,000 to $19,999 | 40 (5.4%) | 5 (1.5%) |
| $20,000 to $24,999 | 29 (3.9%) | 10 (3.0%) |
| $25,000 to $34,999 | 25 (3.4%) | 40 (12.2%) |
| $35,000 to $49,999 | 106 (14.3%) | 52 (15.8%) |
| $50,000 to $74,999 | 188 (25.4%) | 59 (17.9%) |
| $75,000 to $99,999 | 122 (16.5%) | 57 (17.3%) |
| $100,000 to $149,999 | 116 (15.7%) | 0 (0.0%) |
| $150,000 or more | 62 (8.4%) | 27 (8.2%) |
| Total | 739 (100.0%) | 329 (100.0%) |
Monthly Housing Cost Tiers in Tama
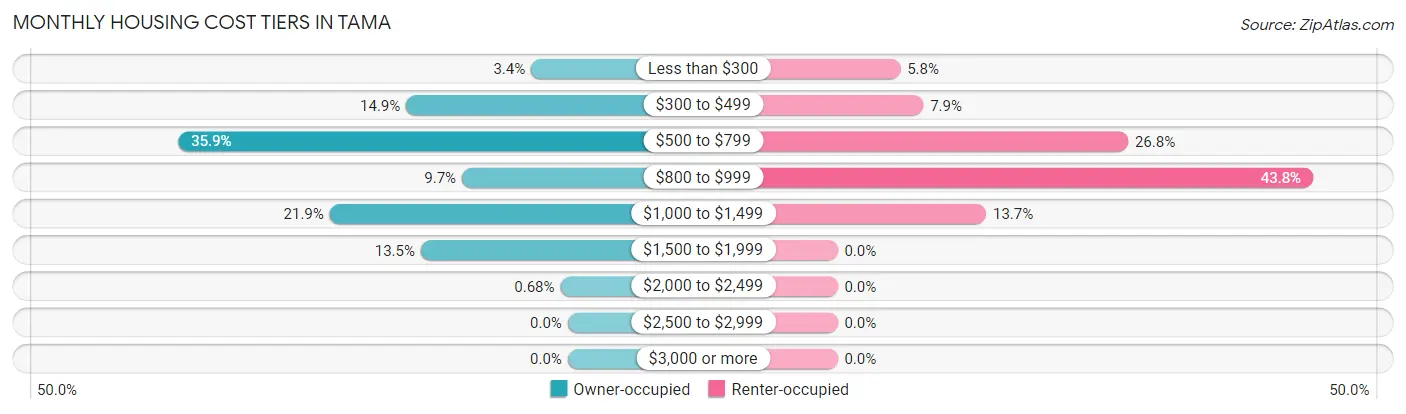
| Monthly Cost | Owner-occupied | Renter-occupied |
| Less than $300 | 25 (3.4%) | 19 (5.8%) |
| $300 to $499 | 110 (14.9%) | 26 (7.9%) |
| $500 to $799 | 265 (35.9%) | 88 (26.8%) |
| $800 to $999 | 72 (9.7%) | 144 (43.8%) |
| $1,000 to $1,499 | 162 (21.9%) | 45 (13.7%) |
| $1,500 to $1,999 | 100 (13.5%) | 0 (0.0%) |
| $2,000 to $2,499 | 5 (0.7%) | 0 (0.0%) |
| $2,500 to $2,999 | 0 (0.0%) | 0 (0.0%) |
| $3,000 or more | 0 (0.0%) | 0 (0.0%) |
| Total | 739 (100.0%) | 329 (100.0%) |
Physical Housing Characteristics in Tama
Housing Structures in Tama
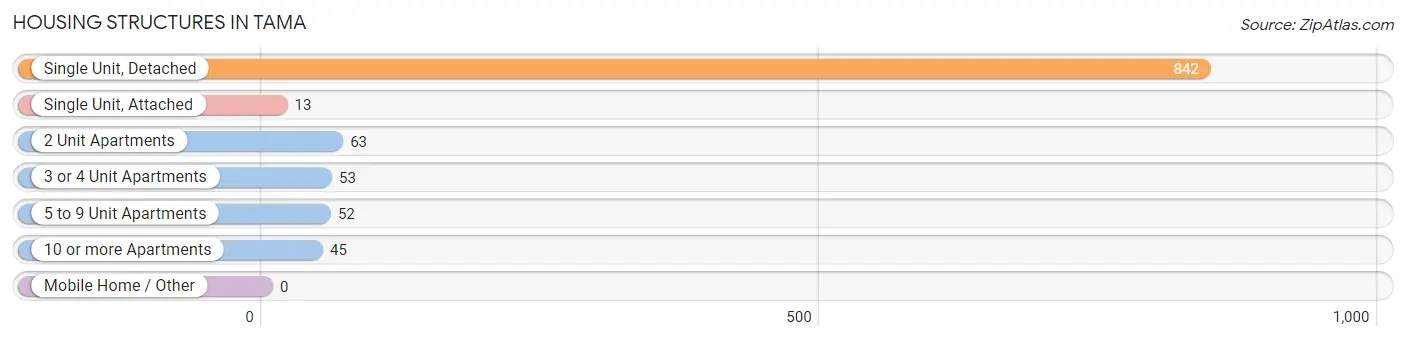
| Structure Type | # Housing Units | % Housing Units |
| Single Unit, Detached | 842 | 78.8% |
| Single Unit, Attached | 13 | 1.2% |
| 2 Unit Apartments | 63 | 5.9% |
| 3 or 4 Unit Apartments | 53 | 5.0% |
| 5 to 9 Unit Apartments | 52 | 4.9% |
| 10 or more Apartments | 45 | 4.2% |
| Mobile Home / Other | 0 | 0.0% |
| Total | 1,068 | 100.0% |
Housing Structures by Occupancy in Tama
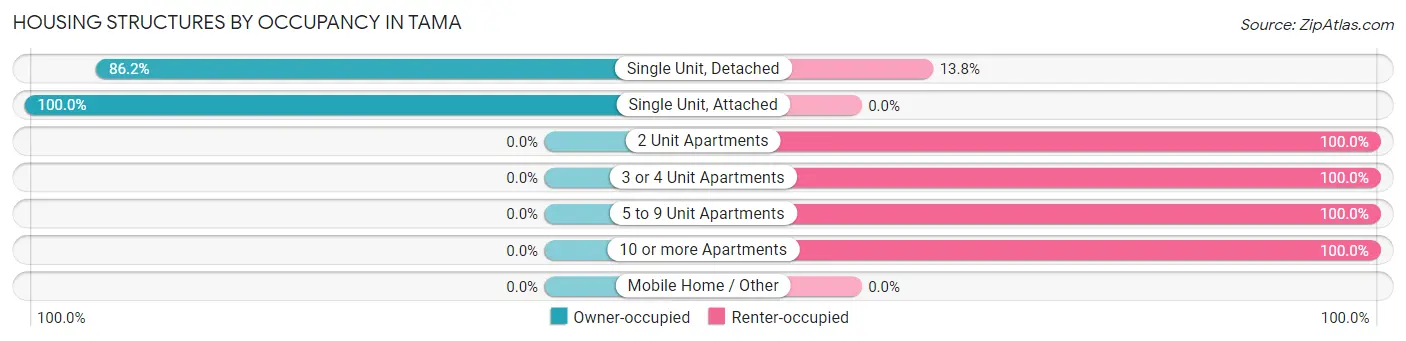
| Structure Type | Owner-occupied | Renter-occupied |
| Single Unit, Detached | 726 (86.2%) | 116 (13.8%) |
| Single Unit, Attached | 13 (100.0%) | 0 (0.0%) |
| 2 Unit Apartments | 0 (0.0%) | 63 (100.0%) |
| 3 or 4 Unit Apartments | 0 (0.0%) | 53 (100.0%) |
| 5 to 9 Unit Apartments | 0 (0.0%) | 52 (100.0%) |
| 10 or more Apartments | 0 (0.0%) | 45 (100.0%) |
| Mobile Home / Other | 0 (0.0%) | 0 (0.0%) |
| Total | 739 (69.2%) | 329 (30.8%) |
Housing Structures by Number of Rooms in Tama
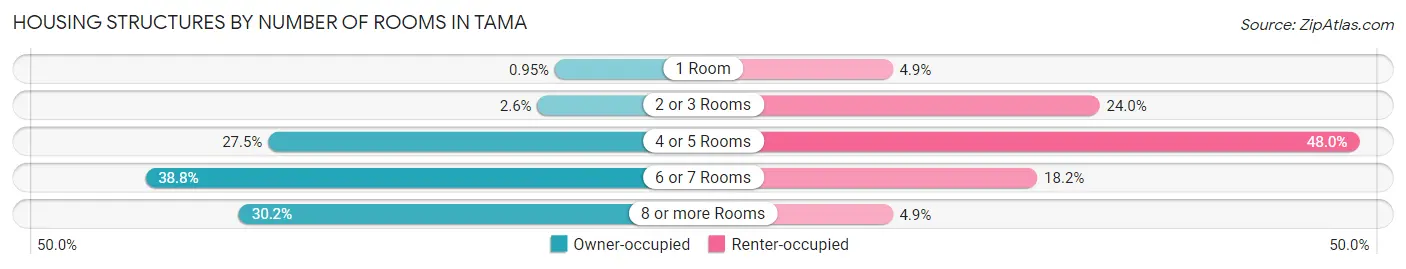
| Number of Rooms | Owner-occupied | Renter-occupied |
| 1 Room | 7 (0.9%) | 16 (4.9%) |
| 2 or 3 Rooms | 19 (2.6%) | 79 (24.0%) |
| 4 or 5 Rooms | 203 (27.5%) | 158 (48.0%) |
| 6 or 7 Rooms | 287 (38.8%) | 60 (18.2%) |
| 8 or more Rooms | 223 (30.2%) | 16 (4.9%) |
| Total | 739 (100.0%) | 329 (100.0%) |
Housing Structure by Heating Type in Tama
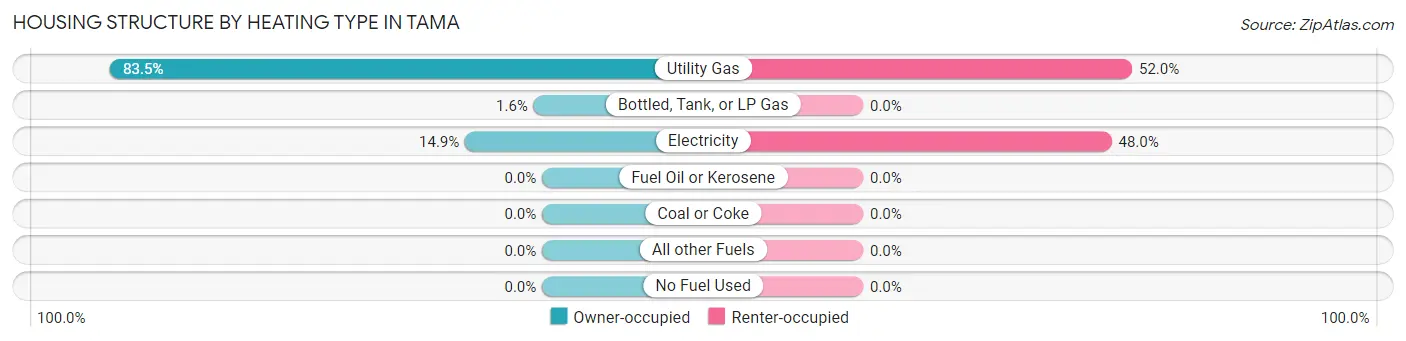
| Heating Type | Owner-occupied | Renter-occupied |
| Utility Gas | 617 (83.5%) | 171 (52.0%) |
| Bottled, Tank, or LP Gas | 12 (1.6%) | 0 (0.0%) |
| Electricity | 110 (14.9%) | 158 (48.0%) |
| Fuel Oil or Kerosene | 0 (0.0%) | 0 (0.0%) |
| Coal or Coke | 0 (0.0%) | 0 (0.0%) |
| All other Fuels | 0 (0.0%) | 0 (0.0%) |
| No Fuel Used | 0 (0.0%) | 0 (0.0%) |
| Total | 739 (100.0%) | 329 (100.0%) |
Household Vehicle Usage in Tama
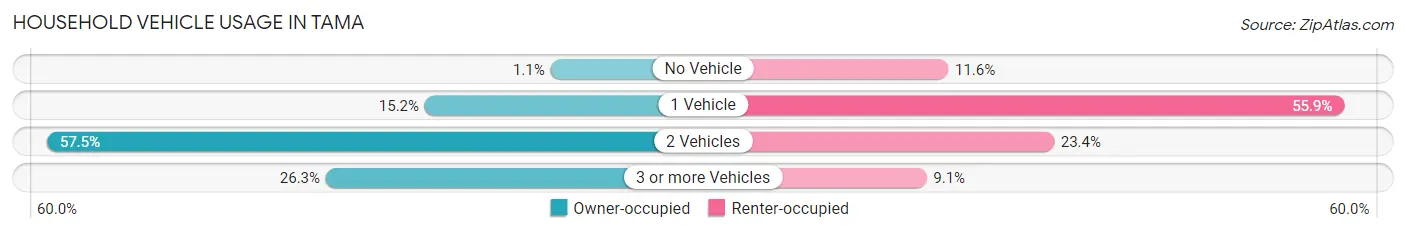
| Vehicles per Household | Owner-occupied | Renter-occupied |
| No Vehicle | 8 (1.1%) | 38 (11.6%) |
| 1 Vehicle | 112 (15.2%) | 184 (55.9%) |
| 2 Vehicles | 425 (57.5%) | 77 (23.4%) |
| 3 or more Vehicles | 194 (26.3%) | 30 (9.1%) |
| Total | 739 (100.0%) | 329 (100.0%) |
Real Estate & Mortgages in Tama
Real Estate and Mortgage Overview in Tama
| Characteristic | Without Mortgage | With Mortgage |
| Housing Units | 380 | 359 |
| Median Property Value | $88,200 | $116,500 |
| Median Household Income | $50,278 | $41 |
| Monthly Housing Costs | $538 | $0 |
| Real Estate Taxes | $1,500 | $3 |
Property Value by Mortgage Status in Tama
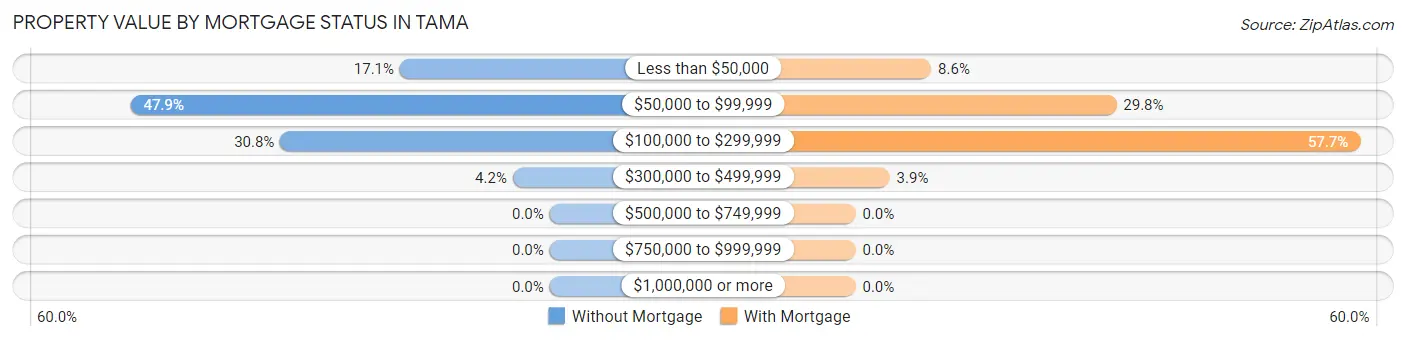
| Property Value | Without Mortgage | With Mortgage |
| Less than $50,000 | 65 (17.1%) | 31 (8.6%) |
| $50,000 to $99,999 | 182 (47.9%) | 107 (29.8%) |
| $100,000 to $299,999 | 117 (30.8%) | 207 (57.7%) |
| $300,000 to $499,999 | 16 (4.2%) | 14 (3.9%) |
| $500,000 to $749,999 | 0 (0.0%) | 0 (0.0%) |
| $750,000 to $999,999 | 0 (0.0%) | 0 (0.0%) |
| $1,000,000 or more | 0 (0.0%) | 0 (0.0%) |
| Total | 380 (100.0%) | 359 (100.0%) |
Household Income by Mortgage Status in Tama
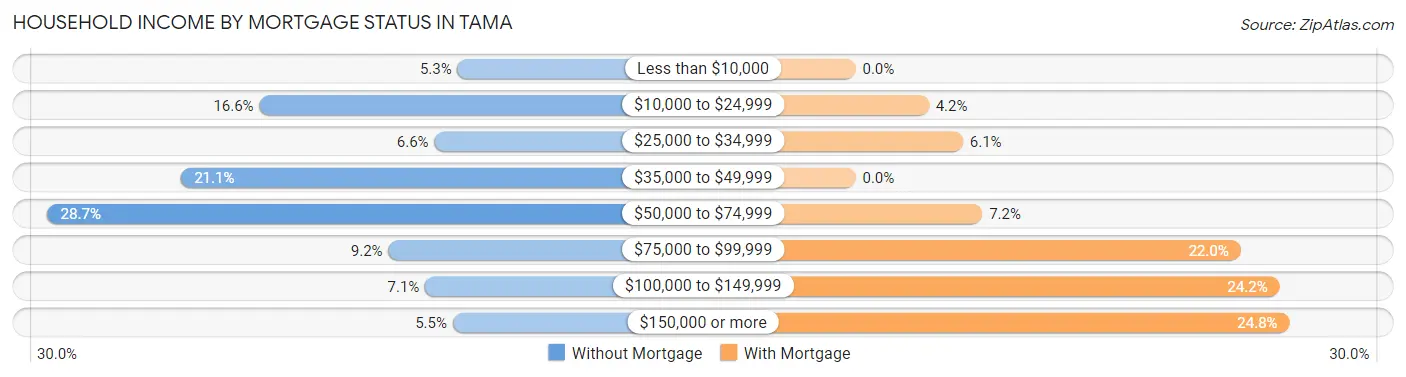
| Household Income | Without Mortgage | With Mortgage |
| Less than $10,000 | 20 (5.3%) | 0 (0.0%) |
| $10,000 to $24,999 | 63 (16.6%) | 15 (4.2%) |
| $25,000 to $34,999 | 25 (6.6%) | 22 (6.1%) |
| $35,000 to $49,999 | 80 (21.0%) | 0 (0.0%) |
| $50,000 to $74,999 | 109 (28.7%) | 26 (7.2%) |
| $75,000 to $99,999 | 35 (9.2%) | 79 (22.0%) |
| $100,000 to $149,999 | 27 (7.1%) | 87 (24.2%) |
| $150,000 or more | 21 (5.5%) | 89 (24.8%) |
| Total | 380 (100.0%) | 359 (100.0%) |
Property Value to Household Income Ratio in Tama
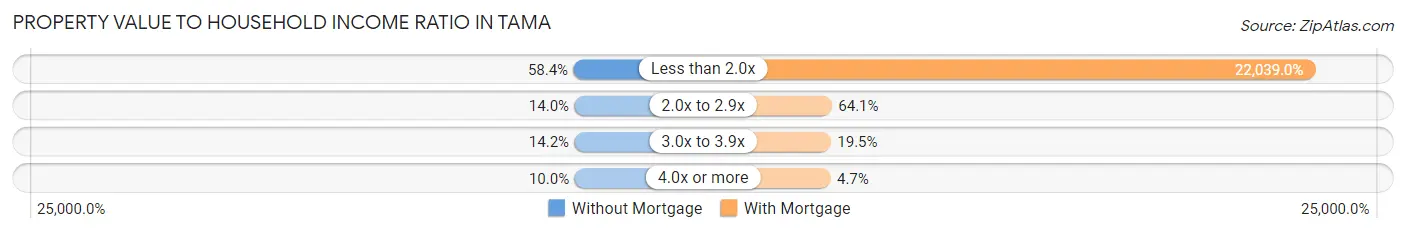
| Value-to-Income Ratio | Without Mortgage | With Mortgage |
| Less than 2.0x | 222 (58.4%) | 79,120 (22,039.0%) |
| 2.0x to 2.9x | 53 (14.0%) | 230 (64.1%) |
| 3.0x to 3.9x | 54 (14.2%) | 70 (19.5%) |
| 4.0x or more | 38 (10.0%) | 17 (4.7%) |
| Total | 380 (100.0%) | 359 (100.0%) |
Real Estate Taxes by Mortgage Status in Tama
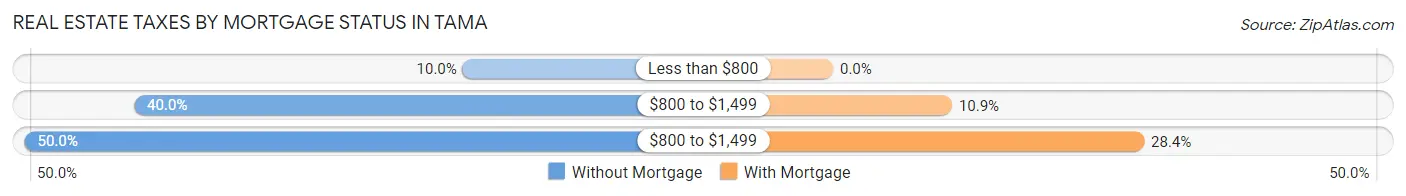
| Property Taxes | Without Mortgage | With Mortgage |
| Less than $800 | 38 (10.0%) | 0 (0.0%) |
| $800 to $1,499 | 152 (40.0%) | 39 (10.9%) |
| $800 to $1,499 | 190 (50.0%) | 102 (28.4%) |
| Total | 380 (100.0%) | 359 (100.0%) |
Health & Disability in Tama
Health Insurance Coverage by Age in Tama
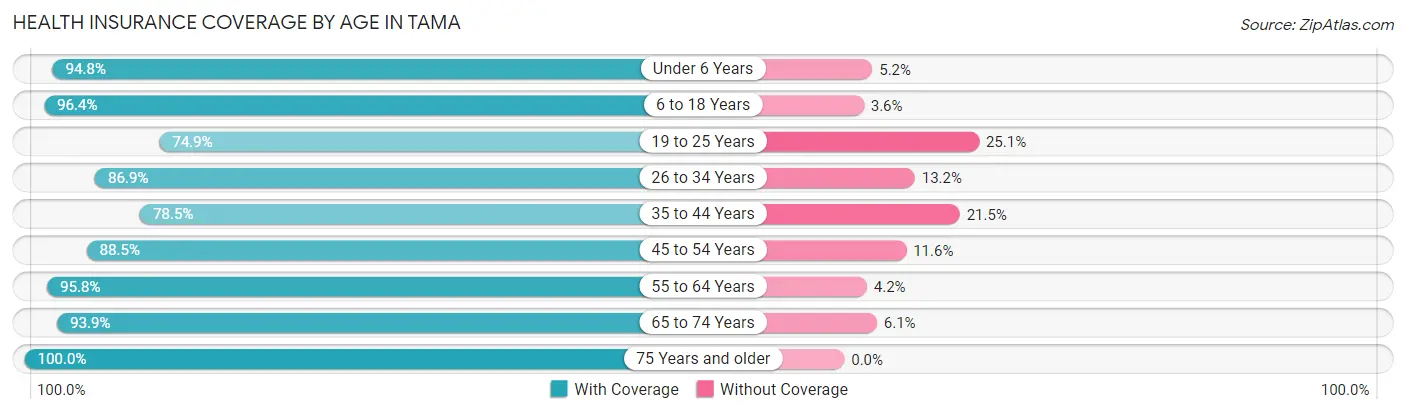
| Age Bracket | With Coverage | Without Coverage |
| Under 6 Years | 236 (94.8%) | 13 (5.2%) |
| 6 to 18 Years | 744 (96.4%) | 28 (3.6%) |
| 19 to 25 Years | 158 (74.9%) | 53 (25.1%) |
| 26 to 34 Years | 403 (86.9%) | 61 (13.2%) |
| 35 to 44 Years | 321 (78.5%) | 88 (21.5%) |
| 45 to 54 Years | 245 (88.4%) | 32 (11.6%) |
| 55 to 64 Years | 205 (95.8%) | 9 (4.2%) |
| 65 to 74 Years | 201 (93.9%) | 13 (6.1%) |
| 75 Years and older | 205 (100.0%) | 0 (0.0%) |
| Total | 2,718 (90.1%) | 297 (9.9%) |
Health Insurance Coverage by Citizenship Status in Tama
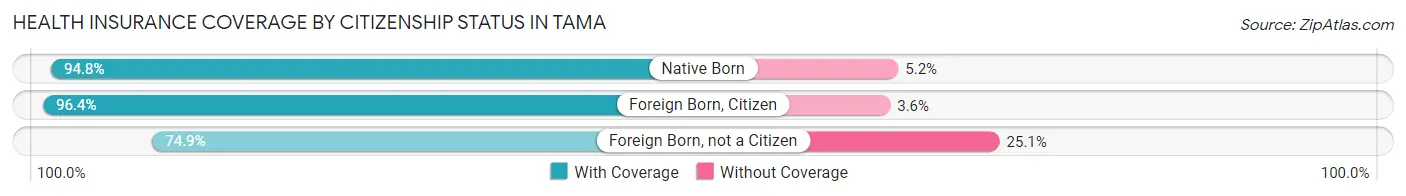
| Citizenship Status | With Coverage | Without Coverage |
| Native Born | 236 (94.8%) | 13 (5.2%) |
| Foreign Born, Citizen | 744 (96.4%) | 28 (3.6%) |
| Foreign Born, not a Citizen | 158 (74.9%) | 53 (25.1%) |
Health Insurance Coverage by Household Income in Tama
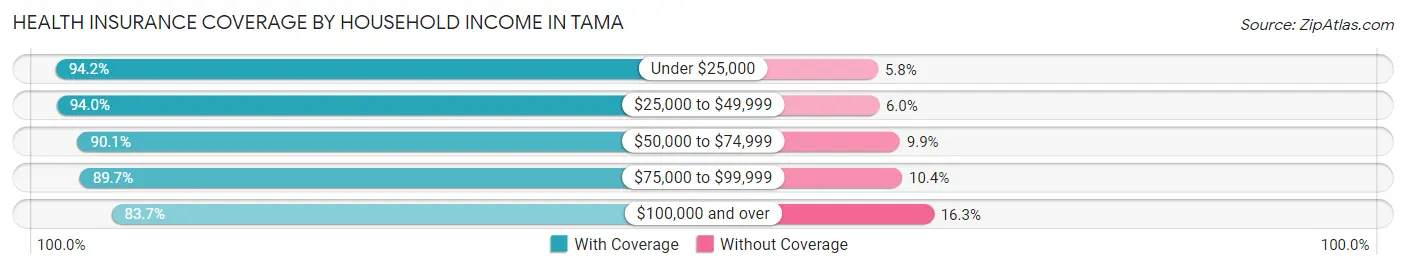
| Household Income | With Coverage | Without Coverage |
| Under $25,000 | 419 (94.2%) | 26 (5.8%) |
| $25,000 to $49,999 | 687 (94.0%) | 44 (6.0%) |
| $50,000 to $74,999 | 589 (90.1%) | 65 (9.9%) |
| $75,000 to $99,999 | 459 (89.6%) | 53 (10.3%) |
| $100,000 and over | 560 (83.7%) | 109 (16.3%) |
Public vs Private Health Insurance Coverage by Age in Tama
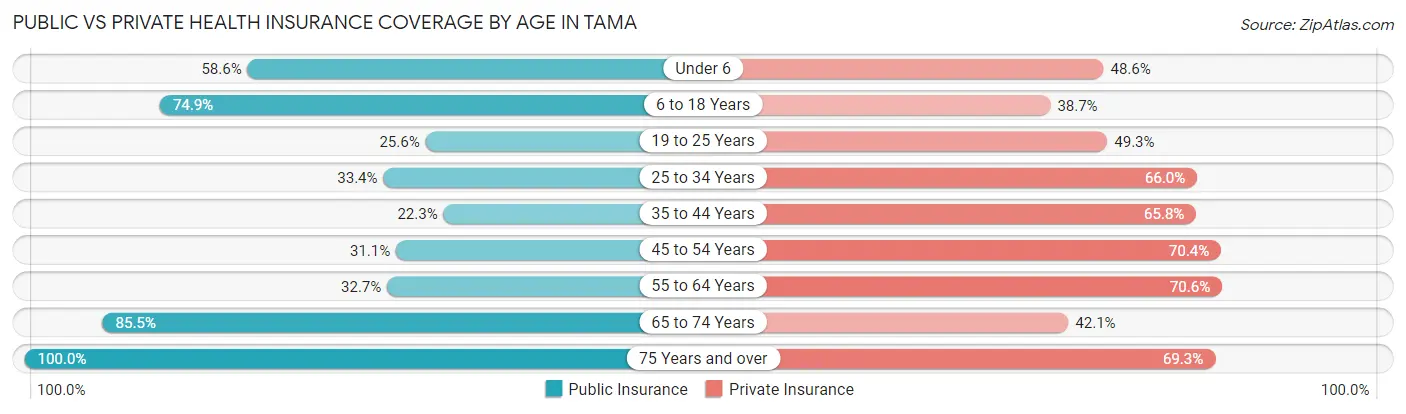
| Age Bracket | Public Insurance | Private Insurance |
| Under 6 | 146 (58.6%) | 121 (48.6%) |
| 6 to 18 Years | 578 (74.9%) | 299 (38.7%) |
| 19 to 25 Years | 54 (25.6%) | 104 (49.3%) |
| 25 to 34 Years | 155 (33.4%) | 306 (65.9%) |
| 35 to 44 Years | 91 (22.3%) | 269 (65.8%) |
| 45 to 54 Years | 86 (31.0%) | 195 (70.4%) |
| 55 to 64 Years | 70 (32.7%) | 151 (70.6%) |
| 65 to 74 Years | 183 (85.5%) | 90 (42.1%) |
| 75 Years and over | 205 (100.0%) | 142 (69.3%) |
| Total | 1,568 (52.0%) | 1,677 (55.6%) |
Disability Status by Sex by Age in Tama
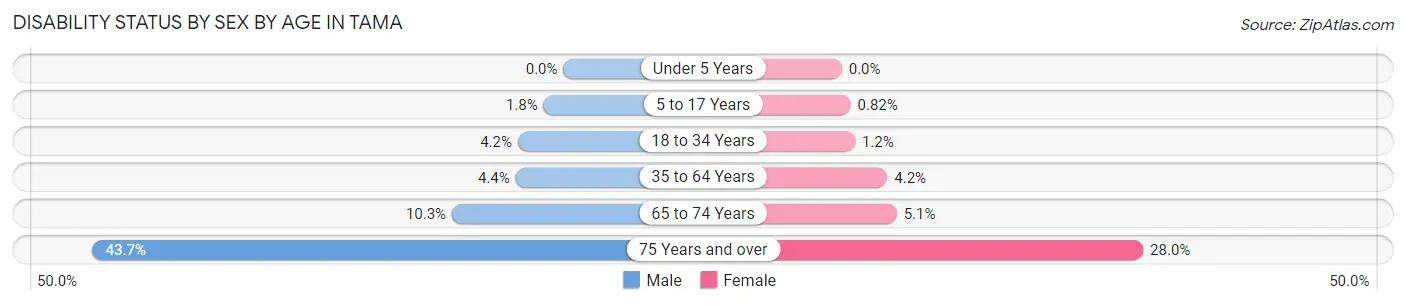
| Age Bracket | Male | Female |
| Under 5 Years | 0 (0.0%) | 0 (0.0%) |
| 5 to 17 Years | 8 (1.8%) | 3 (0.8%) |
| 18 to 34 Years | 16 (4.2%) | 4 (1.2%) |
| 35 to 64 Years | 20 (4.4%) | 19 (4.2%) |
| 65 to 74 Years | 12 (10.3%) | 5 (5.1%) |
| 75 Years and over | 38 (43.7%) | 33 (28.0%) |
Disability Class by Sex by Age in Tama
Disability Class: Hearing Difficulty
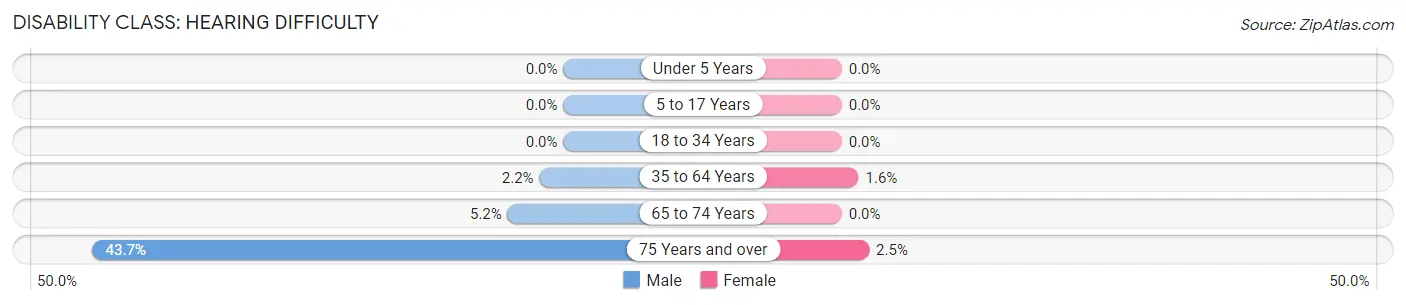
| Age Bracket | Male | Female |
| Under 5 Years | 0 (0.0%) | 0 (0.0%) |
| 5 to 17 Years | 0 (0.0%) | 0 (0.0%) |
| 18 to 34 Years | 0 (0.0%) | 0 (0.0%) |
| 35 to 64 Years | 10 (2.2%) | 7 (1.6%) |
| 65 to 74 Years | 6 (5.2%) | 0 (0.0%) |
| 75 Years and over | 38 (43.7%) | 3 (2.5%) |
Disability Class: Vision Difficulty
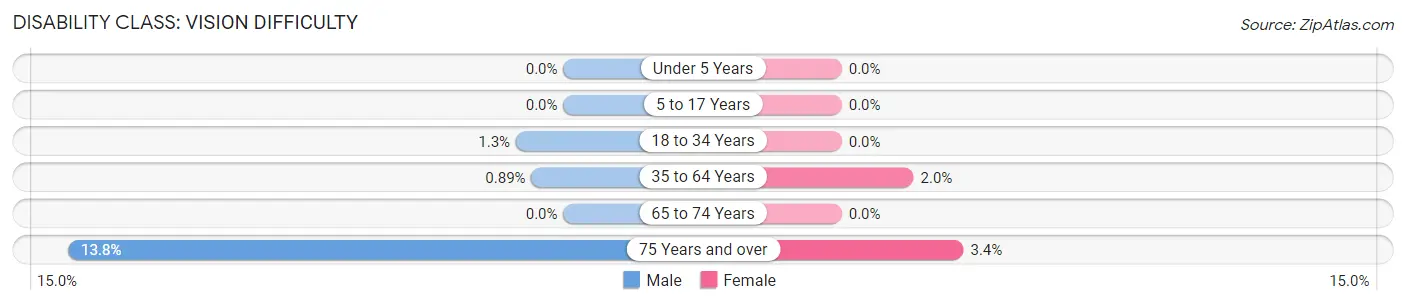
| Age Bracket | Male | Female |
| Under 5 Years | 0 (0.0%) | 0 (0.0%) |
| 5 to 17 Years | 0 (0.0%) | 0 (0.0%) |
| 18 to 34 Years | 5 (1.3%) | 0 (0.0%) |
| 35 to 64 Years | 4 (0.9%) | 9 (2.0%) |
| 65 to 74 Years | 0 (0.0%) | 0 (0.0%) |
| 75 Years and over | 12 (13.8%) | 4 (3.4%) |
Disability Class: Cognitive Difficulty
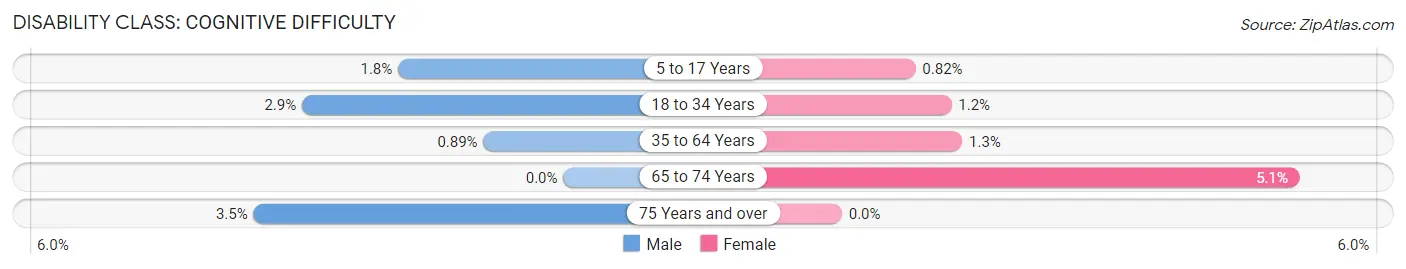
| Age Bracket | Male | Female |
| 5 to 17 Years | 8 (1.8%) | 3 (0.8%) |
| 18 to 34 Years | 11 (2.9%) | 4 (1.2%) |
| 35 to 64 Years | 4 (0.9%) | 6 (1.3%) |
| 65 to 74 Years | 0 (0.0%) | 5 (5.1%) |
| 75 Years and over | 3 (3.5%) | 0 (0.0%) |
Disability Class: Ambulatory Difficulty
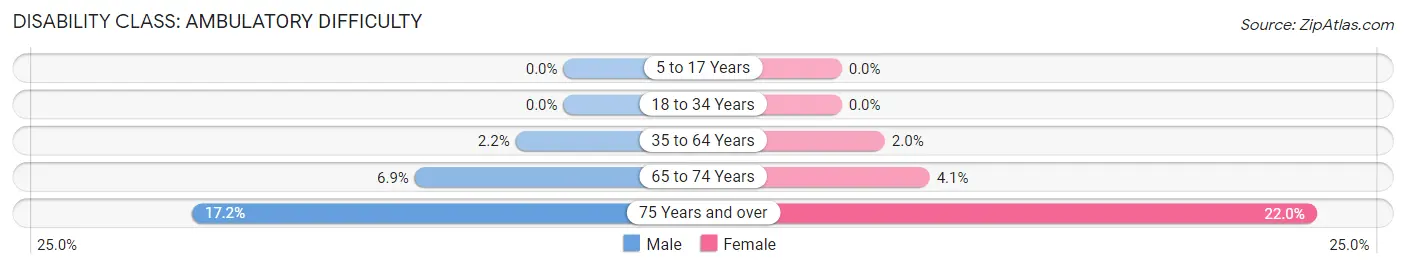
| Age Bracket | Male | Female |
| 5 to 17 Years | 0 (0.0%) | 0 (0.0%) |
| 18 to 34 Years | 0 (0.0%) | 0 (0.0%) |
| 35 to 64 Years | 10 (2.2%) | 9 (2.0%) |
| 65 to 74 Years | 8 (6.9%) | 4 (4.1%) |
| 75 Years and over | 15 (17.2%) | 26 (22.0%) |
Disability Class: Self-Care Difficulty
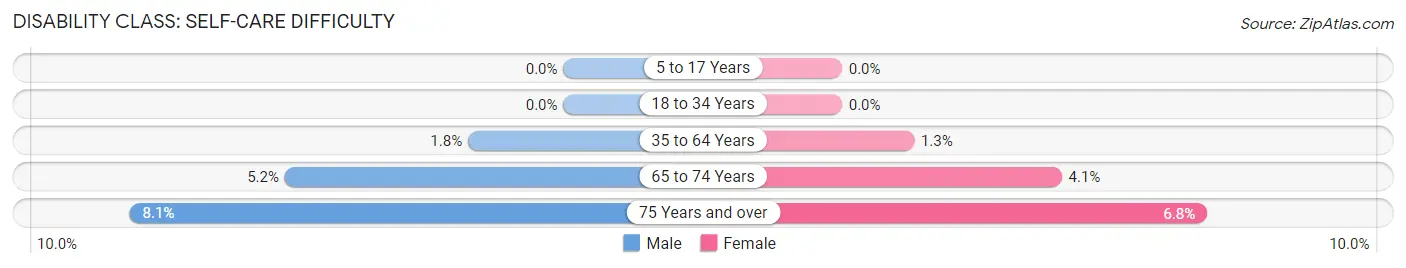
| Age Bracket | Male | Female |
| 5 to 17 Years | 0 (0.0%) | 0 (0.0%) |
| 18 to 34 Years | 0 (0.0%) | 0 (0.0%) |
| 35 to 64 Years | 8 (1.8%) | 6 (1.3%) |
| 65 to 74 Years | 6 (5.2%) | 4 (4.1%) |
| 75 Years and over | 7 (8.1%) | 8 (6.8%) |
Technology Access in Tama
Computing Device Access in Tama
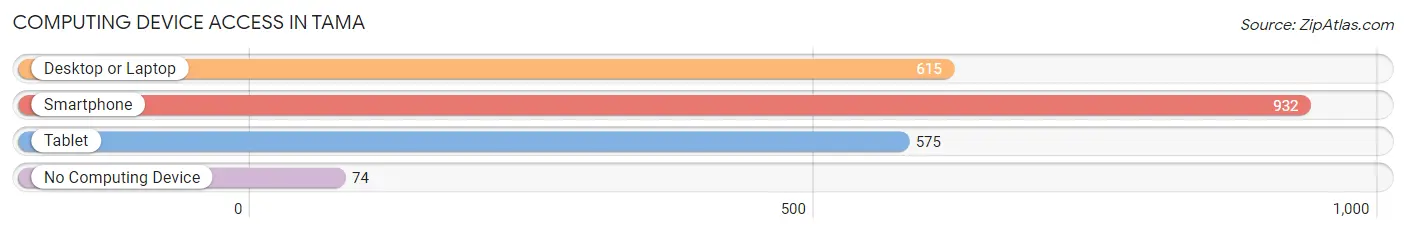
| Device Type | # Households | % Households |
| Desktop or Laptop | 615 | 57.6% |
| Smartphone | 932 | 87.3% |
| Tablet | 575 | 53.8% |
| No Computing Device | 74 | 6.9% |
| Total | 1,068 | 100.0% |
Internet Access in Tama
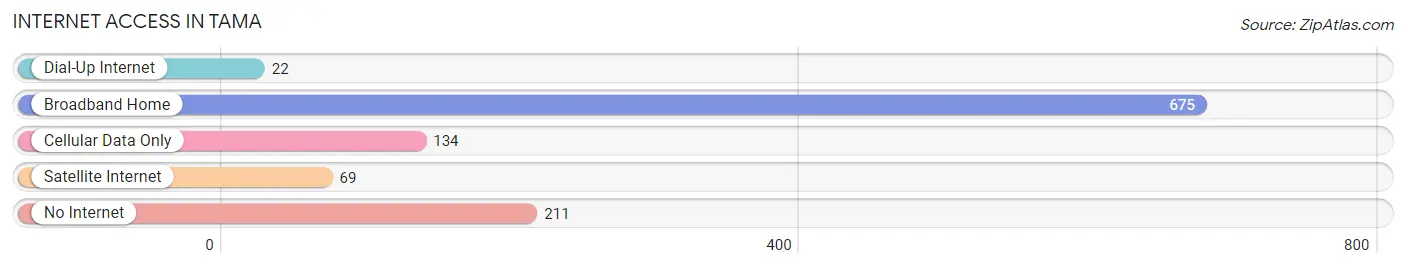
| Internet Type | # Households | % Households |
| Dial-Up Internet | 22 | 2.1% |
| Broadband Home | 675 | 63.2% |
| Cellular Data Only | 134 | 12.6% |
| Satellite Internet | 69 | 6.5% |
| No Internet | 211 | 19.8% |
| Total | 1,068 | 100.0% |
Tama Summary
Tama, Iowa is a small city located in Tama County in the state of Iowa. It is situated in the central part of the state, approximately 40 miles east of Des Moines. The city has a population of 2,877 people, according to the 2010 census.
History
Tama was founded in 1853 by a group of settlers from Ohio. The city was named after the Tama Indians, who were the original inhabitants of the area. The city was incorporated in 1875 and has since grown to become a thriving community.
The city has a rich history of industry and agriculture. In the late 19th century, the city was home to several sawmills, gristmills, and a brickyard. The city also had a thriving dairy industry, which provided milk and other dairy products to the surrounding area.
In the early 20th century, the city was home to several manufacturing companies, including a furniture factory, a canning factory, and a flour mill. The city also had a thriving agricultural industry, with several farms located in the area.
Geography
Tama is located in the central part of Iowa, approximately 40 miles east of Des Moines. The city is situated in the Tama County, which is part of the Iowa Great Lakes region. The city is located on the banks of the Iowa River, which flows through the city.
The city has a total area of 2.2 square miles, all of which is land. The city has a humid continental climate, with hot summers and cold winters. The average temperature in the summer is around 75 degrees Fahrenheit, while the average temperature in the winter is around 25 degrees Fahrenheit.
Economy
Tama has a strong economy, with a variety of industries located in the city. The city is home to several manufacturing companies, including a furniture factory, a canning factory, and a flour mill. The city also has a thriving agricultural industry, with several farms located in the area.
The city is also home to several retail stores, restaurants, and other businesses. The city is also home to several educational institutions, including a community college and a vocational school.
Demographics
According to the 2010 census, the population of Tama was 2,877 people. The city has a population density of 1,310 people per square mile. The median age of the population is 38.7 years, and the median household income is $41,944.
The racial makeup of the city is 97.3% White, 0.7% African American, 0.3% Native American, 0.2% Asian, 0.1% Pacific Islander, 0.3% from other races, and 1.2% from two or more races. The city has a Hispanic or Latino population of 1.2%.
Conclusion
Tama, Iowa is a small city located in Tama County in the state of Iowa. It is situated in the central part of the state, approximately 40 miles east of Des Moines. The city has a population of 2,877 people, according to the 2010 census. The city has a rich history of industry and agriculture, and a strong economy with a variety of industries located in the city. The city has a population density of 1,310 people per square mile, and a median household income of $41,944. The racial makeup of the city is 97.3% White, 0.7% African American, 0.3% Native American, 0.2% Asian, 0.1% Pacific Islander, 0.3% from other races, and 1.2% from two or more races. The city has a Hispanic or Latino population of 1.2%.
Common Questions
What is Per Capita Income in Tama?
Per Capita income in Tama is $24,944.
What is the Median Family Income in Tama?
Median Family Income in Tama is $65,469.
What is the Median Household income in Tama?
Median Household Income in Tama is $59,129.
What is Income or Wage Gap in Tama?
Income or Wage Gap in Tama is 36.4%.
Women in Tama earn 63.6 cents for every dollar earned by a man.
What is Inequality or Gini Index in Tama?
Inequality or Gini Index in Tama is 0.41.
What is the Total Population of Tama?
Total Population of Tama is 3,073.
What is the Total Male Population of Tama?
Total Male Population of Tama is 1,595.
What is the Total Female Population of Tama?
Total Female Population of Tama is 1,478.
What is the Ratio of Males per 100 Females in Tama?
There are 107.92 Males per 100 Females in Tama.
What is the Ratio of Females per 100 Males in Tama?
There are 92.66 Females per 100 Males in Tama.
What is the Median Population Age in Tama?
Median Population Age in Tama is 31.3 Years.
What is the Average Family Size in Tama
Average Family Size in Tama is 3.2 People.
What is the Average Household Size in Tama
Average Household Size in Tama is 2.8 People.
How Large is the Labor Force in Tama?
There are 1,390 People in the Labor Forcein in Tama.
What is the Percentage of People in the Labor Force in Tama?
64.0% of People are in the Labor Force in Tama.
What is the Unemployment Rate in Tama?
Unemployment Rate in Tama is 7.7%.