Westview, FL Map & Demographics
Westview Map
Westview Overview
$20,781
PER CAPITA INCOME
$65,929
AVG FAMILY INCOME
$44,538
AVG HOUSEHOLD INCOME
19.8%
WAGE / INCOME GAP [ % ]
80.2¢/ $1
WAGE / INCOME GAP [ $ ]
$9,733
FAMILY INCOME DEFICIT
0.45
INEQUALITY / GINI INDEX
10,992
TOTAL POPULATION
5,263
MALE POPULATION
5,729
FEMALE POPULATION
91.87
MALES / 100 FEMALES
108.85
FEMALES / 100 MALES
40.1
MEDIAN AGE
3.6
AVG FAMILY SIZE
3.1
AVG HOUSEHOLD SIZE
4,847
LABOR FORCE [ PEOPLE ]
55.6%
PERCENT IN LABOR FORCE
2.0%
UNEMPLOYMENT RATE
Income in Westview
Income Overview in Westview
Per Capita Income in Westview is $20,781, while median incomes of families and households are $65,929 and $44,538 respectively.
| Characteristic | Number | Measure |
| Per Capita Income | 10,992 | $20,781 |
| Median Family Income | 2,726 | $65,929 |
| Mean Family Income | 2,726 | $70,371 |
| Median Household Income | 3,488 | $44,538 |
| Mean Household Income | 3,488 | $61,656 |
| Income Deficit | 2,726 | $9,733 |
| Wage / Income Gap (%) | 10,992 | 19.84% |
| Wage / Income Gap ($) | 10,992 | 80.16¢ per $1 |
| Gini / Inequality Index | 10,992 | 0.45 |
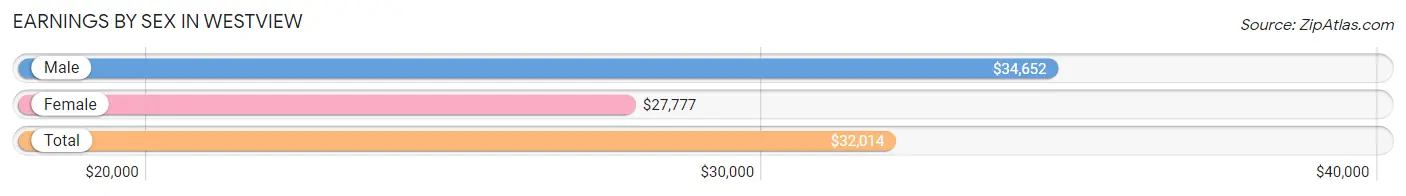
Earnings by Sex in Westview
Average Earnings in Westview are $32,014, $34,652 for men and $27,777 for women, a difference of 19.8%.
| Sex | Number | Average Earnings |
| Male | 2,567 (52.2%) | $34,652 |
| Female | 2,351 (47.8%) | $27,777 |
| Total | 4,918 (100.0%) | $32,014 |
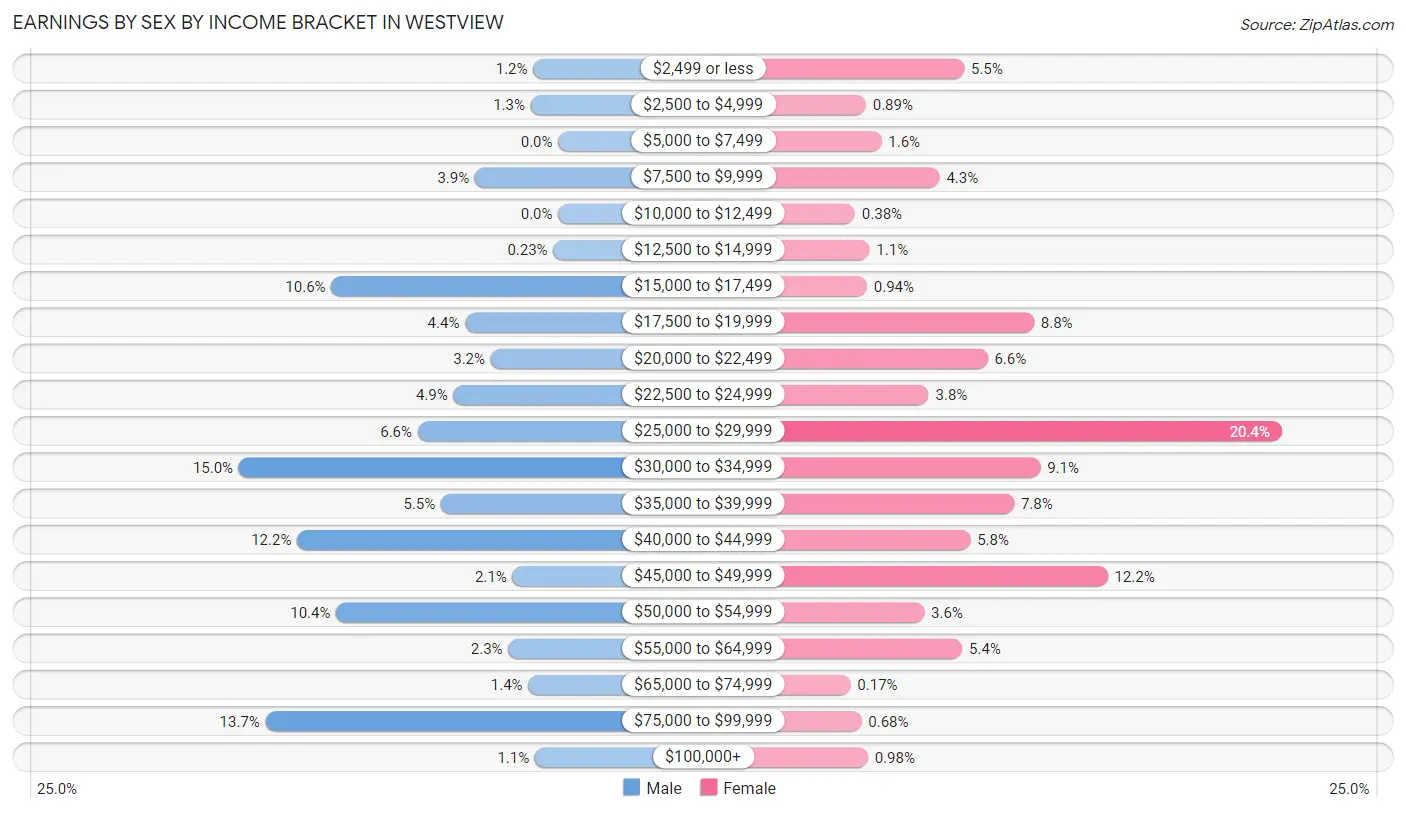
Earnings by Sex by Income Bracket in Westview
The most common earnings brackets in Westview are $30,000 to $34,999 for men (384 | 15.0%) and $25,000 to $29,999 for women (479 | 20.4%).
| Income | Male | Female |
| $2,499 or less | 30 (1.2%) | 129 (5.5%) |
| $2,500 to $4,999 | 33 (1.3%) | 21 (0.9%) |
| $5,000 to $7,499 | 0 (0.0%) | 38 (1.6%) |
| $7,500 to $9,999 | 100 (3.9%) | 102 (4.3%) |
| $10,000 to $12,499 | 0 (0.0%) | 9 (0.4%) |
| $12,500 to $14,999 | 6 (0.2%) | 25 (1.1%) |
| $15,000 to $17,499 | 273 (10.6%) | 22 (0.9%) |
| $17,500 to $19,999 | 112 (4.4%) | 206 (8.8%) |
| $20,000 to $22,499 | 81 (3.2%) | 155 (6.6%) |
| $22,500 to $24,999 | 126 (4.9%) | 90 (3.8%) |
| $25,000 to $29,999 | 169 (6.6%) | 479 (20.4%) |
| $30,000 to $34,999 | 384 (15.0%) | 213 (9.1%) |
| $35,000 to $39,999 | 141 (5.5%) | 184 (7.8%) |
| $40,000 to $44,999 | 314 (12.2%) | 136 (5.8%) |
| $45,000 to $49,999 | 55 (2.1%) | 287 (12.2%) |
| $50,000 to $54,999 | 267 (10.4%) | 85 (3.6%) |
| $55,000 to $64,999 | 60 (2.3%) | 127 (5.4%) |
| $65,000 to $74,999 | 36 (1.4%) | 4 (0.2%) |
| $75,000 to $99,999 | 352 (13.7%) | 16 (0.7%) |
| $100,000+ | 28 (1.1%) | 23 (1.0%) |
| Total | 2,567 (100.0%) | 2,351 (100.0%) |
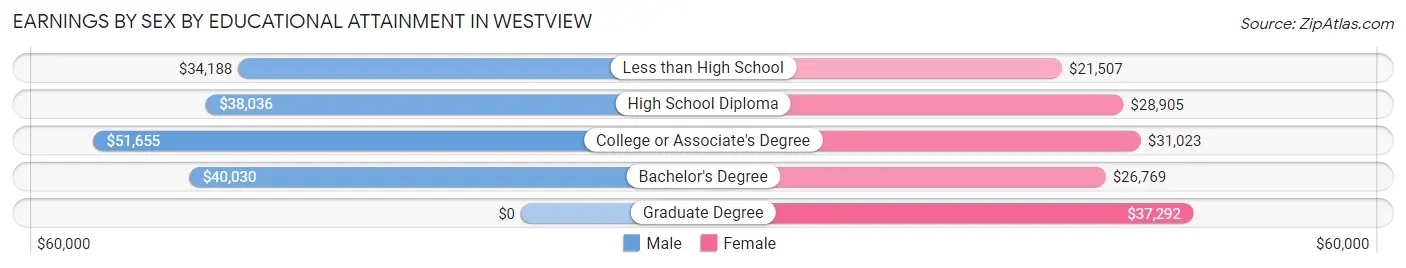
Earnings by Sex by Educational Attainment in Westview
Average earnings in Westview are $40,379 for men and $28,562 for women, a difference of 29.3%. Men with an educational attainment of college or associate's degree enjoy the highest average annual earnings of $51,655, while those with less than high school education earn the least with $34,188. Women with an educational attainment of graduate degree earn the most with the average annual earnings of $37,292, while those with less than high school education have the smallest earnings of $21,507.
| Educational Attainment | Male Income | Female Income |
| Less than High School | $34,188 | $21,507 |
| High School Diploma | $38,036 | $28,905 |
| College or Associate's Degree | $51,655 | $31,023 |
| Bachelor's Degree | $40,030 | $26,769 |
| Graduate Degree | - | - |
| Total | $40,379 | $28,562 |
Family Income in Westview
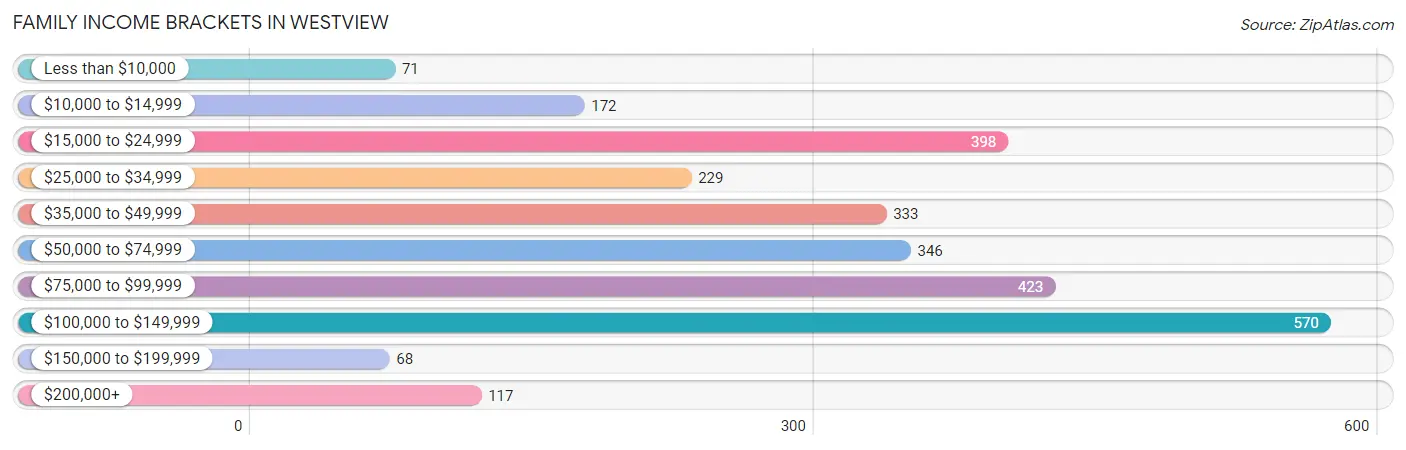
Family Income Brackets in Westview
According to the Westview family income data, there are 570 families falling into the $100,000 to $149,999 income range, which is the most common income bracket and makes up 20.9% of all families. Conversely, the $150,000 to $199,999 income bracket is the least frequent group with only 68 families (2.5%) belonging to this category.
| Income Bracket | # Families | % Families |
| Less than $10,000 | 71 | 2.6% |
| $10,000 to $14,999 | 172 | 6.3% |
| $15,000 to $24,999 | 398 | 14.6% |
| $25,000 to $34,999 | 229 | 8.4% |
| $35,000 to $49,999 | 333 | 12.2% |
| $50,000 to $74,999 | 346 | 12.7% |
| $75,000 to $99,999 | 423 | 15.5% |
| $100,000 to $149,999 | 570 | 20.9% |
| $150,000 to $199,999 | 68 | 2.5% |
| $200,000+ | 117 | 4.3% |
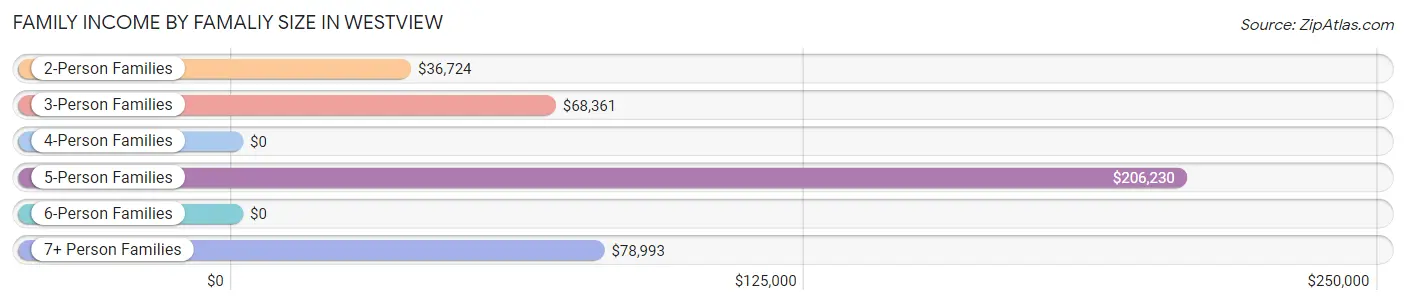
Family Income by Famaliy Size in Westview
5-person families (167 | 6.1%) account for the highest median family income in Westview with $206,230 per family, while 5-person families (167 | 6.1%) have the highest median income of $41,246 per family member.
| Income Bracket | # Families | Median Income |
| 2-Person Families | 936 (34.3%) | $36,724 |
| 3-Person Families | 924 (33.9%) | $68,361 |
| 4-Person Families | 503 (18.4%) | $0 |
| 5-Person Families | 167 (6.1%) | $206,230 |
| 6-Person Families | 55 (2.0%) | $0 |
| 7+ Person Families | 141 (5.2%) | $78,993 |
| Total | 2,726 (100.0%) | $65,929 |
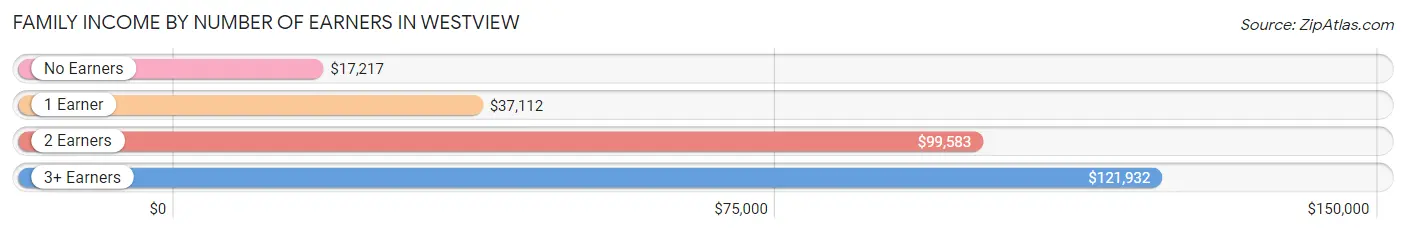
Family Income by Number of Earners in Westview
The median family income in Westview is $65,929, with families comprising 3+ earners (338) having the highest median family income of $121,932, while families with no earners (478) have the lowest median family income of $17,217, accounting for 12.4% and 17.5% of families, respectively.
| Number of Earners | # Families | Median Income |
| No Earners | 478 (17.5%) | $17,217 |
| 1 Earner | 921 (33.8%) | $37,112 |
| 2 Earners | 989 (36.3%) | $99,583 |
| 3+ Earners | 338 (12.4%) | $121,932 |
| Total | 2,726 (100.0%) | $65,929 |
Household Income in Westview
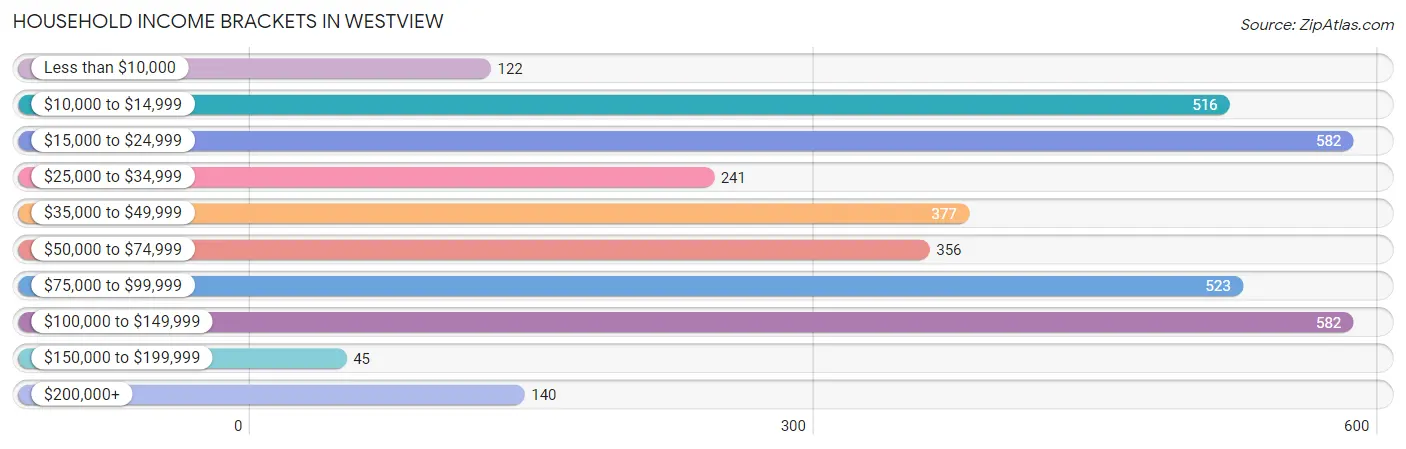
Household Income Brackets in Westview
With 582 households falling in the category, the $15,000 to $24,999 income range is the most frequent in Westview, accounting for 16.7% of all households. In contrast, only 45 households (1.3%) fall into the $150,000 to $199,999 income bracket, making it the least populous group.
| Income Bracket | # Households | % Households |
| Less than $10,000 | 122 | 3.5% |
| $10,000 to $14,999 | 516 | 14.8% |
| $15,000 to $24,999 | 582 | 16.7% |
| $25,000 to $34,999 | 241 | 6.9% |
| $35,000 to $49,999 | 377 | 10.8% |
| $50,000 to $74,999 | 356 | 10.2% |
| $75,000 to $99,999 | 523 | 15.0% |
| $100,000 to $149,999 | 582 | 16.7% |
| $150,000 to $199,999 | 45 | 1.3% |
| $200,000+ | 140 | 4.0% |
Household Income by Householder Age in Westview
The median household income in Westview is $44,538, with the highest median household income of $93,237 found in the 45 to 64 years age bracket for the primary householder. A total of 1,403 households (40.2%) fall into this category. Meanwhile, the 15 to 24 years age bracket for the primary householder has the lowest median household income of $0, with 15 households (0.4%) in this group.
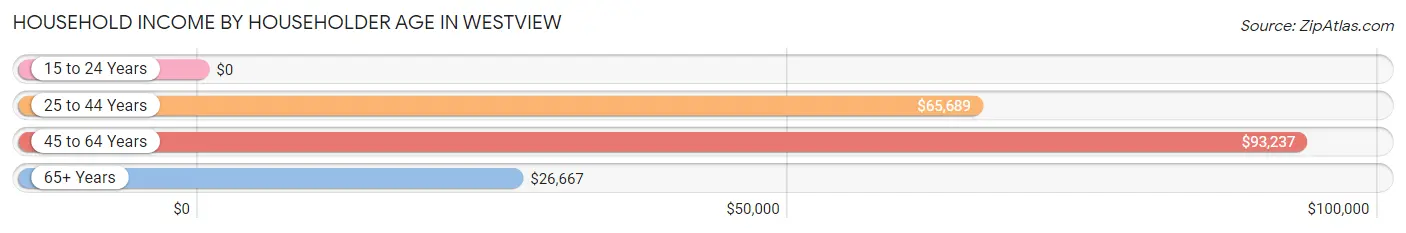
| Income Bracket | # Households | Median Income |
| 15 to 24 Years | 15 (0.4%) | $0 |
| 25 to 44 Years | 910 (26.1%) | $65,689 |
| 45 to 64 Years | 1,403 (40.2%) | $93,237 |
| 65+ Years | 1,160 (33.3%) | $26,667 |
| Total | 3,488 (100.0%) | $44,538 |
Poverty in Westview
Income Below Poverty by Sex and Age in Westview
With 20.6% poverty level for males and 29.1% for females among the residents of Westview, 16 and 17 year old males and 6 to 11 year old females are the most vulnerable to poverty, with 31 males (100.0%) and 307 females (60.9%) in their respective age groups living below the poverty level.
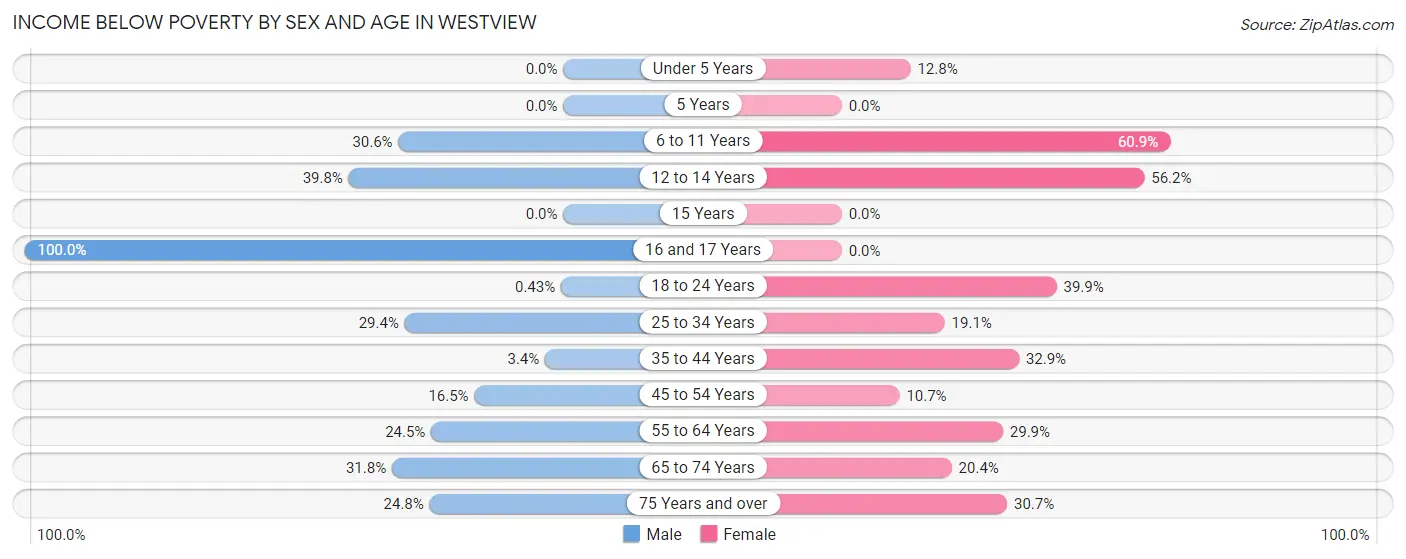
| Age Bracket | Male | Female |
| Under 5 Years | 0 (0.0%) | 13 (12.8%) |
| 5 Years | 0 (0.0%) | 0 (0.0%) |
| 6 to 11 Years | 187 (30.6%) | 307 (60.9%) |
| 12 to 14 Years | 147 (39.8%) | 73 (56.1%) |
| 15 Years | 0 (0.0%) | 0 (0.0%) |
| 16 and 17 Years | 31 (100.0%) | 0 (0.0%) |
| 18 to 24 Years | 2 (0.4%) | 177 (39.9%) |
| 25 to 34 Years | 209 (29.4%) | 118 (19.1%) |
| 35 to 44 Years | 22 (3.4%) | 292 (32.9%) |
| 45 to 54 Years | 98 (16.5%) | 73 (10.7%) |
| 55 to 64 Years | 156 (24.5%) | 296 (29.9%) |
| 65 to 74 Years | 195 (31.8%) | 157 (20.4%) |
| 75 Years and over | 38 (24.8%) | 131 (30.7%) |
| Total | 1,085 (20.6%) | 1,637 (29.1%) |
Income Above Poverty by Sex and Age in Westview
According to the poverty statistics in Westview, males aged under 5 years and females aged 15 years are the age groups that are most secure financially, with 100.0% of males and 100.0% of females in these age groups living above the poverty line.
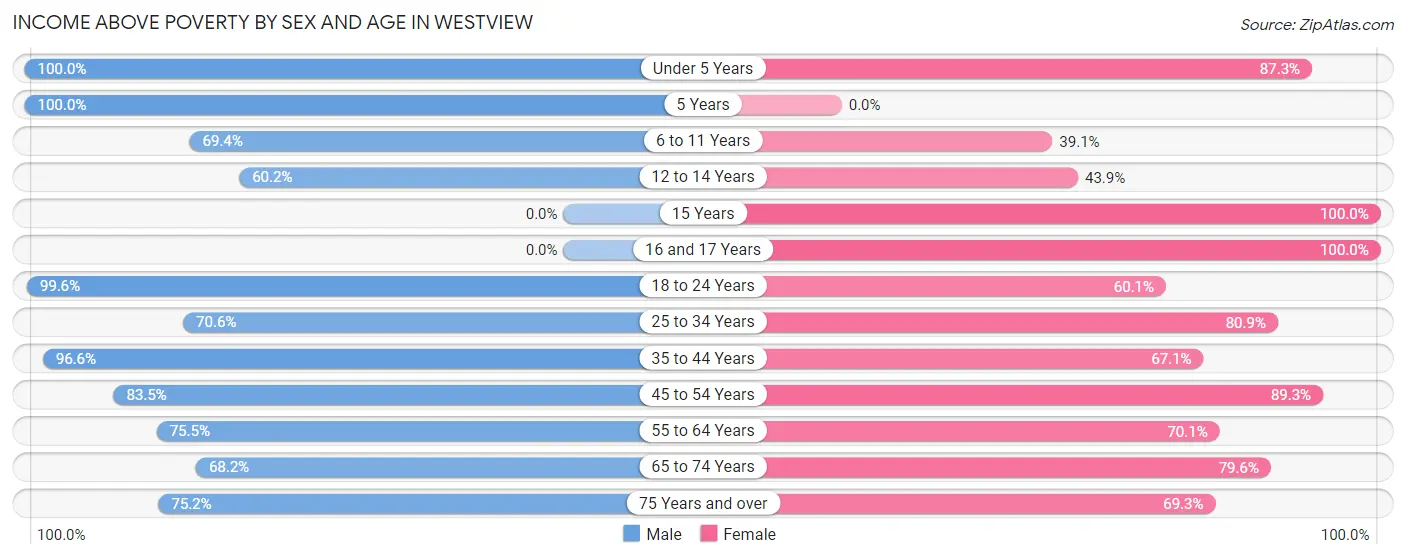
| Age Bracket | Male | Female |
| Under 5 Years | 330 (100.0%) | 89 (87.3%) |
| 5 Years | 95 (100.0%) | 0 (0.0%) |
| 6 to 11 Years | 424 (69.4%) | 197 (39.1%) |
| 12 to 14 Years | 222 (60.2%) | 57 (43.9%) |
| 15 Years | 0 (0.0%) | 31 (100.0%) |
| 16 and 17 Years | 0 (0.0%) | 41 (100.0%) |
| 18 to 24 Years | 468 (99.6%) | 267 (60.1%) |
| 25 to 34 Years | 501 (70.6%) | 500 (80.9%) |
| 35 to 44 Years | 629 (96.6%) | 596 (67.1%) |
| 45 to 54 Years | 496 (83.5%) | 609 (89.3%) |
| 55 to 64 Years | 480 (75.5%) | 694 (70.1%) |
| 65 to 74 Years | 418 (68.2%) | 613 (79.6%) |
| 75 Years and over | 115 (75.2%) | 296 (69.3%) |
| Total | 4,178 (79.4%) | 3,990 (70.9%) |
Income Below Poverty Among Married-Couple Families in Westview
The poverty statistics for married-couple families in Westview show that 13.0% or 211 of the total 1,626 families live below the poverty line. Families with 3 or 4 children have the highest poverty rate of 100.0%, comprising of 11 families. On the other hand, families with 5 or more children have the lowest poverty rate of 0.0%, which includes 0 families.
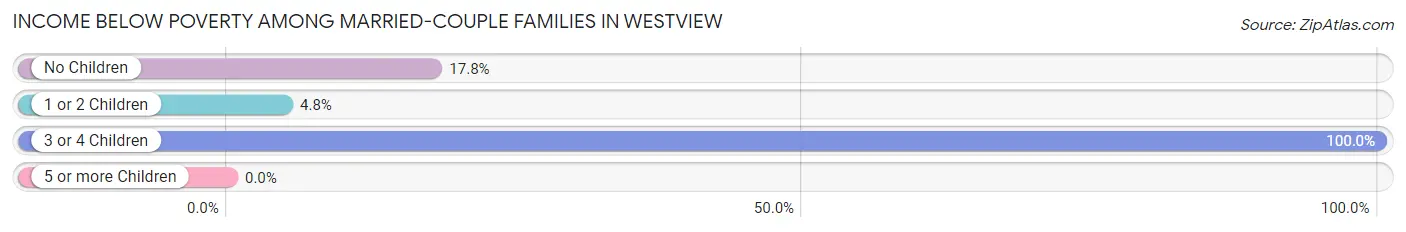
| Children | Above Poverty | Below Poverty |
| No Children | 790 (82.2%) | 171 (17.8%) |
| 1 or 2 Children | 576 (95.2%) | 29 (4.8%) |
| 3 or 4 Children | 0 (0.0%) | 11 (100.0%) |
| 5 or more Children | 49 (100.0%) | 0 (0.0%) |
| Total | 1,415 (87.0%) | 211 (13.0%) |
Income Below Poverty Among Single-Parent Households in Westview
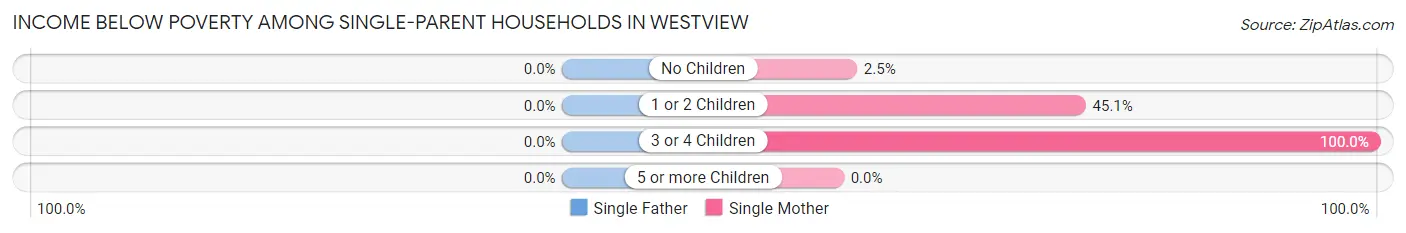
| Children | Single Father | Single Mother |
| No Children | 0 (0.0%) | 10 (2.5%) |
| 1 or 2 Children | 0 (0.0%) | 192 (45.1%) |
| 3 or 4 Children | 0 (0.0%) | 94 (100.0%) |
| 5 or more Children | 0 (0.0%) | 0 (0.0%) |
| Total | 0 (0.0%) | 296 (32.0%) |
Income Below Poverty Among Married-Couple vs Single-Parent Households in Westview
The poverty data for Westview shows that 211 of the married-couple family households (13.0%) and 296 of the single-parent households (26.9%) are living below the poverty level. Within the married-couple family households, those with 3 or 4 children have the highest poverty rate, with 11 households (100.0%) falling below the poverty line. Among the single-parent households, those with 3 or 4 children have the highest poverty rate, with 94 household (100.0%) living below poverty.
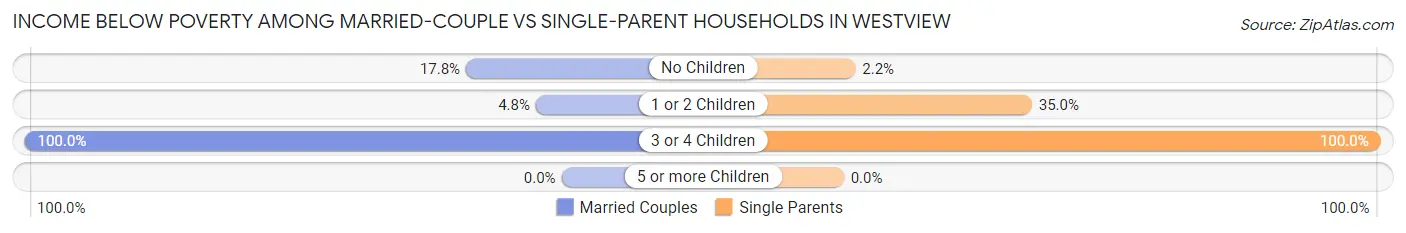
| Children | Married-Couple Families | Single-Parent Households |
| No Children | 171 (17.8%) | 10 (2.2%) |
| 1 or 2 Children | 29 (4.8%) | 192 (35.0%) |
| 3 or 4 Children | 11 (100.0%) | 94 (100.0%) |
| 5 or more Children | 0 (0.0%) | 0 (0.0%) |
| Total | 211 (13.0%) | 296 (26.9%) |
Race in Westview
The most populous races in Westview are Black / African American (6,395 | 58.2%), Hispanic or Latino (4,586 | 41.7%), and White / Caucasian (2,525 | 23.0%).
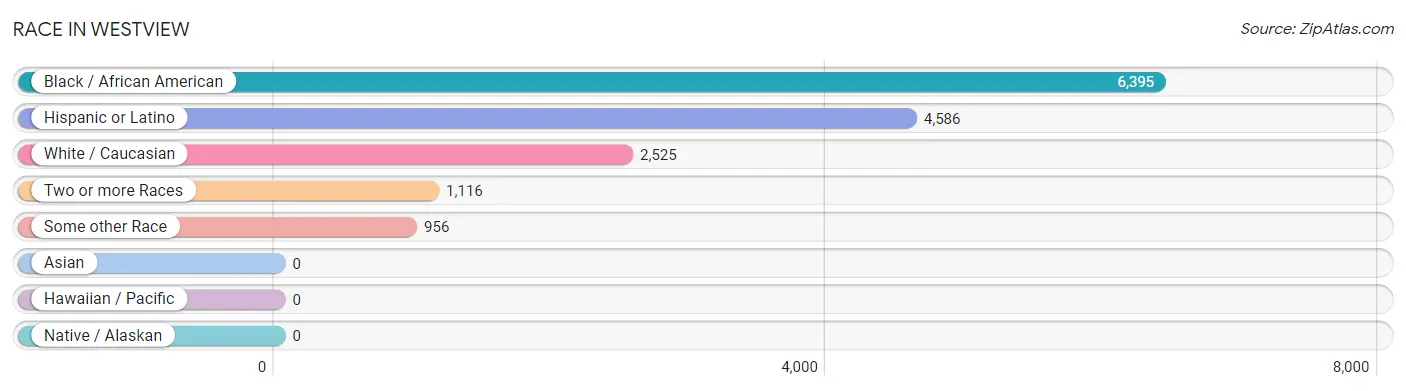
| Race | # Population | % Population |
| Asian | 0 | 0.0% |
| Black / African American | 6,395 | 58.2% |
| Hawaiian / Pacific | 0 | 0.0% |
| Hispanic or Latino | 4,586 | 41.7% |
| Native / Alaskan | 0 | 0.0% |
| White / Caucasian | 2,525 | 23.0% |
| Two or more Races | 1,116 | 10.2% |
| Some other Race | 956 | 8.7% |
| Total | 10,992 | 100.0% |
Ancestry in Westview
The most populous ancestries reported in Westview are Cuban (2,277 | 20.7%), Haitian (1,403 | 12.8%), Central American (1,395 | 12.7%), Honduran (857 | 7.8%), and American (806 | 7.3%), together accounting for 61.3% of all Westview residents.
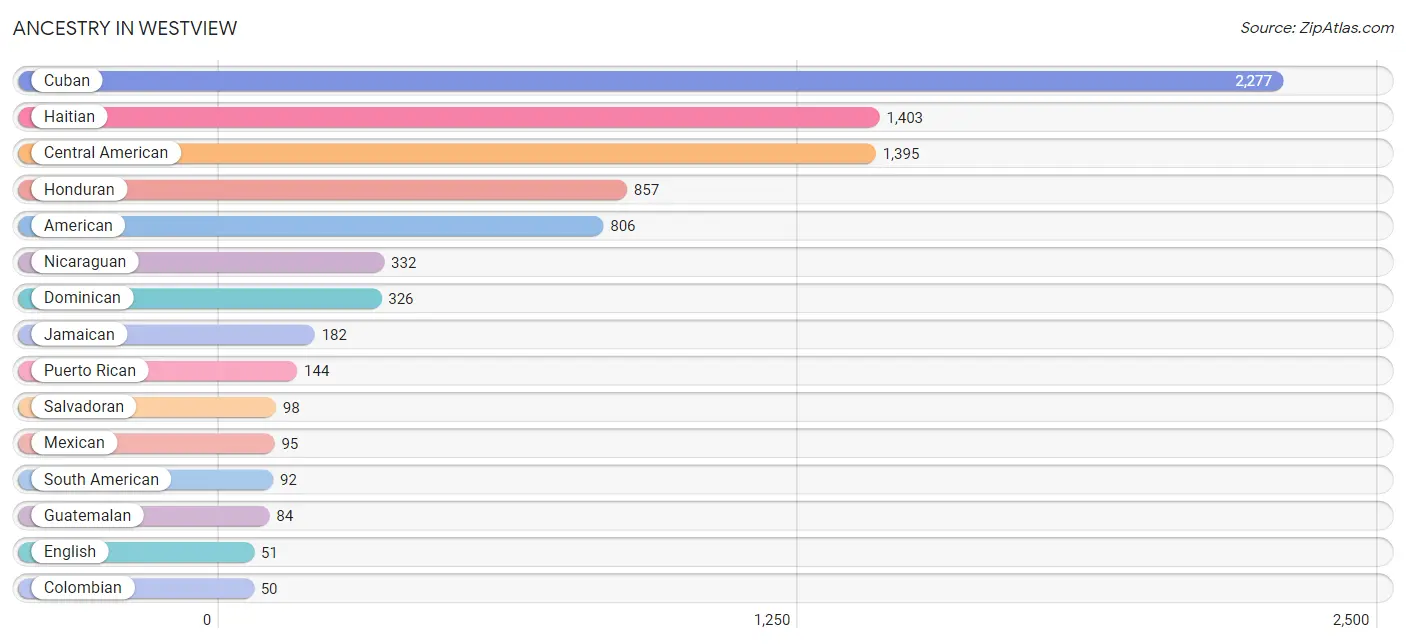
| Ancestry | # Population | % Population |
| African | 21 | 0.2% |
| American | 806 | 7.3% |
| Brazilian | 26 | 0.2% |
| British | 2 | 0.0% |
| British West Indian | 5 | 0.1% |
| Central American | 1,395 | 12.7% |
| Colombian | 50 | 0.4% |
| Costa Rican | 24 | 0.2% |
| Cuban | 2,277 | 20.7% |
| Dominican | 326 | 3.0% |
| English | 51 | 0.5% |
| French | 13 | 0.1% |
| German | 13 | 0.1% |
| Guatemalan | 84 | 0.8% |
| Haitian | 1,403 | 12.8% |
| Honduran | 857 | 7.8% |
| Indian (Asian) | 16 | 0.2% |
| Irish | 19 | 0.2% |
| Jamaican | 182 | 1.7% |
| Mexican | 95 | 0.9% |
| Nicaraguan | 332 | 3.0% |
| Peruvian | 42 | 0.4% |
| Puerto Rican | 144 | 1.3% |
| Russian | 27 | 0.3% |
| Salvadoran | 98 | 0.9% |
| Scottish | 10 | 0.1% |
| South American | 92 | 0.8% |
| Spaniard | 16 | 0.2% |
| Subsaharan African | 21 | 0.2% |
| Trinidadian and Tobagonian | 5 | 0.1% | View All 30 Rows |
Immigrants in Westview
The most numerous immigrant groups reported in Westview came from Latin America (4,562 | 41.5%), Caribbean (3,169 | 28.8%), Cuba (1,837 | 16.7%), Central America (1,220 | 11.1%), and Haiti (729 | 6.6%), together accounting for 104.8% of all Westview residents.
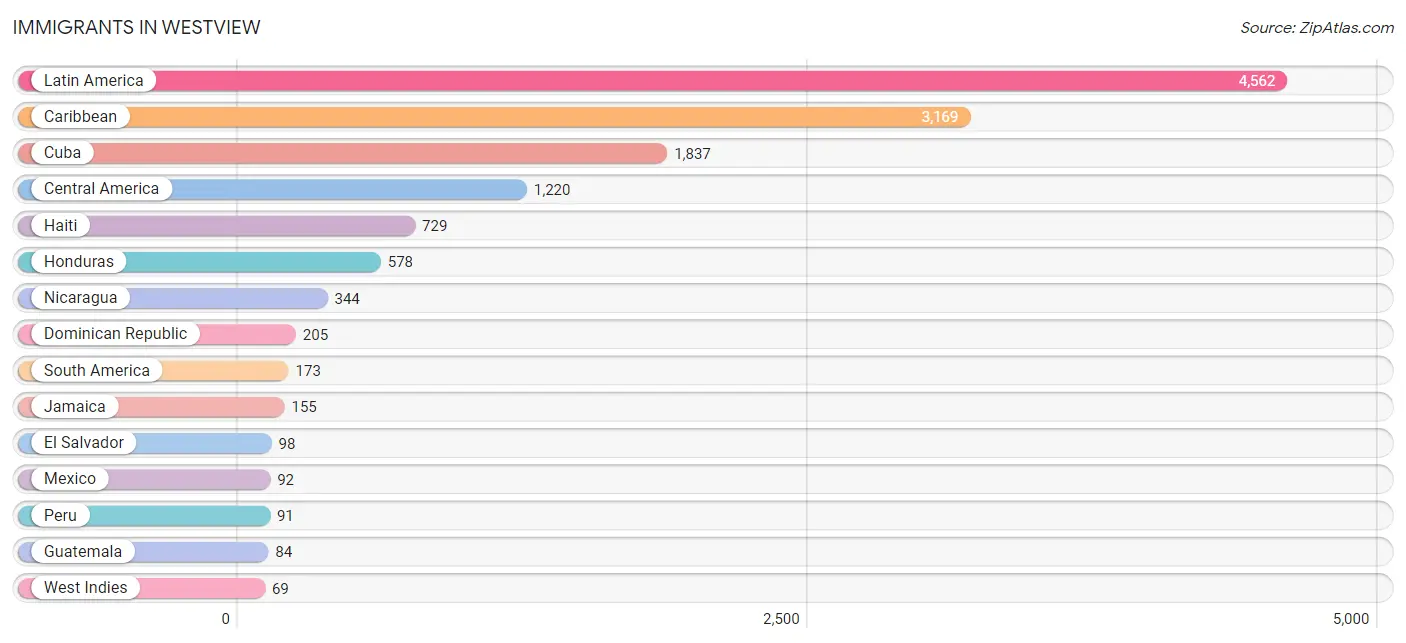
| Immigration Origin | # Population | % Population |
| Bahamas | 62 | 0.6% |
| Brazil | 26 | 0.2% |
| Caribbean | 3,169 | 28.8% |
| Central America | 1,220 | 11.1% |
| Colombia | 56 | 0.5% |
| Costa Rica | 24 | 0.2% |
| Cuba | 1,837 | 16.7% |
| Dominica | 47 | 0.4% |
| Dominican Republic | 205 | 1.9% |
| Eastern Europe | 27 | 0.3% |
| El Salvador | 98 | 0.9% |
| Europe | 27 | 0.3% |
| Guatemala | 84 | 0.8% |
| Haiti | 729 | 6.6% |
| Honduras | 578 | 5.3% |
| Jamaica | 155 | 1.4% |
| Latin America | 4,562 | 41.5% |
| Mexico | 92 | 0.8% |
| Nicaragua | 344 | 3.1% |
| Peru | 91 | 0.8% |
| Russia | 27 | 0.3% |
| South America | 173 | 1.6% |
| St. Vincent and the Grenadines | 5 | 0.1% |
| Trinidad and Tobago | 5 | 0.1% |
| West Indies | 69 | 0.6% | View All 25 Rows |
Sex and Age in Westview
Sex and Age in Westview
The most populous age groups in Westview are 10 to 14 Years (685 | 13.0%) for men and 35 to 39 Years (624 | 10.9%) for women.
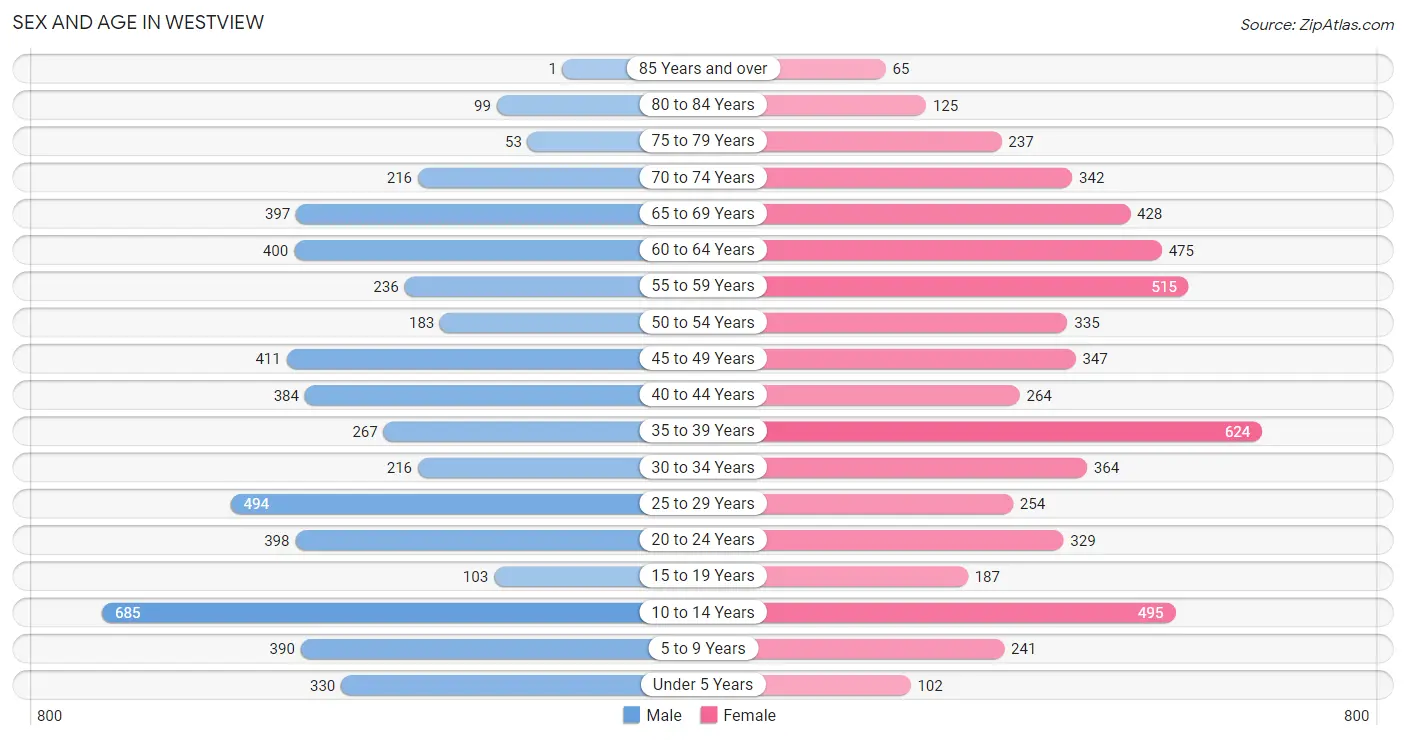
| Age Bracket | Male | Female |
| Under 5 Years | 330 (6.3%) | 102 (1.8%) |
| 5 to 9 Years | 390 (7.4%) | 241 (4.2%) |
| 10 to 14 Years | 685 (13.0%) | 495 (8.6%) |
| 15 to 19 Years | 103 (2.0%) | 187 (3.3%) |
| 20 to 24 Years | 398 (7.6%) | 329 (5.7%) |
| 25 to 29 Years | 494 (9.4%) | 254 (4.4%) |
| 30 to 34 Years | 216 (4.1%) | 364 (6.4%) |
| 35 to 39 Years | 267 (5.1%) | 624 (10.9%) |
| 40 to 44 Years | 384 (7.3%) | 264 (4.6%) |
| 45 to 49 Years | 411 (7.8%) | 347 (6.1%) |
| 50 to 54 Years | 183 (3.5%) | 335 (5.9%) |
| 55 to 59 Years | 236 (4.5%) | 515 (9.0%) |
| 60 to 64 Years | 400 (7.6%) | 475 (8.3%) |
| 65 to 69 Years | 397 (7.5%) | 428 (7.5%) |
| 70 to 74 Years | 216 (4.1%) | 342 (6.0%) |
| 75 to 79 Years | 53 (1.0%) | 237 (4.1%) |
| 80 to 84 Years | 99 (1.9%) | 125 (2.2%) |
| 85 Years and over | 1 (0.0%) | 65 (1.1%) |
| Total | 5,263 (100.0%) | 5,729 (100.0%) |
Families and Households in Westview
Median Family Size in Westview
The median family size in Westview is 3.61 persons per family, with married-couple families (1,626 | 59.7%) accounting for the largest median family size of 3.64 persons per family. On the other hand, single male/father families (175 | 6.4%) represent the smallest median family size with 3.51 persons per family.
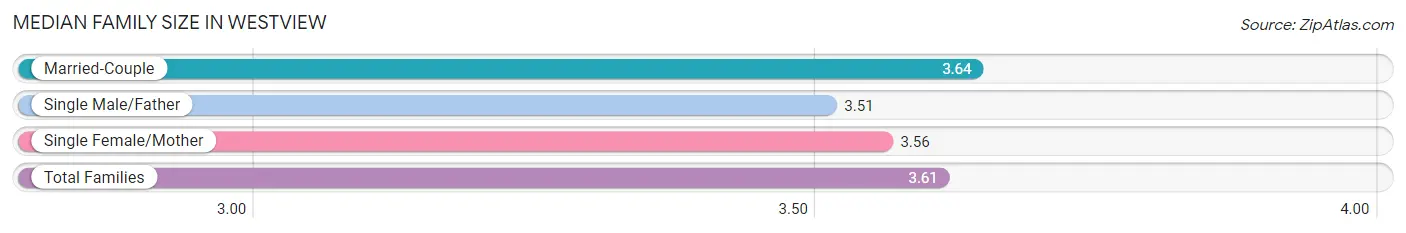
| Family Type | # Families | Family Size |
| Married-Couple | 1,626 (59.7%) | 3.64 |
| Single Male/Father | 175 (6.4%) | 3.51 |
| Single Female/Mother | 925 (33.9%) | 3.56 |
| Total Families | 2,726 (100.0%) | 3.61 |
Median Household Size in Westview
The median household size in Westview is 3.15 persons per household, with single male/father households (175 | 5.0%) accounting for the largest median household size of 3.88 persons per household. non-family households (762 | 21.8%) represent the smallest median household size with 1.08 persons per household.
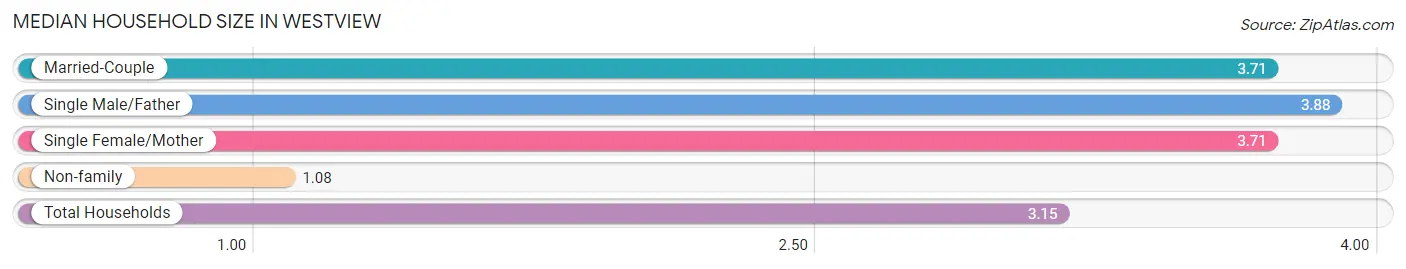
| Household Type | # Households | Household Size |
| Married-Couple | 1,626 (46.6%) | 3.71 |
| Single Male/Father | 175 (5.0%) | 3.88 |
| Single Female/Mother | 925 (26.5%) | 3.71 |
| Non-family | 762 (21.8%) | 1.08 |
| Total Households | 3,488 (100.0%) | 3.15 |
Household Size by Marriage Status in Westview
Out of a total of 3,488 households in Westview, 2,726 (78.1%) are family households, while 762 (21.8%) are nonfamily households. The most numerous type of family households are 2-person households, comprising 925, and the most common type of nonfamily households are 1-person households, comprising 709.
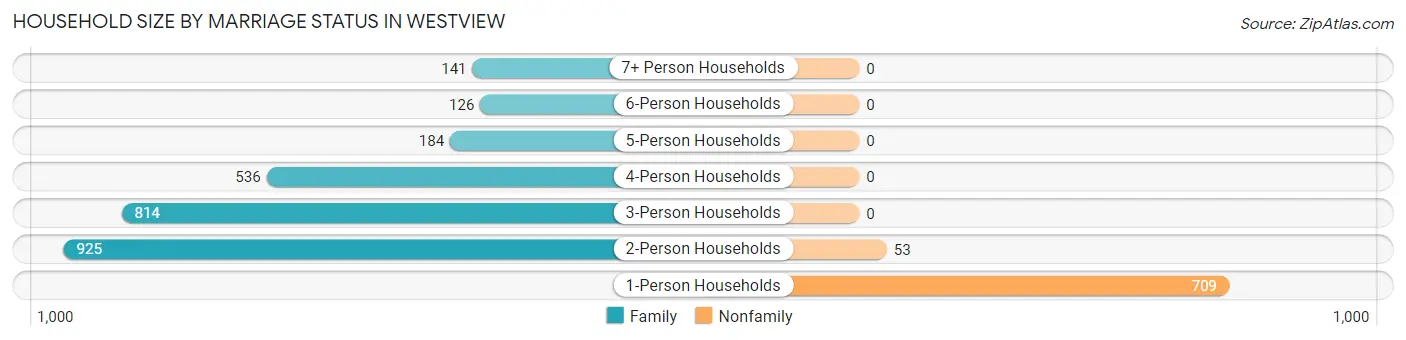
| Household Size | Family Households | Nonfamily Households |
| 1-Person Households | - | 709 (20.3%) |
| 2-Person Households | 925 (26.5%) | 53 (1.5%) |
| 3-Person Households | 814 (23.3%) | 0 (0.0%) |
| 4-Person Households | 536 (15.4%) | 0 (0.0%) |
| 5-Person Households | 184 (5.3%) | 0 (0.0%) |
| 6-Person Households | 126 (3.6%) | 0 (0.0%) |
| 7+ Person Households | 141 (4.0%) | 0 (0.0%) |
| Total | 2,726 (78.1%) | 762 (21.8%) |
Female Fertility in Westview
Fertility by Age in Westview
Average fertility rate in Westview is 35.0 births per 1,000 women. Women in the age bracket of 20 to 34 years have the highest fertility rate with 90.0 births per 1,000 women. Women in the age bracket of 20 to 34 years acount for 100.0% of all women with births.
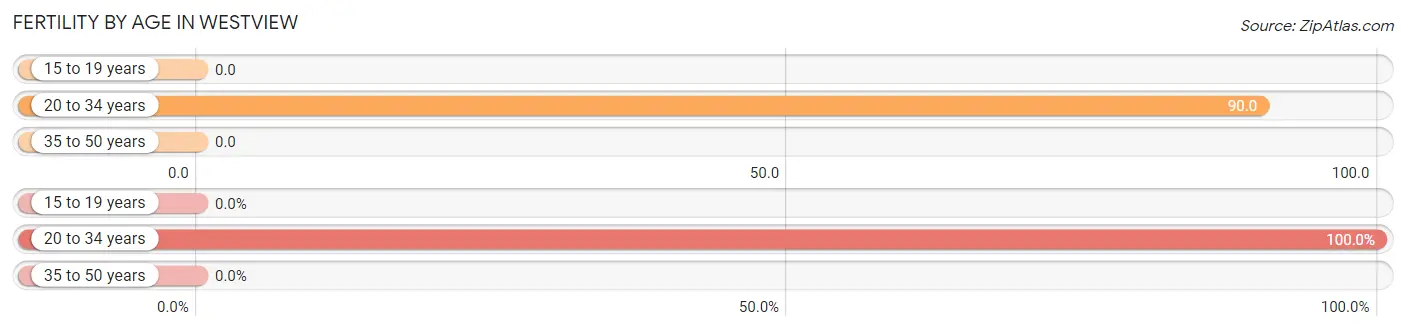
| Age Bracket | Women with Births | Births / 1,000 Women |
| 15 to 19 years | 0 (0.0%) | 0.0 |
| 20 to 34 years | 85 (100.0%) | 90.0 |
| 35 to 50 years | 0 (0.0%) | 0.0 |
| Total | 85 (100.0%) | 35.0 |
Fertility by Age by Marriage Status in Westview
43.5% of women with births (85) in Westview are married. The highest percentage of unmarried women with births falls into 20 to 34 years age bracket with 56.5% of them unmarried at the time of birth, while the lowest percentage of unmarried women with births belong to 20 to 34 years age bracket with 56.5% of them unmarried.
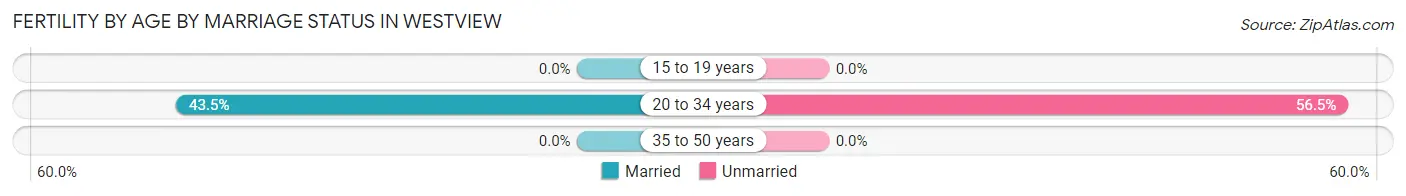
| Age Bracket | Married | Unmarried |
| 15 to 19 years | 0 (0.0%) | 0 (0.0%) |
| 20 to 34 years | 37 (43.5%) | 48 (56.5%) |
| 35 to 50 years | 0 (0.0%) | 0 (0.0%) |
| Total | 37 (43.5%) | 48 (56.5%) |
Fertility by Education in Westview
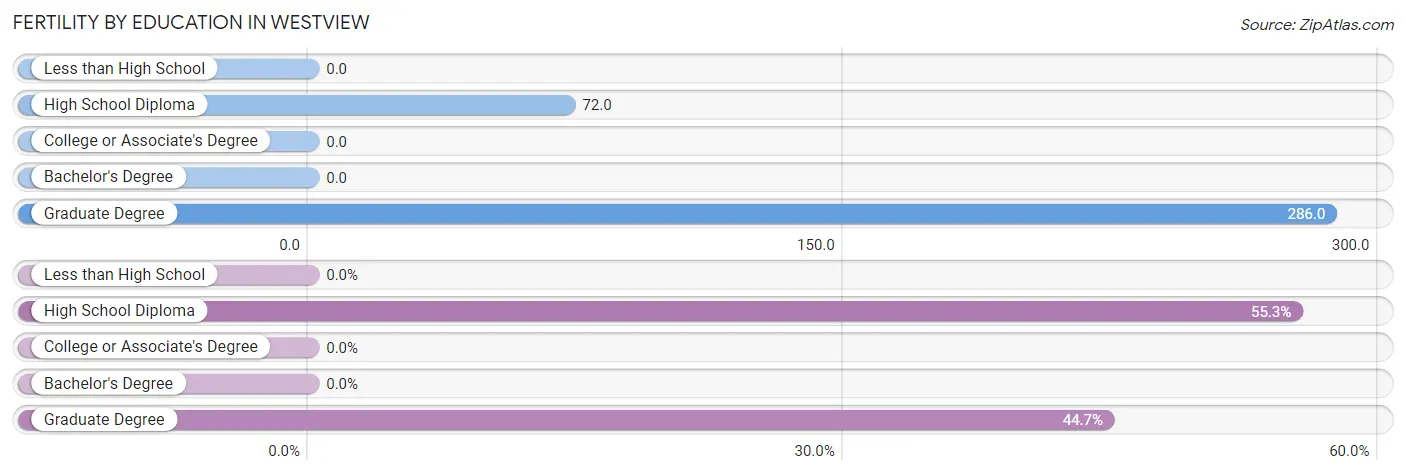
| Educational Attainment | Women with Births | Births / 1,000 Women |
| Less than High School | 0 (0.0%) | 0.0 |
| High School Diploma | 47 (55.3%) | 72.0 |
| College or Associate's Degree | 0 (0.0%) | 0.0 |
| Bachelor's Degree | 0 (0.0%) | 0.0 |
| Graduate Degree | 38 (44.7%) | 286.0 |
| Total | 85 (100.0%) | 35.0 |
Fertility by Education by Marriage Status in Westview
56.5% of women with births in Westview are unmarried. Women with the educational attainment of high school diploma are most likely to be married with 78.7% of them married at childbirth, while women with the educational attainment of graduate degree are least likely to be married with 100.0% of them unmarried at childbirth.
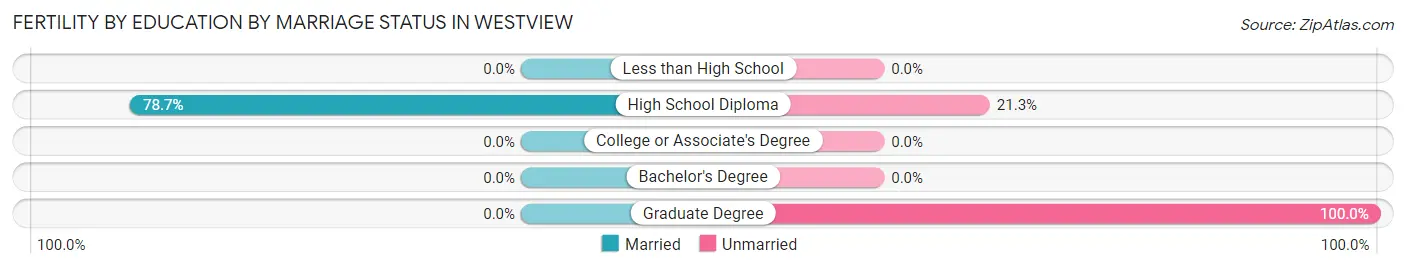
| Educational Attainment | Married | Unmarried |
| Less than High School | 0 (0.0%) | 0 (0.0%) |
| High School Diploma | 37 (78.7%) | 10 (21.3%) |
| College or Associate's Degree | 0 (0.0%) | 0 (0.0%) |
| Bachelor's Degree | 0 (0.0%) | 0 (0.0%) |
| Graduate Degree | 0 (0.0%) | 38 (100.0%) |
| Total | 37 (43.5%) | 48 (56.5%) |
Employment Characteristics in Westview
Employment by Class of Employer in Westview
Among the 4,735 employed individuals in Westview, private company employees (3,166 | 66.9%), local government employees (407 | 8.6%), and federal government employees (365 | 7.7%) make up the most common classes of employment.
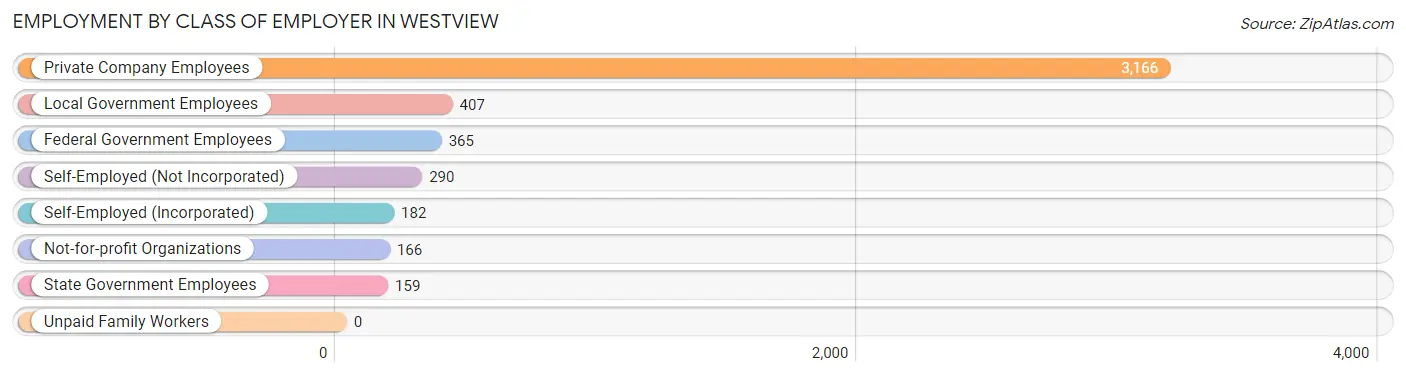
| Employer Class | # Employees | % Employees |
| Private Company Employees | 3,166 | 66.9% |
| Self-Employed (Incorporated) | 182 | 3.8% |
| Self-Employed (Not Incorporated) | 290 | 6.1% |
| Not-for-profit Organizations | 166 | 3.5% |
| Local Government Employees | 407 | 8.6% |
| State Government Employees | 159 | 3.4% |
| Federal Government Employees | 365 | 7.7% |
| Unpaid Family Workers | 0 | 0.0% |
| Total | 4,735 | 100.0% |
Employment Status by Age in Westview
According to the labor force statistics for Westview, out of the total population over 16 years of age (8,718), 55.6% or 4,847 individuals are in the labor force, with 2.0% or 97 of them unemployed. The age group with the highest labor force participation rate is 45 to 54 years, with 84.3% or 1,076 individuals in the labor force. Within the labor force, the 65 to 74 years age range has the highest percentage of unemployed individuals, with 8.0% or 15 of them being unemployed.
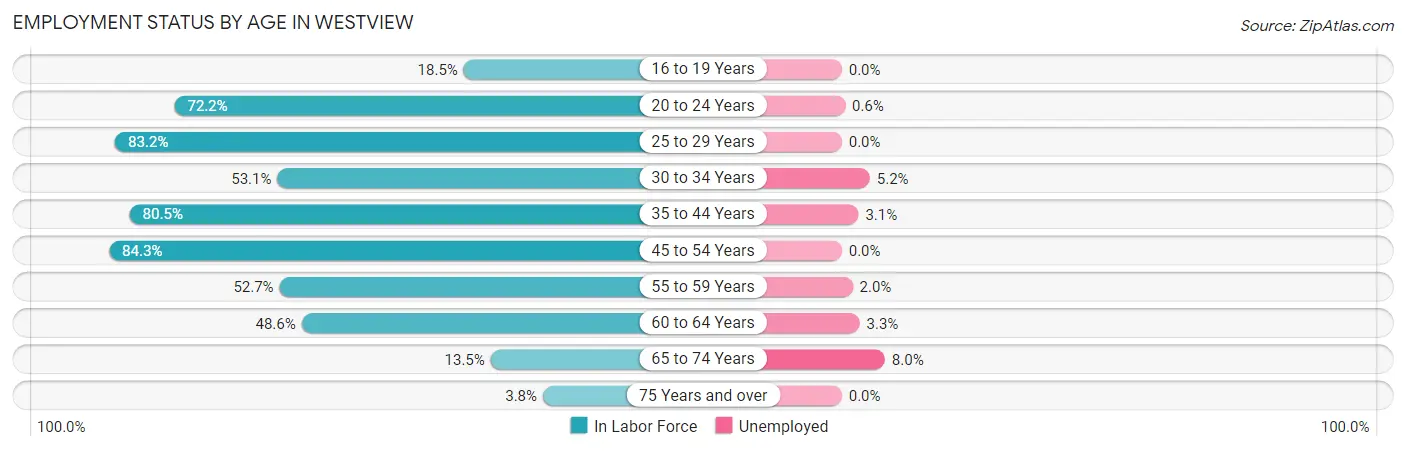
| Age Bracket | In Labor Force | Unemployed |
| 16 to 19 Years | 48 (18.5%) | 0 (0.0%) |
| 20 to 24 Years | 525 (72.2%) | 3 (0.6%) |
| 25 to 29 Years | 622 (83.2%) | 0 (0.0%) |
| 30 to 34 Years | 308 (53.1%) | 16 (5.2%) |
| 35 to 44 Years | 1,239 (80.5%) | 38 (3.1%) |
| 45 to 54 Years | 1,076 (84.3%) | 0 (0.0%) |
| 55 to 59 Years | 396 (52.7%) | 8 (2.0%) |
| 60 to 64 Years | 425 (48.6%) | 14 (3.3%) |
| 65 to 74 Years | 187 (13.5%) | 15 (8.0%) |
| 75 Years and over | 22 (3.8%) | 0 (0.0%) |
| Total | 4,847 (55.6%) | 97 (2.0%) |
Employment Status by Educational Attainment in Westview
According to labor force statistics for Westview, 70.5% of individuals (4,067) out of the total population between 25 and 64 years of age (5,769) are in the labor force, with 1.9% or 77 of them being unemployed. The group with the highest labor force participation rate are those with the educational attainment of bachelor's degree or higher, with 93.9% or 976 individuals in the labor force. Within the labor force, individuals with less than high school education have the highest percentage of unemployment, with 3.4% or 16 of them being unemployed.
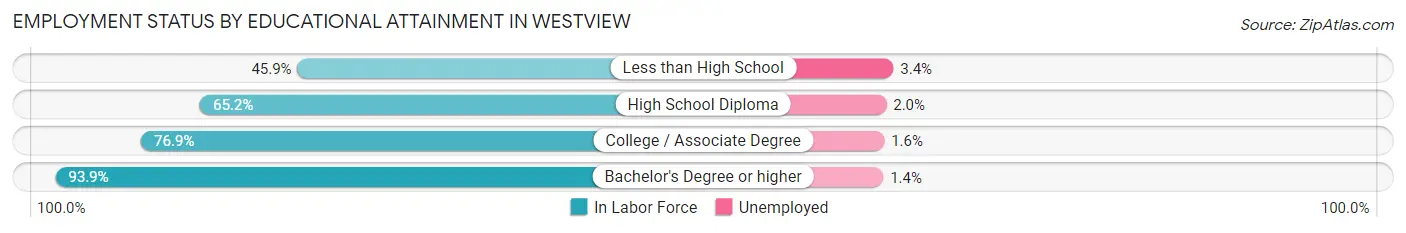
| Educational Attainment | In Labor Force | Unemployed |
| Less than High School | 467 (45.9%) | 35 (3.4%) |
| High School Diploma | 1,286 (65.2%) | 39 (2.0%) |
| College / Associate Degree | 1,339 (76.9%) | 28 (1.6%) |
| Bachelor's Degree or higher | 976 (93.9%) | 15 (1.4%) |
| Total | 4,067 (70.5%) | 110 (1.9%) |
Employment Occupations by Sex in Westview
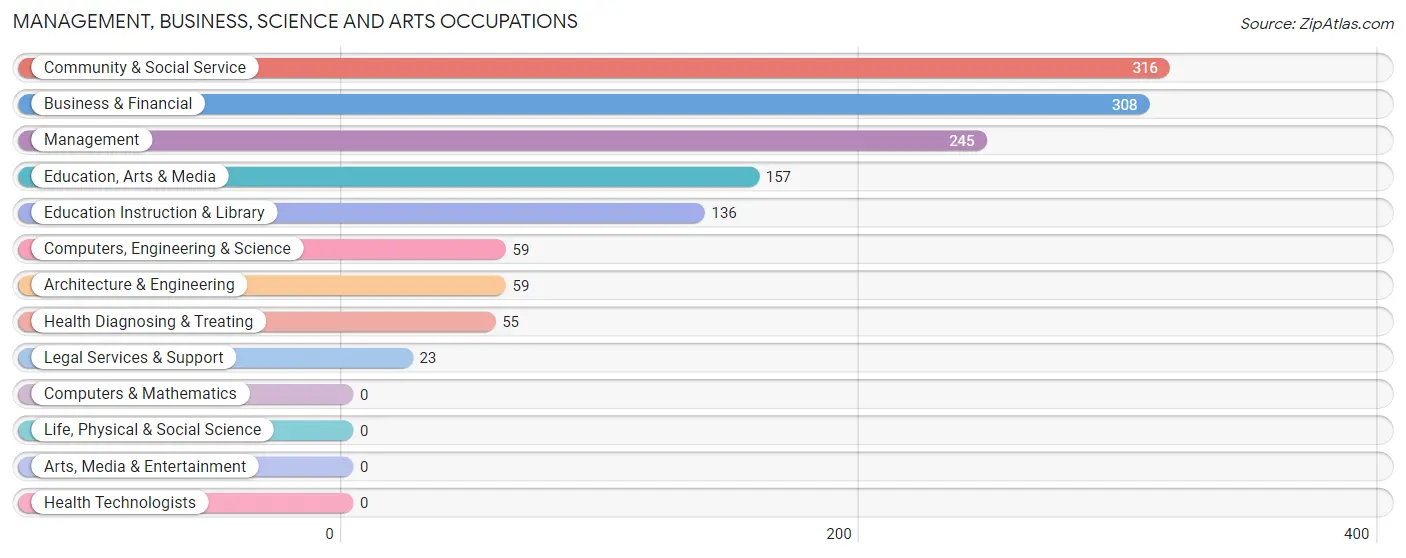
Management, Business, Science and Arts Occupations
The most common Management, Business, Science and Arts occupations in Westview are Community & Social Service (316 | 6.7%), Business & Financial (308 | 6.5%), Management (245 | 5.1%), Education, Arts & Media (157 | 3.3%), and Education Instruction & Library (136 | 2.9%).
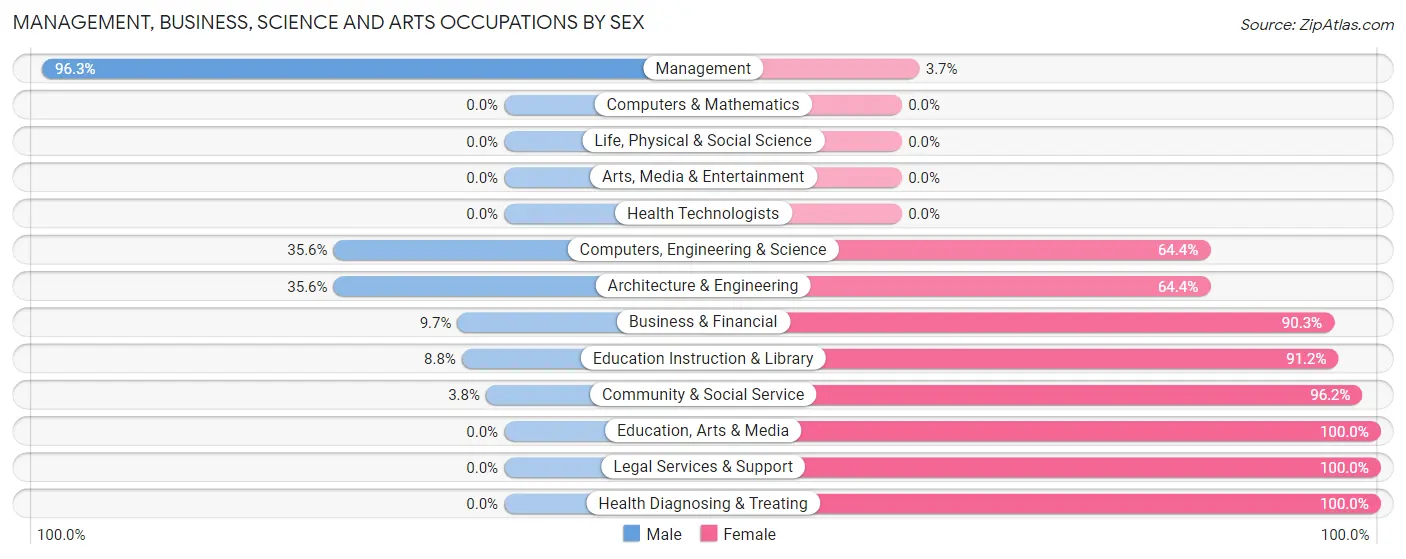
Management, Business, Science and Arts Occupations by Sex
Within the Management, Business, Science and Arts occupations in Westview, the most male-oriented occupations are Management (96.3%), Computers, Engineering & Science (35.6%), and Architecture & Engineering (35.6%), while the most female-oriented occupations are Education, Arts & Media (100.0%), Legal Services & Support (100.0%), and Health Diagnosing & Treating (100.0%).
| Occupation | Male | Female |
| Management | 236 (96.3%) | 9 (3.7%) |
| Business & Financial | 30 (9.7%) | 278 (90.3%) |
| Computers, Engineering & Science | 21 (35.6%) | 38 (64.4%) |
| Computers & Mathematics | 0 (0.0%) | 0 (0.0%) |
| Architecture & Engineering | 21 (35.6%) | 38 (64.4%) |
| Life, Physical & Social Science | 0 (0.0%) | 0 (0.0%) |
| Community & Social Service | 12 (3.8%) | 304 (96.2%) |
| Education, Arts & Media | 0 (0.0%) | 157 (100.0%) |
| Legal Services & Support | 0 (0.0%) | 23 (100.0%) |
| Education Instruction & Library | 12 (8.8%) | 124 (91.2%) |
| Arts, Media & Entertainment | 0 (0.0%) | 0 (0.0%) |
| Health Diagnosing & Treating | 0 (0.0%) | 55 (100.0%) |
| Health Technologists | 0 (0.0%) | 0 (0.0%) |
| Total (Category) | 299 (30.4%) | 684 (69.6%) |
| Total (Overall) | 2,492 (52.4%) | 2,261 (47.6%) |
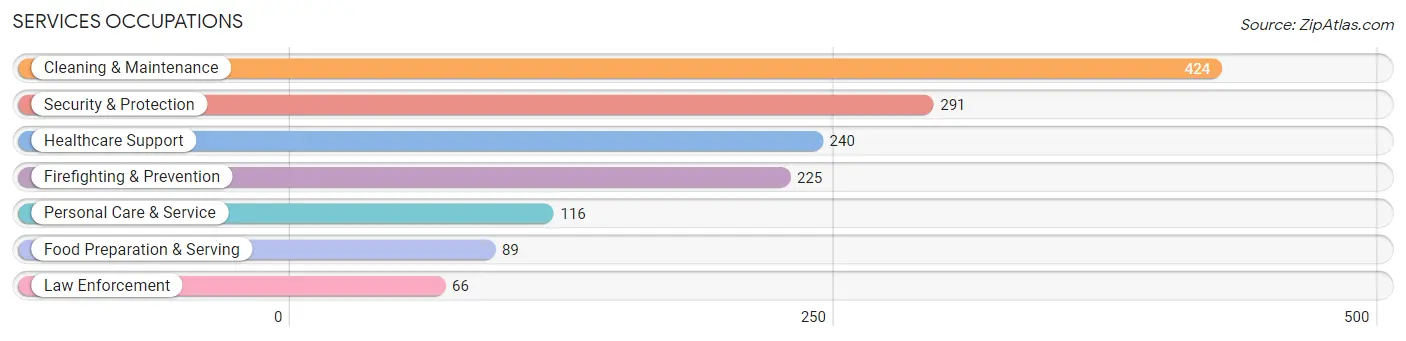
Services Occupations
The most common Services occupations in Westview are Cleaning & Maintenance (424 | 8.9%), Security & Protection (291 | 6.1%), Healthcare Support (240 | 5.1%), Firefighting & Prevention (225 | 4.7%), and Personal Care & Service (116 | 2.4%).
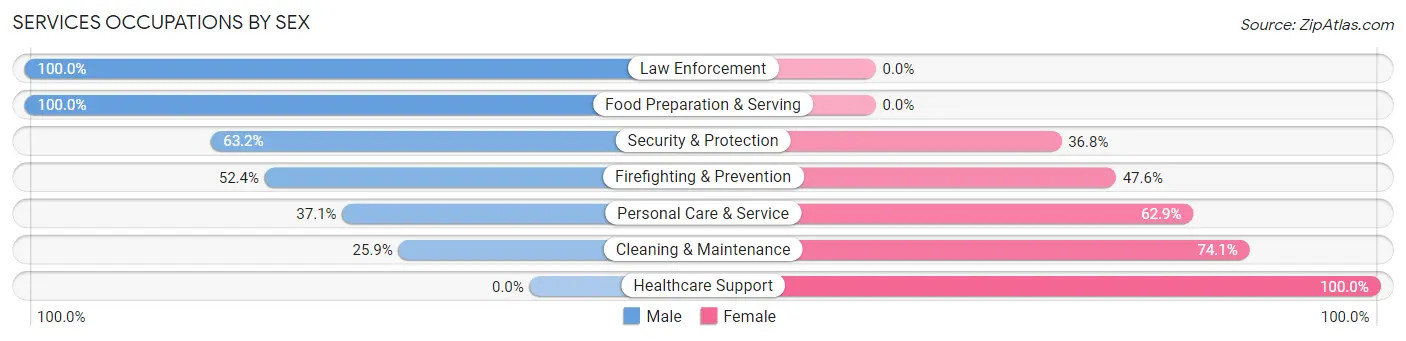
Services Occupations by Sex
Within the Services occupations in Westview, the most male-oriented occupations are Law Enforcement (100.0%), Food Preparation & Serving (100.0%), and Security & Protection (63.2%), while the most female-oriented occupations are Healthcare Support (100.0%), Cleaning & Maintenance (74.1%), and Personal Care & Service (62.9%).
| Occupation | Male | Female |
| Healthcare Support | 0 (0.0%) | 240 (100.0%) |
| Security & Protection | 184 (63.2%) | 107 (36.8%) |
| Firefighting & Prevention | 118 (52.4%) | 107 (47.6%) |
| Law Enforcement | 66 (100.0%) | 0 (0.0%) |
| Food Preparation & Serving | 89 (100.0%) | 0 (0.0%) |
| Cleaning & Maintenance | 110 (25.9%) | 314 (74.1%) |
| Personal Care & Service | 43 (37.1%) | 73 (62.9%) |
| Total (Category) | 426 (36.7%) | 734 (63.3%) |
| Total (Overall) | 2,492 (52.4%) | 2,261 (47.6%) |
Sales and Office Occupations
The most common Sales and Office occupations in Westview are Office & Administration (525 | 11.1%), and Sales & Related (243 | 5.1%).

Sales and Office Occupations by Sex

| Occupation | Male | Female |
| Sales & Related | 34 (14.0%) | 209 (86.0%) |
| Office & Administration | 139 (26.5%) | 386 (73.5%) |
| Total (Category) | 173 (22.5%) | 595 (77.5%) |
| Total (Overall) | 2,492 (52.4%) | 2,261 (47.6%) |
Natural Resources, Construction and Maintenance Occupations
The most common Natural Resources, Construction and Maintenance occupations in Westview are Construction & Extraction (734 | 15.4%), and Installation, Maintenance & Repair (120 | 2.5%).
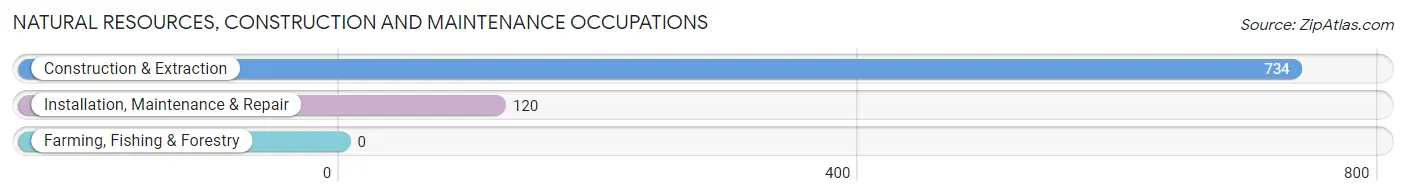
Natural Resources, Construction and Maintenance Occupations by Sex

| Occupation | Male | Female |
| Farming, Fishing & Forestry | 0 (0.0%) | 0 (0.0%) |
| Construction & Extraction | 734 (100.0%) | 0 (0.0%) |
| Installation, Maintenance & Repair | 110 (91.7%) | 10 (8.3%) |
| Total (Category) | 844 (98.8%) | 10 (1.2%) |
| Total (Overall) | 2,492 (52.4%) | 2,261 (47.6%) |
Production, Transportation and Moving Occupations
The most common Production, Transportation and Moving occupations in Westview are Transportation (477 | 10.0%), Production (437 | 9.2%), and Material Moving (74 | 1.6%).

Production, Transportation and Moving Occupations by Sex
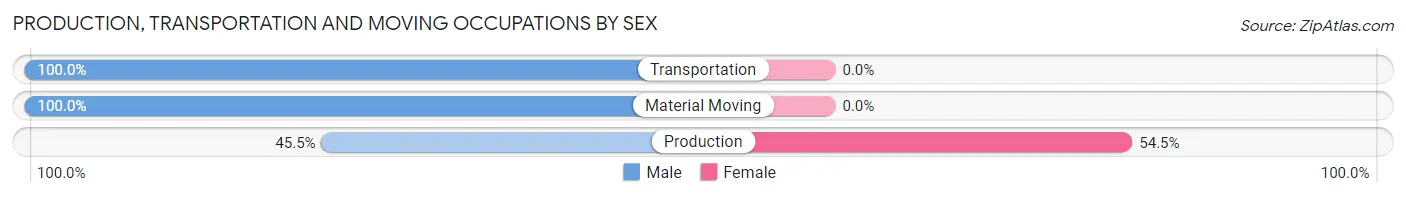
| Occupation | Male | Female |
| Production | 199 (45.5%) | 238 (54.5%) |
| Transportation | 477 (100.0%) | 0 (0.0%) |
| Material Moving | 74 (100.0%) | 0 (0.0%) |
| Total (Category) | 750 (75.9%) | 238 (24.1%) |
| Total (Overall) | 2,492 (52.4%) | 2,261 (47.6%) |
Employment Industries by Sex in Westview
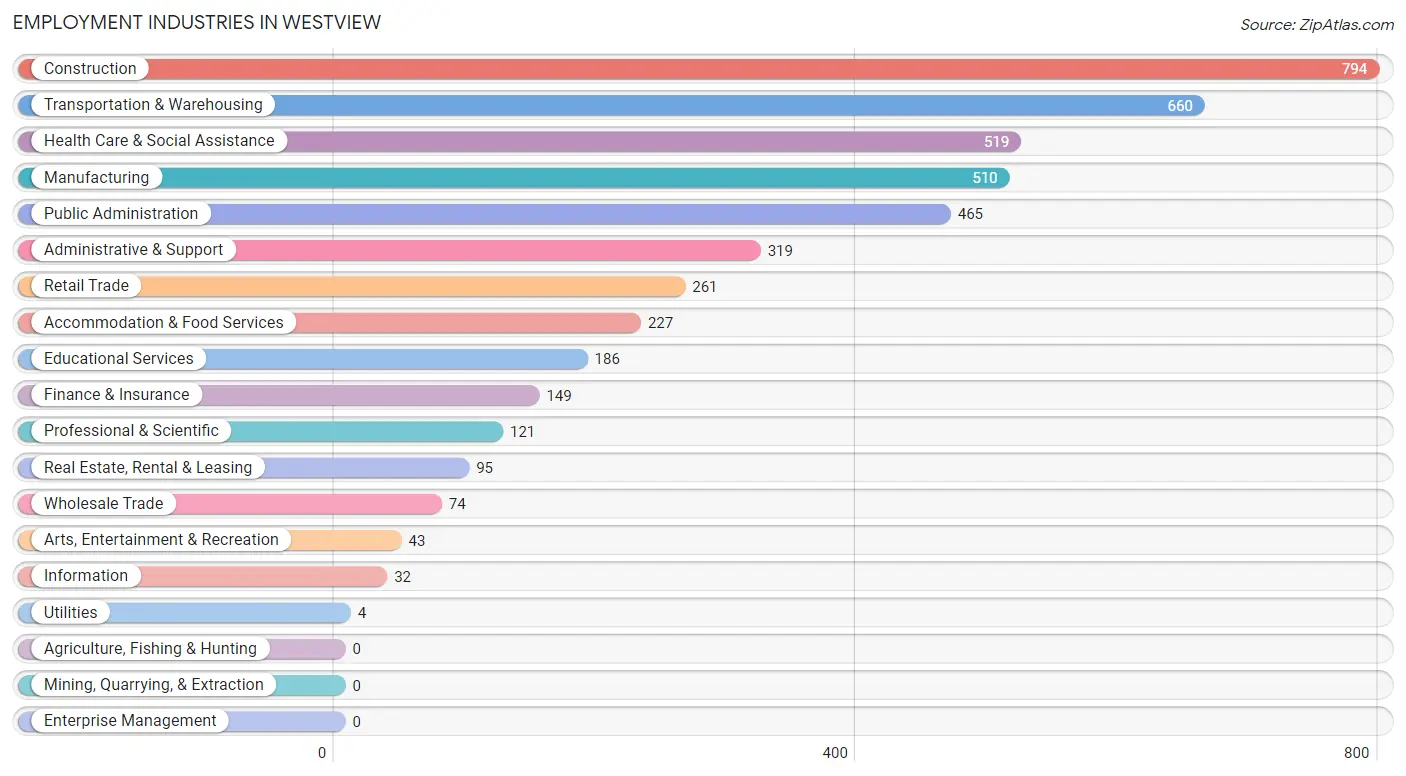
Employment Industries in Westview
The major employment industries in Westview include Construction (794 | 16.7%), Transportation & Warehousing (660 | 13.9%), Health Care & Social Assistance (519 | 10.9%), Manufacturing (510 | 10.7%), and Public Administration (465 | 9.8%).
Employment Industries by Sex in Westview
The Westview industries that see more men than women are Utilities (100.0%), Arts, Entertainment & Recreation (100.0%), and Construction (98.7%), whereas the industries that tend to have a higher number of women are Educational Services (93.5%), Health Care & Social Assistance (93.3%), and Retail Trade (78.2%).
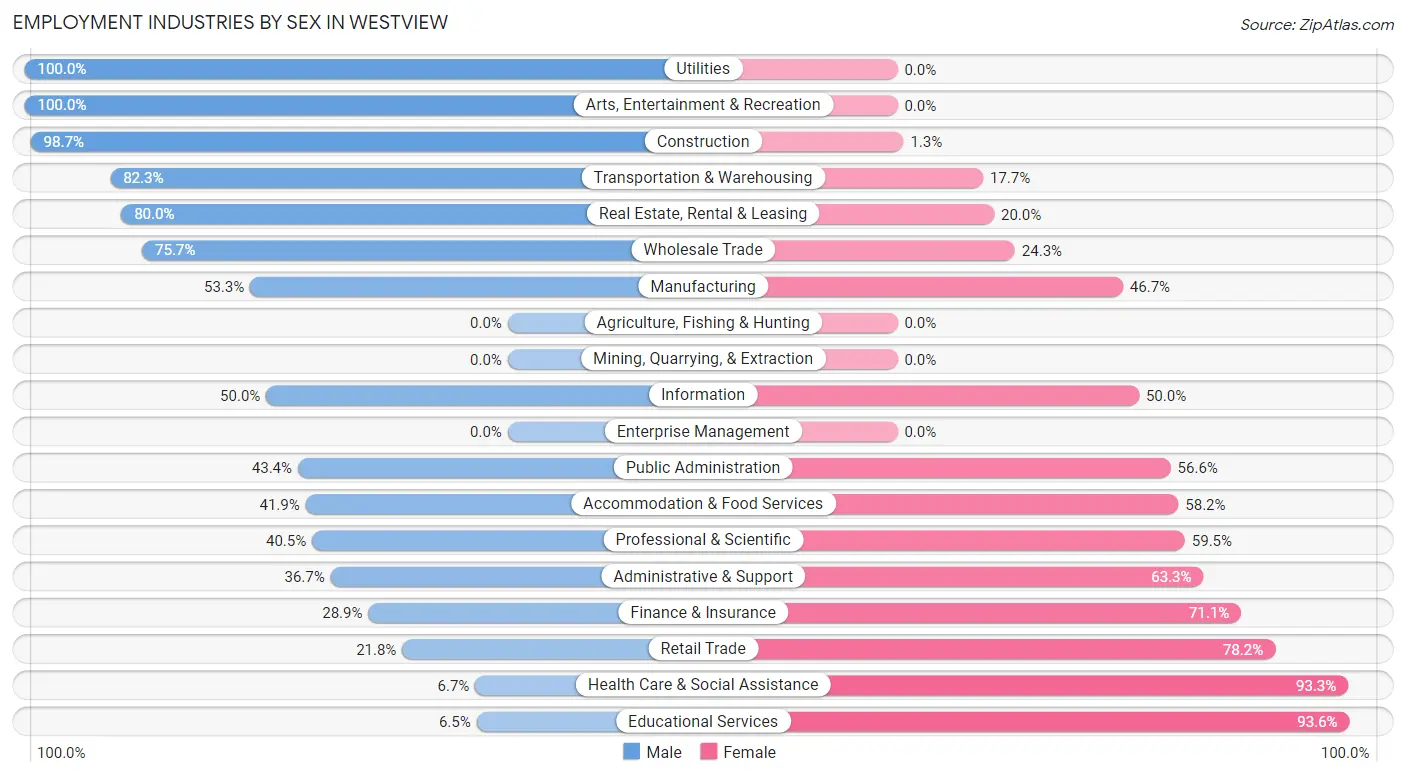
| Industry | Male | Female |
| Agriculture, Fishing & Hunting | 0 (0.0%) | 0 (0.0%) |
| Mining, Quarrying, & Extraction | 0 (0.0%) | 0 (0.0%) |
| Construction | 784 (98.7%) | 10 (1.3%) |
| Manufacturing | 272 (53.3%) | 238 (46.7%) |
| Wholesale Trade | 56 (75.7%) | 18 (24.3%) |
| Retail Trade | 57 (21.8%) | 204 (78.2%) |
| Transportation & Warehousing | 543 (82.3%) | 117 (17.7%) |
| Utilities | 4 (100.0%) | 0 (0.0%) |
| Information | 16 (50.0%) | 16 (50.0%) |
| Finance & Insurance | 43 (28.9%) | 106 (71.1%) |
| Real Estate, Rental & Leasing | 76 (80.0%) | 19 (20.0%) |
| Professional & Scientific | 49 (40.5%) | 72 (59.5%) |
| Enterprise Management | 0 (0.0%) | 0 (0.0%) |
| Administrative & Support | 117 (36.7%) | 202 (63.3%) |
| Educational Services | 12 (6.5%) | 174 (93.5%) |
| Health Care & Social Assistance | 35 (6.7%) | 484 (93.3%) |
| Arts, Entertainment & Recreation | 43 (100.0%) | 0 (0.0%) |
| Accommodation & Food Services | 95 (41.8%) | 132 (58.2%) |
| Public Administration | 202 (43.4%) | 263 (56.6%) |
| Total | 2,492 (52.4%) | 2,261 (47.6%) |
Education in Westview
School Enrollment in Westview
The most common levels of schooling among the 2,548 students in Westview are middle school (981 | 38.5%), elementary school (660 | 25.9%), and college / undergraduate (441 | 17.3%).
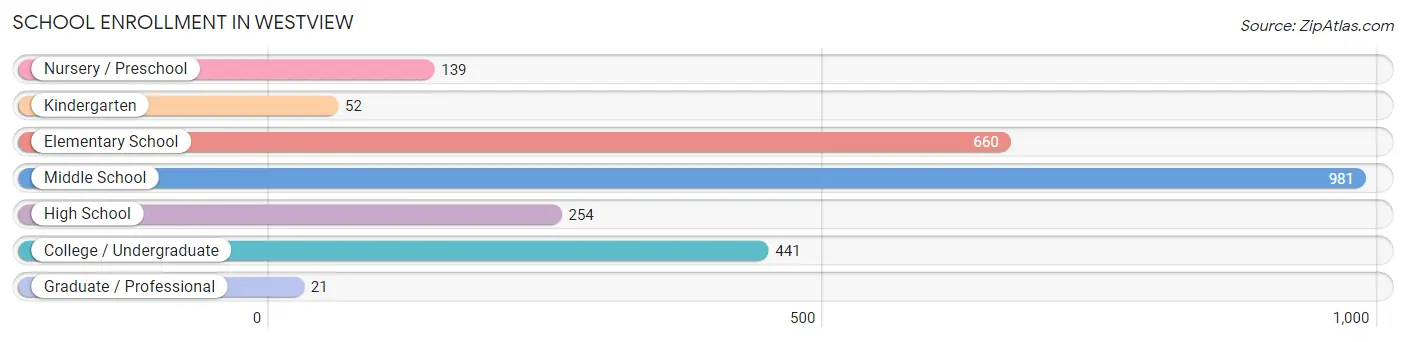
| School Level | # Students | % Students |
| Nursery / Preschool | 139 | 5.5% |
| Kindergarten | 52 | 2.0% |
| Elementary School | 660 | 25.9% |
| Middle School | 981 | 38.5% |
| High School | 254 | 10.0% |
| College / Undergraduate | 441 | 17.3% |
| Graduate / Professional | 21 | 0.8% |
| Total | 2,548 | 100.0% |
School Enrollment by Age by Funding Source in Westview
Out of a total of 2,548 students who are enrolled in schools in Westview, 428 (16.8%) attend a private institution, while the remaining 2,120 (83.2%) are enrolled in public schools. The age group of 3 to 4 year olds has the highest likelihood of being enrolled in private schools, with 96 (100.0% in the age bracket) enrolled. Conversely, the age group of 15 to 17 year olds has the lowest likelihood of being enrolled in a private school, with 103 (100.0% in the age bracket) attending a public institution.
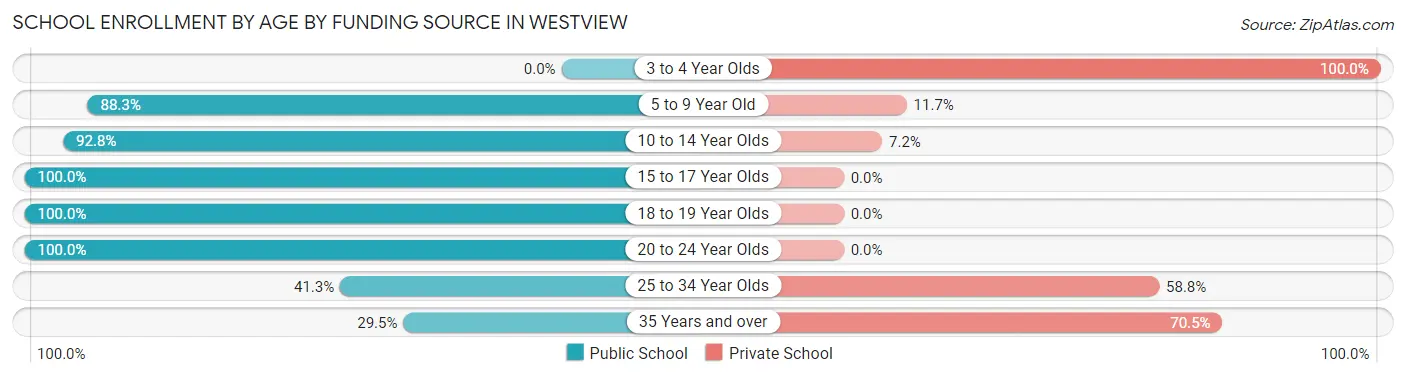
| Age Bracket | Public School | Private School |
| 3 to 4 Year Olds | 0 (0.0%) | 96 (100.0%) |
| 5 to 9 Year Old | 557 (88.3%) | 74 (11.7%) |
| 10 to 14 Year Olds | 1,089 (92.8%) | 84 (7.2%) |
| 15 to 17 Year Olds | 103 (100.0%) | 0 (0.0%) |
| 18 to 19 Year Olds | 122 (100.0%) | 0 (0.0%) |
| 20 to 24 Year Olds | 151 (100.0%) | 0 (0.0%) |
| 25 to 34 Year Olds | 66 (41.2%) | 94 (58.8%) |
| 35 Years and over | 33 (29.5%) | 79 (70.5%) |
| Total | 2,120 (83.2%) | 428 (16.8%) |
Educational Attainment by Field of Study in Westview
Science & technology (395 | 31.2%), business (279 | 22.0%), education (130 | 10.3%), arts & humanities (103 | 8.1%), and engineering (92 | 7.3%) are the most common fields of study among 1,266 individuals in Westview who have obtained a bachelor's degree or higher.
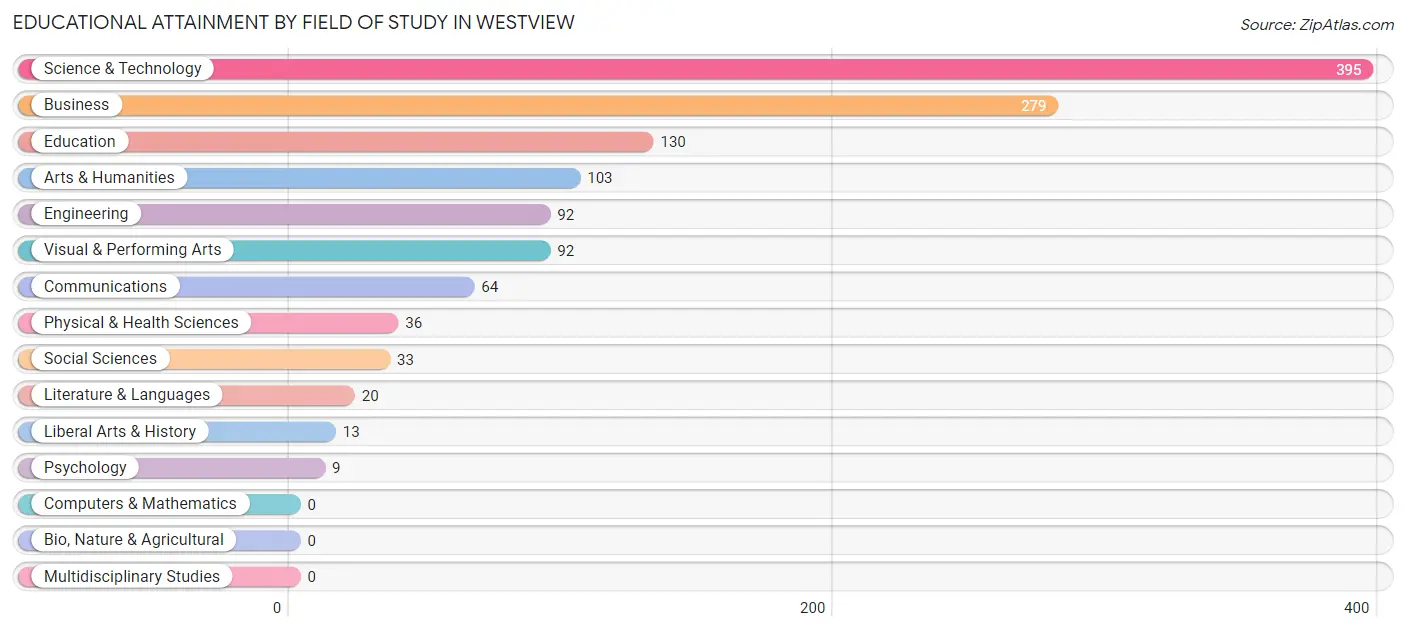
| Field of Study | # Graduates | % Graduates |
| Computers & Mathematics | 0 | 0.0% |
| Bio, Nature & Agricultural | 0 | 0.0% |
| Physical & Health Sciences | 36 | 2.8% |
| Psychology | 9 | 0.7% |
| Social Sciences | 33 | 2.6% |
| Engineering | 92 | 7.3% |
| Multidisciplinary Studies | 0 | 0.0% |
| Science & Technology | 395 | 31.2% |
| Business | 279 | 22.0% |
| Education | 130 | 10.3% |
| Literature & Languages | 20 | 1.6% |
| Liberal Arts & History | 13 | 1.0% |
| Visual & Performing Arts | 92 | 7.3% |
| Communications | 64 | 5.1% |
| Arts & Humanities | 103 | 8.1% |
| Total | 1,266 | 100.0% |
Transportation & Commute in Westview
Vehicle Availability by Sex in Westview
The most prevalent vehicle ownership categories in Westview are males with 2 vehicles (1,066, accounting for 43.1%) and females with 2 vehicles (828, making up 47.1%).
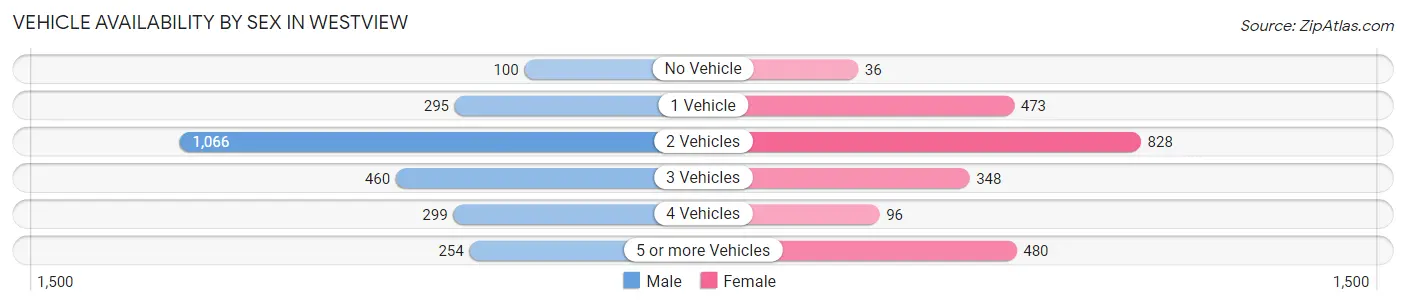
| Vehicles Available | Male | Female |
| No Vehicle | 100 (4.0%) | 36 (1.6%) |
| 1 Vehicle | 295 (11.9%) | 473 (20.9%) |
| 2 Vehicles | 1,066 (43.1%) | 828 (36.6%) |
| 3 Vehicles | 460 (18.6%) | 348 (15.4%) |
| 4 Vehicles | 299 (12.1%) | 96 (4.3%) |
| 5 or more Vehicles | 254 (10.3%) | 480 (21.2%) |
| Total | 2,474 (100.0%) | 2,261 (100.0%) |
Commute Time in Westview
The most frequently occuring commute durations in Westview are 30 to 34 minutes (1,761 commuters, 38.6%), 45 to 59 minutes (455 commuters, 10.0%), and 60 to 89 minutes (446 commuters, 9.8%).
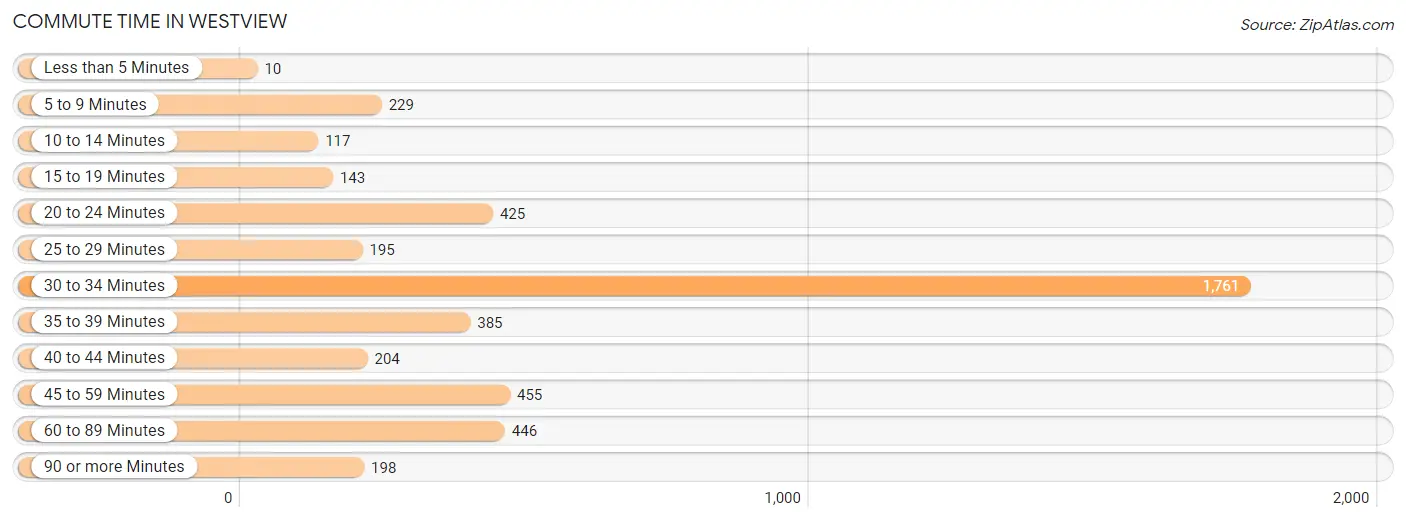
| Commute Time | # Commuters | % Commuters |
| Less than 5 Minutes | 10 | 0.2% |
| 5 to 9 Minutes | 229 | 5.0% |
| 10 to 14 Minutes | 117 | 2.6% |
| 15 to 19 Minutes | 143 | 3.1% |
| 20 to 24 Minutes | 425 | 9.3% |
| 25 to 29 Minutes | 195 | 4.3% |
| 30 to 34 Minutes | 1,761 | 38.6% |
| 35 to 39 Minutes | 385 | 8.4% |
| 40 to 44 Minutes | 204 | 4.5% |
| 45 to 59 Minutes | 455 | 10.0% |
| 60 to 89 Minutes | 446 | 9.8% |
| 90 or more Minutes | 198 | 4.3% |
Commute Time by Sex in Westview
The most common commute times in Westview are 30 to 34 minutes (1,007 commuters, 42.9%) for males and 30 to 34 minutes (754 commuters, 33.9%) for females.
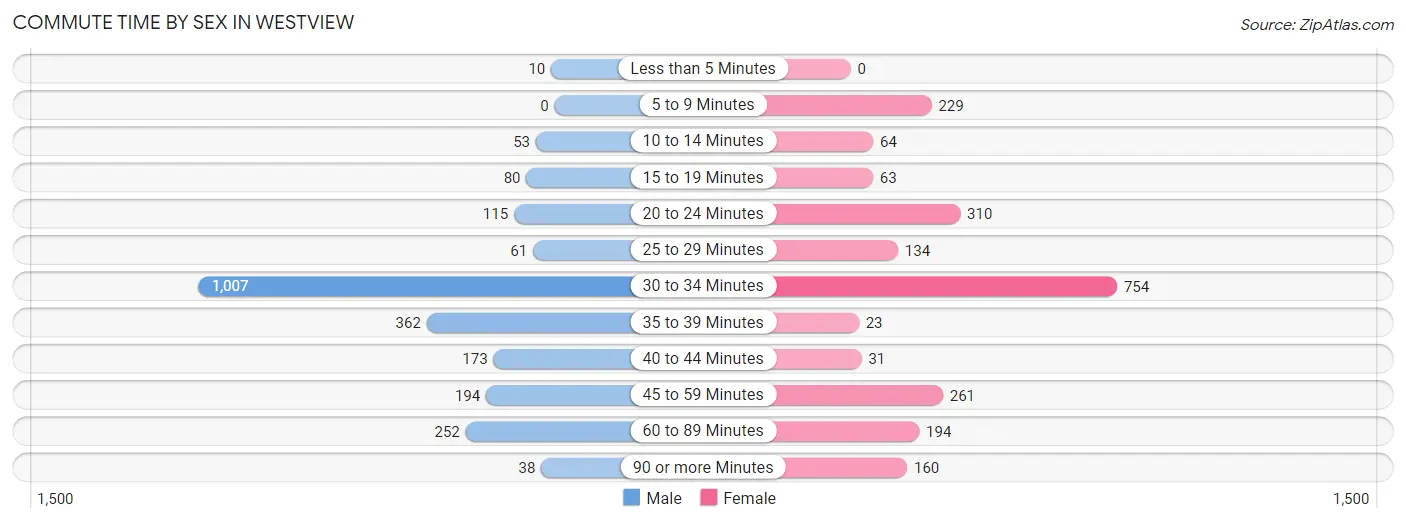
| Commute Time | Male | Female |
| Less than 5 Minutes | 10 (0.4%) | 0 (0.0%) |
| 5 to 9 Minutes | 0 (0.0%) | 229 (10.3%) |
| 10 to 14 Minutes | 53 (2.3%) | 64 (2.9%) |
| 15 to 19 Minutes | 80 (3.4%) | 63 (2.8%) |
| 20 to 24 Minutes | 115 (4.9%) | 310 (14.0%) |
| 25 to 29 Minutes | 61 (2.6%) | 134 (6.0%) |
| 30 to 34 Minutes | 1,007 (42.9%) | 754 (33.9%) |
| 35 to 39 Minutes | 362 (15.4%) | 23 (1.0%) |
| 40 to 44 Minutes | 173 (7.4%) | 31 (1.4%) |
| 45 to 59 Minutes | 194 (8.3%) | 261 (11.7%) |
| 60 to 89 Minutes | 252 (10.7%) | 194 (8.7%) |
| 90 or more Minutes | 38 (1.6%) | 160 (7.2%) |
Time of Departure to Work by Sex in Westview
The most frequent times of departure to work in Westview are 7:00 AM to 7:29 AM (777, 33.1%) for males and 7:00 AM to 7:29 AM (664, 29.9%) for females.
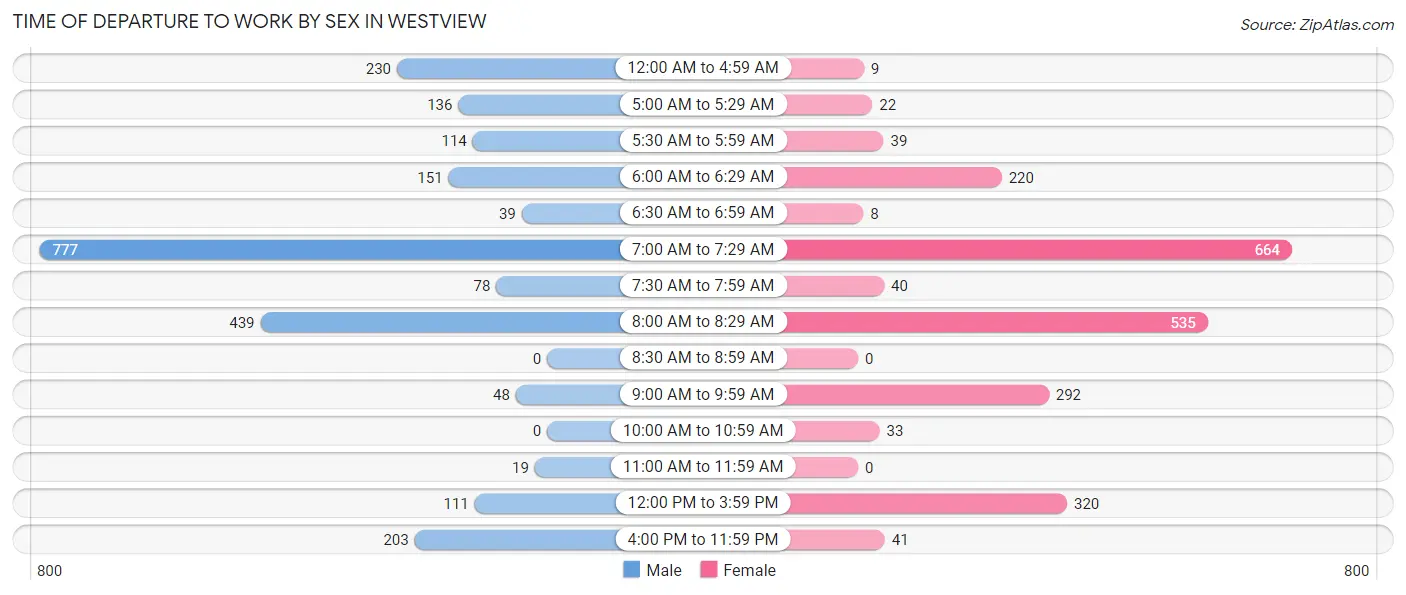
| Time of Departure | Male | Female |
| 12:00 AM to 4:59 AM | 230 (9.8%) | 9 (0.4%) |
| 5:00 AM to 5:29 AM | 136 (5.8%) | 22 (1.0%) |
| 5:30 AM to 5:59 AM | 114 (4.9%) | 39 (1.8%) |
| 6:00 AM to 6:29 AM | 151 (6.4%) | 220 (9.9%) |
| 6:30 AM to 6:59 AM | 39 (1.7%) | 8 (0.4%) |
| 7:00 AM to 7:29 AM | 777 (33.1%) | 664 (29.9%) |
| 7:30 AM to 7:59 AM | 78 (3.3%) | 40 (1.8%) |
| 8:00 AM to 8:29 AM | 439 (18.7%) | 535 (24.1%) |
| 8:30 AM to 8:59 AM | 0 (0.0%) | 0 (0.0%) |
| 9:00 AM to 9:59 AM | 48 (2.1%) | 292 (13.1%) |
| 10:00 AM to 10:59 AM | 0 (0.0%) | 33 (1.5%) |
| 11:00 AM to 11:59 AM | 19 (0.8%) | 0 (0.0%) |
| 12:00 PM to 3:59 PM | 111 (4.7%) | 320 (14.4%) |
| 4:00 PM to 11:59 PM | 203 (8.7%) | 41 (1.8%) |
| Total | 2,345 (100.0%) | 2,223 (100.0%) |
Housing Occupancy in Westview
Occupancy by Ownership in Westview
Of the total 3,488 dwellings in Westview, owner-occupied units account for 2,042 (58.5%), while renter-occupied units make up 1,446 (41.5%).
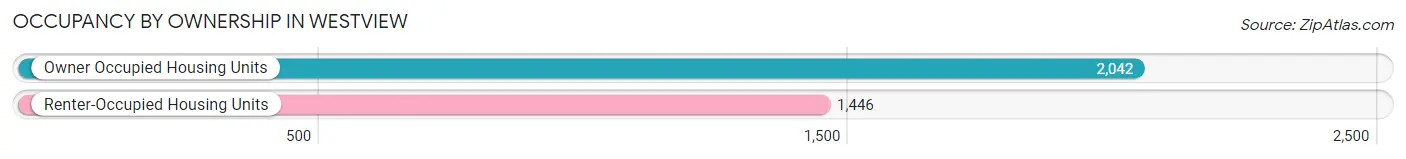
| Occupancy | # Housing Units | % Housing Units |
| Owner Occupied Housing Units | 2,042 | 58.5% |
| Renter-Occupied Housing Units | 1,446 | 41.5% |
| Total Occupied Housing Units | 3,488 | 100.0% |
Occupancy by Household Size in Westview
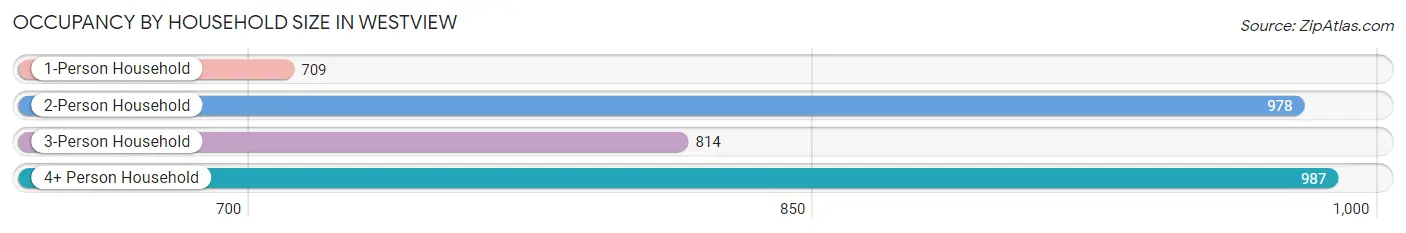
| Household Size | # Housing Units | % Housing Units |
| 1-Person Household | 709 | 20.3% |
| 2-Person Household | 978 | 28.0% |
| 3-Person Household | 814 | 23.3% |
| 4+ Person Household | 987 | 28.3% |
| Total Housing Units | 3,488 | 100.0% |
Occupancy by Ownership by Household Size in Westview
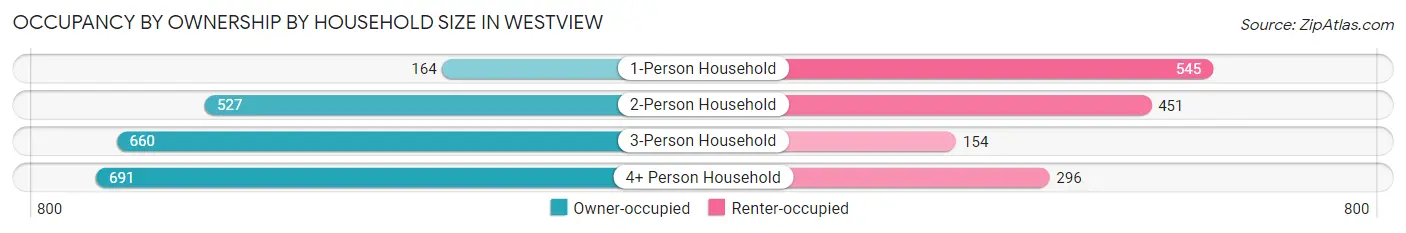
| Household Size | Owner-occupied | Renter-occupied |
| 1-Person Household | 164 (23.1%) | 545 (76.9%) |
| 2-Person Household | 527 (53.9%) | 451 (46.1%) |
| 3-Person Household | 660 (81.1%) | 154 (18.9%) |
| 4+ Person Household | 691 (70.0%) | 296 (30.0%) |
| Total Housing Units | 2,042 (58.5%) | 1,446 (41.5%) |
Occupancy by Educational Attainment in Westview
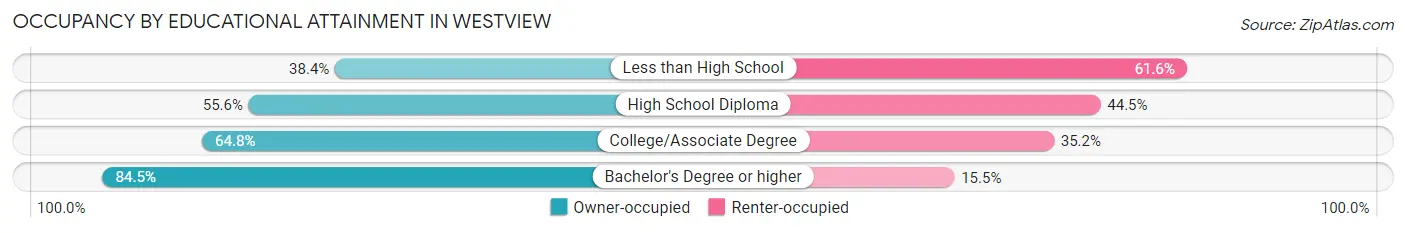
| Household Size | Owner-occupied | Renter-occupied |
| Less than High School | 309 (38.4%) | 495 (61.6%) |
| High School Diploma | 771 (55.5%) | 617 (44.5%) |
| College/Associate Degree | 438 (64.8%) | 238 (35.2%) |
| Bachelor's Degree or higher | 524 (84.5%) | 96 (15.5%) |
Occupancy by Age of Householder in Westview
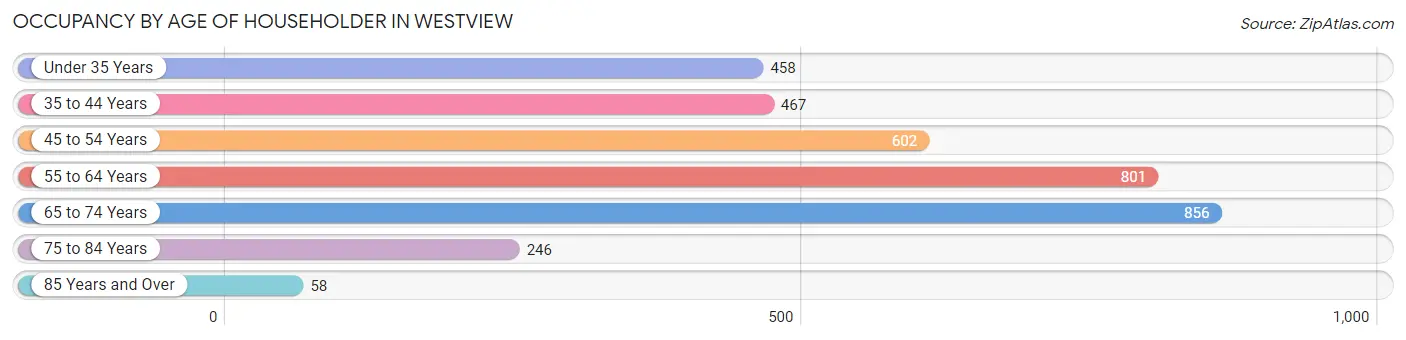
| Age Bracket | # Households | % Households |
| Under 35 Years | 458 | 13.1% |
| 35 to 44 Years | 467 | 13.4% |
| 45 to 54 Years | 602 | 17.3% |
| 55 to 64 Years | 801 | 23.0% |
| 65 to 74 Years | 856 | 24.5% |
| 75 to 84 Years | 246 | 7.0% |
| 85 Years and Over | 58 | 1.7% |
| Total | 3,488 | 100.0% |
Housing Finances in Westview
Median Income by Occupancy in Westview
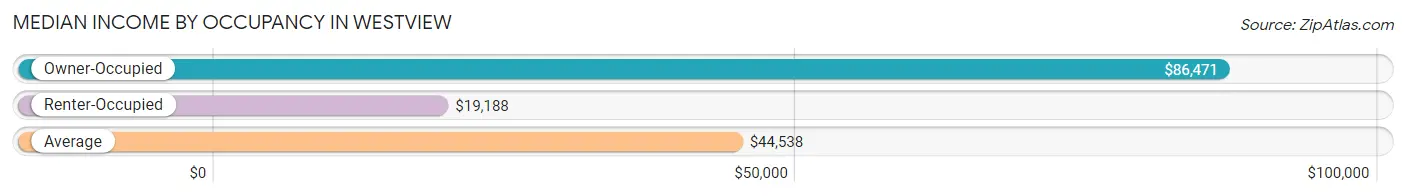
| Occupancy Type | # Households | Median Income |
| Owner-Occupied | 2,042 (58.5%) | $86,471 |
| Renter-Occupied | 1,446 (41.5%) | $19,188 |
| Average | 3,488 (100.0%) | $44,538 |
Occupancy by Householder Income Bracket in Westview
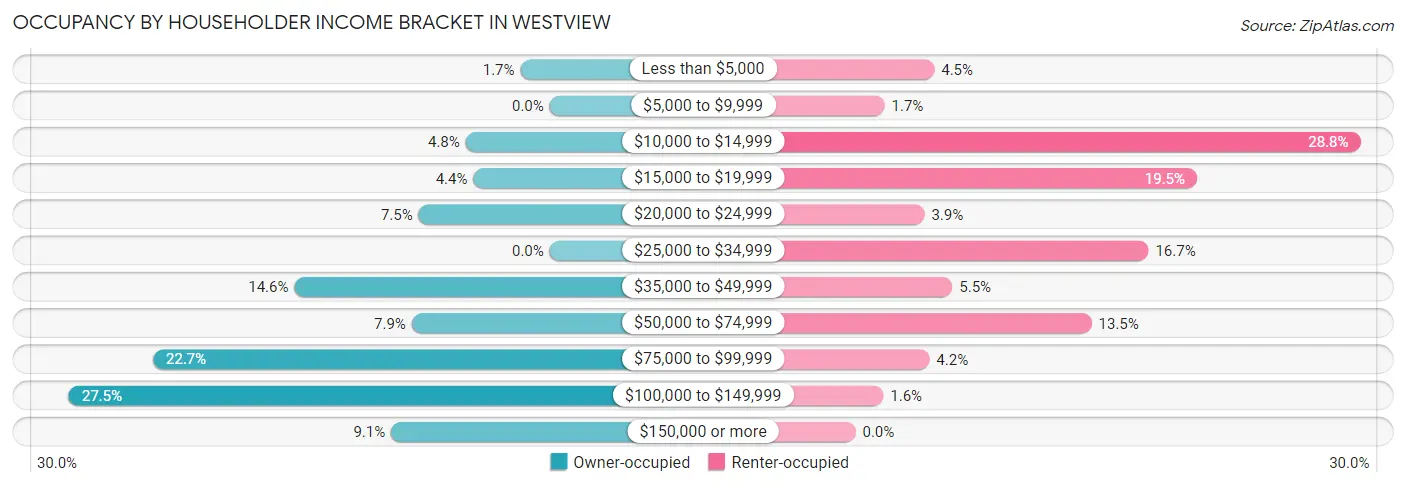
| Income Bracket | Owner-occupied | Renter-occupied |
| Less than $5,000 | 34 (1.7%) | 65 (4.5%) |
| $5,000 to $9,999 | 0 (0.0%) | 24 (1.7%) |
| $10,000 to $14,999 | 98 (4.8%) | 417 (28.8%) |
| $15,000 to $19,999 | 89 (4.4%) | 282 (19.5%) |
| $20,000 to $24,999 | 153 (7.5%) | 57 (3.9%) |
| $25,000 to $34,999 | 0 (0.0%) | 242 (16.7%) |
| $35,000 to $49,999 | 298 (14.6%) | 80 (5.5%) |
| $50,000 to $74,999 | 161 (7.9%) | 195 (13.5%) |
| $75,000 to $99,999 | 463 (22.7%) | 61 (4.2%) |
| $100,000 to $149,999 | 561 (27.5%) | 23 (1.6%) |
| $150,000 or more | 185 (9.1%) | 0 (0.0%) |
| Total | 2,042 (100.0%) | 1,446 (100.0%) |
Monthly Housing Cost Tiers in Westview
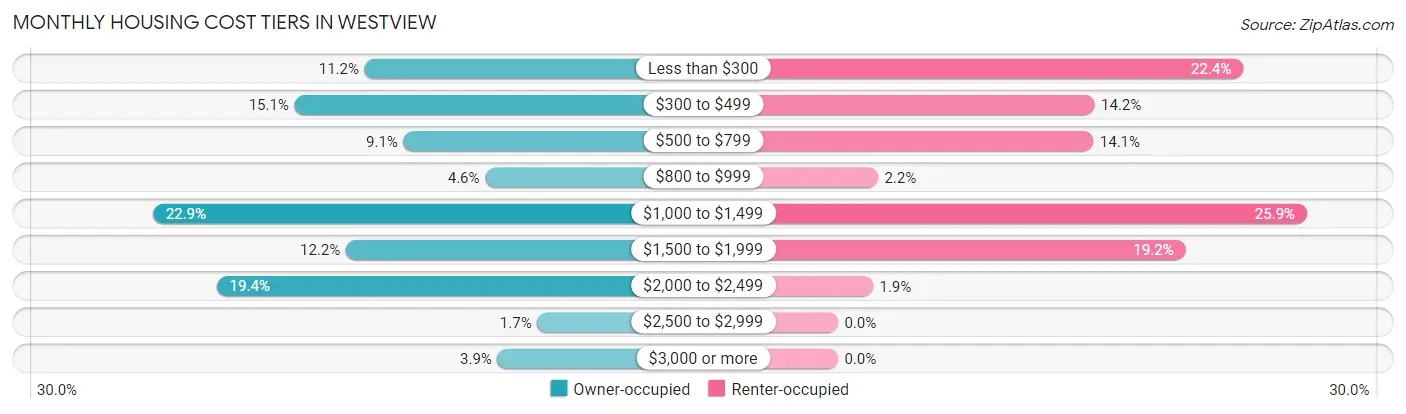
| Monthly Cost | Owner-occupied | Renter-occupied |
| Less than $300 | 229 (11.2%) | 324 (22.4%) |
| $300 to $499 | 308 (15.1%) | 205 (14.2%) |
| $500 to $799 | 185 (9.1%) | 204 (14.1%) |
| $800 to $999 | 93 (4.5%) | 32 (2.2%) |
| $1,000 to $1,499 | 468 (22.9%) | 375 (25.9%) |
| $1,500 to $1,999 | 250 (12.2%) | 278 (19.2%) |
| $2,000 to $2,499 | 396 (19.4%) | 28 (1.9%) |
| $2,500 to $2,999 | 34 (1.7%) | 0 (0.0%) |
| $3,000 or more | 79 (3.9%) | 0 (0.0%) |
| Total | 2,042 (100.0%) | 1,446 (100.0%) |
Physical Housing Characteristics in Westview
Housing Structures in Westview
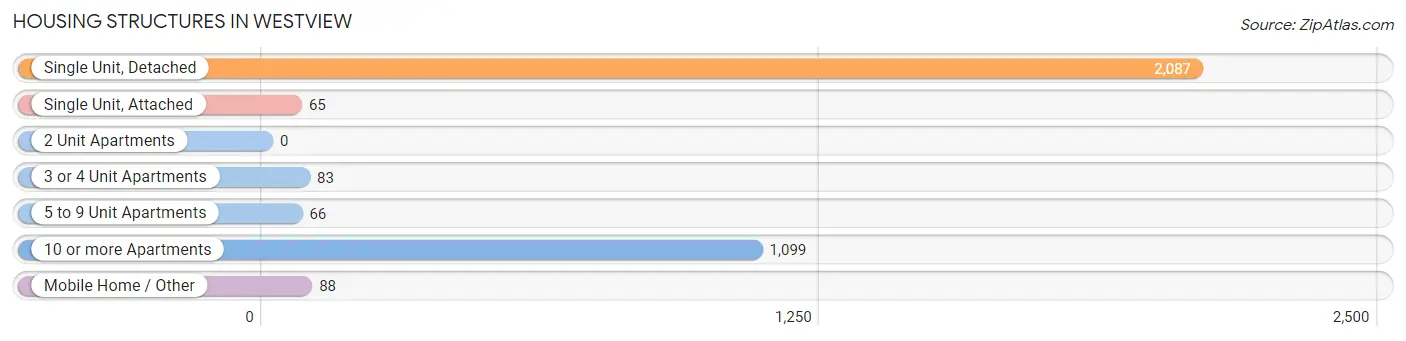
| Structure Type | # Housing Units | % Housing Units |
| Single Unit, Detached | 2,087 | 59.8% |
| Single Unit, Attached | 65 | 1.9% |
| 2 Unit Apartments | 0 | 0.0% |
| 3 or 4 Unit Apartments | 83 | 2.4% |
| 5 to 9 Unit Apartments | 66 | 1.9% |
| 10 or more Apartments | 1,099 | 31.5% |
| Mobile Home / Other | 88 | 2.5% |
| Total | 3,488 | 100.0% |
Housing Structures by Occupancy in Westview
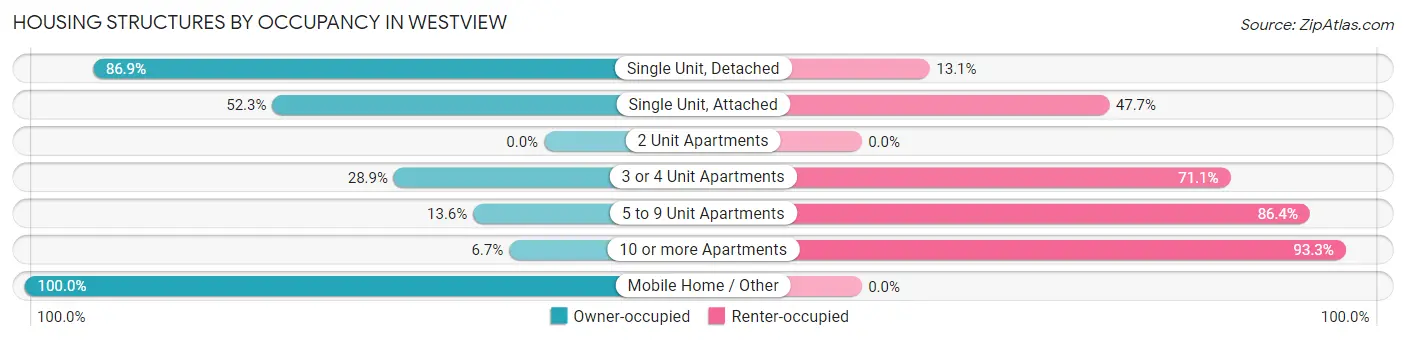
| Structure Type | Owner-occupied | Renter-occupied |
| Single Unit, Detached | 1,813 (86.9%) | 274 (13.1%) |
| Single Unit, Attached | 34 (52.3%) | 31 (47.7%) |
| 2 Unit Apartments | 0 (0.0%) | 0 (0.0%) |
| 3 or 4 Unit Apartments | 24 (28.9%) | 59 (71.1%) |
| 5 to 9 Unit Apartments | 9 (13.6%) | 57 (86.4%) |
| 10 or more Apartments | 74 (6.7%) | 1,025 (93.3%) |
| Mobile Home / Other | 88 (100.0%) | 0 (0.0%) |
| Total | 2,042 (58.5%) | 1,446 (41.5%) |
Housing Structures by Number of Rooms in Westview
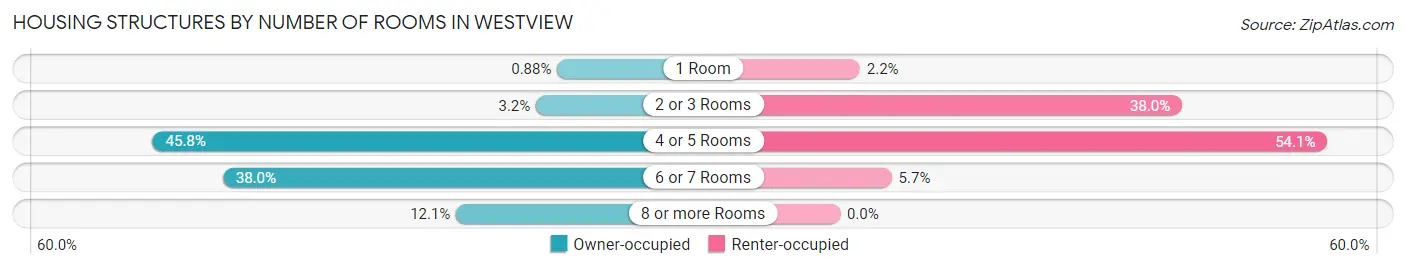
| Number of Rooms | Owner-occupied | Renter-occupied |
| 1 Room | 18 (0.9%) | 32 (2.2%) |
| 2 or 3 Rooms | 66 (3.2%) | 549 (38.0%) |
| 4 or 5 Rooms | 935 (45.8%) | 782 (54.1%) |
| 6 or 7 Rooms | 776 (38.0%) | 83 (5.7%) |
| 8 or more Rooms | 247 (12.1%) | 0 (0.0%) |
| Total | 2,042 (100.0%) | 1,446 (100.0%) |
Housing Structure by Heating Type in Westview
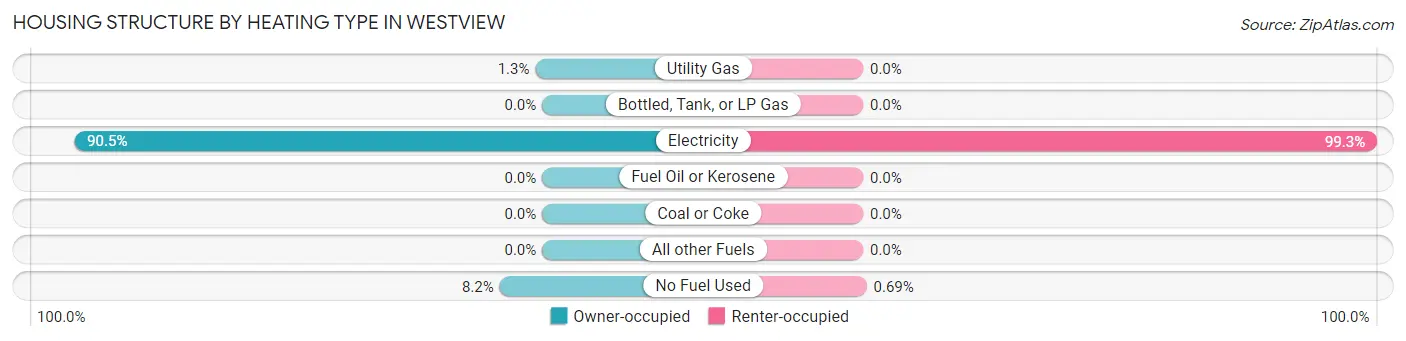
| Heating Type | Owner-occupied | Renter-occupied |
| Utility Gas | 27 (1.3%) | 0 (0.0%) |
| Bottled, Tank, or LP Gas | 0 (0.0%) | 0 (0.0%) |
| Electricity | 1,847 (90.4%) | 1,436 (99.3%) |
| Fuel Oil or Kerosene | 0 (0.0%) | 0 (0.0%) |
| Coal or Coke | 0 (0.0%) | 0 (0.0%) |
| All other Fuels | 0 (0.0%) | 0 (0.0%) |
| No Fuel Used | 168 (8.2%) | 10 (0.7%) |
| Total | 2,042 (100.0%) | 1,446 (100.0%) |
Household Vehicle Usage in Westview
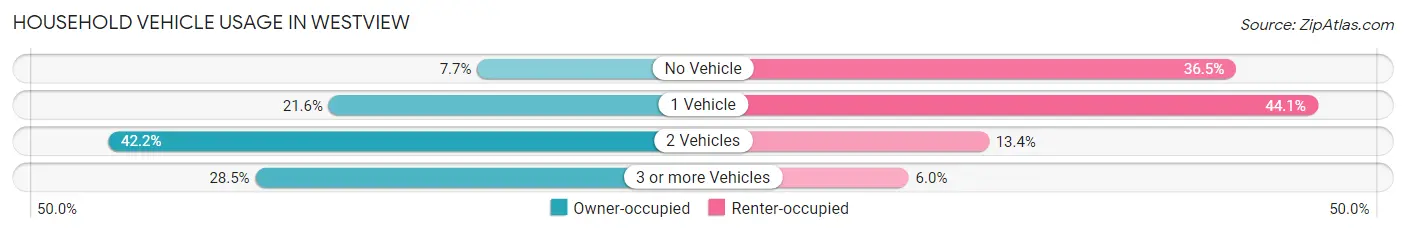
| Vehicles per Household | Owner-occupied | Renter-occupied |
| No Vehicle | 158 (7.7%) | 528 (36.5%) |
| 1 Vehicle | 441 (21.6%) | 638 (44.1%) |
| 2 Vehicles | 862 (42.2%) | 194 (13.4%) |
| 3 or more Vehicles | 581 (28.4%) | 86 (5.9%) |
| Total | 2,042 (100.0%) | 1,446 (100.0%) |
Real Estate & Mortgages in Westview
Real Estate and Mortgage Overview in Westview
| Characteristic | Without Mortgage | With Mortgage |
| Housing Units | 823 | 1,219 |
| Median Property Value | $260,200 | $303,400 |
| Median Household Income | $69,857 | $181 |
| Monthly Housing Costs | $370 | $79 |
| Real Estate Taxes | $1,424 | $115 |
Property Value by Mortgage Status in Westview
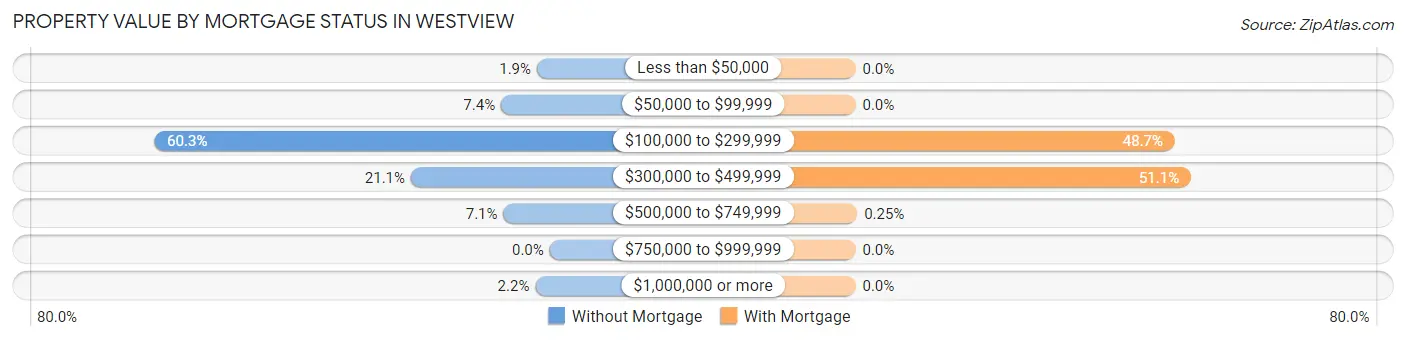
| Property Value | Without Mortgage | With Mortgage |
| Less than $50,000 | 16 (1.9%) | 0 (0.0%) |
| $50,000 to $99,999 | 61 (7.4%) | 0 (0.0%) |
| $100,000 to $299,999 | 496 (60.3%) | 593 (48.6%) |
| $300,000 to $499,999 | 174 (21.1%) | 623 (51.1%) |
| $500,000 to $749,999 | 58 (7.0%) | 3 (0.3%) |
| $750,000 to $999,999 | 0 (0.0%) | 0 (0.0%) |
| $1,000,000 or more | 18 (2.2%) | 0 (0.0%) |
| Total | 823 (100.0%) | 1,219 (100.0%) |
Household Income by Mortgage Status in Westview
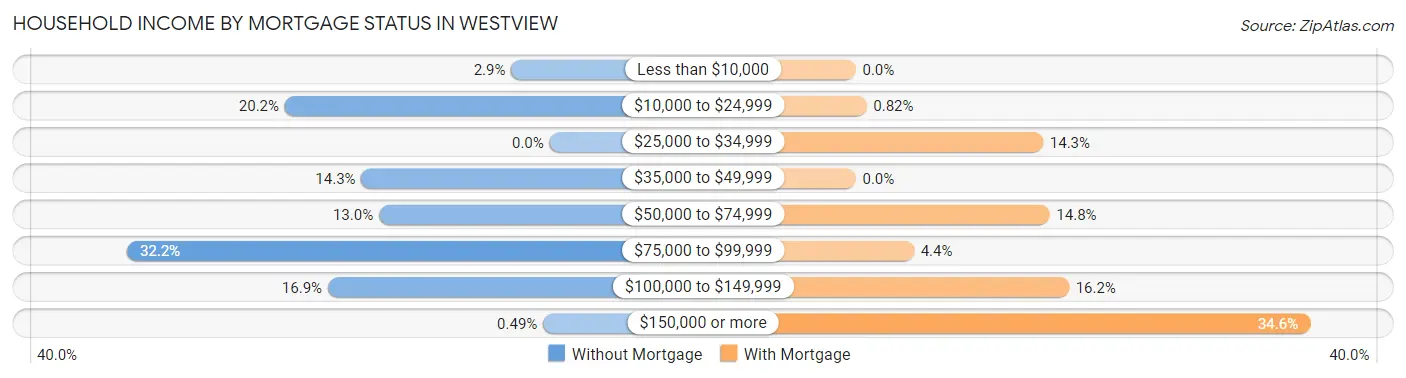
| Household Income | Without Mortgage | With Mortgage |
| Less than $10,000 | 24 (2.9%) | 0 (0.0%) |
| $10,000 to $24,999 | 166 (20.2%) | 10 (0.8%) |
| $25,000 to $34,999 | 0 (0.0%) | 174 (14.3%) |
| $35,000 to $49,999 | 118 (14.3%) | 0 (0.0%) |
| $50,000 to $74,999 | 107 (13.0%) | 180 (14.8%) |
| $75,000 to $99,999 | 265 (32.2%) | 54 (4.4%) |
| $100,000 to $149,999 | 139 (16.9%) | 198 (16.2%) |
| $150,000 or more | 4 (0.5%) | 422 (34.6%) |
| Total | 823 (100.0%) | 1,219 (100.0%) |
Property Value to Household Income Ratio in Westview
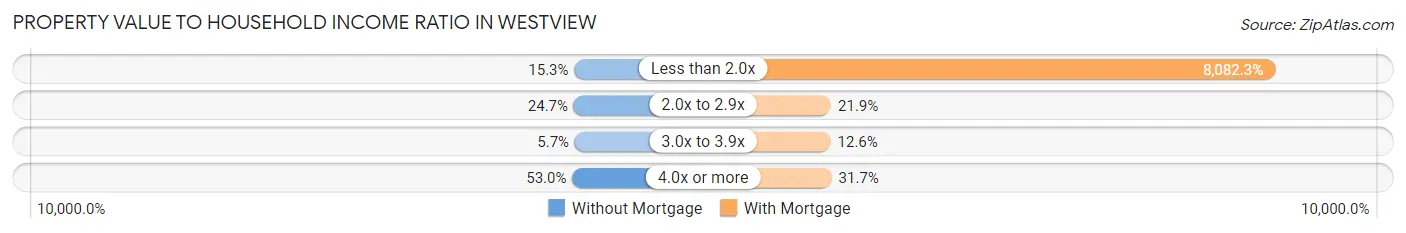
| Value-to-Income Ratio | Without Mortgage | With Mortgage |
| Less than 2.0x | 126 (15.3%) | 98,523 (8,082.3%) |
| 2.0x to 2.9x | 203 (24.7%) | 267 (21.9%) |
| 3.0x to 3.9x | 47 (5.7%) | 153 (12.6%) |
| 4.0x or more | 436 (53.0%) | 386 (31.7%) |
| Total | 823 (100.0%) | 1,219 (100.0%) |
Real Estate Taxes by Mortgage Status in Westview
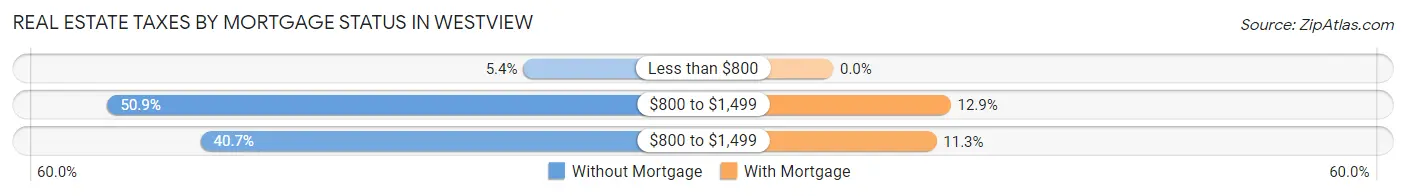
| Property Taxes | Without Mortgage | With Mortgage |
| Less than $800 | 44 (5.3%) | 0 (0.0%) |
| $800 to $1,499 | 419 (50.9%) | 157 (12.9%) |
| $800 to $1,499 | 335 (40.7%) | 138 (11.3%) |
| Total | 823 (100.0%) | 1,219 (100.0%) |
Health & Disability in Westview
Health Insurance Coverage by Age in Westview
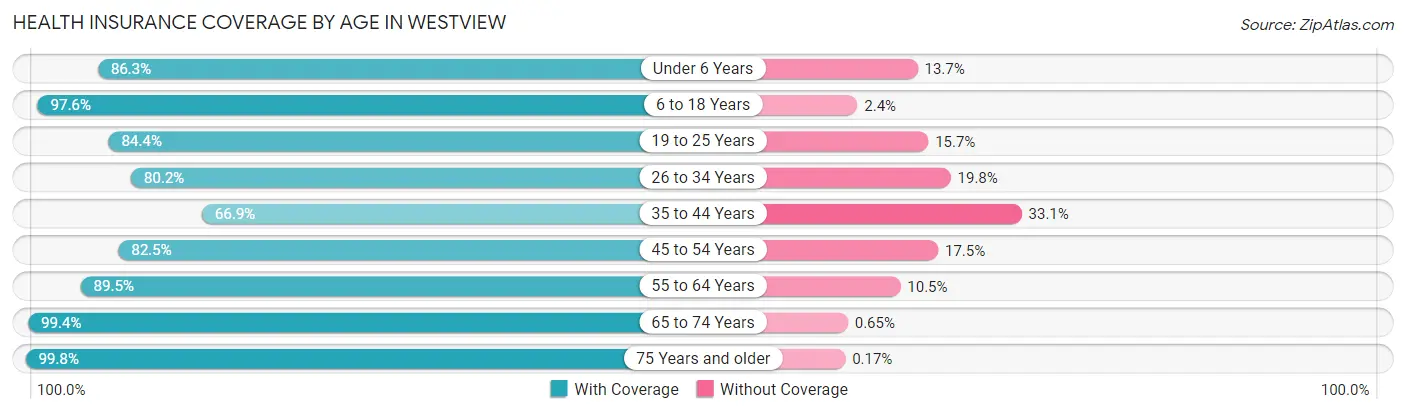
| Age Bracket | With Coverage | Without Coverage |
| Under 6 Years | 455 (86.3%) | 72 (13.7%) |
| 6 to 18 Years | 1,887 (97.6%) | 47 (2.4%) |
| 19 to 25 Years | 722 (84.4%) | 134 (15.7%) |
| 26 to 34 Years | 1,019 (80.2%) | 252 (19.8%) |
| 35 to 44 Years | 1,030 (66.9%) | 509 (33.1%) |
| 45 to 54 Years | 1,053 (82.5%) | 223 (17.5%) |
| 55 to 64 Years | 1,456 (89.5%) | 170 (10.5%) |
| 65 to 74 Years | 1,374 (99.4%) | 9 (0.6%) |
| 75 Years and older | 579 (99.8%) | 1 (0.2%) |
| Total | 9,575 (87.1%) | 1,417 (12.9%) |
Health Insurance Coverage by Citizenship Status in Westview
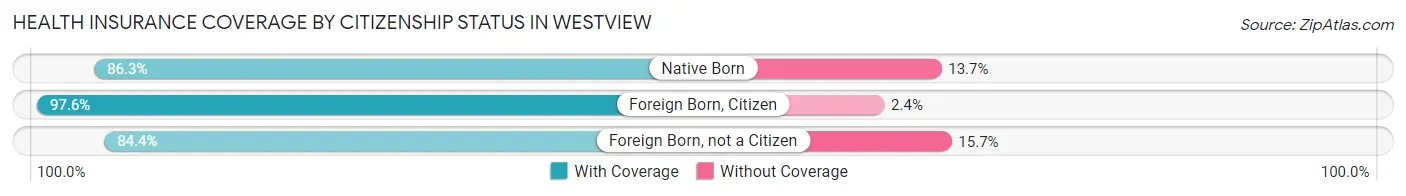
| Citizenship Status | With Coverage | Without Coverage |
| Native Born | 455 (86.3%) | 72 (13.7%) |
| Foreign Born, Citizen | 1,887 (97.6%) | 47 (2.4%) |
| Foreign Born, not a Citizen | 722 (84.4%) | 134 (15.7%) |
Health Insurance Coverage by Household Income in Westview
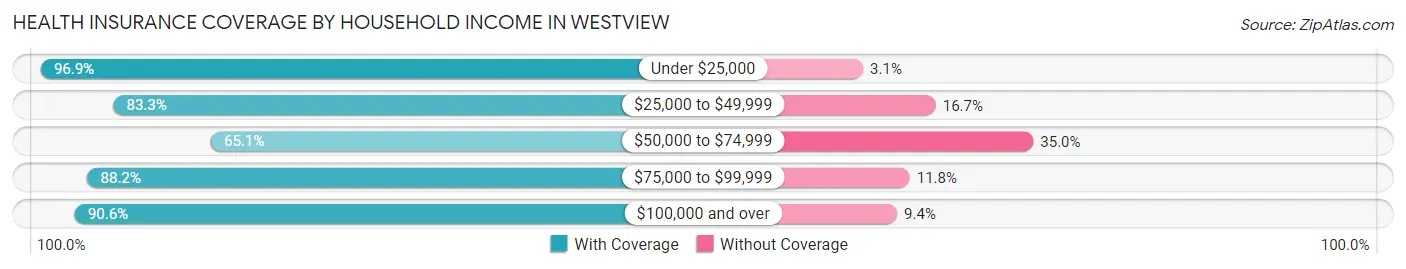
| Household Income | With Coverage | Without Coverage |
| Under $25,000 | 2,555 (96.9%) | 81 (3.1%) |
| $25,000 to $49,999 | 1,350 (83.3%) | 270 (16.7%) |
| $50,000 to $74,999 | 977 (65.0%) | 525 (34.9%) |
| $75,000 to $99,999 | 1,785 (88.2%) | 239 (11.8%) |
| $100,000 and over | 2,891 (90.6%) | 301 (9.4%) |
Public vs Private Health Insurance Coverage by Age in Westview
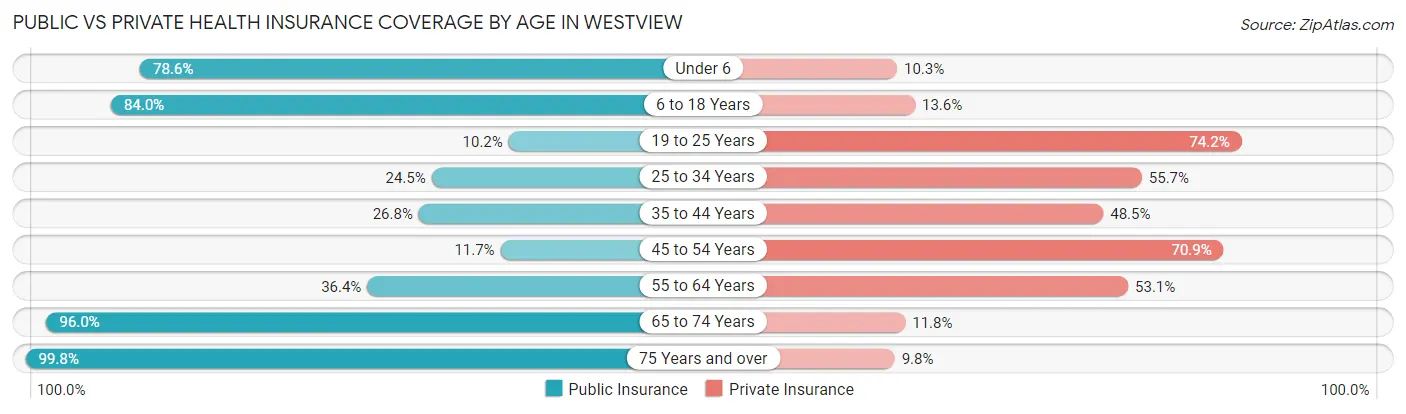
| Age Bracket | Public Insurance | Private Insurance |
| Under 6 | 414 (78.6%) | 54 (10.2%) |
| 6 to 18 Years | 1,624 (84.0%) | 263 (13.6%) |
| 19 to 25 Years | 87 (10.2%) | 635 (74.2%) |
| 25 to 34 Years | 311 (24.5%) | 708 (55.7%) |
| 35 to 44 Years | 413 (26.8%) | 747 (48.5%) |
| 45 to 54 Years | 149 (11.7%) | 904 (70.9%) |
| 55 to 64 Years | 592 (36.4%) | 864 (53.1%) |
| 65 to 74 Years | 1,327 (96.0%) | 163 (11.8%) |
| 75 Years and over | 579 (99.8%) | 57 (9.8%) |
| Total | 5,496 (50.0%) | 4,395 (40.0%) |
Disability Status by Sex by Age in Westview
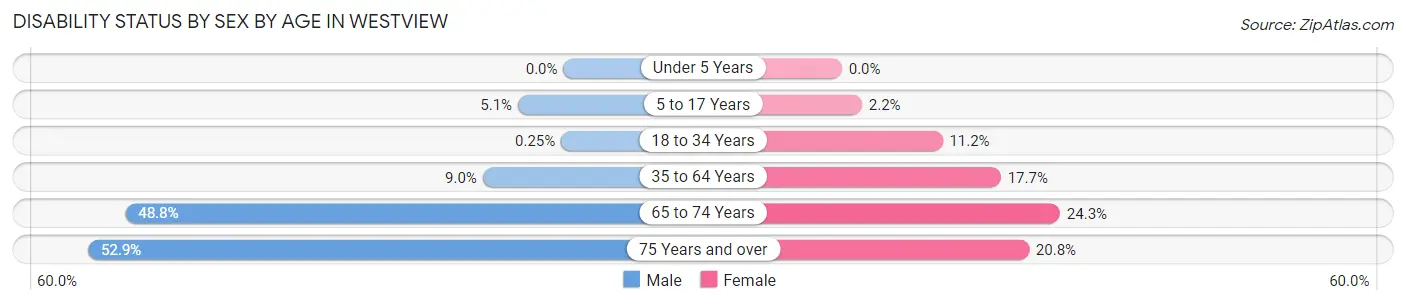
| Age Bracket | Male | Female |
| Under 5 Years | 0 (0.0%) | 0 (0.0%) |
| 5 to 17 Years | 56 (5.1%) | 18 (2.2%) |
| 18 to 34 Years | 3 (0.3%) | 119 (11.2%) |
| 35 to 64 Years | 169 (9.0%) | 453 (17.7%) |
| 65 to 74 Years | 299 (48.8%) | 187 (24.3%) |
| 75 Years and over | 81 (52.9%) | 89 (20.8%) |
Disability Class by Sex by Age in Westview
Disability Class: Hearing Difficulty
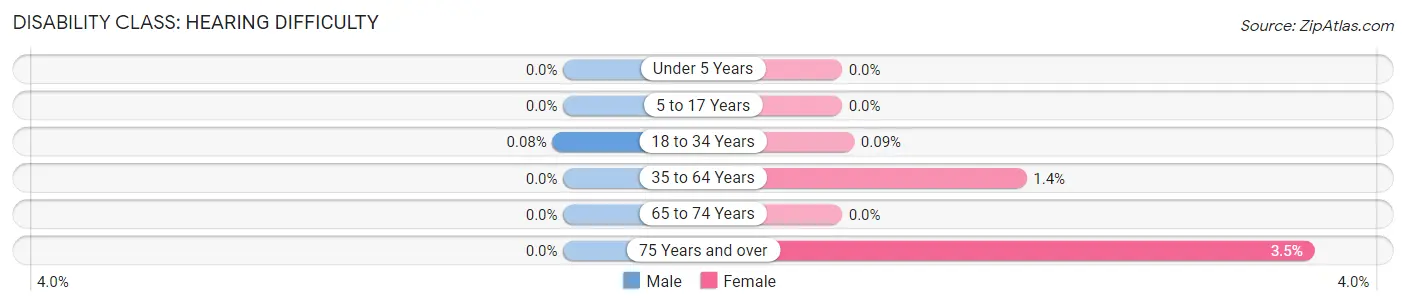
| Age Bracket | Male | Female |
| Under 5 Years | 0 (0.0%) | 0 (0.0%) |
| 5 to 17 Years | 0 (0.0%) | 0 (0.0%) |
| 18 to 34 Years | 1 (0.1%) | 1 (0.1%) |
| 35 to 64 Years | 0 (0.0%) | 35 (1.4%) |
| 65 to 74 Years | 0 (0.0%) | 0 (0.0%) |
| 75 Years and over | 0 (0.0%) | 15 (3.5%) |
Disability Class: Vision Difficulty
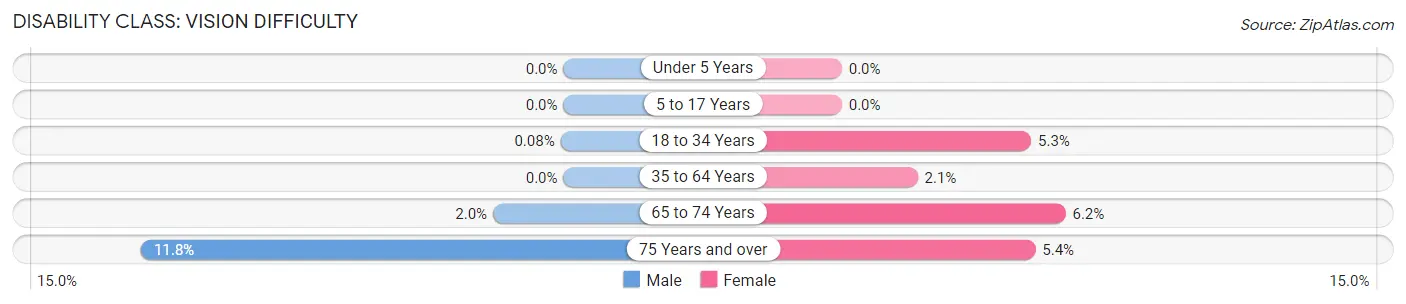
| Age Bracket | Male | Female |
| Under 5 Years | 0 (0.0%) | 0 (0.0%) |
| 5 to 17 Years | 0 (0.0%) | 0 (0.0%) |
| 18 to 34 Years | 1 (0.1%) | 56 (5.3%) |
| 35 to 64 Years | 0 (0.0%) | 54 (2.1%) |
| 65 to 74 Years | 12 (2.0%) | 48 (6.2%) |
| 75 Years and over | 18 (11.8%) | 23 (5.4%) |
Disability Class: Cognitive Difficulty
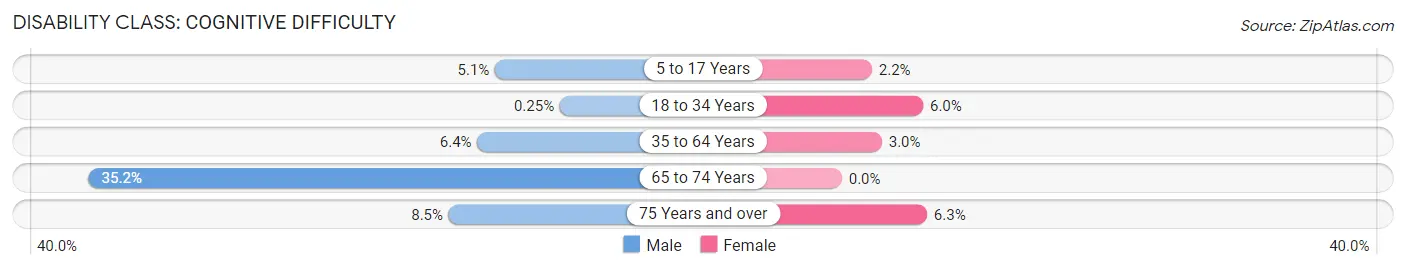
| Age Bracket | Male | Female |
| 5 to 17 Years | 56 (5.1%) | 18 (2.2%) |
| 18 to 34 Years | 3 (0.3%) | 64 (6.0%) |
| 35 to 64 Years | 120 (6.4%) | 76 (3.0%) |
| 65 to 74 Years | 216 (35.2%) | 0 (0.0%) |
| 75 Years and over | 13 (8.5%) | 27 (6.3%) |
Disability Class: Ambulatory Difficulty
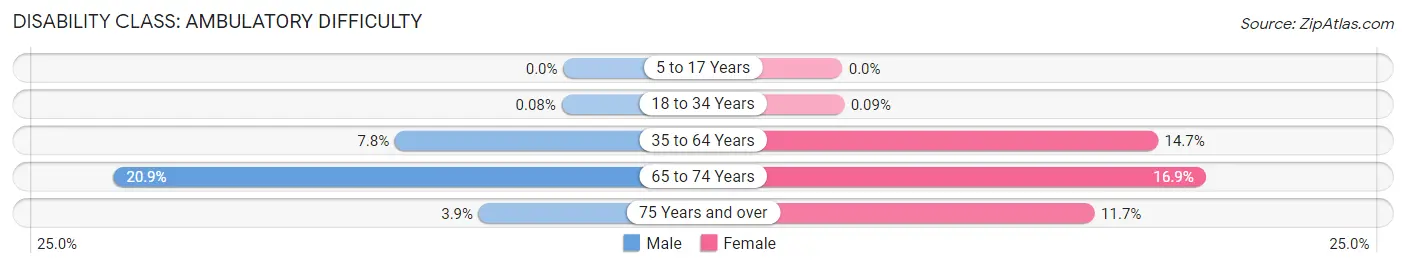
| Age Bracket | Male | Female |
| 5 to 17 Years | 0 (0.0%) | 0 (0.0%) |
| 18 to 34 Years | 1 (0.1%) | 1 (0.1%) |
| 35 to 64 Years | 147 (7.8%) | 375 (14.6%) |
| 65 to 74 Years | 128 (20.9%) | 130 (16.9%) |
| 75 Years and over | 6 (3.9%) | 50 (11.7%) |
Disability Class: Self-Care Difficulty
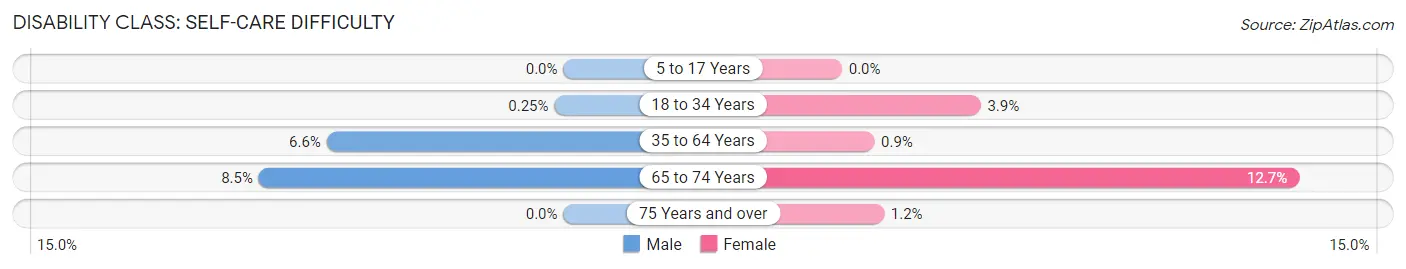
| Age Bracket | Male | Female |
| 5 to 17 Years | 0 (0.0%) | 0 (0.0%) |
| 18 to 34 Years | 3 (0.3%) | 41 (3.9%) |
| 35 to 64 Years | 124 (6.6%) | 23 (0.9%) |
| 65 to 74 Years | 52 (8.5%) | 98 (12.7%) |
| 75 Years and over | 0 (0.0%) | 5 (1.2%) |
Technology Access in Westview
Computing Device Access in Westview
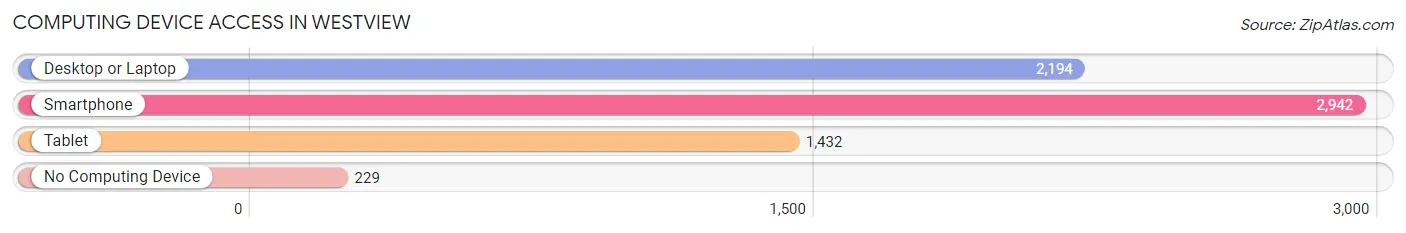
| Device Type | # Households | % Households |
| Desktop or Laptop | 2,194 | 62.9% |
| Smartphone | 2,942 | 84.4% |
| Tablet | 1,432 | 41.1% |
| No Computing Device | 229 | 6.6% |
| Total | 3,488 | 100.0% |
Internet Access in Westview
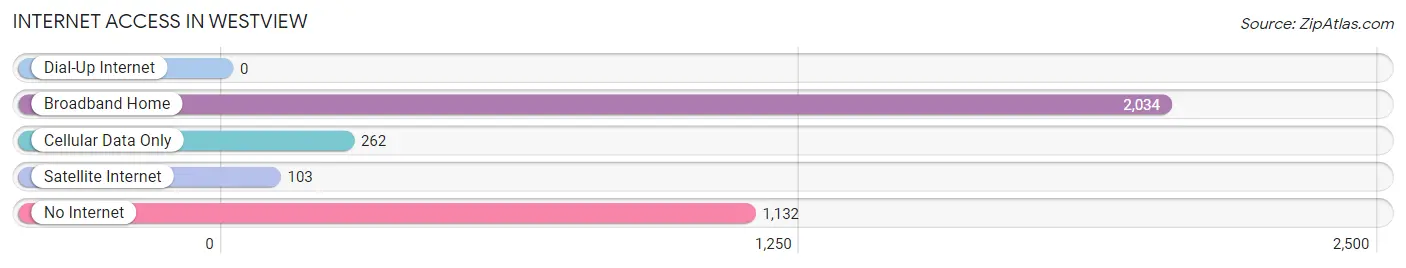
| Internet Type | # Households | % Households |
| Dial-Up Internet | 0 | 0.0% |
| Broadband Home | 2,034 | 58.3% |
| Cellular Data Only | 262 | 7.5% |
| Satellite Internet | 103 | 2.9% |
| No Internet | 1,132 | 32.5% |
| Total | 3,488 | 100.0% |
Westview Summary
Westview is a small town located in the state of Florida, in the United States. It is situated in the northern part of the state, in the county of Clay. The town has a population of approximately 1,500 people, and is located about 25 miles south of Jacksonville.
History
Westview was founded in 1887 by a group of settlers from Georgia. The town was originally called “Westview Station”, and was a stop on the Florida Central and Peninsular Railroad. The town was officially incorporated in 1891, and the name was changed to Westview.
The town grew slowly over the years, and by the early 1900s, it had become a thriving agricultural community. The town was known for its citrus groves, and it was also home to a number of small businesses.
In the 1950s, Westview began to experience a period of growth and development. The town was connected to the rest of the state by the newly constructed Interstate 10, and the population began to increase. The town also began to attract new businesses, and the economy began to diversify.
Geography
Westview is located in the northern part of the state of Florida, in the county of Clay. The town is situated on the banks of the St. Johns River, and is about 25 miles south of Jacksonville. The town is surrounded by a number of small towns and villages, including Orange Park, Middleburg, and Green Cove Springs.
The town is located in a flat, low-lying area, and is surrounded by a number of small lakes and ponds. The climate in Westview is humid subtropical, with hot, humid summers and mild winters.
Economy
Westview’s economy is largely based on agriculture and tourism. The town is home to a number of small businesses, including restaurants, retail stores, and service providers. The town is also home to a number of citrus groves, and is a popular destination for tourists.
The town is also home to a number of manufacturing companies, including a paper mill and a plastics factory. The town is also home to a number of small technology companies, and is a popular destination for entrepreneurs.
Demographics
As of the 2010 census, Westview had a population of 1,500 people. The town is predominantly white, with a small African American population. The town is also home to a small Hispanic population, and a small Asian population.
The median household income in Westview is $45,000, and the median home value is $150,000. The town has a low unemployment rate, and a high rate of homeownership. The town is also home to a number of small businesses, and is a popular destination for entrepreneurs.
Common Questions
What is Per Capita Income in Westview?
Per Capita income in Westview is $20,781.
What is the Median Family Income in Westview?
Median Family Income in Westview is $65,929.
What is the Median Household income in Westview?
Median Household Income in Westview is $44,538.
What is Income or Wage Gap in Westview?
Income or Wage Gap in Westview is 19.8%.
Women in Westview earn 80.2 cents for every dollar earned by a man.
What is Family Income Deficit in Westview?
Family Income Deficit in Westview is $9,733.
Families that are below poverty line in Westview earn $9,733 less on average than the poverty threshold level.
What is Inequality or Gini Index in Westview?
Inequality or Gini Index in Westview is 0.45.
What is the Total Population of Westview?
Total Population of Westview is 10,992.
What is the Total Male Population of Westview?
Total Male Population of Westview is 5,263.
What is the Total Female Population of Westview?
Total Female Population of Westview is 5,729.
What is the Ratio of Males per 100 Females in Westview?
There are 91.87 Males per 100 Females in Westview.
What is the Ratio of Females per 100 Males in Westview?
There are 108.85 Females per 100 Males in Westview.
What is the Median Population Age in Westview?
Median Population Age in Westview is 40.1 Years.
What is the Average Family Size in Westview
Average Family Size in Westview is 3.6 People.
What is the Average Household Size in Westview
Average Household Size in Westview is 3.1 People.
How Large is the Labor Force in Westview?
There are 4,847 People in the Labor Forcein in Westview.
What is the Percentage of People in the Labor Force in Westview?
55.6% of People are in the Labor Force in Westview.
What is the Unemployment Rate in Westview?
Unemployment Rate in Westview is 2.0%.