Uvalde, TX Map & Demographics
Uvalde Map
Uvalde Overview
$24,387
PER CAPITA INCOME
$60,043
AVG FAMILY INCOME
$47,289
AVG HOUSEHOLD INCOME
46.2%
WAGE / INCOME GAP [ % ]
53.8¢/ $1
WAGE / INCOME GAP [ $ ]
$10,883
FAMILY INCOME DEFICIT
0.51
INEQUALITY / GINI INDEX
15,342
TOTAL POPULATION
7,581
MALE POPULATION
7,761
FEMALE POPULATION
97.68
MALES / 100 FEMALES
102.37
FEMALES / 100 MALES
31.9
MEDIAN AGE
3.4
AVG FAMILY SIZE
2.9
AVG HOUSEHOLD SIZE
6,374
LABOR FORCE [ PEOPLE ]
55.9%
PERCENT IN LABOR FORCE
1.1%
UNEMPLOYMENT RATE
Uvalde Zip Codes
Uvalde Area Codes
Income in Uvalde
Income Overview in Uvalde
Per Capita Income in Uvalde is $24,387, while median incomes of families and households are $60,043 and $47,289 respectively.
| Characteristic | Number | Measure |
| Per Capita Income | 15,342 | $24,387 |
| Median Family Income | 3,644 | $60,043 |
| Mean Family Income | 3,644 | $75,758 |
| Median Household Income | 5,186 | $47,289 |
| Mean Household Income | 5,186 | $64,624 |
| Income Deficit | 3,644 | $10,883 |
| Wage / Income Gap (%) | 15,342 | 46.22% |
| Wage / Income Gap ($) | 15,342 | 53.78¢ per $1 |
| Gini / Inequality Index | 15,342 | 0.51 |
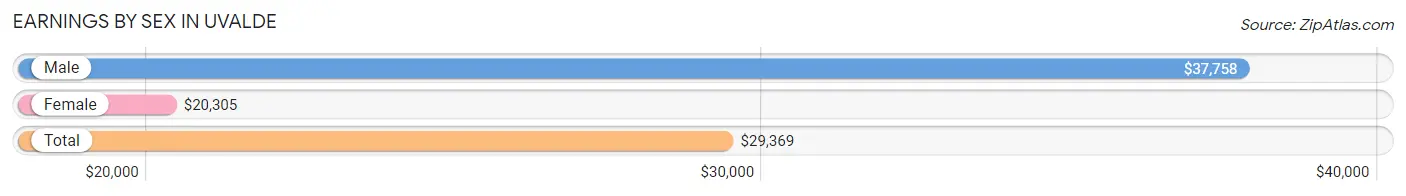
Earnings by Sex in Uvalde
Average Earnings in Uvalde are $29,369, $37,758 for men and $20,305 for women, a difference of 46.2%.
| Sex | Number | Average Earnings |
| Male | 3,409 (48.4%) | $37,758 |
| Female | 3,629 (51.6%) | $20,305 |
| Total | 7,038 (100.0%) | $29,369 |
Earnings by Sex by Income Bracket in Uvalde
The most common earnings brackets in Uvalde are $35,000 to $39,999 for men (318 | 9.3%) and $30,000 to $34,999 for women (354 | 9.8%).
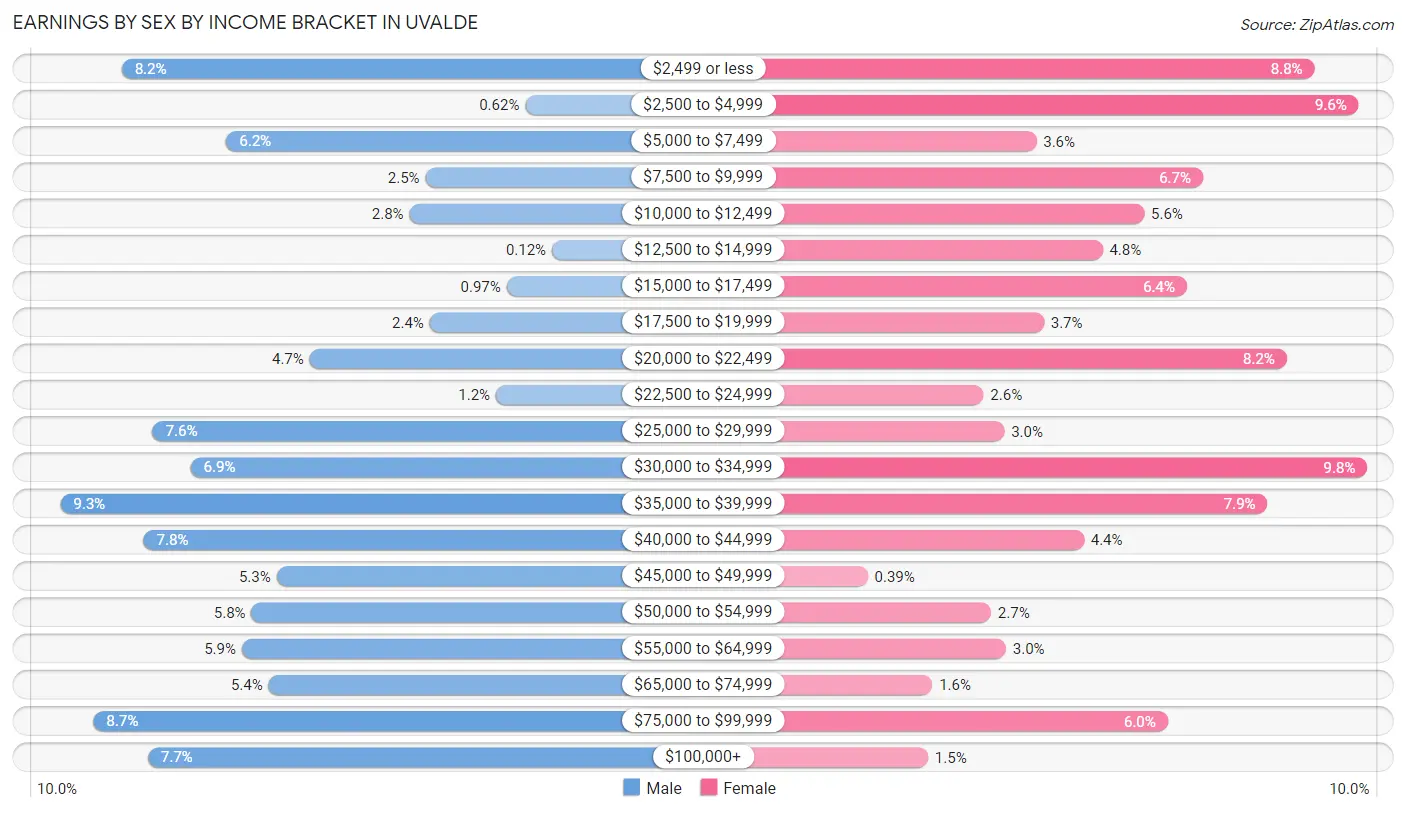
| Income | Male | Female |
| $2,499 or less | 279 (8.2%) | 318 (8.8%) |
| $2,500 to $4,999 | 21 (0.6%) | 348 (9.6%) |
| $5,000 to $7,499 | 212 (6.2%) | 129 (3.5%) |
| $7,500 to $9,999 | 85 (2.5%) | 242 (6.7%) |
| $10,000 to $12,499 | 95 (2.8%) | 202 (5.6%) |
| $12,500 to $14,999 | 4 (0.1%) | 174 (4.8%) |
| $15,000 to $17,499 | 33 (1.0%) | 231 (6.4%) |
| $17,500 to $19,999 | 82 (2.4%) | 134 (3.7%) |
| $20,000 to $22,499 | 159 (4.7%) | 299 (8.2%) |
| $22,500 to $24,999 | 40 (1.2%) | 93 (2.6%) |
| $25,000 to $29,999 | 259 (7.6%) | 107 (2.9%) |
| $30,000 to $34,999 | 235 (6.9%) | 354 (9.8%) |
| $35,000 to $39,999 | 318 (9.3%) | 286 (7.9%) |
| $40,000 to $44,999 | 265 (7.8%) | 161 (4.4%) |
| $45,000 to $49,999 | 180 (5.3%) | 14 (0.4%) |
| $50,000 to $54,999 | 196 (5.8%) | 98 (2.7%) |
| $55,000 to $64,999 | 202 (5.9%) | 108 (3.0%) |
| $65,000 to $74,999 | 185 (5.4%) | 58 (1.6%) |
| $75,000 to $99,999 | 297 (8.7%) | 218 (6.0%) |
| $100,000+ | 262 (7.7%) | 55 (1.5%) |
| Total | 3,409 (100.0%) | 3,629 (100.0%) |
Earnings by Sex by Educational Attainment in Uvalde
Average earnings in Uvalde are $43,642 for men and $22,412 for women, a difference of 48.6%. Men with an educational attainment of bachelor's degree enjoy the highest average annual earnings of $46,812, while those with high school diploma education earn the least with $35,366. Women with an educational attainment of bachelor's degree earn the most with the average annual earnings of $36,250, while those with less than high school education have the smallest earnings of $15,945.
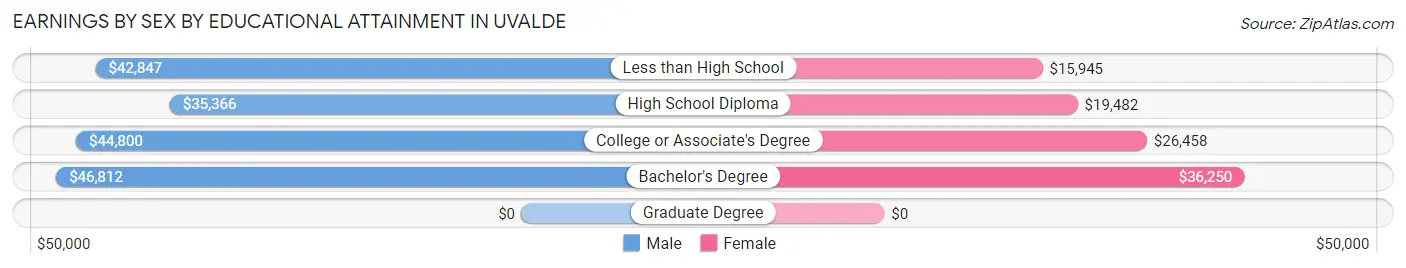
| Educational Attainment | Male Income | Female Income |
| Less than High School | $42,847 | $15,945 |
| High School Diploma | $35,366 | $19,482 |
| College or Associate's Degree | $44,800 | $26,458 |
| Bachelor's Degree | $46,812 | $36,250 |
| Graduate Degree | - | - |
| Total | $43,642 | $22,412 |
Family Income in Uvalde
Family Income Brackets in Uvalde
According to the Uvalde family income data, there are 791 families falling into the $50,000 to $74,999 income range, which is the most common income bracket and makes up 21.7% of all families. Conversely, the $10,000 to $14,999 income bracket is the least frequent group with only 95 families (2.6%) belonging to this category.
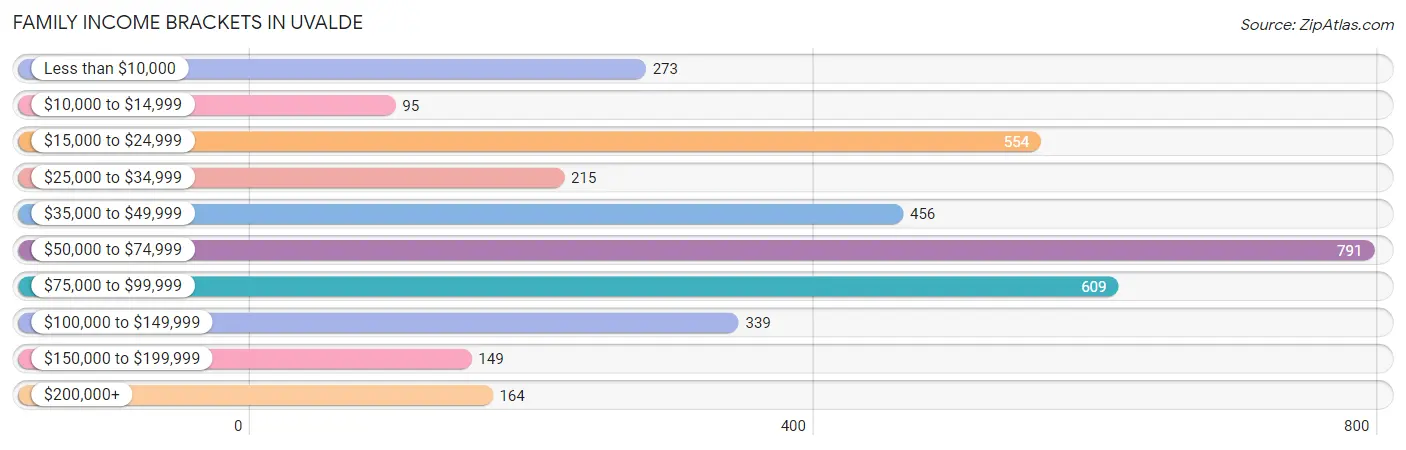
| Income Bracket | # Families | % Families |
| Less than $10,000 | 273 | 7.5% |
| $10,000 to $14,999 | 95 | 2.6% |
| $15,000 to $24,999 | 554 | 15.2% |
| $25,000 to $34,999 | 215 | 5.9% |
| $35,000 to $49,999 | 456 | 12.5% |
| $50,000 to $74,999 | 791 | 21.7% |
| $75,000 to $99,999 | 609 | 16.7% |
| $100,000 to $149,999 | 339 | 9.3% |
| $150,000 to $199,999 | 149 | 4.1% |
| $200,000+ | 164 | 4.5% |
Family Income by Famaliy Size in Uvalde
4-person families (512 | 14.1%) account for the highest median family income in Uvalde with $65,455 per family, while 2-person families (1,190 | 32.7%) have the highest median income of $28,978 per family member.
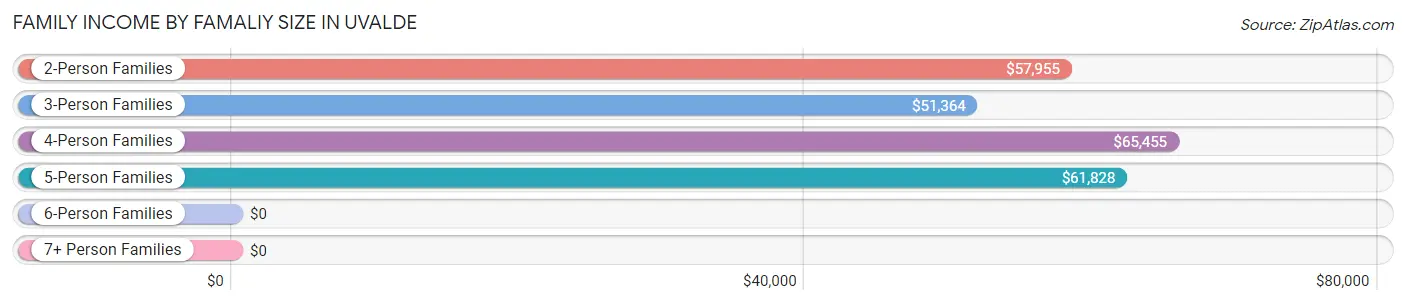
| Income Bracket | # Families | Median Income |
| 2-Person Families | 1,190 (32.7%) | $57,955 |
| 3-Person Families | 1,142 (31.3%) | $51,364 |
| 4-Person Families | 512 (14.1%) | $65,455 |
| 5-Person Families | 664 (18.2%) | $61,828 |
| 6-Person Families | 6 (0.2%) | $0 |
| 7+ Person Families | 130 (3.6%) | $0 |
| Total | 3,644 (100.0%) | $60,043 |
Family Income by Number of Earners in Uvalde
The median family income in Uvalde is $60,043, with families comprising 2 earners (906) having the highest median family income of $96,629, while families with no earners (588) have the lowest median family income of $17,092, accounting for 24.9% and 16.1% of families, respectively.
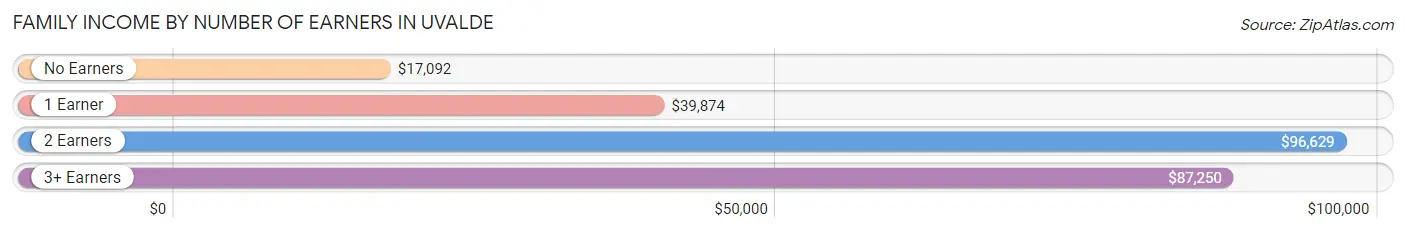
| Number of Earners | # Families | Median Income |
| No Earners | 588 (16.1%) | $17,092 |
| 1 Earner | 1,703 (46.7%) | $39,874 |
| 2 Earners | 906 (24.9%) | $96,629 |
| 3+ Earners | 447 (12.3%) | $87,250 |
| Total | 3,644 (100.0%) | $60,043 |
Household Income in Uvalde
Household Income Brackets in Uvalde
With 1,016 households falling in the category, the $15,000 to $24,999 income range is the most frequent in Uvalde, accounting for 19.6% of all households. In contrast, only 150 households (2.9%) fall into the $150,000 to $199,999 income bracket, making it the least populous group.
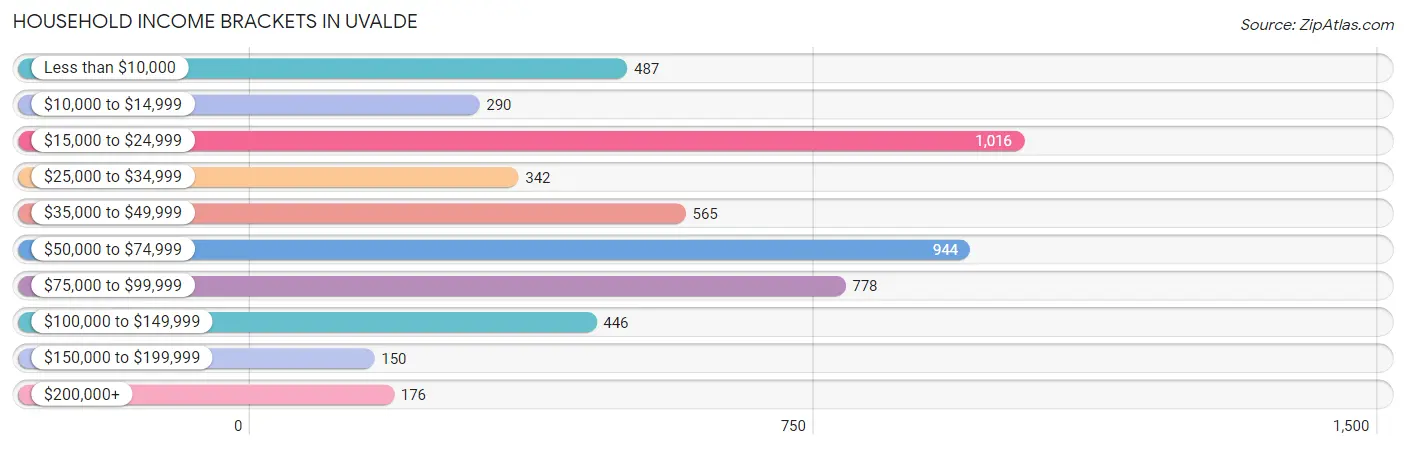
| Income Bracket | # Households | % Households |
| Less than $10,000 | 487 | 9.4% |
| $10,000 to $14,999 | 290 | 5.6% |
| $15,000 to $24,999 | 1,016 | 19.6% |
| $25,000 to $34,999 | 342 | 6.6% |
| $35,000 to $49,999 | 565 | 10.9% |
| $50,000 to $74,999 | 944 | 18.2% |
| $75,000 to $99,999 | 778 | 15.0% |
| $100,000 to $149,999 | 446 | 8.6% |
| $150,000 to $199,999 | 150 | 2.9% |
| $200,000+ | 176 | 3.4% |
Household Income by Householder Age in Uvalde
The median household income in Uvalde is $47,289, with the highest median household income of $60,735 found in the 25 to 44 years age bracket for the primary householder. A total of 2,164 households (41.7%) fall into this category. Meanwhile, the 15 to 24 years age bracket for the primary householder has the lowest median household income of $0, with 229 households (4.4%) in this group.
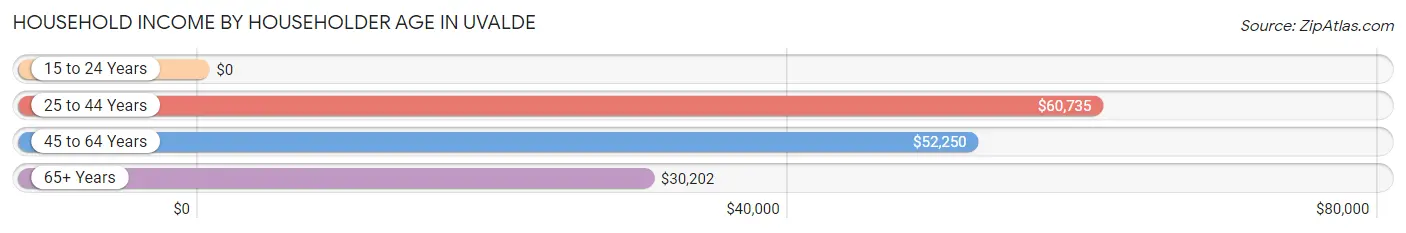
| Income Bracket | # Households | Median Income |
| 15 to 24 Years | 229 (4.4%) | $0 |
| 25 to 44 Years | 2,164 (41.7%) | $60,735 |
| 45 to 64 Years | 1,374 (26.5%) | $52,250 |
| 65+ Years | 1,419 (27.4%) | $30,202 |
| Total | 5,186 (100.0%) | $47,289 |
Poverty in Uvalde
Income Below Poverty by Sex and Age in Uvalde
With 31.1% poverty level for males and 26.5% for females among the residents of Uvalde, 15 year old males and 45 to 54 year old females are the most vulnerable to poverty, with 157 males (62.8%) and 215 females (43.2%) in their respective age groups living below the poverty level.
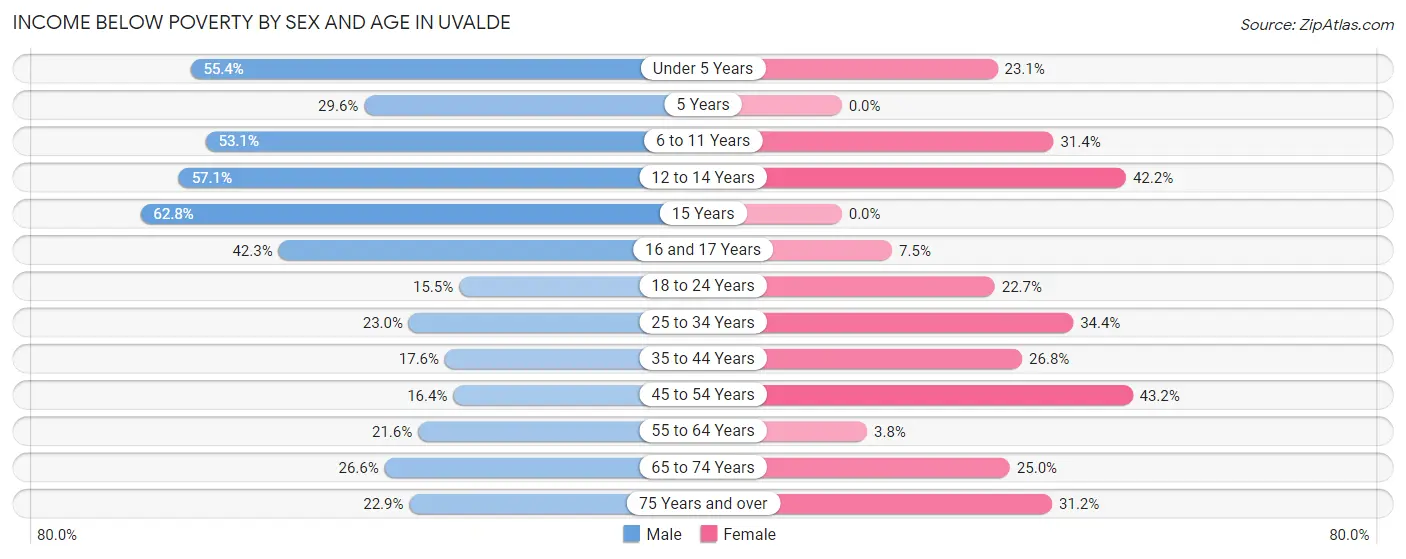
| Age Bracket | Male | Female |
| Under 5 Years | 340 (55.4%) | 108 (23.1%) |
| 5 Years | 42 (29.6%) | 0 (0.0%) |
| 6 to 11 Years | 331 (53.1%) | 187 (31.4%) |
| 12 to 14 Years | 269 (57.1%) | 211 (42.2%) |
| 15 Years | 157 (62.8%) | 0 (0.0%) |
| 16 and 17 Years | 129 (42.3%) | 11 (7.5%) |
| 18 to 24 Years | 103 (15.5%) | 207 (22.7%) |
| 25 to 34 Years | 241 (23.0%) | 381 (34.4%) |
| 35 to 44 Years | 152 (17.6%) | 301 (26.8%) |
| 45 to 54 Years | 104 (16.4%) | 215 (43.2%) |
| 55 to 64 Years | 134 (21.6%) | 30 (3.8%) |
| 65 to 74 Years | 124 (26.6%) | 178 (25.0%) |
| 75 Years and over | 100 (22.9%) | 168 (31.2%) |
| Total | 2,226 (31.1%) | 1,997 (26.5%) |
Income Above Poverty by Sex and Age in Uvalde
According to the poverty statistics in Uvalde, males aged 18 to 24 years and females aged 5 years are the age groups that are most secure financially, with 84.5% of males and 100.0% of females in these age groups living above the poverty line.
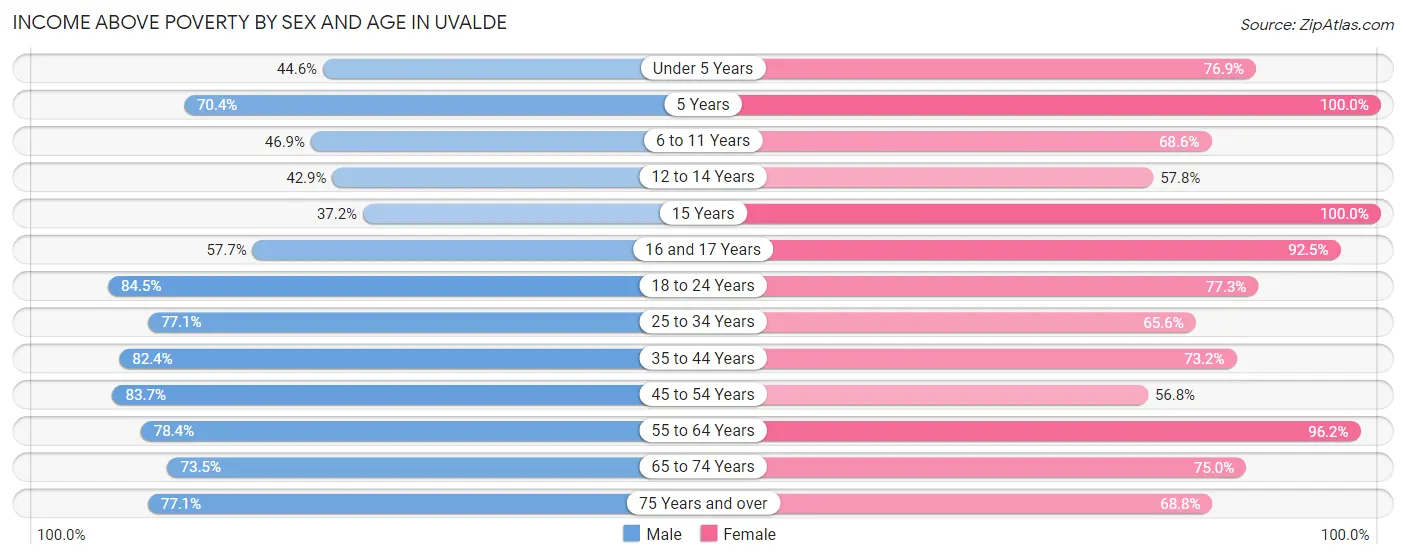
| Age Bracket | Male | Female |
| Under 5 Years | 274 (44.6%) | 359 (76.9%) |
| 5 Years | 100 (70.4%) | 118 (100.0%) |
| 6 to 11 Years | 292 (46.9%) | 408 (68.6%) |
| 12 to 14 Years | 202 (42.9%) | 289 (57.8%) |
| 15 Years | 93 (37.2%) | 29 (100.0%) |
| 16 and 17 Years | 176 (57.7%) | 136 (92.5%) |
| 18 to 24 Years | 562 (84.5%) | 704 (77.3%) |
| 25 to 34 Years | 809 (77.0%) | 728 (65.6%) |
| 35 to 44 Years | 712 (82.4%) | 823 (73.2%) |
| 45 to 54 Years | 532 (83.7%) | 283 (56.8%) |
| 55 to 64 Years | 487 (78.4%) | 767 (96.2%) |
| 65 to 74 Years | 343 (73.5%) | 535 (75.0%) |
| 75 Years and over | 337 (77.1%) | 370 (68.8%) |
| Total | 4,919 (68.9%) | 5,549 (73.5%) |
Income Below Poverty Among Married-Couple Families in Uvalde
The poverty statistics for married-couple families in Uvalde show that 16.8% or 357 of the total 2,130 families live below the poverty line. Families with 5 or more children have the highest poverty rate of 100.0%, comprising of 82 families. On the other hand, families with no children have the lowest poverty rate of 9.4%, which includes 86 families.
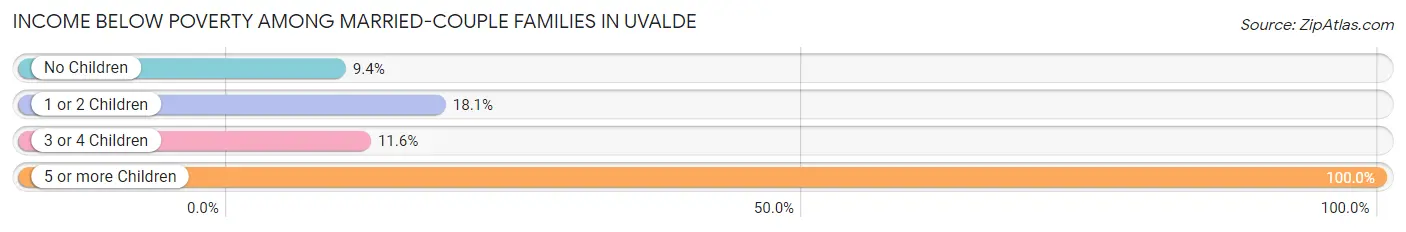
| Children | Above Poverty | Below Poverty |
| No Children | 830 (90.6%) | 86 (9.4%) |
| 1 or 2 Children | 729 (81.9%) | 161 (18.1%) |
| 3 or 4 Children | 214 (88.4%) | 28 (11.6%) |
| 5 or more Children | 0 (0.0%) | 82 (100.0%) |
| Total | 1,773 (83.2%) | 357 (16.8%) |
Income Below Poverty Among Single-Parent Households in Uvalde
According to the poverty data in Uvalde, 29.9% or 98 single-father households and 45.7% or 542 single-mother households are living below the poverty line. Among single-father households, those with 3 or 4 children have the highest poverty rate, with 14 households (34.2%) experiencing poverty. Likewise, among single-mother households, those with 1 or 2 children have the highest poverty rate, with 419 households (60.7%) falling below the poverty line.
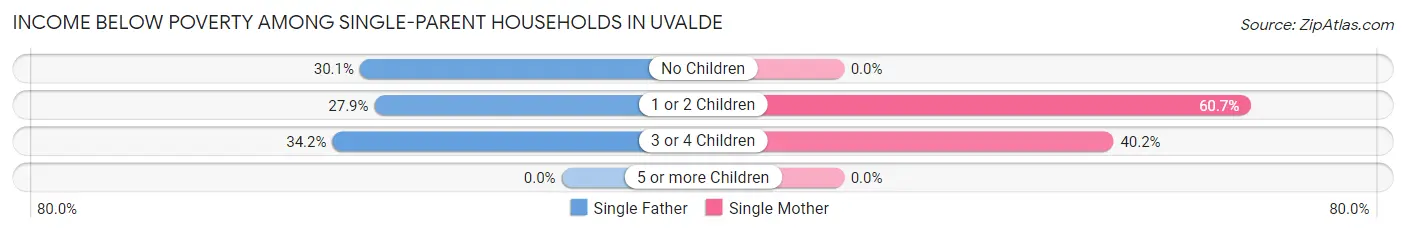
| Children | Single Father | Single Mother |
| No Children | 55 (30.0%) | 0 (0.0%) |
| 1 or 2 Children | 29 (27.9%) | 419 (60.7%) |
| 3 or 4 Children | 14 (34.2%) | 123 (40.2%) |
| 5 or more Children | 0 (0.0%) | 0 (0.0%) |
| Total | 98 (29.9%) | 542 (45.7%) |
Income Below Poverty Among Married-Couple vs Single-Parent Households in Uvalde
The poverty data for Uvalde shows that 357 of the married-couple family households (16.8%) and 640 of the single-parent households (42.3%) are living below the poverty level. Within the married-couple family households, those with 5 or more children have the highest poverty rate, with 82 households (100.0%) falling below the poverty line. Among the single-parent households, those with 1 or 2 children have the highest poverty rate, with 448 household (56.4%) living below poverty.
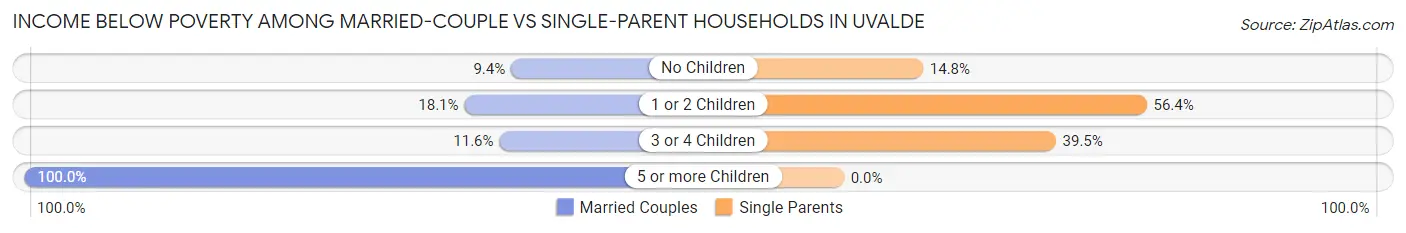
| Children | Married-Couple Families | Single-Parent Households |
| No Children | 86 (9.4%) | 55 (14.7%) |
| 1 or 2 Children | 161 (18.1%) | 448 (56.4%) |
| 3 or 4 Children | 28 (11.6%) | 137 (39.5%) |
| 5 or more Children | 82 (100.0%) | 0 (0.0%) |
| Total | 357 (16.8%) | 640 (42.3%) |
Race in Uvalde
The most populous races in Uvalde are Hispanic or Latino (12,586 | 82.0%), White / Caucasian (10,899 | 71.0%), and Two or more Races (2,031 | 13.2%).
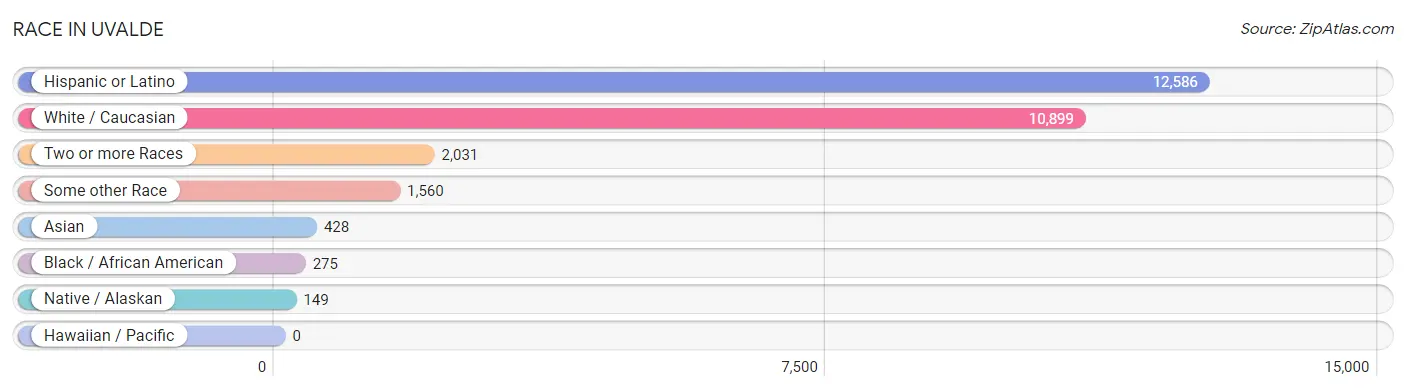
| Race | # Population | % Population |
| Asian | 428 | 2.8% |
| Black / African American | 275 | 1.8% |
| Hawaiian / Pacific | 0 | 0.0% |
| Hispanic or Latino | 12,586 | 82.0% |
| Native / Alaskan | 149 | 1.0% |
| White / Caucasian | 10,899 | 71.0% |
| Two or more Races | 2,031 | 13.2% |
| Some other Race | 1,560 | 10.2% |
| Total | 15,342 | 100.0% |
Ancestry in Uvalde
The most populous ancestries reported in Uvalde are Mexican (11,253 | 73.4%), English (516 | 3.4%), American (498 | 3.3%), German (472 | 3.1%), and Irish (339 | 2.2%), together accounting for 85.3% of all Uvalde residents.
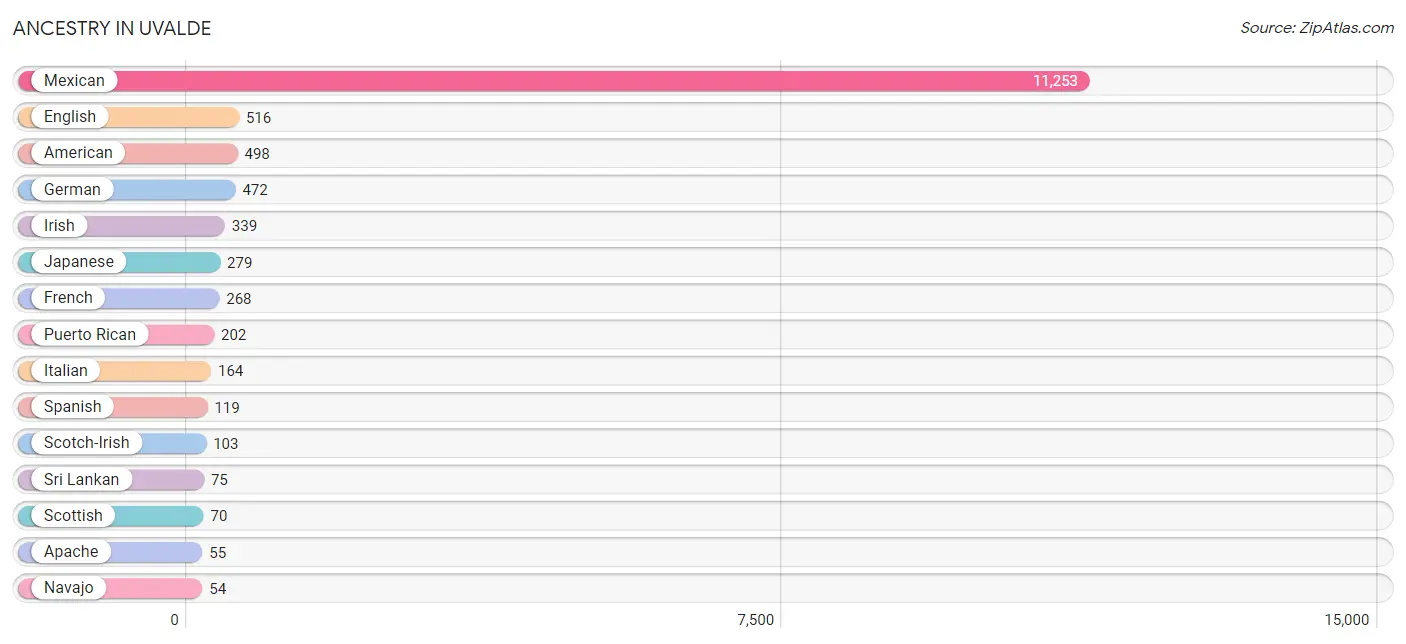
| Ancestry | # Population | % Population |
| African | 8 | 0.1% |
| American | 498 | 3.3% |
| Apache | 55 | 0.4% |
| Brazilian | 16 | 0.1% |
| Burmese | 25 | 0.2% |
| Central American | 14 | 0.1% |
| Cherokee | 25 | 0.2% |
| Choctaw | 24 | 0.2% |
| Czech | 23 | 0.2% |
| Danish | 18 | 0.1% |
| Dutch | 5 | 0.0% |
| Dutch West Indian | 13 | 0.1% |
| English | 516 | 3.4% |
| European | 18 | 0.1% |
| French | 268 | 1.8% |
| German | 472 | 3.1% |
| Guatemalan | 4 | 0.0% |
| Honduran | 5 | 0.0% |
| Indian (Asian) | 49 | 0.3% |
| Irish | 339 | 2.2% |
| Italian | 164 | 1.1% |
| Japanese | 279 | 1.8% |
| Korean | 21 | 0.1% |
| Lithuanian | 40 | 0.3% |
| Mexican | 11,253 | 73.4% |
| Navajo | 54 | 0.4% |
| New Zealander | 11 | 0.1% |
| Norwegian | 3 | 0.0% |
| Panamanian | 5 | 0.0% |
| Polish | 17 | 0.1% |
| Portuguese | 10 | 0.1% |
| Pueblo | 18 | 0.1% |
| Puerto Rican | 202 | 1.3% |
| Scotch-Irish | 103 | 0.7% |
| Scottish | 70 | 0.5% |
| Spanish | 119 | 0.8% |
| Sri Lankan | 75 | 0.5% |
| Subsaharan African | 8 | 0.1% |
| Thai | 14 | 0.1% |
| Welsh | 11 | 0.1% | View All 40 Rows |
Immigrants in Uvalde
The most numerous immigrant groups reported in Uvalde came from Latin America (1,436 | 9.4%), Central America (1,420 | 9.3%), Mexico (1,411 | 9.2%), Asia (220 | 1.4%), and South Eastern Asia (146 | 0.9%), together accounting for 30.2% of all Uvalde residents.
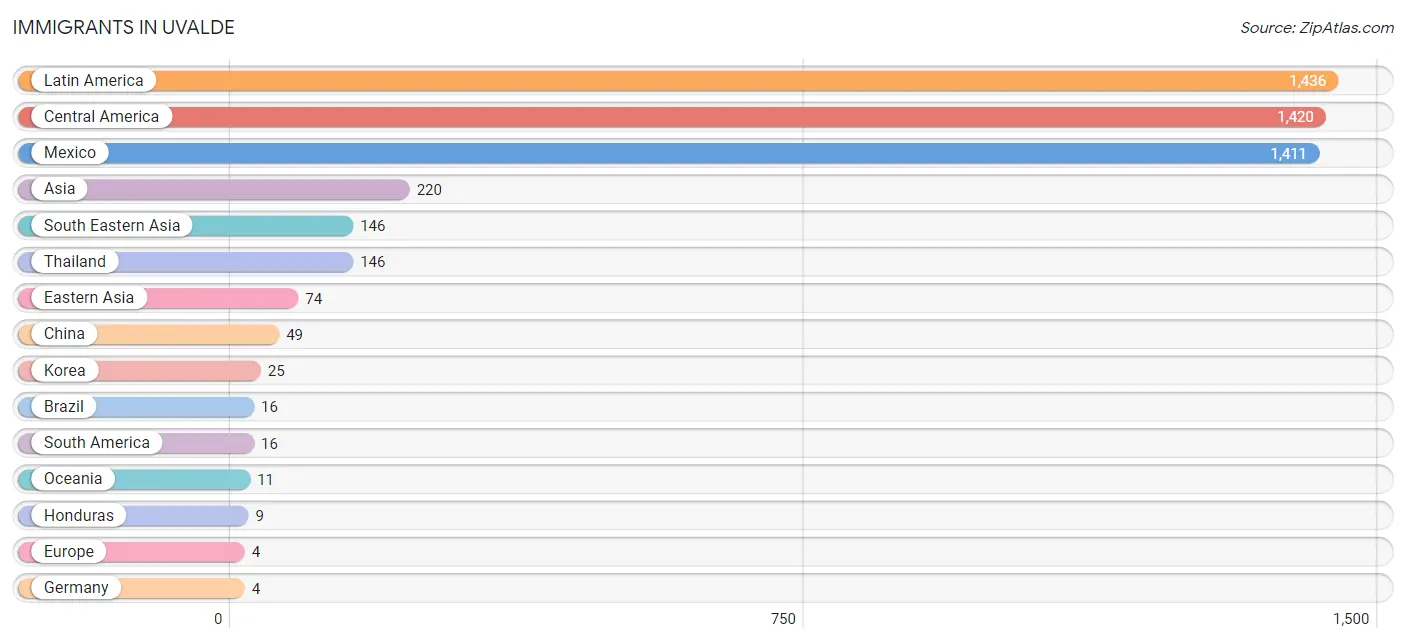
| Immigration Origin | # Population | % Population |
| Asia | 220 | 1.4% |
| Brazil | 16 | 0.1% |
| Central America | 1,420 | 9.3% |
| China | 49 | 0.3% |
| Eastern Asia | 74 | 0.5% |
| Europe | 4 | 0.0% |
| Germany | 4 | 0.0% |
| Honduras | 9 | 0.1% |
| Korea | 25 | 0.2% |
| Latin America | 1,436 | 9.4% |
| Mexico | 1,411 | 9.2% |
| Oceania | 11 | 0.1% |
| South America | 16 | 0.1% |
| South Eastern Asia | 146 | 0.9% |
| Thailand | 146 | 0.9% |
| Western Europe | 4 | 0.0% | View All 16 Rows |
Sex and Age in Uvalde
Sex and Age in Uvalde
The most populous age groups in Uvalde are 15 to 19 Years (688 | 9.1%) for men and 10 to 14 Years (751 | 9.7%) for women.
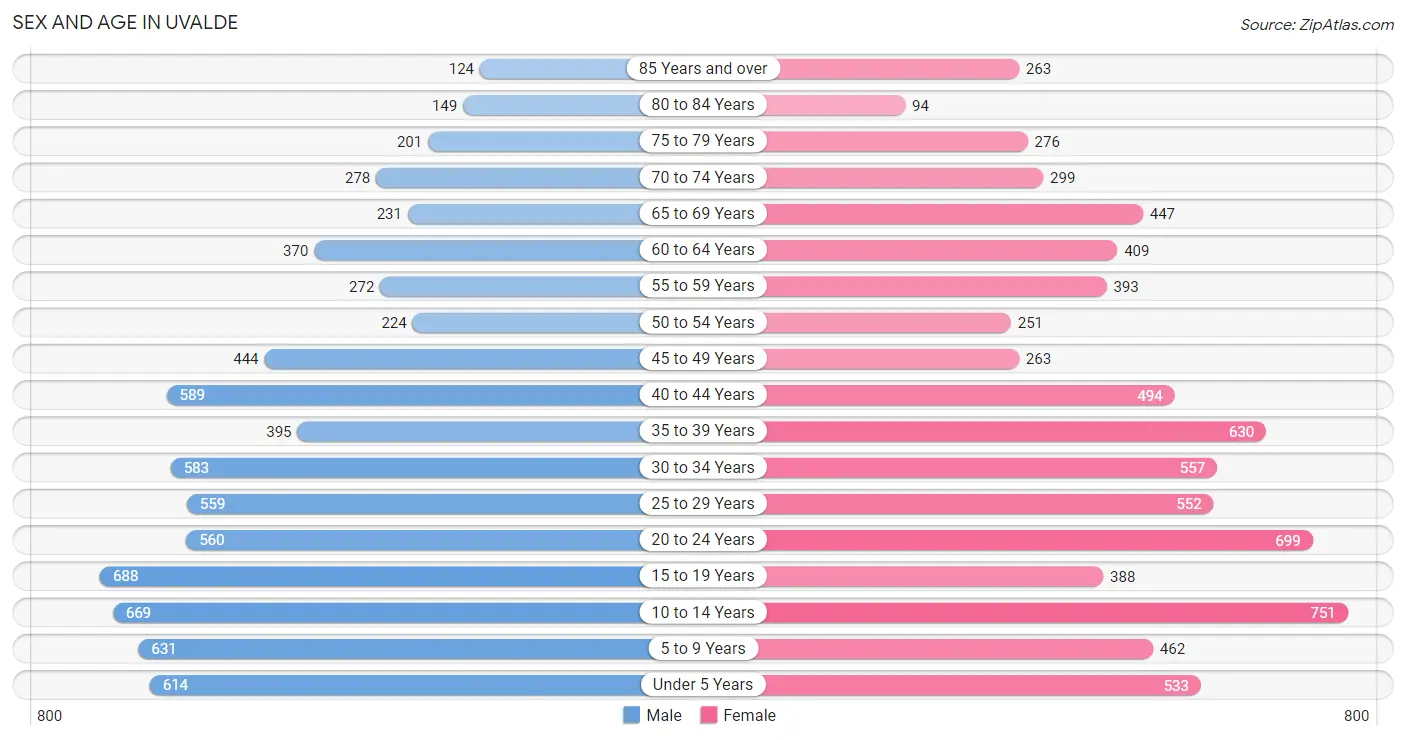
| Age Bracket | Male | Female |
| Under 5 Years | 614 (8.1%) | 533 (6.9%) |
| 5 to 9 Years | 631 (8.3%) | 462 (5.9%) |
| 10 to 14 Years | 669 (8.8%) | 751 (9.7%) |
| 15 to 19 Years | 688 (9.1%) | 388 (5.0%) |
| 20 to 24 Years | 560 (7.4%) | 699 (9.0%) |
| 25 to 29 Years | 559 (7.4%) | 552 (7.1%) |
| 30 to 34 Years | 583 (7.7%) | 557 (7.2%) |
| 35 to 39 Years | 395 (5.2%) | 630 (8.1%) |
| 40 to 44 Years | 589 (7.8%) | 494 (6.4%) |
| 45 to 49 Years | 444 (5.9%) | 263 (3.4%) |
| 50 to 54 Years | 224 (2.9%) | 251 (3.2%) |
| 55 to 59 Years | 272 (3.6%) | 393 (5.1%) |
| 60 to 64 Years | 370 (4.9%) | 409 (5.3%) |
| 65 to 69 Years | 231 (3.0%) | 447 (5.8%) |
| 70 to 74 Years | 278 (3.7%) | 299 (3.8%) |
| 75 to 79 Years | 201 (2.6%) | 276 (3.6%) |
| 80 to 84 Years | 149 (2.0%) | 94 (1.2%) |
| 85 Years and over | 124 (1.6%) | 263 (3.4%) |
| Total | 7,581 (100.0%) | 7,761 (100.0%) |
Families and Households in Uvalde
Median Family Size in Uvalde
The median family size in Uvalde is 3.44 persons per family, with single female/mother families (1,186 | 32.6%) accounting for the largest median family size of 3.58 persons per family. On the other hand, single male/father families (328 | 9.0%) represent the smallest median family size with 2.86 persons per family.
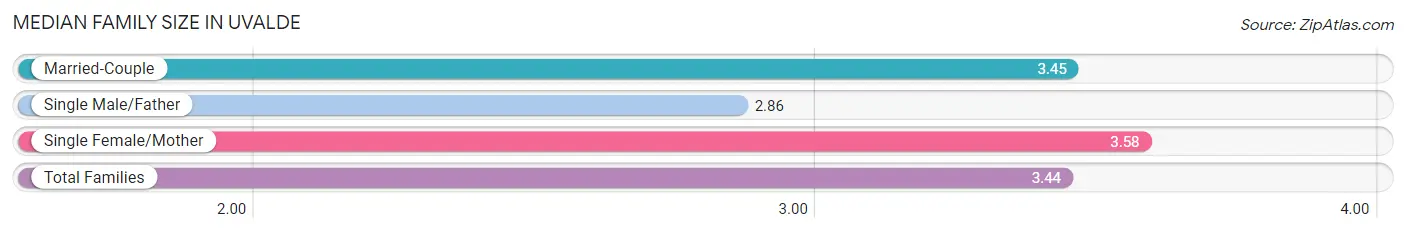
| Family Type | # Families | Family Size |
| Married-Couple | 2,130 (58.5%) | 3.45 |
| Single Male/Father | 328 (9.0%) | 2.86 |
| Single Female/Mother | 1,186 (32.6%) | 3.58 |
| Total Families | 3,644 (100.0%) | 3.44 |
Median Household Size in Uvalde
The median household size in Uvalde is 2.85 persons per household, with single female/mother households (1,186 | 22.9%) accounting for the largest median household size of 3.81 persons per household. non-family households (1,542 | 29.7%) represent the smallest median household size with 1.20 persons per household.
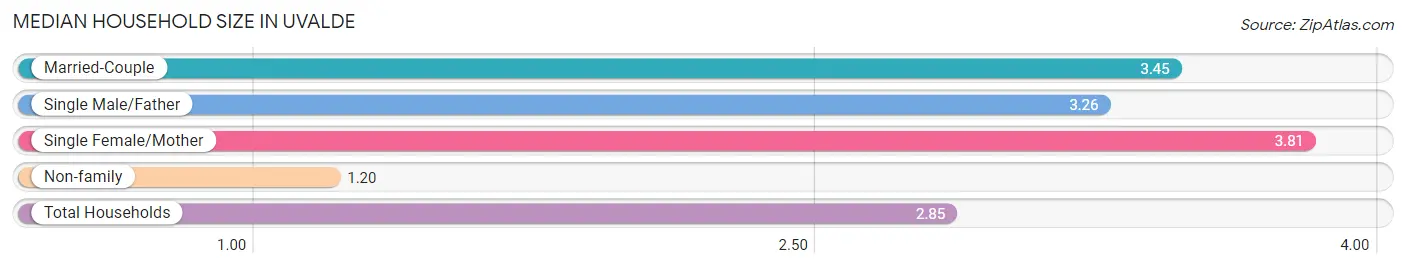
| Household Type | # Households | Household Size |
| Married-Couple | 2,130 (41.1%) | 3.45 |
| Single Male/Father | 328 (6.3%) | 3.26 |
| Single Female/Mother | 1,186 (22.9%) | 3.81 |
| Non-family | 1,542 (29.7%) | 1.20 |
| Total Households | 5,186 (100.0%) | 2.85 |
Household Size by Marriage Status in Uvalde
Out of a total of 5,186 households in Uvalde, 3,644 (70.3%) are family households, while 1,542 (29.7%) are nonfamily households. The most numerous type of family households are 3-person households, comprising 1,134, and the most common type of nonfamily households are 1-person households, comprising 1,269.
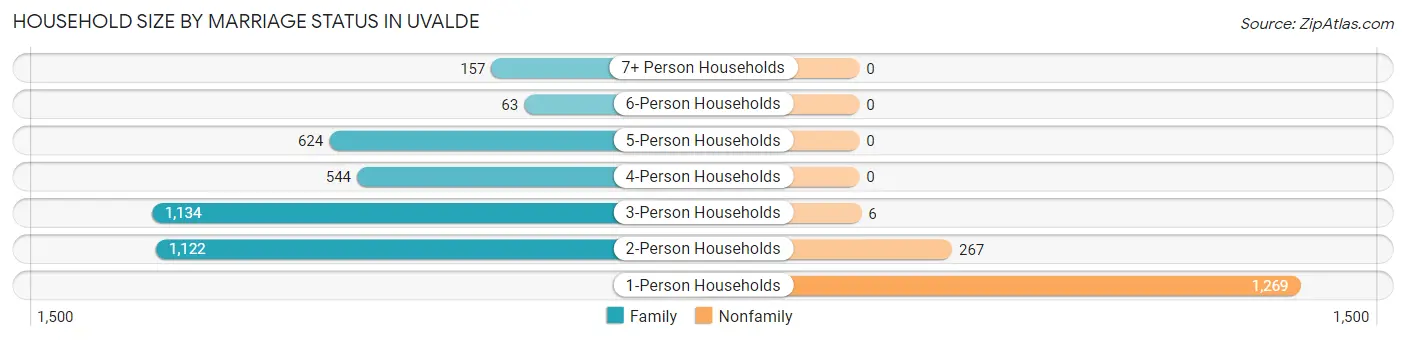
| Household Size | Family Households | Nonfamily Households |
| 1-Person Households | - | 1,269 (24.5%) |
| 2-Person Households | 1,122 (21.6%) | 267 (5.1%) |
| 3-Person Households | 1,134 (21.9%) | 6 (0.1%) |
| 4-Person Households | 544 (10.5%) | 0 (0.0%) |
| 5-Person Households | 624 (12.0%) | 0 (0.0%) |
| 6-Person Households | 63 (1.2%) | 0 (0.0%) |
| 7+ Person Households | 157 (3.0%) | 0 (0.0%) |
| Total | 3,644 (70.3%) | 1,542 (29.7%) |
Female Fertility in Uvalde
Fertility by Age in Uvalde
Average fertility rate in Uvalde is 100.0 births per 1,000 women. Women in the age bracket of 20 to 34 years have the highest fertility rate with 121.0 births per 1,000 women. Women in the age bracket of 20 to 34 years acount for 61.1% of all women with births.
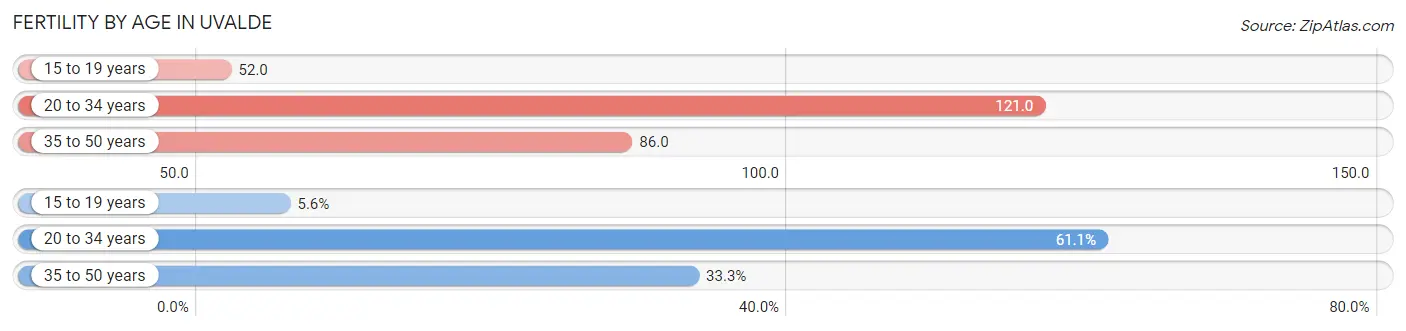
| Age Bracket | Women with Births | Births / 1,000 Women |
| 15 to 19 years | 20 (5.6%) | 52.0 |
| 20 to 34 years | 218 (61.1%) | 121.0 |
| 35 to 50 years | 119 (33.3%) | 86.0 |
| Total | 357 (100.0%) | 100.0 |
Fertility by Age by Marriage Status in Uvalde
60.2% of women with births (357) in Uvalde are married. The highest percentage of unmarried women with births falls into 15 to 19 years age bracket with 100.0% of them unmarried at the time of birth, while the lowest percentage of unmarried women with births belong to 35 to 50 years age bracket with 0.0% of them unmarried.
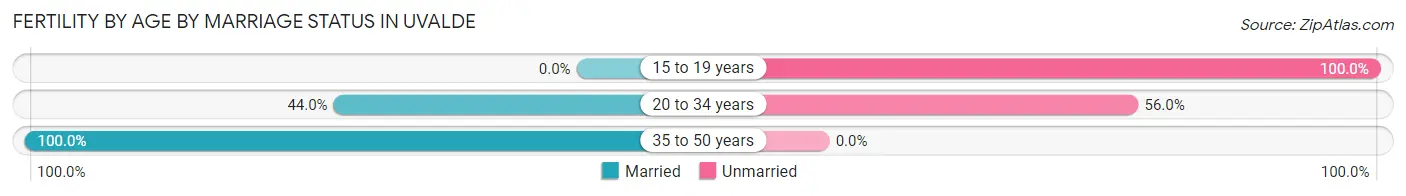
| Age Bracket | Married | Unmarried |
| 15 to 19 years | 0 (0.0%) | 20 (100.0%) |
| 20 to 34 years | 96 (44.0%) | 122 (56.0%) |
| 35 to 50 years | 119 (100.0%) | 0 (0.0%) |
| Total | 215 (60.2%) | 142 (39.8%) |
Fertility by Education in Uvalde
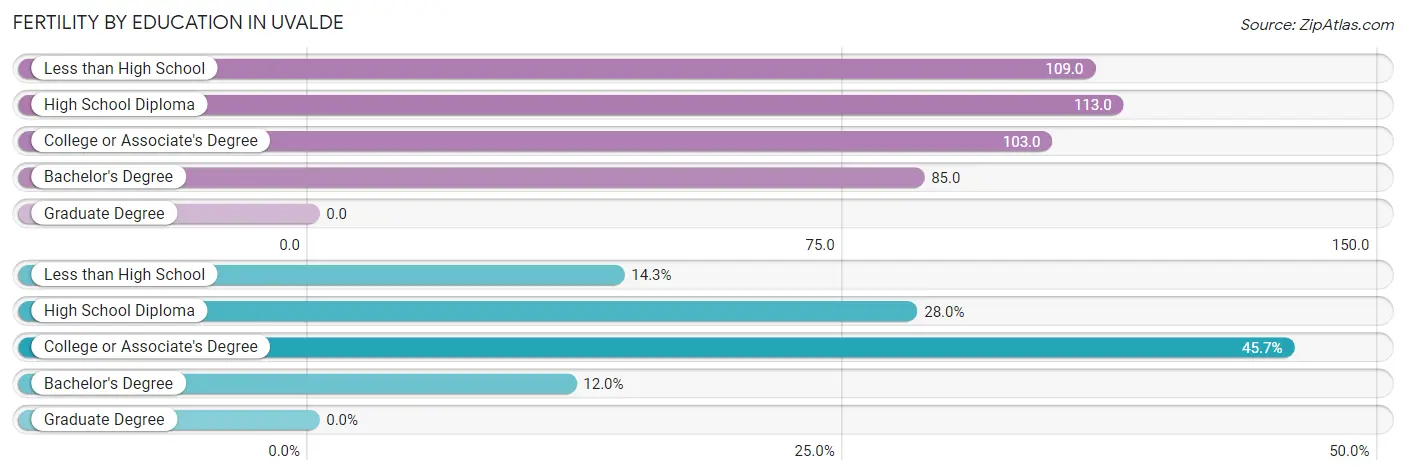
| Educational Attainment | Women with Births | Births / 1,000 Women |
| Less than High School | 51 (14.3%) | 109.0 |
| High School Diploma | 100 (28.0%) | 113.0 |
| College or Associate's Degree | 163 (45.7%) | 103.0 |
| Bachelor's Degree | 43 (12.0%) | 85.0 |
| Graduate Degree | 0 (0.0%) | 0.0 |
| Total | 357 (100.0%) | 100.0 |
Fertility by Education by Marriage Status in Uvalde
39.8% of women with births in Uvalde are unmarried. Women with the educational attainment of less than high school are most likely to be married with 100.0% of them married at childbirth, while women with the educational attainment of college or associate's degree are least likely to be married with 74.9% of them unmarried at childbirth.
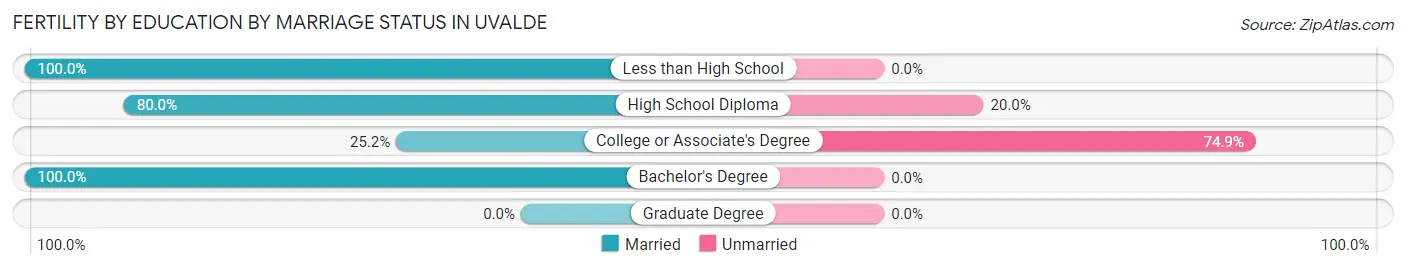
| Educational Attainment | Married | Unmarried |
| Less than High School | 51 (100.0%) | 0 (0.0%) |
| High School Diploma | 80 (80.0%) | 20 (20.0%) |
| College or Associate's Degree | 41 (25.2%) | 122 (74.9%) |
| Bachelor's Degree | 43 (100.0%) | 0 (0.0%) |
| Graduate Degree | 0 (0.0%) | 0 (0.0%) |
| Total | 215 (60.2%) | 142 (39.8%) |
Employment Characteristics in Uvalde
Employment by Class of Employer in Uvalde
Among the 6,196 employed individuals in Uvalde, private company employees (3,831 | 61.8%), local government employees (535 | 8.6%), and not-for-profit organizations (497 | 8.0%) make up the most common classes of employment.
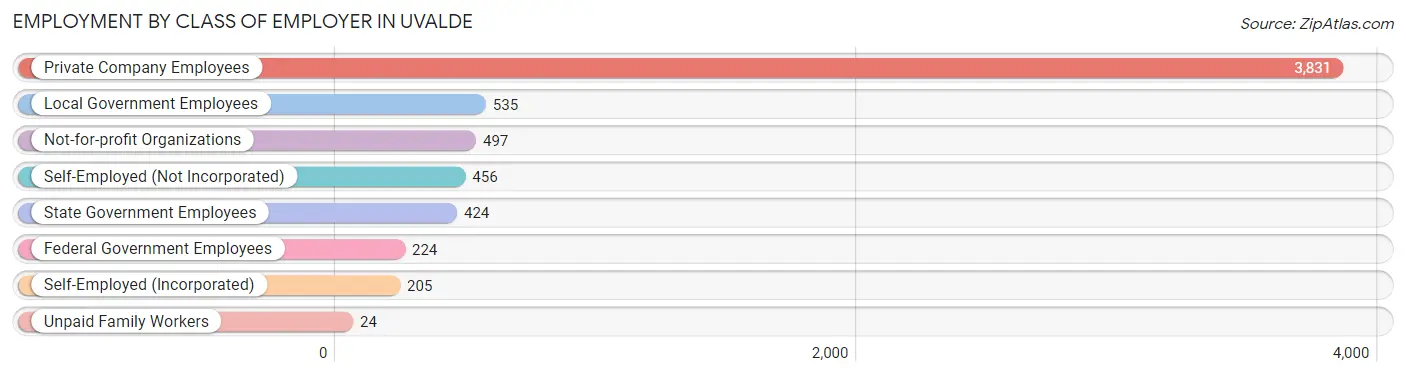
| Employer Class | # Employees | % Employees |
| Private Company Employees | 3,831 | 61.8% |
| Self-Employed (Incorporated) | 205 | 3.3% |
| Self-Employed (Not Incorporated) | 456 | 7.4% |
| Not-for-profit Organizations | 497 | 8.0% |
| Local Government Employees | 535 | 8.6% |
| State Government Employees | 424 | 6.8% |
| Federal Government Employees | 224 | 3.6% |
| Unpaid Family Workers | 24 | 0.4% |
| Total | 6,196 | 100.0% |
Employment Status by Age in Uvalde
According to the labor force statistics for Uvalde, out of the total population over 16 years of age (11,403), 55.9% or 6,374 individuals are in the labor force, with 1.1% or 70 of them unemployed. The age group with the highest labor force participation rate is 20 to 24 years, with 79.7% or 1,003 individuals in the labor force. Within the labor force, the 55 to 59 years age range has the highest percentage of unemployed individuals, with 7.1% or 20 of them being unemployed.
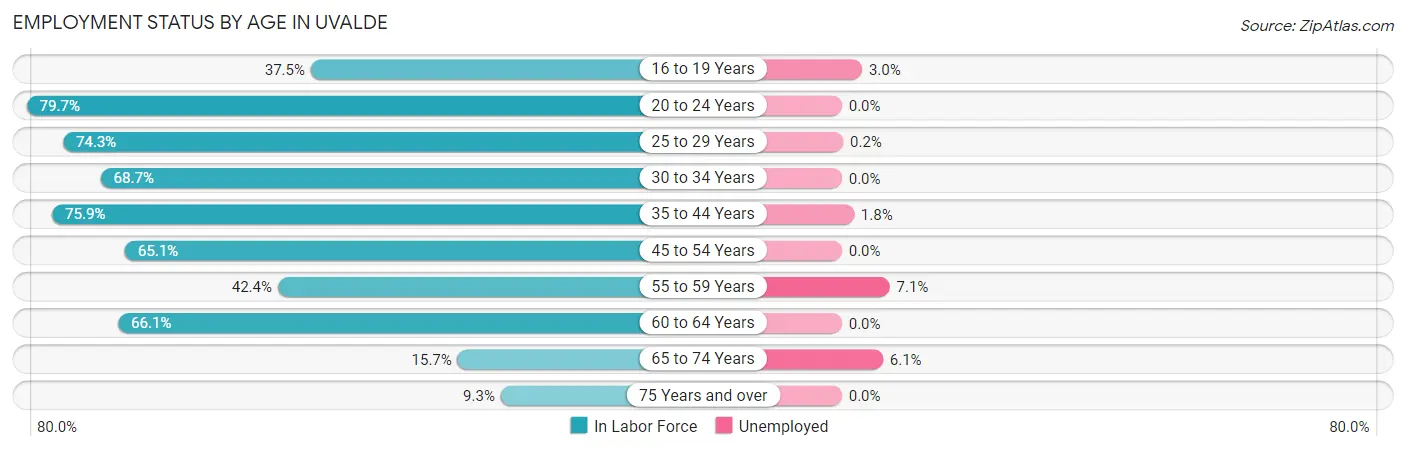
| Age Bracket | In Labor Force | Unemployed |
| 16 to 19 Years | 299 (37.5%) | 9 (3.0%) |
| 20 to 24 Years | 1,003 (79.7%) | 0 (0.0%) |
| 25 to 29 Years | 825 (74.3%) | 2 (0.2%) |
| 30 to 34 Years | 783 (68.7%) | 0 (0.0%) |
| 35 to 44 Years | 1,600 (75.9%) | 29 (1.8%) |
| 45 to 54 Years | 769 (65.1%) | 0 (0.0%) |
| 55 to 59 Years | 282 (42.4%) | 20 (7.1%) |
| 60 to 64 Years | 515 (66.1%) | 0 (0.0%) |
| 65 to 74 Years | 197 (15.7%) | 12 (6.1%) |
| 75 Years and over | 103 (9.3%) | 0 (0.0%) |
| Total | 6,374 (55.9%) | 70 (1.1%) |
Employment Status by Educational Attainment in Uvalde
According to labor force statistics for Uvalde, 68.4% of individuals (4,778) out of the total population between 25 and 64 years of age (6,985) are in the labor force, with 1.0% or 48 of them being unemployed. The group with the highest labor force participation rate are those with the educational attainment of bachelor's degree or higher, with 81.3% or 960 individuals in the labor force. Within the labor force, individuals with high school diploma education have the highest percentage of unemployment, with 2.7% or 30 of them being unemployed.
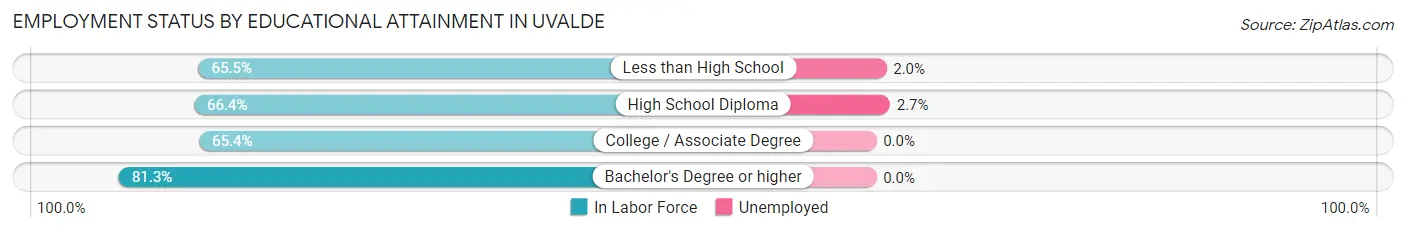
| Educational Attainment | In Labor Force | Unemployed |
| Less than High School | 975 (65.5%) | 30 (2.0%) |
| High School Diploma | 1,108 (66.4%) | 45 (2.7%) |
| College / Associate Degree | 1,731 (65.4%) | 0 (0.0%) |
| Bachelor's Degree or higher | 960 (81.3%) | 0 (0.0%) |
| Total | 4,778 (68.4%) | 70 (1.0%) |
Employment Occupations by Sex in Uvalde
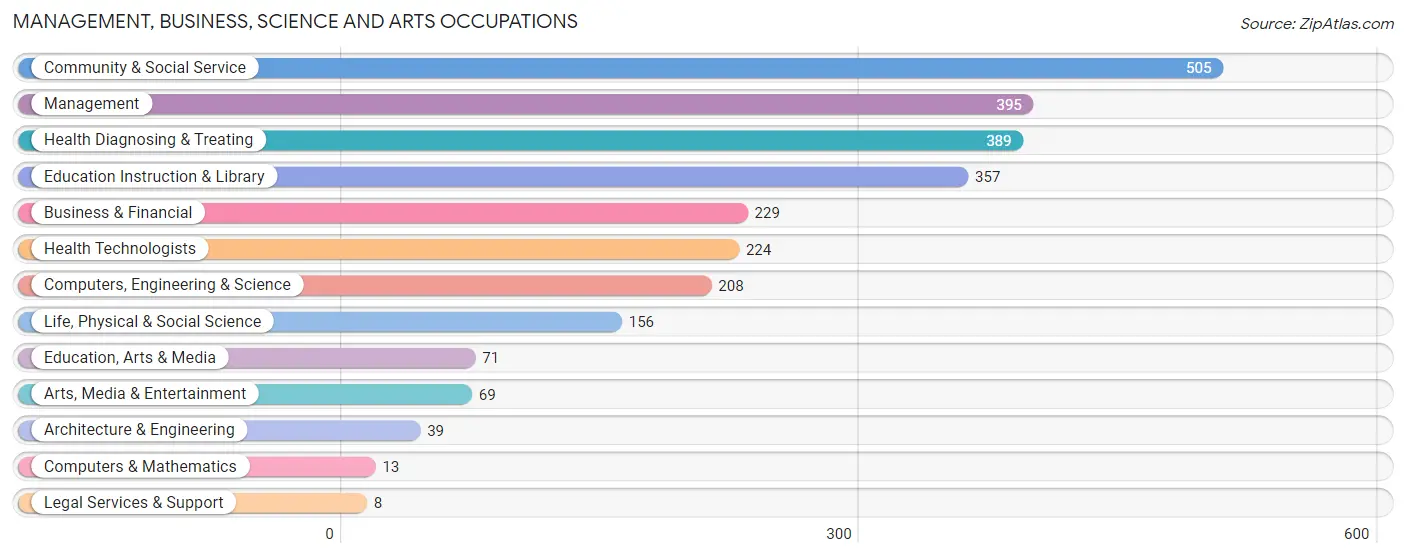
Management, Business, Science and Arts Occupations
The most common Management, Business, Science and Arts occupations in Uvalde are Community & Social Service (505 | 8.0%), Management (395 | 6.3%), Health Diagnosing & Treating (389 | 6.2%), Education Instruction & Library (357 | 5.7%), and Business & Financial (229 | 3.6%).
Management, Business, Science and Arts Occupations by Sex
Within the Management, Business, Science and Arts occupations in Uvalde, the most male-oriented occupations are Computers & Mathematics (100.0%), Architecture & Engineering (100.0%), and Computers, Engineering & Science (72.1%), while the most female-oriented occupations are Business & Financial (100.0%), Legal Services & Support (100.0%), and Education, Arts & Media (74.7%).
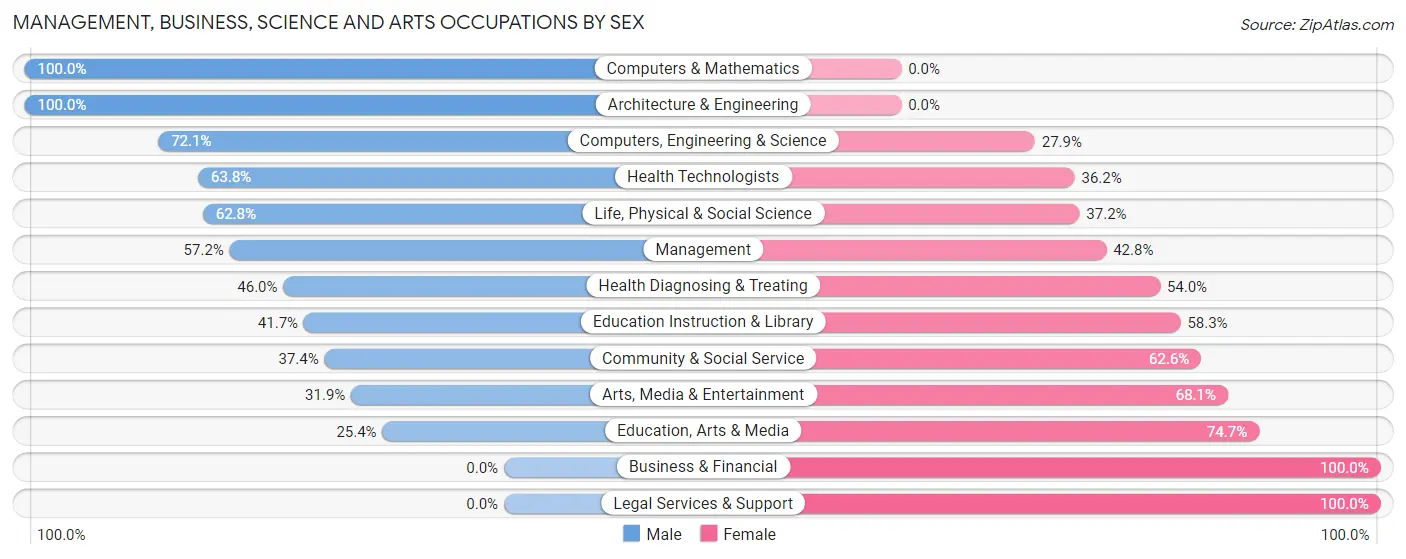
| Occupation | Male | Female |
| Management | 226 (57.2%) | 169 (42.8%) |
| Business & Financial | 0 (0.0%) | 229 (100.0%) |
| Computers, Engineering & Science | 150 (72.1%) | 58 (27.9%) |
| Computers & Mathematics | 13 (100.0%) | 0 (0.0%) |
| Architecture & Engineering | 39 (100.0%) | 0 (0.0%) |
| Life, Physical & Social Science | 98 (62.8%) | 58 (37.2%) |
| Community & Social Service | 189 (37.4%) | 316 (62.6%) |
| Education, Arts & Media | 18 (25.4%) | 53 (74.7%) |
| Legal Services & Support | 0 (0.0%) | 8 (100.0%) |
| Education Instruction & Library | 149 (41.7%) | 208 (58.3%) |
| Arts, Media & Entertainment | 22 (31.9%) | 47 (68.1%) |
| Health Diagnosing & Treating | 179 (46.0%) | 210 (54.0%) |
| Health Technologists | 143 (63.8%) | 81 (36.2%) |
| Total (Category) | 744 (43.1%) | 982 (56.9%) |
| Total (Overall) | 3,006 (47.7%) | 3,301 (52.3%) |
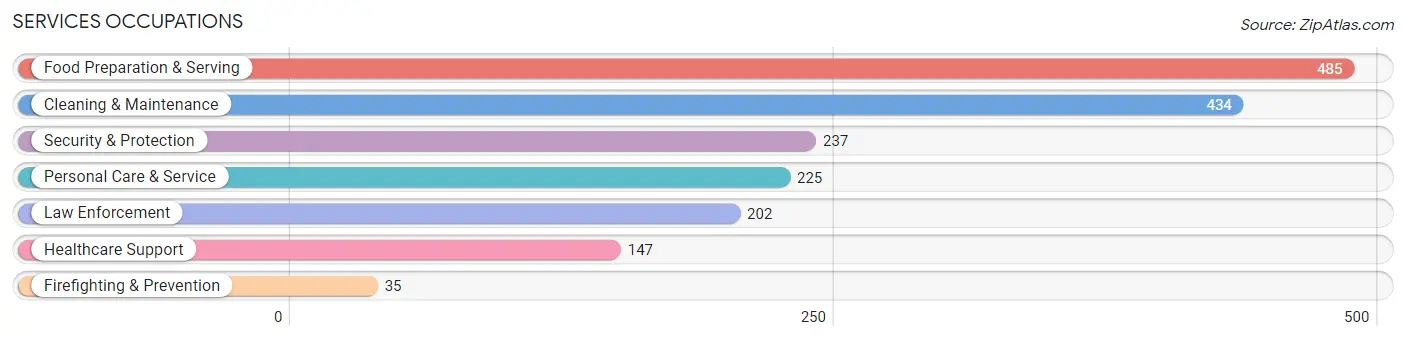
Services Occupations
The most common Services occupations in Uvalde are Food Preparation & Serving (485 | 7.7%), Cleaning & Maintenance (434 | 6.9%), Security & Protection (237 | 3.8%), Personal Care & Service (225 | 3.6%), and Law Enforcement (202 | 3.2%).
Services Occupations by Sex
Within the Services occupations in Uvalde, the most male-oriented occupations are Firefighting & Prevention (100.0%), Security & Protection (59.1%), and Law Enforcement (52.0%), while the most female-oriented occupations are Healthcare Support (100.0%), Personal Care & Service (76.9%), and Cleaning & Maintenance (63.1%).
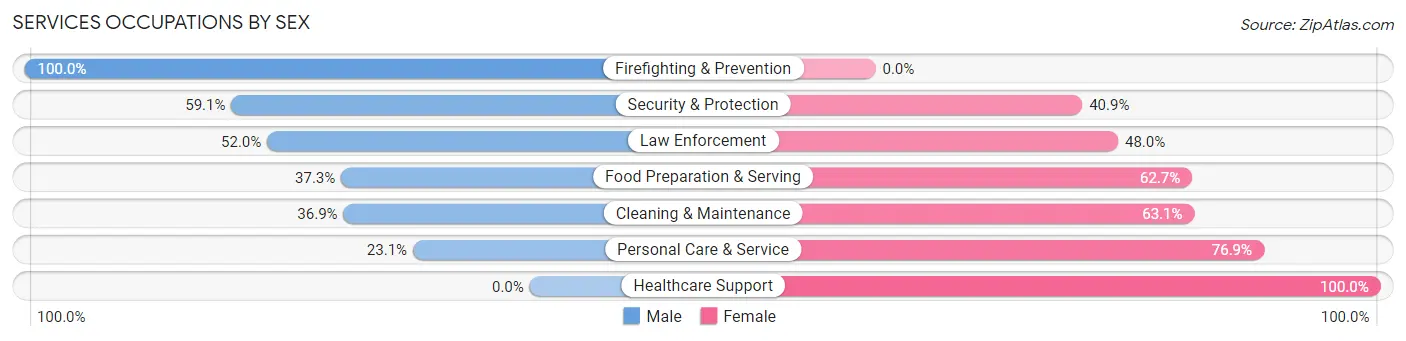
| Occupation | Male | Female |
| Healthcare Support | 0 (0.0%) | 147 (100.0%) |
| Security & Protection | 140 (59.1%) | 97 (40.9%) |
| Firefighting & Prevention | 35 (100.0%) | 0 (0.0%) |
| Law Enforcement | 105 (52.0%) | 97 (48.0%) |
| Food Preparation & Serving | 181 (37.3%) | 304 (62.7%) |
| Cleaning & Maintenance | 160 (36.9%) | 274 (63.1%) |
| Personal Care & Service | 52 (23.1%) | 173 (76.9%) |
| Total (Category) | 533 (34.9%) | 995 (65.1%) |
| Total (Overall) | 3,006 (47.7%) | 3,301 (52.3%) |
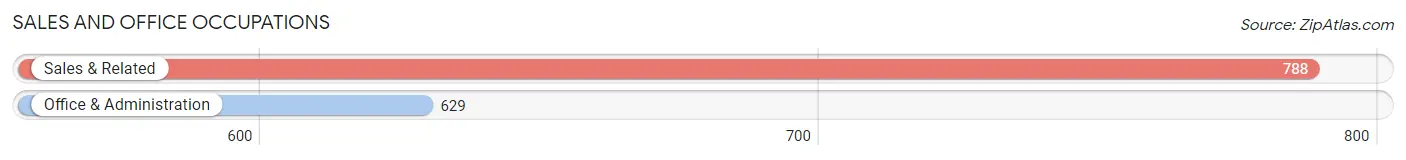
Sales and Office Occupations
The most common Sales and Office occupations in Uvalde are Sales & Related (788 | 12.5%), and Office & Administration (629 | 10.0%).
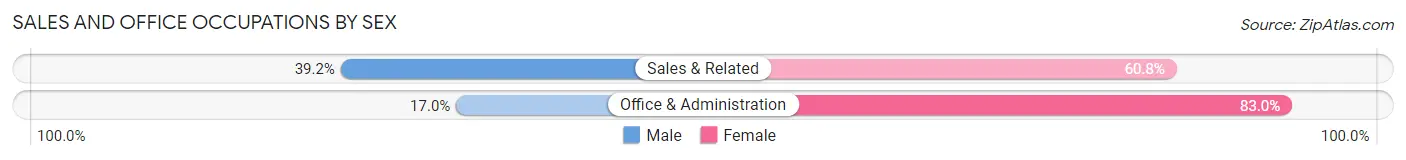
Sales and Office Occupations by Sex
| Occupation | Male | Female |
| Sales & Related | 309 (39.2%) | 479 (60.8%) |
| Office & Administration | 107 (17.0%) | 522 (83.0%) |
| Total (Category) | 416 (29.4%) | 1,001 (70.6%) |
| Total (Overall) | 3,006 (47.7%) | 3,301 (52.3%) |
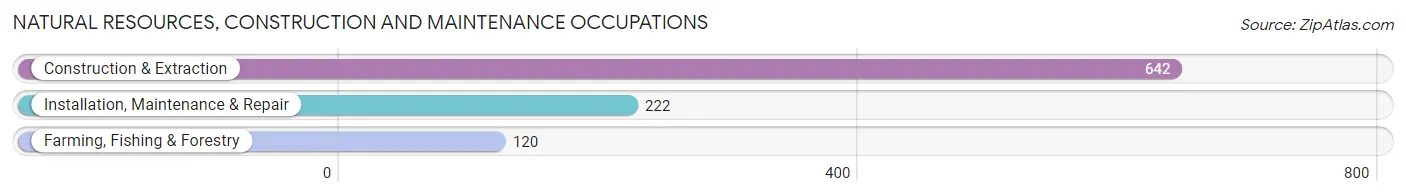
Natural Resources, Construction and Maintenance Occupations
The most common Natural Resources, Construction and Maintenance occupations in Uvalde are Construction & Extraction (642 | 10.2%), Installation, Maintenance & Repair (222 | 3.5%), and Farming, Fishing & Forestry (120 | 1.9%).
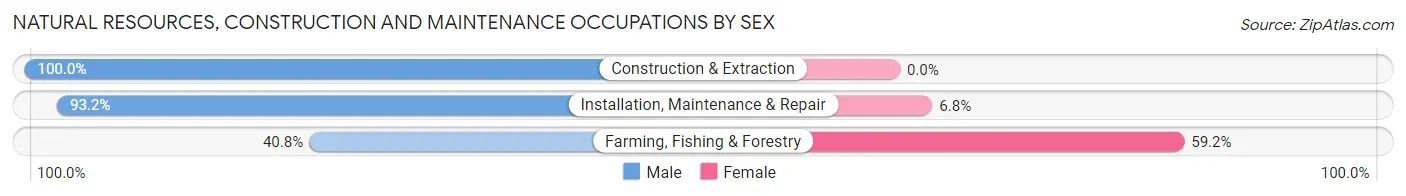
Natural Resources, Construction and Maintenance Occupations by Sex
| Occupation | Male | Female |
| Farming, Fishing & Forestry | 49 (40.8%) | 71 (59.2%) |
| Construction & Extraction | 642 (100.0%) | 0 (0.0%) |
| Installation, Maintenance & Repair | 207 (93.2%) | 15 (6.8%) |
| Total (Category) | 898 (91.3%) | 86 (8.7%) |
| Total (Overall) | 3,006 (47.7%) | 3,301 (52.3%) |
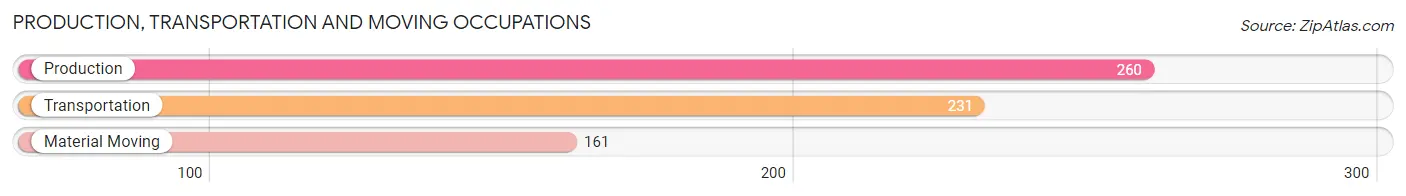
Production, Transportation and Moving Occupations
The most common Production, Transportation and Moving occupations in Uvalde are Production (260 | 4.1%), Transportation (231 | 3.7%), and Material Moving (161 | 2.5%).
Production, Transportation and Moving Occupations by Sex
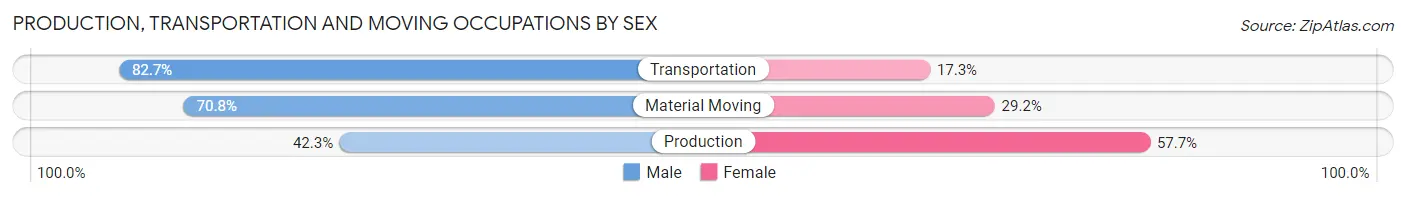
| Occupation | Male | Female |
| Production | 110 (42.3%) | 150 (57.7%) |
| Transportation | 191 (82.7%) | 40 (17.3%) |
| Material Moving | 114 (70.8%) | 47 (29.2%) |
| Total (Category) | 415 (63.6%) | 237 (36.3%) |
| Total (Overall) | 3,006 (47.7%) | 3,301 (52.3%) |
Employment Industries by Sex in Uvalde
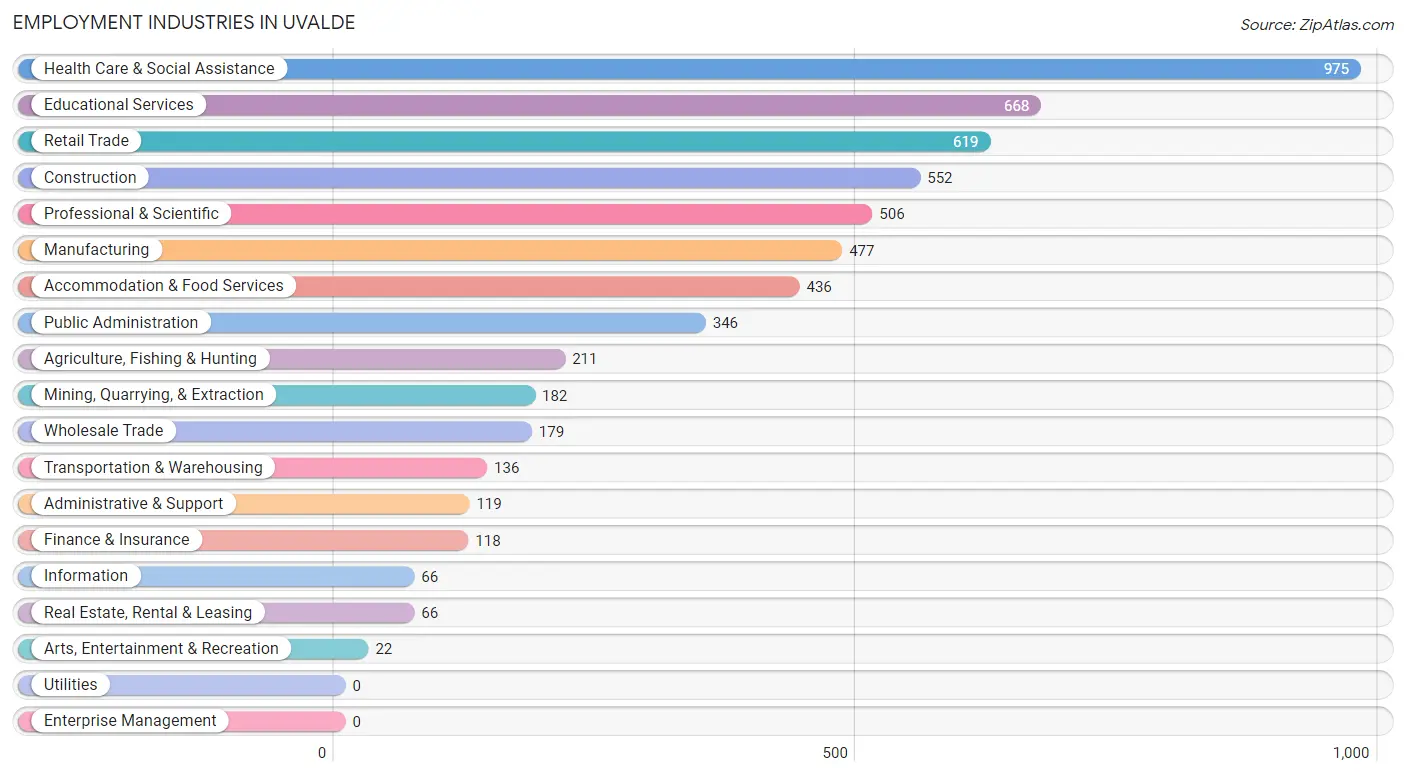
Employment Industries in Uvalde
The major employment industries in Uvalde include Health Care & Social Assistance (975 | 15.5%), Educational Services (668 | 10.6%), Retail Trade (619 | 9.8%), Construction (552 | 8.7%), and Professional & Scientific (506 | 8.0%).
Employment Industries by Sex in Uvalde
The Uvalde industries that see more men than women are Mining, Quarrying, & Extraction (100.0%), Information (100.0%), and Construction (95.5%), whereas the industries that tend to have a higher number of women are Finance & Insurance (100.0%), Arts, Entertainment & Recreation (100.0%), and Agriculture, Fishing & Hunting (67.8%).
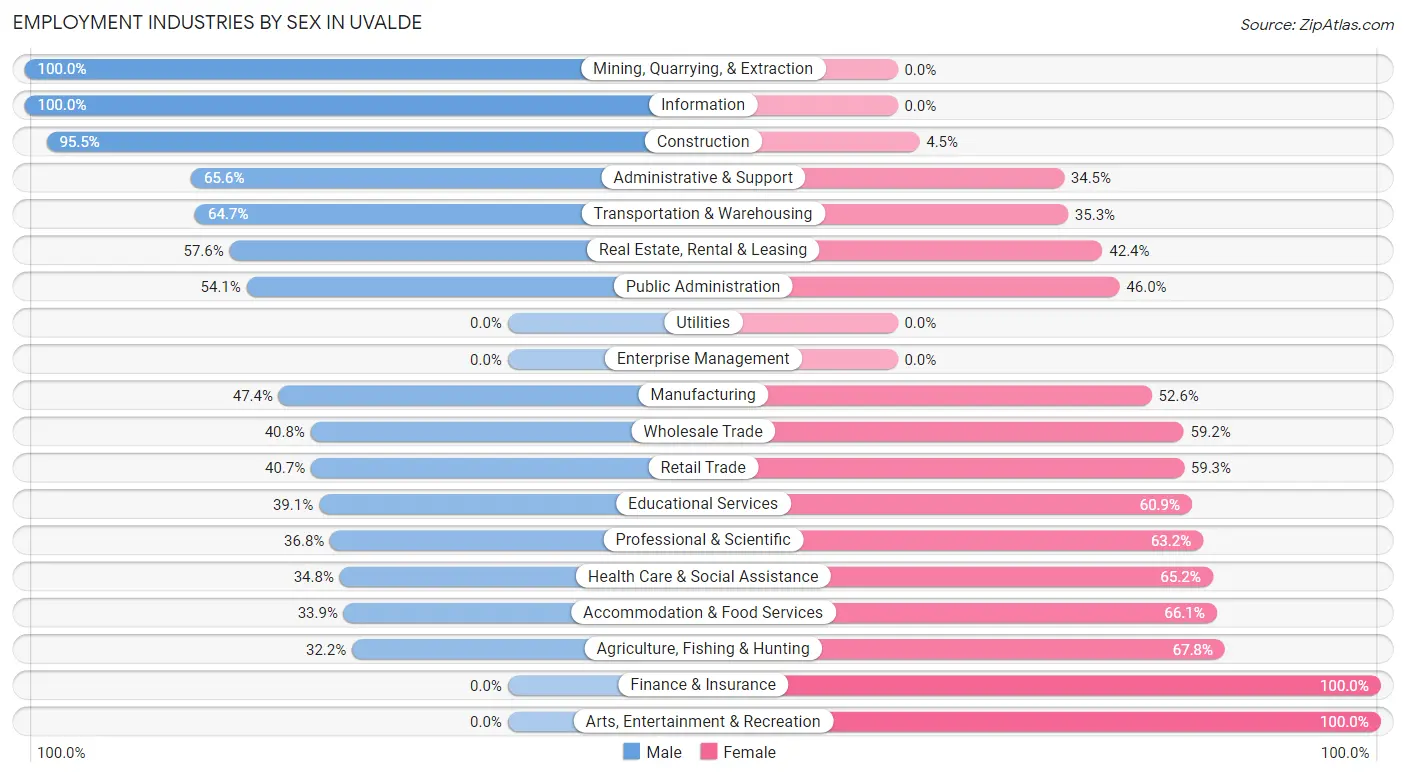
| Industry | Male | Female |
| Agriculture, Fishing & Hunting | 68 (32.2%) | 143 (67.8%) |
| Mining, Quarrying, & Extraction | 182 (100.0%) | 0 (0.0%) |
| Construction | 527 (95.5%) | 25 (4.5%) |
| Manufacturing | 226 (47.4%) | 251 (52.6%) |
| Wholesale Trade | 73 (40.8%) | 106 (59.2%) |
| Retail Trade | 252 (40.7%) | 367 (59.3%) |
| Transportation & Warehousing | 88 (64.7%) | 48 (35.3%) |
| Utilities | 0 (0.0%) | 0 (0.0%) |
| Information | 66 (100.0%) | 0 (0.0%) |
| Finance & Insurance | 0 (0.0%) | 118 (100.0%) |
| Real Estate, Rental & Leasing | 38 (57.6%) | 28 (42.4%) |
| Professional & Scientific | 186 (36.8%) | 320 (63.2%) |
| Enterprise Management | 0 (0.0%) | 0 (0.0%) |
| Administrative & Support | 78 (65.5%) | 41 (34.4%) |
| Educational Services | 261 (39.1%) | 407 (60.9%) |
| Health Care & Social Assistance | 339 (34.8%) | 636 (65.2%) |
| Arts, Entertainment & Recreation | 0 (0.0%) | 22 (100.0%) |
| Accommodation & Food Services | 148 (33.9%) | 288 (66.1%) |
| Public Administration | 187 (54.0%) | 159 (46.0%) |
| Total | 3,006 (47.7%) | 3,301 (52.3%) |
Education in Uvalde
School Enrollment in Uvalde
The most common levels of schooling among the 4,388 students in Uvalde are middle school (1,192 | 27.2%), college / undergraduate (934 | 21.3%), and elementary school (851 | 19.4%).
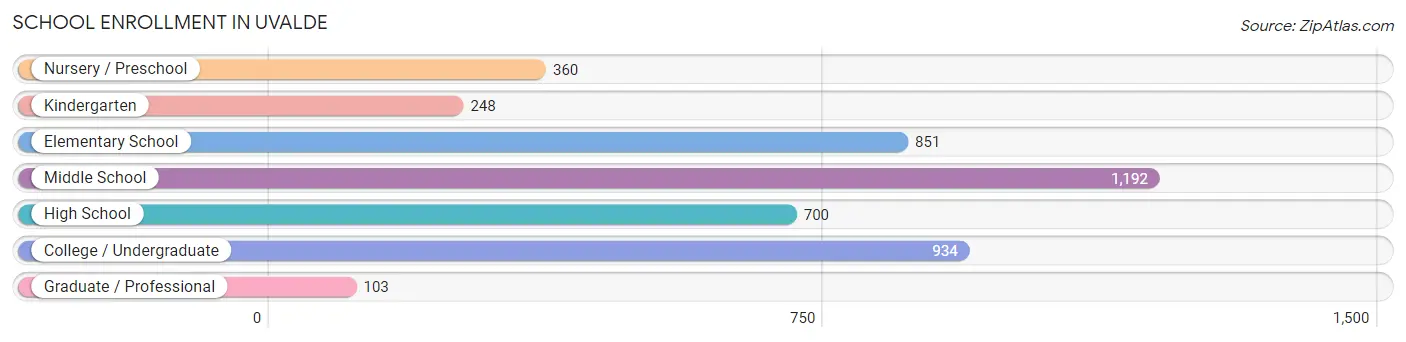
| School Level | # Students | % Students |
| Nursery / Preschool | 360 | 8.2% |
| Kindergarten | 248 | 5.7% |
| Elementary School | 851 | 19.4% |
| Middle School | 1,192 | 27.2% |
| High School | 700 | 16.0% |
| College / Undergraduate | 934 | 21.3% |
| Graduate / Professional | 103 | 2.4% |
| Total | 4,388 | 100.0% |
School Enrollment by Age by Funding Source in Uvalde
Out of a total of 4,388 students who are enrolled in schools in Uvalde, 531 (12.1%) attend a private institution, while the remaining 3,857 (87.9%) are enrolled in public schools. The age group of 3 to 4 year olds has the highest likelihood of being enrolled in private schools, with 88 (26.8% in the age bracket) enrolled. Conversely, the age group of 25 to 34 year olds has the lowest likelihood of being enrolled in a private school, with 258 (100.0% in the age bracket) attending a public institution.
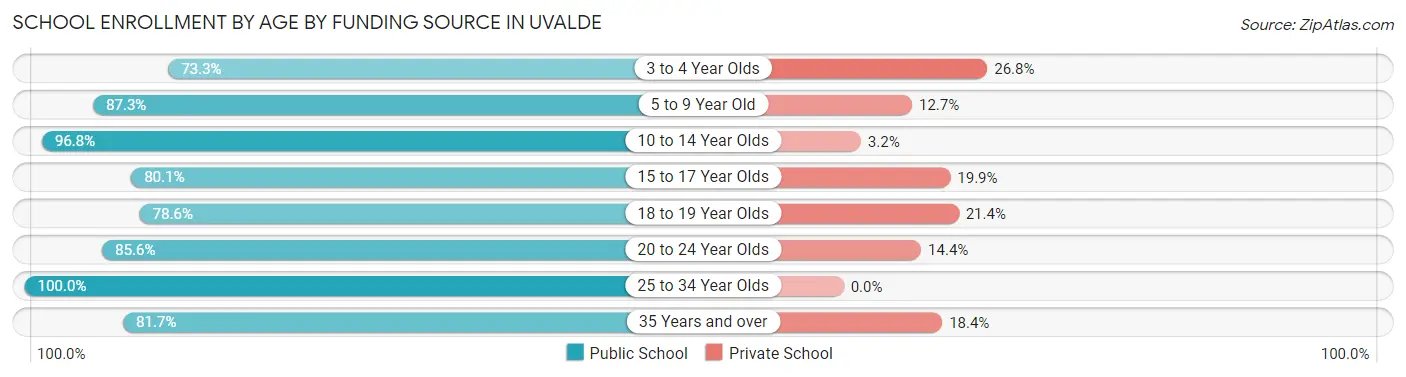
| Age Bracket | Public School | Private School |
| 3 to 4 Year Olds | 241 (73.3%) | 88 (26.8%) |
| 5 to 9 Year Old | 925 (87.3%) | 135 (12.7%) |
| 10 to 14 Year Olds | 1,265 (96.8%) | 42 (3.2%) |
| 15 to 17 Year Olds | 508 (80.1%) | 126 (19.9%) |
| 18 to 19 Year Olds | 99 (78.6%) | 27 (21.4%) |
| 20 to 24 Year Olds | 255 (85.6%) | 43 (14.4%) |
| 25 to 34 Year Olds | 258 (100.0%) | 0 (0.0%) |
| 35 Years and over | 307 (81.7%) | 69 (18.3%) |
| Total | 3,857 (87.9%) | 531 (12.1%) |
Educational Attainment by Field of Study in Uvalde
Education (464 | 29.5%), business (242 | 15.4%), arts & humanities (223 | 14.2%), science & technology (137 | 8.7%), and social sciences (131 | 8.3%) are the most common fields of study among 1,571 individuals in Uvalde who have obtained a bachelor's degree or higher.
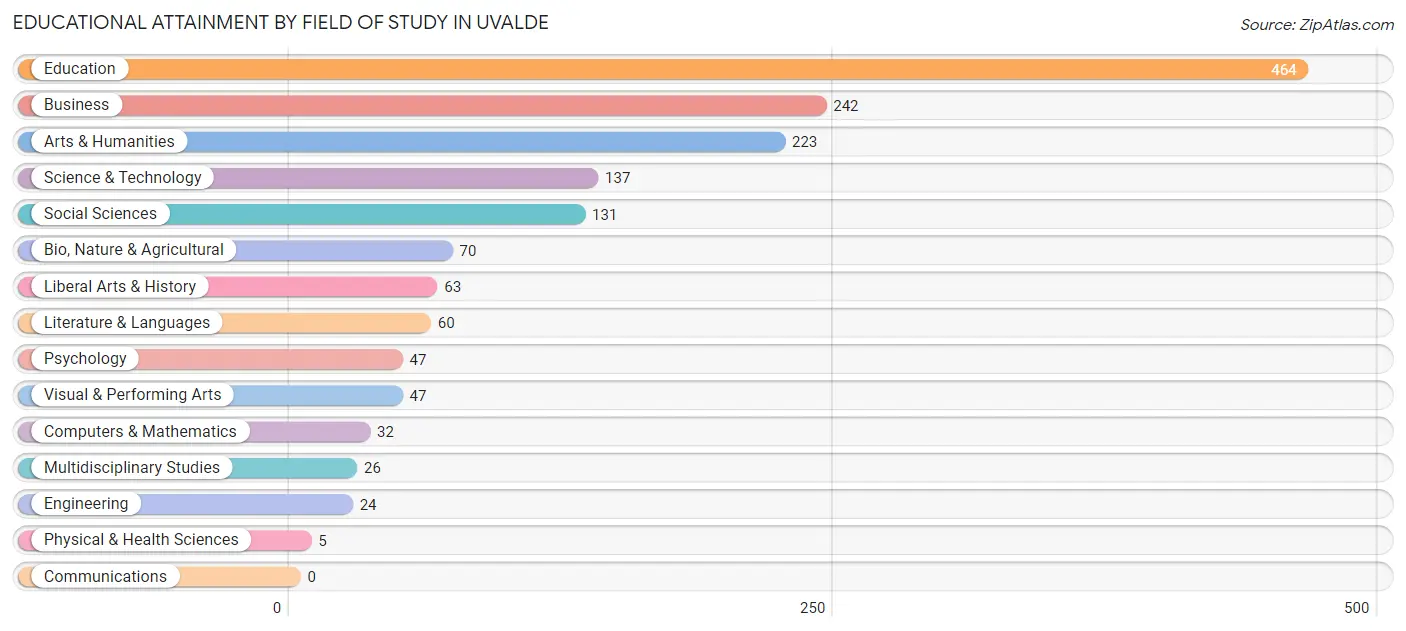
| Field of Study | # Graduates | % Graduates |
| Computers & Mathematics | 32 | 2.0% |
| Bio, Nature & Agricultural | 70 | 4.5% |
| Physical & Health Sciences | 5 | 0.3% |
| Psychology | 47 | 3.0% |
| Social Sciences | 131 | 8.3% |
| Engineering | 24 | 1.5% |
| Multidisciplinary Studies | 26 | 1.7% |
| Science & Technology | 137 | 8.7% |
| Business | 242 | 15.4% |
| Education | 464 | 29.5% |
| Literature & Languages | 60 | 3.8% |
| Liberal Arts & History | 63 | 4.0% |
| Visual & Performing Arts | 47 | 3.0% |
| Communications | 0 | 0.0% |
| Arts & Humanities | 223 | 14.2% |
| Total | 1,571 | 100.0% |
Transportation & Commute in Uvalde
Vehicle Availability by Sex in Uvalde
The most prevalent vehicle ownership categories in Uvalde are males with 2 vehicles (1,638, accounting for 56.3%) and females with 2 vehicles (1,481, making up 49.8%).
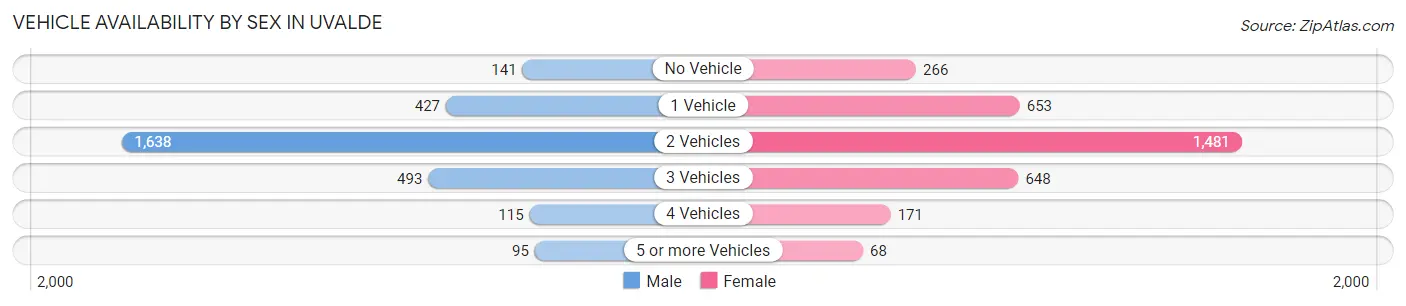
| Vehicles Available | Male | Female |
| No Vehicle | 141 (4.9%) | 266 (8.1%) |
| 1 Vehicle | 427 (14.7%) | 653 (19.9%) |
| 2 Vehicles | 1,638 (56.3%) | 1,481 (45.1%) |
| 3 Vehicles | 493 (17.0%) | 648 (19.7%) |
| 4 Vehicles | 115 (4.0%) | 171 (5.2%) |
| 5 or more Vehicles | 95 (3.3%) | 68 (2.1%) |
| Total | 2,909 (100.0%) | 3,287 (100.0%) |
Commute Time in Uvalde
The most frequently occuring commute durations in Uvalde are 5 to 9 minutes (2,251 commuters, 37.6%), 10 to 14 minutes (1,119 commuters, 18.7%), and 15 to 19 minutes (1,092 commuters, 18.2%).
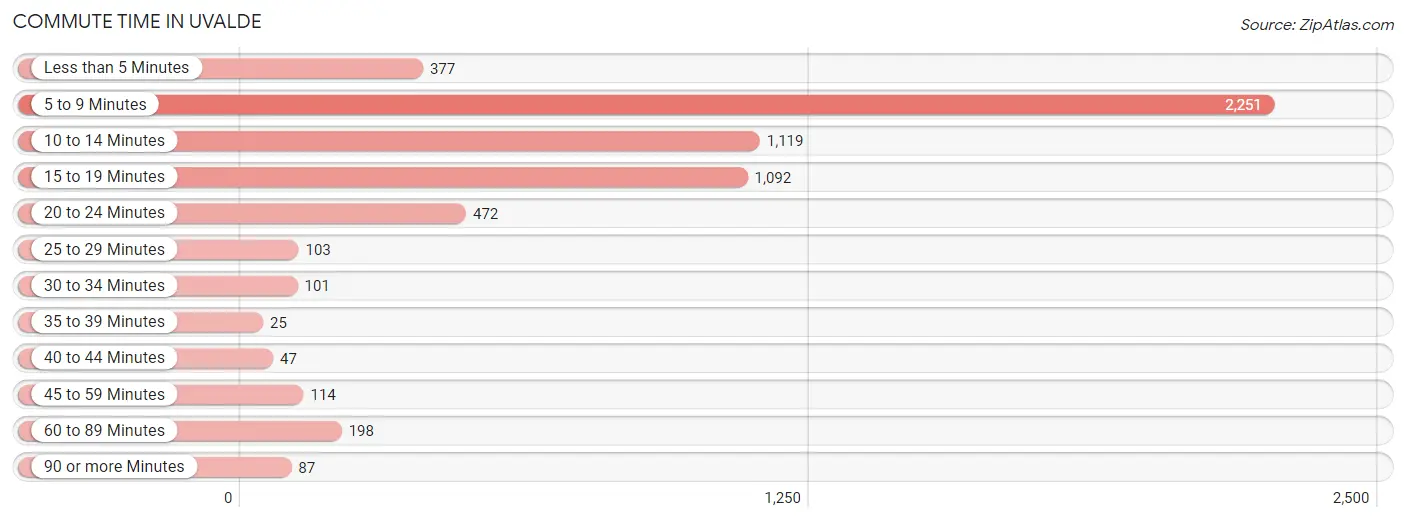
| Commute Time | # Commuters | % Commuters |
| Less than 5 Minutes | 377 | 6.3% |
| 5 to 9 Minutes | 2,251 | 37.6% |
| 10 to 14 Minutes | 1,119 | 18.7% |
| 15 to 19 Minutes | 1,092 | 18.2% |
| 20 to 24 Minutes | 472 | 7.9% |
| 25 to 29 Minutes | 103 | 1.7% |
| 30 to 34 Minutes | 101 | 1.7% |
| 35 to 39 Minutes | 25 | 0.4% |
| 40 to 44 Minutes | 47 | 0.8% |
| 45 to 59 Minutes | 114 | 1.9% |
| 60 to 89 Minutes | 198 | 3.3% |
| 90 or more Minutes | 87 | 1.5% |
Commute Time by Sex in Uvalde
The most common commute times in Uvalde are 5 to 9 minutes (996 commuters, 34.6%) for males and 5 to 9 minutes (1,255 commuters, 40.4%) for females.
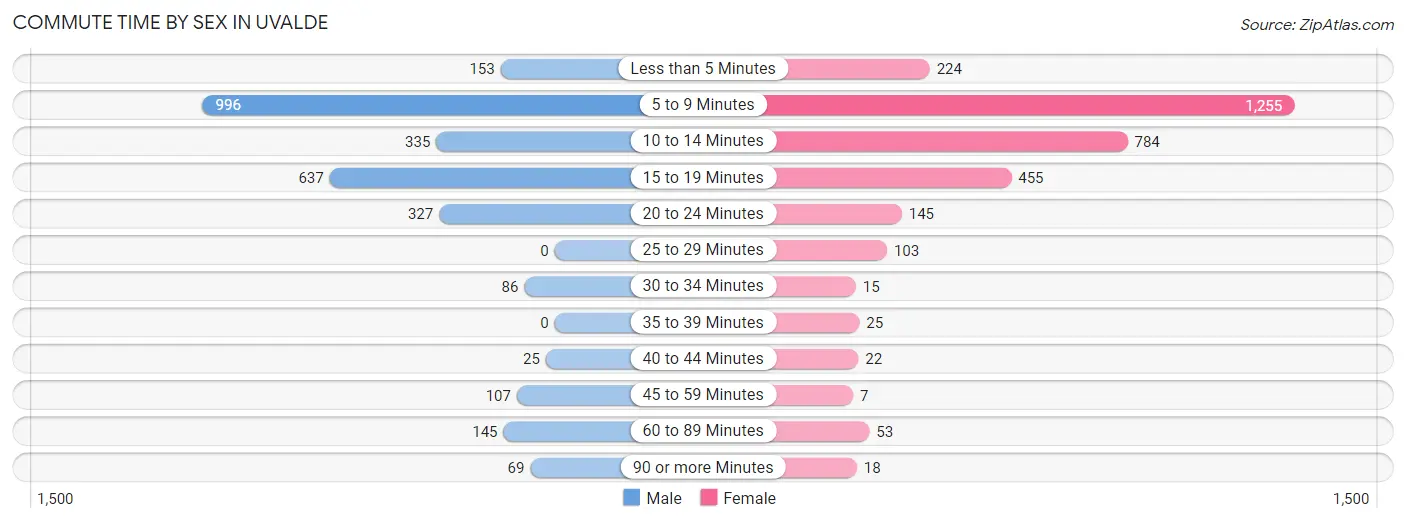
| Commute Time | Male | Female |
| Less than 5 Minutes | 153 (5.3%) | 224 (7.2%) |
| 5 to 9 Minutes | 996 (34.6%) | 1,255 (40.4%) |
| 10 to 14 Minutes | 335 (11.6%) | 784 (25.2%) |
| 15 to 19 Minutes | 637 (22.1%) | 455 (14.6%) |
| 20 to 24 Minutes | 327 (11.4%) | 145 (4.7%) |
| 25 to 29 Minutes | 0 (0.0%) | 103 (3.3%) |
| 30 to 34 Minutes | 86 (3.0%) | 15 (0.5%) |
| 35 to 39 Minutes | 0 (0.0%) | 25 (0.8%) |
| 40 to 44 Minutes | 25 (0.9%) | 22 (0.7%) |
| 45 to 59 Minutes | 107 (3.7%) | 7 (0.2%) |
| 60 to 89 Minutes | 145 (5.0%) | 53 (1.7%) |
| 90 or more Minutes | 69 (2.4%) | 18 (0.6%) |
Time of Departure to Work by Sex in Uvalde
The most frequent times of departure to work in Uvalde are 7:00 AM to 7:29 AM (539, 18.7%) for males and 7:30 AM to 7:59 AM (597, 19.2%) for females.
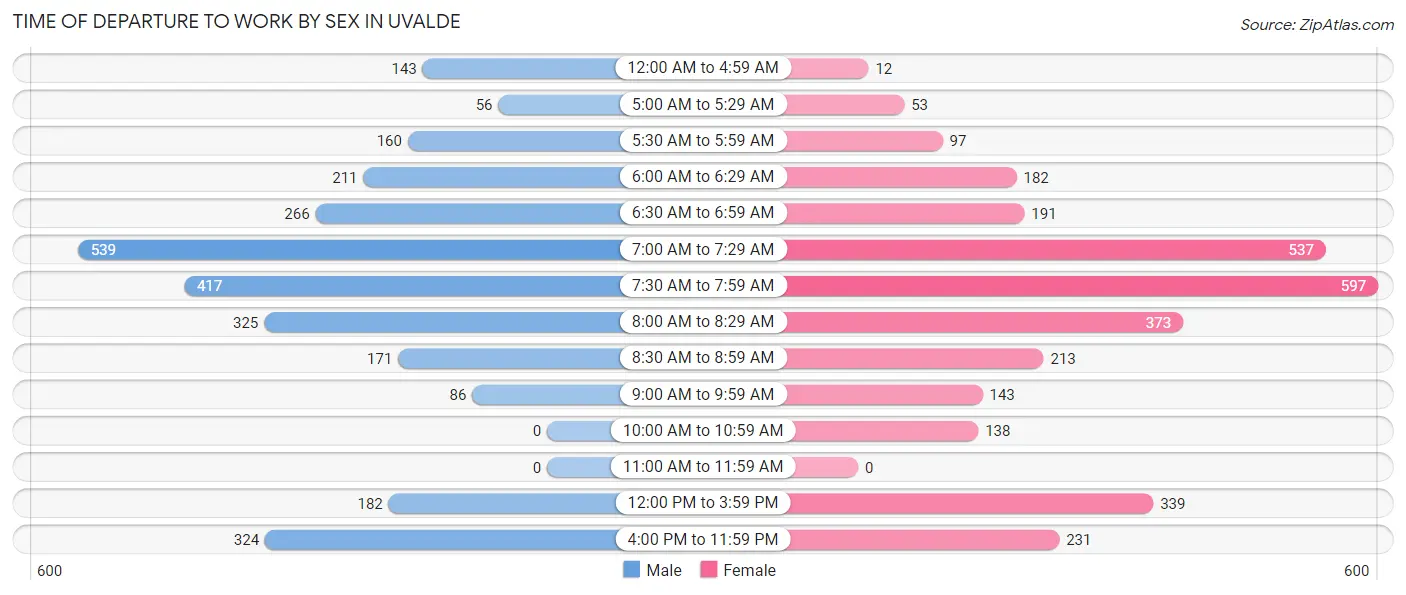
| Time of Departure | Male | Female |
| 12:00 AM to 4:59 AM | 143 (5.0%) | 12 (0.4%) |
| 5:00 AM to 5:29 AM | 56 (1.9%) | 53 (1.7%) |
| 5:30 AM to 5:59 AM | 160 (5.6%) | 97 (3.1%) |
| 6:00 AM to 6:29 AM | 211 (7.3%) | 182 (5.9%) |
| 6:30 AM to 6:59 AM | 266 (9.2%) | 191 (6.1%) |
| 7:00 AM to 7:29 AM | 539 (18.7%) | 537 (17.3%) |
| 7:30 AM to 7:59 AM | 417 (14.5%) | 597 (19.2%) |
| 8:00 AM to 8:29 AM | 325 (11.3%) | 373 (12.0%) |
| 8:30 AM to 8:59 AM | 171 (5.9%) | 213 (6.9%) |
| 9:00 AM to 9:59 AM | 86 (3.0%) | 143 (4.6%) |
| 10:00 AM to 10:59 AM | 0 (0.0%) | 138 (4.4%) |
| 11:00 AM to 11:59 AM | 0 (0.0%) | 0 (0.0%) |
| 12:00 PM to 3:59 PM | 182 (6.3%) | 339 (10.9%) |
| 4:00 PM to 11:59 PM | 324 (11.3%) | 231 (7.4%) |
| Total | 2,880 (100.0%) | 3,106 (100.0%) |
Housing Occupancy in Uvalde
Occupancy by Ownership in Uvalde
Of the total 5,186 dwellings in Uvalde, owner-occupied units account for 3,237 (62.4%), while renter-occupied units make up 1,949 (37.6%).
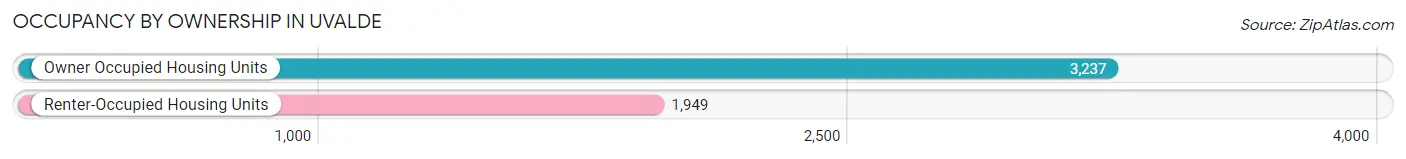
| Occupancy | # Housing Units | % Housing Units |
| Owner Occupied Housing Units | 3,237 | 62.4% |
| Renter-Occupied Housing Units | 1,949 | 37.6% |
| Total Occupied Housing Units | 5,186 | 100.0% |
Occupancy by Household Size in Uvalde
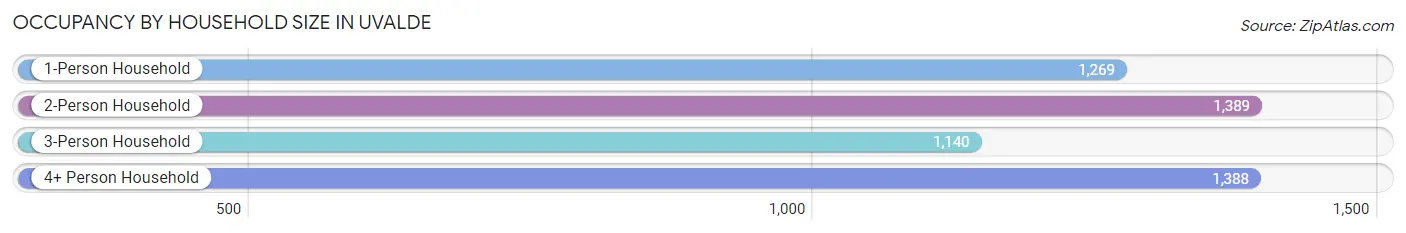
| Household Size | # Housing Units | % Housing Units |
| 1-Person Household | 1,269 | 24.5% |
| 2-Person Household | 1,389 | 26.8% |
| 3-Person Household | 1,140 | 22.0% |
| 4+ Person Household | 1,388 | 26.8% |
| Total Housing Units | 5,186 | 100.0% |
Occupancy by Ownership by Household Size in Uvalde
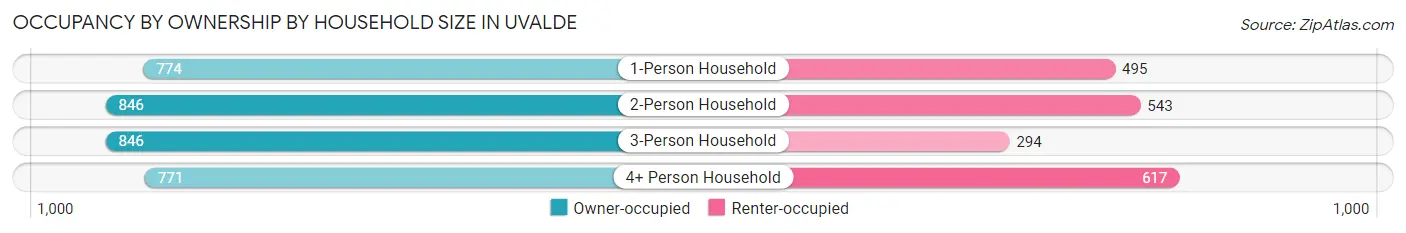
| Household Size | Owner-occupied | Renter-occupied |
| 1-Person Household | 774 (61.0%) | 495 (39.0%) |
| 2-Person Household | 846 (60.9%) | 543 (39.1%) |
| 3-Person Household | 846 (74.2%) | 294 (25.8%) |
| 4+ Person Household | 771 (55.5%) | 617 (44.5%) |
| Total Housing Units | 3,237 (62.4%) | 1,949 (37.6%) |
Occupancy by Educational Attainment in Uvalde
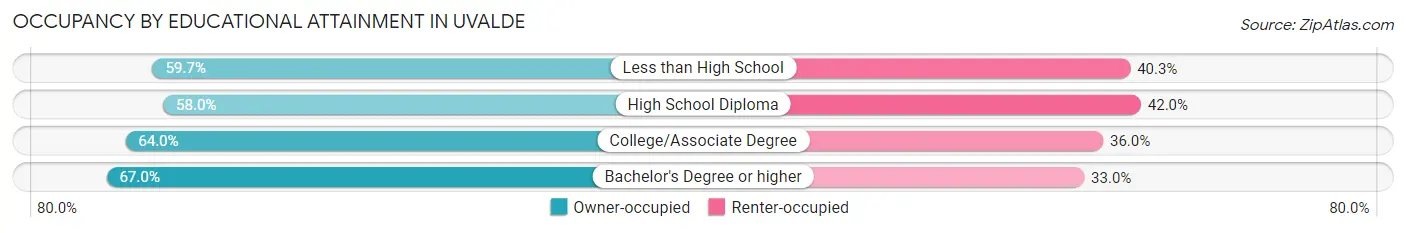
| Household Size | Owner-occupied | Renter-occupied |
| Less than High School | 790 (59.7%) | 533 (40.3%) |
| High School Diploma | 532 (58.0%) | 385 (42.0%) |
| College/Associate Degree | 1,261 (64.0%) | 709 (36.0%) |
| Bachelor's Degree or higher | 654 (67.0%) | 322 (33.0%) |
Occupancy by Age of Householder in Uvalde
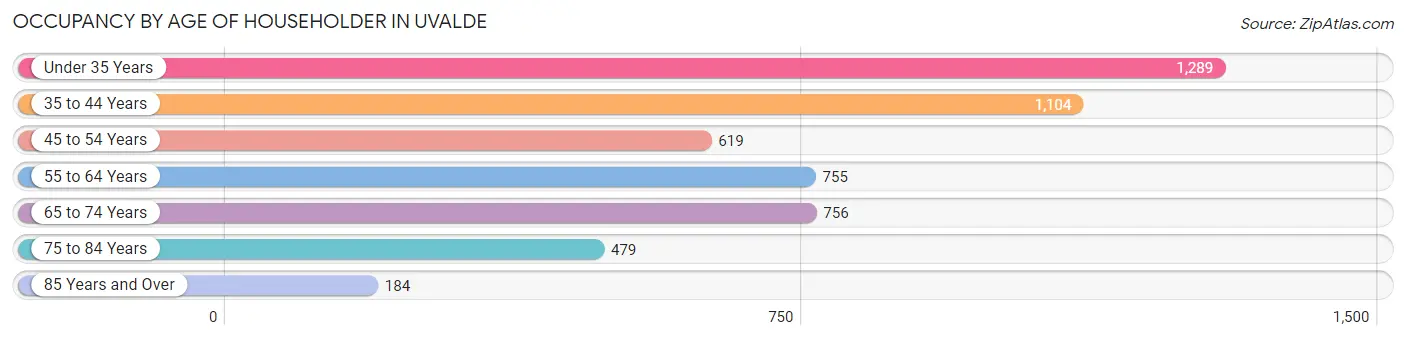
| Age Bracket | # Households | % Households |
| Under 35 Years | 1,289 | 24.9% |
| 35 to 44 Years | 1,104 | 21.3% |
| 45 to 54 Years | 619 | 11.9% |
| 55 to 64 Years | 755 | 14.6% |
| 65 to 74 Years | 756 | 14.6% |
| 75 to 84 Years | 479 | 9.2% |
| 85 Years and Over | 184 | 3.5% |
| Total | 5,186 | 100.0% |
Housing Finances in Uvalde
Median Income by Occupancy in Uvalde
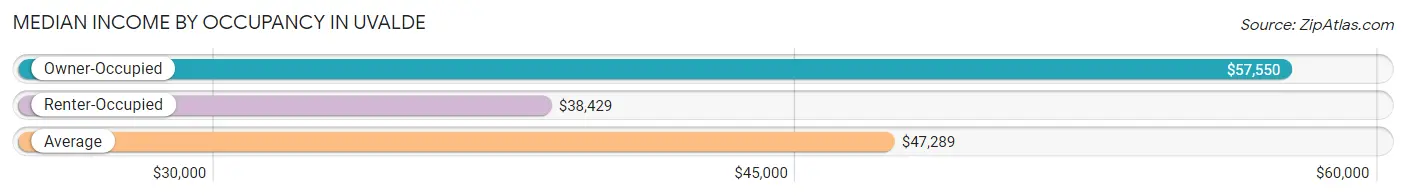
| Occupancy Type | # Households | Median Income |
| Owner-Occupied | 3,237 (62.4%) | $57,550 |
| Renter-Occupied | 1,949 (37.6%) | $38,429 |
| Average | 5,186 (100.0%) | $47,289 |
Occupancy by Householder Income Bracket in Uvalde
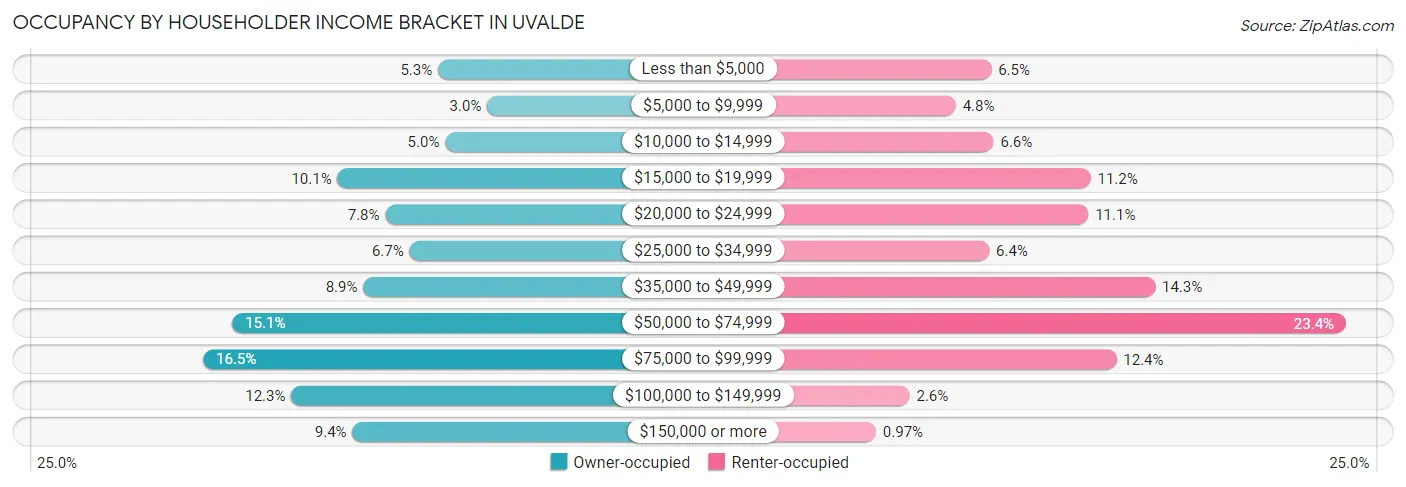
| Income Bracket | Owner-occupied | Renter-occupied |
| Less than $5,000 | 172 (5.3%) | 126 (6.5%) |
| $5,000 to $9,999 | 96 (3.0%) | 93 (4.8%) |
| $10,000 to $14,999 | 161 (5.0%) | 128 (6.6%) |
| $15,000 to $19,999 | 327 (10.1%) | 218 (11.2%) |
| $20,000 to $24,999 | 253 (7.8%) | 216 (11.1%) |
| $25,000 to $34,999 | 216 (6.7%) | 124 (6.4%) |
| $35,000 to $49,999 | 287 (8.9%) | 278 (14.3%) |
| $50,000 to $74,999 | 489 (15.1%) | 455 (23.4%) |
| $75,000 to $99,999 | 534 (16.5%) | 242 (12.4%) |
| $100,000 to $149,999 | 398 (12.3%) | 50 (2.6%) |
| $150,000 or more | 304 (9.4%) | 19 (1.0%) |
| Total | 3,237 (100.0%) | 1,949 (100.0%) |
Monthly Housing Cost Tiers in Uvalde
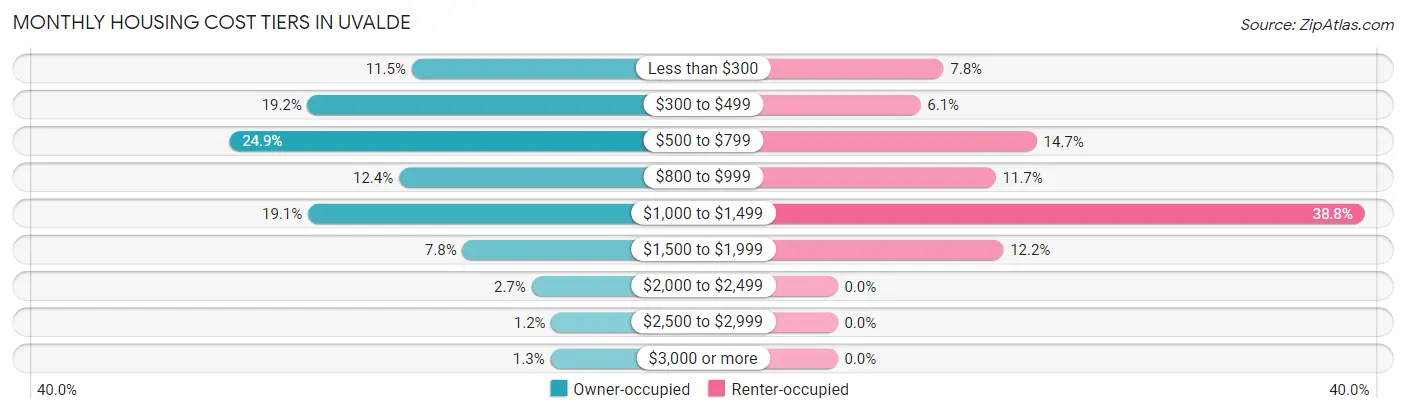
| Monthly Cost | Owner-occupied | Renter-occupied |
| Less than $300 | 372 (11.5%) | 152 (7.8%) |
| $300 to $499 | 620 (19.2%) | 119 (6.1%) |
| $500 to $799 | 807 (24.9%) | 286 (14.7%) |
| $800 to $999 | 402 (12.4%) | 227 (11.7%) |
| $1,000 to $1,499 | 619 (19.1%) | 757 (38.8%) |
| $1,500 to $1,999 | 251 (7.7%) | 238 (12.2%) |
| $2,000 to $2,499 | 86 (2.7%) | 0 (0.0%) |
| $2,500 to $2,999 | 39 (1.2%) | 0 (0.0%) |
| $3,000 or more | 41 (1.3%) | 0 (0.0%) |
| Total | 3,237 (100.0%) | 1,949 (100.0%) |
Physical Housing Characteristics in Uvalde
Housing Structures in Uvalde
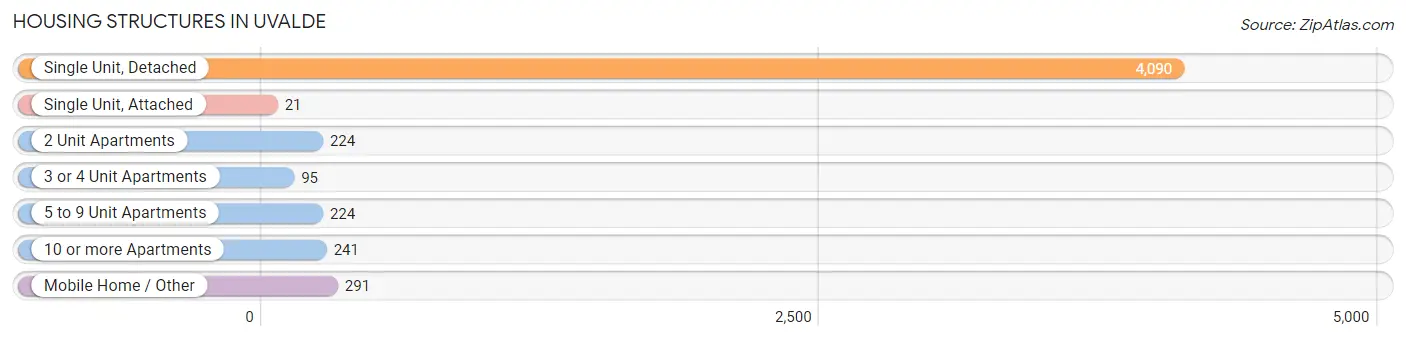
| Structure Type | # Housing Units | % Housing Units |
| Single Unit, Detached | 4,090 | 78.9% |
| Single Unit, Attached | 21 | 0.4% |
| 2 Unit Apartments | 224 | 4.3% |
| 3 or 4 Unit Apartments | 95 | 1.8% |
| 5 to 9 Unit Apartments | 224 | 4.3% |
| 10 or more Apartments | 241 | 4.6% |
| Mobile Home / Other | 291 | 5.6% |
| Total | 5,186 | 100.0% |
Housing Structures by Occupancy in Uvalde
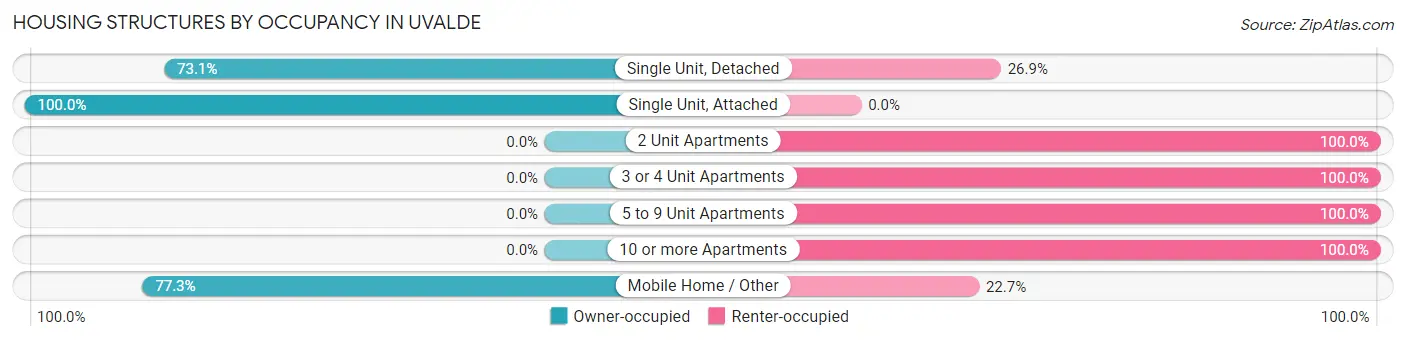
| Structure Type | Owner-occupied | Renter-occupied |
| Single Unit, Detached | 2,991 (73.1%) | 1,099 (26.9%) |
| Single Unit, Attached | 21 (100.0%) | 0 (0.0%) |
| 2 Unit Apartments | 0 (0.0%) | 224 (100.0%) |
| 3 or 4 Unit Apartments | 0 (0.0%) | 95 (100.0%) |
| 5 to 9 Unit Apartments | 0 (0.0%) | 224 (100.0%) |
| 10 or more Apartments | 0 (0.0%) | 241 (100.0%) |
| Mobile Home / Other | 225 (77.3%) | 66 (22.7%) |
| Total | 3,237 (62.4%) | 1,949 (37.6%) |
Housing Structures by Number of Rooms in Uvalde
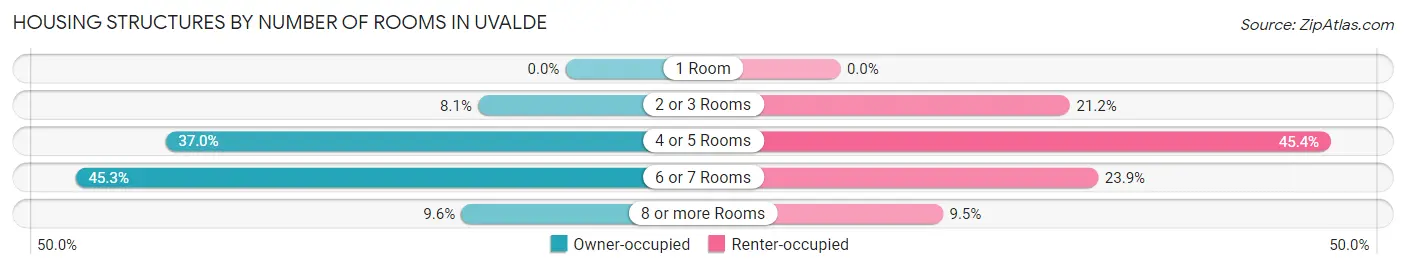
| Number of Rooms | Owner-occupied | Renter-occupied |
| 1 Room | 0 (0.0%) | 0 (0.0%) |
| 2 or 3 Rooms | 262 (8.1%) | 414 (21.2%) |
| 4 or 5 Rooms | 1,197 (37.0%) | 885 (45.4%) |
| 6 or 7 Rooms | 1,466 (45.3%) | 465 (23.9%) |
| 8 or more Rooms | 312 (9.6%) | 185 (9.5%) |
| Total | 3,237 (100.0%) | 1,949 (100.0%) |
Housing Structure by Heating Type in Uvalde
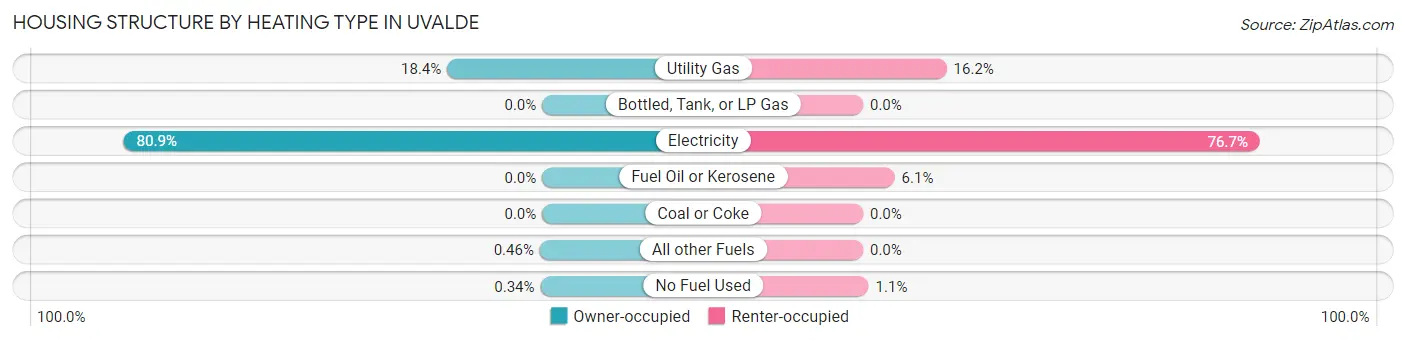
| Heating Type | Owner-occupied | Renter-occupied |
| Utility Gas | 594 (18.3%) | 315 (16.2%) |
| Bottled, Tank, or LP Gas | 0 (0.0%) | 0 (0.0%) |
| Electricity | 2,617 (80.8%) | 1,494 (76.6%) |
| Fuel Oil or Kerosene | 0 (0.0%) | 119 (6.1%) |
| Coal or Coke | 0 (0.0%) | 0 (0.0%) |
| All other Fuels | 15 (0.5%) | 0 (0.0%) |
| No Fuel Used | 11 (0.3%) | 21 (1.1%) |
| Total | 3,237 (100.0%) | 1,949 (100.0%) |
Household Vehicle Usage in Uvalde
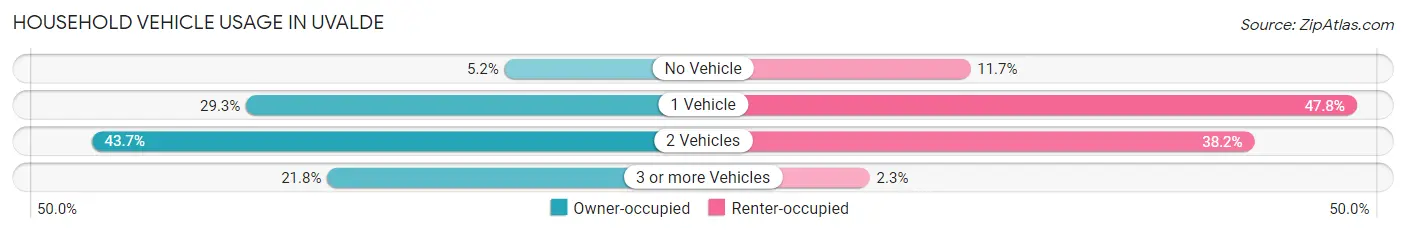
| Vehicles per Household | Owner-occupied | Renter-occupied |
| No Vehicle | 168 (5.2%) | 228 (11.7%) |
| 1 Vehicle | 949 (29.3%) | 931 (47.8%) |
| 2 Vehicles | 1,416 (43.7%) | 745 (38.2%) |
| 3 or more Vehicles | 704 (21.7%) | 45 (2.3%) |
| Total | 3,237 (100.0%) | 1,949 (100.0%) |
Real Estate & Mortgages in Uvalde
Real Estate and Mortgage Overview in Uvalde
| Characteristic | Without Mortgage | With Mortgage |
| Housing Units | 2,135 | 1,102 |
| Median Property Value | $89,600 | $154,400 |
| Median Household Income | $31,510 | $162 |
| Monthly Housing Costs | $516 | $41 |
| Real Estate Taxes | $1,456 | $88 |
Property Value by Mortgage Status in Uvalde
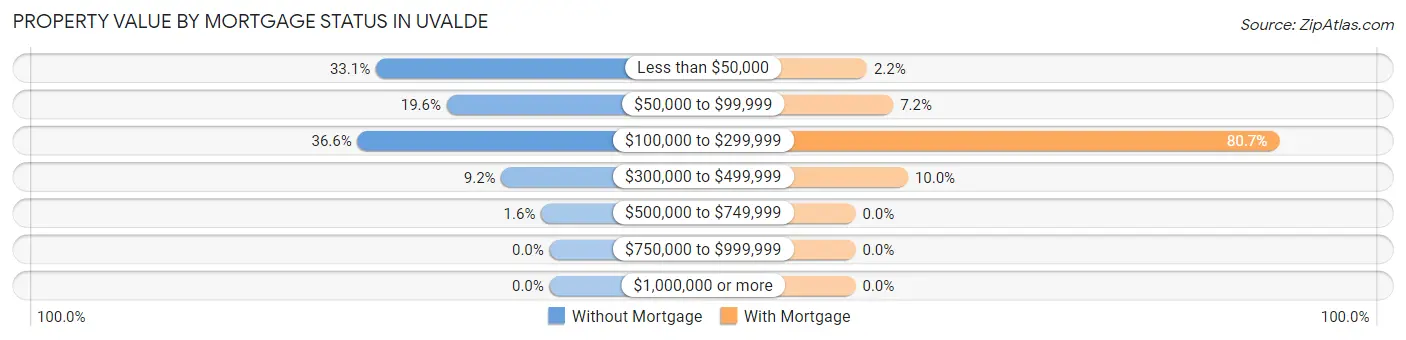
| Property Value | Without Mortgage | With Mortgage |
| Less than $50,000 | 706 (33.1%) | 24 (2.2%) |
| $50,000 to $99,999 | 418 (19.6%) | 79 (7.2%) |
| $100,000 to $299,999 | 781 (36.6%) | 889 (80.7%) |
| $300,000 to $499,999 | 196 (9.2%) | 110 (10.0%) |
| $500,000 to $749,999 | 34 (1.6%) | 0 (0.0%) |
| $750,000 to $999,999 | 0 (0.0%) | 0 (0.0%) |
| $1,000,000 or more | 0 (0.0%) | 0 (0.0%) |
| Total | 2,135 (100.0%) | 1,102 (100.0%) |
Household Income by Mortgage Status in Uvalde
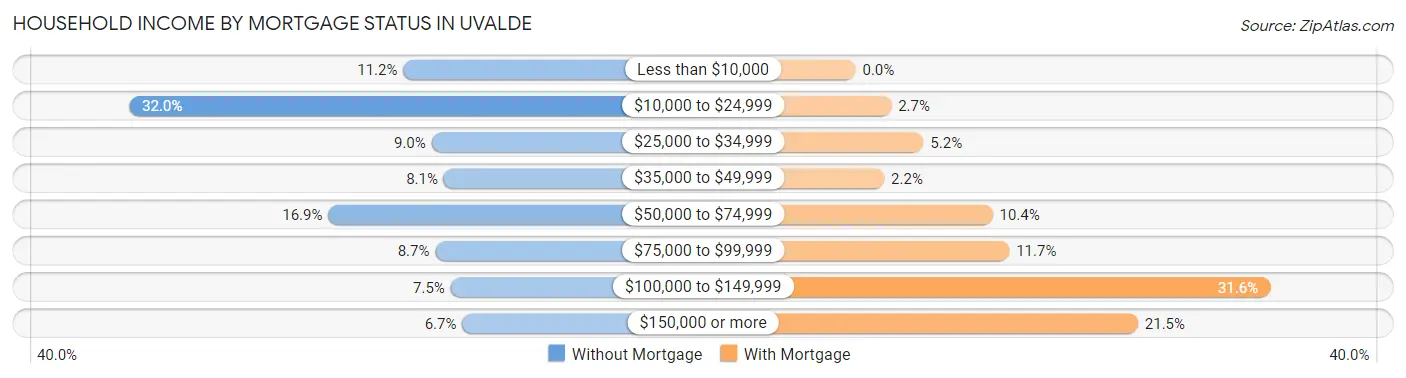
| Household Income | Without Mortgage | With Mortgage |
| Less than $10,000 | 238 (11.2%) | 0 (0.0%) |
| $10,000 to $24,999 | 684 (32.0%) | 30 (2.7%) |
| $25,000 to $34,999 | 192 (9.0%) | 57 (5.2%) |
| $35,000 to $49,999 | 172 (8.1%) | 24 (2.2%) |
| $50,000 to $74,999 | 360 (16.9%) | 115 (10.4%) |
| $75,000 to $99,999 | 186 (8.7%) | 129 (11.7%) |
| $100,000 to $149,999 | 161 (7.5%) | 348 (31.6%) |
| $150,000 or more | 142 (6.7%) | 237 (21.5%) |
| Total | 2,135 (100.0%) | 1,102 (100.0%) |
Property Value to Household Income Ratio in Uvalde
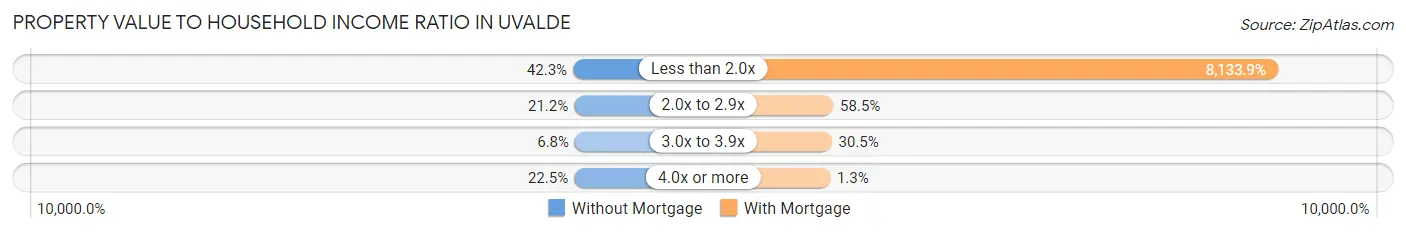
| Value-to-Income Ratio | Without Mortgage | With Mortgage |
| Less than 2.0x | 902 (42.2%) | 89,635 (8,133.8%) |
| 2.0x to 2.9x | 452 (21.2%) | 645 (58.5%) |
| 3.0x to 3.9x | 145 (6.8%) | 336 (30.5%) |
| 4.0x or more | 480 (22.5%) | 14 (1.3%) |
| Total | 2,135 (100.0%) | 1,102 (100.0%) |
Real Estate Taxes by Mortgage Status in Uvalde
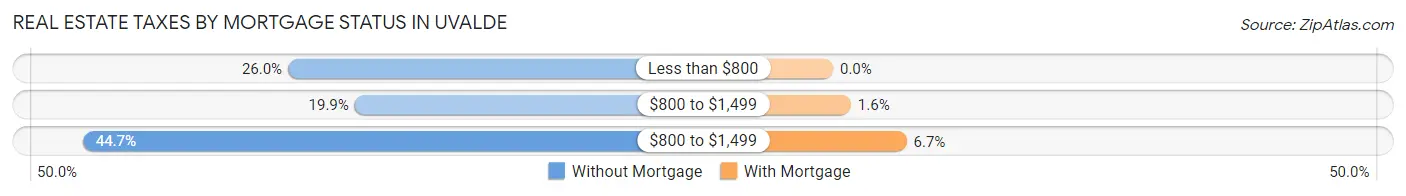
| Property Taxes | Without Mortgage | With Mortgage |
| Less than $800 | 554 (26.0%) | 0 (0.0%) |
| $800 to $1,499 | 424 (19.9%) | 18 (1.6%) |
| $800 to $1,499 | 954 (44.7%) | 74 (6.7%) |
| Total | 2,135 (100.0%) | 1,102 (100.0%) |
Health & Disability in Uvalde
Health Insurance Coverage by Age in Uvalde
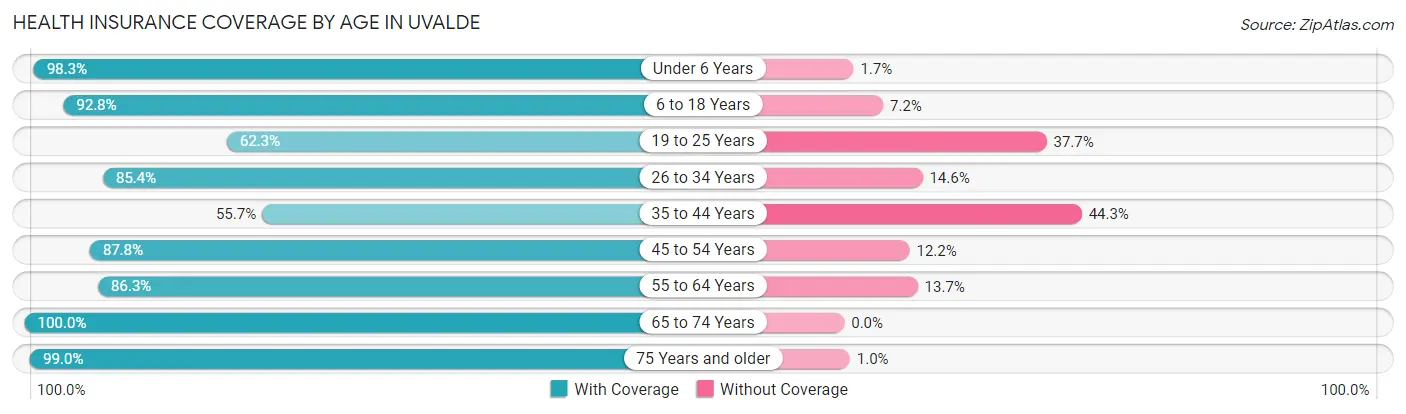
| Age Bracket | With Coverage | Without Coverage |
| Under 6 Years | 1,383 (98.3%) | 24 (1.7%) |
| 6 to 18 Years | 2,832 (92.8%) | 221 (7.2%) |
| 19 to 25 Years | 1,062 (62.3%) | 643 (37.7%) |
| 26 to 34 Years | 1,675 (85.4%) | 286 (14.6%) |
| 35 to 44 Years | 1,108 (55.7%) | 880 (44.3%) |
| 45 to 54 Years | 996 (87.8%) | 138 (12.2%) |
| 55 to 64 Years | 1,224 (86.3%) | 194 (13.7%) |
| 65 to 74 Years | 1,180 (100.0%) | 0 (0.0%) |
| 75 Years and older | 965 (99.0%) | 10 (1.0%) |
| Total | 12,425 (83.8%) | 2,396 (16.2%) |
Health Insurance Coverage by Citizenship Status in Uvalde
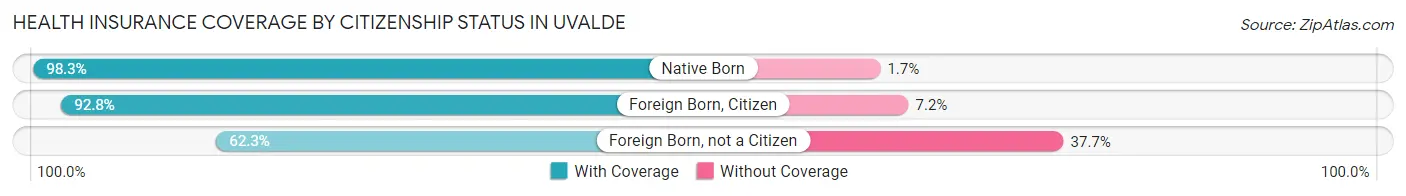
| Citizenship Status | With Coverage | Without Coverage |
| Native Born | 1,383 (98.3%) | 24 (1.7%) |
| Foreign Born, Citizen | 2,832 (92.8%) | 221 (7.2%) |
| Foreign Born, not a Citizen | 1,062 (62.3%) | 643 (37.7%) |
Health Insurance Coverage by Household Income in Uvalde
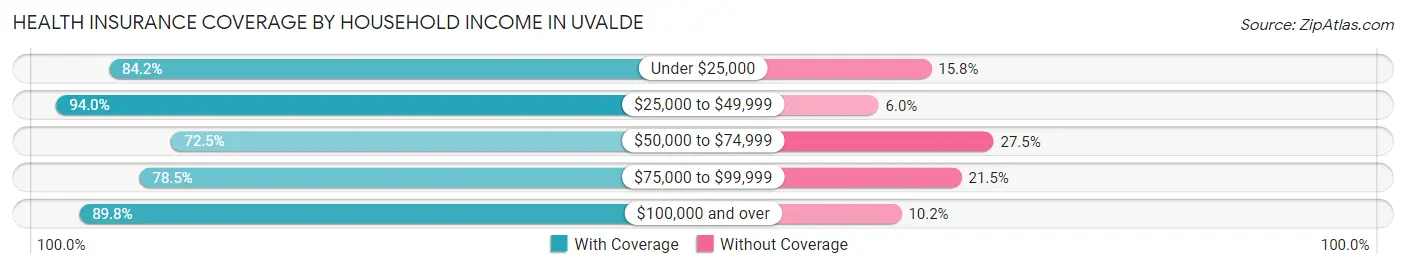
| Household Income | With Coverage | Without Coverage |
| Under $25,000 | 3,238 (84.2%) | 609 (15.8%) |
| $25,000 to $49,999 | 2,696 (94.0%) | 171 (6.0%) |
| $50,000 to $74,999 | 2,172 (72.5%) | 824 (27.5%) |
| $75,000 to $99,999 | 1,882 (78.5%) | 516 (21.5%) |
| $100,000 and over | 2,418 (89.8%) | 276 (10.2%) |
Public vs Private Health Insurance Coverage by Age in Uvalde
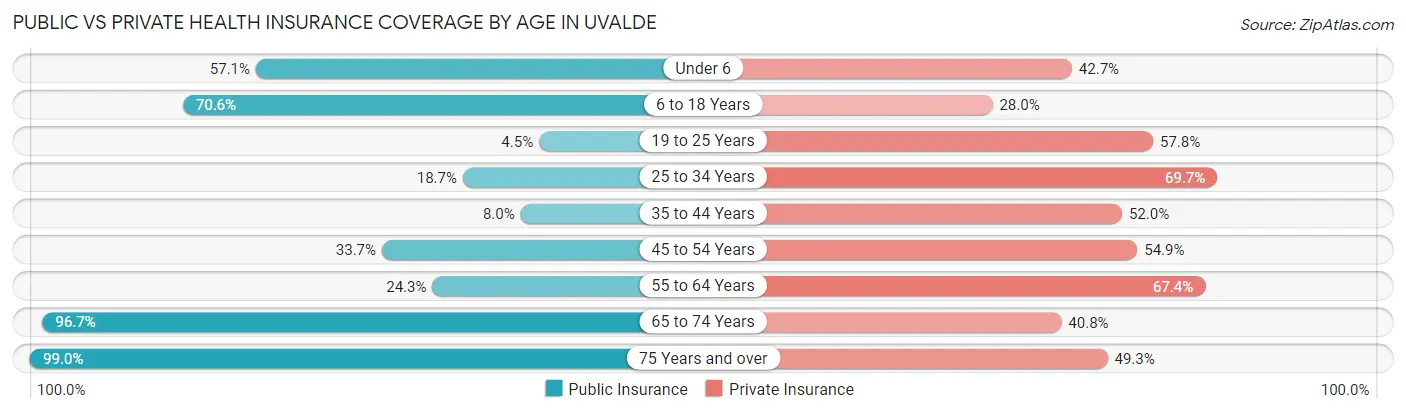
| Age Bracket | Public Insurance | Private Insurance |
| Under 6 | 803 (57.1%) | 601 (42.7%) |
| 6 to 18 Years | 2,156 (70.6%) | 854 (28.0%) |
| 19 to 25 Years | 77 (4.5%) | 985 (57.8%) |
| 25 to 34 Years | 366 (18.7%) | 1,366 (69.7%) |
| 35 to 44 Years | 158 (8.0%) | 1,034 (52.0%) |
| 45 to 54 Years | 382 (33.7%) | 622 (54.8%) |
| 55 to 64 Years | 345 (24.3%) | 956 (67.4%) |
| 65 to 74 Years | 1,141 (96.7%) | 481 (40.8%) |
| 75 Years and over | 965 (99.0%) | 481 (49.3%) |
| Total | 6,393 (43.1%) | 7,380 (49.8%) |
Disability Status by Sex by Age in Uvalde
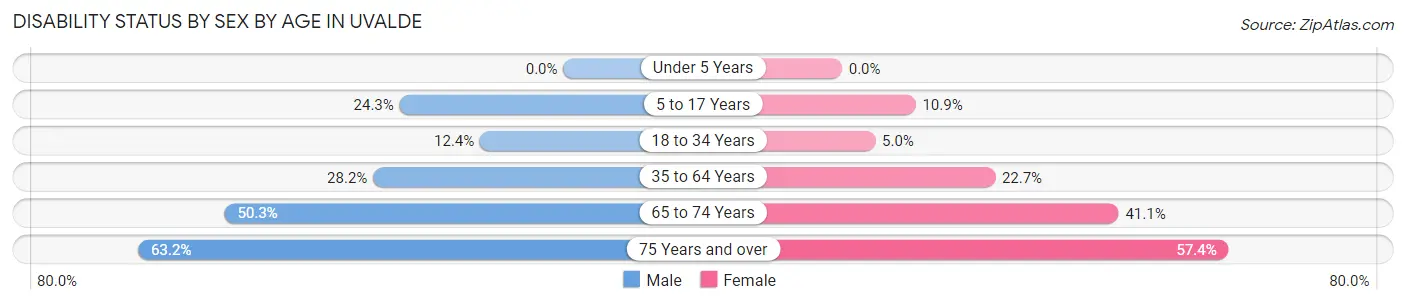
| Age Bracket | Male | Female |
| Under 5 Years | 0 (0.0%) | 0 (0.0%) |
| 5 to 17 Years | 451 (24.3%) | 152 (10.9%) |
| 18 to 34 Years | 212 (12.4%) | 100 (5.0%) |
| 35 to 64 Years | 599 (28.2%) | 550 (22.7%) |
| 65 to 74 Years | 235 (50.3%) | 293 (41.1%) |
| 75 Years and over | 276 (63.2%) | 309 (57.4%) |
Disability Class by Sex by Age in Uvalde
Disability Class: Hearing Difficulty
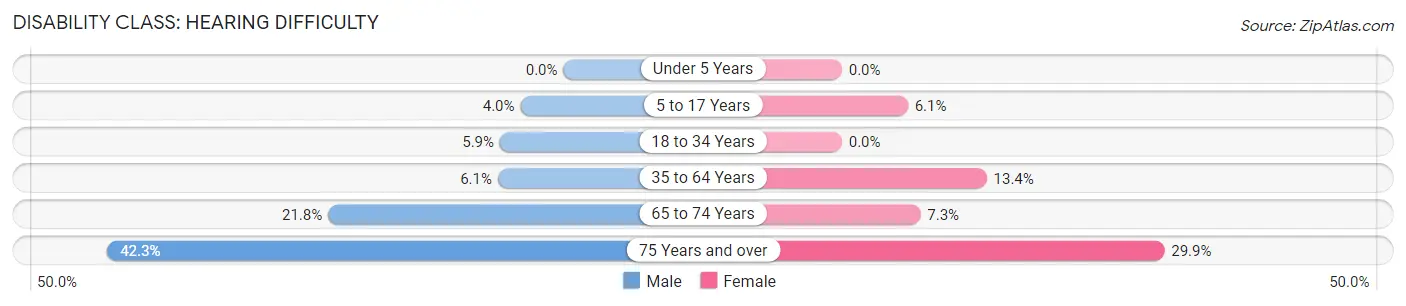
| Age Bracket | Male | Female |
| Under 5 Years | 0 (0.0%) | 0 (0.0%) |
| 5 to 17 Years | 74 (4.0%) | 85 (6.1%) |
| 18 to 34 Years | 101 (5.9%) | 0 (0.0%) |
| 35 to 64 Years | 129 (6.1%) | 325 (13.4%) |
| 65 to 74 Years | 102 (21.8%) | 52 (7.3%) |
| 75 Years and over | 185 (42.3%) | 161 (29.9%) |
Disability Class: Vision Difficulty
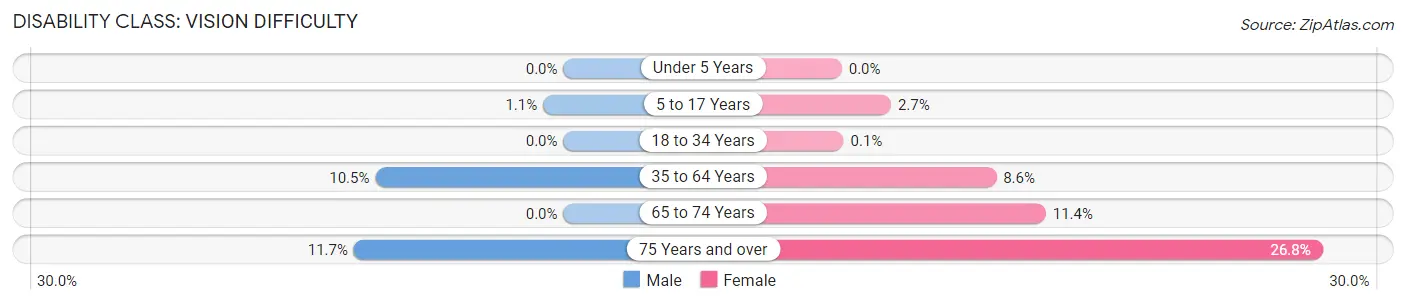
| Age Bracket | Male | Female |
| Under 5 Years | 0 (0.0%) | 0 (0.0%) |
| 5 to 17 Years | 21 (1.1%) | 38 (2.7%) |
| 18 to 34 Years | 0 (0.0%) | 2 (0.1%) |
| 35 to 64 Years | 222 (10.5%) | 208 (8.6%) |
| 65 to 74 Years | 0 (0.0%) | 81 (11.4%) |
| 75 Years and over | 51 (11.7%) | 144 (26.8%) |
Disability Class: Cognitive Difficulty
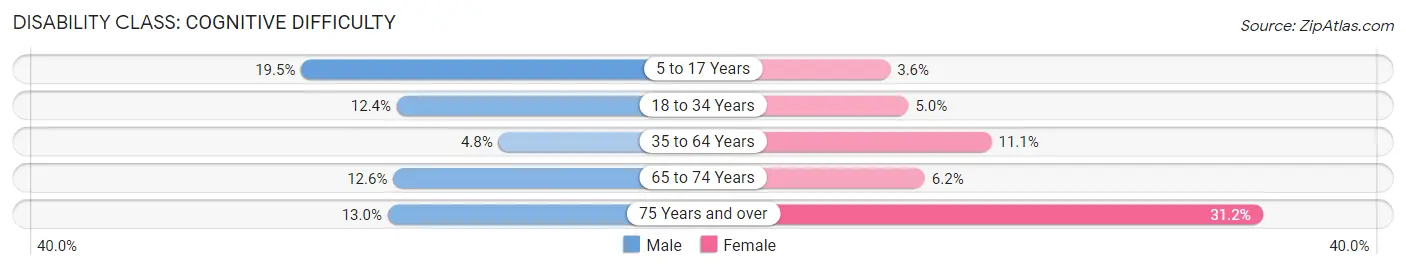
| Age Bracket | Male | Female |
| 5 to 17 Years | 361 (19.5%) | 50 (3.6%) |
| 18 to 34 Years | 212 (12.4%) | 100 (5.0%) |
| 35 to 64 Years | 102 (4.8%) | 269 (11.1%) |
| 65 to 74 Years | 59 (12.6%) | 44 (6.2%) |
| 75 Years and over | 57 (13.0%) | 168 (31.2%) |
Disability Class: Ambulatory Difficulty
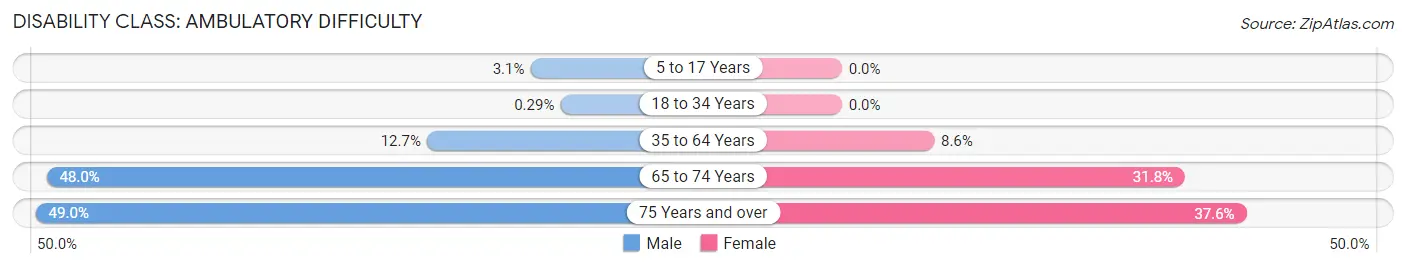
| Age Bracket | Male | Female |
| 5 to 17 Years | 57 (3.1%) | 0 (0.0%) |
| 18 to 34 Years | 5 (0.3%) | 0 (0.0%) |
| 35 to 64 Years | 269 (12.7%) | 207 (8.6%) |
| 65 to 74 Years | 224 (48.0%) | 227 (31.8%) |
| 75 Years and over | 214 (49.0%) | 202 (37.6%) |
Disability Class: Self-Care Difficulty
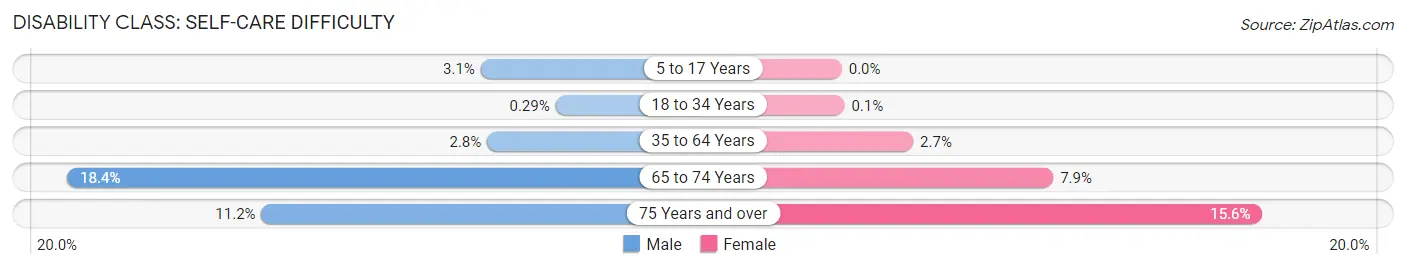
| Age Bracket | Male | Female |
| 5 to 17 Years | 57 (3.1%) | 0 (0.0%) |
| 18 to 34 Years | 5 (0.3%) | 2 (0.1%) |
| 35 to 64 Years | 60 (2.8%) | 64 (2.6%) |
| 65 to 74 Years | 86 (18.4%) | 56 (7.9%) |
| 75 Years and over | 49 (11.2%) | 84 (15.6%) |
Technology Access in Uvalde
Computing Device Access in Uvalde
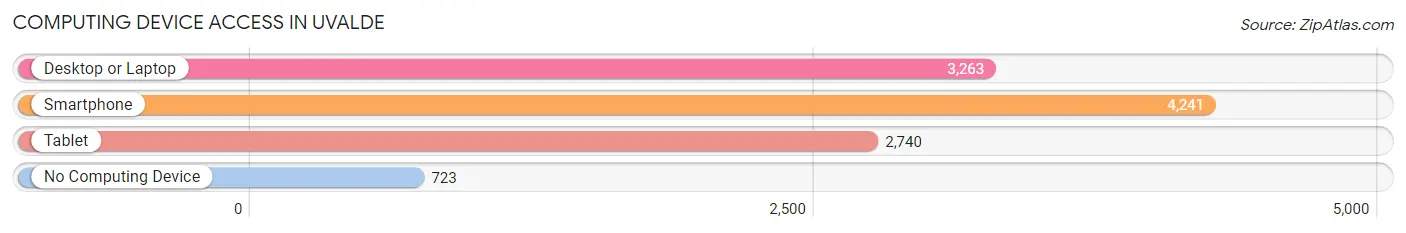
| Device Type | # Households | % Households |
| Desktop or Laptop | 3,263 | 62.9% |
| Smartphone | 4,241 | 81.8% |
| Tablet | 2,740 | 52.8% |
| No Computing Device | 723 | 13.9% |
| Total | 5,186 | 100.0% |
Internet Access in Uvalde
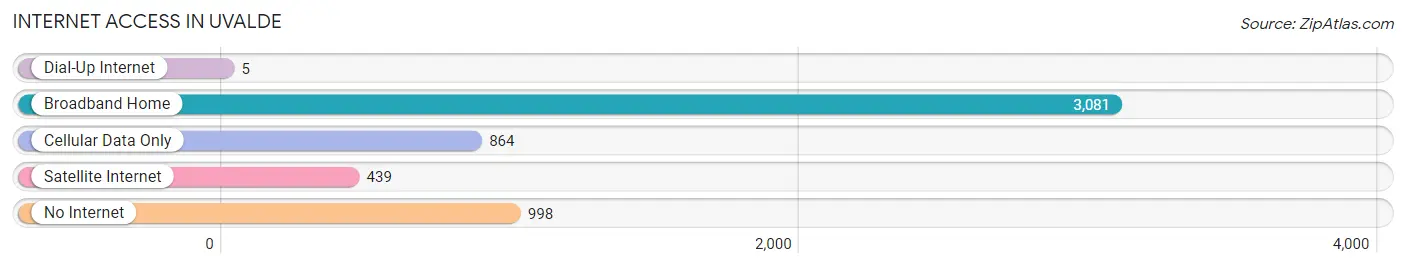
| Internet Type | # Households | % Households |
| Dial-Up Internet | 5 | 0.1% |
| Broadband Home | 3,081 | 59.4% |
| Cellular Data Only | 864 | 16.7% |
| Satellite Internet | 439 | 8.5% |
| No Internet | 998 | 19.2% |
| Total | 5,186 | 100.0% |
Uvalde Summary
Uvalde, Texas is a city located in Uvalde County in the south-central part of the state. It is the county seat and the largest city in the county. The city is situated on the Leona River, a tributary of the Nueces River, and is located about 90 miles west of San Antonio and about 80 miles south of Austin. The population of Uvalde was estimated to be 16,921 in 2019.
History
Uvalde was founded in 1853 by Reading Wood Black, a former mayor of San Antonio. He named the city after Juan de Ugalde, the Spanish governor of Coahuila and Texas at the time. The city was incorporated in 1856 and was the first city in Uvalde County.
In the late 19th century, Uvalde was a major stop on the San Antonio-El Paso Road, which was a major route for cattle drives. The city was also a major center for the production of wool and mohair.
Geography
Uvalde is located in south-central Texas, about 90 miles west of San Antonio and about 80 miles south of Austin. The city is situated on the Leona River, a tributary of the Nueces River. The terrain around Uvalde is mostly flat, with some rolling hills. The climate is semi-arid, with hot summers and mild winters.
Economy
The economy of Uvalde is largely based on agriculture and tourism. The city is home to several large farms and ranches, and is a major producer of wool and mohair. The city is also a popular tourist destination, with attractions such as the Uvalde County Historical Museum, the Uvalde County Courthouse, and the Uvalde County Fairgrounds.
Demographics
As of the 2019 census, the population of Uvalde was estimated to be 16,921. The racial makeup of the city was 79.2% White, 0.7% African American, 0.3% Native American, 0.3% Asian, 0.1% Pacific Islander, 17.3% from other races, and 2.3% from two or more races. Hispanic or Latino of any race were 63.2% of the population.
The median household income in Uvalde was $35,945 in 2019, and the median home value was $90,400. The city has a poverty rate of 22.3%.
Education
Uvalde is served by the Uvalde Consolidated Independent School District. The district has seven elementary schools, two middle schools, and one high school. The city is also home to Southwest Texas Junior College, a two-year community college.
Common Questions
What is Per Capita Income in Uvalde?
Per Capita income in Uvalde is $24,387.
What is the Median Family Income in Uvalde?
Median Family Income in Uvalde is $60,043.
What is the Median Household income in Uvalde?
Median Household Income in Uvalde is $47,289.
What is Income or Wage Gap in Uvalde?
Income or Wage Gap in Uvalde is 46.2%.
Women in Uvalde earn 53.8 cents for every dollar earned by a man.
What is Family Income Deficit in Uvalde?
Family Income Deficit in Uvalde is $10,883.
Families that are below poverty line in Uvalde earn $10,883 less on average than the poverty threshold level.
What is Inequality or Gini Index in Uvalde?
Inequality or Gini Index in Uvalde is 0.51.
What is the Total Population of Uvalde?
Total Population of Uvalde is 15,342.
What is the Total Male Population of Uvalde?
Total Male Population of Uvalde is 7,581.
What is the Total Female Population of Uvalde?
Total Female Population of Uvalde is 7,761.
What is the Ratio of Males per 100 Females in Uvalde?
There are 97.68 Males per 100 Females in Uvalde.
What is the Ratio of Females per 100 Males in Uvalde?
There are 102.37 Females per 100 Males in Uvalde.
What is the Median Population Age in Uvalde?
Median Population Age in Uvalde is 31.9 Years.
What is the Average Family Size in Uvalde
Average Family Size in Uvalde is 3.4 People.
What is the Average Household Size in Uvalde
Average Household Size in Uvalde is 2.9 People.
How Large is the Labor Force in Uvalde?
There are 6,374 People in the Labor Forcein in Uvalde.
What is the Percentage of People in the Labor Force in Uvalde?
55.9% of People are in the Labor Force in Uvalde.
What is the Unemployment Rate in Uvalde?
Unemployment Rate in Uvalde is 1.1%.