Rangely, CO Map & Demographics
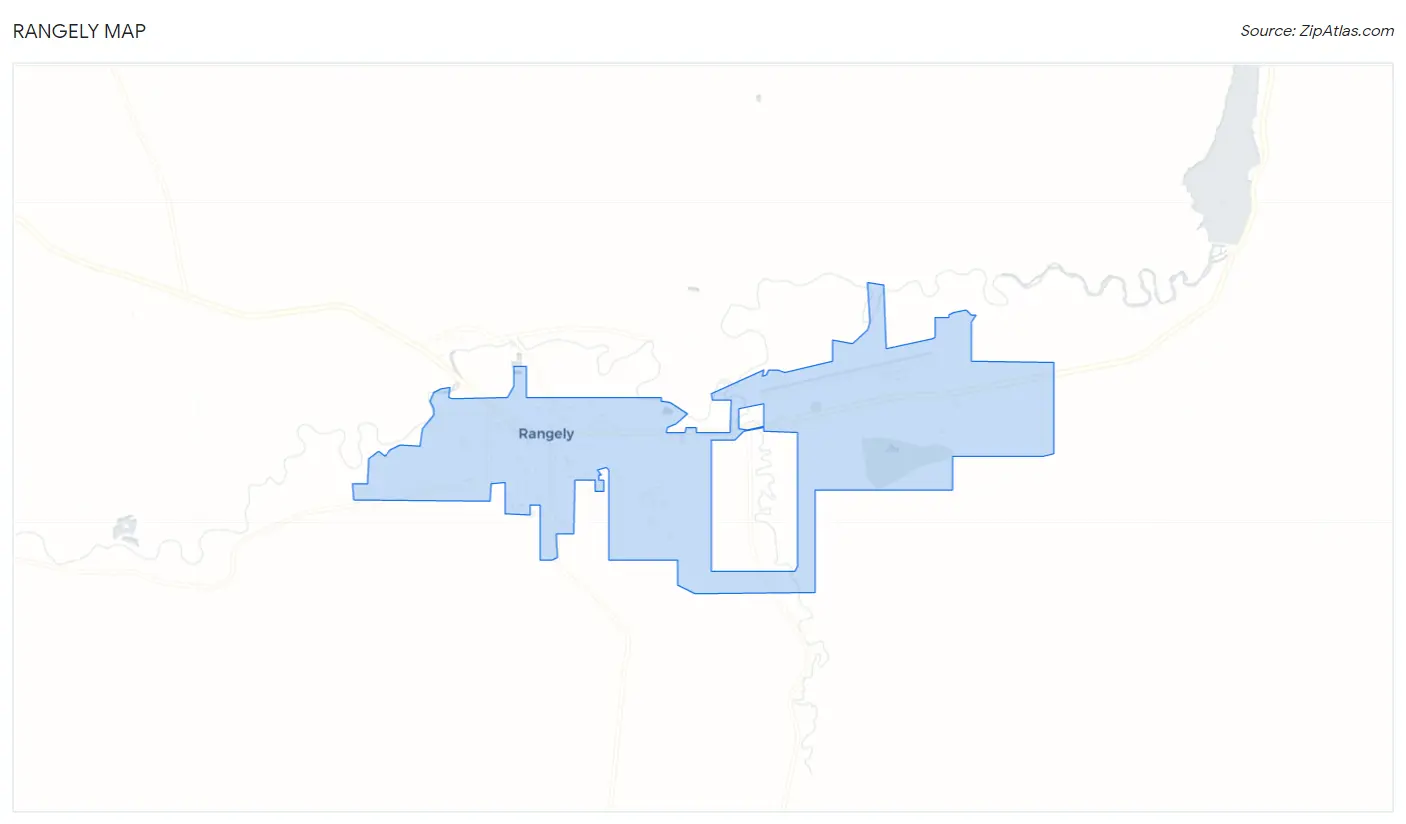
Rangely Map
Rangely Overview
$28,893
PER CAPITA INCOME
$86,917
AVG FAMILY INCOME
$70,363
AVG HOUSEHOLD INCOME
52.3%
WAGE / INCOME GAP [ % ]
47.7¢/ $1
WAGE / INCOME GAP [ $ ]
0.38
INEQUALITY / GINI INDEX
2,382
TOTAL POPULATION
1,252
MALE POPULATION
1,130
FEMALE POPULATION
110.80
MALES / 100 FEMALES
90.26
FEMALES / 100 MALES
35.8
MEDIAN AGE
3.1
AVG FAMILY SIZE
2.5
AVG HOUSEHOLD SIZE
1,229
LABOR FORCE [ PEOPLE ]
61.5%
PERCENT IN LABOR FORCE
6.5%
UNEMPLOYMENT RATE
Rangely Zip Codes
Rangely Area Codes
Income in Rangely
Income Overview in Rangely
Per Capita Income in Rangely is $28,893, while median incomes of families and households are $86,917 and $70,363 respectively.
| Characteristic | Number | Measure |
| Per Capita Income | 2,382 | $28,893 |
| Median Family Income | 541 | $86,917 |
| Mean Family Income | 541 | $89,936 |
| Median Household Income | 835 | $70,363 |
| Mean Household Income | 835 | $76,647 |
| Income Deficit | 541 | $0 |
| Wage / Income Gap (%) | 2,382 | 52.30% |
| Wage / Income Gap ($) | 2,382 | 47.70¢ per $1 |
| Gini / Inequality Index | 2,382 | 0.38 |
Earnings by Sex in Rangely
Average Earnings in Rangely are $21,977, $34,234 for men and $16,328 for women, a difference of 52.3%.
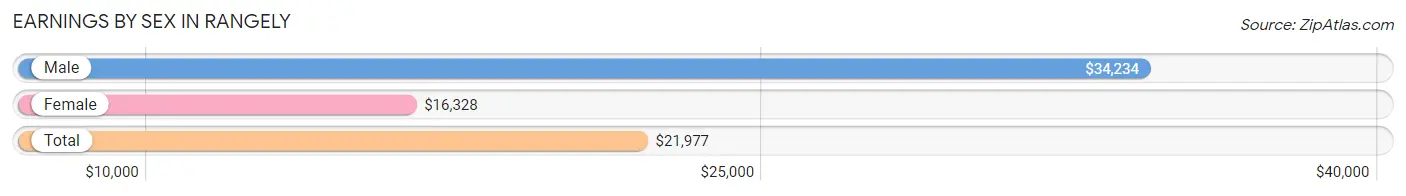
| Sex | Number | Average Earnings |
| Male | 791 (56.2%) | $34,234 |
| Female | 617 (43.8%) | $16,328 |
| Total | 1,408 (100.0%) | $21,977 |
Earnings by Sex by Income Bracket in Rangely
The most common earnings brackets in Rangely are $100,000+ for men (115 | 14.5%) and $2,499 or less for women (108 | 17.5%).
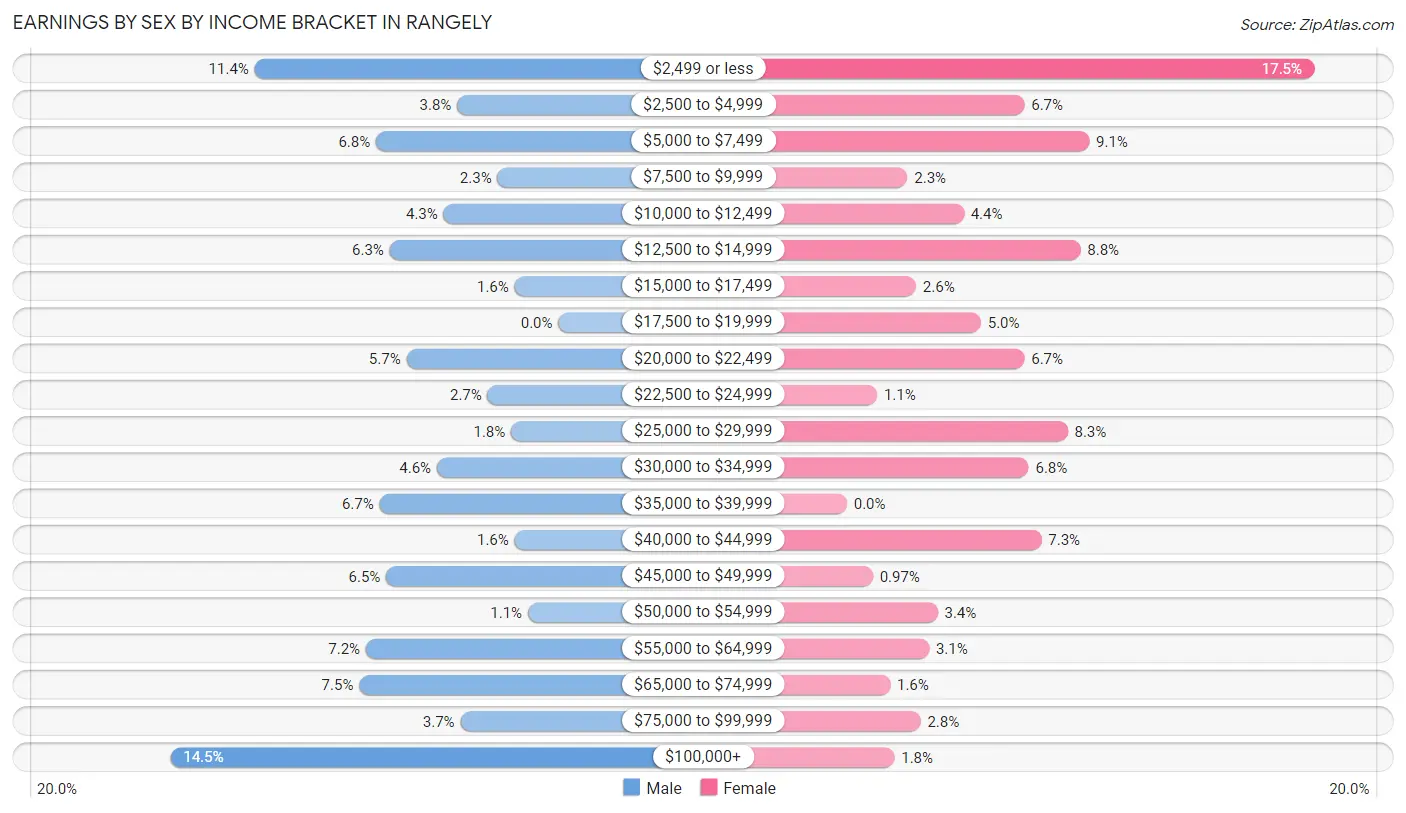
| Income | Male | Female |
| $2,499 or less | 90 (11.4%) | 108 (17.5%) |
| $2,500 to $4,999 | 30 (3.8%) | 41 (6.7%) |
| $5,000 to $7,499 | 54 (6.8%) | 56 (9.1%) |
| $7,500 to $9,999 | 18 (2.3%) | 14 (2.3%) |
| $10,000 to $12,499 | 34 (4.3%) | 27 (4.4%) |
| $12,500 to $14,999 | 50 (6.3%) | 54 (8.7%) |
| $15,000 to $17,499 | 13 (1.6%) | 16 (2.6%) |
| $17,500 to $19,999 | 0 (0.0%) | 31 (5.0%) |
| $20,000 to $22,499 | 45 (5.7%) | 41 (6.7%) |
| $22,500 to $24,999 | 21 (2.6%) | 7 (1.1%) |
| $25,000 to $29,999 | 14 (1.8%) | 51 (8.3%) |
| $30,000 to $34,999 | 36 (4.5%) | 42 (6.8%) |
| $35,000 to $39,999 | 53 (6.7%) | 0 (0.0%) |
| $40,000 to $44,999 | 13 (1.6%) | 45 (7.3%) |
| $45,000 to $49,999 | 51 (6.5%) | 6 (1.0%) |
| $50,000 to $54,999 | 9 (1.1%) | 21 (3.4%) |
| $55,000 to $64,999 | 57 (7.2%) | 19 (3.1%) |
| $65,000 to $74,999 | 59 (7.5%) | 10 (1.6%) |
| $75,000 to $99,999 | 29 (3.7%) | 17 (2.8%) |
| $100,000+ | 115 (14.5%) | 11 (1.8%) |
| Total | 791 (100.0%) | 617 (100.0%) |
Earnings by Sex by Educational Attainment in Rangely
Average earnings in Rangely are $46,797 for men and $25,189 for women, a difference of 46.2%. Men with an educational attainment of high school diploma enjoy the highest average annual earnings of $73,080, while those with college or associate's degree education earn the least with $39,333. Women with an educational attainment of college or associate's degree earn the most with the average annual earnings of $33,750, while those with less than high school education have the smallest earnings of $2,499.
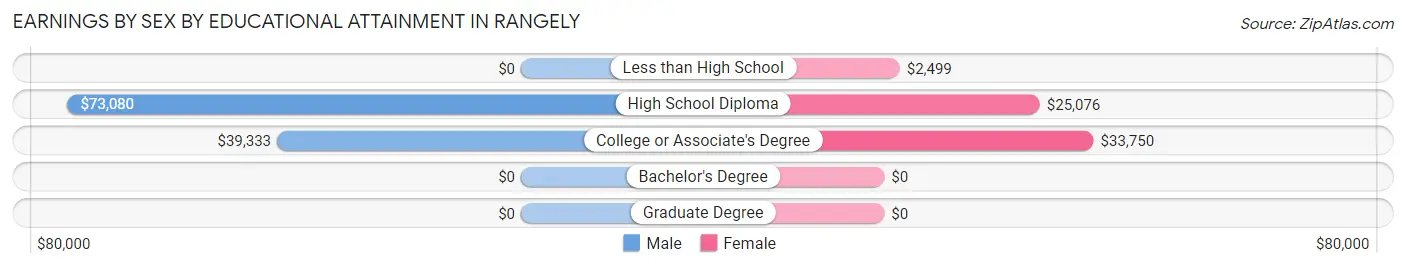
| Educational Attainment | Male Income | Female Income |
| Less than High School | - | - |
| High School Diploma | $73,080 | $25,076 |
| College or Associate's Degree | $39,333 | $33,750 |
| Bachelor's Degree | - | - |
| Graduate Degree | - | - |
| Total | $46,797 | $25,189 |
Family Income in Rangely
Family Income Brackets in Rangely
According to the Rangely family income data, there are 196 families falling into the $100,000 to $149,999 income range, which is the most common income bracket and makes up 36.2% of all families.
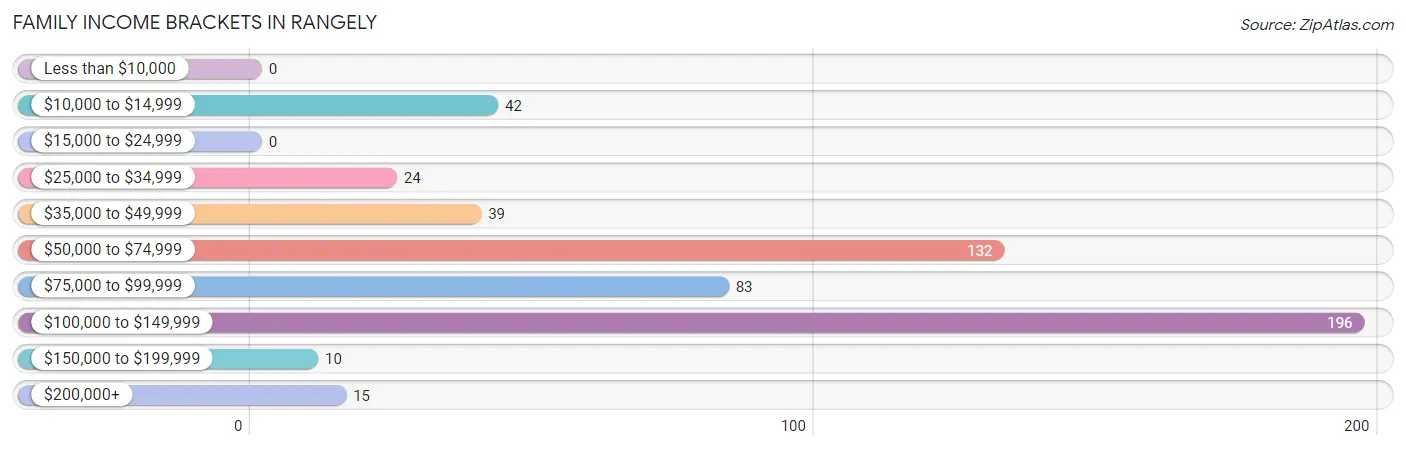
| Income Bracket | # Families | % Families |
| Less than $10,000 | 0 | 0.0% |
| $10,000 to $14,999 | 42 | 7.8% |
| $15,000 to $24,999 | 0 | 0.0% |
| $25,000 to $34,999 | 24 | 4.4% |
| $35,000 to $49,999 | 39 | 7.2% |
| $50,000 to $74,999 | 132 | 24.4% |
| $75,000 to $99,999 | 83 | 15.3% |
| $100,000 to $149,999 | 196 | 36.2% |
| $150,000 to $199,999 | 10 | 1.8% |
| $200,000+ | 15 | 2.8% |
Family Income by Famaliy Size in Rangely
4-person families (128 | 23.7%) account for the highest median family income in Rangely with $98,750 per family, while 2-person families (281 | 51.9%) have the highest median income of $43,789 per family member.
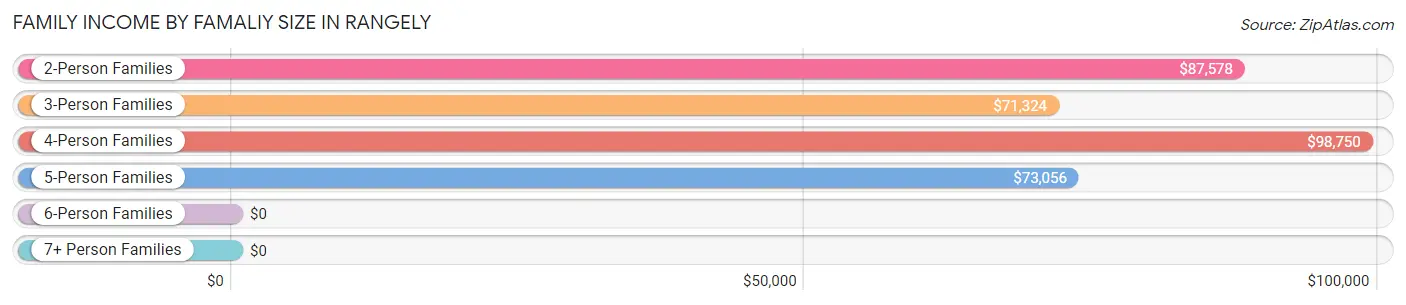
| Income Bracket | # Families | Median Income |
| 2-Person Families | 281 (51.9%) | $87,578 |
| 3-Person Families | 68 (12.6%) | $71,324 |
| 4-Person Families | 128 (23.7%) | $98,750 |
| 5-Person Families | 58 (10.7%) | $73,056 |
| 6-Person Families | 6 (1.1%) | $0 |
| 7+ Person Families | 0 (0.0%) | $0 |
| Total | 541 (100.0%) | $86,917 |
Family Income by Number of Earners in Rangely
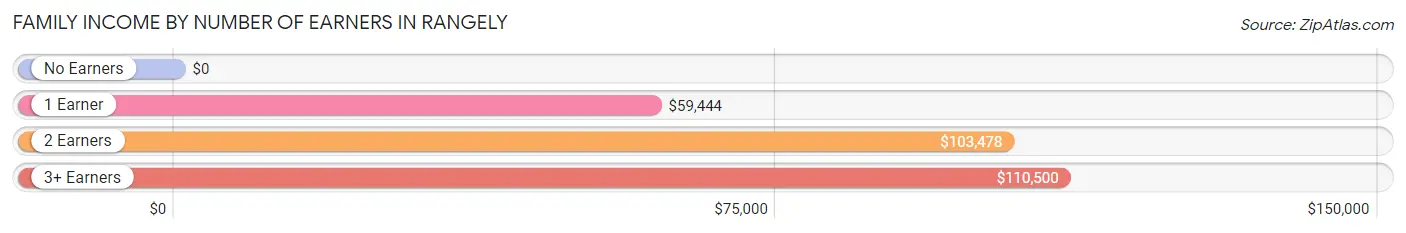
| Number of Earners | # Families | Median Income |
| No Earners | 39 (7.2%) | $0 |
| 1 Earner | 242 (44.7%) | $59,444 |
| 2 Earners | 192 (35.5%) | $103,478 |
| 3+ Earners | 68 (12.6%) | $110,500 |
| Total | 541 (100.0%) | $86,917 |
Household Income in Rangely
Household Income Brackets in Rangely
With 243 households falling in the category, the $100,000 to $149,999 income range is the most frequent in Rangely, accounting for 29.1% of all households. In contrast, only 15 households (1.8%) fall into the $200,000+ income bracket, making it the least populous group.
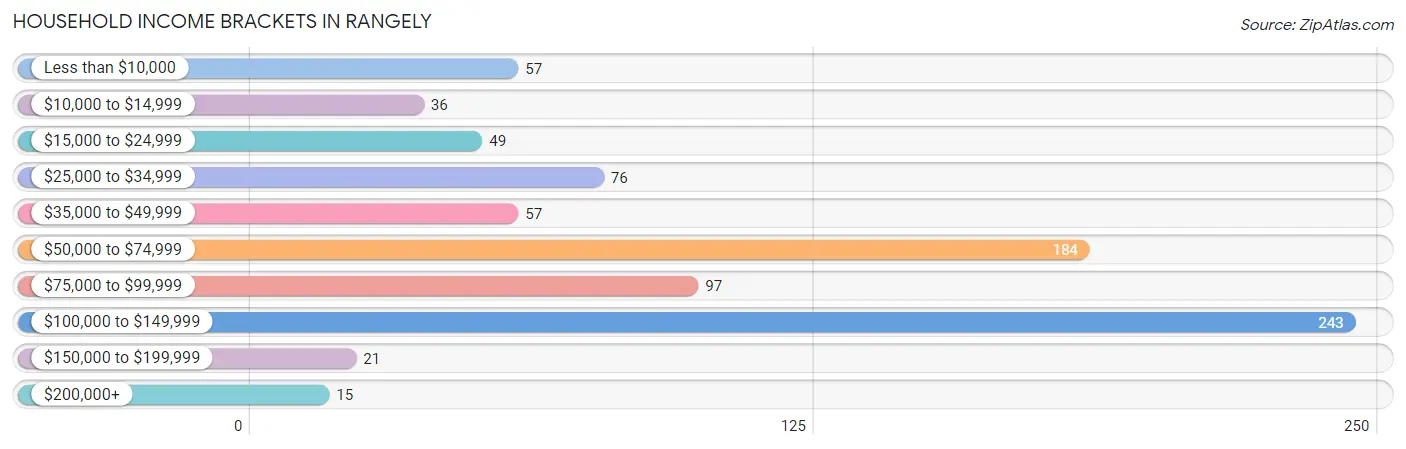
| Income Bracket | # Households | % Households |
| Less than $10,000 | 57 | 6.8% |
| $10,000 to $14,999 | 36 | 4.3% |
| $15,000 to $24,999 | 49 | 5.9% |
| $25,000 to $34,999 | 76 | 9.1% |
| $35,000 to $49,999 | 57 | 6.8% |
| $50,000 to $74,999 | 184 | 22.0% |
| $75,000 to $99,999 | 97 | 11.6% |
| $100,000 to $149,999 | 243 | 29.1% |
| $150,000 to $199,999 | 21 | 2.5% |
| $200,000+ | 15 | 1.8% |
Household Income by Householder Age in Rangely
The median household income in Rangely is $70,363, with the highest median household income of $87,333 found in the 45 to 64 years age bracket for the primary householder. A total of 360 households (43.1%) fall into this category. Meanwhile, the 15 to 24 years age bracket for the primary householder has the lowest median household income of $0, with 70 households (8.4%) in this group.
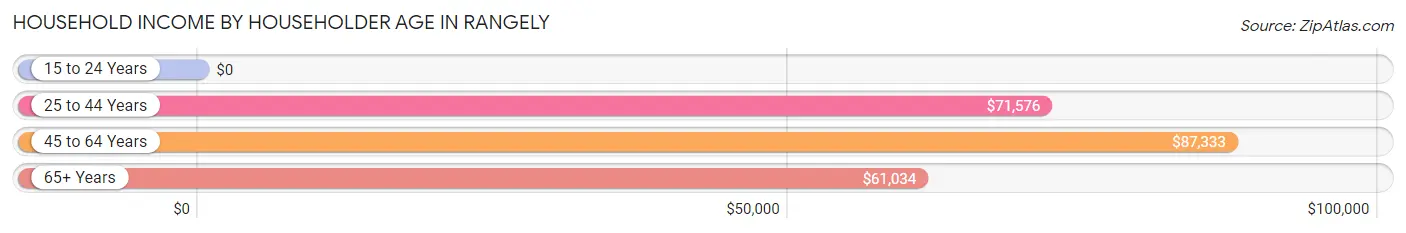
| Income Bracket | # Households | Median Income |
| 15 to 24 Years | 70 (8.4%) | $0 |
| 25 to 44 Years | 235 (28.1%) | $71,576 |
| 45 to 64 Years | 360 (43.1%) | $87,333 |
| 65+ Years | 170 (20.4%) | $61,034 |
| Total | 835 (100.0%) | $70,363 |
Poverty in Rangely
Income Below Poverty by Sex and Age in Rangely
With 14.0% poverty level for males and 12.4% for females among the residents of Rangely, 5 year old males and 25 to 34 year old females are the most vulnerable to poverty, with 31 males (59.6%) and 47 females (31.8%) in their respective age groups living below the poverty level.
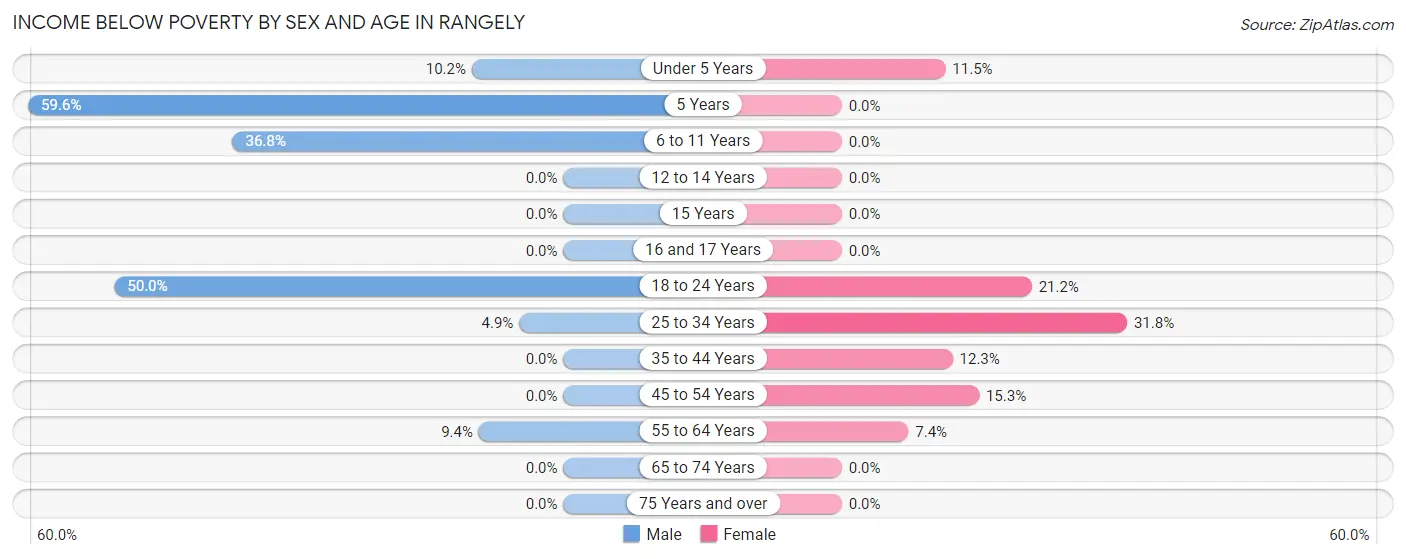
| Age Bracket | Male | Female |
| Under 5 Years | 5 (10.2%) | 6 (11.5%) |
| 5 Years | 31 (59.6%) | 0 (0.0%) |
| 6 to 11 Years | 35 (36.8%) | 0 (0.0%) |
| 12 to 14 Years | 0 (0.0%) | 0 (0.0%) |
| 15 Years | 0 (0.0%) | 0 (0.0%) |
| 16 and 17 Years | 0 (0.0%) | 0 (0.0%) |
| 18 to 24 Years | 62 (50.0%) | 22 (21.1%) |
| 25 to 34 Years | 6 (4.9%) | 47 (31.8%) |
| 35 to 44 Years | 0 (0.0%) | 19 (12.3%) |
| 45 to 54 Years | 0 (0.0%) | 11 (15.3%) |
| 55 to 64 Years | 18 (9.4%) | 18 (7.4%) |
| 65 to 74 Years | 0 (0.0%) | 0 (0.0%) |
| 75 Years and over | 0 (0.0%) | 0 (0.0%) |
| Total | 157 (14.0%) | 123 (12.4%) |
Income Above Poverty by Sex and Age in Rangely
According to the poverty statistics in Rangely, males aged 12 to 14 years and females aged 5 years are the age groups that are most secure financially, with 100.0% of males and 100.0% of females in these age groups living above the poverty line.
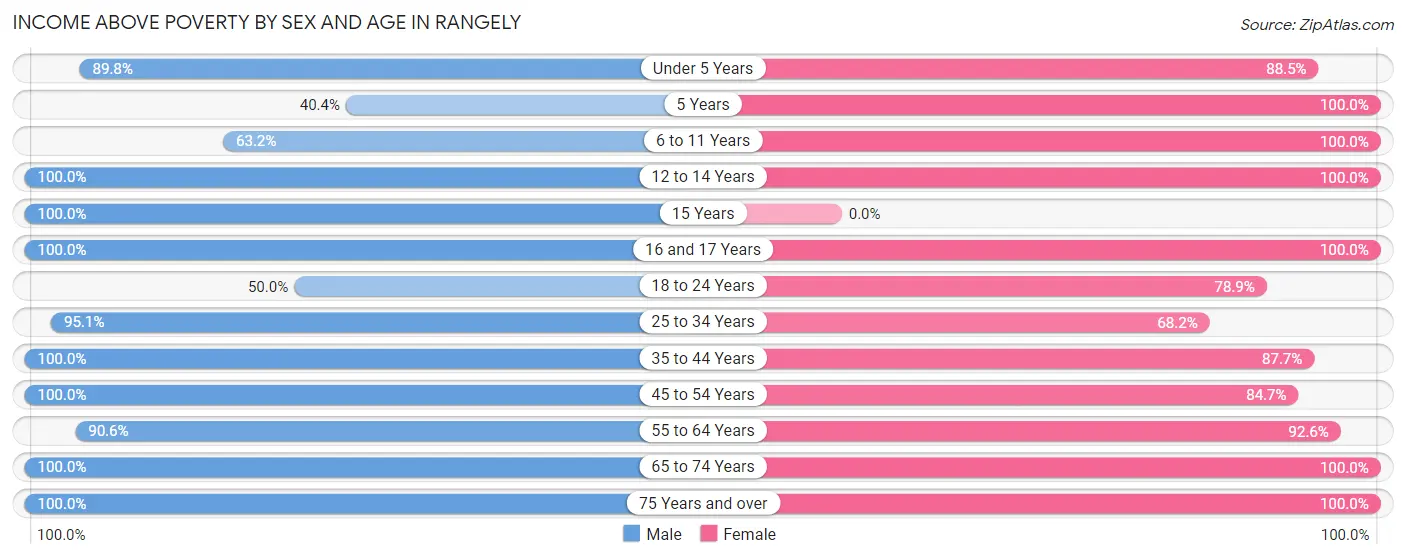
| Age Bracket | Male | Female |
| Under 5 Years | 44 (89.8%) | 46 (88.5%) |
| 5 Years | 21 (40.4%) | 7 (100.0%) |
| 6 to 11 Years | 60 (63.2%) | 59 (100.0%) |
| 12 to 14 Years | 38 (100.0%) | 20 (100.0%) |
| 15 Years | 2 (100.0%) | 0 (0.0%) |
| 16 and 17 Years | 44 (100.0%) | 54 (100.0%) |
| 18 to 24 Years | 62 (50.0%) | 82 (78.8%) |
| 25 to 34 Years | 116 (95.1%) | 101 (68.2%) |
| 35 to 44 Years | 164 (100.0%) | 135 (87.7%) |
| 45 to 54 Years | 102 (100.0%) | 61 (84.7%) |
| 55 to 64 Years | 173 (90.6%) | 225 (92.6%) |
| 65 to 74 Years | 93 (100.0%) | 54 (100.0%) |
| 75 Years and over | 45 (100.0%) | 22 (100.0%) |
| Total | 964 (86.0%) | 866 (87.6%) |
Income Below Poverty Among Married-Couple Families in Rangely
The poverty statistics for married-couple families in Rangely show that 4.2% or 18 of the total 425 families live below the poverty line. Families with no children have the highest poverty rate of 4.9%, comprising of 12 families. On the other hand, families with 3 or 4 children have the lowest poverty rate of 0.0%, which includes 0 families.
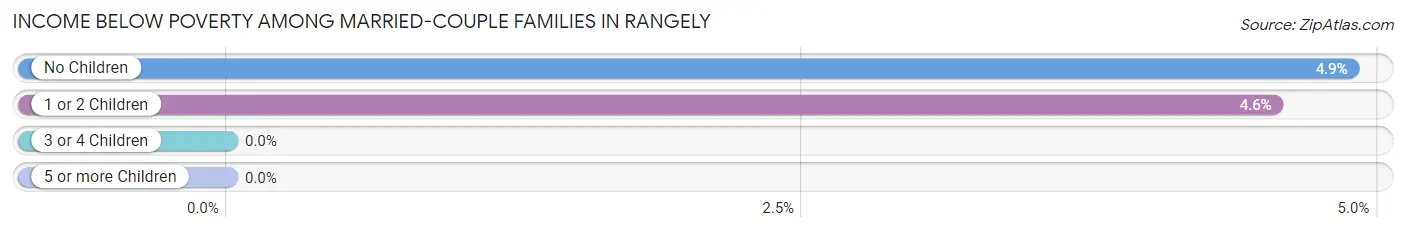
| Children | Above Poverty | Below Poverty |
| No Children | 234 (95.1%) | 12 (4.9%) |
| 1 or 2 Children | 126 (95.5%) | 6 (4.5%) |
| 3 or 4 Children | 47 (100.0%) | 0 (0.0%) |
| 5 or more Children | 0 (0.0%) | 0 (0.0%) |
| Total | 407 (95.8%) | 18 (4.2%) |
Income Below Poverty Among Single-Parent Households in Rangely
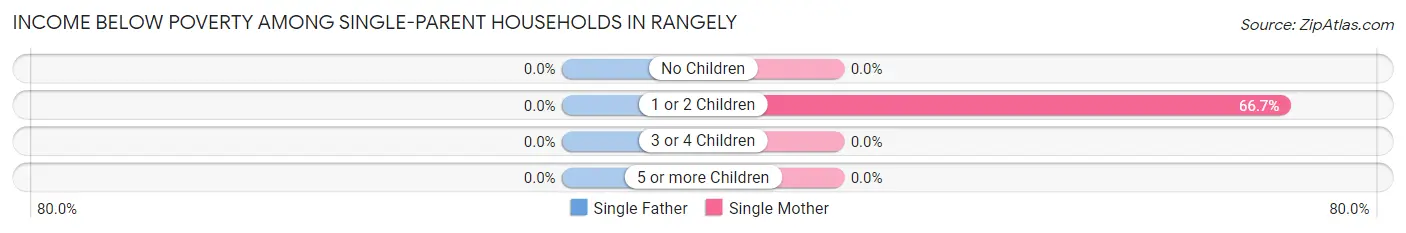
| Children | Single Father | Single Mother |
| No Children | 0 (0.0%) | 0 (0.0%) |
| 1 or 2 Children | 0 (0.0%) | 30 (66.7%) |
| 3 or 4 Children | 0 (0.0%) | 0 (0.0%) |
| 5 or more Children | 0 (0.0%) | 0 (0.0%) |
| Total | 0 (0.0%) | 30 (35.3%) |
Income Below Poverty Among Married-Couple vs Single-Parent Households in Rangely
The poverty data for Rangely shows that 18 of the married-couple family households (4.2%) and 30 of the single-parent households (25.9%) are living below the poverty level. Within the married-couple family households, those with no children have the highest poverty rate, with 12 households (4.9%) falling below the poverty line. Among the single-parent households, those with 1 or 2 children have the highest poverty rate, with 30 household (50.8%) living below poverty.
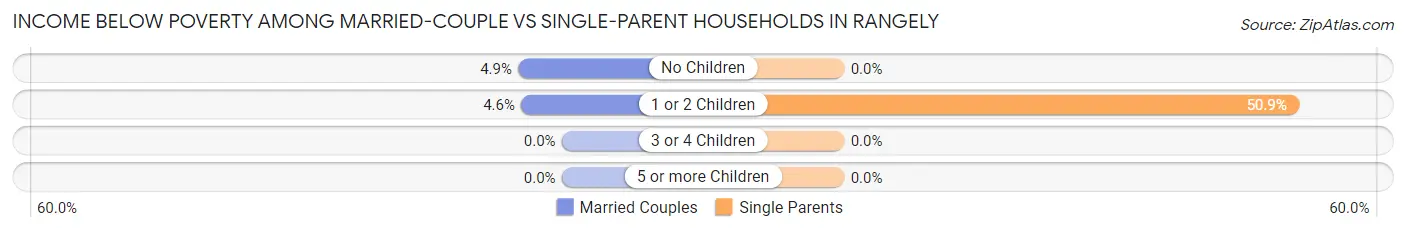
| Children | Married-Couple Families | Single-Parent Households |
| No Children | 12 (4.9%) | 0 (0.0%) |
| 1 or 2 Children | 6 (4.5%) | 30 (50.8%) |
| 3 or 4 Children | 0 (0.0%) | 0 (0.0%) |
| 5 or more Children | 0 (0.0%) | 0 (0.0%) |
| Total | 18 (4.2%) | 30 (25.9%) |
Race in Rangely
The most populous races in Rangely are White / Caucasian (2,036 | 85.5%), Two or more Races (252 | 10.6%), and Hispanic or Latino (218 | 9.1%).
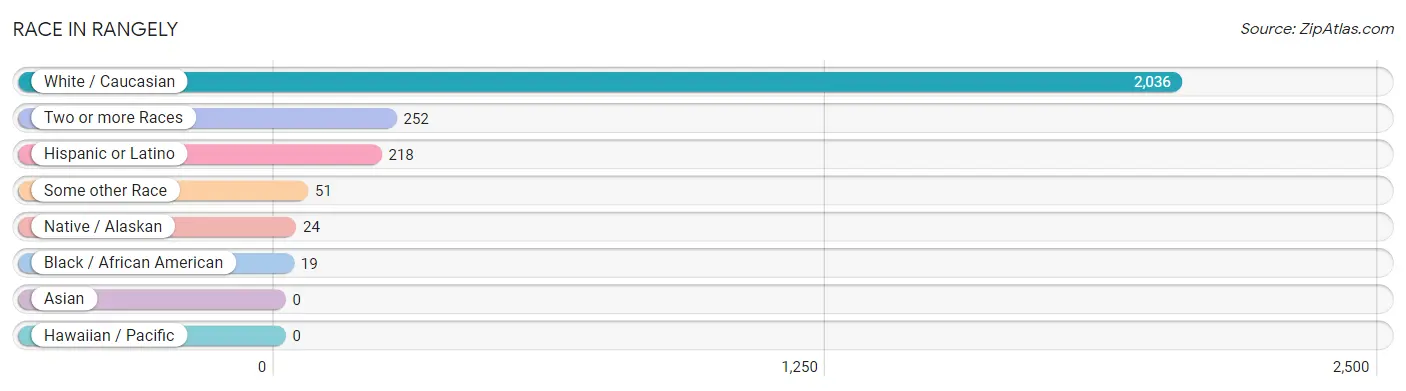
| Race | # Population | % Population |
| Asian | 0 | 0.0% |
| Black / African American | 19 | 0.8% |
| Hawaiian / Pacific | 0 | 0.0% |
| Hispanic or Latino | 218 | 9.1% |
| Native / Alaskan | 24 | 1.0% |
| White / Caucasian | 2,036 | 85.5% |
| Two or more Races | 252 | 10.6% |
| Some other Race | 51 | 2.1% |
| Total | 2,382 | 100.0% |
Ancestry in Rangely
The most populous ancestries reported in Rangely are German (422 | 17.7%), English (388 | 16.3%), Irish (205 | 8.6%), American (137 | 5.8%), and European (121 | 5.1%), together accounting for 53.4% of all Rangely residents.
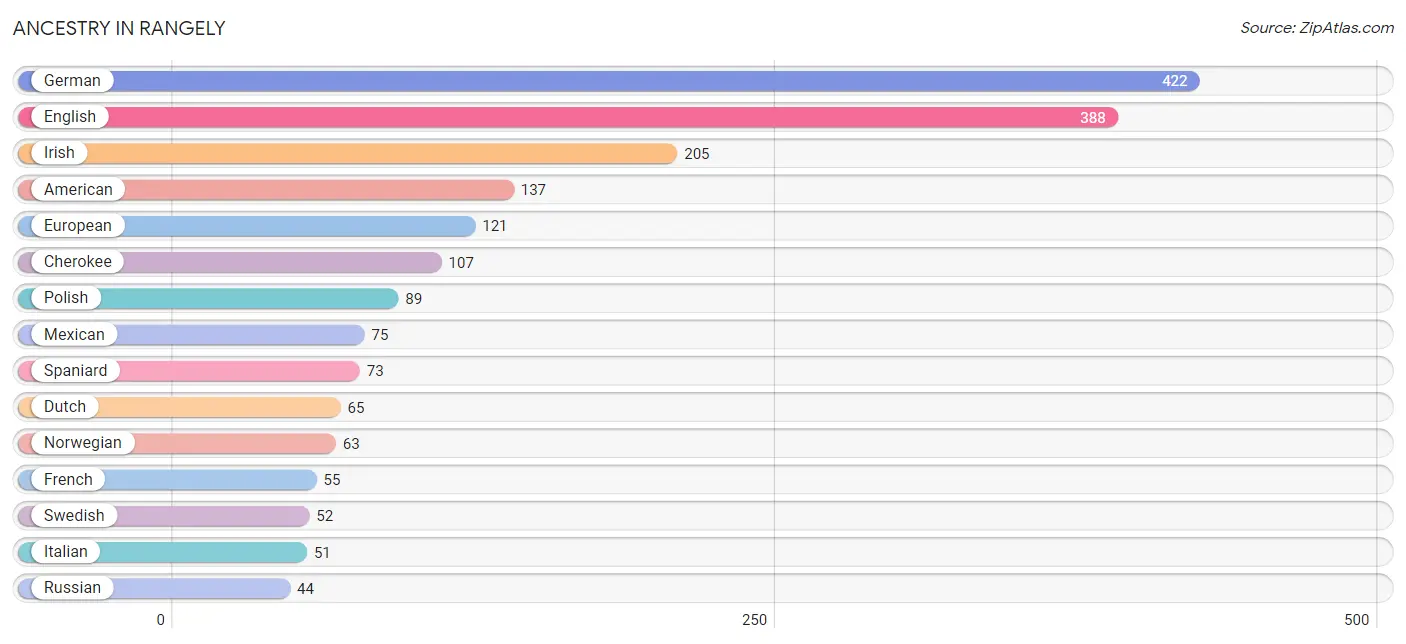
| Ancestry | # Population | % Population |
| American | 137 | 5.8% |
| Arab | 11 | 0.5% |
| Armenian | 7 | 0.3% |
| Austrian | 20 | 0.8% |
| Burmese | 6 | 0.3% |
| Canadian | 20 | 0.8% |
| Cherokee | 107 | 4.5% |
| Chippewa | 16 | 0.7% |
| Choctaw | 5 | 0.2% |
| Czechoslovakian | 11 | 0.5% |
| Danish | 6 | 0.3% |
| Dutch | 65 | 2.7% |
| Eastern European | 8 | 0.3% |
| Ecuadorian | 32 | 1.3% |
| English | 388 | 16.3% |
| European | 121 | 5.1% |
| Finnish | 9 | 0.4% |
| French | 55 | 2.3% |
| German | 422 | 17.7% |
| Irish | 205 | 8.6% |
| Italian | 51 | 2.1% |
| Kiowa | 4 | 0.2% |
| Latvian | 1 | 0.0% |
| Lebanese | 11 | 0.5% |
| Mexican | 75 | 3.2% |
| Northern European | 7 | 0.3% |
| Norwegian | 63 | 2.6% |
| Peruvian | 5 | 0.2% |
| Polish | 89 | 3.7% |
| Puerto Rican | 13 | 0.5% |
| Russian | 44 | 1.8% |
| Scandinavian | 12 | 0.5% |
| Scotch-Irish | 29 | 1.2% |
| Scottish | 25 | 1.1% |
| Seminole | 6 | 0.3% |
| Slavic | 12 | 0.5% |
| South American | 38 | 1.6% |
| Spaniard | 73 | 3.1% |
| Spanish | 7 | 0.3% |
| Spanish American | 7 | 0.3% |
| Spanish American Indian | 10 | 0.4% |
| Swedish | 52 | 2.2% |
| Swiss | 14 | 0.6% |
| Thai | 4 | 0.2% |
| Ute | 9 | 0.4% |
| Venezuelan | 1 | 0.0% |
| Welsh | 22 | 0.9% | View All 47 Rows |
Immigrants in Rangely
The most numerous immigrant groups reported in Rangely came from Central America (4 | 0.2%), Latin America (4 | 0.2%), Mexico (4 | 0.2%), Eastern Europe (2 | 0.1%), and Europe (2 | 0.1%), together accounting for 0.7% of all Rangely residents.
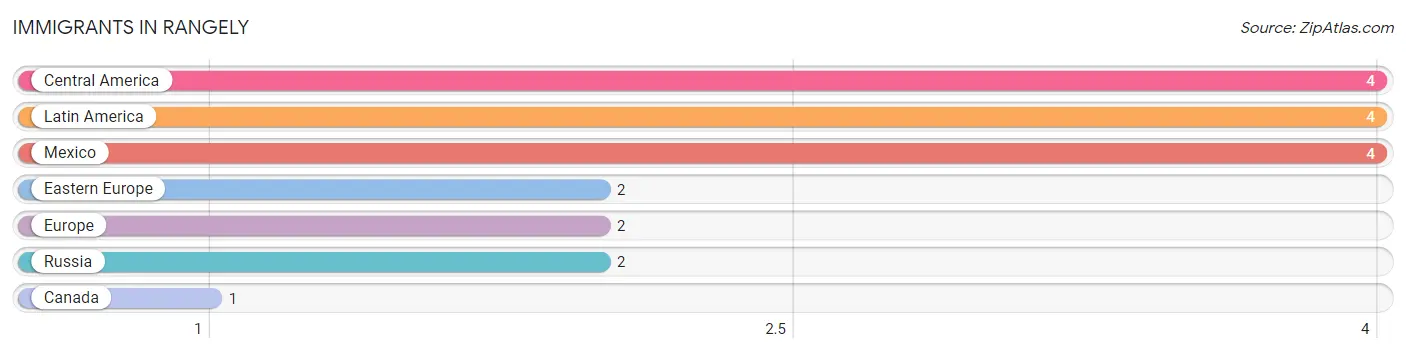
| Immigration Origin | # Population | % Population |
| Canada | 1 | 0.0% |
| Central America | 4 | 0.2% |
| Eastern Europe | 2 | 0.1% |
| Europe | 2 | 0.1% |
| Latin America | 4 | 0.2% |
| Mexico | 4 | 0.2% |
| Russia | 2 | 0.1% | View All 7 Rows |
Sex and Age in Rangely
Sex and Age in Rangely
The most populous age groups in Rangely are 15 to 19 Years (144 | 11.5%) for men and 55 to 59 Years (171 | 15.1%) for women.
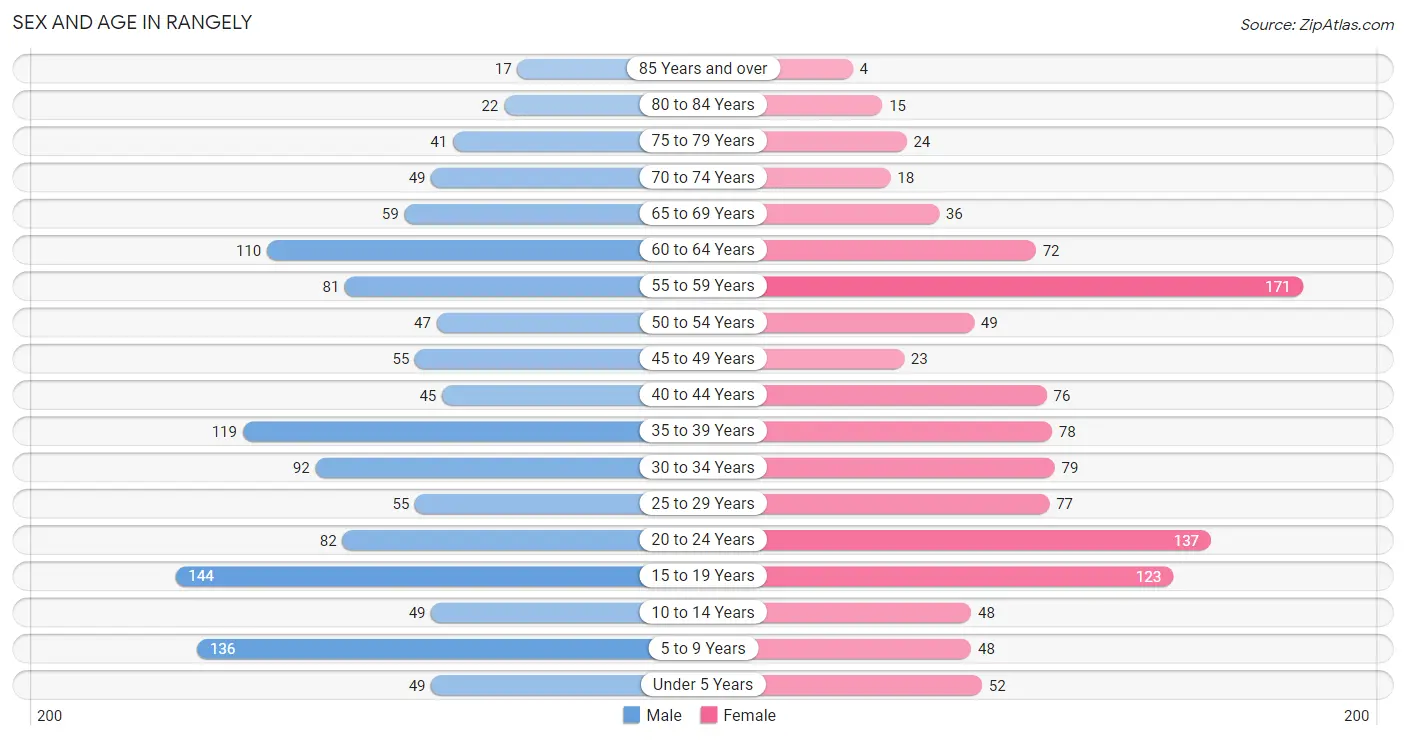
| Age Bracket | Male | Female |
| Under 5 Years | 49 (3.9%) | 52 (4.6%) |
| 5 to 9 Years | 136 (10.9%) | 48 (4.3%) |
| 10 to 14 Years | 49 (3.9%) | 48 (4.3%) |
| 15 to 19 Years | 144 (11.5%) | 123 (10.9%) |
| 20 to 24 Years | 82 (6.6%) | 137 (12.1%) |
| 25 to 29 Years | 55 (4.4%) | 77 (6.8%) |
| 30 to 34 Years | 92 (7.3%) | 79 (7.0%) |
| 35 to 39 Years | 119 (9.5%) | 78 (6.9%) |
| 40 to 44 Years | 45 (3.6%) | 76 (6.7%) |
| 45 to 49 Years | 55 (4.4%) | 23 (2.0%) |
| 50 to 54 Years | 47 (3.7%) | 49 (4.3%) |
| 55 to 59 Years | 81 (6.5%) | 171 (15.1%) |
| 60 to 64 Years | 110 (8.8%) | 72 (6.4%) |
| 65 to 69 Years | 59 (4.7%) | 36 (3.2%) |
| 70 to 74 Years | 49 (3.9%) | 18 (1.6%) |
| 75 to 79 Years | 41 (3.3%) | 24 (2.1%) |
| 80 to 84 Years | 22 (1.8%) | 15 (1.3%) |
| 85 Years and over | 17 (1.4%) | 4 (0.4%) |
| Total | 1,252 (100.0%) | 1,130 (100.0%) |
Families and Households in Rangely
Median Family Size in Rangely
The median family size in Rangely is 3.08 persons per family, with married-couple families (425 | 78.6%) accounting for the largest median family size of 3.16 persons per family. On the other hand, single male/father families (31 | 5.7%) represent the smallest median family size with 2.10 persons per family.
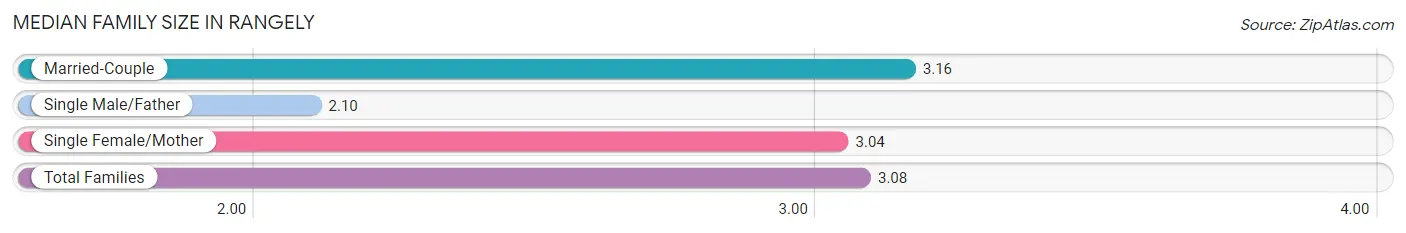
| Family Type | # Families | Family Size |
| Married-Couple | 425 (78.6%) | 3.16 |
| Single Male/Father | 31 (5.7%) | 2.10 |
| Single Female/Mother | 85 (15.7%) | 3.04 |
| Total Families | 541 (100.0%) | 3.08 |
Median Household Size in Rangely
The median household size in Rangely is 2.54 persons per household, with married-couple households (425 | 50.9%) accounting for the largest median household size of 3.19 persons per household. non-family households (294 | 35.2%) represent the smallest median household size with 1.43 persons per household.
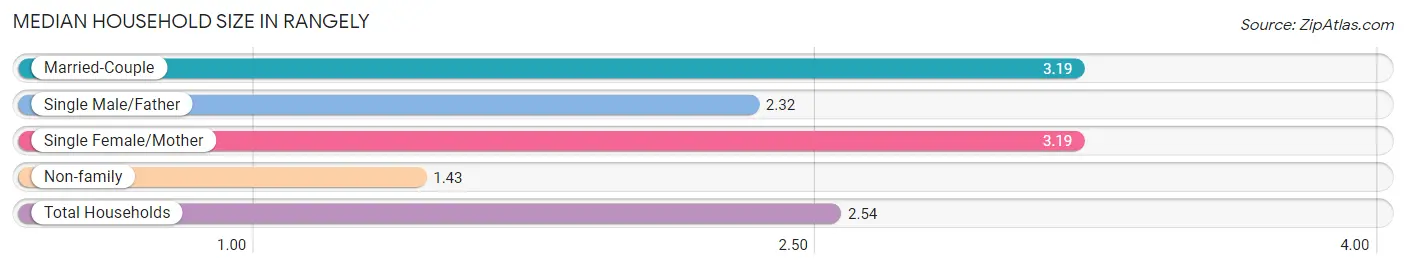
| Household Type | # Households | Household Size |
| Married-Couple | 425 (50.9%) | 3.19 |
| Single Male/Father | 31 (3.7%) | 2.32 |
| Single Female/Mother | 85 (10.2%) | 3.19 |
| Non-family | 294 (35.2%) | 1.43 |
| Total Households | 835 (100.0%) | 2.54 |
Household Size by Marriage Status in Rangely
Out of a total of 835 households in Rangely, 541 (64.8%) are family households, while 294 (35.2%) are nonfamily households. The most numerous type of family households are 2-person households, comprising 264, and the most common type of nonfamily households are 1-person households, comprising 209.
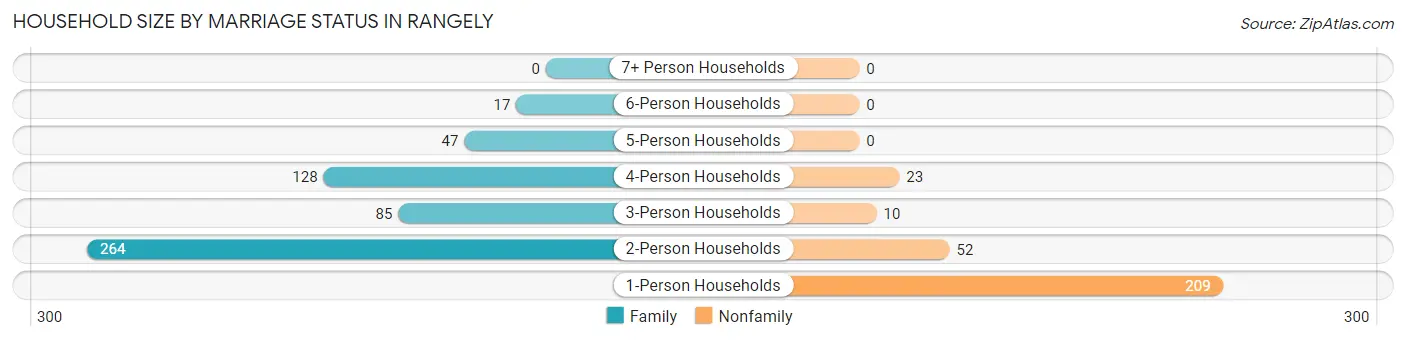
| Household Size | Family Households | Nonfamily Households |
| 1-Person Households | - | 209 (25.0%) |
| 2-Person Households | 264 (31.6%) | 52 (6.2%) |
| 3-Person Households | 85 (10.2%) | 10 (1.2%) |
| 4-Person Households | 128 (15.3%) | 23 (2.8%) |
| 5-Person Households | 47 (5.6%) | 0 (0.0%) |
| 6-Person Households | 17 (2.0%) | 0 (0.0%) |
| 7+ Person Households | 0 (0.0%) | 0 (0.0%) |
| Total | 541 (64.8%) | 294 (35.2%) |
Female Fertility in Rangely
Fertility by Age in Rangely
Average fertility rate in Rangely is 62.0 births per 1,000 women. Women in the age bracket of 35 to 50 years have the highest fertility rate with 82.0 births per 1,000 women. Women in the age bracket of 20 to 34 years acount for 57.9% of all women with births.
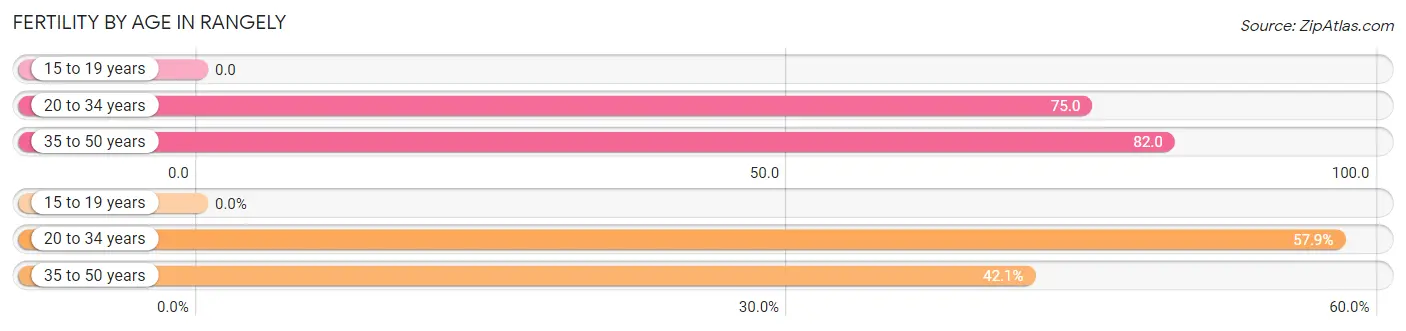
| Age Bracket | Women with Births | Births / 1,000 Women |
| 15 to 19 years | 0 (0.0%) | 0.0 |
| 20 to 34 years | 22 (57.9%) | 75.0 |
| 35 to 50 years | 16 (42.1%) | 82.0 |
| Total | 38 (100.0%) | 62.0 |
Fertility by Age by Marriage Status in Rangely
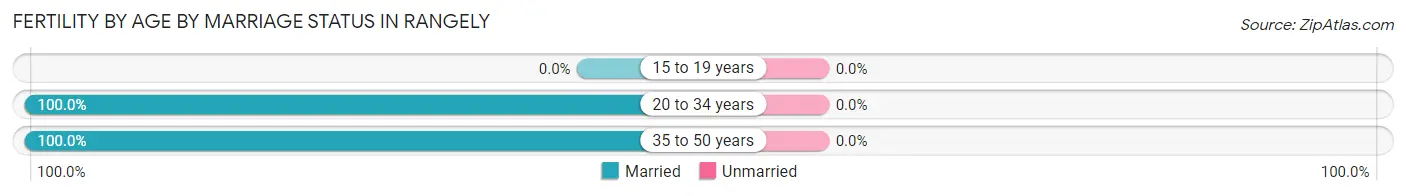
| Age Bracket | Married | Unmarried |
| 15 to 19 years | 0 (0.0%) | 0 (0.0%) |
| 20 to 34 years | 22 (100.0%) | 0 (0.0%) |
| 35 to 50 years | 16 (100.0%) | 0 (0.0%) |
| Total | 38 (100.0%) | 0 (0.0%) |
Fertility by Education in Rangely
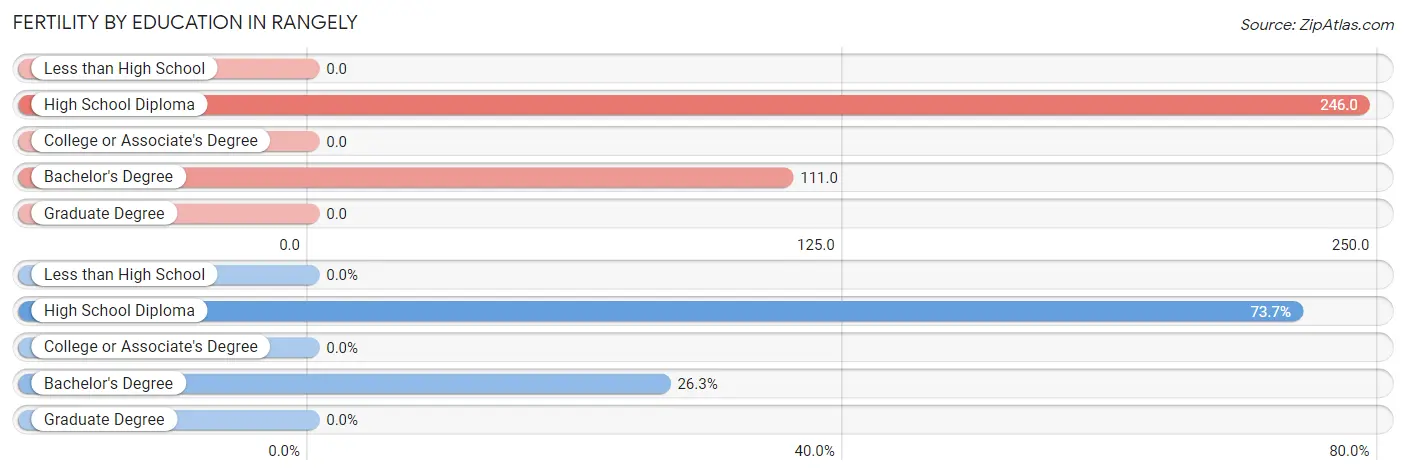
| Educational Attainment | Women with Births | Births / 1,000 Women |
| Less than High School | 0 (0.0%) | 0.0 |
| High School Diploma | 28 (73.7%) | 246.0 |
| College or Associate's Degree | 0 (0.0%) | 0.0 |
| Bachelor's Degree | 10 (26.3%) | 111.0 |
| Graduate Degree | 0 (0.0%) | 0.0 |
| Total | 38 (100.0%) | 62.0 |
Fertility by Education by Marriage Status in Rangely
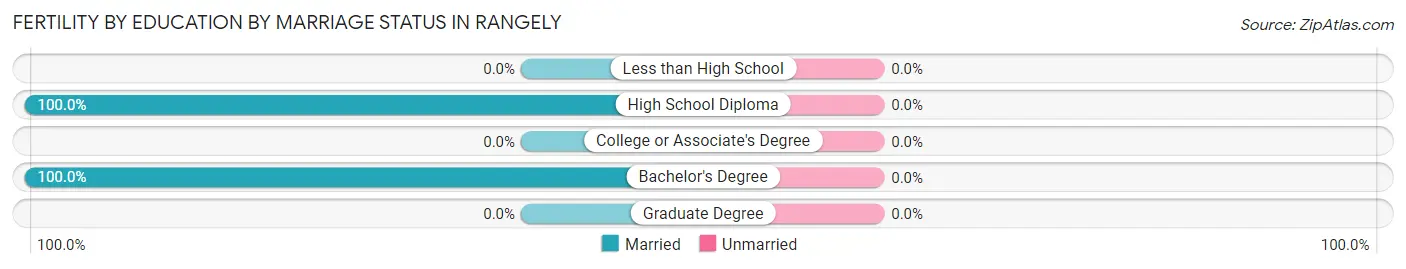
| Educational Attainment | Married | Unmarried |
| Less than High School | 0 (0.0%) | 0 (0.0%) |
| High School Diploma | 28 (100.0%) | 0 (0.0%) |
| College or Associate's Degree | 0 (0.0%) | 0 (0.0%) |
| Bachelor's Degree | 10 (100.0%) | 0 (0.0%) |
| Graduate Degree | 0 (0.0%) | 0 (0.0%) |
| Total | 38 (100.0%) | 0 (0.0%) |
Employment Characteristics in Rangely
Employment by Class of Employer in Rangely
Among the 1,141 employed individuals in Rangely, private company employees (776 | 68.0%), local government employees (142 | 12.4%), and self-employed (not incorporated) (66 | 5.8%) make up the most common classes of employment.
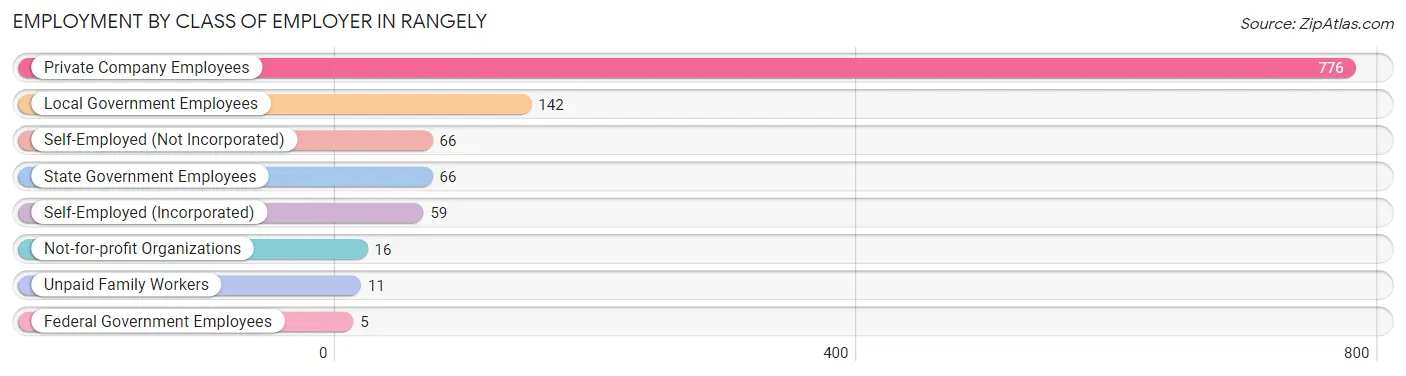
| Employer Class | # Employees | % Employees |
| Private Company Employees | 776 | 68.0% |
| Self-Employed (Incorporated) | 59 | 5.2% |
| Self-Employed (Not Incorporated) | 66 | 5.8% |
| Not-for-profit Organizations | 16 | 1.4% |
| Local Government Employees | 142 | 12.4% |
| State Government Employees | 66 | 5.8% |
| Federal Government Employees | 5 | 0.4% |
| Unpaid Family Workers | 11 | 1.0% |
| Total | 1,141 | 100.0% |
Employment Status by Age in Rangely
According to the labor force statistics for Rangely, out of the total population over 16 years of age (1,998), 61.5% or 1,229 individuals are in the labor force, with 6.5% or 80 of them unemployed. The age group with the highest labor force participation rate is 30 to 34 years, with 80.7% or 138 individuals in the labor force. Within the labor force, the 25 to 29 years age range has the highest percentage of unemployed individuals, with 24.3% or 18 of them being unemployed.
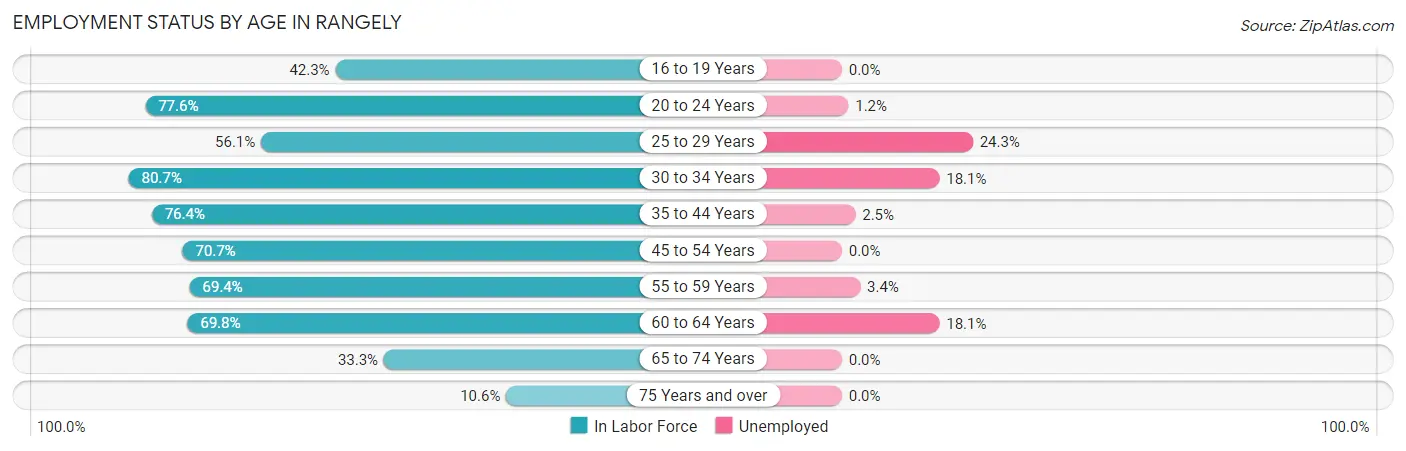
| Age Bracket | In Labor Force | Unemployed |
| 16 to 19 Years | 112 (42.3%) | 0 (0.0%) |
| 20 to 24 Years | 170 (77.6%) | 2 (1.2%) |
| 25 to 29 Years | 74 (56.1%) | 18 (24.3%) |
| 30 to 34 Years | 138 (80.7%) | 25 (18.1%) |
| 35 to 44 Years | 243 (76.4%) | 6 (2.5%) |
| 45 to 54 Years | 123 (70.7%) | 0 (0.0%) |
| 55 to 59 Years | 175 (69.4%) | 6 (3.4%) |
| 60 to 64 Years | 127 (69.8%) | 23 (18.1%) |
| 65 to 74 Years | 54 (33.3%) | 0 (0.0%) |
| 75 Years and over | 13 (10.6%) | 0 (0.0%) |
| Total | 1,229 (61.5%) | 80 (6.5%) |
Employment Status by Educational Attainment in Rangely
According to labor force statistics for Rangely, 71.6% of individuals (880) out of the total population between 25 and 64 years of age (1,229) are in the labor force, with 8.9% or 78 of them being unemployed. The group with the highest labor force participation rate are those with the educational attainment of bachelor's degree or higher, with 81.3% or 148 individuals in the labor force. Within the labor force, individuals with bachelor's degree or higher education have the highest percentage of unemployment, with 18.2% or 27 of them being unemployed.
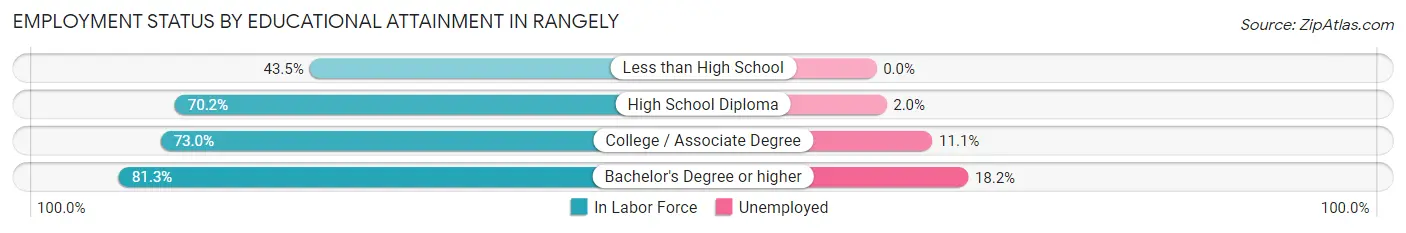
| Educational Attainment | In Labor Force | Unemployed |
| Less than High School | 30 (43.5%) | 0 (0.0%) |
| High School Diploma | 297 (70.2%) | 8 (2.0%) |
| College / Associate Degree | 405 (73.0%) | 62 (11.1%) |
| Bachelor's Degree or higher | 148 (81.3%) | 33 (18.2%) |
| Total | 880 (71.6%) | 109 (8.9%) |
Employment Occupations by Sex in Rangely
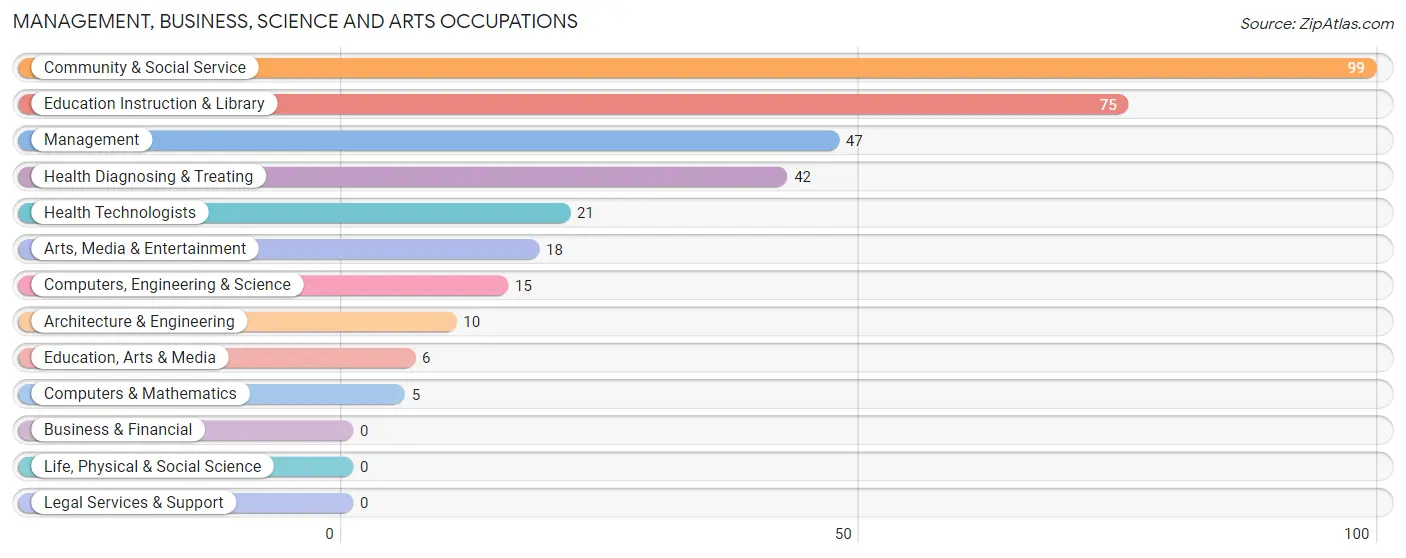
Management, Business, Science and Arts Occupations
The most common Management, Business, Science and Arts occupations in Rangely are Community & Social Service (99 | 8.6%), Education Instruction & Library (75 | 6.5%), Management (47 | 4.1%), Health Diagnosing & Treating (42 | 3.7%), and Health Technologists (21 | 1.8%).
Management, Business, Science and Arts Occupations by Sex
Within the Management, Business, Science and Arts occupations in Rangely, the most male-oriented occupations are Arts, Media & Entertainment (100.0%), Community & Social Service (54.5%), and Education Instruction & Library (48.0%), while the most female-oriented occupations are Computers, Engineering & Science (100.0%), Computers & Mathematics (100.0%), and Architecture & Engineering (100.0%).
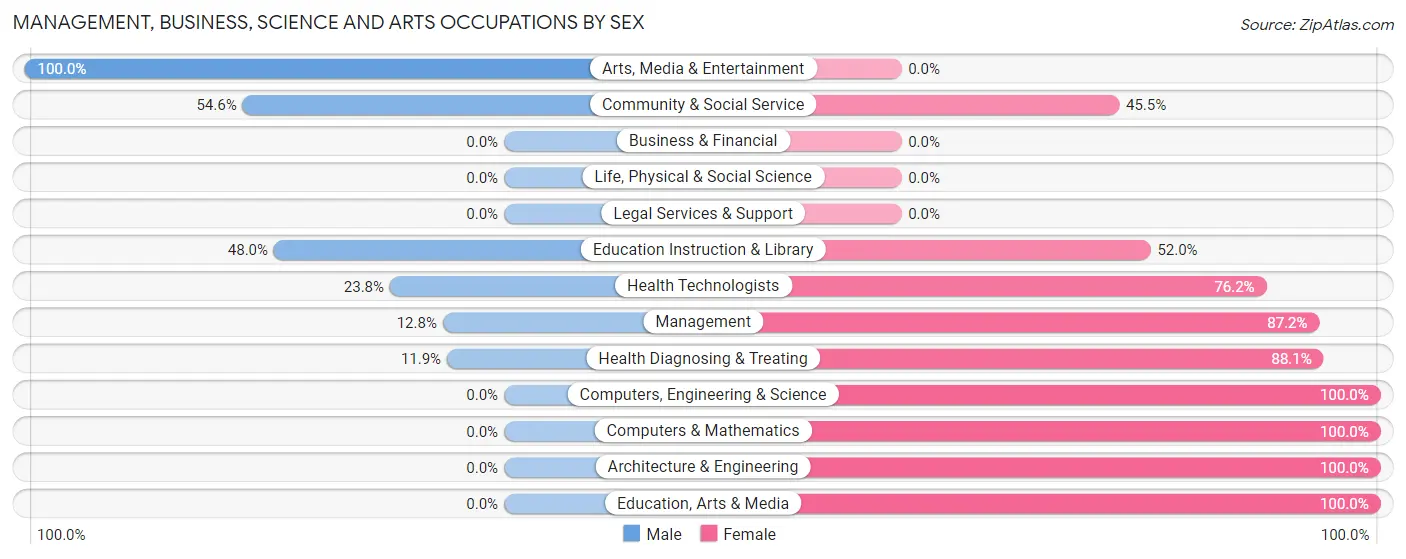
| Occupation | Male | Female |
| Management | 6 (12.8%) | 41 (87.2%) |
| Business & Financial | 0 (0.0%) | 0 (0.0%) |
| Computers, Engineering & Science | 0 (0.0%) | 15 (100.0%) |
| Computers & Mathematics | 0 (0.0%) | 5 (100.0%) |
| Architecture & Engineering | 0 (0.0%) | 10 (100.0%) |
| Life, Physical & Social Science | 0 (0.0%) | 0 (0.0%) |
| Community & Social Service | 54 (54.5%) | 45 (45.5%) |
| Education, Arts & Media | 0 (0.0%) | 6 (100.0%) |
| Legal Services & Support | 0 (0.0%) | 0 (0.0%) |
| Education Instruction & Library | 36 (48.0%) | 39 (52.0%) |
| Arts, Media & Entertainment | 18 (100.0%) | 0 (0.0%) |
| Health Diagnosing & Treating | 5 (11.9%) | 37 (88.1%) |
| Health Technologists | 5 (23.8%) | 16 (76.2%) |
| Total (Category) | 65 (32.0%) | 138 (68.0%) |
| Total (Overall) | 638 (55.5%) | 511 (44.5%) |
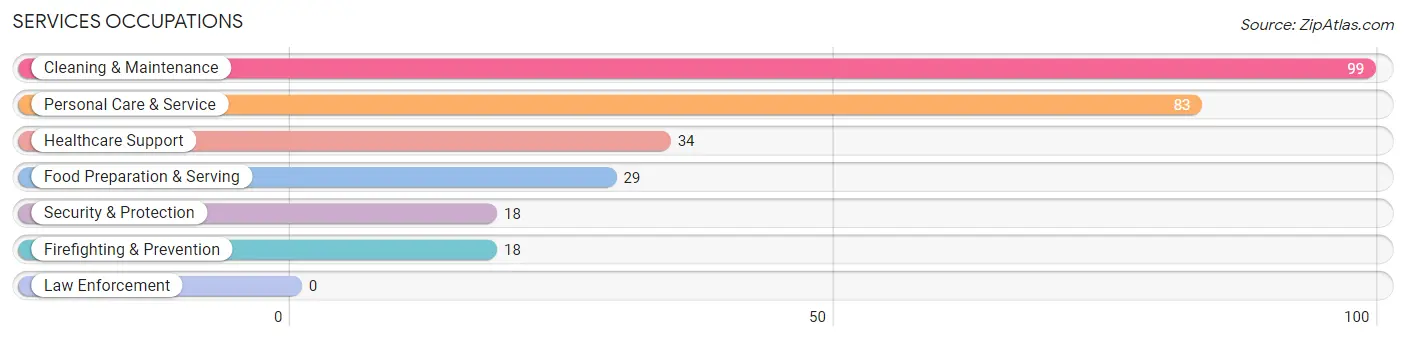
Services Occupations
The most common Services occupations in Rangely are Cleaning & Maintenance (99 | 8.6%), Personal Care & Service (83 | 7.2%), Healthcare Support (34 | 3.0%), Food Preparation & Serving (29 | 2.5%), and Security & Protection (18 | 1.6%).
Services Occupations by Sex
Within the Services occupations in Rangely, the most male-oriented occupations are Food Preparation & Serving (69.0%), Cleaning & Maintenance (53.5%), and Personal Care & Service (6.0%), while the most female-oriented occupations are Healthcare Support (100.0%), Security & Protection (100.0%), and Firefighting & Prevention (100.0%).
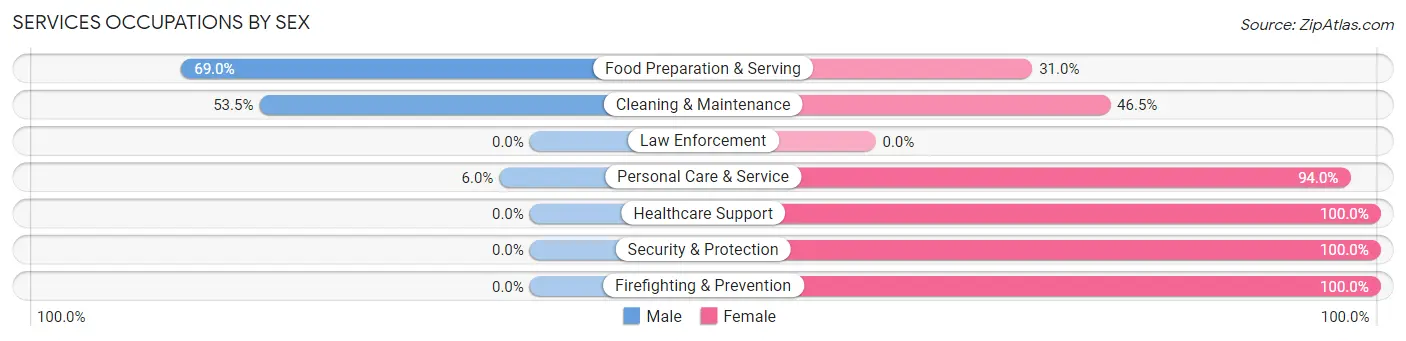
| Occupation | Male | Female |
| Healthcare Support | 0 (0.0%) | 34 (100.0%) |
| Security & Protection | 0 (0.0%) | 18 (100.0%) |
| Firefighting & Prevention | 0 (0.0%) | 18 (100.0%) |
| Law Enforcement | 0 (0.0%) | 0 (0.0%) |
| Food Preparation & Serving | 20 (69.0%) | 9 (31.0%) |
| Cleaning & Maintenance | 53 (53.5%) | 46 (46.5%) |
| Personal Care & Service | 5 (6.0%) | 78 (94.0%) |
| Total (Category) | 78 (29.7%) | 185 (70.3%) |
| Total (Overall) | 638 (55.5%) | 511 (44.5%) |
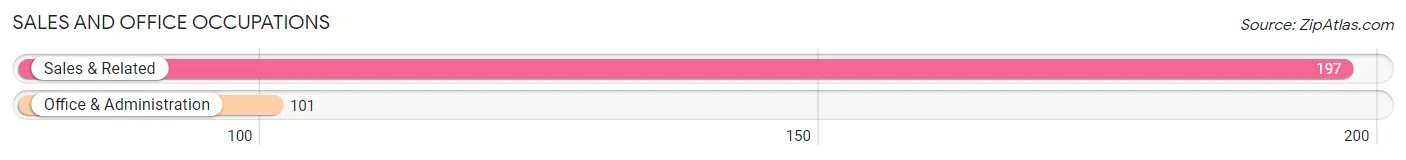
Sales and Office Occupations
The most common Sales and Office occupations in Rangely are Sales & Related (197 | 17.2%), and Office & Administration (101 | 8.8%).
Sales and Office Occupations by Sex
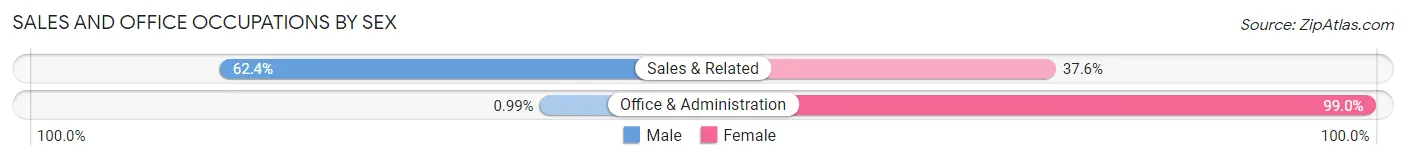
| Occupation | Male | Female |
| Sales & Related | 123 (62.4%) | 74 (37.6%) |
| Office & Administration | 1 (1.0%) | 100 (99.0%) |
| Total (Category) | 124 (41.6%) | 174 (58.4%) |
| Total (Overall) | 638 (55.5%) | 511 (44.5%) |
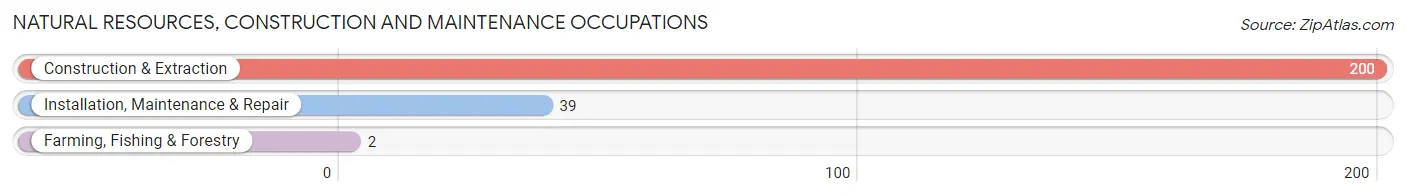
Natural Resources, Construction and Maintenance Occupations
The most common Natural Resources, Construction and Maintenance occupations in Rangely are Construction & Extraction (200 | 17.4%), Installation, Maintenance & Repair (39 | 3.4%), and Farming, Fishing & Forestry (2 | 0.2%).
Natural Resources, Construction and Maintenance Occupations by Sex
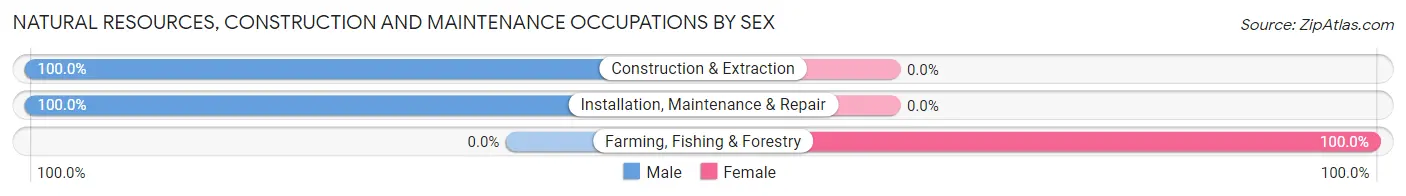
| Occupation | Male | Female |
| Farming, Fishing & Forestry | 0 (0.0%) | 2 (100.0%) |
| Construction & Extraction | 200 (100.0%) | 0 (0.0%) |
| Installation, Maintenance & Repair | 39 (100.0%) | 0 (0.0%) |
| Total (Category) | 239 (99.2%) | 2 (0.8%) |
| Total (Overall) | 638 (55.5%) | 511 (44.5%) |
Production, Transportation and Moving Occupations
The most common Production, Transportation and Moving occupations in Rangely are Production (85 | 7.4%), Transportation (40 | 3.5%), and Material Moving (19 | 1.7%).
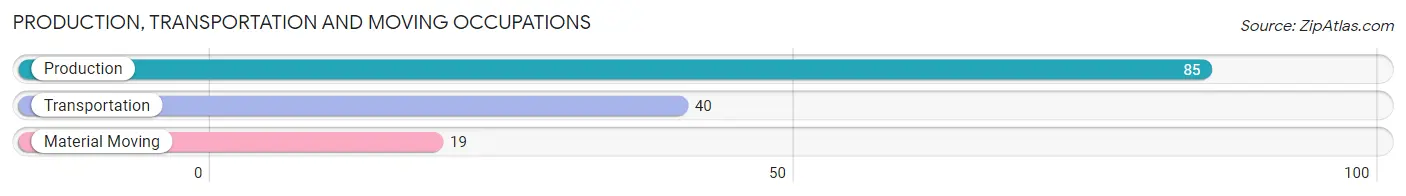
Production, Transportation and Moving Occupations by Sex
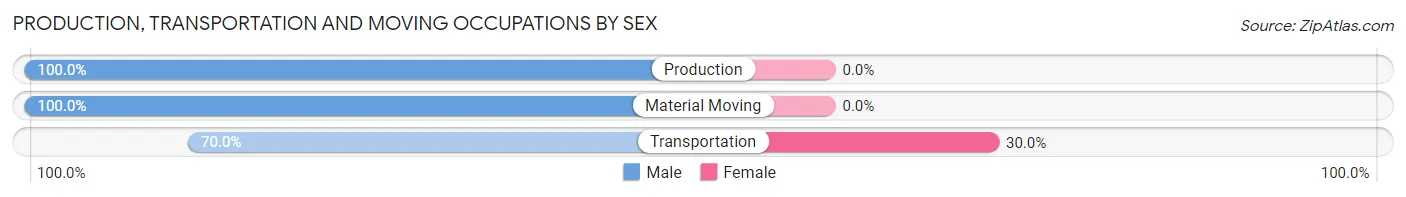
| Occupation | Male | Female |
| Production | 85 (100.0%) | 0 (0.0%) |
| Transportation | 28 (70.0%) | 12 (30.0%) |
| Material Moving | 19 (100.0%) | 0 (0.0%) |
| Total (Category) | 132 (91.7%) | 12 (8.3%) |
| Total (Overall) | 638 (55.5%) | 511 (44.5%) |
Employment Industries by Sex in Rangely
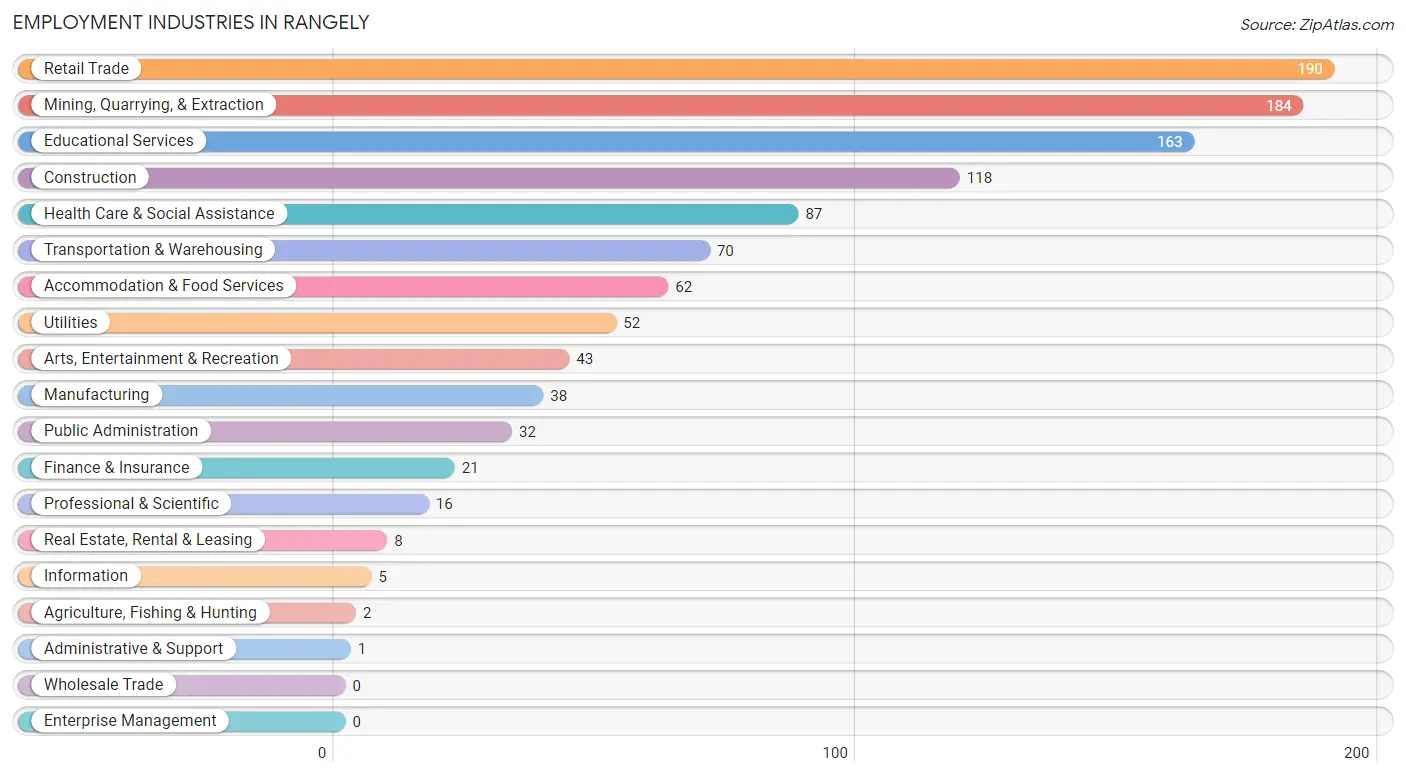
Employment Industries in Rangely
The major employment industries in Rangely include Retail Trade (190 | 16.5%), Mining, Quarrying, & Extraction (184 | 16.0%), Educational Services (163 | 14.2%), Construction (118 | 10.3%), and Health Care & Social Assistance (87 | 7.6%).
Employment Industries by Sex in Rangely
The Rangely industries that see more men than women are Manufacturing (100.0%), Real Estate, Rental & Leasing (100.0%), and Mining, Quarrying, & Extraction (89.7%), whereas the industries that tend to have a higher number of women are Agriculture, Fishing & Hunting (100.0%), Information (100.0%), and Finance & Insurance (100.0%).
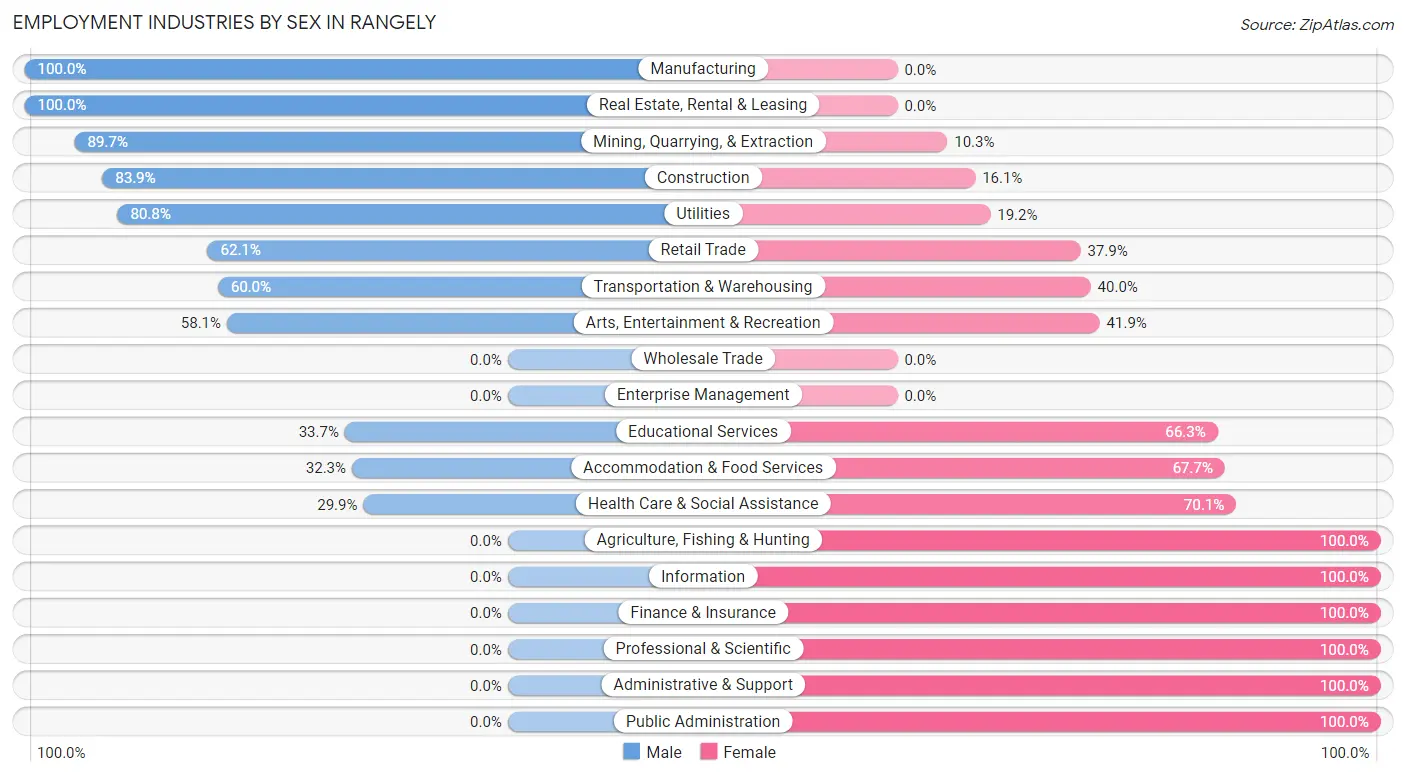
| Industry | Male | Female |
| Agriculture, Fishing & Hunting | 0 (0.0%) | 2 (100.0%) |
| Mining, Quarrying, & Extraction | 165 (89.7%) | 19 (10.3%) |
| Construction | 99 (83.9%) | 19 (16.1%) |
| Manufacturing | 38 (100.0%) | 0 (0.0%) |
| Wholesale Trade | 0 (0.0%) | 0 (0.0%) |
| Retail Trade | 118 (62.1%) | 72 (37.9%) |
| Transportation & Warehousing | 42 (60.0%) | 28 (40.0%) |
| Utilities | 42 (80.8%) | 10 (19.2%) |
| Information | 0 (0.0%) | 5 (100.0%) |
| Finance & Insurance | 0 (0.0%) | 21 (100.0%) |
| Real Estate, Rental & Leasing | 8 (100.0%) | 0 (0.0%) |
| Professional & Scientific | 0 (0.0%) | 16 (100.0%) |
| Enterprise Management | 0 (0.0%) | 0 (0.0%) |
| Administrative & Support | 0 (0.0%) | 1 (100.0%) |
| Educational Services | 55 (33.7%) | 108 (66.3%) |
| Health Care & Social Assistance | 26 (29.9%) | 61 (70.1%) |
| Arts, Entertainment & Recreation | 25 (58.1%) | 18 (41.9%) |
| Accommodation & Food Services | 20 (32.3%) | 42 (67.7%) |
| Public Administration | 0 (0.0%) | 32 (100.0%) |
| Total | 638 (55.5%) | 511 (44.5%) |
Education in Rangely
School Enrollment in Rangely
The most common levels of schooling among the 725 students in Rangely are college / undergraduate (265 | 36.5%), high school (117 | 16.1%), and elementary school (105 | 14.5%).
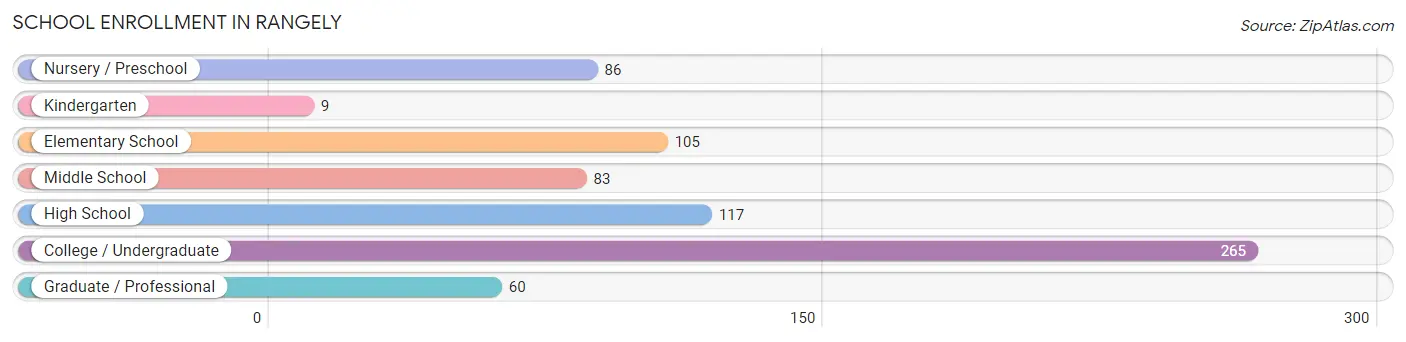
| School Level | # Students | % Students |
| Nursery / Preschool | 86 | 11.9% |
| Kindergarten | 9 | 1.2% |
| Elementary School | 105 | 14.5% |
| Middle School | 83 | 11.5% |
| High School | 117 | 16.1% |
| College / Undergraduate | 265 | 36.5% |
| Graduate / Professional | 60 | 8.3% |
| Total | 725 | 100.0% |
School Enrollment by Age by Funding Source in Rangely
Out of a total of 725 students who are enrolled in schools in Rangely, 68 (9.4%) attend a private institution, while the remaining 657 (90.6%) are enrolled in public schools. The age group of 18 to 19 year olds has the highest likelihood of being enrolled in private schools, with 31 (19.8% in the age bracket) enrolled. Conversely, the age group of 3 to 4 year olds has the lowest likelihood of being enrolled in a private school, with 18 (100.0% in the age bracket) attending a public institution.
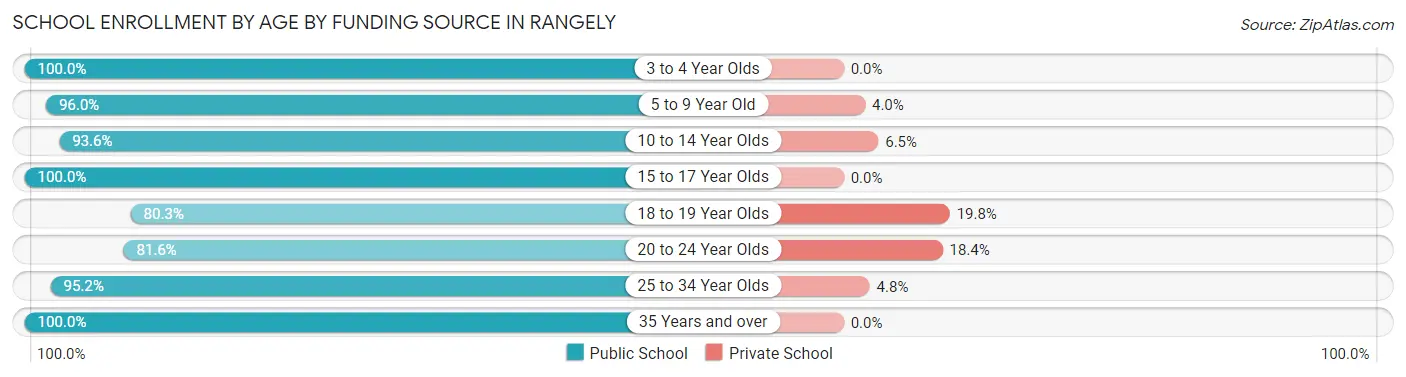
| Age Bracket | Public School | Private School |
| 3 to 4 Year Olds | 18 (100.0%) | 0 (0.0%) |
| 5 to 9 Year Old | 169 (96.0%) | 7 (4.0%) |
| 10 to 14 Year Olds | 87 (93.5%) | 6 (6.5%) |
| 15 to 17 Year Olds | 100 (100.0%) | 0 (0.0%) |
| 18 to 19 Year Olds | 126 (80.2%) | 31 (19.8%) |
| 20 to 24 Year Olds | 93 (81.6%) | 21 (18.4%) |
| 25 to 34 Year Olds | 59 (95.2%) | 3 (4.8%) |
| 35 Years and over | 5 (100.0%) | 0 (0.0%) |
| Total | 657 (90.6%) | 68 (9.4%) |
Educational Attainment by Field of Study in Rangely
Bio, nature & agricultural (46 | 16.6%), arts & humanities (42 | 15.1%), education (36 | 13.0%), literature & languages (36 | 13.0%), and communications (22 | 7.9%) are the most common fields of study among 278 individuals in Rangely who have obtained a bachelor's degree or higher.
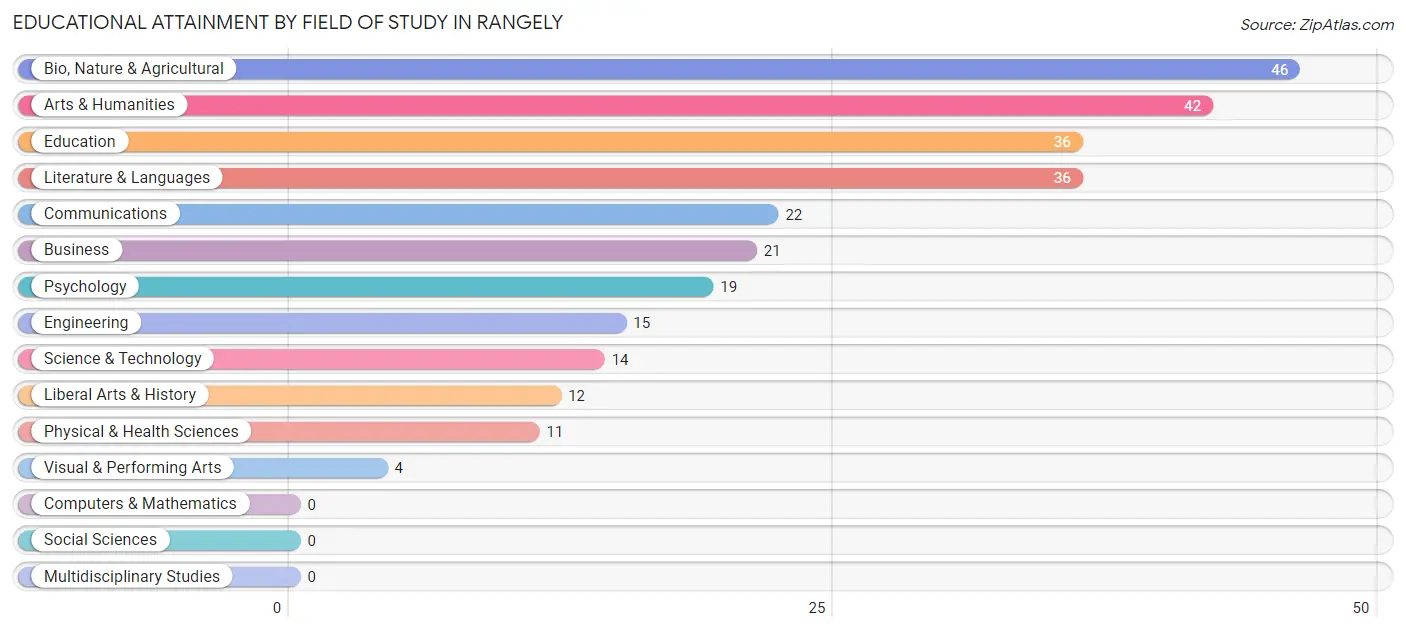
| Field of Study | # Graduates | % Graduates |
| Computers & Mathematics | 0 | 0.0% |
| Bio, Nature & Agricultural | 46 | 16.6% |
| Physical & Health Sciences | 11 | 4.0% |
| Psychology | 19 | 6.8% |
| Social Sciences | 0 | 0.0% |
| Engineering | 15 | 5.4% |
| Multidisciplinary Studies | 0 | 0.0% |
| Science & Technology | 14 | 5.0% |
| Business | 21 | 7.5% |
| Education | 36 | 13.0% |
| Literature & Languages | 36 | 13.0% |
| Liberal Arts & History | 12 | 4.3% |
| Visual & Performing Arts | 4 | 1.4% |
| Communications | 22 | 7.9% |
| Arts & Humanities | 42 | 15.1% |
| Total | 278 | 100.0% |
Transportation & Commute in Rangely
Vehicle Availability by Sex in Rangely
The most prevalent vehicle ownership categories in Rangely are males with 2 vehicles (275, accounting for 44.1%) and females with 2 vehicles (168, making up 60.2%).
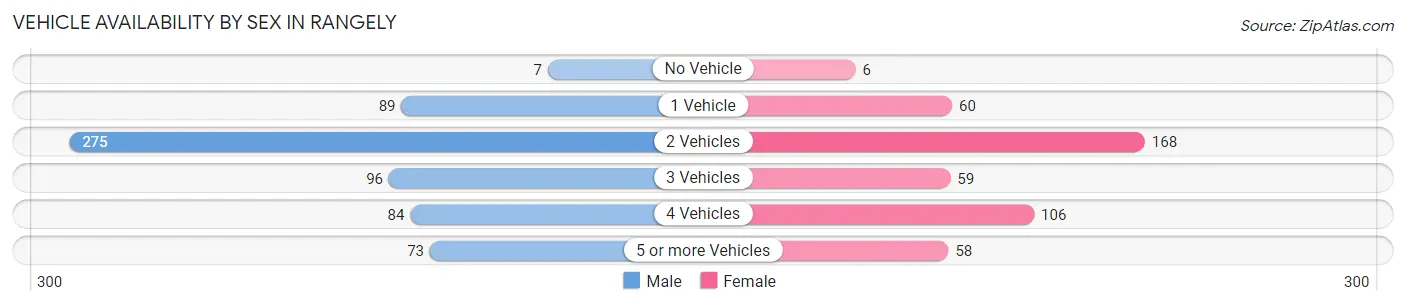
| Vehicles Available | Male | Female |
| No Vehicle | 7 (1.1%) | 6 (1.3%) |
| 1 Vehicle | 89 (14.3%) | 60 (13.1%) |
| 2 Vehicles | 275 (44.1%) | 168 (36.8%) |
| 3 Vehicles | 96 (15.4%) | 59 (12.9%) |
| 4 Vehicles | 84 (13.5%) | 106 (23.2%) |
| 5 or more Vehicles | 73 (11.7%) | 58 (12.7%) |
| Total | 624 (100.0%) | 457 (100.0%) |
Commute Time in Rangely
The most frequently occuring commute durations in Rangely are 5 to 9 minutes (496 commuters, 45.6%), less than 5 minutes (262 commuters, 24.1%), and 15 to 19 minutes (101 commuters, 9.3%).
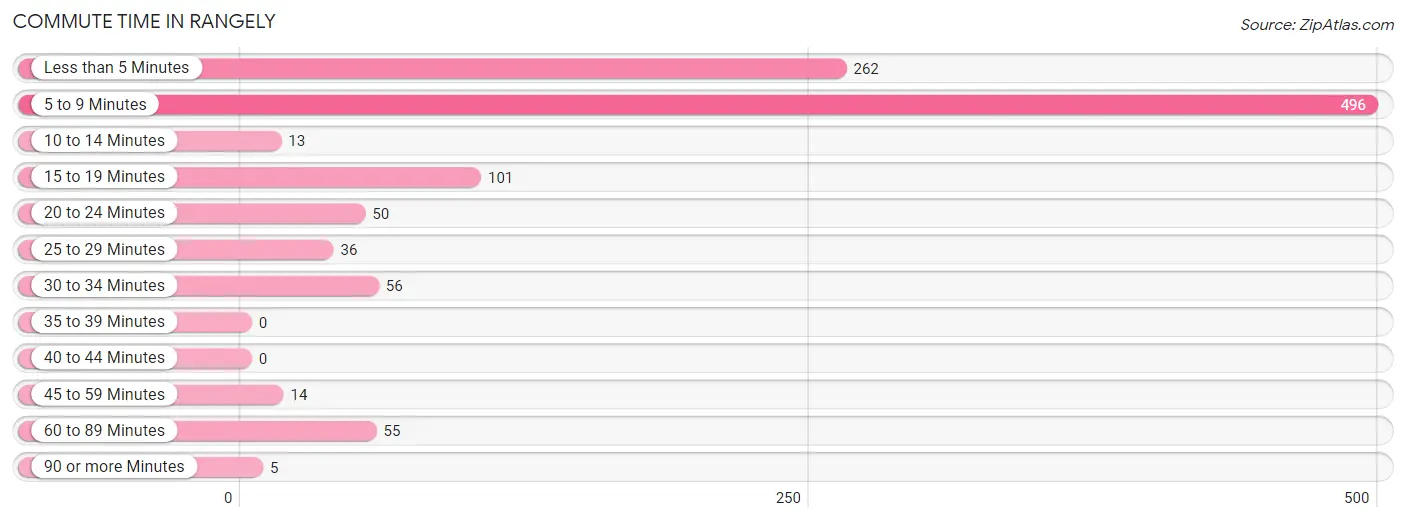
| Commute Time | # Commuters | % Commuters |
| Less than 5 Minutes | 262 | 24.1% |
| 5 to 9 Minutes | 496 | 45.6% |
| 10 to 14 Minutes | 13 | 1.2% |
| 15 to 19 Minutes | 101 | 9.3% |
| 20 to 24 Minutes | 50 | 4.6% |
| 25 to 29 Minutes | 36 | 3.3% |
| 30 to 34 Minutes | 56 | 5.1% |
| 35 to 39 Minutes | 0 | 0.0% |
| 40 to 44 Minutes | 0 | 0.0% |
| 45 to 59 Minutes | 14 | 1.3% |
| 60 to 89 Minutes | 55 | 5.1% |
| 90 or more Minutes | 5 | 0.5% |
Commute Time by Sex in Rangely
The most common commute times in Rangely are 5 to 9 minutes (212 commuters, 34.3%) for males and 5 to 9 minutes (284 commuters, 60.6%) for females.
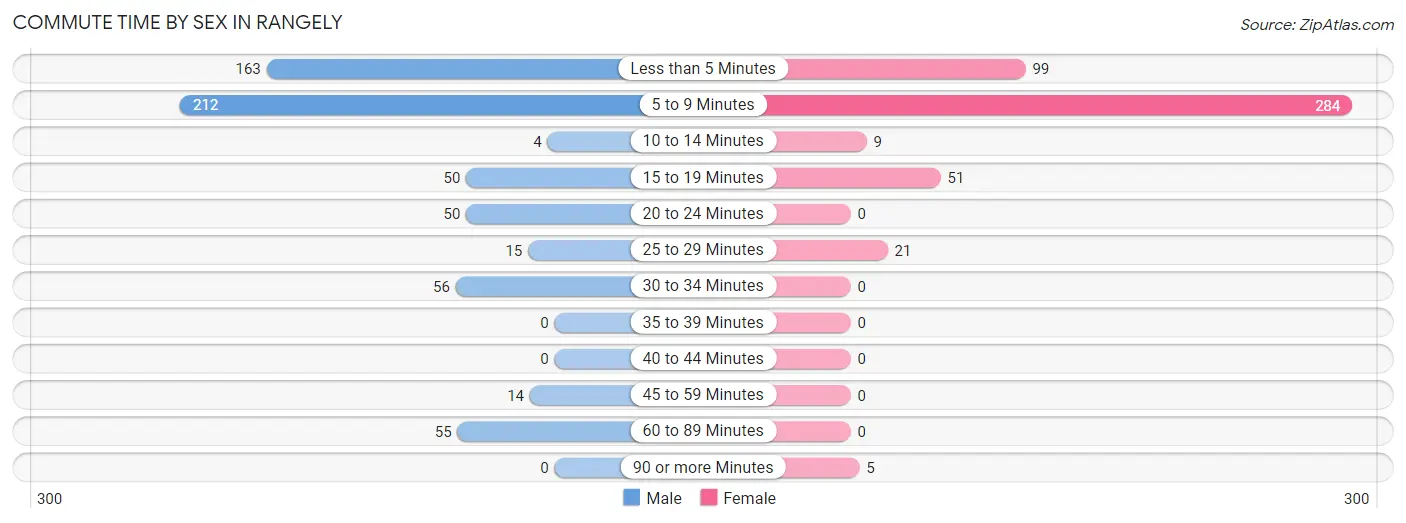
| Commute Time | Male | Female |
| Less than 5 Minutes | 163 (26.3%) | 99 (21.1%) |
| 5 to 9 Minutes | 212 (34.3%) | 284 (60.6%) |
| 10 to 14 Minutes | 4 (0.6%) | 9 (1.9%) |
| 15 to 19 Minutes | 50 (8.1%) | 51 (10.9%) |
| 20 to 24 Minutes | 50 (8.1%) | 0 (0.0%) |
| 25 to 29 Minutes | 15 (2.4%) | 21 (4.5%) |
| 30 to 34 Minutes | 56 (9.0%) | 0 (0.0%) |
| 35 to 39 Minutes | 0 (0.0%) | 0 (0.0%) |
| 40 to 44 Minutes | 0 (0.0%) | 0 (0.0%) |
| 45 to 59 Minutes | 14 (2.3%) | 0 (0.0%) |
| 60 to 89 Minutes | 55 (8.9%) | 0 (0.0%) |
| 90 or more Minutes | 0 (0.0%) | 5 (1.1%) |
Time of Departure to Work by Sex in Rangely
The most frequent times of departure to work in Rangely are 5:30 AM to 5:59 AM (93, 15.0%) for males and 7:30 AM to 7:59 AM (104, 22.2%) for females.
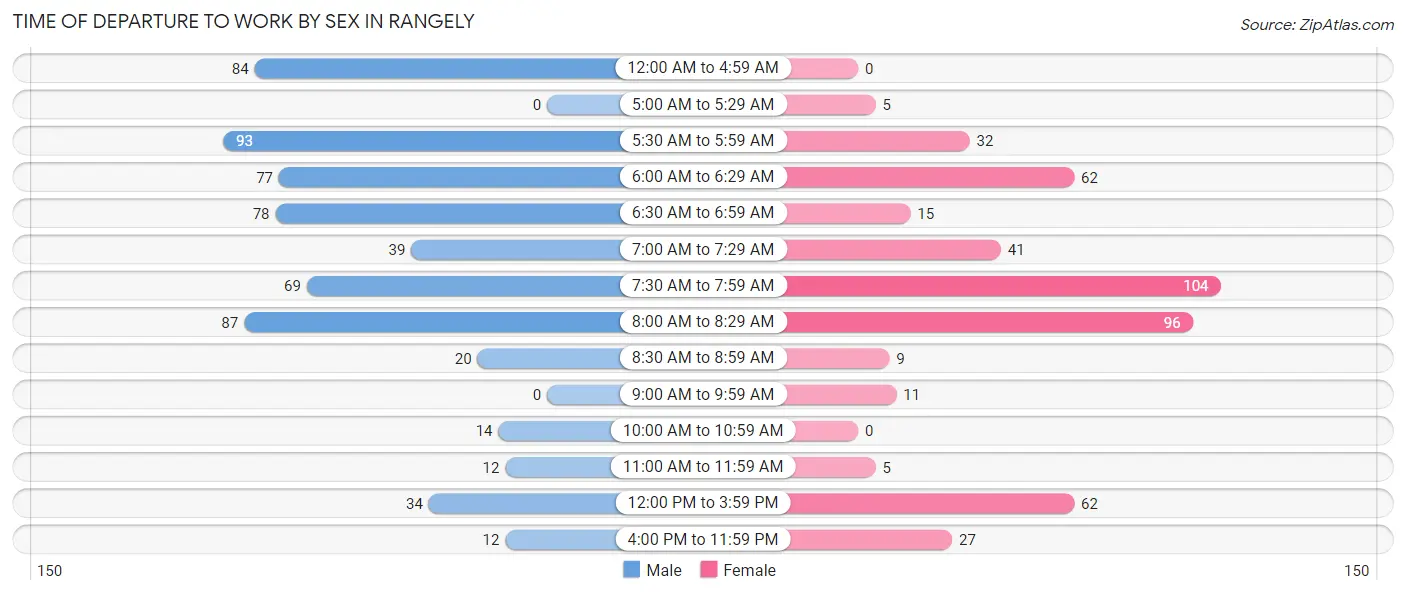
| Time of Departure | Male | Female |
| 12:00 AM to 4:59 AM | 84 (13.6%) | 0 (0.0%) |
| 5:00 AM to 5:29 AM | 0 (0.0%) | 5 (1.1%) |
| 5:30 AM to 5:59 AM | 93 (15.0%) | 32 (6.8%) |
| 6:00 AM to 6:29 AM | 77 (12.4%) | 62 (13.2%) |
| 6:30 AM to 6:59 AM | 78 (12.6%) | 15 (3.2%) |
| 7:00 AM to 7:29 AM | 39 (6.3%) | 41 (8.7%) |
| 7:30 AM to 7:59 AM | 69 (11.2%) | 104 (22.2%) |
| 8:00 AM to 8:29 AM | 87 (14.1%) | 96 (20.5%) |
| 8:30 AM to 8:59 AM | 20 (3.2%) | 9 (1.9%) |
| 9:00 AM to 9:59 AM | 0 (0.0%) | 11 (2.4%) |
| 10:00 AM to 10:59 AM | 14 (2.3%) | 0 (0.0%) |
| 11:00 AM to 11:59 AM | 12 (1.9%) | 5 (1.1%) |
| 12:00 PM to 3:59 PM | 34 (5.5%) | 62 (13.2%) |
| 4:00 PM to 11:59 PM | 12 (1.9%) | 27 (5.8%) |
| Total | 619 (100.0%) | 469 (100.0%) |
Housing Occupancy in Rangely
Occupancy by Ownership in Rangely
Of the total 835 dwellings in Rangely, owner-occupied units account for 666 (79.8%), while renter-occupied units make up 169 (20.2%).
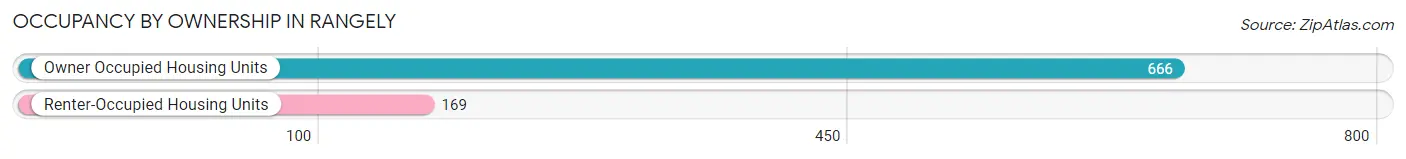
| Occupancy | # Housing Units | % Housing Units |
| Owner Occupied Housing Units | 666 | 79.8% |
| Renter-Occupied Housing Units | 169 | 20.2% |
| Total Occupied Housing Units | 835 | 100.0% |
Occupancy by Household Size in Rangely
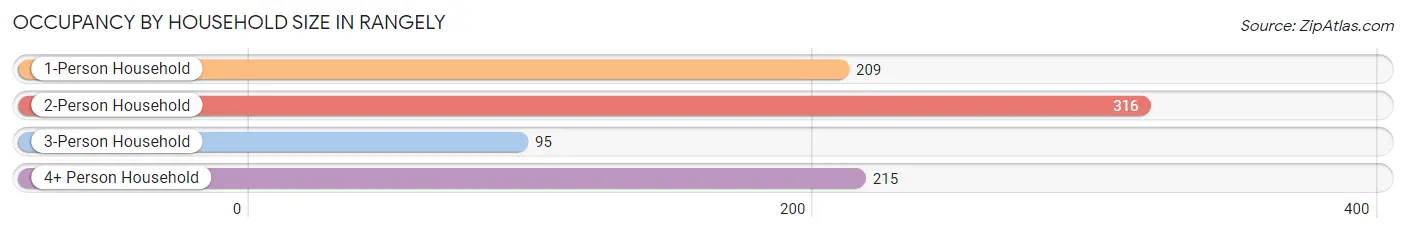
| Household Size | # Housing Units | % Housing Units |
| 1-Person Household | 209 | 25.0% |
| 2-Person Household | 316 | 37.8% |
| 3-Person Household | 95 | 11.4% |
| 4+ Person Household | 215 | 25.8% |
| Total Housing Units | 835 | 100.0% |
Occupancy by Ownership by Household Size in Rangely
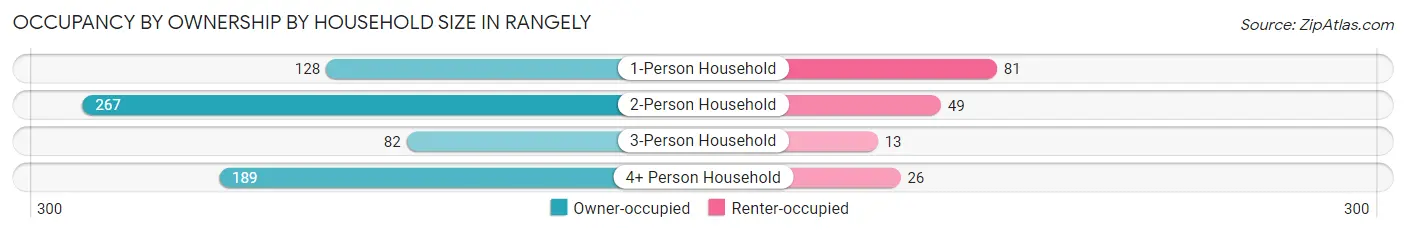
| Household Size | Owner-occupied | Renter-occupied |
| 1-Person Household | 128 (61.2%) | 81 (38.8%) |
| 2-Person Household | 267 (84.5%) | 49 (15.5%) |
| 3-Person Household | 82 (86.3%) | 13 (13.7%) |
| 4+ Person Household | 189 (87.9%) | 26 (12.1%) |
| Total Housing Units | 666 (79.8%) | 169 (20.2%) |
Occupancy by Educational Attainment in Rangely
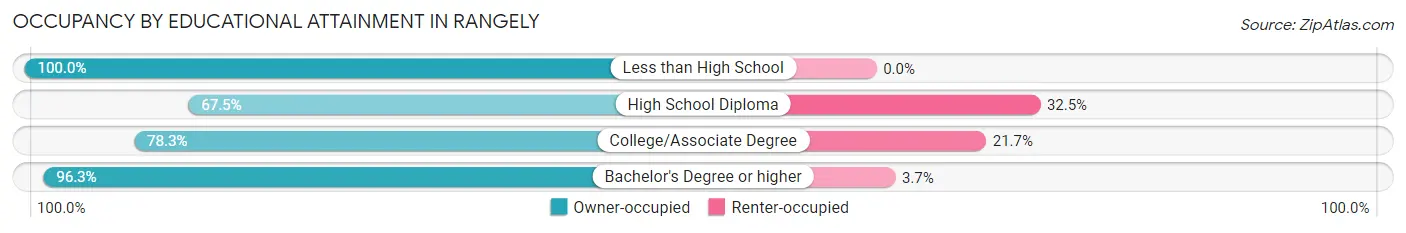
| Household Size | Owner-occupied | Renter-occupied |
| Less than High School | 38 (100.0%) | 0 (0.0%) |
| High School Diploma | 156 (67.5%) | 75 (32.5%) |
| College/Associate Degree | 317 (78.3%) | 88 (21.7%) |
| Bachelor's Degree or higher | 155 (96.3%) | 6 (3.7%) |
Occupancy by Age of Householder in Rangely
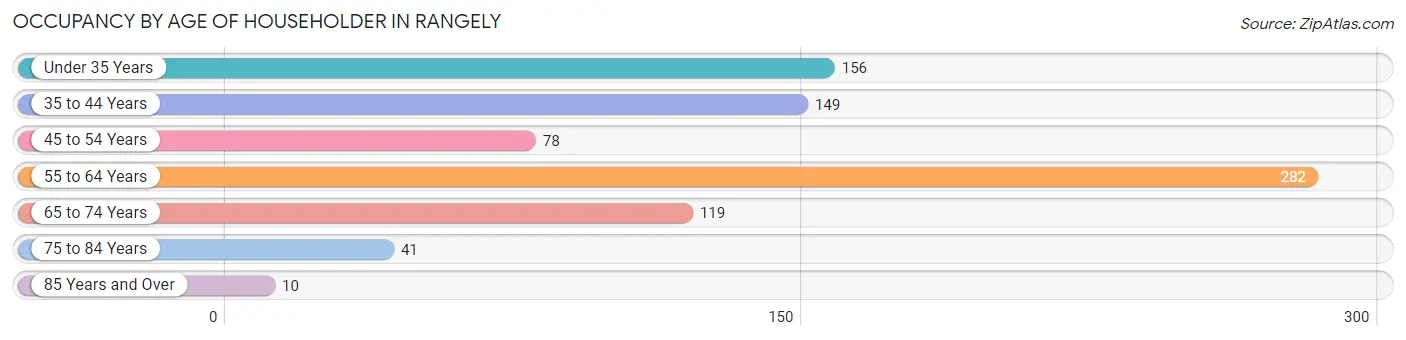
| Age Bracket | # Households | % Households |
| Under 35 Years | 156 | 18.7% |
| 35 to 44 Years | 149 | 17.8% |
| 45 to 54 Years | 78 | 9.3% |
| 55 to 64 Years | 282 | 33.8% |
| 65 to 74 Years | 119 | 14.2% |
| 75 to 84 Years | 41 | 4.9% |
| 85 Years and Over | 10 | 1.2% |
| Total | 835 | 100.0% |
Housing Finances in Rangely
Median Income by Occupancy in Rangely
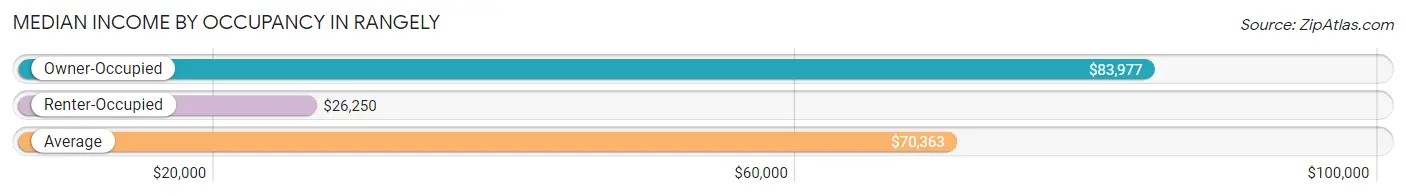
| Occupancy Type | # Households | Median Income |
| Owner-Occupied | 666 (79.8%) | $83,977 |
| Renter-Occupied | 169 (20.2%) | $26,250 |
| Average | 835 (100.0%) | $70,363 |
Occupancy by Householder Income Bracket in Rangely
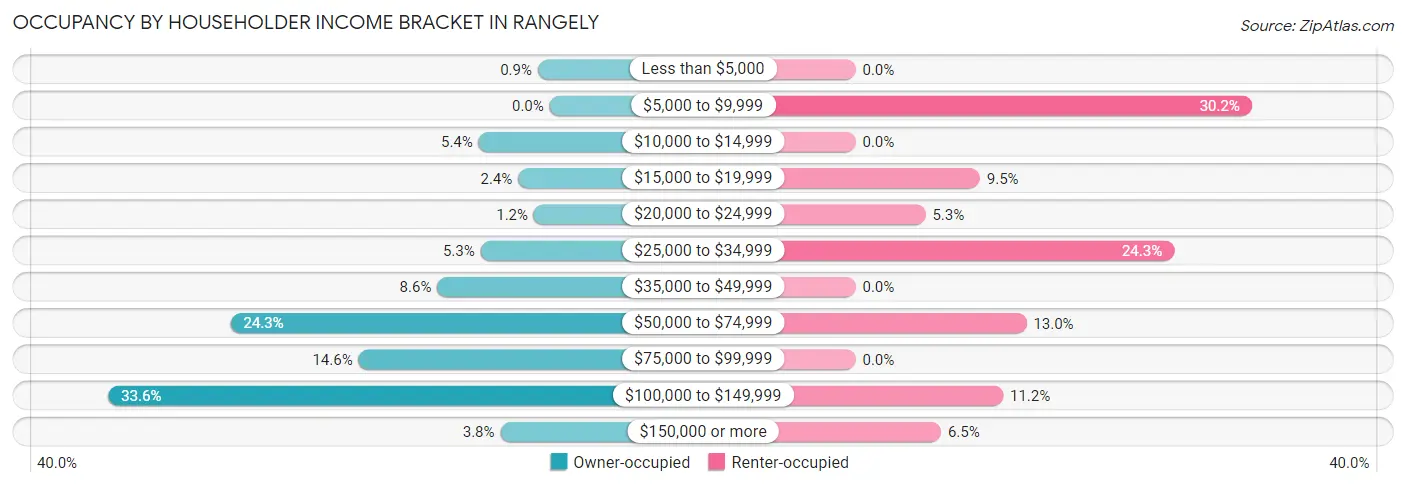
| Income Bracket | Owner-occupied | Renter-occupied |
| Less than $5,000 | 6 (0.9%) | 0 (0.0%) |
| $5,000 to $9,999 | 0 (0.0%) | 51 (30.2%) |
| $10,000 to $14,999 | 36 (5.4%) | 0 (0.0%) |
| $15,000 to $19,999 | 16 (2.4%) | 16 (9.5%) |
| $20,000 to $24,999 | 8 (1.2%) | 9 (5.3%) |
| $25,000 to $34,999 | 35 (5.3%) | 41 (24.3%) |
| $35,000 to $49,999 | 57 (8.6%) | 0 (0.0%) |
| $50,000 to $74,999 | 162 (24.3%) | 22 (13.0%) |
| $75,000 to $99,999 | 97 (14.6%) | 0 (0.0%) |
| $100,000 to $149,999 | 224 (33.6%) | 19 (11.2%) |
| $150,000 or more | 25 (3.7%) | 11 (6.5%) |
| Total | 666 (100.0%) | 169 (100.0%) |
Monthly Housing Cost Tiers in Rangely
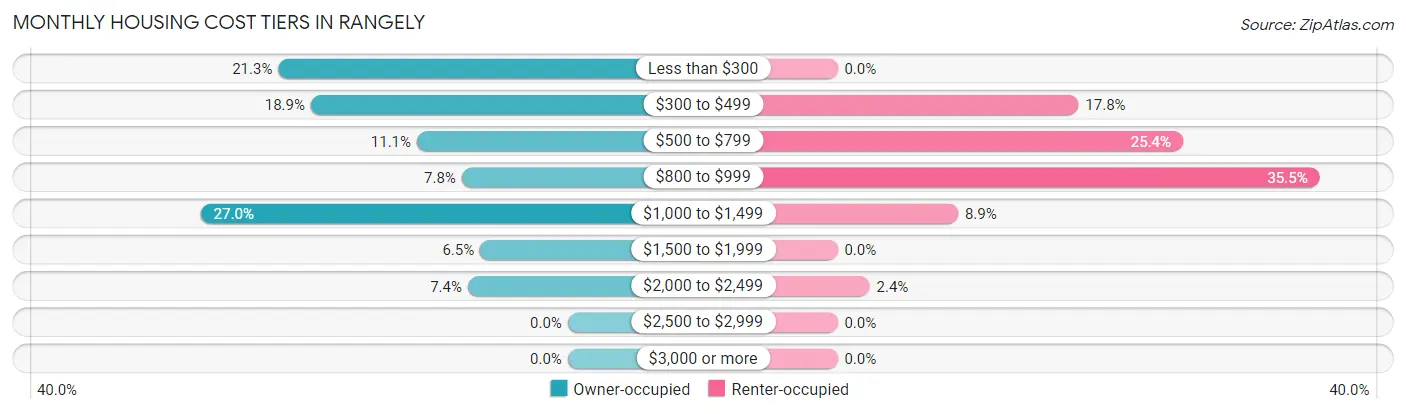
| Monthly Cost | Owner-occupied | Renter-occupied |
| Less than $300 | 142 (21.3%) | 0 (0.0%) |
| $300 to $499 | 126 (18.9%) | 30 (17.7%) |
| $500 to $799 | 74 (11.1%) | 43 (25.4%) |
| $800 to $999 | 52 (7.8%) | 60 (35.5%) |
| $1,000 to $1,499 | 180 (27.0%) | 15 (8.9%) |
| $1,500 to $1,999 | 43 (6.5%) | 0 (0.0%) |
| $2,000 to $2,499 | 49 (7.4%) | 4 (2.4%) |
| $2,500 to $2,999 | 0 (0.0%) | 0 (0.0%) |
| $3,000 or more | 0 (0.0%) | 0 (0.0%) |
| Total | 666 (100.0%) | 169 (100.0%) |
Physical Housing Characteristics in Rangely
Housing Structures in Rangely
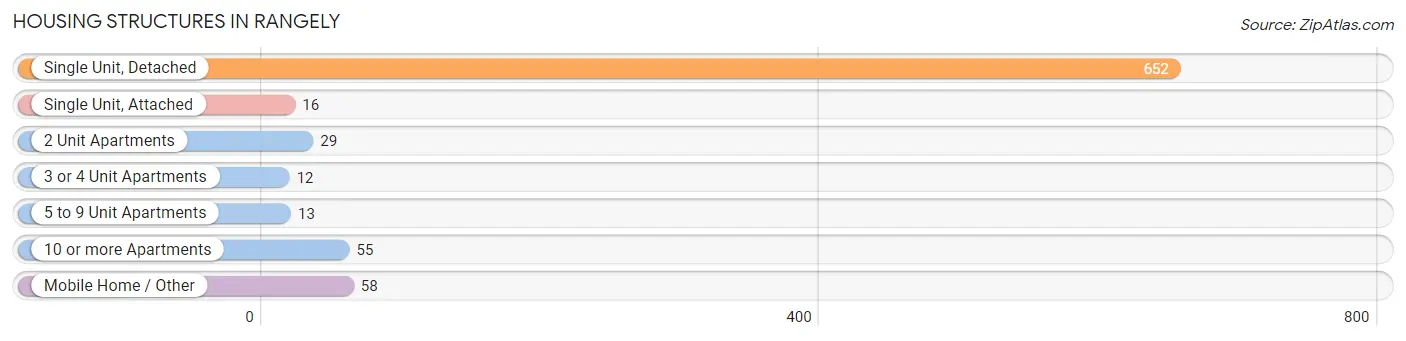
| Structure Type | # Housing Units | % Housing Units |
| Single Unit, Detached | 652 | 78.1% |
| Single Unit, Attached | 16 | 1.9% |
| 2 Unit Apartments | 29 | 3.5% |
| 3 or 4 Unit Apartments | 12 | 1.4% |
| 5 to 9 Unit Apartments | 13 | 1.6% |
| 10 or more Apartments | 55 | 6.6% |
| Mobile Home / Other | 58 | 7.0% |
| Total | 835 | 100.0% |
Housing Structures by Occupancy in Rangely
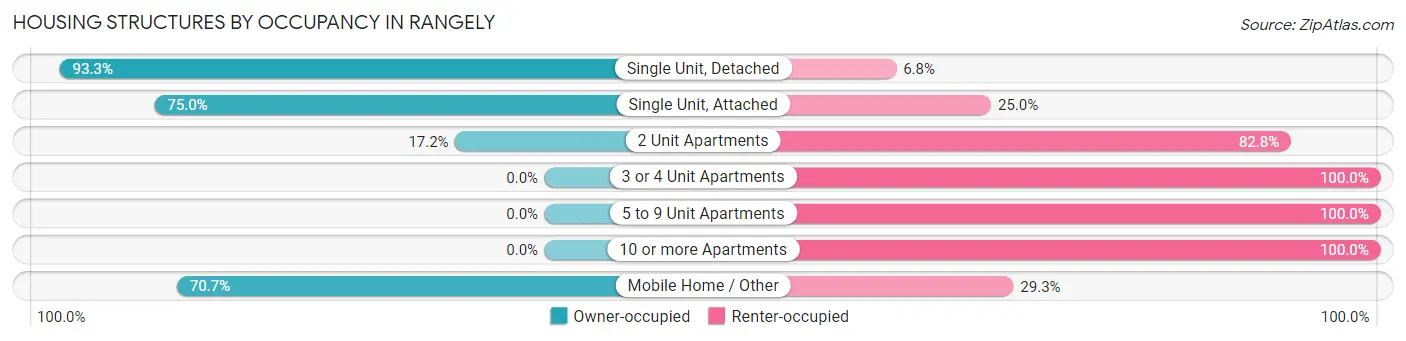
| Structure Type | Owner-occupied | Renter-occupied |
| Single Unit, Detached | 608 (93.2%) | 44 (6.8%) |
| Single Unit, Attached | 12 (75.0%) | 4 (25.0%) |
| 2 Unit Apartments | 5 (17.2%) | 24 (82.8%) |
| 3 or 4 Unit Apartments | 0 (0.0%) | 12 (100.0%) |
| 5 to 9 Unit Apartments | 0 (0.0%) | 13 (100.0%) |
| 10 or more Apartments | 0 (0.0%) | 55 (100.0%) |
| Mobile Home / Other | 41 (70.7%) | 17 (29.3%) |
| Total | 666 (79.8%) | 169 (20.2%) |
Housing Structures by Number of Rooms in Rangely
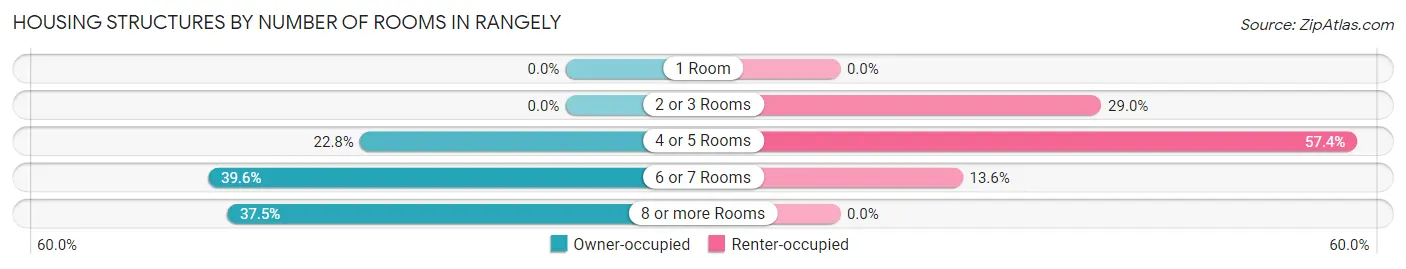
| Number of Rooms | Owner-occupied | Renter-occupied |
| 1 Room | 0 (0.0%) | 0 (0.0%) |
| 2 or 3 Rooms | 0 (0.0%) | 49 (29.0%) |
| 4 or 5 Rooms | 152 (22.8%) | 97 (57.4%) |
| 6 or 7 Rooms | 264 (39.6%) | 23 (13.6%) |
| 8 or more Rooms | 250 (37.5%) | 0 (0.0%) |
| Total | 666 (100.0%) | 169 (100.0%) |
Housing Structure by Heating Type in Rangely
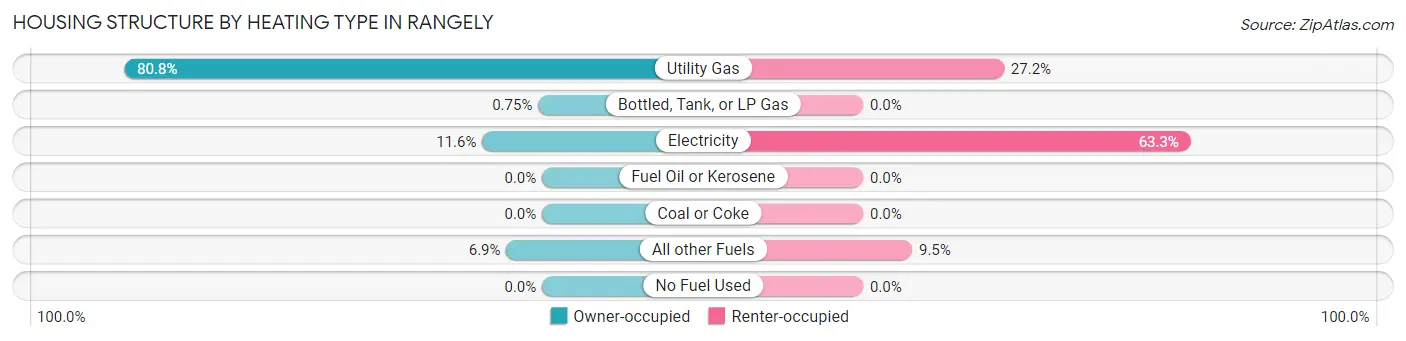
| Heating Type | Owner-occupied | Renter-occupied |
| Utility Gas | 538 (80.8%) | 46 (27.2%) |
| Bottled, Tank, or LP Gas | 5 (0.7%) | 0 (0.0%) |
| Electricity | 77 (11.6%) | 107 (63.3%) |
| Fuel Oil or Kerosene | 0 (0.0%) | 0 (0.0%) |
| Coal or Coke | 0 (0.0%) | 0 (0.0%) |
| All other Fuels | 46 (6.9%) | 16 (9.5%) |
| No Fuel Used | 0 (0.0%) | 0 (0.0%) |
| Total | 666 (100.0%) | 169 (100.0%) |
Household Vehicle Usage in Rangely
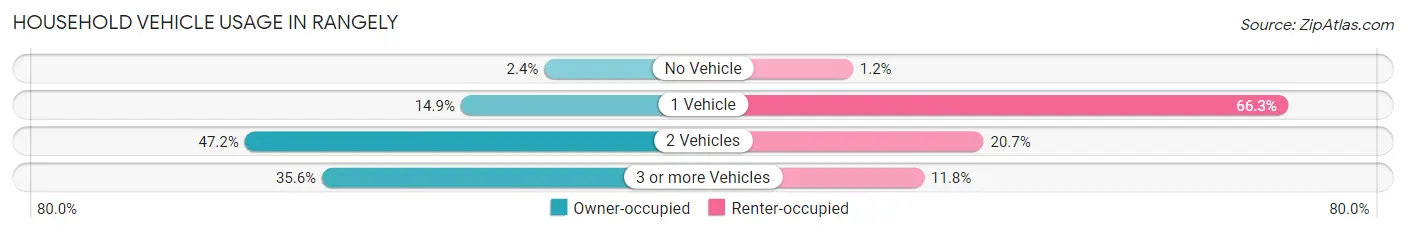
| Vehicles per Household | Owner-occupied | Renter-occupied |
| No Vehicle | 16 (2.4%) | 2 (1.2%) |
| 1 Vehicle | 99 (14.9%) | 112 (66.3%) |
| 2 Vehicles | 314 (47.1%) | 35 (20.7%) |
| 3 or more Vehicles | 237 (35.6%) | 20 (11.8%) |
| Total | 666 (100.0%) | 169 (100.0%) |
Real Estate & Mortgages in Rangely
Real Estate and Mortgage Overview in Rangely
| Characteristic | Without Mortgage | With Mortgage |
| Housing Units | 318 | 348 |
| Median Property Value | $180,000 | $196,600 |
| Median Household Income | $62,917 | $25 |
| Monthly Housing Costs | $318 | $0 |
| Real Estate Taxes | $622 | $0 |
Property Value by Mortgage Status in Rangely
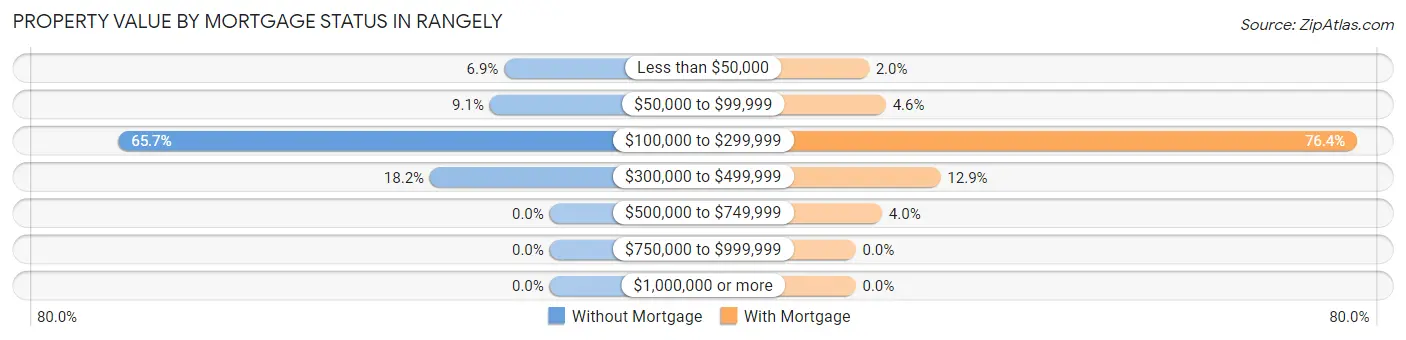
| Property Value | Without Mortgage | With Mortgage |
| Less than $50,000 | 22 (6.9%) | 7 (2.0%) |
| $50,000 to $99,999 | 29 (9.1%) | 16 (4.6%) |
| $100,000 to $299,999 | 209 (65.7%) | 266 (76.4%) |
| $300,000 to $499,999 | 58 (18.2%) | 45 (12.9%) |
| $500,000 to $749,999 | 0 (0.0%) | 14 (4.0%) |
| $750,000 to $999,999 | 0 (0.0%) | 0 (0.0%) |
| $1,000,000 or more | 0 (0.0%) | 0 (0.0%) |
| Total | 318 (100.0%) | 348 (100.0%) |
Household Income by Mortgage Status in Rangely
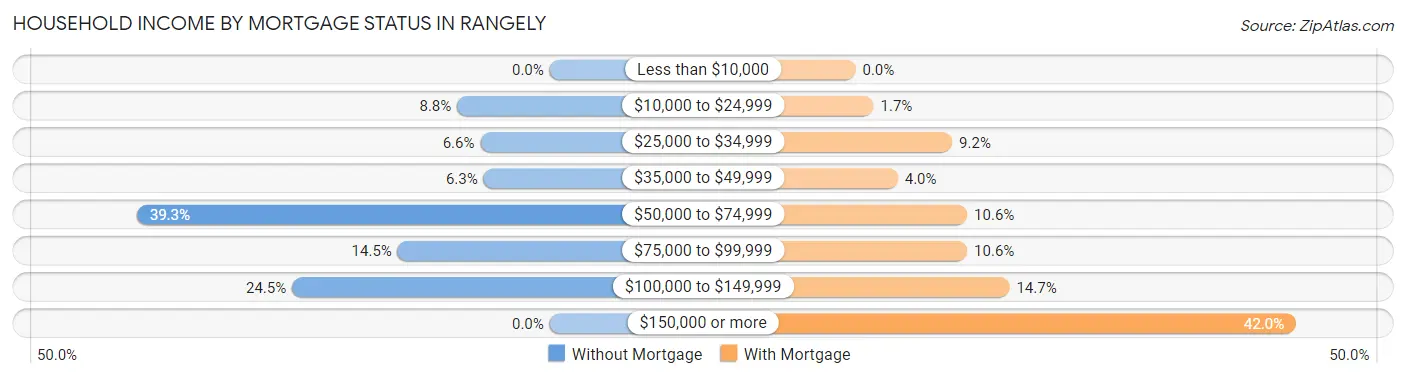
| Household Income | Without Mortgage | With Mortgage |
| Less than $10,000 | 0 (0.0%) | 0 (0.0%) |
| $10,000 to $24,999 | 28 (8.8%) | 6 (1.7%) |
| $25,000 to $34,999 | 21 (6.6%) | 32 (9.2%) |
| $35,000 to $49,999 | 20 (6.3%) | 14 (4.0%) |
| $50,000 to $74,999 | 125 (39.3%) | 37 (10.6%) |
| $75,000 to $99,999 | 46 (14.5%) | 37 (10.6%) |
| $100,000 to $149,999 | 78 (24.5%) | 51 (14.7%) |
| $150,000 or more | 0 (0.0%) | 146 (41.9%) |
| Total | 318 (100.0%) | 348 (100.0%) |
Property Value to Household Income Ratio in Rangely
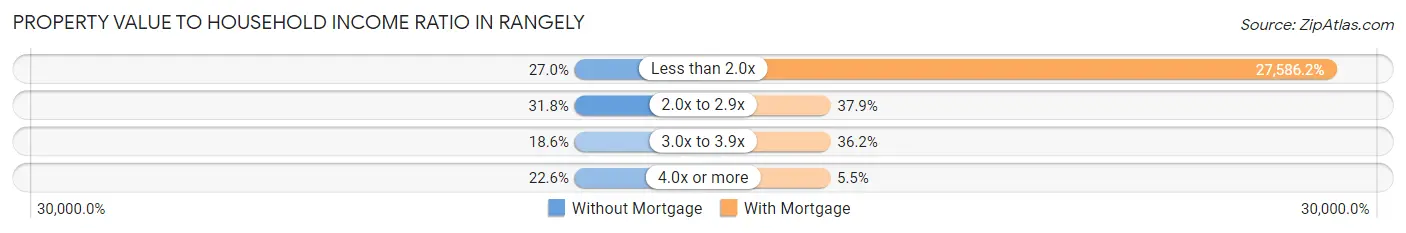
| Value-to-Income Ratio | Without Mortgage | With Mortgage |
| Less than 2.0x | 86 (27.0%) | 96,000 (27,586.2%) |
| 2.0x to 2.9x | 101 (31.8%) | 132 (37.9%) |
| 3.0x to 3.9x | 59 (18.5%) | 126 (36.2%) |
| 4.0x or more | 72 (22.6%) | 19 (5.5%) |
| Total | 318 (100.0%) | 348 (100.0%) |
Real Estate Taxes by Mortgage Status in Rangely
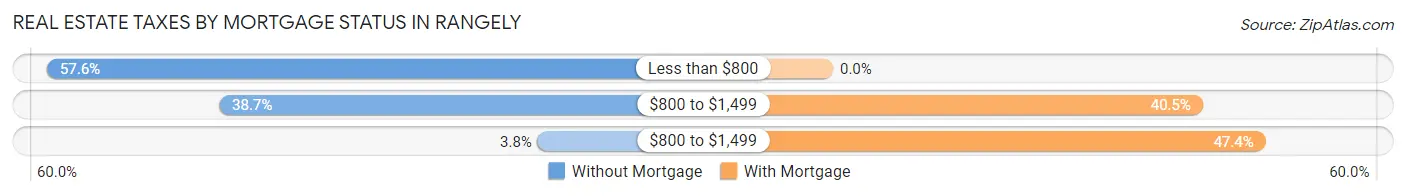
| Property Taxes | Without Mortgage | With Mortgage |
| Less than $800 | 183 (57.6%) | 0 (0.0%) |
| $800 to $1,499 | 123 (38.7%) | 141 (40.5%) |
| $800 to $1,499 | 12 (3.8%) | 165 (47.4%) |
| Total | 318 (100.0%) | 348 (100.0%) |
Health & Disability in Rangely
Health Insurance Coverage by Age in Rangely
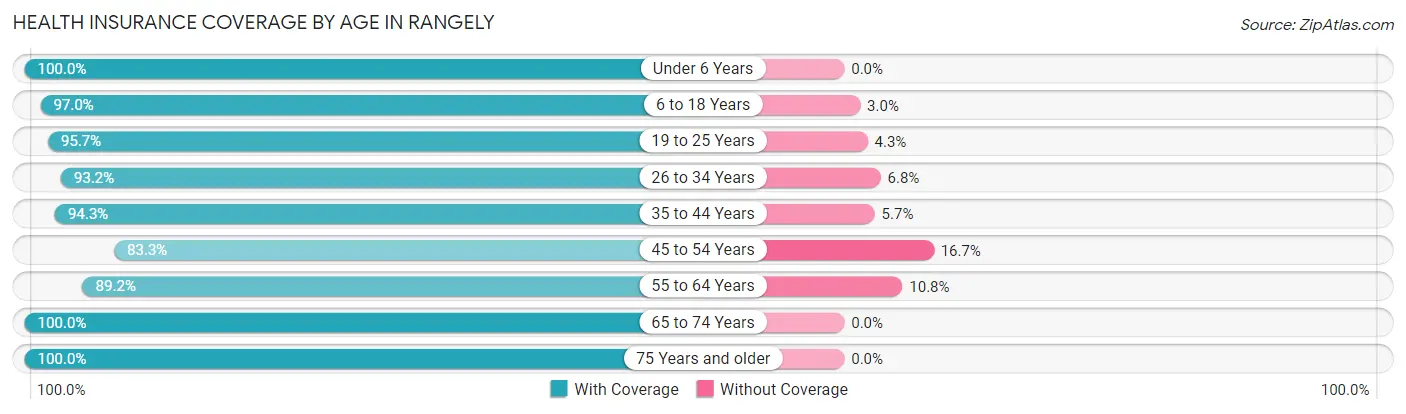
| Age Bracket | With Coverage | Without Coverage |
| Under 6 Years | 164 (100.0%) | 0 (0.0%) |
| 6 to 18 Years | 361 (97.0%) | 11 (3.0%) |
| 19 to 25 Years | 353 (95.7%) | 16 (4.3%) |
| 26 to 34 Years | 248 (93.2%) | 18 (6.8%) |
| 35 to 44 Years | 300 (94.3%) | 18 (5.7%) |
| 45 to 54 Years | 145 (83.3%) | 29 (16.7%) |
| 55 to 64 Years | 387 (89.2%) | 47 (10.8%) |
| 65 to 74 Years | 147 (100.0%) | 0 (0.0%) |
| 75 Years and older | 67 (100.0%) | 0 (0.0%) |
| Total | 2,172 (94.0%) | 139 (6.0%) |
Health Insurance Coverage by Citizenship Status in Rangely
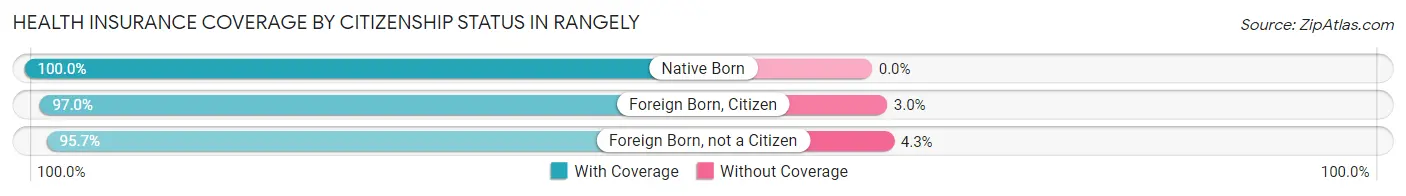
| Citizenship Status | With Coverage | Without Coverage |
| Native Born | 164 (100.0%) | 0 (0.0%) |
| Foreign Born, Citizen | 361 (97.0%) | 11 (3.0%) |
| Foreign Born, not a Citizen | 353 (95.7%) | 16 (4.3%) |
Health Insurance Coverage by Household Income in Rangely
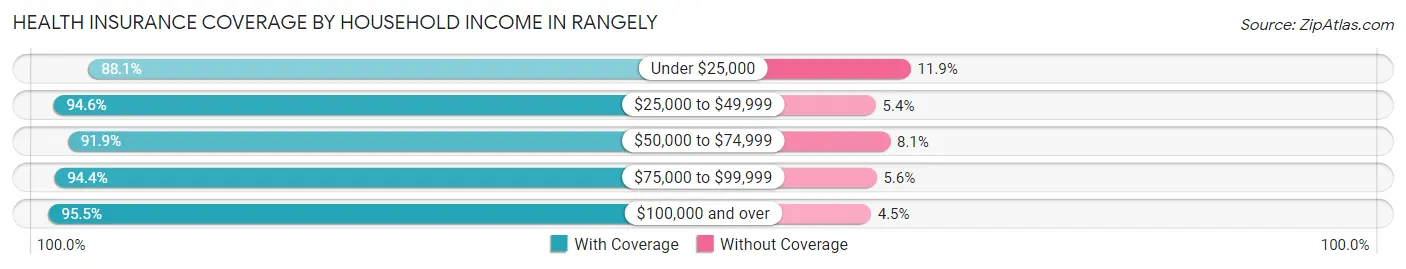
| Household Income | With Coverage | Without Coverage |
| Under $25,000 | 236 (88.1%) | 32 (11.9%) |
| $25,000 to $49,999 | 280 (94.6%) | 16 (5.4%) |
| $50,000 to $74,999 | 454 (91.9%) | 40 (8.1%) |
| $75,000 to $99,999 | 204 (94.4%) | 12 (5.6%) |
| $100,000 and over | 808 (95.5%) | 38 (4.5%) |
Public vs Private Health Insurance Coverage by Age in Rangely
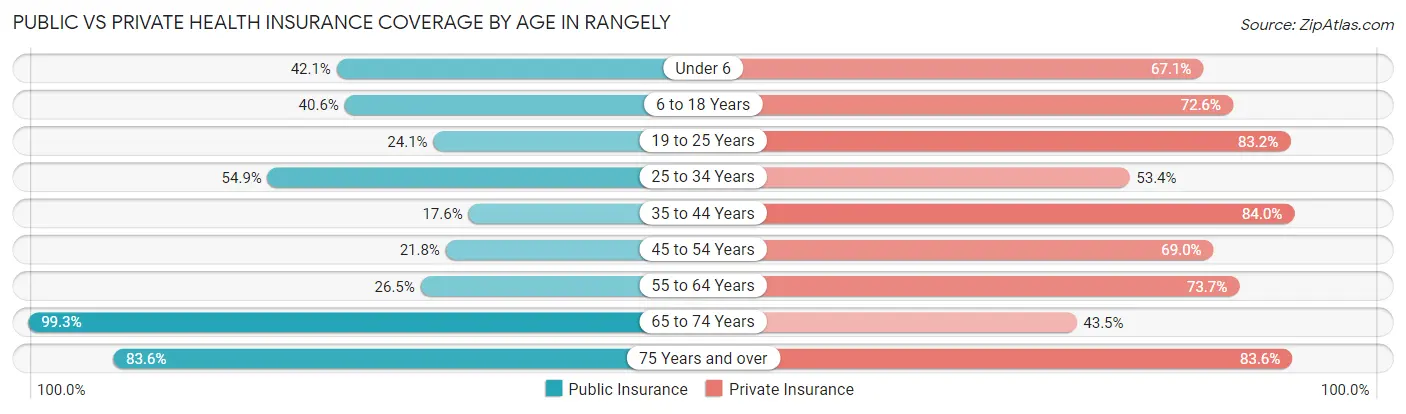
| Age Bracket | Public Insurance | Private Insurance |
| Under 6 | 69 (42.1%) | 110 (67.1%) |
| 6 to 18 Years | 151 (40.6%) | 270 (72.6%) |
| 19 to 25 Years | 89 (24.1%) | 307 (83.2%) |
| 25 to 34 Years | 146 (54.9%) | 142 (53.4%) |
| 35 to 44 Years | 56 (17.6%) | 267 (84.0%) |
| 45 to 54 Years | 38 (21.8%) | 120 (69.0%) |
| 55 to 64 Years | 115 (26.5%) | 320 (73.7%) |
| 65 to 74 Years | 146 (99.3%) | 64 (43.5%) |
| 75 Years and over | 56 (83.6%) | 56 (83.6%) |
| Total | 866 (37.5%) | 1,656 (71.7%) |
Disability Status by Sex by Age in Rangely
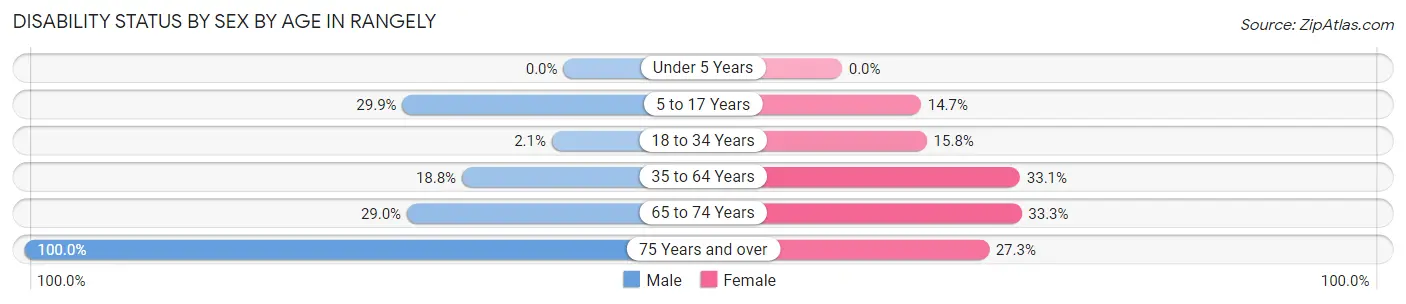
| Age Bracket | Male | Female |
| Under 5 Years | 0 (0.0%) | 0 (0.0%) |
| 5 to 17 Years | 69 (29.9%) | 22 (14.7%) |
| 18 to 34 Years | 7 (2.1%) | 57 (15.8%) |
| 35 to 64 Years | 86 (18.8%) | 155 (33.1%) |
| 65 to 74 Years | 27 (29.0%) | 18 (33.3%) |
| 75 Years and over | 45 (100.0%) | 6 (27.3%) |
Disability Class by Sex by Age in Rangely
Disability Class: Hearing Difficulty
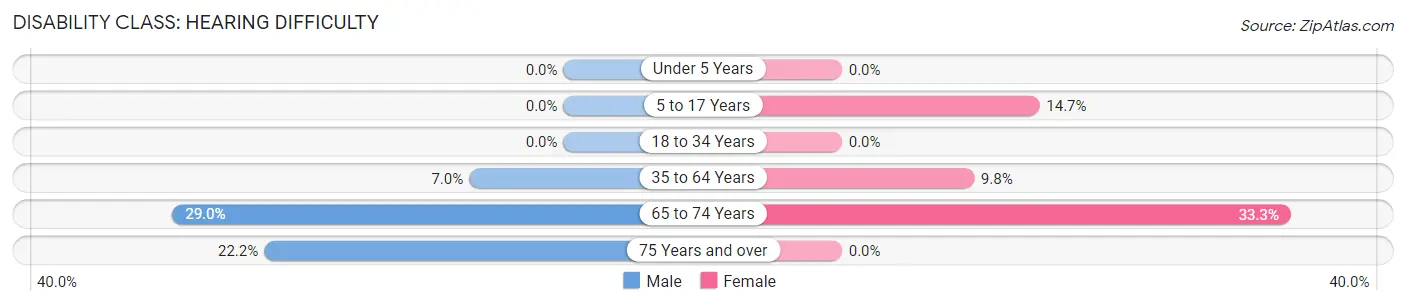
| Age Bracket | Male | Female |
| Under 5 Years | 0 (0.0%) | 0 (0.0%) |
| 5 to 17 Years | 0 (0.0%) | 22 (14.7%) |
| 18 to 34 Years | 0 (0.0%) | 0 (0.0%) |
| 35 to 64 Years | 32 (7.0%) | 46 (9.8%) |
| 65 to 74 Years | 27 (29.0%) | 18 (33.3%) |
| 75 Years and over | 10 (22.2%) | 0 (0.0%) |
Disability Class: Vision Difficulty
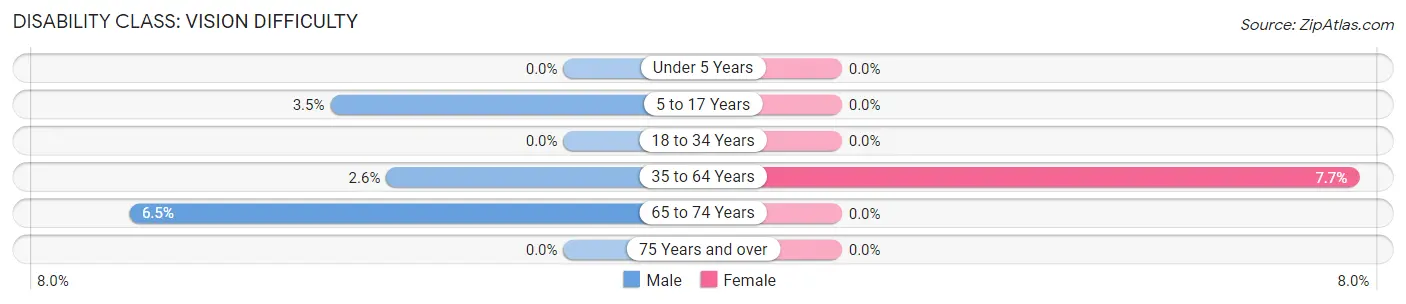
| Age Bracket | Male | Female |
| Under 5 Years | 0 (0.0%) | 0 (0.0%) |
| 5 to 17 Years | 8 (3.5%) | 0 (0.0%) |
| 18 to 34 Years | 0 (0.0%) | 0 (0.0%) |
| 35 to 64 Years | 12 (2.6%) | 36 (7.7%) |
| 65 to 74 Years | 6 (6.5%) | 0 (0.0%) |
| 75 Years and over | 0 (0.0%) | 0 (0.0%) |
Disability Class: Cognitive Difficulty
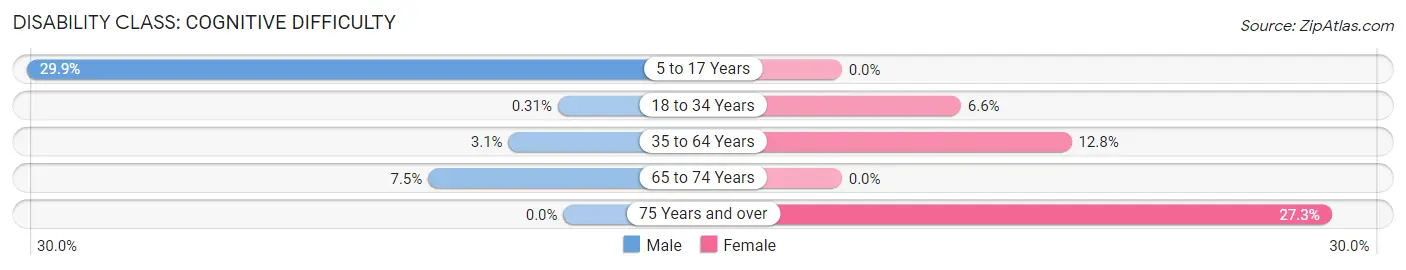
| Age Bracket | Male | Female |
| 5 to 17 Years | 69 (29.9%) | 0 (0.0%) |
| 18 to 34 Years | 1 (0.3%) | 24 (6.6%) |
| 35 to 64 Years | 14 (3.1%) | 60 (12.8%) |
| 65 to 74 Years | 7 (7.5%) | 0 (0.0%) |
| 75 Years and over | 0 (0.0%) | 6 (27.3%) |
Disability Class: Ambulatory Difficulty
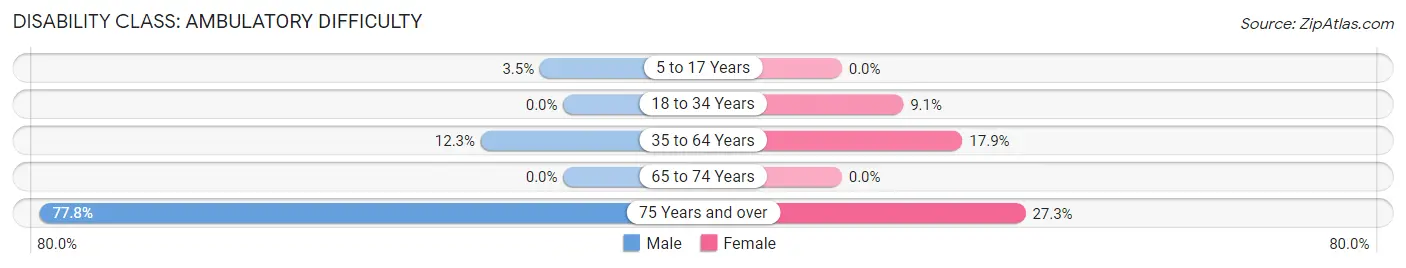
| Age Bracket | Male | Female |
| 5 to 17 Years | 8 (3.5%) | 0 (0.0%) |
| 18 to 34 Years | 0 (0.0%) | 33 (9.1%) |
| 35 to 64 Years | 56 (12.2%) | 84 (17.9%) |
| 65 to 74 Years | 0 (0.0%) | 0 (0.0%) |
| 75 Years and over | 35 (77.8%) | 6 (27.3%) |
Disability Class: Self-Care Difficulty
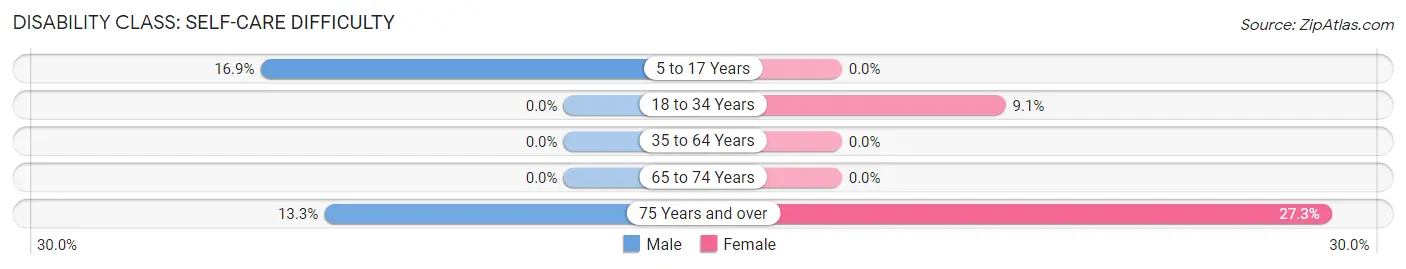
| Age Bracket | Male | Female |
| 5 to 17 Years | 39 (16.9%) | 0 (0.0%) |
| 18 to 34 Years | 0 (0.0%) | 33 (9.1%) |
| 35 to 64 Years | 0 (0.0%) | 0 (0.0%) |
| 65 to 74 Years | 0 (0.0%) | 0 (0.0%) |
| 75 Years and over | 6 (13.3%) | 6 (27.3%) |
Technology Access in Rangely
Computing Device Access in Rangely
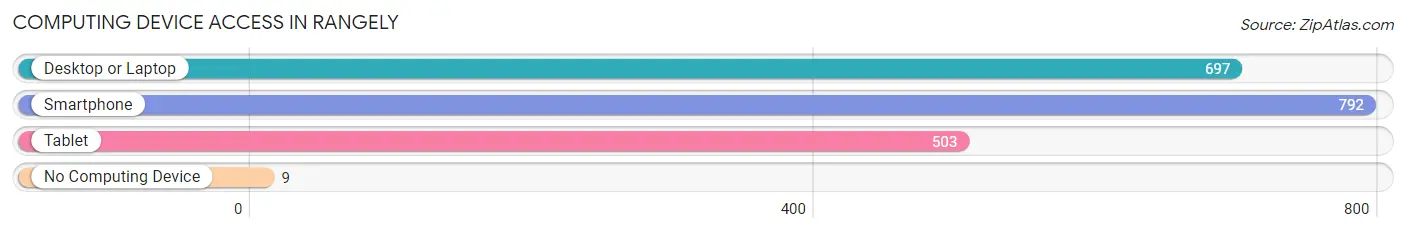
| Device Type | # Households | % Households |
| Desktop or Laptop | 697 | 83.5% |
| Smartphone | 792 | 94.9% |
| Tablet | 503 | 60.2% |
| No Computing Device | 9 | 1.1% |
| Total | 835 | 100.0% |
Internet Access in Rangely
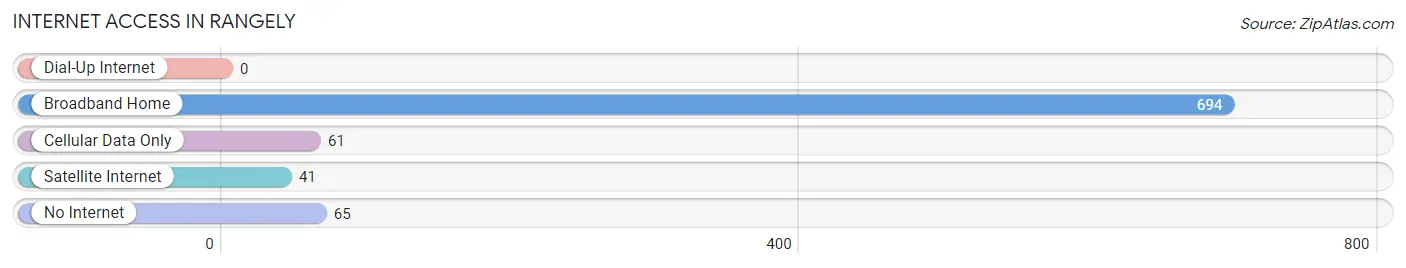
| Internet Type | # Households | % Households |
| Dial-Up Internet | 0 | 0.0% |
| Broadband Home | 694 | 83.1% |
| Cellular Data Only | 61 | 7.3% |
| Satellite Internet | 41 | 4.9% |
| No Internet | 65 | 7.8% |
| Total | 835 | 100.0% |
Rangely Summary
Rangely is a small town located in the northwest corner of Colorado, in Rio Blanco County. It is situated in the high desert of the Colorado Plateau, at an elevation of 5,945 feet. The town is surrounded by the White River National Forest and the Flat Tops Wilderness Area, and is home to a variety of wildlife, including elk, deer, and antelope.
History
Rangely was founded in 1906 as a mining town. The town was named after the Rangely Oil Field, which was discovered in the area in 1901. The oil field was the first major oil discovery in Colorado, and it quickly became a major source of employment for the area. The town grew rapidly, and by 1910, it had a population of over 1,000 people.
The town was also home to a number of other industries, including a brickyard, a sawmill, and a coal mine. The coal mine was the largest employer in the area, and it provided jobs for many of the town’s residents.
In the 1950s, the oil industry began to decline, and the town’s population began to decline as well. By the 1970s, the town’s population had dropped to just over 500 people.
Geography
Rangely is located in the northwest corner of Colorado, in Rio Blanco County. It is situated in the high desert of the Colorado Plateau, at an elevation of 5,945 feet. The town is surrounded by the White River National Forest and the Flat Tops Wilderness Area.
The town is located on the western edge of the Colorado River Basin, and is bordered by the White River to the north and the Green River to the south. The town is also located near the Utah border, and is just a few miles from the Utah towns of Vernal and Duchesne.
The town is located in a semi-arid climate, with hot summers and cold winters. The average annual temperature is around 50 degrees Fahrenheit, and the average annual precipitation is around 12 inches.
Economy
Rangely’s economy is largely based on the oil and gas industry. The town is home to several oil and gas companies, including Chevron, BP, and Shell. The town is also home to several other industries, including a brickyard, a sawmill, and a coal mine.
The town is also home to a number of small businesses, including restaurants, retail stores, and hotels. The town is also home to a number of tourist attractions, including the Rangely Museum and the Rangely Outdoor Adventure Center.
Demographics
As of the 2010 census, the town had a population of 2,078 people. The racial makeup of the town was 94.3% White, 0.7% African American, 0.3% Native American, 0.2% Asian, 0.1% Pacific Islander, 2.2% from other races, and 2.4% from two or more races. Hispanic or Latino of any race were 5.3% of the population.
The median income for a household in the town was $37,917, and the median income for a family was $45,000. The per capita income for the town was $19,945. About 11.2% of families and 14.2% of the population were below the poverty line, including 18.2% of those under age 18 and 8.3% of those age 65 or over.
Common Questions
What is Per Capita Income in Rangely?
Per Capita income in Rangely is $28,893.
What is the Median Family Income in Rangely?
Median Family Income in Rangely is $86,917.
What is the Median Household income in Rangely?
Median Household Income in Rangely is $70,363.
What is Income or Wage Gap in Rangely?
Income or Wage Gap in Rangely is 52.3%.
Women in Rangely earn 47.7 cents for every dollar earned by a man.
What is Inequality or Gini Index in Rangely?
Inequality or Gini Index in Rangely is 0.38.
What is the Total Population of Rangely?
Total Population of Rangely is 2,382.
What is the Total Male Population of Rangely?
Total Male Population of Rangely is 1,252.
What is the Total Female Population of Rangely?
Total Female Population of Rangely is 1,130.
What is the Ratio of Males per 100 Females in Rangely?
There are 110.80 Males per 100 Females in Rangely.
What is the Ratio of Females per 100 Males in Rangely?
There are 90.26 Females per 100 Males in Rangely.
What is the Median Population Age in Rangely?
Median Population Age in Rangely is 35.8 Years.
What is the Average Family Size in Rangely
Average Family Size in Rangely is 3.1 People.
What is the Average Household Size in Rangely
Average Household Size in Rangely is 2.5 People.
How Large is the Labor Force in Rangely?
There are 1,229 People in the Labor Forcein in Rangely.
What is the Percentage of People in the Labor Force in Rangely?
61.5% of People are in the Labor Force in Rangely.
What is the Unemployment Rate in Rangely?
Unemployment Rate in Rangely is 6.5%.