University, MS Map & Demographics
University Map
University Overview
$3,525
PER CAPITA INCOME
42.7%
WAGE / INCOME GAP [ % ]
57.3¢/ $1
WAGE / INCOME GAP [ $ ]
4,480
TOTAL POPULATION
1,918
MALE POPULATION
2,562
FEMALE POPULATION
74.86
MALES / 100 FEMALES
133.58
FEMALES / 100 MALES
19.2
MEDIAN AGE
896
LABOR FORCE [ PEOPLE ]
20.0%
PERCENT IN LABOR FORCE
0.2%
UNEMPLOYMENT RATE
University Zip Codes
University Area Codes
Income in University
Income Overview in University
| Characteristic | Number | Measure |
| Per Capita Income | 4,480 | $3,525 |
| Median Family Income | 0 | $0 |
| Mean Family Income | 0 | $0 |
| Median Household Income | 0 | $0 |
| Mean Household Income | 0 | $0 |
| Income Deficit | 0 | $0 |
| Wage / Income Gap (%) | 4,480 | 42.66% |
| Wage / Income Gap ($) | 4,480 | 57.34¢ per $1 |
| Gini / Inequality Index | 4,480 | 0.00 |
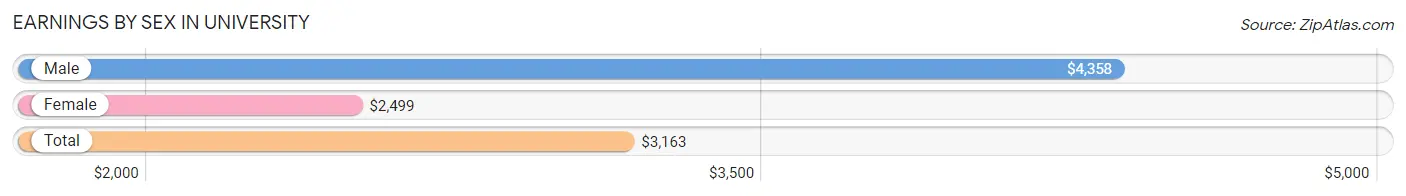
Earnings by Sex in University
Average Earnings in University are $3,163, $4,358 for men and $2,499 for women, a difference of 42.7%.
| Sex | Number | Average Earnings |
| Male | 1,476 (42.2%) | $4,358 |
| Female | 2,019 (57.8%) | $2,499 |
| Total | 3,495 (100.0%) | $3,163 |
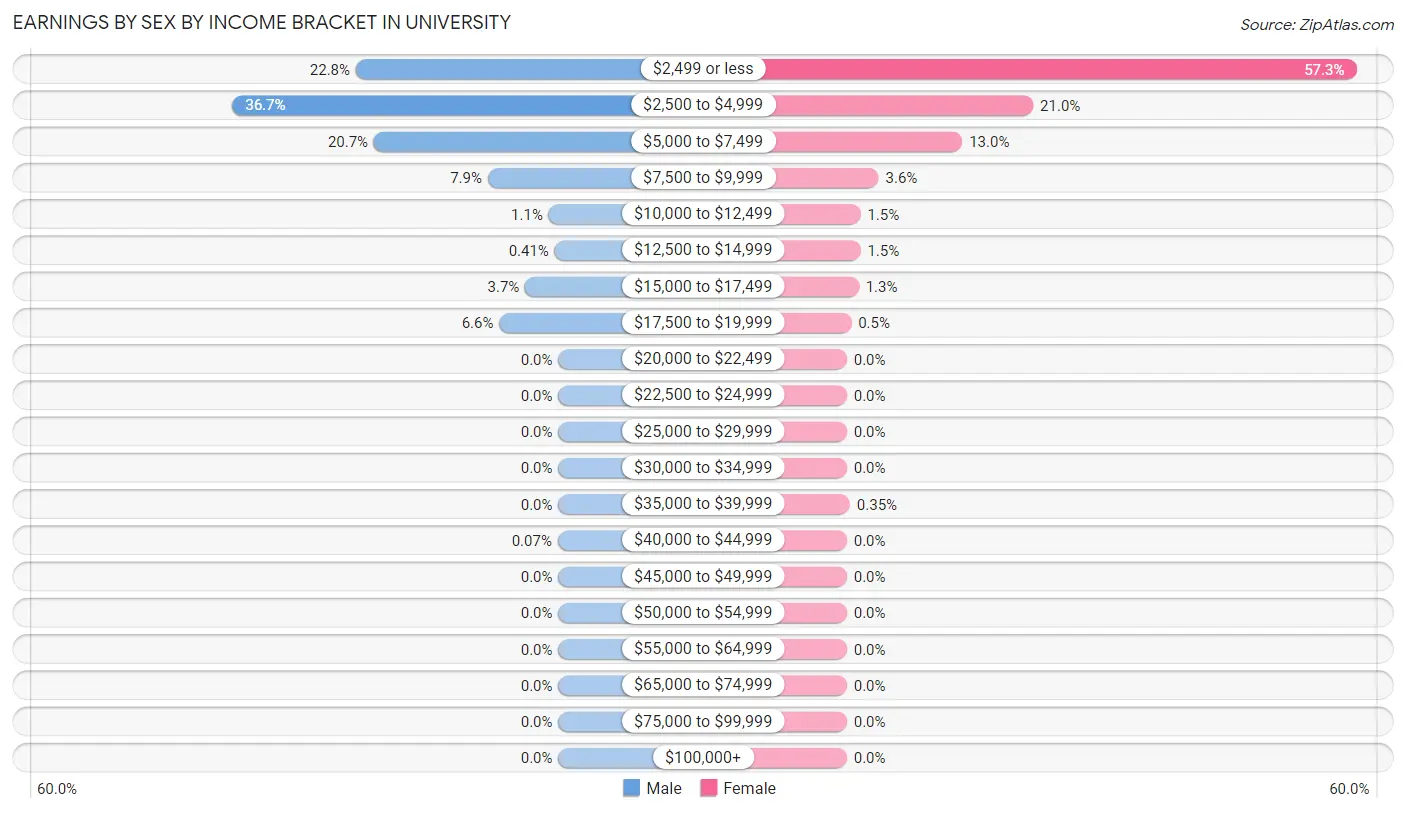
Earnings by Sex by Income Bracket in University
The most common earnings brackets in University are $2,500 to $4,999 for men (541 | 36.6%) and $2,499 or less for women (1,156 | 57.3%).
| Income | Male | Female |
| $2,499 or less | 336 (22.8%) | 1,156 (57.3%) |
| $2,500 to $4,999 | 541 (36.6%) | 423 (20.9%) |
| $5,000 to $7,499 | 306 (20.7%) | 262 (13.0%) |
| $7,500 to $9,999 | 117 (7.9%) | 72 (3.6%) |
| $10,000 to $12,499 | 16 (1.1%) | 31 (1.5%) |
| $12,500 to $14,999 | 6 (0.4%) | 31 (1.5%) |
| $15,000 to $17,499 | 55 (3.7%) | 27 (1.3%) |
| $17,500 to $19,999 | 98 (6.6%) | 10 (0.5%) |
| $20,000 to $22,499 | 0 (0.0%) | 0 (0.0%) |
| $22,500 to $24,999 | 0 (0.0%) | 0 (0.0%) |
| $25,000 to $29,999 | 0 (0.0%) | 0 (0.0%) |
| $30,000 to $34,999 | 0 (0.0%) | 0 (0.0%) |
| $35,000 to $39,999 | 0 (0.0%) | 7 (0.4%) |
| $40,000 to $44,999 | 1 (0.1%) | 0 (0.0%) |
| $45,000 to $49,999 | 0 (0.0%) | 0 (0.0%) |
| $50,000 to $54,999 | 0 (0.0%) | 0 (0.0%) |
| $55,000 to $64,999 | 0 (0.0%) | 0 (0.0%) |
| $65,000 to $74,999 | 0 (0.0%) | 0 (0.0%) |
| $75,000 to $99,999 | 0 (0.0%) | 0 (0.0%) |
| $100,000+ | 0 (0.0%) | 0 (0.0%) |
| Total | 1,476 (100.0%) | 2,019 (100.0%) |
Earnings by Sex by Educational Attainment in University
| Educational Attainment | Male Income | Female Income |
| Less than High School | - | - |
| High School Diploma | - | - |
| College or Associate's Degree | - | - |
| Bachelor's Degree | - | - |
| Graduate Degree | - | - |
| Total | - | - |
Family Income in University
Family Income Brackets in University
| Income Bracket | # Families | % Families |
| Less than $10,000 | 0 | 0.0% |
| $10,000 to $14,999 | 0 | 0.0% |
| $15,000 to $24,999 | 0 | 0.0% |
| $25,000 to $34,999 | 0 | 0.0% |
| $35,000 to $49,999 | 0 | 0.0% |
| $50,000 to $74,999 | 0 | 0.0% |
| $75,000 to $99,999 | 0 | 0.0% |
| $100,000 to $149,999 | 0 | 0.0% |
| $150,000 to $199,999 | 0 | 0.0% |
| $200,000+ | 0 | 0.0% |
Family Income by Famaliy Size in University
| Income Bracket | # Families | Median Income |
| 2-Person Families | 0 (0.0%) | $0 |
| 3-Person Families | 0 (0.0%) | $0 |
| 4-Person Families | 0 (0.0%) | $0 |
| 5-Person Families | 0 (0.0%) | $0 |
| 6-Person Families | 0 (0.0%) | $0 |
| 7+ Person Families | 0 (0.0%) | $0 |
| Total | 0 (0.0%) | $0 |
Family Income by Number of Earners in University
| Number of Earners | # Families | Median Income |
| No Earners | 0 (0.0%) | $0 |
| 1 Earner | 0 (0.0%) | $0 |
| 2 Earners | 0 (0.0%) | $0 |
| 3+ Earners | 0 (0.0%) | $0 |
| Total | 0 (0.0%) | $0 |
Household Income in University
Household Income Brackets in University
| Income Bracket | # Households | % Households |
| Less than $10,000 | 0 | 0.0% |
| $10,000 to $14,999 | 0 | 0.0% |
| $15,000 to $24,999 | 0 | 0.0% |
| $25,000 to $34,999 | 0 | 0.0% |
| $35,000 to $49,999 | 0 | 0.0% |
| $50,000 to $74,999 | 0 | 0.0% |
| $75,000 to $99,999 | 0 | 0.0% |
| $100,000 to $149,999 | 0 | 0.0% |
| $150,000 to $199,999 | 0 | 0.0% |
| $200,000+ | 0 | 0.0% |
Household Income by Householder Age in University
| Income Bracket | # Households | Median Income |
| 15 to 24 Years | 0 (0.0%) | $0 |
| 25 to 44 Years | 0 (0.0%) | $0 |
| 45 to 64 Years | 0 (0.0%) | $0 |
| 65+ Years | 0 (0.0%) | $0 |
| Total | 0 (0.0%) | $0 |
Poverty in University
Income Below Poverty by Sex and Age in University
| Age Bracket | Male | Female |
| Under 5 Years | 0 (0.0%) | 0 (0.0%) |
| 5 Years | 0 (0.0%) | 0 (0.0%) |
| 6 to 11 Years | 0 (0.0%) | 0 (0.0%) |
| 12 to 14 Years | 0 (0.0%) | 0 (0.0%) |
| 15 Years | 0 (0.0%) | 0 (0.0%) |
| 16 and 17 Years | 0 (0.0%) | 0 (0.0%) |
| 18 to 24 Years | 0 (0.0%) | 0 (0.0%) |
| 25 to 34 Years | 0 (0.0%) | 0 (0.0%) |
| 35 to 44 Years | 0 (0.0%) | 0 (0.0%) |
| 45 to 54 Years | 0 (0.0%) | 0 (0.0%) |
| 55 to 64 Years | 0 (0.0%) | 0 (0.0%) |
| 65 to 74 Years | 0 (0.0%) | 0 (0.0%) |
| 75 Years and over | 0 (0.0%) | 0 (0.0%) |
| Total | 0 (0.0%) | 0 (0.0%) |
Income Above Poverty by Sex and Age in University
| Age Bracket | Male | Female |
| Under 5 Years | 0 (0.0%) | 0 (0.0%) |
| 5 Years | 0 (0.0%) | 0 (0.0%) |
| 6 to 11 Years | 0 (0.0%) | 0 (0.0%) |
| 12 to 14 Years | 0 (0.0%) | 0 (0.0%) |
| 15 Years | 0 (0.0%) | 0 (0.0%) |
| 16 and 17 Years | 0 (0.0%) | 0 (0.0%) |
| 18 to 24 Years | 0 (0.0%) | 0 (0.0%) |
| 25 to 34 Years | 0 (0.0%) | 0 (0.0%) |
| 35 to 44 Years | 0 (0.0%) | 0 (0.0%) |
| 45 to 54 Years | 0 (0.0%) | 0 (0.0%) |
| 55 to 64 Years | 0 (0.0%) | 0 (0.0%) |
| 65 to 74 Years | 0 (0.0%) | 0 (0.0%) |
| 75 Years and over | 0 (0.0%) | 0 (0.0%) |
| Total | 0 (0.0%) | 0 (0.0%) |
Income Below Poverty Among Married-Couple Families in University
| Children | Above Poverty | Below Poverty |
| No Children | 0 (0.0%) | 0 (0.0%) |
| 1 or 2 Children | 0 (0.0%) | 0 (0.0%) |
| 3 or 4 Children | 0 (0.0%) | 0 (0.0%) |
| 5 or more Children | 0 (0.0%) | 0 (0.0%) |
| Total | 0 (0.0%) | 0 (0.0%) |
Income Below Poverty Among Single-Parent Households in University
| Children | Single Father | Single Mother |
| No Children | 0 (0.0%) | 0 (0.0%) |
| 1 or 2 Children | 0 (0.0%) | 0 (0.0%) |
| 3 or 4 Children | 0 (0.0%) | 0 (0.0%) |
| 5 or more Children | 0 (0.0%) | 0 (0.0%) |
| Total | 0 (0.0%) | 0 (0.0%) |
Income Below Poverty Among Married-Couple vs Single-Parent Households in University
| Children | Married-Couple Families | Single-Parent Households |
| No Children | 0 (0.0%) | 0 (0.0%) |
| 1 or 2 Children | 0 (0.0%) | 0 (0.0%) |
| 3 or 4 Children | 0 (0.0%) | 0 (0.0%) |
| 5 or more Children | 0 (0.0%) | 0 (0.0%) |
| Total | 0 (0.0%) | 0 (0.0%) |
Race in University
The most populous races in University are White / Caucasian (3,164 | 70.6%), Black / African American (621 | 13.9%), and Two or more Races (483 | 10.8%).
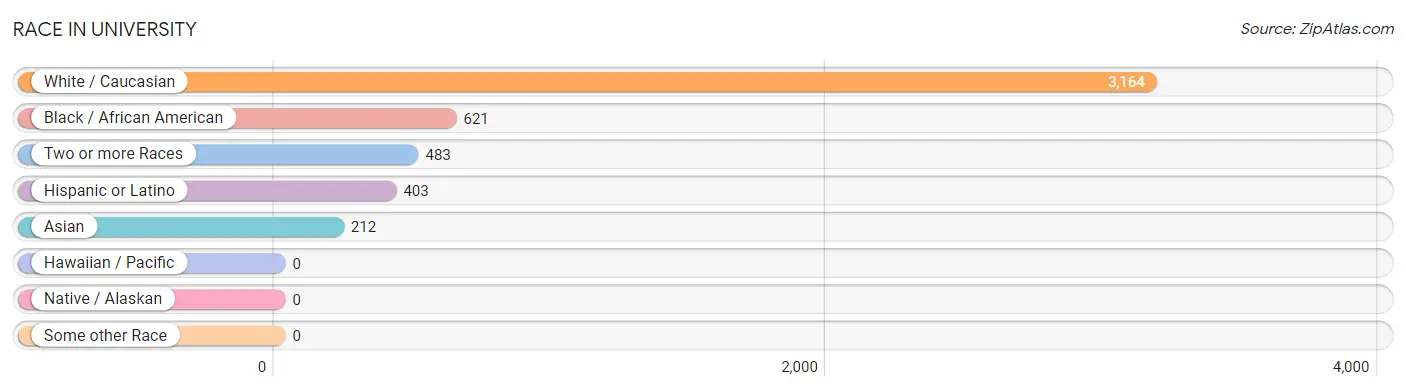
| Race | # Population | % Population |
| Asian | 212 | 4.7% |
| Black / African American | 621 | 13.9% |
| Hawaiian / Pacific | 0 | 0.0% |
| Hispanic or Latino | 403 | 9.0% |
| Native / Alaskan | 0 | 0.0% |
| White / Caucasian | 3,164 | 70.6% |
| Two or more Races | 483 | 10.8% |
| Some other Race | 0 | 0.0% |
| Total | 4,480 | 100.0% |
Ancestry in University
The most populous ancestries reported in University are English (885 | 19.8%), Irish (583 | 13.0%), German (538 | 12.0%), French (203 | 4.5%), and Italian (186 | 4.2%), together accounting for 53.4% of all University residents.
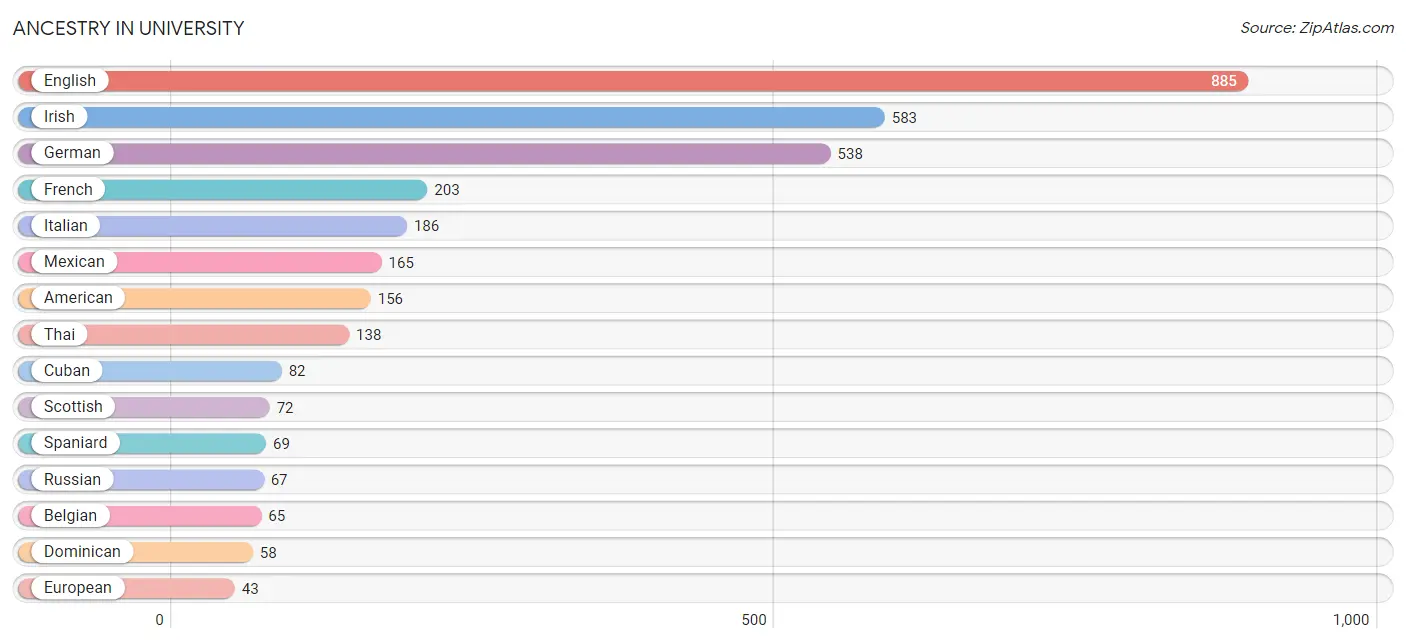
| Ancestry | # Population | % Population |
| African | 2 | 0.0% |
| American | 156 | 3.5% |
| Arab | 9 | 0.2% |
| Belgian | 65 | 1.5% |
| Brazilian | 7 | 0.2% |
| British | 9 | 0.2% |
| Burmese | 10 | 0.2% |
| Central American | 11 | 0.3% |
| Croatian | 3 | 0.1% |
| Cuban | 82 | 1.8% |
| Dominican | 58 | 1.3% |
| Dutch | 1 | 0.0% |
| English | 885 | 19.8% |
| European | 43 | 1.0% |
| French | 203 | 4.5% |
| German | 538 | 12.0% |
| Honduran | 4 | 0.1% |
| Iranian | 14 | 0.3% |
| Irish | 583 | 13.0% |
| Italian | 186 | 4.2% |
| Korean | 9 | 0.2% |
| Mexican | 165 | 3.7% |
| Nicaraguan | 7 | 0.2% |
| Polish | 36 | 0.8% |
| Russian | 67 | 1.5% |
| Scottish | 72 | 1.6% |
| Spaniard | 69 | 1.5% |
| Spanish | 10 | 0.2% |
| Sri Lankan | 10 | 0.2% |
| Subsaharan African | 2 | 0.0% |
| Swedish | 8 | 0.2% |
| Syrian | 9 | 0.2% |
| Thai | 138 | 3.1% |
| Welsh | 22 | 0.5% | View All 34 Rows |
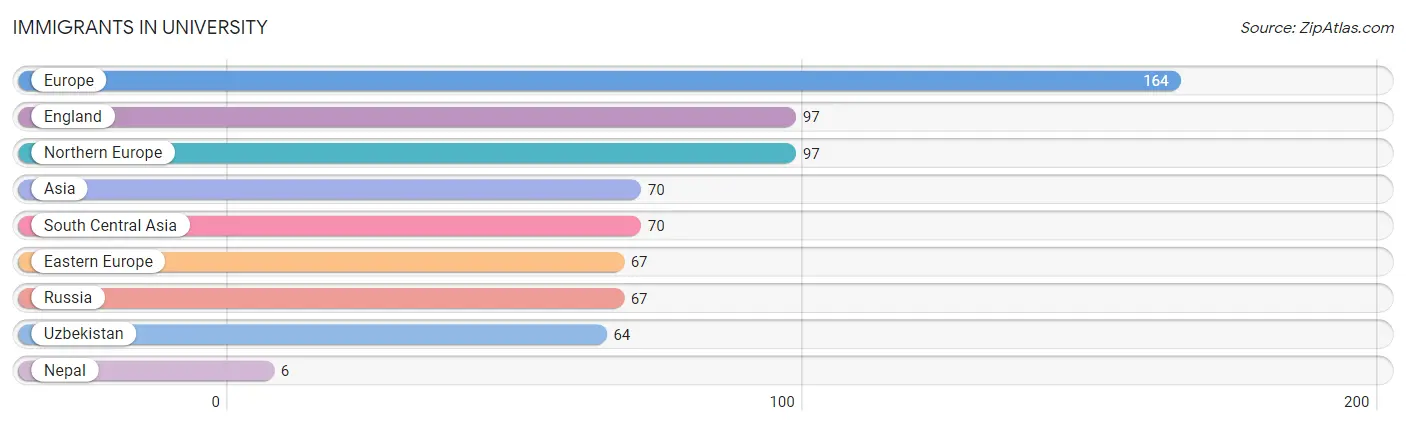
Immigrants in University
The most numerous immigrant groups reported in University came from Europe (164 | 3.7%), England (97 | 2.2%), Northern Europe (97 | 2.2%), Asia (70 | 1.6%), and South Central Asia (70 | 1.6%), together accounting for 11.1% of all University residents.
| Immigration Origin | # Population | % Population |
| Asia | 70 | 1.6% |
| Eastern Europe | 67 | 1.5% |
| England | 97 | 2.2% |
| Europe | 164 | 3.7% |
| Nepal | 6 | 0.1% |
| Northern Europe | 97 | 2.2% |
| Russia | 67 | 1.5% |
| South Central Asia | 70 | 1.6% |
| Uzbekistan | 64 | 1.4% | View All 9 Rows |
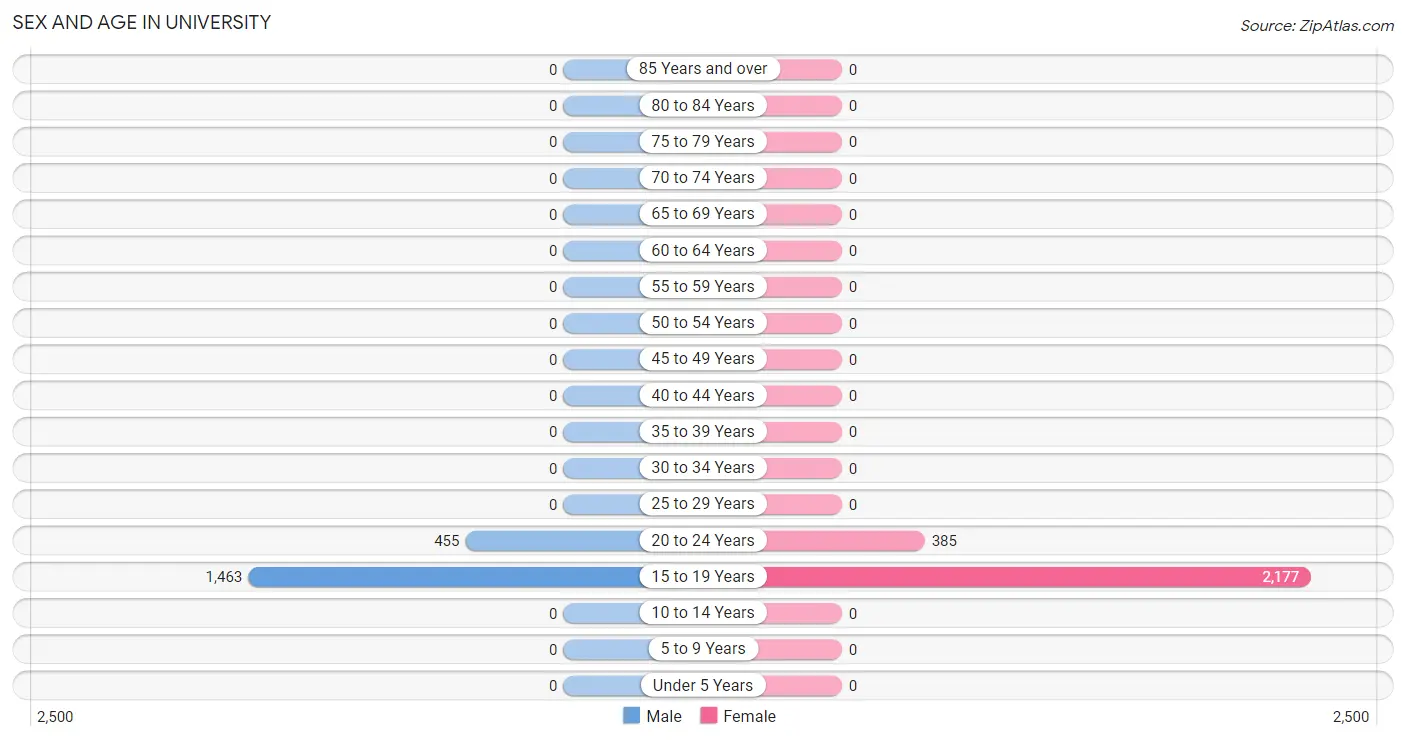
Sex and Age in University
Sex and Age in University
The most populous age groups in University are 15 to 19 Years (1,463 | 76.3%) for men and 15 to 19 Years (2,177 | 85.0%) for women.
| Age Bracket | Male | Female |
| Under 5 Years | 0 (0.0%) | 0 (0.0%) |
| 5 to 9 Years | 0 (0.0%) | 0 (0.0%) |
| 10 to 14 Years | 0 (0.0%) | 0 (0.0%) |
| 15 to 19 Years | 1,463 (76.3%) | 2,177 (85.0%) |
| 20 to 24 Years | 455 (23.7%) | 385 (15.0%) |
| 25 to 29 Years | 0 (0.0%) | 0 (0.0%) |
| 30 to 34 Years | 0 (0.0%) | 0 (0.0%) |
| 35 to 39 Years | 0 (0.0%) | 0 (0.0%) |
| 40 to 44 Years | 0 (0.0%) | 0 (0.0%) |
| 45 to 49 Years | 0 (0.0%) | 0 (0.0%) |
| 50 to 54 Years | 0 (0.0%) | 0 (0.0%) |
| 55 to 59 Years | 0 (0.0%) | 0 (0.0%) |
| 60 to 64 Years | 0 (0.0%) | 0 (0.0%) |
| 65 to 69 Years | 0 (0.0%) | 0 (0.0%) |
| 70 to 74 Years | 0 (0.0%) | 0 (0.0%) |
| 75 to 79 Years | 0 (0.0%) | 0 (0.0%) |
| 80 to 84 Years | 0 (0.0%) | 0 (0.0%) |
| 85 Years and over | 0 (0.0%) | 0 (0.0%) |
| Total | 1,918 (100.0%) | 2,562 (100.0%) |
Families and Households in University
Median Family Size in University
| Family Type | # Families | Family Size |
| Married-Couple | 0 (0.0%) | - |
| Single Male/Father | 0 (0.0%) | - |
| Single Female/Mother | 0 (0.0%) | - |
| Total Families | 0 (0.0%) | - |
Median Household Size in University
| Household Type | # Households | Household Size |
| Married-Couple | 0 (0.0%) | - |
| Single Male/Father | 0 (0.0%) | - |
| Single Female/Mother | 0 (0.0%) | - |
| Non-family | 0 (0.0%) | - |
| Total Households | 0 (0.0%) | - |
Household Size by Marriage Status in University
| Household Size | Family Households | Nonfamily Households |
| 1-Person Households | - | 0 (0.0%) |
| 2-Person Households | 0 (0.0%) | 0 (0.0%) |
| 3-Person Households | 0 (0.0%) | 0 (0.0%) |
| 4-Person Households | 0 (0.0%) | 0 (0.0%) |
| 5-Person Households | 0 (0.0%) | 0 (0.0%) |
| 6-Person Households | 0 (0.0%) | 0 (0.0%) |
| 7+ Person Households | 0 (0.0%) | 0 (0.0%) |
| Total | 0 (0.0%) | 0 (0.0%) |
Female Fertility in University
Fertility by Age in University
| Age Bracket | Women with Births | Births / 1,000 Women |
| 15 to 19 years | 0 (0.0%) | 0.0 |
| 20 to 34 years | 0 (0.0%) | 0.0 |
| 35 to 50 years | 0 (0.0%) | 0.0 |
| Total | 0 (0.0%) | 0.0 |
Fertility by Age by Marriage Status in University
| Age Bracket | Married | Unmarried |
| 15 to 19 years | 0 (0.0%) | 0 (0.0%) |
| 20 to 34 years | 0 (0.0%) | 0 (0.0%) |
| 35 to 50 years | 0 (0.0%) | 0 (0.0%) |
| Total | 0 (0.0%) | 0 (0.0%) |
Fertility by Education in University
| Educational Attainment | Women with Births | Births / 1,000 Women |
| Less than High School | 0 (0.0%) | 0.0 |
| High School Diploma | 0 (0.0%) | 0.0 |
| College or Associate's Degree | 0 (0.0%) | 0.0 |
| Bachelor's Degree | 0 (0.0%) | 0.0 |
| Graduate Degree | 0 (0.0%) | 0.0 |
| Total | 0 (0.0%) | 0.0 |
Fertility by Education by Marriage Status in University
| Educational Attainment | Married | Unmarried |
| Less than High School | 0 (0.0%) | 0 (0.0%) |
| High School Diploma | 0 (0.0%) | 0 (0.0%) |
| College or Associate's Degree | 0 (0.0%) | 0 (0.0%) |
| Bachelor's Degree | 0 (0.0%) | 0 (0.0%) |
| Graduate Degree | 0 (0.0%) | 0 (0.0%) |
| Total | 0 (0.0%) | 0 (0.0%) |
Employment Characteristics in University
Employment by Class of Employer in University
Among the 802 employed individuals in University, private company employees (307 | 38.3%), state government employees (238 | 29.7%), and not-for-profit organizations (183 | 22.8%) make up the most common classes of employment.
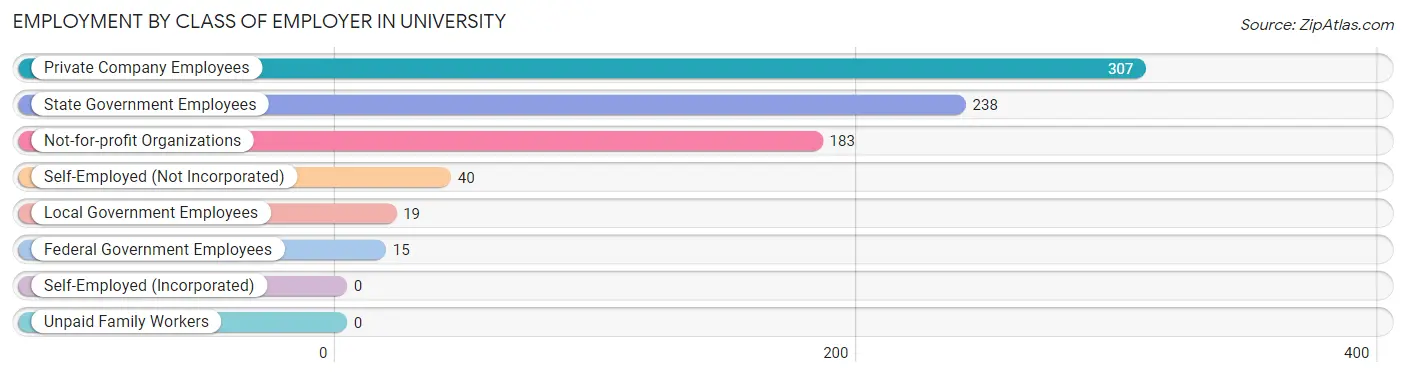
| Employer Class | # Employees | % Employees |
| Private Company Employees | 307 | 38.3% |
| Self-Employed (Incorporated) | 0 | 0.0% |
| Self-Employed (Not Incorporated) | 40 | 5.0% |
| Not-for-profit Organizations | 183 | 22.8% |
| Local Government Employees | 19 | 2.4% |
| State Government Employees | 238 | 29.7% |
| Federal Government Employees | 15 | 1.9% |
| Unpaid Family Workers | 0 | 0.0% |
| Total | 802 | 100.0% |
Employment Status by Age in University
According to the labor force statistics for University, out of the total population over 16 years of age (4,480), 20.0% or 896 individuals are in the labor force, with 0.2% or 2 of them unemployed. The age group with the highest labor force participation rate is 20 to 24 years, with 32.3% or 271 individuals in the labor force. Within the labor force, the 16 to 19 years age range has the highest percentage of unemployed individuals, with 0.3% or 2 of them being unemployed.
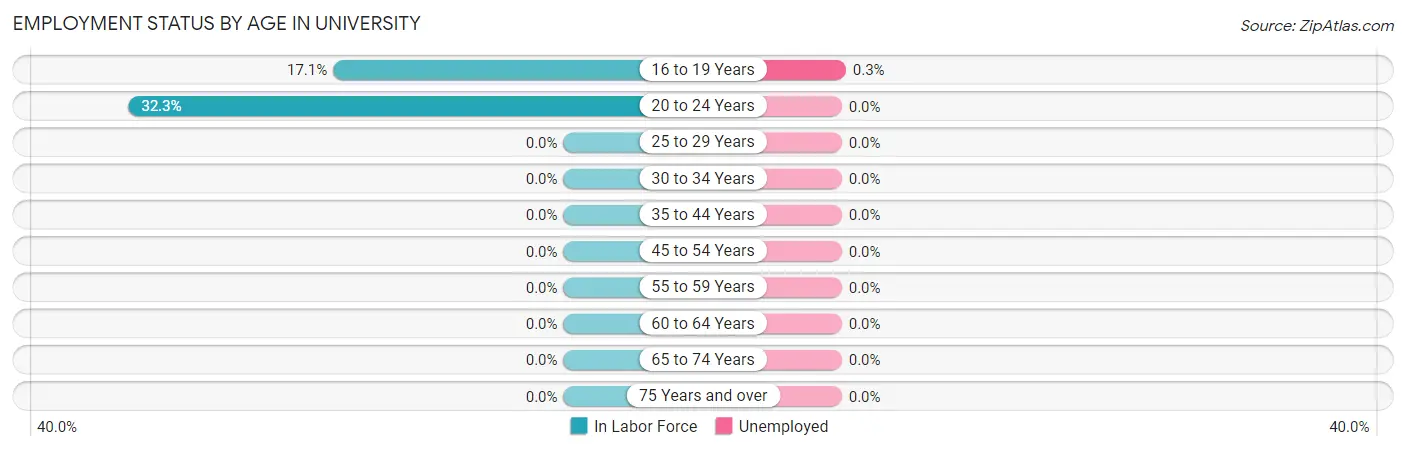
| Age Bracket | In Labor Force | Unemployed |
| 16 to 19 Years | 622 (17.1%) | 2 (0.3%) |
| 20 to 24 Years | 271 (32.3%) | 0 (0.0%) |
| 25 to 29 Years | 0 (0.0%) | 0 (0.0%) |
| 30 to 34 Years | 0 (0.0%) | 0 (0.0%) |
| 35 to 44 Years | 0 (0.0%) | 0 (0.0%) |
| 45 to 54 Years | 0 (0.0%) | 0 (0.0%) |
| 55 to 59 Years | 0 (0.0%) | 0 (0.0%) |
| 60 to 64 Years | 0 (0.0%) | 0 (0.0%) |
| 65 to 74 Years | 0 (0.0%) | 0 (0.0%) |
| 75 Years and over | 0 (0.0%) | 0 (0.0%) |
| Total | 896 (20.0%) | 2 (0.2%) |
Employment Status by Educational Attainment in University
| Educational Attainment | In Labor Force | Unemployed |
| Less than High School | 0 (0.0%) | 0 (0.0%) |
| High School Diploma | 0 (0.0%) | 0 (0.0%) |
| College / Associate Degree | 0 (0.0%) | 0 (0.0%) |
| Bachelor's Degree or higher | 0 (0.0%) | 0 (0.0%) |
| Total | 0 (0.0%) | 0 (0.0%) |
Employment Occupations by Sex in University
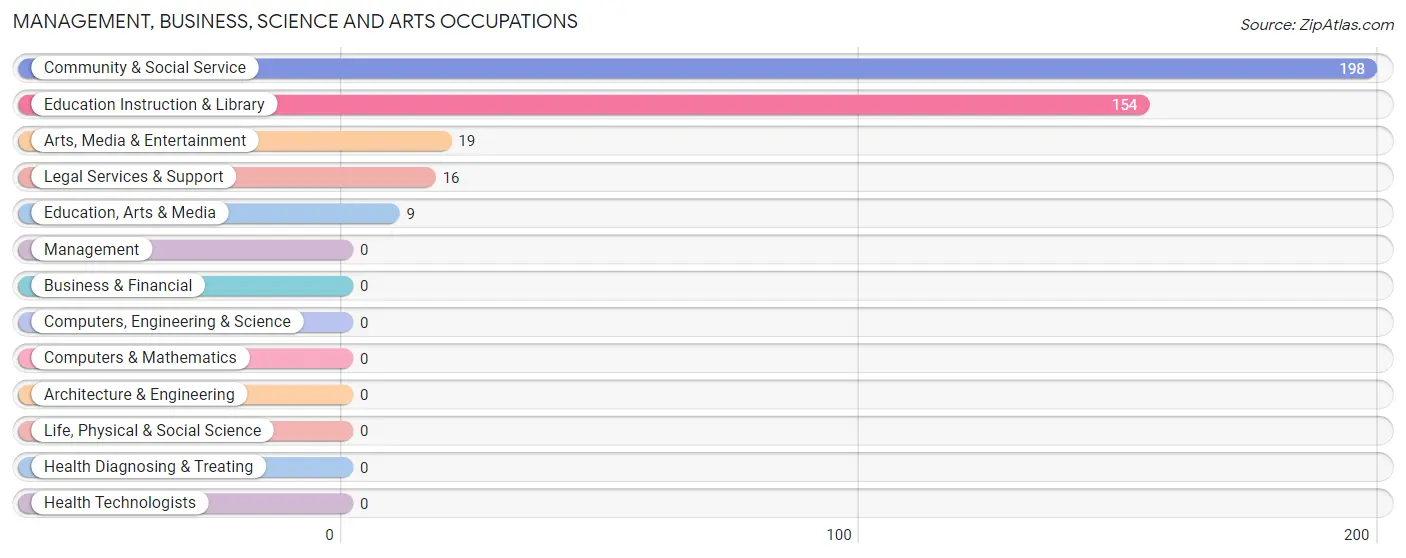
Management, Business, Science and Arts Occupations
The most common Management, Business, Science and Arts occupations in University are Community & Social Service (198 | 22.4%), Education Instruction & Library (154 | 17.4%), Arts, Media & Entertainment (19 | 2.1%), Legal Services & Support (16 | 1.8%), and Education, Arts & Media (9 | 1.0%).
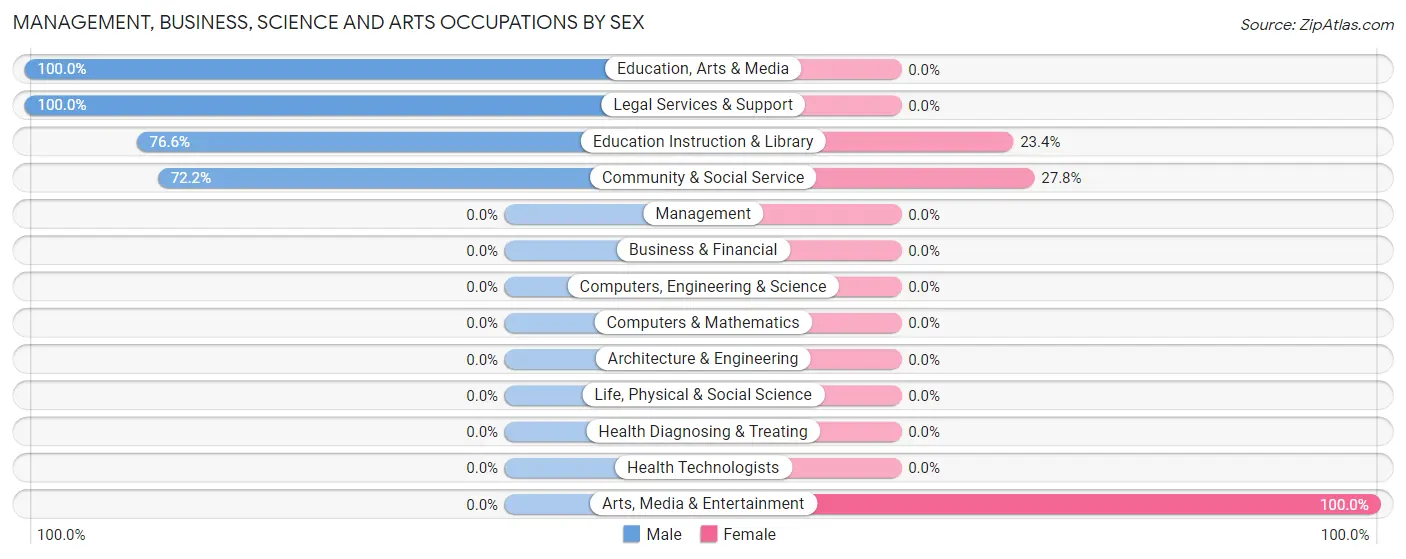
Management, Business, Science and Arts Occupations by Sex
Within the Management, Business, Science and Arts occupations in University, the most male-oriented occupations are Education, Arts & Media (100.0%), Legal Services & Support (100.0%), and Education Instruction & Library (76.6%), while the most female-oriented occupations are Arts, Media & Entertainment (100.0%), Community & Social Service (27.8%), and Education Instruction & Library (23.4%).
| Occupation | Male | Female |
| Management | 0 (0.0%) | 0 (0.0%) |
| Business & Financial | 0 (0.0%) | 0 (0.0%) |
| Computers, Engineering & Science | 0 (0.0%) | 0 (0.0%) |
| Computers & Mathematics | 0 (0.0%) | 0 (0.0%) |
| Architecture & Engineering | 0 (0.0%) | 0 (0.0%) |
| Life, Physical & Social Science | 0 (0.0%) | 0 (0.0%) |
| Community & Social Service | 143 (72.2%) | 55 (27.8%) |
| Education, Arts & Media | 9 (100.0%) | 0 (0.0%) |
| Legal Services & Support | 16 (100.0%) | 0 (0.0%) |
| Education Instruction & Library | 118 (76.6%) | 36 (23.4%) |
| Arts, Media & Entertainment | 0 (0.0%) | 19 (100.0%) |
| Health Diagnosing & Treating | 0 (0.0%) | 0 (0.0%) |
| Health Technologists | 0 (0.0%) | 0 (0.0%) |
| Total (Category) | 143 (72.2%) | 55 (27.8%) |
| Total (Overall) | 443 (50.1%) | 442 (49.9%) |
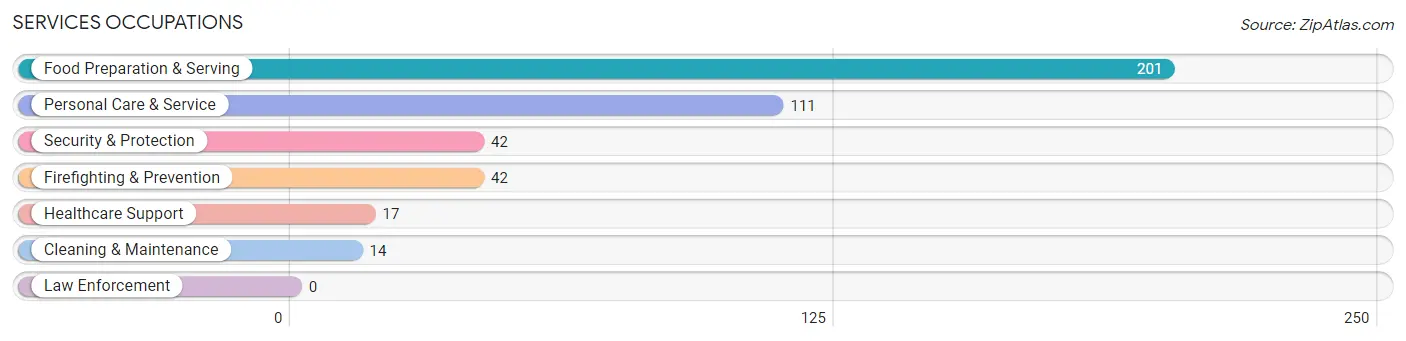
Services Occupations
The most common Services occupations in University are Food Preparation & Serving (201 | 22.7%), Personal Care & Service (111 | 12.5%), Security & Protection (42 | 4.8%), Firefighting & Prevention (42 | 4.8%), and Healthcare Support (17 | 1.9%).
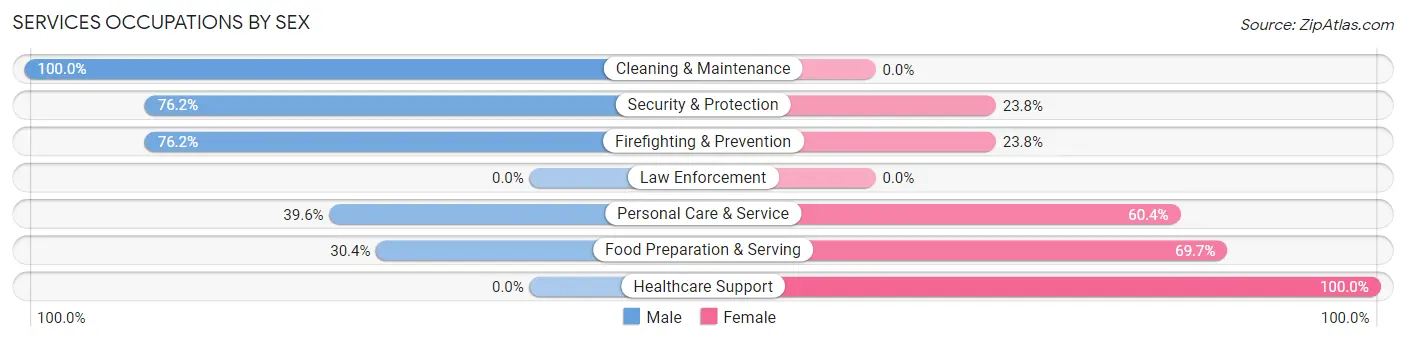
Services Occupations by Sex
Within the Services occupations in University, the most male-oriented occupations are Cleaning & Maintenance (100.0%), Security & Protection (76.2%), and Firefighting & Prevention (76.2%), while the most female-oriented occupations are Healthcare Support (100.0%), Food Preparation & Serving (69.7%), and Personal Care & Service (60.4%).
| Occupation | Male | Female |
| Healthcare Support | 0 (0.0%) | 17 (100.0%) |
| Security & Protection | 32 (76.2%) | 10 (23.8%) |
| Firefighting & Prevention | 32 (76.2%) | 10 (23.8%) |
| Law Enforcement | 0 (0.0%) | 0 (0.0%) |
| Food Preparation & Serving | 61 (30.3%) | 140 (69.7%) |
| Cleaning & Maintenance | 14 (100.0%) | 0 (0.0%) |
| Personal Care & Service | 44 (39.6%) | 67 (60.4%) |
| Total (Category) | 151 (39.2%) | 234 (60.8%) |
| Total (Overall) | 443 (50.1%) | 442 (49.9%) |
Sales and Office Occupations
The most common Sales and Office occupations in University are Office & Administration (147 | 16.6%), and Sales & Related (139 | 15.7%).
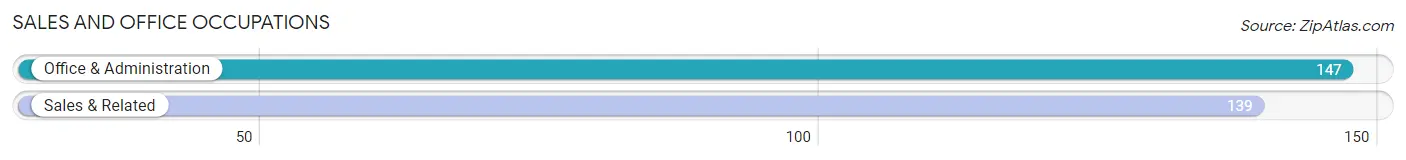
Sales and Office Occupations by Sex
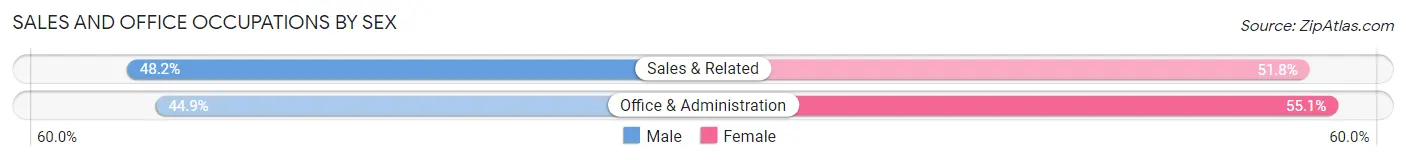
| Occupation | Male | Female |
| Sales & Related | 67 (48.2%) | 72 (51.8%) |
| Office & Administration | 66 (44.9%) | 81 (55.1%) |
| Total (Category) | 133 (46.5%) | 153 (53.5%) |
| Total (Overall) | 443 (50.1%) | 442 (49.9%) |
Natural Resources, Construction and Maintenance Occupations
The most common Natural Resources, Construction and Maintenance occupations in University are , and Installation, Maintenance & Repair (13 | 1.5%).
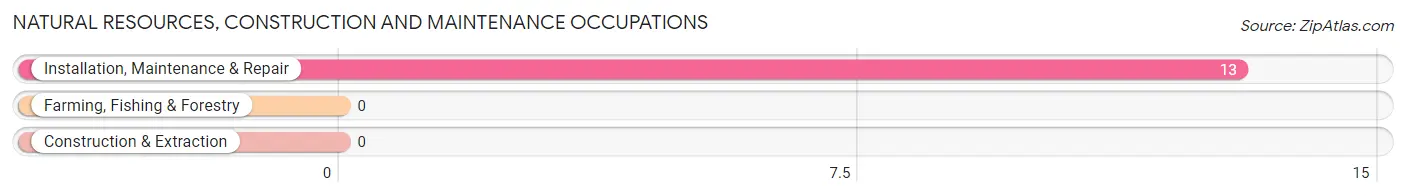
Natural Resources, Construction and Maintenance Occupations by Sex
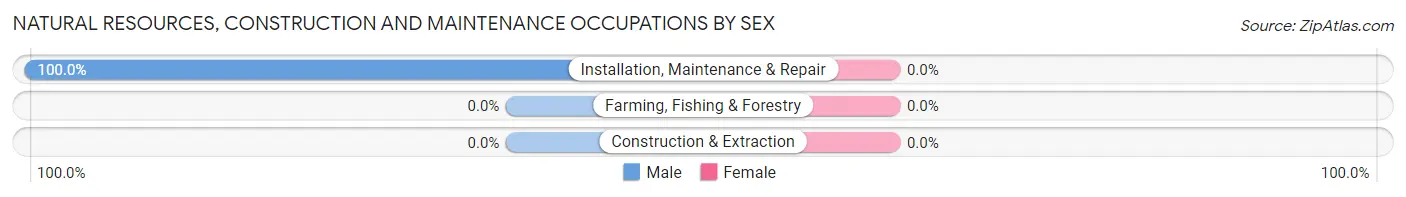
| Occupation | Male | Female |
| Farming, Fishing & Forestry | 0 (0.0%) | 0 (0.0%) |
| Construction & Extraction | 0 (0.0%) | 0 (0.0%) |
| Installation, Maintenance & Repair | 13 (100.0%) | 0 (0.0%) |
| Total (Category) | 13 (100.0%) | 0 (0.0%) |
| Total (Overall) | 443 (50.1%) | 442 (49.9%) |
Production, Transportation and Moving Occupations
The most common Production, Transportation and Moving occupations in University are , and Material Moving (3 | 0.3%).
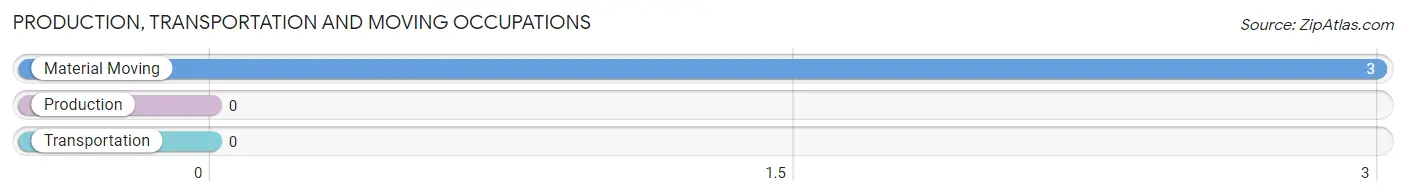
Production, Transportation and Moving Occupations by Sex
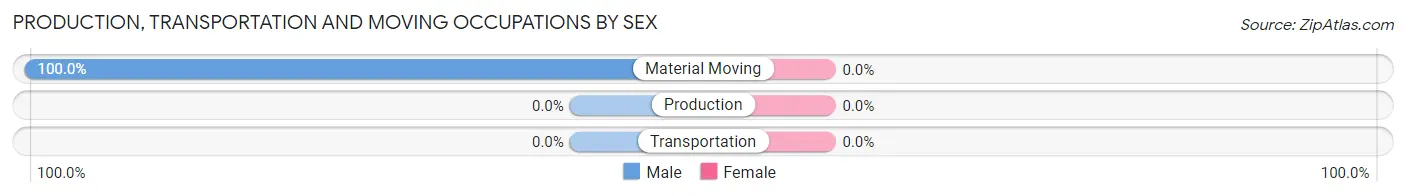
| Occupation | Male | Female |
| Production | 0 (0.0%) | 0 (0.0%) |
| Transportation | 0 (0.0%) | 0 (0.0%) |
| Material Moving | 3 (100.0%) | 0 (0.0%) |
| Total (Category) | 3 (100.0%) | 0 (0.0%) |
| Total (Overall) | 443 (50.1%) | 442 (49.9%) |
Employment Industries by Sex in University
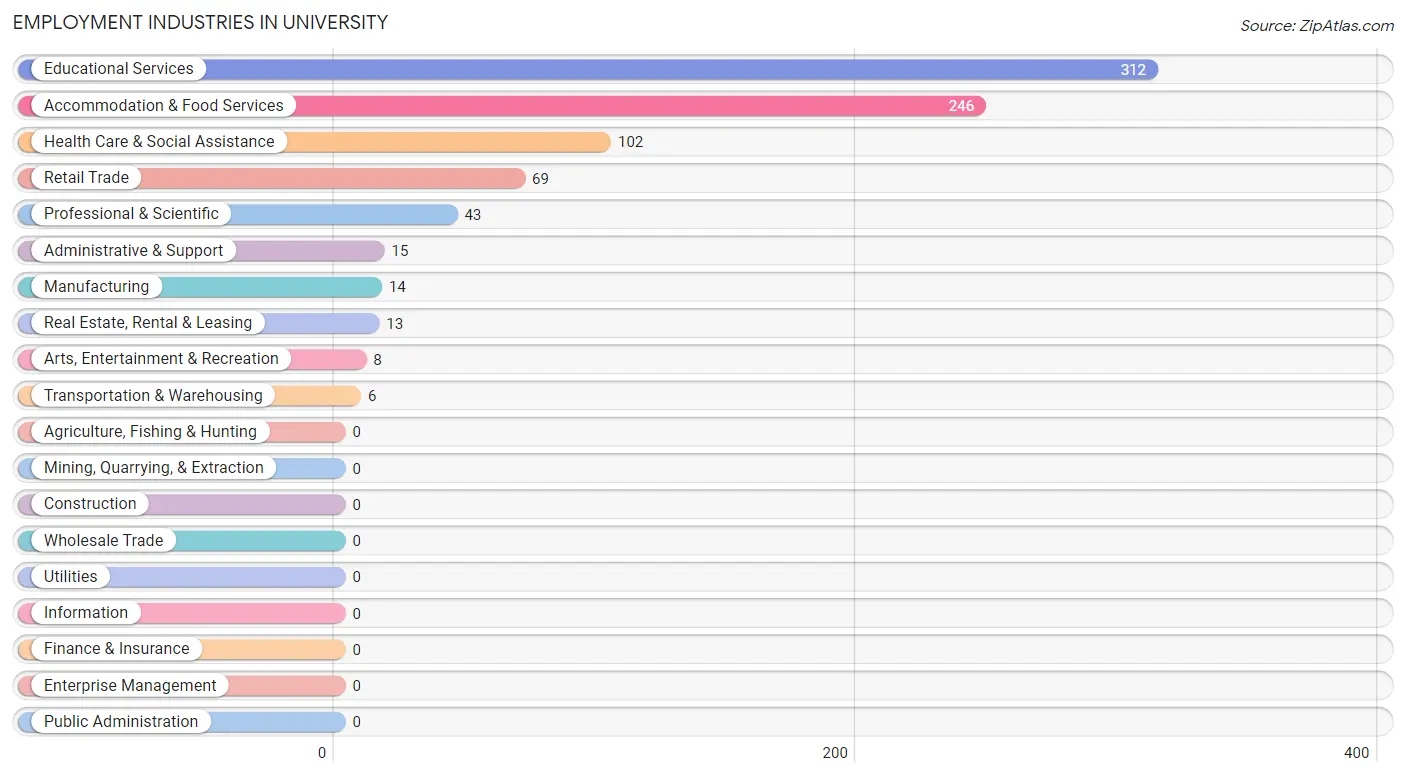
Employment Industries in University
The major employment industries in University include Educational Services (312 | 35.2%), Accommodation & Food Services (246 | 27.8%), Health Care & Social Assistance (102 | 11.5%), Retail Trade (69 | 7.8%), and Professional & Scientific (43 | 4.9%).
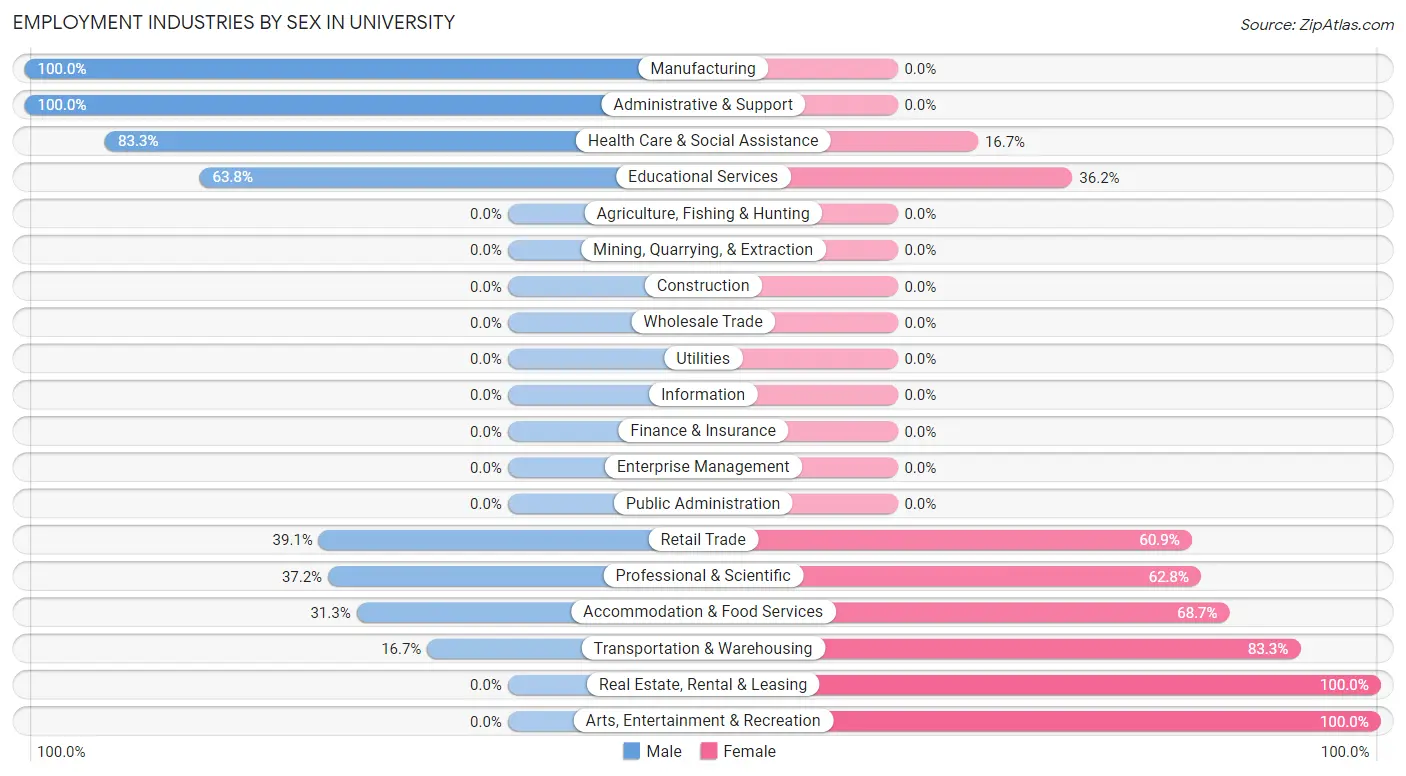
Employment Industries by Sex in University
The University industries that see more men than women are Manufacturing (100.0%), Administrative & Support (100.0%), and Health Care & Social Assistance (83.3%), whereas the industries that tend to have a higher number of women are Real Estate, Rental & Leasing (100.0%), Arts, Entertainment & Recreation (100.0%), and Transportation & Warehousing (83.3%).
| Industry | Male | Female |
| Agriculture, Fishing & Hunting | 0 (0.0%) | 0 (0.0%) |
| Mining, Quarrying, & Extraction | 0 (0.0%) | 0 (0.0%) |
| Construction | 0 (0.0%) | 0 (0.0%) |
| Manufacturing | 14 (100.0%) | 0 (0.0%) |
| Wholesale Trade | 0 (0.0%) | 0 (0.0%) |
| Retail Trade | 27 (39.1%) | 42 (60.9%) |
| Transportation & Warehousing | 1 (16.7%) | 5 (83.3%) |
| Utilities | 0 (0.0%) | 0 (0.0%) |
| Information | 0 (0.0%) | 0 (0.0%) |
| Finance & Insurance | 0 (0.0%) | 0 (0.0%) |
| Real Estate, Rental & Leasing | 0 (0.0%) | 13 (100.0%) |
| Professional & Scientific | 16 (37.2%) | 27 (62.8%) |
| Enterprise Management | 0 (0.0%) | 0 (0.0%) |
| Administrative & Support | 15 (100.0%) | 0 (0.0%) |
| Educational Services | 199 (63.8%) | 113 (36.2%) |
| Health Care & Social Assistance | 85 (83.3%) | 17 (16.7%) |
| Arts, Entertainment & Recreation | 0 (0.0%) | 8 (100.0%) |
| Accommodation & Food Services | 77 (31.3%) | 169 (68.7%) |
| Public Administration | 0 (0.0%) | 0 (0.0%) |
| Total | 443 (50.1%) | 442 (49.9%) |
Education in University
School Enrollment in University
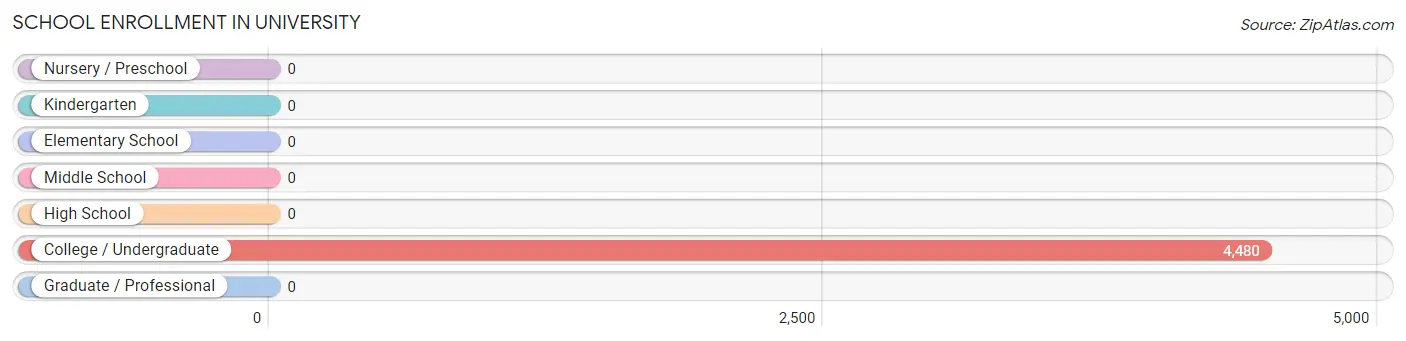
| School Level | # Students | % Students |
| Nursery / Preschool | 0 | 0.0% |
| Kindergarten | 0 | 0.0% |
| Elementary School | 0 | 0.0% |
| Middle School | 0 | 0.0% |
| High School | 0 | 0.0% |
| College / Undergraduate | 4,480 | 100.0% |
| Graduate / Professional | 0 | 0.0% |
| Total | 4,480 | 100.0% |
School Enrollment by Age by Funding Source in University
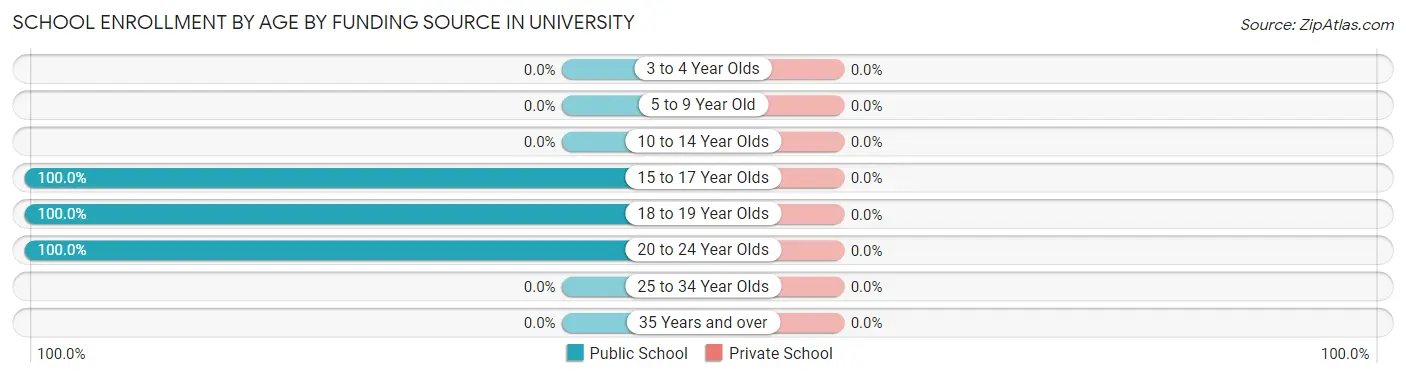
| Age Bracket | Public School | Private School |
| 3 to 4 Year Olds | 0 (0.0%) | 0 (0.0%) |
| 5 to 9 Year Old | 0 (0.0%) | 0 (0.0%) |
| 10 to 14 Year Olds | 0 (0.0%) | 0 (0.0%) |
| 15 to 17 Year Olds | 28 (100.0%) | 0 (0.0%) |
| 18 to 19 Year Olds | 3,612 (100.0%) | 0 (0.0%) |
| 20 to 24 Year Olds | 840 (100.0%) | 0 (0.0%) |
| 25 to 34 Year Olds | 0 (0.0%) | 0 (0.0%) |
| 35 Years and over | 0 (0.0%) | 0 (0.0%) |
| Total | 4,480 (100.0%) | 0 (0.0%) |
Educational Attainment by Field of Study in University
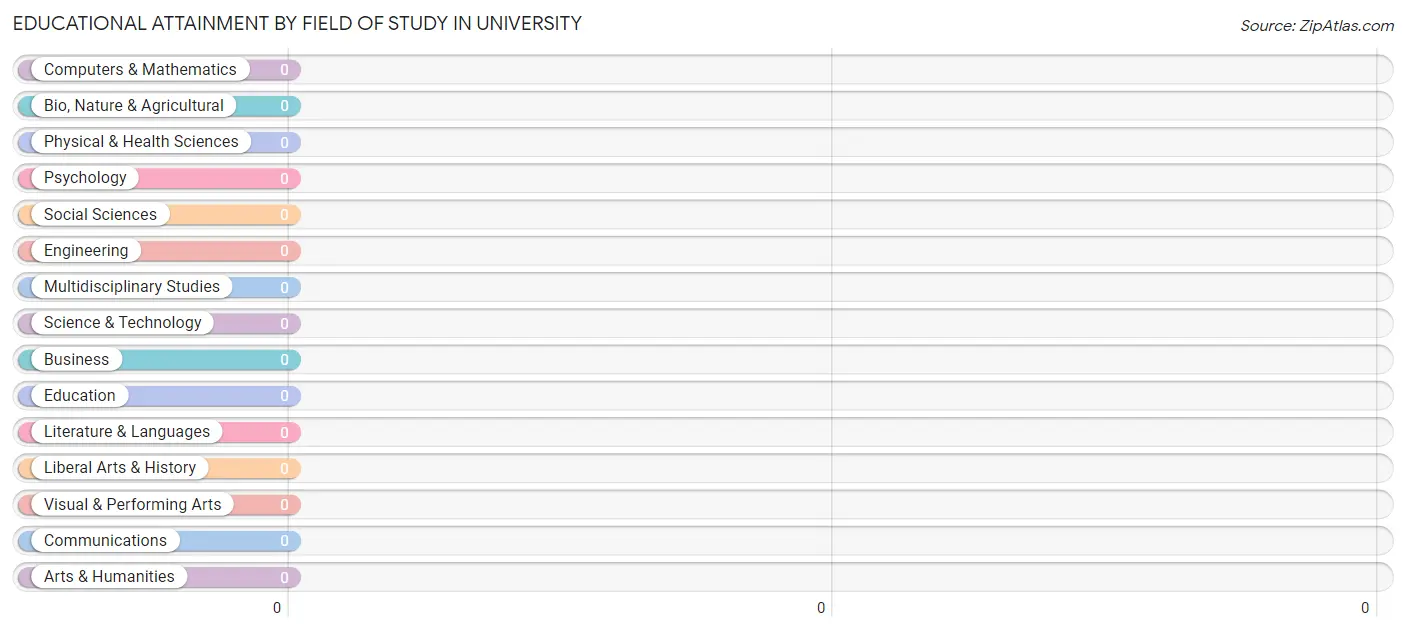
| Field of Study | # Graduates | % Graduates |
| Computers & Mathematics | 0 | 0.0% |
| Bio, Nature & Agricultural | 0 | 0.0% |
| Physical & Health Sciences | 0 | 0.0% |
| Psychology | 0 | 0.0% |
| Social Sciences | 0 | 0.0% |
| Engineering | 0 | 0.0% |
| Multidisciplinary Studies | 0 | 0.0% |
| Science & Technology | 0 | 0.0% |
| Business | 0 | 0.0% |
| Education | 0 | 0.0% |
| Literature & Languages | 0 | 0.0% |
| Liberal Arts & History | 0 | 0.0% |
| Visual & Performing Arts | 0 | 0.0% |
| Communications | 0 | 0.0% |
| Arts & Humanities | 0 | 0.0% |
| Total | 0 | 0.0% |
Transportation & Commute in University
Vehicle Availability by Sex in University
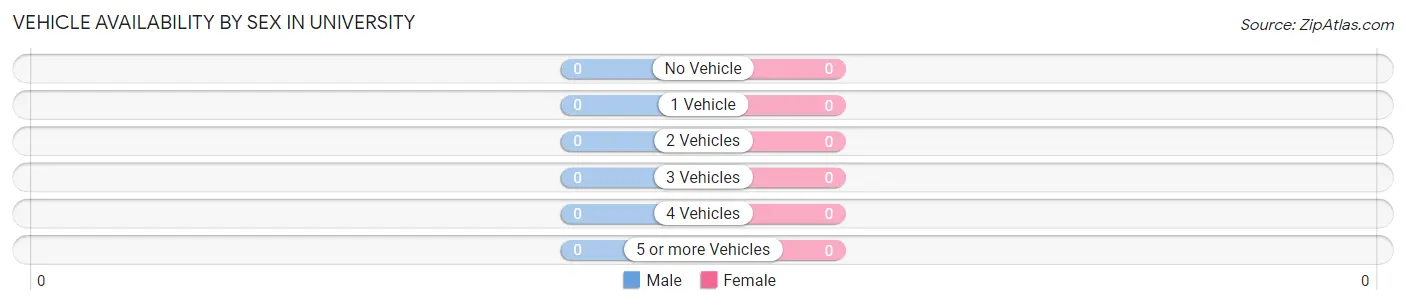
| Vehicles Available | Male | Female |
| No Vehicle | 0 (0.0%) | 0 (0.0%) |
| 1 Vehicle | 0 (0.0%) | 0 (0.0%) |
| 2 Vehicles | 0 (0.0%) | 0 (0.0%) |
| 3 Vehicles | 0 (0.0%) | 0 (0.0%) |
| 4 Vehicles | 0 (0.0%) | 0 (0.0%) |
| 5 or more Vehicles | 0 (0.0%) | 0 (0.0%) |
| Total | 0 (0.0%) | 0 (0.0%) |
Commute Time in University
The most frequently occuring commute durations in University are 5 to 9 minutes (452 commuters, 62.1%), 15 to 19 minutes (123 commuters, 16.9%), and less than 5 minutes (69 commuters, 9.5%).
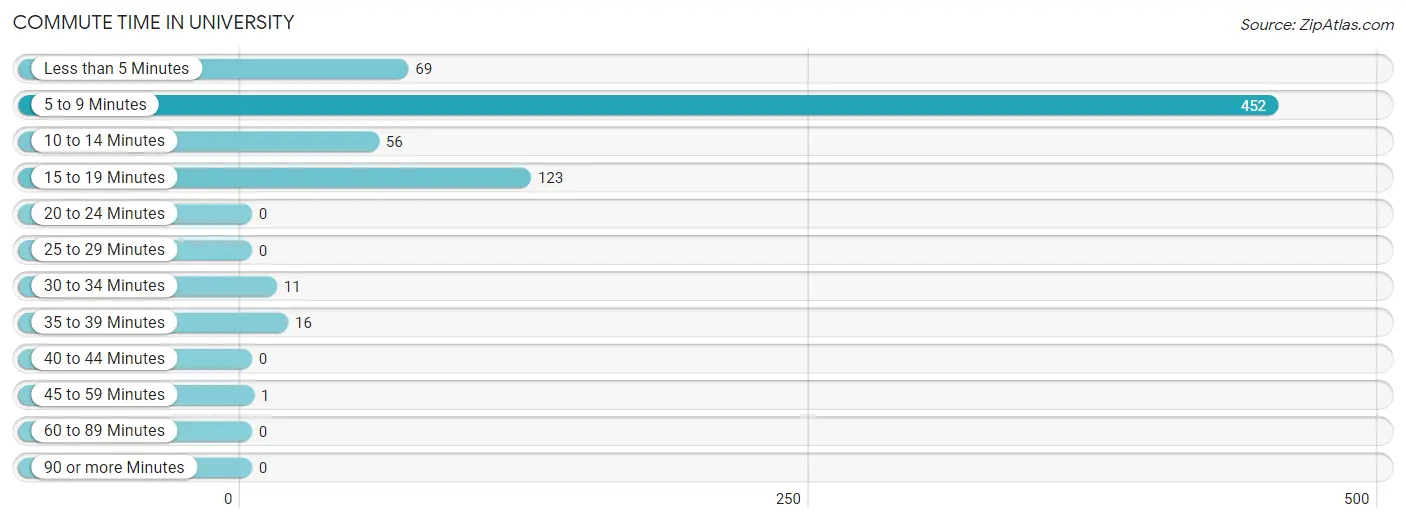
| Commute Time | # Commuters | % Commuters |
| Less than 5 Minutes | 69 | 9.5% |
| 5 to 9 Minutes | 452 | 62.1% |
| 10 to 14 Minutes | 56 | 7.7% |
| 15 to 19 Minutes | 123 | 16.9% |
| 20 to 24 Minutes | 0 | 0.0% |
| 25 to 29 Minutes | 0 | 0.0% |
| 30 to 34 Minutes | 11 | 1.5% |
| 35 to 39 Minutes | 16 | 2.2% |
| 40 to 44 Minutes | 0 | 0.0% |
| 45 to 59 Minutes | 1 | 0.1% |
| 60 to 89 Minutes | 0 | 0.0% |
| 90 or more Minutes | 0 | 0.0% |
Commute Time by Sex in University
The most common commute times in University are 5 to 9 minutes (265 commuters, 66.7%) for males and 5 to 9 minutes (187 commuters, 56.5%) for females.
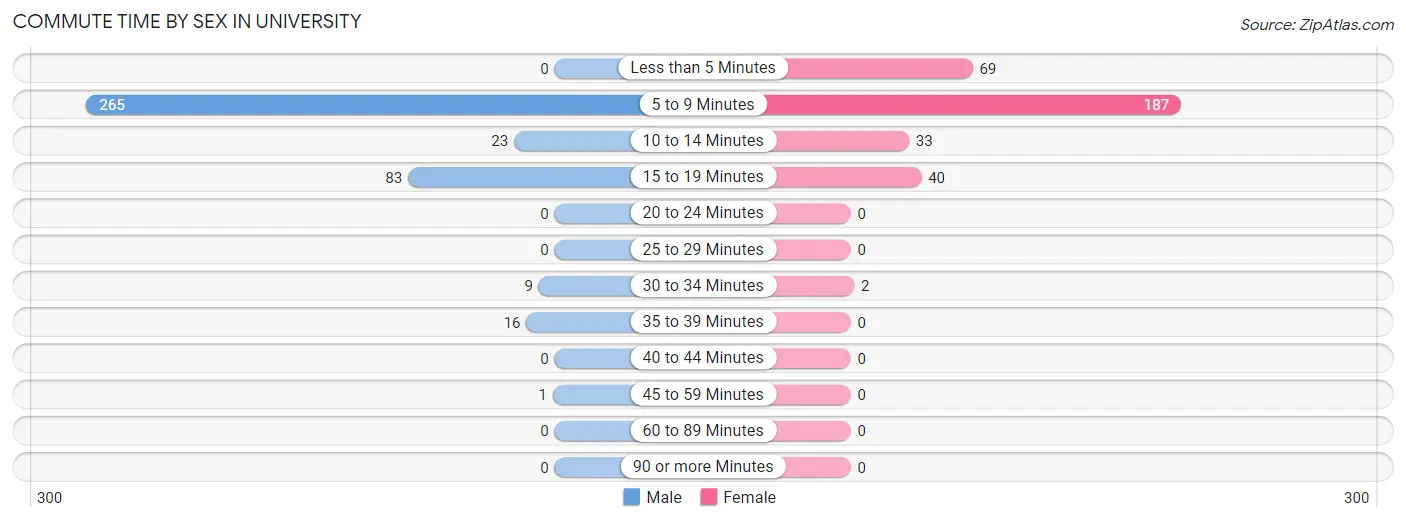
| Commute Time | Male | Female |
| Less than 5 Minutes | 0 (0.0%) | 69 (20.8%) |
| 5 to 9 Minutes | 265 (66.7%) | 187 (56.5%) |
| 10 to 14 Minutes | 23 (5.8%) | 33 (10.0%) |
| 15 to 19 Minutes | 83 (20.9%) | 40 (12.1%) |
| 20 to 24 Minutes | 0 (0.0%) | 0 (0.0%) |
| 25 to 29 Minutes | 0 (0.0%) | 0 (0.0%) |
| 30 to 34 Minutes | 9 (2.3%) | 2 (0.6%) |
| 35 to 39 Minutes | 16 (4.0%) | 0 (0.0%) |
| 40 to 44 Minutes | 0 (0.0%) | 0 (0.0%) |
| 45 to 59 Minutes | 1 (0.3%) | 0 (0.0%) |
| 60 to 89 Minutes | 0 (0.0%) | 0 (0.0%) |
| 90 or more Minutes | 0 (0.0%) | 0 (0.0%) |
Time of Departure to Work by Sex in University
The most frequent times of departure to work in University are 12:00 PM to 3:59 PM (163, 41.1%) for males and 12:00 PM to 3:59 PM (157, 47.4%) for females.
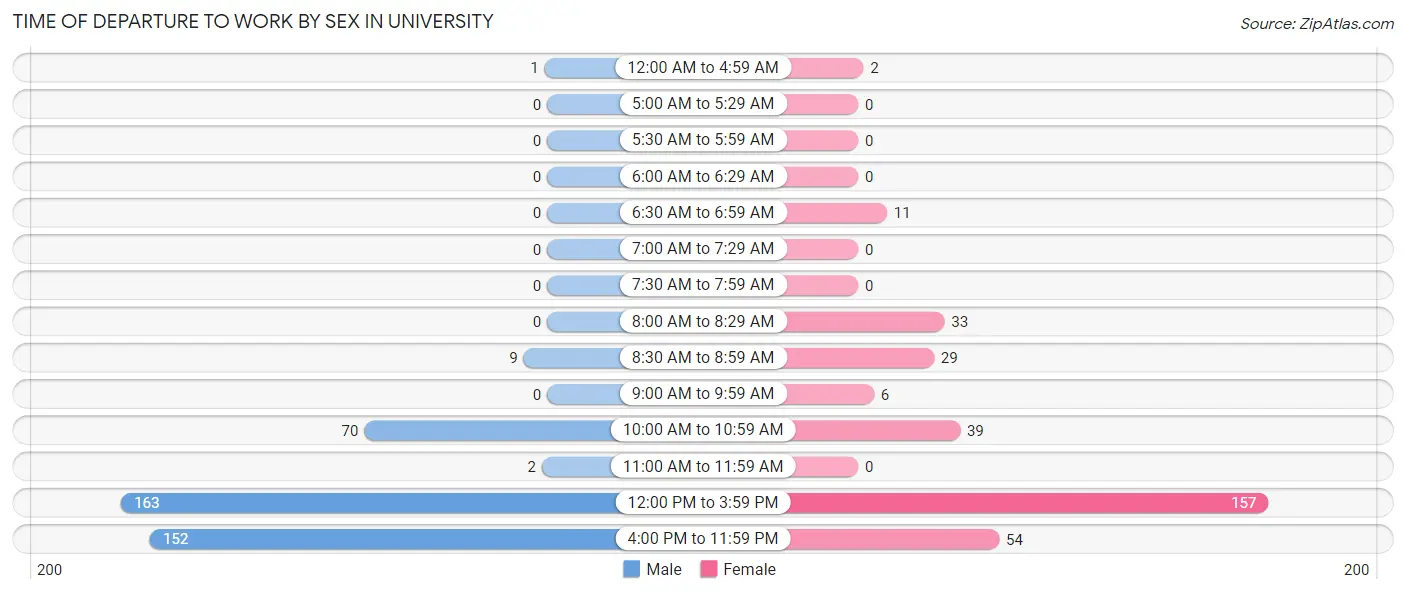
| Time of Departure | Male | Female |
| 12:00 AM to 4:59 AM | 1 (0.3%) | 2 (0.6%) |
| 5:00 AM to 5:29 AM | 0 (0.0%) | 0 (0.0%) |
| 5:30 AM to 5:59 AM | 0 (0.0%) | 0 (0.0%) |
| 6:00 AM to 6:29 AM | 0 (0.0%) | 0 (0.0%) |
| 6:30 AM to 6:59 AM | 0 (0.0%) | 11 (3.3%) |
| 7:00 AM to 7:29 AM | 0 (0.0%) | 0 (0.0%) |
| 7:30 AM to 7:59 AM | 0 (0.0%) | 0 (0.0%) |
| 8:00 AM to 8:29 AM | 0 (0.0%) | 33 (10.0%) |
| 8:30 AM to 8:59 AM | 9 (2.3%) | 29 (8.8%) |
| 9:00 AM to 9:59 AM | 0 (0.0%) | 6 (1.8%) |
| 10:00 AM to 10:59 AM | 70 (17.6%) | 39 (11.8%) |
| 11:00 AM to 11:59 AM | 2 (0.5%) | 0 (0.0%) |
| 12:00 PM to 3:59 PM | 163 (41.1%) | 157 (47.4%) |
| 4:00 PM to 11:59 PM | 152 (38.3%) | 54 (16.3%) |
| Total | 397 (100.0%) | 331 (100.0%) |
Housing Occupancy in University
Occupancy by Ownership in University
| Occupancy | # Housing Units | % Housing Units |
| Owner Occupied Housing Units | 0 | 0.0% |
| Renter-Occupied Housing Units | 0 | 0.0% |
| Total Occupied Housing Units | 0 | 0.0% |
Occupancy by Household Size in University
| Household Size | # Housing Units | % Housing Units |
| 1-Person Household | 0 | 0.0% |
| 2-Person Household | 0 | 0.0% |
| 3-Person Household | 0 | 0.0% |
| 4+ Person Household | 0 | 0.0% |
| Total Housing Units | 0 | 0.0% |
Occupancy by Ownership by Household Size in University
| Household Size | Owner-occupied | Renter-occupied |
| 1-Person Household | 0 (0.0%) | 0 (0.0%) |
| 2-Person Household | 0 (0.0%) | 0 (0.0%) |
| 3-Person Household | 0 (0.0%) | 0 (0.0%) |
| 4+ Person Household | 0 (0.0%) | 0 (0.0%) |
| Total Housing Units | 0 (0.0%) | 0 (0.0%) |
Occupancy by Educational Attainment in University
| Household Size | Owner-occupied | Renter-occupied |
| Less than High School | 0 (0.0%) | 0 (0.0%) |
| High School Diploma | 0 (0.0%) | 0 (0.0%) |
| College/Associate Degree | 0 (0.0%) | 0 (0.0%) |
| Bachelor's Degree or higher | 0 (0.0%) | 0 (0.0%) |
Occupancy by Age of Householder in University
| Age Bracket | # Households | % Households |
| Under 35 Years | 0 | 0.0% |
| 35 to 44 Years | 0 | 0.0% |
| 45 to 54 Years | 0 | 0.0% |
| 55 to 64 Years | 0 | 0.0% |
| 65 to 74 Years | 0 | 0.0% |
| 75 to 84 Years | 0 | 0.0% |
| 85 Years and Over | 0 | 0.0% |
| Total | 0 | 0.0% |
Housing Finances in University
Median Income by Occupancy in University
| Occupancy Type | # Households | Median Income |
| Owner-Occupied | 0 (0.0%) | $0 |
| Renter-Occupied | 0 (0.0%) | $0 |
| Average | 0 (0.0%) | $0 |
Occupancy by Householder Income Bracket in University
| Income Bracket | Owner-occupied | Renter-occupied |
| Less than $5,000 | 0 (0.0%) | 0 (0.0%) |
| $5,000 to $9,999 | 0 (0.0%) | 0 (0.0%) |
| $10,000 to $14,999 | 0 (0.0%) | 0 (0.0%) |
| $15,000 to $19,999 | 0 (0.0%) | 0 (0.0%) |
| $20,000 to $24,999 | 0 (0.0%) | 0 (0.0%) |
| $25,000 to $34,999 | 0 (0.0%) | 0 (0.0%) |
| $35,000 to $49,999 | 0 (0.0%) | 0 (0.0%) |
| $50,000 to $74,999 | 0 (0.0%) | 0 (0.0%) |
| $75,000 to $99,999 | 0 (0.0%) | 0 (0.0%) |
| $100,000 to $149,999 | 0 (0.0%) | 0 (0.0%) |
| $150,000 or more | 0 (0.0%) | 0 (0.0%) |
| Total | 0 (0.0%) | 0 (0.0%) |
Monthly Housing Cost Tiers in University
| Monthly Cost | Owner-occupied | Renter-occupied |
| Less than $300 | 0 (0.0%) | 0 (0.0%) |
| $300 to $499 | 0 (0.0%) | 0 (0.0%) |
| $500 to $799 | 0 (0.0%) | 0 (0.0%) |
| $800 to $999 | 0 (0.0%) | 0 (0.0%) |
| $1,000 to $1,499 | 0 (0.0%) | 0 (0.0%) |
| $1,500 to $1,999 | 0 (0.0%) | 0 (0.0%) |
| $2,000 to $2,499 | 0 (0.0%) | 0 (0.0%) |
| $2,500 to $2,999 | 0 (0.0%) | 0 (0.0%) |
| $3,000 or more | 0 (0.0%) | 0 (0.0%) |
| Total | 0 (0.0%) | 0 (0.0%) |
Physical Housing Characteristics in University
Housing Structures in University
| Structure Type | # Housing Units | % Housing Units |
| Single Unit, Detached | 0 | 0.0% |
| Single Unit, Attached | 0 | 0.0% |
| 2 Unit Apartments | 0 | 0.0% |
| 3 or 4 Unit Apartments | 0 | 0.0% |
| 5 to 9 Unit Apartments | 0 | 0.0% |
| 10 or more Apartments | 0 | 0.0% |
| Mobile Home / Other | 0 | 0.0% |
| Total | 0 | 0.0% |
Housing Structures by Occupancy in University
| Structure Type | Owner-occupied | Renter-occupied |
| Single Unit, Detached | 0 (0.0%) | 0 (0.0%) |
| Single Unit, Attached | 0 (0.0%) | 0 (0.0%) |
| 2 Unit Apartments | 0 (0.0%) | 0 (0.0%) |
| 3 or 4 Unit Apartments | 0 (0.0%) | 0 (0.0%) |
| 5 to 9 Unit Apartments | 0 (0.0%) | 0 (0.0%) |
| 10 or more Apartments | 0 (0.0%) | 0 (0.0%) |
| Mobile Home / Other | 0 (0.0%) | 0 (0.0%) |
| Total | 0 (0.0%) | 0 (0.0%) |
Housing Structures by Number of Rooms in University
| Number of Rooms | Owner-occupied | Renter-occupied |
| 1 Room | 0 (0.0%) | 0 (0.0%) |
| 2 or 3 Rooms | 0 (0.0%) | 0 (0.0%) |
| 4 or 5 Rooms | 0 (0.0%) | 0 (0.0%) |
| 6 or 7 Rooms | 0 (0.0%) | 0 (0.0%) |
| 8 or more Rooms | 0 (0.0%) | 0 (0.0%) |
| Total | 0 (0.0%) | 0 (0.0%) |
Housing Structure by Heating Type in University
| Heating Type | Owner-occupied | Renter-occupied |
| Utility Gas | 0 (0.0%) | 0 (0.0%) |
| Bottled, Tank, or LP Gas | 0 (0.0%) | 0 (0.0%) |
| Electricity | 0 (0.0%) | 0 (0.0%) |
| Fuel Oil or Kerosene | 0 (0.0%) | 0 (0.0%) |
| Coal or Coke | 0 (0.0%) | 0 (0.0%) |
| All other Fuels | 0 (0.0%) | 0 (0.0%) |
| No Fuel Used | 0 (0.0%) | 0 (0.0%) |
| Total | 0 (0.0%) | 0 (0.0%) |
Household Vehicle Usage in University
| Vehicles per Household | Owner-occupied | Renter-occupied |
| No Vehicle | 0 (0.0%) | 0 (0.0%) |
| 1 Vehicle | 0 (0.0%) | 0 (0.0%) |
| 2 Vehicles | 0 (0.0%) | 0 (0.0%) |
| 3 or more Vehicles | 0 (0.0%) | 0 (0.0%) |
| Total | 0 (0.0%) | 0 (0.0%) |
Real Estate & Mortgages in University
Real Estate and Mortgage Overview in University
| Characteristic | Without Mortgage | With Mortgage |
| Housing Units | 0 | 0 |
| Median Property Value | - | - |
| Median Household Income | - | - |
| Monthly Housing Costs | - | - |
| Real Estate Taxes | - | - |
Property Value by Mortgage Status in University
| Property Value | Without Mortgage | With Mortgage |
| Less than $50,000 | 0 (0.0%) | 0 (0.0%) |
| $50,000 to $99,999 | 0 (0.0%) | 0 (0.0%) |
| $100,000 to $299,999 | 0 (0.0%) | 0 (0.0%) |
| $300,000 to $499,999 | 0 (0.0%) | 0 (0.0%) |
| $500,000 to $749,999 | 0 (0.0%) | 0 (0.0%) |
| $750,000 to $999,999 | 0 (0.0%) | 0 (0.0%) |
| $1,000,000 or more | 0 (0.0%) | 0 (0.0%) |
| Total | 0 (0.0%) | 0 (0.0%) |
Household Income by Mortgage Status in University
| Household Income | Without Mortgage | With Mortgage |
| Less than $10,000 | 0 (0.0%) | 0 (0.0%) |
| $10,000 to $24,999 | 0 (0.0%) | 0 (0.0%) |
| $25,000 to $34,999 | 0 (0.0%) | 0 (0.0%) |
| $35,000 to $49,999 | 0 (0.0%) | 0 (0.0%) |
| $50,000 to $74,999 | 0 (0.0%) | 0 (0.0%) |
| $75,000 to $99,999 | 0 (0.0%) | 0 (0.0%) |
| $100,000 to $149,999 | 0 (0.0%) | 0 (0.0%) |
| $150,000 or more | 0 (0.0%) | 0 (0.0%) |
| Total | 0 (0.0%) | 0 (0.0%) |
Property Value to Household Income Ratio in University
| Value-to-Income Ratio | Without Mortgage | With Mortgage |
| Less than 2.0x | 0 (0.0%) | 0 (0.0%) |
| 2.0x to 2.9x | 0 (0.0%) | 0 (0.0%) |
| 3.0x to 3.9x | 0 (0.0%) | 0 (0.0%) |
| 4.0x or more | 0 (0.0%) | 0 (0.0%) |
| Total | 0 (0.0%) | 0 (0.0%) |
Real Estate Taxes by Mortgage Status in University
| Property Taxes | Without Mortgage | With Mortgage |
| Less than $800 | 0 (0.0%) | 0 (0.0%) |
| $800 to $1,499 | 0 (0.0%) | 0 (0.0%) |
| $800 to $1,499 | 0 (0.0%) | 0 (0.0%) |
| Total | 0 (0.0%) | 0 (0.0%) |
Health & Disability in University
Health Insurance Coverage by Age in University
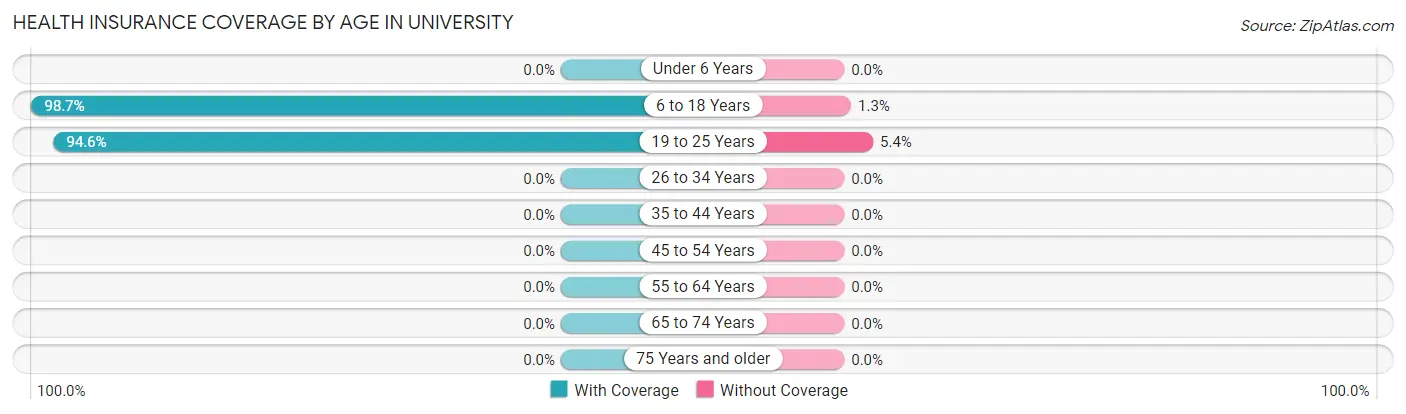
| Age Bracket | With Coverage | Without Coverage |
| Under 6 Years | 0 (0.0%) | 0 (0.0%) |
| 6 to 18 Years | 1,788 (98.7%) | 23 (1.3%) |
| 19 to 25 Years | 2,519 (94.6%) | 143 (5.4%) |
| 26 to 34 Years | 0 (0.0%) | 0 (0.0%) |
| 35 to 44 Years | 0 (0.0%) | 0 (0.0%) |
| 45 to 54 Years | 0 (0.0%) | 0 (0.0%) |
| 55 to 64 Years | 0 (0.0%) | 0 (0.0%) |
| 65 to 74 Years | 0 (0.0%) | 0 (0.0%) |
| 75 Years and older | 0 (0.0%) | 0 (0.0%) |
| Total | 4,307 (96.3%) | 166 (3.7%) |
Health Insurance Coverage by Citizenship Status in University
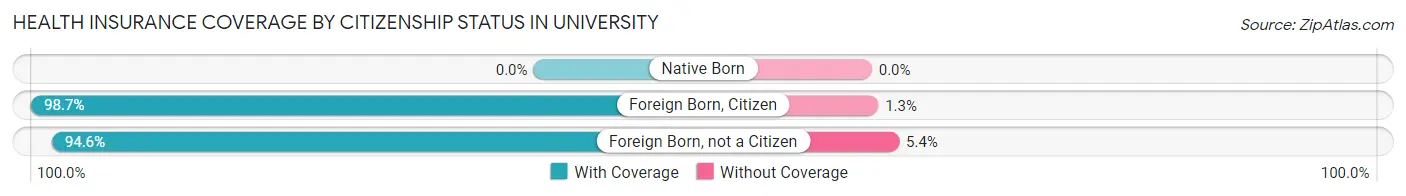
| Citizenship Status | With Coverage | Without Coverage |
| Native Born | 0 (0.0%) | 0 (0.0%) |
| Foreign Born, Citizen | 1,788 (98.7%) | 23 (1.3%) |
| Foreign Born, not a Citizen | 2,519 (94.6%) | 143 (5.4%) |
Health Insurance Coverage by Household Income in University
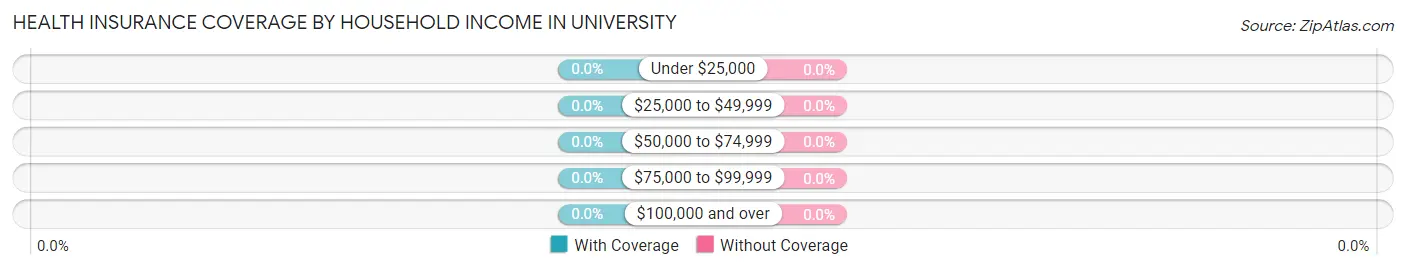
| Household Income | With Coverage | Without Coverage |
| Under $25,000 | 0 (0.0%) | 0 (0.0%) |
| $25,000 to $49,999 | 0 (0.0%) | 0 (0.0%) |
| $50,000 to $74,999 | 0 (0.0%) | 0 (0.0%) |
| $75,000 to $99,999 | 0 (0.0%) | 0 (0.0%) |
| $100,000 and over | 0 (0.0%) | 0 (0.0%) |
Public vs Private Health Insurance Coverage by Age in University
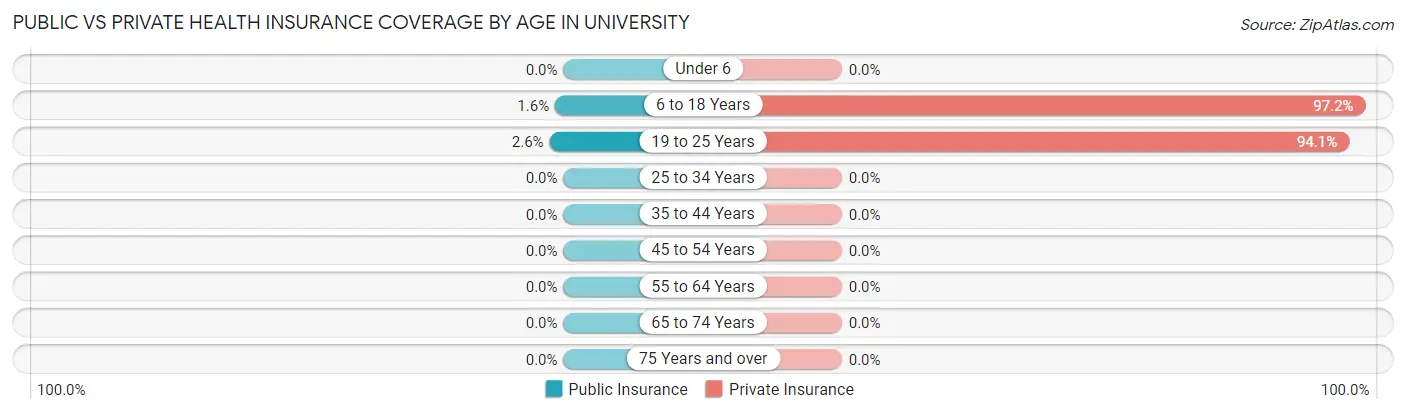
| Age Bracket | Public Insurance | Private Insurance |
| Under 6 | 0 (0.0%) | 0 (0.0%) |
| 6 to 18 Years | 28 (1.5%) | 1,760 (97.2%) |
| 19 to 25 Years | 69 (2.6%) | 2,506 (94.1%) |
| 25 to 34 Years | 0 (0.0%) | 0 (0.0%) |
| 35 to 44 Years | 0 (0.0%) | 0 (0.0%) |
| 45 to 54 Years | 0 (0.0%) | 0 (0.0%) |
| 55 to 64 Years | 0 (0.0%) | 0 (0.0%) |
| 65 to 74 Years | 0 (0.0%) | 0 (0.0%) |
| 75 Years and over | 0 (0.0%) | 0 (0.0%) |
| Total | 97 (2.2%) | 4,266 (95.4%) |
Disability Status by Sex by Age in University
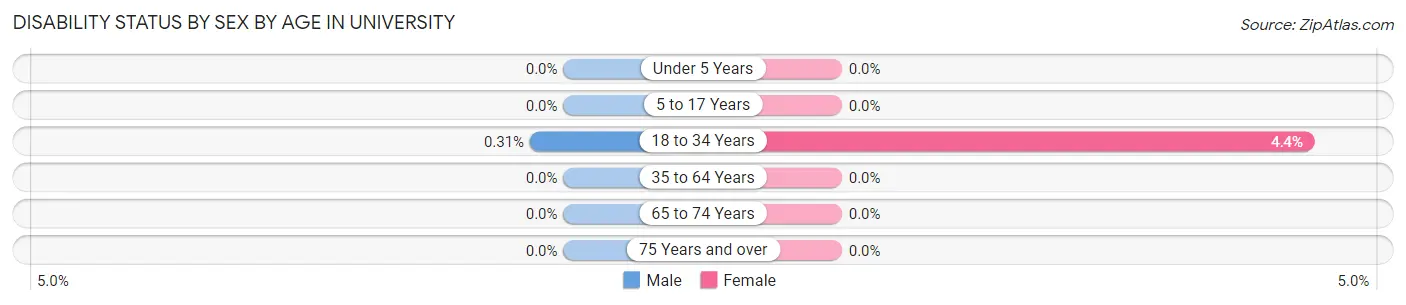
| Age Bracket | Male | Female |
| Under 5 Years | 0 (0.0%) | 0 (0.0%) |
| 5 to 17 Years | 0 (0.0%) | 0 (0.0%) |
| 18 to 34 Years | 6 (0.3%) | 111 (4.4%) |
| 35 to 64 Years | 0 (0.0%) | 0 (0.0%) |
| 65 to 74 Years | 0 (0.0%) | 0 (0.0%) |
| 75 Years and over | 0 (0.0%) | 0 (0.0%) |
Disability Class by Sex by Age in University
Disability Class: Hearing Difficulty
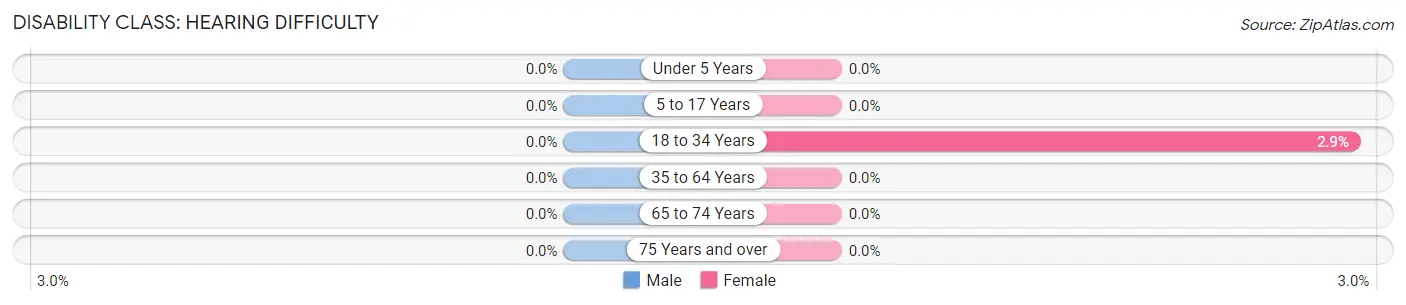
| Age Bracket | Male | Female |
| Under 5 Years | 0 (0.0%) | 0 (0.0%) |
| 5 to 17 Years | 0 (0.0%) | 0 (0.0%) |
| 18 to 34 Years | 0 (0.0%) | 73 (2.9%) |
| 35 to 64 Years | 0 (0.0%) | 0 (0.0%) |
| 65 to 74 Years | 0 (0.0%) | 0 (0.0%) |
| 75 Years and over | 0 (0.0%) | 0 (0.0%) |
Disability Class: Vision Difficulty
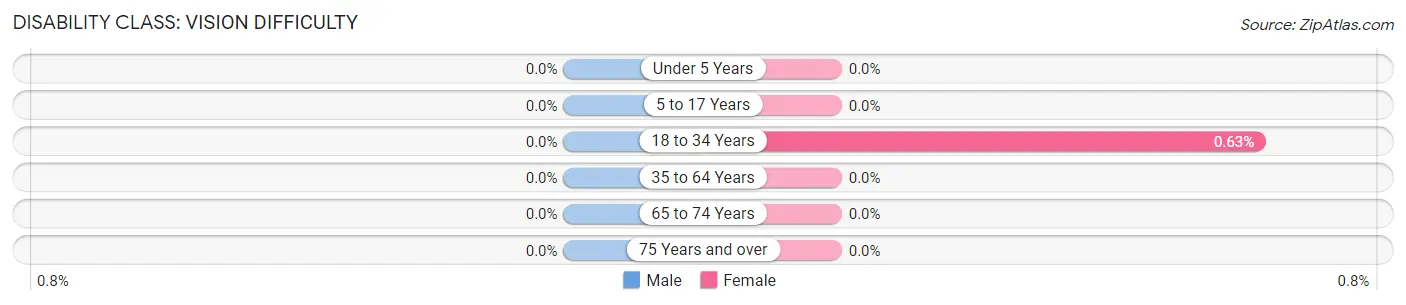
| Age Bracket | Male | Female |
| Under 5 Years | 0 (0.0%) | 0 (0.0%) |
| 5 to 17 Years | 0 (0.0%) | 0 (0.0%) |
| 18 to 34 Years | 0 (0.0%) | 16 (0.6%) |
| 35 to 64 Years | 0 (0.0%) | 0 (0.0%) |
| 65 to 74 Years | 0 (0.0%) | 0 (0.0%) |
| 75 Years and over | 0 (0.0%) | 0 (0.0%) |
Disability Class: Cognitive Difficulty
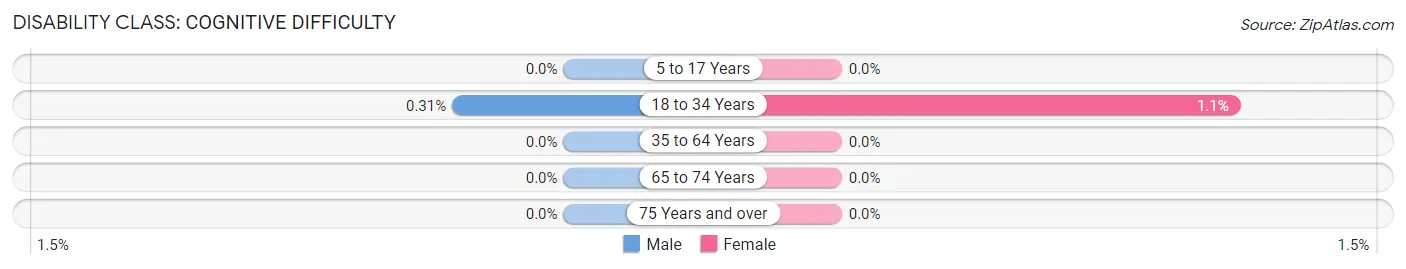
| Age Bracket | Male | Female |
| 5 to 17 Years | 0 (0.0%) | 0 (0.0%) |
| 18 to 34 Years | 6 (0.3%) | 28 (1.1%) |
| 35 to 64 Years | 0 (0.0%) | 0 (0.0%) |
| 65 to 74 Years | 0 (0.0%) | 0 (0.0%) |
| 75 Years and over | 0 (0.0%) | 0 (0.0%) |
Disability Class: Ambulatory Difficulty
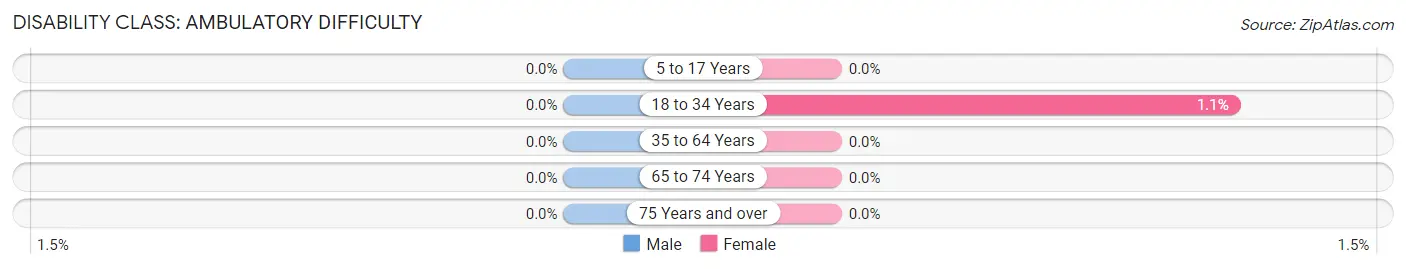
| Age Bracket | Male | Female |
| 5 to 17 Years | 0 (0.0%) | 0 (0.0%) |
| 18 to 34 Years | 0 (0.0%) | 28 (1.1%) |
| 35 to 64 Years | 0 (0.0%) | 0 (0.0%) |
| 65 to 74 Years | 0 (0.0%) | 0 (0.0%) |
| 75 Years and over | 0 (0.0%) | 0 (0.0%) |
Disability Class: Self-Care Difficulty
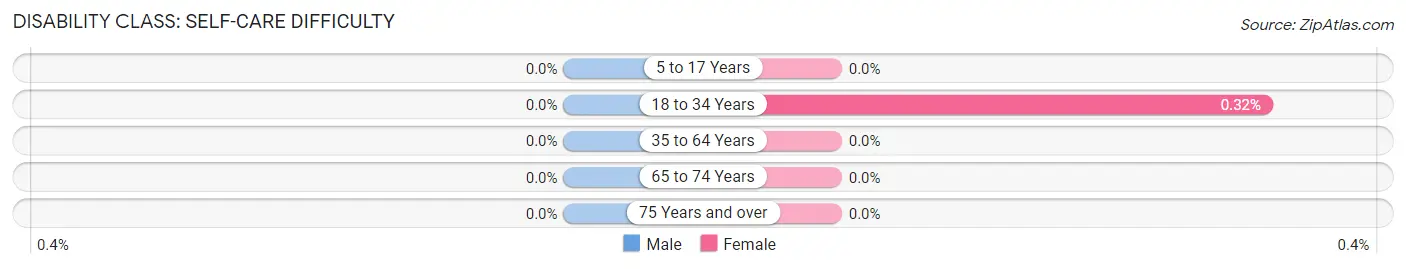
| Age Bracket | Male | Female |
| 5 to 17 Years | 0 (0.0%) | 0 (0.0%) |
| 18 to 34 Years | 0 (0.0%) | 8 (0.3%) |
| 35 to 64 Years | 0 (0.0%) | 0 (0.0%) |
| 65 to 74 Years | 0 (0.0%) | 0 (0.0%) |
| 75 Years and over | 0 (0.0%) | 0 (0.0%) |
Technology Access in University
Computing Device Access in University
| Device Type | # Households | % Households |
| Desktop or Laptop | 0 | 0.0% |
| Smartphone | 0 | 0.0% |
| Tablet | 0 | 0.0% |
| No Computing Device | 0 | 0.0% |
| Total | 0 | 0.0% |
Internet Access in University
| Internet Type | # Households | % Households |
| Dial-Up Internet | 0 | 0.0% |
| Broadband Home | 0 | 0.0% |
| Cellular Data Only | 0 | 0.0% |
| Satellite Internet | 0 | 0.0% |
| No Internet | 0 | 0.0% |
| Total | 0 | 0.0% |
University Summary
University, MS is a city located in Lafayette County, Mississippi. It is the county seat of Lafayette County and is located in the northeastern part of the state. The city has a population of approximately 11,000 people and is home to the University of Mississippi, which is the state’s flagship university.
History
University, MS was founded in 1848 and was originally known as Oxford. The city was named after the University of Mississippi, which was founded in 1848. The city was incorporated in 1854 and was the first city in the state to be incorporated. The city was originally a small farming community, but it grew rapidly after the university was established.
Geography
University, MS is located in the northeastern part of the state, in Lafayette County. The city is situated on the banks of the Tallahatchie River and is surrounded by rolling hills and forests. The city has a total area of 8.2 square miles, with a population density of 1,364 people per square mile.
Economy
University, MS is home to the University of Mississippi, which is the state’s flagship university. The university is the largest employer in the city and provides jobs for thousands of people. The city also has a thriving retail sector, with several shopping centers and malls located in the city. The city also has a strong manufacturing sector, with several factories located in the city.
Demographics
As of the 2010 census, University, MS had a population of 11,039 people. The racial makeup of the city was 79.2% White, 17.3% African American, 0.3% Native American, 1.2% Asian, 0.1% Pacific Islander, 0.7% from other races, and 1.4% from two or more races. The median household income in the city was $31,945, and the median family income was $41,945.
Conclusion
University, MS is a city located in Lafayette County, Mississippi. It is the county seat of Lafayette County and is home to the University of Mississippi, which is the state’s flagship university. The city has a population of approximately 11,000 people and has a thriving economy, with the university being the largest employer in the city. The city also has a strong retail and manufacturing sector. The racial makeup of the city is 79.2% White, 17.3% African American, 0.3% Native American, 1.2% Asian, 0.1% Pacific Islander, 0.7% from other races, and 1.4% from two or more races. The median household income in the city was $31,945, and the median family income was $41,945.
Common Questions
What is Per Capita Income in University?
Per Capita income in University is $3,525.
What is Income or Wage Gap in University?
Income or Wage Gap in University is 42.7%.
Women in University earn 57.3 cents for every dollar earned by a man.
What is the Total Population of University?
Total Population of University is 4,480.
What is the Total Male Population of University?
Total Male Population of University is 1,918.
What is the Total Female Population of University?
Total Female Population of University is 2,562.
What is the Ratio of Males per 100 Females in University?
There are 74.86 Males per 100 Females in University.
What is the Ratio of Females per 100 Males in University?
There are 133.58 Females per 100 Males in University.
What is the Median Population Age in University?
Median Population Age in University is 19.2 Years.
How Large is the Labor Force in University?
There are 896 People in the Labor Forcein in University.
What is the Percentage of People in the Labor Force in University?
20.0% of People are in the Labor Force in University.
What is the Unemployment Rate in University?
Unemployment Rate in University is 0.2%.