Las Maravillas, NM Map & Demographics
Las Maravillas Map
Las Maravillas Overview
$27,489
PER CAPITA INCOME
$55,917
AVG FAMILY INCOME
$55,734
AVG HOUSEHOLD INCOME
8.6%
WAGE / INCOME GAP [ % ]
91.4¢/ $1
WAGE / INCOME GAP [ $ ]
0.39
INEQUALITY / GINI INDEX
1,796
TOTAL POPULATION
862
MALE POPULATION
934
FEMALE POPULATION
92.29
MALES / 100 FEMALES
108.35
FEMALES / 100 MALES
30.5
MEDIAN AGE
4.1
AVG FAMILY SIZE
3.3
AVG HOUSEHOLD SIZE
1,011
LABOR FORCE [ PEOPLE ]
71.0%
PERCENT IN LABOR FORCE
4.6%
UNEMPLOYMENT RATE
Income in Las Maravillas
Income Overview in Las Maravillas
Per Capita Income in Las Maravillas is $27,489, while median incomes of families and households are $55,917 and $55,734 respectively.
| Characteristic | Number | Measure |
| Per Capita Income | 1,796 | $27,489 |
| Median Family Income | 378 | $55,917 |
| Mean Family Income | 378 | $77,548 |
| Median Household Income | 549 | $55,734 |
| Mean Household Income | 549 | $71,716 |
| Income Deficit | 378 | $0 |
| Wage / Income Gap (%) | 1,796 | 8.57% |
| Wage / Income Gap ($) | 1,796 | 91.43¢ per $1 |
| Gini / Inequality Index | 1,796 | 0.39 |
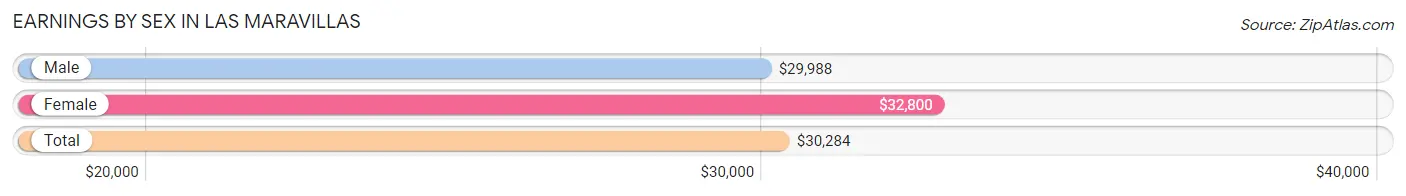
Earnings by Sex in Las Maravillas
Average Earnings in Las Maravillas are $30,284, $29,988 for men and $32,800 for women, a difference of 8.6%.
| Sex | Number | Average Earnings |
| Male | 443 (43.7%) | $29,988 |
| Female | 570 (56.3%) | $32,800 |
| Total | 1,013 (100.0%) | $30,284 |
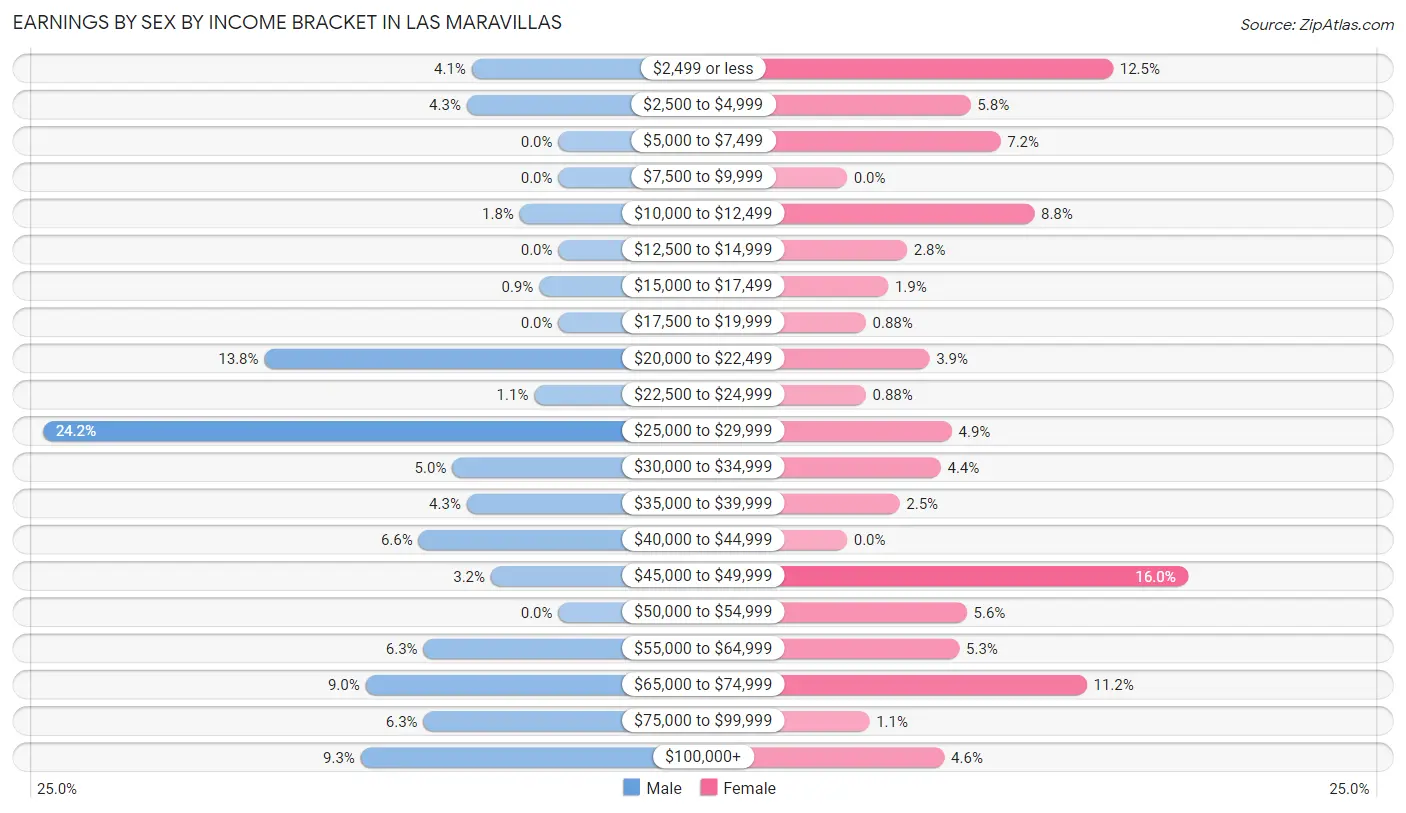
Earnings by Sex by Income Bracket in Las Maravillas
The most common earnings brackets in Las Maravillas are $25,000 to $29,999 for men (107 | 24.1%) and $45,000 to $49,999 for women (91 | 16.0%).
| Income | Male | Female |
| $2,499 or less | 18 (4.1%) | 71 (12.5%) |
| $2,500 to $4,999 | 19 (4.3%) | 33 (5.8%) |
| $5,000 to $7,499 | 0 (0.0%) | 41 (7.2%) |
| $7,500 to $9,999 | 0 (0.0%) | 0 (0.0%) |
| $10,000 to $12,499 | 8 (1.8%) | 50 (8.8%) |
| $12,500 to $14,999 | 0 (0.0%) | 16 (2.8%) |
| $15,000 to $17,499 | 4 (0.9%) | 11 (1.9%) |
| $17,500 to $19,999 | 0 (0.0%) | 5 (0.9%) |
| $20,000 to $22,499 | 61 (13.8%) | 22 (3.9%) |
| $22,500 to $24,999 | 5 (1.1%) | 5 (0.9%) |
| $25,000 to $29,999 | 107 (24.1%) | 28 (4.9%) |
| $30,000 to $34,999 | 22 (5.0%) | 25 (4.4%) |
| $35,000 to $39,999 | 19 (4.3%) | 14 (2.5%) |
| $40,000 to $44,999 | 29 (6.6%) | 0 (0.0%) |
| $45,000 to $49,999 | 14 (3.2%) | 91 (16.0%) |
| $50,000 to $54,999 | 0 (0.0%) | 32 (5.6%) |
| $55,000 to $64,999 | 28 (6.3%) | 30 (5.3%) |
| $65,000 to $74,999 | 40 (9.0%) | 64 (11.2%) |
| $75,000 to $99,999 | 28 (6.3%) | 6 (1.1%) |
| $100,000+ | 41 (9.3%) | 26 (4.6%) |
| Total | 443 (100.0%) | 570 (100.0%) |
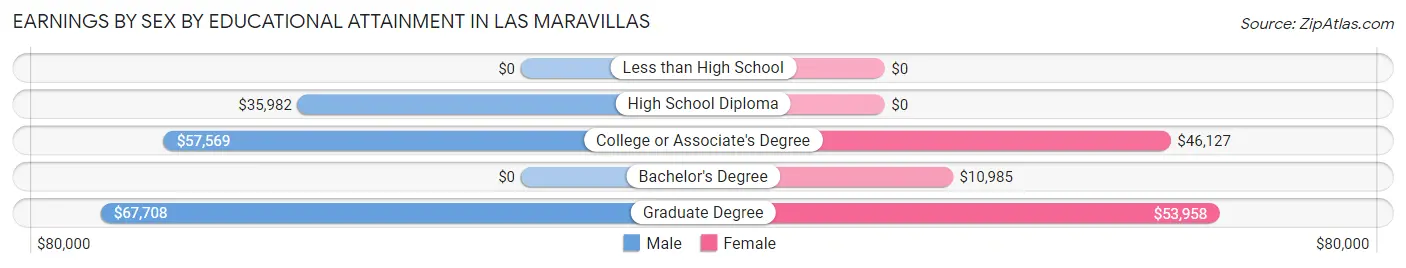
Earnings by Sex by Educational Attainment in Las Maravillas
Average earnings in Las Maravillas are $46,964 for men and $37,768 for women, a difference of 19.6%. Men with an educational attainment of graduate degree enjoy the highest average annual earnings of $67,708, while those with high school diploma education earn the least with $35,982. Women with an educational attainment of graduate degree earn the most with the average annual earnings of $53,958, while those with bachelor's degree education have the smallest earnings of $10,985.
| Educational Attainment | Male Income | Female Income |
| Less than High School | - | - |
| High School Diploma | $35,982 | $0 |
| College or Associate's Degree | $57,569 | $46,127 |
| Bachelor's Degree | - | - |
| Graduate Degree | $67,708 | $53,958 |
| Total | $46,964 | $37,768 |
Family Income in Las Maravillas
Family Income Brackets in Las Maravillas
According to the Las Maravillas family income data, there are 103 families falling into the $50,000 to $74,999 income range, which is the most common income bracket and makes up 27.3% of all families.
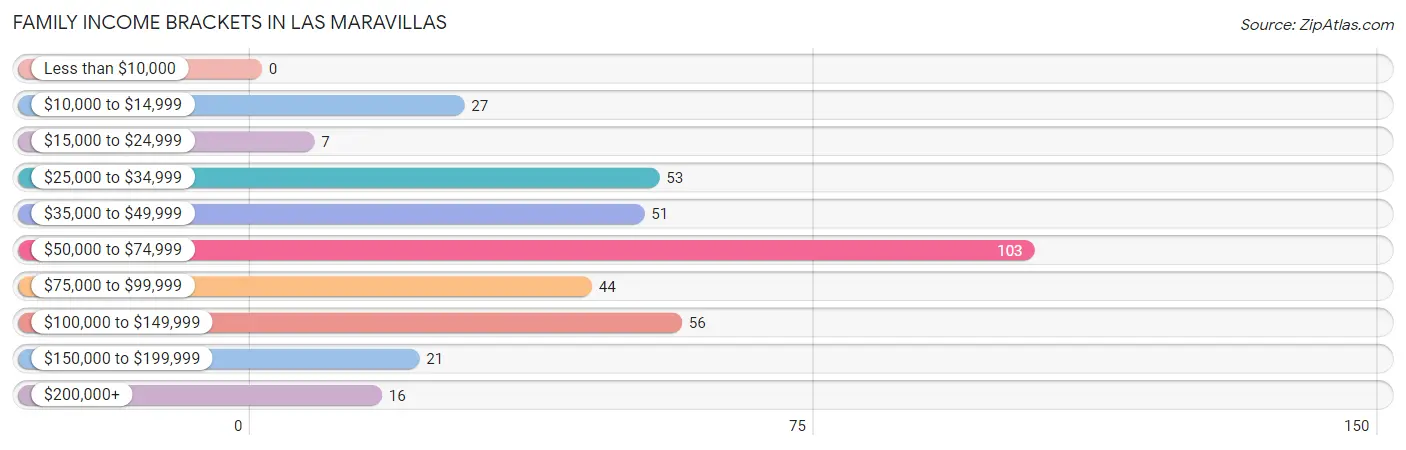
| Income Bracket | # Families | % Families |
| Less than $10,000 | 0 | 0.0% |
| $10,000 to $14,999 | 27 | 7.1% |
| $15,000 to $24,999 | 7 | 1.9% |
| $25,000 to $34,999 | 53 | 14.0% |
| $35,000 to $49,999 | 51 | 13.5% |
| $50,000 to $74,999 | 103 | 27.2% |
| $75,000 to $99,999 | 44 | 11.6% |
| $100,000 to $149,999 | 56 | 14.8% |
| $150,000 to $199,999 | 21 | 5.6% |
| $200,000+ | 16 | 4.2% |
Family Income by Famaliy Size in Las Maravillas
5-person families (24 | 6.4%) account for the highest median family income in Las Maravillas with $116,042 per family, while 2-person families (175 | 46.3%) have the highest median income of $28,438 per family member.
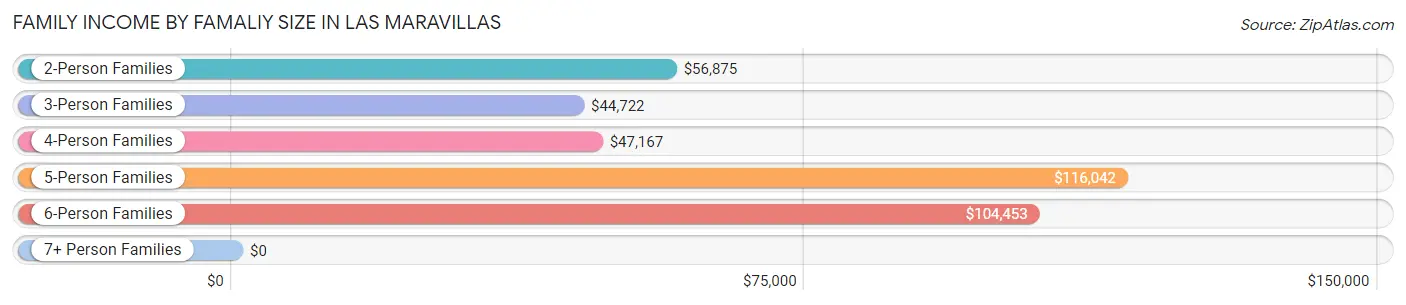
| Income Bracket | # Families | Median Income |
| 2-Person Families | 175 (46.3%) | $56,875 |
| 3-Person Families | 82 (21.7%) | $44,722 |
| 4-Person Families | 72 (19.1%) | $47,167 |
| 5-Person Families | 24 (6.4%) | $116,042 |
| 6-Person Families | 25 (6.6%) | $104,453 |
| 7+ Person Families | 0 (0.0%) | $0 |
| Total | 378 (100.0%) | $55,917 |
Family Income by Number of Earners in Las Maravillas
The median family income in Las Maravillas is $55,917, with families comprising 3+ earners (24) having the highest median family income of $125,000, while families with no earners (51) have the lowest median family income of $32,188, accounting for 6.4% and 13.5% of families, respectively.
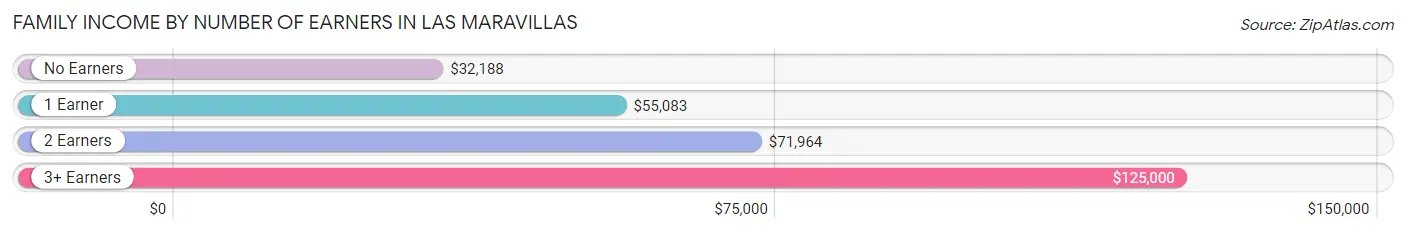
| Number of Earners | # Families | Median Income |
| No Earners | 51 (13.5%) | $32,188 |
| 1 Earner | 106 (28.0%) | $55,083 |
| 2 Earners | 197 (52.1%) | $71,964 |
| 3+ Earners | 24 (6.4%) | $125,000 |
| Total | 378 (100.0%) | $55,917 |
Household Income in Las Maravillas
Household Income Brackets in Las Maravillas
With 143 households falling in the category, the $50,000 to $74,999 income range is the most frequent in Las Maravillas, accounting for 26.1% of all households. In contrast, only 5 households (0.9%) fall into the less than $10,000 income bracket, making it the least populous group.
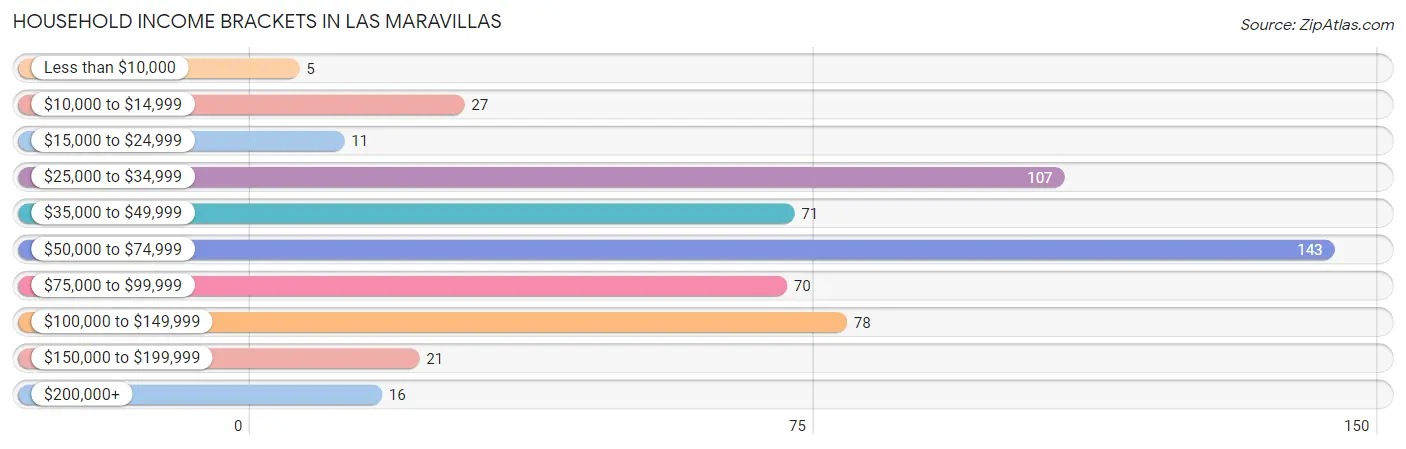
| Income Bracket | # Households | % Households |
| Less than $10,000 | 5 | 0.9% |
| $10,000 to $14,999 | 27 | 4.9% |
| $15,000 to $24,999 | 11 | 2.0% |
| $25,000 to $34,999 | 107 | 19.5% |
| $35,000 to $49,999 | 71 | 12.9% |
| $50,000 to $74,999 | 143 | 26.0% |
| $75,000 to $99,999 | 70 | 12.8% |
| $100,000 to $149,999 | 78 | 14.2% |
| $150,000 to $199,999 | 21 | 3.8% |
| $200,000+ | 16 | 2.9% |
Household Income by Householder Age in Las Maravillas
The median household income in Las Maravillas is $55,734, with the highest median household income of $61,250 found in the 45 to 64 years age bracket for the primary householder. A total of 228 households (41.5%) fall into this category. Meanwhile, the 15 to 24 years age bracket for the primary householder has the lowest median household income of $0, with 10 households (1.8%) in this group.
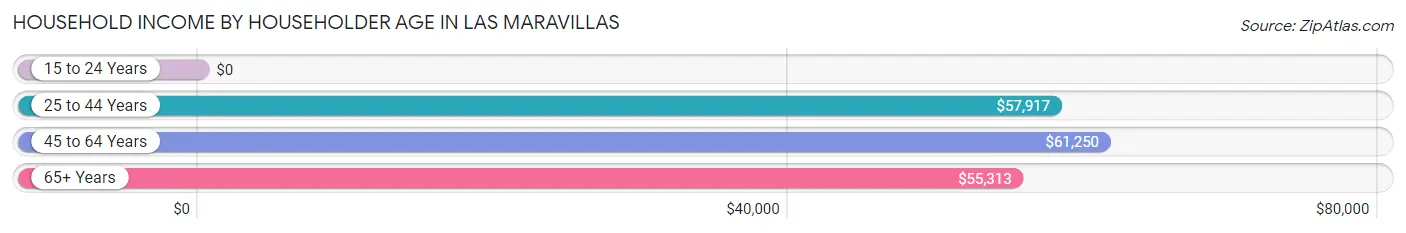
| Income Bracket | # Households | Median Income |
| 15 to 24 Years | 10 (1.8%) | $0 |
| 25 to 44 Years | 200 (36.4%) | $57,917 |
| 45 to 64 Years | 228 (41.5%) | $61,250 |
| 65+ Years | 111 (20.2%) | $55,313 |
| Total | 549 (100.0%) | $55,734 |
Poverty in Las Maravillas
Income Below Poverty by Sex and Age in Las Maravillas
With 7.0% poverty level for males and 11.4% for females among the residents of Las Maravillas, 55 to 64 year old males and 16 and 17 year old females are the most vulnerable to poverty, with 20 males (50.0%) and 11 females (100.0%) in their respective age groups living below the poverty level.
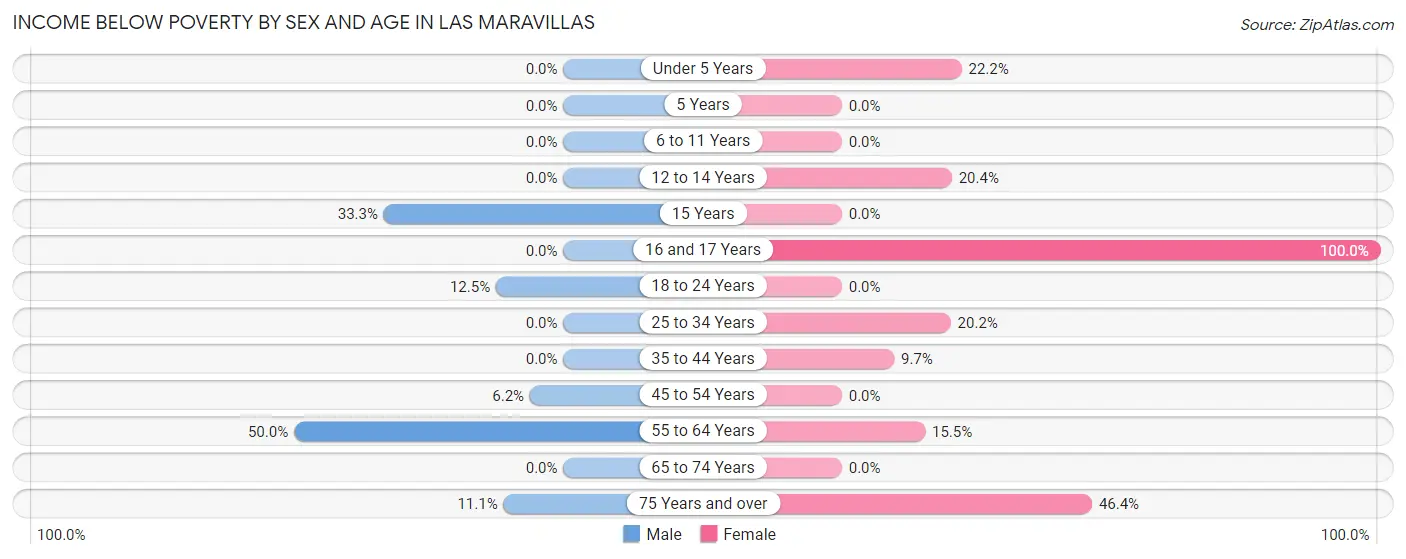
| Age Bracket | Male | Female |
| Under 5 Years | 0 (0.0%) | 6 (22.2%) |
| 5 Years | 0 (0.0%) | 0 (0.0%) |
| 6 to 11 Years | 0 (0.0%) | 0 (0.0%) |
| 12 to 14 Years | 0 (0.0%) | 10 (20.4%) |
| 15 Years | 8 (33.3%) | 0 (0.0%) |
| 16 and 17 Years | 0 (0.0%) | 11 (100.0%) |
| 18 to 24 Years | 20 (12.5%) | 0 (0.0%) |
| 25 to 34 Years | 0 (0.0%) | 39 (20.2%) |
| 35 to 44 Years | 0 (0.0%) | 10 (9.7%) |
| 45 to 54 Years | 8 (6.2%) | 0 (0.0%) |
| 55 to 64 Years | 20 (50.0%) | 17 (15.4%) |
| 65 to 74 Years | 0 (0.0%) | 0 (0.0%) |
| 75 Years and over | 4 (11.1%) | 13 (46.4%) |
| Total | 60 (7.0%) | 106 (11.4%) |
Income Above Poverty by Sex and Age in Las Maravillas
According to the poverty statistics in Las Maravillas, males aged under 5 years and females aged 5 years are the age groups that are most secure financially, with 100.0% of males and 100.0% of females in these age groups living above the poverty line.
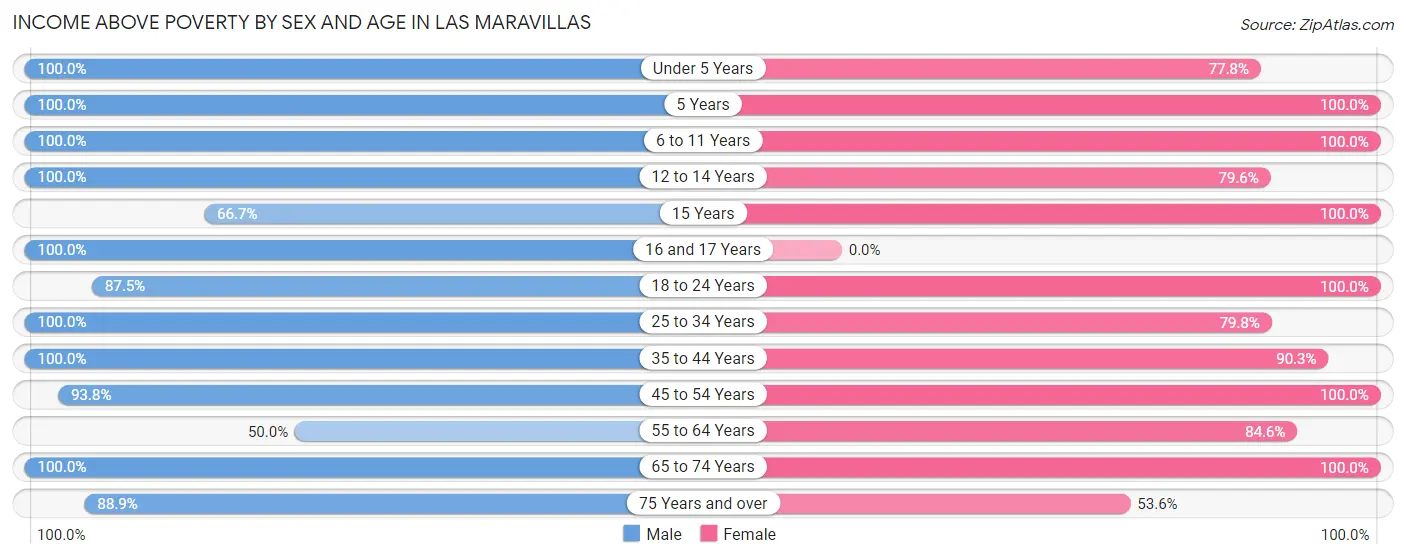
| Age Bracket | Male | Female |
| Under 5 Years | 42 (100.0%) | 21 (77.8%) |
| 5 Years | 5 (100.0%) | 6 (100.0%) |
| 6 to 11 Years | 94 (100.0%) | 57 (100.0%) |
| 12 to 14 Years | 42 (100.0%) | 39 (79.6%) |
| 15 Years | 16 (66.7%) | 26 (100.0%) |
| 16 and 17 Years | 83 (100.0%) | 0 (0.0%) |
| 18 to 24 Years | 140 (87.5%) | 103 (100.0%) |
| 25 to 34 Years | 68 (100.0%) | 154 (79.8%) |
| 35 to 44 Years | 106 (100.0%) | 93 (90.3%) |
| 45 to 54 Years | 121 (93.8%) | 145 (100.0%) |
| 55 to 64 Years | 20 (50.0%) | 93 (84.6%) |
| 65 to 74 Years | 33 (100.0%) | 76 (100.0%) |
| 75 Years and over | 32 (88.9%) | 15 (53.6%) |
| Total | 802 (93.0%) | 828 (88.6%) |
Income Below Poverty Among Married-Couple Families in Las Maravillas
The poverty statistics for married-couple families in Las Maravillas show that 2.1% or 4 of the total 190 families live below the poverty line. Families with no children have the highest poverty rate of 4.5%, comprising of 4 families. On the other hand, families with 1 or 2 children have the lowest poverty rate of 0.0%, which includes 0 families.
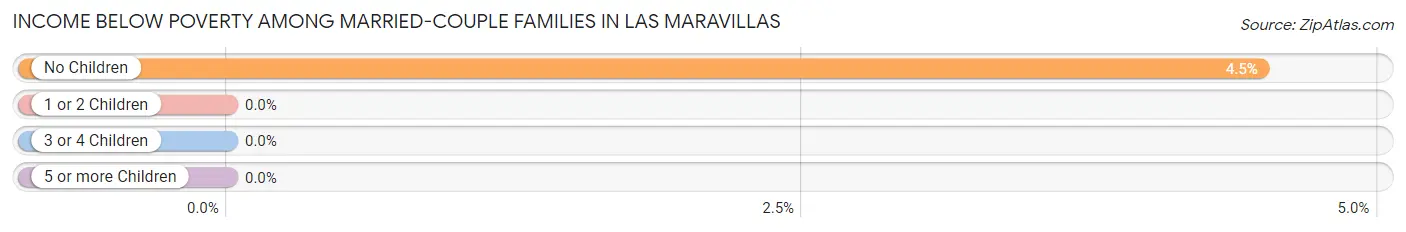
| Children | Above Poverty | Below Poverty |
| No Children | 85 (95.5%) | 4 (4.5%) |
| 1 or 2 Children | 76 (100.0%) | 0 (0.0%) |
| 3 or 4 Children | 25 (100.0%) | 0 (0.0%) |
| 5 or more Children | 0 (0.0%) | 0 (0.0%) |
| Total | 186 (97.9%) | 4 (2.1%) |
Income Below Poverty Among Single-Parent Households in Las Maravillas
According to the poverty data in Las Maravillas, 100.0% or 4 single-father households and 17.9% or 33 single-mother households are living below the poverty line. Among single-father households, those with 1 or 2 children have the highest poverty rate, with 4 households (100.0%) experiencing poverty. Likewise, among single-mother households, those with 3 or 4 children have the highest poverty rate, with 10 households (58.8%) falling below the poverty line.
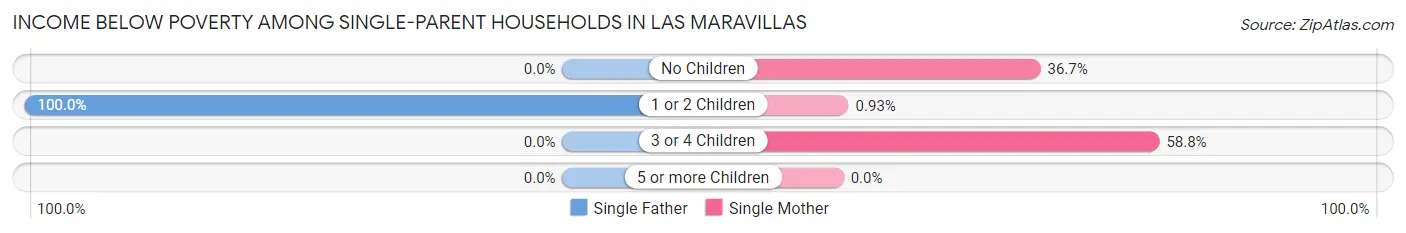
| Children | Single Father | Single Mother |
| No Children | 0 (0.0%) | 22 (36.7%) |
| 1 or 2 Children | 4 (100.0%) | 1 (0.9%) |
| 3 or 4 Children | 0 (0.0%) | 10 (58.8%) |
| 5 or more Children | 0 (0.0%) | 0 (0.0%) |
| Total | 4 (100.0%) | 33 (17.9%) |
Income Below Poverty Among Married-Couple vs Single-Parent Households in Las Maravillas
The poverty data for Las Maravillas shows that 4 of the married-couple family households (2.1%) and 37 of the single-parent households (19.7%) are living below the poverty level. Within the married-couple family households, those with no children have the highest poverty rate, with 4 households (4.5%) falling below the poverty line. Among the single-parent households, those with 3 or 4 children have the highest poverty rate, with 10 household (58.8%) living below poverty.
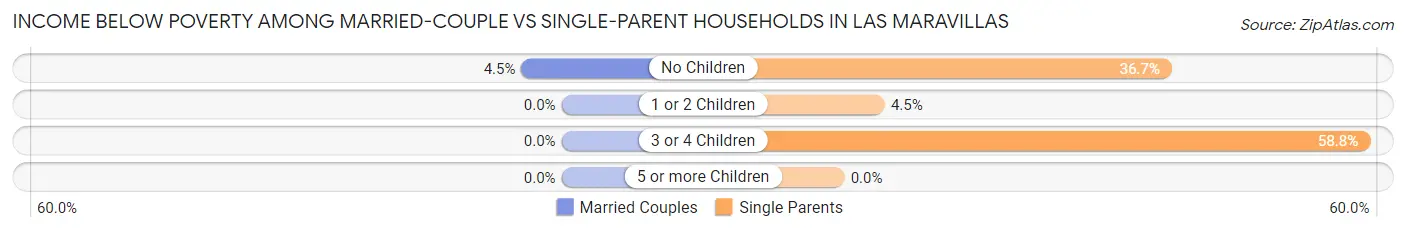
| Children | Married-Couple Families | Single-Parent Households |
| No Children | 4 (4.5%) | 22 (36.7%) |
| 1 or 2 Children | 0 (0.0%) | 5 (4.5%) |
| 3 or 4 Children | 0 (0.0%) | 10 (58.8%) |
| 5 or more Children | 0 (0.0%) | 0 (0.0%) |
| Total | 4 (2.1%) | 37 (19.7%) |
Race in Las Maravillas
The most populous races in Las Maravillas are White / Caucasian (1,198 | 66.7%), Hispanic or Latino (774 | 43.1%), and Black / African American (331 | 18.4%).
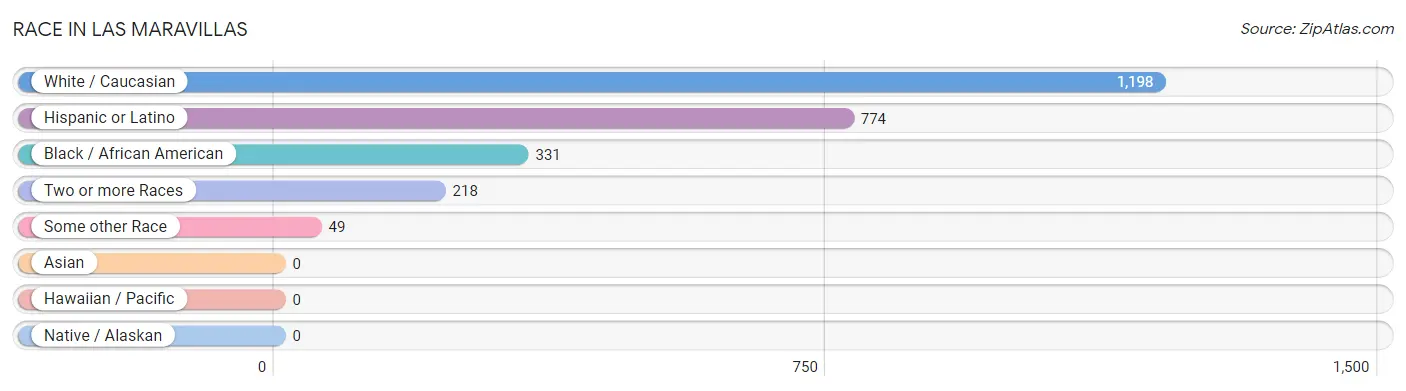
| Race | # Population | % Population |
| Asian | 0 | 0.0% |
| Black / African American | 331 | 18.4% |
| Hawaiian / Pacific | 0 | 0.0% |
| Hispanic or Latino | 774 | 43.1% |
| Native / Alaskan | 0 | 0.0% |
| White / Caucasian | 1,198 | 66.7% |
| Two or more Races | 218 | 12.1% |
| Some other Race | 49 | 2.7% |
| Total | 1,796 | 100.0% |
Ancestry in Las Maravillas
The most populous ancestries reported in Las Maravillas are Mexican (513 | 28.6%), American (114 | 6.4%), Welsh (88 | 4.9%), German (61 | 3.4%), and English (56 | 3.1%), together accounting for 46.3% of all Las Maravillas residents.
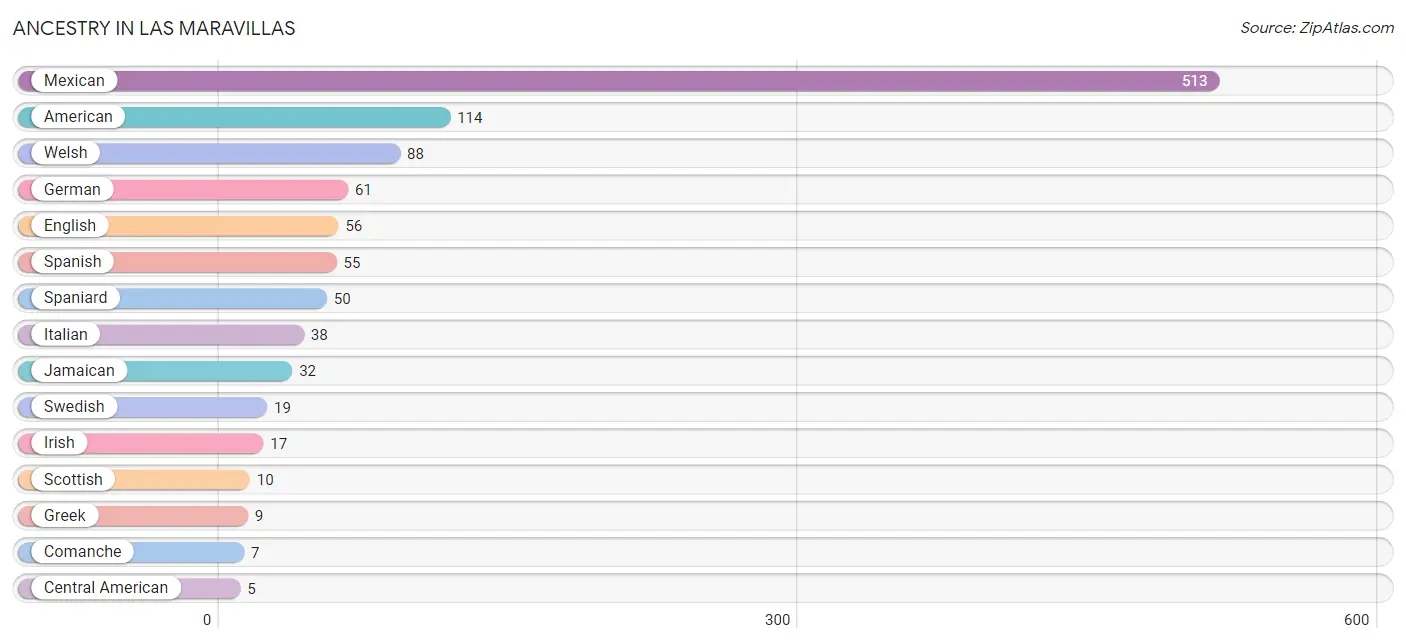
| Ancestry | # Population | % Population |
| American | 114 | 6.4% |
| British | 4 | 0.2% |
| Central American | 5 | 0.3% |
| Comanche | 7 | 0.4% |
| Dutch | 4 | 0.2% |
| English | 56 | 3.1% |
| European | 4 | 0.2% |
| French Canadian | 3 | 0.2% |
| German | 61 | 3.4% |
| Greek | 9 | 0.5% |
| Guatemalan | 5 | 0.3% |
| Irish | 17 | 0.9% |
| Italian | 38 | 2.1% |
| Jamaican | 32 | 1.8% |
| Mexican | 513 | 28.6% |
| Norwegian | 5 | 0.3% |
| Polish | 3 | 0.2% |
| Pueblo | 4 | 0.2% |
| Puerto Rican | 5 | 0.3% |
| Russian | 4 | 0.2% |
| Scottish | 10 | 0.6% |
| Sioux | 4 | 0.2% |
| Spaniard | 50 | 2.8% |
| Spanish | 55 | 3.1% |
| Swedish | 19 | 1.1% |
| Welsh | 88 | 4.9% | View All 26 Rows |
Immigrants in Las Maravillas
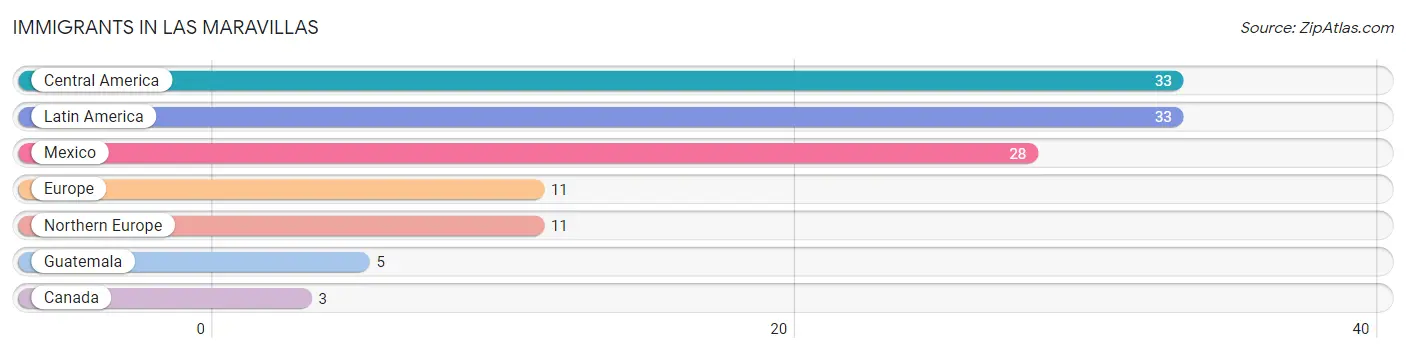
The most numerous immigrant groups reported in Las Maravillas came from Central America (33 | 1.8%), Latin America (33 | 1.8%), Mexico (28 | 1.6%), Europe (11 | 0.6%), and Northern Europe (11 | 0.6%), together accounting for 6.5% of all Las Maravillas residents.
| Immigration Origin | # Population | % Population |
| Canada | 3 | 0.2% |
| Central America | 33 | 1.8% |
| Europe | 11 | 0.6% |
| Guatemala | 5 | 0.3% |
| Latin America | 33 | 1.8% |
| Mexico | 28 | 1.6% |
| Northern Europe | 11 | 0.6% | View All 7 Rows |
Sex and Age in Las Maravillas
Sex and Age in Las Maravillas
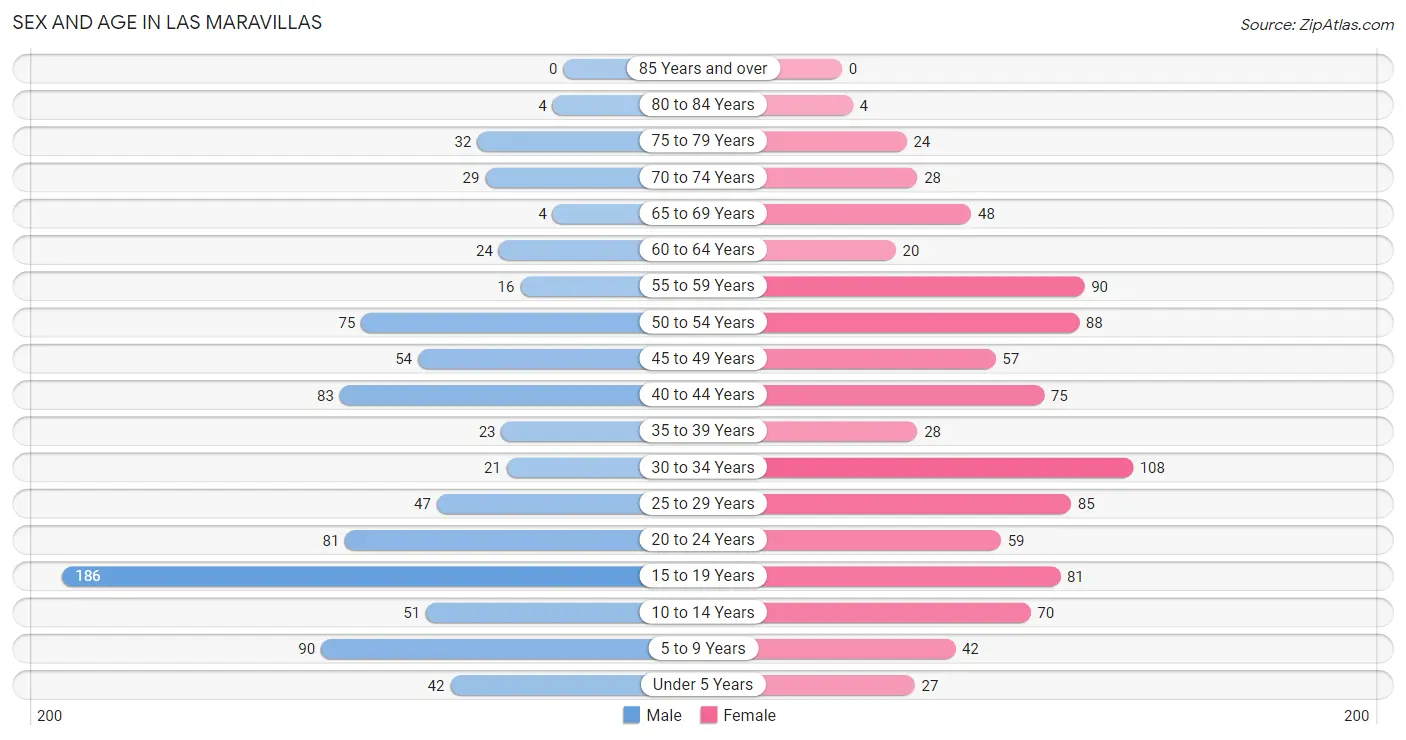
The most populous age groups in Las Maravillas are 15 to 19 Years (186 | 21.6%) for men and 30 to 34 Years (108 | 11.6%) for women.
| Age Bracket | Male | Female |
| Under 5 Years | 42 (4.9%) | 27 (2.9%) |
| 5 to 9 Years | 90 (10.4%) | 42 (4.5%) |
| 10 to 14 Years | 51 (5.9%) | 70 (7.5%) |
| 15 to 19 Years | 186 (21.6%) | 81 (8.7%) |
| 20 to 24 Years | 81 (9.4%) | 59 (6.3%) |
| 25 to 29 Years | 47 (5.4%) | 85 (9.1%) |
| 30 to 34 Years | 21 (2.4%) | 108 (11.6%) |
| 35 to 39 Years | 23 (2.7%) | 28 (3.0%) |
| 40 to 44 Years | 83 (9.6%) | 75 (8.0%) |
| 45 to 49 Years | 54 (6.3%) | 57 (6.1%) |
| 50 to 54 Years | 75 (8.7%) | 88 (9.4%) |
| 55 to 59 Years | 16 (1.9%) | 90 (9.6%) |
| 60 to 64 Years | 24 (2.8%) | 20 (2.1%) |
| 65 to 69 Years | 4 (0.5%) | 48 (5.1%) |
| 70 to 74 Years | 29 (3.4%) | 28 (3.0%) |
| 75 to 79 Years | 32 (3.7%) | 24 (2.6%) |
| 80 to 84 Years | 4 (0.5%) | 4 (0.4%) |
| 85 Years and over | 0 (0.0%) | 0 (0.0%) |
| Total | 862 (100.0%) | 934 (100.0%) |
Families and Households in Las Maravillas
Median Family Size in Las Maravillas
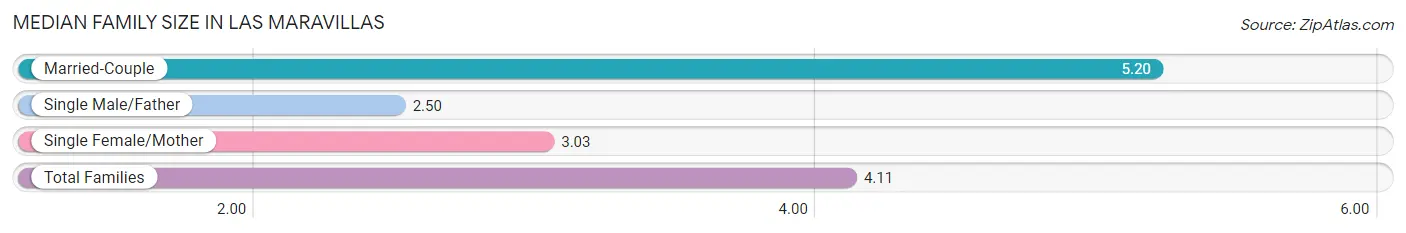
The median family size in Las Maravillas is 4.11 persons per family, with married-couple families (190 | 50.3%) accounting for the largest median family size of 5.2 persons per family. On the other hand, single male/father families (4 | 1.1%) represent the smallest median family size with 2.50 persons per family.
| Family Type | # Families | Family Size |
| Married-Couple | 190 (50.3%) | 5.20 |
| Single Male/Father | 4 (1.1%) | 2.50 |
| Single Female/Mother | 184 (48.7%) | 3.03 |
| Total Families | 378 (100.0%) | 4.11 |
Median Household Size in Las Maravillas
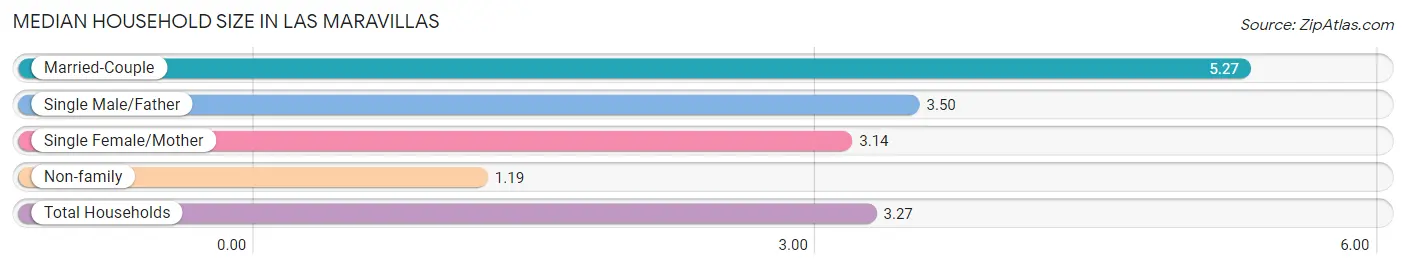
The median household size in Las Maravillas is 3.27 persons per household, with married-couple households (190 | 34.6%) accounting for the largest median household size of 5.27 persons per household. non-family households (171 | 31.1%) represent the smallest median household size with 1.19 persons per household.
| Household Type | # Households | Household Size |
| Married-Couple | 190 (34.6%) | 5.27 |
| Single Male/Father | 4 (0.7%) | 3.50 |
| Single Female/Mother | 184 (33.5%) | 3.14 |
| Non-family | 171 (31.1%) | 1.19 |
| Total Households | 549 (100.0%) | 3.27 |
Household Size by Marriage Status in Las Maravillas
Out of a total of 549 households in Las Maravillas, 378 (68.9%) are family households, while 171 (31.1%) are nonfamily households. The most numerous type of family households are 2-person households, comprising 149, and the most common type of nonfamily households are 1-person households, comprising 150.
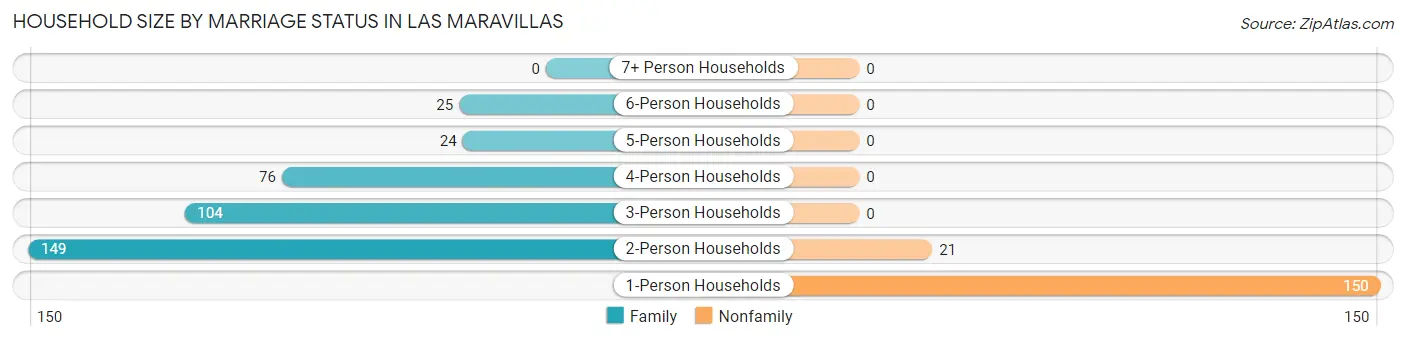
| Household Size | Family Households | Nonfamily Households |
| 1-Person Households | - | 150 (27.3%) |
| 2-Person Households | 149 (27.1%) | 21 (3.8%) |
| 3-Person Households | 104 (18.9%) | 0 (0.0%) |
| 4-Person Households | 76 (13.8%) | 0 (0.0%) |
| 5-Person Households | 24 (4.4%) | 0 (0.0%) |
| 6-Person Households | 25 (4.5%) | 0 (0.0%) |
| 7+ Person Households | 0 (0.0%) | 0 (0.0%) |
| Total | 378 (68.9%) | 171 (31.1%) |
Female Fertility in Las Maravillas
Fertility by Age in Las Maravillas
Average fertility rate in Las Maravillas is 81.0 births per 1,000 women. Women in the age bracket of 20 to 34 years have the highest fertility rate with 107.0 births per 1,000 women. Women in the age bracket of 20 to 34 years acount for 67.5% of all women with births.
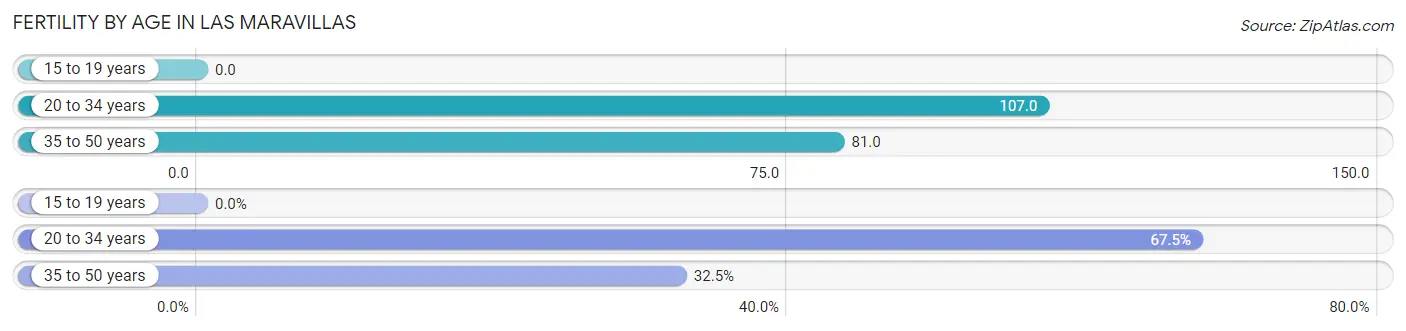
| Age Bracket | Women with Births | Births / 1,000 Women |
| 15 to 19 years | 0 (0.0%) | 0.0 |
| 20 to 34 years | 27 (67.5%) | 107.0 |
| 35 to 50 years | 13 (32.5%) | 81.0 |
| Total | 40 (100.0%) | 81.0 |
Fertility by Age by Marriage Status in Las Maravillas
72.5% of women with births (40) in Las Maravillas are married. The highest percentage of unmarried women with births falls into 20 to 34 years age bracket with 40.7% of them unmarried at the time of birth, while the lowest percentage of unmarried women with births belong to 35 to 50 years age bracket with 0.0% of them unmarried.
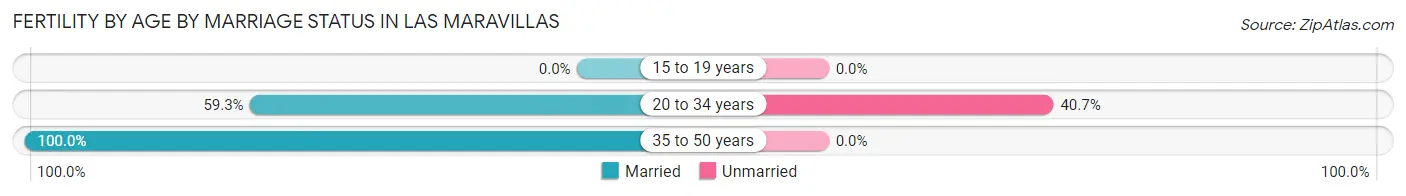
| Age Bracket | Married | Unmarried |
| 15 to 19 years | 0 (0.0%) | 0 (0.0%) |
| 20 to 34 years | 16 (59.3%) | 11 (40.7%) |
| 35 to 50 years | 13 (100.0%) | 0 (0.0%) |
| Total | 29 (72.5%) | 11 (27.5%) |
Fertility by Education in Las Maravillas
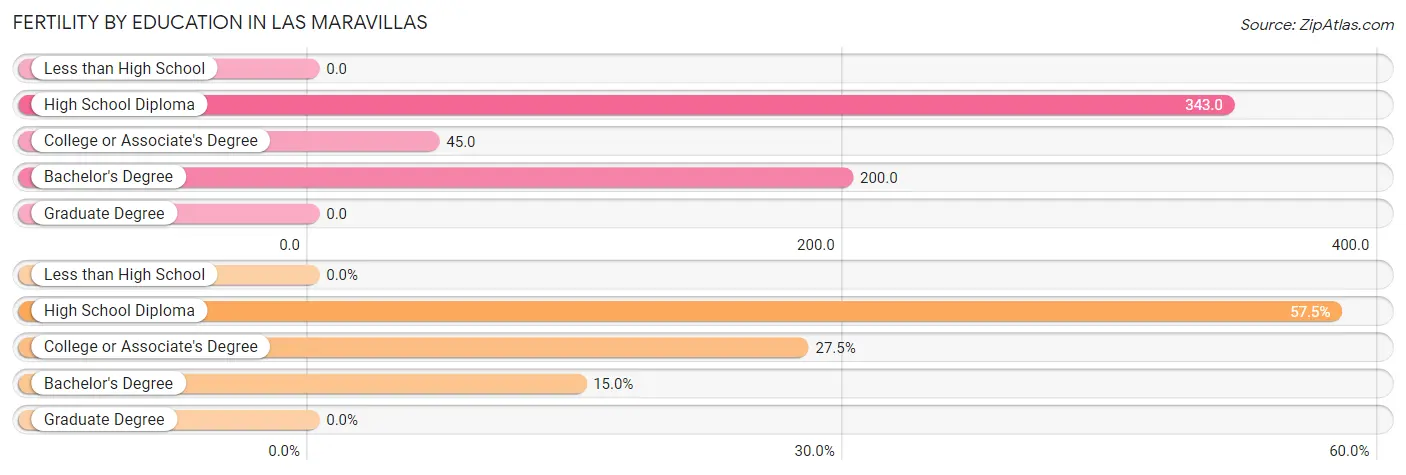
| Educational Attainment | Women with Births | Births / 1,000 Women |
| Less than High School | 0 (0.0%) | 0.0 |
| High School Diploma | 23 (57.5%) | 343.0 |
| College or Associate's Degree | 11 (27.5%) | 45.0 |
| Bachelor's Degree | 6 (15.0%) | 200.0 |
| Graduate Degree | 0 (0.0%) | 0.0 |
| Total | 40 (100.0%) | 81.0 |
Fertility by Education by Marriage Status in Las Maravillas
27.5% of women with births in Las Maravillas are unmarried. Women with the educational attainment of high school diploma are most likely to be married with 100.0% of them married at childbirth, while women with the educational attainment of college or associate's degree are least likely to be married with 100.0% of them unmarried at childbirth.
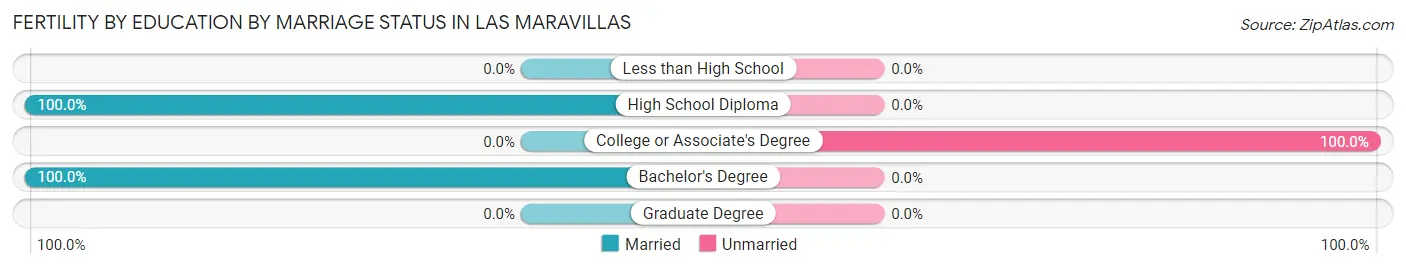
| Educational Attainment | Married | Unmarried |
| Less than High School | 0 (0.0%) | 0 (0.0%) |
| High School Diploma | 23 (100.0%) | 0 (0.0%) |
| College or Associate's Degree | 0 (0.0%) | 11 (100.0%) |
| Bachelor's Degree | 6 (100.0%) | 0 (0.0%) |
| Graduate Degree | 0 (0.0%) | 0 (0.0%) |
| Total | 29 (72.5%) | 11 (27.5%) |
Employment Characteristics in Las Maravillas
Employment by Class of Employer in Las Maravillas
Among the 958 employed individuals in Las Maravillas, private company employees (677 | 70.7%), state government employees (157 | 16.4%), and not-for-profit organizations (68 | 7.1%) make up the most common classes of employment.
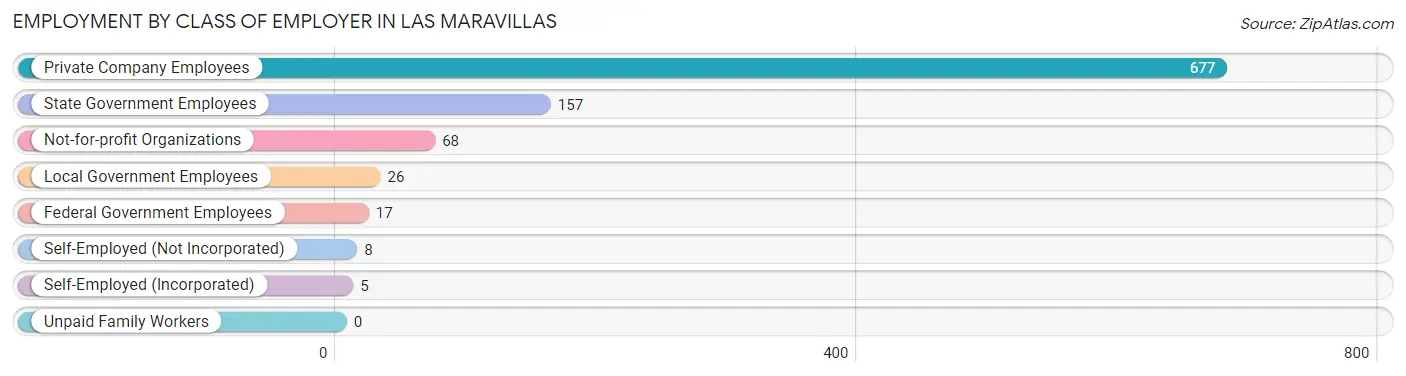
| Employer Class | # Employees | % Employees |
| Private Company Employees | 677 | 70.7% |
| Self-Employed (Incorporated) | 5 | 0.5% |
| Self-Employed (Not Incorporated) | 8 | 0.8% |
| Not-for-profit Organizations | 68 | 7.1% |
| Local Government Employees | 26 | 2.7% |
| State Government Employees | 157 | 16.4% |
| Federal Government Employees | 17 | 1.8% |
| Unpaid Family Workers | 0 | 0.0% |
| Total | 958 | 100.0% |
Employment Status by Age in Las Maravillas
According to the labor force statistics for Las Maravillas, out of the total population over 16 years of age (1,424), 71.0% or 1,011 individuals are in the labor force, with 4.6% or 47 of them unemployed. The age group with the highest labor force participation rate is 45 to 54 years, with 97.1% or 266 individuals in the labor force. Within the labor force, the 30 to 34 years age range has the highest percentage of unemployed individuals, with 34.2% or 38 of them being unemployed.
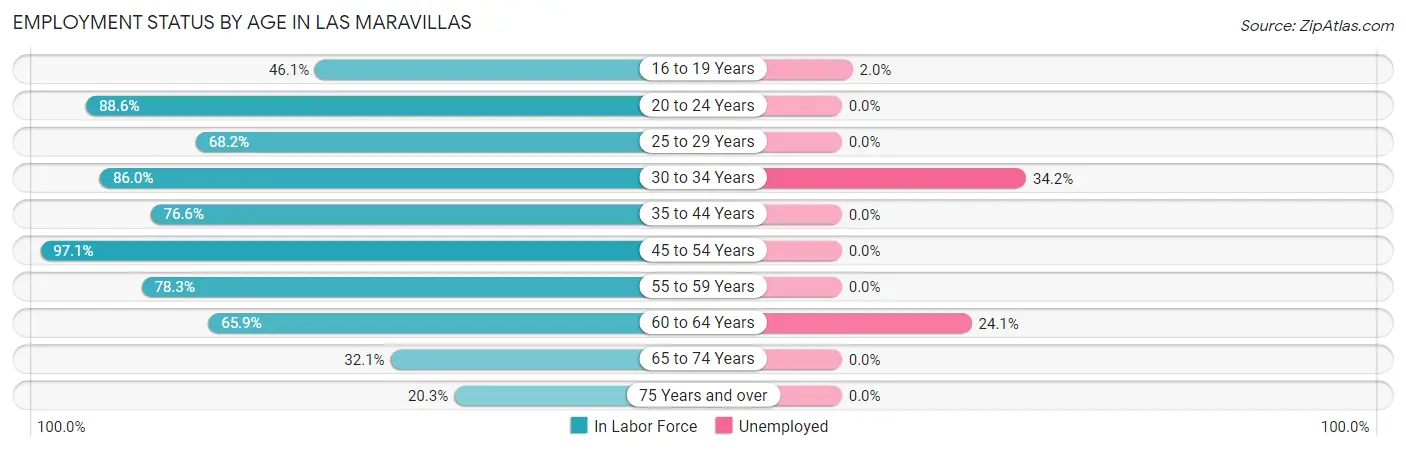
| Age Bracket | In Labor Force | Unemployed |
| 16 to 19 Years | 100 (46.1%) | 2 (2.0%) |
| 20 to 24 Years | 124 (88.6%) | 0 (0.0%) |
| 25 to 29 Years | 90 (68.2%) | 0 (0.0%) |
| 30 to 34 Years | 111 (86.0%) | 38 (34.2%) |
| 35 to 44 Years | 160 (76.6%) | 0 (0.0%) |
| 45 to 54 Years | 266 (97.1%) | 0 (0.0%) |
| 55 to 59 Years | 83 (78.3%) | 0 (0.0%) |
| 60 to 64 Years | 29 (65.9%) | 7 (24.1%) |
| 65 to 74 Years | 35 (32.1%) | 0 (0.0%) |
| 75 Years and over | 13 (20.3%) | 0 (0.0%) |
| Total | 1,011 (71.0%) | 47 (4.6%) |
Employment Status by Educational Attainment in Las Maravillas
According to labor force statistics for Las Maravillas, 82.7% of individuals (739) out of the total population between 25 and 64 years of age (894) are in the labor force, with 6.1% or 45 of them being unemployed. The group with the highest labor force participation rate are those with the educational attainment of college / associate degree, with 97.4% or 411 individuals in the labor force. Within the labor force, individuals with less than high school education have the highest percentage of unemployment, with 35.5% or 33 of them being unemployed.
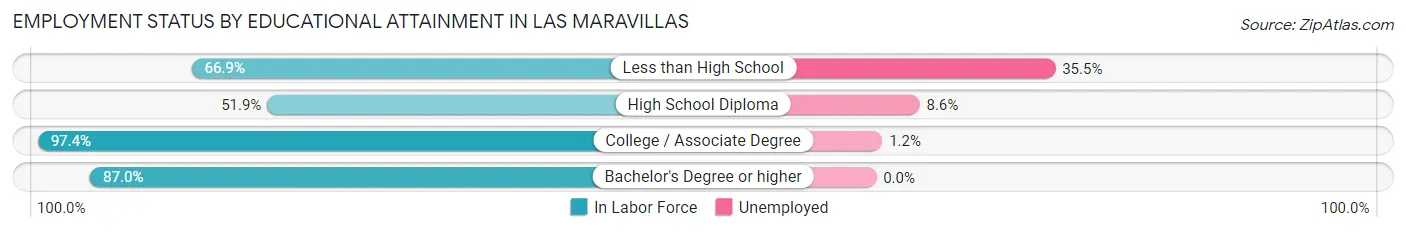
| Educational Attainment | In Labor Force | Unemployed |
| Less than High School | 93 (66.9%) | 49 (35.5%) |
| High School Diploma | 81 (51.9%) | 13 (8.6%) |
| College / Associate Degree | 411 (97.4%) | 5 (1.2%) |
| Bachelor's Degree or higher | 154 (87.0%) | 0 (0.0%) |
| Total | 739 (82.7%) | 55 (6.1%) |
Employment Occupations by Sex in Las Maravillas
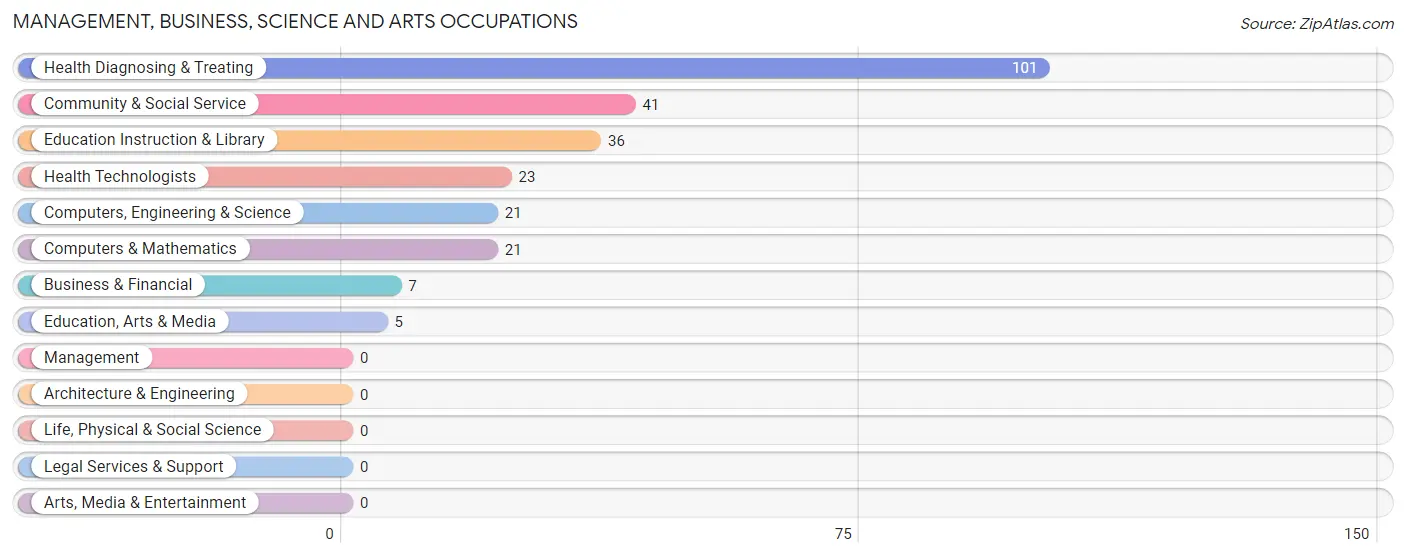
Management, Business, Science and Arts Occupations
The most common Management, Business, Science and Arts occupations in Las Maravillas are Health Diagnosing & Treating (101 | 10.5%), Community & Social Service (41 | 4.3%), Education Instruction & Library (36 | 3.7%), Health Technologists (23 | 2.4%), and Computers, Engineering & Science (21 | 2.2%).
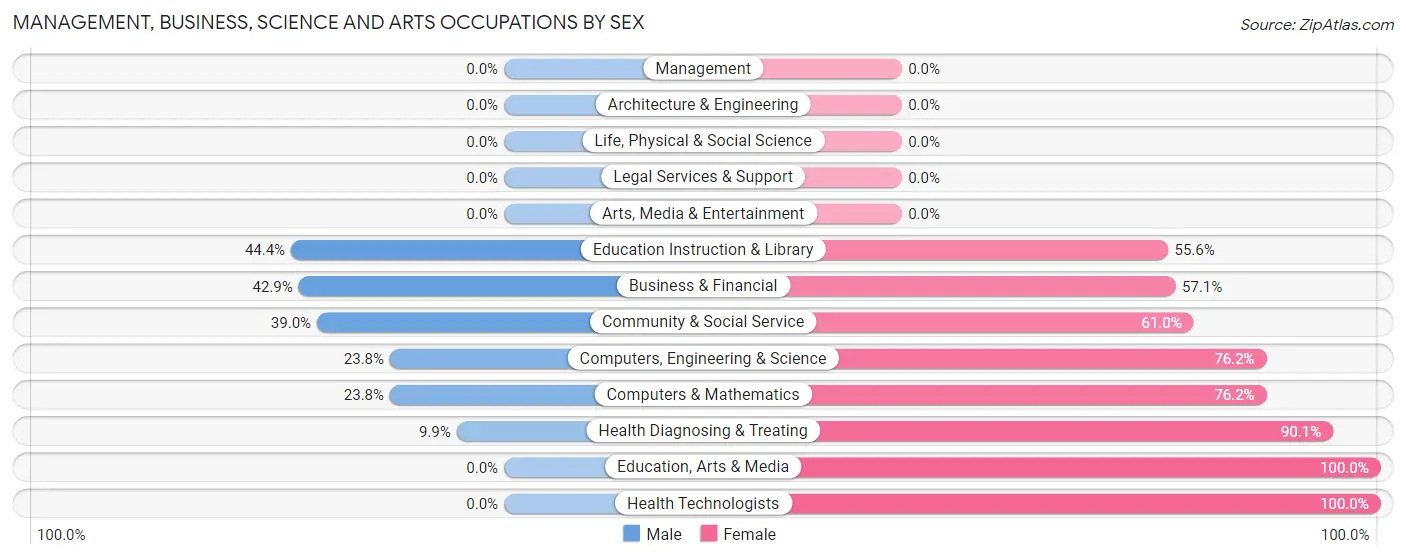
Management, Business, Science and Arts Occupations by Sex
Within the Management, Business, Science and Arts occupations in Las Maravillas, the most male-oriented occupations are Education Instruction & Library (44.4%), Business & Financial (42.9%), and Community & Social Service (39.0%), while the most female-oriented occupations are Education, Arts & Media (100.0%), Health Technologists (100.0%), and Health Diagnosing & Treating (90.1%).
| Occupation | Male | Female |
| Management | 0 (0.0%) | 0 (0.0%) |
| Business & Financial | 3 (42.9%) | 4 (57.1%) |
| Computers, Engineering & Science | 5 (23.8%) | 16 (76.2%) |
| Computers & Mathematics | 5 (23.8%) | 16 (76.2%) |
| Architecture & Engineering | 0 (0.0%) | 0 (0.0%) |
| Life, Physical & Social Science | 0 (0.0%) | 0 (0.0%) |
| Community & Social Service | 16 (39.0%) | 25 (61.0%) |
| Education, Arts & Media | 0 (0.0%) | 5 (100.0%) |
| Legal Services & Support | 0 (0.0%) | 0 (0.0%) |
| Education Instruction & Library | 16 (44.4%) | 20 (55.6%) |
| Arts, Media & Entertainment | 0 (0.0%) | 0 (0.0%) |
| Health Diagnosing & Treating | 10 (9.9%) | 91 (90.1%) |
| Health Technologists | 0 (0.0%) | 23 (100.0%) |
| Total (Category) | 34 (20.0%) | 136 (80.0%) |
| Total (Overall) | 443 (46.0%) | 521 (54.0%) |
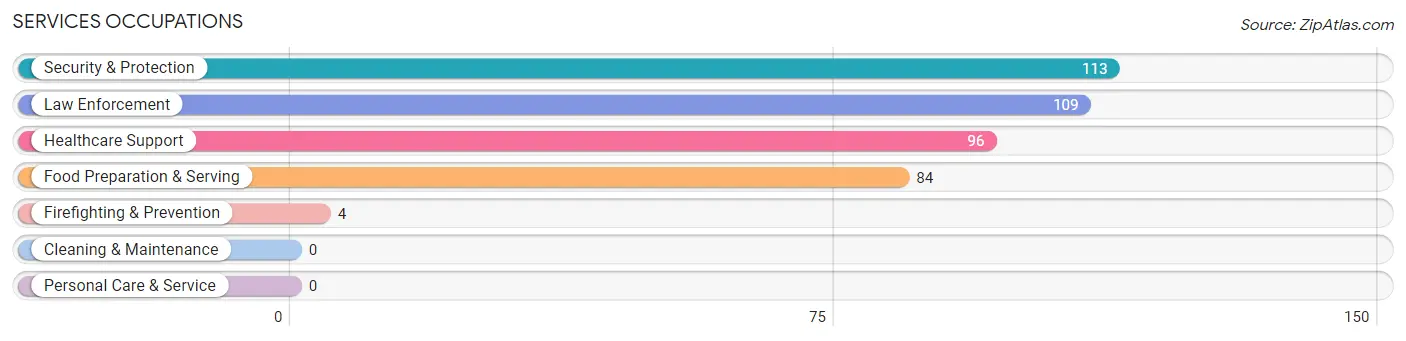
Services Occupations
The most common Services occupations in Las Maravillas are Security & Protection (113 | 11.7%), Law Enforcement (109 | 11.3%), Healthcare Support (96 | 10.0%), Food Preparation & Serving (84 | 8.7%), and Firefighting & Prevention (4 | 0.4%).
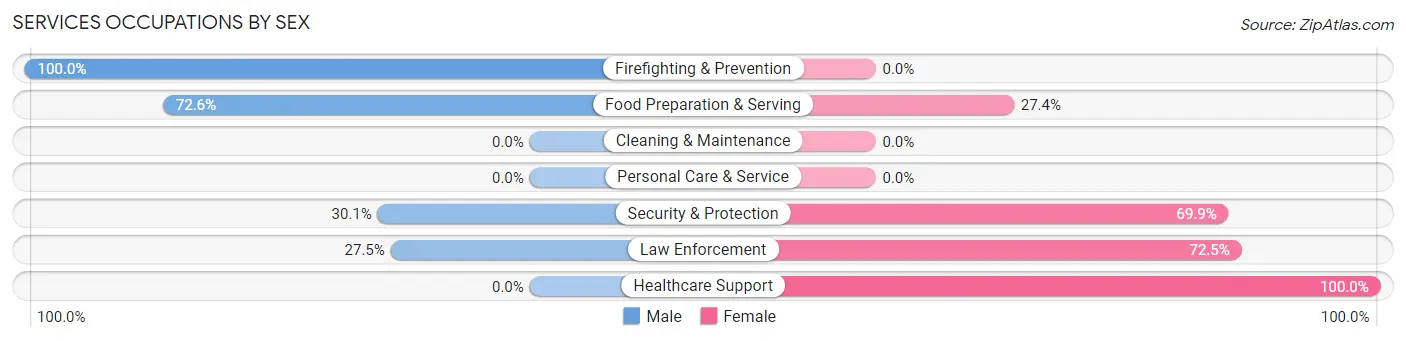
Services Occupations by Sex
Within the Services occupations in Las Maravillas, the most male-oriented occupations are Firefighting & Prevention (100.0%), Food Preparation & Serving (72.6%), and Security & Protection (30.1%), while the most female-oriented occupations are Healthcare Support (100.0%), Law Enforcement (72.5%), and Security & Protection (69.9%).
| Occupation | Male | Female |
| Healthcare Support | 0 (0.0%) | 96 (100.0%) |
| Security & Protection | 34 (30.1%) | 79 (69.9%) |
| Firefighting & Prevention | 4 (100.0%) | 0 (0.0%) |
| Law Enforcement | 30 (27.5%) | 79 (72.5%) |
| Food Preparation & Serving | 61 (72.6%) | 23 (27.4%) |
| Cleaning & Maintenance | 0 (0.0%) | 0 (0.0%) |
| Personal Care & Service | 0 (0.0%) | 0 (0.0%) |
| Total (Category) | 95 (32.4%) | 198 (67.6%) |
| Total (Overall) | 443 (46.0%) | 521 (54.0%) |
Sales and Office Occupations
The most common Sales and Office occupations in Las Maravillas are Office & Administration (98 | 10.2%), and Sales & Related (72 | 7.5%).
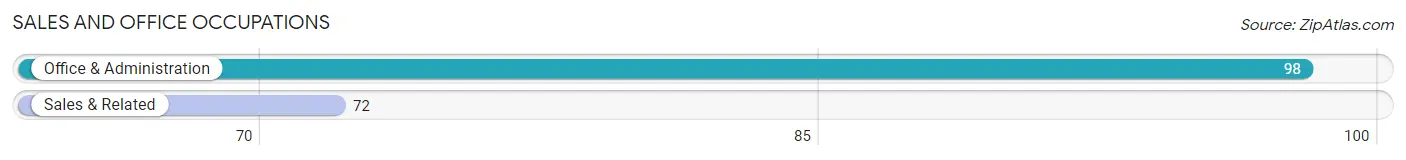
Sales and Office Occupations by Sex

| Occupation | Male | Female |
| Sales & Related | 42 (58.3%) | 30 (41.7%) |
| Office & Administration | 0 (0.0%) | 98 (100.0%) |
| Total (Category) | 42 (24.7%) | 128 (75.3%) |
| Total (Overall) | 443 (46.0%) | 521 (54.0%) |
Natural Resources, Construction and Maintenance Occupations
The most common Natural Resources, Construction and Maintenance occupations in Las Maravillas are Construction & Extraction (97 | 10.1%), and Installation, Maintenance & Repair (14 | 1.5%).

Natural Resources, Construction and Maintenance Occupations by Sex
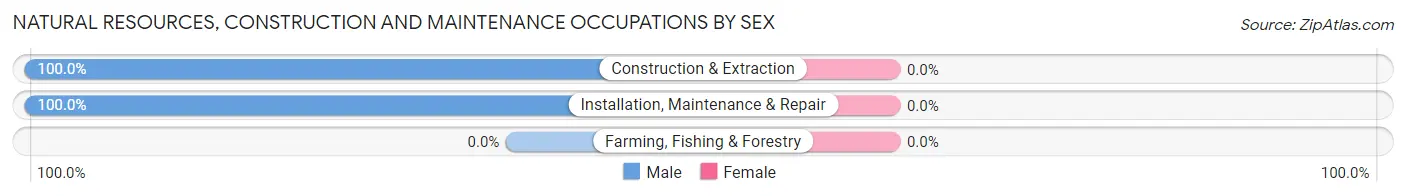
| Occupation | Male | Female |
| Farming, Fishing & Forestry | 0 (0.0%) | 0 (0.0%) |
| Construction & Extraction | 97 (100.0%) | 0 (0.0%) |
| Installation, Maintenance & Repair | 14 (100.0%) | 0 (0.0%) |
| Total (Category) | 111 (100.0%) | 0 (0.0%) |
| Total (Overall) | 443 (46.0%) | 521 (54.0%) |
Production, Transportation and Moving Occupations
The most common Production, Transportation and Moving occupations in Las Maravillas are Material Moving (146 | 15.1%), Production (53 | 5.5%), and Transportation (21 | 2.2%).
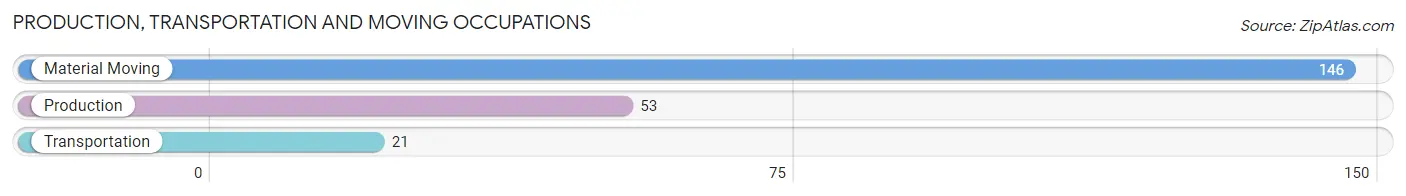
Production, Transportation and Moving Occupations by Sex
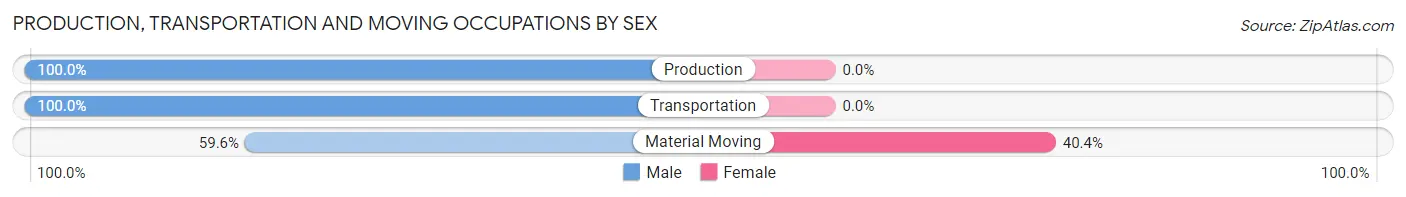
| Occupation | Male | Female |
| Production | 53 (100.0%) | 0 (0.0%) |
| Transportation | 21 (100.0%) | 0 (0.0%) |
| Material Moving | 87 (59.6%) | 59 (40.4%) |
| Total (Category) | 161 (73.2%) | 59 (26.8%) |
| Total (Overall) | 443 (46.0%) | 521 (54.0%) |
Employment Industries by Sex in Las Maravillas
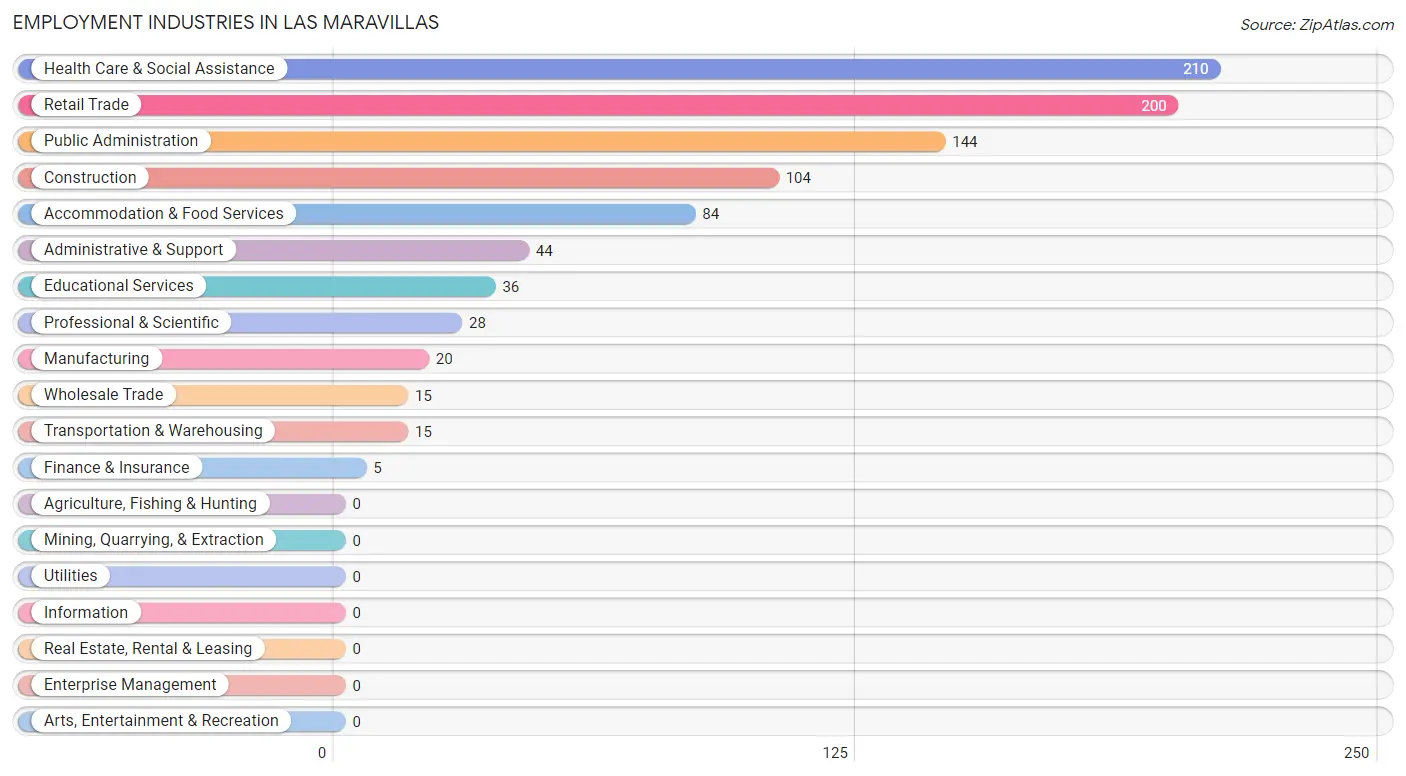
Employment Industries in Las Maravillas
The major employment industries in Las Maravillas include Health Care & Social Assistance (210 | 21.8%), Retail Trade (200 | 20.7%), Public Administration (144 | 14.9%), Construction (104 | 10.8%), and Accommodation & Food Services (84 | 8.7%).
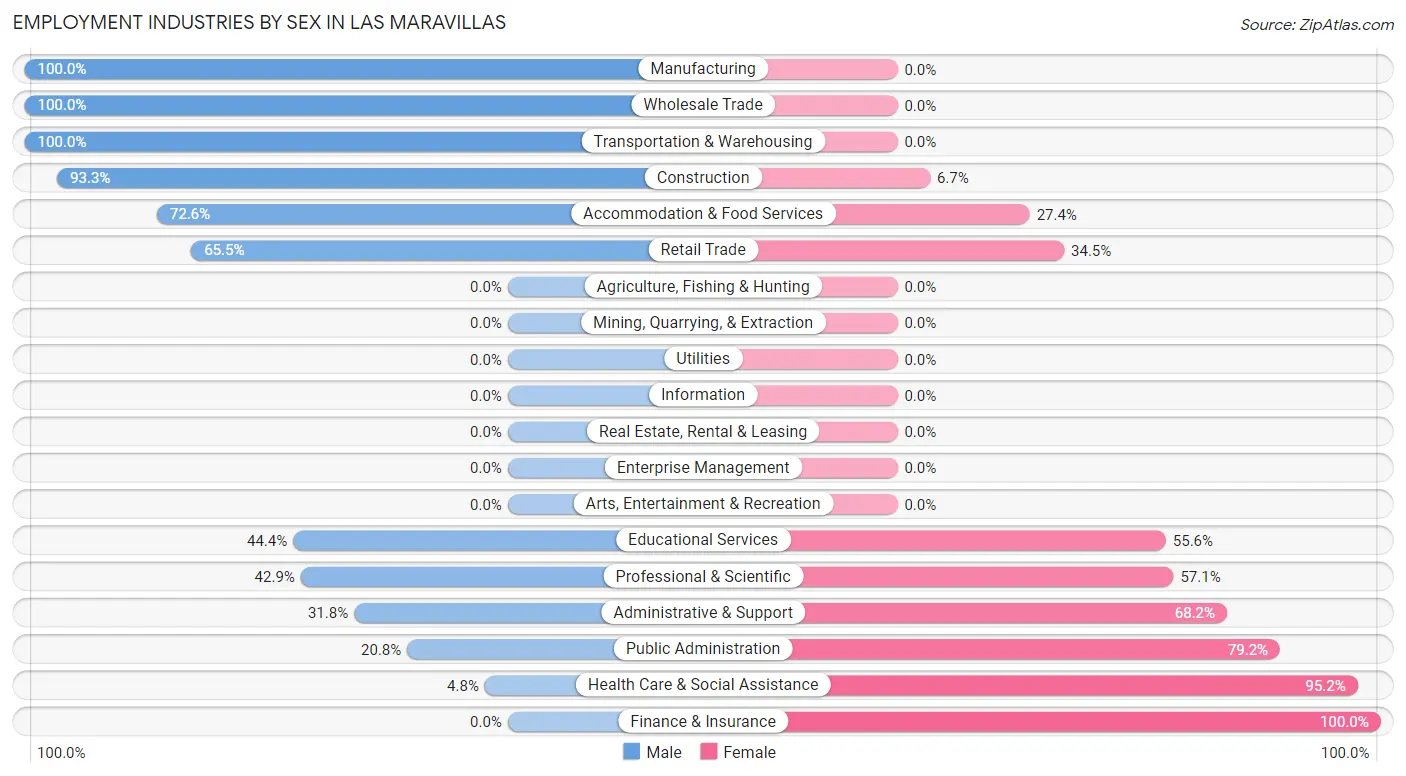
Employment Industries by Sex in Las Maravillas
The Las Maravillas industries that see more men than women are Manufacturing (100.0%), Wholesale Trade (100.0%), and Transportation & Warehousing (100.0%), whereas the industries that tend to have a higher number of women are Finance & Insurance (100.0%), Health Care & Social Assistance (95.2%), and Public Administration (79.2%).
| Industry | Male | Female |
| Agriculture, Fishing & Hunting | 0 (0.0%) | 0 (0.0%) |
| Mining, Quarrying, & Extraction | 0 (0.0%) | 0 (0.0%) |
| Construction | 97 (93.3%) | 7 (6.7%) |
| Manufacturing | 20 (100.0%) | 0 (0.0%) |
| Wholesale Trade | 15 (100.0%) | 0 (0.0%) |
| Retail Trade | 131 (65.5%) | 69 (34.5%) |
| Transportation & Warehousing | 15 (100.0%) | 0 (0.0%) |
| Utilities | 0 (0.0%) | 0 (0.0%) |
| Information | 0 (0.0%) | 0 (0.0%) |
| Finance & Insurance | 0 (0.0%) | 5 (100.0%) |
| Real Estate, Rental & Leasing | 0 (0.0%) | 0 (0.0%) |
| Professional & Scientific | 12 (42.9%) | 16 (57.1%) |
| Enterprise Management | 0 (0.0%) | 0 (0.0%) |
| Administrative & Support | 14 (31.8%) | 30 (68.2%) |
| Educational Services | 16 (44.4%) | 20 (55.6%) |
| Health Care & Social Assistance | 10 (4.8%) | 200 (95.2%) |
| Arts, Entertainment & Recreation | 0 (0.0%) | 0 (0.0%) |
| Accommodation & Food Services | 61 (72.6%) | 23 (27.4%) |
| Public Administration | 30 (20.8%) | 114 (79.2%) |
| Total | 443 (46.0%) | 521 (54.0%) |
Education in Las Maravillas
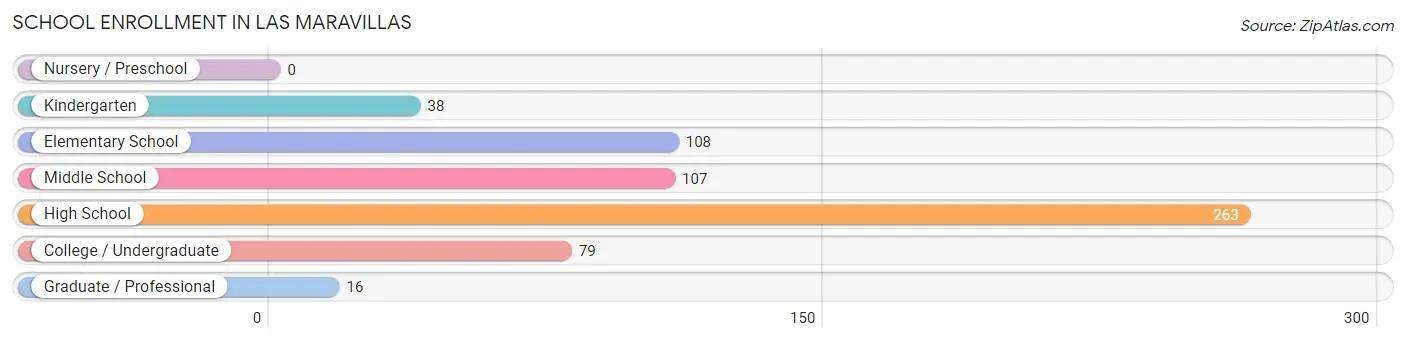
School Enrollment in Las Maravillas
The most common levels of schooling among the 611 students in Las Maravillas are high school (263 | 43.0%), elementary school (108 | 17.7%), and middle school (107 | 17.5%).
| School Level | # Students | % Students |
| Nursery / Preschool | 0 | 0.0% |
| Kindergarten | 38 | 6.2% |
| Elementary School | 108 | 17.7% |
| Middle School | 107 | 17.5% |
| High School | 263 | 43.0% |
| College / Undergraduate | 79 | 12.9% |
| Graduate / Professional | 16 | 2.6% |
| Total | 611 | 100.0% |
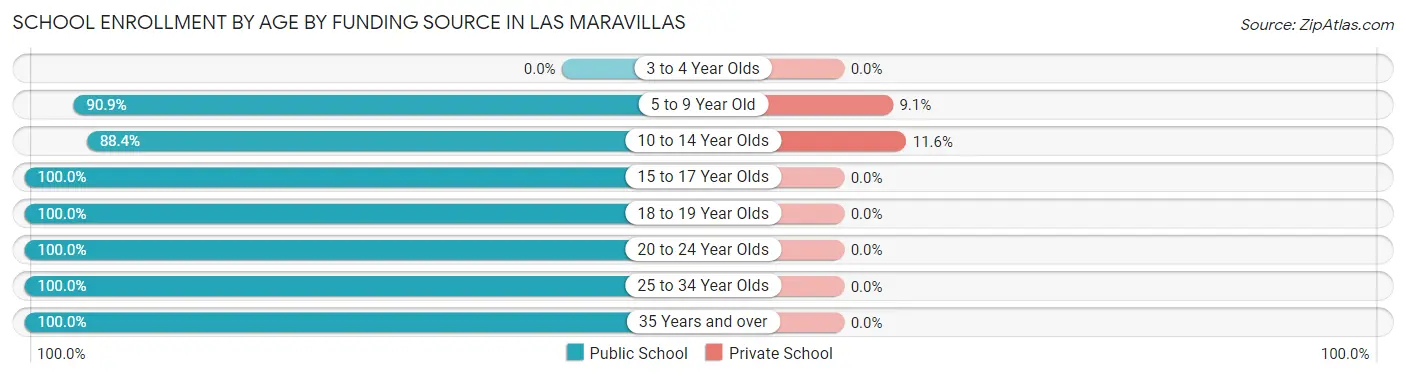
School Enrollment by Age by Funding Source in Las Maravillas
Out of a total of 611 students who are enrolled in schools in Las Maravillas, 26 (4.3%) attend a private institution, while the remaining 585 (95.7%) are enrolled in public schools. The age group of 10 to 14 year olds has the highest likelihood of being enrolled in private schools, with 14 (11.6% in the age bracket) enrolled. Conversely, the age group of 15 to 17 year olds has the lowest likelihood of being enrolled in a private school, with 120 (100.0% in the age bracket) attending a public institution.
| Age Bracket | Public School | Private School |
| 3 to 4 Year Olds | 0 (0.0%) | 0 (0.0%) |
| 5 to 9 Year Old | 120 (90.9%) | 12 (9.1%) |
| 10 to 14 Year Olds | 107 (88.4%) | 14 (11.6%) |
| 15 to 17 Year Olds | 120 (100.0%) | 0 (0.0%) |
| 18 to 19 Year Olds | 123 (100.0%) | 0 (0.0%) |
| 20 to 24 Year Olds | 48 (100.0%) | 0 (0.0%) |
| 25 to 34 Year Olds | 50 (100.0%) | 0 (0.0%) |
| 35 Years and over | 17 (100.0%) | 0 (0.0%) |
| Total | 585 (95.7%) | 26 (4.3%) |
Educational Attainment by Field of Study in Las Maravillas
Science & technology (51 | 16.1%), liberal arts & history (48 | 15.2%), communications (48 | 15.2%), education (45 | 14.2%), and business (41 | 13.0%) are the most common fields of study among 316 individuals in Las Maravillas who have obtained a bachelor's degree or higher.
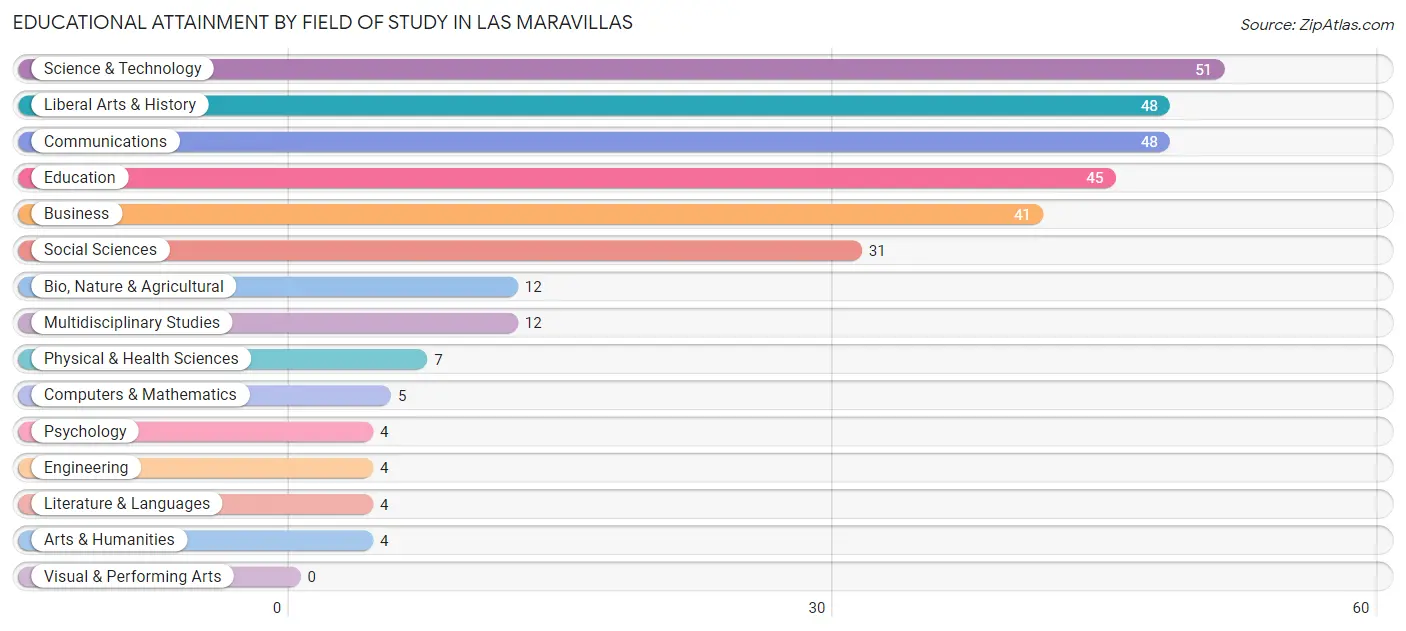
| Field of Study | # Graduates | % Graduates |
| Computers & Mathematics | 5 | 1.6% |
| Bio, Nature & Agricultural | 12 | 3.8% |
| Physical & Health Sciences | 7 | 2.2% |
| Psychology | 4 | 1.3% |
| Social Sciences | 31 | 9.8% |
| Engineering | 4 | 1.3% |
| Multidisciplinary Studies | 12 | 3.8% |
| Science & Technology | 51 | 16.1% |
| Business | 41 | 13.0% |
| Education | 45 | 14.2% |
| Literature & Languages | 4 | 1.3% |
| Liberal Arts & History | 48 | 15.2% |
| Visual & Performing Arts | 0 | 0.0% |
| Communications | 48 | 15.2% |
| Arts & Humanities | 4 | 1.3% |
| Total | 316 | 100.0% |
Transportation & Commute in Las Maravillas
Vehicle Availability by Sex in Las Maravillas
The most prevalent vehicle ownership categories in Las Maravillas are males with 3 vehicles (185, accounting for 41.8%) and females with 3 vehicles (60, making up 35.9%).
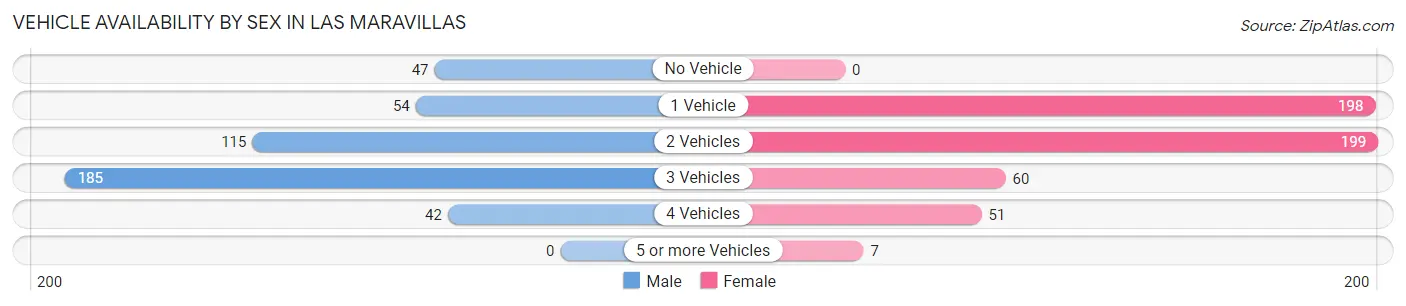
| Vehicles Available | Male | Female |
| No Vehicle | 47 (10.6%) | 0 (0.0%) |
| 1 Vehicle | 54 (12.2%) | 198 (38.5%) |
| 2 Vehicles | 115 (26.0%) | 199 (38.6%) |
| 3 Vehicles | 185 (41.8%) | 60 (11.7%) |
| 4 Vehicles | 42 (9.5%) | 51 (9.9%) |
| 5 or more Vehicles | 0 (0.0%) | 7 (1.4%) |
| Total | 443 (100.0%) | 515 (100.0%) |
Commute Time in Las Maravillas
The most frequently occuring commute durations in Las Maravillas are 45 to 59 minutes (315 commuters, 34.1%), 20 to 24 minutes (304 commuters, 32.9%), and 25 to 29 minutes (74 commuters, 8.0%).
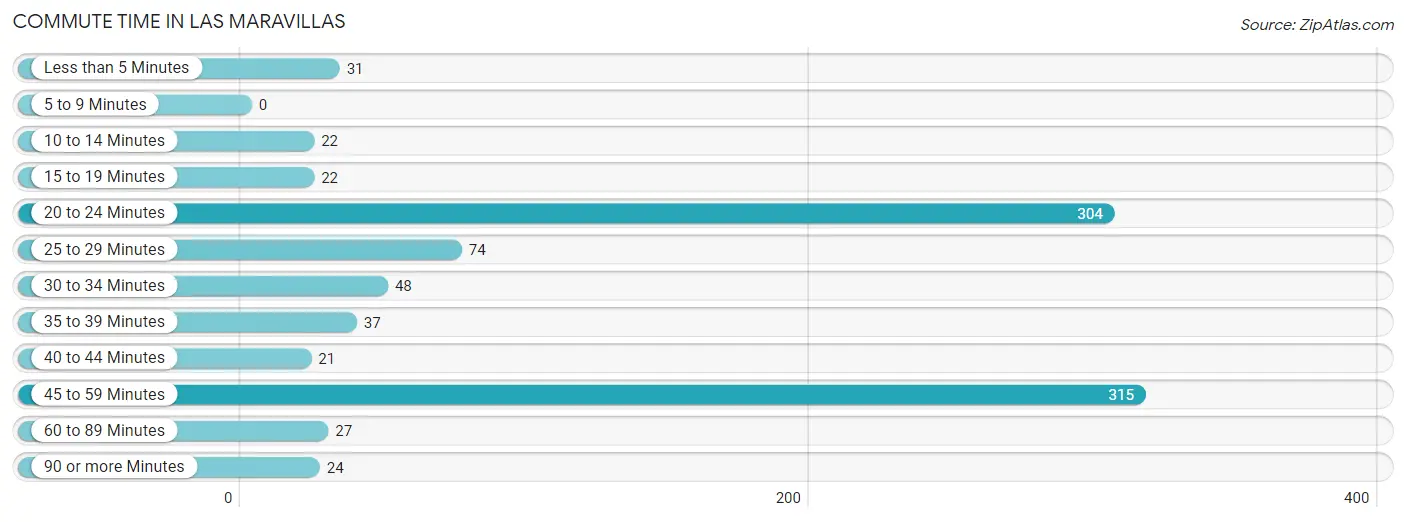
| Commute Time | # Commuters | % Commuters |
| Less than 5 Minutes | 31 | 3.4% |
| 5 to 9 Minutes | 0 | 0.0% |
| 10 to 14 Minutes | 22 | 2.4% |
| 15 to 19 Minutes | 22 | 2.4% |
| 20 to 24 Minutes | 304 | 32.9% |
| 25 to 29 Minutes | 74 | 8.0% |
| 30 to 34 Minutes | 48 | 5.2% |
| 35 to 39 Minutes | 37 | 4.0% |
| 40 to 44 Minutes | 21 | 2.3% |
| 45 to 59 Minutes | 315 | 34.1% |
| 60 to 89 Minutes | 27 | 2.9% |
| 90 or more Minutes | 24 | 2.6% |
Commute Time by Sex in Las Maravillas
The most common commute times in Las Maravillas are 20 to 24 minutes (215 commuters, 50.9%) for males and 45 to 59 minutes (214 commuters, 42.5%) for females.
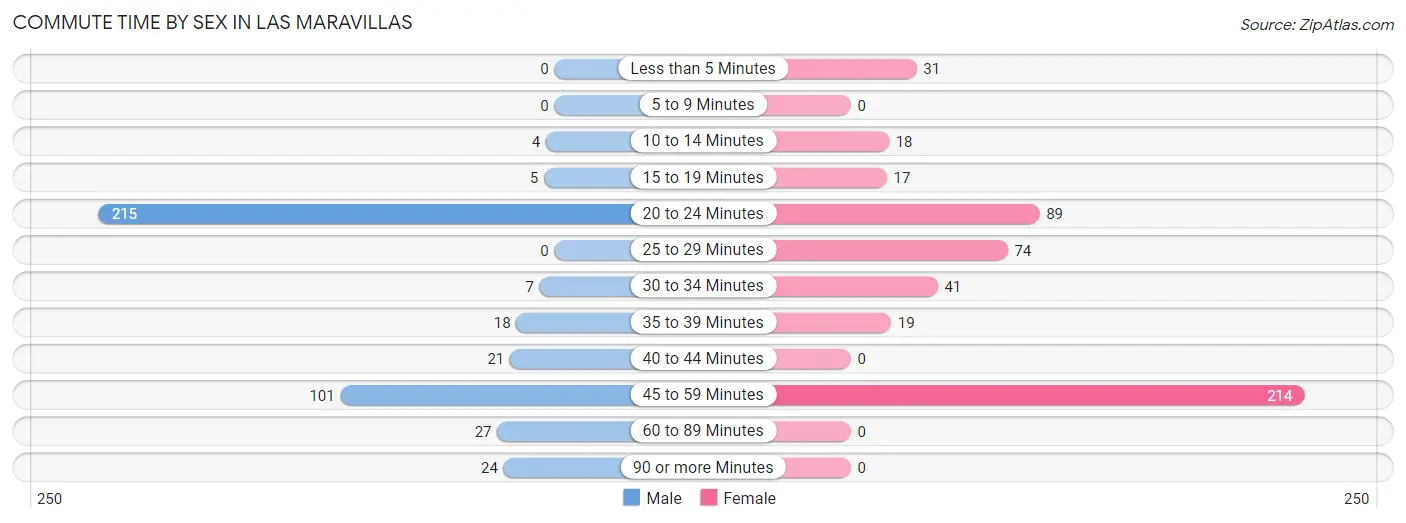
| Commute Time | Male | Female |
| Less than 5 Minutes | 0 (0.0%) | 31 (6.2%) |
| 5 to 9 Minutes | 0 (0.0%) | 0 (0.0%) |
| 10 to 14 Minutes | 4 (0.9%) | 18 (3.6%) |
| 15 to 19 Minutes | 5 (1.2%) | 17 (3.4%) |
| 20 to 24 Minutes | 215 (50.9%) | 89 (17.7%) |
| 25 to 29 Minutes | 0 (0.0%) | 74 (14.7%) |
| 30 to 34 Minutes | 7 (1.7%) | 41 (8.2%) |
| 35 to 39 Minutes | 18 (4.3%) | 19 (3.8%) |
| 40 to 44 Minutes | 21 (5.0%) | 0 (0.0%) |
| 45 to 59 Minutes | 101 (23.9%) | 214 (42.5%) |
| 60 to 89 Minutes | 27 (6.4%) | 0 (0.0%) |
| 90 or more Minutes | 24 (5.7%) | 0 (0.0%) |
Time of Departure to Work by Sex in Las Maravillas
The most frequent times of departure to work in Las Maravillas are 12:00 PM to 3:59 PM (98, 23.2%) for males and 6:00 AM to 6:29 AM (169, 33.6%) for females.
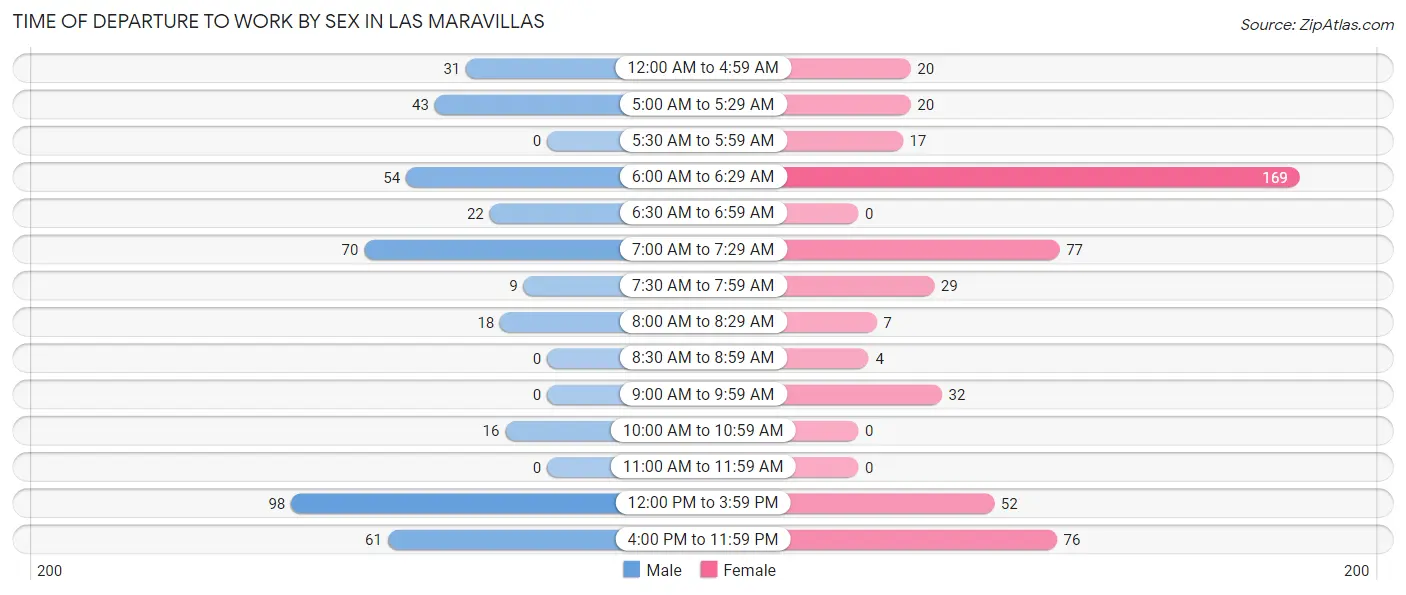
| Time of Departure | Male | Female |
| 12:00 AM to 4:59 AM | 31 (7.3%) | 20 (4.0%) |
| 5:00 AM to 5:29 AM | 43 (10.2%) | 20 (4.0%) |
| 5:30 AM to 5:59 AM | 0 (0.0%) | 17 (3.4%) |
| 6:00 AM to 6:29 AM | 54 (12.8%) | 169 (33.6%) |
| 6:30 AM to 6:59 AM | 22 (5.2%) | 0 (0.0%) |
| 7:00 AM to 7:29 AM | 70 (16.6%) | 77 (15.3%) |
| 7:30 AM to 7:59 AM | 9 (2.1%) | 29 (5.8%) |
| 8:00 AM to 8:29 AM | 18 (4.3%) | 7 (1.4%) |
| 8:30 AM to 8:59 AM | 0 (0.0%) | 4 (0.8%) |
| 9:00 AM to 9:59 AM | 0 (0.0%) | 32 (6.4%) |
| 10:00 AM to 10:59 AM | 16 (3.8%) | 0 (0.0%) |
| 11:00 AM to 11:59 AM | 0 (0.0%) | 0 (0.0%) |
| 12:00 PM to 3:59 PM | 98 (23.2%) | 52 (10.3%) |
| 4:00 PM to 11:59 PM | 61 (14.4%) | 76 (15.1%) |
| Total | 422 (100.0%) | 503 (100.0%) |
Housing Occupancy in Las Maravillas
Occupancy by Ownership in Las Maravillas
Of the total 549 dwellings in Las Maravillas, owner-occupied units account for 524 (95.5%), while renter-occupied units make up 25 (4.5%).
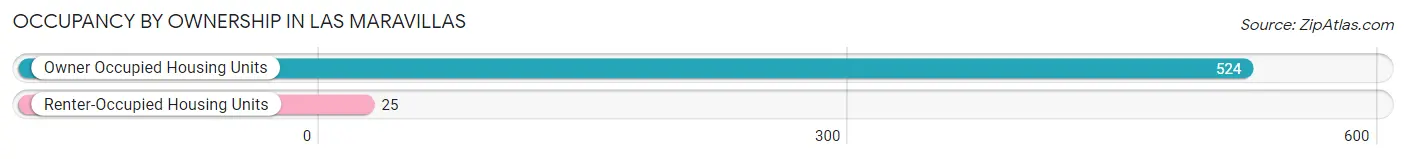
| Occupancy | # Housing Units | % Housing Units |
| Owner Occupied Housing Units | 524 | 95.5% |
| Renter-Occupied Housing Units | 25 | 4.5% |
| Total Occupied Housing Units | 549 | 100.0% |
Occupancy by Household Size in Las Maravillas
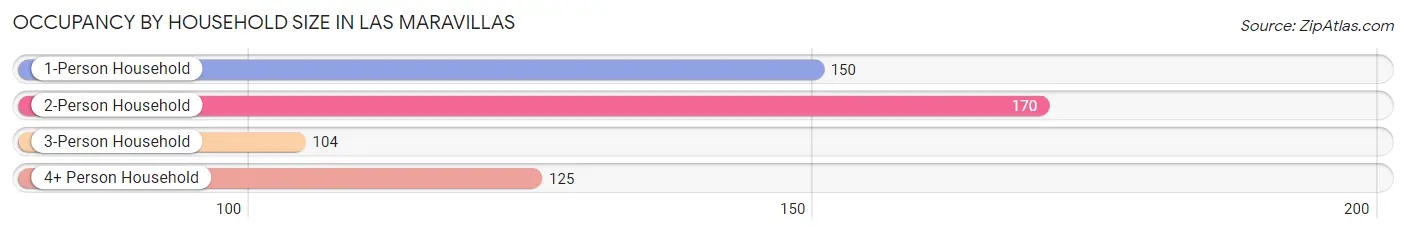
| Household Size | # Housing Units | % Housing Units |
| 1-Person Household | 150 | 27.3% |
| 2-Person Household | 170 | 31.0% |
| 3-Person Household | 104 | 18.9% |
| 4+ Person Household | 125 | 22.8% |
| Total Housing Units | 549 | 100.0% |
Occupancy by Ownership by Household Size in Las Maravillas
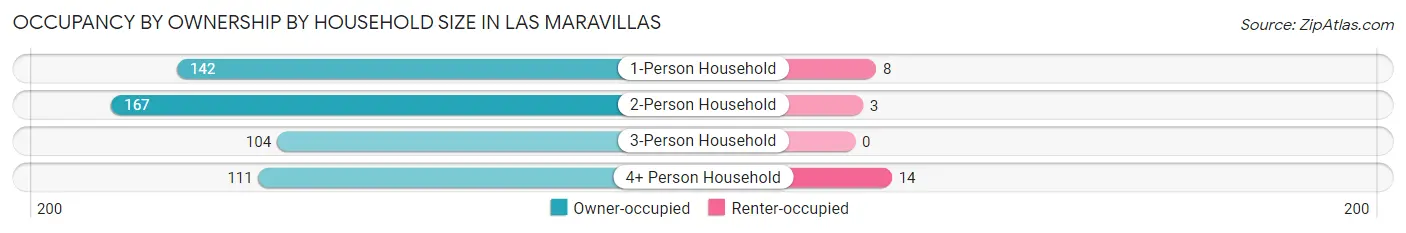
| Household Size | Owner-occupied | Renter-occupied |
| 1-Person Household | 142 (94.7%) | 8 (5.3%) |
| 2-Person Household | 167 (98.2%) | 3 (1.8%) |
| 3-Person Household | 104 (100.0%) | 0 (0.0%) |
| 4+ Person Household | 111 (88.8%) | 14 (11.2%) |
| Total Housing Units | 524 (95.5%) | 25 (4.5%) |
Occupancy by Educational Attainment in Las Maravillas
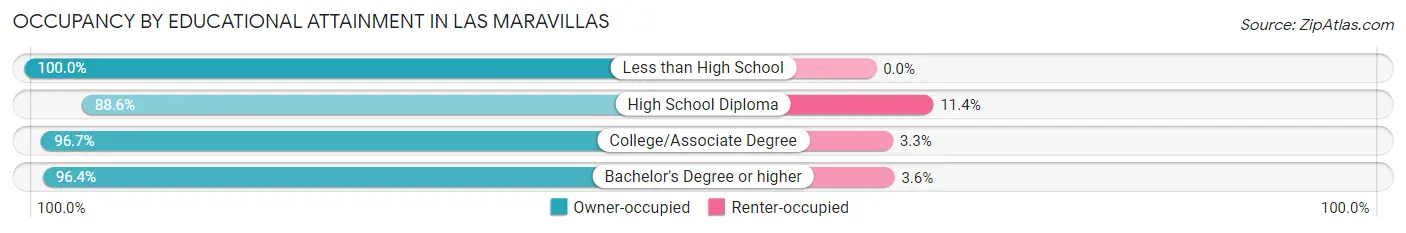
| Household Size | Owner-occupied | Renter-occupied |
| Less than High School | 27 (100.0%) | 0 (0.0%) |
| High School Diploma | 78 (88.6%) | 10 (11.4%) |
| College/Associate Degree | 233 (96.7%) | 8 (3.3%) |
| Bachelor's Degree or higher | 186 (96.4%) | 7 (3.6%) |
Occupancy by Age of Householder in Las Maravillas
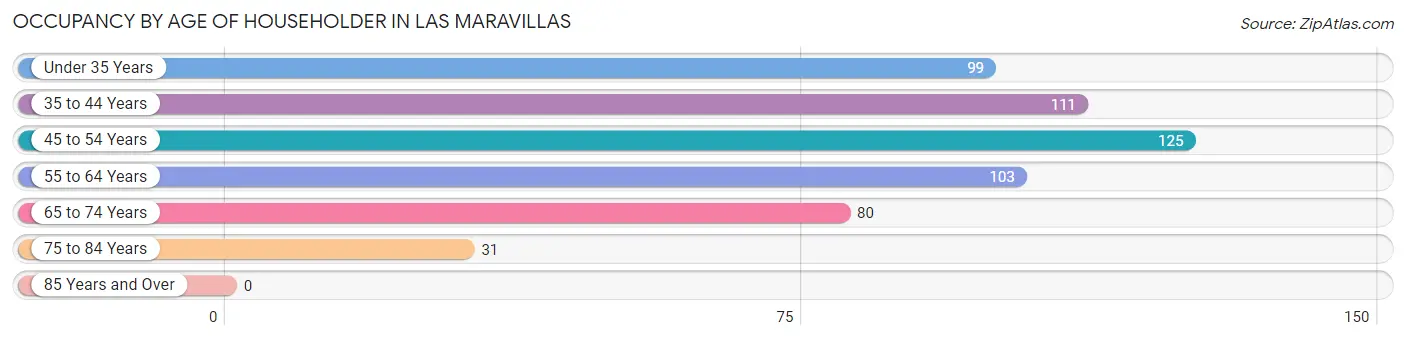
| Age Bracket | # Households | % Households |
| Under 35 Years | 99 | 18.0% |
| 35 to 44 Years | 111 | 20.2% |
| 45 to 54 Years | 125 | 22.8% |
| 55 to 64 Years | 103 | 18.8% |
| 65 to 74 Years | 80 | 14.6% |
| 75 to 84 Years | 31 | 5.7% |
| 85 Years and Over | 0 | 0.0% |
| Total | 549 | 100.0% |
Housing Finances in Las Maravillas
Median Income by Occupancy in Las Maravillas
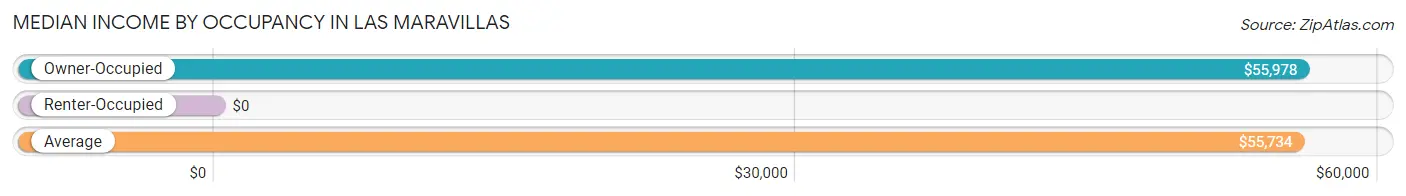
| Occupancy Type | # Households | Median Income |
| Owner-Occupied | 524 (95.5%) | $55,978 |
| Renter-Occupied | 25 (4.5%) | $0 |
| Average | 549 (100.0%) | $55,734 |
Occupancy by Householder Income Bracket in Las Maravillas
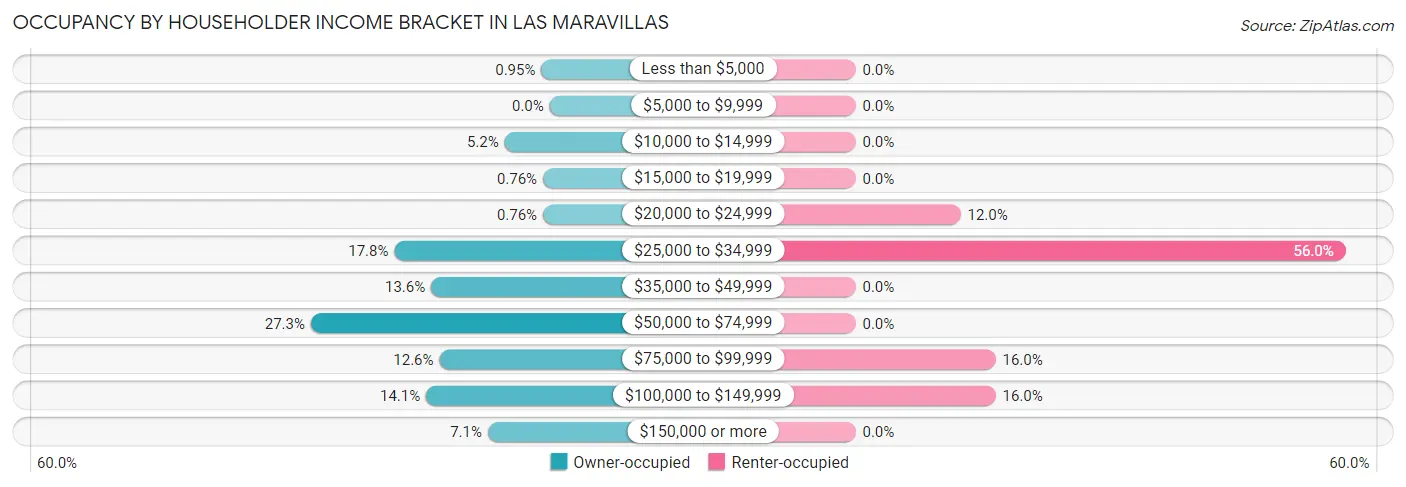
| Income Bracket | Owner-occupied | Renter-occupied |
| Less than $5,000 | 5 (0.9%) | 0 (0.0%) |
| $5,000 to $9,999 | 0 (0.0%) | 0 (0.0%) |
| $10,000 to $14,999 | 27 (5.1%) | 0 (0.0%) |
| $15,000 to $19,999 | 4 (0.8%) | 0 (0.0%) |
| $20,000 to $24,999 | 4 (0.8%) | 3 (12.0%) |
| $25,000 to $34,999 | 93 (17.7%) | 14 (56.0%) |
| $35,000 to $49,999 | 71 (13.6%) | 0 (0.0%) |
| $50,000 to $74,999 | 143 (27.3%) | 0 (0.0%) |
| $75,000 to $99,999 | 66 (12.6%) | 4 (16.0%) |
| $100,000 to $149,999 | 74 (14.1%) | 4 (16.0%) |
| $150,000 or more | 37 (7.1%) | 0 (0.0%) |
| Total | 524 (100.0%) | 25 (100.0%) |
Monthly Housing Cost Tiers in Las Maravillas
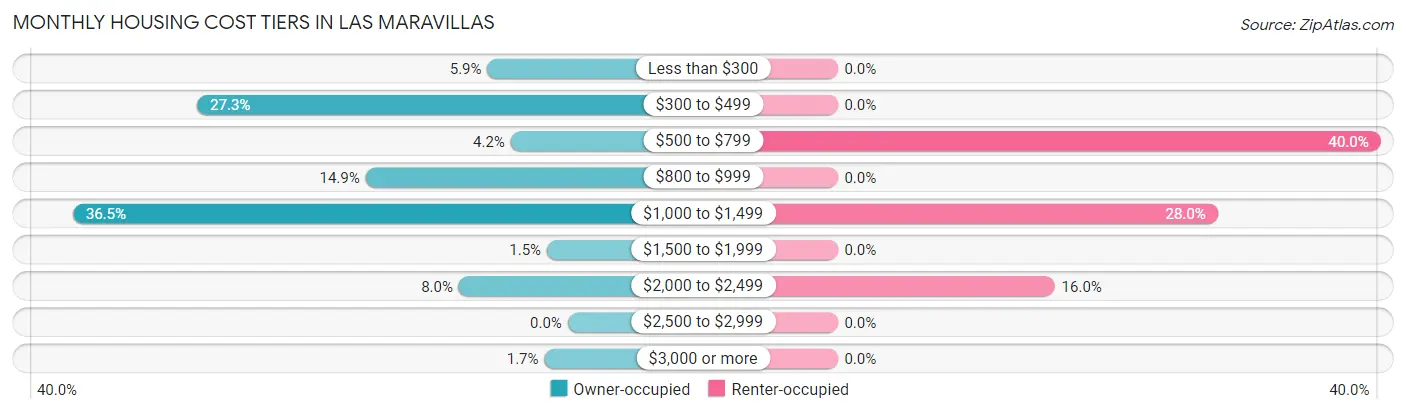
| Monthly Cost | Owner-occupied | Renter-occupied |
| Less than $300 | 31 (5.9%) | 0 (0.0%) |
| $300 to $499 | 143 (27.3%) | 0 (0.0%) |
| $500 to $799 | 22 (4.2%) | 10 (40.0%) |
| $800 to $999 | 78 (14.9%) | 0 (0.0%) |
| $1,000 to $1,499 | 191 (36.4%) | 7 (28.0%) |
| $1,500 to $1,999 | 8 (1.5%) | 0 (0.0%) |
| $2,000 to $2,499 | 42 (8.0%) | 4 (16.0%) |
| $2,500 to $2,999 | 0 (0.0%) | 0 (0.0%) |
| $3,000 or more | 9 (1.7%) | 0 (0.0%) |
| Total | 524 (100.0%) | 25 (100.0%) |
Physical Housing Characteristics in Las Maravillas
Housing Structures in Las Maravillas
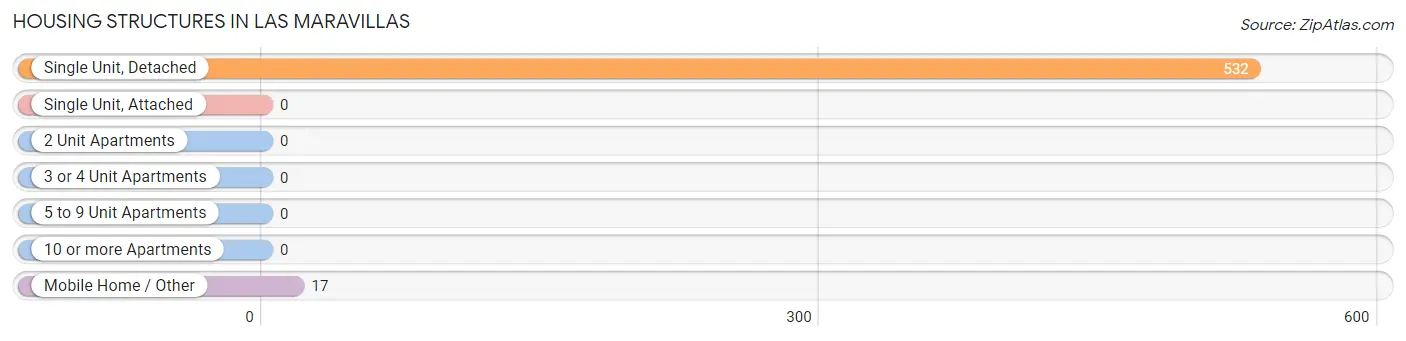
| Structure Type | # Housing Units | % Housing Units |
| Single Unit, Detached | 532 | 96.9% |
| Single Unit, Attached | 0 | 0.0% |
| 2 Unit Apartments | 0 | 0.0% |
| 3 or 4 Unit Apartments | 0 | 0.0% |
| 5 to 9 Unit Apartments | 0 | 0.0% |
| 10 or more Apartments | 0 | 0.0% |
| Mobile Home / Other | 17 | 3.1% |
| Total | 549 | 100.0% |
Housing Structures by Occupancy in Las Maravillas
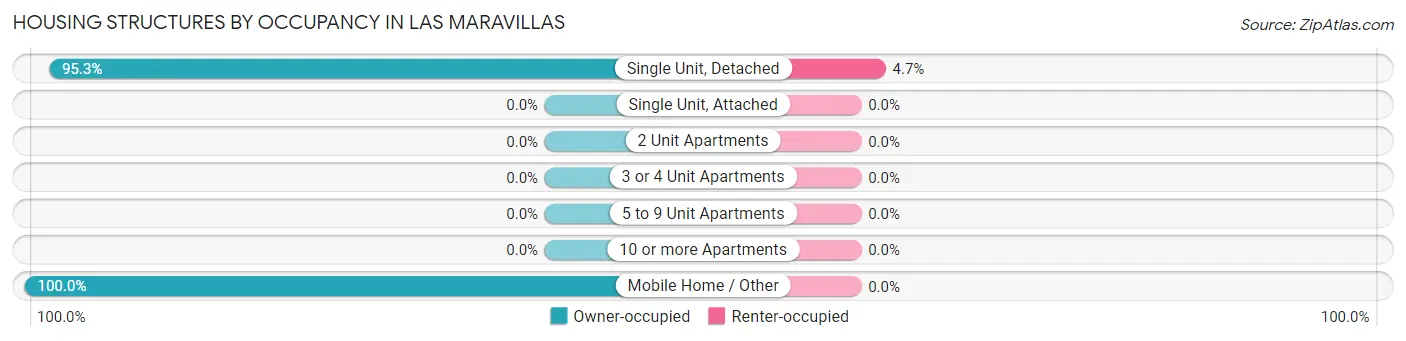
| Structure Type | Owner-occupied | Renter-occupied |
| Single Unit, Detached | 507 (95.3%) | 25 (4.7%) |
| Single Unit, Attached | 0 (0.0%) | 0 (0.0%) |
| 2 Unit Apartments | 0 (0.0%) | 0 (0.0%) |
| 3 or 4 Unit Apartments | 0 (0.0%) | 0 (0.0%) |
| 5 to 9 Unit Apartments | 0 (0.0%) | 0 (0.0%) |
| 10 or more Apartments | 0 (0.0%) | 0 (0.0%) |
| Mobile Home / Other | 17 (100.0%) | 0 (0.0%) |
| Total | 524 (95.5%) | 25 (4.5%) |
Housing Structures by Number of Rooms in Las Maravillas
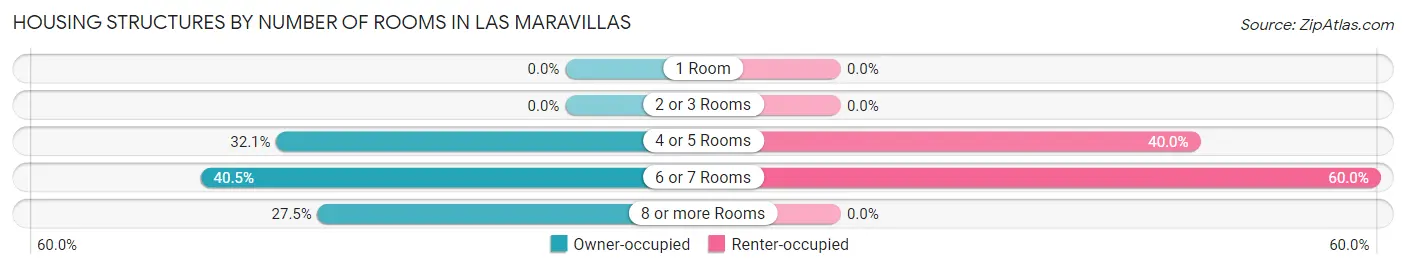
| Number of Rooms | Owner-occupied | Renter-occupied |
| 1 Room | 0 (0.0%) | 0 (0.0%) |
| 2 or 3 Rooms | 0 (0.0%) | 0 (0.0%) |
| 4 or 5 Rooms | 168 (32.1%) | 10 (40.0%) |
| 6 or 7 Rooms | 212 (40.5%) | 15 (60.0%) |
| 8 or more Rooms | 144 (27.5%) | 0 (0.0%) |
| Total | 524 (100.0%) | 25 (100.0%) |
Housing Structure by Heating Type in Las Maravillas
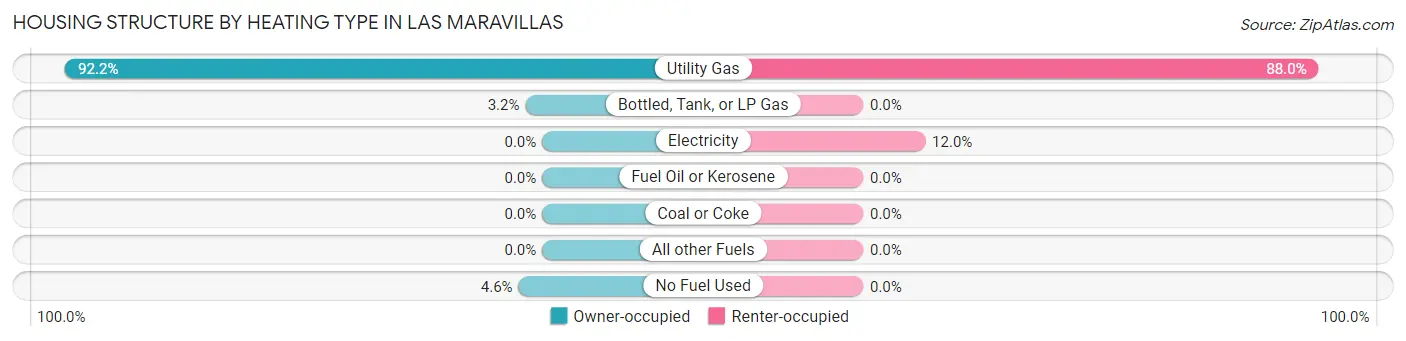
| Heating Type | Owner-occupied | Renter-occupied |
| Utility Gas | 483 (92.2%) | 22 (88.0%) |
| Bottled, Tank, or LP Gas | 17 (3.2%) | 0 (0.0%) |
| Electricity | 0 (0.0%) | 3 (12.0%) |
| Fuel Oil or Kerosene | 0 (0.0%) | 0 (0.0%) |
| Coal or Coke | 0 (0.0%) | 0 (0.0%) |
| All other Fuels | 0 (0.0%) | 0 (0.0%) |
| No Fuel Used | 24 (4.6%) | 0 (0.0%) |
| Total | 524 (100.0%) | 25 (100.0%) |
Household Vehicle Usage in Las Maravillas
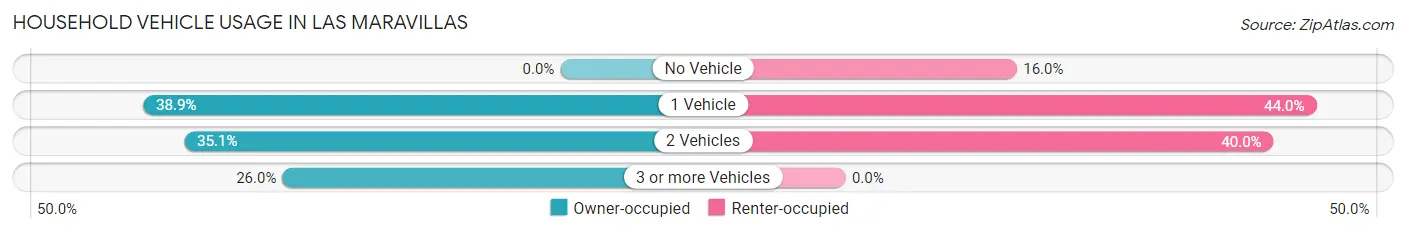
| Vehicles per Household | Owner-occupied | Renter-occupied |
| No Vehicle | 0 (0.0%) | 4 (16.0%) |
| 1 Vehicle | 204 (38.9%) | 11 (44.0%) |
| 2 Vehicles | 184 (35.1%) | 10 (40.0%) |
| 3 or more Vehicles | 136 (26.0%) | 0 (0.0%) |
| Total | 524 (100.0%) | 25 (100.0%) |
Real Estate & Mortgages in Las Maravillas
Real Estate and Mortgage Overview in Las Maravillas
| Characteristic | Without Mortgage | With Mortgage |
| Housing Units | 192 | 332 |
| Median Property Value | $183,600 | $172,700 |
| Median Household Income | $51,875 | $26 |
| Monthly Housing Costs | $406 | $9 |
| Real Estate Taxes | $1,200 | $9 |
Property Value by Mortgage Status in Las Maravillas
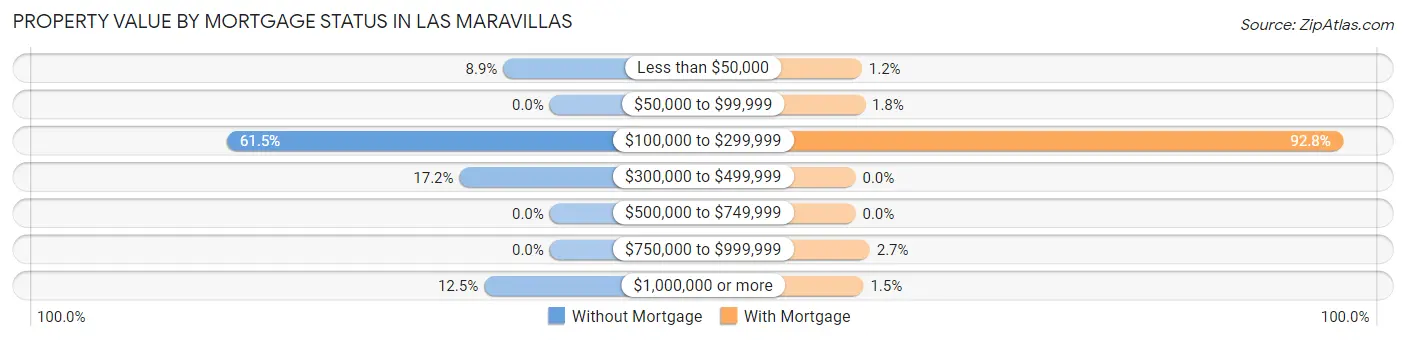
| Property Value | Without Mortgage | With Mortgage |
| Less than $50,000 | 17 (8.8%) | 4 (1.2%) |
| $50,000 to $99,999 | 0 (0.0%) | 6 (1.8%) |
| $100,000 to $299,999 | 118 (61.5%) | 308 (92.8%) |
| $300,000 to $499,999 | 33 (17.2%) | 0 (0.0%) |
| $500,000 to $749,999 | 0 (0.0%) | 0 (0.0%) |
| $750,000 to $999,999 | 0 (0.0%) | 9 (2.7%) |
| $1,000,000 or more | 24 (12.5%) | 5 (1.5%) |
| Total | 192 (100.0%) | 332 (100.0%) |
Household Income by Mortgage Status in Las Maravillas
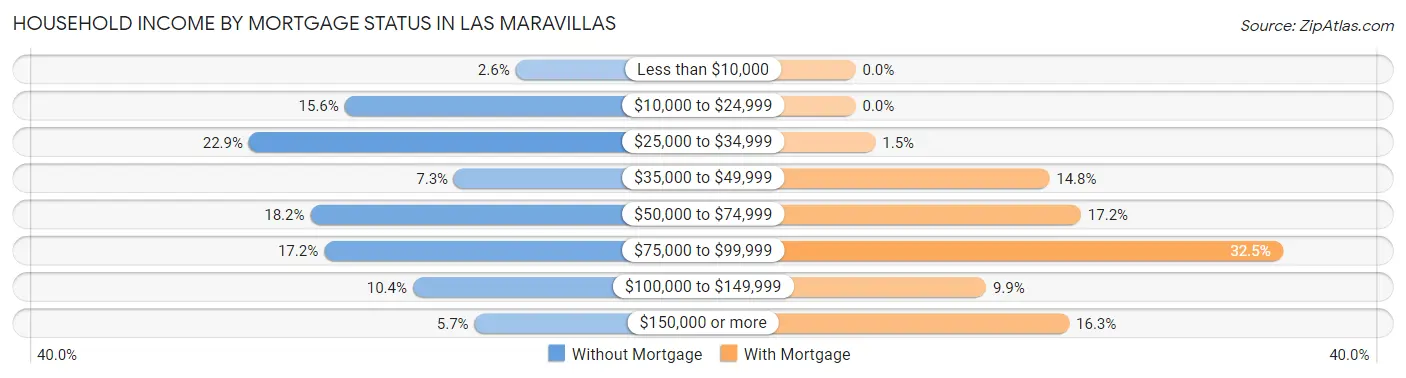
| Household Income | Without Mortgage | With Mortgage |
| Less than $10,000 | 5 (2.6%) | 0 (0.0%) |
| $10,000 to $24,999 | 30 (15.6%) | 0 (0.0%) |
| $25,000 to $34,999 | 44 (22.9%) | 5 (1.5%) |
| $35,000 to $49,999 | 14 (7.3%) | 49 (14.8%) |
| $50,000 to $74,999 | 35 (18.2%) | 57 (17.2%) |
| $75,000 to $99,999 | 33 (17.2%) | 108 (32.5%) |
| $100,000 to $149,999 | 20 (10.4%) | 33 (9.9%) |
| $150,000 or more | 11 (5.7%) | 54 (16.3%) |
| Total | 192 (100.0%) | 332 (100.0%) |
Property Value to Household Income Ratio in Las Maravillas
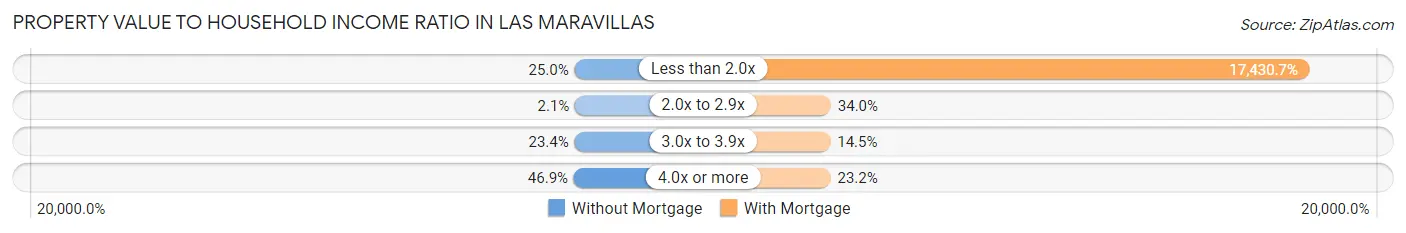
| Value-to-Income Ratio | Without Mortgage | With Mortgage |
| Less than 2.0x | 48 (25.0%) | 57,870 (17,430.7%) |
| 2.0x to 2.9x | 4 (2.1%) | 113 (34.0%) |
| 3.0x to 3.9x | 45 (23.4%) | 48 (14.5%) |
| 4.0x or more | 90 (46.9%) | 77 (23.2%) |
| Total | 192 (100.0%) | 332 (100.0%) |
Real Estate Taxes by Mortgage Status in Las Maravillas
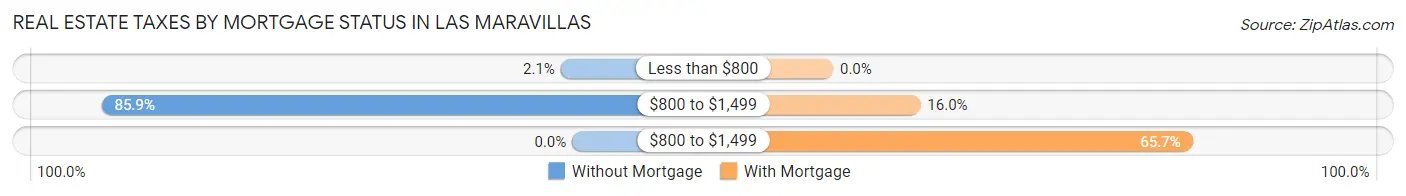
| Property Taxes | Without Mortgage | With Mortgage |
| Less than $800 | 4 (2.1%) | 0 (0.0%) |
| $800 to $1,499 | 165 (85.9%) | 53 (16.0%) |
| $800 to $1,499 | 0 (0.0%) | 218 (65.7%) |
| Total | 192 (100.0%) | 332 (100.0%) |
Health & Disability in Las Maravillas
Health Insurance Coverage by Age in Las Maravillas
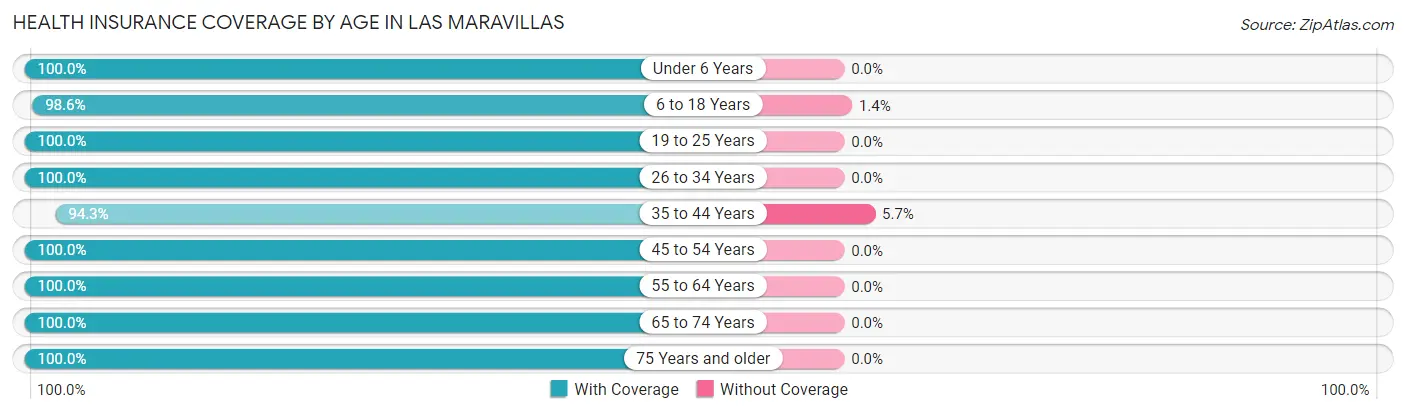
| Age Bracket | With Coverage | Without Coverage |
| Under 6 Years | 80 (100.0%) | 0 (0.0%) |
| 6 to 18 Years | 484 (98.6%) | 7 (1.4%) |
| 19 to 25 Years | 229 (100.0%) | 0 (0.0%) |
| 26 to 34 Years | 190 (100.0%) | 0 (0.0%) |
| 35 to 44 Years | 197 (94.3%) | 12 (5.7%) |
| 45 to 54 Years | 274 (100.0%) | 0 (0.0%) |
| 55 to 64 Years | 150 (100.0%) | 0 (0.0%) |
| 65 to 74 Years | 109 (100.0%) | 0 (0.0%) |
| 75 Years and older | 64 (100.0%) | 0 (0.0%) |
| Total | 1,777 (98.9%) | 19 (1.1%) |
Health Insurance Coverage by Citizenship Status in Las Maravillas

| Citizenship Status | With Coverage | Without Coverage |
| Native Born | 80 (100.0%) | 0 (0.0%) |
| Foreign Born, Citizen | 484 (98.6%) | 7 (1.4%) |
| Foreign Born, not a Citizen | 229 (100.0%) | 0 (0.0%) |
Health Insurance Coverage by Household Income in Las Maravillas
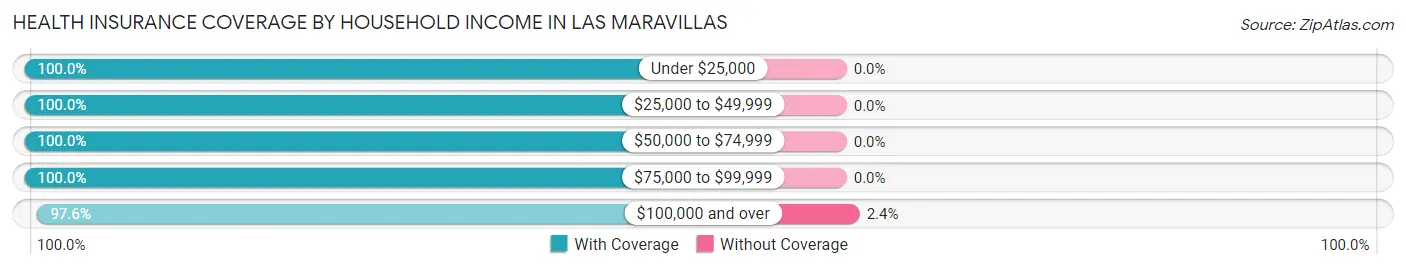
| Household Income | With Coverage | Without Coverage |
| Under $25,000 | 117 (100.0%) | 0 (0.0%) |
| $25,000 to $49,999 | 437 (100.0%) | 0 (0.0%) |
| $50,000 to $74,999 | 307 (100.0%) | 0 (0.0%) |
| $75,000 to $99,999 | 150 (100.0%) | 0 (0.0%) |
| $100,000 and over | 766 (97.6%) | 19 (2.4%) |
Public vs Private Health Insurance Coverage by Age in Las Maravillas
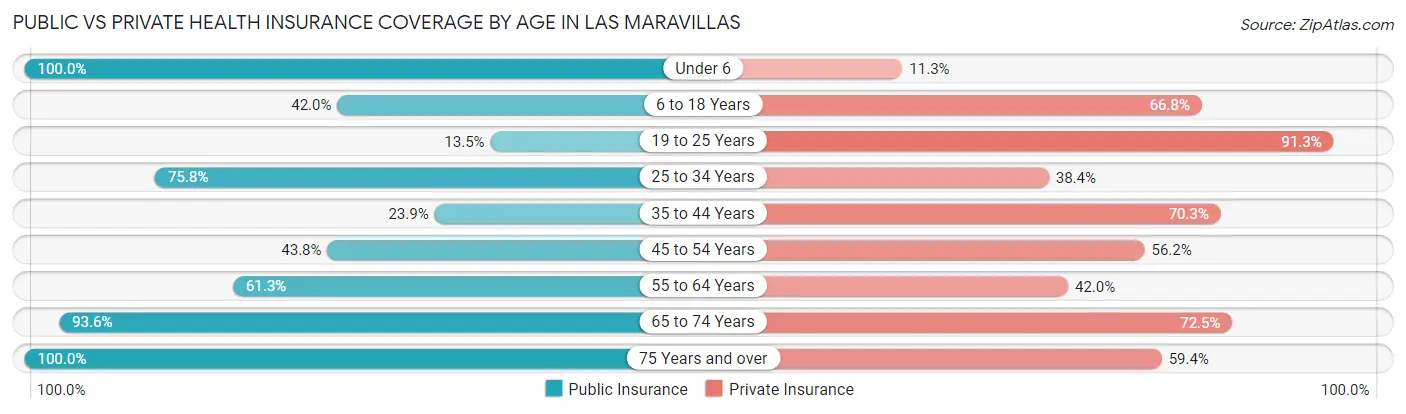
| Age Bracket | Public Insurance | Private Insurance |
| Under 6 | 80 (100.0%) | 9 (11.3%) |
| 6 to 18 Years | 206 (42.0%) | 328 (66.8%) |
| 19 to 25 Years | 31 (13.5%) | 209 (91.3%) |
| 25 to 34 Years | 144 (75.8%) | 73 (38.4%) |
| 35 to 44 Years | 50 (23.9%) | 147 (70.3%) |
| 45 to 54 Years | 120 (43.8%) | 154 (56.2%) |
| 55 to 64 Years | 92 (61.3%) | 63 (42.0%) |
| 65 to 74 Years | 102 (93.6%) | 79 (72.5%) |
| 75 Years and over | 64 (100.0%) | 38 (59.4%) |
| Total | 889 (49.5%) | 1,100 (61.3%) |
Disability Status by Sex by Age in Las Maravillas
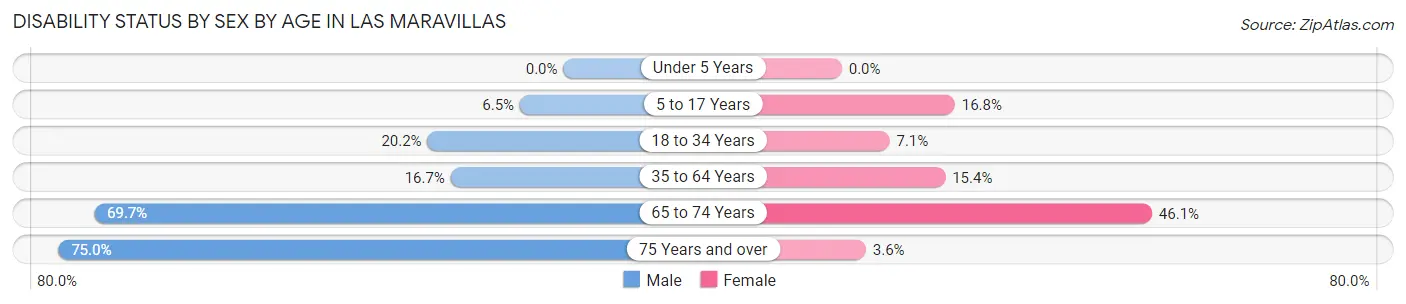
| Age Bracket | Male | Female |
| Under 5 Years | 0 (0.0%) | 0 (0.0%) |
| 5 to 17 Years | 16 (6.5%) | 25 (16.8%) |
| 18 to 34 Years | 46 (20.2%) | 21 (7.1%) |
| 35 to 64 Years | 46 (16.7%) | 55 (15.4%) |
| 65 to 74 Years | 23 (69.7%) | 35 (46.1%) |
| 75 Years and over | 27 (75.0%) | 1 (3.6%) |
Disability Class by Sex by Age in Las Maravillas
Disability Class: Hearing Difficulty
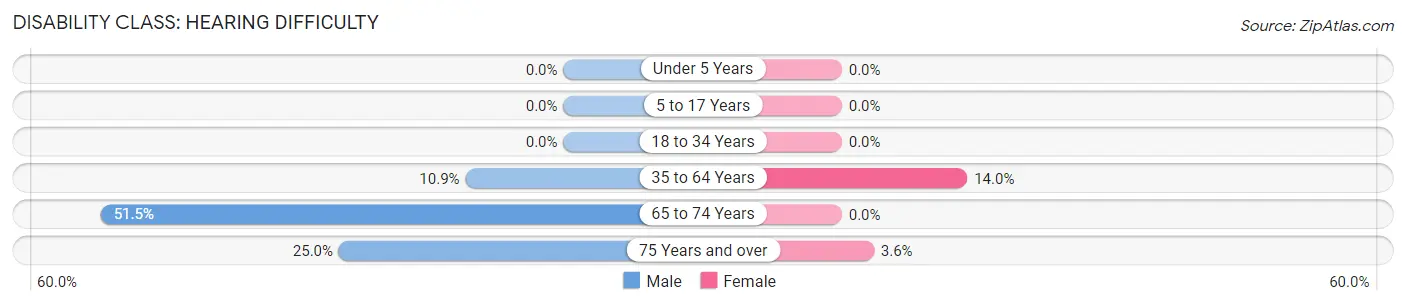
| Age Bracket | Male | Female |
| Under 5 Years | 0 (0.0%) | 0 (0.0%) |
| 5 to 17 Years | 0 (0.0%) | 0 (0.0%) |
| 18 to 34 Years | 0 (0.0%) | 0 (0.0%) |
| 35 to 64 Years | 30 (10.9%) | 50 (14.0%) |
| 65 to 74 Years | 17 (51.5%) | 0 (0.0%) |
| 75 Years and over | 9 (25.0%) | 1 (3.6%) |
Disability Class: Vision Difficulty
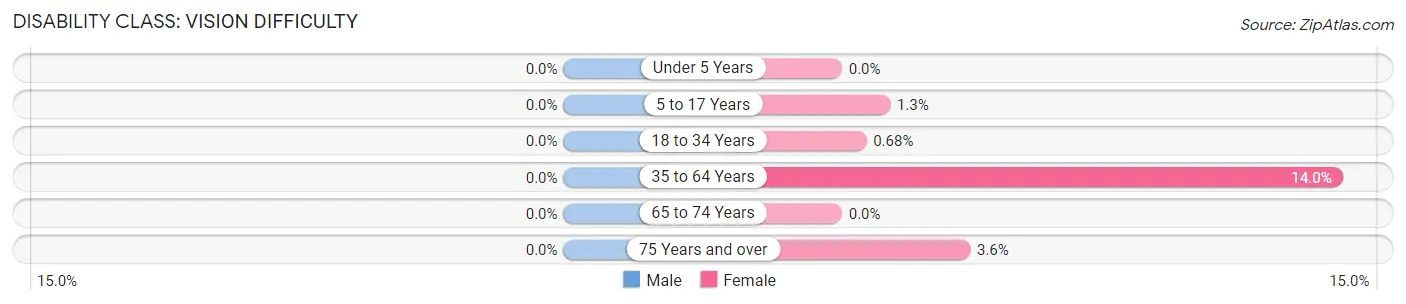
| Age Bracket | Male | Female |
| Under 5 Years | 0 (0.0%) | 0 (0.0%) |
| 5 to 17 Years | 0 (0.0%) | 2 (1.3%) |
| 18 to 34 Years | 0 (0.0%) | 2 (0.7%) |
| 35 to 64 Years | 0 (0.0%) | 50 (14.0%) |
| 65 to 74 Years | 0 (0.0%) | 0 (0.0%) |
| 75 Years and over | 0 (0.0%) | 1 (3.6%) |
Disability Class: Cognitive Difficulty
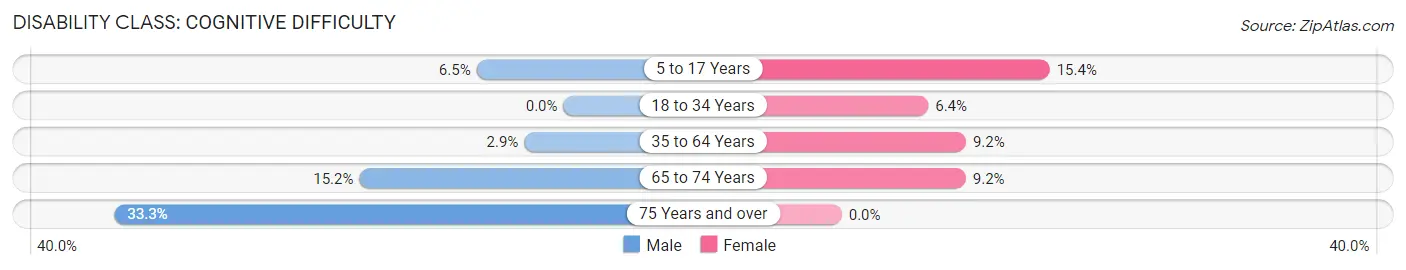
| Age Bracket | Male | Female |
| 5 to 17 Years | 16 (6.5%) | 23 (15.4%) |
| 18 to 34 Years | 0 (0.0%) | 19 (6.4%) |
| 35 to 64 Years | 8 (2.9%) | 33 (9.2%) |
| 65 to 74 Years | 5 (15.1%) | 7 (9.2%) |
| 75 Years and over | 12 (33.3%) | 0 (0.0%) |
Disability Class: Ambulatory Difficulty
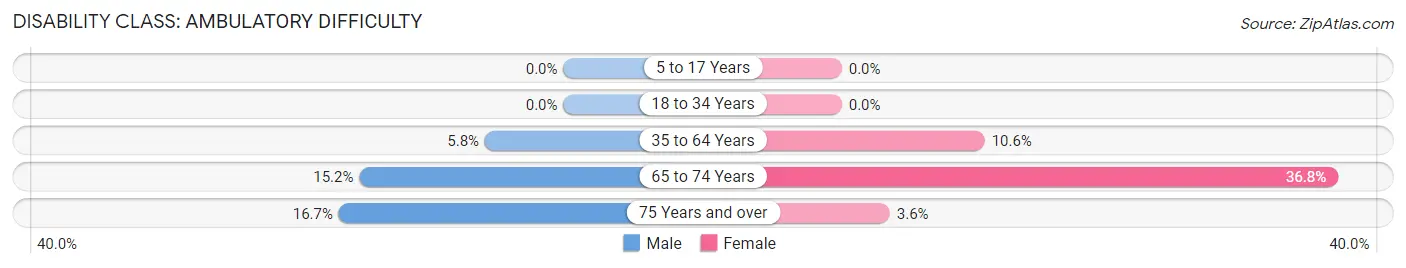
| Age Bracket | Male | Female |
| 5 to 17 Years | 0 (0.0%) | 0 (0.0%) |
| 18 to 34 Years | 0 (0.0%) | 0 (0.0%) |
| 35 to 64 Years | 16 (5.8%) | 38 (10.6%) |
| 65 to 74 Years | 5 (15.1%) | 28 (36.8%) |
| 75 Years and over | 6 (16.7%) | 1 (3.6%) |
Disability Class: Self-Care Difficulty
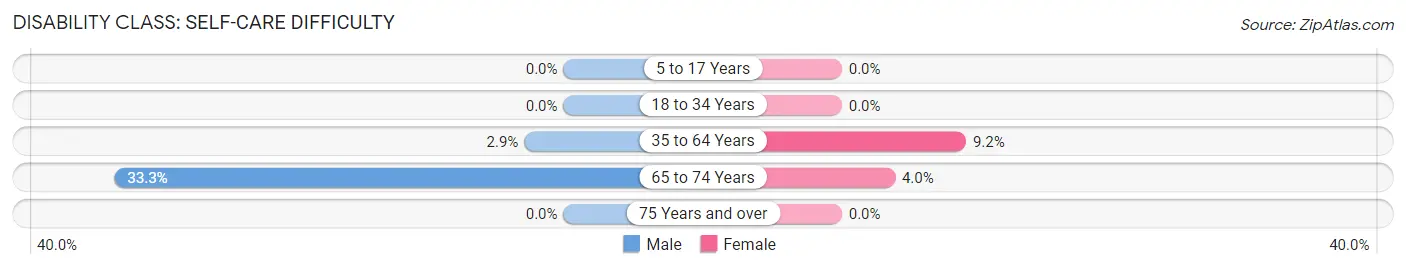
| Age Bracket | Male | Female |
| 5 to 17 Years | 0 (0.0%) | 0 (0.0%) |
| 18 to 34 Years | 0 (0.0%) | 0 (0.0%) |
| 35 to 64 Years | 8 (2.9%) | 33 (9.2%) |
| 65 to 74 Years | 11 (33.3%) | 3 (4.0%) |
| 75 Years and over | 0 (0.0%) | 0 (0.0%) |
Technology Access in Las Maravillas
Computing Device Access in Las Maravillas

| Device Type | # Households | % Households |
| Desktop or Laptop | 378 | 68.9% |
| Smartphone | 411 | 74.9% |
| Tablet | 306 | 55.7% |
| No Computing Device | 77 | 14.0% |
| Total | 549 | 100.0% |
Internet Access in Las Maravillas
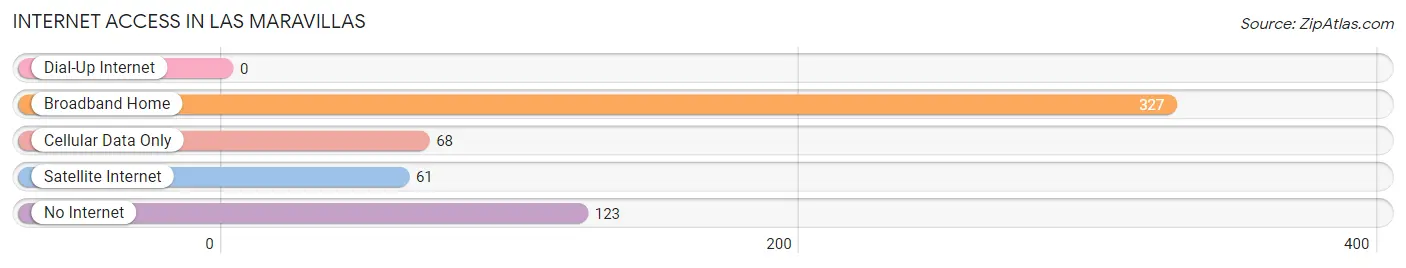
| Internet Type | # Households | % Households |
| Dial-Up Internet | 0 | 0.0% |
| Broadband Home | 327 | 59.6% |
| Cellular Data Only | 68 | 12.4% |
| Satellite Internet | 61 | 11.1% |
| No Internet | 123 | 22.4% |
| Total | 549 | 100.0% |
Las Maravillas Summary
Maravillas, New Mexico is a small town located in the northern part of the state, near the border with Colorado. It is situated in the San Luis Valley, a large, high-altitude valley that is home to a variety of wildlife and vegetation. The town is surrounded by the Sangre de Cristo Mountains to the east and the San Juan Mountains to the west.
History
Maravillas was founded in 1876 by a group of settlers from the nearby town of San Luis. The settlers were looking for a place to settle and raise their families, and they chose the area because of its fertile soil and abundant water supply. The town was named after the nearby Maravillas River, which was named after the Spanish word for “wonderful”.
The town quickly grew and prospered, and by the early 1900s it had become a bustling center of commerce and industry. The town was home to several businesses, including a flour mill, a sawmill, a blacksmith shop, and a general store. The town also had a post office, a school, and a church.
Geography
Maravillas is located in the northern part of the San Luis Valley, at an elevation of 7,000 feet. The town is surrounded by the Sangre de Cristo Mountains to the east and the San Juan Mountains to the west. The valley is home to a variety of wildlife, including elk, deer, antelope, and bighorn sheep. The area is also home to a variety of vegetation, including sagebrush, juniper, and piñon pine.
The climate in Maravillas is semi-arid, with hot summers and cold winters. The average annual temperature is around 50 degrees Fahrenheit, and the average annual precipitation is around 10 inches.
Economy
The economy of Maravillas is largely based on agriculture and tourism. The town is home to several farms, which produce a variety of crops, including alfalfa, hay, and wheat. The town is also home to several tourist attractions, including the Maravillas National Wildlife Refuge, which is home to a variety of birds and other wildlife.
The town is also home to several small businesses, including restaurants, shops, and a gas station. The town is also home to a small airport, which serves as a hub for private and commercial flights.
Demographics
As of the 2010 census, the population of Maravillas was 1,845. The town is predominantly Hispanic, with a population that is approximately 90% Hispanic. The median household income in Maravillas is $30,000, and the median home value is $90,000. The town has a poverty rate of 22%, which is higher than the national average.
Maravillas is a small, rural town with a rich history and a vibrant culture. The town is home to a variety of businesses and attractions, and it is a popular destination for tourists and outdoor enthusiasts. The town is also home to a diverse population, and it is a great place to live and work.
Common Questions
What is Per Capita Income in Las Maravillas?
Per Capita income in Las Maravillas is $27,489.
What is the Median Family Income in Las Maravillas?
Median Family Income in Las Maravillas is $55,917.
What is the Median Household income in Las Maravillas?
Median Household Income in Las Maravillas is $55,734.
What is Income or Wage Gap in Las Maravillas?
Income or Wage Gap in Las Maravillas is 8.6%.
Women in Las Maravillas earn 91.4 cents for every dollar earned by a man.
What is Inequality or Gini Index in Las Maravillas?
Inequality or Gini Index in Las Maravillas is 0.39.
What is the Total Population of Las Maravillas?
Total Population of Las Maravillas is 1,796.
What is the Total Male Population of Las Maravillas?
Total Male Population of Las Maravillas is 862.
What is the Total Female Population of Las Maravillas?
Total Female Population of Las Maravillas is 934.
What is the Ratio of Males per 100 Females in Las Maravillas?
There are 92.29 Males per 100 Females in Las Maravillas.
What is the Ratio of Females per 100 Males in Las Maravillas?
There are 108.35 Females per 100 Males in Las Maravillas.
What is the Median Population Age in Las Maravillas?
Median Population Age in Las Maravillas is 30.5 Years.
What is the Average Family Size in Las Maravillas
Average Family Size in Las Maravillas is 4.1 People.
What is the Average Household Size in Las Maravillas
Average Household Size in Las Maravillas is 3.3 People.
How Large is the Labor Force in Las Maravillas?
There are 1,011 People in the Labor Forcein in Las Maravillas.
What is the Percentage of People in the Labor Force in Las Maravillas?
71.0% of People are in the Labor Force in Las Maravillas.
What is the Unemployment Rate in Las Maravillas?
Unemployment Rate in Las Maravillas is 4.6%.