North Liberty, IA Map & Demographics
North Liberty Map
North Liberty Overview
$50,009
PER CAPITA INCOME
$125,973
AVG FAMILY INCOME
$100,197
AVG HOUSEHOLD INCOME
31.7%
WAGE / INCOME GAP [ % ]
68.3¢/ $1
WAGE / INCOME GAP [ $ ]
0.41
INEQUALITY / GINI INDEX
20,393
TOTAL POPULATION
10,501
MALE POPULATION
9,892
FEMALE POPULATION
106.16
MALES / 100 FEMALES
94.20
FEMALES / 100 MALES
31.9
MEDIAN AGE
3.2
AVG FAMILY SIZE
2.6
AVG HOUSEHOLD SIZE
11,833
LABOR FORCE [ PEOPLE ]
78.6%
PERCENT IN LABOR FORCE
2.0%
UNEMPLOYMENT RATE
North Liberty Zip Codes
North Liberty Area Codes
Income in North Liberty
Income Overview in North Liberty
Per Capita Income in North Liberty is $50,009, while median incomes of families and households are $125,973 and $100,197 respectively.
| Characteristic | Number | Measure |
| Per Capita Income | 20,393 | $50,009 |
| Median Family Income | 5,154 | $125,973 |
| Mean Family Income | 5,154 | $158,126 |
| Median Household Income | 7,742 | $100,197 |
| Mean Household Income | 7,742 | $129,759 |
| Income Deficit | 5,154 | $0 |
| Wage / Income Gap (%) | 20,393 | 31.65% |
| Wage / Income Gap ($) | 20,393 | 68.35¢ per $1 |
| Gini / Inequality Index | 20,393 | 0.41 |
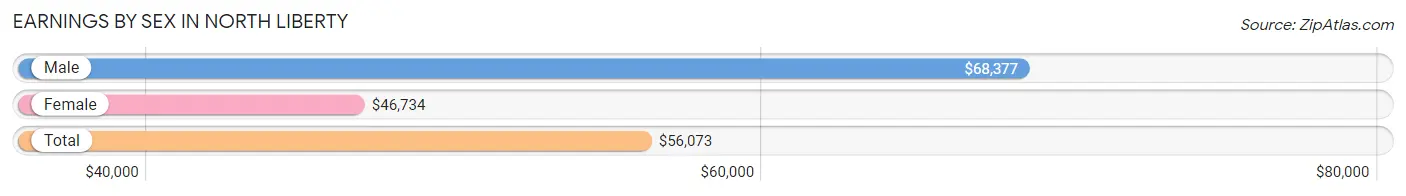
Earnings by Sex in North Liberty
Average Earnings in North Liberty are $56,073, $68,377 for men and $46,734 for women, a difference of 31.7%.
| Sex | Number | Average Earnings |
| Male | 6,641 (52.0%) | $68,377 |
| Female | 6,137 (48.0%) | $46,734 |
| Total | 12,778 (100.0%) | $56,073 |
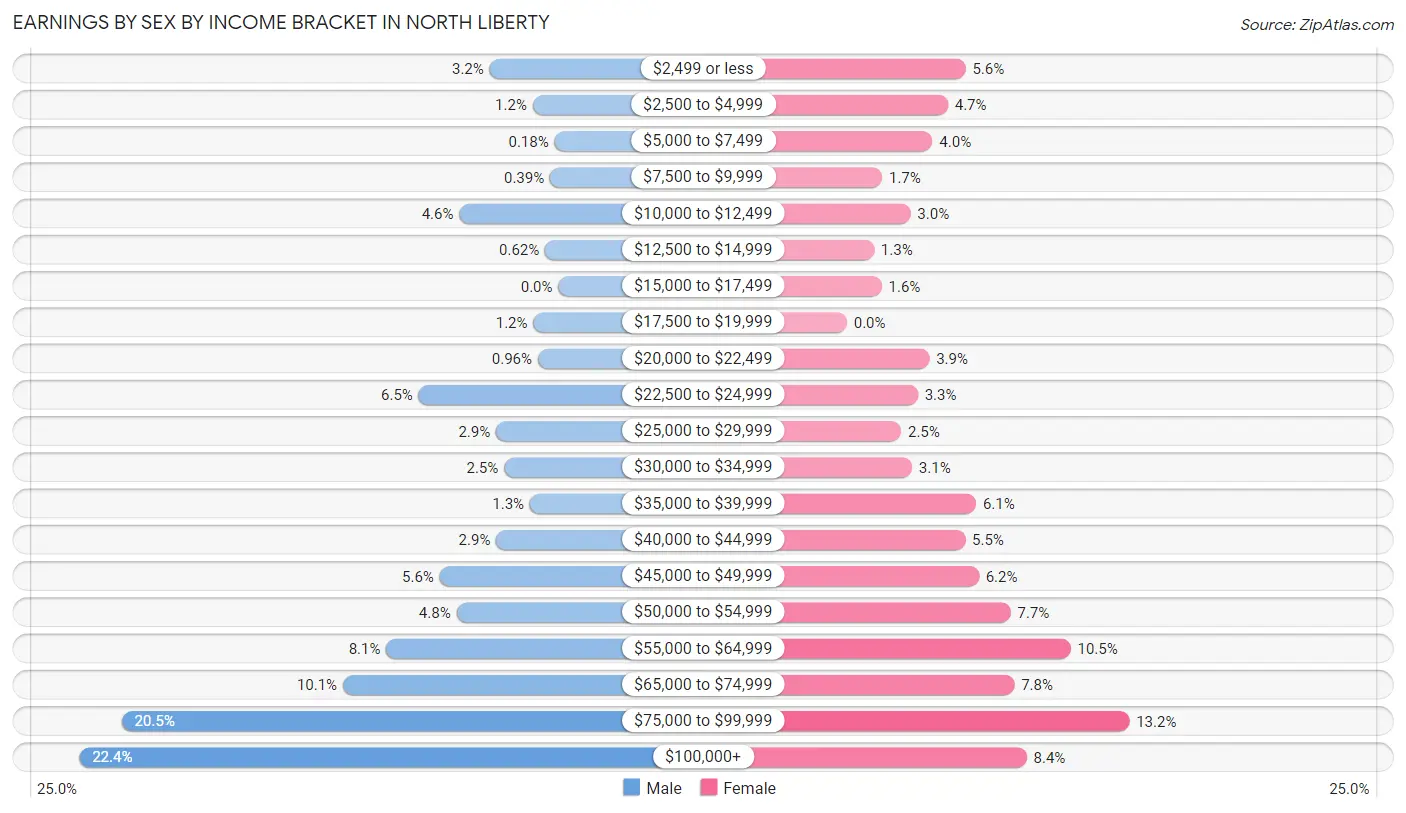
Earnings by Sex by Income Bracket in North Liberty
The most common earnings brackets in North Liberty are $100,000+ for men (1,490 | 22.4%) and $75,000 to $99,999 for women (812 | 13.2%).
| Income | Male | Female |
| $2,499 or less | 214 (3.2%) | 341 (5.6%) |
| $2,500 to $4,999 | 80 (1.2%) | 290 (4.7%) |
| $5,000 to $7,499 | 12 (0.2%) | 246 (4.0%) |
| $7,500 to $9,999 | 26 (0.4%) | 101 (1.7%) |
| $10,000 to $12,499 | 308 (4.6%) | 183 (3.0%) |
| $12,500 to $14,999 | 41 (0.6%) | 78 (1.3%) |
| $15,000 to $17,499 | 0 (0.0%) | 100 (1.6%) |
| $17,500 to $19,999 | 78 (1.2%) | 0 (0.0%) |
| $20,000 to $22,499 | 64 (1.0%) | 237 (3.9%) |
| $22,500 to $24,999 | 434 (6.5%) | 204 (3.3%) |
| $25,000 to $29,999 | 194 (2.9%) | 156 (2.5%) |
| $30,000 to $34,999 | 169 (2.5%) | 187 (3.0%) |
| $35,000 to $39,999 | 88 (1.3%) | 371 (6.0%) |
| $40,000 to $44,999 | 193 (2.9%) | 340 (5.5%) |
| $45,000 to $49,999 | 369 (5.6%) | 379 (6.2%) |
| $50,000 to $54,999 | 317 (4.8%) | 471 (7.7%) |
| $55,000 to $64,999 | 535 (8.1%) | 643 (10.5%) |
| $65,000 to $74,999 | 670 (10.1%) | 481 (7.8%) |
| $75,000 to $99,999 | 1,359 (20.5%) | 812 (13.2%) |
| $100,000+ | 1,490 (22.4%) | 517 (8.4%) |
| Total | 6,641 (100.0%) | 6,137 (100.0%) |
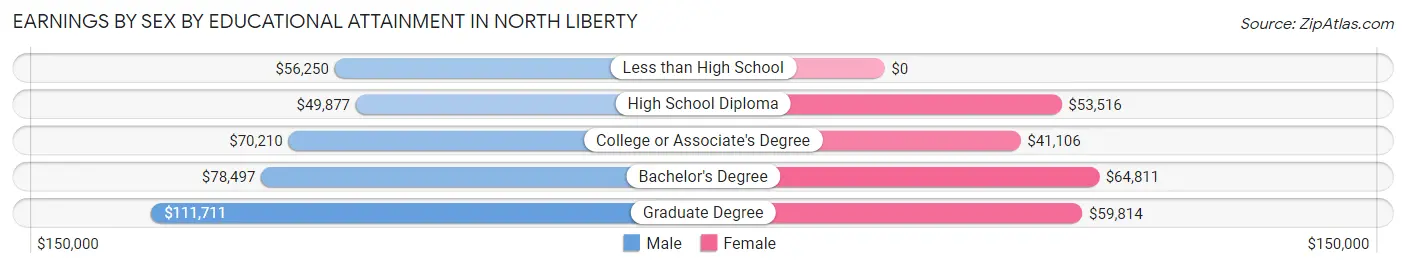
Earnings by Sex by Educational Attainment in North Liberty
Average earnings in North Liberty are $76,357 for men and $51,405 for women, a difference of 32.7%. Men with an educational attainment of graduate degree enjoy the highest average annual earnings of $111,711, while those with high school diploma education earn the least with $49,877. Women with an educational attainment of bachelor's degree earn the most with the average annual earnings of $64,811, while those with college or associate's degree education have the smallest earnings of $41,106.
| Educational Attainment | Male Income | Female Income |
| Less than High School | $56,250 | $0 |
| High School Diploma | $49,877 | $53,516 |
| College or Associate's Degree | $70,210 | $41,106 |
| Bachelor's Degree | $78,497 | $64,811 |
| Graduate Degree | $111,711 | $59,814 |
| Total | $76,357 | $51,405 |
Family Income in North Liberty
Family Income Brackets in North Liberty
According to the North Liberty family income data, there are 1,500 families falling into the $100,000 to $149,999 income range, which is the most common income bracket and makes up 29.1% of all families. Conversely, the less than $10,000 income bracket is the least frequent group with only 36 families (0.7%) belonging to this category.
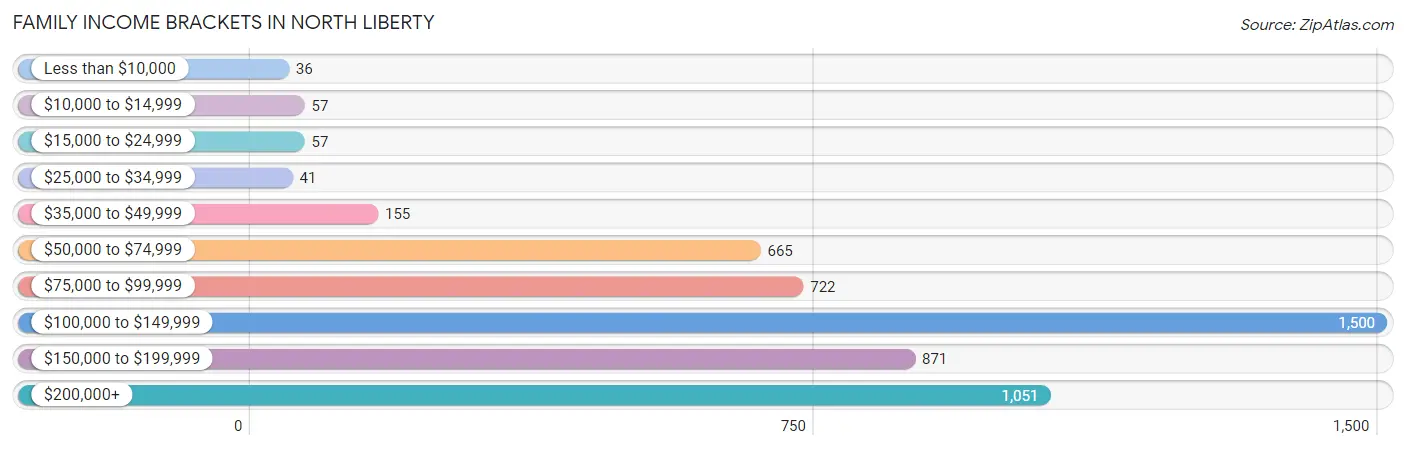
| Income Bracket | # Families | % Families |
| Less than $10,000 | 36 | 0.7% |
| $10,000 to $14,999 | 57 | 1.1% |
| $15,000 to $24,999 | 57 | 1.1% |
| $25,000 to $34,999 | 41 | 0.8% |
| $35,000 to $49,999 | 155 | 3.0% |
| $50,000 to $74,999 | 665 | 12.9% |
| $75,000 to $99,999 | 722 | 14.0% |
| $100,000 to $149,999 | 1,500 | 29.1% |
| $150,000 to $199,999 | 871 | 16.9% |
| $200,000+ | 1,051 | 20.4% |
Family Income by Famaliy Size in North Liberty
4-person families (797 | 15.5%) account for the highest median family income in North Liberty with $162,073 per family, while 2-person families (2,140 | 41.5%) have the highest median income of $47,384 per family member.
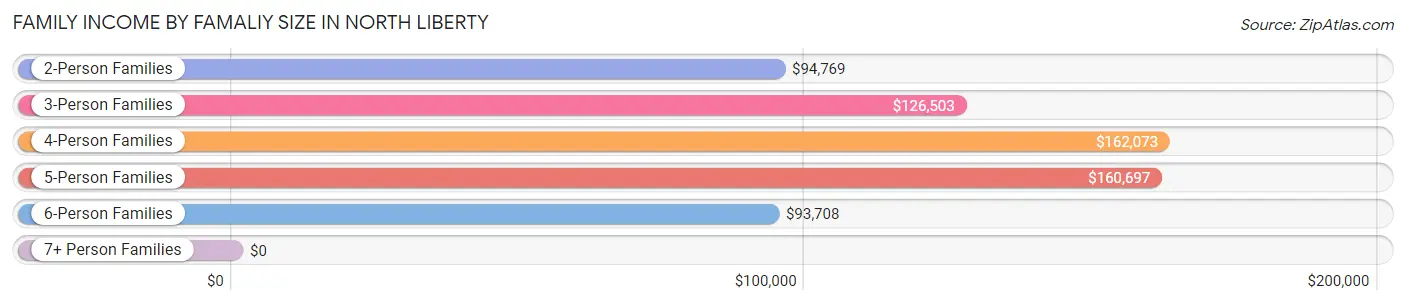
| Income Bracket | # Families | Median Income |
| 2-Person Families | 2,140 (41.5%) | $94,769 |
| 3-Person Families | 1,458 (28.3%) | $126,503 |
| 4-Person Families | 797 (15.5%) | $162,073 |
| 5-Person Families | 595 (11.5%) | $160,697 |
| 6-Person Families | 139 (2.7%) | $93,708 |
| 7+ Person Families | 25 (0.5%) | $0 |
| Total | 5,154 (100.0%) | $125,973 |
Family Income by Number of Earners in North Liberty
The median family income in North Liberty is $125,973, with families comprising 3+ earners (547) having the highest median family income of $160,402, while families with no earners (361) have the lowest median family income of $64,911, accounting for 10.6% and 7.0% of families, respectively.
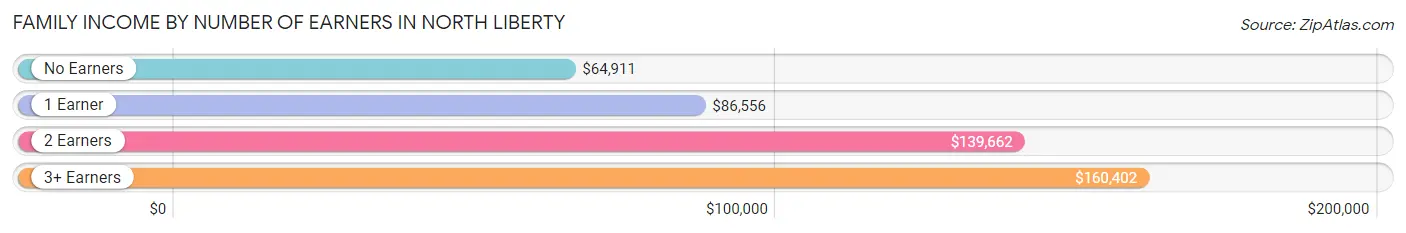
| Number of Earners | # Families | Median Income |
| No Earners | 361 (7.0%) | $64,911 |
| 1 Earner | 938 (18.2%) | $86,556 |
| 2 Earners | 3,308 (64.2%) | $139,662 |
| 3+ Earners | 547 (10.6%) | $160,402 |
| Total | 5,154 (100.0%) | $125,973 |
Household Income in North Liberty
Household Income Brackets in North Liberty
With 1,874 households falling in the category, the $100,000 to $149,999 income range is the most frequent in North Liberty, accounting for 24.2% of all households. In contrast, only 77 households (1.0%) fall into the $10,000 to $14,999 income bracket, making it the least populous group.
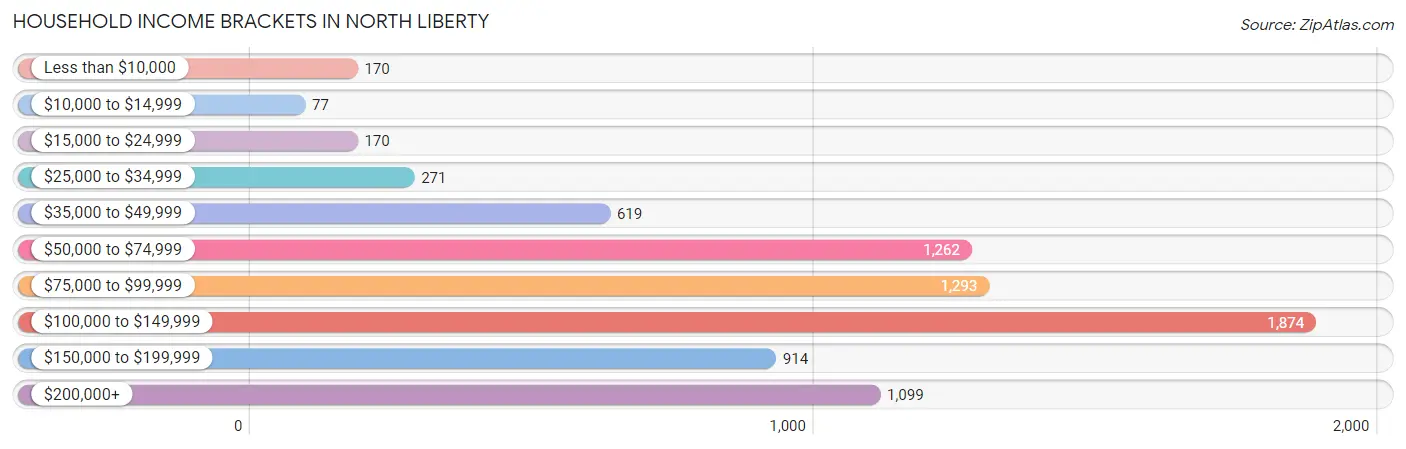
| Income Bracket | # Households | % Households |
| Less than $10,000 | 170 | 2.2% |
| $10,000 to $14,999 | 77 | 1.0% |
| $15,000 to $24,999 | 170 | 2.2% |
| $25,000 to $34,999 | 271 | 3.5% |
| $35,000 to $49,999 | 619 | 8.0% |
| $50,000 to $74,999 | 1,262 | 16.3% |
| $75,000 to $99,999 | 1,293 | 16.7% |
| $100,000 to $149,999 | 1,874 | 24.2% |
| $150,000 to $199,999 | 914 | 11.8% |
| $200,000+ | 1,099 | 14.2% |
Household Income by Householder Age in North Liberty
The median household income in North Liberty is $100,197, with the highest median household income of $119,041 found in the 25 to 44 years age bracket for the primary householder. A total of 3,973 households (51.3%) fall into this category. Meanwhile, the 15 to 24 years age bracket for the primary householder has the lowest median household income of $60,183, with 564 households (7.3%) in this group.
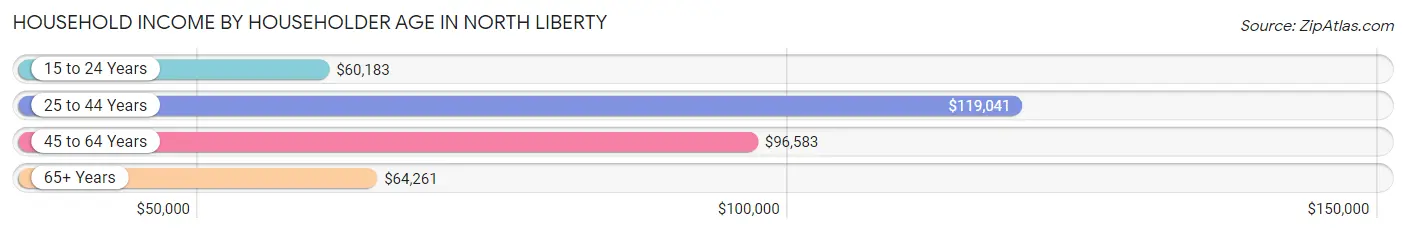
| Income Bracket | # Households | Median Income |
| 15 to 24 Years | 564 (7.3%) | $60,183 |
| 25 to 44 Years | 3,973 (51.3%) | $119,041 |
| 45 to 64 Years | 2,216 (28.6%) | $96,583 |
| 65+ Years | 989 (12.8%) | $64,261 |
| Total | 7,742 (100.0%) | $100,197 |
Poverty in North Liberty
Income Below Poverty by Sex and Age in North Liberty
With 3.7% poverty level for males and 5.4% for females among the residents of North Liberty, 12 to 14 year old males and 18 to 24 year old females are the most vulnerable to poverty, with 56 males (17.9%) and 228 females (36.3%) in their respective age groups living below the poverty level.
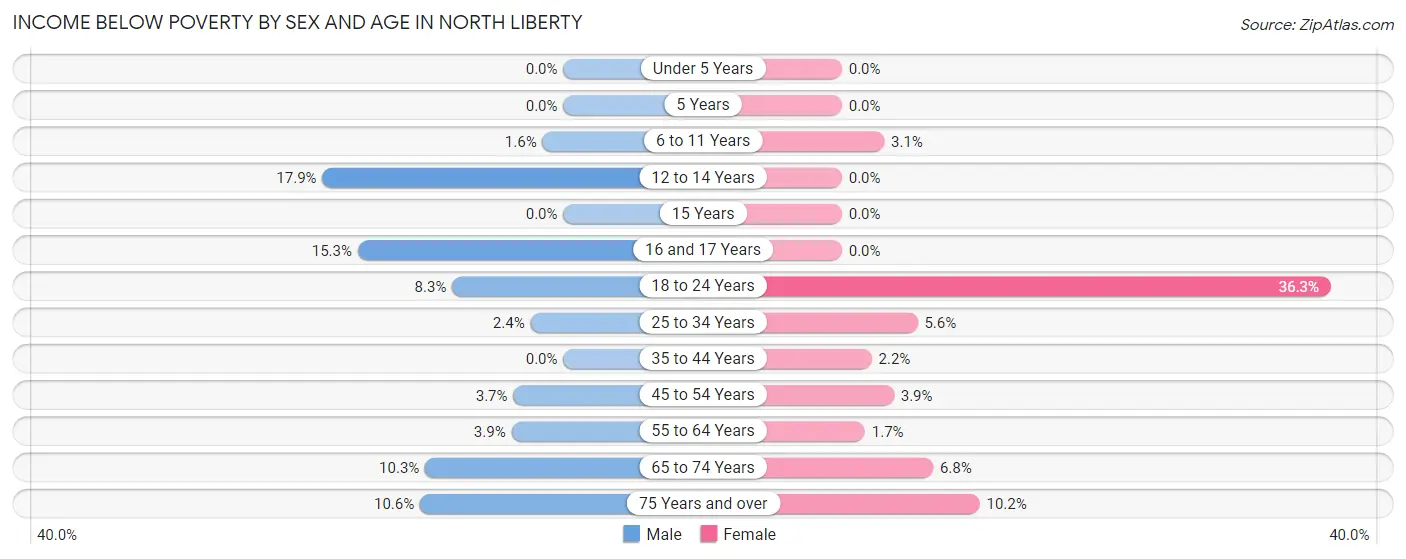
| Age Bracket | Male | Female |
| Under 5 Years | 0 (0.0%) | 0 (0.0%) |
| 5 Years | 0 (0.0%) | 0 (0.0%) |
| 6 to 11 Years | 20 (1.5%) | 38 (3.1%) |
| 12 to 14 Years | 56 (17.9%) | 0 (0.0%) |
| 15 Years | 0 (0.0%) | 0 (0.0%) |
| 16 and 17 Years | 29 (15.3%) | 0 (0.0%) |
| 18 to 24 Years | 96 (8.3%) | 228 (36.3%) |
| 25 to 34 Years | 46 (2.4%) | 107 (5.6%) |
| 35 to 44 Years | 0 (0.0%) | 42 (2.2%) |
| 45 to 54 Years | 49 (3.7%) | 35 (3.9%) |
| 55 to 64 Years | 21 (3.8%) | 16 (1.7%) |
| 65 to 74 Years | 43 (10.3%) | 26 (6.8%) |
| 75 Years and over | 30 (10.6%) | 36 (10.2%) |
| Total | 390 (3.7%) | 528 (5.4%) |
Income Above Poverty by Sex and Age in North Liberty
According to the poverty statistics in North Liberty, males aged under 5 years and females aged under 5 years are the age groups that are most secure financially, with 100.0% of males and 100.0% of females in these age groups living above the poverty line.
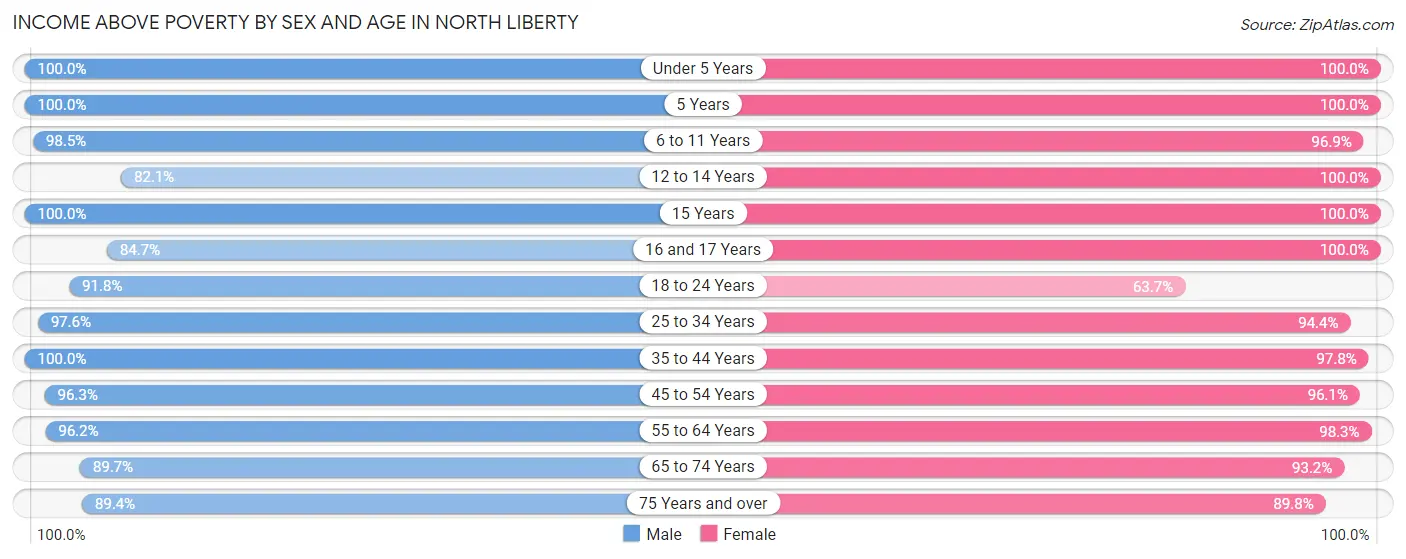
| Age Bracket | Male | Female |
| Under 5 Years | 653 (100.0%) | 800 (100.0%) |
| 5 Years | 232 (100.0%) | 92 (100.0%) |
| 6 to 11 Years | 1,271 (98.5%) | 1,172 (96.9%) |
| 12 to 14 Years | 257 (82.1%) | 443 (100.0%) |
| 15 Years | 238 (100.0%) | 25 (100.0%) |
| 16 and 17 Years | 161 (84.7%) | 257 (100.0%) |
| 18 to 24 Years | 1,067 (91.7%) | 400 (63.7%) |
| 25 to 34 Years | 1,841 (97.6%) | 1,796 (94.4%) |
| 35 to 44 Years | 1,918 (100.0%) | 1,861 (97.8%) |
| 45 to 54 Years | 1,272 (96.3%) | 871 (96.1%) |
| 55 to 64 Years | 525 (96.2%) | 919 (98.3%) |
| 65 to 74 Years | 376 (89.7%) | 358 (93.2%) |
| 75 Years and over | 252 (89.4%) | 316 (89.8%) |
| Total | 10,063 (96.3%) | 9,310 (94.6%) |
Income Below Poverty Among Married-Couple Families in North Liberty
The poverty statistics for married-couple families in North Liberty show that 2.3% or 99 of the total 4,239 families live below the poverty line. Families with no children have the highest poverty rate of 5.0%, comprising of 83 families. On the other hand, families with 1 or 2 children have the lowest poverty rate of 0.0%, which includes 0 families.
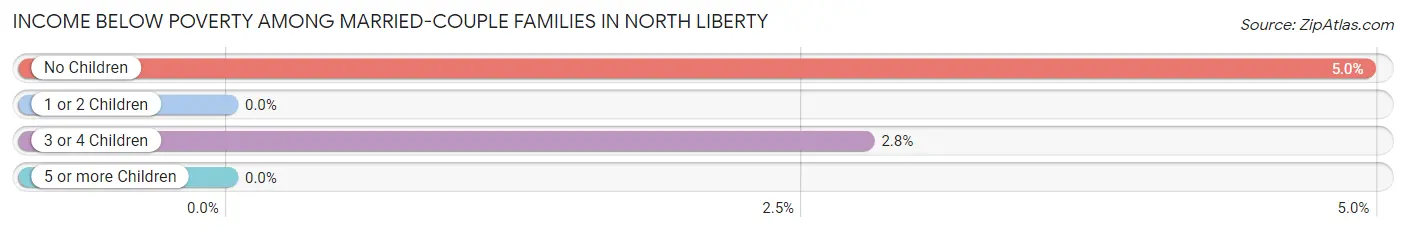
| Children | Above Poverty | Below Poverty |
| No Children | 1,595 (95.1%) | 83 (5.0%) |
| 1 or 2 Children | 1,983 (100.0%) | 0 (0.0%) |
| 3 or 4 Children | 562 (97.2%) | 16 (2.8%) |
| 5 or more Children | 0 (0.0%) | 0 (0.0%) |
| Total | 4,140 (97.7%) | 99 (2.3%) |
Income Below Poverty Among Single-Parent Households in North Liberty
According to the poverty data in North Liberty, 2.7% or 11 single-father households and 3.5% or 18 single-mother households are living below the poverty line. Among single-father households, those with 1 or 2 children have the highest poverty rate, with 11 households (6.8%) experiencing poverty. Likewise, among single-mother households, those with 3 or 4 children have the highest poverty rate, with 18 households (100.0%) falling below the poverty line.
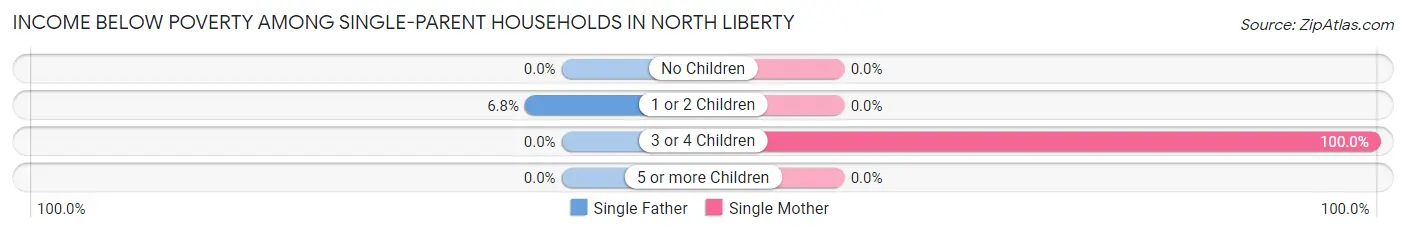
| Children | Single Father | Single Mother |
| No Children | 0 (0.0%) | 0 (0.0%) |
| 1 or 2 Children | 11 (6.8%) | 0 (0.0%) |
| 3 or 4 Children | 0 (0.0%) | 18 (100.0%) |
| 5 or more Children | 0 (0.0%) | 0 (0.0%) |
| Total | 11 (2.7%) | 18 (3.5%) |
Income Below Poverty Among Married-Couple vs Single-Parent Households in North Liberty
The poverty data for North Liberty shows that 99 of the married-couple family households (2.3%) and 29 of the single-parent households (3.2%) are living below the poverty level. Within the married-couple family households, those with no children have the highest poverty rate, with 83 households (5.0%) falling below the poverty line. Among the single-parent households, those with 3 or 4 children have the highest poverty rate, with 18 household (100.0%) living below poverty.
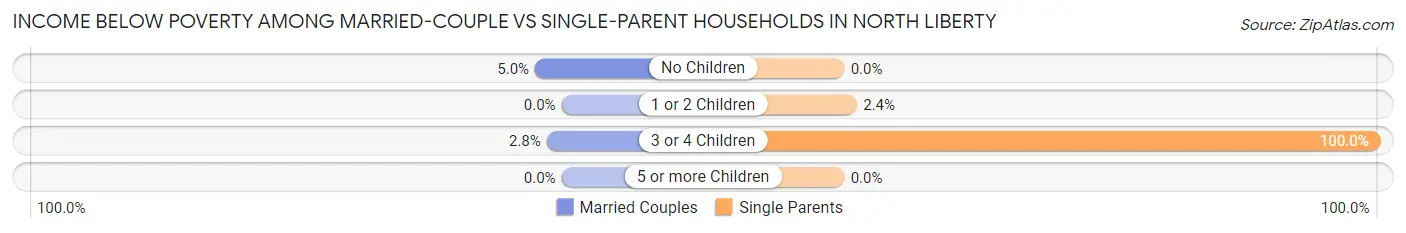
| Children | Married-Couple Families | Single-Parent Households |
| No Children | 83 (5.0%) | 0 (0.0%) |
| 1 or 2 Children | 0 (0.0%) | 11 (2.4%) |
| 3 or 4 Children | 16 (2.8%) | 18 (100.0%) |
| 5 or more Children | 0 (0.0%) | 0 (0.0%) |
| Total | 99 (2.3%) | 29 (3.2%) |
Race in North Liberty
The most populous races in North Liberty are White / Caucasian (16,458 | 80.7%), Two or more Races (1,689 | 8.3%), and Hispanic or Latino (1,306 | 6.4%).
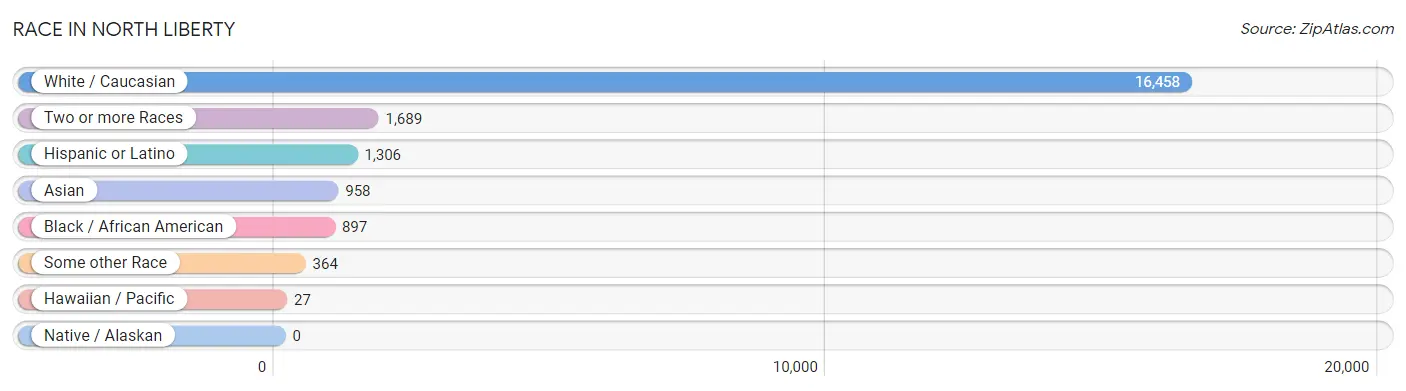
| Race | # Population | % Population |
| Asian | 958 | 4.7% |
| Black / African American | 897 | 4.4% |
| Hawaiian / Pacific | 27 | 0.1% |
| Hispanic or Latino | 1,306 | 6.4% |
| Native / Alaskan | 0 | 0.0% |
| White / Caucasian | 16,458 | 80.7% |
| Two or more Races | 1,689 | 8.3% |
| Some other Race | 364 | 1.8% |
| Total | 20,393 | 100.0% |
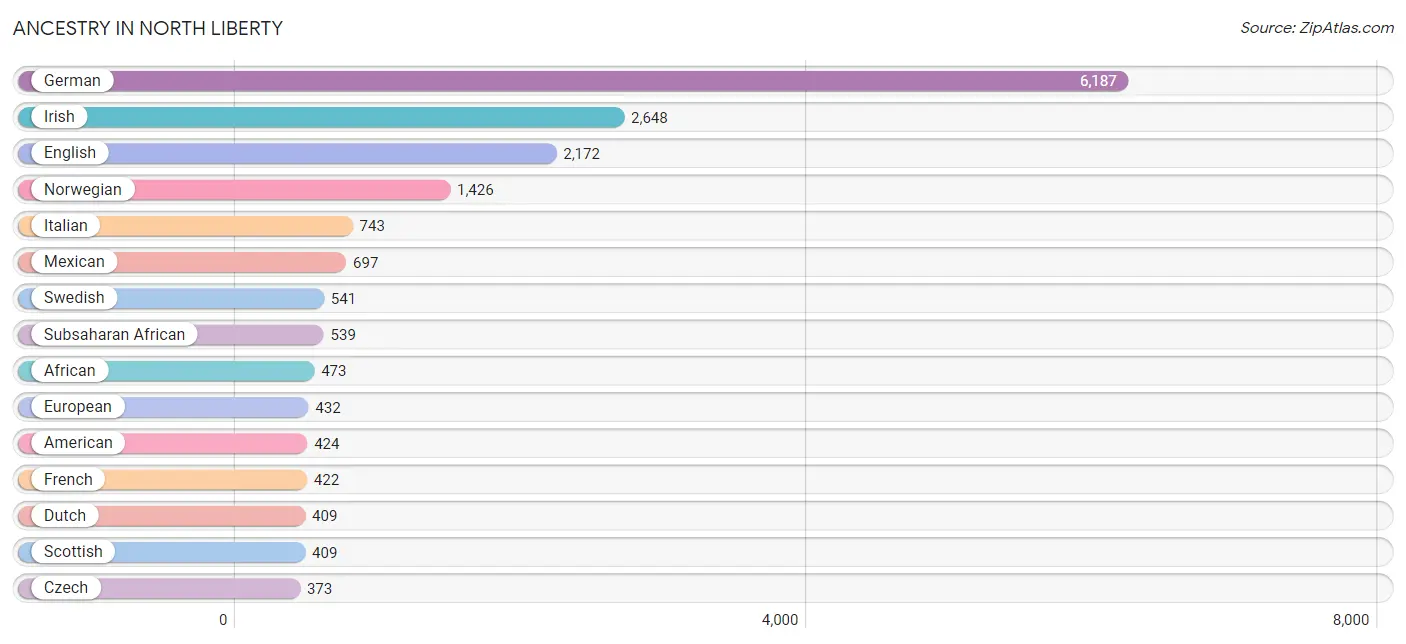
Ancestry in North Liberty
The most populous ancestries reported in North Liberty are German (6,187 | 30.3%), Irish (2,648 | 13.0%), English (2,172 | 10.6%), Norwegian (1,426 | 7.0%), and Italian (743 | 3.6%), together accounting for 64.6% of all North Liberty residents.
| Ancestry | # Population | % Population |
| African | 473 | 2.3% |
| American | 424 | 2.1% |
| Belgian | 179 | 0.9% |
| Bhutanese | 63 | 0.3% |
| Bolivian | 74 | 0.4% |
| British | 216 | 1.1% |
| Burmese | 217 | 1.1% |
| Canadian | 30 | 0.2% |
| Central American | 144 | 0.7% |
| Chickasaw | 72 | 0.4% |
| Chippewa | 66 | 0.3% |
| Colombian | 251 | 1.2% |
| Czech | 373 | 1.8% |
| Danish | 329 | 1.6% |
| Dutch | 409 | 2.0% |
| Eastern European | 28 | 0.1% |
| English | 2,172 | 10.6% |
| European | 432 | 2.1% |
| Finnish | 51 | 0.3% |
| French | 422 | 2.1% |
| French Canadian | 117 | 0.6% |
| German | 6,187 | 30.3% |
| Greek | 21 | 0.1% |
| Guatemalan | 20 | 0.1% |
| Honduran | 41 | 0.2% |
| Indian (Asian) | 127 | 0.6% |
| Irish | 2,648 | 13.0% |
| Italian | 743 | 3.6% |
| Korean | 151 | 0.7% |
| Latvian | 31 | 0.2% |
| Lithuanian | 117 | 0.6% |
| Malaysian | 238 | 1.2% |
| Mexican | 697 | 3.4% |
| Native Hawaiian | 107 | 0.5% |
| Nicaraguan | 66 | 0.3% |
| Nigerian | 66 | 0.3% |
| Norwegian | 1,426 | 7.0% |
| Pennsylvania German | 19 | 0.1% |
| Peruvian | 22 | 0.1% |
| Polish | 63 | 0.3% |
| Portuguese | 26 | 0.1% |
| Puerto Rican | 54 | 0.3% |
| Russian | 51 | 0.3% |
| Salvadoran | 17 | 0.1% |
| Scandinavian | 237 | 1.2% |
| Scotch-Irish | 181 | 0.9% |
| Scottish | 409 | 2.0% |
| Serbian | 15 | 0.1% |
| Slovak | 35 | 0.2% |
| South American | 347 | 1.7% |
| Spanish American | 29 | 0.1% |
| Sri Lankan | 97 | 0.5% |
| Subsaharan African | 539 | 2.6% |
| Swedish | 541 | 2.6% |
| Swiss | 75 | 0.4% |
| Thai | 328 | 1.6% |
| Ukrainian | 174 | 0.9% |
| Welsh | 31 | 0.2% | View All 58 Rows |
Immigrants in North Liberty
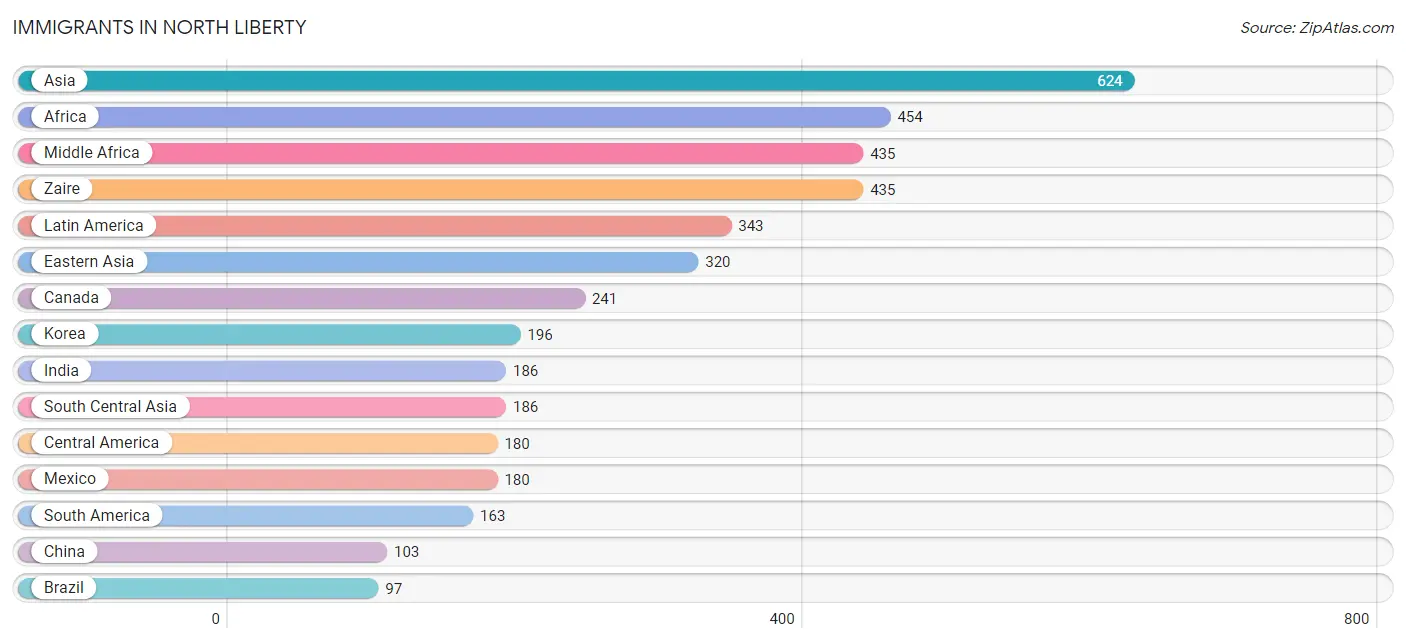
The most numerous immigrant groups reported in North Liberty came from Asia (624 | 3.1%), Africa (454 | 2.2%), Middle Africa (435 | 2.1%), Zaire (435 | 2.1%), and Latin America (343 | 1.7%), together accounting for 11.2% of all North Liberty residents.
| Immigration Origin | # Population | % Population |
| Africa | 454 | 2.2% |
| Asia | 624 | 3.1% |
| Brazil | 97 | 0.5% |
| Cambodia | 51 | 0.3% |
| Canada | 241 | 1.2% |
| Central America | 180 | 0.9% |
| China | 103 | 0.5% |
| Colombia | 66 | 0.3% |
| Eastern Asia | 320 | 1.6% |
| Eastern Europe | 17 | 0.1% |
| Europe | 31 | 0.2% |
| Germany | 14 | 0.1% |
| Hong Kong | 26 | 0.1% |
| India | 186 | 0.9% |
| Japan | 21 | 0.1% |
| Korea | 196 | 1.0% |
| Latin America | 343 | 1.7% |
| Lithuania | 2 | 0.0% |
| Mexico | 180 | 0.9% |
| Middle Africa | 435 | 2.1% |
| Oceania | 16 | 0.1% |
| Russia | 15 | 0.1% |
| South Africa | 19 | 0.1% |
| South America | 163 | 0.8% |
| South Central Asia | 186 | 0.9% |
| South Eastern Asia | 95 | 0.5% |
| Taiwan | 27 | 0.1% |
| Vietnam | 44 | 0.2% |
| Western Asia | 23 | 0.1% |
| Western Europe | 14 | 0.1% |
| Zaire | 435 | 2.1% | View All 31 Rows |
Sex and Age in North Liberty
Sex and Age in North Liberty
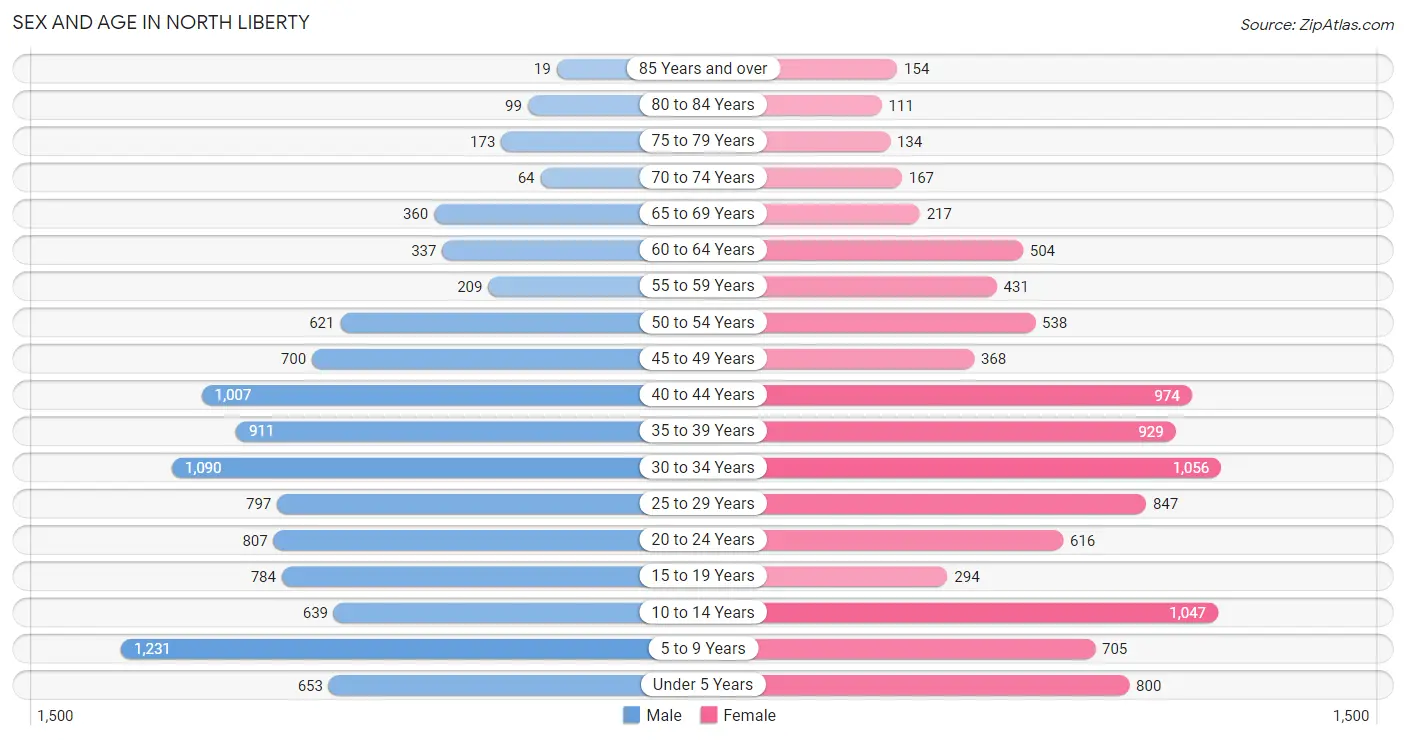
The most populous age groups in North Liberty are 5 to 9 Years (1,231 | 11.7%) for men and 30 to 34 Years (1,056 | 10.7%) for women.
| Age Bracket | Male | Female |
| Under 5 Years | 653 (6.2%) | 800 (8.1%) |
| 5 to 9 Years | 1,231 (11.7%) | 705 (7.1%) |
| 10 to 14 Years | 639 (6.1%) | 1,047 (10.6%) |
| 15 to 19 Years | 784 (7.5%) | 294 (3.0%) |
| 20 to 24 Years | 807 (7.7%) | 616 (6.2%) |
| 25 to 29 Years | 797 (7.6%) | 847 (8.6%) |
| 30 to 34 Years | 1,090 (10.4%) | 1,056 (10.7%) |
| 35 to 39 Years | 911 (8.7%) | 929 (9.4%) |
| 40 to 44 Years | 1,007 (9.6%) | 974 (9.9%) |
| 45 to 49 Years | 700 (6.7%) | 368 (3.7%) |
| 50 to 54 Years | 621 (5.9%) | 538 (5.4%) |
| 55 to 59 Years | 209 (2.0%) | 431 (4.4%) |
| 60 to 64 Years | 337 (3.2%) | 504 (5.1%) |
| 65 to 69 Years | 360 (3.4%) | 217 (2.2%) |
| 70 to 74 Years | 64 (0.6%) | 167 (1.7%) |
| 75 to 79 Years | 173 (1.7%) | 134 (1.3%) |
| 80 to 84 Years | 99 (0.9%) | 111 (1.1%) |
| 85 Years and over | 19 (0.2%) | 154 (1.6%) |
| Total | 10,501 (100.0%) | 9,892 (100.0%) |
Families and Households in North Liberty
Median Family Size in North Liberty
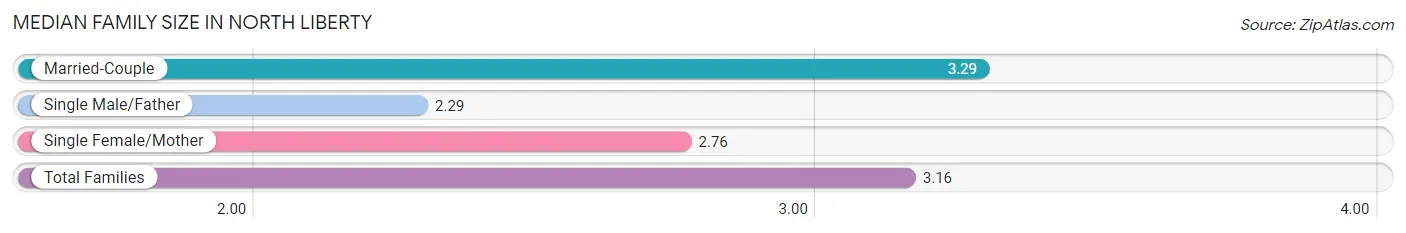
The median family size in North Liberty is 3.16 persons per family, with married-couple families (4,239 | 82.3%) accounting for the largest median family size of 3.29 persons per family. On the other hand, single male/father families (404 | 7.8%) represent the smallest median family size with 2.29 persons per family.
| Family Type | # Families | Family Size |
| Married-Couple | 4,239 (82.3%) | 3.29 |
| Single Male/Father | 404 (7.8%) | 2.29 |
| Single Female/Mother | 511 (9.9%) | 2.76 |
| Total Families | 5,154 (100.0%) | 3.16 |
Median Household Size in North Liberty
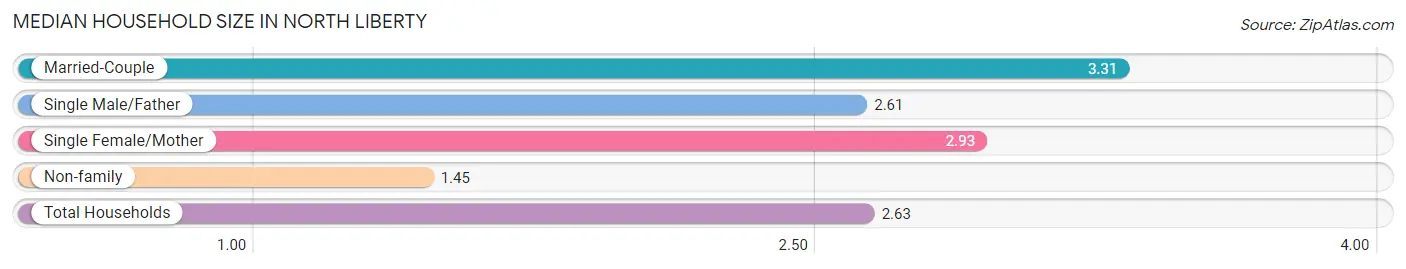
The median household size in North Liberty is 2.63 persons per household, with married-couple households (4,239 | 54.7%) accounting for the largest median household size of 3.31 persons per household. non-family households (2,588 | 33.4%) represent the smallest median household size with 1.45 persons per household.
| Household Type | # Households | Household Size |
| Married-Couple | 4,239 (54.7%) | 3.31 |
| Single Male/Father | 404 (5.2%) | 2.61 |
| Single Female/Mother | 511 (6.6%) | 2.93 |
| Non-family | 2,588 (33.4%) | 1.45 |
| Total Households | 7,742 (100.0%) | 2.63 |
Household Size by Marriage Status in North Liberty
Out of a total of 7,742 households in North Liberty, 5,154 (66.6%) are family households, while 2,588 (33.4%) are nonfamily households. The most numerous type of family households are 2-person households, comprising 1,975, and the most common type of nonfamily households are 1-person households, comprising 1,615.
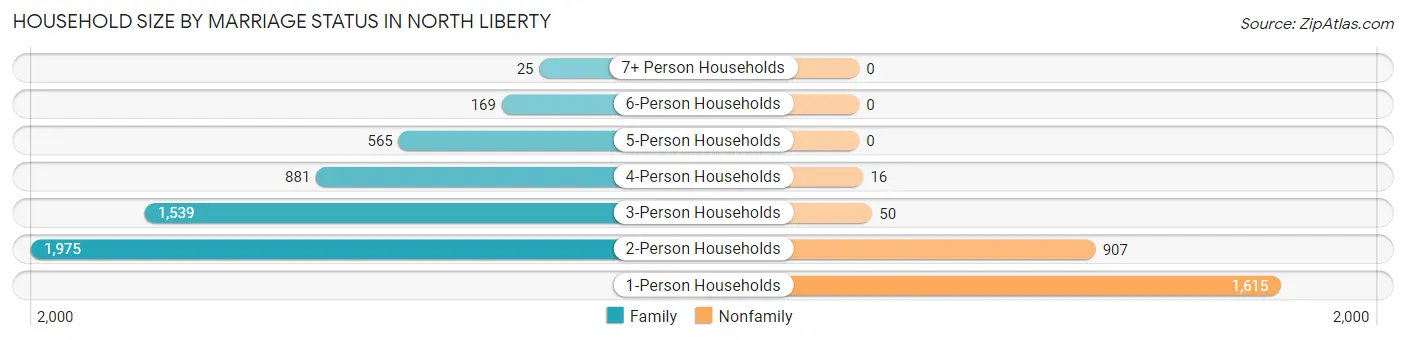
| Household Size | Family Households | Nonfamily Households |
| 1-Person Households | - | 1,615 (20.9%) |
| 2-Person Households | 1,975 (25.5%) | 907 (11.7%) |
| 3-Person Households | 1,539 (19.9%) | 50 (0.6%) |
| 4-Person Households | 881 (11.4%) | 16 (0.2%) |
| 5-Person Households | 565 (7.3%) | 0 (0.0%) |
| 6-Person Households | 169 (2.2%) | 0 (0.0%) |
| 7+ Person Households | 25 (0.3%) | 0 (0.0%) |
| Total | 5,154 (66.6%) | 2,588 (33.4%) |
Female Fertility in North Liberty
Fertility by Age in North Liberty
Average fertility rate in North Liberty is 59.0 births per 1,000 women. Women in the age bracket of 20 to 34 years have the highest fertility rate with 97.0 births per 1,000 women. Women in the age bracket of 20 to 34 years acount for 79.3% of all women with births.
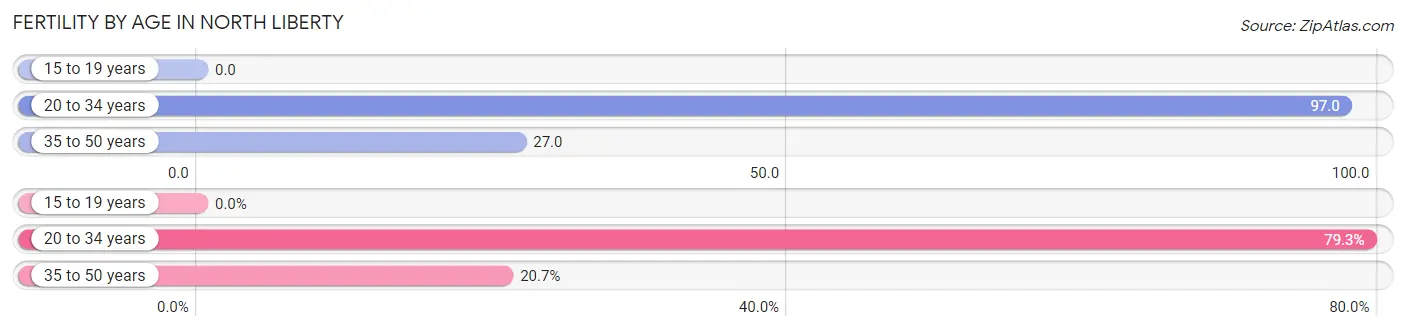
| Age Bracket | Women with Births | Births / 1,000 Women |
| 15 to 19 years | 0 (0.0%) | 0.0 |
| 20 to 34 years | 245 (79.3%) | 97.0 |
| 35 to 50 years | 64 (20.7%) | 27.0 |
| Total | 309 (100.0%) | 59.0 |
Fertility by Age by Marriage Status in North Liberty
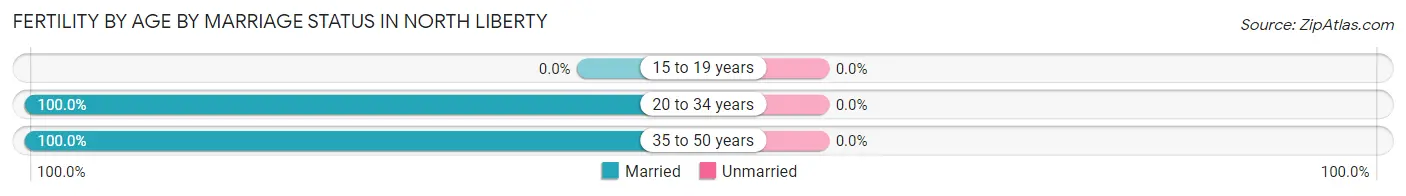
| Age Bracket | Married | Unmarried |
| 15 to 19 years | 0 (0.0%) | 0 (0.0%) |
| 20 to 34 years | 245 (100.0%) | 0 (0.0%) |
| 35 to 50 years | 64 (100.0%) | 0 (0.0%) |
| Total | 309 (100.0%) | 0 (0.0%) |
Fertility by Education in North Liberty
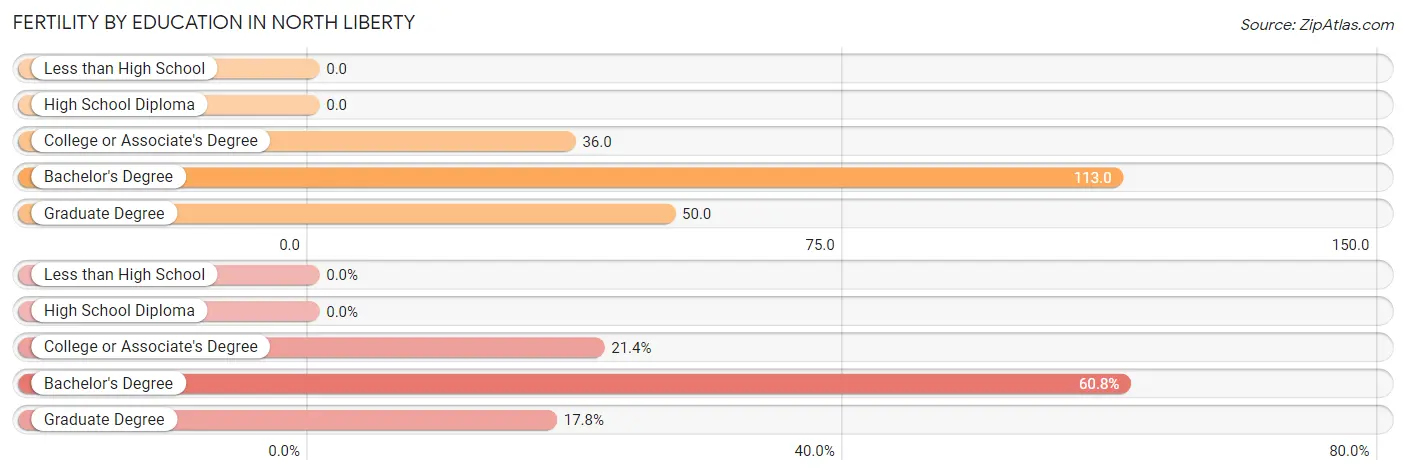
| Educational Attainment | Women with Births | Births / 1,000 Women |
| Less than High School | 0 (0.0%) | 0.0 |
| High School Diploma | 0 (0.0%) | 0.0 |
| College or Associate's Degree | 66 (21.4%) | 36.0 |
| Bachelor's Degree | 188 (60.8%) | 113.0 |
| Graduate Degree | 55 (17.8%) | 50.0 |
| Total | 309 (100.0%) | 59.0 |
Fertility by Education by Marriage Status in North Liberty
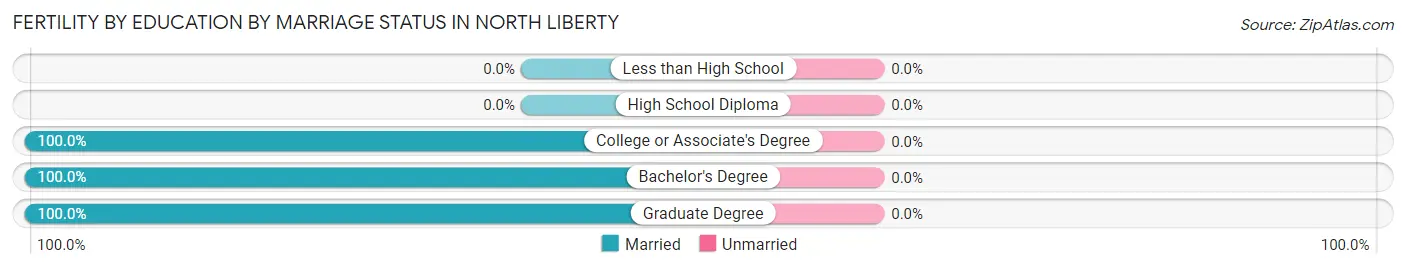
| Educational Attainment | Married | Unmarried |
| Less than High School | 0 (0.0%) | 0 (0.0%) |
| High School Diploma | 0 (0.0%) | 0 (0.0%) |
| College or Associate's Degree | 66 (100.0%) | 0 (0.0%) |
| Bachelor's Degree | 188 (100.0%) | 0 (0.0%) |
| Graduate Degree | 55 (100.0%) | 0 (0.0%) |
| Total | 309 (100.0%) | 0 (0.0%) |
Employment Characteristics in North Liberty
Employment by Class of Employer in North Liberty
Among the 11,393 employed individuals in North Liberty, private company employees (6,593 | 57.9%), state government employees (1,799 | 15.8%), and not-for-profit organizations (1,056 | 9.3%) make up the most common classes of employment.
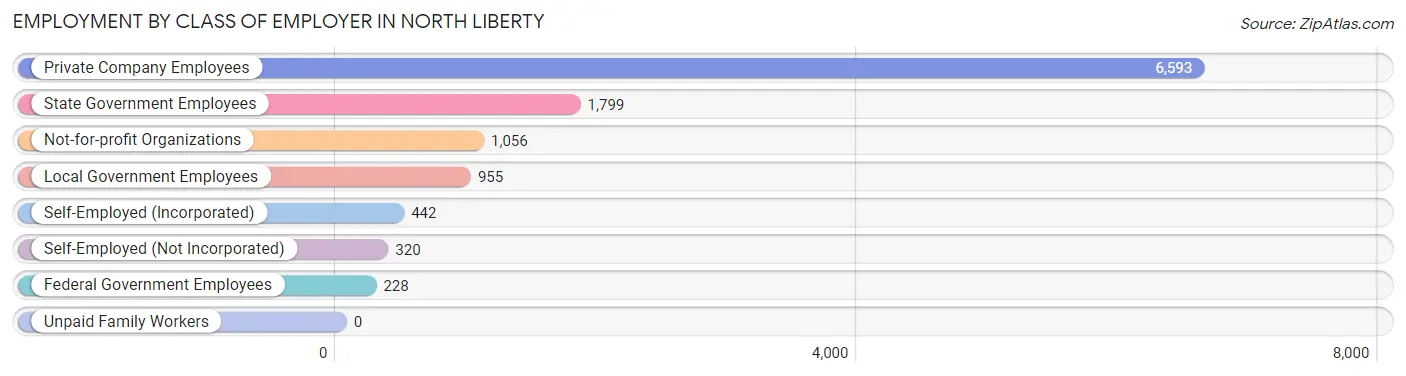
| Employer Class | # Employees | % Employees |
| Private Company Employees | 6,593 | 57.9% |
| Self-Employed (Incorporated) | 442 | 3.9% |
| Self-Employed (Not Incorporated) | 320 | 2.8% |
| Not-for-profit Organizations | 1,056 | 9.3% |
| Local Government Employees | 955 | 8.4% |
| State Government Employees | 1,799 | 15.8% |
| Federal Government Employees | 228 | 2.0% |
| Unpaid Family Workers | 0 | 0.0% |
| Total | 11,393 | 100.0% |
Employment Status by Age in North Liberty
According to the labor force statistics for North Liberty, out of the total population over 16 years of age (15,055), 78.6% or 11,833 individuals are in the labor force, with 2.0% or 237 of them unemployed. The age group with the highest labor force participation rate is 55 to 59 years, with 100.0% or 640 individuals in the labor force. Within the labor force, the 55 to 59 years age range has the highest percentage of unemployed individuals, with 13.9% or 89 of them being unemployed.
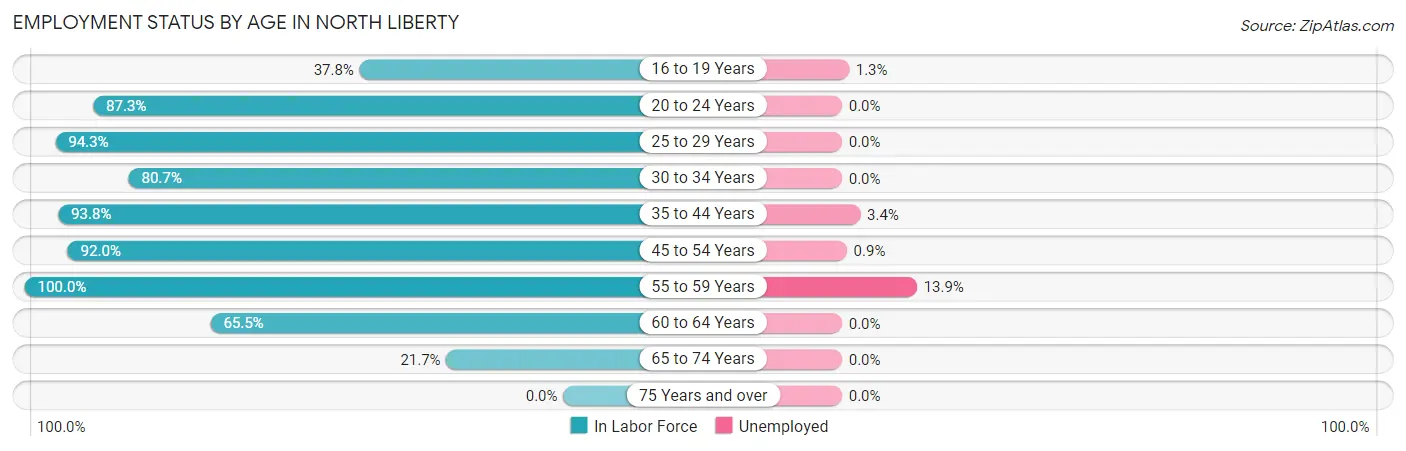
| Age Bracket | In Labor Force | Unemployed |
| 16 to 19 Years | 308 (37.8%) | 4 (1.3%) |
| 20 to 24 Years | 1,242 (87.3%) | 0 (0.0%) |
| 25 to 29 Years | 1,550 (94.3%) | 0 (0.0%) |
| 30 to 34 Years | 1,732 (80.7%) | 0 (0.0%) |
| 35 to 44 Years | 3,584 (93.8%) | 122 (3.4%) |
| 45 to 54 Years | 2,049 (92.0%) | 18 (0.9%) |
| 55 to 59 Years | 640 (100.0%) | 89 (13.9%) |
| 60 to 64 Years | 551 (65.5%) | 0 (0.0%) |
| 65 to 74 Years | 175 (21.7%) | 0 (0.0%) |
| 75 Years and over | 0 (0.0%) | 0 (0.0%) |
| Total | 11,833 (78.6%) | 237 (2.0%) |
Employment Status by Educational Attainment in North Liberty
According to labor force statistics for North Liberty, 89.3% of individuals (10,108) out of the total population between 25 and 64 years of age (11,319) are in the labor force, with 2.3% or 232 of them being unemployed. The group with the highest labor force participation rate are those with the educational attainment of college / associate degree, with 94.6% or 3,569 individuals in the labor force. Within the labor force, individuals with college / associate degree education have the highest percentage of unemployment, with 5.9% or 211 of them being unemployed.
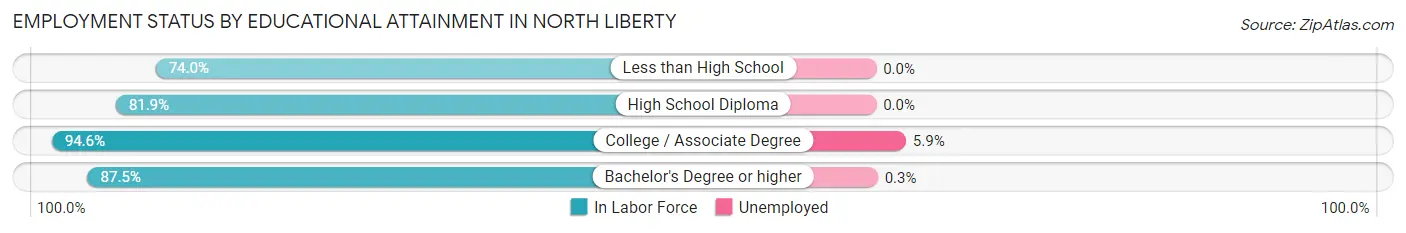
| Educational Attainment | In Labor Force | Unemployed |
| Less than High School | 57 (74.0%) | 0 (0.0%) |
| High School Diploma | 745 (81.9%) | 0 (0.0%) |
| College / Associate Degree | 3,569 (94.6%) | 223 (5.9%) |
| Bachelor's Degree or higher | 5,739 (87.5%) | 20 (0.3%) |
| Total | 10,108 (89.3%) | 260 (2.3%) |
Employment Occupations by Sex in North Liberty
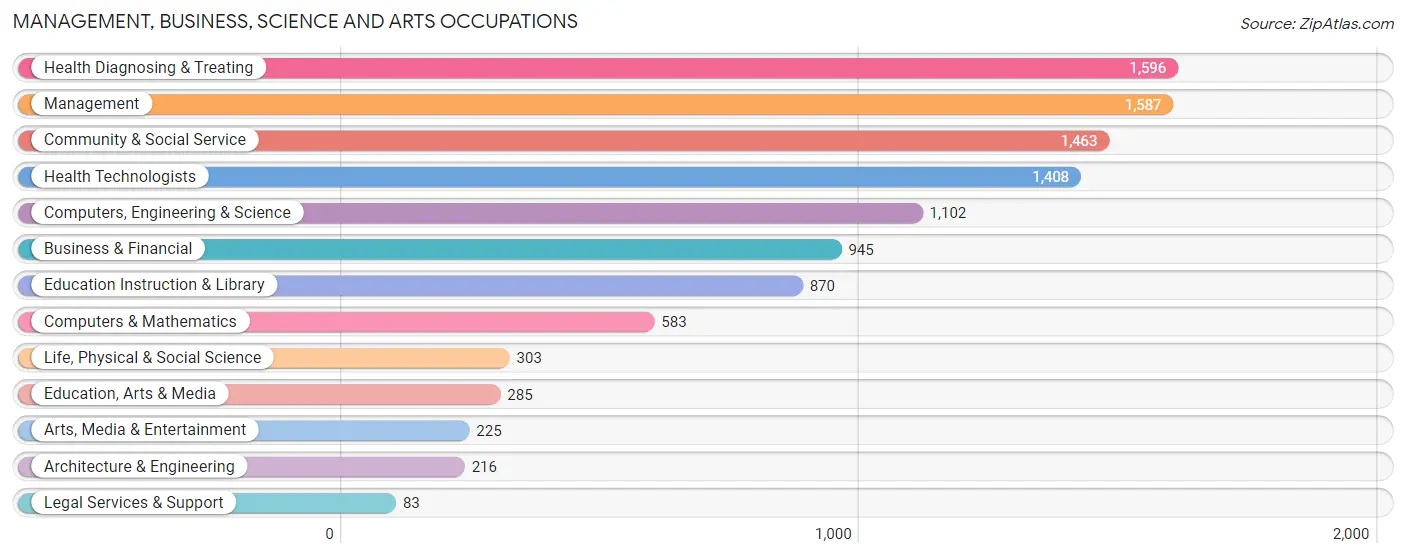
Management, Business, Science and Arts Occupations
The most common Management, Business, Science and Arts occupations in North Liberty are Health Diagnosing & Treating (1,596 | 13.8%), Management (1,587 | 13.7%), Community & Social Service (1,463 | 12.6%), Health Technologists (1,408 | 12.1%), and Computers, Engineering & Science (1,102 | 9.5%).
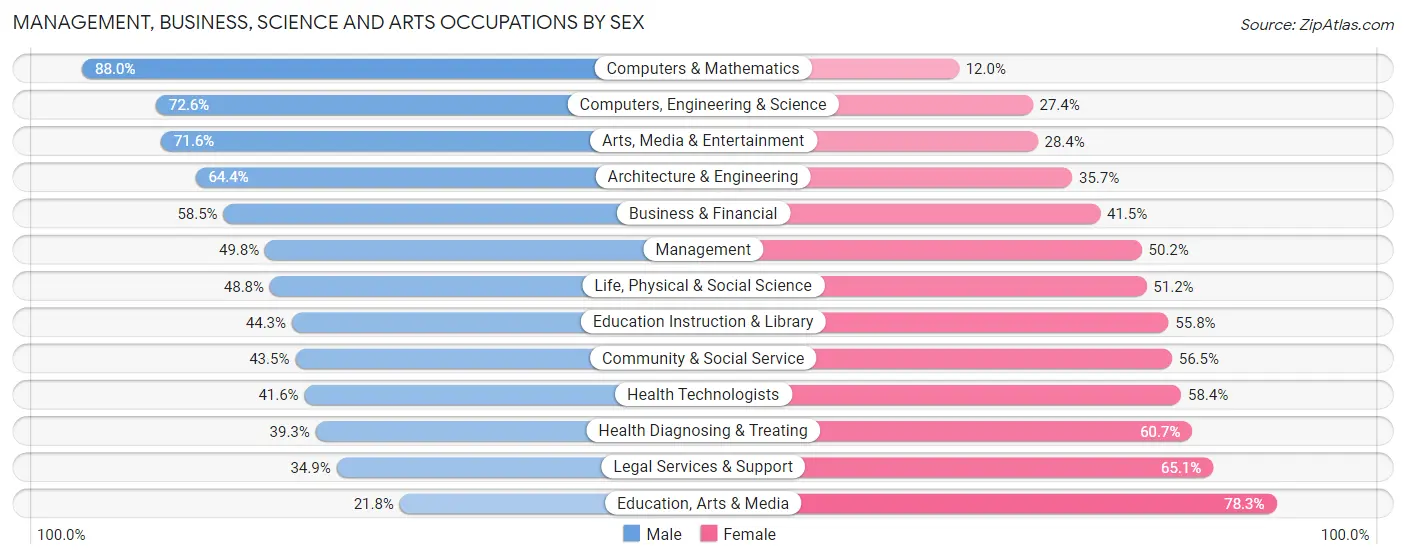
Management, Business, Science and Arts Occupations by Sex
Within the Management, Business, Science and Arts occupations in North Liberty, the most male-oriented occupations are Computers & Mathematics (88.0%), Computers, Engineering & Science (72.6%), and Arts, Media & Entertainment (71.6%), while the most female-oriented occupations are Education, Arts & Media (78.2%), Legal Services & Support (65.1%), and Health Diagnosing & Treating (60.7%).
| Occupation | Male | Female |
| Management | 791 (49.8%) | 796 (50.2%) |
| Business & Financial | 553 (58.5%) | 392 (41.5%) |
| Computers, Engineering & Science | 800 (72.6%) | 302 (27.4%) |
| Computers & Mathematics | 513 (88.0%) | 70 (12.0%) |
| Architecture & Engineering | 139 (64.3%) | 77 (35.6%) |
| Life, Physical & Social Science | 148 (48.8%) | 155 (51.2%) |
| Community & Social Service | 637 (43.5%) | 826 (56.5%) |
| Education, Arts & Media | 62 (21.7%) | 223 (78.2%) |
| Legal Services & Support | 29 (34.9%) | 54 (65.1%) |
| Education Instruction & Library | 385 (44.3%) | 485 (55.7%) |
| Arts, Media & Entertainment | 161 (71.6%) | 64 (28.4%) |
| Health Diagnosing & Treating | 627 (39.3%) | 969 (60.7%) |
| Health Technologists | 586 (41.6%) | 822 (58.4%) |
| Total (Category) | 3,408 (50.9%) | 3,285 (49.1%) |
| Total (Overall) | 6,073 (52.3%) | 5,528 (47.6%) |
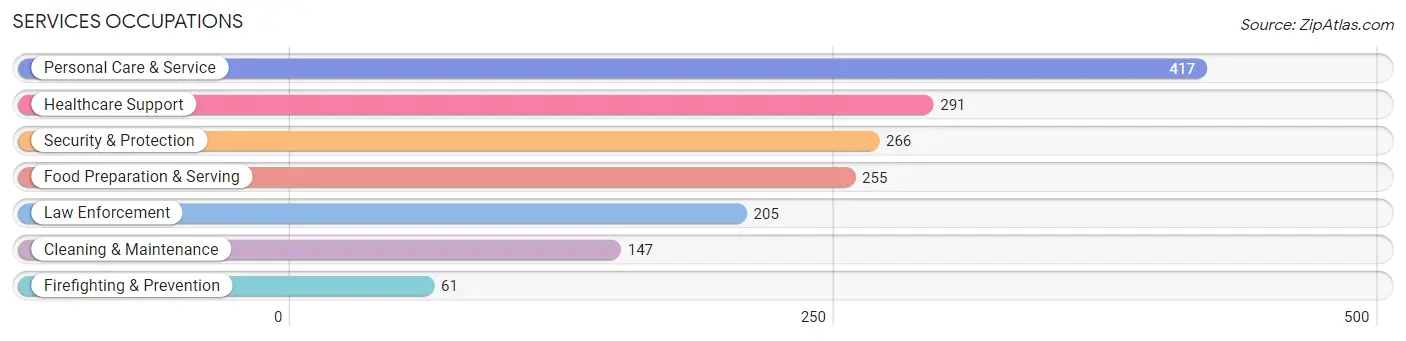
Services Occupations
The most common Services occupations in North Liberty are Personal Care & Service (417 | 3.6%), Healthcare Support (291 | 2.5%), Security & Protection (266 | 2.3%), Food Preparation & Serving (255 | 2.2%), and Law Enforcement (205 | 1.8%).
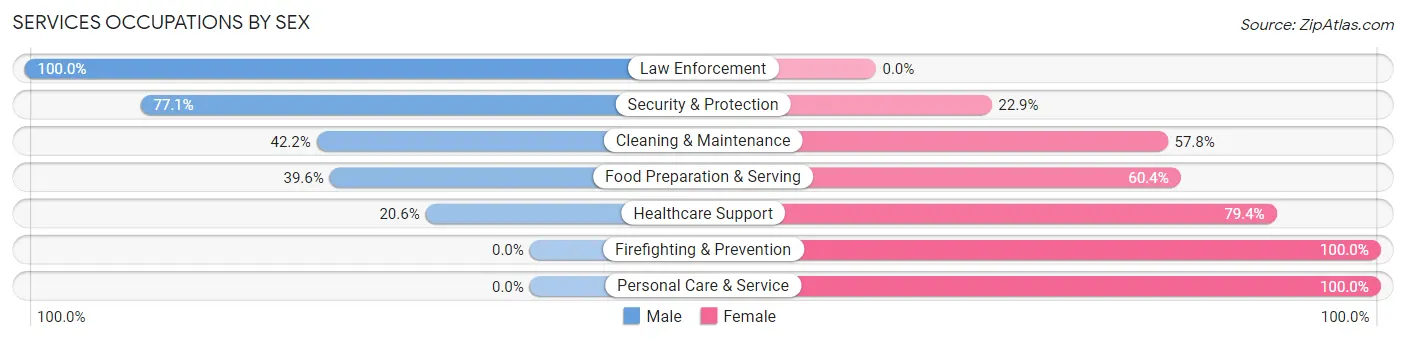
Services Occupations by Sex
Within the Services occupations in North Liberty, the most male-oriented occupations are Law Enforcement (100.0%), Security & Protection (77.1%), and Cleaning & Maintenance (42.2%), while the most female-oriented occupations are Firefighting & Prevention (100.0%), Personal Care & Service (100.0%), and Healthcare Support (79.4%).
| Occupation | Male | Female |
| Healthcare Support | 60 (20.6%) | 231 (79.4%) |
| Security & Protection | 205 (77.1%) | 61 (22.9%) |
| Firefighting & Prevention | 0 (0.0%) | 61 (100.0%) |
| Law Enforcement | 205 (100.0%) | 0 (0.0%) |
| Food Preparation & Serving | 101 (39.6%) | 154 (60.4%) |
| Cleaning & Maintenance | 62 (42.2%) | 85 (57.8%) |
| Personal Care & Service | 0 (0.0%) | 417 (100.0%) |
| Total (Category) | 428 (31.1%) | 948 (68.9%) |
| Total (Overall) | 6,073 (52.3%) | 5,528 (47.6%) |
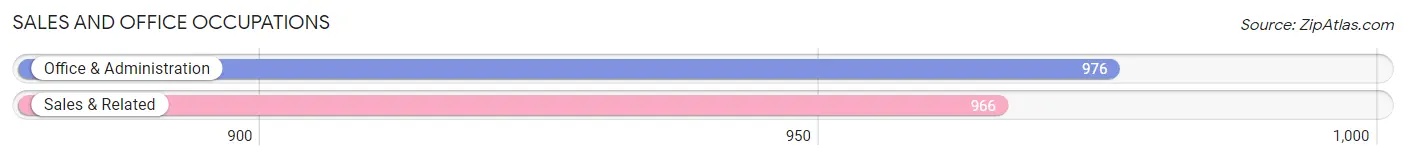
Sales and Office Occupations
The most common Sales and Office occupations in North Liberty are Office & Administration (976 | 8.4%), and Sales & Related (966 | 8.3%).
Sales and Office Occupations by Sex
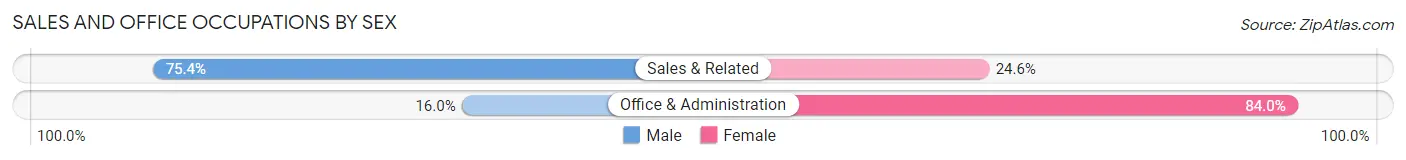
| Occupation | Male | Female |
| Sales & Related | 728 (75.4%) | 238 (24.6%) |
| Office & Administration | 156 (16.0%) | 820 (84.0%) |
| Total (Category) | 884 (45.5%) | 1,058 (54.5%) |
| Total (Overall) | 6,073 (52.3%) | 5,528 (47.6%) |
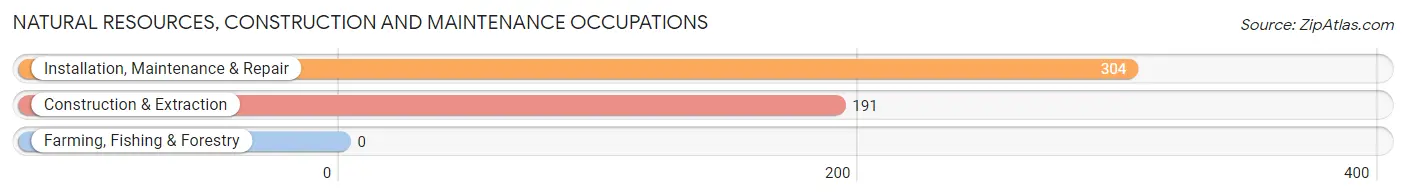
Natural Resources, Construction and Maintenance Occupations
The most common Natural Resources, Construction and Maintenance occupations in North Liberty are Installation, Maintenance & Repair (304 | 2.6%), and Construction & Extraction (191 | 1.7%).
Natural Resources, Construction and Maintenance Occupations by Sex
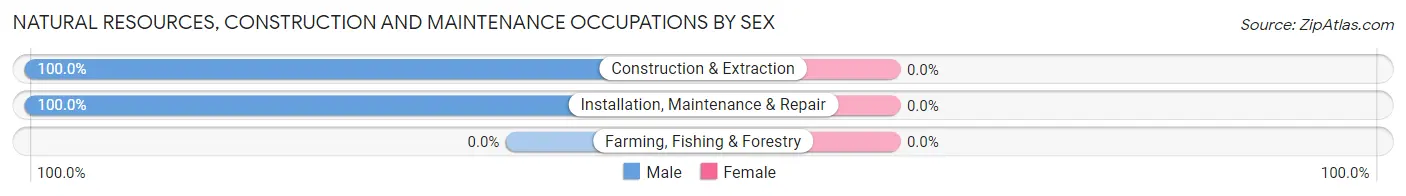
| Occupation | Male | Female |
| Farming, Fishing & Forestry | 0 (0.0%) | 0 (0.0%) |
| Construction & Extraction | 191 (100.0%) | 0 (0.0%) |
| Installation, Maintenance & Repair | 304 (100.0%) | 0 (0.0%) |
| Total (Category) | 495 (100.0%) | 0 (0.0%) |
| Total (Overall) | 6,073 (52.3%) | 5,528 (47.6%) |
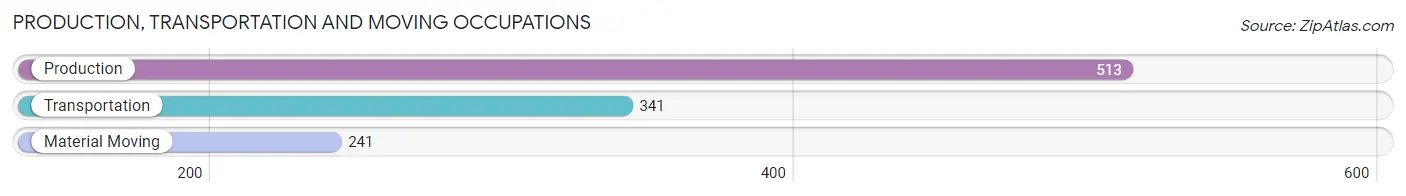
Production, Transportation and Moving Occupations
The most common Production, Transportation and Moving occupations in North Liberty are Production (513 | 4.4%), Transportation (341 | 2.9%), and Material Moving (241 | 2.1%).
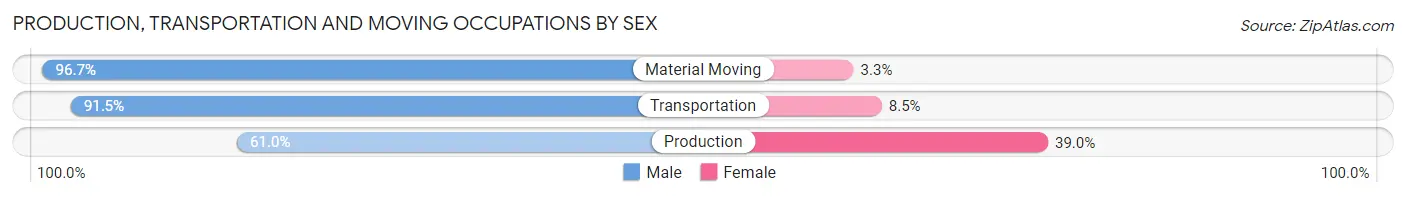
Production, Transportation and Moving Occupations by Sex
| Occupation | Male | Female |
| Production | 313 (61.0%) | 200 (39.0%) |
| Transportation | 312 (91.5%) | 29 (8.5%) |
| Material Moving | 233 (96.7%) | 8 (3.3%) |
| Total (Category) | 858 (78.4%) | 237 (21.6%) |
| Total (Overall) | 6,073 (52.3%) | 5,528 (47.6%) |
Employment Industries by Sex in North Liberty
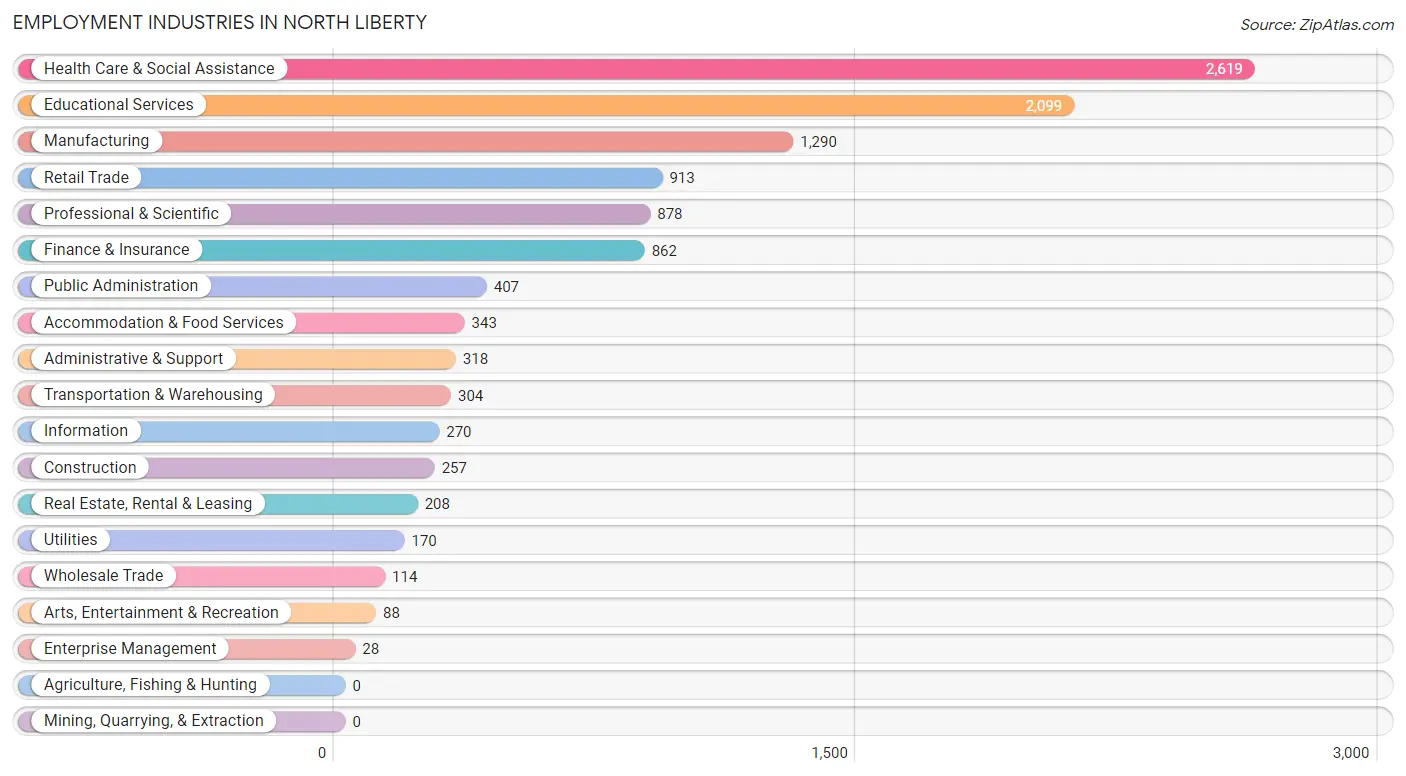
Employment Industries in North Liberty
The major employment industries in North Liberty include Health Care & Social Assistance (2,619 | 22.6%), Educational Services (2,099 | 18.1%), Manufacturing (1,290 | 11.1%), Retail Trade (913 | 7.9%), and Professional & Scientific (878 | 7.6%).
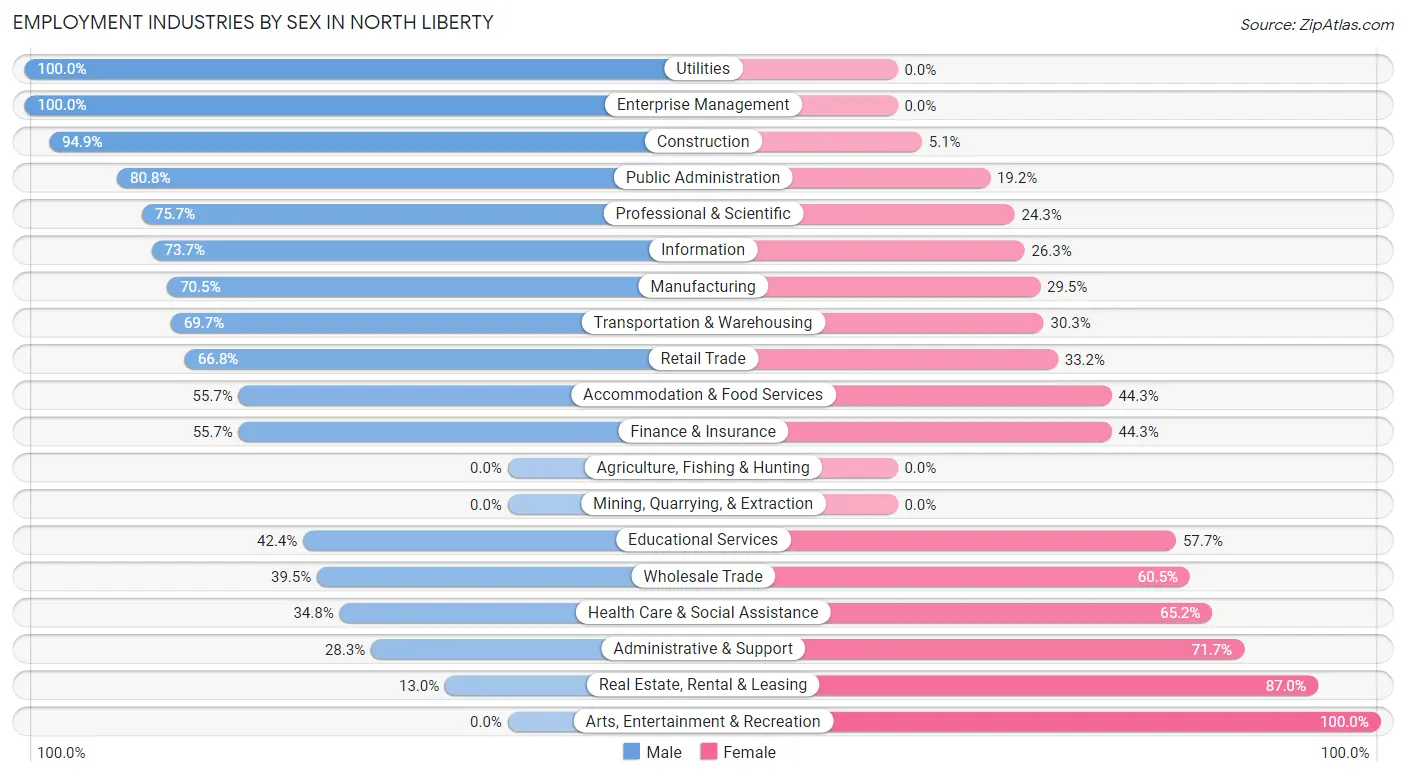
Employment Industries by Sex in North Liberty
The North Liberty industries that see more men than women are Utilities (100.0%), Enterprise Management (100.0%), and Construction (94.9%), whereas the industries that tend to have a higher number of women are Arts, Entertainment & Recreation (100.0%), Real Estate, Rental & Leasing (87.0%), and Administrative & Support (71.7%).
| Industry | Male | Female |
| Agriculture, Fishing & Hunting | 0 (0.0%) | 0 (0.0%) |
| Mining, Quarrying, & Extraction | 0 (0.0%) | 0 (0.0%) |
| Construction | 244 (94.9%) | 13 (5.1%) |
| Manufacturing | 909 (70.5%) | 381 (29.5%) |
| Wholesale Trade | 45 (39.5%) | 69 (60.5%) |
| Retail Trade | 610 (66.8%) | 303 (33.2%) |
| Transportation & Warehousing | 212 (69.7%) | 92 (30.3%) |
| Utilities | 170 (100.0%) | 0 (0.0%) |
| Information | 199 (73.7%) | 71 (26.3%) |
| Finance & Insurance | 480 (55.7%) | 382 (44.3%) |
| Real Estate, Rental & Leasing | 27 (13.0%) | 181 (87.0%) |
| Professional & Scientific | 665 (75.7%) | 213 (24.3%) |
| Enterprise Management | 28 (100.0%) | 0 (0.0%) |
| Administrative & Support | 90 (28.3%) | 228 (71.7%) |
| Educational Services | 889 (42.3%) | 1,210 (57.7%) |
| Health Care & Social Assistance | 912 (34.8%) | 1,707 (65.2%) |
| Arts, Entertainment & Recreation | 0 (0.0%) | 88 (100.0%) |
| Accommodation & Food Services | 191 (55.7%) | 152 (44.3%) |
| Public Administration | 329 (80.8%) | 78 (19.2%) |
| Total | 6,073 (52.3%) | 5,528 (47.6%) |
Education in North Liberty
School Enrollment in North Liberty
The most common levels of schooling among the 6,229 students in North Liberty are elementary school (1,562 | 25.1%), middle school (1,526 | 24.5%), and college / undergraduate (1,048 | 16.8%).
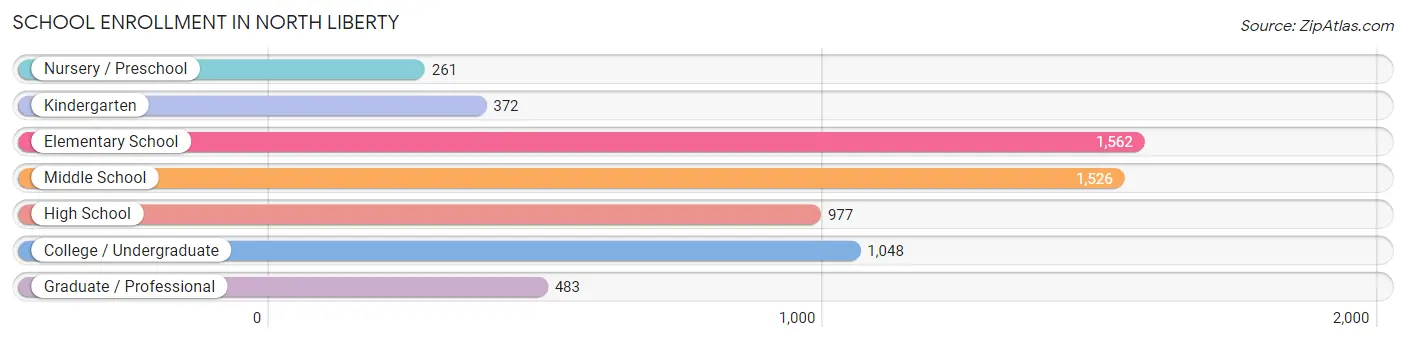
| School Level | # Students | % Students |
| Nursery / Preschool | 261 | 4.2% |
| Kindergarten | 372 | 6.0% |
| Elementary School | 1,562 | 25.1% |
| Middle School | 1,526 | 24.5% |
| High School | 977 | 15.7% |
| College / Undergraduate | 1,048 | 16.8% |
| Graduate / Professional | 483 | 7.7% |
| Total | 6,229 | 100.0% |
School Enrollment by Age by Funding Source in North Liberty
Out of a total of 6,229 students who are enrolled in schools in North Liberty, 529 (8.5%) attend a private institution, while the remaining 5,700 (91.5%) are enrolled in public schools. The age group of 3 to 4 year olds has the highest likelihood of being enrolled in private schools, with 137 (71.4% in the age bracket) enrolled. Conversely, the age group of 5 to 9 year old has the lowest likelihood of being enrolled in a private school, with 1,811 (98.3% in the age bracket) attending a public institution.
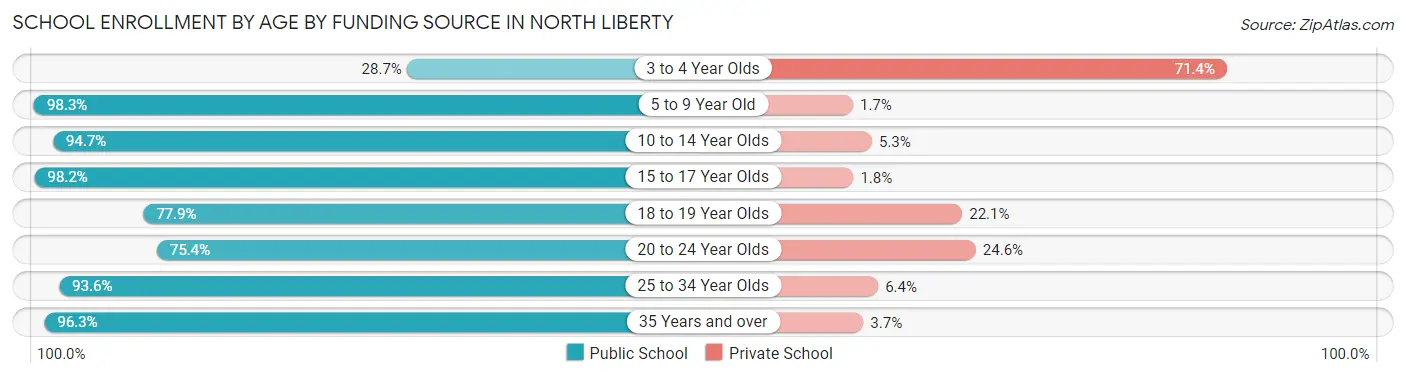
| Age Bracket | Public School | Private School |
| 3 to 4 Year Olds | 55 (28.6%) | 137 (71.4%) |
| 5 to 9 Year Old | 1,811 (98.3%) | 32 (1.7%) |
| 10 to 14 Year Olds | 1,597 (94.7%) | 89 (5.3%) |
| 15 to 17 Year Olds | 697 (98.2%) | 13 (1.8%) |
| 18 to 19 Year Olds | 275 (77.9%) | 78 (22.1%) |
| 20 to 24 Year Olds | 404 (75.4%) | 132 (24.6%) |
| 25 to 34 Year Olds | 596 (93.6%) | 41 (6.4%) |
| 35 Years and over | 262 (96.3%) | 10 (3.7%) |
| Total | 5,700 (91.5%) | 529 (8.5%) |
Educational Attainment by Field of Study in North Liberty
Education (1,089 | 14.0%), science & technology (942 | 12.1%), business (918 | 11.8%), bio, nature & agricultural (803 | 10.3%), and arts & humanities (547 | 7.0%) are the most common fields of study among 7,764 individuals in North Liberty who have obtained a bachelor's degree or higher.
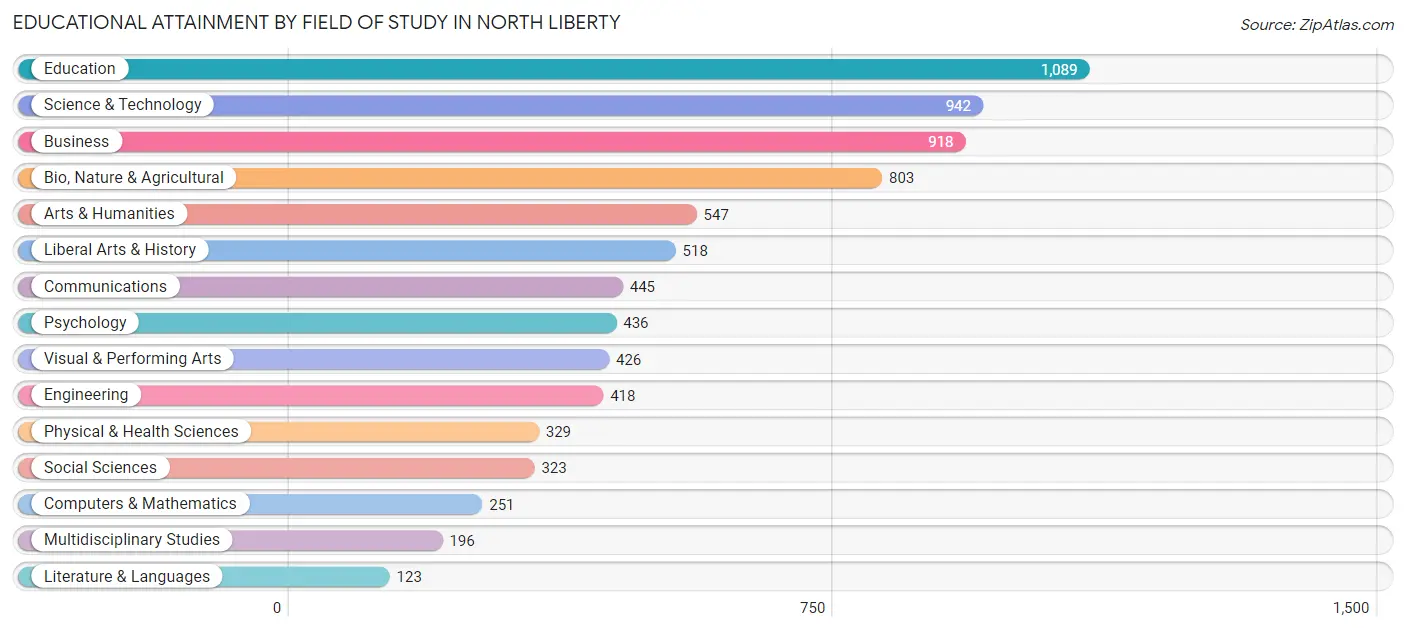
| Field of Study | # Graduates | % Graduates |
| Computers & Mathematics | 251 | 3.2% |
| Bio, Nature & Agricultural | 803 | 10.3% |
| Physical & Health Sciences | 329 | 4.2% |
| Psychology | 436 | 5.6% |
| Social Sciences | 323 | 4.2% |
| Engineering | 418 | 5.4% |
| Multidisciplinary Studies | 196 | 2.5% |
| Science & Technology | 942 | 12.1% |
| Business | 918 | 11.8% |
| Education | 1,089 | 14.0% |
| Literature & Languages | 123 | 1.6% |
| Liberal Arts & History | 518 | 6.7% |
| Visual & Performing Arts | 426 | 5.5% |
| Communications | 445 | 5.7% |
| Arts & Humanities | 547 | 7.0% |
| Total | 7,764 | 100.0% |
Transportation & Commute in North Liberty
Vehicle Availability by Sex in North Liberty
The most prevalent vehicle ownership categories in North Liberty are males with 2 vehicles (3,210, accounting for 53.9%) and females with 2 vehicles (2,924, making up 59.1%).
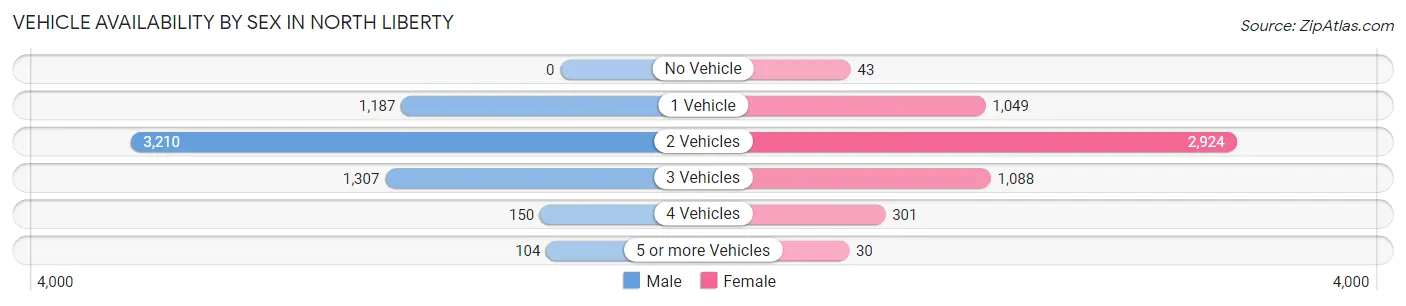
| Vehicles Available | Male | Female |
| No Vehicle | 0 (0.0%) | 43 (0.8%) |
| 1 Vehicle | 1,187 (19.9%) | 1,049 (19.3%) |
| 2 Vehicles | 3,210 (53.9%) | 2,924 (53.8%) |
| 3 Vehicles | 1,307 (21.9%) | 1,088 (20.0%) |
| 4 Vehicles | 150 (2.5%) | 301 (5.5%) |
| 5 or more Vehicles | 104 (1.8%) | 30 (0.5%) |
| Total | 5,958 (100.0%) | 5,435 (100.0%) |
Commute Time in North Liberty
The most frequently occuring commute durations in North Liberty are 20 to 24 minutes (2,187 commuters, 21.7%), 15 to 19 minutes (1,615 commuters, 16.1%), and 10 to 14 minutes (1,323 commuters, 13.2%).
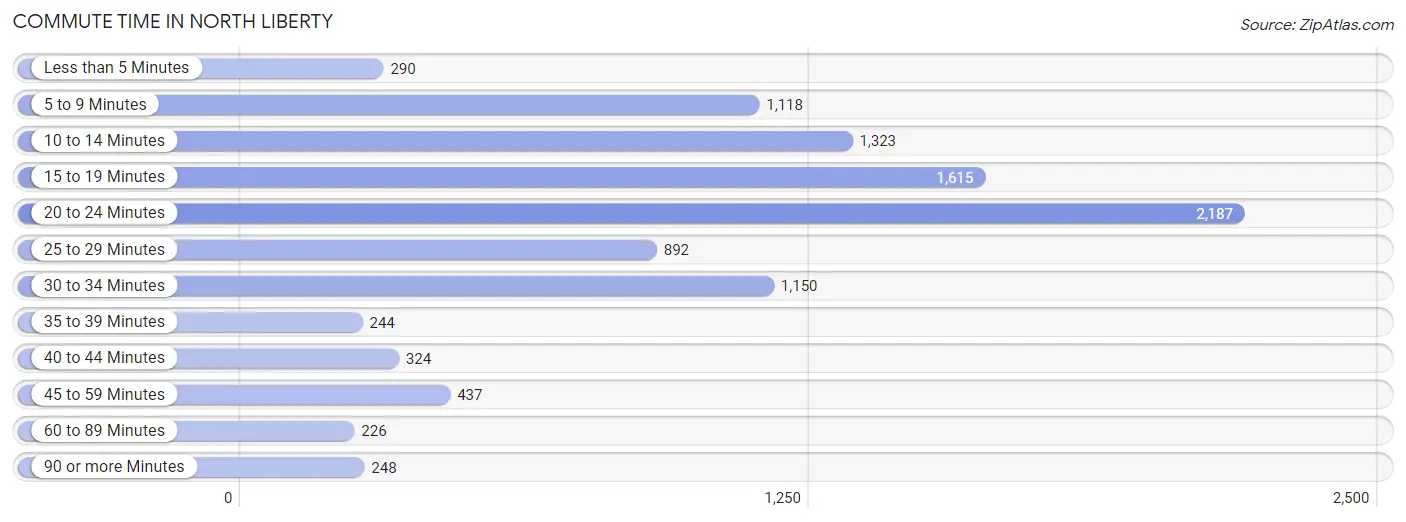
| Commute Time | # Commuters | % Commuters |
| Less than 5 Minutes | 290 | 2.9% |
| 5 to 9 Minutes | 1,118 | 11.1% |
| 10 to 14 Minutes | 1,323 | 13.2% |
| 15 to 19 Minutes | 1,615 | 16.1% |
| 20 to 24 Minutes | 2,187 | 21.7% |
| 25 to 29 Minutes | 892 | 8.9% |
| 30 to 34 Minutes | 1,150 | 11.4% |
| 35 to 39 Minutes | 244 | 2.4% |
| 40 to 44 Minutes | 324 | 3.2% |
| 45 to 59 Minutes | 437 | 4.3% |
| 60 to 89 Minutes | 226 | 2.2% |
| 90 or more Minutes | 248 | 2.5% |
Commute Time by Sex in North Liberty
The most common commute times in North Liberty are 20 to 24 minutes (1,284 commuters, 24.1%) for males and 15 to 19 minutes (976 commuters, 20.7%) for females.
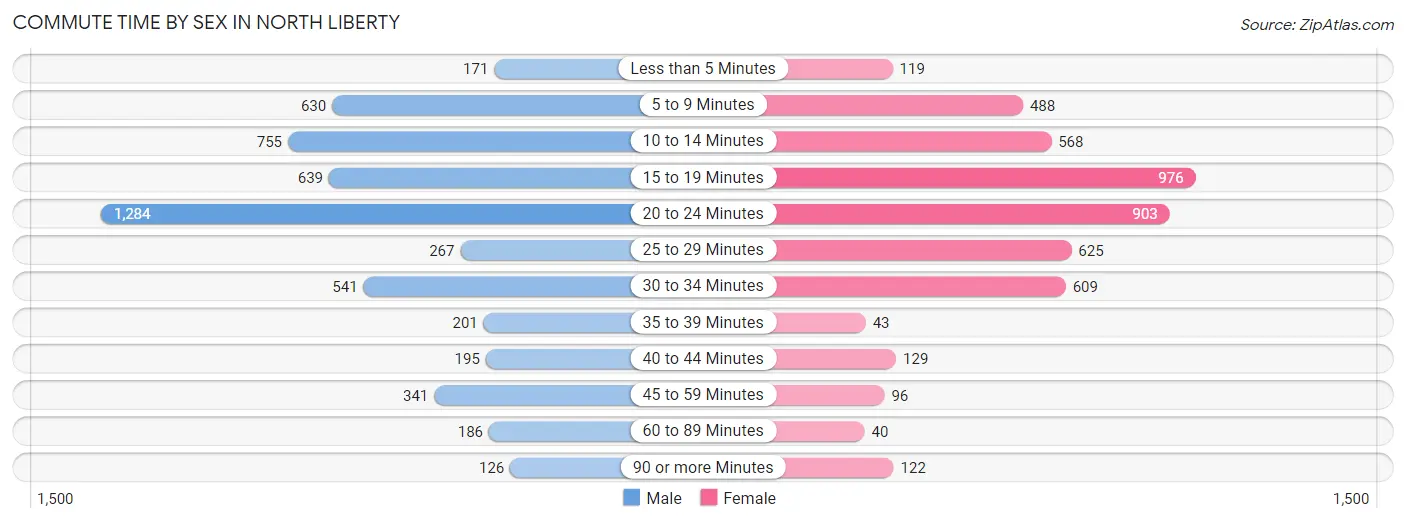
| Commute Time | Male | Female |
| Less than 5 Minutes | 171 (3.2%) | 119 (2.5%) |
| 5 to 9 Minutes | 630 (11.8%) | 488 (10.3%) |
| 10 to 14 Minutes | 755 (14.1%) | 568 (12.0%) |
| 15 to 19 Minutes | 639 (12.0%) | 976 (20.7%) |
| 20 to 24 Minutes | 1,284 (24.1%) | 903 (19.1%) |
| 25 to 29 Minutes | 267 (5.0%) | 625 (13.3%) |
| 30 to 34 Minutes | 541 (10.1%) | 609 (12.9%) |
| 35 to 39 Minutes | 201 (3.8%) | 43 (0.9%) |
| 40 to 44 Minutes | 195 (3.6%) | 129 (2.7%) |
| 45 to 59 Minutes | 341 (6.4%) | 96 (2.0%) |
| 60 to 89 Minutes | 186 (3.5%) | 40 (0.9%) |
| 90 or more Minutes | 126 (2.4%) | 122 (2.6%) |
Time of Departure to Work by Sex in North Liberty
The most frequent times of departure to work in North Liberty are 7:00 AM to 7:29 AM (1,146, 21.5%) for males and 7:00 AM to 7:29 AM (1,221, 25.9%) for females.
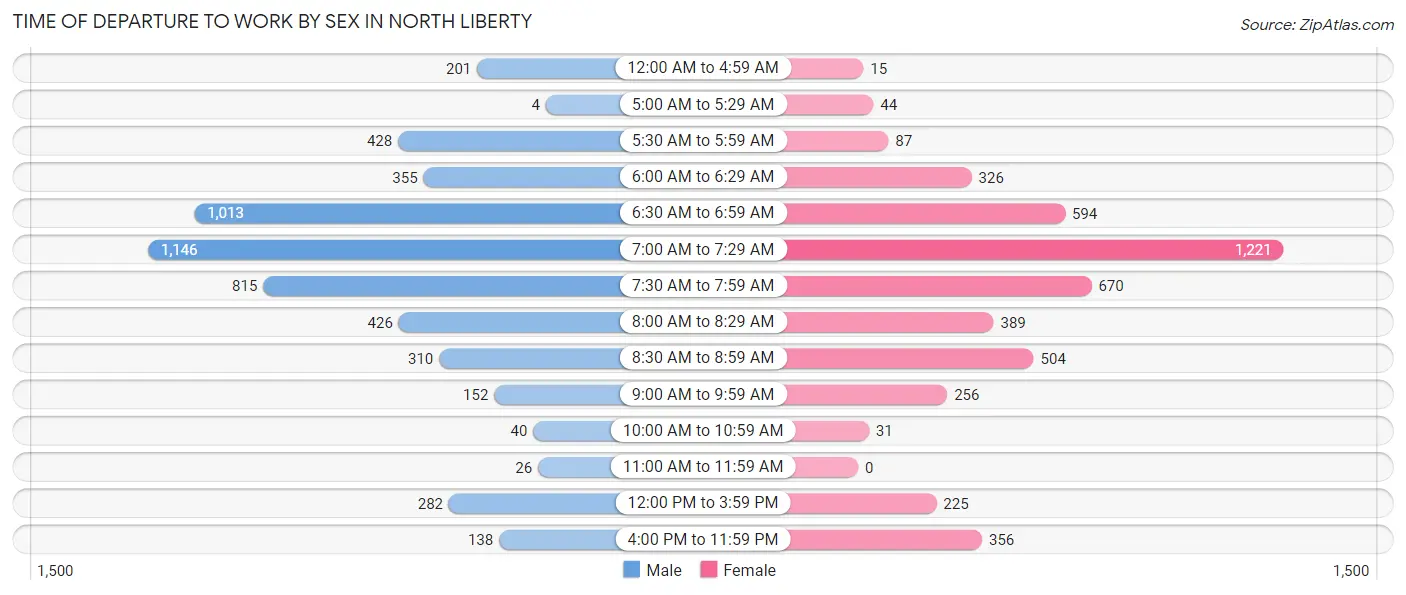
| Time of Departure | Male | Female |
| 12:00 AM to 4:59 AM | 201 (3.8%) | 15 (0.3%) |
| 5:00 AM to 5:29 AM | 4 (0.1%) | 44 (0.9%) |
| 5:30 AM to 5:59 AM | 428 (8.0%) | 87 (1.8%) |
| 6:00 AM to 6:29 AM | 355 (6.7%) | 326 (6.9%) |
| 6:30 AM to 6:59 AM | 1,013 (19.0%) | 594 (12.6%) |
| 7:00 AM to 7:29 AM | 1,146 (21.5%) | 1,221 (25.9%) |
| 7:30 AM to 7:59 AM | 815 (15.3%) | 670 (14.2%) |
| 8:00 AM to 8:29 AM | 426 (8.0%) | 389 (8.3%) |
| 8:30 AM to 8:59 AM | 310 (5.8%) | 504 (10.7%) |
| 9:00 AM to 9:59 AM | 152 (2.9%) | 256 (5.4%) |
| 10:00 AM to 10:59 AM | 40 (0.7%) | 31 (0.7%) |
| 11:00 AM to 11:59 AM | 26 (0.5%) | 0 (0.0%) |
| 12:00 PM to 3:59 PM | 282 (5.3%) | 225 (4.8%) |
| 4:00 PM to 11:59 PM | 138 (2.6%) | 356 (7.5%) |
| Total | 5,336 (100.0%) | 4,718 (100.0%) |
Housing Occupancy in North Liberty
Occupancy by Ownership in North Liberty
Of the total 7,742 dwellings in North Liberty, owner-occupied units account for 5,503 (71.1%), while renter-occupied units make up 2,239 (28.9%).
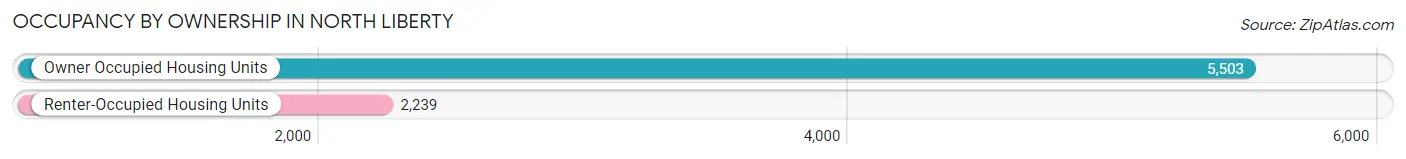
| Occupancy | # Housing Units | % Housing Units |
| Owner Occupied Housing Units | 5,503 | 71.1% |
| Renter-Occupied Housing Units | 2,239 | 28.9% |
| Total Occupied Housing Units | 7,742 | 100.0% |
Occupancy by Household Size in North Liberty
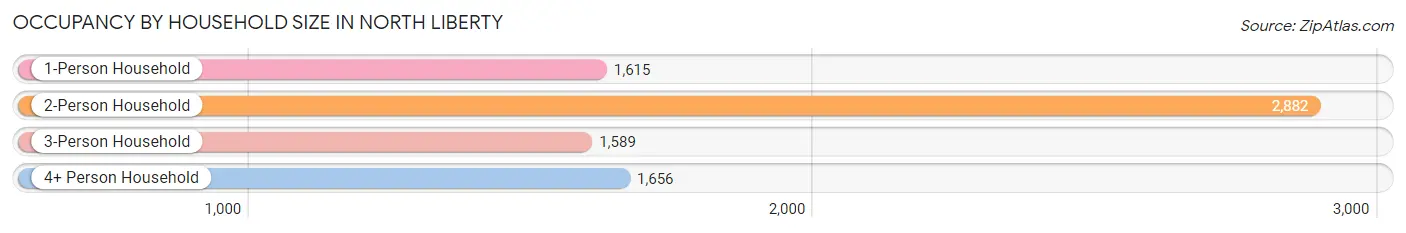
| Household Size | # Housing Units | % Housing Units |
| 1-Person Household | 1,615 | 20.9% |
| 2-Person Household | 2,882 | 37.2% |
| 3-Person Household | 1,589 | 20.5% |
| 4+ Person Household | 1,656 | 21.4% |
| Total Housing Units | 7,742 | 100.0% |
Occupancy by Ownership by Household Size in North Liberty
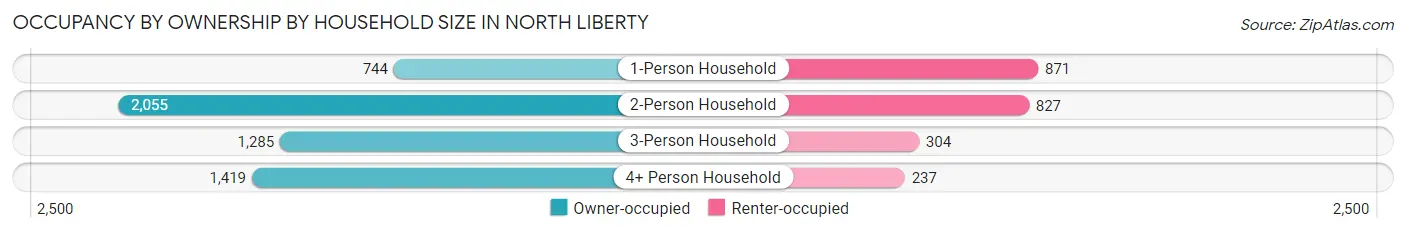
| Household Size | Owner-occupied | Renter-occupied |
| 1-Person Household | 744 (46.1%) | 871 (53.9%) |
| 2-Person Household | 2,055 (71.3%) | 827 (28.7%) |
| 3-Person Household | 1,285 (80.9%) | 304 (19.1%) |
| 4+ Person Household | 1,419 (85.7%) | 237 (14.3%) |
| Total Housing Units | 5,503 (71.1%) | 2,239 (28.9%) |
Occupancy by Educational Attainment in North Liberty
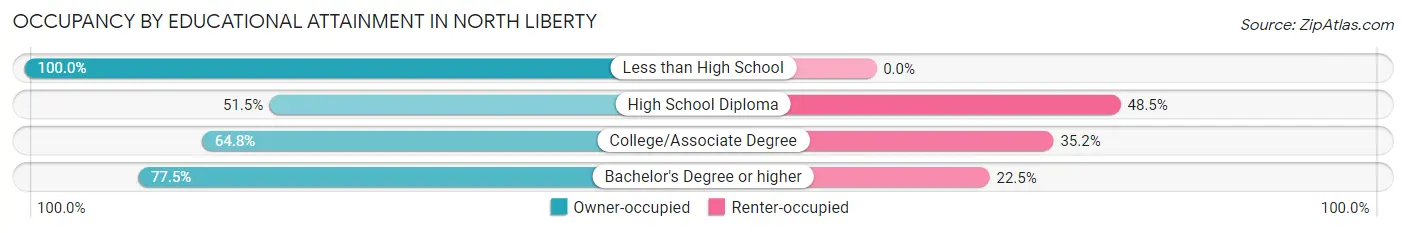
| Household Size | Owner-occupied | Renter-occupied |
| Less than High School | 53 (100.0%) | 0 (0.0%) |
| High School Diploma | 387 (51.5%) | 364 (48.5%) |
| College/Associate Degree | 1,612 (64.8%) | 874 (35.2%) |
| Bachelor's Degree or higher | 3,451 (77.5%) | 1,001 (22.5%) |
Occupancy by Age of Householder in North Liberty
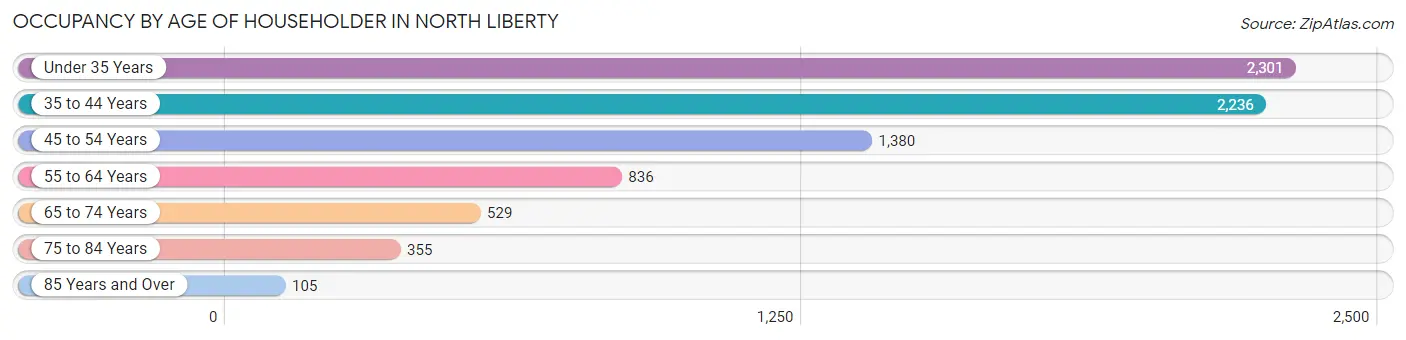
| Age Bracket | # Households | % Households |
| Under 35 Years | 2,301 | 29.7% |
| 35 to 44 Years | 2,236 | 28.9% |
| 45 to 54 Years | 1,380 | 17.8% |
| 55 to 64 Years | 836 | 10.8% |
| 65 to 74 Years | 529 | 6.8% |
| 75 to 84 Years | 355 | 4.6% |
| 85 Years and Over | 105 | 1.4% |
| Total | 7,742 | 100.0% |
Housing Finances in North Liberty
Median Income by Occupancy in North Liberty
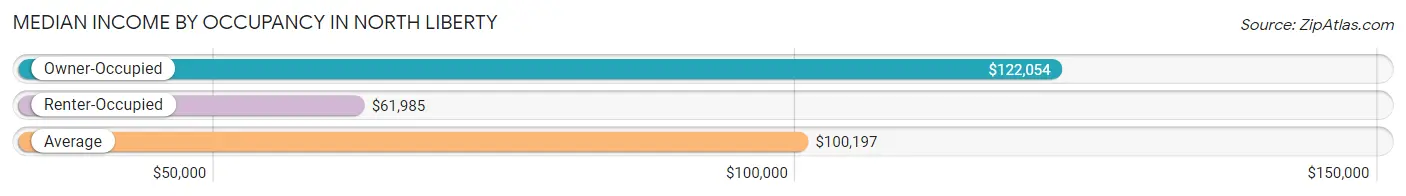
| Occupancy Type | # Households | Median Income |
| Owner-Occupied | 5,503 (71.1%) | $122,054 |
| Renter-Occupied | 2,239 (28.9%) | $61,985 |
| Average | 7,742 (100.0%) | $100,197 |
Occupancy by Householder Income Bracket in North Liberty
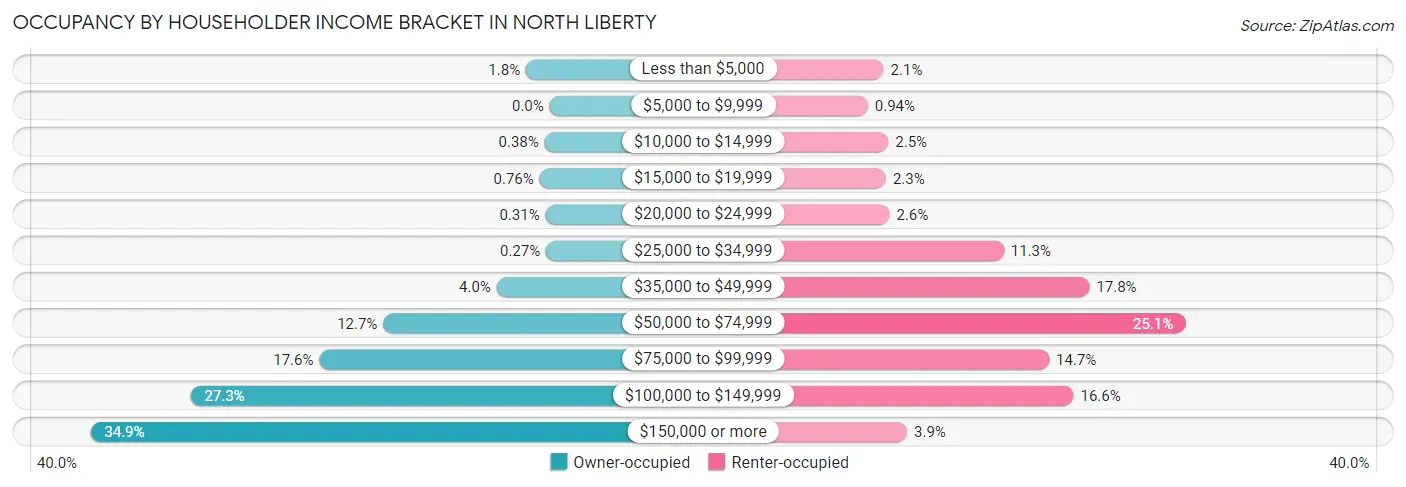
| Income Bracket | Owner-occupied | Renter-occupied |
| Less than $5,000 | 99 (1.8%) | 48 (2.1%) |
| $5,000 to $9,999 | 0 (0.0%) | 21 (0.9%) |
| $10,000 to $14,999 | 21 (0.4%) | 56 (2.5%) |
| $15,000 to $19,999 | 42 (0.8%) | 52 (2.3%) |
| $20,000 to $24,999 | 17 (0.3%) | 58 (2.6%) |
| $25,000 to $34,999 | 15 (0.3%) | 253 (11.3%) |
| $35,000 to $49,999 | 222 (4.0%) | 399 (17.8%) |
| $50,000 to $74,999 | 698 (12.7%) | 562 (25.1%) |
| $75,000 to $99,999 | 966 (17.5%) | 330 (14.7%) |
| $100,000 to $149,999 | 1,502 (27.3%) | 372 (16.6%) |
| $150,000 or more | 1,921 (34.9%) | 88 (3.9%) |
| Total | 5,503 (100.0%) | 2,239 (100.0%) |
Monthly Housing Cost Tiers in North Liberty
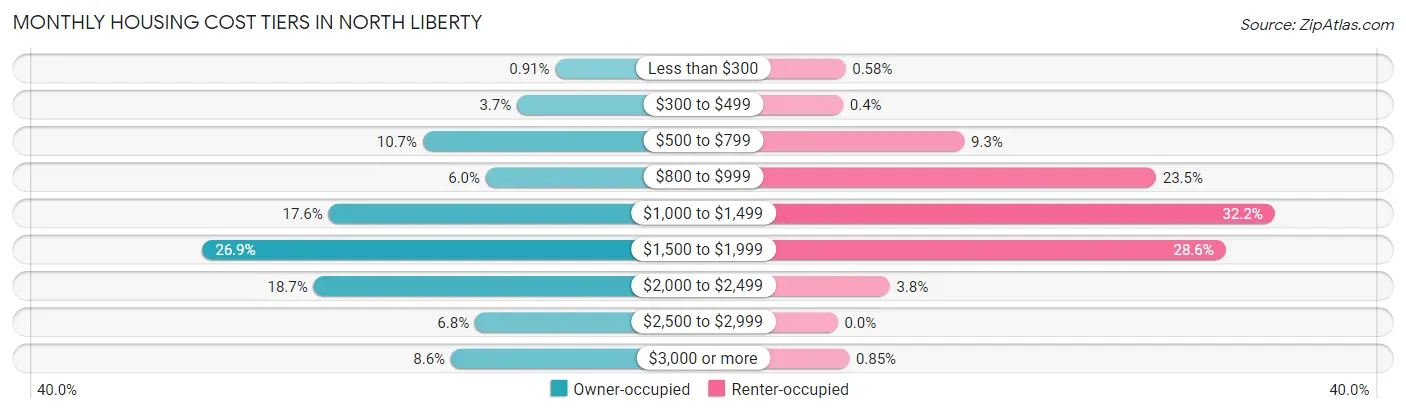
| Monthly Cost | Owner-occupied | Renter-occupied |
| Less than $300 | 50 (0.9%) | 13 (0.6%) |
| $300 to $499 | 205 (3.7%) | 9 (0.4%) |
| $500 to $799 | 587 (10.7%) | 209 (9.3%) |
| $800 to $999 | 332 (6.0%) | 525 (23.4%) |
| $1,000 to $1,499 | 969 (17.6%) | 721 (32.2%) |
| $1,500 to $1,999 | 1,481 (26.9%) | 640 (28.6%) |
| $2,000 to $2,499 | 1,030 (18.7%) | 86 (3.8%) |
| $2,500 to $2,999 | 376 (6.8%) | 0 (0.0%) |
| $3,000 or more | 473 (8.6%) | 19 (0.9%) |
| Total | 5,503 (100.0%) | 2,239 (100.0%) |
Physical Housing Characteristics in North Liberty
Housing Structures in North Liberty
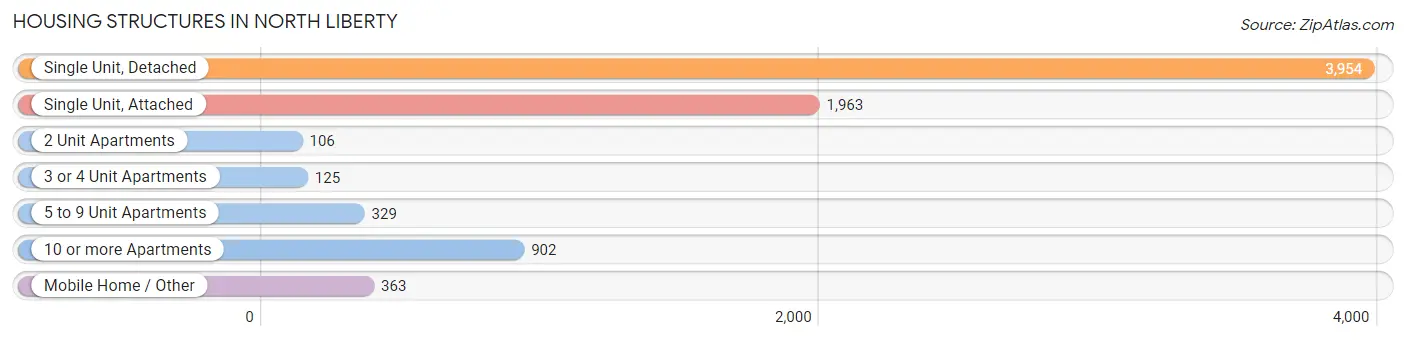
| Structure Type | # Housing Units | % Housing Units |
| Single Unit, Detached | 3,954 | 51.1% |
| Single Unit, Attached | 1,963 | 25.4% |
| 2 Unit Apartments | 106 | 1.4% |
| 3 or 4 Unit Apartments | 125 | 1.6% |
| 5 to 9 Unit Apartments | 329 | 4.3% |
| 10 or more Apartments | 902 | 11.7% |
| Mobile Home / Other | 363 | 4.7% |
| Total | 7,742 | 100.0% |
Housing Structures by Occupancy in North Liberty
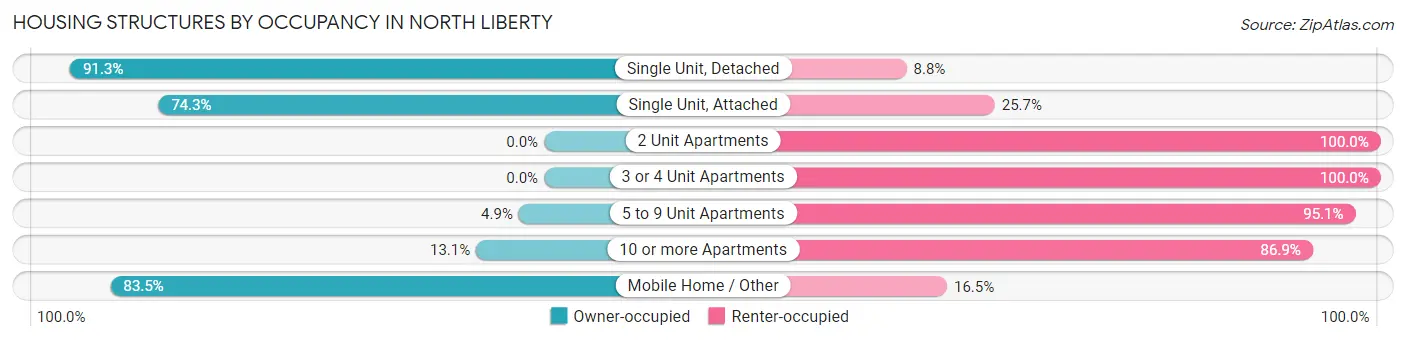
| Structure Type | Owner-occupied | Renter-occupied |
| Single Unit, Detached | 3,608 (91.2%) | 346 (8.7%) |
| Single Unit, Attached | 1,458 (74.3%) | 505 (25.7%) |
| 2 Unit Apartments | 0 (0.0%) | 106 (100.0%) |
| 3 or 4 Unit Apartments | 0 (0.0%) | 125 (100.0%) |
| 5 to 9 Unit Apartments | 16 (4.9%) | 313 (95.1%) |
| 10 or more Apartments | 118 (13.1%) | 784 (86.9%) |
| Mobile Home / Other | 303 (83.5%) | 60 (16.5%) |
| Total | 5,503 (71.1%) | 2,239 (28.9%) |
Housing Structures by Number of Rooms in North Liberty
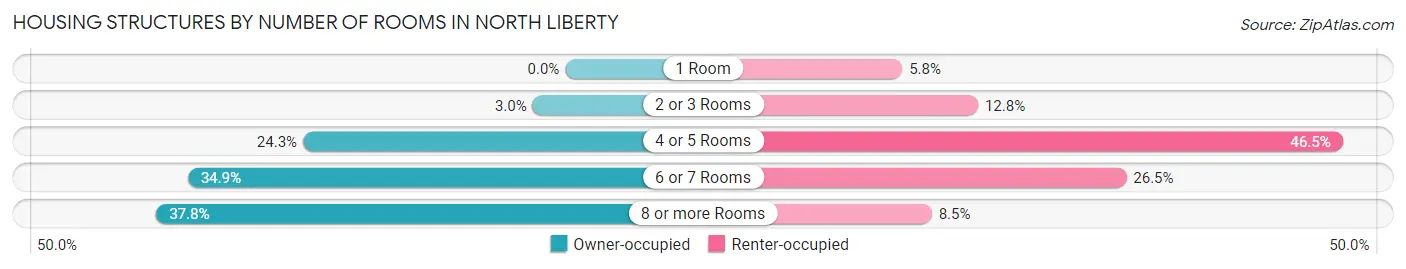
| Number of Rooms | Owner-occupied | Renter-occupied |
| 1 Room | 0 (0.0%) | 129 (5.8%) |
| 2 or 3 Rooms | 166 (3.0%) | 286 (12.8%) |
| 4 or 5 Rooms | 1,335 (24.3%) | 1,041 (46.5%) |
| 6 or 7 Rooms | 1,921 (34.9%) | 593 (26.5%) |
| 8 or more Rooms | 2,081 (37.8%) | 190 (8.5%) |
| Total | 5,503 (100.0%) | 2,239 (100.0%) |
Housing Structure by Heating Type in North Liberty
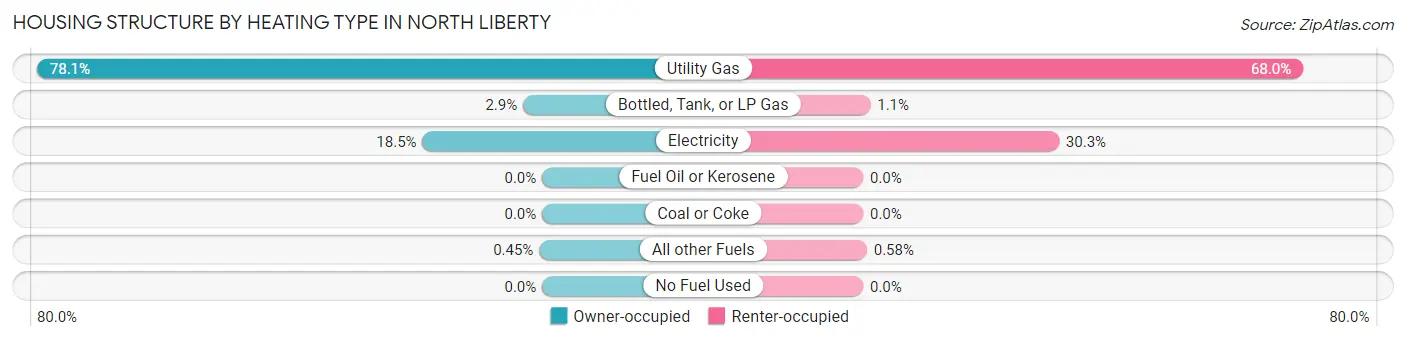
| Heating Type | Owner-occupied | Renter-occupied |
| Utility Gas | 4,298 (78.1%) | 1,523 (68.0%) |
| Bottled, Tank, or LP Gas | 162 (2.9%) | 25 (1.1%) |
| Electricity | 1,018 (18.5%) | 678 (30.3%) |
| Fuel Oil or Kerosene | 0 (0.0%) | 0 (0.0%) |
| Coal or Coke | 0 (0.0%) | 0 (0.0%) |
| All other Fuels | 25 (0.4%) | 13 (0.6%) |
| No Fuel Used | 0 (0.0%) | 0 (0.0%) |
| Total | 5,503 (100.0%) | 2,239 (100.0%) |
Household Vehicle Usage in North Liberty
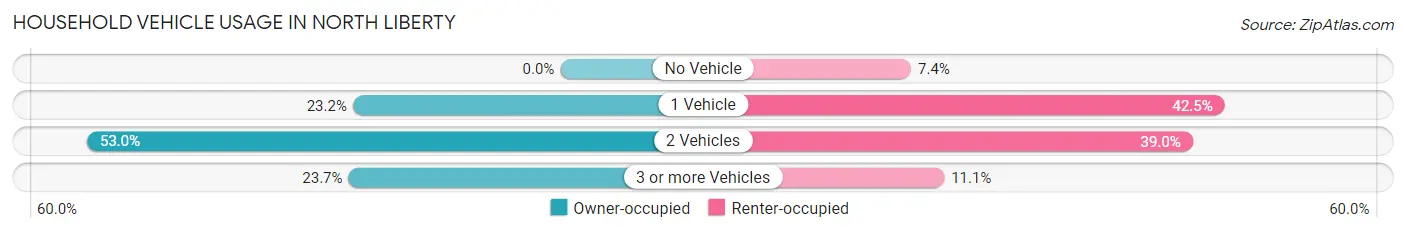
| Vehicles per Household | Owner-occupied | Renter-occupied |
| No Vehicle | 0 (0.0%) | 166 (7.4%) |
| 1 Vehicle | 1,279 (23.2%) | 952 (42.5%) |
| 2 Vehicles | 2,918 (53.0%) | 872 (39.0%) |
| 3 or more Vehicles | 1,306 (23.7%) | 249 (11.1%) |
| Total | 5,503 (100.0%) | 2,239 (100.0%) |
Real Estate & Mortgages in North Liberty
Real Estate and Mortgage Overview in North Liberty
| Characteristic | Without Mortgage | With Mortgage |
| Housing Units | 1,104 | 4,399 |
| Median Property Value | $233,900 | $287,300 |
| Median Household Income | $93,214 | $1,702 |
| Monthly Housing Costs | $622 | $473 |
| Real Estate Taxes | $3,313 | $106 |
Property Value by Mortgage Status in North Liberty
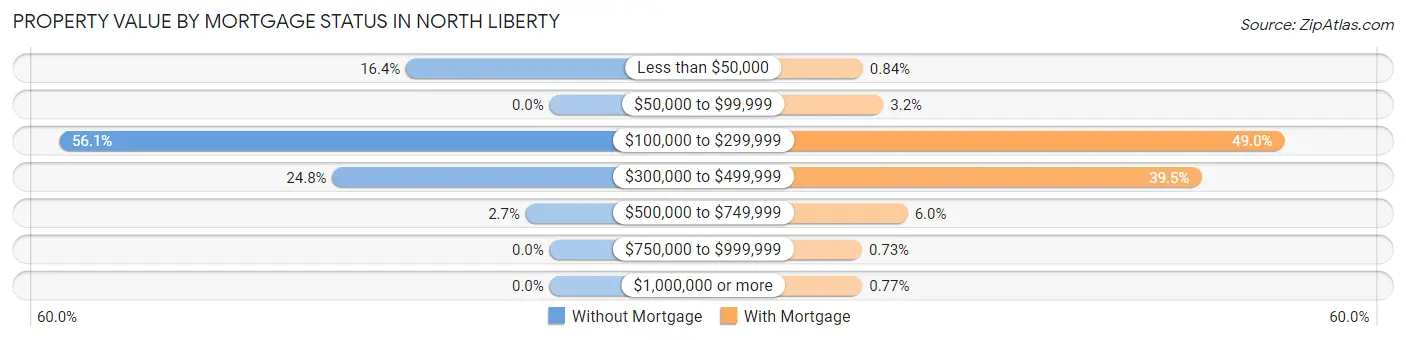
| Property Value | Without Mortgage | With Mortgage |
| Less than $50,000 | 181 (16.4%) | 37 (0.8%) |
| $50,000 to $99,999 | 0 (0.0%) | 140 (3.2%) |
| $100,000 to $299,999 | 619 (56.1%) | 2,156 (49.0%) |
| $300,000 to $499,999 | 274 (24.8%) | 1,738 (39.5%) |
| $500,000 to $749,999 | 30 (2.7%) | 262 (6.0%) |
| $750,000 to $999,999 | 0 (0.0%) | 32 (0.7%) |
| $1,000,000 or more | 0 (0.0%) | 34 (0.8%) |
| Total | 1,104 (100.0%) | 4,399 (100.0%) |
Household Income by Mortgage Status in North Liberty
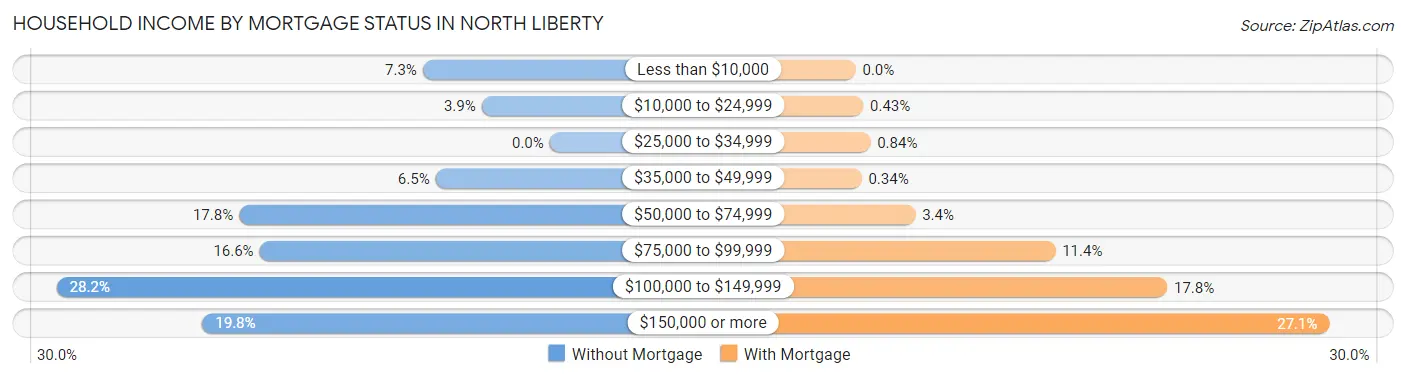
| Household Income | Without Mortgage | With Mortgage |
| Less than $10,000 | 80 (7.2%) | 0 (0.0%) |
| $10,000 to $24,999 | 43 (3.9%) | 19 (0.4%) |
| $25,000 to $34,999 | 0 (0.0%) | 37 (0.8%) |
| $35,000 to $49,999 | 72 (6.5%) | 15 (0.3%) |
| $50,000 to $74,999 | 196 (17.7%) | 150 (3.4%) |
| $75,000 to $99,999 | 183 (16.6%) | 502 (11.4%) |
| $100,000 to $149,999 | 311 (28.2%) | 783 (17.8%) |
| $150,000 or more | 219 (19.8%) | 1,191 (27.1%) |
| Total | 1,104 (100.0%) | 4,399 (100.0%) |
Property Value to Household Income Ratio in North Liberty
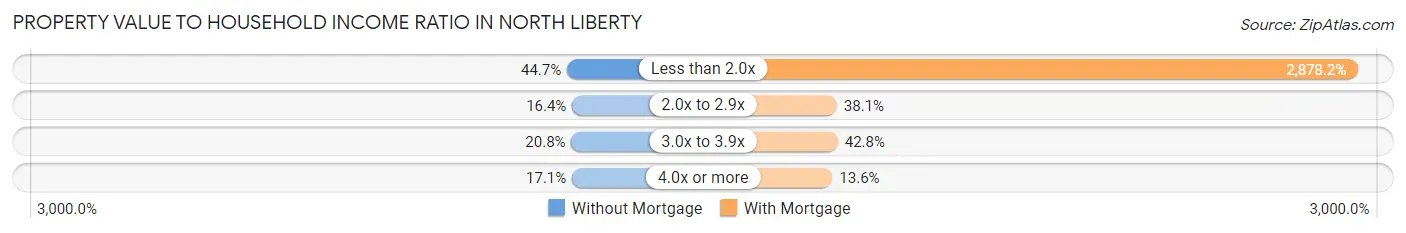
| Value-to-Income Ratio | Without Mortgage | With Mortgage |
| Less than 2.0x | 493 (44.7%) | 126,611 (2,878.2%) |
| 2.0x to 2.9x | 181 (16.4%) | 1,677 (38.1%) |
| 3.0x to 3.9x | 230 (20.8%) | 1,884 (42.8%) |
| 4.0x or more | 189 (17.1%) | 596 (13.6%) |
| Total | 1,104 (100.0%) | 4,399 (100.0%) |
Real Estate Taxes by Mortgage Status in North Liberty
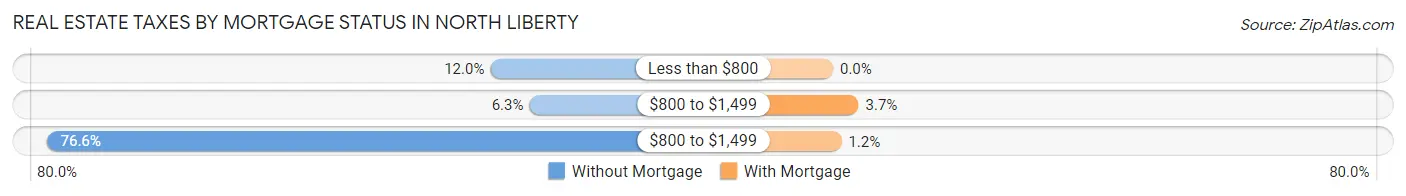
| Property Taxes | Without Mortgage | With Mortgage |
| Less than $800 | 132 (12.0%) | 0 (0.0%) |
| $800 to $1,499 | 69 (6.2%) | 164 (3.7%) |
| $800 to $1,499 | 846 (76.6%) | 54 (1.2%) |
| Total | 1,104 (100.0%) | 4,399 (100.0%) |
Health & Disability in North Liberty
Health Insurance Coverage by Age in North Liberty
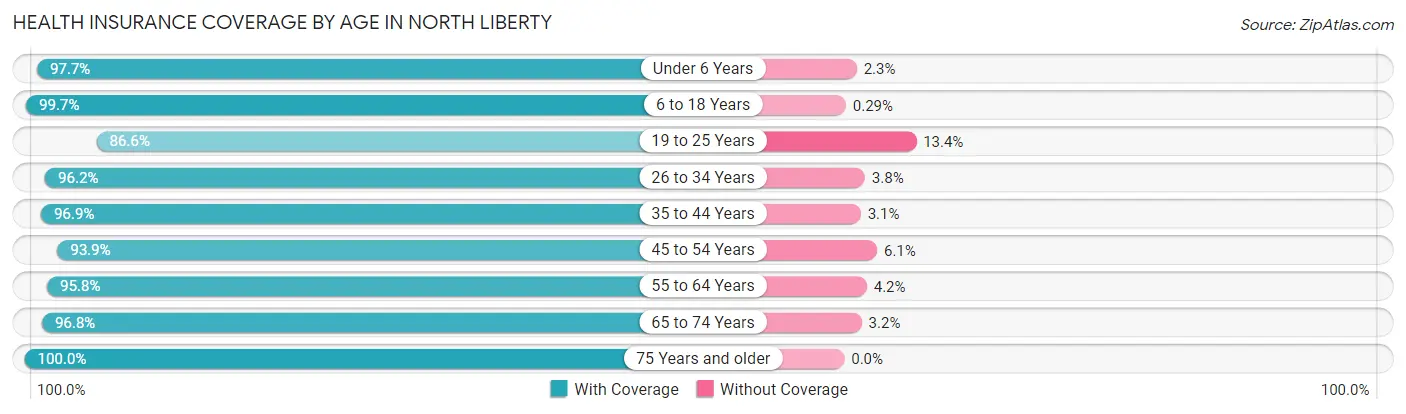
| Age Bracket | With Coverage | Without Coverage |
| Under 6 Years | 1,736 (97.7%) | 41 (2.3%) |
| 6 to 18 Years | 4,182 (99.7%) | 12 (0.3%) |
| 19 to 25 Years | 1,563 (86.6%) | 242 (13.4%) |
| 26 to 34 Years | 3,452 (96.2%) | 138 (3.8%) |
| 35 to 44 Years | 3,704 (96.9%) | 117 (3.1%) |
| 45 to 54 Years | 2,091 (93.9%) | 136 (6.1%) |
| 55 to 64 Years | 1,419 (95.8%) | 62 (4.2%) |
| 65 to 74 Years | 777 (96.8%) | 26 (3.2%) |
| 75 Years and older | 634 (100.0%) | 0 (0.0%) |
| Total | 19,558 (96.2%) | 774 (3.8%) |
Health Insurance Coverage by Citizenship Status in North Liberty
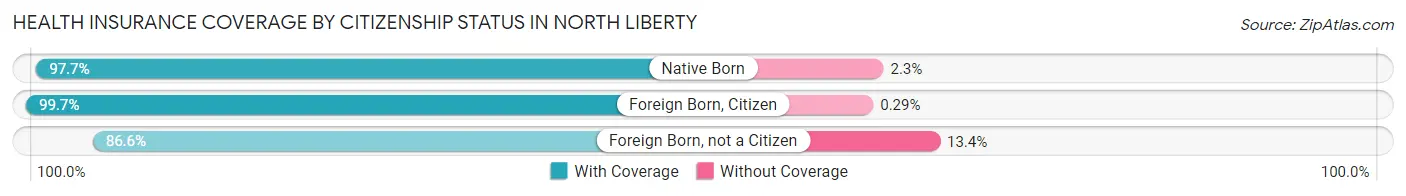
| Citizenship Status | With Coverage | Without Coverage |
| Native Born | 1,736 (97.7%) | 41 (2.3%) |
| Foreign Born, Citizen | 4,182 (99.7%) | 12 (0.3%) |
| Foreign Born, not a Citizen | 1,563 (86.6%) | 242 (13.4%) |
Health Insurance Coverage by Household Income in North Liberty
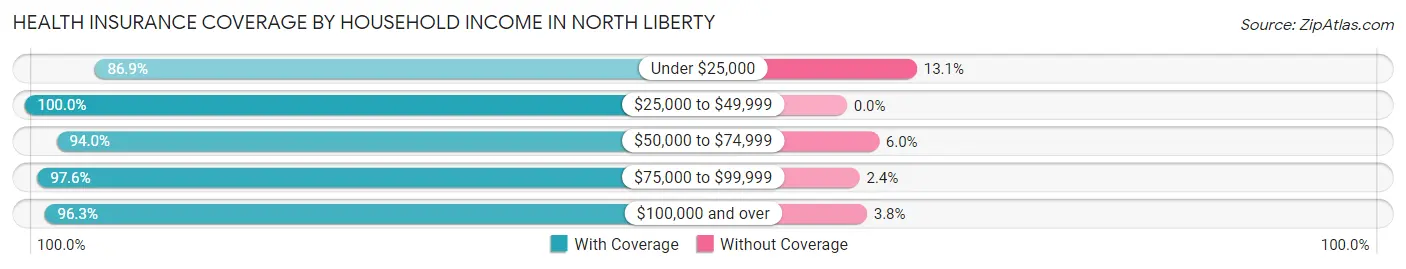
| Household Income | With Coverage | Without Coverage |
| Under $25,000 | 530 (86.9%) | 80 (13.1%) |
| $25,000 to $49,999 | 1,647 (100.0%) | 0 (0.0%) |
| $50,000 to $74,999 | 2,362 (94.0%) | 151 (6.0%) |
| $75,000 to $99,999 | 2,903 (97.6%) | 71 (2.4%) |
| $100,000 and over | 12,116 (96.3%) | 472 (3.7%) |
Public vs Private Health Insurance Coverage by Age in North Liberty
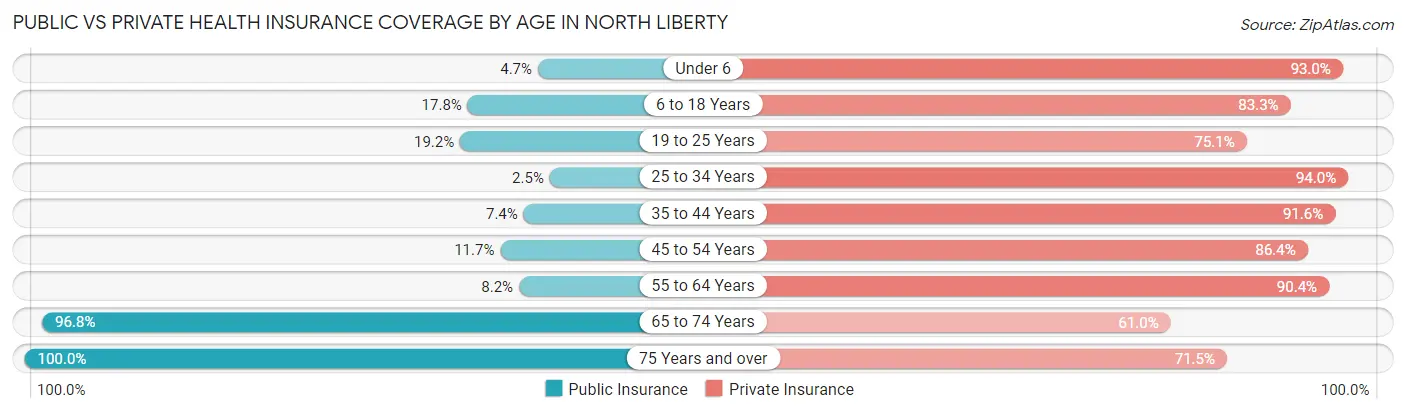
| Age Bracket | Public Insurance | Private Insurance |
| Under 6 | 84 (4.7%) | 1,652 (93.0%) |
| 6 to 18 Years | 745 (17.8%) | 3,492 (83.3%) |
| 19 to 25 Years | 346 (19.2%) | 1,356 (75.1%) |
| 25 to 34 Years | 91 (2.5%) | 3,373 (94.0%) |
| 35 to 44 Years | 282 (7.4%) | 3,498 (91.5%) |
| 45 to 54 Years | 261 (11.7%) | 1,925 (86.4%) |
| 55 to 64 Years | 122 (8.2%) | 1,339 (90.4%) |
| 65 to 74 Years | 777 (96.8%) | 490 (61.0%) |
| 75 Years and over | 634 (100.0%) | 453 (71.5%) |
| Total | 3,342 (16.4%) | 17,578 (86.5%) |
Disability Status by Sex by Age in North Liberty
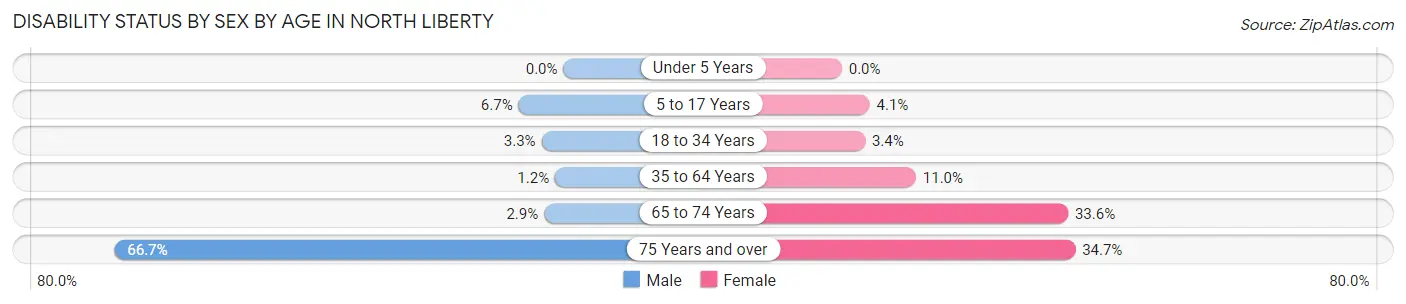
| Age Bracket | Male | Female |
| Under 5 Years | 0 (0.0%) | 0 (0.0%) |
| 5 to 17 Years | 153 (6.7%) | 84 (4.1%) |
| 18 to 34 Years | 99 (3.3%) | 87 (3.4%) |
| 35 to 64 Years | 47 (1.2%) | 412 (11.0%) |
| 65 to 74 Years | 12 (2.9%) | 129 (33.6%) |
| 75 Years and over | 188 (66.7%) | 122 (34.7%) |
Disability Class by Sex by Age in North Liberty
Disability Class: Hearing Difficulty
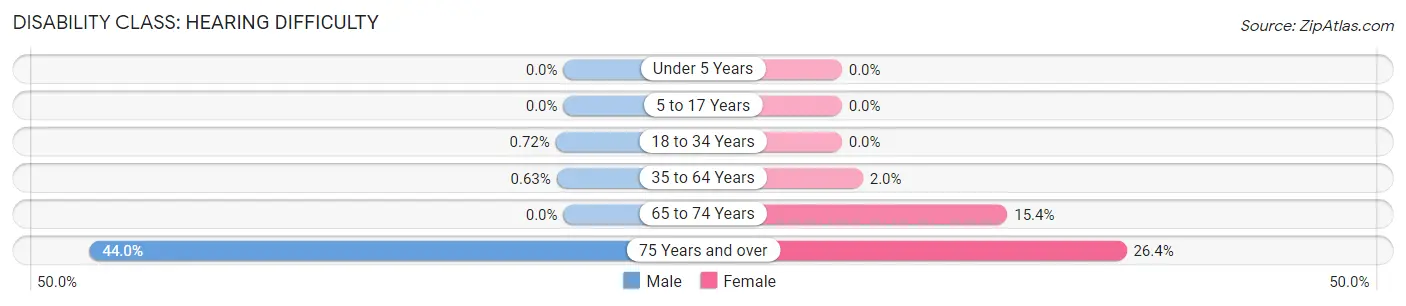
| Age Bracket | Male | Female |
| Under 5 Years | 0 (0.0%) | 0 (0.0%) |
| 5 to 17 Years | 0 (0.0%) | 0 (0.0%) |
| 18 to 34 Years | 22 (0.7%) | 0 (0.0%) |
| 35 to 64 Years | 24 (0.6%) | 73 (1.9%) |
| 65 to 74 Years | 0 (0.0%) | 59 (15.4%) |
| 75 Years and over | 124 (44.0%) | 93 (26.4%) |
Disability Class: Vision Difficulty
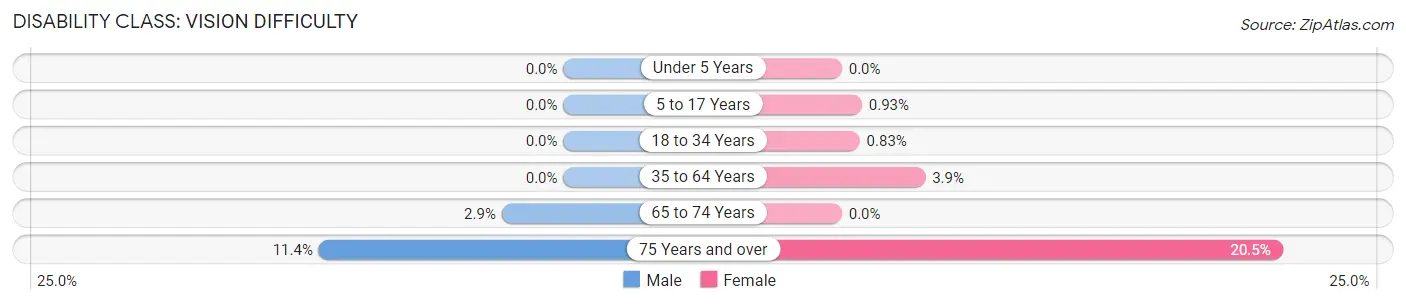
| Age Bracket | Male | Female |
| Under 5 Years | 0 (0.0%) | 0 (0.0%) |
| 5 to 17 Years | 0 (0.0%) | 19 (0.9%) |
| 18 to 34 Years | 0 (0.0%) | 21 (0.8%) |
| 35 to 64 Years | 0 (0.0%) | 145 (3.9%) |
| 65 to 74 Years | 12 (2.9%) | 0 (0.0%) |
| 75 Years and over | 32 (11.4%) | 72 (20.4%) |
Disability Class: Cognitive Difficulty
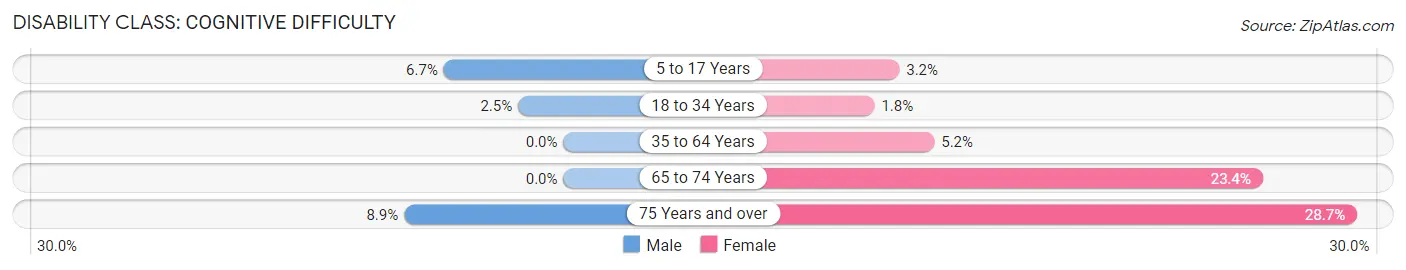
| Age Bracket | Male | Female |
| 5 to 17 Years | 153 (6.7%) | 65 (3.2%) |
| 18 to 34 Years | 77 (2.5%) | 46 (1.8%) |
| 35 to 64 Years | 0 (0.0%) | 193 (5.1%) |
| 65 to 74 Years | 0 (0.0%) | 90 (23.4%) |
| 75 Years and over | 25 (8.9%) | 101 (28.7%) |
Disability Class: Ambulatory Difficulty
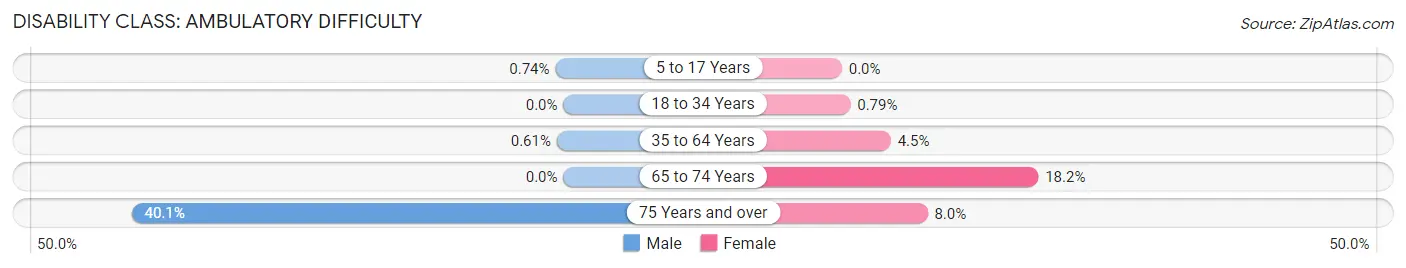
| Age Bracket | Male | Female |
| 5 to 17 Years | 17 (0.7%) | 0 (0.0%) |
| 18 to 34 Years | 0 (0.0%) | 20 (0.8%) |
| 35 to 64 Years | 23 (0.6%) | 170 (4.5%) |
| 65 to 74 Years | 0 (0.0%) | 70 (18.2%) |
| 75 Years and over | 113 (40.1%) | 28 (8.0%) |
Disability Class: Self-Care Difficulty
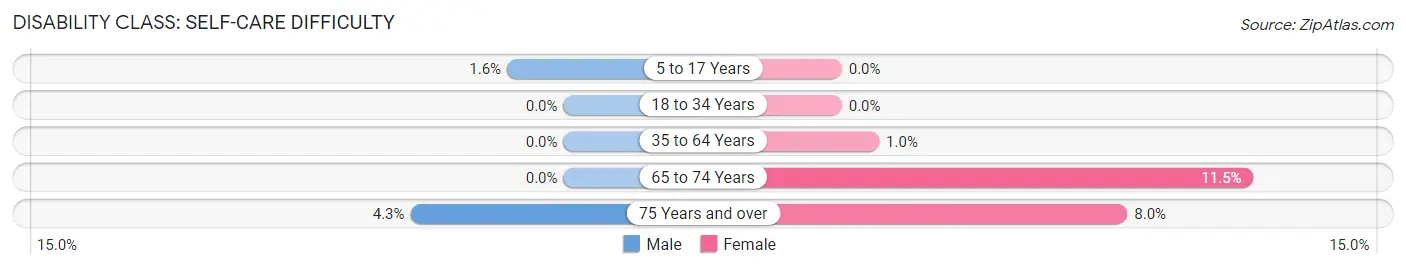
| Age Bracket | Male | Female |
| 5 to 17 Years | 36 (1.6%) | 0 (0.0%) |
| 18 to 34 Years | 0 (0.0%) | 0 (0.0%) |
| 35 to 64 Years | 0 (0.0%) | 39 (1.0%) |
| 65 to 74 Years | 0 (0.0%) | 44 (11.5%) |
| 75 Years and over | 12 (4.3%) | 28 (8.0%) |
Technology Access in North Liberty
Computing Device Access in North Liberty
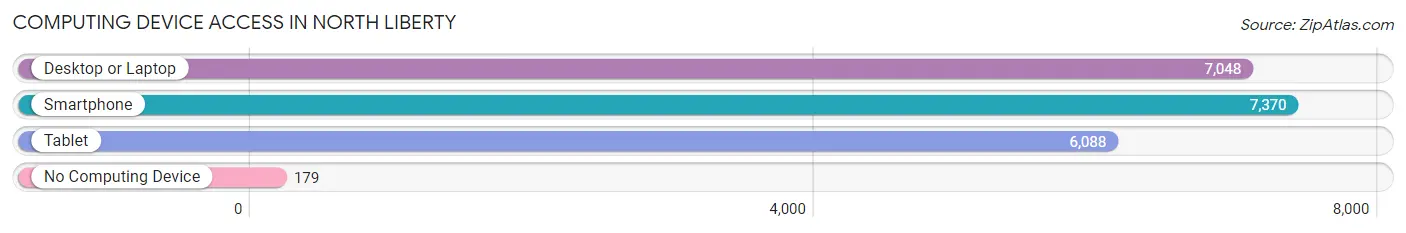
| Device Type | # Households | % Households |
| Desktop or Laptop | 7,048 | 91.0% |
| Smartphone | 7,370 | 95.2% |
| Tablet | 6,088 | 78.6% |
| No Computing Device | 179 | 2.3% |
| Total | 7,742 | 100.0% |
Internet Access in North Liberty
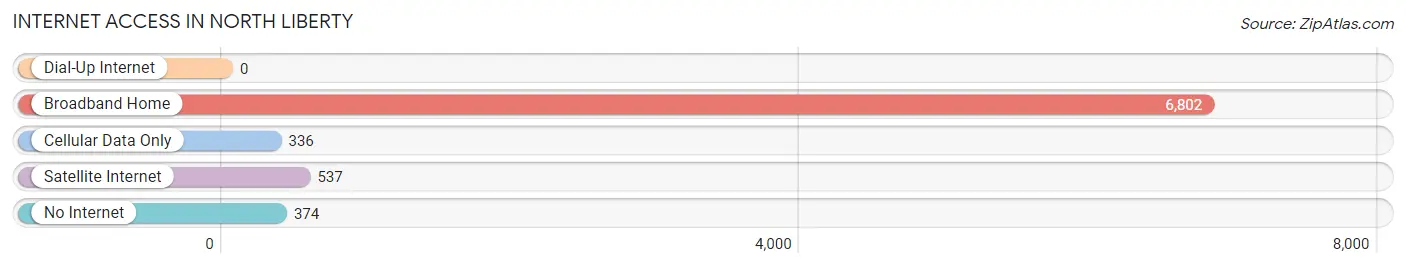
| Internet Type | # Households | % Households |
| Dial-Up Internet | 0 | 0.0% |
| Broadband Home | 6,802 | 87.9% |
| Cellular Data Only | 336 | 4.3% |
| Satellite Internet | 537 | 6.9% |
| No Internet | 374 | 4.8% |
| Total | 7,742 | 100.0% |
North Liberty Summary
History
North Liberty is a city located in Johnson County, Iowa, United States. It is part of the Iowa City, Coralville, and North Liberty Metropolitan Statistical Area. The city was founded in 1838 and incorporated in 1965.
The area that is now North Liberty was originally inhabited by the Meskwaki and Sauk Native American tribes. The first white settlers arrived in the area in the early 1830s. The first settler was William Penn Clarke, who arrived in 1838 and established a trading post. The area was known as Penn’s Point until 1851, when it was renamed North Liberty.
The city was officially incorporated in 1965, and the population has grown steadily since then. In 2000, the population was 5,719. By 2010, the population had grown to 12,998.
Geography
North Liberty is located in Johnson County, Iowa, in the Iowa City, Coralville, and North Liberty Metropolitan Statistical Area. The city is situated on the Iowa River, and is bordered by the cities of Coralville and Iowa City. The city covers an area of 8.3 square miles, and has a population density of 1,564 people per square mile.
The city has a humid continental climate, with hot, humid summers and cold, snowy winters. The average temperature in July is 79°F, and the average temperature in January is 22°F. The average annual precipitation is 37.5 inches.
Economy
North Liberty’s economy is largely based on the service industry. The city is home to several large employers, including the University of Iowa, the University of Iowa Hospitals and Clinics, and the University of Iowa Research Park. Other major employers include the North Liberty Community School District, the City of North Liberty, and the North Liberty Community Center.
The city also has a thriving retail sector, with several large shopping centers and retail outlets. The city is home to several restaurants, bars, and entertainment venues.
Demographics
As of the 2010 census, the population of North Liberty was 12,998. The racial makeup of the city was 87.3% White, 5.2% African American, 0.7% Native American, 2.3% Asian, 0.1% Pacific Islander, 1.7% from other races, and 2.7% from two or more races. Hispanic or Latino of any race were 4.2% of the population.
The median household income in North Liberty was $60,945, and the median family income was $71,945. The per capita income was $27,945. About 5.2% of families and 7.2% of the population were below the poverty line, including 8.3% of those under age 18 and 4.2% of those age 65 or over.
Common Questions
What is Per Capita Income in North Liberty?
Per Capita income in North Liberty is $50,009.
What is the Median Family Income in North Liberty?
Median Family Income in North Liberty is $125,973.
What is the Median Household income in North Liberty?
Median Household Income in North Liberty is $100,197.
What is Income or Wage Gap in North Liberty?
Income or Wage Gap in North Liberty is 31.7%.
Women in North Liberty earn 68.3 cents for every dollar earned by a man.
What is Inequality or Gini Index in North Liberty?
Inequality or Gini Index in North Liberty is 0.41.
What is the Total Population of North Liberty?
Total Population of North Liberty is 20,393.
What is the Total Male Population of North Liberty?
Total Male Population of North Liberty is 10,501.
What is the Total Female Population of North Liberty?
Total Female Population of North Liberty is 9,892.
What is the Ratio of Males per 100 Females in North Liberty?
There are 106.16 Males per 100 Females in North Liberty.
What is the Ratio of Females per 100 Males in North Liberty?
There are 94.20 Females per 100 Males in North Liberty.
What is the Median Population Age in North Liberty?
Median Population Age in North Liberty is 31.9 Years.
What is the Average Family Size in North Liberty
Average Family Size in North Liberty is 3.2 People.
What is the Average Household Size in North Liberty
Average Household Size in North Liberty is 2.6 People.
How Large is the Labor Force in North Liberty?
There are 11,833 People in the Labor Forcein in North Liberty.
What is the Percentage of People in the Labor Force in North Liberty?
78.6% of People are in the Labor Force in North Liberty.
What is the Unemployment Rate in North Liberty?
Unemployment Rate in North Liberty is 2.0%.