Louisville, KY Map & Demographics
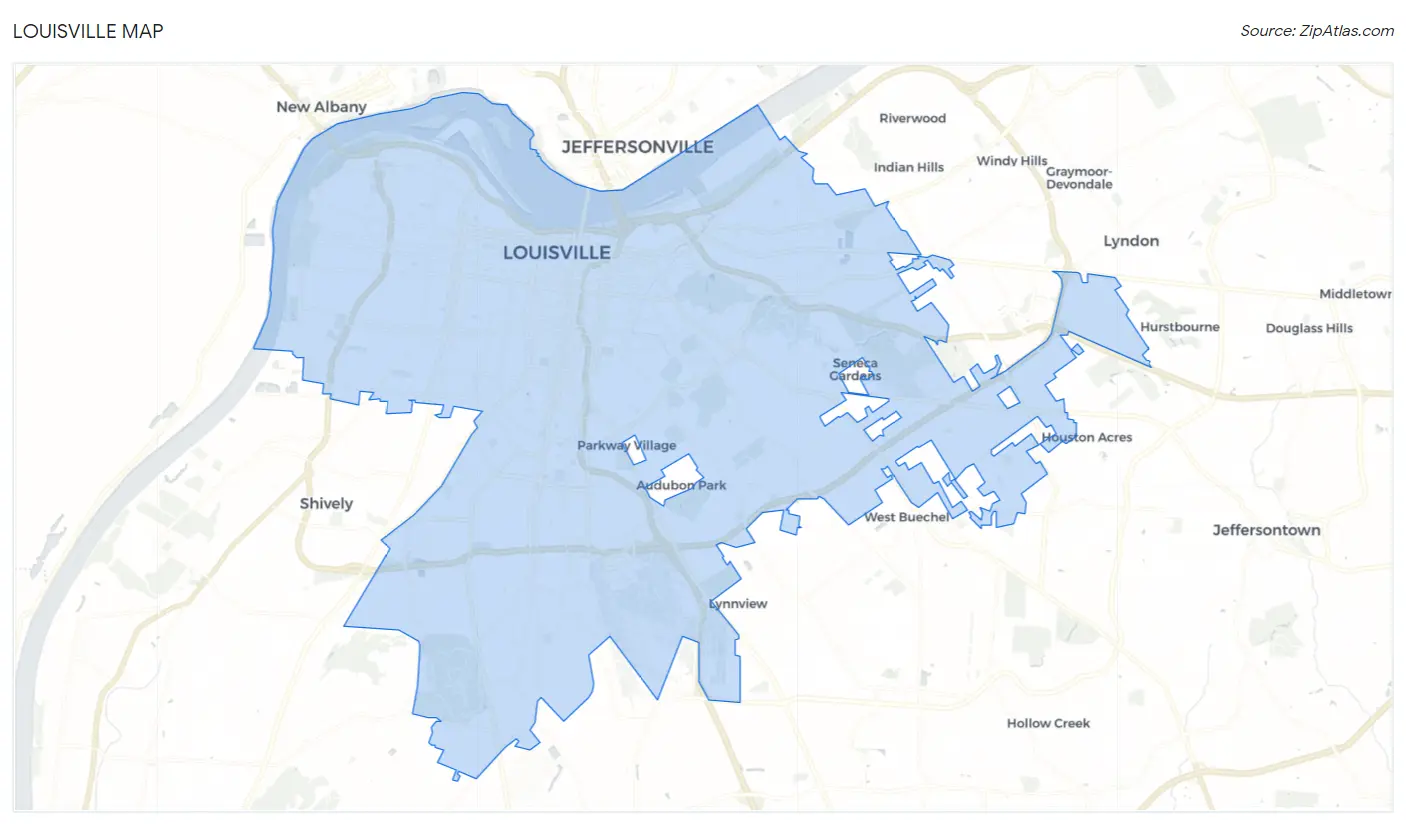
Louisville Map
Louisville Overview
$37,588
PER CAPITA INCOME
$81,196
AVG FAMILY INCOME
$63,114
AVG HOUSEHOLD INCOME
22.5%
WAGE / INCOME GAP [ % ]
77.5¢/ $1
WAGE / INCOME GAP [ $ ]
$11,003
FAMILY INCOME DEFICIT
0.48
INEQUALITY / GINI INDEX
629,176
TOTAL POPULATION
307,201
MALE POPULATION
321,975
FEMALE POPULATION
95.41
MALES / 100 FEMALES
104.81
FEMALES / 100 MALES
37.9
MEDIAN AGE
3.1
AVG FAMILY SIZE
2.4
AVG HOUSEHOLD SIZE
332,707
LABOR FORCE [ PEOPLE ]
65.8%
PERCENT IN LABOR FORCE
5.3%
UNEMPLOYMENT RATE
Louisville Zip Codes
Louisville Area Codes
Income in Louisville
Income Overview in Louisville
Per Capita Income in Louisville is $37,588, while median incomes of families and households are $81,196 and $63,114 respectively.
| Characteristic | Number | Measure |
| Per Capita Income | 629,176 | $37,588 |
| Median Family Income | 152,245 | $81,196 |
| Mean Family Income | 152,245 | $108,609 |
| Median Household Income | 261,105 | $63,114 |
| Mean Household Income | 261,105 | $88,552 |
| Income Deficit | 152,245 | $11,003 |
| Wage / Income Gap (%) | 629,176 | 22.53% |
| Wage / Income Gap ($) | 629,176 | 77.47¢ per $1 |
| Gini / Inequality Index | 629,176 | 0.48 |
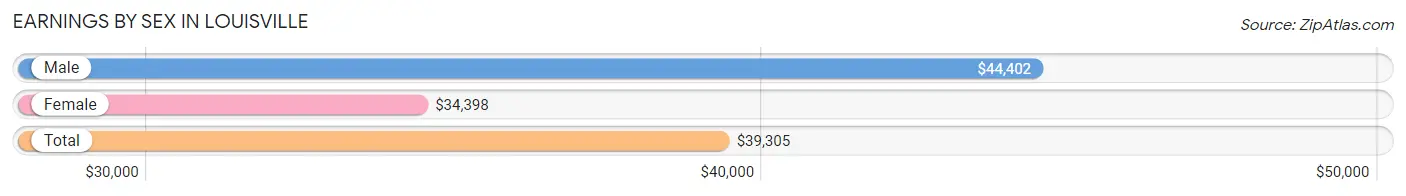
Earnings by Sex in Louisville
Average Earnings in Louisville are $39,305, $44,402 for men and $34,398 for women, a difference of 22.5%.
| Sex | Number | Average Earnings |
| Male | 176,456 (51.1%) | $44,402 |
| Female | 168,620 (48.9%) | $34,398 |
| Total | 345,076 (100.0%) | $39,305 |
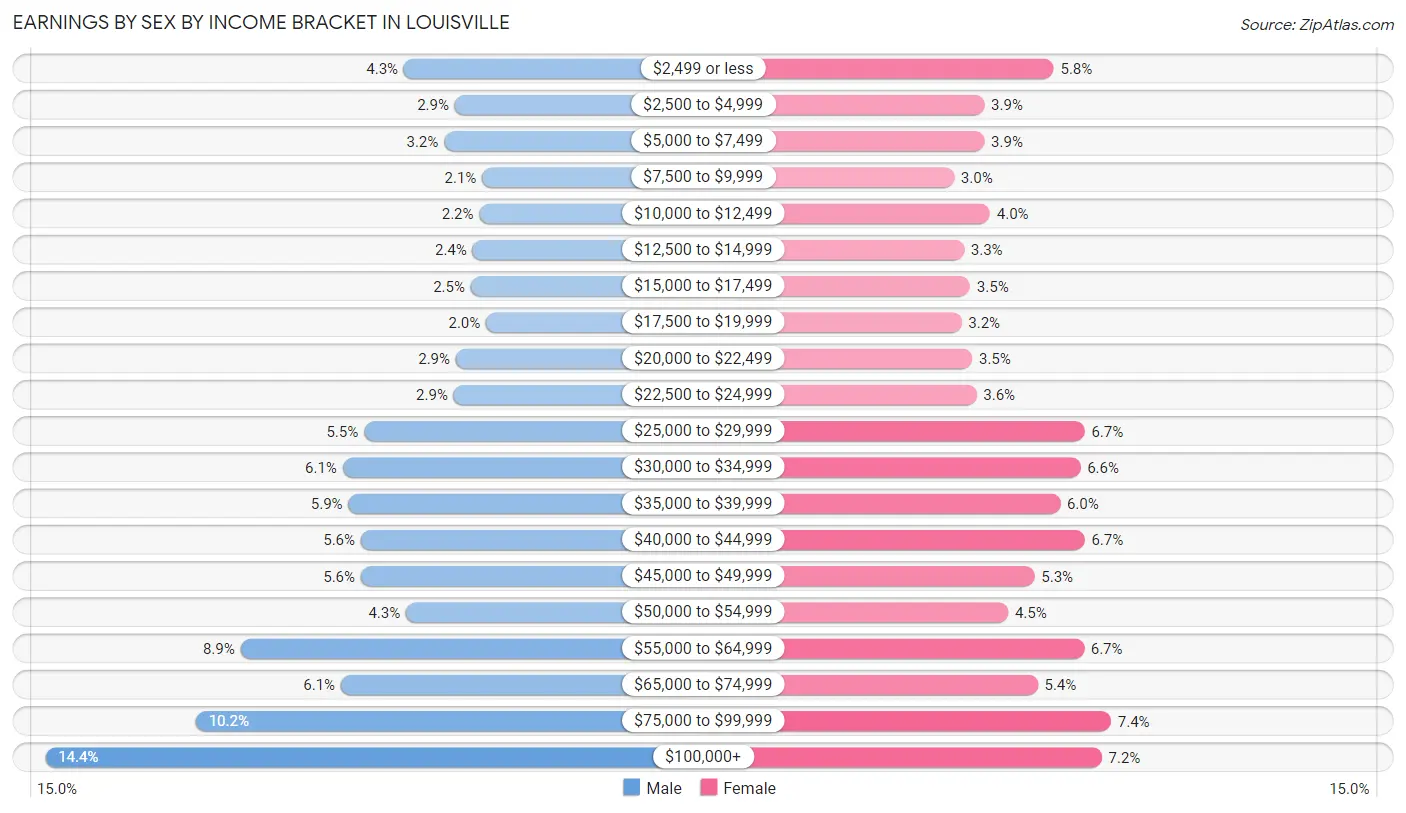
Earnings by Sex by Income Bracket in Louisville
The most common earnings brackets in Louisville are $100,000+ for men (25,440 | 14.4%) and $75,000 to $99,999 for women (12,519 | 7.4%).
| Income | Male | Female |
| $2,499 or less | 7,657 (4.3%) | 9,795 (5.8%) |
| $2,500 to $4,999 | 5,141 (2.9%) | 6,503 (3.9%) |
| $5,000 to $7,499 | 5,664 (3.2%) | 6,505 (3.9%) |
| $7,500 to $9,999 | 3,783 (2.1%) | 5,070 (3.0%) |
| $10,000 to $12,499 | 3,910 (2.2%) | 6,779 (4.0%) |
| $12,500 to $14,999 | 4,249 (2.4%) | 5,552 (3.3%) |
| $15,000 to $17,499 | 4,349 (2.5%) | 5,836 (3.5%) |
| $17,500 to $19,999 | 3,584 (2.0%) | 5,433 (3.2%) |
| $20,000 to $22,499 | 5,090 (2.9%) | 5,934 (3.5%) |
| $22,500 to $24,999 | 5,183 (2.9%) | 6,133 (3.6%) |
| $25,000 to $29,999 | 9,640 (5.5%) | 11,270 (6.7%) |
| $30,000 to $34,999 | 10,687 (6.1%) | 11,059 (6.6%) |
| $35,000 to $39,999 | 10,414 (5.9%) | 10,105 (6.0%) |
| $40,000 to $44,999 | 9,787 (5.6%) | 11,259 (6.7%) |
| $45,000 to $49,999 | 9,800 (5.6%) | 8,884 (5.3%) |
| $50,000 to $54,999 | 7,551 (4.3%) | 7,640 (4.5%) |
| $55,000 to $64,999 | 15,763 (8.9%) | 11,236 (6.7%) |
| $65,000 to $74,999 | 10,786 (6.1%) | 9,043 (5.4%) |
| $75,000 to $99,999 | 17,978 (10.2%) | 12,519 (7.4%) |
| $100,000+ | 25,440 (14.4%) | 12,065 (7.2%) |
| Total | 176,456 (100.0%) | 168,620 (100.0%) |
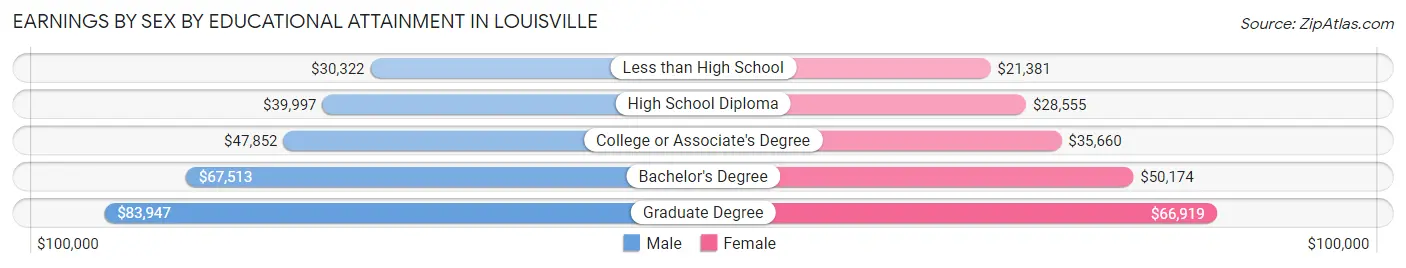
Earnings by Sex by Educational Attainment in Louisville
Average earnings in Louisville are $50,417 for men and $39,231 for women, a difference of 22.2%. Men with an educational attainment of graduate degree enjoy the highest average annual earnings of $83,947, while those with less than high school education earn the least with $30,322. Women with an educational attainment of graduate degree earn the most with the average annual earnings of $66,919, while those with less than high school education have the smallest earnings of $21,381.
| Educational Attainment | Male Income | Female Income |
| Less than High School | $30,322 | $21,381 |
| High School Diploma | $39,997 | $28,555 |
| College or Associate's Degree | $47,852 | $35,660 |
| Bachelor's Degree | $67,513 | $50,174 |
| Graduate Degree | $83,947 | $66,919 |
| Total | $50,417 | $39,231 |
Family Income in Louisville
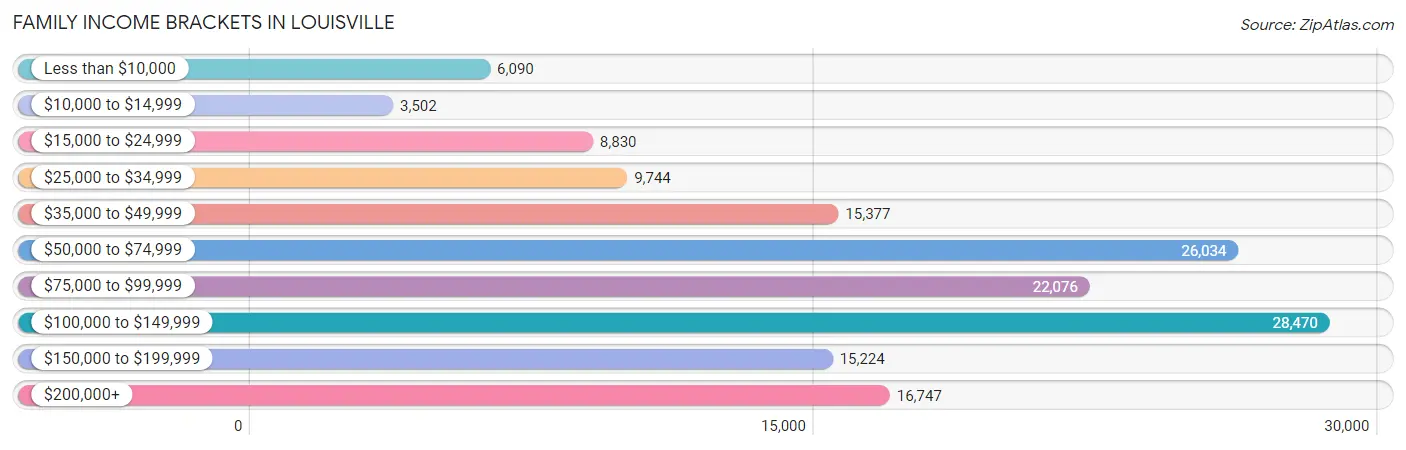
Family Income Brackets in Louisville
According to the Louisville family income data, there are 28,470 families falling into the $100,000 to $149,999 income range, which is the most common income bracket and makes up 18.7% of all families. Conversely, the $10,000 to $14,999 income bracket is the least frequent group with only 3,502 families (2.3%) belonging to this category.
| Income Bracket | # Families | % Families |
| Less than $10,000 | 6,090 | 4.0% |
| $10,000 to $14,999 | 3,502 | 2.3% |
| $15,000 to $24,999 | 8,830 | 5.8% |
| $25,000 to $34,999 | 9,744 | 6.4% |
| $35,000 to $49,999 | 15,377 | 10.1% |
| $50,000 to $74,999 | 26,034 | 17.1% |
| $75,000 to $99,999 | 22,076 | 14.5% |
| $100,000 to $149,999 | 28,470 | 18.7% |
| $150,000 to $199,999 | 15,224 | 10.0% |
| $200,000+ | 16,747 | 11.0% |
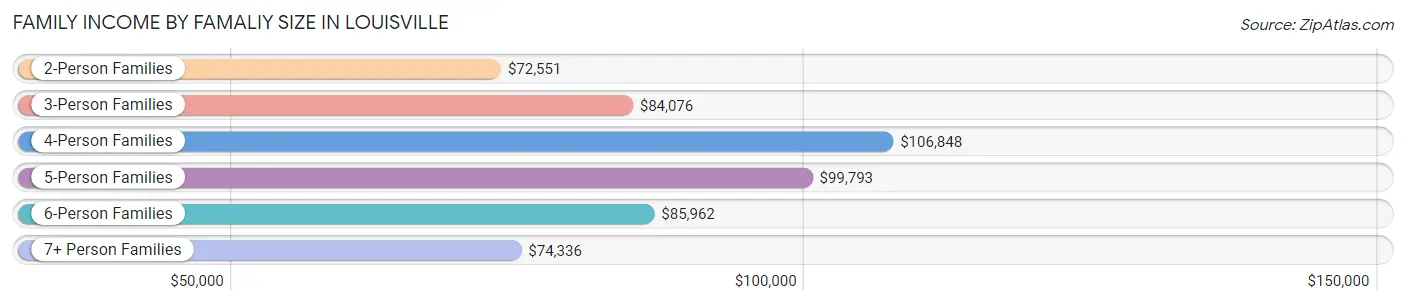
Family Income by Famaliy Size in Louisville
4-person families (25,353 | 16.7%) account for the highest median family income in Louisville with $106,848 per family, while 2-person families (75,989 | 49.9%) have the highest median income of $36,276 per family member.
| Income Bracket | # Families | Median Income |
| 2-Person Families | 75,989 (49.9%) | $72,551 |
| 3-Person Families | 35,334 (23.2%) | $84,076 |
| 4-Person Families | 25,353 (16.7%) | $106,848 |
| 5-Person Families | 10,700 (7.0%) | $99,793 |
| 6-Person Families | 3,150 (2.1%) | $85,962 |
| 7+ Person Families | 1,719 (1.1%) | $74,336 |
| Total | 152,245 (100.0%) | $81,196 |
Family Income by Number of Earners in Louisville
The median family income in Louisville is $81,196, with families comprising 3+ earners (15,773) having the highest median family income of $146,781, while families with no earners (21,178) have the lowest median family income of $44,277, accounting for 10.4% and 13.9% of families, respectively.

| Number of Earners | # Families | Median Income |
| No Earners | 21,178 (13.9%) | $44,277 |
| 1 Earner | 50,940 (33.5%) | $53,244 |
| 2 Earners | 64,354 (42.3%) | $107,712 |
| 3+ Earners | 15,773 (10.4%) | $146,781 |
| Total | 152,245 (100.0%) | $81,196 |
Household Income in Louisville
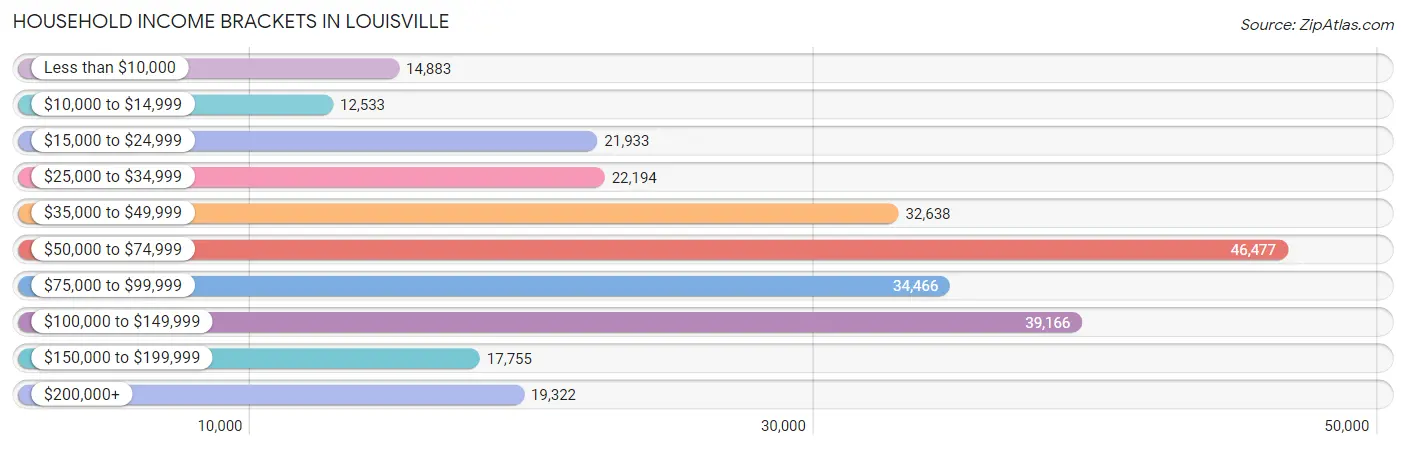
Household Income Brackets in Louisville
With 46,477 households falling in the category, the $50,000 to $74,999 income range is the most frequent in Louisville, accounting for 17.8% of all households. In contrast, only 12,533 households (4.8%) fall into the $10,000 to $14,999 income bracket, making it the least populous group.
| Income Bracket | # Households | % Households |
| Less than $10,000 | 14,883 | 5.7% |
| $10,000 to $14,999 | 12,533 | 4.8% |
| $15,000 to $24,999 | 21,933 | 8.4% |
| $25,000 to $34,999 | 22,194 | 8.5% |
| $35,000 to $49,999 | 32,638 | 12.5% |
| $50,000 to $74,999 | 46,477 | 17.8% |
| $75,000 to $99,999 | 34,466 | 13.2% |
| $100,000 to $149,999 | 39,166 | 15.0% |
| $150,000 to $199,999 | 17,755 | 6.8% |
| $200,000+ | 19,322 | 7.4% |
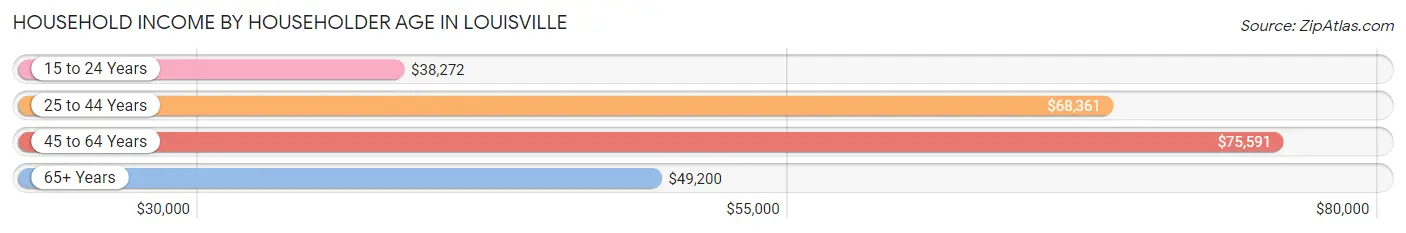
Household Income by Householder Age in Louisville
The median household income in Louisville is $63,114, with the highest median household income of $75,591 found in the 45 to 64 years age bracket for the primary householder. A total of 93,371 households (35.8%) fall into this category. Meanwhile, the 15 to 24 years age bracket for the primary householder has the lowest median household income of $38,272, with 11,390 households (4.4%) in this group.
| Income Bracket | # Households | Median Income |
| 15 to 24 Years | 11,390 (4.4%) | $38,272 |
| 25 to 44 Years | 89,922 (34.4%) | $68,361 |
| 45 to 64 Years | 93,371 (35.8%) | $75,591 |
| 65+ Years | 66,422 (25.4%) | $49,200 |
| Total | 261,105 (100.0%) | $63,114 |
Poverty in Louisville
Income Below Poverty by Sex and Age in Louisville
With 14.2% poverty level for males and 17.1% for females among the residents of Louisville, 5 year old males and 5 year old females are the most vulnerable to poverty, with 1,068 males (26.3%) and 1,201 females (30.2%) in their respective age groups living below the poverty level.
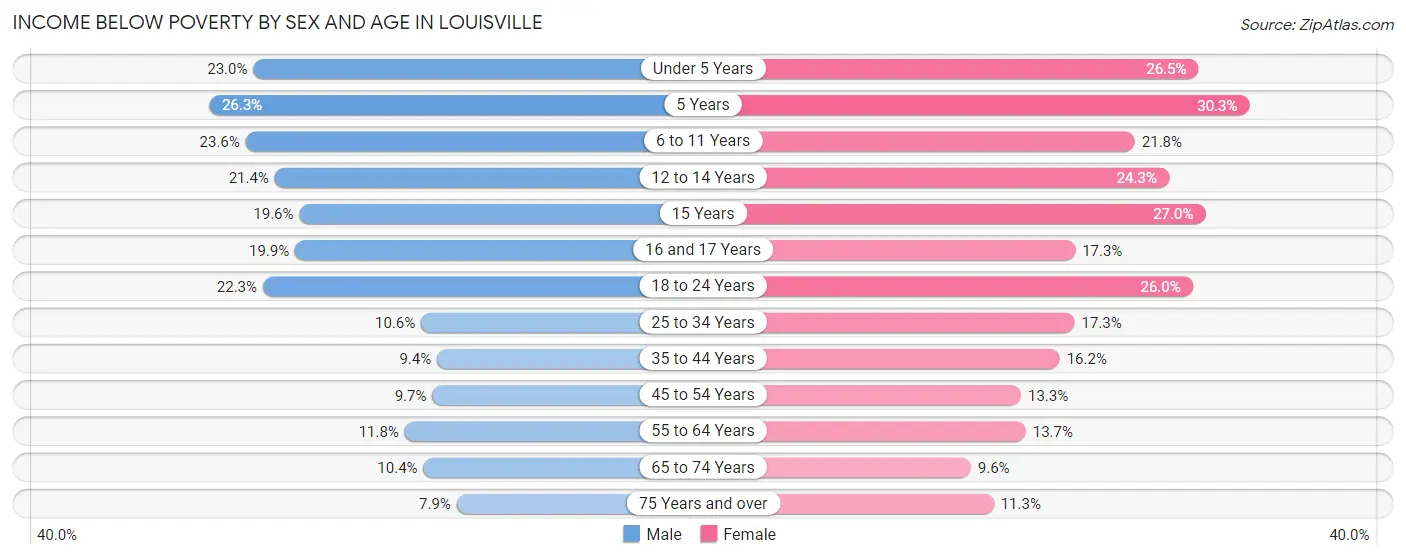
| Age Bracket | Male | Female |
| Under 5 Years | 4,407 (23.0%) | 4,882 (26.5%) |
| 5 Years | 1,068 (26.3%) | 1,201 (30.2%) |
| 6 to 11 Years | 5,558 (23.6%) | 4,454 (21.8%) |
| 12 to 14 Years | 2,432 (21.4%) | 2,921 (24.3%) |
| 15 Years | 823 (19.6%) | 986 (27.0%) |
| 16 and 17 Years | 1,511 (19.9%) | 1,383 (17.3%) |
| 18 to 24 Years | 6,014 (22.3%) | 6,817 (26.0%) |
| 25 to 34 Years | 4,769 (10.6%) | 7,949 (17.3%) |
| 35 to 44 Years | 3,731 (9.4%) | 6,573 (16.2%) |
| 45 to 54 Years | 3,589 (9.7%) | 5,137 (13.3%) |
| 55 to 64 Years | 4,645 (11.8%) | 5,835 (13.7%) |
| 65 to 74 Years | 2,886 (10.4%) | 3,052 (9.6%) |
| 75 Years and over | 1,146 (7.9%) | 2,557 (11.3%) |
| Total | 42,579 (14.2%) | 53,747 (17.1%) |
Income Above Poverty by Sex and Age in Louisville
According to the poverty statistics in Louisville, males aged 75 years and over and females aged 65 to 74 years are the age groups that are most secure financially, with 92.1% of males and 90.4% of females in these age groups living above the poverty line.
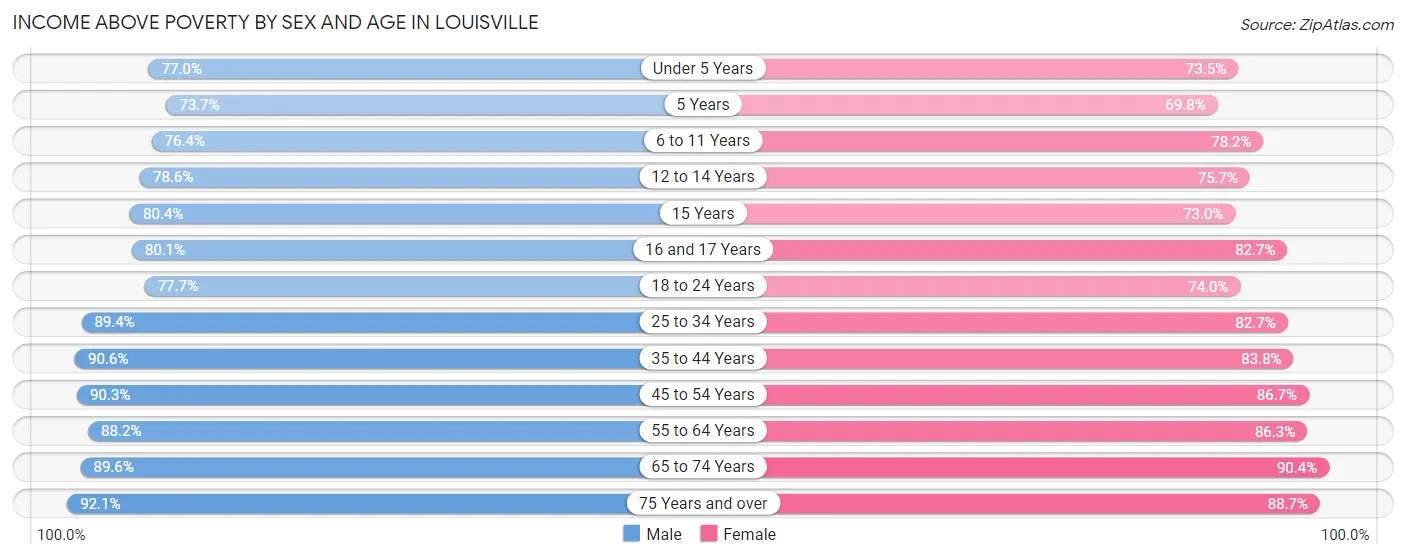
| Age Bracket | Male | Female |
| Under 5 Years | 14,737 (77.0%) | 13,562 (73.5%) |
| 5 Years | 2,991 (73.7%) | 2,769 (69.8%) |
| 6 to 11 Years | 17,998 (76.4%) | 16,017 (78.2%) |
| 12 to 14 Years | 8,915 (78.6%) | 9,116 (75.7%) |
| 15 Years | 3,375 (80.4%) | 2,669 (73.0%) |
| 16 and 17 Years | 6,074 (80.1%) | 6,598 (82.7%) |
| 18 to 24 Years | 20,938 (77.7%) | 19,365 (74.0%) |
| 25 to 34 Years | 40,406 (89.4%) | 38,043 (82.7%) |
| 35 to 44 Years | 36,064 (90.6%) | 34,063 (83.8%) |
| 45 to 54 Years | 33,287 (90.3%) | 33,466 (86.7%) |
| 55 to 64 Years | 34,796 (88.2%) | 36,884 (86.3%) |
| 65 to 74 Years | 24,887 (89.6%) | 28,801 (90.4%) |
| 75 Years and over | 13,329 (92.1%) | 20,111 (88.7%) |
| Total | 257,797 (85.8%) | 261,464 (83.0%) |
Income Below Poverty Among Married-Couple Families in Louisville
The poverty statistics for married-couple families in Louisville show that 4.3% or 4,250 of the total 99,531 families live below the poverty line. Families with 5 or more children have the highest poverty rate of 17.2%, comprising of 82 families. On the other hand, families with no children have the lowest poverty rate of 3.0%, which includes 1,828 families.
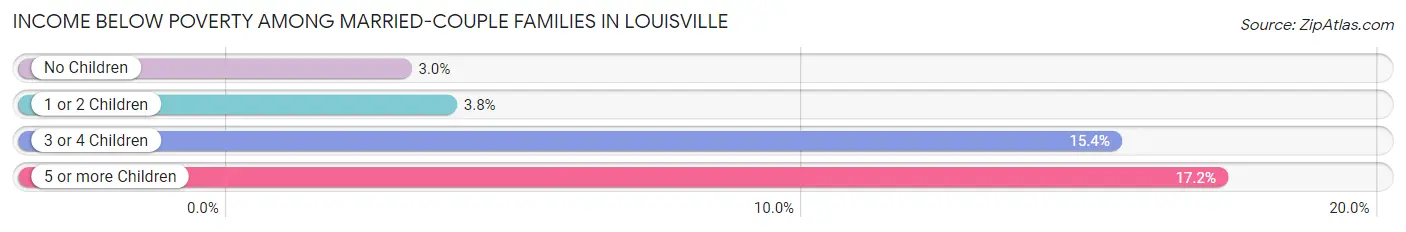
| Children | Above Poverty | Below Poverty |
| No Children | 58,694 (97.0%) | 1,828 (3.0%) |
| 1 or 2 Children | 29,820 (96.2%) | 1,182 (3.8%) |
| 3 or 4 Children | 6,373 (84.6%) | 1,158 (15.4%) |
| 5 or more Children | 394 (82.8%) | 82 (17.2%) |
| Total | 95,281 (95.7%) | 4,250 (4.3%) |
Income Below Poverty Among Single-Parent Households in Louisville
According to the poverty data in Louisville, 11.0% or 1,469 single-father households and 29.4% or 11,559 single-mother households are living below the poverty line. Among single-father households, those with 5 or more children have the highest poverty rate, with 44 households (43.1%) experiencing poverty. Likewise, among single-mother households, those with 5 or more children have the highest poverty rate, with 459 households (86.3%) falling below the poverty line.
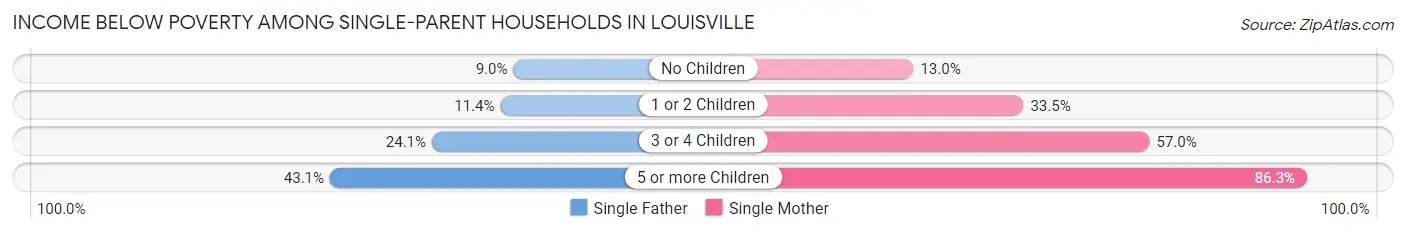
| Children | Single Father | Single Mother |
| No Children | 624 (9.0%) | 1,896 (13.0%) |
| 1 or 2 Children | 647 (11.4%) | 6,567 (33.5%) |
| 3 or 4 Children | 154 (24.1%) | 2,637 (57.0%) |
| 5 or more Children | 44 (43.1%) | 459 (86.3%) |
| Total | 1,469 (11.0%) | 11,559 (29.4%) |
Income Below Poverty Among Married-Couple vs Single-Parent Households in Louisville
The poverty data for Louisville shows that 4,250 of the married-couple family households (4.3%) and 13,028 of the single-parent households (24.7%) are living below the poverty level. Within the married-couple family households, those with 5 or more children have the highest poverty rate, with 82 households (17.2%) falling below the poverty line. Among the single-parent households, those with 5 or more children have the highest poverty rate, with 503 household (79.3%) living below poverty.
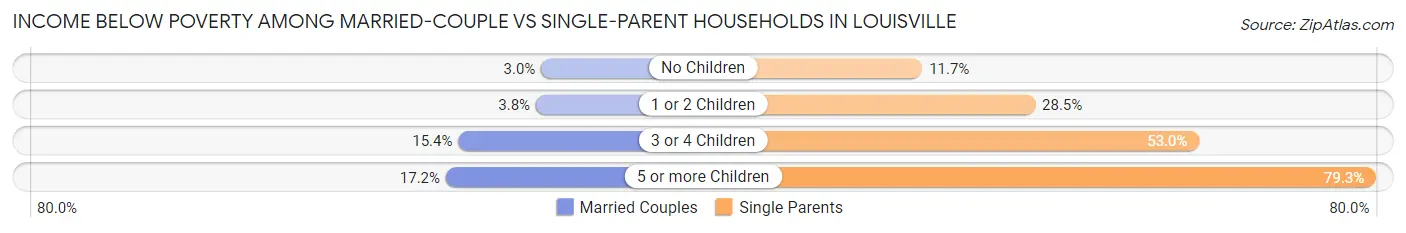
| Children | Married-Couple Families | Single-Parent Households |
| No Children | 1,828 (3.0%) | 2,520 (11.7%) |
| 1 or 2 Children | 1,182 (3.8%) | 7,214 (28.5%) |
| 3 or 4 Children | 1,158 (15.4%) | 2,791 (53.0%) |
| 5 or more Children | 82 (17.2%) | 503 (79.3%) |
| Total | 4,250 (4.3%) | 13,028 (24.7%) |
Race in Louisville
The most populous races in Louisville are White / Caucasian (411,703 | 65.4%), Black / African American (150,640 | 23.9%), and Hispanic or Latino (43,002 | 6.8%).
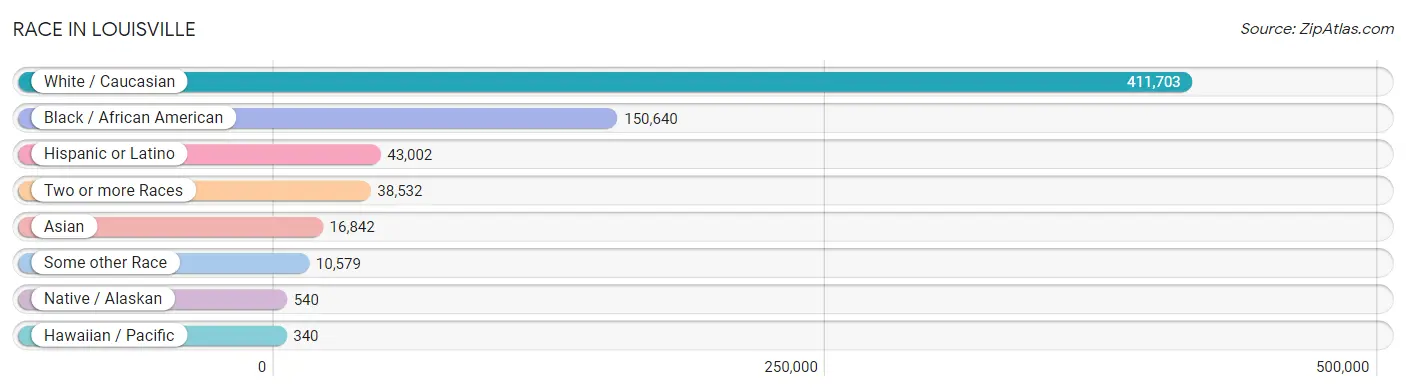
| Race | # Population | % Population |
| Asian | 16,842 | 2.7% |
| Black / African American | 150,640 | 23.9% |
| Hawaiian / Pacific | 340 | 0.1% |
| Hispanic or Latino | 43,002 | 6.8% |
| Native / Alaskan | 540 | 0.1% |
| White / Caucasian | 411,703 | 65.4% |
| Two or more Races | 38,532 | 6.1% |
| Some other Race | 10,579 | 1.7% |
| Total | 629,176 | 100.0% |
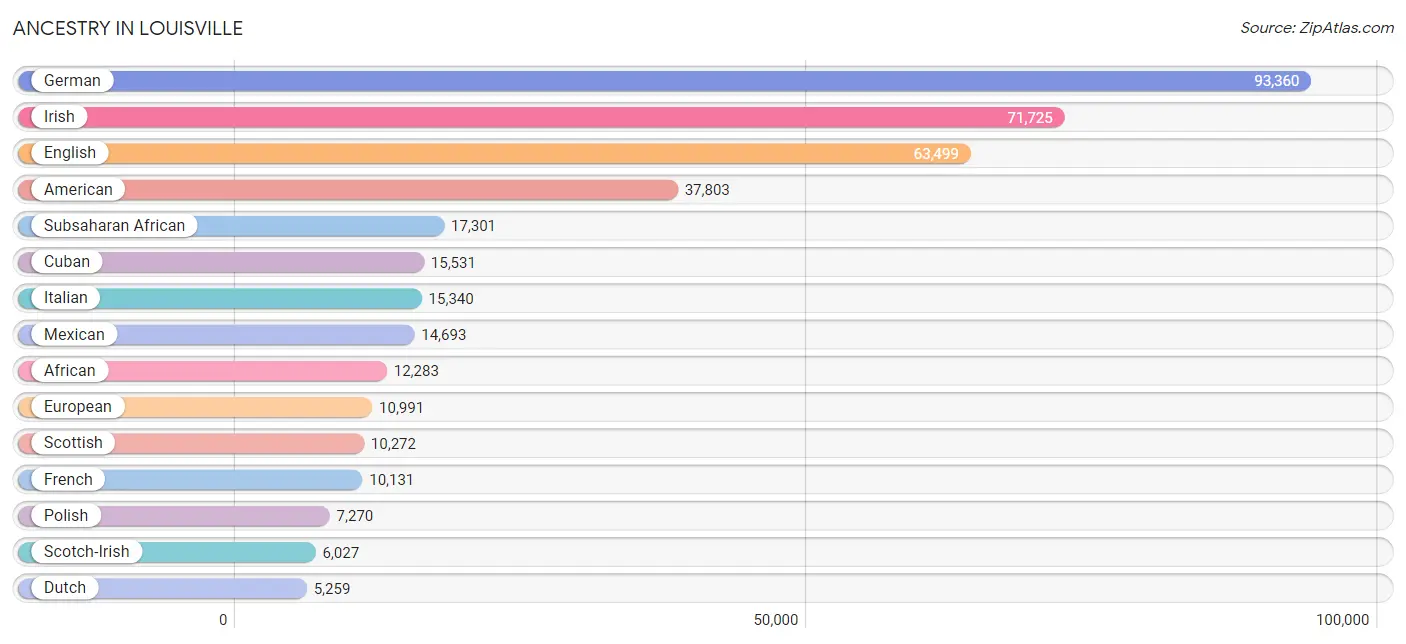
Ancestry in Louisville
The most populous ancestries reported in Louisville are German (93,360 | 14.8%), Irish (71,725 | 11.4%), English (63,499 | 10.1%), American (37,803 | 6.0%), and Subsaharan African (17,301 | 2.8%), together accounting for 45.1% of all Louisville residents.
| Ancestry | # Population | % Population |
| Afghan | 187 | 0.0% |
| African | 12,283 | 1.9% |
| Alaska Native | 23 | 0.0% |
| Albanian | 571 | 0.1% |
| Aleut | 5 | 0.0% |
| Alsatian | 62 | 0.0% |
| American | 37,803 | 6.0% |
| Arab | 5,204 | 0.8% |
| Argentinean | 328 | 0.1% |
| Armenian | 86 | 0.0% |
| Assyrian / Chaldean / Syriac | 23 | 0.0% |
| Australian | 86 | 0.0% |
| Austrian | 452 | 0.1% |
| Bangladeshi | 228 | 0.0% |
| Barbadian | 85 | 0.0% |
| Basque | 22 | 0.0% |
| Belgian | 297 | 0.1% |
| Belizean | 16 | 0.0% |
| Bermudan | 101 | 0.0% |
| Bhutanese | 1,025 | 0.2% |
| Blackfeet | 516 | 0.1% |
| Bolivian | 101 | 0.0% |
| Brazilian | 121 | 0.0% |
| British | 3,328 | 0.5% |
| British West Indian | 12 | 0.0% |
| Bulgarian | 66 | 0.0% |
| Burmese | 2,061 | 0.3% |
| Cajun | 29 | 0.0% |
| Cambodian | 47 | 0.0% |
| Canadian | 768 | 0.1% |
| Cape Verdean | 79 | 0.0% |
| Celtic | 56 | 0.0% |
| Central American | 5,253 | 0.8% |
| Central American Indian | 233 | 0.0% |
| Cherokee | 2,114 | 0.3% |
| Cheyenne | 16 | 0.0% |
| Chickasaw | 93 | 0.0% |
| Chilean | 264 | 0.0% |
| Chinese | 13 | 0.0% |
| Chippewa | 61 | 0.0% |
| Choctaw | 71 | 0.0% |
| Colombian | 650 | 0.1% |
| Costa Rican | 61 | 0.0% |
| Cree | 23 | 0.0% |
| Creek | 5 | 0.0% |
| Croatian | 556 | 0.1% |
| Crow | 17 | 0.0% |
| Cuban | 15,531 | 2.5% |
| Czech | 1,006 | 0.2% |
| Czechoslovakian | 215 | 0.0% |
| Danish | 498 | 0.1% |
| Delaware | 6 | 0.0% |
| Dominican | 268 | 0.0% |
| Dutch | 5,259 | 0.8% |
| Dutch West Indian | 5 | 0.0% |
| Eastern European | 1,117 | 0.2% |
| Ecuadorian | 115 | 0.0% |
| Egyptian | 93 | 0.0% |
| English | 63,499 | 10.1% |
| Ethiopian | 374 | 0.1% |
| European | 10,991 | 1.8% |
| Filipino | 145 | 0.0% |
| Finnish | 228 | 0.0% |
| French | 10,131 | 1.6% |
| French American Indian | 43 | 0.0% |
| French Canadian | 729 | 0.1% |
| German | 93,360 | 14.8% |
| Ghanaian | 68 | 0.0% |
| Greek | 428 | 0.1% |
| Guamanian / Chamorro | 69 | 0.0% |
| Guatemalan | 2,047 | 0.3% |
| Guyanese | 9 | 0.0% |
| Haitian | 778 | 0.1% |
| Honduran | 2,117 | 0.3% |
| Hopi | 23 | 0.0% |
| Hungarian | 908 | 0.1% |
| Icelander | 99 | 0.0% |
| Indian (Asian) | 2,433 | 0.4% |
| Indonesian | 1,337 | 0.2% |
| Inupiat | 27 | 0.0% |
| Iranian | 492 | 0.1% |
| Iraqi | 888 | 0.1% |
| Irish | 71,725 | 11.4% |
| Iroquois | 6 | 0.0% |
| Israeli | 164 | 0.0% |
| Italian | 15,340 | 2.4% |
| Jamaican | 334 | 0.1% |
| Japanese | 374 | 0.1% |
| Jordanian | 641 | 0.1% |
| Kenyan | 223 | 0.0% |
| Korean | 3,244 | 0.5% |
| Latvian | 124 | 0.0% |
| Lebanese | 659 | 0.1% |
| Liberian | 329 | 0.1% |
| Lithuanian | 700 | 0.1% |
| Lumbee | 3 | 0.0% |
| Luxembourger | 27 | 0.0% |
| Malaysian | 30 | 0.0% |
| Maltese | 15 | 0.0% |
| Menominee | 8 | 0.0% |
| Mexican | 14,693 | 2.3% |
| Mexican American Indian | 177 | 0.0% |
| Mongolian | 44 | 0.0% |
| Moroccan | 541 | 0.1% |
| Native Hawaiian | 269 | 0.0% |
| Navajo | 25 | 0.0% |
| New Zealander | 9 | 0.0% |
| Nicaraguan | 187 | 0.0% |
| Nigerian | 488 | 0.1% |
| Northern European | 541 | 0.1% |
| Norwegian | 2,234 | 0.4% |
| Osage | 30 | 0.0% |
| Pakistani | 438 | 0.1% |
| Palestinian | 207 | 0.0% |
| Panamanian | 536 | 0.1% |
| Paraguayan | 11 | 0.0% |
| Pennsylvania German | 7 | 0.0% |
| Peruvian | 754 | 0.1% |
| Polish | 7,270 | 1.2% |
| Portuguese | 1,000 | 0.2% |
| Pueblo | 5 | 0.0% |
| Puerto Rican | 2,636 | 0.4% |
| Romanian | 236 | 0.0% |
| Russian | 2,368 | 0.4% |
| Salvadoran | 305 | 0.1% |
| Samoan | 56 | 0.0% |
| Scandinavian | 1,307 | 0.2% |
| Scotch-Irish | 6,027 | 1.0% |
| Scottish | 10,272 | 1.6% |
| Seminole | 6 | 0.0% |
| Senegalese | 141 | 0.0% |
| Serbian | 239 | 0.0% |
| Shoshone | 17 | 0.0% |
| Sioux | 77 | 0.0% |
| Slavic | 405 | 0.1% |
| Slovak | 660 | 0.1% |
| Slovene | 78 | 0.0% |
| Somali | 1,289 | 0.2% |
| South African | 95 | 0.0% |
| South American | 2,528 | 0.4% |
| Soviet Union | 16 | 0.0% |
| Spaniard | 369 | 0.1% |
| Spanish | 655 | 0.1% |
| Sri Lankan | 2,919 | 0.5% |
| Subsaharan African | 17,301 | 2.8% |
| Sudanese | 267 | 0.0% |
| Swedish | 3,188 | 0.5% |
| Swiss | 1,976 | 0.3% |
| Syrian | 134 | 0.0% |
| Taiwanese | 38 | 0.0% |
| Thai | 4,675 | 0.7% |
| Tohono O'Odham | 9 | 0.0% |
| Tongan | 4 | 0.0% |
| Trinidadian and Tobagonian | 191 | 0.0% |
| Turkish | 339 | 0.1% |
| U.S. Virgin Islander | 48 | 0.0% |
| Ugandan | 33 | 0.0% |
| Ukrainian | 430 | 0.1% |
| Uruguayan | 10 | 0.0% |
| Venezuelan | 271 | 0.0% |
| Welsh | 3,761 | 0.6% |
| West Indian | 70 | 0.0% |
| Yugoslavian | 1,484 | 0.2% | View All 163 Rows |
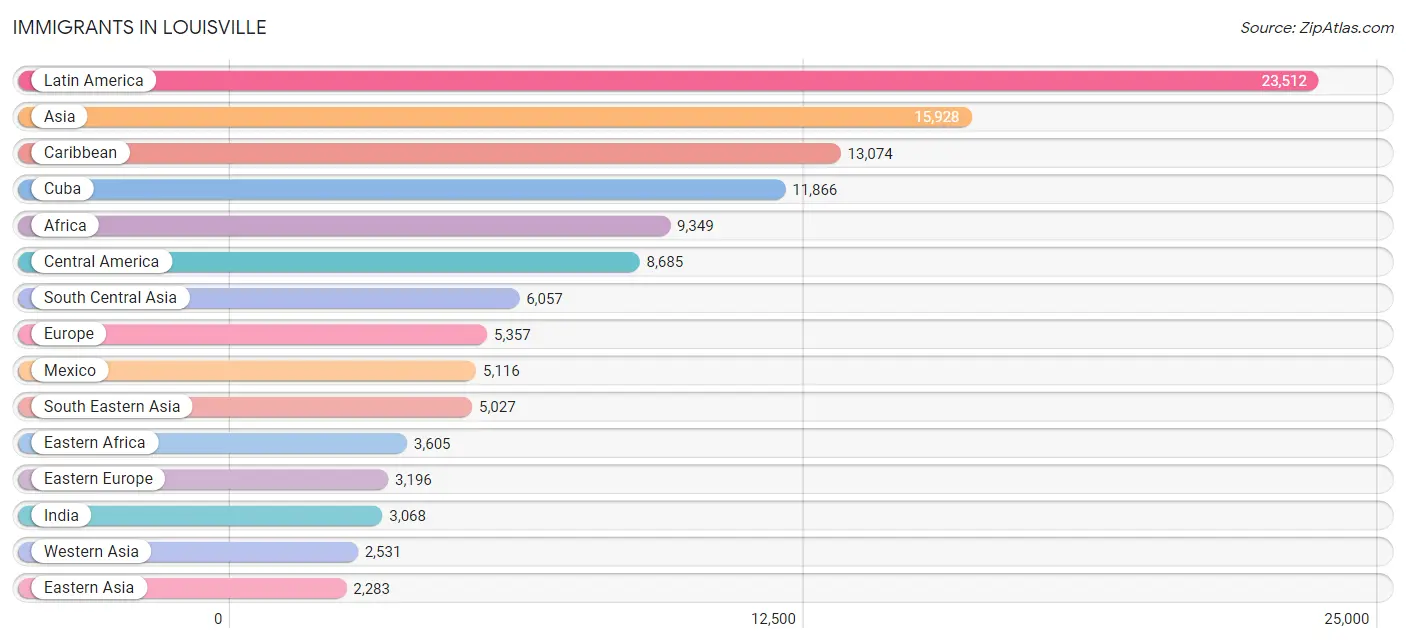
Immigrants in Louisville
The most numerous immigrant groups reported in Louisville came from Latin America (23,512 | 3.7%), Asia (15,928 | 2.5%), Caribbean (13,074 | 2.1%), Cuba (11,866 | 1.9%), and Africa (9,349 | 1.5%), together accounting for 11.7% of all Louisville residents.
| Immigration Origin | # Population | % Population |
| Afghanistan | 172 | 0.0% |
| Africa | 9,349 | 1.5% |
| Albania | 113 | 0.0% |
| Argentina | 138 | 0.0% |
| Asia | 15,928 | 2.5% |
| Australia | 10 | 0.0% |
| Austria | 91 | 0.0% |
| Bangladesh | 35 | 0.0% |
| Barbados | 34 | 0.0% |
| Belarus | 190 | 0.0% |
| Belgium | 18 | 0.0% |
| Belize | 16 | 0.0% |
| Bolivia | 83 | 0.0% |
| Bosnia and Herzegovina | 1,201 | 0.2% |
| Brazil | 123 | 0.0% |
| Bulgaria | 16 | 0.0% |
| Cambodia | 103 | 0.0% |
| Cameroon | 22 | 0.0% |
| Canada | 907 | 0.1% |
| Caribbean | 13,074 | 2.1% |
| Central America | 8,685 | 1.4% |
| Chile | 137 | 0.0% |
| China | 1,121 | 0.2% |
| Colombia | 395 | 0.1% |
| Congo | 910 | 0.1% |
| Costa Rica | 61 | 0.0% |
| Croatia | 157 | 0.0% |
| Cuba | 11,866 | 1.9% |
| Czechoslovakia | 21 | 0.0% |
| Denmark | 17 | 0.0% |
| Dominican Republic | 37 | 0.0% |
| Eastern Africa | 3,605 | 0.6% |
| Eastern Asia | 2,283 | 0.4% |
| Eastern Europe | 3,196 | 0.5% |
| Ecuador | 21 | 0.0% |
| Egypt | 42 | 0.0% |
| El Salvador | 173 | 0.0% |
| England | 233 | 0.0% |
| Eritrea | 153 | 0.0% |
| Ethiopia | 733 | 0.1% |
| Europe | 5,357 | 0.9% |
| Fiji | 9 | 0.0% |
| France | 172 | 0.0% |
| Germany | 973 | 0.2% |
| Ghana | 172 | 0.0% |
| Guatemala | 1,530 | 0.2% |
| Guyana | 181 | 0.0% |
| Haiti | 628 | 0.1% |
| Honduras | 1,557 | 0.3% |
| Hong Kong | 113 | 0.0% |
| Hungary | 27 | 0.0% |
| India | 3,068 | 0.5% |
| Indonesia | 1 | 0.0% |
| Iran | 286 | 0.1% |
| Iraq | 1,414 | 0.2% |
| Ireland | 58 | 0.0% |
| Israel | 32 | 0.0% |
| Italy | 57 | 0.0% |
| Jamaica | 391 | 0.1% |
| Japan | 282 | 0.0% |
| Jordan | 626 | 0.1% |
| Kazakhstan | 33 | 0.0% |
| Kenya | 571 | 0.1% |
| Korea | 814 | 0.1% |
| Kuwait | 86 | 0.0% |
| Laos | 193 | 0.0% |
| Latin America | 23,512 | 3.7% |
| Latvia | 8 | 0.0% |
| Lebanon | 7 | 0.0% |
| Liberia | 461 | 0.1% |
| Lithuania | 29 | 0.0% |
| Malaysia | 106 | 0.0% |
| Mexico | 5,116 | 0.8% |
| Micronesia | 27 | 0.0% |
| Middle Africa | 2,119 | 0.3% |
| Moldova | 93 | 0.0% |
| Morocco | 370 | 0.1% |
| Nepal | 502 | 0.1% |
| Netherlands | 48 | 0.0% |
| Nicaragua | 120 | 0.0% |
| Nigeria | 291 | 0.1% |
| Northern Africa | 1,052 | 0.2% |
| Northern Europe | 693 | 0.1% |
| Norway | 13 | 0.0% |
| Oceania | 82 | 0.0% |
| Pakistan | 355 | 0.1% |
| Panama | 112 | 0.0% |
| Peru | 374 | 0.1% |
| Philippines | 1,414 | 0.2% |
| Poland | 124 | 0.0% |
| Portugal | 40 | 0.0% |
| Russia | 436 | 0.1% |
| Saudi Arabia | 41 | 0.0% |
| Scotland | 110 | 0.0% |
| Senegal | 52 | 0.0% |
| Serbia | 164 | 0.0% |
| Singapore | 24 | 0.0% |
| Somalia | 1,361 | 0.2% |
| South Africa | 216 | 0.0% |
| South America | 1,753 | 0.3% |
| South Central Asia | 6,057 | 1.0% |
| South Eastern Asia | 5,027 | 0.8% |
| Southern Europe | 166 | 0.0% |
| Spain | 69 | 0.0% |
| Sri Lanka | 161 | 0.0% |
| Sudan | 161 | 0.0% |
| Sweden | 16 | 0.0% |
| Syria | 103 | 0.0% |
| Taiwan | 136 | 0.0% |
| Thailand | 712 | 0.1% |
| Trinidad and Tobago | 118 | 0.0% |
| Turkey | 39 | 0.0% |
| Uganda | 64 | 0.0% |
| Ukraine | 176 | 0.0% |
| Uruguay | 10 | 0.0% |
| Uzbekistan | 419 | 0.1% |
| Venezuela | 266 | 0.0% |
| Vietnam | 1,864 | 0.3% |
| Western Africa | 1,481 | 0.2% |
| Western Asia | 2,531 | 0.4% |
| Western Europe | 1,302 | 0.2% |
| Zaire | 952 | 0.2% | View All 122 Rows |
Sex and Age in Louisville
Sex and Age in Louisville
The most populous age groups in Louisville are 25 to 29 Years (23,636 | 7.7%) for men and 30 to 34 Years (23,185 | 7.2%) for women.
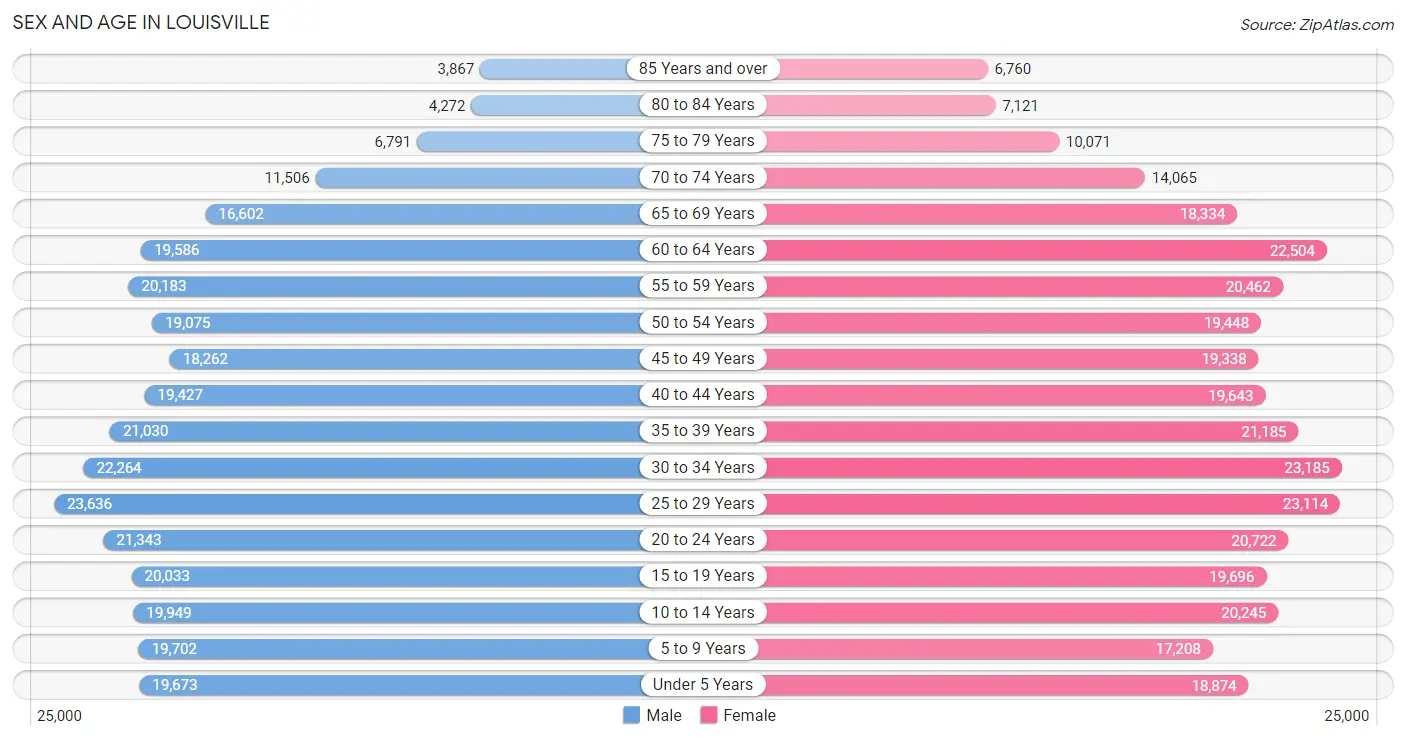
| Age Bracket | Male | Female |
| Under 5 Years | 19,673 (6.4%) | 18,874 (5.9%) |
| 5 to 9 Years | 19,702 (6.4%) | 17,208 (5.3%) |
| 10 to 14 Years | 19,949 (6.5%) | 20,245 (6.3%) |
| 15 to 19 Years | 20,033 (6.5%) | 19,696 (6.1%) |
| 20 to 24 Years | 21,343 (7.0%) | 20,722 (6.4%) |
| 25 to 29 Years | 23,636 (7.7%) | 23,114 (7.2%) |
| 30 to 34 Years | 22,264 (7.2%) | 23,185 (7.2%) |
| 35 to 39 Years | 21,030 (6.9%) | 21,185 (6.6%) |
| 40 to 44 Years | 19,427 (6.3%) | 19,643 (6.1%) |
| 45 to 49 Years | 18,262 (5.9%) | 19,338 (6.0%) |
| 50 to 54 Years | 19,075 (6.2%) | 19,448 (6.0%) |
| 55 to 59 Years | 20,183 (6.6%) | 20,462 (6.4%) |
| 60 to 64 Years | 19,586 (6.4%) | 22,504 (7.0%) |
| 65 to 69 Years | 16,602 (5.4%) | 18,334 (5.7%) |
| 70 to 74 Years | 11,506 (3.7%) | 14,065 (4.4%) |
| 75 to 79 Years | 6,791 (2.2%) | 10,071 (3.1%) |
| 80 to 84 Years | 4,272 (1.4%) | 7,121 (2.2%) |
| 85 Years and over | 3,867 (1.3%) | 6,760 (2.1%) |
| Total | 307,201 (100.0%) | 321,975 (100.0%) |
Families and Households in Louisville
Median Family Size in Louisville
The median family size in Louisville is 3.06 persons per family, with married-couple families (99,531 | 65.4%) accounting for the largest median family size of 3.08 persons per family. On the other hand, single male/father families (13,364 | 8.8%) represent the smallest median family size with 2.83 persons per family.
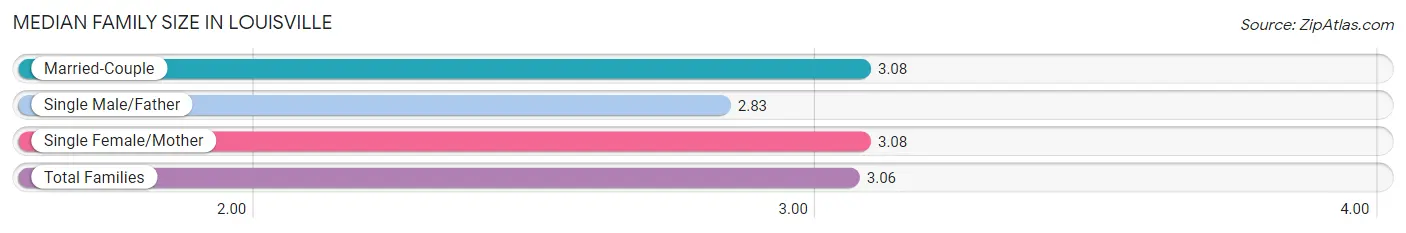
| Family Type | # Families | Family Size |
| Married-Couple | 99,531 (65.4%) | 3.08 |
| Single Male/Father | 13,364 (8.8%) | 2.83 |
| Single Female/Mother | 39,350 (25.9%) | 3.08 |
| Total Families | 152,245 (100.0%) | 3.06 |
Median Household Size in Louisville
The median household size in Louisville is 2.36 persons per household, with single female/mother households (39,350 | 15.1%) accounting for the largest median household size of 3.28 persons per household. non-family households (108,860 | 41.7%) represent the smallest median household size with 1.24 persons per household.
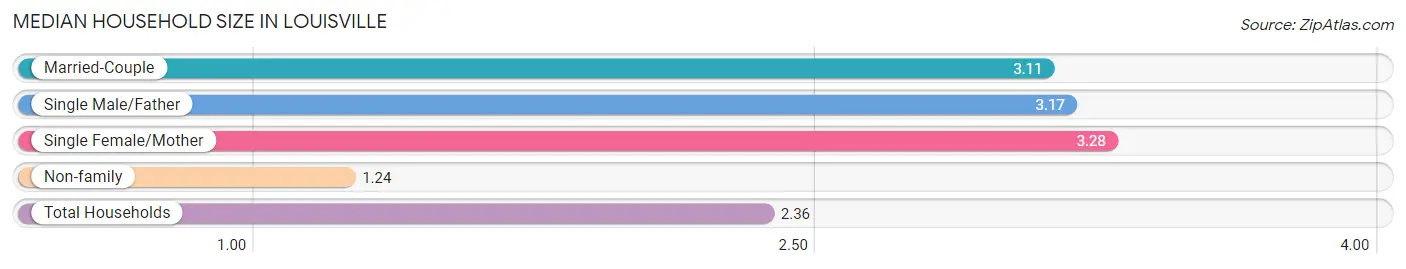
| Household Type | # Households | Household Size |
| Married-Couple | 99,531 (38.1%) | 3.11 |
| Single Male/Father | 13,364 (5.1%) | 3.17 |
| Single Female/Mother | 39,350 (15.1%) | 3.28 |
| Non-family | 108,860 (41.7%) | 1.24 |
| Total Households | 261,105 (100.0%) | 2.36 |
Household Size by Marriage Status in Louisville
Out of a total of 261,105 households in Louisville, 152,245 (58.3%) are family households, while 108,860 (41.7%) are nonfamily households. The most numerous type of family households are 2-person households, comprising 69,856, and the most common type of nonfamily households are 1-person households, comprising 89,032.
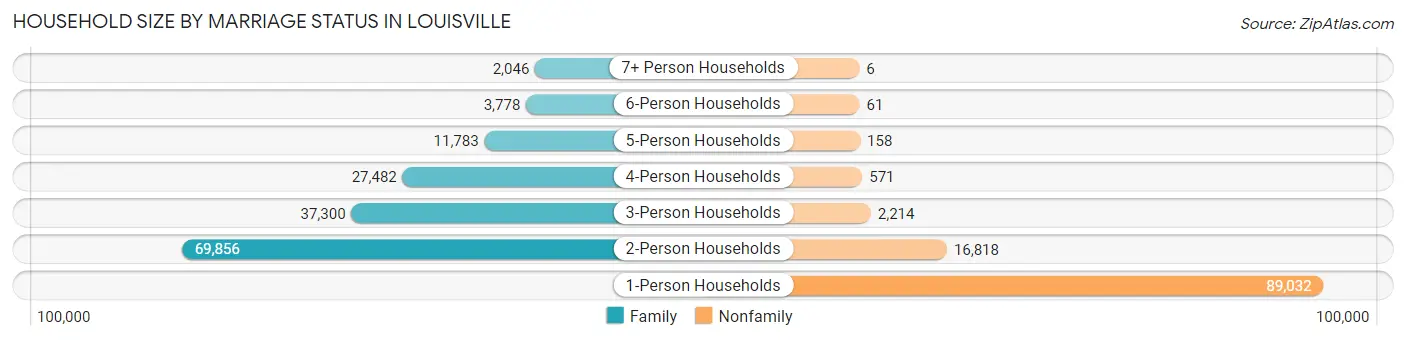
| Household Size | Family Households | Nonfamily Households |
| 1-Person Households | - | 89,032 (34.1%) |
| 2-Person Households | 69,856 (26.8%) | 16,818 (6.4%) |
| 3-Person Households | 37,300 (14.3%) | 2,214 (0.9%) |
| 4-Person Households | 27,482 (10.5%) | 571 (0.2%) |
| 5-Person Households | 11,783 (4.5%) | 158 (0.1%) |
| 6-Person Households | 3,778 (1.5%) | 61 (0.0%) |
| 7+ Person Households | 2,046 (0.8%) | 6 (0.0%) |
| Total | 152,245 (58.3%) | 108,860 (41.7%) |
Female Fertility in Louisville
Fertility by Age in Louisville
Average fertility rate in Louisville is 54.0 births per 1,000 women. Women in the age bracket of 20 to 34 years have the highest fertility rate with 95.0 births per 1,000 women. Women in the age bracket of 20 to 34 years acount for 78.3% of all women with births.
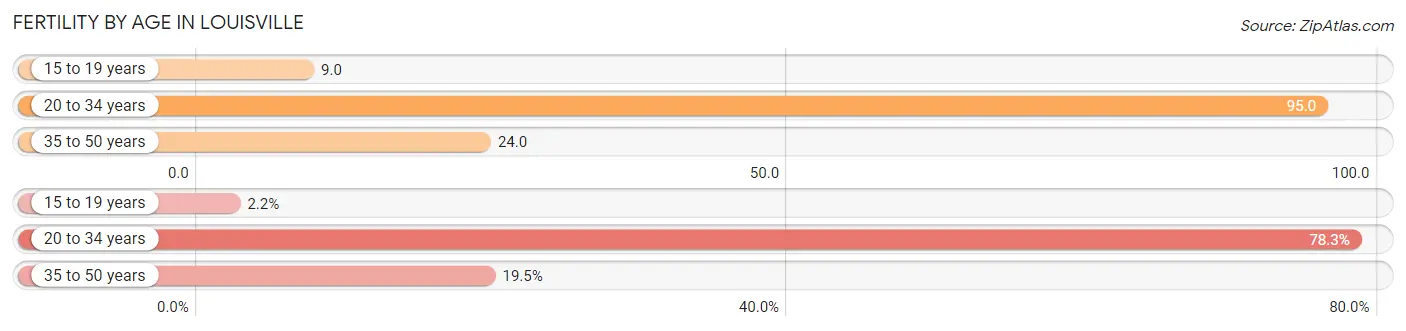
| Age Bracket | Women with Births | Births / 1,000 Women |
| 15 to 19 years | 179 (2.2%) | 9.0 |
| 20 to 34 years | 6,355 (78.3%) | 95.0 |
| 35 to 50 years | 1,584 (19.5%) | 24.0 |
| Total | 8,118 (100.0%) | 54.0 |
Fertility by Age by Marriage Status in Louisville
56.5% of women with births (8,118) in Louisville are married. The highest percentage of unmarried women with births falls into 15 to 19 years age bracket with 79.9% of them unmarried at the time of birth, while the lowest percentage of unmarried women with births belong to 35 to 50 years age bracket with 26.3% of them unmarried.
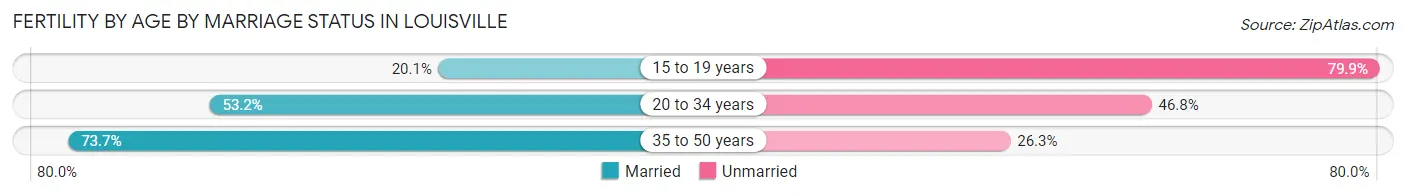
| Age Bracket | Married | Unmarried |
| 15 to 19 years | 36 (20.1%) | 143 (79.9%) |
| 20 to 34 years | 3,381 (53.2%) | 2,974 (46.8%) |
| 35 to 50 years | 1,167 (73.7%) | 417 (26.3%) |
| Total | 4,587 (56.5%) | 3,531 (43.5%) |
Fertility by Education in Louisville
Average fertility rate in Louisville is 54.0 births per 1,000 women. Women with the education attainment of graduate degree have the highest fertility rate of 68.0 births per 1,000 women, while women with the education attainment of less than high school have the lowest fertility at 40.0 births per 1,000 women. Women with the education attainment of college or associate's degree represent 27.2% of all women with births.
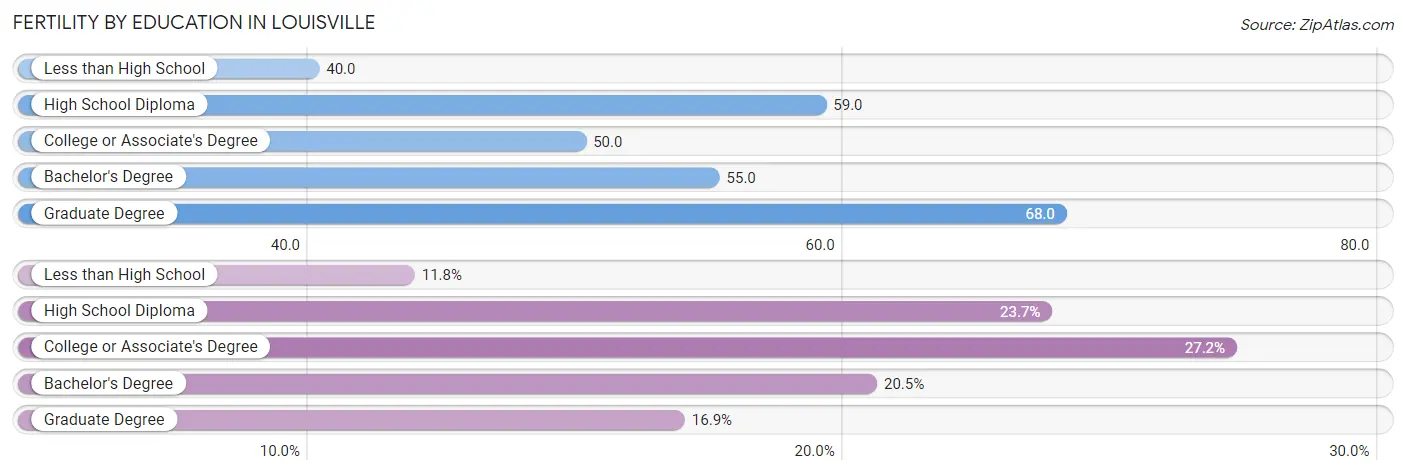
| Educational Attainment | Women with Births | Births / 1,000 Women |
| Less than High School | 957 (11.8%) | 40.0 |
| High School Diploma | 1,926 (23.7%) | 59.0 |
| College or Associate's Degree | 2,207 (27.2%) | 50.0 |
| Bachelor's Degree | 1,660 (20.4%) | 55.0 |
| Graduate Degree | 1,368 (16.9%) | 68.0 |
| Total | 8,118 (100.0%) | 54.0 |
Fertility by Education by Marriage Status in Louisville
43.5% of women with births in Louisville are unmarried. Women with the educational attainment of graduate degree are most likely to be married with 88.1% of them married at childbirth, while women with the educational attainment of less than high school are least likely to be married with 68.1% of them unmarried at childbirth.
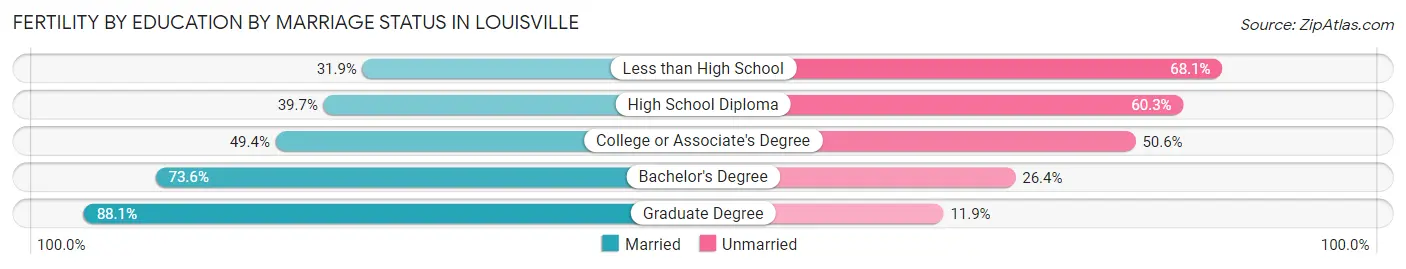
| Educational Attainment | Married | Unmarried |
| Less than High School | 305 (31.9%) | 652 (68.1%) |
| High School Diploma | 765 (39.7%) | 1,161 (60.3%) |
| College or Associate's Degree | 1,090 (49.4%) | 1,117 (50.6%) |
| Bachelor's Degree | 1,222 (73.6%) | 438 (26.4%) |
| Graduate Degree | 1,205 (88.1%) | 163 (11.9%) |
| Total | 4,587 (56.5%) | 3,531 (43.5%) |
Employment Characteristics in Louisville
Employment by Class of Employer in Louisville
Among the 308,061 employed individuals in Louisville, private company employees (223,093 | 72.4%), not-for-profit organizations (27,290 | 8.9%), and local government employees (16,638 | 5.4%) make up the most common classes of employment.
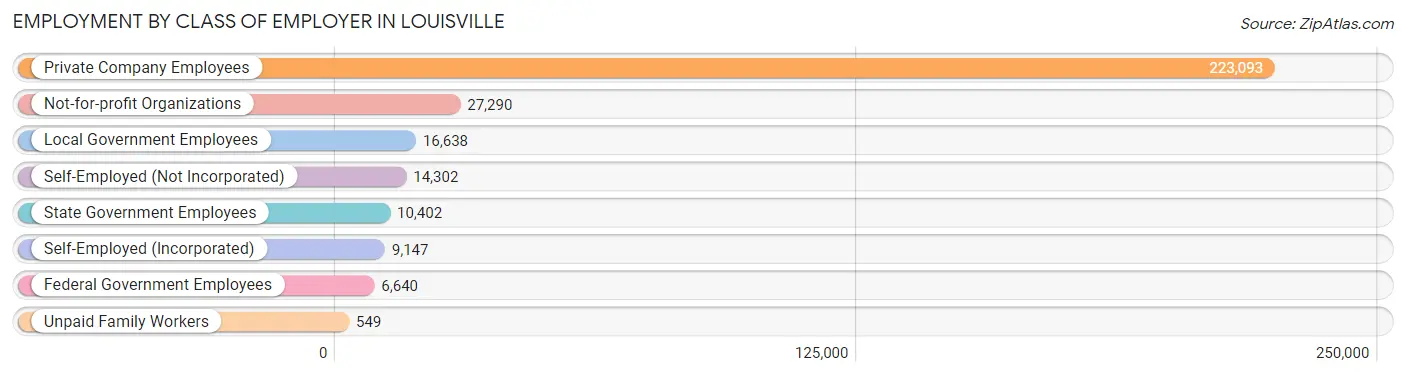
| Employer Class | # Employees | % Employees |
| Private Company Employees | 223,093 | 72.4% |
| Self-Employed (Incorporated) | 9,147 | 3.0% |
| Self-Employed (Not Incorporated) | 14,302 | 4.6% |
| Not-for-profit Organizations | 27,290 | 8.9% |
| Local Government Employees | 16,638 | 5.4% |
| State Government Employees | 10,402 | 3.4% |
| Federal Government Employees | 6,640 | 2.2% |
| Unpaid Family Workers | 549 | 0.2% |
| Total | 308,061 | 100.0% |
Employment Status by Age in Louisville
According to the labor force statistics for Louisville, out of the total population over 16 years of age (505,633), 65.8% or 332,707 individuals are in the labor force, with 5.3% or 17,633 of them unemployed. The age group with the highest labor force participation rate is 25 to 29 years, with 86.0% or 40,205 individuals in the labor force. Within the labor force, the 16 to 19 years age range has the highest percentage of unemployed individuals, with 11.4% or 1,728 of them being unemployed.
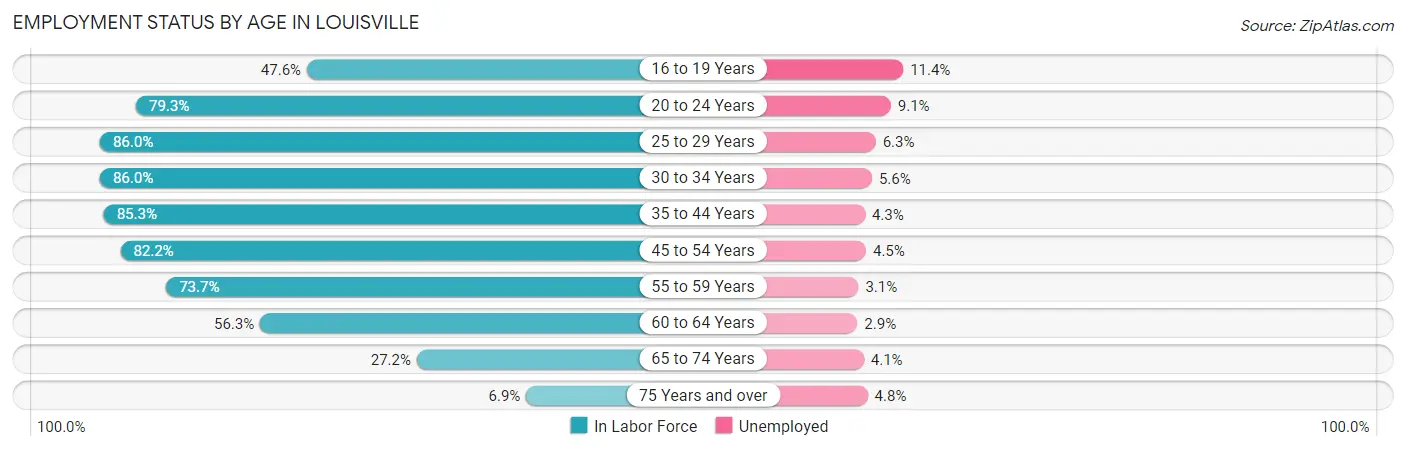
| Age Bracket | In Labor Force | Unemployed |
| 16 to 19 Years | 15,154 (47.6%) | 1,728 (11.4%) |
| 20 to 24 Years | 33,358 (79.3%) | 3,036 (9.1%) |
| 25 to 29 Years | 40,205 (86.0%) | 2,533 (6.3%) |
| 30 to 34 Years | 39,086 (86.0%) | 2,189 (5.6%) |
| 35 to 44 Years | 69,336 (85.3%) | 2,981 (4.3%) |
| 45 to 54 Years | 62,573 (82.2%) | 2,816 (4.5%) |
| 55 to 59 Years | 29,955 (73.7%) | 929 (3.1%) |
| 60 to 64 Years | 23,697 (56.3%) | 687 (2.9%) |
| 65 to 74 Years | 16,458 (27.2%) | 675 (4.1%) |
| 75 Years and over | 2,683 (6.9%) | 129 (4.8%) |
| Total | 332,707 (65.8%) | 17,633 (5.3%) |
Employment Status by Educational Attainment in Louisville
According to labor force statistics for Louisville, 79.7% of individuals (264,877) out of the total population between 25 and 64 years of age (332,342) are in the labor force, with 4.6% or 12,184 of them being unemployed. The group with the highest labor force participation rate are those with the educational attainment of bachelor's degree or higher, with 89.2% or 102,971 individuals in the labor force. Within the labor force, individuals with less than high school education have the highest percentage of unemployment, with 8.2% or 1,433 of them being unemployed.
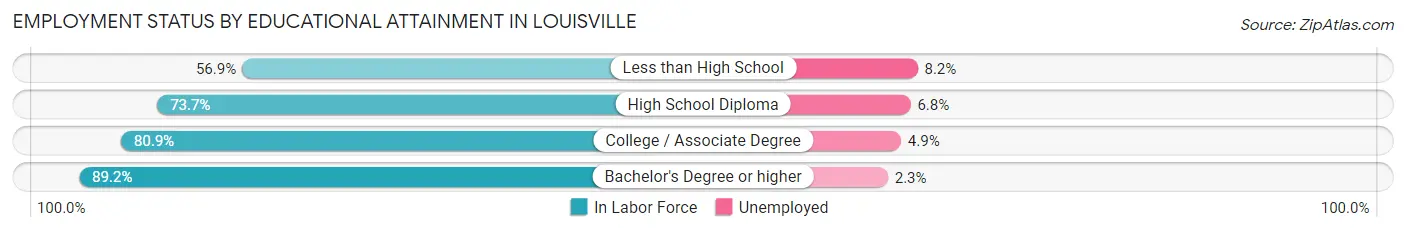
| Educational Attainment | In Labor Force | Unemployed |
| Less than High School | 17,471 (56.9%) | 2,518 (8.2%) |
| High School Diploma | 63,386 (73.7%) | 5,848 (6.8%) |
| College / Associate Degree | 81,058 (80.9%) | 4,910 (4.9%) |
| Bachelor's Degree or higher | 102,971 (89.2%) | 2,655 (2.3%) |
| Total | 264,877 (79.7%) | 15,288 (4.6%) |
Employment Occupations by Sex in Louisville
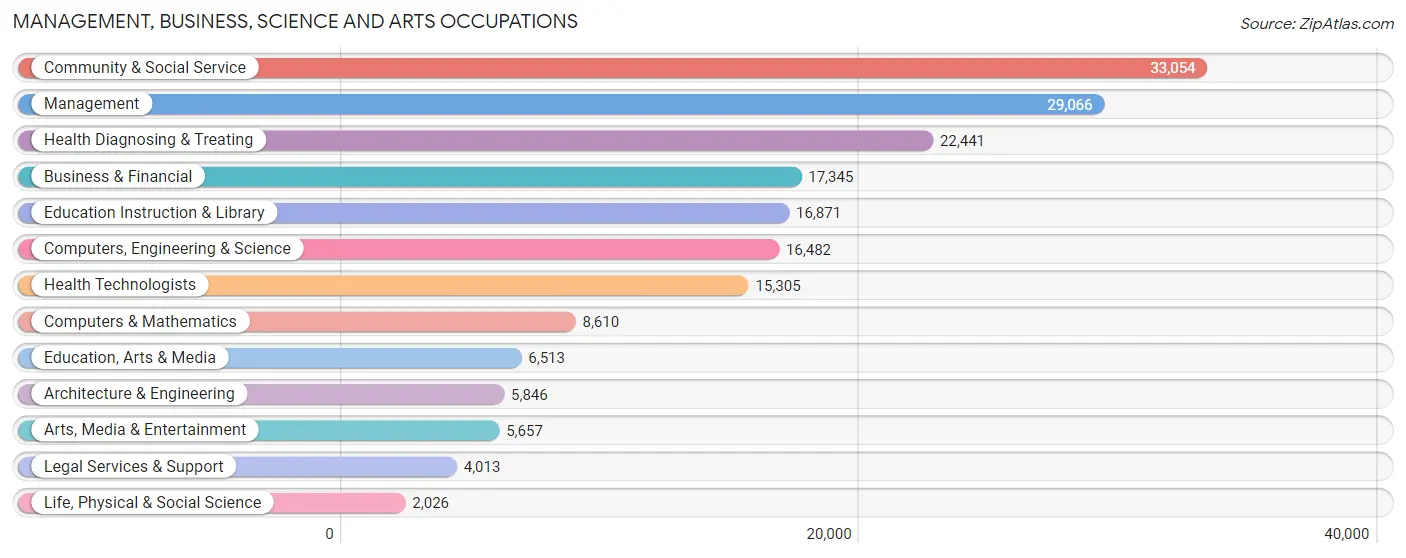
Management, Business, Science and Arts Occupations
The most common Management, Business, Science and Arts occupations in Louisville are Community & Social Service (33,054 | 10.5%), Management (29,066 | 9.2%), Health Diagnosing & Treating (22,441 | 7.1%), Business & Financial (17,345 | 5.5%), and Education Instruction & Library (16,871 | 5.4%).
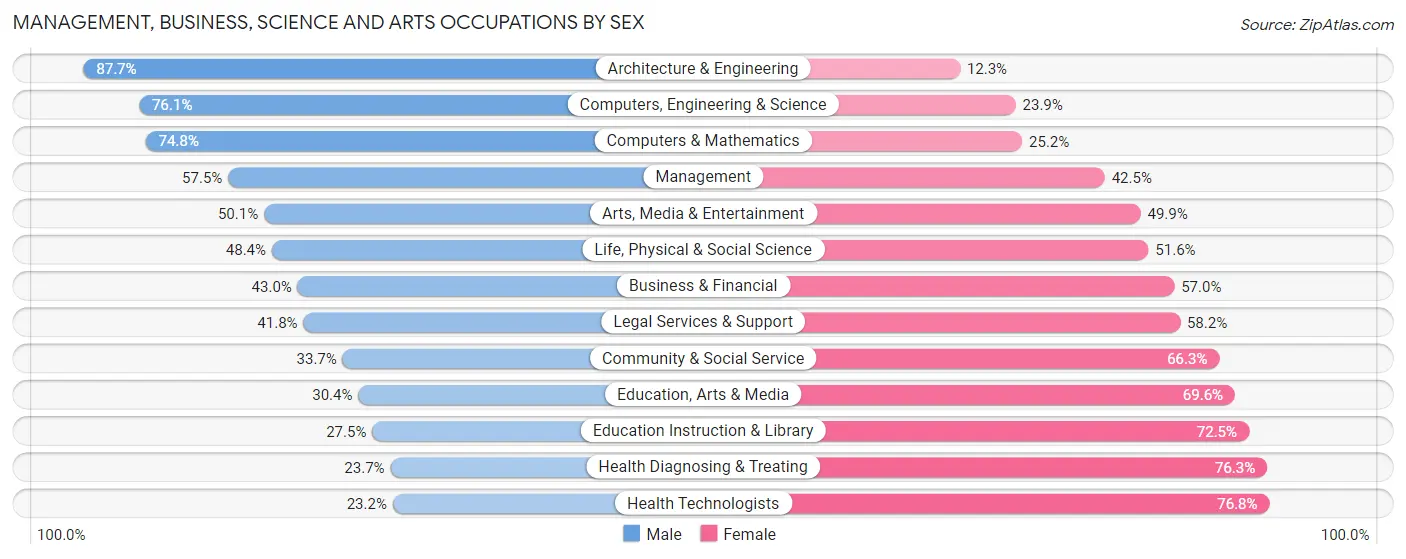
Management, Business, Science and Arts Occupations by Sex
Within the Management, Business, Science and Arts occupations in Louisville, the most male-oriented occupations are Architecture & Engineering (87.7%), Computers, Engineering & Science (76.1%), and Computers & Mathematics (74.8%), while the most female-oriented occupations are Health Technologists (76.8%), Health Diagnosing & Treating (76.3%), and Education Instruction & Library (72.5%).
| Occupation | Male | Female |
| Management | 16,726 (57.5%) | 12,340 (42.5%) |
| Business & Financial | 7,465 (43.0%) | 9,880 (57.0%) |
| Computers, Engineering & Science | 12,548 (76.1%) | 3,934 (23.9%) |
| Computers & Mathematics | 6,438 (74.8%) | 2,172 (25.2%) |
| Architecture & Engineering | 5,129 (87.7%) | 717 (12.3%) |
| Life, Physical & Social Science | 981 (48.4%) | 1,045 (51.6%) |
| Community & Social Service | 11,126 (33.7%) | 21,928 (66.3%) |
| Education, Arts & Media | 1,979 (30.4%) | 4,534 (69.6%) |
| Legal Services & Support | 1,679 (41.8%) | 2,334 (58.2%) |
| Education Instruction & Library | 4,636 (27.5%) | 12,235 (72.5%) |
| Arts, Media & Entertainment | 2,832 (50.1%) | 2,825 (49.9%) |
| Health Diagnosing & Treating | 5,317 (23.7%) | 17,124 (76.3%) |
| Health Technologists | 3,550 (23.2%) | 11,755 (76.8%) |
| Total (Category) | 53,182 (44.9%) | 65,206 (55.1%) |
| Total (Overall) | 161,401 (51.4%) | 152,710 (48.6%) |
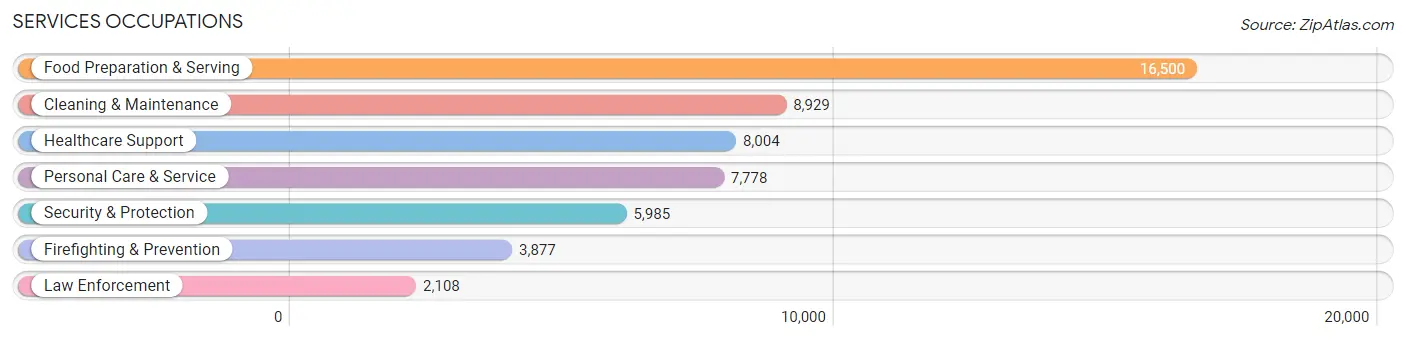
Services Occupations
The most common Services occupations in Louisville are Food Preparation & Serving (16,500 | 5.2%), Cleaning & Maintenance (8,929 | 2.8%), Healthcare Support (8,004 | 2.5%), Personal Care & Service (7,778 | 2.5%), and Security & Protection (5,985 | 1.9%).
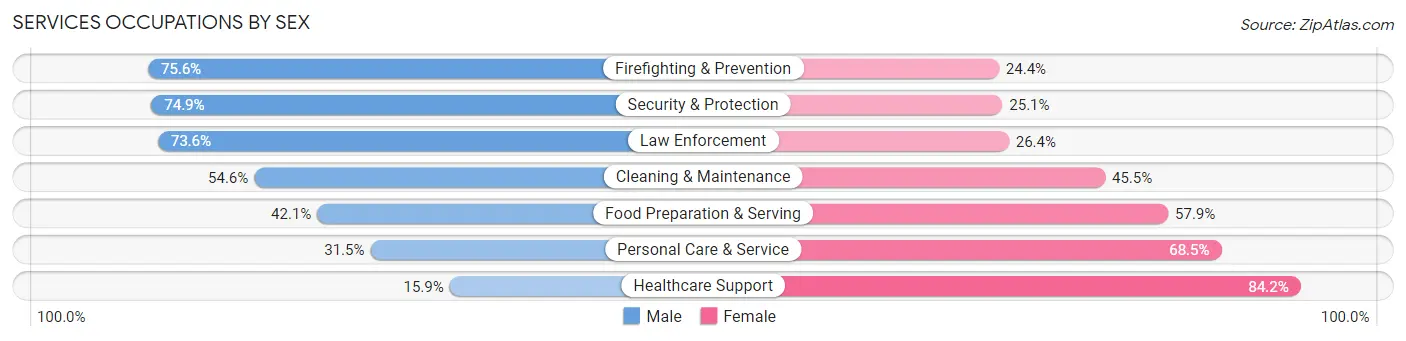
Services Occupations by Sex
Within the Services occupations in Louisville, the most male-oriented occupations are Firefighting & Prevention (75.6%), Security & Protection (74.9%), and Law Enforcement (73.6%), while the most female-oriented occupations are Healthcare Support (84.2%), Personal Care & Service (68.5%), and Food Preparation & Serving (57.9%).
| Occupation | Male | Female |
| Healthcare Support | 1,269 (15.9%) | 6,735 (84.2%) |
| Security & Protection | 4,482 (74.9%) | 1,503 (25.1%) |
| Firefighting & Prevention | 2,930 (75.6%) | 947 (24.4%) |
| Law Enforcement | 1,552 (73.6%) | 556 (26.4%) |
| Food Preparation & Serving | 6,941 (42.1%) | 9,559 (57.9%) |
| Cleaning & Maintenance | 4,871 (54.5%) | 4,058 (45.5%) |
| Personal Care & Service | 2,453 (31.5%) | 5,325 (68.5%) |
| Total (Category) | 20,016 (42.4%) | 27,180 (57.6%) |
| Total (Overall) | 161,401 (51.4%) | 152,710 (48.6%) |
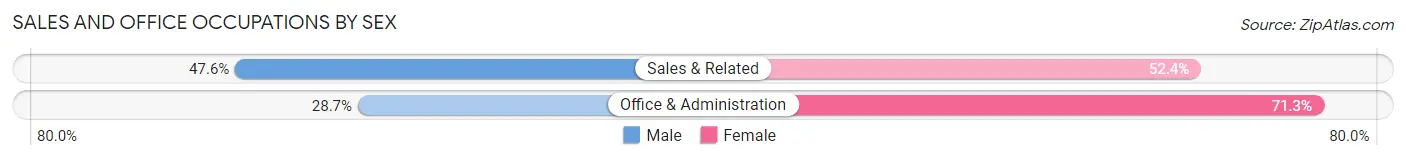
Sales and Office Occupations
The most common Sales and Office occupations in Louisville are Office & Administration (37,159 | 11.8%), and Sales & Related (28,450 | 9.1%).

Sales and Office Occupations by Sex
| Occupation | Male | Female |
| Sales & Related | 13,546 (47.6%) | 14,904 (52.4%) |
| Office & Administration | 10,674 (28.7%) | 26,485 (71.3%) |
| Total (Category) | 24,220 (36.9%) | 41,389 (63.1%) |
| Total (Overall) | 161,401 (51.4%) | 152,710 (48.6%) |
Natural Resources, Construction and Maintenance Occupations
The most common Natural Resources, Construction and Maintenance occupations in Louisville are Construction & Extraction (11,695 | 3.7%), Installation, Maintenance & Repair (8,250 | 2.6%), and Farming, Fishing & Forestry (377 | 0.1%).

Natural Resources, Construction and Maintenance Occupations by Sex
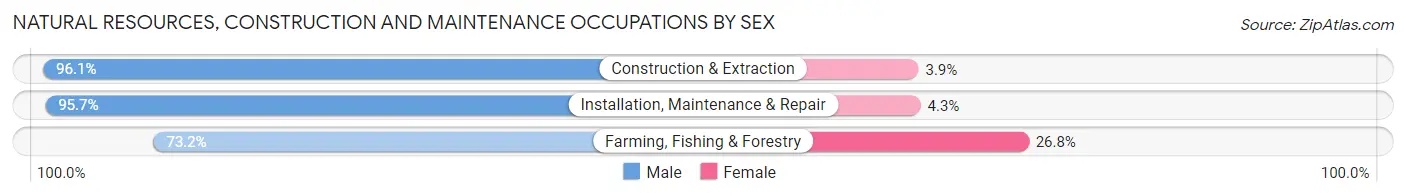
| Occupation | Male | Female |
| Farming, Fishing & Forestry | 276 (73.2%) | 101 (26.8%) |
| Construction & Extraction | 11,242 (96.1%) | 453 (3.9%) |
| Installation, Maintenance & Repair | 7,895 (95.7%) | 355 (4.3%) |
| Total (Category) | 19,413 (95.5%) | 909 (4.5%) |
| Total (Overall) | 161,401 (51.4%) | 152,710 (48.6%) |
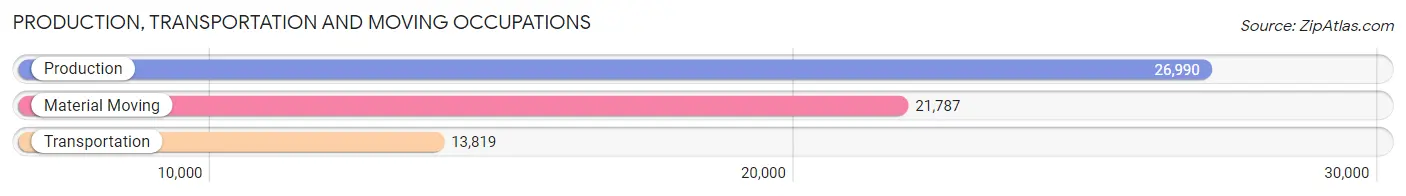
Production, Transportation and Moving Occupations
The most common Production, Transportation and Moving occupations in Louisville are Production (26,990 | 8.6%), Material Moving (21,787 | 6.9%), and Transportation (13,819 | 4.4%).
Production, Transportation and Moving Occupations by Sex
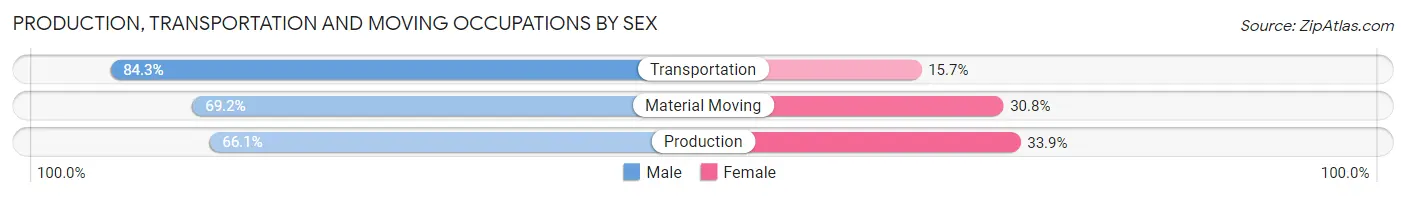
| Occupation | Male | Female |
| Production | 17,841 (66.1%) | 9,149 (33.9%) |
| Transportation | 11,646 (84.3%) | 2,173 (15.7%) |
| Material Moving | 15,083 (69.2%) | 6,704 (30.8%) |
| Total (Category) | 44,570 (71.2%) | 18,026 (28.8%) |
| Total (Overall) | 161,401 (51.4%) | 152,710 (48.6%) |
Employment Industries by Sex in Louisville
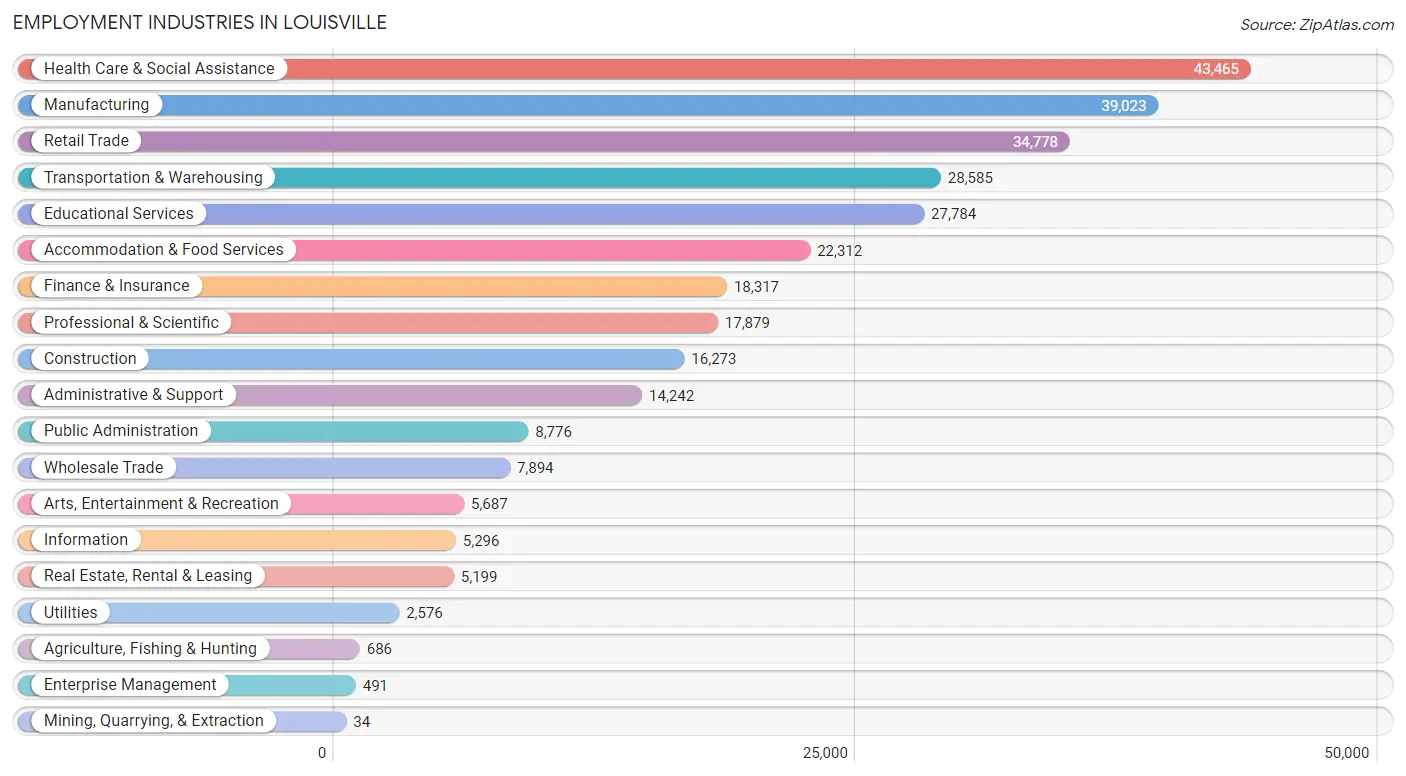
Employment Industries in Louisville
The major employment industries in Louisville include Health Care & Social Assistance (43,465 | 13.8%), Manufacturing (39,023 | 12.4%), Retail Trade (34,778 | 11.1%), Transportation & Warehousing (28,585 | 9.1%), and Educational Services (27,784 | 8.8%).
Employment Industries by Sex in Louisville
The Louisville industries that see more men than women are Mining, Quarrying, & Extraction (100.0%), Construction (89.6%), and Manufacturing (68.8%), whereas the industries that tend to have a higher number of women are Health Care & Social Assistance (77.3%), Educational Services (68.2%), and Enterprise Management (61.9%).
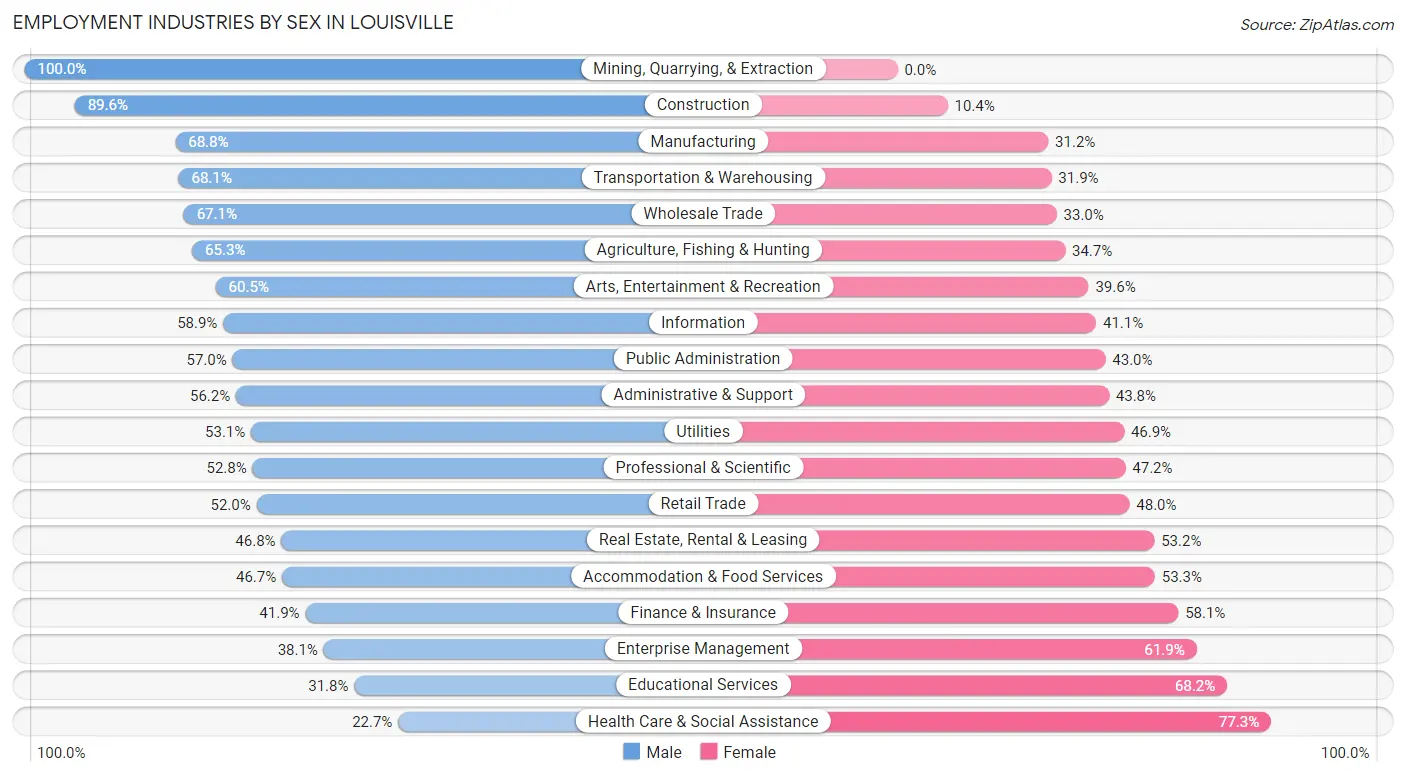
| Industry | Male | Female |
| Agriculture, Fishing & Hunting | 448 (65.3%) | 238 (34.7%) |
| Mining, Quarrying, & Extraction | 34 (100.0%) | 0 (0.0%) |
| Construction | 14,584 (89.6%) | 1,689 (10.4%) |
| Manufacturing | 26,846 (68.8%) | 12,177 (31.2%) |
| Wholesale Trade | 5,293 (67.0%) | 2,601 (33.0%) |
| Retail Trade | 18,081 (52.0%) | 16,697 (48.0%) |
| Transportation & Warehousing | 19,476 (68.1%) | 9,109 (31.9%) |
| Utilities | 1,368 (53.1%) | 1,208 (46.9%) |
| Information | 3,119 (58.9%) | 2,177 (41.1%) |
| Finance & Insurance | 7,672 (41.9%) | 10,645 (58.1%) |
| Real Estate, Rental & Leasing | 2,435 (46.8%) | 2,764 (53.2%) |
| Professional & Scientific | 9,443 (52.8%) | 8,436 (47.2%) |
| Enterprise Management | 187 (38.1%) | 304 (61.9%) |
| Administrative & Support | 8,009 (56.2%) | 6,233 (43.8%) |
| Educational Services | 8,825 (31.8%) | 18,959 (68.2%) |
| Health Care & Social Assistance | 9,853 (22.7%) | 33,612 (77.3%) |
| Arts, Entertainment & Recreation | 3,438 (60.5%) | 2,249 (39.6%) |
| Accommodation & Food Services | 10,425 (46.7%) | 11,887 (53.3%) |
| Public Administration | 4,999 (57.0%) | 3,777 (43.0%) |
| Total | 161,401 (51.4%) | 152,710 (48.6%) |
Education in Louisville
School Enrollment in Louisville
The most common levels of schooling among the 144,342 students in Louisville are middle school (32,057 | 22.2%), high school (31,088 | 21.5%), and college / undergraduate (29,155 | 20.2%).
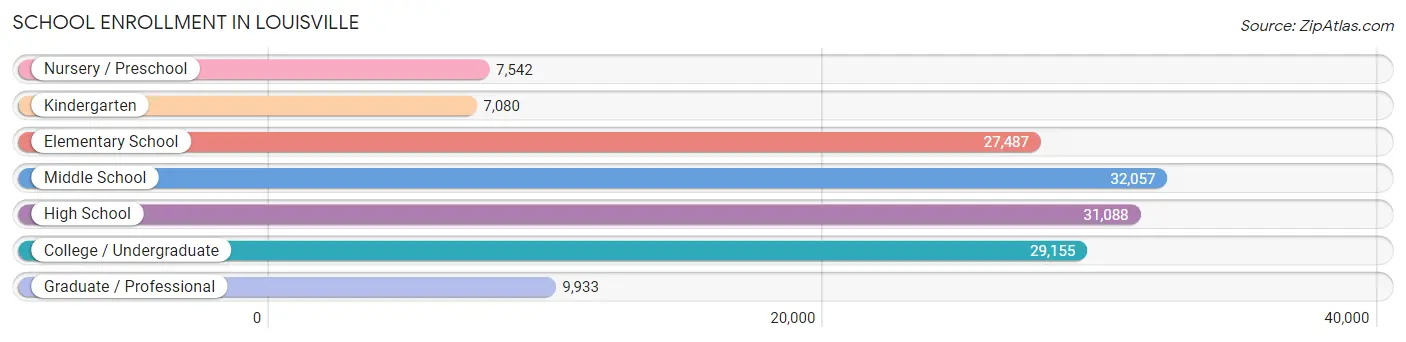
| School Level | # Students | % Students |
| Nursery / Preschool | 7,542 | 5.2% |
| Kindergarten | 7,080 | 4.9% |
| Elementary School | 27,487 | 19.0% |
| Middle School | 32,057 | 22.2% |
| High School | 31,088 | 21.5% |
| College / Undergraduate | 29,155 | 20.2% |
| Graduate / Professional | 9,933 | 6.9% |
| Total | 144,342 | 100.0% |
School Enrollment by Age by Funding Source in Louisville
Out of a total of 144,342 students who are enrolled in schools in Louisville, 33,632 (23.3%) attend a private institution, while the remaining 110,710 (76.7%) are enrolled in public schools. The age group of 3 to 4 year olds has the highest likelihood of being enrolled in private schools, with 2,729 (49.8% in the age bracket) enrolled. Conversely, the age group of 10 to 14 year olds has the lowest likelihood of being enrolled in a private school, with 31,835 (82.4% in the age bracket) attending a public institution.
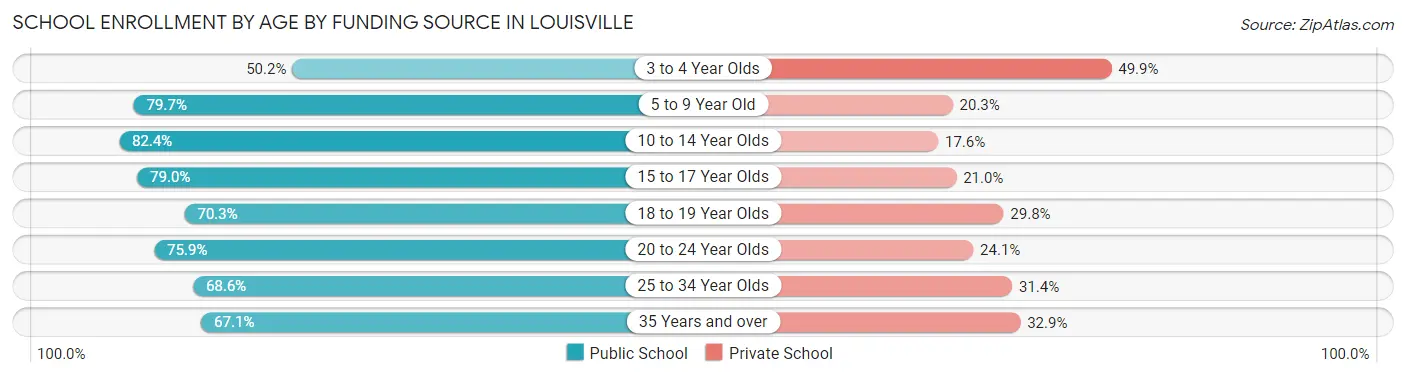
| Age Bracket | Public School | Private School |
| 3 to 4 Year Olds | 2,745 (50.1%) | 2,729 (49.8%) |
| 5 to 9 Year Old | 26,949 (79.7%) | 6,859 (20.3%) |
| 10 to 14 Year Olds | 31,835 (82.4%) | 6,791 (17.6%) |
| 15 to 17 Year Olds | 17,656 (79.0%) | 4,682 (21.0%) |
| 18 to 19 Year Olds | 7,034 (70.3%) | 2,979 (29.7%) |
| 20 to 24 Year Olds | 12,289 (75.9%) | 3,906 (24.1%) |
| 25 to 34 Year Olds | 7,331 (68.6%) | 3,349 (31.4%) |
| 35 Years and over | 4,837 (67.1%) | 2,371 (32.9%) |
| Total | 110,710 (76.7%) | 33,632 (23.3%) |
Educational Attainment by Field of Study in Louisville
Business (29,707 | 19.5%), science & technology (16,975 | 11.1%), education (14,957 | 9.8%), social sciences (11,020 | 7.2%), and arts & humanities (10,478 | 6.9%) are the most common fields of study among 152,760 individuals in Louisville who have obtained a bachelor's degree or higher.
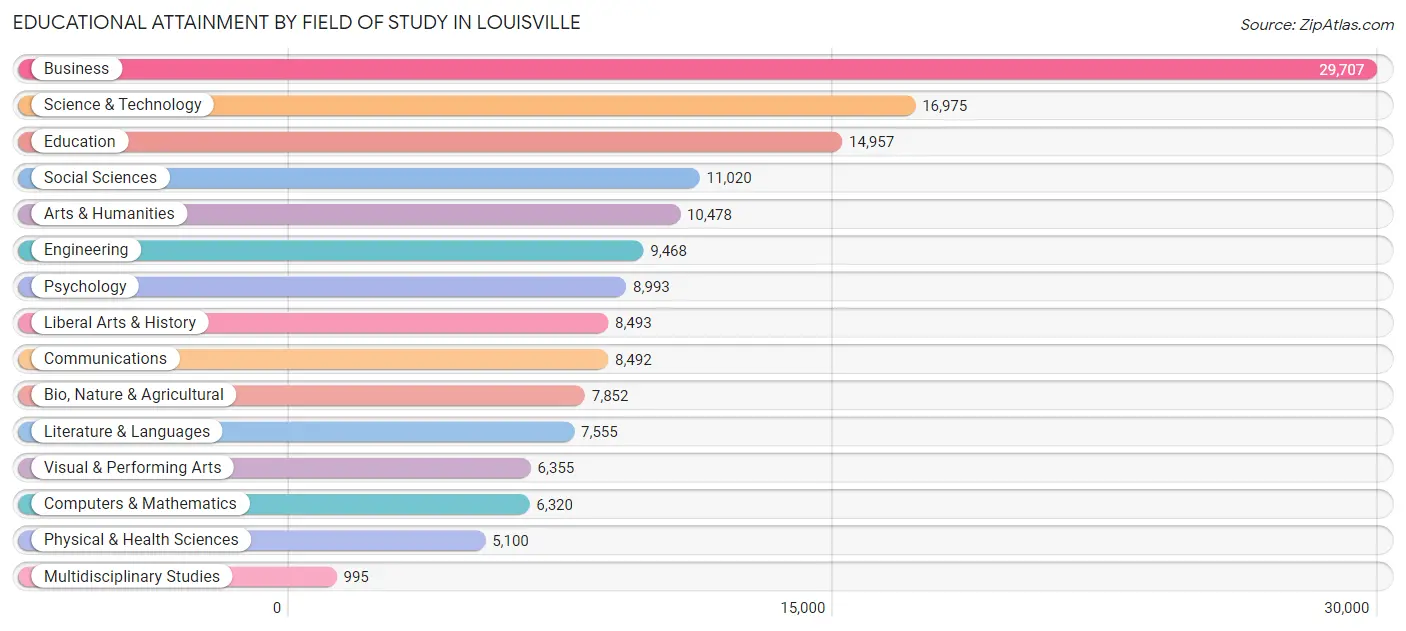
| Field of Study | # Graduates | % Graduates |
| Computers & Mathematics | 6,320 | 4.1% |
| Bio, Nature & Agricultural | 7,852 | 5.1% |
| Physical & Health Sciences | 5,100 | 3.3% |
| Psychology | 8,993 | 5.9% |
| Social Sciences | 11,020 | 7.2% |
| Engineering | 9,468 | 6.2% |
| Multidisciplinary Studies | 995 | 0.6% |
| Science & Technology | 16,975 | 11.1% |
| Business | 29,707 | 19.5% |
| Education | 14,957 | 9.8% |
| Literature & Languages | 7,555 | 5.0% |
| Liberal Arts & History | 8,493 | 5.6% |
| Visual & Performing Arts | 6,355 | 4.2% |
| Communications | 8,492 | 5.6% |
| Arts & Humanities | 10,478 | 6.9% |
| Total | 152,760 | 100.0% |
Transportation & Commute in Louisville
Vehicle Availability by Sex in Louisville
The most prevalent vehicle ownership categories in Louisville are males with 2 vehicles (70,406, accounting for 44.7%) and females with 2 vehicles (60,143, making up 47.9%).
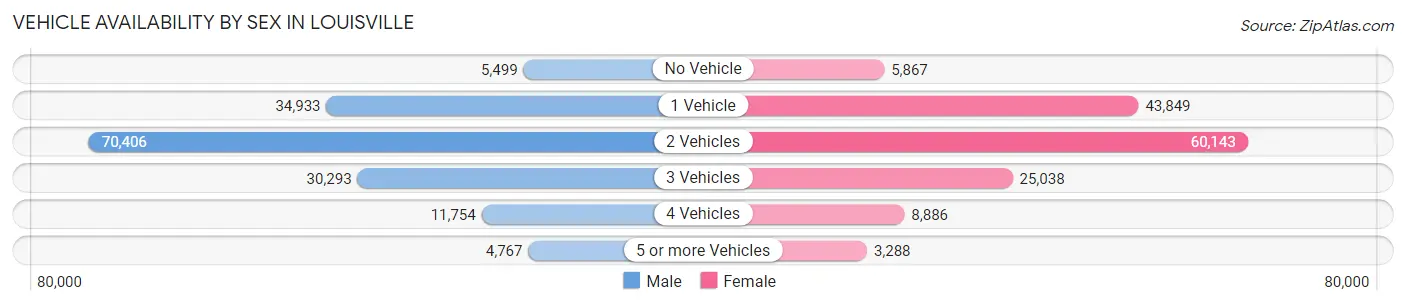
| Vehicles Available | Male | Female |
| No Vehicle | 5,499 (3.5%) | 5,867 (4.0%) |
| 1 Vehicle | 34,933 (22.2%) | 43,849 (29.8%) |
| 2 Vehicles | 70,406 (44.7%) | 60,143 (40.9%) |
| 3 Vehicles | 30,293 (19.2%) | 25,038 (17.0%) |
| 4 Vehicles | 11,754 (7.5%) | 8,886 (6.0%) |
| 5 or more Vehicles | 4,767 (3.0%) | 3,288 (2.2%) |
| Total | 157,652 (100.0%) | 147,071 (100.0%) |
Commute Time in Louisville
The most frequently occuring commute durations in Louisville are 20 to 24 minutes (61,378 commuters, 22.2%), 15 to 19 minutes (51,153 commuters, 18.5%), and 30 to 34 minutes (37,272 commuters, 13.5%).
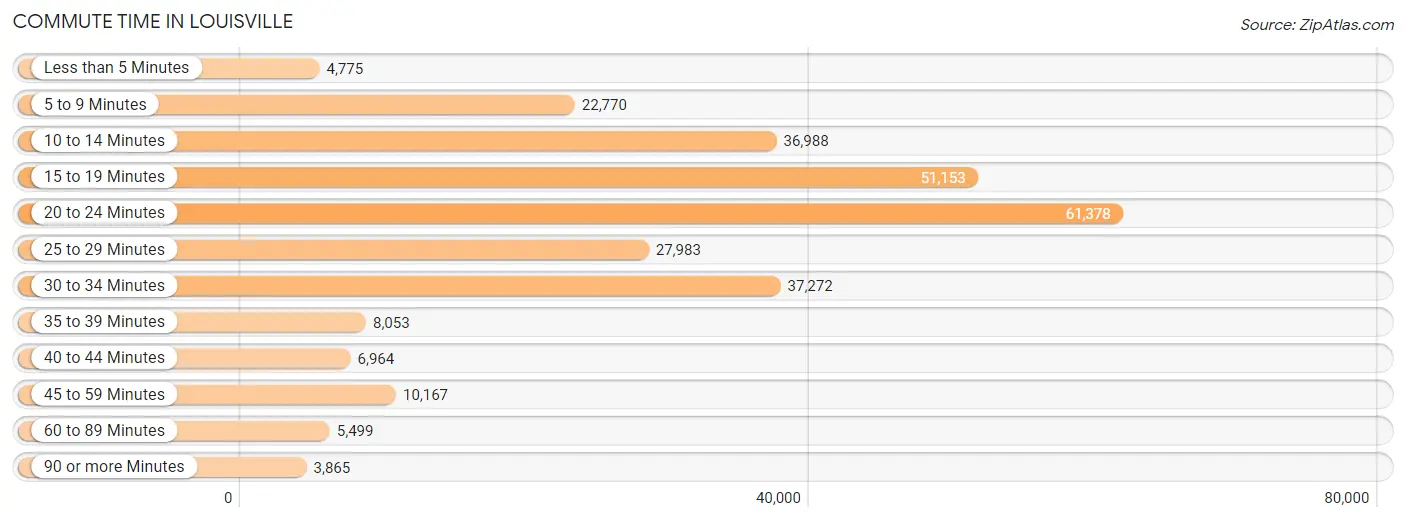
| Commute Time | # Commuters | % Commuters |
| Less than 5 Minutes | 4,775 | 1.7% |
| 5 to 9 Minutes | 22,770 | 8.2% |
| 10 to 14 Minutes | 36,988 | 13.4% |
| 15 to 19 Minutes | 51,153 | 18.5% |
| 20 to 24 Minutes | 61,378 | 22.2% |
| 25 to 29 Minutes | 27,983 | 10.1% |
| 30 to 34 Minutes | 37,272 | 13.5% |
| 35 to 39 Minutes | 8,053 | 2.9% |
| 40 to 44 Minutes | 6,964 | 2.5% |
| 45 to 59 Minutes | 10,167 | 3.7% |
| 60 to 89 Minutes | 5,499 | 2.0% |
| 90 or more Minutes | 3,865 | 1.4% |
Commute Time by Sex in Louisville
The most common commute times in Louisville are 20 to 24 minutes (33,305 commuters, 23.0%) for males and 20 to 24 minutes (28,073 commuters, 21.3%) for females.
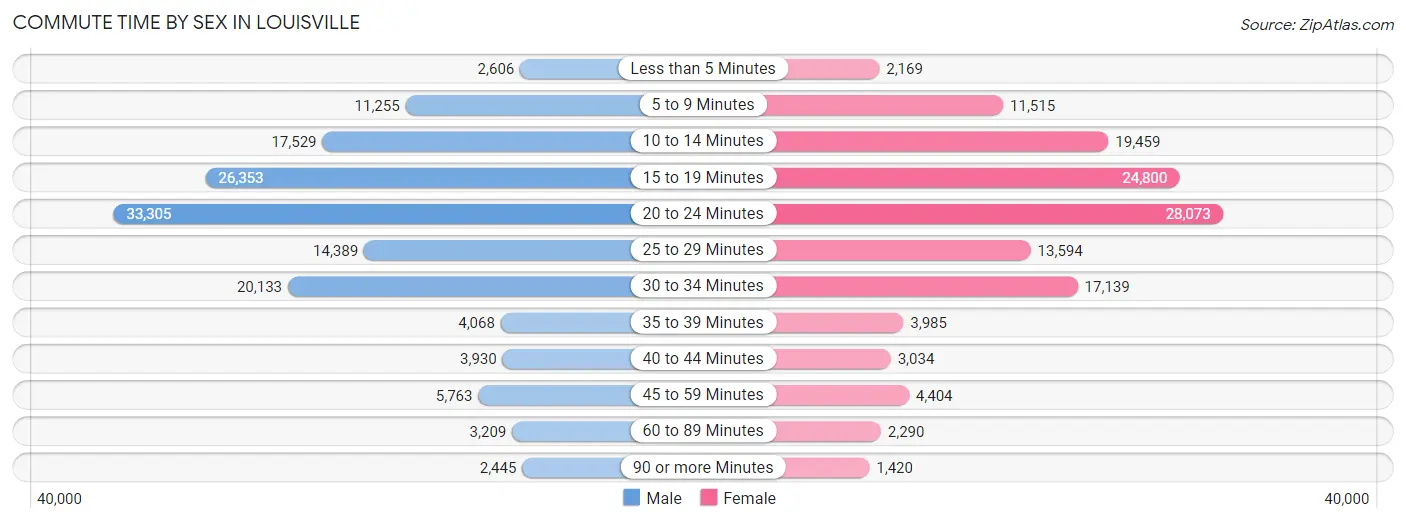
| Commute Time | Male | Female |
| Less than 5 Minutes | 2,606 (1.8%) | 2,169 (1.6%) |
| 5 to 9 Minutes | 11,255 (7.8%) | 11,515 (8.7%) |
| 10 to 14 Minutes | 17,529 (12.1%) | 19,459 (14.7%) |
| 15 to 19 Minutes | 26,353 (18.2%) | 24,800 (18.8%) |
| 20 to 24 Minutes | 33,305 (23.0%) | 28,073 (21.3%) |
| 25 to 29 Minutes | 14,389 (9.9%) | 13,594 (10.3%) |
| 30 to 34 Minutes | 20,133 (13.9%) | 17,139 (13.0%) |
| 35 to 39 Minutes | 4,068 (2.8%) | 3,985 (3.0%) |
| 40 to 44 Minutes | 3,930 (2.7%) | 3,034 (2.3%) |
| 45 to 59 Minutes | 5,763 (4.0%) | 4,404 (3.3%) |
| 60 to 89 Minutes | 3,209 (2.2%) | 2,290 (1.7%) |
| 90 or more Minutes | 2,445 (1.7%) | 1,420 (1.1%) |
Time of Departure to Work by Sex in Louisville
The most frequent times of departure to work in Louisville are 7:00 AM to 7:29 AM (22,953, 15.8%) for males and 7:00 AM to 7:29 AM (23,171, 17.6%) for females.
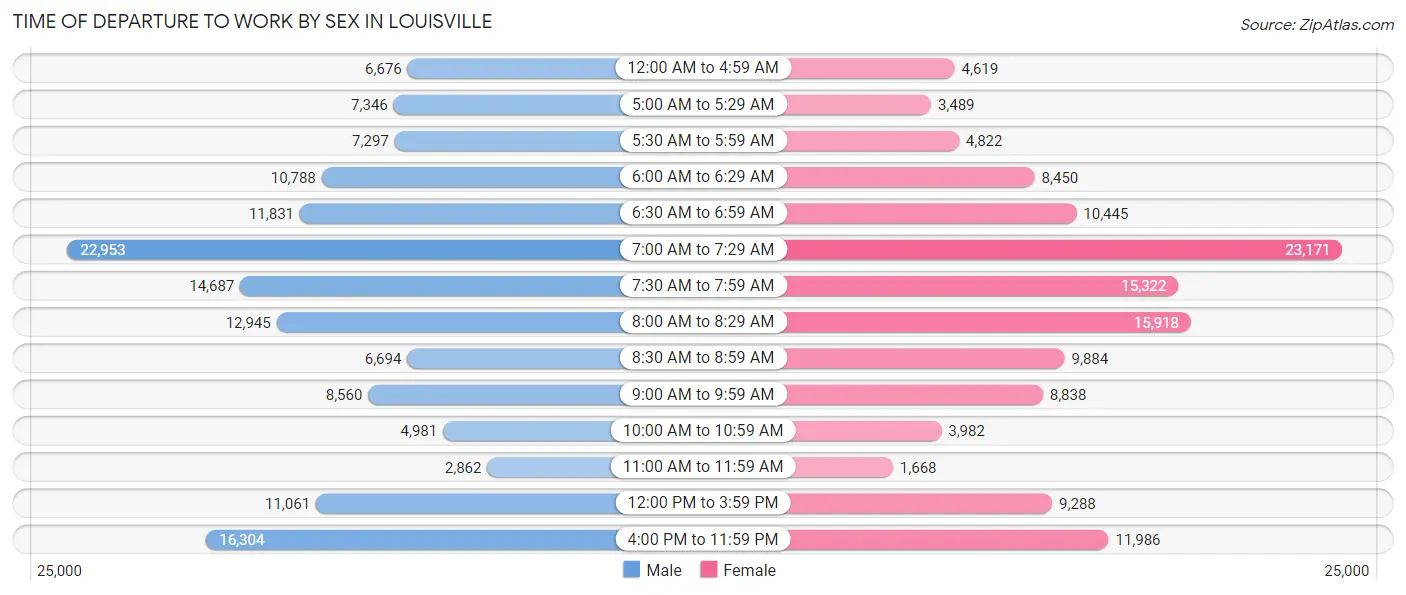
| Time of Departure | Male | Female |
| 12:00 AM to 4:59 AM | 6,676 (4.6%) | 4,619 (3.5%) |
| 5:00 AM to 5:29 AM | 7,346 (5.1%) | 3,489 (2.6%) |
| 5:30 AM to 5:59 AM | 7,297 (5.0%) | 4,822 (3.7%) |
| 6:00 AM to 6:29 AM | 10,788 (7.4%) | 8,450 (6.4%) |
| 6:30 AM to 6:59 AM | 11,831 (8.2%) | 10,445 (7.9%) |
| 7:00 AM to 7:29 AM | 22,953 (15.8%) | 23,171 (17.6%) |
| 7:30 AM to 7:59 AM | 14,687 (10.1%) | 15,322 (11.6%) |
| 8:00 AM to 8:29 AM | 12,945 (8.9%) | 15,918 (12.1%) |
| 8:30 AM to 8:59 AM | 6,694 (4.6%) | 9,884 (7.5%) |
| 9:00 AM to 9:59 AM | 8,560 (5.9%) | 8,838 (6.7%) |
| 10:00 AM to 10:59 AM | 4,981 (3.4%) | 3,982 (3.0%) |
| 11:00 AM to 11:59 AM | 2,862 (2.0%) | 1,668 (1.3%) |
| 12:00 PM to 3:59 PM | 11,061 (7.6%) | 9,288 (7.0%) |
| 4:00 PM to 11:59 PM | 16,304 (11.3%) | 11,986 (9.1%) |
| Total | 144,985 (100.0%) | 131,882 (100.0%) |
Housing Occupancy in Louisville
Occupancy by Ownership in Louisville
Of the total 261,105 dwellings in Louisville, owner-occupied units account for 157,735 (60.4%), while renter-occupied units make up 103,370 (39.6%).
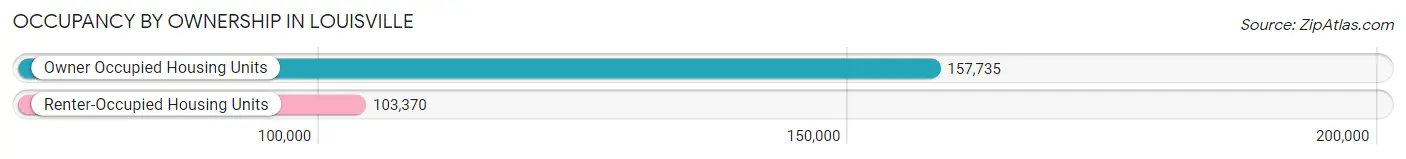
| Occupancy | # Housing Units | % Housing Units |
| Owner Occupied Housing Units | 157,735 | 60.4% |
| Renter-Occupied Housing Units | 103,370 | 39.6% |
| Total Occupied Housing Units | 261,105 | 100.0% |
Occupancy by Household Size in Louisville
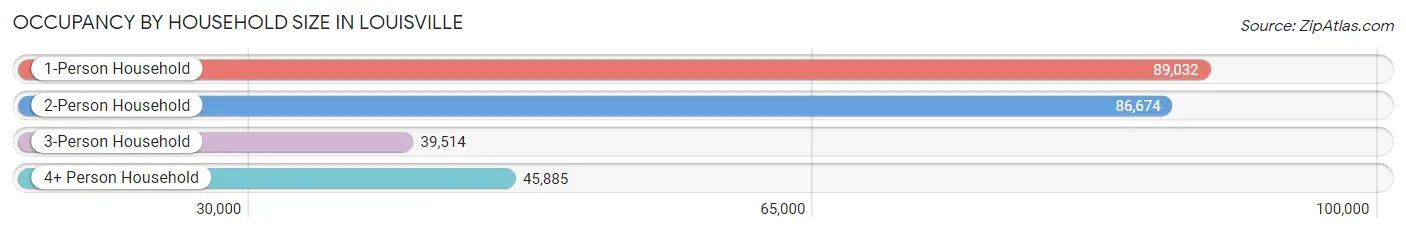
| Household Size | # Housing Units | % Housing Units |
| 1-Person Household | 89,032 | 34.1% |
| 2-Person Household | 86,674 | 33.2% |
| 3-Person Household | 39,514 | 15.1% |
| 4+ Person Household | 45,885 | 17.6% |
| Total Housing Units | 261,105 | 100.0% |
Occupancy by Ownership by Household Size in Louisville
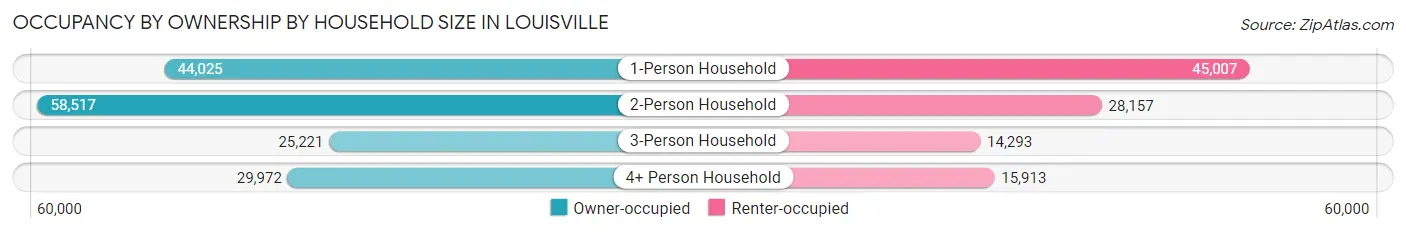
| Household Size | Owner-occupied | Renter-occupied |
| 1-Person Household | 44,025 (49.4%) | 45,007 (50.5%) |
| 2-Person Household | 58,517 (67.5%) | 28,157 (32.5%) |
| 3-Person Household | 25,221 (63.8%) | 14,293 (36.2%) |
| 4+ Person Household | 29,972 (65.3%) | 15,913 (34.7%) |
| Total Housing Units | 157,735 (60.4%) | 103,370 (39.6%) |
Occupancy by Educational Attainment in Louisville
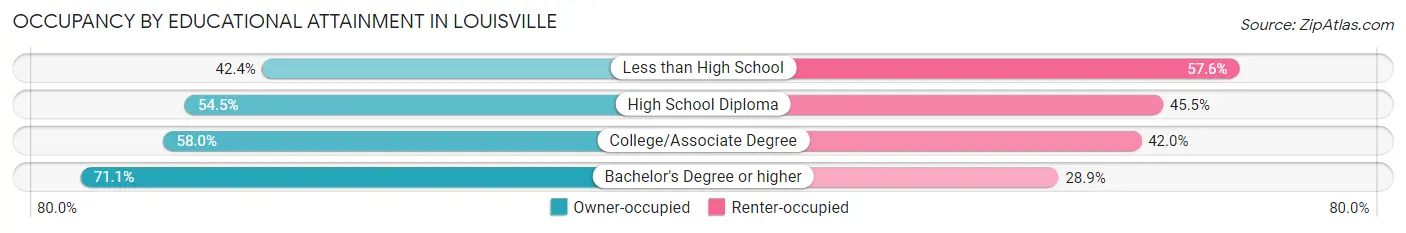
| Household Size | Owner-occupied | Renter-occupied |
| Less than High School | 9,152 (42.4%) | 12,435 (57.6%) |
| High School Diploma | 35,822 (54.5%) | 29,865 (45.5%) |
| College/Associate Degree | 47,685 (58.0%) | 34,591 (42.0%) |
| Bachelor's Degree or higher | 65,076 (71.1%) | 26,479 (28.9%) |
Occupancy by Age of Householder in Louisville
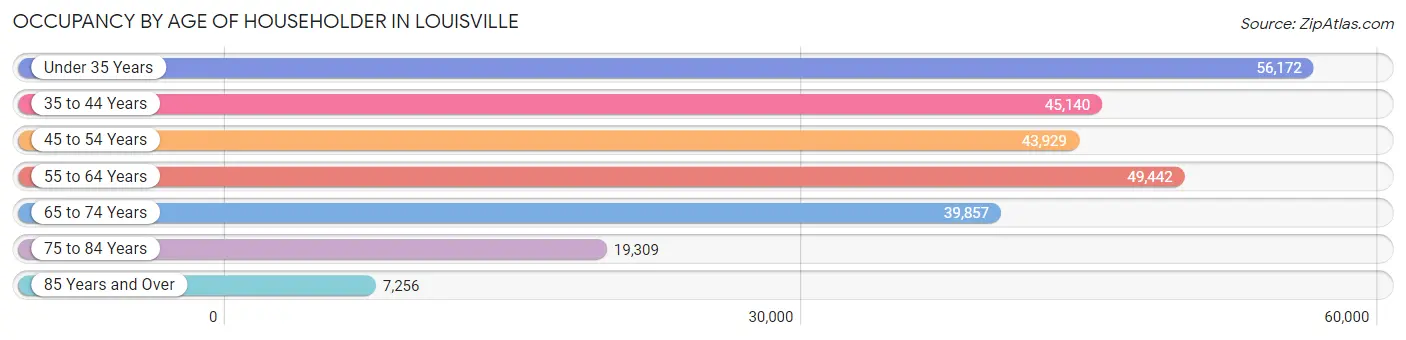
| Age Bracket | # Households | % Households |
| Under 35 Years | 56,172 | 21.5% |
| 35 to 44 Years | 45,140 | 17.3% |
| 45 to 54 Years | 43,929 | 16.8% |
| 55 to 64 Years | 49,442 | 18.9% |
| 65 to 74 Years | 39,857 | 15.3% |
| 75 to 84 Years | 19,309 | 7.4% |
| 85 Years and Over | 7,256 | 2.8% |
| Total | 261,105 | 100.0% |
Housing Finances in Louisville
Median Income by Occupancy in Louisville
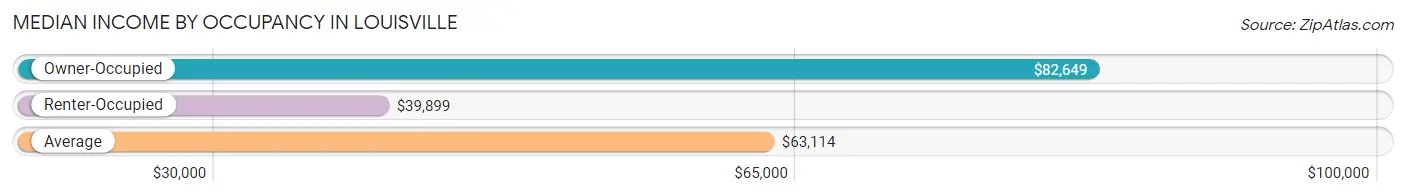
| Occupancy Type | # Households | Median Income |
| Owner-Occupied | 157,735 (60.4%) | $82,649 |
| Renter-Occupied | 103,370 (39.6%) | $39,899 |
| Average | 261,105 (100.0%) | $63,114 |
Occupancy by Householder Income Bracket in Louisville
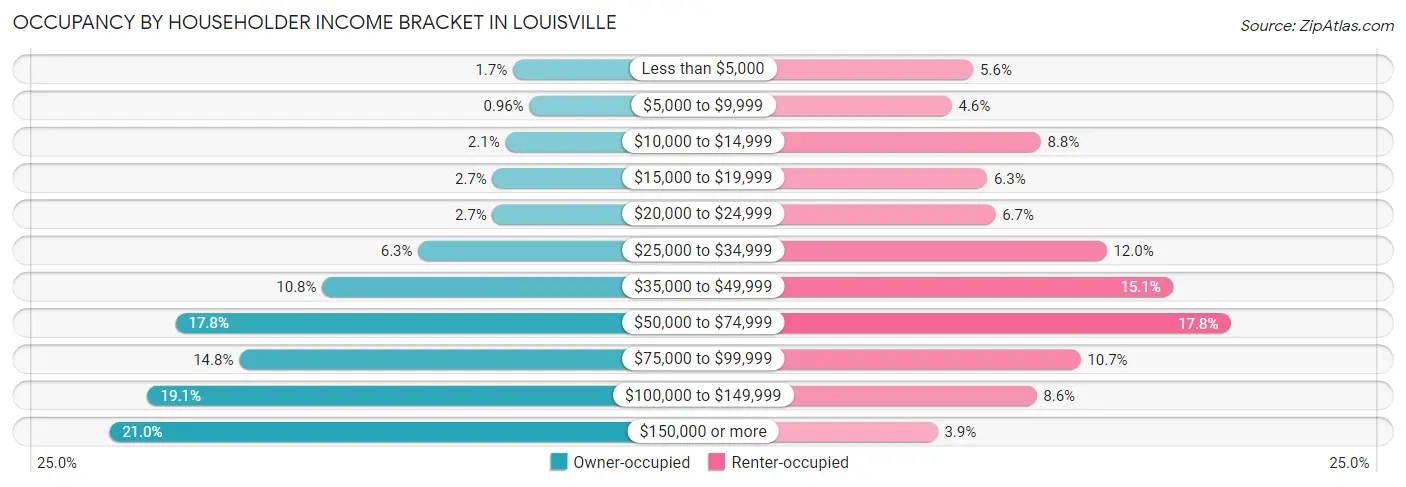
| Income Bracket | Owner-occupied | Renter-occupied |
| Less than $5,000 | 2,742 (1.7%) | 5,788 (5.6%) |
| $5,000 to $9,999 | 1,519 (1.0%) | 4,726 (4.6%) |
| $10,000 to $14,999 | 3,311 (2.1%) | 9,111 (8.8%) |
| $15,000 to $19,999 | 4,280 (2.7%) | 6,471 (6.3%) |
| $20,000 to $24,999 | 4,272 (2.7%) | 6,879 (6.7%) |
| $25,000 to $34,999 | 9,861 (6.2%) | 12,348 (11.9%) |
| $35,000 to $49,999 | 17,067 (10.8%) | 15,604 (15.1%) |
| $50,000 to $74,999 | 28,095 (17.8%) | 18,446 (17.8%) |
| $75,000 to $99,999 | 23,318 (14.8%) | 11,069 (10.7%) |
| $100,000 to $149,999 | 30,192 (19.1%) | 8,899 (8.6%) |
| $150,000 or more | 33,078 (21.0%) | 4,029 (3.9%) |
| Total | 157,735 (100.0%) | 103,370 (100.0%) |
Monthly Housing Cost Tiers in Louisville
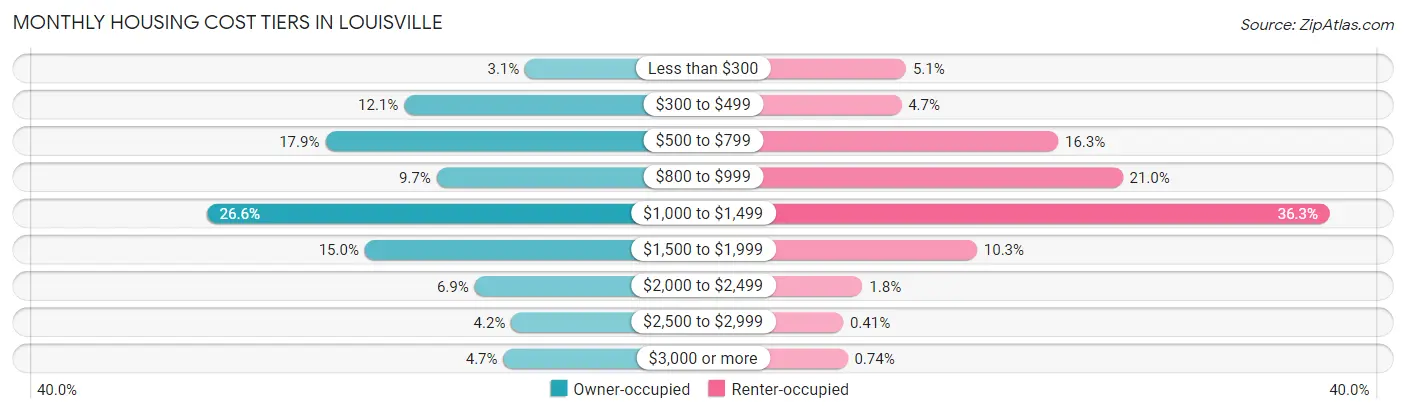
| Monthly Cost | Owner-occupied | Renter-occupied |
| Less than $300 | 4,946 (3.1%) | 5,225 (5.1%) |
| $300 to $499 | 19,008 (12.0%) | 4,862 (4.7%) |
| $500 to $799 | 28,169 (17.9%) | 16,793 (16.3%) |
| $800 to $999 | 15,234 (9.7%) | 21,709 (21.0%) |
| $1,000 to $1,499 | 41,939 (26.6%) | 37,480 (36.3%) |
| $1,500 to $1,999 | 23,578 (14.9%) | 10,616 (10.3%) |
| $2,000 to $2,499 | 10,814 (6.9%) | 1,904 (1.8%) |
| $2,500 to $2,999 | 6,567 (4.2%) | 424 (0.4%) |
| $3,000 or more | 7,480 (4.7%) | 770 (0.7%) |
| Total | 157,735 (100.0%) | 103,370 (100.0%) |
Physical Housing Characteristics in Louisville
Housing Structures in Louisville
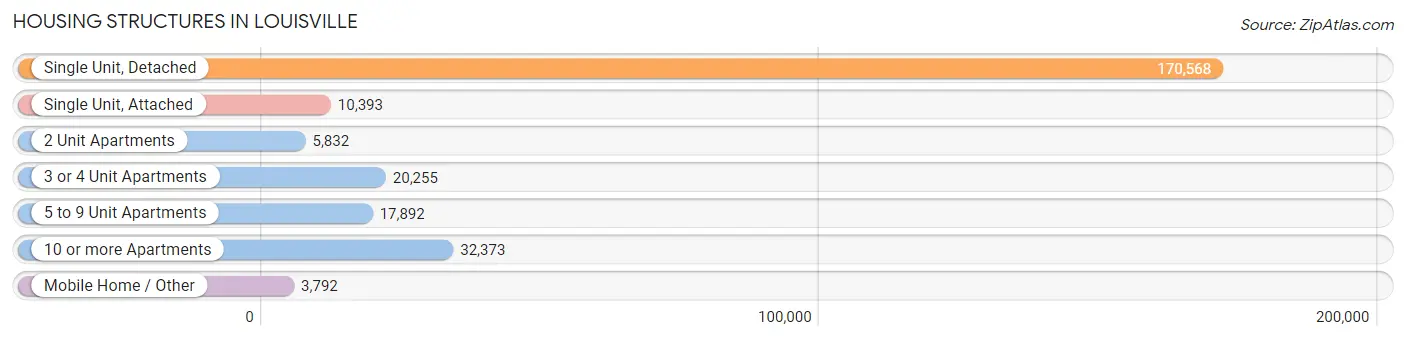
| Structure Type | # Housing Units | % Housing Units |
| Single Unit, Detached | 170,568 | 65.3% |
| Single Unit, Attached | 10,393 | 4.0% |
| 2 Unit Apartments | 5,832 | 2.2% |
| 3 or 4 Unit Apartments | 20,255 | 7.8% |
| 5 to 9 Unit Apartments | 17,892 | 6.9% |
| 10 or more Apartments | 32,373 | 12.4% |
| Mobile Home / Other | 3,792 | 1.5% |
| Total | 261,105 | 100.0% |
Housing Structures by Occupancy in Louisville
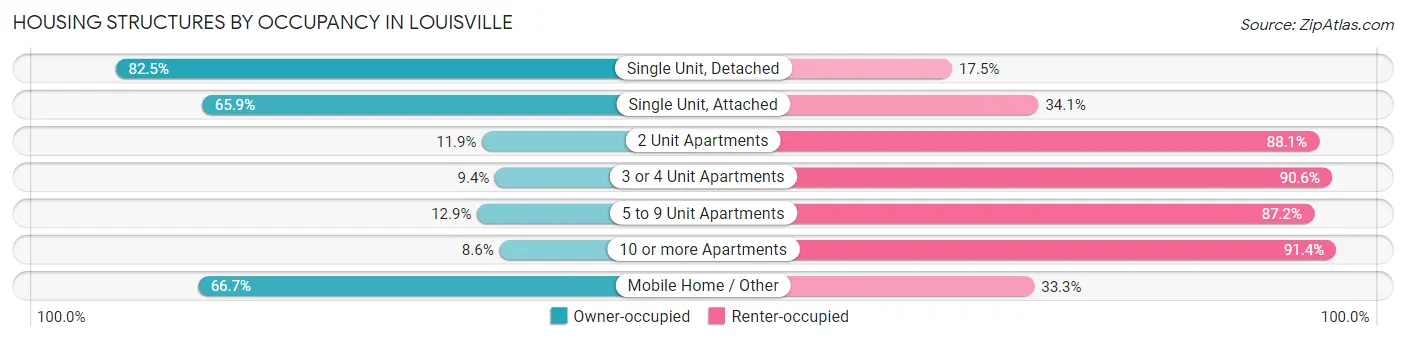
| Structure Type | Owner-occupied | Renter-occupied |
| Single Unit, Detached | 140,692 (82.5%) | 29,876 (17.5%) |
| Single Unit, Attached | 6,845 (65.9%) | 3,548 (34.1%) |
| 2 Unit Apartments | 693 (11.9%) | 5,139 (88.1%) |
| 3 or 4 Unit Apartments | 1,903 (9.4%) | 18,352 (90.6%) |
| 5 to 9 Unit Apartments | 2,299 (12.9%) | 15,593 (87.2%) |
| 10 or more Apartments | 2,775 (8.6%) | 29,598 (91.4%) |
| Mobile Home / Other | 2,528 (66.7%) | 1,264 (33.3%) |
| Total | 157,735 (60.4%) | 103,370 (39.6%) |
Housing Structures by Number of Rooms in Louisville
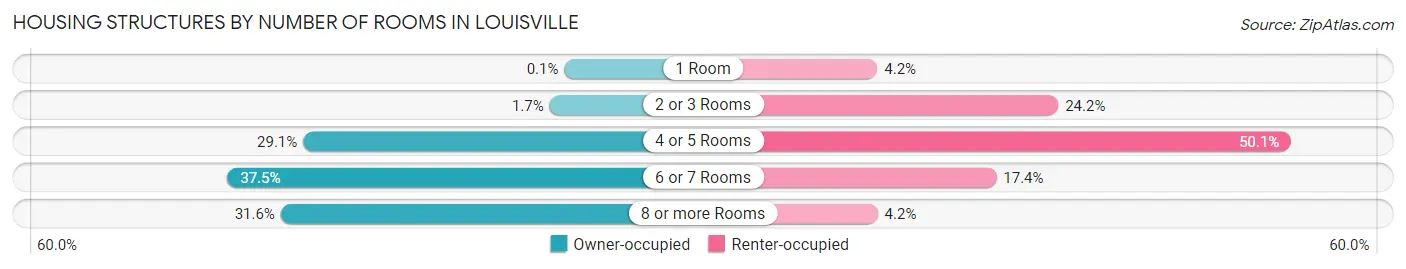
| Number of Rooms | Owner-occupied | Renter-occupied |
| 1 Room | 154 (0.1%) | 4,295 (4.2%) |
| 2 or 3 Rooms | 2,743 (1.7%) | 25,042 (24.2%) |
| 4 or 5 Rooms | 45,882 (29.1%) | 51,763 (50.1%) |
| 6 or 7 Rooms | 59,146 (37.5%) | 17,942 (17.4%) |
| 8 or more Rooms | 49,810 (31.6%) | 4,328 (4.2%) |
| Total | 157,735 (100.0%) | 103,370 (100.0%) |
Housing Structure by Heating Type in Louisville
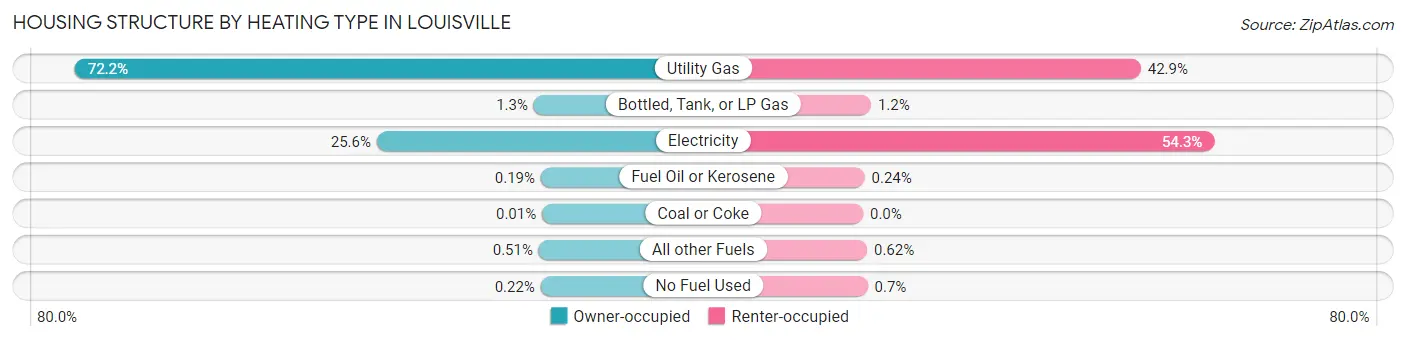
| Heating Type | Owner-occupied | Renter-occupied |
| Utility Gas | 113,946 (72.2%) | 44,388 (42.9%) |
| Bottled, Tank, or LP Gas | 2,022 (1.3%) | 1,274 (1.2%) |
| Electricity | 40,305 (25.6%) | 56,099 (54.3%) |
| Fuel Oil or Kerosene | 300 (0.2%) | 246 (0.2%) |
| Coal or Coke | 15 (0.0%) | 2 (0.0%) |
| All other Fuels | 806 (0.5%) | 642 (0.6%) |
| No Fuel Used | 341 (0.2%) | 719 (0.7%) |
| Total | 157,735 (100.0%) | 103,370 (100.0%) |
Household Vehicle Usage in Louisville
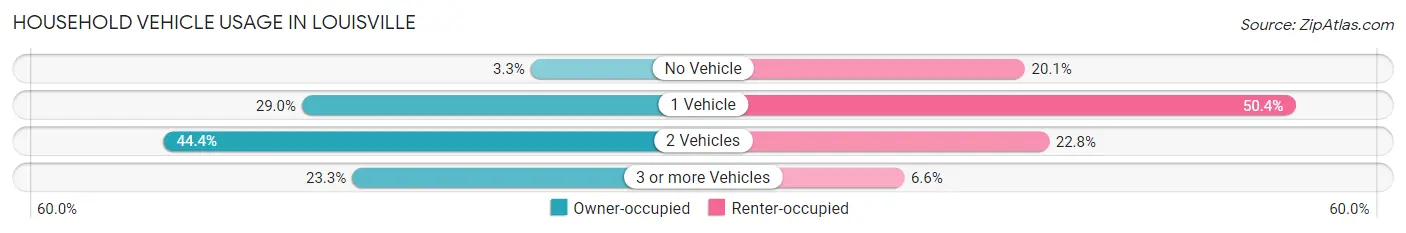
| Vehicles per Household | Owner-occupied | Renter-occupied |
| No Vehicle | 5,216 (3.3%) | 20,808 (20.1%) |
| 1 Vehicle | 45,665 (28.9%) | 52,116 (50.4%) |
| 2 Vehicles | 70,065 (44.4%) | 23,610 (22.8%) |
| 3 or more Vehicles | 36,789 (23.3%) | 6,836 (6.6%) |
| Total | 157,735 (100.0%) | 103,370 (100.0%) |
Real Estate & Mortgages in Louisville
Real Estate and Mortgage Overview in Louisville
| Characteristic | Without Mortgage | With Mortgage |
| Housing Units | 54,819 | 102,916 |
| Median Property Value | $189,600 | $213,400 |
| Median Household Income | $60,238 | $25,707 |
| Monthly Housing Costs | $544 | $7,324 |
| Real Estate Taxes | $1,559 | $2,557 |
Property Value by Mortgage Status in Louisville
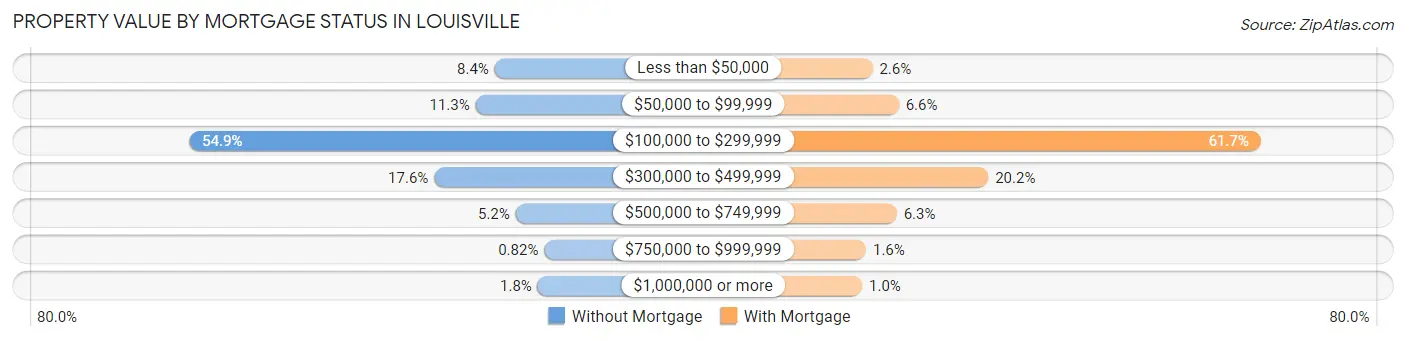
| Property Value | Without Mortgage | With Mortgage |
| Less than $50,000 | 4,591 (8.4%) | 2,659 (2.6%) |
| $50,000 to $99,999 | 6,190 (11.3%) | 6,774 (6.6%) |
| $100,000 to $299,999 | 30,105 (54.9%) | 63,541 (61.7%) |
| $300,000 to $499,999 | 9,644 (17.6%) | 20,811 (20.2%) |
| $500,000 to $749,999 | 2,842 (5.2%) | 6,456 (6.3%) |
| $750,000 to $999,999 | 451 (0.8%) | 1,642 (1.6%) |
| $1,000,000 or more | 996 (1.8%) | 1,033 (1.0%) |
| Total | 54,819 (100.0%) | 102,916 (100.0%) |
Household Income by Mortgage Status in Louisville
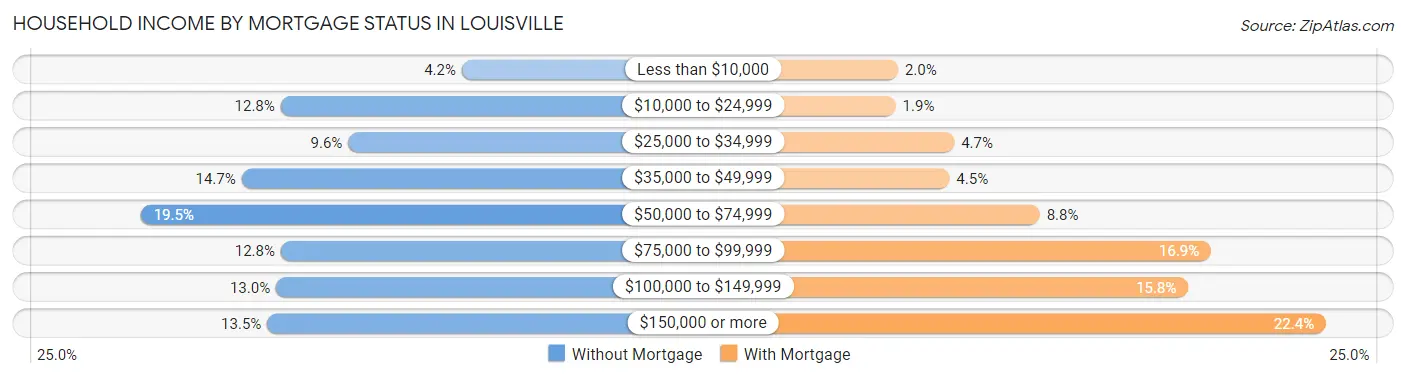
| Household Income | Without Mortgage | With Mortgage |
| Less than $10,000 | 2,294 (4.2%) | 2,079 (2.0%) |
| $10,000 to $24,999 | 7,024 (12.8%) | 1,967 (1.9%) |
| $25,000 to $34,999 | 5,256 (9.6%) | 4,839 (4.7%) |
| $35,000 to $49,999 | 8,041 (14.7%) | 4,605 (4.5%) |
| $50,000 to $74,999 | 10,676 (19.5%) | 9,026 (8.8%) |
| $75,000 to $99,999 | 7,015 (12.8%) | 17,419 (16.9%) |
| $100,000 to $149,999 | 7,142 (13.0%) | 16,303 (15.8%) |
| $150,000 or more | 7,371 (13.5%) | 23,050 (22.4%) |
| Total | 54,819 (100.0%) | 102,916 (100.0%) |
Property Value to Household Income Ratio in Louisville
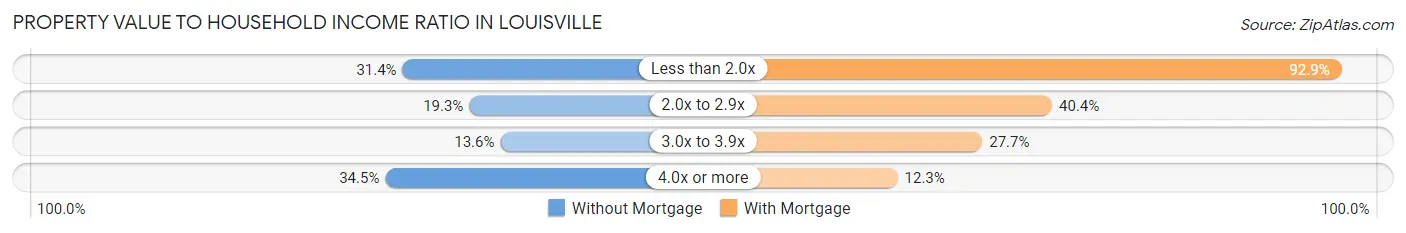
| Value-to-Income Ratio | Without Mortgage | With Mortgage |
| Less than 2.0x | 17,202 (31.4%) | 95,628 (92.9%) |
| 2.0x to 2.9x | 10,557 (19.3%) | 41,531 (40.4%) |
| 3.0x to 3.9x | 7,462 (13.6%) | 28,491 (27.7%) |
| 4.0x or more | 18,910 (34.5%) | 12,647 (12.3%) |
| Total | 54,819 (100.0%) | 102,916 (100.0%) |
Real Estate Taxes by Mortgage Status in Louisville
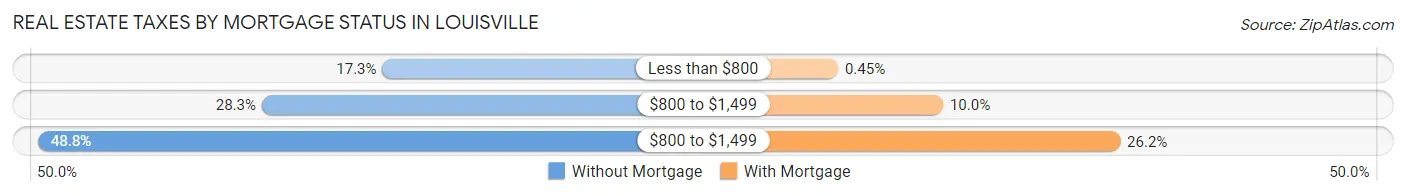
| Property Taxes | Without Mortgage | With Mortgage |
| Less than $800 | 9,502 (17.3%) | 460 (0.4%) |
| $800 to $1,499 | 15,533 (28.3%) | 10,337 (10.0%) |
| $800 to $1,499 | 26,738 (48.8%) | 26,989 (26.2%) |
| Total | 54,819 (100.0%) | 102,916 (100.0%) |
Health & Disability in Louisville
Health Insurance Coverage by Age in Louisville
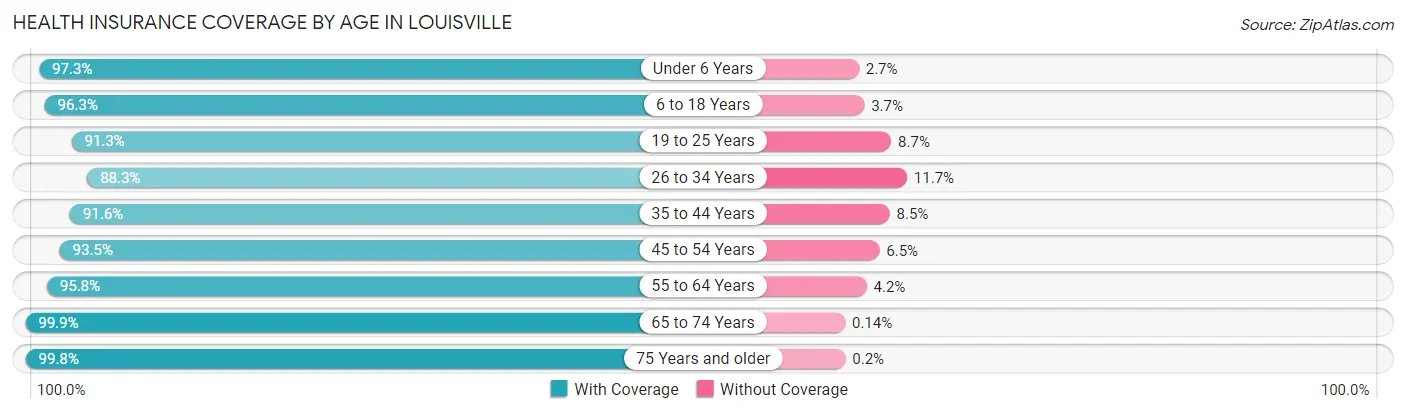
| Age Bracket | With Coverage | Without Coverage |
| Under 6 Years | 45,328 (97.3%) | 1,256 (2.7%) |
| 6 to 18 Years | 96,275 (96.3%) | 3,715 (3.7%) |
| 19 to 25 Years | 55,773 (91.3%) | 5,344 (8.7%) |
| 26 to 34 Years | 70,679 (88.3%) | 9,348 (11.7%) |
| 35 to 44 Years | 73,331 (91.5%) | 6,768 (8.5%) |
| 45 to 54 Years | 70,528 (93.5%) | 4,936 (6.5%) |
| 55 to 64 Years | 78,742 (95.8%) | 3,418 (4.2%) |
| 65 to 74 Years | 59,545 (99.9%) | 81 (0.1%) |
| 75 Years and older | 37,067 (99.8%) | 76 (0.2%) |
| Total | 587,268 (94.4%) | 34,942 (5.6%) |
Health Insurance Coverage by Citizenship Status in Louisville
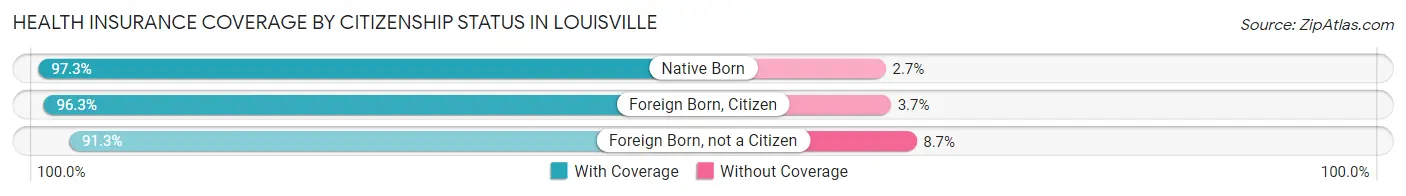
| Citizenship Status | With Coverage | Without Coverage |
| Native Born | 45,328 (97.3%) | 1,256 (2.7%) |
| Foreign Born, Citizen | 96,275 (96.3%) | 3,715 (3.7%) |
| Foreign Born, not a Citizen | 55,773 (91.3%) | 5,344 (8.7%) |
Health Insurance Coverage by Household Income in Louisville
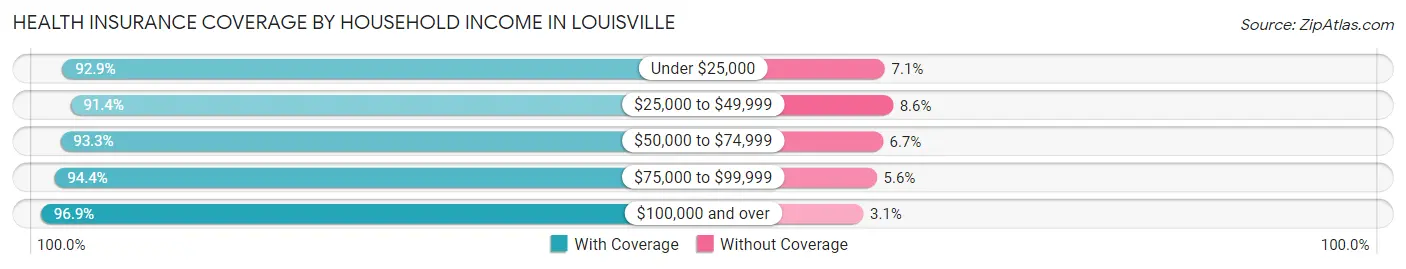
| Household Income | With Coverage | Without Coverage |
| Under $25,000 | 82,493 (92.9%) | 6,287 (7.1%) |
| $25,000 to $49,999 | 100,806 (91.4%) | 9,487 (8.6%) |
| $50,000 to $74,999 | 95,933 (93.3%) | 6,894 (6.7%) |
| $75,000 to $99,999 | 81,050 (94.4%) | 4,802 (5.6%) |
| $100,000 and over | 220,101 (96.9%) | 6,952 (3.1%) |
Public vs Private Health Insurance Coverage by Age in Louisville
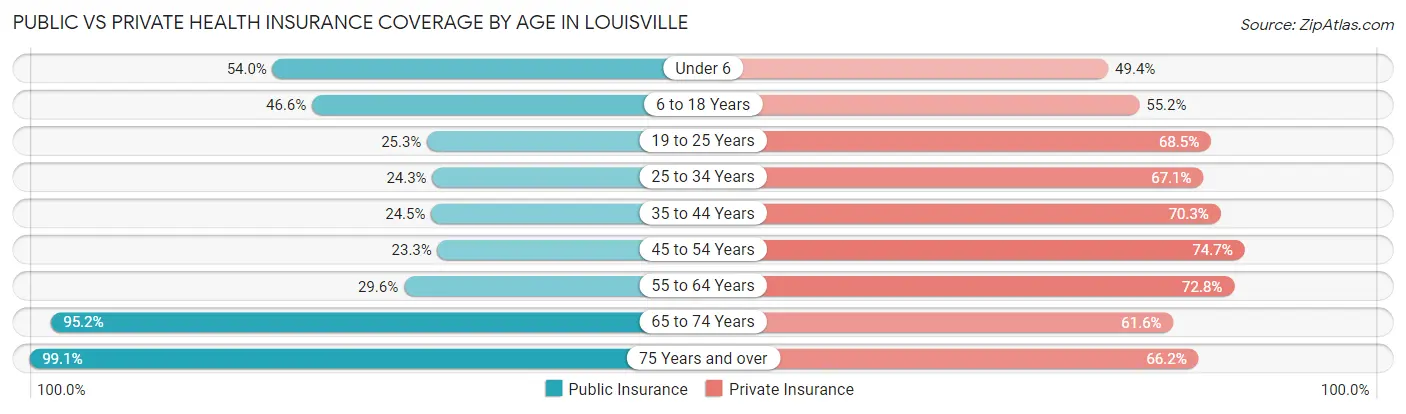
| Age Bracket | Public Insurance | Private Insurance |
| Under 6 | 25,133 (53.9%) | 23,029 (49.4%) |
| 6 to 18 Years | 46,625 (46.6%) | 55,210 (55.2%) |
| 19 to 25 Years | 15,446 (25.3%) | 41,884 (68.5%) |
| 25 to 34 Years | 19,448 (24.3%) | 53,706 (67.1%) |
| 35 to 44 Years | 19,635 (24.5%) | 56,322 (70.3%) |
| 45 to 54 Years | 17,611 (23.3%) | 56,399 (74.7%) |
| 55 to 64 Years | 24,306 (29.6%) | 59,833 (72.8%) |
| 65 to 74 Years | 56,774 (95.2%) | 36,700 (61.6%) |
| 75 Years and over | 36,821 (99.1%) | 24,590 (66.2%) |
| Total | 261,799 (42.1%) | 407,673 (65.5%) |
Disability Status by Sex by Age in Louisville
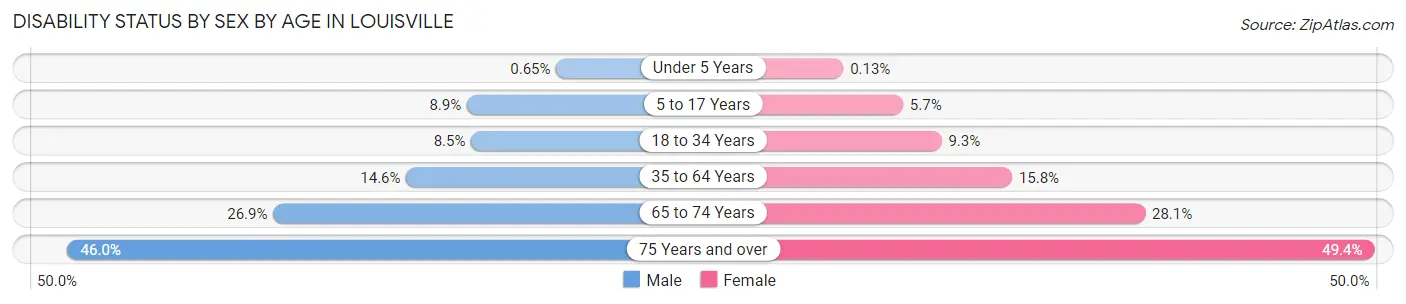
| Age Bracket | Male | Female |
| Under 5 Years | 128 (0.6%) | 24 (0.1%) |
| 5 to 17 Years | 4,593 (8.9%) | 2,782 (5.7%) |
| 18 to 34 Years | 6,336 (8.5%) | 6,900 (9.2%) |
| 35 to 64 Years | 16,867 (14.6%) | 19,253 (15.8%) |
| 65 to 74 Years | 7,476 (26.9%) | 8,962 (28.1%) |
| 75 Years and over | 6,658 (46.0%) | 11,203 (49.4%) |
Disability Class by Sex by Age in Louisville
Disability Class: Hearing Difficulty
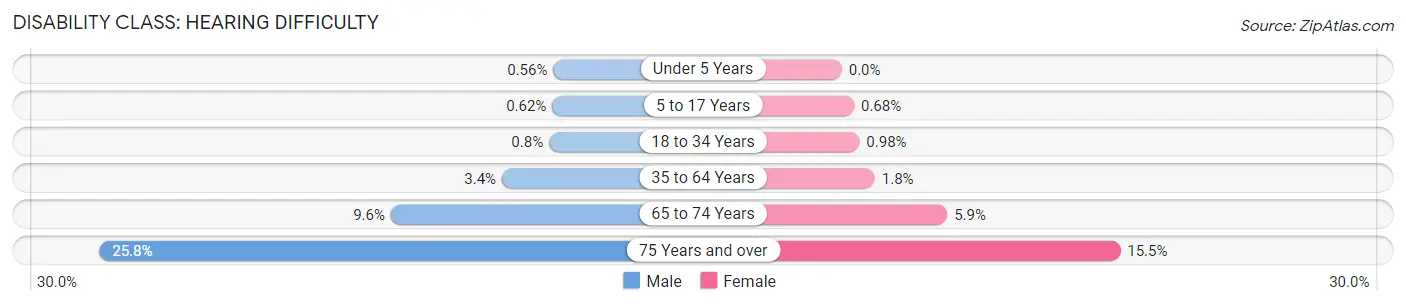
| Age Bracket | Male | Female |
| Under 5 Years | 111 (0.6%) | 0 (0.0%) |
| 5 to 17 Years | 320 (0.6%) | 333 (0.7%) |
| 18 to 34 Years | 594 (0.8%) | 728 (1.0%) |
| 35 to 64 Years | 3,965 (3.4%) | 2,249 (1.8%) |
| 65 to 74 Years | 2,668 (9.6%) | 1,871 (5.9%) |
| 75 Years and over | 3,741 (25.8%) | 3,515 (15.5%) |
Disability Class: Vision Difficulty
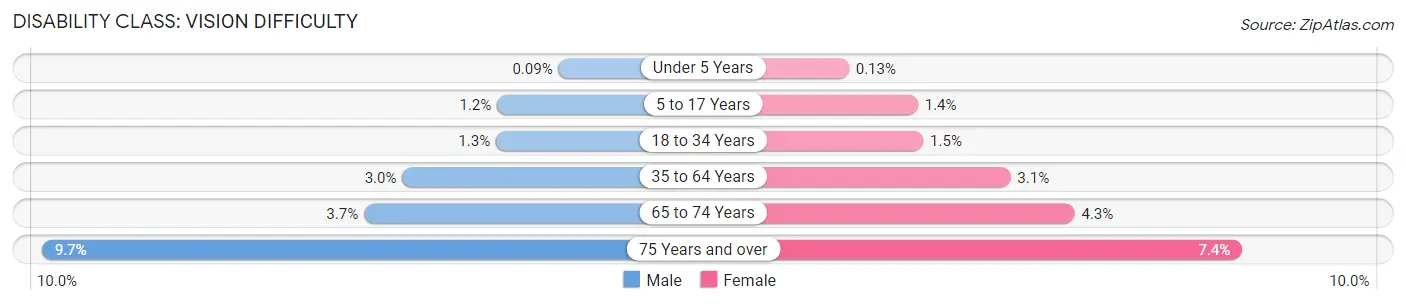
| Age Bracket | Male | Female |
| Under 5 Years | 17 (0.1%) | 24 (0.1%) |
| 5 to 17 Years | 632 (1.2%) | 691 (1.4%) |
| 18 to 34 Years | 926 (1.3%) | 1,130 (1.5%) |
| 35 to 64 Years | 3,461 (3.0%) | 3,811 (3.1%) |
| 65 to 74 Years | 1,028 (3.7%) | 1,375 (4.3%) |
| 75 Years and over | 1,401 (9.7%) | 1,684 (7.4%) |
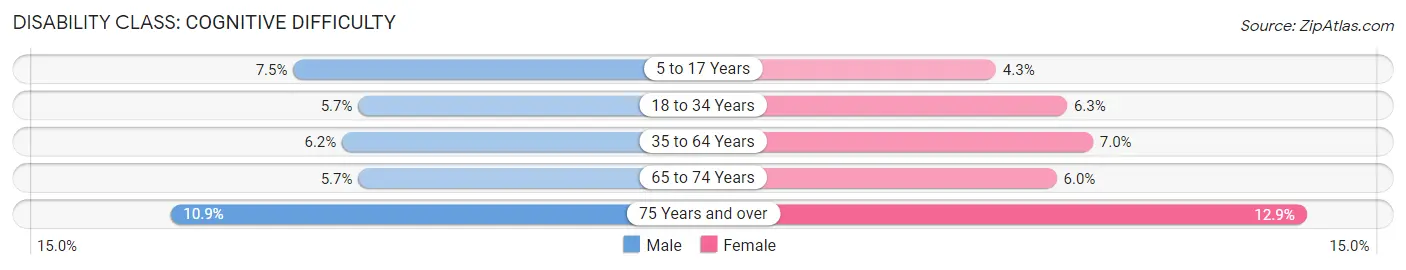
Disability Class: Cognitive Difficulty
| Age Bracket | Male | Female |
| 5 to 17 Years | 3,861 (7.5%) | 2,103 (4.3%) |
| 18 to 34 Years | 4,236 (5.7%) | 4,678 (6.3%) |
| 35 to 64 Years | 7,130 (6.2%) | 8,519 (7.0%) |
| 65 to 74 Years | 1,585 (5.7%) | 1,905 (6.0%) |
| 75 Years and over | 1,584 (10.9%) | 2,933 (12.9%) |
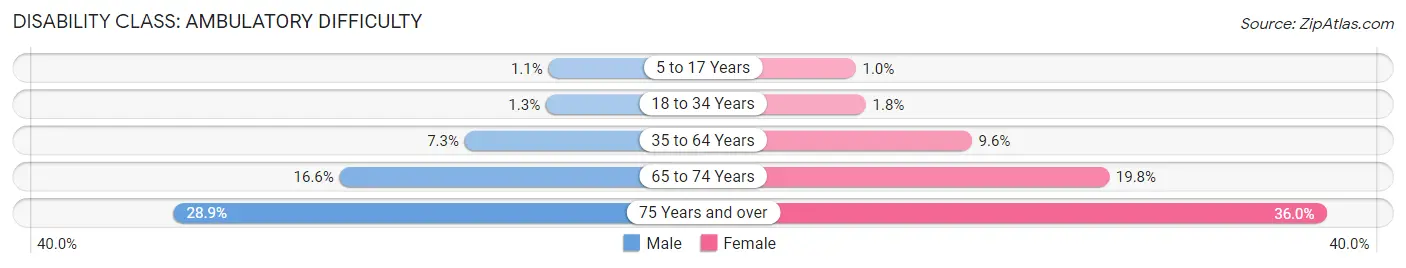
Disability Class: Ambulatory Difficulty
| Age Bracket | Male | Female |
| 5 to 17 Years | 566 (1.1%) | 498 (1.0%) |
| 18 to 34 Years | 956 (1.3%) | 1,323 (1.8%) |
| 35 to 64 Years | 8,472 (7.3%) | 11,759 (9.6%) |
| 65 to 74 Years | 4,613 (16.6%) | 6,318 (19.8%) |
| 75 Years and over | 4,187 (28.9%) | 8,154 (36.0%) |
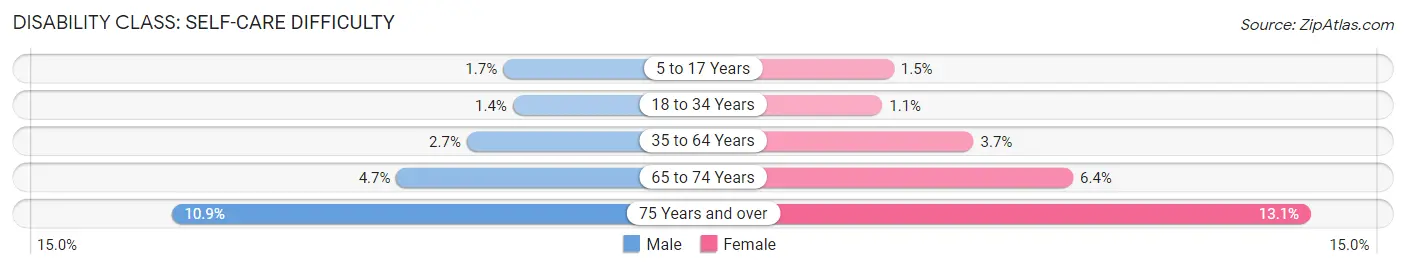
Disability Class: Self-Care Difficulty
| Age Bracket | Male | Female |
| 5 to 17 Years | 864 (1.7%) | 712 (1.5%) |
| 18 to 34 Years | 1,046 (1.4%) | 845 (1.1%) |
| 35 to 64 Years | 3,112 (2.7%) | 4,477 (3.7%) |
| 65 to 74 Years | 1,292 (4.6%) | 2,052 (6.4%) |
| 75 Years and over | 1,579 (10.9%) | 2,960 (13.1%) |
Technology Access in Louisville
Computing Device Access in Louisville
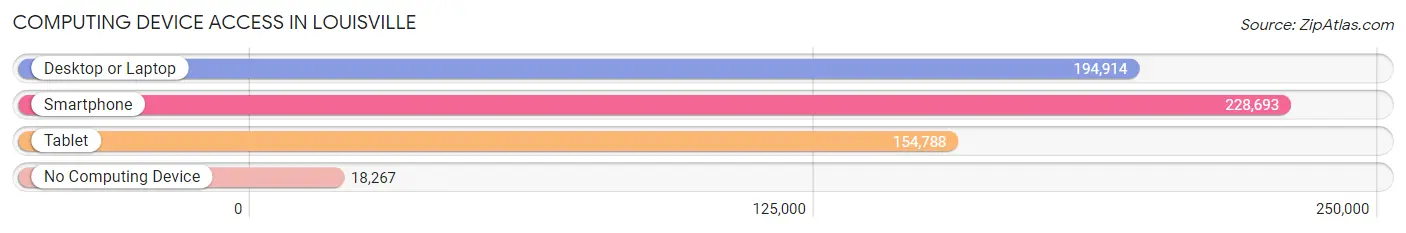
| Device Type | # Households | % Households |
| Desktop or Laptop | 194,914 | 74.7% |
| Smartphone | 228,693 | 87.6% |
| Tablet | 154,788 | 59.3% |
| No Computing Device | 18,267 | 7.0% |
| Total | 261,105 | 100.0% |
Internet Access in Louisville
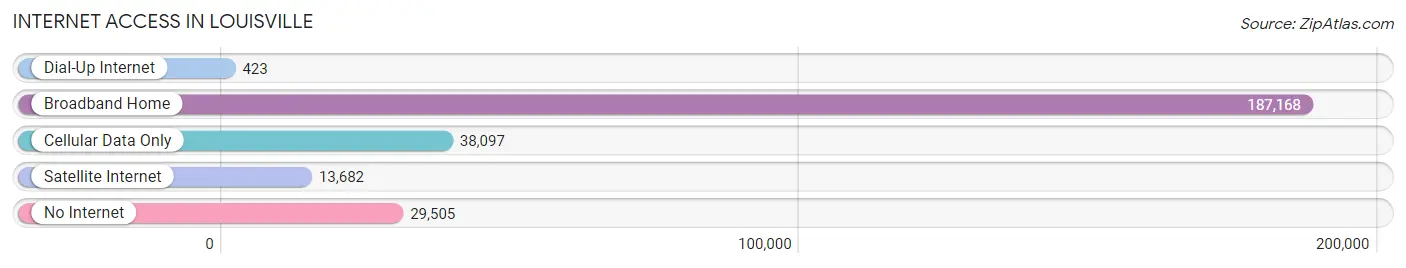
| Internet Type | # Households | % Households |
| Dial-Up Internet | 423 | 0.2% |
| Broadband Home | 187,168 | 71.7% |
| Cellular Data Only | 38,097 | 14.6% |
| Satellite Internet | 13,682 | 5.2% |
| No Internet | 29,505 | 11.3% |
| Total | 261,105 | 100.0% |
Louisville Summary
Louisville, Kentucky is the largest city in the state and the county seat of Jefferson County. It is located on the Ohio River in north-central Kentucky, and is the principal city of the Louisville metropolitan area. Louisville is the home of the Kentucky Derby, the world’s most famous horse race, and the Louisville Slugger baseball bat.
History
Louisville was founded in 1778 by George Rogers Clark and named after King Louis XVI of France. It was the first city in Kentucky to be incorporated, and it quickly became a major port city. Louisville was a major center of the slave trade in the early 19th century, and it was the site of the first public library in the state.
The city was a major center of the Civil War, and it was the site of the Battle of Perryville in 1862. After the war, Louisville became a major industrial center, and it was the home of the Louisville and Nashville Railroad. The city was also the site of the first Kentucky Derby in 1875.
Geography
Louisville is located in north-central Kentucky, on the Ohio River. It is situated on a broad plain, with the Ohio River to the north and the Kentucky River to the south. The city is surrounded by rolling hills and is located in the Bluegrass region of the state.
The climate in Louisville is humid subtropical, with hot, humid summers and mild winters. The average annual temperature is around 60°F (15°C). The city receives an average of 44 inches (112 cm) of precipitation per year.
Economy
Louisville’s economy is largely based on manufacturing, healthcare, and logistics. The city is home to several major corporations, including Brown-Forman, Humana, and Yum! Brands. Louisville is also a major center for the automotive industry, with several major auto manufacturers having plants in the city.
The city is also home to several major universities, including the University of Louisville, Bellarmine University, and Spalding University. Louisville is also home to several major hospitals, including the University of Louisville Hospital and Norton Healthcare.
Demographics
As of the 2010 census, Louisville had a population of 741,096. The city is racially diverse, with the largest racial groups being white (63.2%), African American (25.2%), and Hispanic or Latino (7.2%). The median household income in Louisville is $45,837, and the median home value is $133,400.
Louisville is home to several major religions, including Christianity, Judaism, and Islam. The city is also home to several major cultural institutions, including the Louisville Ballet, the Louisville Orchestra, and the Kentucky Opera.
Louisville is a major tourist destination, with attractions such as the Kentucky Derby, the Louisville Slugger Museum, and the Louisville Zoo. The city is also home to several major sports teams, including the Louisville Bats (minor league baseball), the Louisville Cardinals (NCAA Division I basketball), and the Louisville City FC (soccer).
Common Questions
What is Per Capita Income in Louisville?
Per Capita income in Louisville is $37,588.
What is the Median Family Income in Louisville?
Median Family Income in Louisville is $81,196.
What is the Median Household income in Louisville?
Median Household Income in Louisville is $63,114.
What is Income or Wage Gap in Louisville?
Income or Wage Gap in Louisville is 22.5%.
Women in Louisville earn 77.5 cents for every dollar earned by a man.
What is Family Income Deficit in Louisville?
Family Income Deficit in Louisville is $11,003.
Families that are below poverty line in Louisville earn $11,003 less on average than the poverty threshold level.
What is Inequality or Gini Index in Louisville?
Inequality or Gini Index in Louisville is 0.48.
What is the Total Population of Louisville?
Total Population of Louisville is 629,176.
What is the Total Male Population of Louisville?
Total Male Population of Louisville is 307,201.
What is the Total Female Population of Louisville?
Total Female Population of Louisville is 321,975.
What is the Ratio of Males per 100 Females in Louisville?
There are 95.41 Males per 100 Females in Louisville.
What is the Ratio of Females per 100 Males in Louisville?
There are 104.81 Females per 100 Males in Louisville.
What is the Median Population Age in Louisville?
Median Population Age in Louisville is 37.9 Years.
What is the Average Family Size in Louisville
Average Family Size in Louisville is 3.1 People.
What is the Average Household Size in Louisville
Average Household Size in Louisville is 2.4 People.
How Large is the Labor Force in Louisville?
There are 332,707 People in the Labor Forcein in Louisville.
What is the Percentage of People in the Labor Force in Louisville?
65.8% of People are in the Labor Force in Louisville.
What is the Unemployment Rate in Louisville?
Unemployment Rate in Louisville is 5.3%.