Port St Lucie, FL Map & Demographics
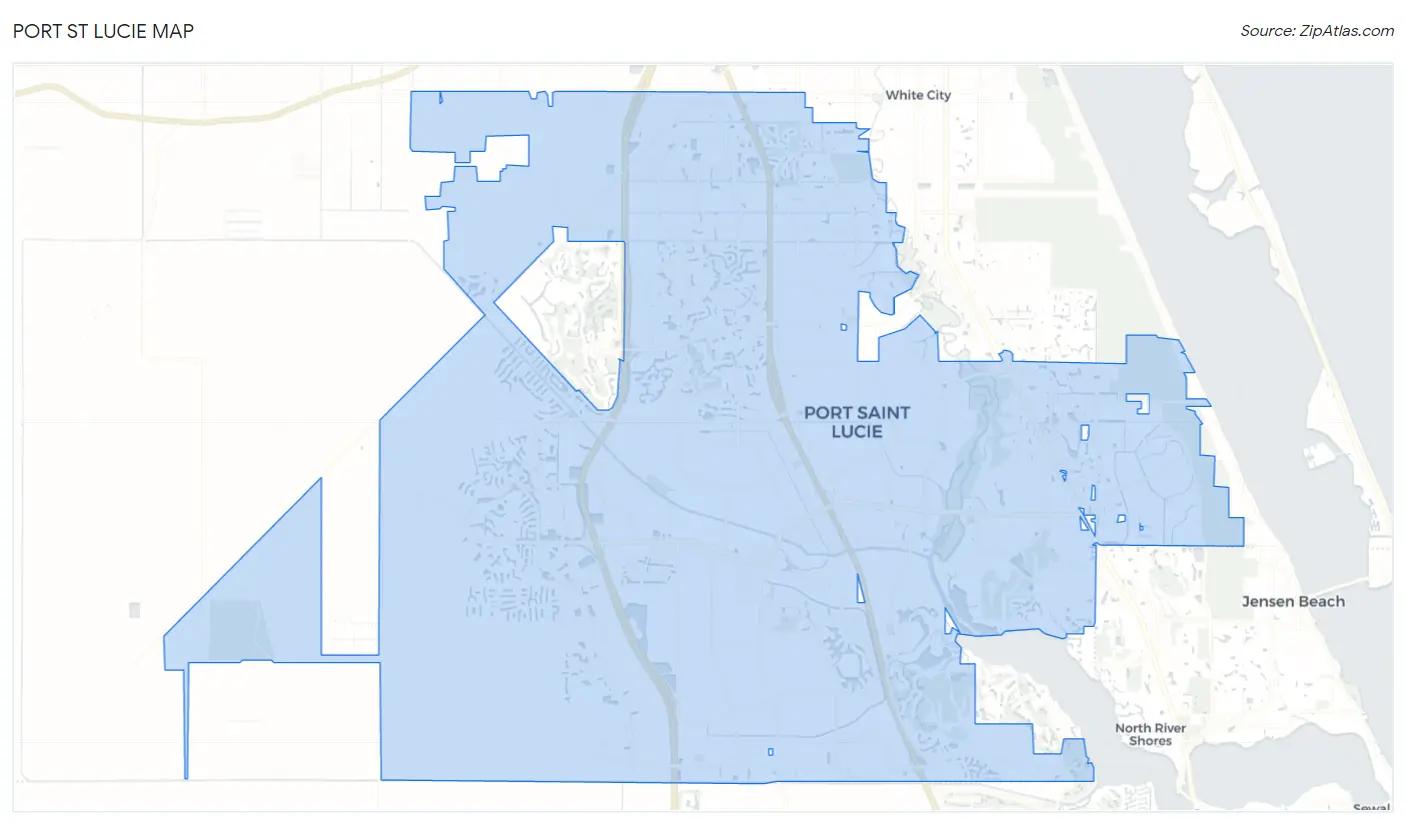
Port St Lucie Map
Port St Lucie Overview
$35,301
PER CAPITA INCOME
$82,429
AVG FAMILY INCOME
$75,040
AVG HOUSEHOLD INCOME
24.7%
WAGE / INCOME GAP [ % ]
75.3¢/ $1
WAGE / INCOME GAP [ $ ]
$9,639
FAMILY INCOME DEFICIT
0.41
INEQUALITY / GINI INDEX
210,520
TOTAL POPULATION
103,284
MALE POPULATION
107,236
FEMALE POPULATION
96.31
MALES / 100 FEMALES
103.83
FEMALES / 100 MALES
43.5
MEDIAN AGE
3.2
AVG FAMILY SIZE
2.8
AVG HOUSEHOLD SIZE
102,881
LABOR FORCE [ PEOPLE ]
59.9%
PERCENT IN LABOR FORCE
5.7%
UNEMPLOYMENT RATE
Port St Lucie Area Codes
Income in Port St Lucie
Income Overview in Port St Lucie
Per Capita Income in Port St Lucie is $35,301, while median incomes of families and households are $82,429 and $75,040 respectively.
| Characteristic | Number | Measure |
| Per Capita Income | 210,520 | $35,301 |
| Median Family Income | 56,177 | $82,429 |
| Mean Family Income | 56,177 | $103,003 |
| Median Household Income | 74,960 | $75,040 |
| Mean Household Income | 74,960 | $94,089 |
| Income Deficit | 56,177 | $9,639 |
| Wage / Income Gap (%) | 210,520 | 24.71% |
| Wage / Income Gap ($) | 210,520 | 75.29¢ per $1 |
| Gini / Inequality Index | 210,520 | 0.41 |
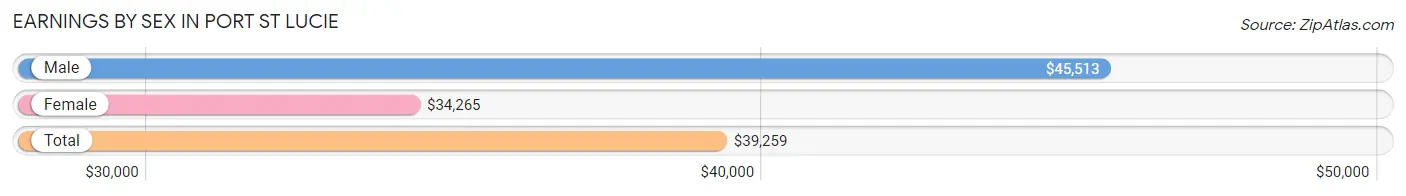
Earnings by Sex in Port St Lucie
Average Earnings in Port St Lucie are $39,259, $45,513 for men and $34,265 for women, a difference of 24.7%.
| Sex | Number | Average Earnings |
| Male | 54,721 (52.2%) | $45,513 |
| Female | 50,081 (47.8%) | $34,265 |
| Total | 104,802 (100.0%) | $39,259 |
Earnings by Sex by Income Bracket in Port St Lucie
The most common earnings brackets in Port St Lucie are $100,000+ for men (6,904 | 12.6%) and $30,000 to $34,999 for women (4,930 | 9.8%).
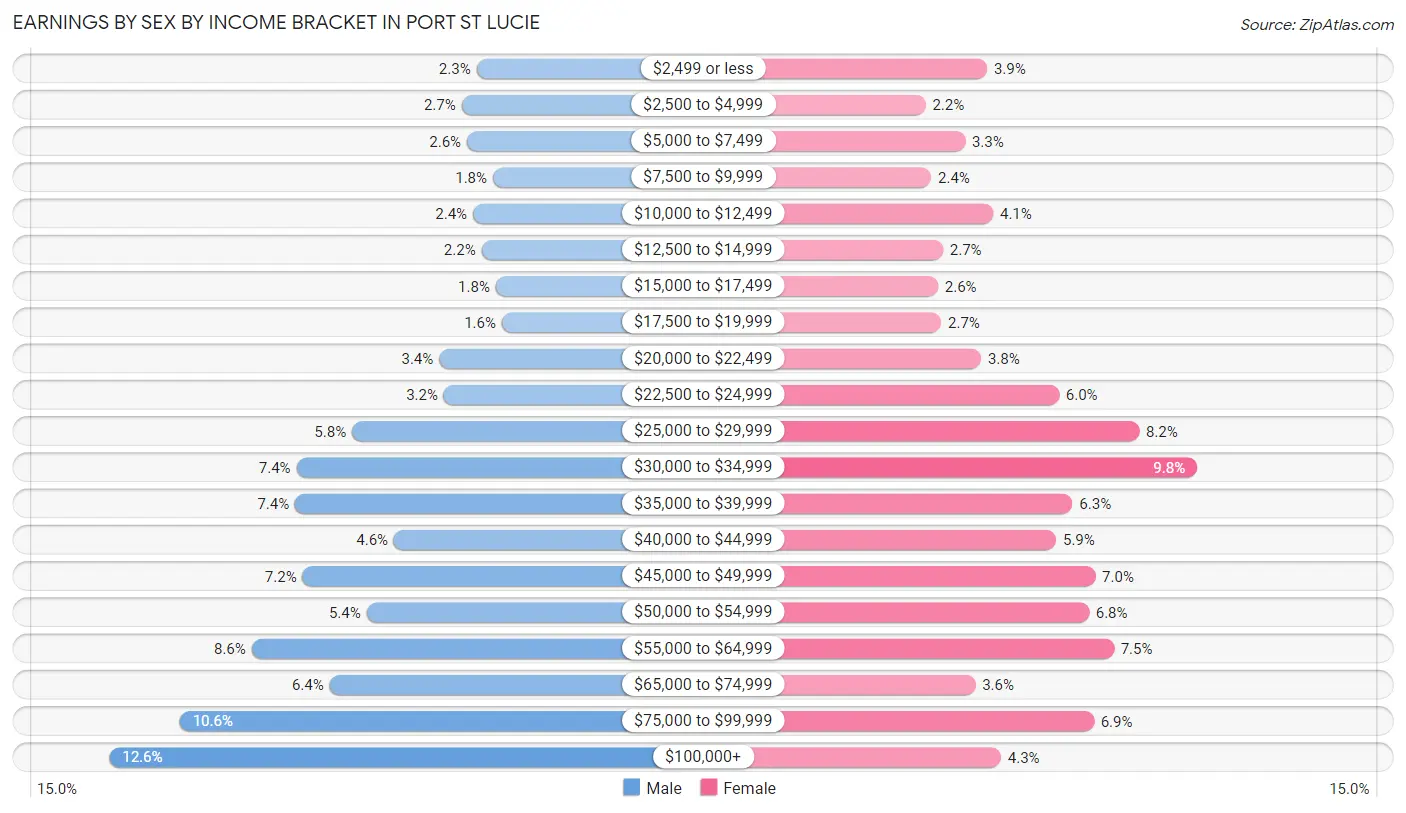
| Income | Male | Female |
| $2,499 or less | 1,256 (2.3%) | 1,972 (3.9%) |
| $2,500 to $4,999 | 1,491 (2.7%) | 1,105 (2.2%) |
| $5,000 to $7,499 | 1,409 (2.6%) | 1,661 (3.3%) |
| $7,500 to $9,999 | 1,008 (1.8%) | 1,185 (2.4%) |
| $10,000 to $12,499 | 1,315 (2.4%) | 2,060 (4.1%) |
| $12,500 to $14,999 | 1,181 (2.2%) | 1,351 (2.7%) |
| $15,000 to $17,499 | 963 (1.8%) | 1,280 (2.6%) |
| $17,500 to $19,999 | 872 (1.6%) | 1,325 (2.6%) |
| $20,000 to $22,499 | 1,833 (3.4%) | 1,888 (3.8%) |
| $22,500 to $24,999 | 1,764 (3.2%) | 2,985 (6.0%) |
| $25,000 to $29,999 | 3,176 (5.8%) | 4,110 (8.2%) |
| $30,000 to $34,999 | 4,029 (7.4%) | 4,930 (9.8%) |
| $35,000 to $39,999 | 4,047 (7.4%) | 3,174 (6.3%) |
| $40,000 to $44,999 | 2,526 (4.6%) | 2,947 (5.9%) |
| $45,000 to $49,999 | 3,935 (7.2%) | 3,494 (7.0%) |
| $50,000 to $54,999 | 2,950 (5.4%) | 3,408 (6.8%) |
| $55,000 to $64,999 | 4,719 (8.6%) | 3,757 (7.5%) |
| $65,000 to $74,999 | 3,520 (6.4%) | 1,807 (3.6%) |
| $75,000 to $99,999 | 5,823 (10.6%) | 3,475 (6.9%) |
| $100,000+ | 6,904 (12.6%) | 2,167 (4.3%) |
| Total | 54,721 (100.0%) | 50,081 (100.0%) |
Earnings by Sex by Educational Attainment in Port St Lucie
Average earnings in Port St Lucie are $49,511 for men and $37,401 for women, a difference of 24.5%. Men with an educational attainment of graduate degree enjoy the highest average annual earnings of $64,989, while those with less than high school education earn the least with $38,771. Women with an educational attainment of graduate degree earn the most with the average annual earnings of $54,181, while those with less than high school education have the smallest earnings of $27,276.
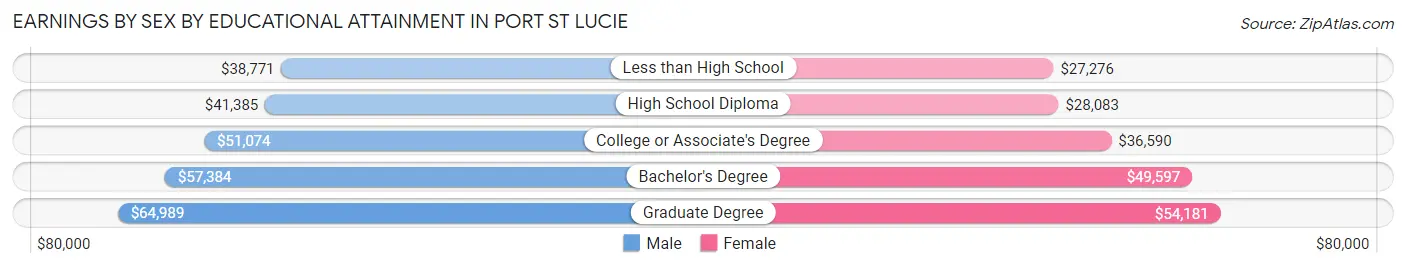
| Educational Attainment | Male Income | Female Income |
| Less than High School | $38,771 | $27,276 |
| High School Diploma | $41,385 | $28,083 |
| College or Associate's Degree | $51,074 | $36,590 |
| Bachelor's Degree | $57,384 | $49,597 |
| Graduate Degree | $64,989 | $54,181 |
| Total | $49,511 | $37,401 |
Family Income in Port St Lucie
Family Income Brackets in Port St Lucie
According to the Port St Lucie family income data, there are 12,527 families falling into the $100,000 to $149,999 income range, which is the most common income bracket and makes up 22.3% of all families. Conversely, the $10,000 to $14,999 income bracket is the least frequent group with only 674 families (1.2%) belonging to this category.
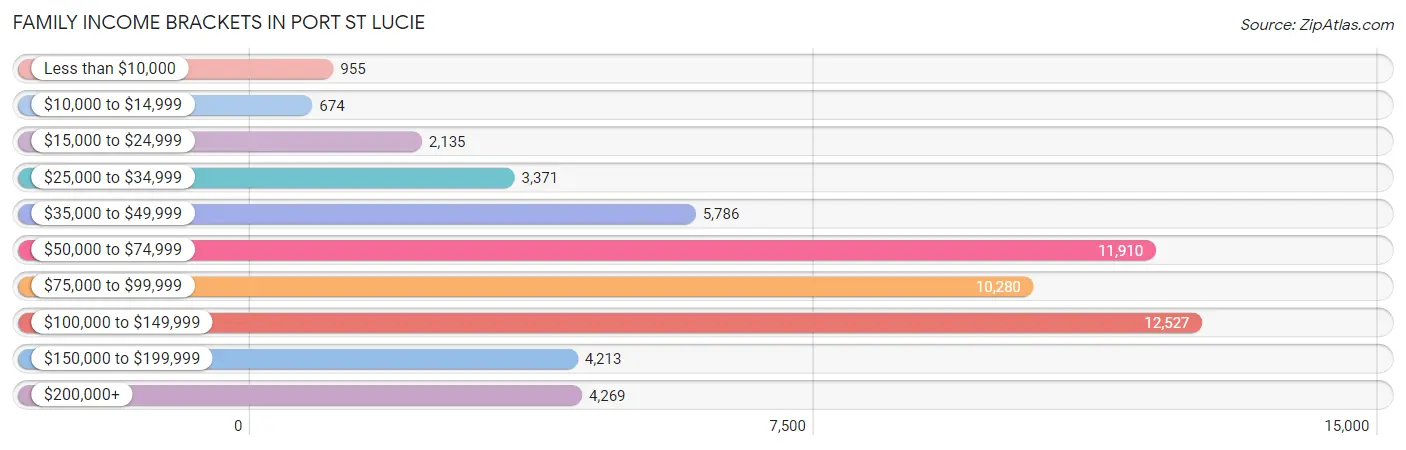
| Income Bracket | # Families | % Families |
| Less than $10,000 | 955 | 1.7% |
| $10,000 to $14,999 | 674 | 1.2% |
| $15,000 to $24,999 | 2,135 | 3.8% |
| $25,000 to $34,999 | 3,371 | 6.0% |
| $35,000 to $49,999 | 5,786 | 10.3% |
| $50,000 to $74,999 | 11,910 | 21.2% |
| $75,000 to $99,999 | 10,280 | 18.3% |
| $100,000 to $149,999 | 12,527 | 22.3% |
| $150,000 to $199,999 | 4,213 | 7.5% |
| $200,000+ | 4,269 | 7.6% |
Family Income by Famaliy Size in Port St Lucie
6-person families (1,553 | 2.8%) account for the highest median family income in Port St Lucie with $103,250 per family, while 2-person families (27,358 | 48.7%) have the highest median income of $36,828 per family member.
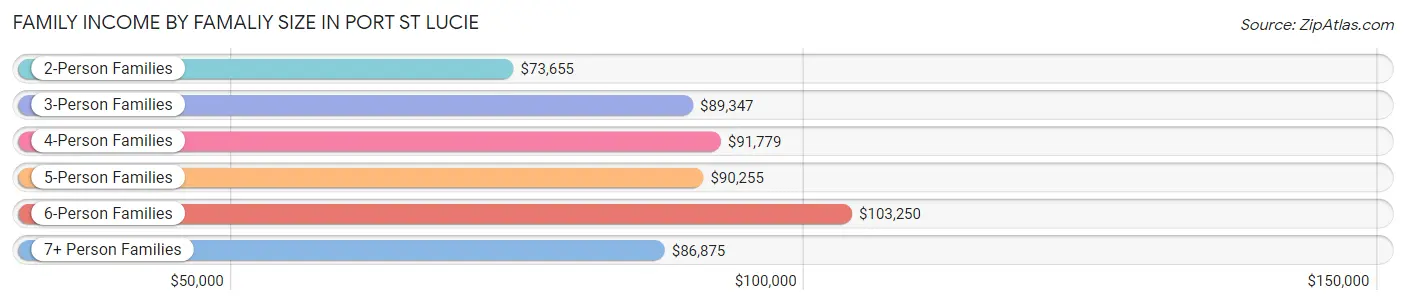
| Income Bracket | # Families | Median Income |
| 2-Person Families | 27,358 (48.7%) | $73,655 |
| 3-Person Families | 13,124 (23.4%) | $89,347 |
| 4-Person Families | 9,688 (17.2%) | $91,779 |
| 5-Person Families | 3,813 (6.8%) | $90,255 |
| 6-Person Families | 1,553 (2.8%) | $103,250 |
| 7+ Person Families | 641 (1.1%) | $86,875 |
| Total | 56,177 (100.0%) | $82,429 |
Family Income by Number of Earners in Port St Lucie
The median family income in Port St Lucie is $82,429, with families comprising 3+ earners (6,975) having the highest median family income of $120,296, while families with no earners (11,082) have the lowest median family income of $55,977, accounting for 12.4% and 19.7% of families, respectively.
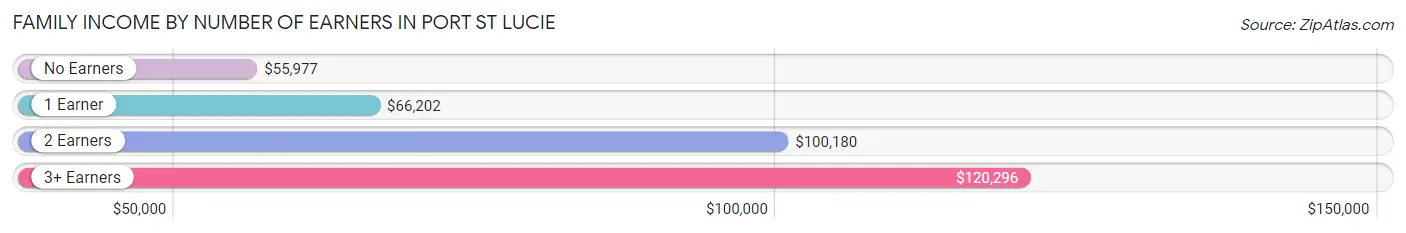
| Number of Earners | # Families | Median Income |
| No Earners | 11,082 (19.7%) | $55,977 |
| 1 Earner | 18,093 (32.2%) | $66,202 |
| 2 Earners | 20,027 (35.6%) | $100,180 |
| 3+ Earners | 6,975 (12.4%) | $120,296 |
| Total | 56,177 (100.0%) | $82,429 |
Household Income in Port St Lucie
Household Income Brackets in Port St Lucie
With 15,667 households falling in the category, the $50,000 to $74,999 income range is the most frequent in Port St Lucie, accounting for 20.9% of all households. In contrast, only 1,274 households (1.7%) fall into the $10,000 to $14,999 income bracket, making it the least populous group.
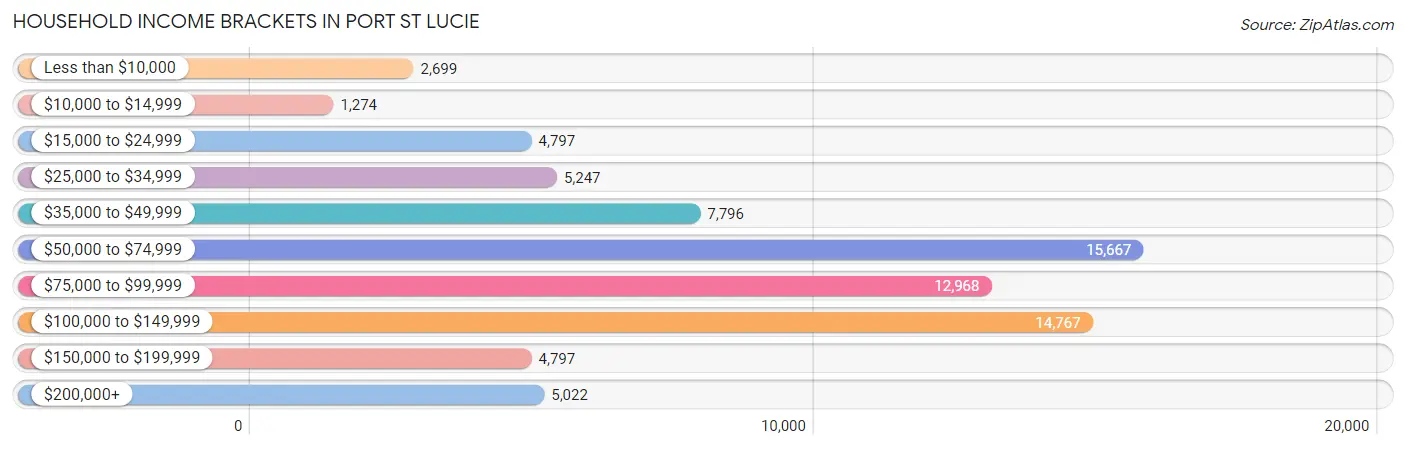
| Income Bracket | # Households | % Households |
| Less than $10,000 | 2,699 | 3.6% |
| $10,000 to $14,999 | 1,274 | 1.7% |
| $15,000 to $24,999 | 4,797 | 6.4% |
| $25,000 to $34,999 | 5,247 | 7.0% |
| $35,000 to $49,999 | 7,796 | 10.4% |
| $50,000 to $74,999 | 15,667 | 20.9% |
| $75,000 to $99,999 | 12,968 | 17.3% |
| $100,000 to $149,999 | 14,767 | 19.7% |
| $150,000 to $199,999 | 4,797 | 6.4% |
| $200,000+ | 5,022 | 6.7% |
Household Income by Householder Age in Port St Lucie
The median household income in Port St Lucie is $75,040, with the highest median household income of $85,048 found in the 45 to 64 years age bracket for the primary householder. A total of 30,296 households (40.4%) fall into this category. Meanwhile, the 15 to 24 years age bracket for the primary householder has the lowest median household income of $0, with 674 households (0.9%) in this group.
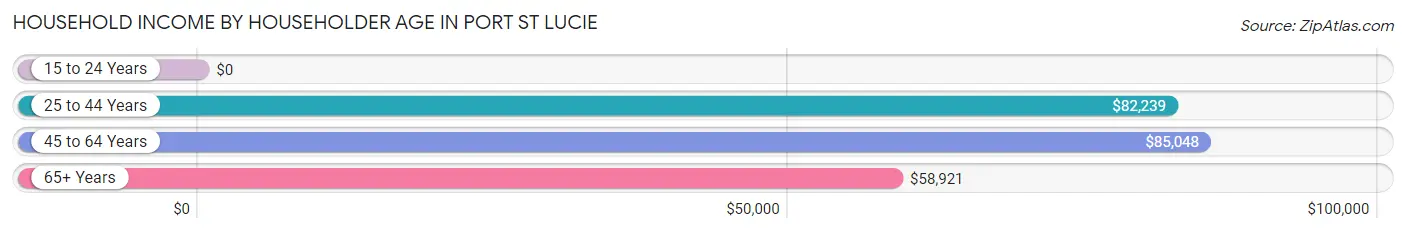
| Income Bracket | # Households | Median Income |
| 15 to 24 Years | 674 (0.9%) | $0 |
| 25 to 44 Years | 19,805 (26.4%) | $82,239 |
| 45 to 64 Years | 30,296 (40.4%) | $85,048 |
| 65+ Years | 24,185 (32.3%) | $58,921 |
| Total | 74,960 (100.0%) | $75,040 |
Poverty in Port St Lucie
Income Below Poverty by Sex and Age in Port St Lucie
With 7.0% poverty level for males and 9.9% for females among the residents of Port St Lucie, under 5 year old males and 5 year old females are the most vulnerable to poverty, with 896 males (15.7%) and 259 females (23.4%) in their respective age groups living below the poverty level.
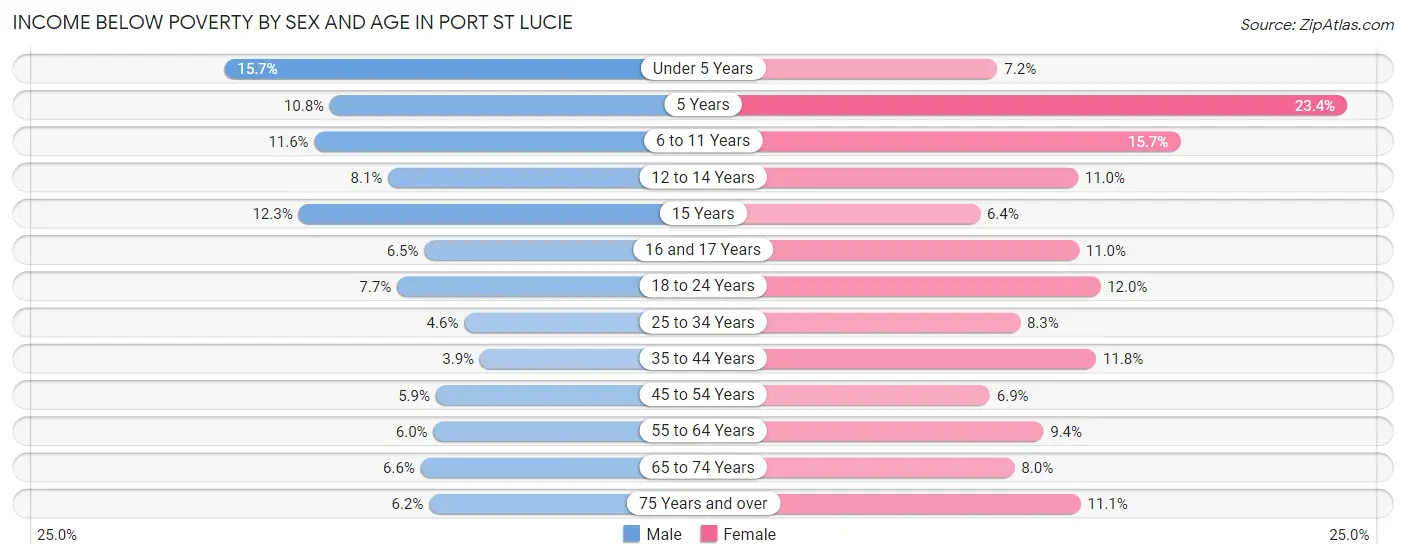
| Age Bracket | Male | Female |
| Under 5 Years | 896 (15.7%) | 361 (7.2%) |
| 5 Years | 120 (10.8%) | 259 (23.4%) |
| 6 to 11 Years | 777 (11.6%) | 1,045 (15.7%) |
| 12 to 14 Years | 378 (8.1%) | 472 (11.0%) |
| 15 Years | 222 (12.3%) | 72 (6.4%) |
| 16 and 17 Years | 146 (6.5%) | 314 (11.0%) |
| 18 to 24 Years | 592 (7.7%) | 890 (12.0%) |
| 25 to 34 Years | 575 (4.6%) | 1,039 (8.3%) |
| 35 to 44 Years | 485 (3.9%) | 1,555 (11.8%) |
| 45 to 54 Years | 785 (5.9%) | 934 (6.9%) |
| 55 to 64 Years | 840 (6.0%) | 1,399 (9.3%) |
| 65 to 74 Years | 737 (6.6%) | 1,040 (8.0%) |
| 75 Years and over | 594 (6.2%) | 1,194 (11.1%) |
| Total | 7,147 (7.0%) | 10,574 (9.9%) |
Income Above Poverty by Sex and Age in Port St Lucie
According to the poverty statistics in Port St Lucie, males aged 35 to 44 years and females aged 15 years are the age groups that are most secure financially, with 96.1% of males and 93.6% of females in these age groups living above the poverty line.
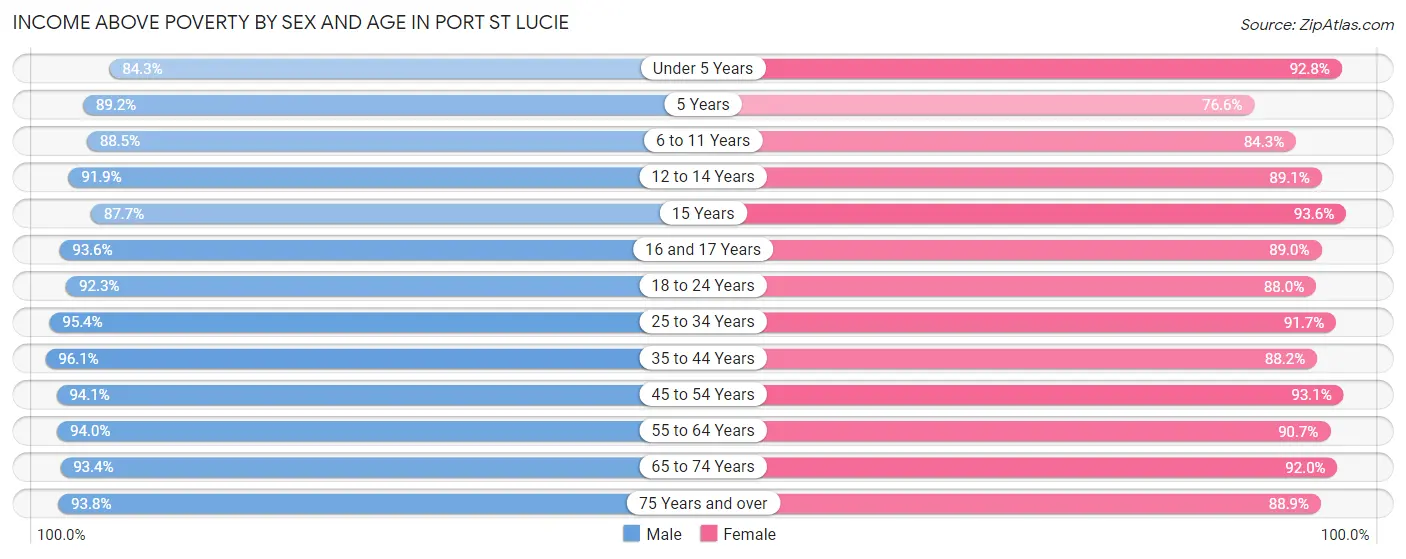
| Age Bracket | Male | Female |
| Under 5 Years | 4,799 (84.3%) | 4,637 (92.8%) |
| 5 Years | 988 (89.2%) | 846 (76.6%) |
| 6 to 11 Years | 5,952 (88.4%) | 5,613 (84.3%) |
| 12 to 14 Years | 4,274 (91.9%) | 3,839 (89.0%) |
| 15 Years | 1,584 (87.7%) | 1,052 (93.6%) |
| 16 and 17 Years | 2,119 (93.5%) | 2,541 (89.0%) |
| 18 to 24 Years | 7,075 (92.3%) | 6,533 (88.0%) |
| 25 to 34 Years | 11,920 (95.4%) | 11,526 (91.7%) |
| 35 to 44 Years | 12,052 (96.1%) | 11,618 (88.2%) |
| 45 to 54 Years | 12,477 (94.1%) | 12,669 (93.1%) |
| 55 to 64 Years | 13,091 (94.0%) | 13,571 (90.6%) |
| 65 to 74 Years | 10,394 (93.4%) | 11,949 (92.0%) |
| 75 Years and over | 8,943 (93.8%) | 9,578 (88.9%) |
| Total | 95,668 (93.0%) | 95,972 (90.1%) |
Income Below Poverty Among Married-Couple Families in Port St Lucie
The poverty statistics for married-couple families in Port St Lucie show that 3.8% or 1,568 of the total 41,673 families live below the poverty line. Families with 3 or 4 children have the highest poverty rate of 12.9%, comprising of 330 families. On the other hand, families with 1 or 2 children have the lowest poverty rate of 3.1%, which includes 374 families.
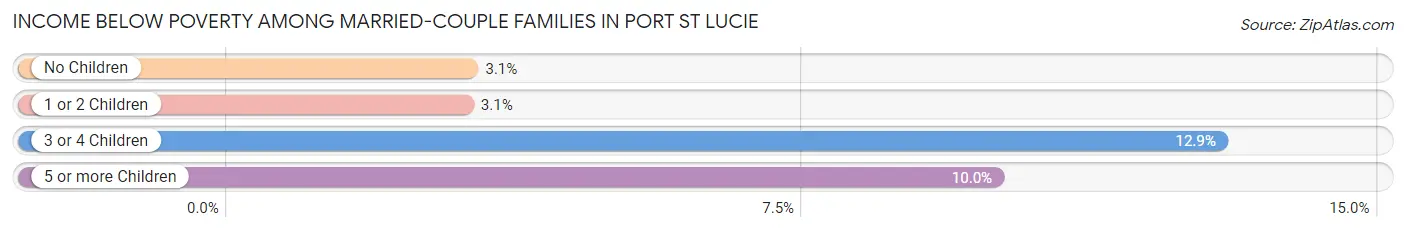
| Children | Above Poverty | Below Poverty |
| No Children | 25,908 (96.9%) | 840 (3.1%) |
| 1 or 2 Children | 11,756 (96.9%) | 374 (3.1%) |
| 3 or 4 Children | 2,225 (87.1%) | 330 (12.9%) |
| 5 or more Children | 216 (90.0%) | 24 (10.0%) |
| Total | 40,105 (96.2%) | 1,568 (3.8%) |
Income Below Poverty Among Single-Parent Households in Port St Lucie
According to the poverty data in Port St Lucie, 2.8% or 107 single-father households and 14.1% or 1,505 single-mother households are living below the poverty line. Among single-father households, those with 1 or 2 children have the highest poverty rate, with 107 households (6.4%) experiencing poverty. Likewise, among single-mother households, those with 3 or 4 children have the highest poverty rate, with 386 households (51.5%) falling below the poverty line.
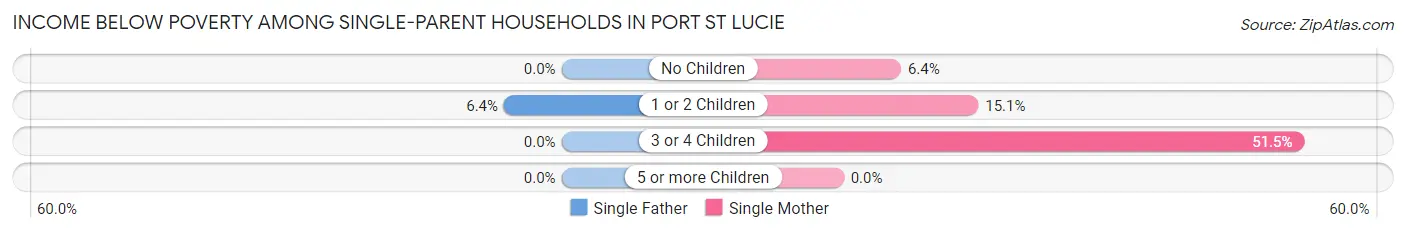
| Children | Single Father | Single Mother |
| No Children | 0 (0.0%) | 279 (6.4%) |
| 1 or 2 Children | 107 (6.4%) | 840 (15.0%) |
| 3 or 4 Children | 0 (0.0%) | 386 (51.5%) |
| 5 or more Children | 0 (0.0%) | 0 (0.0%) |
| Total | 107 (2.8%) | 1,505 (14.1%) |
Income Below Poverty Among Married-Couple vs Single-Parent Households in Port St Lucie
The poverty data for Port St Lucie shows that 1,568 of the married-couple family households (3.8%) and 1,612 of the single-parent households (11.1%) are living below the poverty level. Within the married-couple family households, those with 3 or 4 children have the highest poverty rate, with 330 households (12.9%) falling below the poverty line. Among the single-parent households, those with 3 or 4 children have the highest poverty rate, with 386 household (44.2%) living below poverty.
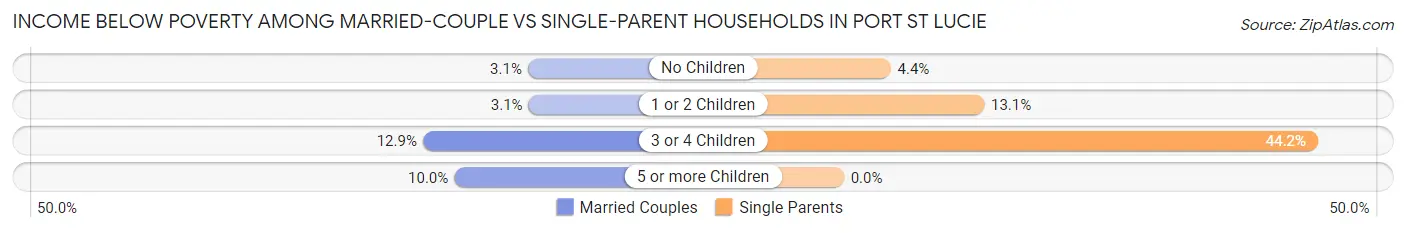
| Children | Married-Couple Families | Single-Parent Households |
| No Children | 840 (3.1%) | 279 (4.4%) |
| 1 or 2 Children | 374 (3.1%) | 947 (13.1%) |
| 3 or 4 Children | 330 (12.9%) | 386 (44.2%) |
| 5 or more Children | 24 (10.0%) | 0 (0.0%) |
| Total | 1,568 (3.8%) | 1,612 (11.1%) |
Race in Port St Lucie
The most populous races in Port St Lucie are White / Caucasian (133,173 | 63.3%), Hispanic or Latino (48,177 | 22.9%), and Black / African American (38,528 | 18.3%).
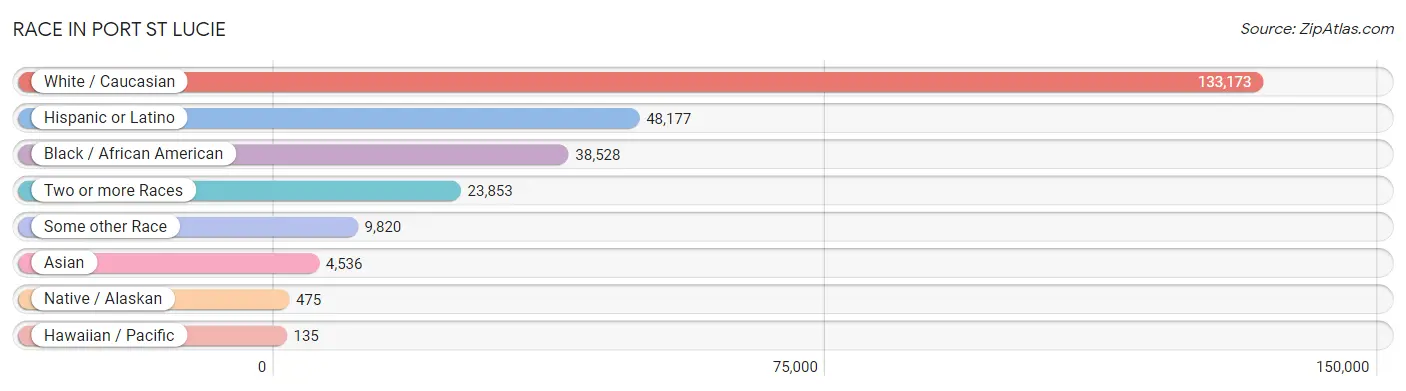
| Race | # Population | % Population |
| Asian | 4,536 | 2.1% |
| Black / African American | 38,528 | 18.3% |
| Hawaiian / Pacific | 135 | 0.1% |
| Hispanic or Latino | 48,177 | 22.9% |
| Native / Alaskan | 475 | 0.2% |
| White / Caucasian | 133,173 | 63.3% |
| Two or more Races | 23,853 | 11.3% |
| Some other Race | 9,820 | 4.7% |
| Total | 210,520 | 100.0% |
Ancestry in Port St Lucie
The most populous ancestries reported in Port St Lucie are American (44,953 | 21.3%), Irish (19,996 | 9.5%), Italian (19,027 | 9.0%), German (17,752 | 8.4%), and Puerto Rican (14,634 | 7.0%), together accounting for 55.3% of all Port St Lucie residents.
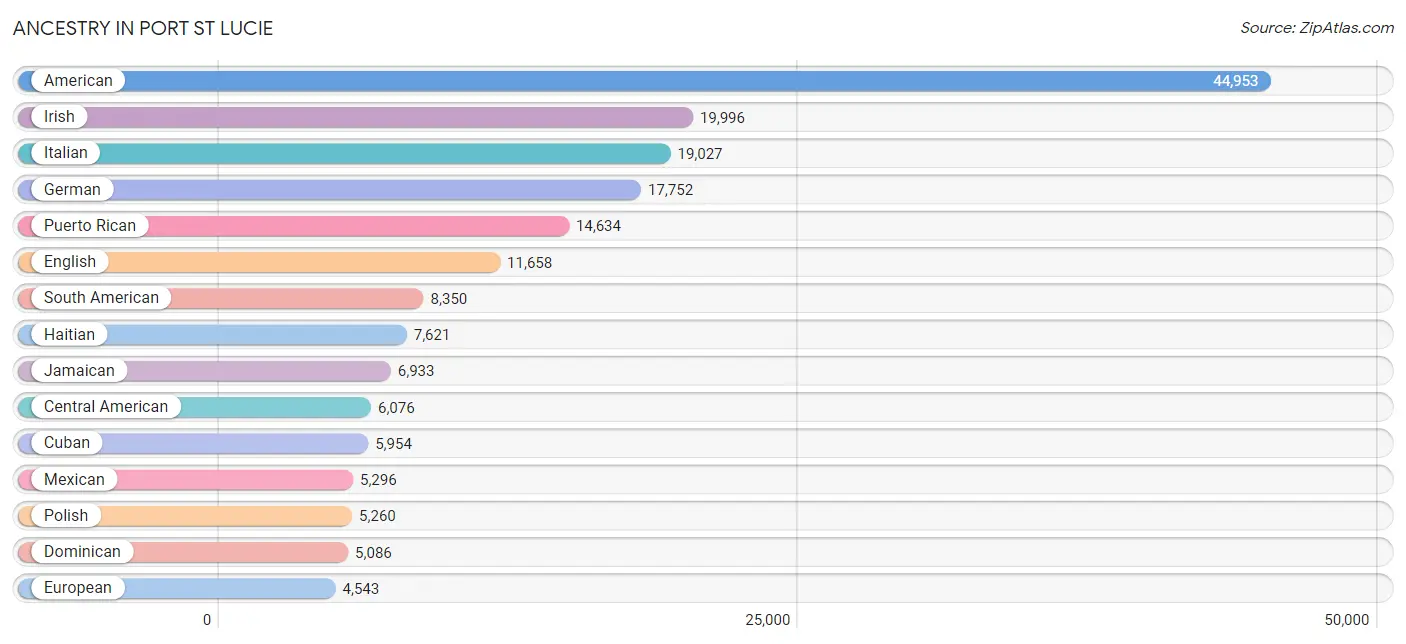
| Ancestry | # Population | % Population |
| African | 926 | 0.4% |
| American | 44,953 | 21.3% |
| Apache | 286 | 0.1% |
| Arab | 1,000 | 0.5% |
| Argentinean | 302 | 0.1% |
| Armenian | 164 | 0.1% |
| Austrian | 503 | 0.2% |
| Bahamian | 262 | 0.1% |
| Barbadian | 114 | 0.1% |
| Basque | 14 | 0.0% |
| Belgian | 105 | 0.1% |
| Belizean | 14 | 0.0% |
| Bhutanese | 525 | 0.3% |
| Blackfeet | 69 | 0.0% |
| Bolivian | 497 | 0.2% |
| Brazilian | 1,890 | 0.9% |
| British | 1,055 | 0.5% |
| British West Indian | 597 | 0.3% |
| Burmese | 355 | 0.2% |
| Canadian | 773 | 0.4% |
| Cape Verdean | 12 | 0.0% |
| Carpatho Rusyn | 12 | 0.0% |
| Central American | 6,076 | 2.9% |
| Central American Indian | 279 | 0.1% |
| Cherokee | 462 | 0.2% |
| Cheyenne | 15 | 0.0% |
| Chickasaw | 44 | 0.0% |
| Chilean | 362 | 0.2% |
| Colombian | 2,733 | 1.3% |
| Costa Rican | 254 | 0.1% |
| Croatian | 289 | 0.1% |
| Cuban | 5,954 | 2.8% |
| Czech | 256 | 0.1% |
| Czechoslovakian | 76 | 0.0% |
| Danish | 271 | 0.1% |
| Dominican | 5,086 | 2.4% |
| Dutch | 1,549 | 0.7% |
| Eastern European | 333 | 0.2% |
| Ecuadorian | 1,558 | 0.7% |
| Egyptian | 31 | 0.0% |
| English | 11,658 | 5.5% |
| Estonian | 45 | 0.0% |
| European | 4,543 | 2.2% |
| Finnish | 551 | 0.3% |
| French | 3,020 | 1.4% |
| French American Indian | 38 | 0.0% |
| French Canadian | 973 | 0.5% |
| German | 17,752 | 8.4% |
| German Russian | 51 | 0.0% |
| Ghanaian | 35 | 0.0% |
| Greek | 423 | 0.2% |
| Guamanian / Chamorro | 38 | 0.0% |
| Guatemalan | 1,328 | 0.6% |
| Guyanese | 332 | 0.2% |
| Haitian | 7,621 | 3.6% |
| Honduran | 2,159 | 1.0% |
| Hungarian | 1,251 | 0.6% |
| Indian (Asian) | 552 | 0.3% |
| Iranian | 53 | 0.0% |
| Irish | 19,996 | 9.5% |
| Iroquois | 21 | 0.0% |
| Israeli | 86 | 0.0% |
| Italian | 19,027 | 9.0% |
| Jamaican | 6,933 | 3.3% |
| Japanese | 44 | 0.0% |
| Jordanian | 53 | 0.0% |
| Korean | 1,829 | 0.9% |
| Laotian | 20 | 0.0% |
| Latvian | 39 | 0.0% |
| Lebanese | 323 | 0.2% |
| Lithuanian | 293 | 0.1% |
| Lumbee | 85 | 0.0% |
| Malaysian | 73 | 0.0% |
| Maltese | 53 | 0.0% |
| Mexican | 5,296 | 2.5% |
| Mexican American Indian | 144 | 0.1% |
| Moroccan | 173 | 0.1% |
| Native Hawaiian | 5 | 0.0% |
| Navajo | 44 | 0.0% |
| New Zealander | 10 | 0.0% |
| Nicaraguan | 1,204 | 0.6% |
| Nigerian | 31 | 0.0% |
| Northern European | 69 | 0.0% |
| Norwegian | 945 | 0.4% |
| Okinawan | 15 | 0.0% |
| Pakistani | 194 | 0.1% |
| Palestinian | 279 | 0.1% |
| Panamanian | 283 | 0.1% |
| Paraguayan | 12 | 0.0% |
| Pennsylvania German | 104 | 0.1% |
| Peruvian | 1,912 | 0.9% |
| Polish | 5,260 | 2.5% |
| Portuguese | 1,345 | 0.6% |
| Puerto Rican | 14,634 | 7.0% |
| Romanian | 336 | 0.2% |
| Russian | 1,434 | 0.7% |
| Salvadoran | 848 | 0.4% |
| Samoan | 107 | 0.1% |
| Scandinavian | 127 | 0.1% |
| Scotch-Irish | 924 | 0.4% |
| Scottish | 1,354 | 0.6% |
| Serbian | 28 | 0.0% |
| Slavic | 90 | 0.0% |
| Slovak | 446 | 0.2% |
| Slovene | 30 | 0.0% |
| South African | 136 | 0.1% |
| South American | 8,350 | 4.0% |
| South American Indian | 122 | 0.1% |
| Spaniard | 403 | 0.2% |
| Spanish | 417 | 0.2% |
| Sri Lankan | 828 | 0.4% |
| Subsaharan African | 1,140 | 0.5% |
| Swedish | 1,192 | 0.6% |
| Swiss | 233 | 0.1% |
| Syrian | 62 | 0.0% |
| Thai | 1,061 | 0.5% |
| Tlingit-Haida | 10 | 0.0% |
| Trinidadian and Tobagonian | 1,272 | 0.6% |
| U.S. Virgin Islander | 180 | 0.1% |
| Ukrainian | 490 | 0.2% |
| Uruguayan | 30 | 0.0% |
| Venezuelan | 944 | 0.4% |
| Welsh | 403 | 0.2% |
| West Indian | 247 | 0.1% |
| Yaqui | 41 | 0.0% |
| Yugoslavian | 110 | 0.1% | View All 126 Rows |
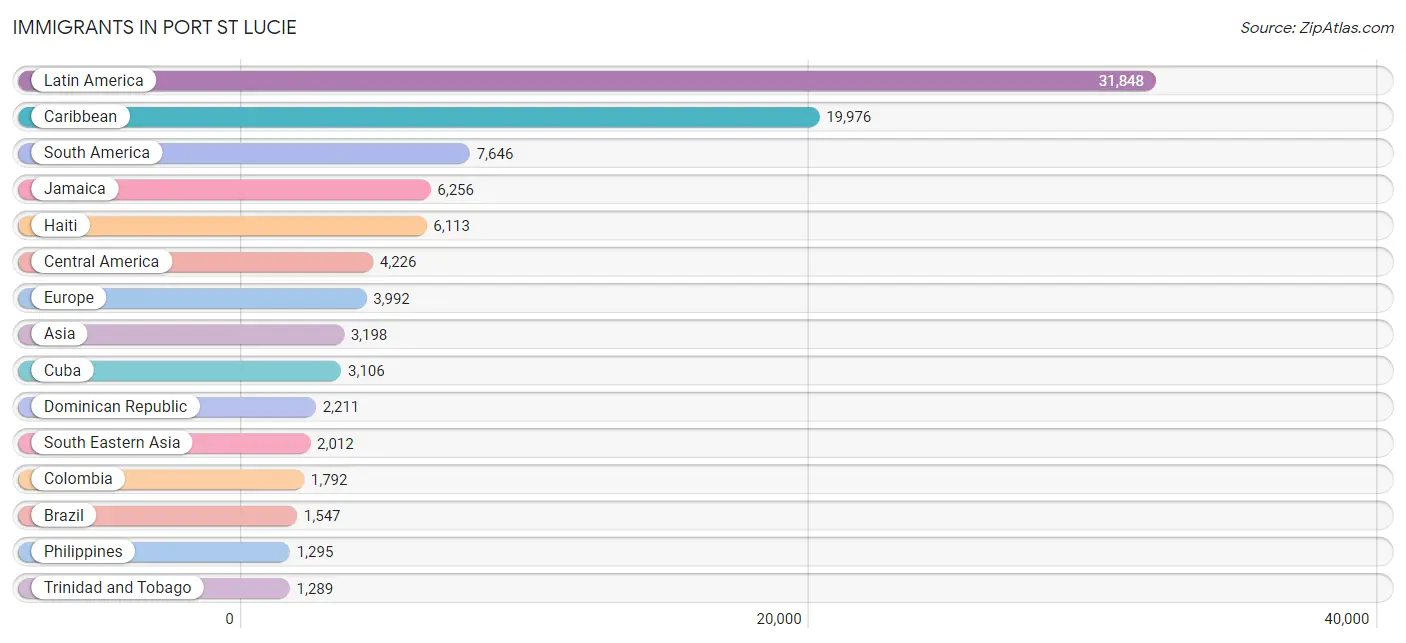
Immigrants in Port St Lucie
The most numerous immigrant groups reported in Port St Lucie came from Latin America (31,848 | 15.1%), Caribbean (19,976 | 9.5%), South America (7,646 | 3.6%), Jamaica (6,256 | 3.0%), and Haiti (6,113 | 2.9%), together accounting for 34.1% of all Port St Lucie residents.
| Immigration Origin | # Population | % Population |
| Africa | 763 | 0.4% |
| Argentina | 227 | 0.1% |
| Asia | 3,198 | 1.5% |
| Australia | 14 | 0.0% |
| Austria | 17 | 0.0% |
| Bahamas | 48 | 0.0% |
| Bangladesh | 8 | 0.0% |
| Barbados | 109 | 0.1% |
| Belarus | 39 | 0.0% |
| Belgium | 109 | 0.1% |
| Belize | 18 | 0.0% |
| Bolivia | 261 | 0.1% |
| Bosnia and Herzegovina | 110 | 0.1% |
| Brazil | 1,547 | 0.7% |
| Canada | 1,264 | 0.6% |
| Caribbean | 19,976 | 9.5% |
| Central America | 4,226 | 2.0% |
| Chile | 255 | 0.1% |
| China | 242 | 0.1% |
| Colombia | 1,792 | 0.9% |
| Costa Rica | 113 | 0.1% |
| Cuba | 3,106 | 1.5% |
| Czechoslovakia | 71 | 0.0% |
| Dominica | 117 | 0.1% |
| Dominican Republic | 2,211 | 1.1% |
| Eastern Africa | 25 | 0.0% |
| Eastern Asia | 541 | 0.3% |
| Eastern Europe | 951 | 0.4% |
| Ecuador | 814 | 0.4% |
| Egypt | 28 | 0.0% |
| El Salvador | 375 | 0.2% |
| England | 497 | 0.2% |
| Europe | 3,992 | 1.9% |
| France | 91 | 0.0% |
| Germany | 459 | 0.2% |
| Ghana | 224 | 0.1% |
| Greece | 44 | 0.0% |
| Grenada | 173 | 0.1% |
| Guatemala | 624 | 0.3% |
| Guyana | 869 | 0.4% |
| Haiti | 6,113 | 2.9% |
| Honduras | 1,142 | 0.5% |
| Hong Kong | 10 | 0.0% |
| Hungary | 201 | 0.1% |
| India | 187 | 0.1% |
| Indonesia | 20 | 0.0% |
| Iran | 21 | 0.0% |
| Ireland | 106 | 0.1% |
| Israel | 47 | 0.0% |
| Italy | 312 | 0.2% |
| Jamaica | 6,256 | 3.0% |
| Japan | 76 | 0.0% |
| Jordan | 32 | 0.0% |
| Kenya | 25 | 0.0% |
| Korea | 223 | 0.1% |
| Laos | 23 | 0.0% |
| Latin America | 31,848 | 15.1% |
| Latvia | 18 | 0.0% |
| Lebanon | 251 | 0.1% |
| Lithuania | 15 | 0.0% |
| Malaysia | 24 | 0.0% |
| Mexico | 1,005 | 0.5% |
| Middle Africa | 21 | 0.0% |
| Moldova | 72 | 0.0% |
| Morocco | 70 | 0.0% |
| Netherlands | 81 | 0.0% |
| Nicaragua | 769 | 0.4% |
| Nigeria | 102 | 0.1% |
| Northern Africa | 98 | 0.1% |
| Northern Europe | 1,205 | 0.6% |
| Norway | 23 | 0.0% |
| Oceania | 24 | 0.0% |
| Pakistan | 59 | 0.0% |
| Panama | 180 | 0.1% |
| Peru | 1,197 | 0.6% |
| Philippines | 1,295 | 0.6% |
| Poland | 82 | 0.0% |
| Portugal | 500 | 0.2% |
| Romania | 46 | 0.0% |
| Russia | 112 | 0.1% |
| Saudi Arabia | 7 | 0.0% |
| Scotland | 11 | 0.0% |
| Singapore | 15 | 0.0% |
| South Africa | 244 | 0.1% |
| South America | 7,646 | 3.6% |
| South Central Asia | 275 | 0.1% |
| South Eastern Asia | 2,012 | 1.0% |
| Southern Europe | 1,043 | 0.5% |
| Spain | 159 | 0.1% |
| St. Vincent and the Grenadines | 206 | 0.1% |
| Sweden | 55 | 0.0% |
| Switzerland | 36 | 0.0% |
| Taiwan | 124 | 0.1% |
| Thailand | 182 | 0.1% |
| Trinidad and Tobago | 1,289 | 0.6% |
| Ukraine | 100 | 0.1% |
| Uruguay | 6 | 0.0% |
| Venezuela | 666 | 0.3% |
| Vietnam | 453 | 0.2% |
| Western Africa | 326 | 0.2% |
| Western Asia | 337 | 0.2% |
| Western Europe | 793 | 0.4% |
| Zaire | 21 | 0.0% | View All 103 Rows |
Sex and Age in Port St Lucie
Sex and Age in Port St Lucie
The most populous age groups in Port St Lucie are 55 to 59 Years (7,053 | 6.8%) for men and 55 to 59 Years (7,708 | 7.2%) for women.
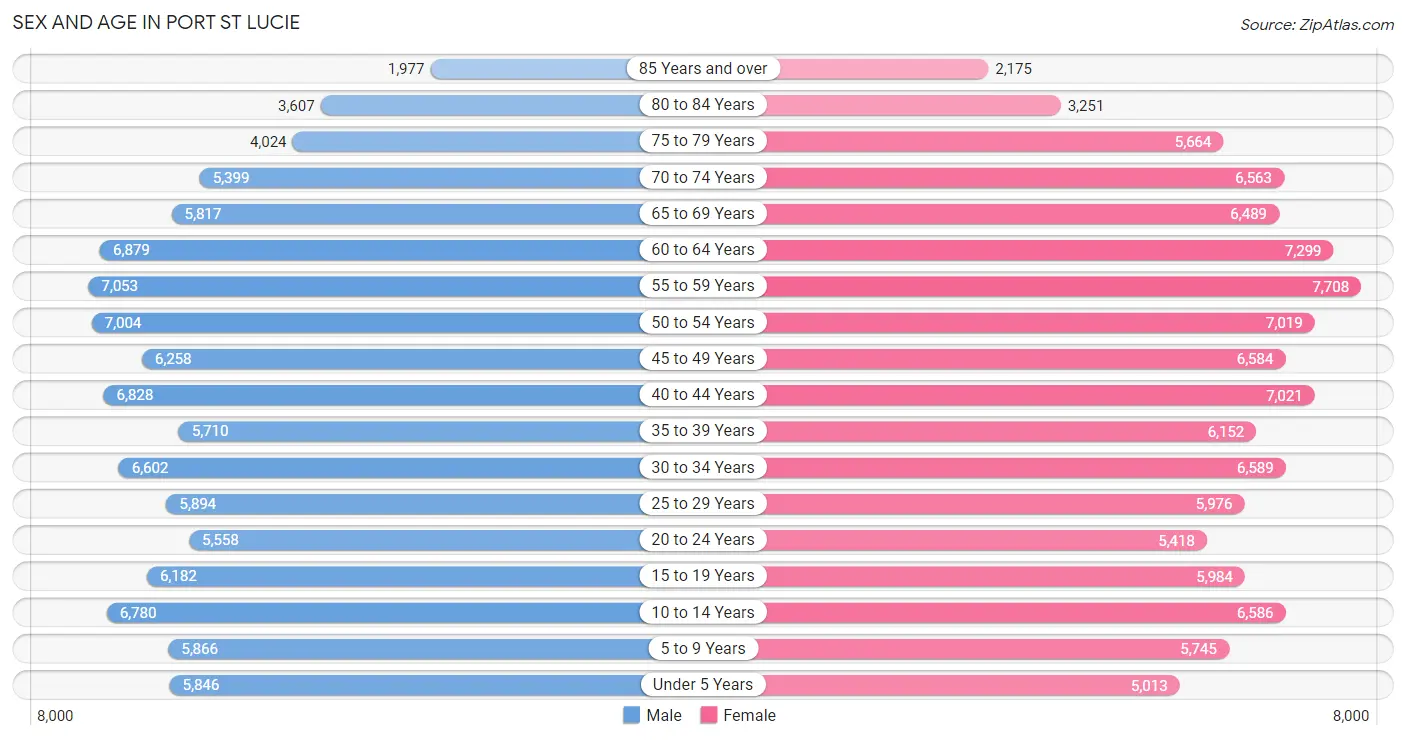
| Age Bracket | Male | Female |
| Under 5 Years | 5,846 (5.7%) | 5,013 (4.7%) |
| 5 to 9 Years | 5,866 (5.7%) | 5,745 (5.4%) |
| 10 to 14 Years | 6,780 (6.6%) | 6,586 (6.1%) |
| 15 to 19 Years | 6,182 (6.0%) | 5,984 (5.6%) |
| 20 to 24 Years | 5,558 (5.4%) | 5,418 (5.1%) |
| 25 to 29 Years | 5,894 (5.7%) | 5,976 (5.6%) |
| 30 to 34 Years | 6,602 (6.4%) | 6,589 (6.1%) |
| 35 to 39 Years | 5,710 (5.5%) | 6,152 (5.7%) |
| 40 to 44 Years | 6,828 (6.6%) | 7,021 (6.6%) |
| 45 to 49 Years | 6,258 (6.1%) | 6,584 (6.1%) |
| 50 to 54 Years | 7,004 (6.8%) | 7,019 (6.6%) |
| 55 to 59 Years | 7,053 (6.8%) | 7,708 (7.2%) |
| 60 to 64 Years | 6,879 (6.7%) | 7,299 (6.8%) |
| 65 to 69 Years | 5,817 (5.6%) | 6,489 (6.0%) |
| 70 to 74 Years | 5,399 (5.2%) | 6,563 (6.1%) |
| 75 to 79 Years | 4,024 (3.9%) | 5,664 (5.3%) |
| 80 to 84 Years | 3,607 (3.5%) | 3,251 (3.0%) |
| 85 Years and over | 1,977 (1.9%) | 2,175 (2.0%) |
| Total | 103,284 (100.0%) | 107,236 (100.0%) |
Families and Households in Port St Lucie
Median Family Size in Port St Lucie
The median family size in Port St Lucie is 3.19 persons per family, with single female/mother families (10,688 | 19.0%) accounting for the largest median family size of 3.4 persons per family. On the other hand, single male/father families (3,816 | 6.8%) represent the smallest median family size with 2.79 persons per family.
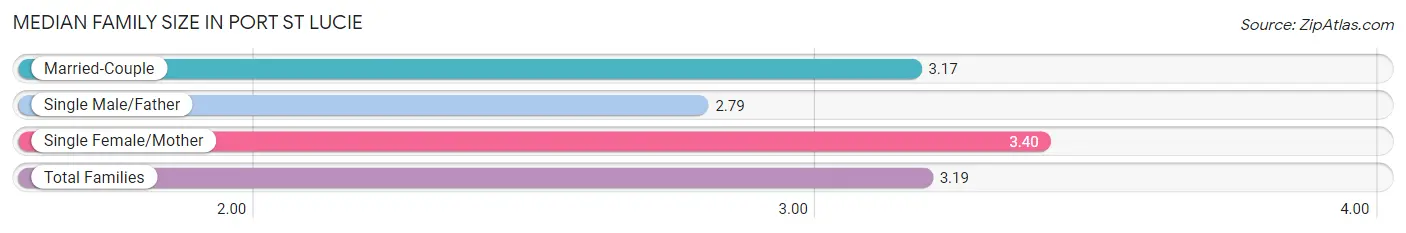
| Family Type | # Families | Family Size |
| Married-Couple | 41,673 (74.2%) | 3.17 |
| Single Male/Father | 3,816 (6.8%) | 2.79 |
| Single Female/Mother | 10,688 (19.0%) | 3.40 |
| Total Families | 56,177 (100.0%) | 3.19 |
Median Household Size in Port St Lucie
The median household size in Port St Lucie is 2.80 persons per household, with single female/mother households (10,688 | 14.3%) accounting for the largest median household size of 3.65 persons per household. non-family households (18,783 | 25.1%) represent the smallest median household size with 1.26 persons per household.
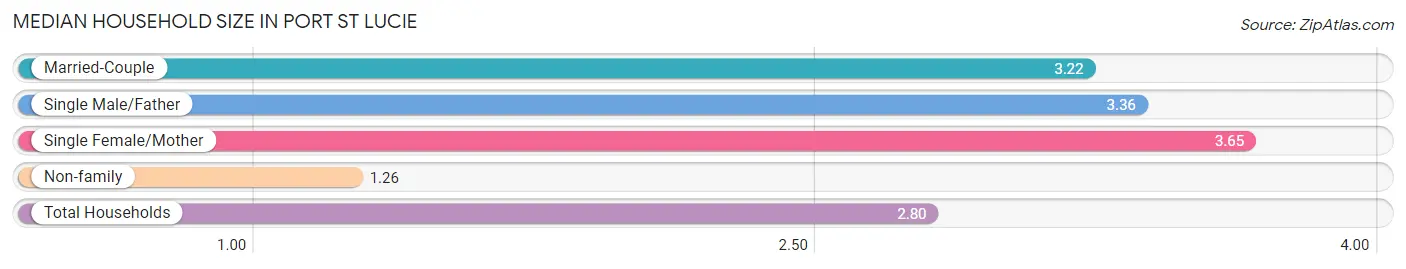
| Household Type | # Households | Household Size |
| Married-Couple | 41,673 (55.6%) | 3.22 |
| Single Male/Father | 3,816 (5.1%) | 3.36 |
| Single Female/Mother | 10,688 (14.3%) | 3.65 |
| Non-family | 18,783 (25.1%) | 1.26 |
| Total Households | 74,960 (100.0%) | 2.80 |
Household Size by Marriage Status in Port St Lucie
Out of a total of 74,960 households in Port St Lucie, 56,177 (74.9%) are family households, while 18,783 (25.1%) are nonfamily households. The most numerous type of family households are 2-person households, comprising 25,589, and the most common type of nonfamily households are 1-person households, comprising 15,405.
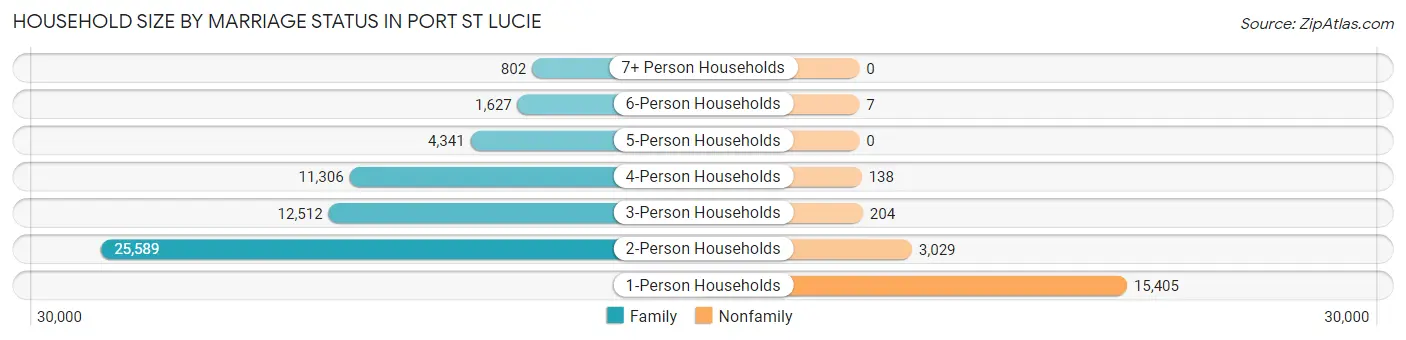
| Household Size | Family Households | Nonfamily Households |
| 1-Person Households | - | 15,405 (20.5%) |
| 2-Person Households | 25,589 (34.1%) | 3,029 (4.0%) |
| 3-Person Households | 12,512 (16.7%) | 204 (0.3%) |
| 4-Person Households | 11,306 (15.1%) | 138 (0.2%) |
| 5-Person Households | 4,341 (5.8%) | 0 (0.0%) |
| 6-Person Households | 1,627 (2.2%) | 7 (0.0%) |
| 7+ Person Households | 802 (1.1%) | 0 (0.0%) |
| Total | 56,177 (74.9%) | 18,783 (25.1%) |
Female Fertility in Port St Lucie
Fertility by Age in Port St Lucie
Average fertility rate in Port St Lucie is 53.0 births per 1,000 women. Women in the age bracket of 20 to 34 years have the highest fertility rate with 96.0 births per 1,000 women. Women in the age bracket of 20 to 34 years acount for 72.9% of all women with births.
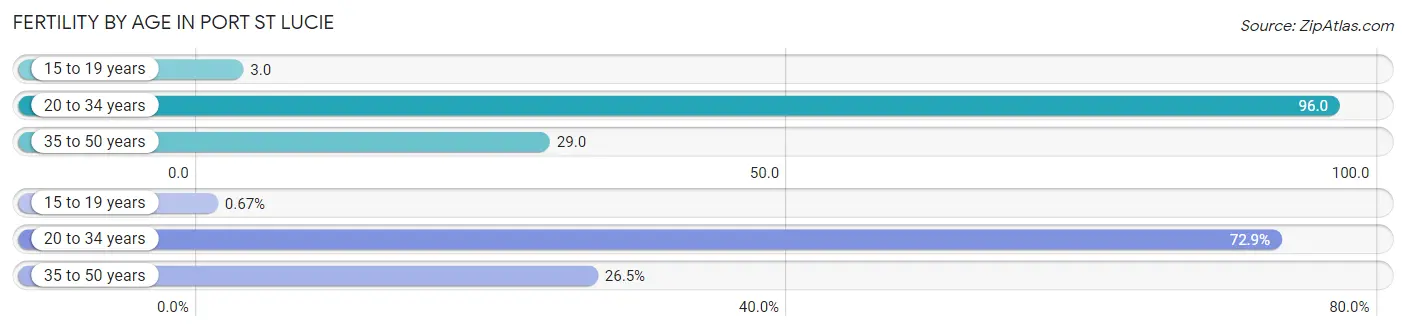
| Age Bracket | Women with Births | Births / 1,000 Women |
| 15 to 19 years | 16 (0.7%) | 3.0 |
| 20 to 34 years | 1,735 (72.9%) | 96.0 |
| 35 to 50 years | 630 (26.5%) | 29.0 |
| Total | 2,381 (100.0%) | 53.0 |
Fertility by Age by Marriage Status in Port St Lucie
62.1% of women with births (2,381) in Port St Lucie are married. The highest percentage of unmarried women with births falls into 15 to 19 years age bracket with 100.0% of them unmarried at the time of birth, while the lowest percentage of unmarried women with births belong to 20 to 34 years age bracket with 35.9% of them unmarried.
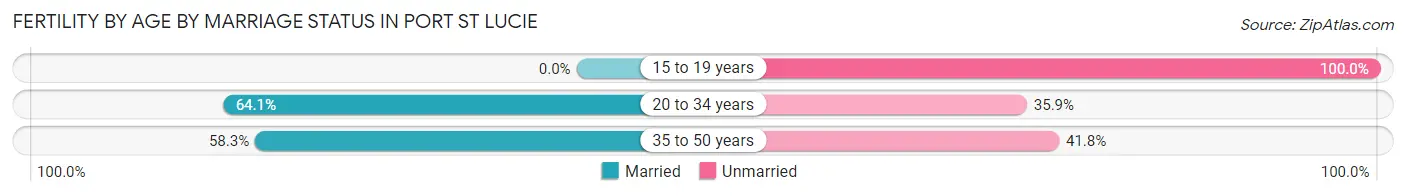
| Age Bracket | Married | Unmarried |
| 15 to 19 years | 0 (0.0%) | 16 (100.0%) |
| 20 to 34 years | 1,112 (64.1%) | 623 (35.9%) |
| 35 to 50 years | 367 (58.3%) | 263 (41.7%) |
| Total | 1,479 (62.1%) | 902 (37.9%) |
Fertility by Education in Port St Lucie
Average fertility rate in Port St Lucie is 53.0 births per 1,000 women. Women with the education attainment of graduate degree have the highest fertility rate of 147.0 births per 1,000 women, while women with the education attainment of less than high school have the lowest fertility at 9.0 births per 1,000 women. Women with the education attainment of college or associate's degree represent 36.0% of all women with births.
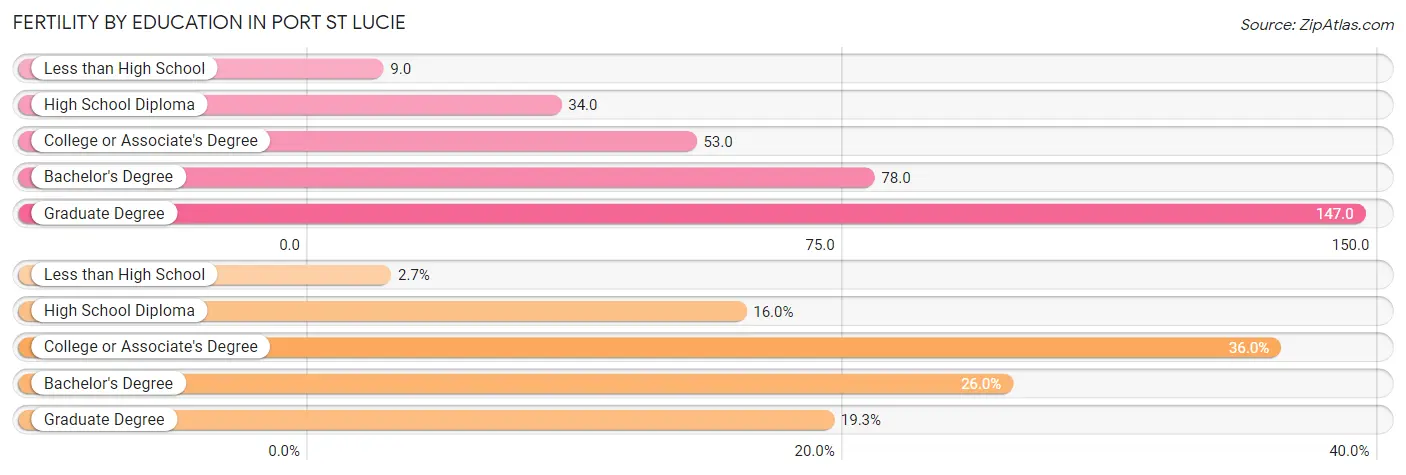
| Educational Attainment | Women with Births | Births / 1,000 Women |
| Less than High School | 64 (2.7%) | 9.0 |
| High School Diploma | 381 (16.0%) | 34.0 |
| College or Associate's Degree | 858 (36.0%) | 53.0 |
| Bachelor's Degree | 619 (26.0%) | 78.0 |
| Graduate Degree | 459 (19.3%) | 147.0 |
| Total | 2,381 (100.0%) | 53.0 |
Fertility by Education by Marriage Status in Port St Lucie
37.9% of women with births in Port St Lucie are unmarried. Women with the educational attainment of less than high school are most likely to be married with 100.0% of them married at childbirth, while women with the educational attainment of high school diploma are least likely to be married with 74.8% of them unmarried at childbirth.
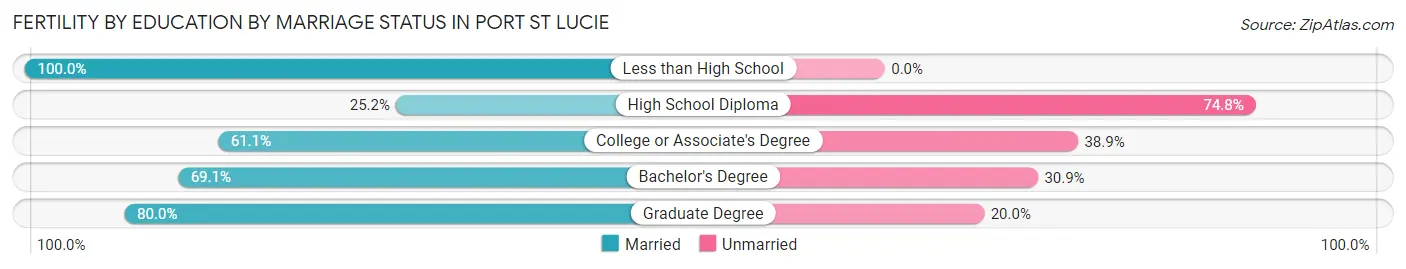
| Educational Attainment | Married | Unmarried |
| Less than High School | 64 (100.0%) | 0 (0.0%) |
| High School Diploma | 96 (25.2%) | 285 (74.8%) |
| College or Associate's Degree | 524 (61.1%) | 334 (38.9%) |
| Bachelor's Degree | 428 (69.1%) | 191 (30.9%) |
| Graduate Degree | 367 (80.0%) | 92 (20.0%) |
| Total | 1,479 (62.1%) | 902 (37.9%) |
Employment Characteristics in Port St Lucie
Employment by Class of Employer in Port St Lucie
Among the 95,431 employed individuals in Port St Lucie, private company employees (66,186 | 69.4%), local government employees (6,873 | 7.2%), and not-for-profit organizations (6,751 | 7.1%) make up the most common classes of employment.
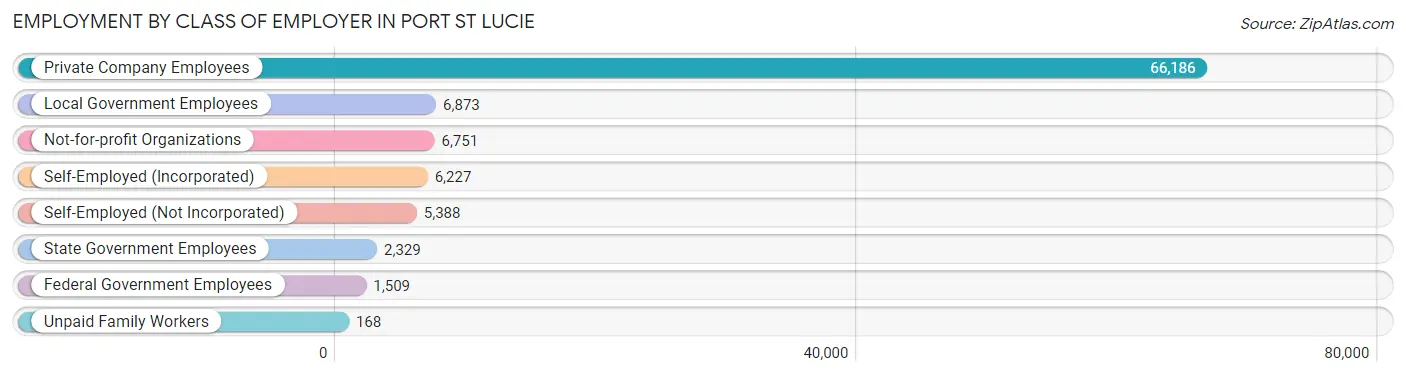
| Employer Class | # Employees | % Employees |
| Private Company Employees | 66,186 | 69.4% |
| Self-Employed (Incorporated) | 6,227 | 6.5% |
| Self-Employed (Not Incorporated) | 5,388 | 5.7% |
| Not-for-profit Organizations | 6,751 | 7.1% |
| Local Government Employees | 6,873 | 7.2% |
| State Government Employees | 2,329 | 2.4% |
| Federal Government Employees | 1,509 | 1.6% |
| Unpaid Family Workers | 168 | 0.2% |
| Total | 95,431 | 100.0% |
Employment Status by Age in Port St Lucie
According to the labor force statistics for Port St Lucie, out of the total population over 16 years of age (171,754), 59.9% or 102,881 individuals are in the labor force, with 5.7% or 5,864 of them unemployed. The age group with the highest labor force participation rate is 30 to 34 years, with 89.6% or 11,819 individuals in the labor force. Within the labor force, the 16 to 19 years age range has the highest percentage of unemployed individuals, with 22.7% or 868 of them being unemployed.
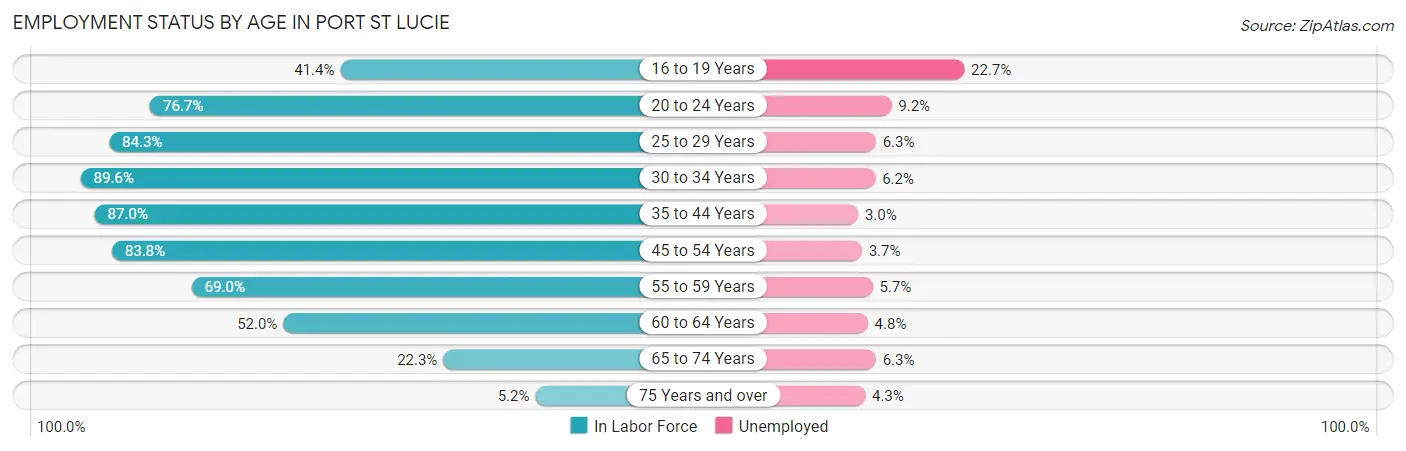
| Age Bracket | In Labor Force | Unemployed |
| 16 to 19 Years | 3,824 (41.4%) | 868 (22.7%) |
| 20 to 24 Years | 8,419 (76.7%) | 775 (9.2%) |
| 25 to 29 Years | 10,006 (84.3%) | 630 (6.3%) |
| 30 to 34 Years | 11,819 (89.6%) | 733 (6.2%) |
| 35 to 44 Years | 22,369 (87.0%) | 671 (3.0%) |
| 45 to 54 Years | 22,513 (83.8%) | 833 (3.7%) |
| 55 to 59 Years | 10,185 (69.0%) | 581 (5.7%) |
| 60 to 64 Years | 7,373 (52.0%) | 354 (4.8%) |
| 65 to 74 Years | 5,412 (22.3%) | 341 (6.3%) |
| 75 Years and over | 1,076 (5.2%) | 46 (4.3%) |
| Total | 102,881 (59.9%) | 5,864 (5.7%) |
Employment Status by Educational Attainment in Port St Lucie
According to labor force statistics for Port St Lucie, 79.1% of individuals (84,302) out of the total population between 25 and 64 years of age (106,576) are in the labor force, with 4.5% or 3,794 of them being unemployed. The group with the highest labor force participation rate are those with the educational attainment of bachelor's degree or higher, with 84.1% or 23,595 individuals in the labor force. Within the labor force, individuals with less than high school education have the highest percentage of unemployment, with 5.9% or 321 of them being unemployed.
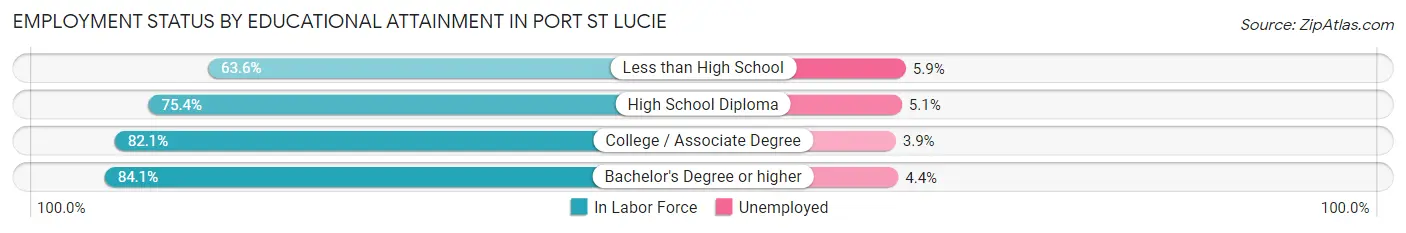
| Educational Attainment | In Labor Force | Unemployed |
| Less than High School | 5,448 (63.6%) | 505 (5.9%) |
| High School Diploma | 25,076 (75.4%) | 1,696 (5.1%) |
| College / Associate Degree | 30,128 (82.1%) | 1,431 (3.9%) |
| Bachelor's Degree or higher | 23,595 (84.1%) | 1,234 (4.4%) |
| Total | 84,302 (79.1%) | 4,796 (4.5%) |
Employment Occupations by Sex in Port St Lucie
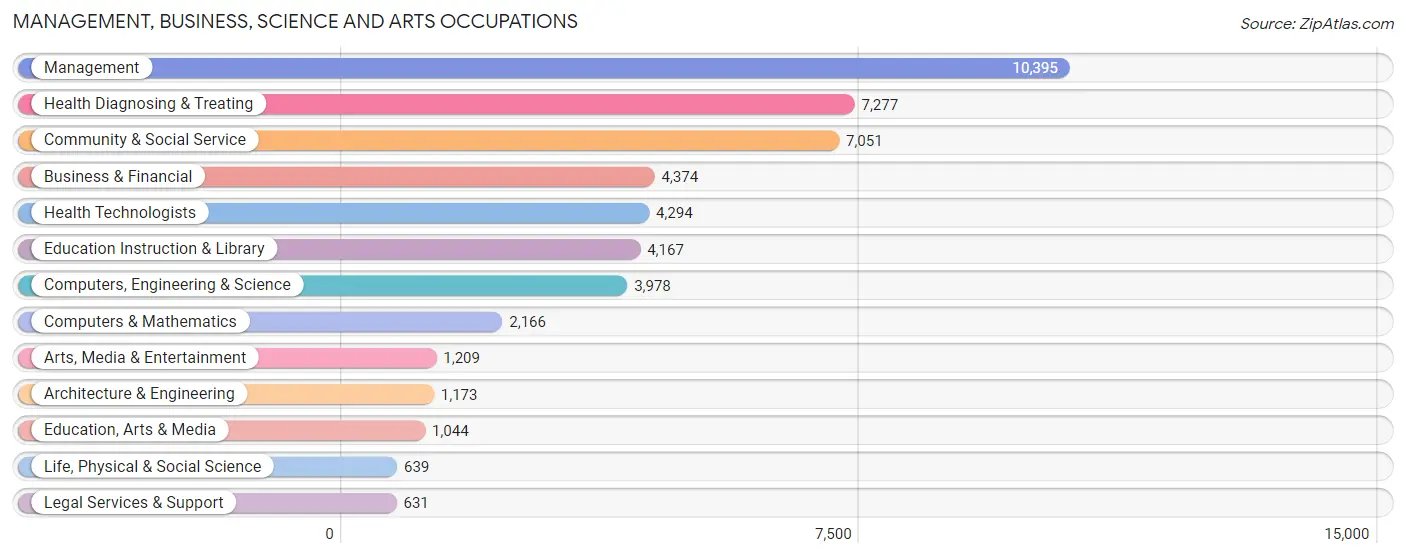
Management, Business, Science and Arts Occupations
The most common Management, Business, Science and Arts occupations in Port St Lucie are Management (10,395 | 10.7%), Health Diagnosing & Treating (7,277 | 7.5%), Community & Social Service (7,051 | 7.3%), Business & Financial (4,374 | 4.5%), and Health Technologists (4,294 | 4.4%).
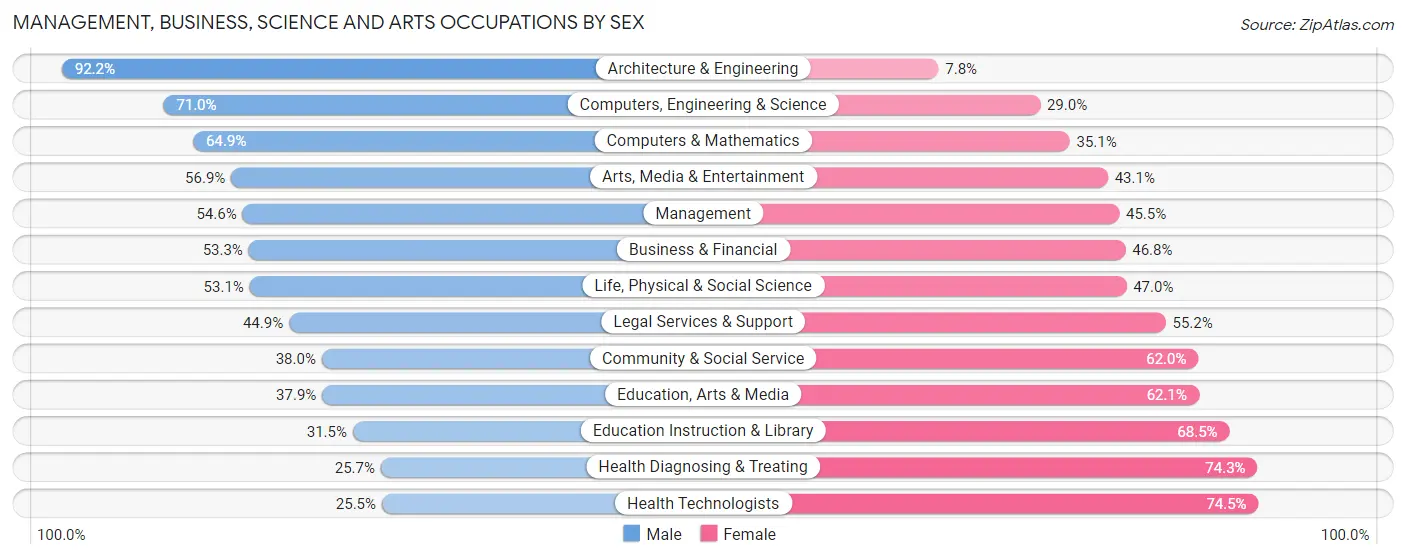
Management, Business, Science and Arts Occupations by Sex
Within the Management, Business, Science and Arts occupations in Port St Lucie, the most male-oriented occupations are Architecture & Engineering (92.2%), Computers, Engineering & Science (71.0%), and Computers & Mathematics (64.9%), while the most female-oriented occupations are Health Technologists (74.5%), Health Diagnosing & Treating (74.3%), and Education Instruction & Library (68.5%).
| Occupation | Male | Female |
| Management | 5,670 (54.5%) | 4,725 (45.5%) |
| Business & Financial | 2,329 (53.2%) | 2,045 (46.8%) |
| Computers, Engineering & Science | 2,826 (71.0%) | 1,152 (29.0%) |
| Computers & Mathematics | 1,405 (64.9%) | 761 (35.1%) |
| Architecture & Engineering | 1,082 (92.2%) | 91 (7.8%) |
| Life, Physical & Social Science | 339 (53.0%) | 300 (46.9%) |
| Community & Social Service | 2,681 (38.0%) | 4,370 (62.0%) |
| Education, Arts & Media | 396 (37.9%) | 648 (62.1%) |
| Legal Services & Support | 283 (44.9%) | 348 (55.1%) |
| Education Instruction & Library | 1,314 (31.5%) | 2,853 (68.5%) |
| Arts, Media & Entertainment | 688 (56.9%) | 521 (43.1%) |
| Health Diagnosing & Treating | 1,870 (25.7%) | 5,407 (74.3%) |
| Health Technologists | 1,094 (25.5%) | 3,200 (74.5%) |
| Total (Category) | 15,376 (46.5%) | 17,699 (53.5%) |
| Total (Overall) | 50,830 (52.4%) | 46,109 (47.6%) |
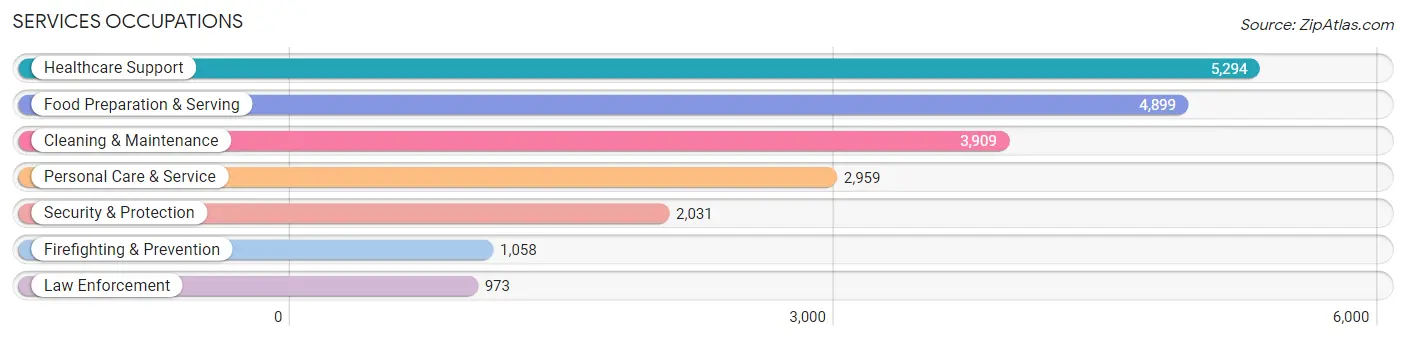
Services Occupations
The most common Services occupations in Port St Lucie are Healthcare Support (5,294 | 5.5%), Food Preparation & Serving (4,899 | 5.1%), Cleaning & Maintenance (3,909 | 4.0%), Personal Care & Service (2,959 | 3.0%), and Security & Protection (2,031 | 2.1%).
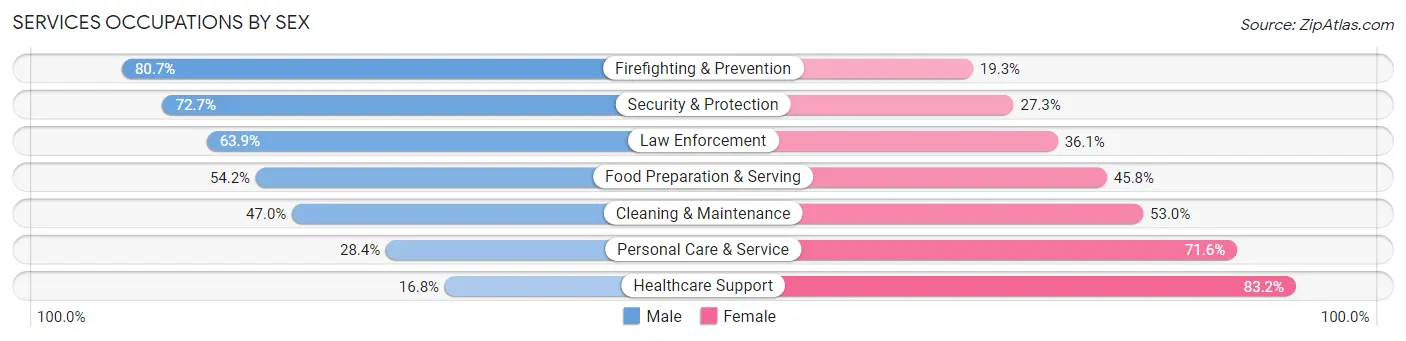
Services Occupations by Sex
Within the Services occupations in Port St Lucie, the most male-oriented occupations are Firefighting & Prevention (80.7%), Security & Protection (72.7%), and Law Enforcement (63.9%), while the most female-oriented occupations are Healthcare Support (83.2%), Personal Care & Service (71.6%), and Cleaning & Maintenance (53.0%).
| Occupation | Male | Female |
| Healthcare Support | 888 (16.8%) | 4,406 (83.2%) |
| Security & Protection | 1,476 (72.7%) | 555 (27.3%) |
| Firefighting & Prevention | 854 (80.7%) | 204 (19.3%) |
| Law Enforcement | 622 (63.9%) | 351 (36.1%) |
| Food Preparation & Serving | 2,655 (54.2%) | 2,244 (45.8%) |
| Cleaning & Maintenance | 1,838 (47.0%) | 2,071 (53.0%) |
| Personal Care & Service | 841 (28.4%) | 2,118 (71.6%) |
| Total (Category) | 7,698 (40.3%) | 11,394 (59.7%) |
| Total (Overall) | 50,830 (52.4%) | 46,109 (47.6%) |
Sales and Office Occupations
The most common Sales and Office occupations in Port St Lucie are Sales & Related (11,424 | 11.8%), and Office & Administration (10,880 | 11.2%).

Sales and Office Occupations by Sex
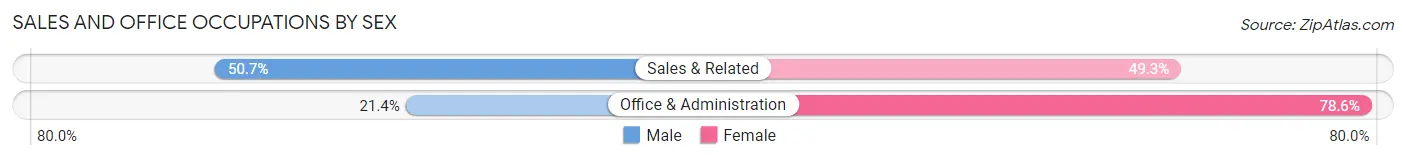
| Occupation | Male | Female |
| Sales & Related | 5,791 (50.7%) | 5,633 (49.3%) |
| Office & Administration | 2,326 (21.4%) | 8,554 (78.6%) |
| Total (Category) | 8,117 (36.4%) | 14,187 (63.6%) |
| Total (Overall) | 50,830 (52.4%) | 46,109 (47.6%) |
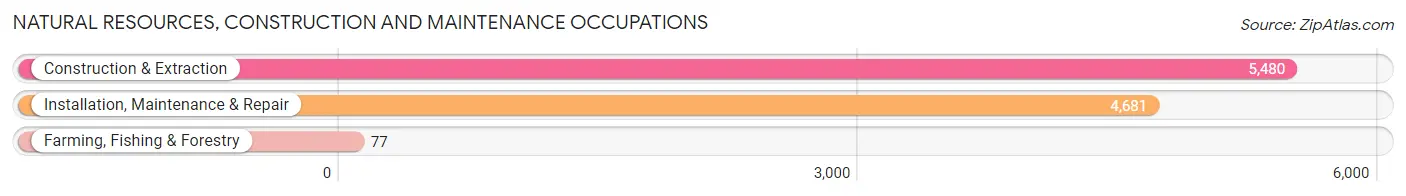
Natural Resources, Construction and Maintenance Occupations
The most common Natural Resources, Construction and Maintenance occupations in Port St Lucie are Construction & Extraction (5,480 | 5.7%), Installation, Maintenance & Repair (4,681 | 4.8%), and Farming, Fishing & Forestry (77 | 0.1%).
Natural Resources, Construction and Maintenance Occupations by Sex
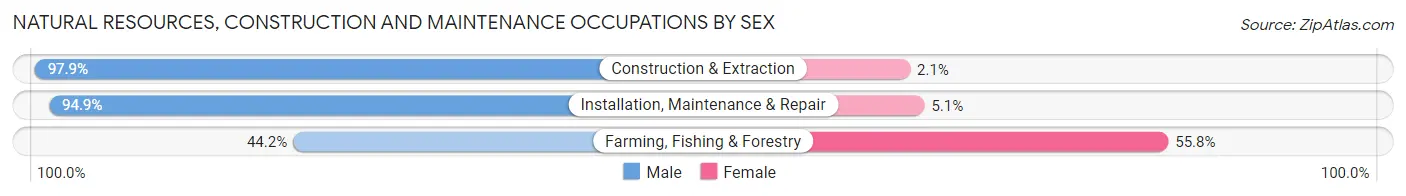
| Occupation | Male | Female |
| Farming, Fishing & Forestry | 34 (44.2%) | 43 (55.8%) |
| Construction & Extraction | 5,364 (97.9%) | 116 (2.1%) |
| Installation, Maintenance & Repair | 4,442 (94.9%) | 239 (5.1%) |
| Total (Category) | 9,840 (96.1%) | 398 (3.9%) |
| Total (Overall) | 50,830 (52.4%) | 46,109 (47.6%) |
Production, Transportation and Moving Occupations
The most common Production, Transportation and Moving occupations in Port St Lucie are Transportation (4,884 | 5.0%), Production (4,059 | 4.2%), and Material Moving (3,287 | 3.4%).
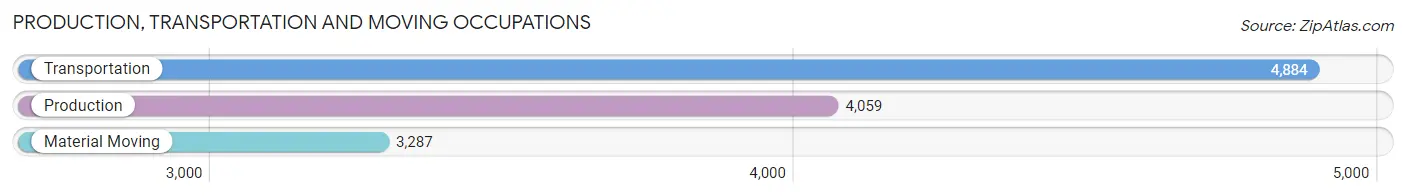
Production, Transportation and Moving Occupations by Sex
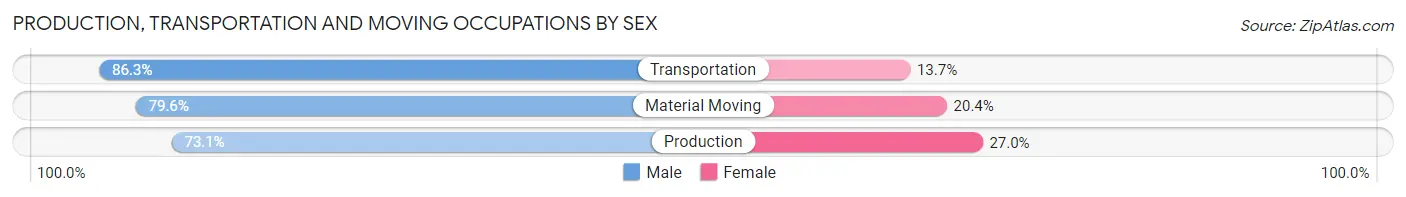
| Occupation | Male | Female |
| Production | 2,965 (73.1%) | 1,094 (27.0%) |
| Transportation | 4,217 (86.3%) | 667 (13.7%) |
| Material Moving | 2,617 (79.6%) | 670 (20.4%) |
| Total (Category) | 9,799 (80.1%) | 2,431 (19.9%) |
| Total (Overall) | 50,830 (52.4%) | 46,109 (47.6%) |
Employment Industries by Sex in Port St Lucie
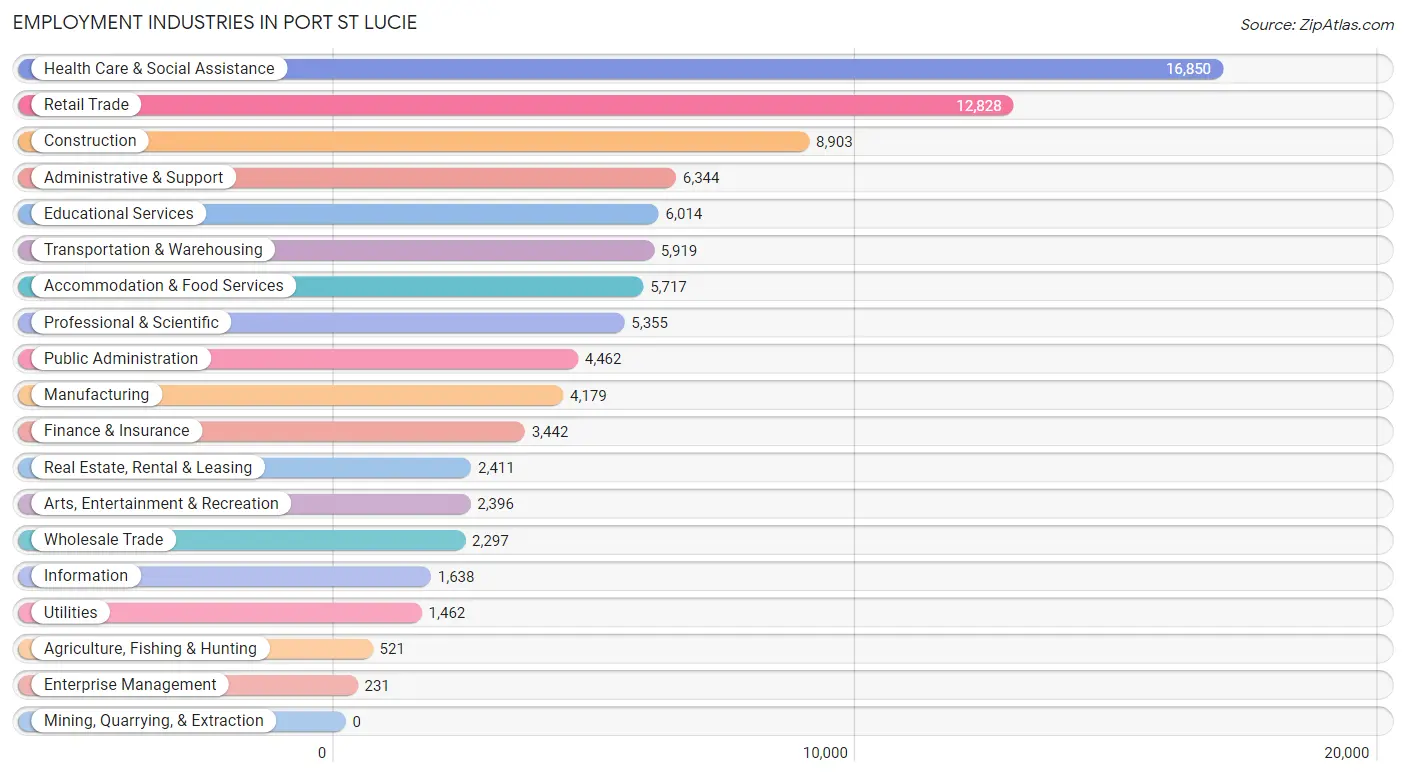
Employment Industries in Port St Lucie
The major employment industries in Port St Lucie include Health Care & Social Assistance (16,850 | 17.4%), Retail Trade (12,828 | 13.2%), Construction (8,903 | 9.2%), Administrative & Support (6,344 | 6.5%), and Educational Services (6,014 | 6.2%).
Employment Industries by Sex in Port St Lucie
The Port St Lucie industries that see more men than women are Construction (88.6%), Agriculture, Fishing & Hunting (84.8%), and Utilities (78.0%), whereas the industries that tend to have a higher number of women are Health Care & Social Assistance (77.2%), Enterprise Management (75.3%), and Educational Services (67.7%).
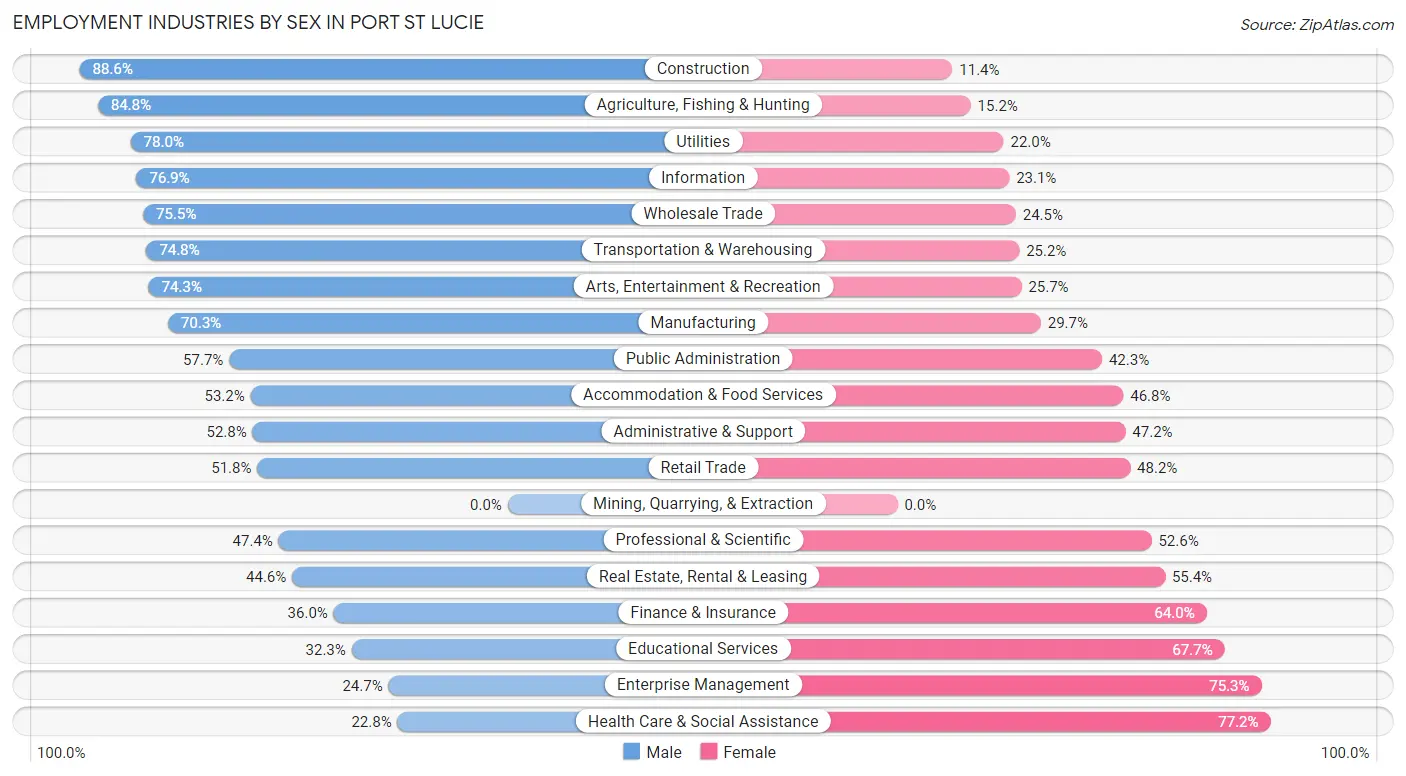
| Industry | Male | Female |
| Agriculture, Fishing & Hunting | 442 (84.8%) | 79 (15.2%) |
| Mining, Quarrying, & Extraction | 0 (0.0%) | 0 (0.0%) |
| Construction | 7,891 (88.6%) | 1,012 (11.4%) |
| Manufacturing | 2,939 (70.3%) | 1,240 (29.7%) |
| Wholesale Trade | 1,734 (75.5%) | 563 (24.5%) |
| Retail Trade | 6,649 (51.8%) | 6,179 (48.2%) |
| Transportation & Warehousing | 4,427 (74.8%) | 1,492 (25.2%) |
| Utilities | 1,141 (78.0%) | 321 (22.0%) |
| Information | 1,259 (76.9%) | 379 (23.1%) |
| Finance & Insurance | 1,240 (36.0%) | 2,202 (64.0%) |
| Real Estate, Rental & Leasing | 1,076 (44.6%) | 1,335 (55.4%) |
| Professional & Scientific | 2,539 (47.4%) | 2,816 (52.6%) |
| Enterprise Management | 57 (24.7%) | 174 (75.3%) |
| Administrative & Support | 3,350 (52.8%) | 2,994 (47.2%) |
| Educational Services | 1,943 (32.3%) | 4,071 (67.7%) |
| Health Care & Social Assistance | 3,846 (22.8%) | 13,004 (77.2%) |
| Arts, Entertainment & Recreation | 1,781 (74.3%) | 615 (25.7%) |
| Accommodation & Food Services | 3,044 (53.2%) | 2,673 (46.8%) |
| Public Administration | 2,573 (57.7%) | 1,889 (42.3%) |
| Total | 50,830 (52.4%) | 46,109 (47.6%) |
Education in Port St Lucie
School Enrollment in Port St Lucie
The most common levels of schooling among the 47,841 students in Port St Lucie are middle school (11,208 | 23.4%), high school (10,806 | 22.6%), and college / undergraduate (9,634 | 20.1%).
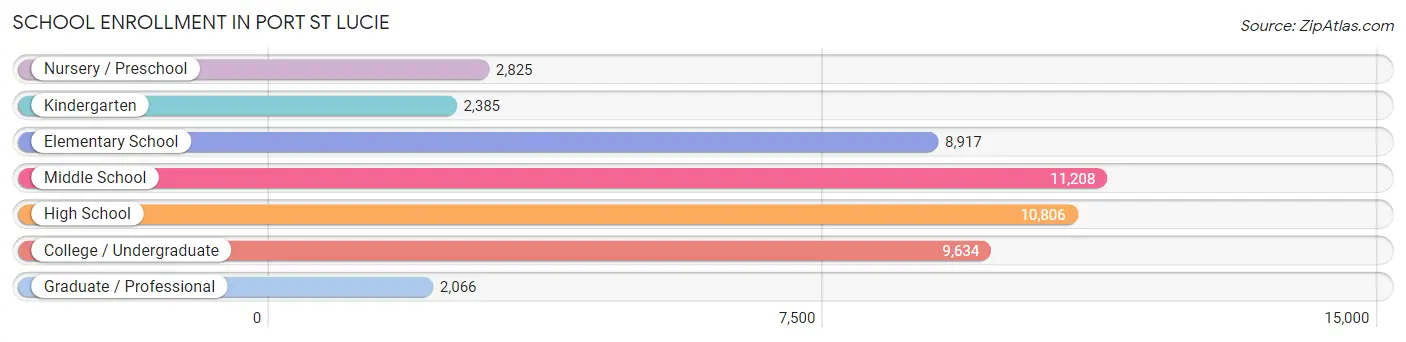
| School Level | # Students | % Students |
| Nursery / Preschool | 2,825 | 5.9% |
| Kindergarten | 2,385 | 5.0% |
| Elementary School | 8,917 | 18.6% |
| Middle School | 11,208 | 23.4% |
| High School | 10,806 | 22.6% |
| College / Undergraduate | 9,634 | 20.1% |
| Graduate / Professional | 2,066 | 4.3% |
| Total | 47,841 | 100.0% |
School Enrollment by Age by Funding Source in Port St Lucie
Out of a total of 47,841 students who are enrolled in schools in Port St Lucie, 8,181 (17.1%) attend a private institution, while the remaining 39,660 (82.9%) are enrolled in public schools. The age group of 3 to 4 year olds has the highest likelihood of being enrolled in private schools, with 998 (44.7% in the age bracket) enrolled. Conversely, the age group of 15 to 17 year olds has the lowest likelihood of being enrolled in a private school, with 7,334 (92.8% in the age bracket) attending a public institution.
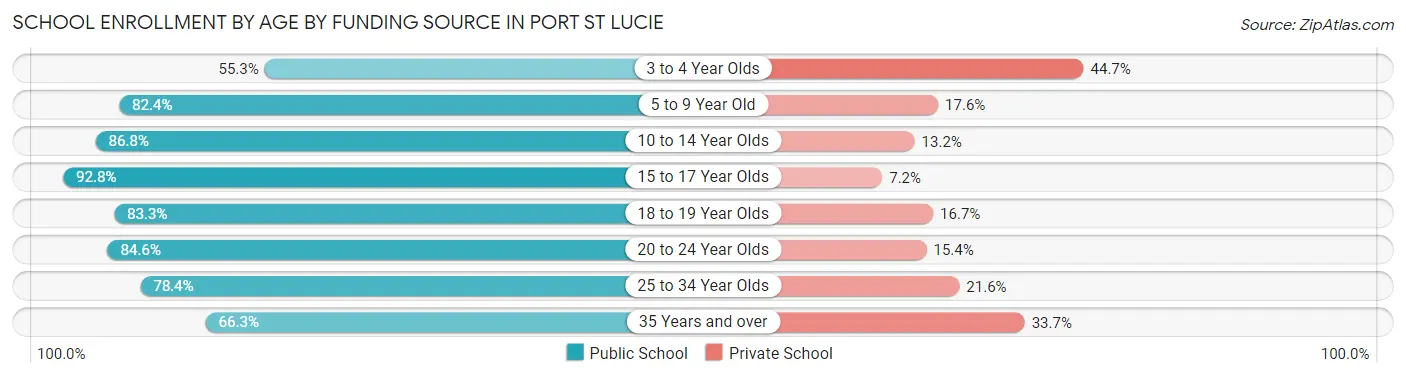
| Age Bracket | Public School | Private School |
| 3 to 4 Year Olds | 1,235 (55.3%) | 998 (44.7%) |
| 5 to 9 Year Old | 9,147 (82.4%) | 1,954 (17.6%) |
| 10 to 14 Year Olds | 11,441 (86.8%) | 1,743 (13.2%) |
| 15 to 17 Year Olds | 7,334 (92.8%) | 568 (7.2%) |
| 18 to 19 Year Olds | 2,335 (83.3%) | 467 (16.7%) |
| 20 to 24 Year Olds | 3,226 (84.6%) | 589 (15.4%) |
| 25 to 34 Year Olds | 2,663 (78.4%) | 732 (21.6%) |
| 35 Years and over | 2,259 (66.3%) | 1,150 (33.7%) |
| Total | 39,660 (82.9%) | 8,181 (17.1%) |
Educational Attainment by Field of Study in Port St Lucie
Business (10,058 | 24.1%), science & technology (4,955 | 11.9%), education (4,777 | 11.4%), arts & humanities (4,183 | 10.0%), and social sciences (2,607 | 6.2%) are the most common fields of study among 41,786 individuals in Port St Lucie who have obtained a bachelor's degree or higher.
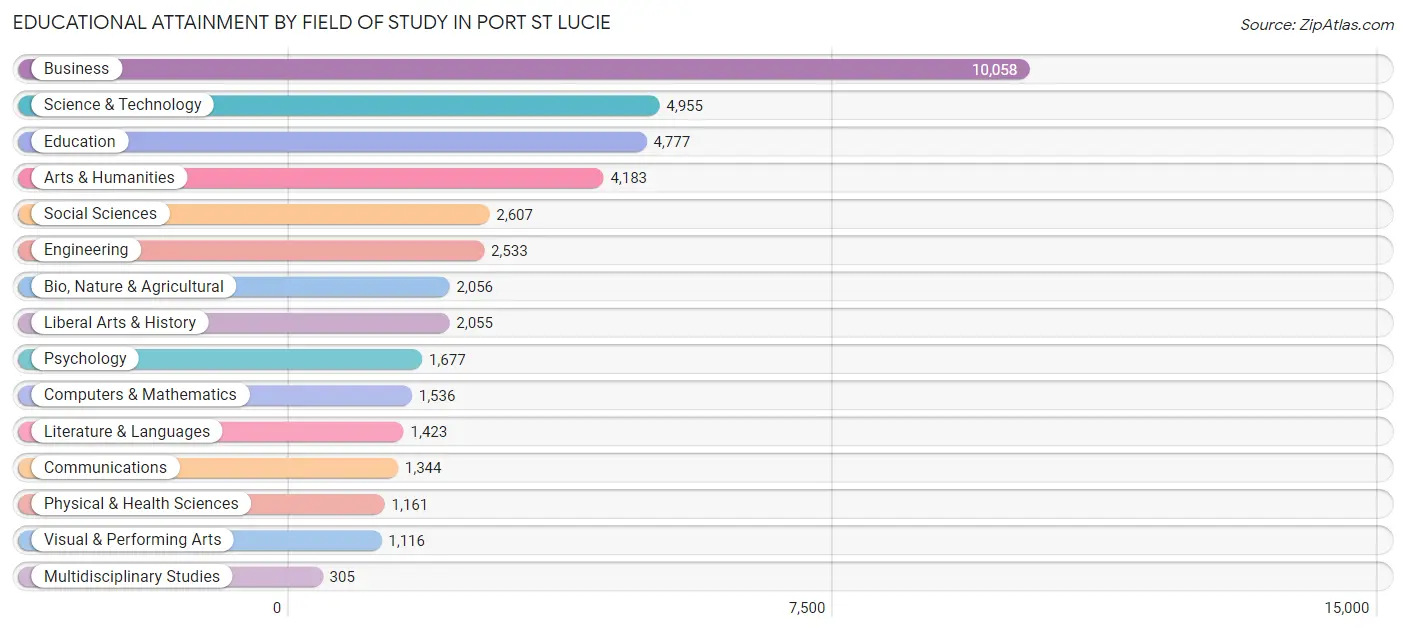
| Field of Study | # Graduates | % Graduates |
| Computers & Mathematics | 1,536 | 3.7% |
| Bio, Nature & Agricultural | 2,056 | 4.9% |
| Physical & Health Sciences | 1,161 | 2.8% |
| Psychology | 1,677 | 4.0% |
| Social Sciences | 2,607 | 6.2% |
| Engineering | 2,533 | 6.1% |
| Multidisciplinary Studies | 305 | 0.7% |
| Science & Technology | 4,955 | 11.9% |
| Business | 10,058 | 24.1% |
| Education | 4,777 | 11.4% |
| Literature & Languages | 1,423 | 3.4% |
| Liberal Arts & History | 2,055 | 4.9% |
| Visual & Performing Arts | 1,116 | 2.7% |
| Communications | 1,344 | 3.2% |
| Arts & Humanities | 4,183 | 10.0% |
| Total | 41,786 | 100.0% |
Transportation & Commute in Port St Lucie
Vehicle Availability by Sex in Port St Lucie
The most prevalent vehicle ownership categories in Port St Lucie are males with 2 vehicles (22,700, accounting for 45.3%) and females with 2 vehicles (18,911, making up 50.2%).
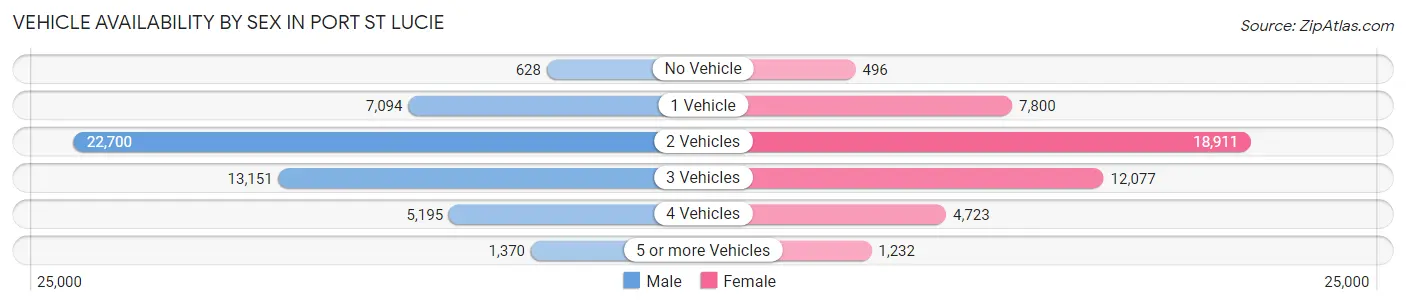
| Vehicles Available | Male | Female |
| No Vehicle | 628 (1.3%) | 496 (1.1%) |
| 1 Vehicle | 7,094 (14.1%) | 7,800 (17.2%) |
| 2 Vehicles | 22,700 (45.3%) | 18,911 (41.8%) |
| 3 Vehicles | 13,151 (26.2%) | 12,077 (26.7%) |
| 4 Vehicles | 5,195 (10.4%) | 4,723 (10.4%) |
| 5 or more Vehicles | 1,370 (2.7%) | 1,232 (2.7%) |
| Total | 50,138 (100.0%) | 45,239 (100.0%) |
Commute Time in Port St Lucie
The most frequently occuring commute durations in Port St Lucie are 30 to 34 minutes (16,080 commuters, 18.5%), 15 to 19 minutes (13,927 commuters, 16.0%), and 20 to 24 minutes (13,580 commuters, 15.6%).
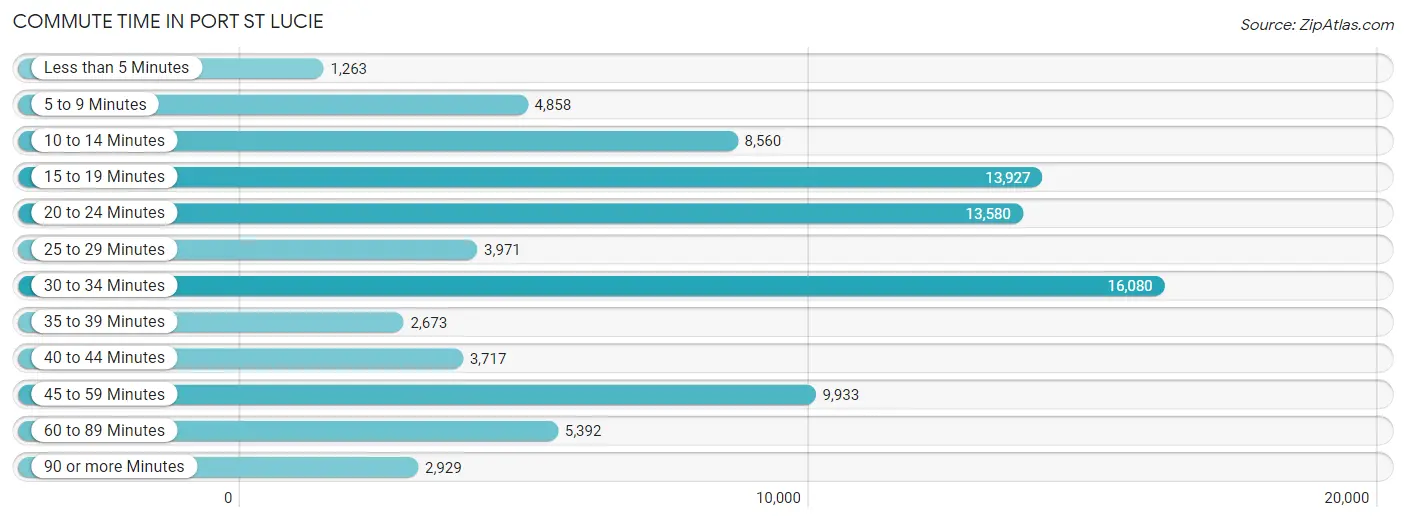
| Commute Time | # Commuters | % Commuters |
| Less than 5 Minutes | 1,263 | 1.5% |
| 5 to 9 Minutes | 4,858 | 5.6% |
| 10 to 14 Minutes | 8,560 | 9.9% |
| 15 to 19 Minutes | 13,927 | 16.0% |
| 20 to 24 Minutes | 13,580 | 15.6% |
| 25 to 29 Minutes | 3,971 | 4.6% |
| 30 to 34 Minutes | 16,080 | 18.5% |
| 35 to 39 Minutes | 2,673 | 3.1% |
| 40 to 44 Minutes | 3,717 | 4.3% |
| 45 to 59 Minutes | 9,933 | 11.4% |
| 60 to 89 Minutes | 5,392 | 6.2% |
| 90 or more Minutes | 2,929 | 3.4% |
Commute Time by Sex in Port St Lucie
The most common commute times in Port St Lucie are 30 to 34 minutes (9,217 commuters, 19.8%) for males and 15 to 19 minutes (7,239 commuters, 17.9%) for females.
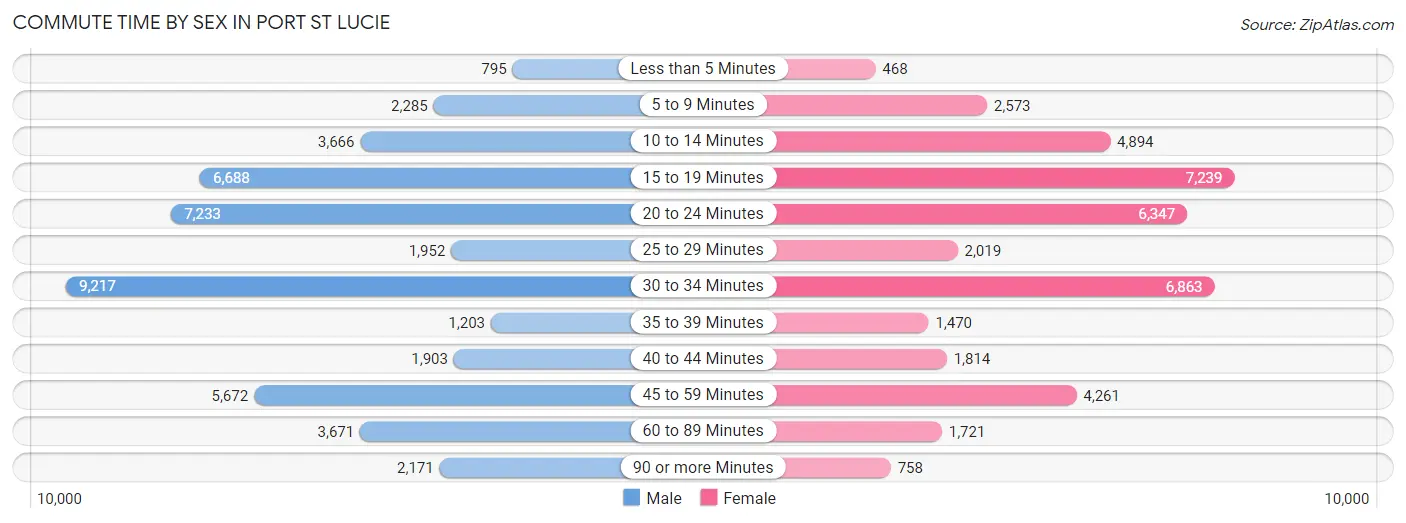
| Commute Time | Male | Female |
| Less than 5 Minutes | 795 (1.7%) | 468 (1.2%) |
| 5 to 9 Minutes | 2,285 (4.9%) | 2,573 (6.4%) |
| 10 to 14 Minutes | 3,666 (7.9%) | 4,894 (12.1%) |
| 15 to 19 Minutes | 6,688 (14.4%) | 7,239 (17.9%) |
| 20 to 24 Minutes | 7,233 (15.6%) | 6,347 (15.7%) |
| 25 to 29 Minutes | 1,952 (4.2%) | 2,019 (5.0%) |
| 30 to 34 Minutes | 9,217 (19.8%) | 6,863 (17.0%) |
| 35 to 39 Minutes | 1,203 (2.6%) | 1,470 (3.6%) |
| 40 to 44 Minutes | 1,903 (4.1%) | 1,814 (4.5%) |
| 45 to 59 Minutes | 5,672 (12.2%) | 4,261 (10.5%) |
| 60 to 89 Minutes | 3,671 (7.9%) | 1,721 (4.3%) |
| 90 or more Minutes | 2,171 (4.7%) | 758 (1.9%) |
Time of Departure to Work by Sex in Port St Lucie
The most frequent times of departure to work in Port St Lucie are 8:00 AM to 8:29 AM (6,686, 14.4%) for males and 8:00 AM to 8:29 AM (5,925, 14.7%) for females.
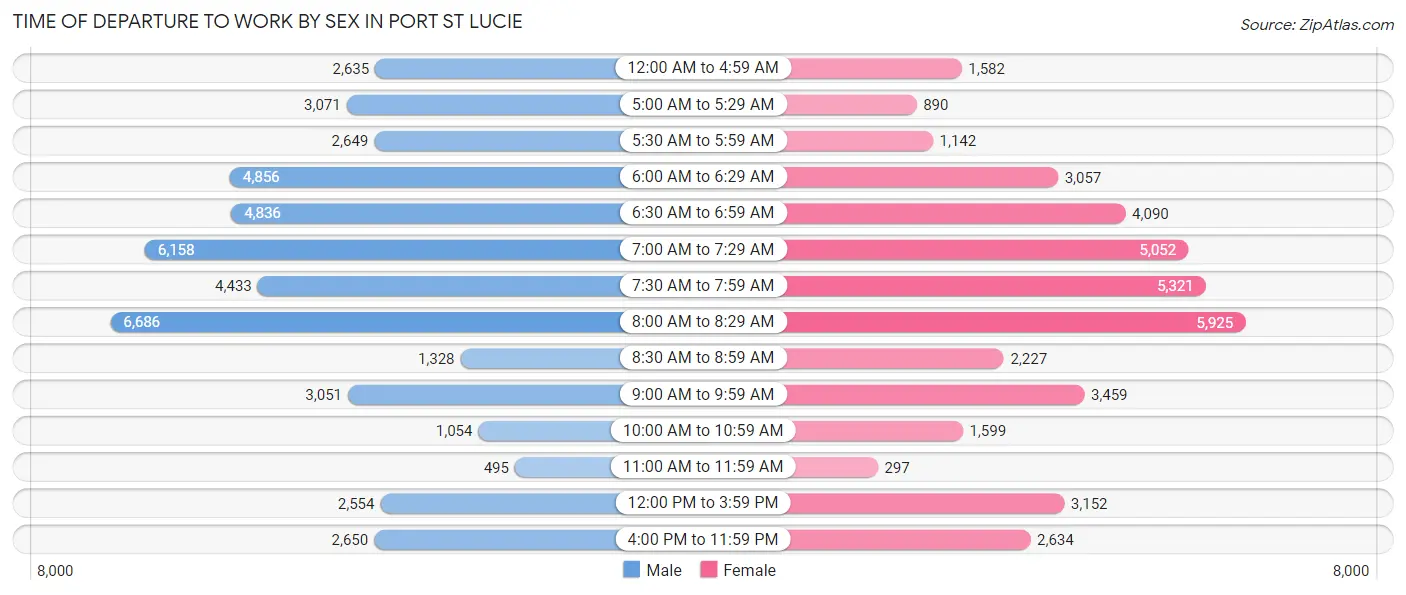
| Time of Departure | Male | Female |
| 12:00 AM to 4:59 AM | 2,635 (5.7%) | 1,582 (3.9%) |
| 5:00 AM to 5:29 AM | 3,071 (6.6%) | 890 (2.2%) |
| 5:30 AM to 5:59 AM | 2,649 (5.7%) | 1,142 (2.8%) |
| 6:00 AM to 6:29 AM | 4,856 (10.4%) | 3,057 (7.6%) |
| 6:30 AM to 6:59 AM | 4,836 (10.4%) | 4,090 (10.1%) |
| 7:00 AM to 7:29 AM | 6,158 (13.3%) | 5,052 (12.5%) |
| 7:30 AM to 7:59 AM | 4,433 (9.5%) | 5,321 (13.2%) |
| 8:00 AM to 8:29 AM | 6,686 (14.4%) | 5,925 (14.7%) |
| 8:30 AM to 8:59 AM | 1,328 (2.9%) | 2,227 (5.5%) |
| 9:00 AM to 9:59 AM | 3,051 (6.6%) | 3,459 (8.6%) |
| 10:00 AM to 10:59 AM | 1,054 (2.3%) | 1,599 (4.0%) |
| 11:00 AM to 11:59 AM | 495 (1.1%) | 297 (0.7%) |
| 12:00 PM to 3:59 PM | 2,554 (5.5%) | 3,152 (7.8%) |
| 4:00 PM to 11:59 PM | 2,650 (5.7%) | 2,634 (6.5%) |
| Total | 46,456 (100.0%) | 40,427 (100.0%) |
Housing Occupancy in Port St Lucie
Occupancy by Ownership in Port St Lucie
Of the total 74,960 dwellings in Port St Lucie, owner-occupied units account for 62,030 (82.8%), while renter-occupied units make up 12,930 (17.2%).
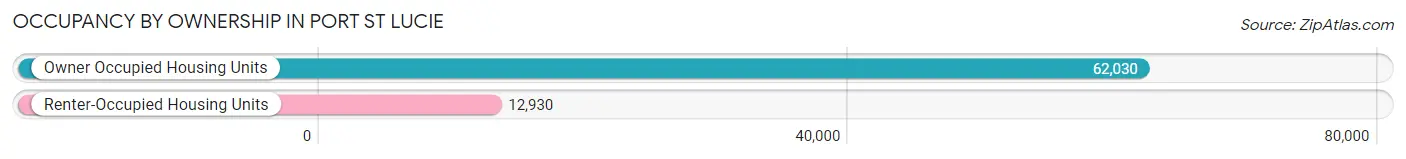
| Occupancy | # Housing Units | % Housing Units |
| Owner Occupied Housing Units | 62,030 | 82.8% |
| Renter-Occupied Housing Units | 12,930 | 17.2% |
| Total Occupied Housing Units | 74,960 | 100.0% |
Occupancy by Household Size in Port St Lucie
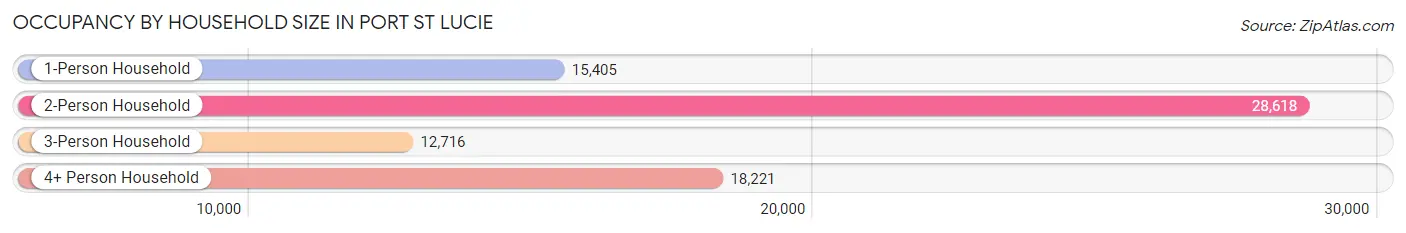
| Household Size | # Housing Units | % Housing Units |
| 1-Person Household | 15,405 | 20.5% |
| 2-Person Household | 28,618 | 38.2% |
| 3-Person Household | 12,716 | 17.0% |
| 4+ Person Household | 18,221 | 24.3% |
| Total Housing Units | 74,960 | 100.0% |
Occupancy by Ownership by Household Size in Port St Lucie
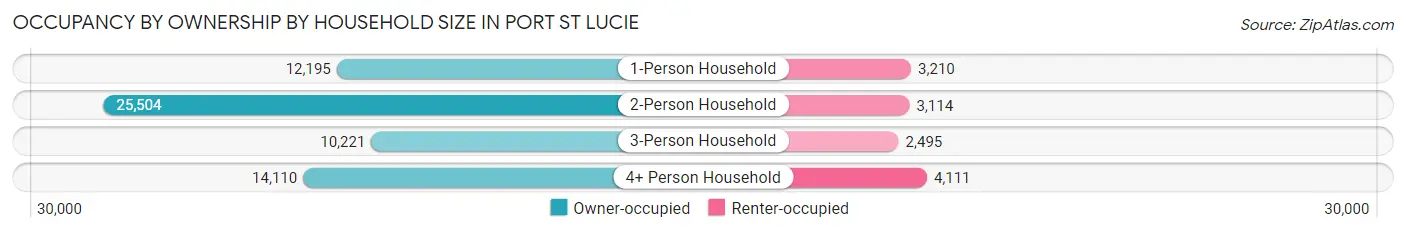
| Household Size | Owner-occupied | Renter-occupied |
| 1-Person Household | 12,195 (79.2%) | 3,210 (20.8%) |
| 2-Person Household | 25,504 (89.1%) | 3,114 (10.9%) |
| 3-Person Household | 10,221 (80.4%) | 2,495 (19.6%) |
| 4+ Person Household | 14,110 (77.4%) | 4,111 (22.6%) |
| Total Housing Units | 62,030 (82.8%) | 12,930 (17.2%) |
Occupancy by Educational Attainment in Port St Lucie
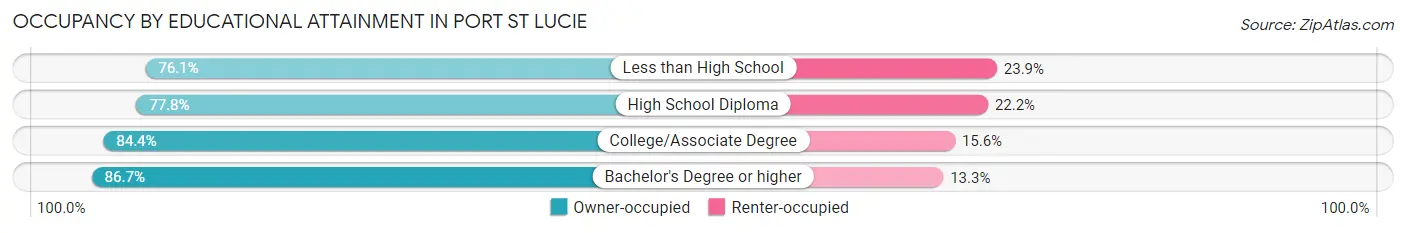
| Household Size | Owner-occupied | Renter-occupied |
| Less than High School | 4,424 (76.1%) | 1,392 (23.9%) |
| High School Diploma | 14,654 (77.8%) | 4,171 (22.2%) |
| College/Associate Degree | 24,572 (84.4%) | 4,547 (15.6%) |
| Bachelor's Degree or higher | 18,380 (86.7%) | 2,820 (13.3%) |
Occupancy by Age of Householder in Port St Lucie
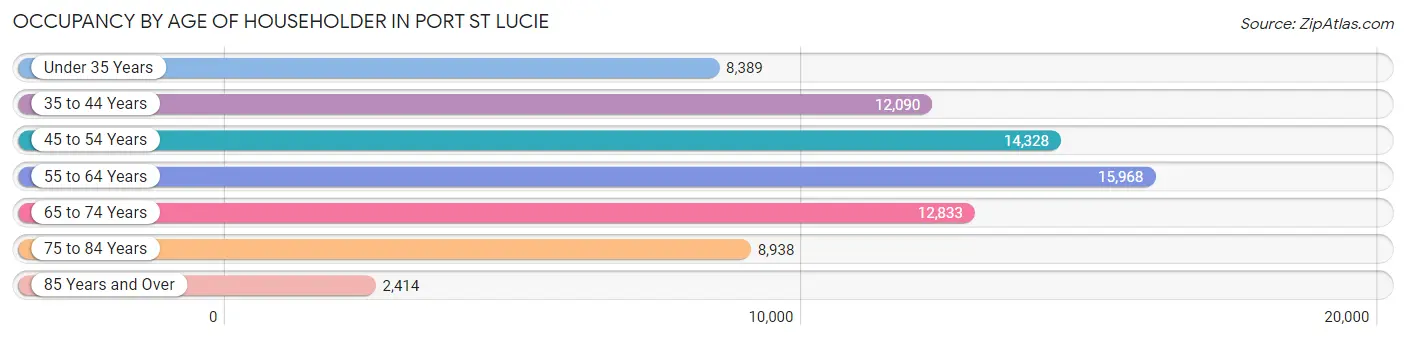
| Age Bracket | # Households | % Households |
| Under 35 Years | 8,389 | 11.2% |
| 35 to 44 Years | 12,090 | 16.1% |
| 45 to 54 Years | 14,328 | 19.1% |
| 55 to 64 Years | 15,968 | 21.3% |
| 65 to 74 Years | 12,833 | 17.1% |
| 75 to 84 Years | 8,938 | 11.9% |
| 85 Years and Over | 2,414 | 3.2% |
| Total | 74,960 | 100.0% |
Housing Finances in Port St Lucie
Median Income by Occupancy in Port St Lucie
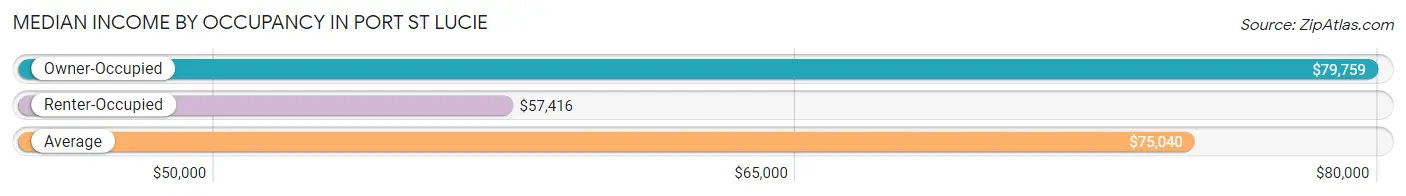
| Occupancy Type | # Households | Median Income |
| Owner-Occupied | 62,030 (82.8%) | $79,759 |
| Renter-Occupied | 12,930 (17.2%) | $57,416 |
| Average | 74,960 (100.0%) | $75,040 |
Occupancy by Householder Income Bracket in Port St Lucie
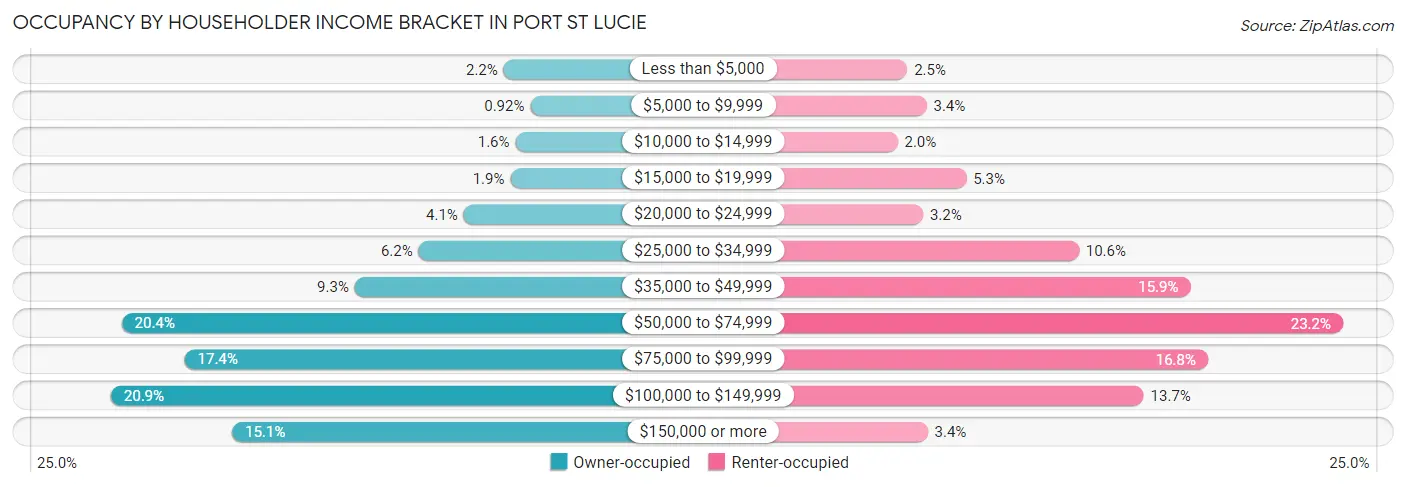
| Income Bracket | Owner-occupied | Renter-occupied |
| Less than $5,000 | 1,361 (2.2%) | 318 (2.5%) |
| $5,000 to $9,999 | 570 (0.9%) | 437 (3.4%) |
| $10,000 to $14,999 | 1,012 (1.6%) | 259 (2.0%) |
| $15,000 to $19,999 | 1,159 (1.9%) | 681 (5.3%) |
| $20,000 to $24,999 | 2,538 (4.1%) | 415 (3.2%) |
| $25,000 to $34,999 | 3,871 (6.2%) | 1,374 (10.6%) |
| $35,000 to $49,999 | 5,755 (9.3%) | 2,061 (15.9%) |
| $50,000 to $74,999 | 12,641 (20.4%) | 3,000 (23.2%) |
| $75,000 to $99,999 | 10,782 (17.4%) | 2,168 (16.8%) |
| $100,000 to $149,999 | 12,961 (20.9%) | 1,774 (13.7%) |
| $150,000 or more | 9,380 (15.1%) | 443 (3.4%) |
| Total | 62,030 (100.0%) | 12,930 (100.0%) |
Monthly Housing Cost Tiers in Port St Lucie
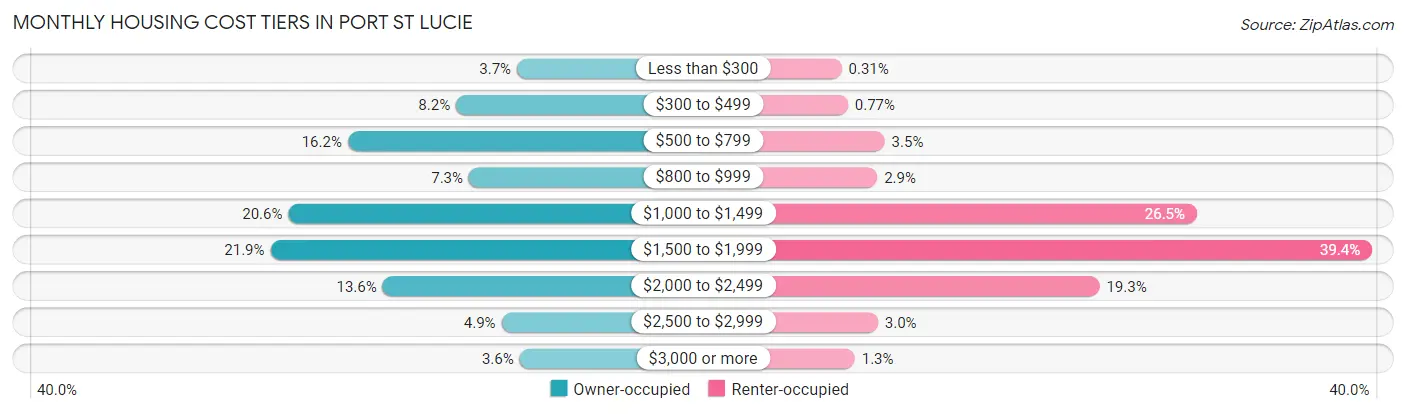
| Monthly Cost | Owner-occupied | Renter-occupied |
| Less than $300 | 2,317 (3.7%) | 40 (0.3%) |
| $300 to $499 | 5,106 (8.2%) | 100 (0.8%) |
| $500 to $799 | 10,049 (16.2%) | 450 (3.5%) |
| $800 to $999 | 4,518 (7.3%) | 379 (2.9%) |
| $1,000 to $1,499 | 12,766 (20.6%) | 3,423 (26.5%) |
| $1,500 to $1,999 | 13,583 (21.9%) | 5,091 (39.4%) |
| $2,000 to $2,499 | 8,463 (13.6%) | 2,496 (19.3%) |
| $2,500 to $2,999 | 3,026 (4.9%) | 385 (3.0%) |
| $3,000 or more | 2,202 (3.5%) | 165 (1.3%) |
| Total | 62,030 (100.0%) | 12,930 (100.0%) |
Physical Housing Characteristics in Port St Lucie
Housing Structures in Port St Lucie
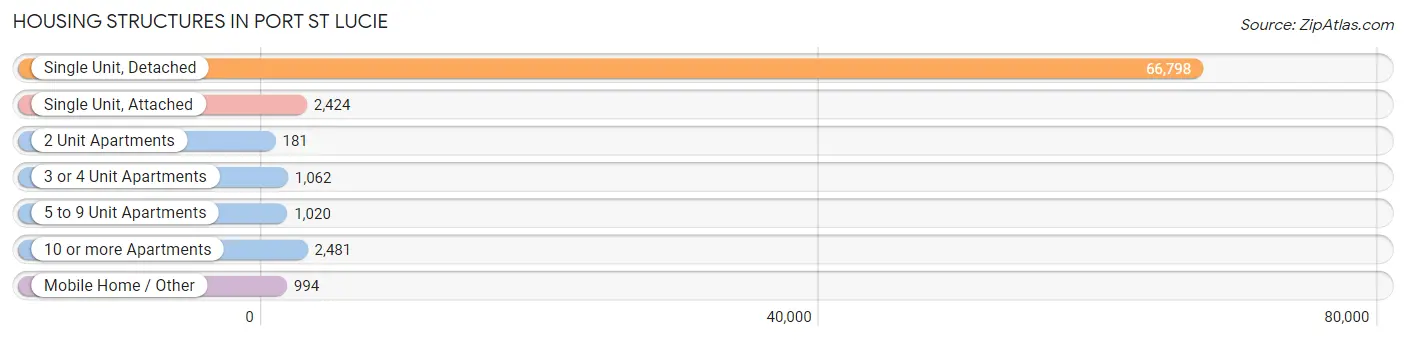
| Structure Type | # Housing Units | % Housing Units |
| Single Unit, Detached | 66,798 | 89.1% |
| Single Unit, Attached | 2,424 | 3.2% |
| 2 Unit Apartments | 181 | 0.2% |
| 3 or 4 Unit Apartments | 1,062 | 1.4% |
| 5 to 9 Unit Apartments | 1,020 | 1.4% |
| 10 or more Apartments | 2,481 | 3.3% |
| Mobile Home / Other | 994 | 1.3% |
| Total | 74,960 | 100.0% |
Housing Structures by Occupancy in Port St Lucie
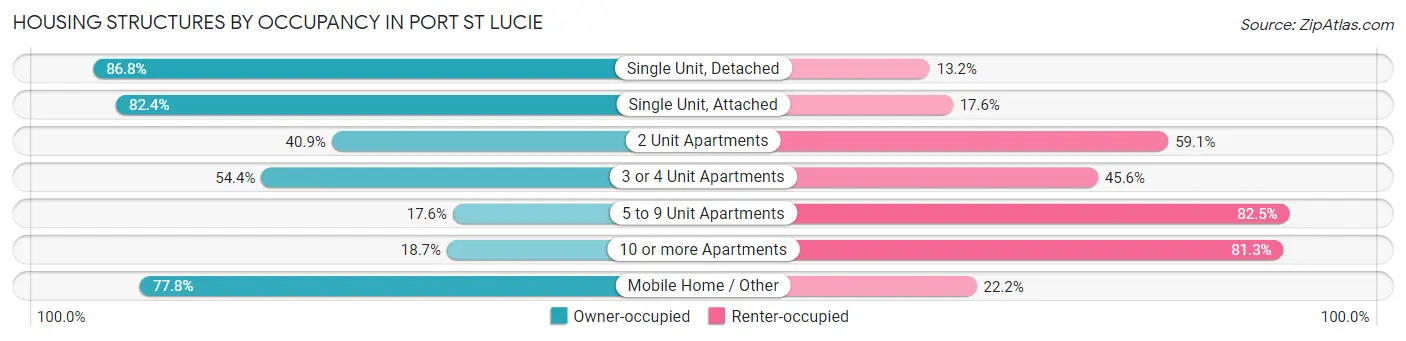
| Structure Type | Owner-occupied | Renter-occupied |
| Single Unit, Detached | 57,965 (86.8%) | 8,833 (13.2%) |
| Single Unit, Attached | 1,997 (82.4%) | 427 (17.6%) |
| 2 Unit Apartments | 74 (40.9%) | 107 (59.1%) |
| 3 or 4 Unit Apartments | 578 (54.4%) | 484 (45.6%) |
| 5 to 9 Unit Apartments | 179 (17.5%) | 841 (82.5%) |
| 10 or more Apartments | 464 (18.7%) | 2,017 (81.3%) |
| Mobile Home / Other | 773 (77.8%) | 221 (22.2%) |
| Total | 62,030 (82.8%) | 12,930 (17.2%) |
Housing Structures by Number of Rooms in Port St Lucie
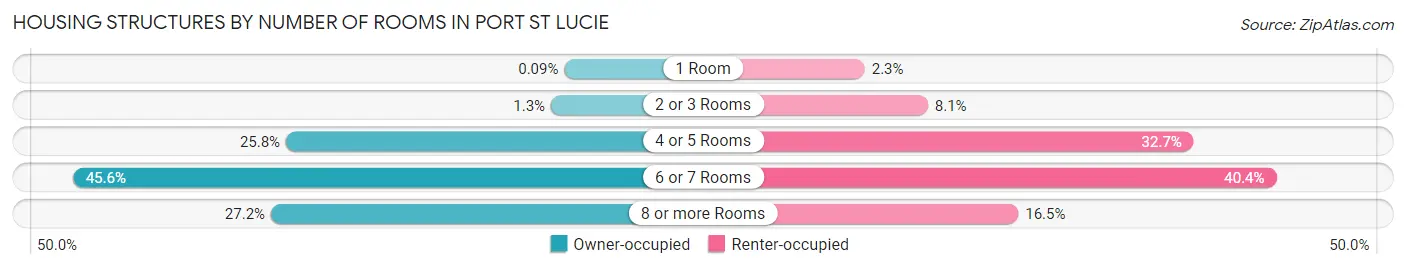
| Number of Rooms | Owner-occupied | Renter-occupied |
| 1 Room | 54 (0.1%) | 298 (2.3%) |
| 2 or 3 Rooms | 816 (1.3%) | 1,051 (8.1%) |
| 4 or 5 Rooms | 16,021 (25.8%) | 4,229 (32.7%) |
| 6 or 7 Rooms | 28,255 (45.6%) | 5,219 (40.4%) |
| 8 or more Rooms | 16,884 (27.2%) | 2,133 (16.5%) |
| Total | 62,030 (100.0%) | 12,930 (100.0%) |
Housing Structure by Heating Type in Port St Lucie
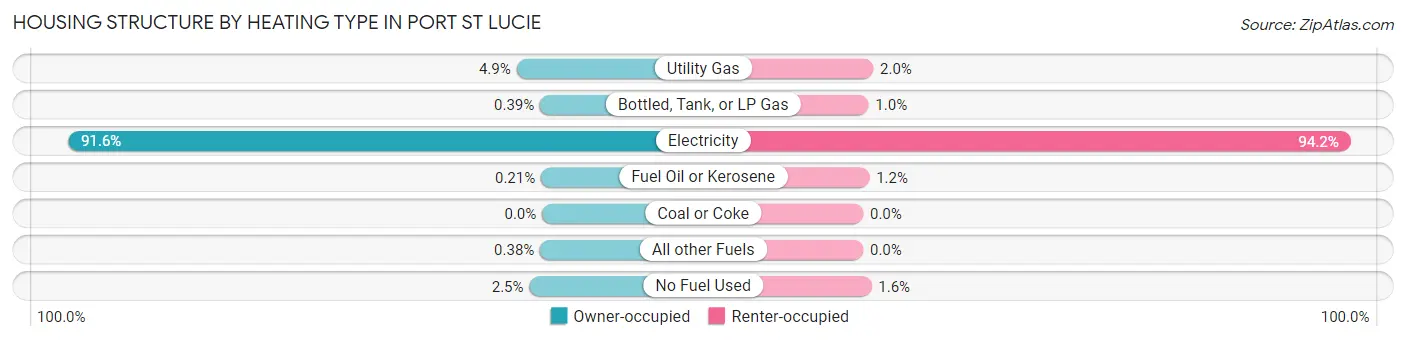
| Heating Type | Owner-occupied | Renter-occupied |
| Utility Gas | 3,058 (4.9%) | 252 (1.9%) |
| Bottled, Tank, or LP Gas | 244 (0.4%) | 135 (1.0%) |
| Electricity | 56,831 (91.6%) | 12,181 (94.2%) |
| Fuel Oil or Kerosene | 131 (0.2%) | 155 (1.2%) |
| Coal or Coke | 0 (0.0%) | 0 (0.0%) |
| All other Fuels | 238 (0.4%) | 0 (0.0%) |
| No Fuel Used | 1,528 (2.5%) | 207 (1.6%) |
| Total | 62,030 (100.0%) | 12,930 (100.0%) |
Household Vehicle Usage in Port St Lucie
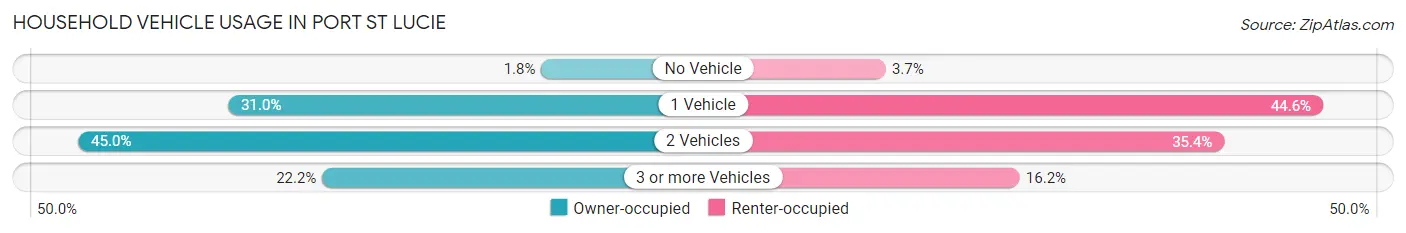
| Vehicles per Household | Owner-occupied | Renter-occupied |
| No Vehicle | 1,100 (1.8%) | 484 (3.7%) |
| 1 Vehicle | 19,234 (31.0%) | 5,769 (44.6%) |
| 2 Vehicles | 27,913 (45.0%) | 4,577 (35.4%) |
| 3 or more Vehicles | 13,783 (22.2%) | 2,100 (16.2%) |
| Total | 62,030 (100.0%) | 12,930 (100.0%) |
Real Estate & Mortgages in Port St Lucie
Real Estate and Mortgage Overview in Port St Lucie
| Characteristic | Without Mortgage | With Mortgage |
| Housing Units | 21,257 | 40,773 |
| Median Property Value | $275,700 | $302,900 |
| Median Household Income | $60,202 | $7,057 |
| Monthly Housing Costs | $615 | $2,134 |
| Real Estate Taxes | $2,873 | $740 |
Property Value by Mortgage Status in Port St Lucie
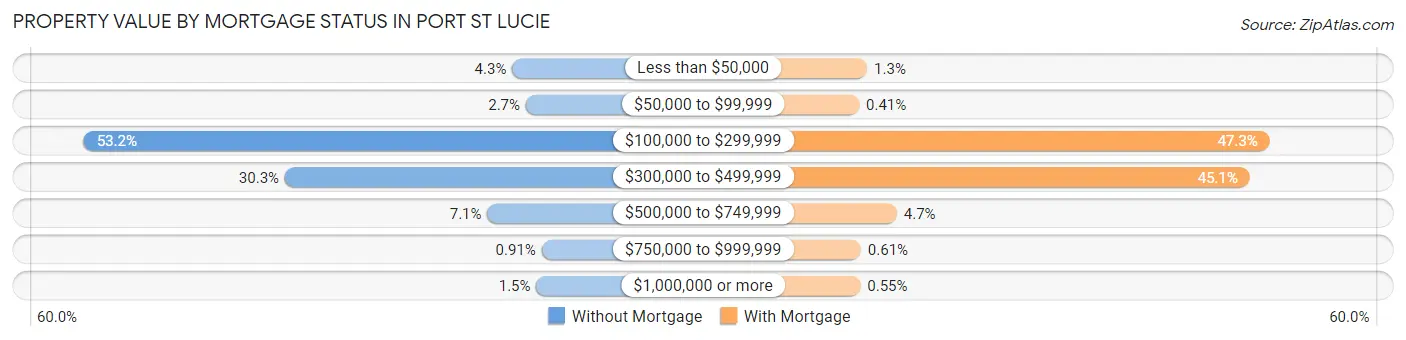
| Property Value | Without Mortgage | With Mortgage |
| Less than $50,000 | 907 (4.3%) | 544 (1.3%) |
| $50,000 to $99,999 | 576 (2.7%) | 166 (0.4%) |
| $100,000 to $299,999 | 11,317 (53.2%) | 19,298 (47.3%) |
| $300,000 to $499,999 | 6,430 (30.2%) | 18,369 (45.1%) |
| $500,000 to $749,999 | 1,512 (7.1%) | 1,924 (4.7%) |
| $750,000 to $999,999 | 193 (0.9%) | 247 (0.6%) |
| $1,000,000 or more | 322 (1.5%) | 225 (0.5%) |
| Total | 21,257 (100.0%) | 40,773 (100.0%) |
Household Income by Mortgage Status in Port St Lucie
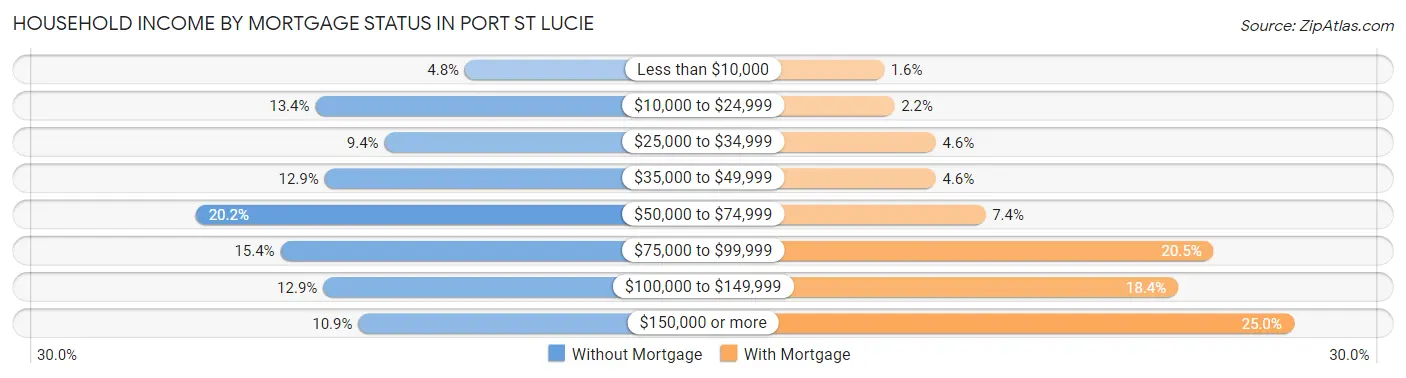
| Household Income | Without Mortgage | With Mortgage |
| Less than $10,000 | 1,029 (4.8%) | 657 (1.6%) |
| $10,000 to $24,999 | 2,846 (13.4%) | 902 (2.2%) |
| $25,000 to $34,999 | 2,007 (9.4%) | 1,863 (4.6%) |
| $35,000 to $49,999 | 2,733 (12.9%) | 1,864 (4.6%) |
| $50,000 to $74,999 | 4,299 (20.2%) | 3,022 (7.4%) |
| $75,000 to $99,999 | 3,269 (15.4%) | 8,342 (20.5%) |
| $100,000 to $149,999 | 2,751 (12.9%) | 7,513 (18.4%) |
| $150,000 or more | 2,323 (10.9%) | 10,210 (25.0%) |
| Total | 21,257 (100.0%) | 40,773 (100.0%) |
Property Value to Household Income Ratio in Port St Lucie
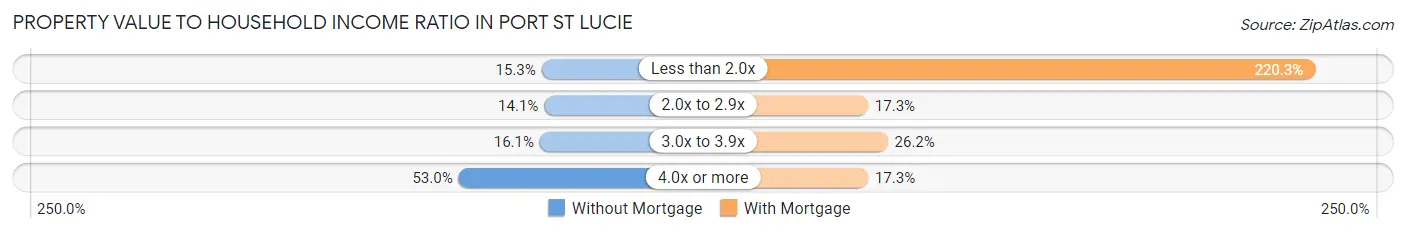
| Value-to-Income Ratio | Without Mortgage | With Mortgage |
| Less than 2.0x | 3,249 (15.3%) | 89,820 (220.3%) |
| 2.0x to 2.9x | 2,998 (14.1%) | 7,033 (17.2%) |
| 3.0x to 3.9x | 3,421 (16.1%) | 10,674 (26.2%) |
| 4.0x or more | 11,269 (53.0%) | 7,046 (17.3%) |
| Total | 21,257 (100.0%) | 40,773 (100.0%) |
Real Estate Taxes by Mortgage Status in Port St Lucie
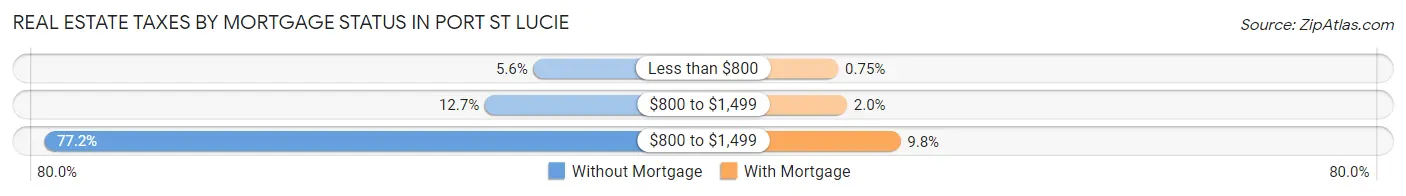
| Property Taxes | Without Mortgage | With Mortgage |
| Less than $800 | 1,195 (5.6%) | 305 (0.7%) |
| $800 to $1,499 | 2,706 (12.7%) | 824 (2.0%) |
| $800 to $1,499 | 16,405 (77.2%) | 4,009 (9.8%) |
| Total | 21,257 (100.0%) | 40,773 (100.0%) |
Health & Disability in Port St Lucie
Health Insurance Coverage by Age in Port St Lucie
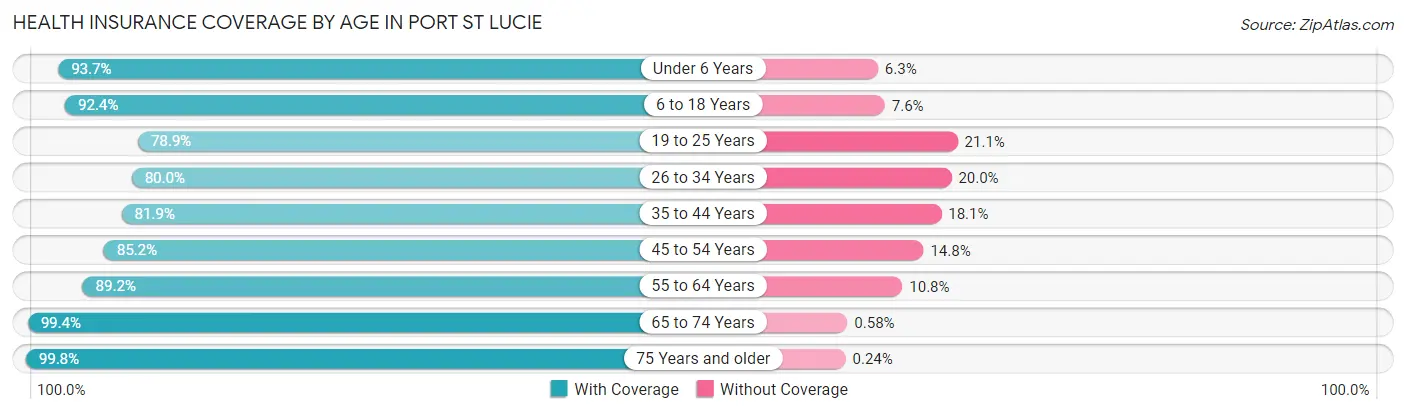
| Age Bracket | With Coverage | Without Coverage |
| Under 6 Years | 12,252 (93.7%) | 819 (6.3%) |
| 6 to 18 Years | 30,127 (92.4%) | 2,463 (7.6%) |
| 19 to 25 Years | 11,940 (78.9%) | 3,200 (21.1%) |
| 26 to 34 Years | 18,528 (80.0%) | 4,626 (20.0%) |
| 35 to 44 Years | 20,984 (81.9%) | 4,631 (18.1%) |
| 45 to 54 Years | 22,864 (85.2%) | 3,962 (14.8%) |
| 55 to 64 Years | 25,770 (89.2%) | 3,131 (10.8%) |
| 65 to 74 Years | 23,979 (99.4%) | 141 (0.6%) |
| 75 Years and older | 20,261 (99.8%) | 48 (0.2%) |
| Total | 186,705 (89.0%) | 23,021 (11.0%) |
Health Insurance Coverage by Citizenship Status in Port St Lucie
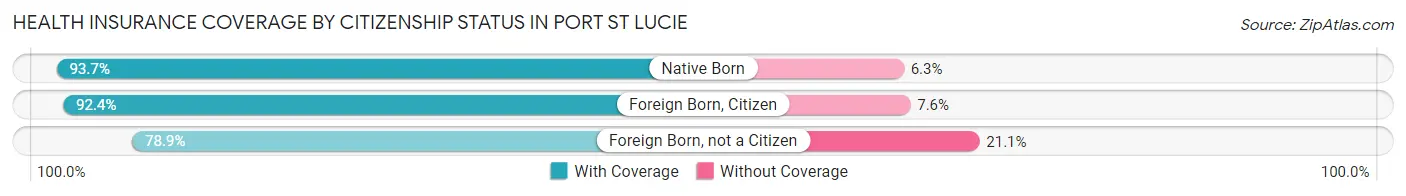
| Citizenship Status | With Coverage | Without Coverage |
| Native Born | 12,252 (93.7%) | 819 (6.3%) |
| Foreign Born, Citizen | 30,127 (92.4%) | 2,463 (7.6%) |
| Foreign Born, not a Citizen | 11,940 (78.9%) | 3,200 (21.1%) |
Health Insurance Coverage by Household Income in Port St Lucie
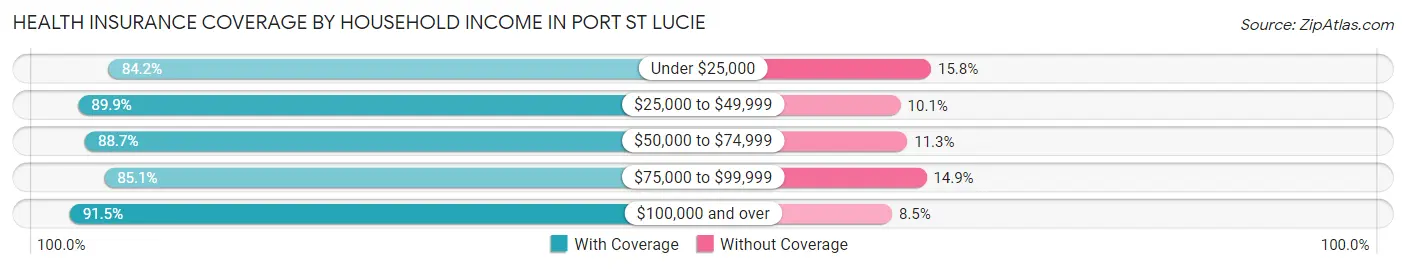
| Household Income | With Coverage | Without Coverage |
| Under $25,000 | 12,790 (84.2%) | 2,396 (15.8%) |
| $25,000 to $49,999 | 27,056 (89.9%) | 3,035 (10.1%) |
| $50,000 to $74,999 | 36,396 (88.7%) | 4,655 (11.3%) |
| $75,000 to $99,999 | 32,358 (85.1%) | 5,674 (14.9%) |
| $100,000 and over | 77,792 (91.5%) | 7,204 (8.5%) |
Public vs Private Health Insurance Coverage by Age in Port St Lucie
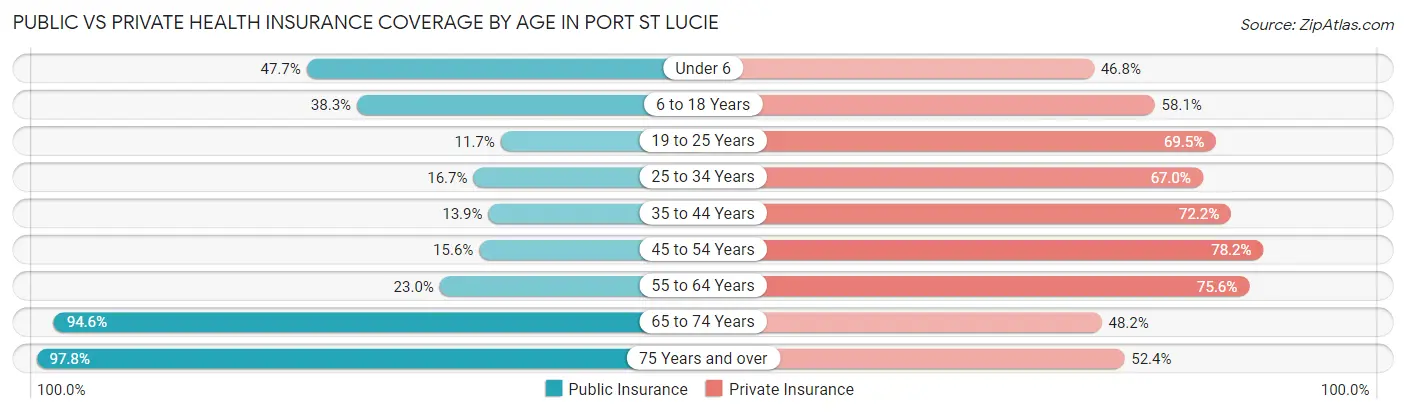
| Age Bracket | Public Insurance | Private Insurance |
| Under 6 | 6,230 (47.7%) | 6,112 (46.8%) |
| 6 to 18 Years | 12,487 (38.3%) | 18,925 (58.1%) |
| 19 to 25 Years | 1,764 (11.7%) | 10,517 (69.5%) |
| 25 to 34 Years | 3,870 (16.7%) | 15,508 (67.0%) |
| 35 to 44 Years | 3,569 (13.9%) | 18,505 (72.2%) |
| 45 to 54 Years | 4,193 (15.6%) | 20,987 (78.2%) |
| 55 to 64 Years | 6,635 (23.0%) | 21,850 (75.6%) |
| 65 to 74 Years | 22,813 (94.6%) | 11,628 (48.2%) |
| 75 Years and over | 19,858 (97.8%) | 10,647 (52.4%) |
| Total | 81,419 (38.8%) | 134,679 (64.2%) |
Disability Status by Sex by Age in Port St Lucie
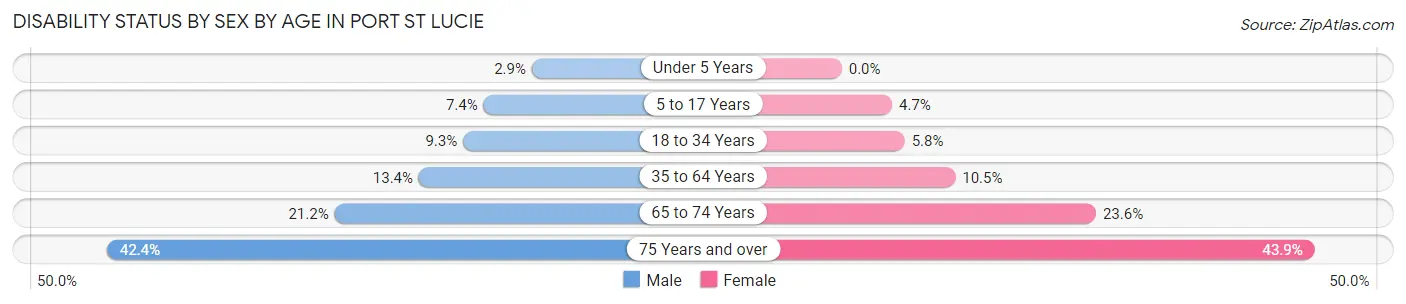
| Age Bracket | Male | Female |
| Under 5 Years | 171 (2.9%) | 0 (0.0%) |
| 5 to 17 Years | 1,239 (7.4%) | 761 (4.7%) |
| 18 to 34 Years | 1,872 (9.3%) | 1,166 (5.8%) |
| 35 to 64 Years | 5,309 (13.4%) | 4,396 (10.5%) |
| 65 to 74 Years | 2,364 (21.2%) | 3,064 (23.6%) |
| 75 Years and over | 4,041 (42.4%) | 4,727 (43.9%) |
Disability Class by Sex by Age in Port St Lucie
Disability Class: Hearing Difficulty
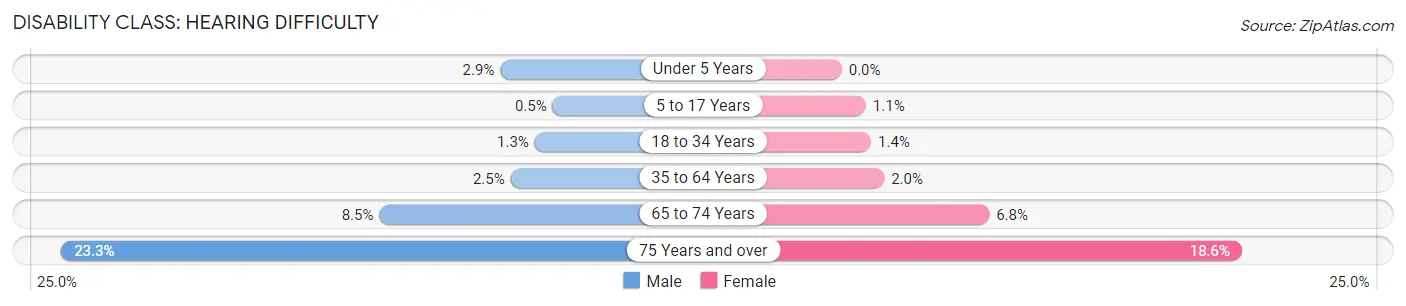
| Age Bracket | Male | Female |
| Under 5 Years | 171 (2.9%) | 0 (0.0%) |
| 5 to 17 Years | 83 (0.5%) | 183 (1.1%) |
| 18 to 34 Years | 268 (1.3%) | 272 (1.4%) |
| 35 to 64 Years | 969 (2.5%) | 823 (2.0%) |
| 65 to 74 Years | 951 (8.5%) | 888 (6.8%) |
| 75 Years and over | 2,222 (23.3%) | 1,999 (18.6%) |
Disability Class: Vision Difficulty
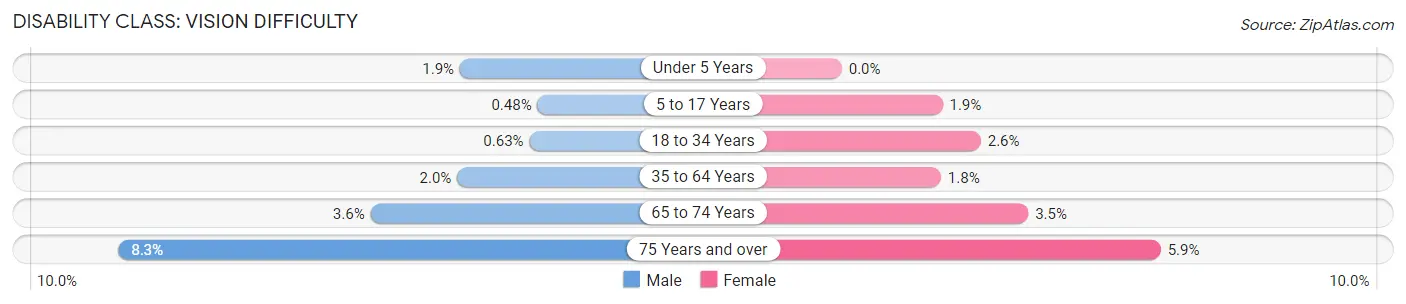
| Age Bracket | Male | Female |
| Under 5 Years | 112 (1.9%) | 0 (0.0%) |
| 5 to 17 Years | 81 (0.5%) | 305 (1.9%) |
| 18 to 34 Years | 126 (0.6%) | 516 (2.6%) |
| 35 to 64 Years | 782 (2.0%) | 769 (1.8%) |
| 65 to 74 Years | 398 (3.6%) | 450 (3.5%) |
| 75 Years and over | 788 (8.3%) | 638 (5.9%) |
Disability Class: Cognitive Difficulty
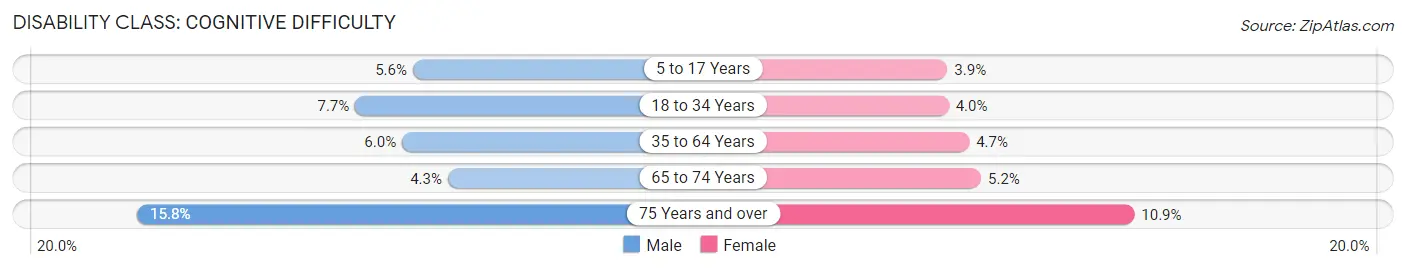
| Age Bracket | Male | Female |
| 5 to 17 Years | 934 (5.6%) | 639 (3.9%) |
| 18 to 34 Years | 1,554 (7.7%) | 793 (4.0%) |
| 35 to 64 Years | 2,373 (6.0%) | 1,976 (4.7%) |
| 65 to 74 Years | 478 (4.3%) | 671 (5.2%) |
| 75 Years and over | 1,509 (15.8%) | 1,170 (10.9%) |
Disability Class: Ambulatory Difficulty
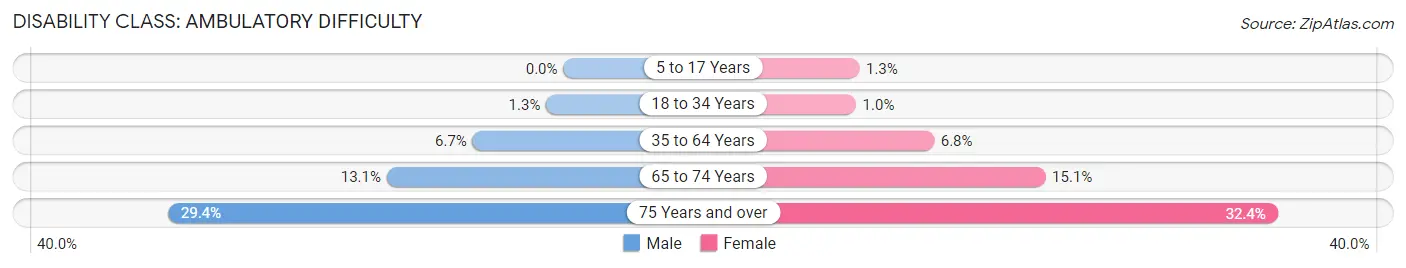
| Age Bracket | Male | Female |
| 5 to 17 Years | 0 (0.0%) | 208 (1.3%) |
| 18 to 34 Years | 256 (1.3%) | 205 (1.0%) |
| 35 to 64 Years | 2,665 (6.7%) | 2,851 (6.8%) |
| 65 to 74 Years | 1,459 (13.1%) | 1,961 (15.1%) |
| 75 Years and over | 2,800 (29.4%) | 3,486 (32.4%) |
Disability Class: Self-Care Difficulty
| Age Bracket | Male | Female |
| 5 to 17 Years | 218 (1.3%) | 203 (1.2%) |
| 18 to 34 Years | 147 (0.7%) | 155 (0.8%) |
| 35 to 64 Years | 1,206 (3.0%) | 877 (2.1%) |
| 65 to 74 Years | 525 (4.7%) | 283 (2.2%) |
| 75 Years and over | 1,280 (13.4%) | 1,354 (12.6%) |
Technology Access in Port St Lucie
Computing Device Access in Port St Lucie
| Device Type | # Households | % Households |
| Desktop or Laptop | 65,645 | 87.6% |
| Smartphone | 68,818 | 91.8% |
| Tablet | 52,304 | 69.8% |
| No Computing Device | 2,172 | 2.9% |
| Total | 74,960 | 100.0% |
Internet Access in Port St Lucie
| Internet Type | # Households | % Households |
| Dial-Up Internet | 83 | 0.1% |
| Broadband Home | 63,028 | 84.1% |
| Cellular Data Only | 5,322 | 7.1% |
| Satellite Internet | 6,481 | 8.6% |
| No Internet | 4,226 | 5.6% |
| Total | 74,960 | 100.0% |
Port St Lucie Summary
Port St. Lucie is a city located in St. Lucie County, Florida, United States. It is the most populous municipality in the county with a population of 164,603 as of the 2010 census. It is located 125 miles (201 km) southeast of Orlando, and 114 miles (183 km) northwest of Miami. Port St. Lucie forms part of a metropolitan area called the Port St. Lucie, Florida Metropolitan Statistical Area that in 2009 was estimated to have 425,000 residents.
History
The area that is now Port St. Lucie was originally inhabited by the Ais Indians, who were part of the Seminole tribe. The first European settlers arrived in the area in the late 19th century, and the area was incorporated as a city in 1961.
The city was named after Saint Lucie of Syracuse, a Christian martyr who was sentenced to death by the Roman Emperor Diocletian in the year 304. The city was originally called "Port St. Lucie Village," but the name was changed to "Port St. Lucie" in 1961.
The city experienced rapid growth in the late 20th century, and by 2000, the population had grown to over 100,000. The city has continued to grow since then, and as of the 2010 census, the population was 164,603.
Geography
Port St. Lucie is located in the Treasure Coast region of Florida, on the east coast of the state. It is bordered by the St. Lucie River to the north, the Indian River Lagoon to the east, and the Atlantic Ocean to the east. The city covers an area of 55.2 square miles (143 km2), of which 54.2 square miles (140 km2) is land and 1.0 square mile (2.6 km2) is water.
The city is located in a humid subtropical climate zone, with hot, humid summers and mild, dry winters. The average temperature in the city is 75°F (24°C), with an average high of 81°F (27°C) and an average low of 68°F (20°C).
Economy
Port St. Lucie is a major economic center in the region, with a diverse economy that includes manufacturing, retail, healthcare, and tourism. The city is home to several major employers, including the St. Lucie Medical Center, the St. Lucie County School District, and the St. Lucie County Sheriff's Office.
The city is also home to several major manufacturing companies, including the Torrey Pines Golf Company, the Florida Power & Light Company, and the Florida East Coast Railway.
Demographics
As of the 2010 census, there were 164,603 people, 63,943 households, and 44,844 families residing in the city. The population density was 2,988.3 people per square mile (1,157.2/km2). There were 71,843 housing units at an average density of 1,316.7 per square mile (508.2/km2).
The racial makeup of the city was 77.2% White, 11.3% African American, 0.4% Native American, 2.2% Asian, 0.1% Pacific Islander, 5.2% from other races, and 3.7% from two or more races. Hispanic or Latino of any race were 17.6% of the population.
The median income for a household in the city was $41,939, and the median income for a family was $50,898. Males had a median income of $36,842 versus $27,868 for females. The per capita income for the city was $21,845. About 10.2% of families and 13.3% of the population were below the poverty line, including 19.2% of those under age 18 and 8.3% of those age 65 or over.
Common Questions
What is Per Capita Income in Port St Lucie?
Per Capita income in Port St Lucie is $35,301.
What is the Median Family Income in Port St Lucie?
Median Family Income in Port St Lucie is $82,429.
What is the Median Household income in Port St Lucie?
Median Household Income in Port St Lucie is $75,040.
What is Income or Wage Gap in Port St Lucie?
Income or Wage Gap in Port St Lucie is 24.7%.
Women in Port St Lucie earn 75.3 cents for every dollar earned by a man.
What is Family Income Deficit in Port St Lucie?
Family Income Deficit in Port St Lucie is $9,639.
Families that are below poverty line in Port St Lucie earn $9,639 less on average than the poverty threshold level.
What is Inequality or Gini Index in Port St Lucie?
Inequality or Gini Index in Port St Lucie is 0.41.
What is the Total Population of Port St Lucie?
Total Population of Port St Lucie is 210,520.
What is the Total Male Population of Port St Lucie?
Total Male Population of Port St Lucie is 103,284.
What is the Total Female Population of Port St Lucie?
Total Female Population of Port St Lucie is 107,236.
What is the Ratio of Males per 100 Females in Port St Lucie?
There are 96.31 Males per 100 Females in Port St Lucie.
What is the Ratio of Females per 100 Males in Port St Lucie?
There are 103.83 Females per 100 Males in Port St Lucie.
What is the Median Population Age in Port St Lucie?
Median Population Age in Port St Lucie is 43.5 Years.
What is the Average Family Size in Port St Lucie
Average Family Size in Port St Lucie is 3.2 People.
What is the Average Household Size in Port St Lucie
Average Household Size in Port St Lucie is 2.8 People.
How Large is the Labor Force in Port St Lucie?
There are 102,881 People in the Labor Forcein in Port St Lucie.
What is the Percentage of People in the Labor Force in Port St Lucie?
59.9% of People are in the Labor Force in Port St Lucie.
What is the Unemployment Rate in Port St Lucie?
Unemployment Rate in Port St Lucie is 5.7%.