Boca Raton, FL Map & Demographics
Boca Raton Map
Boca Raton Overview
$69,500
PER CAPITA INCOME
$131,949
AVG FAMILY INCOME
$95,570
AVG HOUSEHOLD INCOME
44.8%
WAGE / INCOME GAP [ % ]
55.2¢/ $1
WAGE / INCOME GAP [ $ ]
$13,025
FAMILY INCOME DEFICIT
0.55
INEQUALITY / GINI INDEX
97,980
TOTAL POPULATION
45,182
MALE POPULATION
52,798
FEMALE POPULATION
85.58
MALES / 100 FEMALES
116.86
FEMALES / 100 MALES
47.1
MEDIAN AGE
2.9
AVG FAMILY SIZE
2.2
AVG HOUSEHOLD SIZE
47,964
LABOR FORCE [ PEOPLE ]
57.5%
PERCENT IN LABOR FORCE
5.9%
UNEMPLOYMENT RATE
Boca Raton Area Codes
Income in Boca Raton
Income Overview in Boca Raton
Per Capita Income in Boca Raton is $69,500, while median incomes of families and households are $131,949 and $95,570 respectively.
| Characteristic | Number | Measure |
| Per Capita Income | 97,980 | $69,500 |
| Median Family Income | 23,370 | $131,949 |
| Mean Family Income | 23,370 | $204,671 |
| Median Household Income | 41,530 | $95,570 |
| Mean Household Income | 41,530 | $159,017 |
| Income Deficit | 23,370 | $13,025 |
| Wage / Income Gap (%) | 97,980 | 44.83% |
| Wage / Income Gap ($) | 97,980 | 55.17¢ per $1 |
| Gini / Inequality Index | 97,980 | 0.55 |
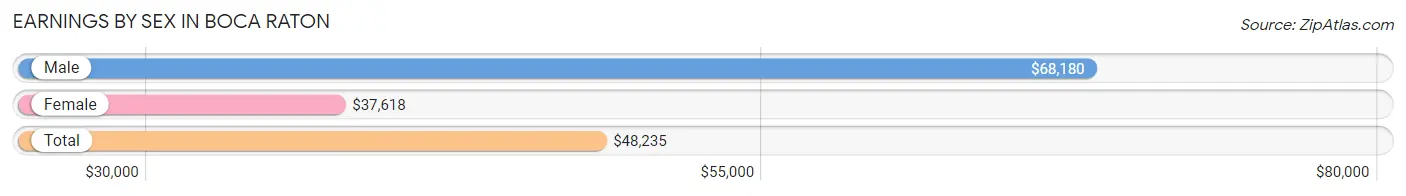
Earnings by Sex in Boca Raton
Average Earnings in Boca Raton are $48,235, $68,180 for men and $37,618 for women, a difference of 44.8%.
| Sex | Number | Average Earnings |
| Male | 25,614 (50.3%) | $68,180 |
| Female | 25,301 (49.7%) | $37,618 |
| Total | 50,915 (100.0%) | $48,235 |
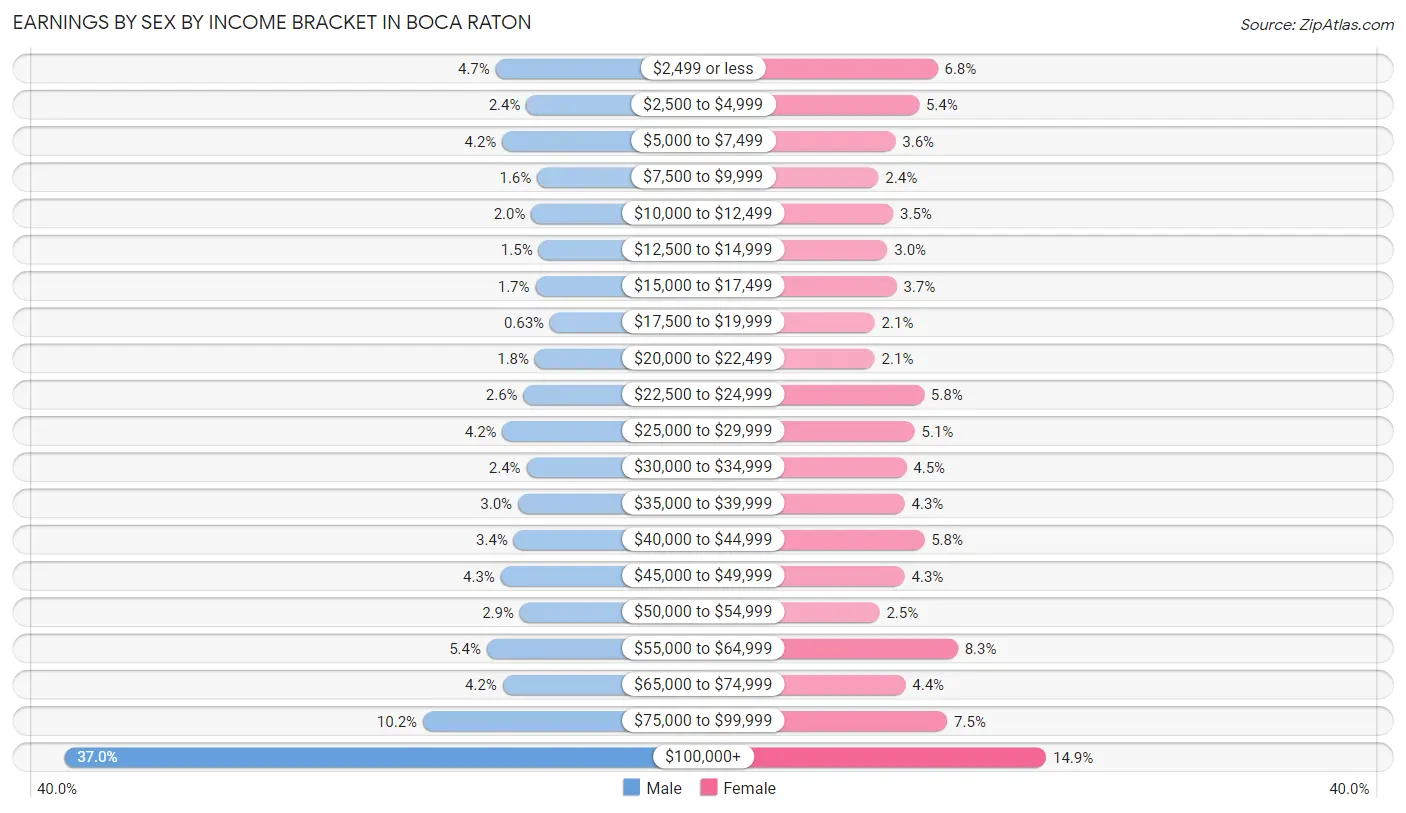
Earnings by Sex by Income Bracket in Boca Raton
The most common earnings brackets in Boca Raton are $100,000+ for men (9,484 | 37.0%) and $100,000+ for women (3,777 | 14.9%).
| Income | Male | Female |
| $2,499 or less | 1,203 (4.7%) | 1,720 (6.8%) |
| $2,500 to $4,999 | 614 (2.4%) | 1,368 (5.4%) |
| $5,000 to $7,499 | 1,079 (4.2%) | 922 (3.6%) |
| $7,500 to $9,999 | 408 (1.6%) | 599 (2.4%) |
| $10,000 to $12,499 | 519 (2.0%) | 879 (3.5%) |
| $12,500 to $14,999 | 381 (1.5%) | 769 (3.0%) |
| $15,000 to $17,499 | 440 (1.7%) | 940 (3.7%) |
| $17,500 to $19,999 | 161 (0.6%) | 528 (2.1%) |
| $20,000 to $22,499 | 451 (1.8%) | 528 (2.1%) |
| $22,500 to $24,999 | 671 (2.6%) | 1,462 (5.8%) |
| $25,000 to $29,999 | 1,073 (4.2%) | 1,285 (5.1%) |
| $30,000 to $34,999 | 612 (2.4%) | 1,128 (4.5%) |
| $35,000 to $39,999 | 775 (3.0%) | 1,096 (4.3%) |
| $40,000 to $44,999 | 857 (3.4%) | 1,468 (5.8%) |
| $45,000 to $49,999 | 1,106 (4.3%) | 1,096 (4.3%) |
| $50,000 to $54,999 | 739 (2.9%) | 620 (2.5%) |
| $55,000 to $64,999 | 1,373 (5.4%) | 2,103 (8.3%) |
| $65,000 to $74,999 | 1,069 (4.2%) | 1,110 (4.4%) |
| $75,000 to $99,999 | 2,599 (10.2%) | 1,903 (7.5%) |
| $100,000+ | 9,484 (37.0%) | 3,777 (14.9%) |
| Total | 25,614 (100.0%) | 25,301 (100.0%) |
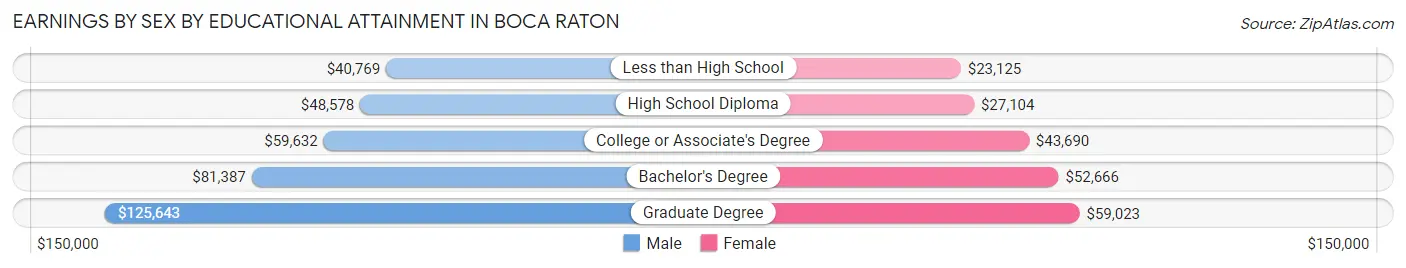
Earnings by Sex by Educational Attainment in Boca Raton
Average earnings in Boca Raton are $78,634 for men and $45,714 for women, a difference of 41.9%. Men with an educational attainment of graduate degree enjoy the highest average annual earnings of $125,643, while those with less than high school education earn the least with $40,769. Women with an educational attainment of graduate degree earn the most with the average annual earnings of $59,023, while those with less than high school education have the smallest earnings of $23,125.
| Educational Attainment | Male Income | Female Income |
| Less than High School | $40,769 | $23,125 |
| High School Diploma | $48,578 | $27,104 |
| College or Associate's Degree | $59,632 | $43,690 |
| Bachelor's Degree | $81,387 | $52,666 |
| Graduate Degree | $125,643 | $59,023 |
| Total | $78,634 | $45,714 |
Family Income in Boca Raton
Family Income Brackets in Boca Raton
According to the Boca Raton family income data, there are 7,291 families falling into the $200,000+ income range, which is the most common income bracket and makes up 31.2% of all families. Conversely, the $10,000 to $14,999 income bracket is the least frequent group with only 164 families (0.7%) belonging to this category.
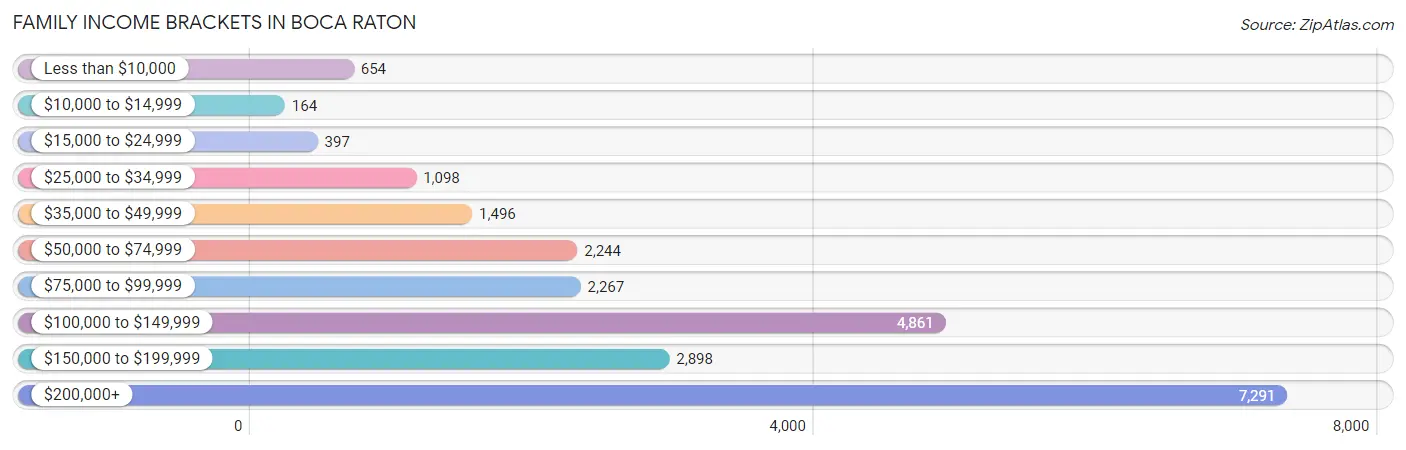
| Income Bracket | # Families | % Families |
| Less than $10,000 | 654 | 2.8% |
| $10,000 to $14,999 | 164 | 0.7% |
| $15,000 to $24,999 | 397 | 1.7% |
| $25,000 to $34,999 | 1,098 | 4.7% |
| $35,000 to $49,999 | 1,496 | 6.4% |
| $50,000 to $74,999 | 2,244 | 9.6% |
| $75,000 to $99,999 | 2,267 | 9.7% |
| $100,000 to $149,999 | 4,861 | 20.8% |
| $150,000 to $199,999 | 2,898 | 12.4% |
| $200,000+ | 7,291 | 31.2% |
Family Income by Famaliy Size in Boca Raton
4-person families (3,536 | 15.1%) account for the highest median family income in Boca Raton with $186,471 per family, while 2-person families (13,614 | 58.3%) have the highest median income of $60,140 per family member.
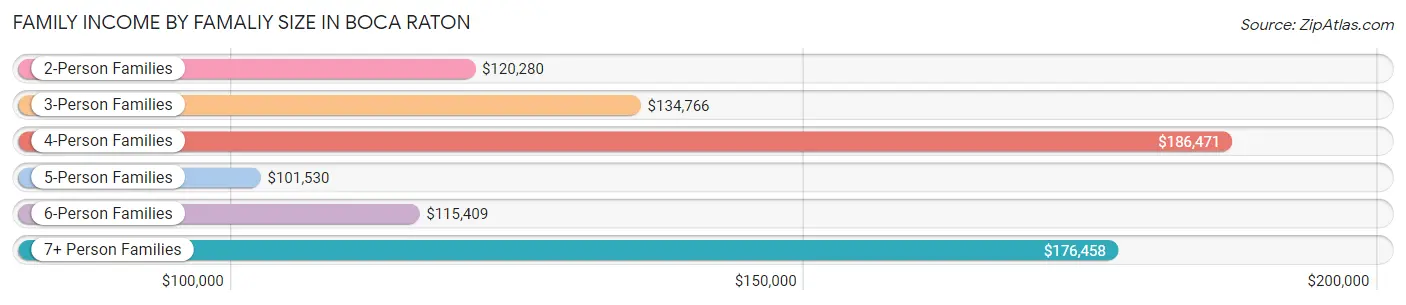
| Income Bracket | # Families | Median Income |
| 2-Person Families | 13,614 (58.3%) | $120,280 |
| 3-Person Families | 4,231 (18.1%) | $134,766 |
| 4-Person Families | 3,536 (15.1%) | $186,471 |
| 5-Person Families | 1,404 (6.0%) | $101,530 |
| 6-Person Families | 449 (1.9%) | $115,409 |
| 7+ Person Families | 136 (0.6%) | $176,458 |
| Total | 23,370 (100.0%) | $131,949 |
Family Income by Number of Earners in Boca Raton
The median family income in Boca Raton is $131,949, with families comprising 3+ earners (1,440) having the highest median family income of $164,097, while families with no earners (4,580) have the lowest median family income of $89,464, accounting for 6.2% and 19.6% of families, respectively.
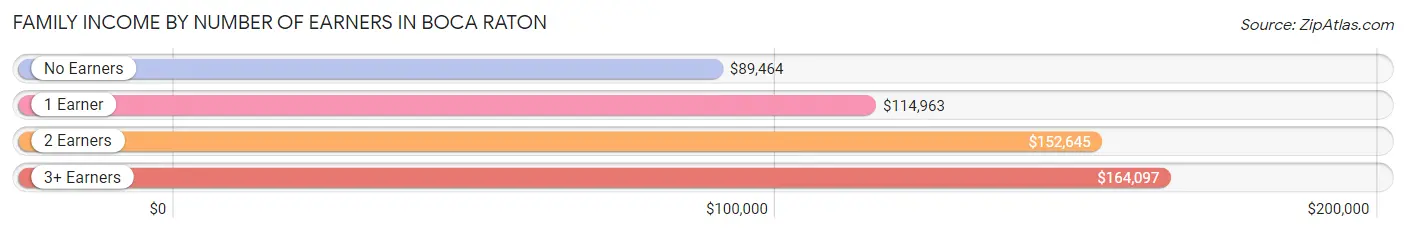
| Number of Earners | # Families | Median Income |
| No Earners | 4,580 (19.6%) | $89,464 |
| 1 Earner | 7,459 (31.9%) | $114,963 |
| 2 Earners | 9,891 (42.3%) | $152,645 |
| 3+ Earners | 1,440 (6.2%) | $164,097 |
| Total | 23,370 (100.0%) | $131,949 |
Household Income in Boca Raton
Household Income Brackets in Boca Raton
With 9,261 households falling in the category, the $200,000+ income range is the most frequent in Boca Raton, accounting for 22.3% of all households. In contrast, only 955 households (2.3%) fall into the $10,000 to $14,999 income bracket, making it the least populous group.
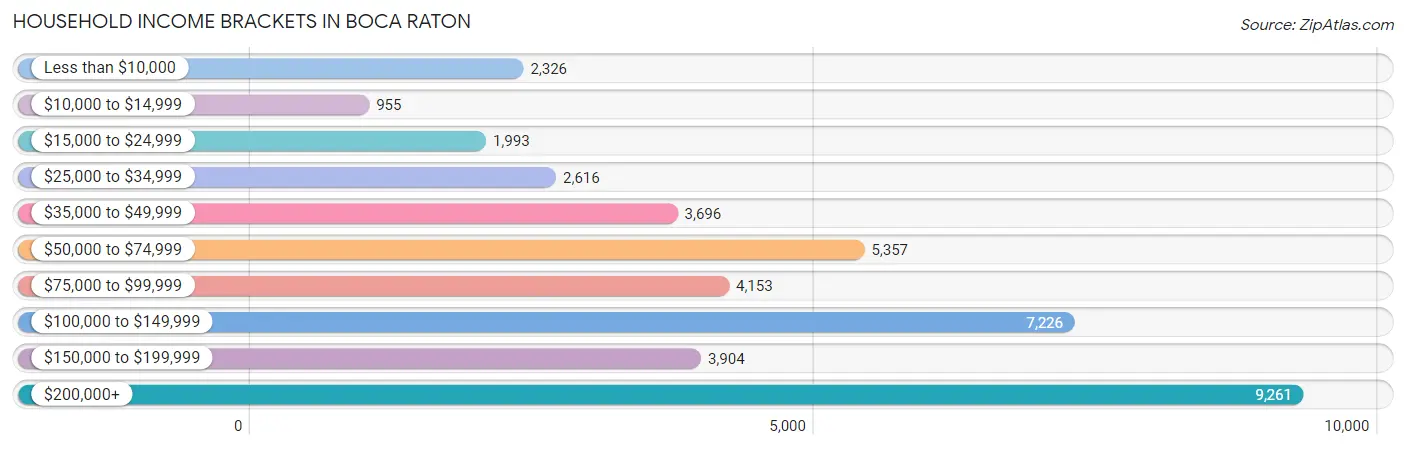
| Income Bracket | # Households | % Households |
| Less than $10,000 | 2,326 | 5.6% |
| $10,000 to $14,999 | 955 | 2.3% |
| $15,000 to $24,999 | 1,993 | 4.8% |
| $25,000 to $34,999 | 2,616 | 6.3% |
| $35,000 to $49,999 | 3,696 | 8.9% |
| $50,000 to $74,999 | 5,357 | 12.9% |
| $75,000 to $99,999 | 4,153 | 10.0% |
| $100,000 to $149,999 | 7,226 | 17.4% |
| $150,000 to $199,999 | 3,904 | 9.4% |
| $200,000+ | 9,261 | 22.3% |
Household Income by Householder Age in Boca Raton
The median household income in Boca Raton is $95,570, with the highest median household income of $110,061 found in the 45 to 64 years age bracket for the primary householder. A total of 15,385 households (37.0%) fall into this category. Meanwhile, the 15 to 24 years age bracket for the primary householder has the lowest median household income of $20,565, with 1,379 households (3.3%) in this group.
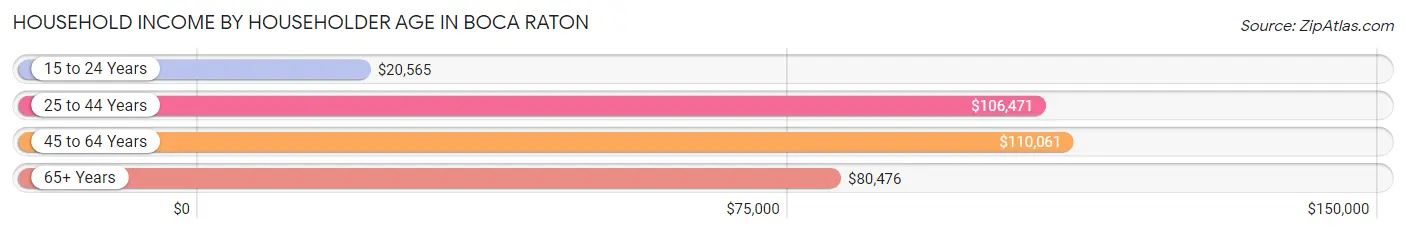
| Income Bracket | # Households | Median Income |
| 15 to 24 Years | 1,379 (3.3%) | $20,565 |
| 25 to 44 Years | 9,161 (22.1%) | $106,471 |
| 45 to 64 Years | 15,385 (37.0%) | $110,061 |
| 65+ Years | 15,605 (37.6%) | $80,476 |
| Total | 41,530 (100.0%) | $95,570 |
Poverty in Boca Raton
Income Below Poverty by Sex and Age in Boca Raton
With 9.3% poverty level for males and 9.4% for females among the residents of Boca Raton, 18 to 24 year old males and 18 to 24 year old females are the most vulnerable to poverty, with 1,044 males (31.6%) and 1,265 females (32.7%) in their respective age groups living below the poverty level.
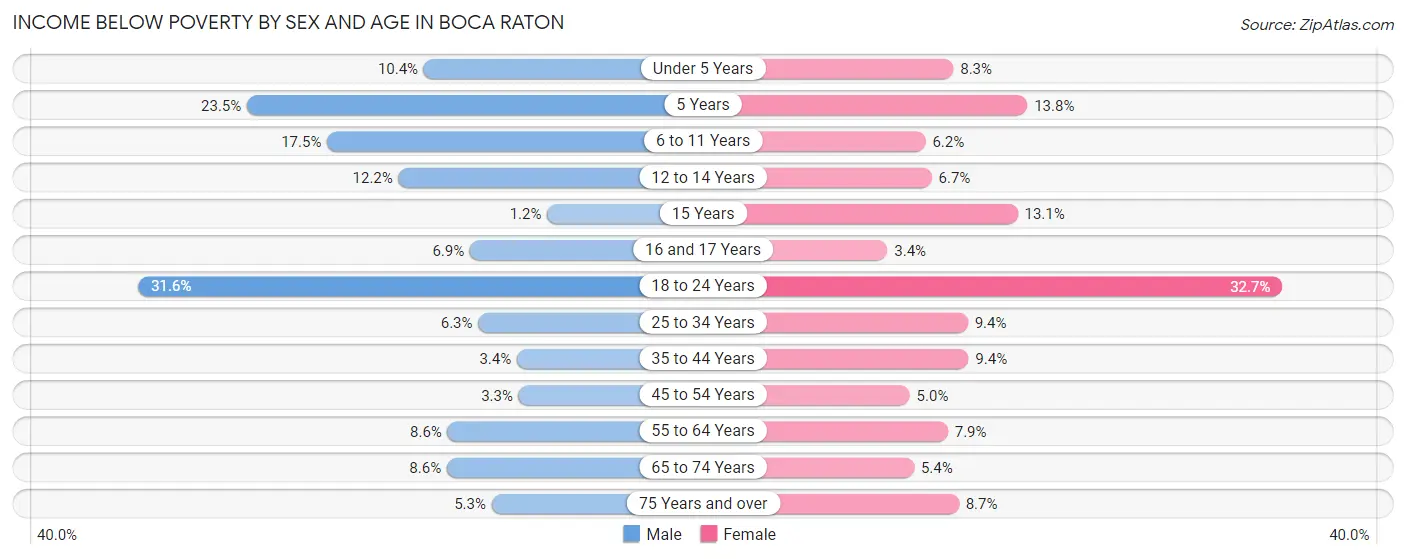
| Age Bracket | Male | Female |
| Under 5 Years | 181 (10.3%) | 182 (8.3%) |
| 5 Years | 93 (23.5%) | 53 (13.8%) |
| 6 to 11 Years | 506 (17.5%) | 158 (6.2%) |
| 12 to 14 Years | 147 (12.2%) | 134 (6.7%) |
| 15 Years | 8 (1.2%) | 65 (13.1%) |
| 16 and 17 Years | 67 (6.9%) | 37 (3.4%) |
| 18 to 24 Years | 1,044 (31.6%) | 1,265 (32.7%) |
| 25 to 34 Years | 294 (6.3%) | 422 (9.3%) |
| 35 to 44 Years | 160 (3.4%) | 473 (9.4%) |
| 45 to 54 Years | 166 (3.3%) | 331 (5.0%) |
| 55 to 64 Years | 595 (8.6%) | 583 (7.9%) |
| 65 to 74 Years | 492 (8.6%) | 325 (5.4%) |
| 75 Years and over | 290 (5.3%) | 638 (8.7%) |
| Total | 4,043 (9.3%) | 4,666 (9.4%) |
Income Above Poverty by Sex and Age in Boca Raton
According to the poverty statistics in Boca Raton, males aged 15 years and females aged 16 and 17 years are the age groups that are most secure financially, with 98.8% of males and 96.6% of females in these age groups living above the poverty line.
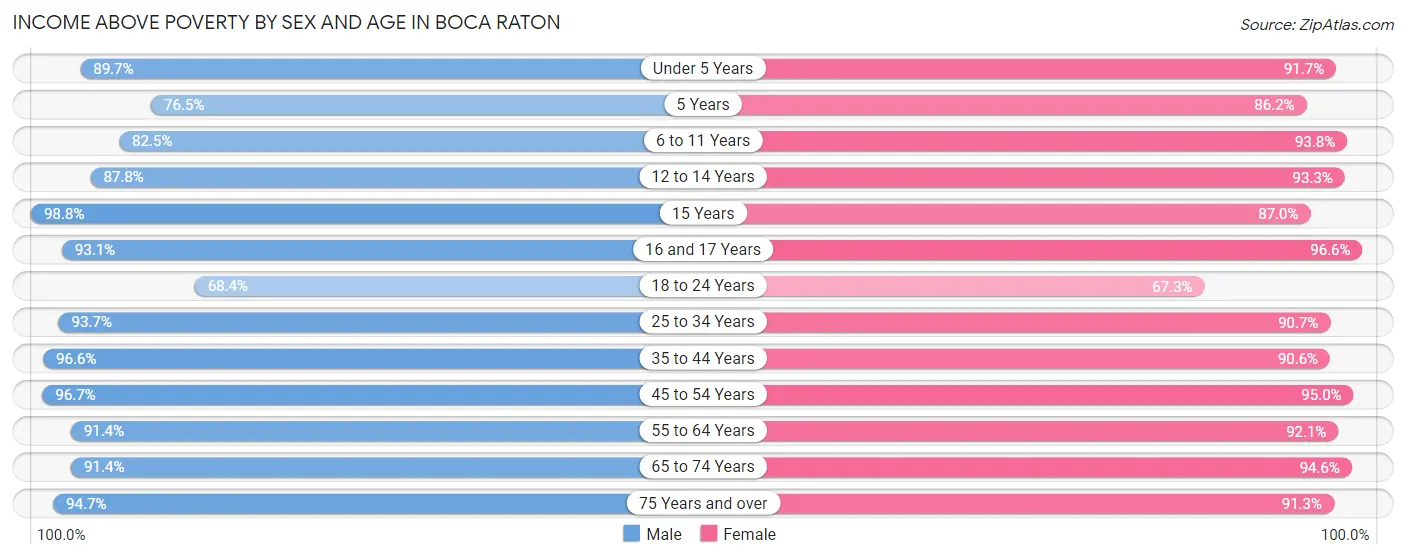
| Age Bracket | Male | Female |
| Under 5 Years | 1,567 (89.6%) | 2,015 (91.7%) |
| 5 Years | 303 (76.5%) | 332 (86.2%) |
| 6 to 11 Years | 2,381 (82.5%) | 2,385 (93.8%) |
| 12 to 14 Years | 1,055 (87.8%) | 1,875 (93.3%) |
| 15 Years | 665 (98.8%) | 433 (87.0%) |
| 16 and 17 Years | 900 (93.1%) | 1,059 (96.6%) |
| 18 to 24 Years | 2,262 (68.4%) | 2,603 (67.3%) |
| 25 to 34 Years | 4,368 (93.7%) | 4,089 (90.6%) |
| 35 to 44 Years | 4,488 (96.6%) | 4,561 (90.6%) |
| 45 to 54 Years | 4,845 (96.7%) | 6,241 (95.0%) |
| 55 to 64 Years | 6,333 (91.4%) | 6,828 (92.1%) |
| 65 to 74 Years | 5,202 (91.4%) | 5,734 (94.6%) |
| 75 Years and over | 5,170 (94.7%) | 6,710 (91.3%) |
| Total | 39,539 (90.7%) | 44,865 (90.6%) |
Income Below Poverty Among Married-Couple Families in Boca Raton
The poverty statistics for married-couple families in Boca Raton show that 3.8% or 705 of the total 18,711 families live below the poverty line. Families with 3 or 4 children have the highest poverty rate of 5.4%, comprising of 60 families. On the other hand, families with 5 or more children have the lowest poverty rate of 0.0%, which includes 0 families.
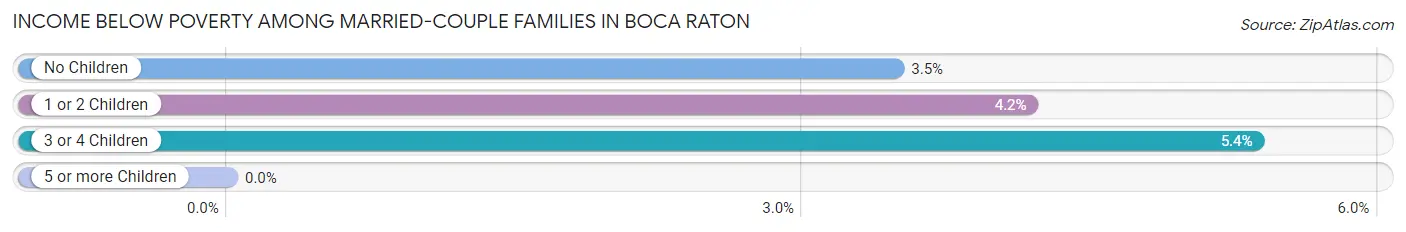
| Children | Above Poverty | Below Poverty |
| No Children | 11,854 (96.5%) | 428 (3.5%) |
| 1 or 2 Children | 4,969 (95.8%) | 217 (4.2%) |
| 3 or 4 Children | 1,060 (94.6%) | 60 (5.4%) |
| 5 or more Children | 123 (100.0%) | 0 (0.0%) |
| Total | 18,006 (96.2%) | 705 (3.8%) |
Income Below Poverty Among Single-Parent Households in Boca Raton
According to the poverty data in Boca Raton, 6.9% or 90 single-father households and 11.8% or 396 single-mother households are living below the poverty line. Among single-father households, those with no children have the highest poverty rate, with 41 households (7.4%) experiencing poverty. Likewise, among single-mother households, those with 5 or more children have the highest poverty rate, with 82 households (100.0%) falling below the poverty line.
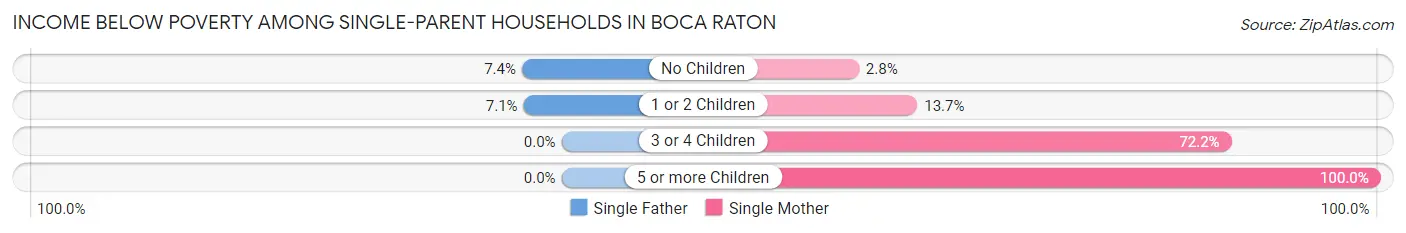
| Children | Single Father | Single Mother |
| No Children | 41 (7.4%) | 46 (2.8%) |
| 1 or 2 Children | 49 (7.1%) | 216 (13.7%) |
| 3 or 4 Children | 0 (0.0%) | 52 (72.2%) |
| 5 or more Children | 0 (0.0%) | 82 (100.0%) |
| Total | 90 (6.9%) | 396 (11.8%) |
Income Below Poverty Among Married-Couple vs Single-Parent Households in Boca Raton
The poverty data for Boca Raton shows that 705 of the married-couple family households (3.8%) and 486 of the single-parent households (10.4%) are living below the poverty level. Within the married-couple family households, those with 3 or 4 children have the highest poverty rate, with 60 households (5.4%) falling below the poverty line. Among the single-parent households, those with 5 or more children have the highest poverty rate, with 82 household (100.0%) living below poverty.
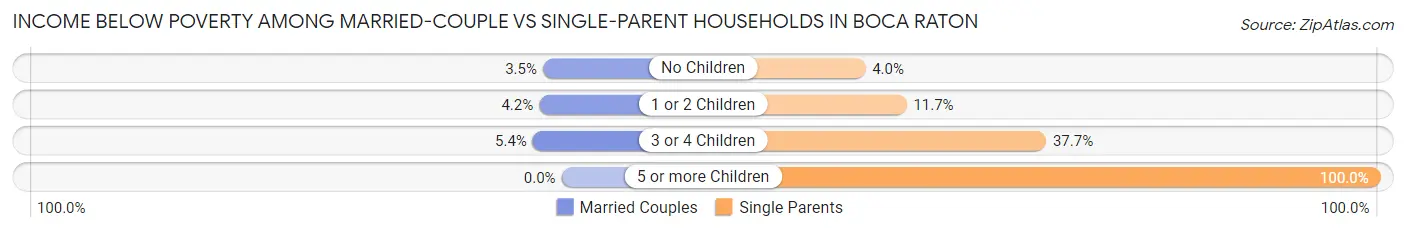
| Children | Married-Couple Families | Single-Parent Households |
| No Children | 428 (3.5%) | 87 (4.0%) |
| 1 or 2 Children | 217 (4.2%) | 265 (11.7%) |
| 3 or 4 Children | 60 (5.4%) | 52 (37.7%) |
| 5 or more Children | 0 (0.0%) | 82 (100.0%) |
| Total | 705 (3.8%) | 486 (10.4%) |
Race in Boca Raton
The most populous races in Boca Raton are White / Caucasian (77,173 | 78.8%), Hispanic or Latino (14,374 | 14.7%), and Two or more Races (8,222 | 8.4%).
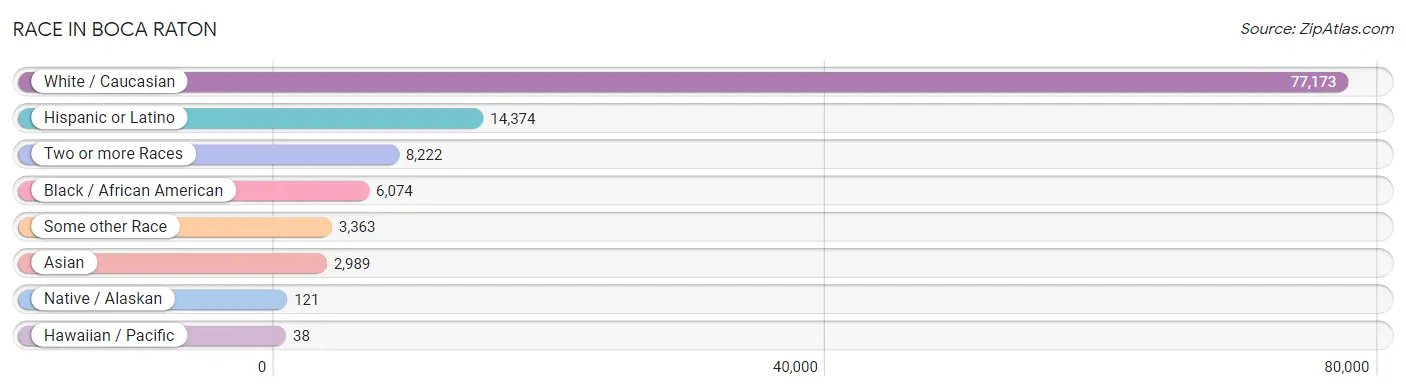
| Race | # Population | % Population |
| Asian | 2,989 | 3.0% |
| Black / African American | 6,074 | 6.2% |
| Hawaiian / Pacific | 38 | 0.0% |
| Hispanic or Latino | 14,374 | 14.7% |
| Native / Alaskan | 121 | 0.1% |
| White / Caucasian | 77,173 | 78.8% |
| Two or more Races | 8,222 | 8.4% |
| Some other Race | 3,363 | 3.4% |
| Total | 97,980 | 100.0% |
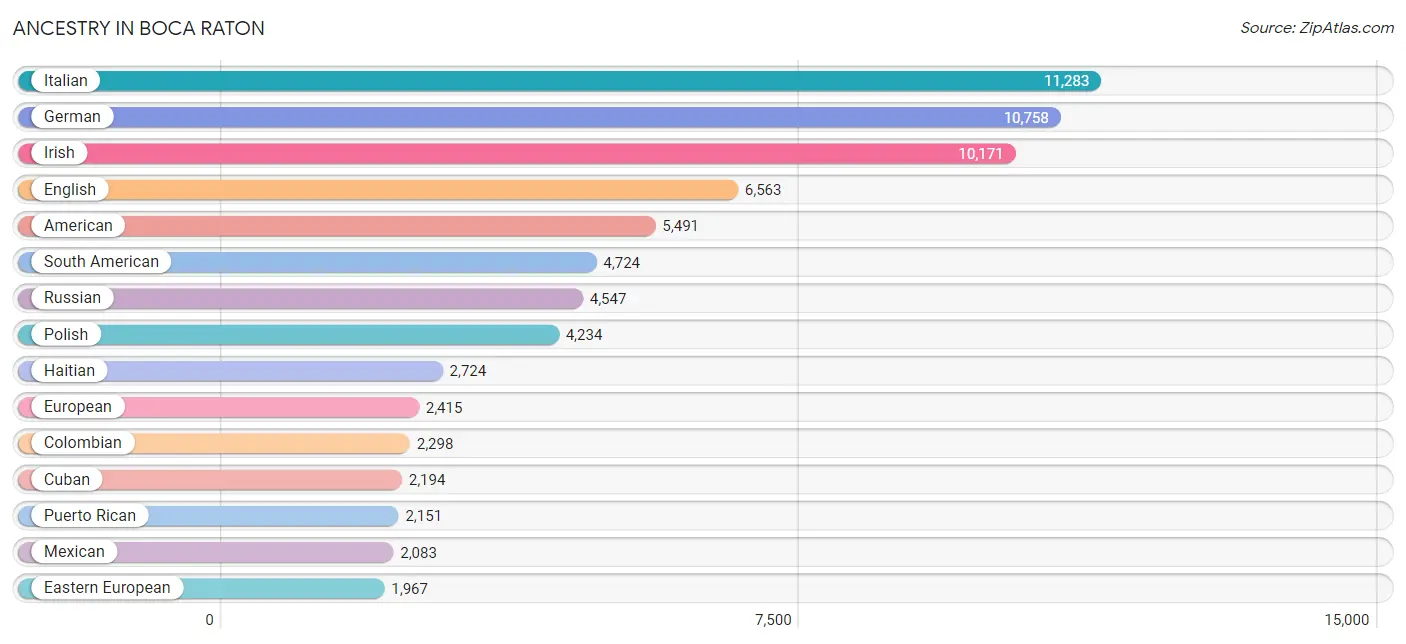
Ancestry in Boca Raton
The most populous ancestries reported in Boca Raton are Italian (11,283 | 11.5%), German (10,758 | 11.0%), Irish (10,171 | 10.4%), English (6,563 | 6.7%), and American (5,491 | 5.6%), together accounting for 45.2% of all Boca Raton residents.
| Ancestry | # Population | % Population |
| African | 193 | 0.2% |
| Albanian | 11 | 0.0% |
| Alsatian | 24 | 0.0% |
| American | 5,491 | 5.6% |
| Arab | 1,190 | 1.2% |
| Argentinean | 95 | 0.1% |
| Armenian | 238 | 0.2% |
| Assyrian / Chaldean / Syriac | 40 | 0.0% |
| Australian | 11 | 0.0% |
| Austrian | 823 | 0.8% |
| Bahamian | 64 | 0.1% |
| Barbadian | 6 | 0.0% |
| Basque | 16 | 0.0% |
| Belgian | 135 | 0.1% |
| Bhutanese | 473 | 0.5% |
| Bolivian | 52 | 0.1% |
| Brazilian | 1,103 | 1.1% |
| British | 628 | 0.6% |
| British West Indian | 18 | 0.0% |
| Bulgarian | 26 | 0.0% |
| Burmese | 277 | 0.3% |
| Canadian | 751 | 0.8% |
| Central American | 1,118 | 1.1% |
| Central American Indian | 204 | 0.2% |
| Cherokee | 207 | 0.2% |
| Chilean | 216 | 0.2% |
| Choctaw | 25 | 0.0% |
| Colombian | 2,298 | 2.4% |
| Costa Rican | 242 | 0.3% |
| Creek | 12 | 0.0% |
| Croatian | 153 | 0.2% |
| Cuban | 2,194 | 2.2% |
| Czech | 258 | 0.3% |
| Czechoslovakian | 42 | 0.0% |
| Danish | 134 | 0.1% |
| Delaware | 5 | 0.0% |
| Dominican | 581 | 0.6% |
| Dutch | 840 | 0.9% |
| Eastern European | 1,967 | 2.0% |
| Ecuadorian | 353 | 0.4% |
| Egyptian | 150 | 0.2% |
| English | 6,563 | 6.7% |
| Ethiopian | 33 | 0.0% |
| European | 2,415 | 2.5% |
| Fijian | 12 | 0.0% |
| Filipino | 66 | 0.1% |
| Finnish | 177 | 0.2% |
| French | 1,816 | 1.8% |
| French Canadian | 498 | 0.5% |
| German | 10,758 | 11.0% |
| Greek | 832 | 0.9% |
| Guatemalan | 284 | 0.3% |
| Guyanese | 108 | 0.1% |
| Haitian | 2,724 | 2.8% |
| Honduran | 133 | 0.1% |
| Hungarian | 1,040 | 1.1% |
| Indian (Asian) | 643 | 0.7% |
| Indonesian | 36 | 0.0% |
| Iranian | 212 | 0.2% |
| Iraqi | 28 | 0.0% |
| Irish | 10,171 | 10.4% |
| Israeli | 305 | 0.3% |
| Italian | 11,283 | 11.5% |
| Jamaican | 614 | 0.6% |
| Japanese | 22 | 0.0% |
| Jordanian | 14 | 0.0% |
| Kenyan | 116 | 0.1% |
| Korean | 383 | 0.4% |
| Laotian | 6 | 0.0% |
| Latvian | 33 | 0.0% |
| Lebanese | 291 | 0.3% |
| Lithuanian | 520 | 0.5% |
| Macedonian | 16 | 0.0% |
| Maltese | 63 | 0.1% |
| Mexican | 2,083 | 2.1% |
| Mexican American Indian | 93 | 0.1% |
| Moroccan | 107 | 0.1% |
| Native Hawaiian | 5 | 0.0% |
| Navajo | 18 | 0.0% |
| Nicaraguan | 117 | 0.1% |
| Nigerian | 23 | 0.0% |
| Northern European | 111 | 0.1% |
| Norwegian | 710 | 0.7% |
| Pakistani | 31 | 0.0% |
| Palestinian | 20 | 0.0% |
| Panamanian | 70 | 0.1% |
| Paraguayan | 23 | 0.0% |
| Pennsylvania German | 6 | 0.0% |
| Peruvian | 906 | 0.9% |
| Polish | 4,234 | 4.3% |
| Portuguese | 539 | 0.5% |
| Puerto Rican | 2,151 | 2.2% |
| Romanian | 713 | 0.7% |
| Russian | 4,547 | 4.6% |
| Salvadoran | 122 | 0.1% |
| Samoan | 26 | 0.0% |
| Scandinavian | 150 | 0.2% |
| Scotch-Irish | 522 | 0.5% |
| Scottish | 843 | 0.9% |
| Seminole | 36 | 0.0% |
| Serbian | 150 | 0.2% |
| Sioux | 14 | 0.0% |
| Slavic | 91 | 0.1% |
| Slovak | 271 | 0.3% |
| Slovene | 40 | 0.0% |
| South African | 193 | 0.2% |
| South American | 4,724 | 4.8% |
| South American Indian | 16 | 0.0% |
| Spaniard | 471 | 0.5% |
| Spanish | 186 | 0.2% |
| Sri Lankan | 480 | 0.5% |
| Subsaharan African | 600 | 0.6% |
| Swedish | 1,168 | 1.2% |
| Swiss | 584 | 0.6% |
| Syrian | 275 | 0.3% |
| Thai | 773 | 0.8% |
| Trinidadian and Tobagonian | 147 | 0.2% |
| Turkish | 765 | 0.8% |
| U.S. Virgin Islander | 9 | 0.0% |
| Ukrainian | 1,584 | 1.6% |
| Uruguayan | 45 | 0.1% |
| Venezuelan | 736 | 0.7% |
| Vietnamese | 454 | 0.5% |
| Welsh | 238 | 0.2% |
| West Indian | 98 | 0.1% |
| Yugoslavian | 82 | 0.1% |
| Yup'ik | 9 | 0.0% | View All 127 Rows |
Immigrants in Boca Raton
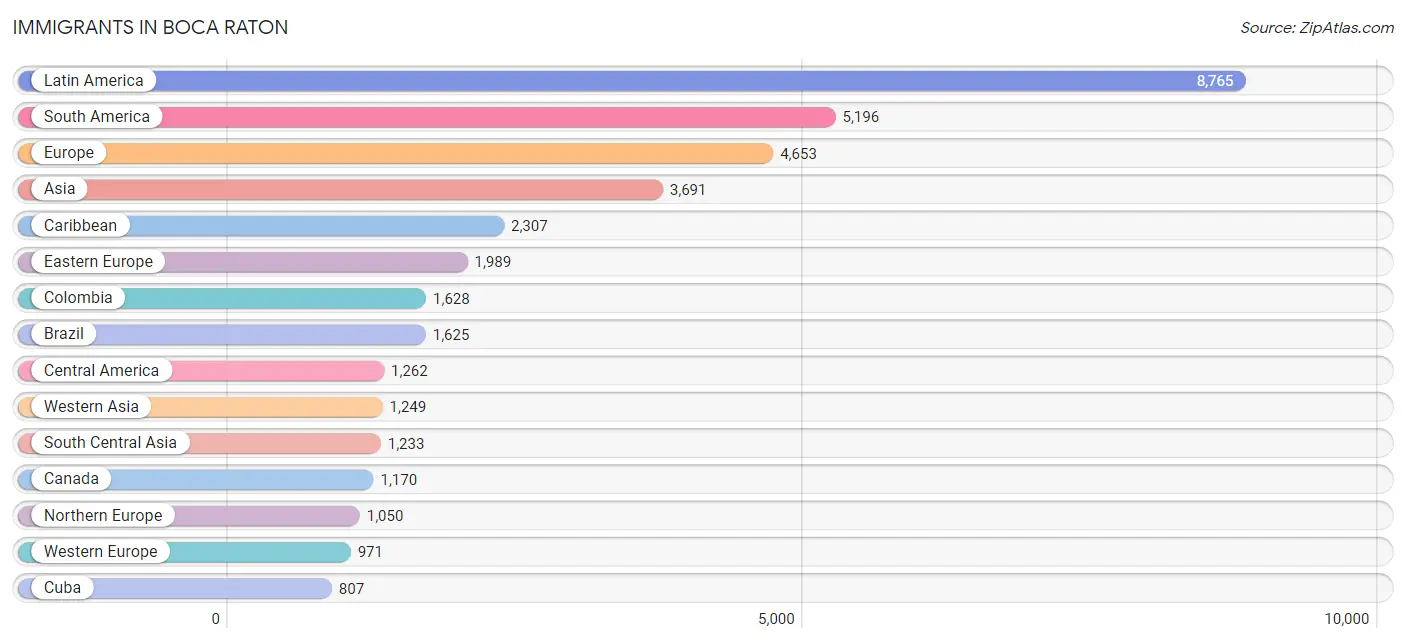
The most numerous immigrant groups reported in Boca Raton came from Latin America (8,765 | 8.9%), South America (5,196 | 5.3%), Europe (4,653 | 4.8%), Asia (3,691 | 3.8%), and Caribbean (2,307 | 2.4%), together accounting for 25.1% of all Boca Raton residents.
| Immigration Origin | # Population | % Population |
| Africa | 497 | 0.5% |
| Argentina | 95 | 0.1% |
| Armenia | 24 | 0.0% |
| Asia | 3,691 | 3.8% |
| Australia | 36 | 0.0% |
| Austria | 64 | 0.1% |
| Bahamas | 43 | 0.0% |
| Bangladesh | 346 | 0.4% |
| Barbados | 12 | 0.0% |
| Belarus | 58 | 0.1% |
| Belgium | 14 | 0.0% |
| Belize | 48 | 0.1% |
| Bolivia | 49 | 0.1% |
| Bosnia and Herzegovina | 31 | 0.0% |
| Brazil | 1,625 | 1.7% |
| Bulgaria | 28 | 0.0% |
| Cambodia | 53 | 0.1% |
| Canada | 1,170 | 1.2% |
| Caribbean | 2,307 | 2.4% |
| Central America | 1,262 | 1.3% |
| Chile | 180 | 0.2% |
| China | 384 | 0.4% |
| Colombia | 1,628 | 1.7% |
| Costa Rica | 249 | 0.3% |
| Croatia | 38 | 0.0% |
| Cuba | 807 | 0.8% |
| Czechoslovakia | 183 | 0.2% |
| Dominican Republic | 358 | 0.4% |
| Eastern Africa | 65 | 0.1% |
| Eastern Asia | 680 | 0.7% |
| Eastern Europe | 1,989 | 2.0% |
| Ecuador | 191 | 0.2% |
| Egypt | 52 | 0.1% |
| El Salvador | 60 | 0.1% |
| England | 220 | 0.2% |
| Ethiopia | 44 | 0.0% |
| Europe | 4,653 | 4.8% |
| France | 224 | 0.2% |
| Germany | 337 | 0.3% |
| Greece | 171 | 0.2% |
| Guatemala | 192 | 0.2% |
| Guyana | 159 | 0.2% |
| Haiti | 656 | 0.7% |
| Honduras | 65 | 0.1% |
| Hong Kong | 55 | 0.1% |
| Hungary | 84 | 0.1% |
| India | 455 | 0.5% |
| Indonesia | 26 | 0.0% |
| Iran | 150 | 0.2% |
| Iraq | 46 | 0.1% |
| Ireland | 63 | 0.1% |
| Israel | 257 | 0.3% |
| Italy | 294 | 0.3% |
| Jamaica | 225 | 0.2% |
| Japan | 145 | 0.2% |
| Kazakhstan | 230 | 0.2% |
| Kenya | 21 | 0.0% |
| Korea | 151 | 0.2% |
| Latin America | 8,765 | 8.9% |
| Latvia | 14 | 0.0% |
| Lebanon | 83 | 0.1% |
| Mexico | 595 | 0.6% |
| Moldova | 11 | 0.0% |
| Morocco | 44 | 0.0% |
| Netherlands | 172 | 0.2% |
| Nicaragua | 31 | 0.0% |
| Nigeria | 11 | 0.0% |
| North Macedonia | 10 | 0.0% |
| Northern Africa | 137 | 0.1% |
| Northern Europe | 1,050 | 1.1% |
| Norway | 20 | 0.0% |
| Oceania | 56 | 0.1% |
| Pakistan | 33 | 0.0% |
| Panama | 22 | 0.0% |
| Peru | 534 | 0.5% |
| Philippines | 216 | 0.2% |
| Poland | 113 | 0.1% |
| Portugal | 9 | 0.0% |
| Romania | 290 | 0.3% |
| Russia | 465 | 0.5% |
| Saudi Arabia | 81 | 0.1% |
| Scotland | 30 | 0.0% |
| Serbia | 304 | 0.3% |
| South Africa | 269 | 0.3% |
| South America | 5,196 | 5.3% |
| South Central Asia | 1,233 | 1.3% |
| South Eastern Asia | 498 | 0.5% |
| Southern Europe | 628 | 0.6% |
| Spain | 154 | 0.2% |
| Sweden | 72 | 0.1% |
| Switzerland | 160 | 0.2% |
| Syria | 203 | 0.2% |
| Taiwan | 71 | 0.1% |
| Thailand | 31 | 0.0% |
| Trinidad and Tobago | 105 | 0.1% |
| Turkey | 555 | 0.6% |
| Ukraine | 225 | 0.2% |
| Uruguay | 49 | 0.1% |
| Uzbekistan | 19 | 0.0% |
| Venezuela | 663 | 0.7% |
| Vietnam | 145 | 0.2% |
| Western Africa | 26 | 0.0% |
| Western Asia | 1,249 | 1.3% |
| Western Europe | 971 | 1.0% | View All 104 Rows |
Sex and Age in Boca Raton
Sex and Age in Boca Raton
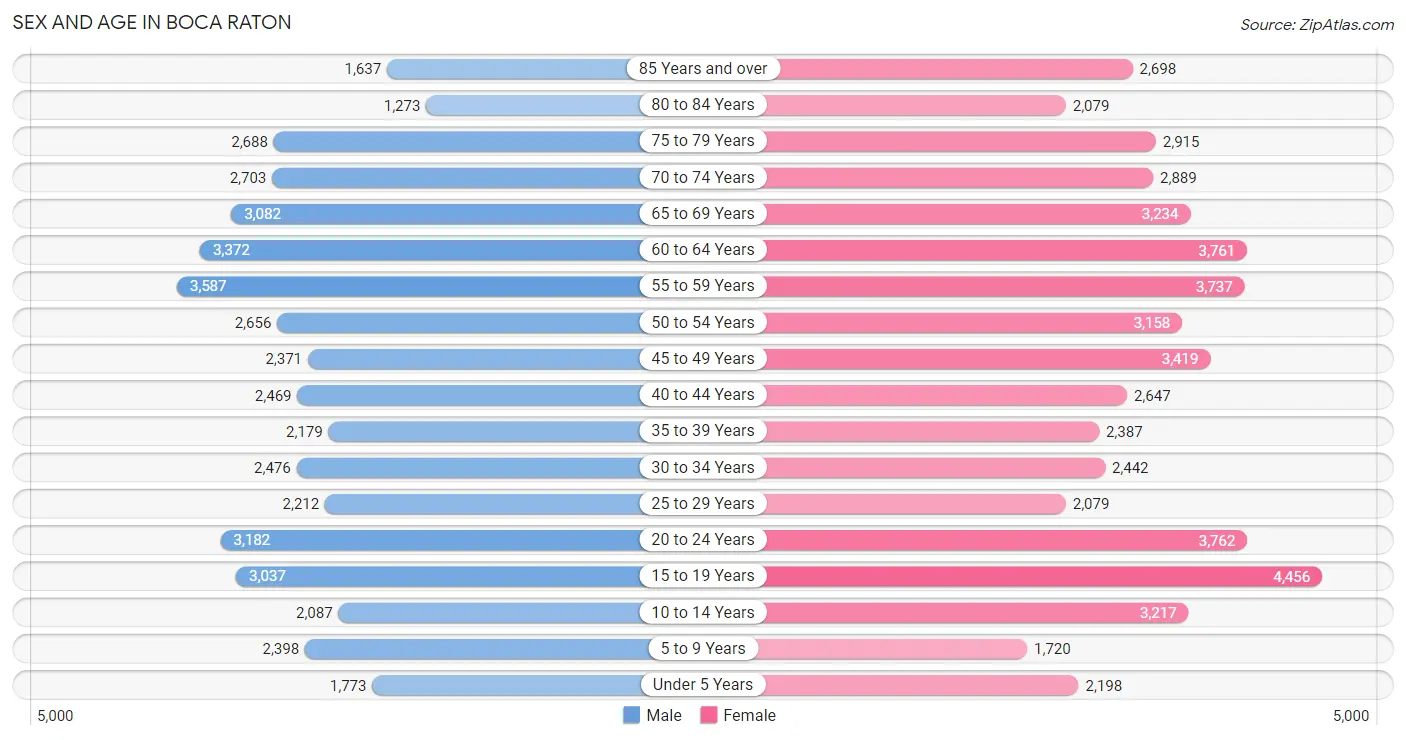
The most populous age groups in Boca Raton are 55 to 59 Years (3,587 | 7.9%) for men and 15 to 19 Years (4,456 | 8.4%) for women.
| Age Bracket | Male | Female |
| Under 5 Years | 1,773 (3.9%) | 2,198 (4.2%) |
| 5 to 9 Years | 2,398 (5.3%) | 1,720 (3.3%) |
| 10 to 14 Years | 2,087 (4.6%) | 3,217 (6.1%) |
| 15 to 19 Years | 3,037 (6.7%) | 4,456 (8.4%) |
| 20 to 24 Years | 3,182 (7.0%) | 3,762 (7.1%) |
| 25 to 29 Years | 2,212 (4.9%) | 2,079 (3.9%) |
| 30 to 34 Years | 2,476 (5.5%) | 2,442 (4.6%) |
| 35 to 39 Years | 2,179 (4.8%) | 2,387 (4.5%) |
| 40 to 44 Years | 2,469 (5.5%) | 2,647 (5.0%) |
| 45 to 49 Years | 2,371 (5.2%) | 3,419 (6.5%) |
| 50 to 54 Years | 2,656 (5.9%) | 3,158 (6.0%) |
| 55 to 59 Years | 3,587 (7.9%) | 3,737 (7.1%) |
| 60 to 64 Years | 3,372 (7.5%) | 3,761 (7.1%) |
| 65 to 69 Years | 3,082 (6.8%) | 3,234 (6.1%) |
| 70 to 74 Years | 2,703 (6.0%) | 2,889 (5.5%) |
| 75 to 79 Years | 2,688 (5.9%) | 2,915 (5.5%) |
| 80 to 84 Years | 1,273 (2.8%) | 2,079 (3.9%) |
| 85 Years and over | 1,637 (3.6%) | 2,698 (5.1%) |
| Total | 45,182 (100.0%) | 52,798 (100.0%) |
Families and Households in Boca Raton
Median Family Size in Boca Raton
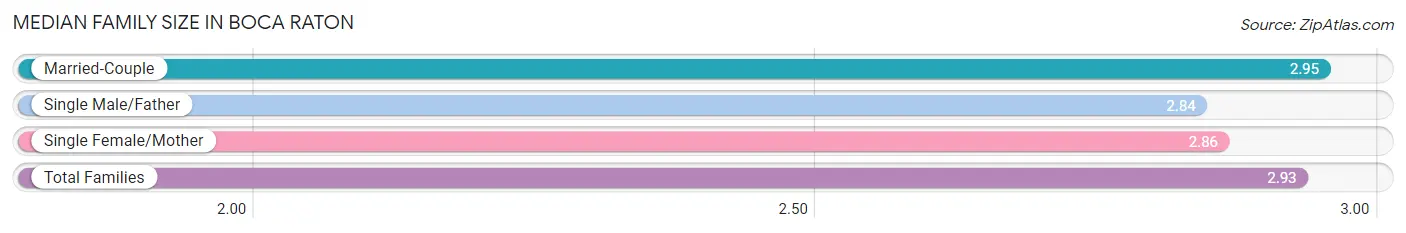
The median family size in Boca Raton is 2.93 persons per family, with married-couple families (18,711 | 80.1%) accounting for the largest median family size of 2.95 persons per family. On the other hand, single male/father families (1,313 | 5.6%) represent the smallest median family size with 2.84 persons per family.
| Family Type | # Families | Family Size |
| Married-Couple | 18,711 (80.1%) | 2.95 |
| Single Male/Father | 1,313 (5.6%) | 2.84 |
| Single Female/Mother | 3,346 (14.3%) | 2.86 |
| Total Families | 23,370 (100.0%) | 2.93 |
Median Household Size in Boca Raton
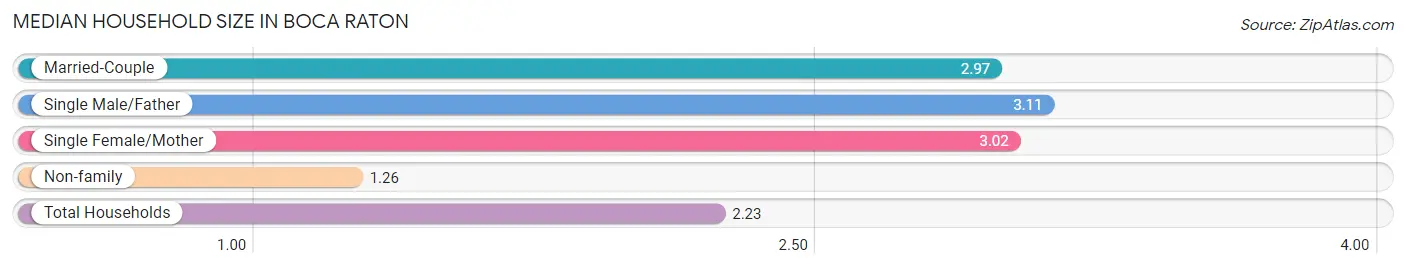
The median household size in Boca Raton is 2.23 persons per household, with single male/father households (1,313 | 3.2%) accounting for the largest median household size of 3.11 persons per household. non-family households (18,160 | 43.7%) represent the smallest median household size with 1.26 persons per household.
| Household Type | # Households | Household Size |
| Married-Couple | 18,711 (45.1%) | 2.97 |
| Single Male/Father | 1,313 (3.2%) | 3.11 |
| Single Female/Mother | 3,346 (8.1%) | 3.02 |
| Non-family | 18,160 (43.7%) | 1.26 |
| Total Households | 41,530 (100.0%) | 2.23 |
Household Size by Marriage Status in Boca Raton
Out of a total of 41,530 households in Boca Raton, 23,370 (56.3%) are family households, while 18,160 (43.7%) are nonfamily households. The most numerous type of family households are 2-person households, comprising 13,043, and the most common type of nonfamily households are 1-person households, comprising 14,831.
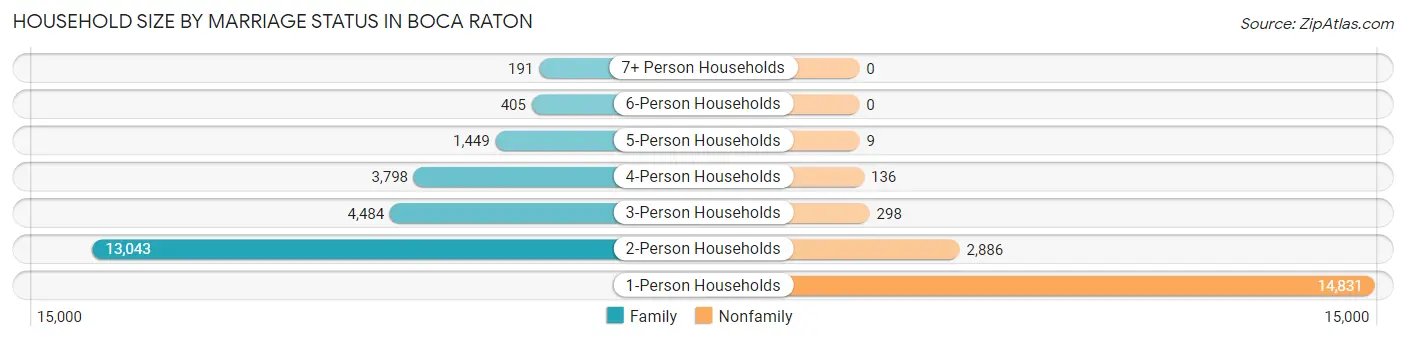
| Household Size | Family Households | Nonfamily Households |
| 1-Person Households | - | 14,831 (35.7%) |
| 2-Person Households | 13,043 (31.4%) | 2,886 (7.0%) |
| 3-Person Households | 4,484 (10.8%) | 298 (0.7%) |
| 4-Person Households | 3,798 (9.1%) | 136 (0.3%) |
| 5-Person Households | 1,449 (3.5%) | 9 (0.0%) |
| 6-Person Households | 405 (1.0%) | 0 (0.0%) |
| 7+ Person Households | 191 (0.5%) | 0 (0.0%) |
| Total | 23,370 (56.3%) | 18,160 (43.7%) |
Female Fertility in Boca Raton
Fertility by Age in Boca Raton
Average fertility rate in Boca Raton is 29.0 births per 1,000 women. Women in the age bracket of 20 to 34 years have the highest fertility rate with 51.0 births per 1,000 women. Women in the age bracket of 20 to 34 years acount for 66.3% of all women with births.
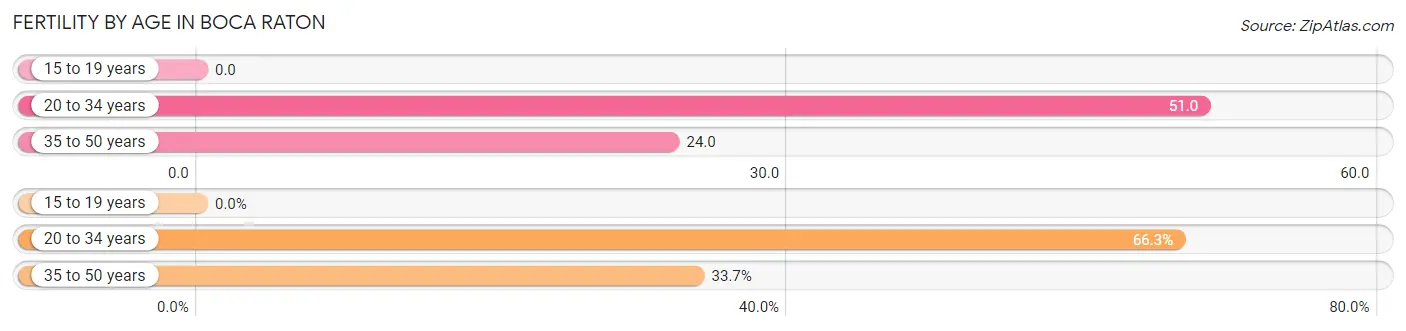
| Age Bracket | Women with Births | Births / 1,000 Women |
| 15 to 19 years | 0 (0.0%) | 0.0 |
| 20 to 34 years | 419 (66.3%) | 51.0 |
| 35 to 50 years | 213 (33.7%) | 24.0 |
| Total | 632 (100.0%) | 29.0 |
Fertility by Age by Marriage Status in Boca Raton
89.6% of women with births (632) in Boca Raton are married. The highest percentage of unmarried women with births falls into 20 to 34 years age bracket with 15.8% of them unmarried at the time of birth, while the lowest percentage of unmarried women with births belong to 35 to 50 years age bracket with 0.0% of them unmarried.
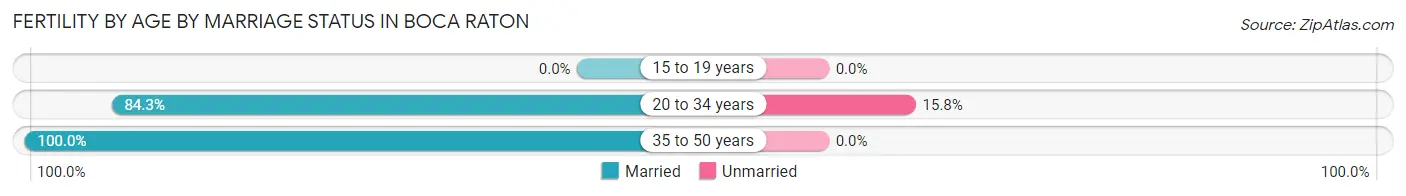
| Age Bracket | Married | Unmarried |
| 15 to 19 years | 0 (0.0%) | 0 (0.0%) |
| 20 to 34 years | 353 (84.3%) | 66 (15.8%) |
| 35 to 50 years | 213 (100.0%) | 0 (0.0%) |
| Total | 566 (89.6%) | 66 (10.4%) |
Fertility by Education in Boca Raton
Average fertility rate in Boca Raton is 29.0 births per 1,000 women. Women with the education attainment of graduate degree have the highest fertility rate of 55.0 births per 1,000 women, while women with the education attainment of college or associate's degree have the lowest fertility at 11.0 births per 1,000 women. Women with the education attainment of bachelor's degree represent 35.1% of all women with births.
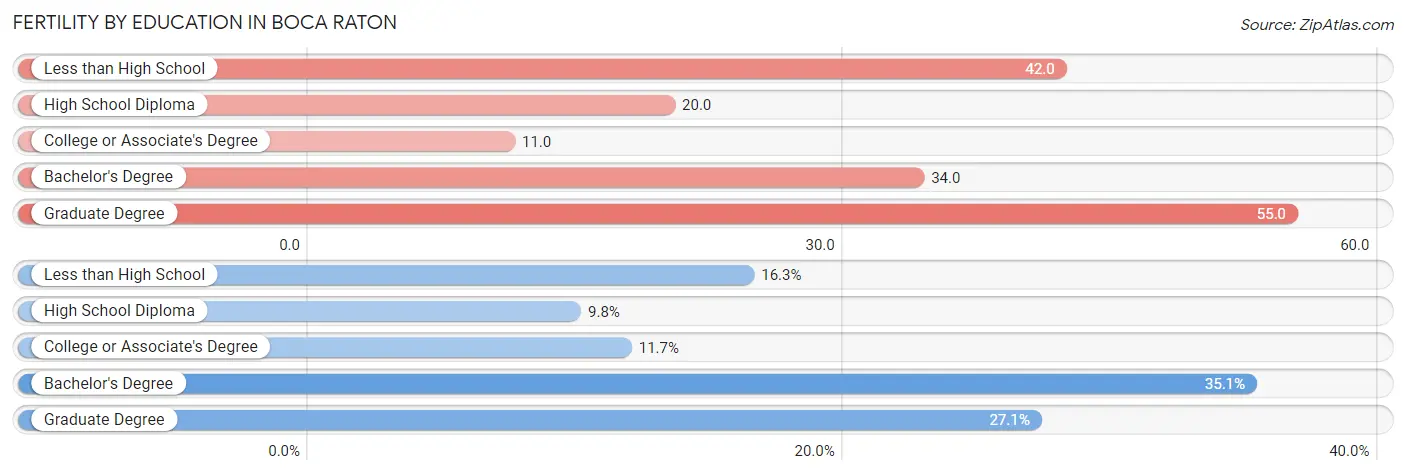
| Educational Attainment | Women with Births | Births / 1,000 Women |
| Less than High School | 103 (16.3%) | 42.0 |
| High School Diploma | 62 (9.8%) | 20.0 |
| College or Associate's Degree | 74 (11.7%) | 11.0 |
| Bachelor's Degree | 222 (35.1%) | 34.0 |
| Graduate Degree | 171 (27.1%) | 55.0 |
| Total | 632 (100.0%) | 29.0 |
Fertility by Education by Marriage Status in Boca Raton
10.4% of women with births in Boca Raton are unmarried. Women with the educational attainment of college or associate's degree are most likely to be married with 100.0% of them married at childbirth, while women with the educational attainment of high school diploma are least likely to be married with 37.1% of them unmarried at childbirth.
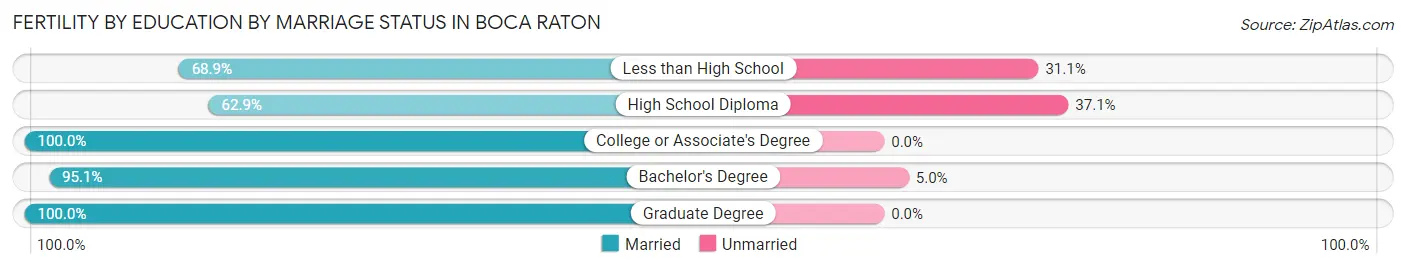
| Educational Attainment | Married | Unmarried |
| Less than High School | 71 (68.9%) | 32 (31.1%) |
| High School Diploma | 39 (62.9%) | 23 (37.1%) |
| College or Associate's Degree | 74 (100.0%) | 0 (0.0%) |
| Bachelor's Degree | 211 (95.1%) | 11 (5.0%) |
| Graduate Degree | 171 (100.0%) | 0 (0.0%) |
| Total | 566 (89.6%) | 66 (10.4%) |
Employment Characteristics in Boca Raton
Employment by Class of Employer in Boca Raton
Among the 44,108 employed individuals in Boca Raton, private company employees (29,461 | 66.8%), self-employed (incorporated) (5,350 | 12.1%), and not-for-profit organizations (3,012 | 6.8%) make up the most common classes of employment.
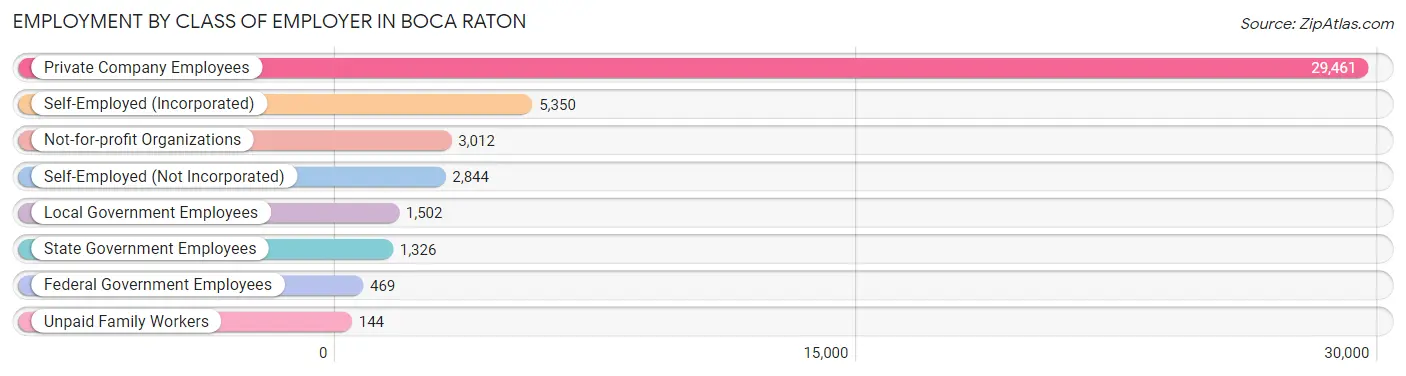
| Employer Class | # Employees | % Employees |
| Private Company Employees | 29,461 | 66.8% |
| Self-Employed (Incorporated) | 5,350 | 12.1% |
| Self-Employed (Not Incorporated) | 2,844 | 6.5% |
| Not-for-profit Organizations | 3,012 | 6.8% |
| Local Government Employees | 1,502 | 3.4% |
| State Government Employees | 1,326 | 3.0% |
| Federal Government Employees | 469 | 1.1% |
| Unpaid Family Workers | 144 | 0.3% |
| Total | 44,108 | 100.0% |
Employment Status by Age in Boca Raton
According to the labor force statistics for Boca Raton, out of the total population over 16 years of age (83,416), 57.5% or 47,964 individuals are in the labor force, with 5.9% or 2,830 of them unemployed. The age group with the highest labor force participation rate is 25 to 29 years, with 86.6% or 3,716 individuals in the labor force. Within the labor force, the 16 to 19 years age range has the highest percentage of unemployed individuals, with 19.1% or 435 of them being unemployed.
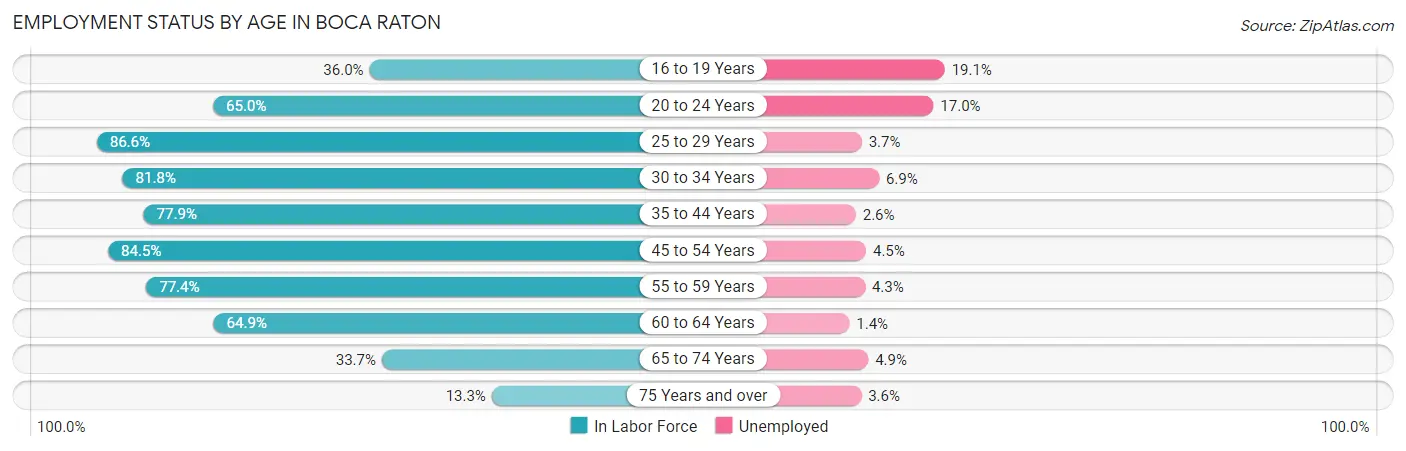
| Age Bracket | In Labor Force | Unemployed |
| 16 to 19 Years | 2,276 (36.0%) | 435 (19.1%) |
| 20 to 24 Years | 4,514 (65.0%) | 767 (17.0%) |
| 25 to 29 Years | 3,716 (86.6%) | 137 (3.7%) |
| 30 to 34 Years | 4,023 (81.8%) | 278 (6.9%) |
| 35 to 44 Years | 7,542 (77.9%) | 196 (2.6%) |
| 45 to 54 Years | 9,805 (84.5%) | 441 (4.5%) |
| 55 to 59 Years | 5,669 (77.4%) | 244 (4.3%) |
| 60 to 64 Years | 4,629 (64.9%) | 65 (1.4%) |
| 65 to 74 Years | 4,013 (33.7%) | 197 (4.9%) |
| 75 Years and over | 1,768 (13.3%) | 64 (3.6%) |
| Total | 47,964 (57.5%) | 2,830 (5.9%) |
Employment Status by Educational Attainment in Boca Raton
According to labor force statistics for Boca Raton, 78.7% of individuals (35,377) out of the total population between 25 and 64 years of age (44,952) are in the labor force, with 3.9% or 1,380 of them being unemployed. The group with the highest labor force participation rate are those with the educational attainment of college / associate degree, with 84.1% or 8,589 individuals in the labor force. Within the labor force, individuals with college / associate degree education have the highest percentage of unemployment, with 4.6% or 395 of them being unemployed.
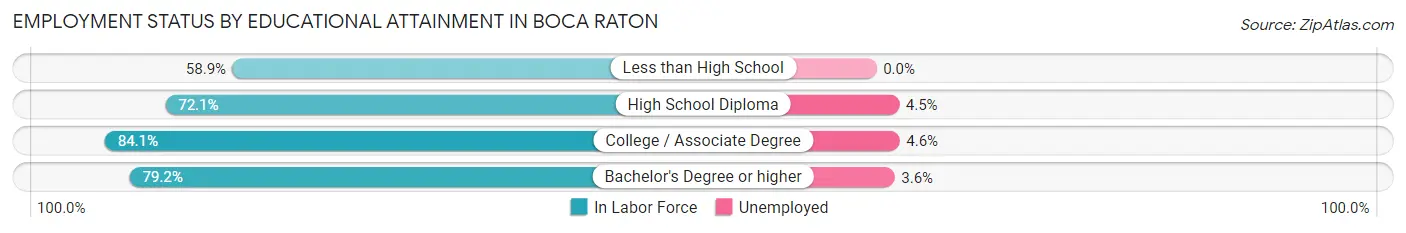
| Educational Attainment | In Labor Force | Unemployed |
| Less than High School | 1,009 (58.9%) | 0 (0.0%) |
| High School Diploma | 3,829 (72.1%) | 239 (4.5%) |
| College / Associate Degree | 8,589 (84.1%) | 470 (4.6%) |
| Bachelor's Degree or higher | 21,951 (79.2%) | 998 (3.6%) |
| Total | 35,377 (78.7%) | 1,753 (3.9%) |
Employment Occupations by Sex in Boca Raton
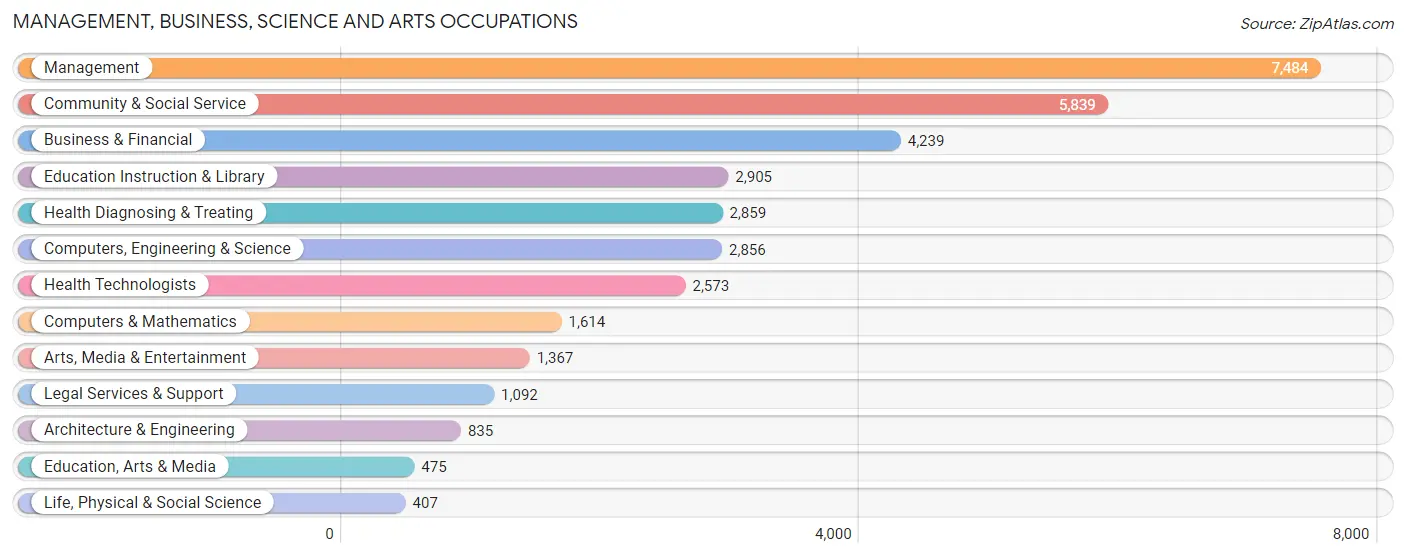
Management, Business, Science and Arts Occupations
The most common Management, Business, Science and Arts occupations in Boca Raton are Management (7,484 | 16.6%), Community & Social Service (5,839 | 13.0%), Business & Financial (4,239 | 9.4%), Education Instruction & Library (2,905 | 6.5%), and Health Diagnosing & Treating (2,859 | 6.3%).
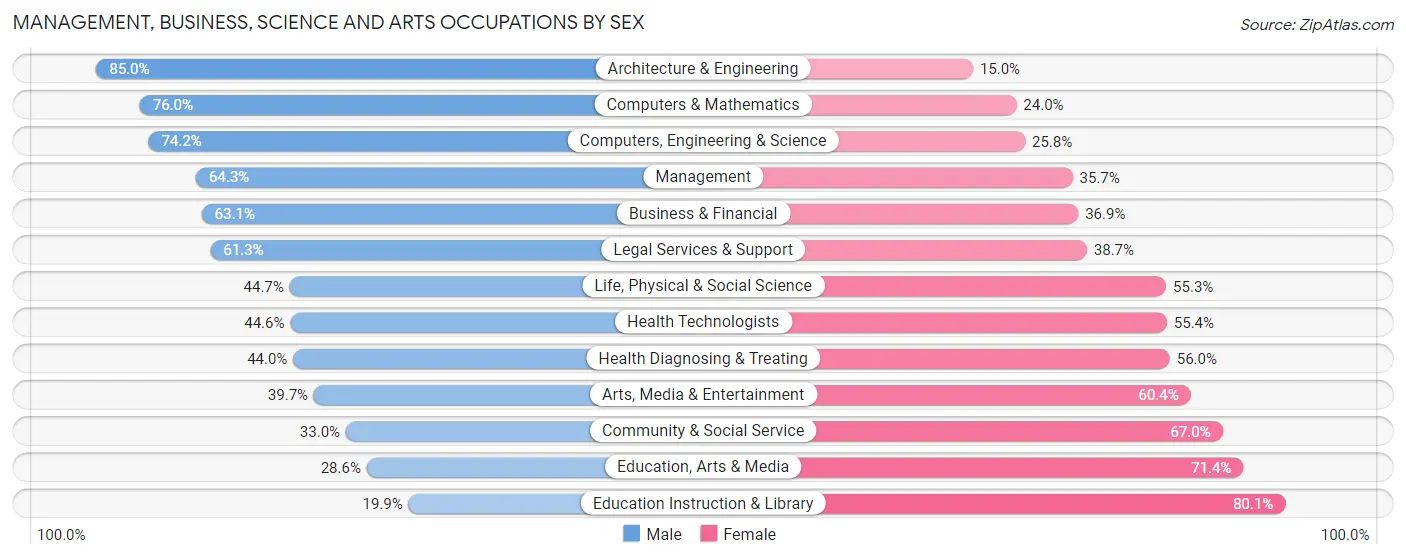
Management, Business, Science and Arts Occupations by Sex
Within the Management, Business, Science and Arts occupations in Boca Raton, the most male-oriented occupations are Architecture & Engineering (85.0%), Computers & Mathematics (76.0%), and Computers, Engineering & Science (74.2%), while the most female-oriented occupations are Education Instruction & Library (80.1%), Education, Arts & Media (71.4%), and Community & Social Service (67.0%).
| Occupation | Male | Female |
| Management | 4,809 (64.3%) | 2,675 (35.7%) |
| Business & Financial | 2,673 (63.1%) | 1,566 (36.9%) |
| Computers, Engineering & Science | 2,118 (74.2%) | 738 (25.8%) |
| Computers & Mathematics | 1,226 (76.0%) | 388 (24.0%) |
| Architecture & Engineering | 710 (85.0%) | 125 (15.0%) |
| Life, Physical & Social Science | 182 (44.7%) | 225 (55.3%) |
| Community & Social Service | 1,925 (33.0%) | 3,914 (67.0%) |
| Education, Arts & Media | 136 (28.6%) | 339 (71.4%) |
| Legal Services & Support | 669 (61.3%) | 423 (38.7%) |
| Education Instruction & Library | 578 (19.9%) | 2,327 (80.1%) |
| Arts, Media & Entertainment | 542 (39.7%) | 825 (60.4%) |
| Health Diagnosing & Treating | 1,257 (44.0%) | 1,602 (56.0%) |
| Health Technologists | 1,147 (44.6%) | 1,426 (55.4%) |
| Total (Category) | 12,782 (54.9%) | 10,495 (45.1%) |
| Total (Overall) | 23,050 (51.1%) | 22,019 (48.9%) |
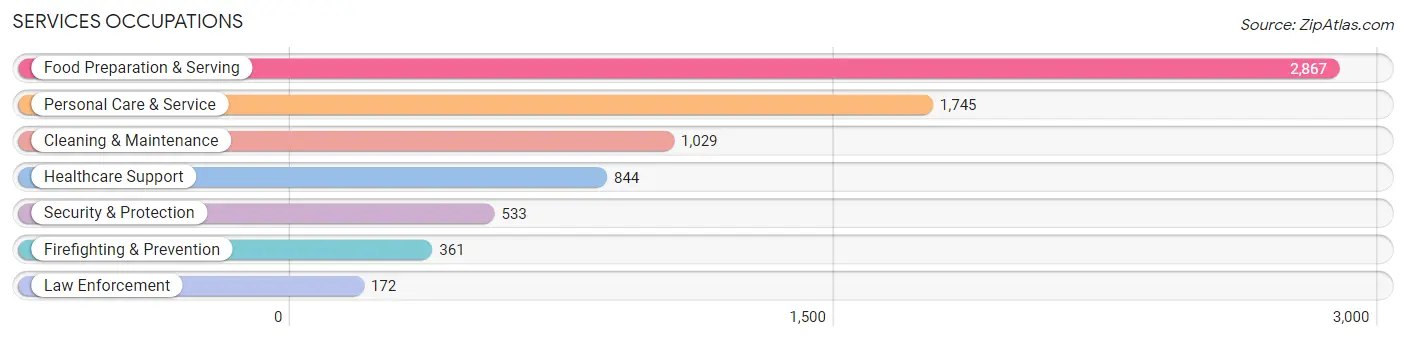
Services Occupations
The most common Services occupations in Boca Raton are Food Preparation & Serving (2,867 | 6.4%), Personal Care & Service (1,745 | 3.9%), Cleaning & Maintenance (1,029 | 2.3%), Healthcare Support (844 | 1.9%), and Security & Protection (533 | 1.2%).
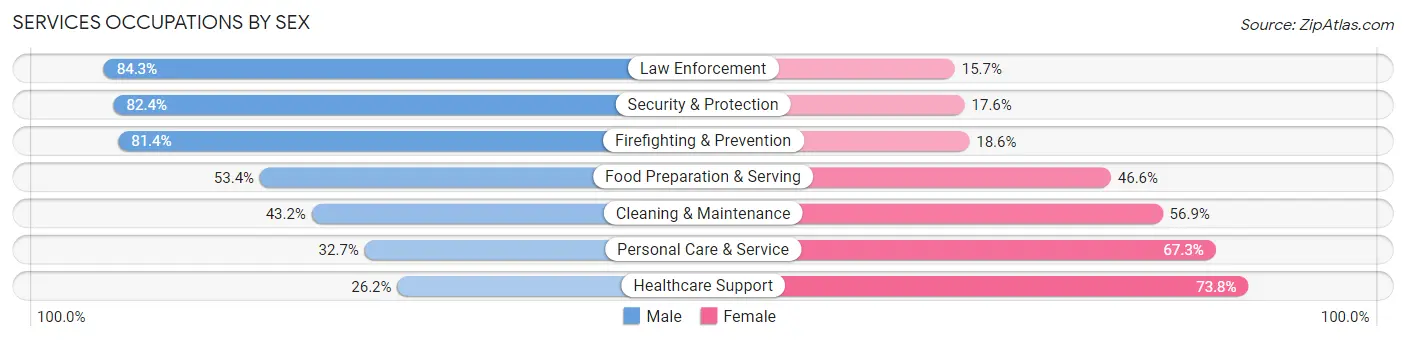
Services Occupations by Sex
Within the Services occupations in Boca Raton, the most male-oriented occupations are Law Enforcement (84.3%), Security & Protection (82.4%), and Firefighting & Prevention (81.4%), while the most female-oriented occupations are Healthcare Support (73.8%), Personal Care & Service (67.3%), and Cleaning & Maintenance (56.9%).
| Occupation | Male | Female |
| Healthcare Support | 221 (26.2%) | 623 (73.8%) |
| Security & Protection | 439 (82.4%) | 94 (17.6%) |
| Firefighting & Prevention | 294 (81.4%) | 67 (18.6%) |
| Law Enforcement | 145 (84.3%) | 27 (15.7%) |
| Food Preparation & Serving | 1,531 (53.4%) | 1,336 (46.6%) |
| Cleaning & Maintenance | 444 (43.1%) | 585 (56.9%) |
| Personal Care & Service | 570 (32.7%) | 1,175 (67.3%) |
| Total (Category) | 3,205 (45.7%) | 3,813 (54.3%) |
| Total (Overall) | 23,050 (51.1%) | 22,019 (48.9%) |
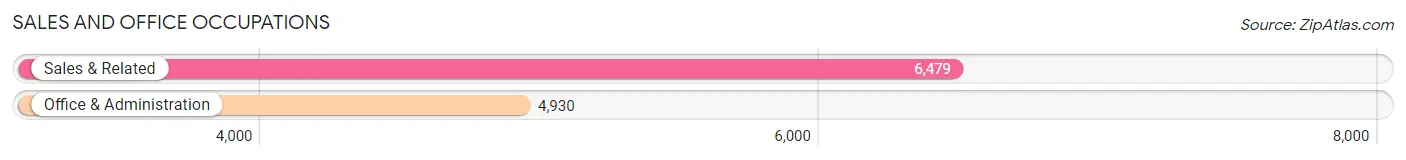
Sales and Office Occupations
The most common Sales and Office occupations in Boca Raton are Sales & Related (6,479 | 14.4%), and Office & Administration (4,930 | 10.9%).
Sales and Office Occupations by Sex
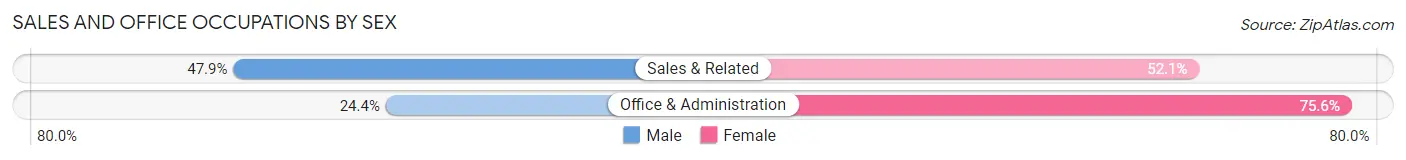
| Occupation | Male | Female |
| Sales & Related | 3,103 (47.9%) | 3,376 (52.1%) |
| Office & Administration | 1,205 (24.4%) | 3,725 (75.6%) |
| Total (Category) | 4,308 (37.8%) | 7,101 (62.2%) |
| Total (Overall) | 23,050 (51.1%) | 22,019 (48.9%) |
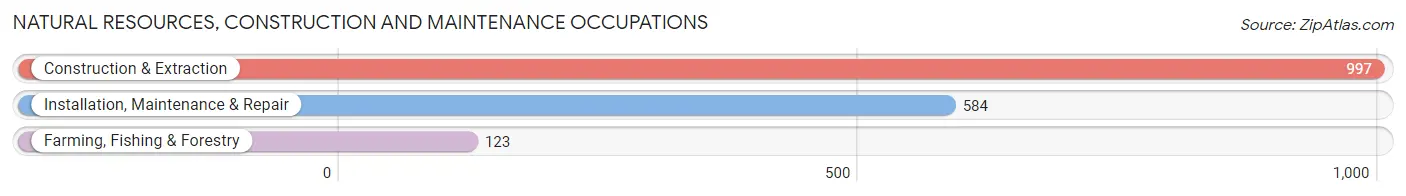
Natural Resources, Construction and Maintenance Occupations
The most common Natural Resources, Construction and Maintenance occupations in Boca Raton are Construction & Extraction (997 | 2.2%), Installation, Maintenance & Repair (584 | 1.3%), and Farming, Fishing & Forestry (123 | 0.3%).
Natural Resources, Construction and Maintenance Occupations by Sex
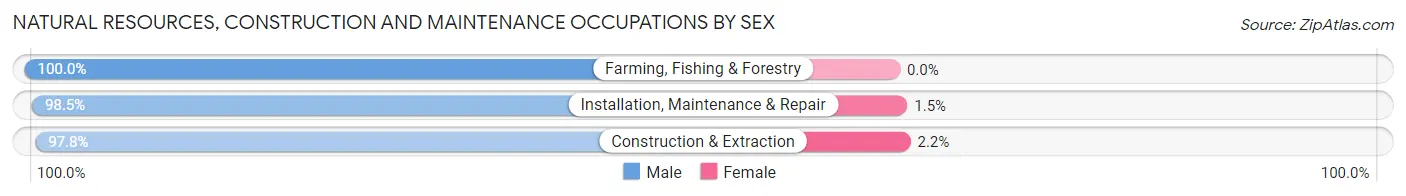
| Occupation | Male | Female |
| Farming, Fishing & Forestry | 123 (100.0%) | 0 (0.0%) |
| Construction & Extraction | 975 (97.8%) | 22 (2.2%) |
| Installation, Maintenance & Repair | 575 (98.5%) | 9 (1.5%) |
| Total (Category) | 1,673 (98.2%) | 31 (1.8%) |
| Total (Overall) | 23,050 (51.1%) | 22,019 (48.9%) |
Production, Transportation and Moving Occupations
The most common Production, Transportation and Moving occupations in Boca Raton are Transportation (568 | 1.3%), Production (563 | 1.3%), and Material Moving (530 | 1.2%).
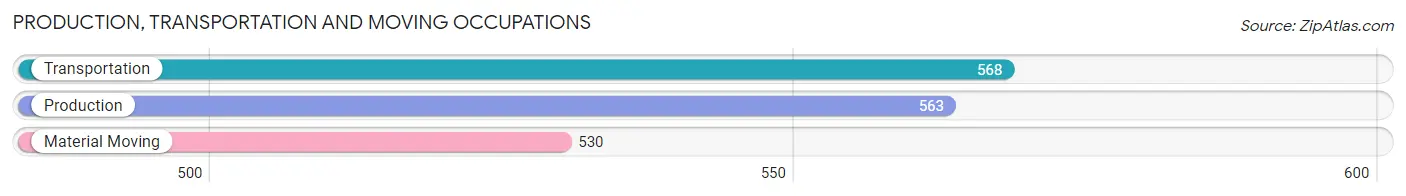
Production, Transportation and Moving Occupations by Sex
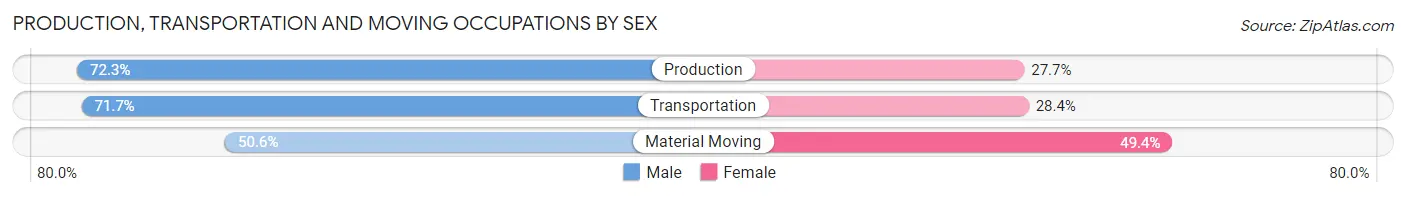
| Occupation | Male | Female |
| Production | 407 (72.3%) | 156 (27.7%) |
| Transportation | 407 (71.7%) | 161 (28.3%) |
| Material Moving | 268 (50.6%) | 262 (49.4%) |
| Total (Category) | 1,082 (65.1%) | 579 (34.9%) |
| Total (Overall) | 23,050 (51.1%) | 22,019 (48.9%) |
Employment Industries by Sex in Boca Raton
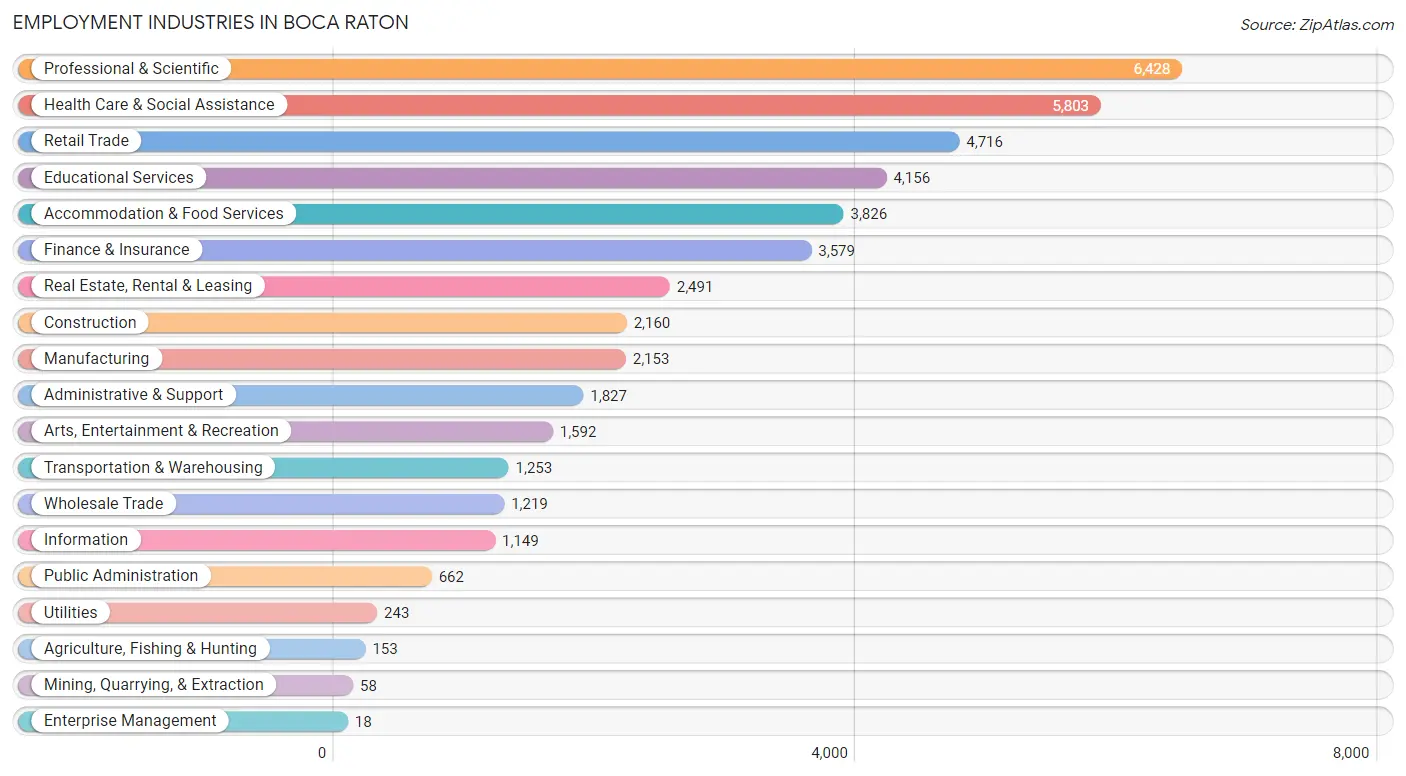
Employment Industries in Boca Raton
The major employment industries in Boca Raton include Professional & Scientific (6,428 | 14.3%), Health Care & Social Assistance (5,803 | 12.9%), Retail Trade (4,716 | 10.5%), Educational Services (4,156 | 9.2%), and Accommodation & Food Services (3,826 | 8.5%).
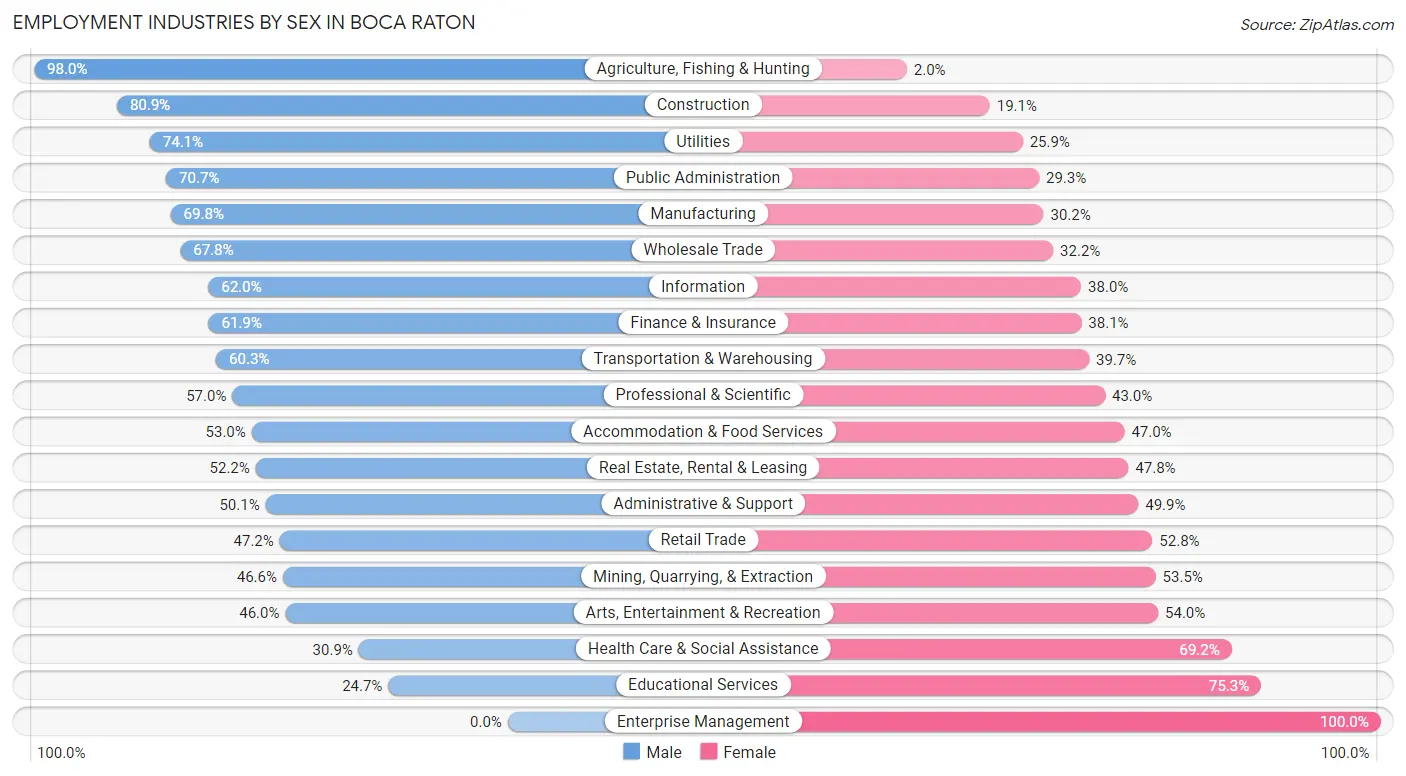
Employment Industries by Sex in Boca Raton
The Boca Raton industries that see more men than women are Agriculture, Fishing & Hunting (98.0%), Construction (80.9%), and Utilities (74.1%), whereas the industries that tend to have a higher number of women are Enterprise Management (100.0%), Educational Services (75.3%), and Health Care & Social Assistance (69.2%).
| Industry | Male | Female |
| Agriculture, Fishing & Hunting | 150 (98.0%) | 3 (2.0%) |
| Mining, Quarrying, & Extraction | 27 (46.6%) | 31 (53.4%) |
| Construction | 1,747 (80.9%) | 413 (19.1%) |
| Manufacturing | 1,502 (69.8%) | 651 (30.2%) |
| Wholesale Trade | 826 (67.8%) | 393 (32.2%) |
| Retail Trade | 2,227 (47.2%) | 2,489 (52.8%) |
| Transportation & Warehousing | 756 (60.3%) | 497 (39.7%) |
| Utilities | 180 (74.1%) | 63 (25.9%) |
| Information | 712 (62.0%) | 437 (38.0%) |
| Finance & Insurance | 2,216 (61.9%) | 1,363 (38.1%) |
| Real Estate, Rental & Leasing | 1,300 (52.2%) | 1,191 (47.8%) |
| Professional & Scientific | 3,665 (57.0%) | 2,763 (43.0%) |
| Enterprise Management | 0 (0.0%) | 18 (100.0%) |
| Administrative & Support | 916 (50.1%) | 911 (49.9%) |
| Educational Services | 1,028 (24.7%) | 3,128 (75.3%) |
| Health Care & Social Assistance | 1,790 (30.8%) | 4,013 (69.2%) |
| Arts, Entertainment & Recreation | 733 (46.0%) | 859 (54.0%) |
| Accommodation & Food Services | 2,028 (53.0%) | 1,798 (47.0%) |
| Public Administration | 468 (70.7%) | 194 (29.3%) |
| Total | 23,050 (51.1%) | 22,019 (48.9%) |
Education in Boca Raton
School Enrollment in Boca Raton
The most common levels of schooling among the 24,639 students in Boca Raton are college / undergraduate (8,828 | 35.8%), middle school (4,392 | 17.8%), and high school (4,217 | 17.1%).
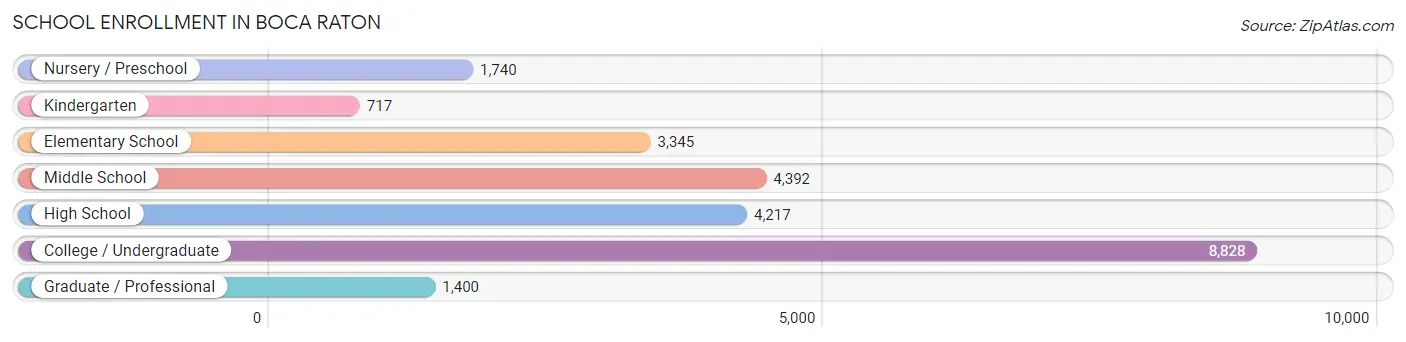
| School Level | # Students | % Students |
| Nursery / Preschool | 1,740 | 7.1% |
| Kindergarten | 717 | 2.9% |
| Elementary School | 3,345 | 13.6% |
| Middle School | 4,392 | 17.8% |
| High School | 4,217 | 17.1% |
| College / Undergraduate | 8,828 | 35.8% |
| Graduate / Professional | 1,400 | 5.7% |
| Total | 24,639 | 100.0% |
School Enrollment by Age by Funding Source in Boca Raton
Out of a total of 24,639 students who are enrolled in schools in Boca Raton, 6,431 (26.1%) attend a private institution, while the remaining 18,208 (73.9%) are enrolled in public schools. The age group of 3 to 4 year olds has the highest likelihood of being enrolled in private schools, with 950 (69.6% in the age bracket) enrolled. Conversely, the age group of 18 to 19 year olds has the lowest likelihood of being enrolled in a private school, with 3,411 (88.5% in the age bracket) attending a public institution.
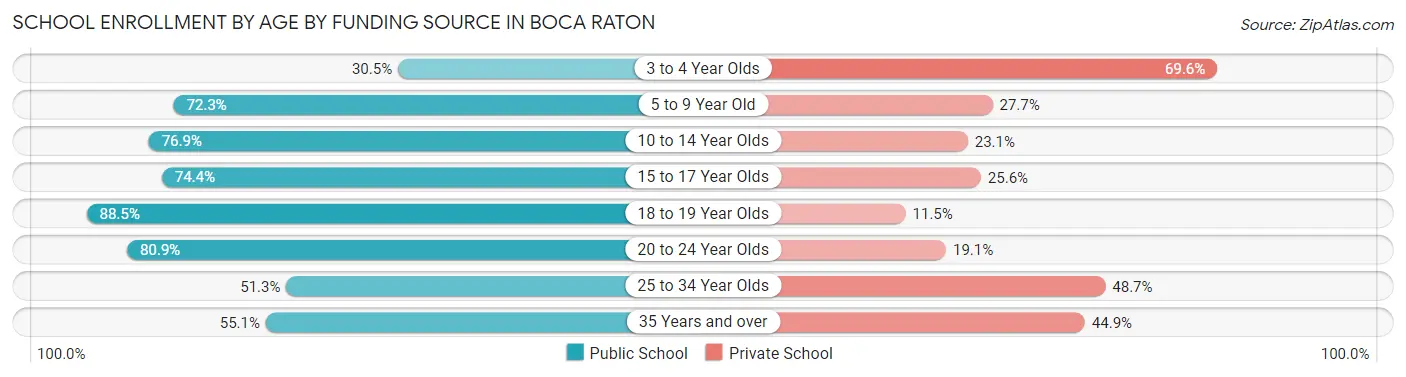
| Age Bracket | Public School | Private School |
| 3 to 4 Year Olds | 416 (30.4%) | 950 (69.6%) |
| 5 to 9 Year Old | 2,921 (72.3%) | 1,121 (27.7%) |
| 10 to 14 Year Olds | 4,028 (76.9%) | 1,211 (23.1%) |
| 15 to 17 Year Olds | 2,359 (74.4%) | 810 (25.6%) |
| 18 to 19 Year Olds | 3,411 (88.5%) | 445 (11.5%) |
| 20 to 24 Year Olds | 3,990 (80.9%) | 940 (19.1%) |
| 25 to 34 Year Olds | 549 (51.3%) | 522 (48.7%) |
| 35 Years and over | 532 (55.1%) | 434 (44.9%) |
| Total | 18,208 (73.9%) | 6,431 (26.1%) |
Educational Attainment by Field of Study in Boca Raton
Business (11,953 | 27.0%), education (4,711 | 10.6%), social sciences (4,495 | 10.2%), science & technology (3,199 | 7.2%), and engineering (3,109 | 7.0%) are the most common fields of study among 44,227 individuals in Boca Raton who have obtained a bachelor's degree or higher.
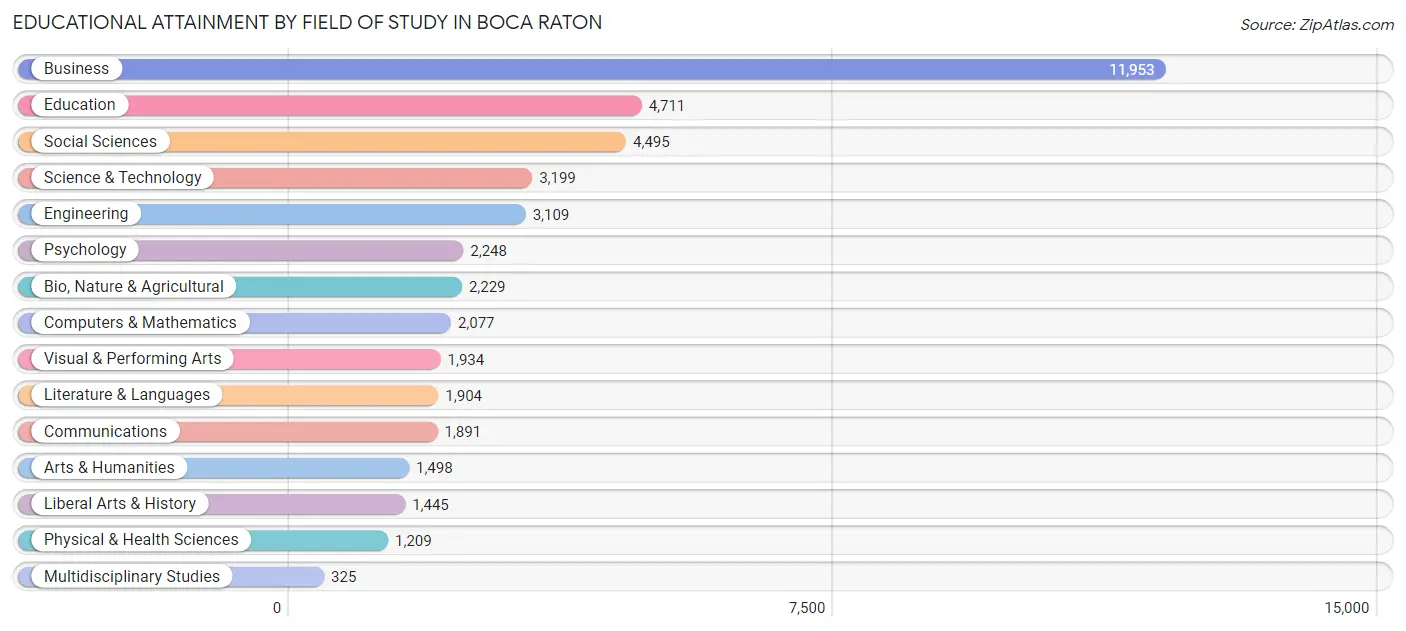
| Field of Study | # Graduates | % Graduates |
| Computers & Mathematics | 2,077 | 4.7% |
| Bio, Nature & Agricultural | 2,229 | 5.0% |
| Physical & Health Sciences | 1,209 | 2.7% |
| Psychology | 2,248 | 5.1% |
| Social Sciences | 4,495 | 10.2% |
| Engineering | 3,109 | 7.0% |
| Multidisciplinary Studies | 325 | 0.7% |
| Science & Technology | 3,199 | 7.2% |
| Business | 11,953 | 27.0% |
| Education | 4,711 | 10.6% |
| Literature & Languages | 1,904 | 4.3% |
| Liberal Arts & History | 1,445 | 3.3% |
| Visual & Performing Arts | 1,934 | 4.4% |
| Communications | 1,891 | 4.3% |
| Arts & Humanities | 1,498 | 3.4% |
| Total | 44,227 | 100.0% |
Transportation & Commute in Boca Raton
Vehicle Availability by Sex in Boca Raton
The most prevalent vehicle ownership categories in Boca Raton are males with 2 vehicles (11,784, accounting for 53.5%) and females with 2 vehicles (9,464, making up 57.5%).
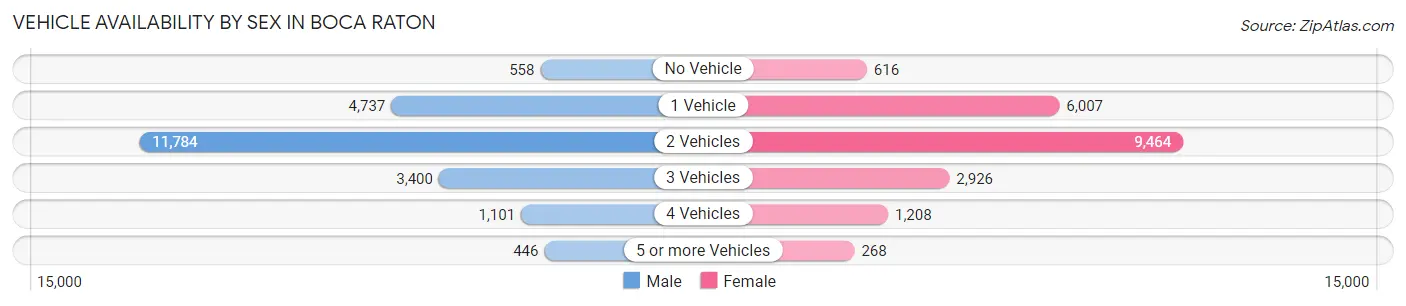
| Vehicles Available | Male | Female |
| No Vehicle | 558 (2.5%) | 616 (3.0%) |
| 1 Vehicle | 4,737 (21.5%) | 6,007 (29.3%) |
| 2 Vehicles | 11,784 (53.5%) | 9,464 (46.2%) |
| 3 Vehicles | 3,400 (15.4%) | 2,926 (14.3%) |
| 4 Vehicles | 1,101 (5.0%) | 1,208 (5.9%) |
| 5 or more Vehicles | 446 (2.0%) | 268 (1.3%) |
| Total | 22,026 (100.0%) | 20,489 (100.0%) |
Commute Time in Boca Raton
The most frequently occuring commute durations in Boca Raton are 15 to 19 minutes (8,029 commuters, 22.2%), 10 to 14 minutes (6,423 commuters, 17.8%), and 20 to 24 minutes (5,574 commuters, 15.4%).
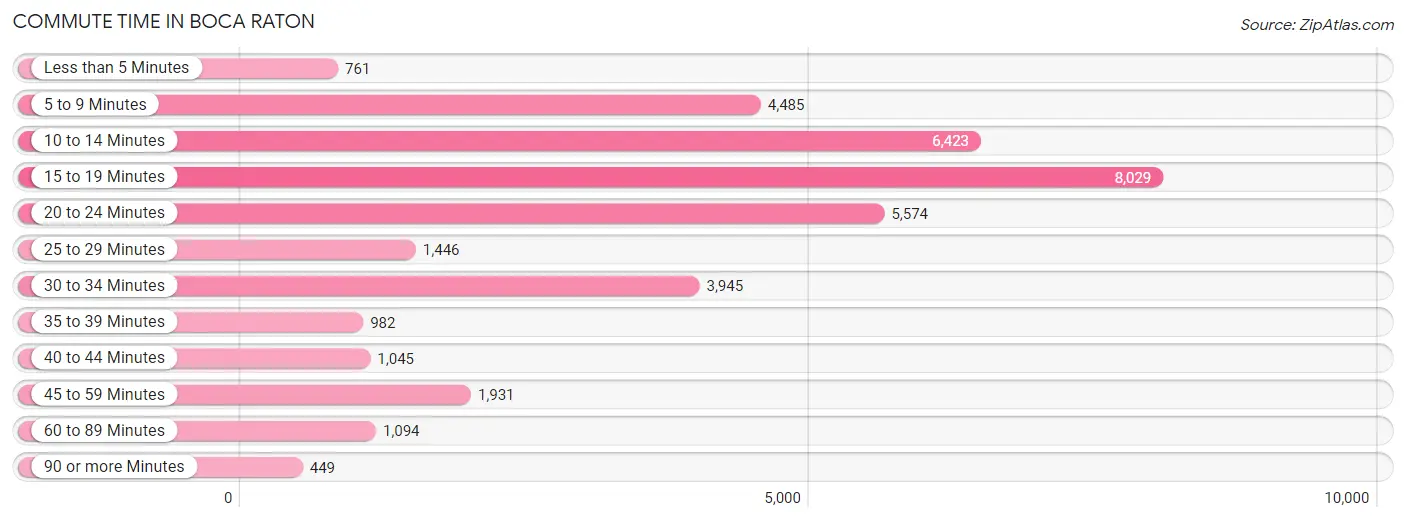
| Commute Time | # Commuters | % Commuters |
| Less than 5 Minutes | 761 | 2.1% |
| 5 to 9 Minutes | 4,485 | 12.4% |
| 10 to 14 Minutes | 6,423 | 17.8% |
| 15 to 19 Minutes | 8,029 | 22.2% |
| 20 to 24 Minutes | 5,574 | 15.4% |
| 25 to 29 Minutes | 1,446 | 4.0% |
| 30 to 34 Minutes | 3,945 | 10.9% |
| 35 to 39 Minutes | 982 | 2.7% |
| 40 to 44 Minutes | 1,045 | 2.9% |
| 45 to 59 Minutes | 1,931 | 5.3% |
| 60 to 89 Minutes | 1,094 | 3.0% |
| 90 or more Minutes | 449 | 1.2% |
Commute Time by Sex in Boca Raton
The most common commute times in Boca Raton are 15 to 19 minutes (4,494 commuters, 24.1%) for males and 10 to 14 minutes (3,683 commuters, 21.1%) for females.
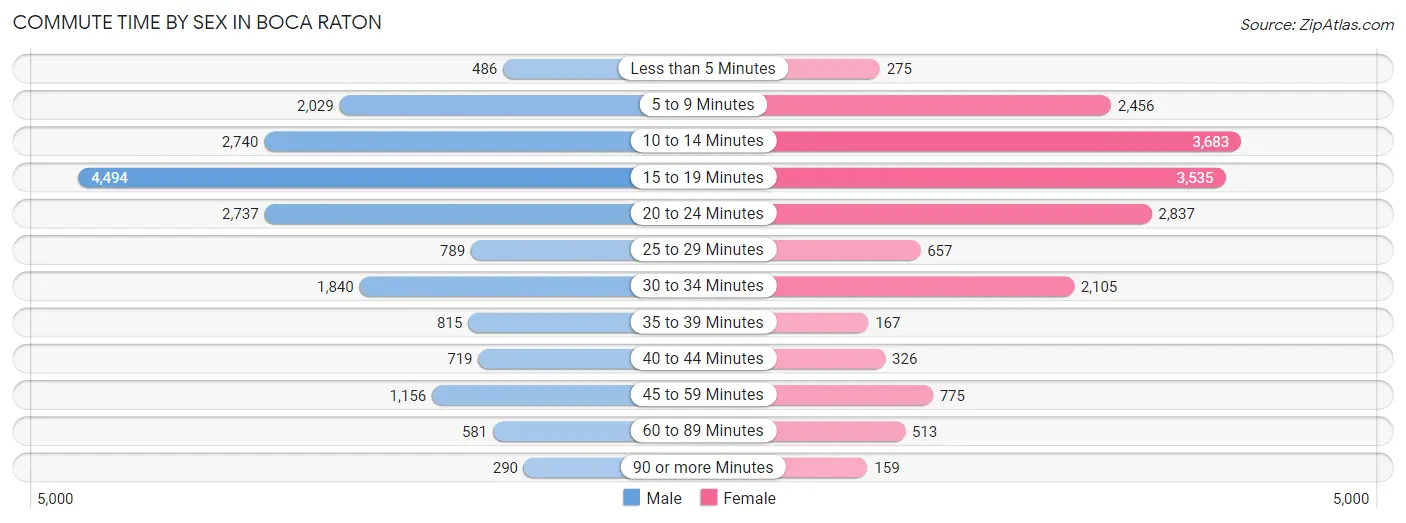
| Commute Time | Male | Female |
| Less than 5 Minutes | 486 (2.6%) | 275 (1.6%) |
| 5 to 9 Minutes | 2,029 (10.9%) | 2,456 (14.0%) |
| 10 to 14 Minutes | 2,740 (14.7%) | 3,683 (21.1%) |
| 15 to 19 Minutes | 4,494 (24.1%) | 3,535 (20.2%) |
| 20 to 24 Minutes | 2,737 (14.7%) | 2,837 (16.2%) |
| 25 to 29 Minutes | 789 (4.2%) | 657 (3.8%) |
| 30 to 34 Minutes | 1,840 (9.9%) | 2,105 (12.0%) |
| 35 to 39 Minutes | 815 (4.4%) | 167 (0.9%) |
| 40 to 44 Minutes | 719 (3.8%) | 326 (1.9%) |
| 45 to 59 Minutes | 1,156 (6.2%) | 775 (4.4%) |
| 60 to 89 Minutes | 581 (3.1%) | 513 (2.9%) |
| 90 or more Minutes | 290 (1.5%) | 159 (0.9%) |
Time of Departure to Work by Sex in Boca Raton
The most frequent times of departure to work in Boca Raton are 8:00 AM to 8:29 AM (3,652, 19.6%) for males and 8:00 AM to 8:29 AM (3,020, 17.3%) for females.
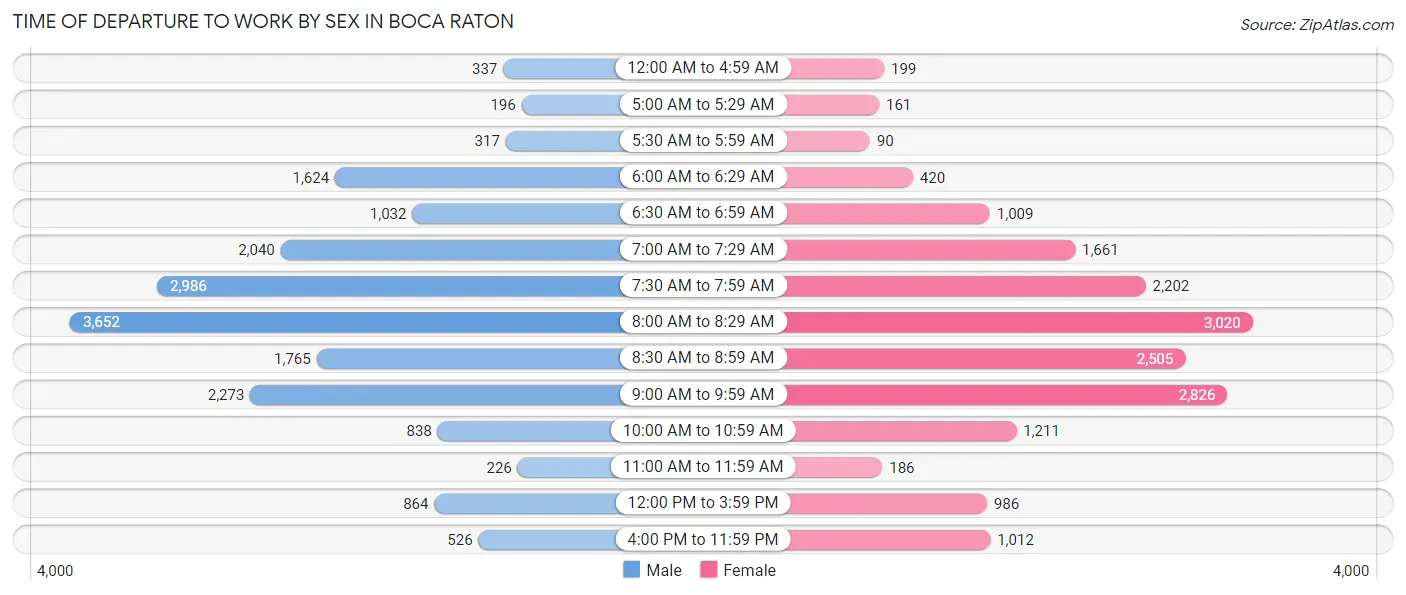
| Time of Departure | Male | Female |
| 12:00 AM to 4:59 AM | 337 (1.8%) | 199 (1.1%) |
| 5:00 AM to 5:29 AM | 196 (1.1%) | 161 (0.9%) |
| 5:30 AM to 5:59 AM | 317 (1.7%) | 90 (0.5%) |
| 6:00 AM to 6:29 AM | 1,624 (8.7%) | 420 (2.4%) |
| 6:30 AM to 6:59 AM | 1,032 (5.5%) | 1,009 (5.8%) |
| 7:00 AM to 7:29 AM | 2,040 (10.9%) | 1,661 (9.5%) |
| 7:30 AM to 7:59 AM | 2,986 (16.0%) | 2,202 (12.6%) |
| 8:00 AM to 8:29 AM | 3,652 (19.6%) | 3,020 (17.3%) |
| 8:30 AM to 8:59 AM | 1,765 (9.5%) | 2,505 (14.3%) |
| 9:00 AM to 9:59 AM | 2,273 (12.2%) | 2,826 (16.2%) |
| 10:00 AM to 10:59 AM | 838 (4.5%) | 1,211 (6.9%) |
| 11:00 AM to 11:59 AM | 226 (1.2%) | 186 (1.1%) |
| 12:00 PM to 3:59 PM | 864 (4.6%) | 986 (5.6%) |
| 4:00 PM to 11:59 PM | 526 (2.8%) | 1,012 (5.8%) |
| Total | 18,676 (100.0%) | 17,488 (100.0%) |
Housing Occupancy in Boca Raton
Occupancy by Ownership in Boca Raton
Of the total 41,530 dwellings in Boca Raton, owner-occupied units account for 27,267 (65.7%), while renter-occupied units make up 14,263 (34.3%).
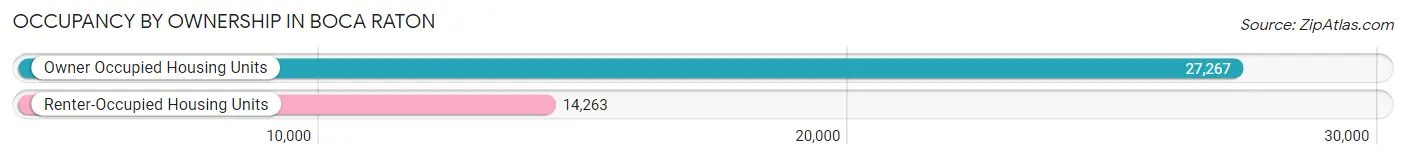
| Occupancy | # Housing Units | % Housing Units |
| Owner Occupied Housing Units | 27,267 | 65.7% |
| Renter-Occupied Housing Units | 14,263 | 34.3% |
| Total Occupied Housing Units | 41,530 | 100.0% |
Occupancy by Household Size in Boca Raton
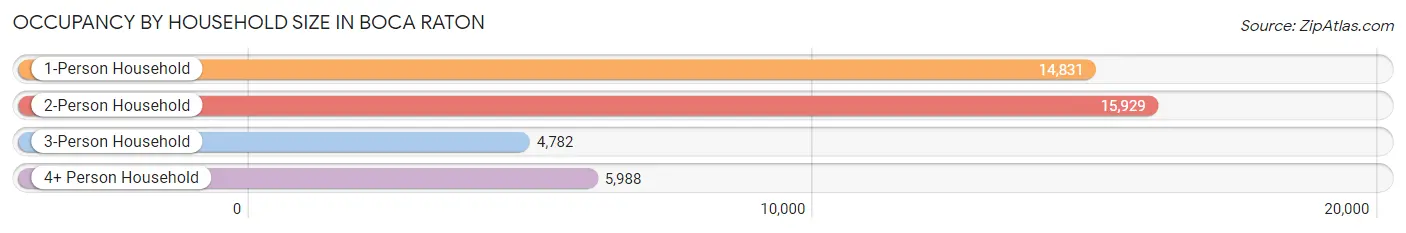
| Household Size | # Housing Units | % Housing Units |
| 1-Person Household | 14,831 | 35.7% |
| 2-Person Household | 15,929 | 38.4% |
| 3-Person Household | 4,782 | 11.5% |
| 4+ Person Household | 5,988 | 14.4% |
| Total Housing Units | 41,530 | 100.0% |
Occupancy by Ownership by Household Size in Boca Raton
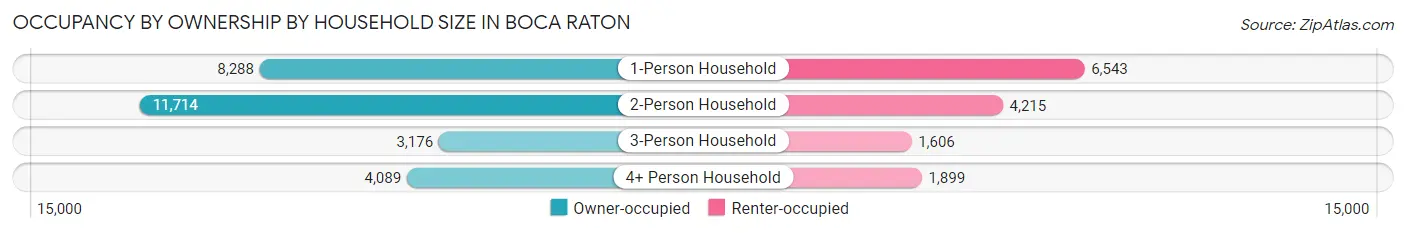
| Household Size | Owner-occupied | Renter-occupied |
| 1-Person Household | 8,288 (55.9%) | 6,543 (44.1%) |
| 2-Person Household | 11,714 (73.5%) | 4,215 (26.5%) |
| 3-Person Household | 3,176 (66.4%) | 1,606 (33.6%) |
| 4+ Person Household | 4,089 (68.3%) | 1,899 (31.7%) |
| Total Housing Units | 27,267 (65.7%) | 14,263 (34.3%) |
Occupancy by Educational Attainment in Boca Raton
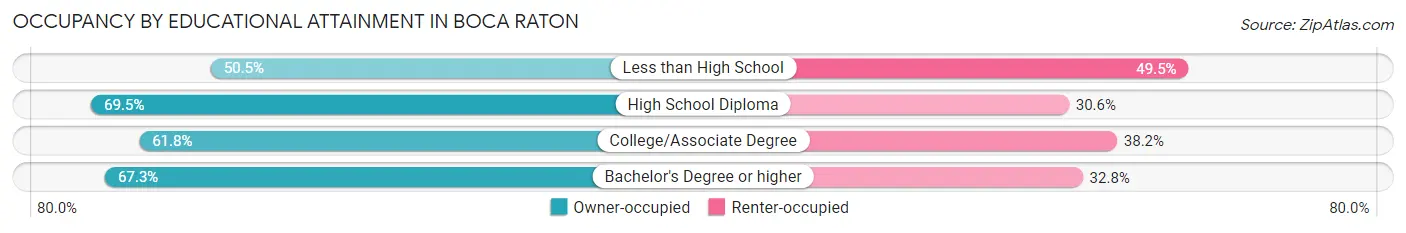
| Household Size | Owner-occupied | Renter-occupied |
| Less than High School | 678 (50.5%) | 665 (49.5%) |
| High School Diploma | 3,398 (69.5%) | 1,495 (30.5%) |
| College/Associate Degree | 6,188 (61.8%) | 3,821 (38.2%) |
| Bachelor's Degree or higher | 17,003 (67.2%) | 8,282 (32.8%) |
Occupancy by Age of Householder in Boca Raton
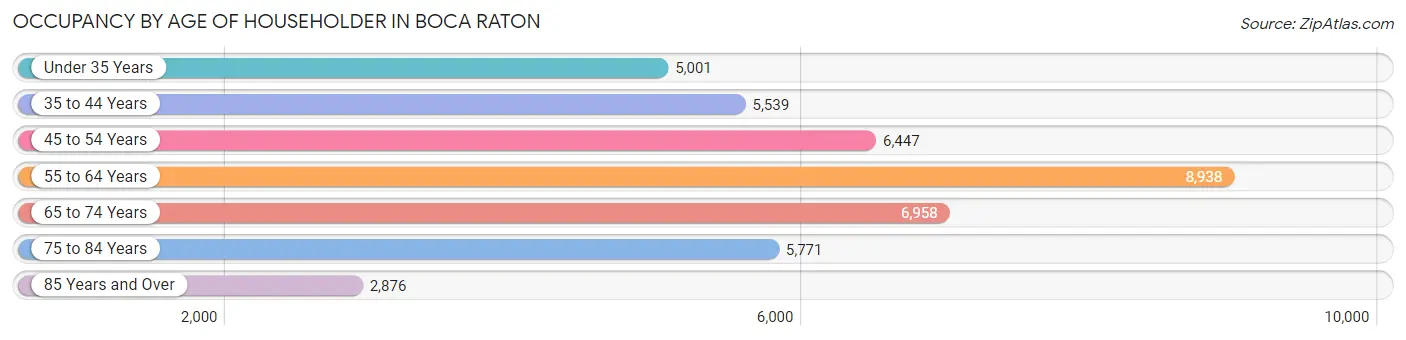
| Age Bracket | # Households | % Households |
| Under 35 Years | 5,001 | 12.0% |
| 35 to 44 Years | 5,539 | 13.3% |
| 45 to 54 Years | 6,447 | 15.5% |
| 55 to 64 Years | 8,938 | 21.5% |
| 65 to 74 Years | 6,958 | 16.8% |
| 75 to 84 Years | 5,771 | 13.9% |
| 85 Years and Over | 2,876 | 6.9% |
| Total | 41,530 | 100.0% |
Housing Finances in Boca Raton
Median Income by Occupancy in Boca Raton
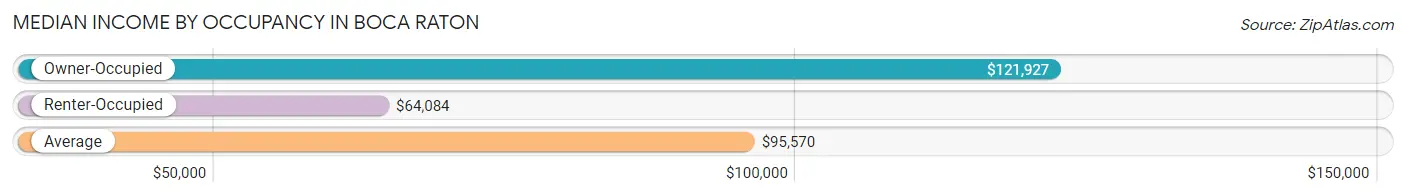
| Occupancy Type | # Households | Median Income |
| Owner-Occupied | 27,267 (65.7%) | $121,927 |
| Renter-Occupied | 14,263 (34.3%) | $64,084 |
| Average | 41,530 (100.0%) | $95,570 |
Occupancy by Householder Income Bracket in Boca Raton
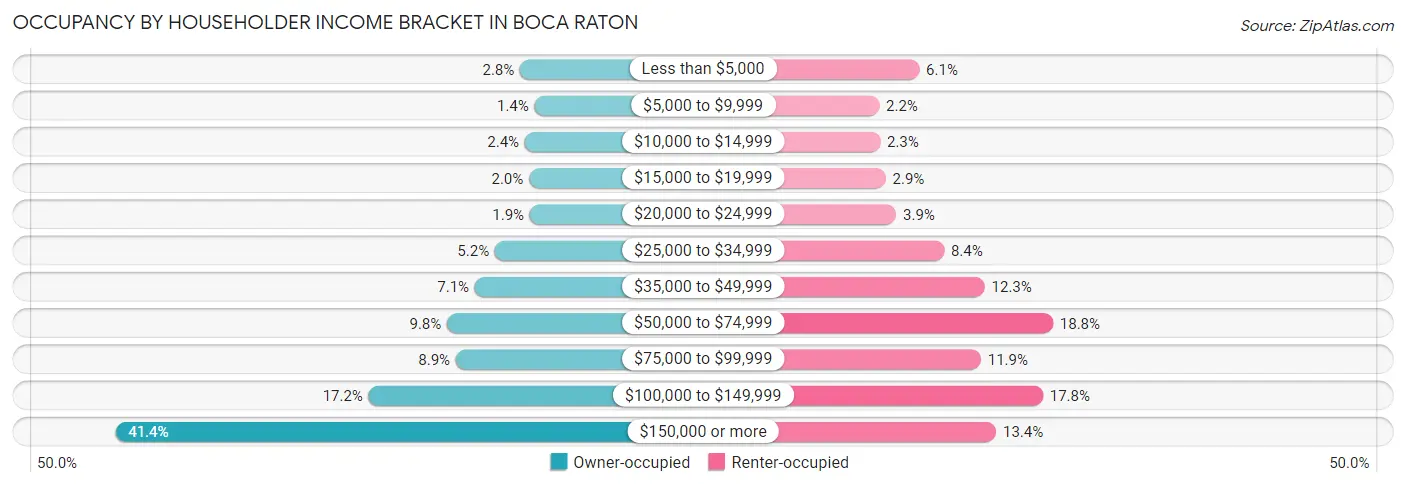
| Income Bracket | Owner-occupied | Renter-occupied |
| Less than $5,000 | 767 (2.8%) | 864 (6.1%) |
| $5,000 to $9,999 | 391 (1.4%) | 320 (2.2%) |
| $10,000 to $14,999 | 642 (2.4%) | 333 (2.3%) |
| $15,000 to $19,999 | 532 (1.9%) | 408 (2.9%) |
| $20,000 to $24,999 | 509 (1.9%) | 551 (3.9%) |
| $25,000 to $34,999 | 1,418 (5.2%) | 1,201 (8.4%) |
| $35,000 to $49,999 | 1,938 (7.1%) | 1,753 (12.3%) |
| $50,000 to $74,999 | 2,662 (9.8%) | 2,680 (18.8%) |
| $75,000 to $99,999 | 2,433 (8.9%) | 1,701 (11.9%) |
| $100,000 to $149,999 | 4,698 (17.2%) | 2,543 (17.8%) |
| $150,000 or more | 11,277 (41.4%) | 1,909 (13.4%) |
| Total | 27,267 (100.0%) | 14,263 (100.0%) |
Monthly Housing Cost Tiers in Boca Raton
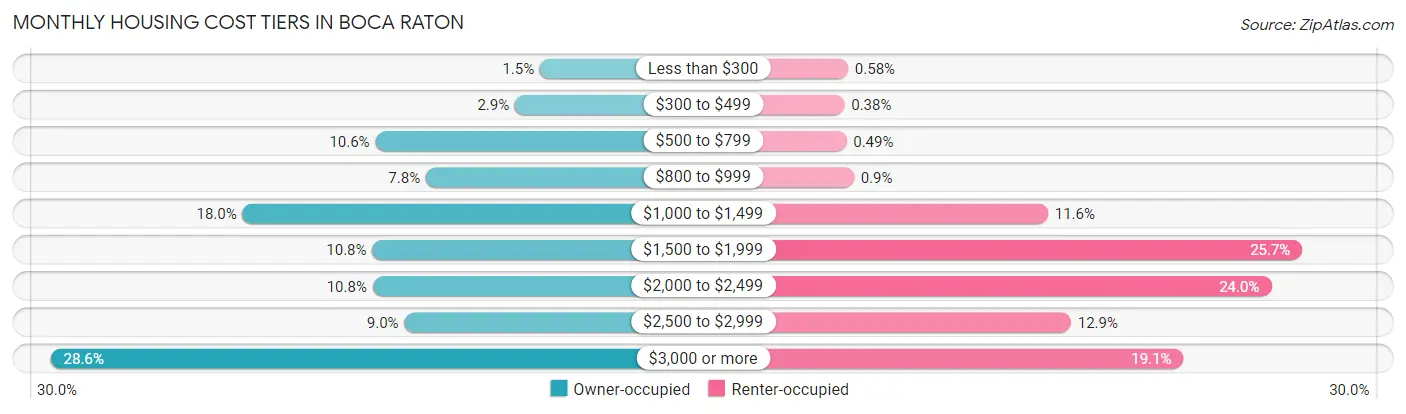
| Monthly Cost | Owner-occupied | Renter-occupied |
| Less than $300 | 417 (1.5%) | 83 (0.6%) |
| $300 to $499 | 793 (2.9%) | 54 (0.4%) |
| $500 to $799 | 2,896 (10.6%) | 70 (0.5%) |
| $800 to $999 | 2,134 (7.8%) | 129 (0.9%) |
| $1,000 to $1,499 | 4,898 (18.0%) | 1,658 (11.6%) |
| $1,500 to $1,999 | 2,943 (10.8%) | 3,662 (25.7%) |
| $2,000 to $2,499 | 2,938 (10.8%) | 3,417 (24.0%) |
| $2,500 to $2,999 | 2,460 (9.0%) | 1,839 (12.9%) |
| $3,000 or more | 7,788 (28.6%) | 2,726 (19.1%) |
| Total | 27,267 (100.0%) | 14,263 (100.0%) |
Physical Housing Characteristics in Boca Raton
Housing Structures in Boca Raton
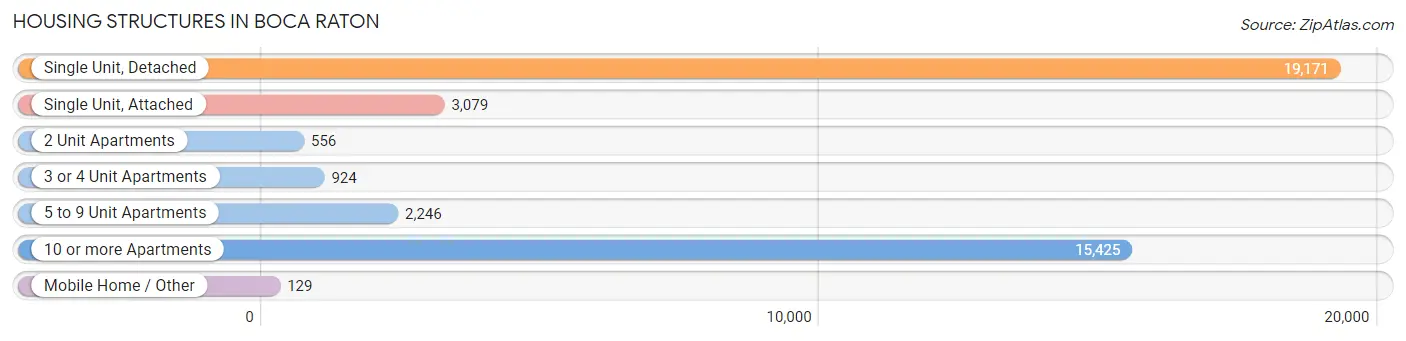
| Structure Type | # Housing Units | % Housing Units |
| Single Unit, Detached | 19,171 | 46.2% |
| Single Unit, Attached | 3,079 | 7.4% |
| 2 Unit Apartments | 556 | 1.3% |
| 3 or 4 Unit Apartments | 924 | 2.2% |
| 5 to 9 Unit Apartments | 2,246 | 5.4% |
| 10 or more Apartments | 15,425 | 37.1% |
| Mobile Home / Other | 129 | 0.3% |
| Total | 41,530 | 100.0% |
Housing Structures by Occupancy in Boca Raton
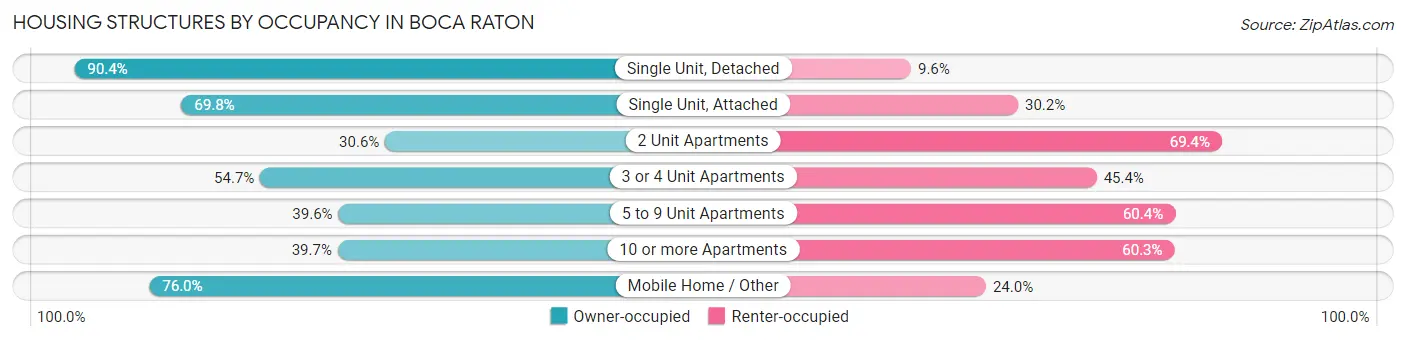
| Structure Type | Owner-occupied | Renter-occupied |
| Single Unit, Detached | 17,331 (90.4%) | 1,840 (9.6%) |
| Single Unit, Attached | 2,149 (69.8%) | 930 (30.2%) |
| 2 Unit Apartments | 170 (30.6%) | 386 (69.4%) |
| 3 or 4 Unit Apartments | 505 (54.6%) | 419 (45.4%) |
| 5 to 9 Unit Apartments | 889 (39.6%) | 1,357 (60.4%) |
| 10 or more Apartments | 6,125 (39.7%) | 9,300 (60.3%) |
| Mobile Home / Other | 98 (76.0%) | 31 (24.0%) |
| Total | 27,267 (65.7%) | 14,263 (34.3%) |
Housing Structures by Number of Rooms in Boca Raton
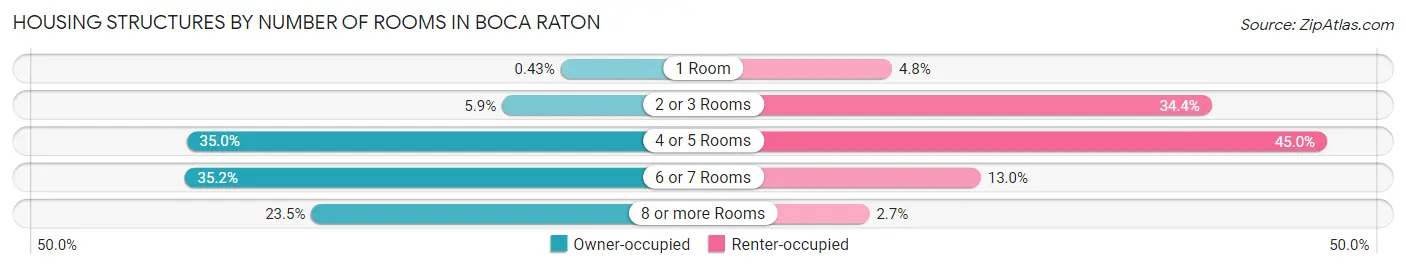
| Number of Rooms | Owner-occupied | Renter-occupied |
| 1 Room | 118 (0.4%) | 688 (4.8%) |
| 2 or 3 Rooms | 1,595 (5.9%) | 4,903 (34.4%) |
| 4 or 5 Rooms | 9,550 (35.0%) | 6,424 (45.0%) |
| 6 or 7 Rooms | 9,598 (35.2%) | 1,858 (13.0%) |
| 8 or more Rooms | 6,406 (23.5%) | 390 (2.7%) |
| Total | 27,267 (100.0%) | 14,263 (100.0%) |
Housing Structure by Heating Type in Boca Raton
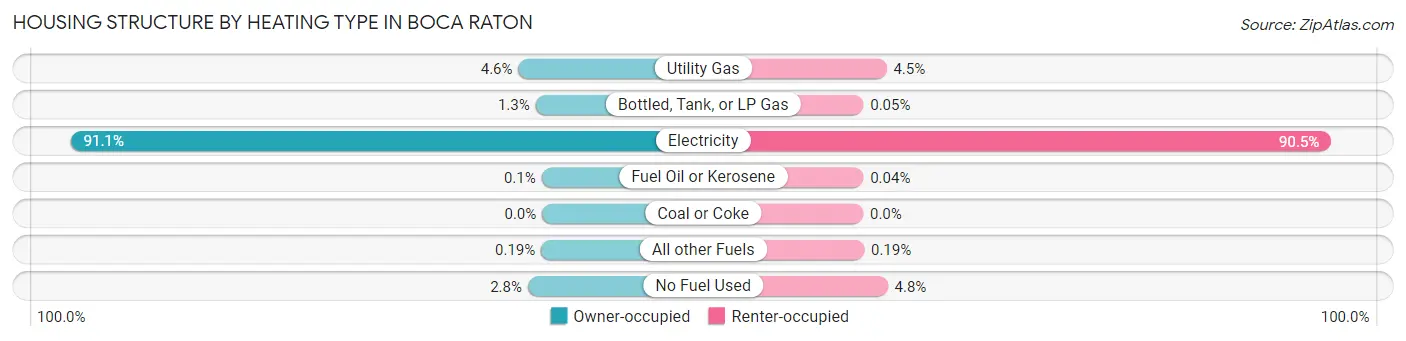
| Heating Type | Owner-occupied | Renter-occupied |
| Utility Gas | 1,252 (4.6%) | 644 (4.5%) |
| Bottled, Tank, or LP Gas | 344 (1.3%) | 7 (0.1%) |
| Electricity | 24,841 (91.1%) | 12,901 (90.4%) |
| Fuel Oil or Kerosene | 26 (0.1%) | 6 (0.0%) |
| Coal or Coke | 0 (0.0%) | 0 (0.0%) |
| All other Fuels | 52 (0.2%) | 27 (0.2%) |
| No Fuel Used | 752 (2.8%) | 678 (4.8%) |
| Total | 27,267 (100.0%) | 14,263 (100.0%) |
Household Vehicle Usage in Boca Raton
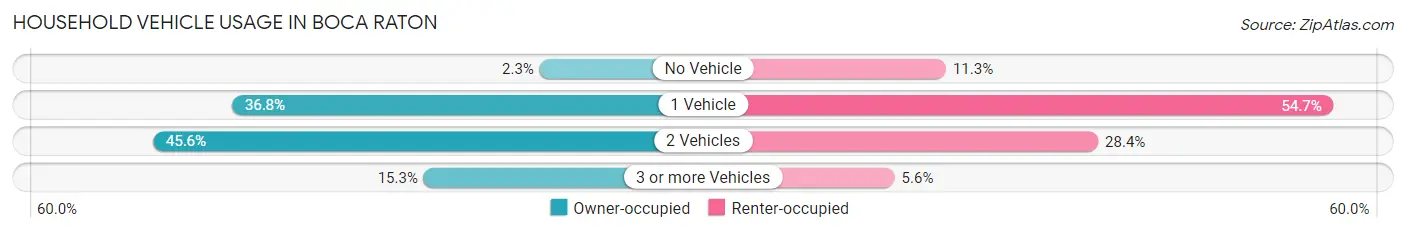
| Vehicles per Household | Owner-occupied | Renter-occupied |
| No Vehicle | 627 (2.3%) | 1,614 (11.3%) |
| 1 Vehicle | 10,029 (36.8%) | 7,808 (54.7%) |
| 2 Vehicles | 12,442 (45.6%) | 4,047 (28.4%) |
| 3 or more Vehicles | 4,169 (15.3%) | 794 (5.6%) |
| Total | 27,267 (100.0%) | 14,263 (100.0%) |
Real Estate & Mortgages in Boca Raton
Real Estate and Mortgage Overview in Boca Raton
| Characteristic | Without Mortgage | With Mortgage |
| Housing Units | 14,103 | 13,164 |
| Median Property Value | $585,200 | $606,700 |
| Median Household Income | $97,654 | $6,507 |
| Monthly Housing Costs | $1,151 | $6,101 |
| Real Estate Taxes | $4,970 | $142 |
Property Value by Mortgage Status in Boca Raton
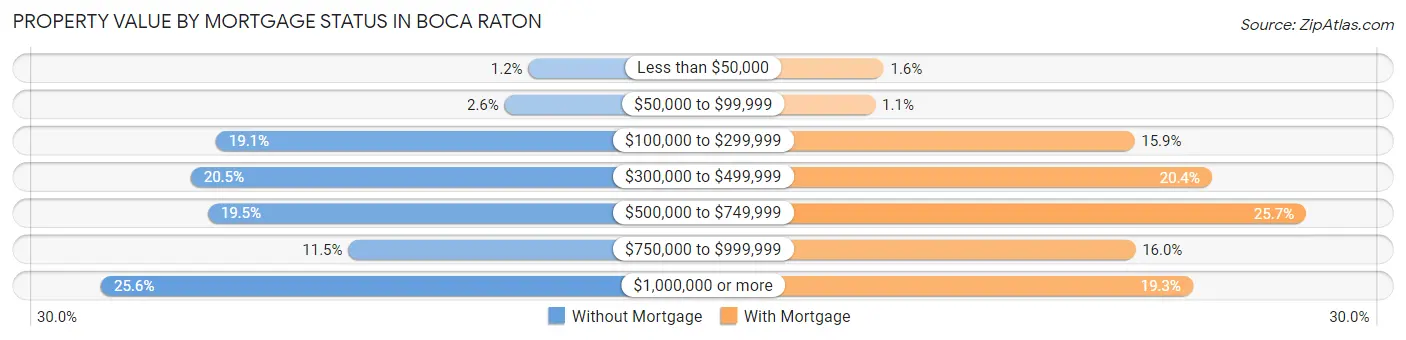
| Property Value | Without Mortgage | With Mortgage |
| Less than $50,000 | 170 (1.2%) | 211 (1.6%) |
| $50,000 to $99,999 | 362 (2.6%) | 147 (1.1%) |
| $100,000 to $299,999 | 2,690 (19.1%) | 2,097 (15.9%) |
| $300,000 to $499,999 | 2,891 (20.5%) | 2,680 (20.4%) |
| $500,000 to $749,999 | 2,754 (19.5%) | 3,389 (25.7%) |
| $750,000 to $999,999 | 1,622 (11.5%) | 2,103 (16.0%) |
| $1,000,000 or more | 3,614 (25.6%) | 2,537 (19.3%) |
| Total | 14,103 (100.0%) | 13,164 (100.0%) |
Household Income by Mortgage Status in Boca Raton
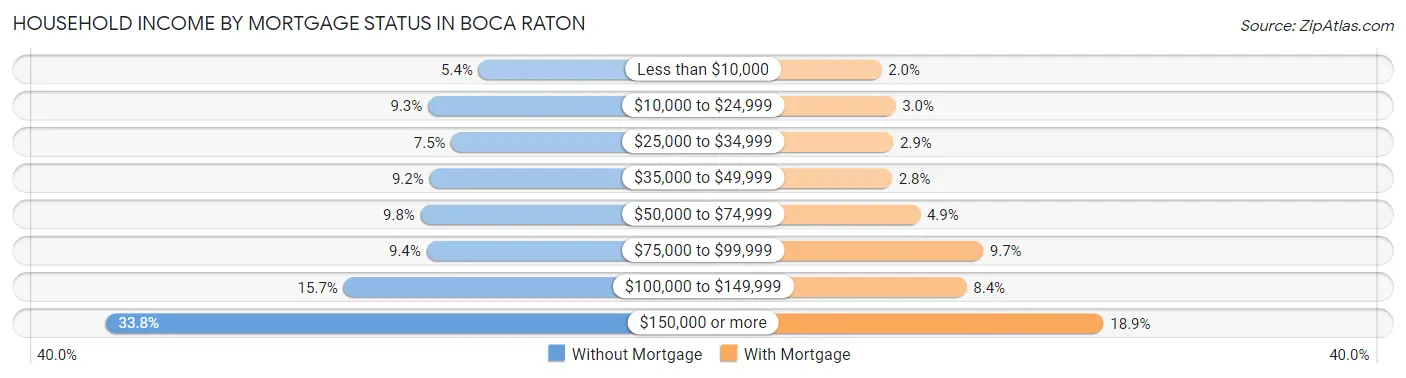
| Household Income | Without Mortgage | With Mortgage |
| Less than $10,000 | 761 (5.4%) | 258 (2.0%) |
| $10,000 to $24,999 | 1,306 (9.3%) | 397 (3.0%) |
| $25,000 to $34,999 | 1,055 (7.5%) | 377 (2.9%) |
| $35,000 to $49,999 | 1,291 (9.1%) | 363 (2.8%) |
| $50,000 to $74,999 | 1,385 (9.8%) | 647 (4.9%) |
| $75,000 to $99,999 | 1,322 (9.4%) | 1,277 (9.7%) |
| $100,000 to $149,999 | 2,213 (15.7%) | 1,111 (8.4%) |
| $150,000 or more | 4,770 (33.8%) | 2,485 (18.9%) |
| Total | 14,103 (100.0%) | 13,164 (100.0%) |
Property Value to Household Income Ratio in Boca Raton
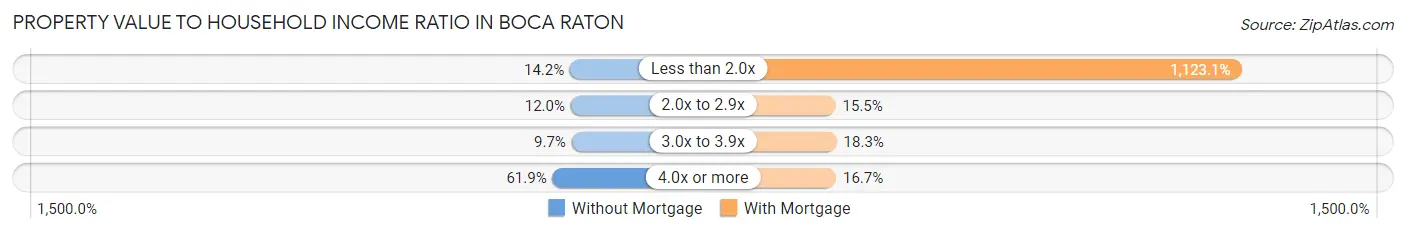
| Value-to-Income Ratio | Without Mortgage | With Mortgage |
| Less than 2.0x | 2,001 (14.2%) | 147,845 (1,123.1%) |
| 2.0x to 2.9x | 1,691 (12.0%) | 2,043 (15.5%) |
| 3.0x to 3.9x | 1,361 (9.7%) | 2,412 (18.3%) |
| 4.0x or more | 8,729 (61.9%) | 2,193 (16.7%) |
| Total | 14,103 (100.0%) | 13,164 (100.0%) |
Real Estate Taxes by Mortgage Status in Boca Raton
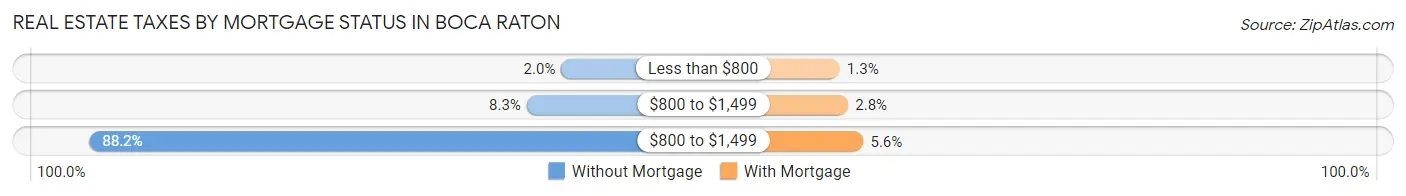
| Property Taxes | Without Mortgage | With Mortgage |
| Less than $800 | 279 (2.0%) | 164 (1.3%) |
| $800 to $1,499 | 1,170 (8.3%) | 369 (2.8%) |
| $800 to $1,499 | 12,435 (88.2%) | 733 (5.6%) |
| Total | 14,103 (100.0%) | 13,164 (100.0%) |
Health & Disability in Boca Raton
Health Insurance Coverage by Age in Boca Raton
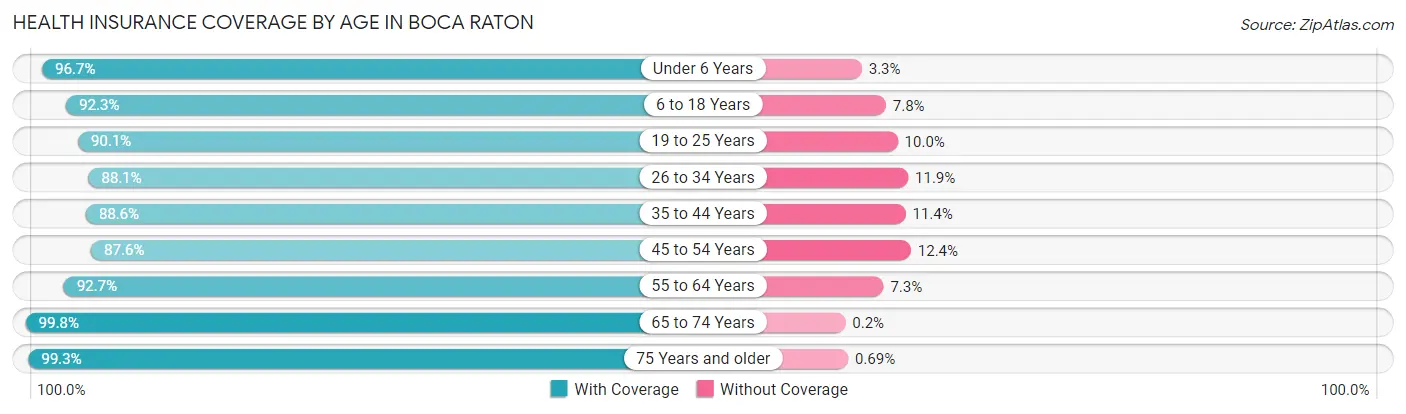
| Age Bracket | With Coverage | Without Coverage |
| Under 6 Years | 4,597 (96.7%) | 155 (3.3%) |
| 6 to 18 Years | 12,799 (92.2%) | 1,075 (7.7%) |
| 19 to 25 Years | 9,088 (90.0%) | 1,004 (10.0%) |
| 26 to 34 Years | 7,279 (88.1%) | 983 (11.9%) |
| 35 to 44 Years | 8,560 (88.6%) | 1,104 (11.4%) |
| 45 to 54 Years | 10,145 (87.6%) | 1,438 (12.4%) |
| 55 to 64 Years | 13,292 (92.7%) | 1,047 (7.3%) |
| 65 to 74 Years | 11,729 (99.8%) | 24 (0.2%) |
| 75 Years and older | 12,720 (99.3%) | 88 (0.7%) |
| Total | 90,209 (92.9%) | 6,918 (7.1%) |
Health Insurance Coverage by Citizenship Status in Boca Raton
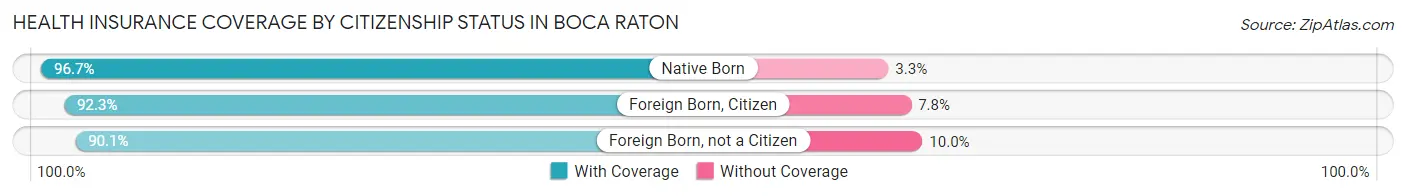
| Citizenship Status | With Coverage | Without Coverage |
| Native Born | 4,597 (96.7%) | 155 (3.3%) |
| Foreign Born, Citizen | 12,799 (92.2%) | 1,075 (7.7%) |
| Foreign Born, not a Citizen | 9,088 (90.0%) | 1,004 (10.0%) |
Health Insurance Coverage by Household Income in Boca Raton
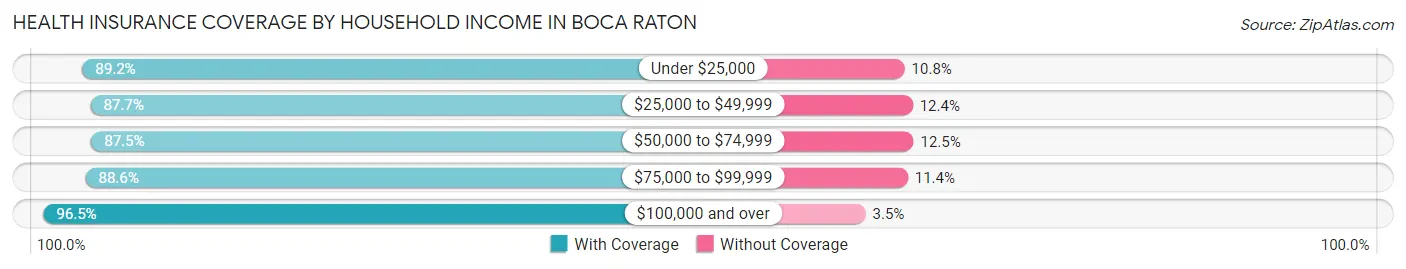
| Household Income | With Coverage | Without Coverage |
| Under $25,000 | 7,130 (89.2%) | 867 (10.8%) |
| $25,000 to $49,999 | 10,288 (87.6%) | 1,449 (12.3%) |
| $50,000 to $74,999 | 8,880 (87.5%) | 1,270 (12.5%) |
| $75,000 to $99,999 | 7,686 (88.6%) | 992 (11.4%) |
| $100,000 and over | 52,058 (96.5%) | 1,905 (3.5%) |
Public vs Private Health Insurance Coverage by Age in Boca Raton
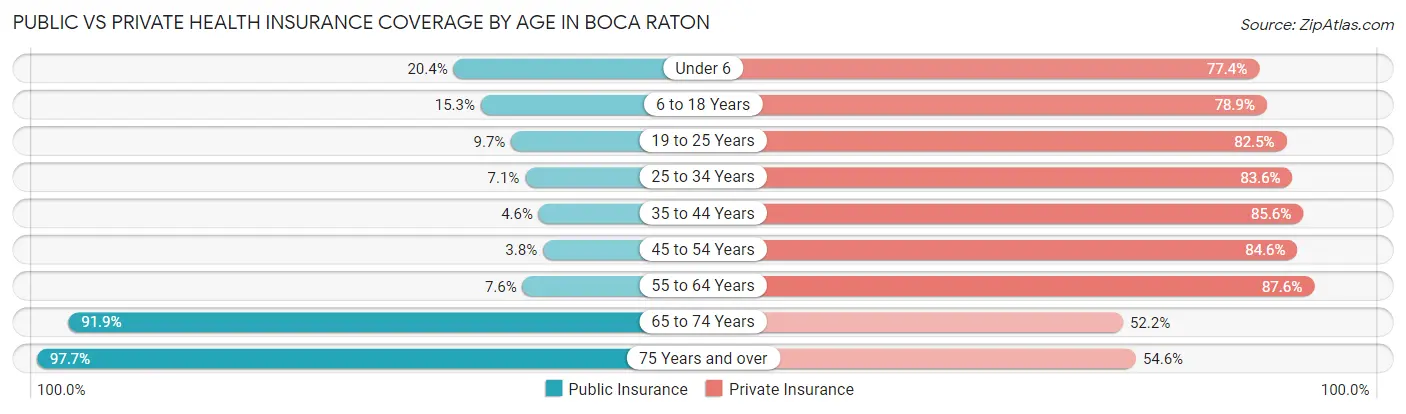
| Age Bracket | Public Insurance | Private Insurance |
| Under 6 | 969 (20.4%) | 3,680 (77.4%) |
| 6 to 18 Years | 2,125 (15.3%) | 10,942 (78.9%) |
| 19 to 25 Years | 978 (9.7%) | 8,328 (82.5%) |
| 25 to 34 Years | 585 (7.1%) | 6,910 (83.6%) |
| 35 to 44 Years | 440 (4.5%) | 8,274 (85.6%) |
| 45 to 54 Years | 438 (3.8%) | 9,794 (84.6%) |
| 55 to 64 Years | 1,087 (7.6%) | 12,566 (87.6%) |
| 65 to 74 Years | 10,800 (91.9%) | 6,134 (52.2%) |
| 75 Years and over | 12,516 (97.7%) | 6,993 (54.6%) |
| Total | 29,938 (30.8%) | 73,621 (75.8%) |
Disability Status by Sex by Age in Boca Raton
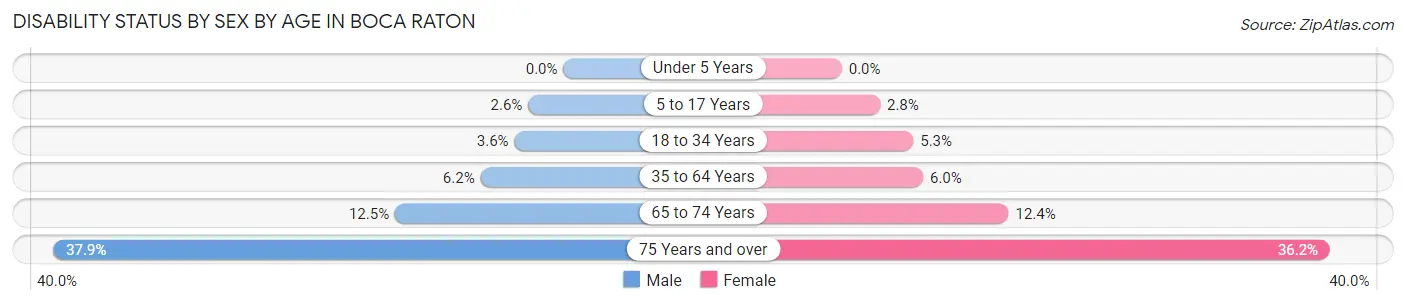
| Age Bracket | Male | Female |
| Under 5 Years | 0 (0.0%) | 0 (0.0%) |
| 5 to 17 Years | 160 (2.6%) | 186 (2.8%) |
| 18 to 34 Years | 336 (3.6%) | 588 (5.3%) |
| 35 to 64 Years | 1,019 (6.1%) | 1,147 (6.0%) |
| 65 to 74 Years | 712 (12.5%) | 750 (12.4%) |
| 75 Years and over | 2,068 (37.9%) | 2,663 (36.2%) |
Disability Class by Sex by Age in Boca Raton
Disability Class: Hearing Difficulty
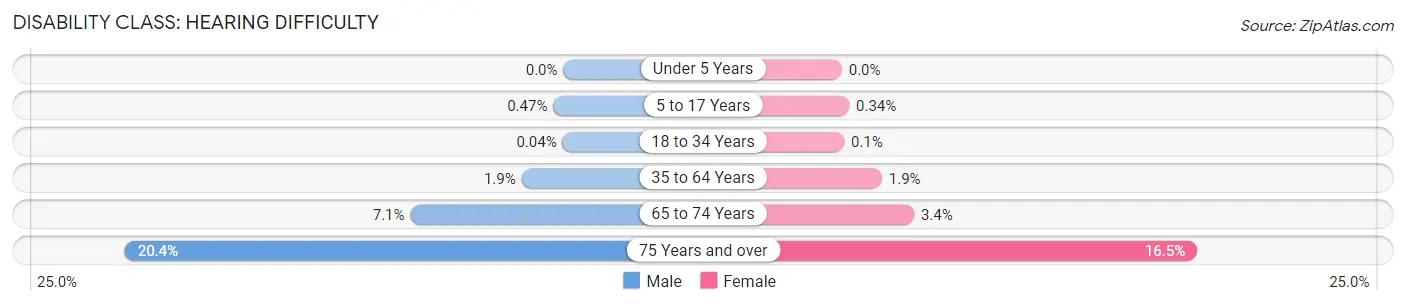
| Age Bracket | Male | Female |
| Under 5 Years | 0 (0.0%) | 0 (0.0%) |
| 5 to 17 Years | 29 (0.5%) | 22 (0.3%) |
| 18 to 34 Years | 4 (0.0%) | 11 (0.1%) |
| 35 to 64 Years | 321 (1.9%) | 354 (1.9%) |
| 65 to 74 Years | 404 (7.1%) | 203 (3.4%) |
| 75 Years and over | 1,111 (20.3%) | 1,211 (16.5%) |
Disability Class: Vision Difficulty
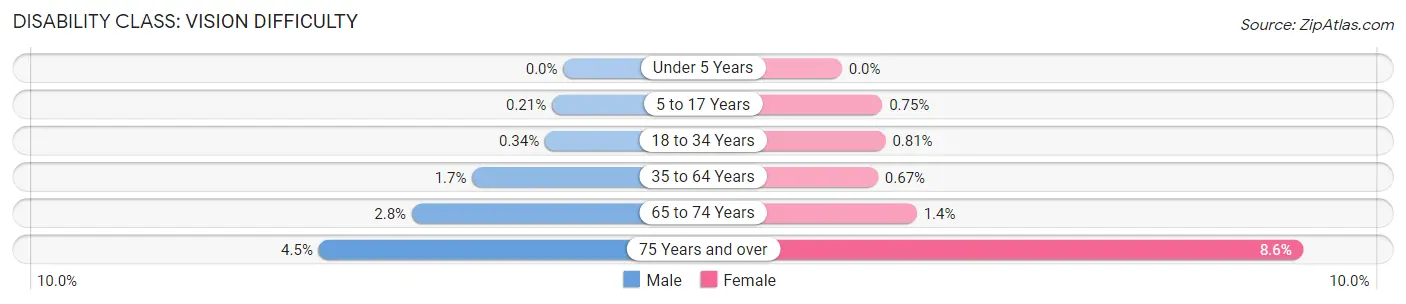
| Age Bracket | Male | Female |
| Under 5 Years | 0 (0.0%) | 0 (0.0%) |
| 5 to 17 Years | 13 (0.2%) | 49 (0.7%) |
| 18 to 34 Years | 31 (0.3%) | 90 (0.8%) |
| 35 to 64 Years | 280 (1.7%) | 127 (0.7%) |
| 65 to 74 Years | 160 (2.8%) | 84 (1.4%) |
| 75 Years and over | 248 (4.5%) | 630 (8.6%) |
Disability Class: Cognitive Difficulty
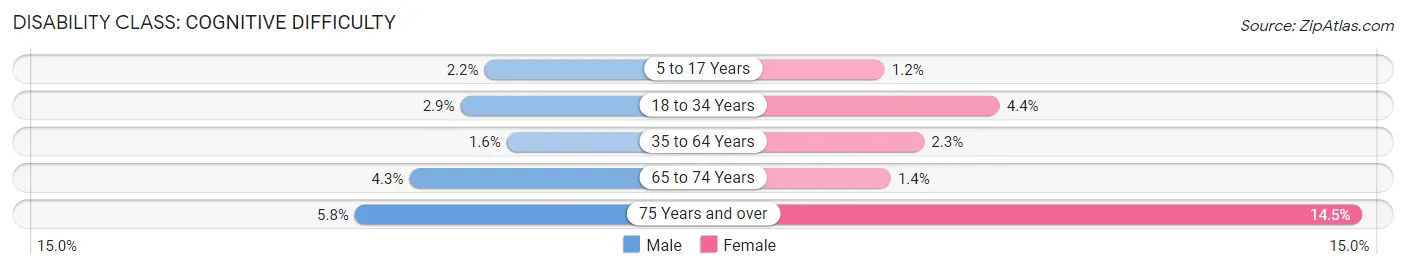
| Age Bracket | Male | Female |
| 5 to 17 Years | 135 (2.2%) | 79 (1.2%) |
| 18 to 34 Years | 266 (2.9%) | 487 (4.4%) |
| 35 to 64 Years | 262 (1.6%) | 437 (2.3%) |
| 65 to 74 Years | 244 (4.3%) | 83 (1.4%) |
| 75 Years and over | 317 (5.8%) | 1,065 (14.5%) |
Disability Class: Ambulatory Difficulty
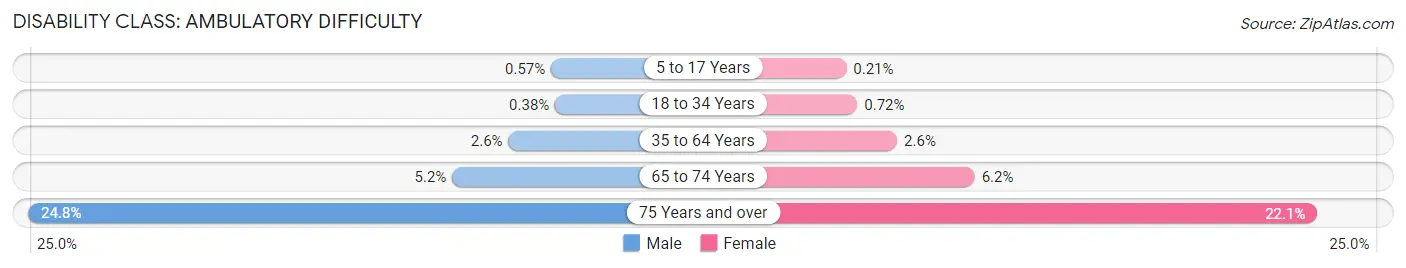
| Age Bracket | Male | Female |
| 5 to 17 Years | 35 (0.6%) | 14 (0.2%) |
| 18 to 34 Years | 35 (0.4%) | 80 (0.7%) |
| 35 to 64 Years | 422 (2.5%) | 489 (2.6%) |
| 65 to 74 Years | 294 (5.2%) | 374 (6.2%) |
| 75 Years and over | 1,356 (24.8%) | 1,621 (22.1%) |
Disability Class: Self-Care Difficulty
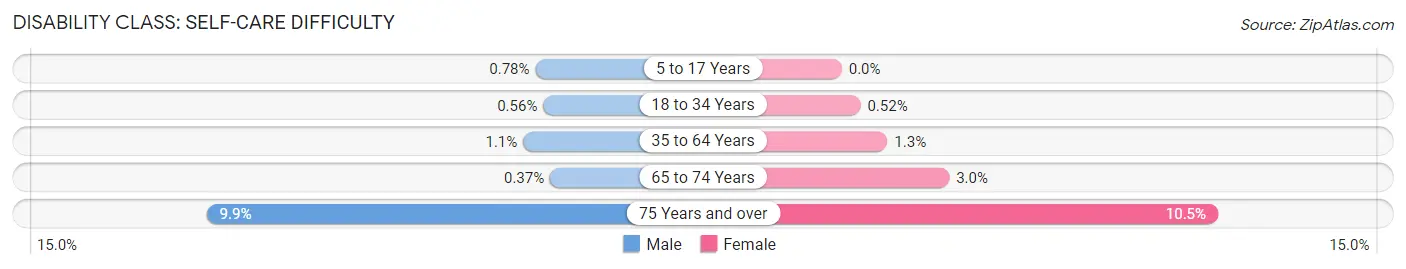
| Age Bracket | Male | Female |
| 5 to 17 Years | 48 (0.8%) | 0 (0.0%) |
| 18 to 34 Years | 52 (0.6%) | 58 (0.5%) |
| 35 to 64 Years | 186 (1.1%) | 241 (1.3%) |
| 65 to 74 Years | 21 (0.4%) | 181 (3.0%) |
| 75 Years and over | 542 (9.9%) | 769 (10.5%) |
Technology Access in Boca Raton
Computing Device Access in Boca Raton
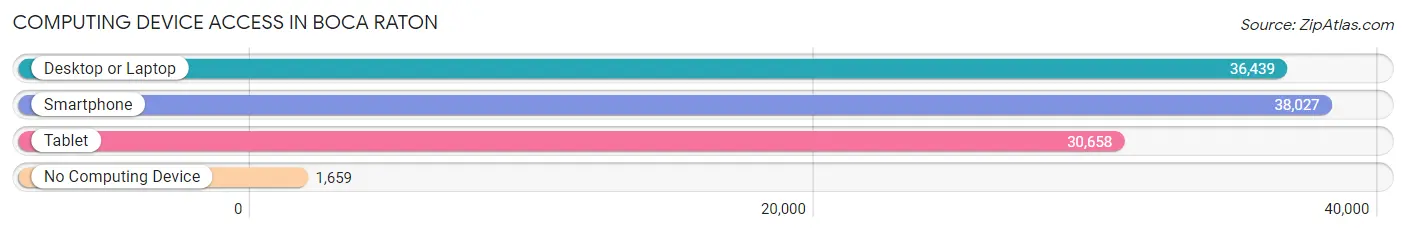
| Device Type | # Households | % Households |
| Desktop or Laptop | 36,439 | 87.7% |
| Smartphone | 38,027 | 91.6% |
| Tablet | 30,658 | 73.8% |
| No Computing Device | 1,659 | 4.0% |
| Total | 41,530 | 100.0% |
Internet Access in Boca Raton
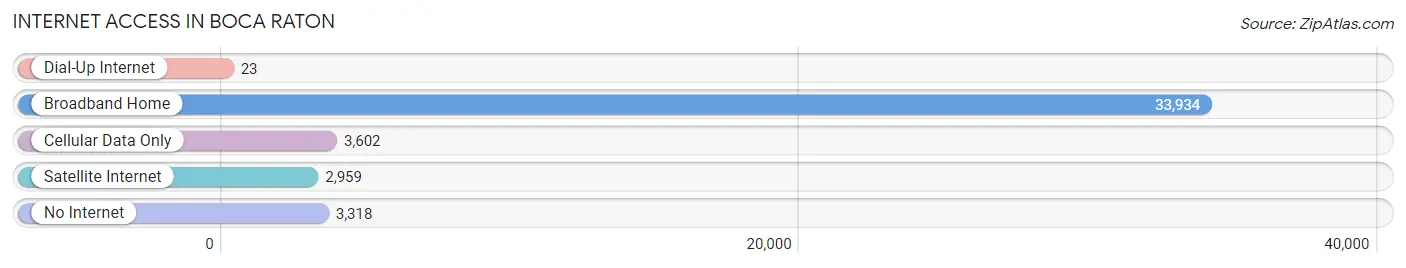
| Internet Type | # Households | % Households |
| Dial-Up Internet | 23 | 0.1% |
| Broadband Home | 33,934 | 81.7% |
| Cellular Data Only | 3,602 | 8.7% |
| Satellite Internet | 2,959 | 7.1% |
| No Internet | 3,318 | 8.0% |
| Total | 41,530 | 100.0% |
Boca Raton Summary
Boca Raton, Florida is a city located in Palm Beach County, on the southeastern coast of the state. It is a popular tourist destination, known for its beautiful beaches, upscale shopping, and vibrant nightlife. The city has a population of over 90,000 people, and is home to many corporate headquarters, including Office Depot, ADT Security Services, and IBM.
History
The area that is now Boca Raton was originally inhabited by the Tequesta Indians, who lived in the area for thousands of years before the arrival of Europeans. The first Europeans to settle in the area were Spanish explorers, who arrived in the late 1500s. The area was later claimed by the British, and in 1824, the United States acquired the land through the Adams-Onis Treaty.
In 1895, a group of settlers from Michigan purchased the land that is now Boca Raton, and established the town of Boca Ratone. The town was named after the Spanish word for “mouth of the rat”, which referred to the nearby inlet. The settlers built a hotel, a post office, and a school, and the town quickly grew.
In 1925, the city was incorporated, and in the following years, it experienced a period of rapid growth. The city was home to many wealthy residents, and it became known as a popular resort destination. In the 1950s, the city began to expand, and many new businesses and residential developments were built.
Geography
Boca Raton is located in southeastern Florida, on the Atlantic coast. It is situated between the cities of West Palm Beach and Fort Lauderdale. The city is bordered by the Intracoastal Waterway to the west, and the Atlantic Ocean to the east.
The city has a total area of 29.4 square miles, of which 28.2 square miles is land and 1.2 square miles is water. The city is located on a barrier island, and is surrounded by several bodies of water, including the Intracoastal Waterway, the Hillsboro Canal, and the Hillsboro Inlet.
Economy
Boca Raton is home to many corporate headquarters, including Office Depot, ADT Security Services, and IBM. The city is also home to several large shopping malls, including the Town Center at Boca Raton and the Mizner Park Mall.
The city’s economy is also supported by tourism, as it is a popular destination for both domestic and international travelers. The city is home to several resorts, including the Boca Raton Resort & Club, and the Boca Beach Club.
Demographics
As of the 2010 census, the population of Boca Raton was 84,392. The racial makeup of the city was 79.2% White, 8.3% African American, 0.2% Native American, 5.2% Asian, 0.1% Pacific Islander, 4.2% from other races, and 2.9% from two or more races. Hispanic or Latino of any race were 15.3% of the population.
The median household income in Boca Raton was $68,824, and the median family income was $87,811. The per capita income for the city was $45,945. About 8.2% of the population was below the poverty line.
Common Questions
What is Per Capita Income in Boca Raton?
Per Capita income in Boca Raton is $69,500.
What is the Median Family Income in Boca Raton?
Median Family Income in Boca Raton is $131,949.
What is the Median Household income in Boca Raton?
Median Household Income in Boca Raton is $95,570.
What is Income or Wage Gap in Boca Raton?
Income or Wage Gap in Boca Raton is 44.8%.
Women in Boca Raton earn 55.2 cents for every dollar earned by a man.
What is Family Income Deficit in Boca Raton?
Family Income Deficit in Boca Raton is $13,025.
Families that are below poverty line in Boca Raton earn $13,025 less on average than the poverty threshold level.
What is Inequality or Gini Index in Boca Raton?
Inequality or Gini Index in Boca Raton is 0.55.
What is the Total Population of Boca Raton?
Total Population of Boca Raton is 97,980.
What is the Total Male Population of Boca Raton?
Total Male Population of Boca Raton is 45,182.
What is the Total Female Population of Boca Raton?
Total Female Population of Boca Raton is 52,798.
What is the Ratio of Males per 100 Females in Boca Raton?
There are 85.58 Males per 100 Females in Boca Raton.
What is the Ratio of Females per 100 Males in Boca Raton?
There are 116.86 Females per 100 Males in Boca Raton.
What is the Median Population Age in Boca Raton?
Median Population Age in Boca Raton is 47.1 Years.
What is the Average Family Size in Boca Raton
Average Family Size in Boca Raton is 2.9 People.
What is the Average Household Size in Boca Raton
Average Household Size in Boca Raton is 2.2 People.
How Large is the Labor Force in Boca Raton?
There are 47,964 People in the Labor Forcein in Boca Raton.
What is the Percentage of People in the Labor Force in Boca Raton?
57.5% of People are in the Labor Force in Boca Raton.
What is the Unemployment Rate in Boca Raton?
Unemployment Rate in Boca Raton is 5.9%.