Spring Hill, FL Map & Demographics
Spring Hill Map
Spring Hill Overview
$29,951
PER CAPITA INCOME
$70,278
AVG FAMILY INCOME
$61,588
AVG HOUSEHOLD INCOME
23.8%
WAGE / INCOME GAP [ % ]
76.2¢/ $1
WAGE / INCOME GAP [ $ ]
$11,297
FAMILY INCOME DEFICIT
0.41
INEQUALITY / GINI INDEX
116,882
TOTAL POPULATION
57,090
MALE POPULATION
59,792
FEMALE POPULATION
95.48
MALES / 100 FEMALES
104.73
FEMALES / 100 MALES
43.2
MEDIAN AGE
3.0
AVG FAMILY SIZE
2.6
AVG HOUSEHOLD SIZE
51,455
LABOR FORCE [ PEOPLE ]
53.5%
PERCENT IN LABOR FORCE
6.4%
UNEMPLOYMENT RATE
Income in Spring Hill
Income Overview in Spring Hill
Per Capita Income in Spring Hill is $29,951, while median incomes of families and households are $70,278 and $61,588 respectively.
| Characteristic | Number | Measure |
| Per Capita Income | 116,882 | $29,951 |
| Median Family Income | 31,213 | $70,278 |
| Mean Family Income | 31,213 | $84,264 |
| Median Household Income | 44,625 | $61,588 |
| Mean Household Income | 44,625 | $76,036 |
| Income Deficit | 31,213 | $11,297 |
| Wage / Income Gap (%) | 116,882 | 23.80% |
| Wage / Income Gap ($) | 116,882 | 76.20¢ per $1 |
| Gini / Inequality Index | 116,882 | 0.41 |
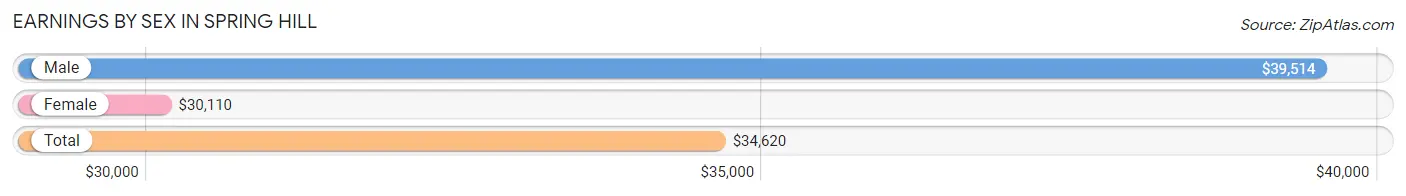
Earnings by Sex in Spring Hill
Average Earnings in Spring Hill are $34,620, $39,514 for men and $30,110 for women, a difference of 23.8%.
| Sex | Number | Average Earnings |
| Male | 27,344 (51.4%) | $39,514 |
| Female | 25,825 (48.6%) | $30,110 |
| Total | 53,169 (100.0%) | $34,620 |
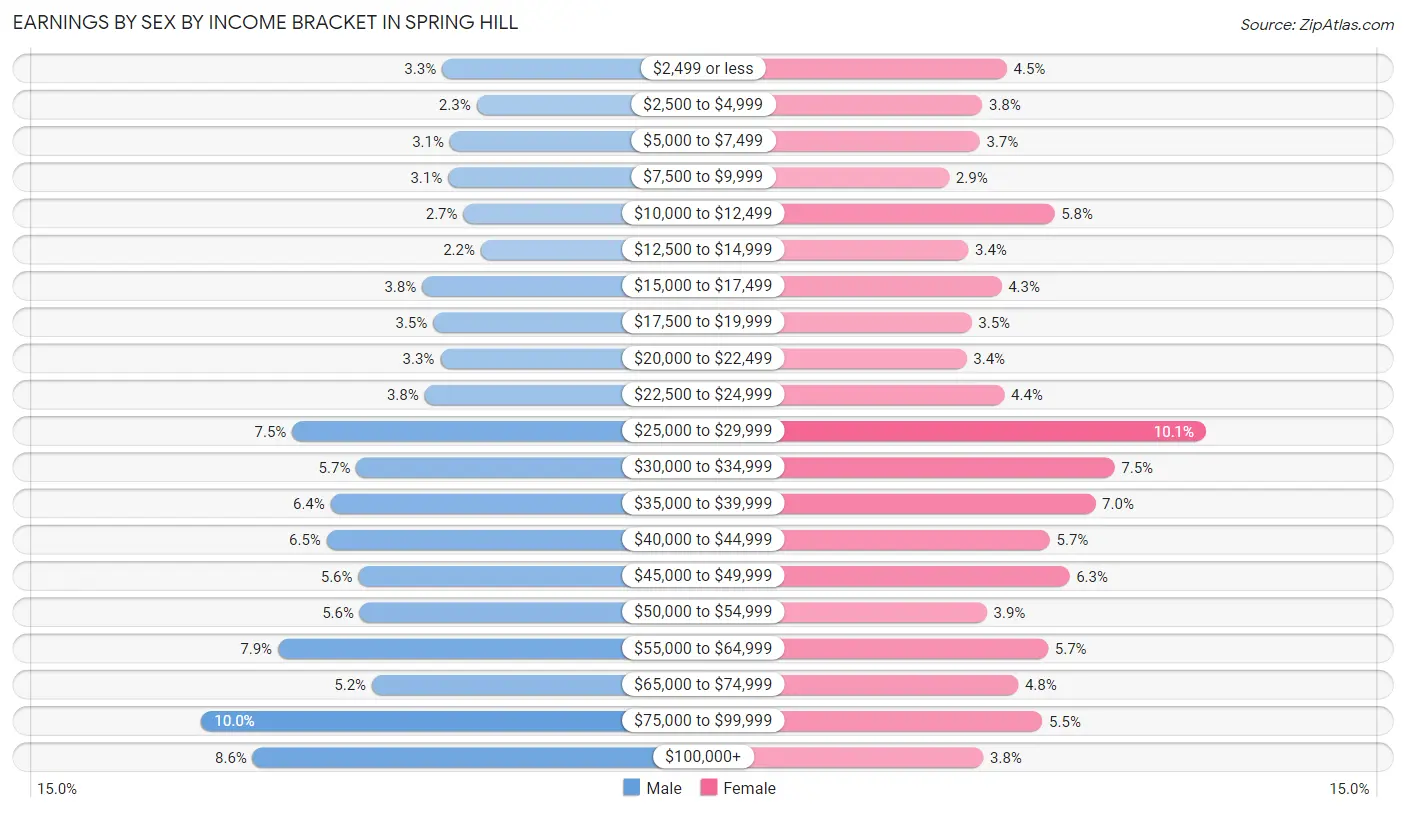
Earnings by Sex by Income Bracket in Spring Hill
The most common earnings brackets in Spring Hill are $75,000 to $99,999 for men (2,743 | 10.0%) and $25,000 to $29,999 for women (2,606 | 10.1%).
| Income | Male | Female |
| $2,499 or less | 894 (3.3%) | 1,160 (4.5%) |
| $2,500 to $4,999 | 630 (2.3%) | 982 (3.8%) |
| $5,000 to $7,499 | 833 (3.0%) | 962 (3.7%) |
| $7,500 to $9,999 | 847 (3.1%) | 740 (2.9%) |
| $10,000 to $12,499 | 730 (2.7%) | 1,505 (5.8%) |
| $12,500 to $14,999 | 596 (2.2%) | 880 (3.4%) |
| $15,000 to $17,499 | 1,048 (3.8%) | 1,121 (4.3%) |
| $17,500 to $19,999 | 963 (3.5%) | 904 (3.5%) |
| $20,000 to $22,499 | 907 (3.3%) | 869 (3.4%) |
| $22,500 to $24,999 | 1,028 (3.8%) | 1,142 (4.4%) |
| $25,000 to $29,999 | 2,044 (7.5%) | 2,606 (10.1%) |
| $30,000 to $34,999 | 1,552 (5.7%) | 1,943 (7.5%) |
| $35,000 to $39,999 | 1,751 (6.4%) | 1,802 (7.0%) |
| $40,000 to $44,999 | 1,780 (6.5%) | 1,472 (5.7%) |
| $45,000 to $49,999 | 1,538 (5.6%) | 1,614 (6.2%) |
| $50,000 to $54,999 | 1,525 (5.6%) | 1,015 (3.9%) |
| $55,000 to $64,999 | 2,154 (7.9%) | 1,458 (5.7%) |
| $65,000 to $74,999 | 1,432 (5.2%) | 1,243 (4.8%) |
| $75,000 to $99,999 | 2,743 (10.0%) | 1,419 (5.5%) |
| $100,000+ | 2,349 (8.6%) | 988 (3.8%) |
| Total | 27,344 (100.0%) | 25,825 (100.0%) |
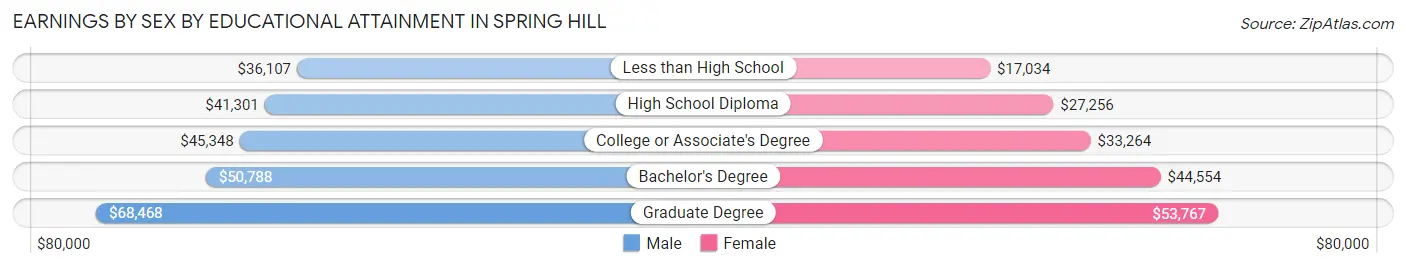
Earnings by Sex by Educational Attainment in Spring Hill
Average earnings in Spring Hill are $43,781 for men and $33,652 for women, a difference of 23.1%. Men with an educational attainment of graduate degree enjoy the highest average annual earnings of $68,468, while those with less than high school education earn the least with $36,107. Women with an educational attainment of graduate degree earn the most with the average annual earnings of $53,767, while those with less than high school education have the smallest earnings of $17,034.
| Educational Attainment | Male Income | Female Income |
| Less than High School | $36,107 | $17,034 |
| High School Diploma | $41,301 | $27,256 |
| College or Associate's Degree | $45,348 | $33,264 |
| Bachelor's Degree | $50,788 | $44,554 |
| Graduate Degree | $68,468 | $53,767 |
| Total | $43,781 | $33,652 |
Family Income in Spring Hill
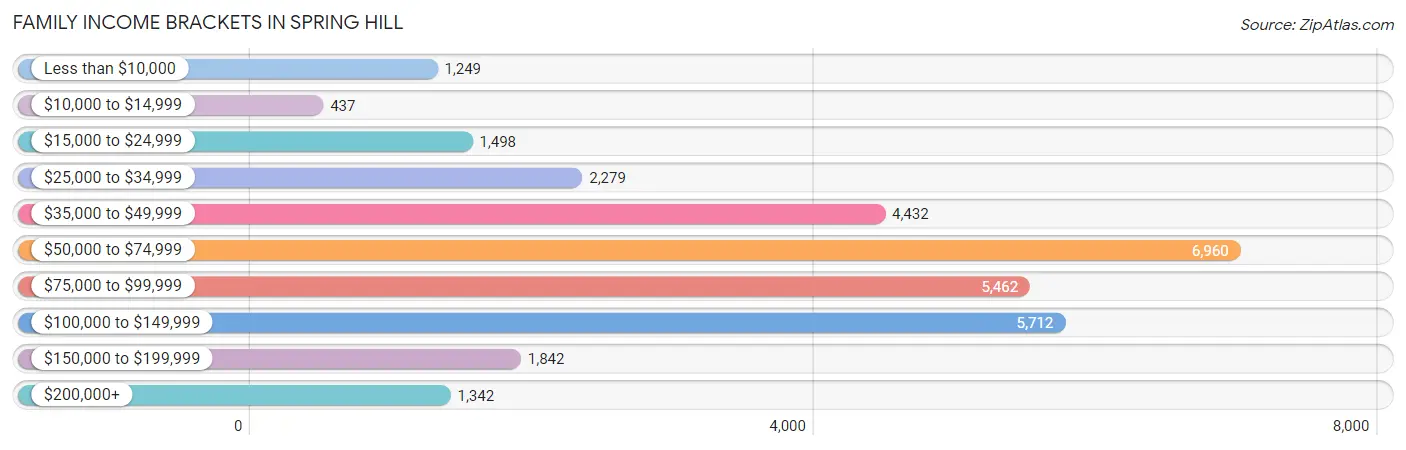
Family Income Brackets in Spring Hill
According to the Spring Hill family income data, there are 6,960 families falling into the $50,000 to $74,999 income range, which is the most common income bracket and makes up 22.3% of all families. Conversely, the $10,000 to $14,999 income bracket is the least frequent group with only 437 families (1.4%) belonging to this category.
| Income Bracket | # Families | % Families |
| Less than $10,000 | 1,249 | 4.0% |
| $10,000 to $14,999 | 437 | 1.4% |
| $15,000 to $24,999 | 1,498 | 4.8% |
| $25,000 to $34,999 | 2,279 | 7.3% |
| $35,000 to $49,999 | 4,432 | 14.2% |
| $50,000 to $74,999 | 6,960 | 22.3% |
| $75,000 to $99,999 | 5,462 | 17.5% |
| $100,000 to $149,999 | 5,712 | 18.3% |
| $150,000 to $199,999 | 1,842 | 5.9% |
| $200,000+ | 1,342 | 4.3% |
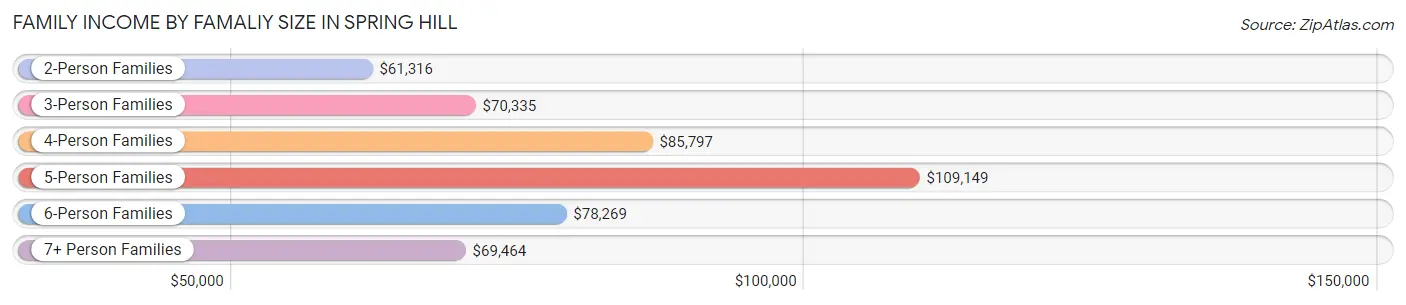
Family Income by Famaliy Size in Spring Hill
5-person families (2,323 | 7.4%) account for the highest median family income in Spring Hill with $109,149 per family, while 2-person families (15,277 | 48.9%) have the highest median income of $30,658 per family member.
| Income Bracket | # Families | Median Income |
| 2-Person Families | 15,277 (48.9%) | $61,316 |
| 3-Person Families | 7,386 (23.7%) | $70,335 |
| 4-Person Families | 5,010 (16.1%) | $85,797 |
| 5-Person Families | 2,323 (7.4%) | $109,149 |
| 6-Person Families | 880 (2.8%) | $78,269 |
| 7+ Person Families | 337 (1.1%) | $69,464 |
| Total | 31,213 (100.0%) | $70,278 |
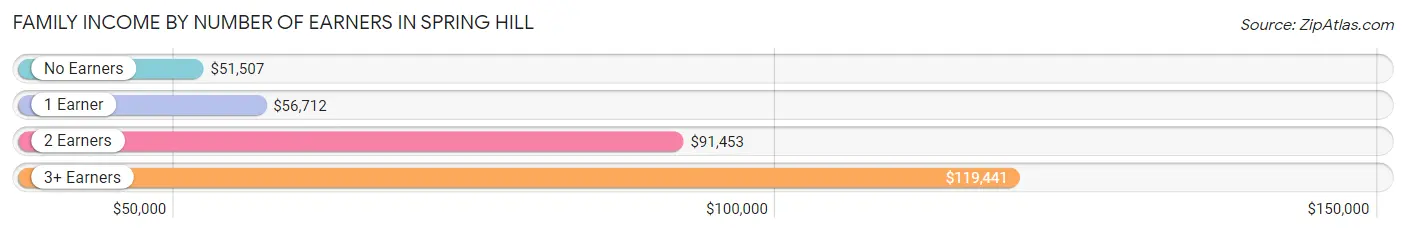
Family Income by Number of Earners in Spring Hill
The median family income in Spring Hill is $70,278, with families comprising 3+ earners (2,536) having the highest median family income of $119,441, while families with no earners (7,768) have the lowest median family income of $51,507, accounting for 8.1% and 24.9% of families, respectively.
| Number of Earners | # Families | Median Income |
| No Earners | 7,768 (24.9%) | $51,507 |
| 1 Earner | 10,345 (33.1%) | $56,712 |
| 2 Earners | 10,564 (33.8%) | $91,453 |
| 3+ Earners | 2,536 (8.1%) | $119,441 |
| Total | 31,213 (100.0%) | $70,278 |
Household Income in Spring Hill
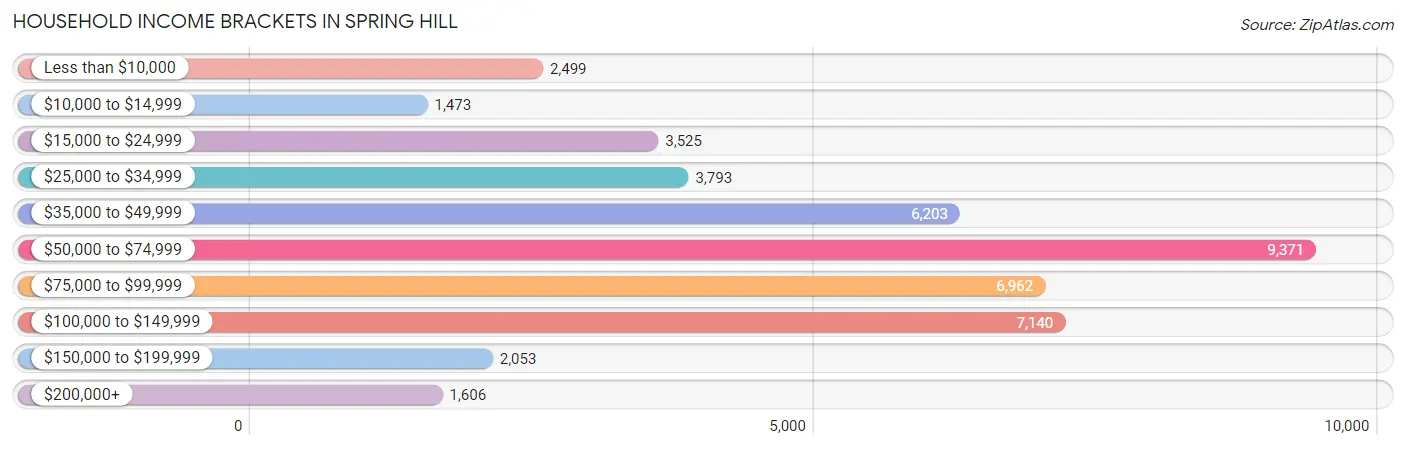
Household Income Brackets in Spring Hill
With 9,371 households falling in the category, the $50,000 to $74,999 income range is the most frequent in Spring Hill, accounting for 21.0% of all households. In contrast, only 1,473 households (3.3%) fall into the $10,000 to $14,999 income bracket, making it the least populous group.
| Income Bracket | # Households | % Households |
| Less than $10,000 | 2,499 | 5.6% |
| $10,000 to $14,999 | 1,473 | 3.3% |
| $15,000 to $24,999 | 3,525 | 7.9% |
| $25,000 to $34,999 | 3,793 | 8.5% |
| $35,000 to $49,999 | 6,203 | 13.9% |
| $50,000 to $74,999 | 9,371 | 21.0% |
| $75,000 to $99,999 | 6,962 | 15.6% |
| $100,000 to $149,999 | 7,140 | 16.0% |
| $150,000 to $199,999 | 2,053 | 4.6% |
| $200,000+ | 1,606 | 3.6% |
Household Income by Householder Age in Spring Hill
The median household income in Spring Hill is $61,588, with the highest median household income of $74,672 found in the 45 to 64 years age bracket for the primary householder. A total of 16,290 households (36.5%) fall into this category. Meanwhile, the 65+ years age bracket for the primary householder has the lowest median household income of $49,714, with 16,007 households (35.9%) in this group.
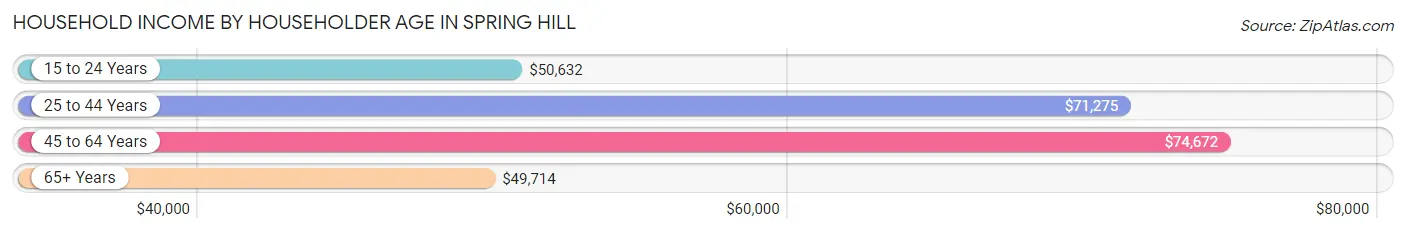
| Income Bracket | # Households | Median Income |
| 15 to 24 Years | 912 (2.0%) | $50,632 |
| 25 to 44 Years | 11,416 (25.6%) | $71,275 |
| 45 to 64 Years | 16,290 (36.5%) | $74,672 |
| 65+ Years | 16,007 (35.9%) | $49,714 |
| Total | 44,625 (100.0%) | $61,588 |
Poverty in Spring Hill
Income Below Poverty by Sex and Age in Spring Hill
With 11.8% poverty level for males and 12.5% for females among the residents of Spring Hill, 15 year old males and 5 year old females are the most vulnerable to poverty, with 255 males (32.7%) and 184 females (32.6%) in their respective age groups living below the poverty level.
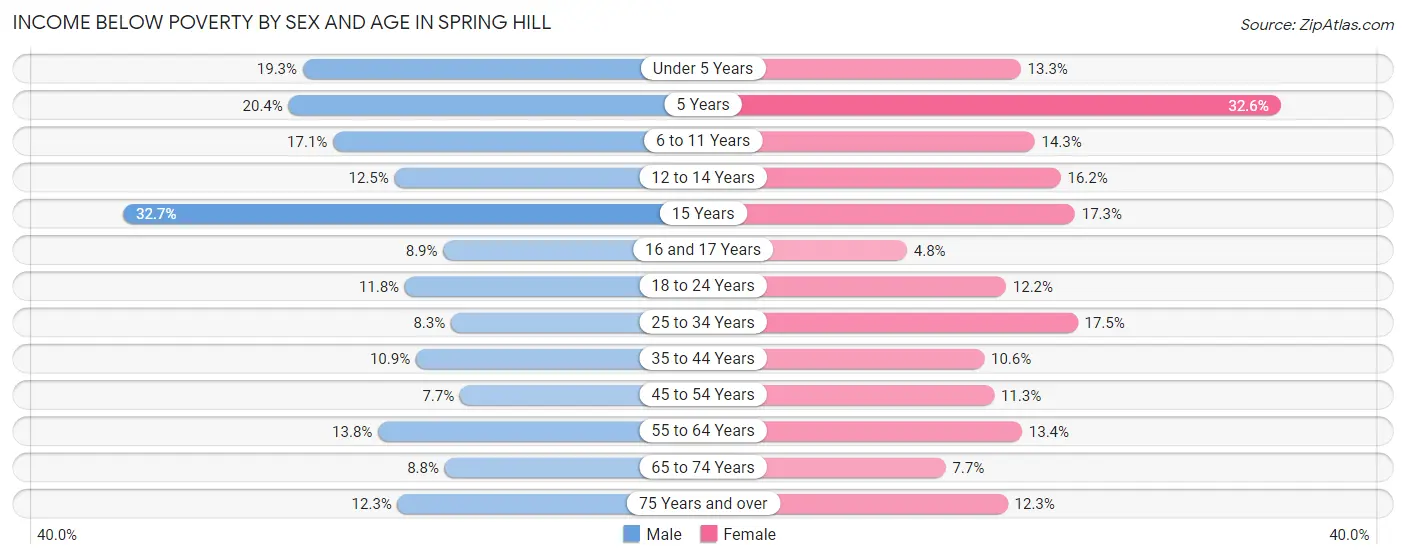
| Age Bracket | Male | Female |
| Under 5 Years | 613 (19.3%) | 368 (13.3%) |
| 5 Years | 111 (20.4%) | 184 (32.6%) |
| 6 to 11 Years | 564 (17.1%) | 524 (14.3%) |
| 12 to 14 Years | 272 (12.5%) | 345 (16.2%) |
| 15 Years | 255 (32.7%) | 169 (17.3%) |
| 16 and 17 Years | 145 (8.9%) | 60 (4.8%) |
| 18 to 24 Years | 510 (11.8%) | 491 (12.2%) |
| 25 to 34 Years | 590 (8.3%) | 1,191 (17.5%) |
| 35 to 44 Years | 740 (10.9%) | 726 (10.6%) |
| 45 to 54 Years | 511 (7.7%) | 812 (11.3%) |
| 55 to 64 Years | 1,073 (13.8%) | 1,078 (13.4%) |
| 65 to 74 Years | 585 (8.8%) | 615 (7.7%) |
| 75 Years and over | 668 (12.3%) | 770 (12.3%) |
| Total | 6,637 (11.8%) | 7,333 (12.5%) |
Income Above Poverty by Sex and Age in Spring Hill
According to the poverty statistics in Spring Hill, males aged 45 to 54 years and females aged 16 and 17 years are the age groups that are most secure financially, with 92.3% of males and 95.2% of females in these age groups living above the poverty line.
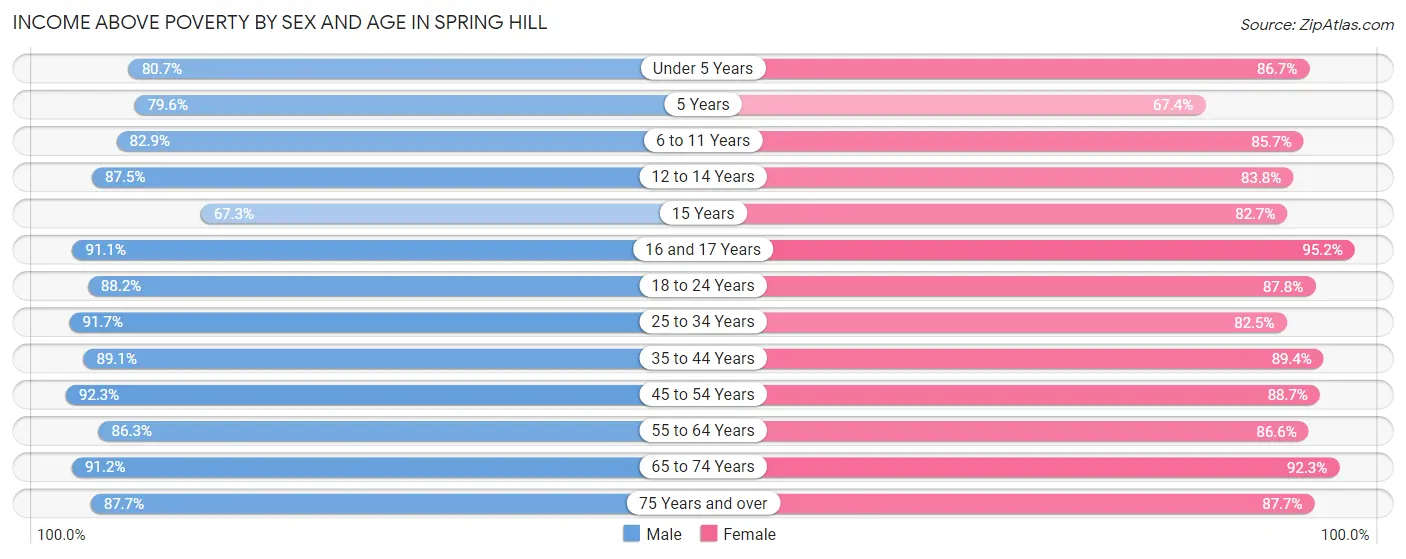
| Age Bracket | Male | Female |
| Under 5 Years | 2,557 (80.7%) | 2,403 (86.7%) |
| 5 Years | 433 (79.6%) | 381 (67.4%) |
| 6 to 11 Years | 2,737 (82.9%) | 3,139 (85.7%) |
| 12 to 14 Years | 1,898 (87.5%) | 1,779 (83.8%) |
| 15 Years | 525 (67.3%) | 808 (82.7%) |
| 16 and 17 Years | 1,482 (91.1%) | 1,182 (95.2%) |
| 18 to 24 Years | 3,827 (88.2%) | 3,539 (87.8%) |
| 25 to 34 Years | 6,486 (91.7%) | 5,614 (82.5%) |
| 35 to 44 Years | 6,023 (89.1%) | 6,146 (89.4%) |
| 45 to 54 Years | 6,155 (92.3%) | 6,377 (88.7%) |
| 55 to 64 Years | 6,728 (86.3%) | 6,985 (86.6%) |
| 65 to 74 Years | 6,065 (91.2%) | 7,369 (92.3%) |
| 75 Years and over | 4,762 (87.7%) | 5,486 (87.7%) |
| Total | 49,678 (88.2%) | 51,208 (87.5%) |
Income Below Poverty Among Married-Couple Families in Spring Hill
The poverty statistics for married-couple families in Spring Hill show that 6.2% or 1,405 of the total 22,541 families live below the poverty line. Families with 3 or 4 children have the highest poverty rate of 19.0%, comprising of 338 families. On the other hand, families with 5 or more children have the lowest poverty rate of 0.0%, which includes 0 families.
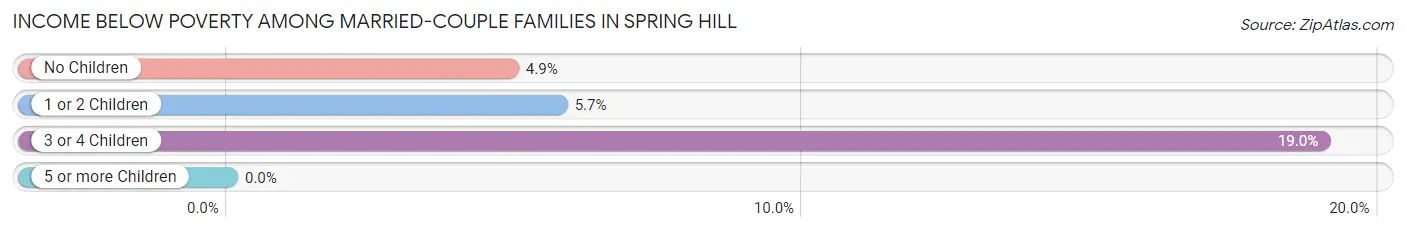
| Children | Above Poverty | Below Poverty |
| No Children | 13,620 (95.1%) | 701 (4.9%) |
| 1 or 2 Children | 6,012 (94.3%) | 366 (5.7%) |
| 3 or 4 Children | 1,440 (81.0%) | 338 (19.0%) |
| 5 or more Children | 64 (100.0%) | 0 (0.0%) |
| Total | 21,136 (93.8%) | 1,405 (6.2%) |
Income Below Poverty Among Single-Parent Households in Spring Hill
According to the poverty data in Spring Hill, 17.2% or 469 single-father households and 17.2% or 1,020 single-mother households are living below the poverty line. Among single-father households, those with 5 or more children have the highest poverty rate, with 12 households (100.0%) experiencing poverty. Likewise, among single-mother households, those with 3 or 4 children have the highest poverty rate, with 191 households (43.3%) falling below the poverty line.
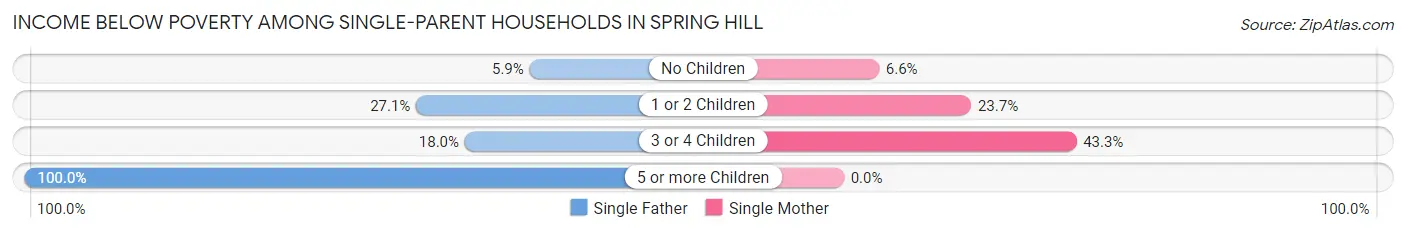
| Children | Single Father | Single Mother |
| No Children | 70 (5.9%) | 181 (6.6%) |
| 1 or 2 Children | 328 (27.1%) | 648 (23.7%) |
| 3 or 4 Children | 59 (18.0%) | 191 (43.3%) |
| 5 or more Children | 12 (100.0%) | 0 (0.0%) |
| Total | 469 (17.2%) | 1,020 (17.2%) |
Income Below Poverty Among Married-Couple vs Single-Parent Households in Spring Hill
The poverty data for Spring Hill shows that 1,405 of the married-couple family households (6.2%) and 1,489 of the single-parent households (17.2%) are living below the poverty level. Within the married-couple family households, those with 3 or 4 children have the highest poverty rate, with 338 households (19.0%) falling below the poverty line. Among the single-parent households, those with 5 or more children have the highest poverty rate, with 12 household (100.0%) living below poverty.
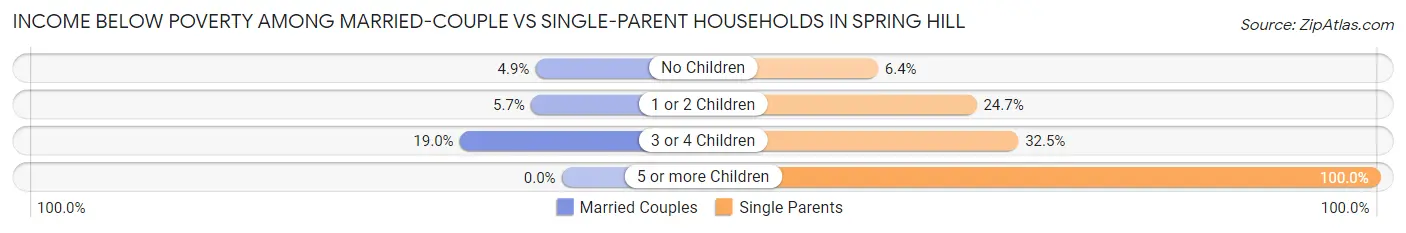
| Children | Married-Couple Families | Single-Parent Households |
| No Children | 701 (4.9%) | 251 (6.4%) |
| 1 or 2 Children | 366 (5.7%) | 976 (24.7%) |
| 3 or 4 Children | 338 (19.0%) | 250 (32.5%) |
| 5 or more Children | 0 (0.0%) | 12 (100.0%) |
| Total | 1,405 (6.2%) | 1,489 (17.2%) |
Race in Spring Hill
The most populous races in Spring Hill are White / Caucasian (89,014 | 76.2%), Hispanic or Latino (23,926 | 20.5%), and Two or more Races (12,521 | 10.7%).
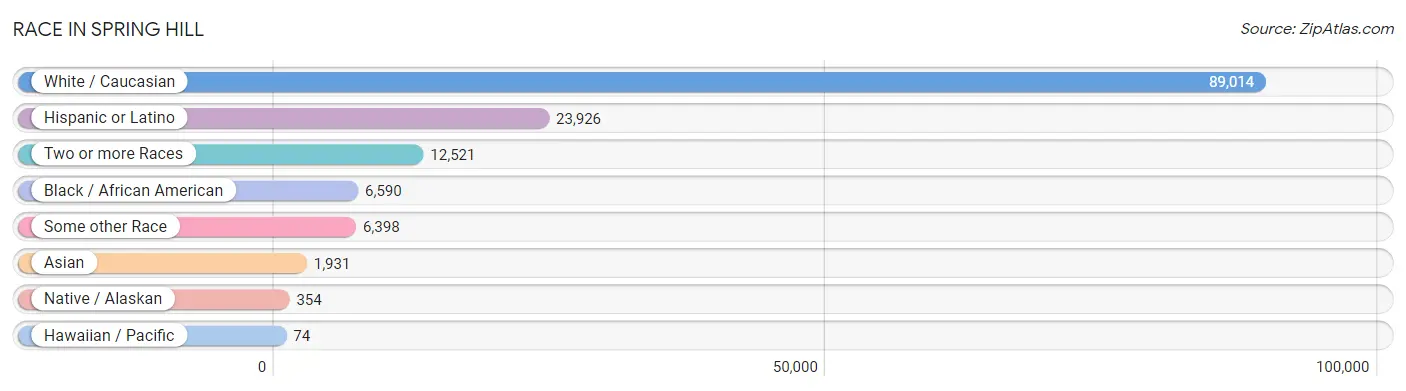
| Race | # Population | % Population |
| Asian | 1,931 | 1.7% |
| Black / African American | 6,590 | 5.6% |
| Hawaiian / Pacific | 74 | 0.1% |
| Hispanic or Latino | 23,926 | 20.5% |
| Native / Alaskan | 354 | 0.3% |
| White / Caucasian | 89,014 | 76.2% |
| Two or more Races | 12,521 | 10.7% |
| Some other Race | 6,398 | 5.5% |
| Total | 116,882 | 100.0% |
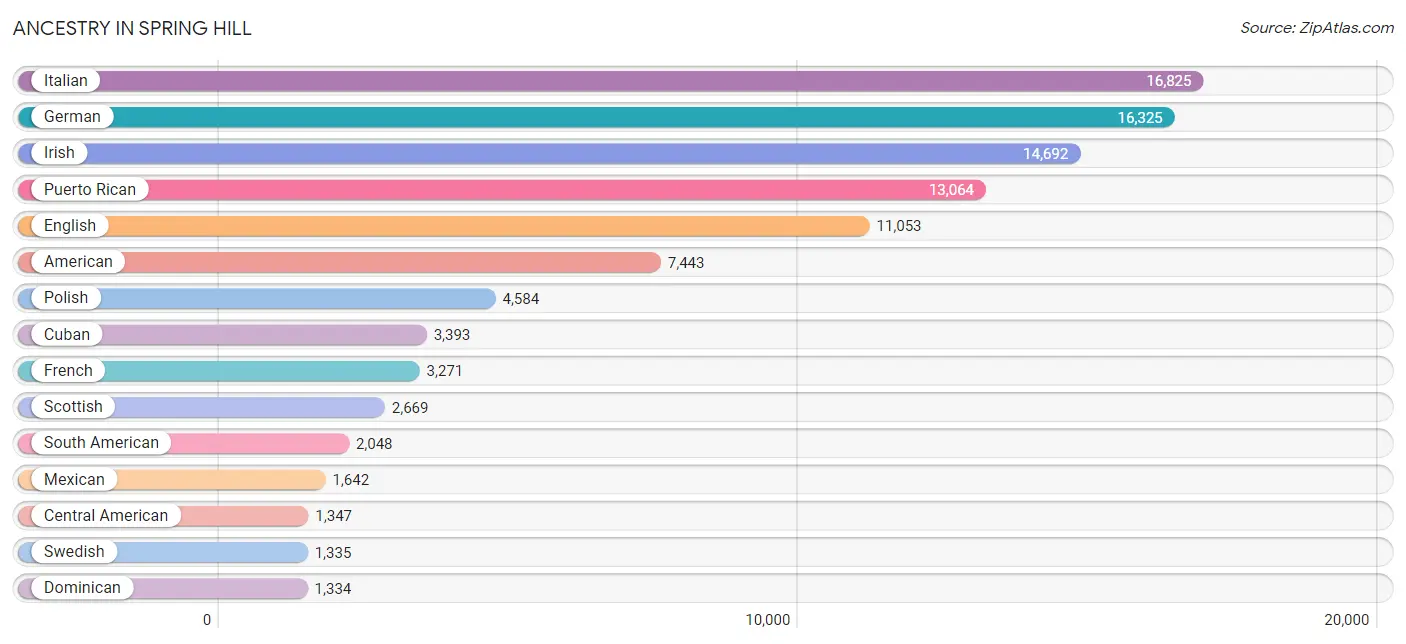
Ancestry in Spring Hill
The most populous ancestries reported in Spring Hill are Italian (16,825 | 14.4%), German (16,325 | 14.0%), Irish (14,692 | 12.6%), Puerto Rican (13,064 | 11.2%), and English (11,053 | 9.5%), together accounting for 61.6% of all Spring Hill residents.
| Ancestry | # Population | % Population |
| African | 290 | 0.3% |
| Albanian | 417 | 0.4% |
| American | 7,443 | 6.4% |
| Apache | 9 | 0.0% |
| Arab | 261 | 0.2% |
| Argentinean | 23 | 0.0% |
| Assyrian / Chaldean / Syriac | 8 | 0.0% |
| Australian | 41 | 0.0% |
| Austrian | 237 | 0.2% |
| Bahamian | 326 | 0.3% |
| Barbadian | 341 | 0.3% |
| Belgian | 137 | 0.1% |
| Belizean | 17 | 0.0% |
| Bhutanese | 198 | 0.2% |
| Blackfeet | 134 | 0.1% |
| Brazilian | 324 | 0.3% |
| British | 416 | 0.4% |
| British West Indian | 66 | 0.1% |
| Burmese | 78 | 0.1% |
| Canadian | 101 | 0.1% |
| Cape Verdean | 39 | 0.0% |
| Celtic | 34 | 0.0% |
| Central American | 1,347 | 1.1% |
| Central American Indian | 57 | 0.1% |
| Cherokee | 472 | 0.4% |
| Chilean | 231 | 0.2% |
| Chippewa | 4 | 0.0% |
| Colombian | 551 | 0.5% |
| Costa Rican | 124 | 0.1% |
| Croatian | 95 | 0.1% |
| Cuban | 3,393 | 2.9% |
| Czech | 351 | 0.3% |
| Czechoslovakian | 118 | 0.1% |
| Danish | 201 | 0.2% |
| Delaware | 10 | 0.0% |
| Dominican | 1,334 | 1.1% |
| Dutch | 1,136 | 1.0% |
| Eastern European | 198 | 0.2% |
| Ecuadorian | 391 | 0.3% |
| Egyptian | 4 | 0.0% |
| English | 11,053 | 9.5% |
| Ethiopian | 17 | 0.0% |
| European | 987 | 0.8% |
| Finnish | 222 | 0.2% |
| French | 3,271 | 2.8% |
| French American Indian | 12 | 0.0% |
| French Canadian | 855 | 0.7% |
| German | 16,325 | 14.0% |
| Greek | 1,067 | 0.9% |
| Guatemalan | 40 | 0.0% |
| Guyanese | 174 | 0.2% |
| Haitian | 279 | 0.2% |
| Honduran | 313 | 0.3% |
| Hungarian | 663 | 0.6% |
| Indian (Asian) | 319 | 0.3% |
| Iranian | 11 | 0.0% |
| Irish | 14,692 | 12.6% |
| Iroquois | 46 | 0.0% |
| Israeli | 62 | 0.1% |
| Italian | 16,825 | 14.4% |
| Jamaican | 868 | 0.7% |
| Korean | 1,141 | 1.0% |
| Latvian | 17 | 0.0% |
| Lebanese | 139 | 0.1% |
| Lithuanian | 365 | 0.3% |
| Malaysian | 170 | 0.2% |
| Maltese | 14 | 0.0% |
| Mexican | 1,642 | 1.4% |
| Native Hawaiian | 198 | 0.2% |
| Nicaraguan | 185 | 0.2% |
| Nigerian | 23 | 0.0% |
| Northern European | 63 | 0.1% |
| Norwegian | 834 | 0.7% |
| Pakistani | 131 | 0.1% |
| Panamanian | 230 | 0.2% |
| Pennsylvania German | 43 | 0.0% |
| Peruvian | 397 | 0.3% |
| Polish | 4,584 | 3.9% |
| Portuguese | 978 | 0.8% |
| Pueblo | 68 | 0.1% |
| Puerto Rican | 13,064 | 11.2% |
| Romanian | 151 | 0.1% |
| Russian | 1,147 | 1.0% |
| Salvadoran | 455 | 0.4% |
| Scandinavian | 418 | 0.4% |
| Scotch-Irish | 787 | 0.7% |
| Scottish | 2,669 | 2.3% |
| Senegalese | 9 | 0.0% |
| Serbian | 42 | 0.0% |
| Sioux | 25 | 0.0% |
| Slavic | 43 | 0.0% |
| Slovak | 127 | 0.1% |
| Slovene | 26 | 0.0% |
| South American | 2,048 | 1.8% |
| South American Indian | 12 | 0.0% |
| Spaniard | 473 | 0.4% |
| Spanish | 153 | 0.1% |
| Sri Lankan | 263 | 0.2% |
| Subsaharan African | 388 | 0.3% |
| Swedish | 1,335 | 1.1% |
| Swiss | 60 | 0.1% |
| Syrian | 17 | 0.0% |
| Thai | 506 | 0.4% |
| Tongan | 17 | 0.0% |
| Trinidadian and Tobagonian | 214 | 0.2% |
| U.S. Virgin Islander | 9 | 0.0% |
| Ugandan | 10 | 0.0% |
| Ukrainian | 373 | 0.3% |
| Uruguayan | 87 | 0.1% |
| Venezuelan | 368 | 0.3% |
| Welsh | 801 | 0.7% |
| West Indian | 284 | 0.2% |
| Yugoslavian | 33 | 0.0% | View All 113 Rows |
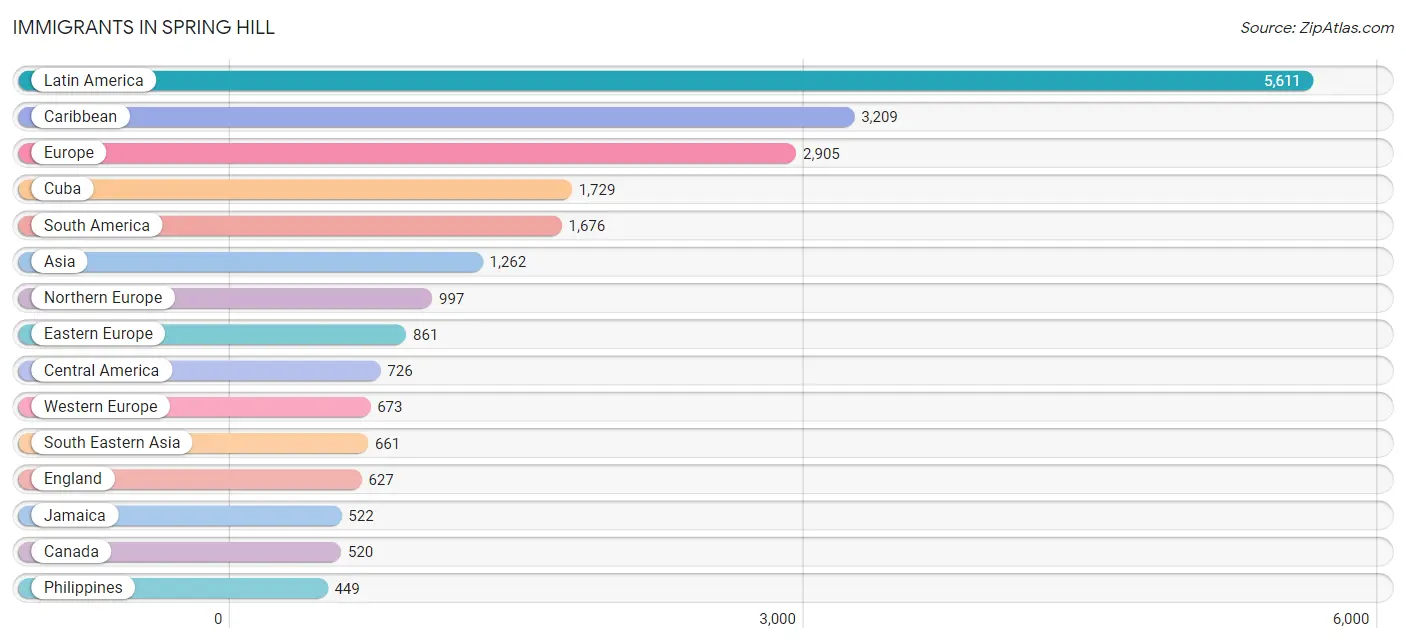
Immigrants in Spring Hill
The most numerous immigrant groups reported in Spring Hill came from Latin America (5,611 | 4.8%), Caribbean (3,209 | 2.8%), Europe (2,905 | 2.5%), Cuba (1,729 | 1.5%), and South America (1,676 | 1.4%), together accounting for 13.0% of all Spring Hill residents.
| Immigration Origin | # Population | % Population |
| Africa | 90 | 0.1% |
| Albania | 184 | 0.2% |
| Asia | 1,262 | 1.1% |
| Austria | 29 | 0.0% |
| Azores | 26 | 0.0% |
| Bahamas | 81 | 0.1% |
| Barbados | 110 | 0.1% |
| Belarus | 14 | 0.0% |
| Belize | 26 | 0.0% |
| Bolivia | 7 | 0.0% |
| Brazil | 150 | 0.1% |
| Canada | 520 | 0.4% |
| Caribbean | 3,209 | 2.8% |
| Central America | 726 | 0.6% |
| Chile | 231 | 0.2% |
| China | 175 | 0.2% |
| Colombia | 441 | 0.4% |
| Costa Rica | 92 | 0.1% |
| Croatia | 6 | 0.0% |
| Cuba | 1,729 | 1.5% |
| Dominican Republic | 384 | 0.3% |
| Eastern Africa | 17 | 0.0% |
| Eastern Asia | 214 | 0.2% |
| Eastern Europe | 861 | 0.7% |
| Ecuador | 111 | 0.1% |
| Egypt | 7 | 0.0% |
| El Salvador | 75 | 0.1% |
| England | 627 | 0.5% |
| Ethiopia | 17 | 0.0% |
| Europe | 2,905 | 2.5% |
| France | 207 | 0.2% |
| Germany | 430 | 0.4% |
| Greece | 22 | 0.0% |
| Grenada | 28 | 0.0% |
| Guyana | 261 | 0.2% |
| Haiti | 52 | 0.0% |
| Honduras | 77 | 0.1% |
| Hungary | 28 | 0.0% |
| India | 204 | 0.2% |
| Indonesia | 25 | 0.0% |
| Iran | 11 | 0.0% |
| Ireland | 77 | 0.1% |
| Italy | 153 | 0.1% |
| Jamaica | 522 | 0.4% |
| Japan | 7 | 0.0% |
| Kazakhstan | 57 | 0.1% |
| Korea | 32 | 0.0% |
| Laos | 24 | 0.0% |
| Latin America | 5,611 | 4.8% |
| Lebanon | 16 | 0.0% |
| Mexico | 231 | 0.2% |
| Middle Africa | 40 | 0.0% |
| Nicaragua | 151 | 0.1% |
| Nigeria | 17 | 0.0% |
| Northern Africa | 16 | 0.0% |
| Northern Europe | 997 | 0.9% |
| Norway | 7 | 0.0% |
| Oceania | 9 | 0.0% |
| Pakistan | 6 | 0.0% |
| Panama | 74 | 0.1% |
| Peru | 167 | 0.1% |
| Philippines | 449 | 0.4% |
| Poland | 253 | 0.2% |
| Portugal | 164 | 0.1% |
| Romania | 14 | 0.0% |
| Russia | 60 | 0.1% |
| Scotland | 93 | 0.1% |
| South America | 1,676 | 1.4% |
| South Central Asia | 325 | 0.3% |
| South Eastern Asia | 661 | 0.6% |
| Southern Europe | 374 | 0.3% |
| Spain | 21 | 0.0% |
| Sri Lanka | 47 | 0.0% |
| St. Vincent and the Grenadines | 33 | 0.0% |
| Sweden | 5 | 0.0% |
| Switzerland | 7 | 0.0% |
| Syria | 38 | 0.0% |
| Taiwan | 3 | 0.0% |
| Thailand | 49 | 0.0% |
| Trinidad and Tobago | 209 | 0.2% |
| Turkey | 8 | 0.0% |
| Ukraine | 92 | 0.1% |
| Uruguay | 49 | 0.0% |
| Venezuela | 259 | 0.2% |
| Vietnam | 114 | 0.1% |
| Western Africa | 17 | 0.0% |
| Western Asia | 62 | 0.1% |
| Western Europe | 673 | 0.6% | View All 88 Rows |
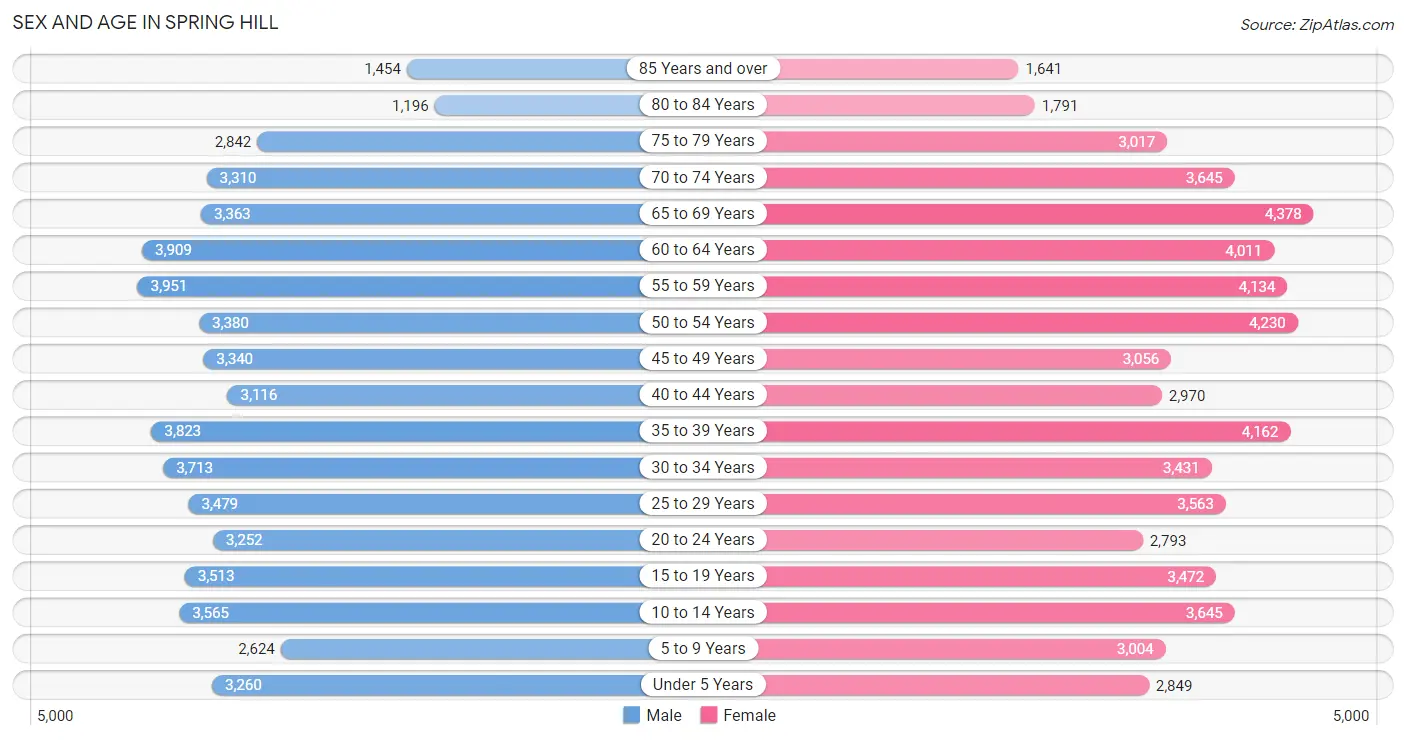
Sex and Age in Spring Hill
Sex and Age in Spring Hill
The most populous age groups in Spring Hill are 55 to 59 Years (3,951 | 6.9%) for men and 65 to 69 Years (4,378 | 7.3%) for women.
| Age Bracket | Male | Female |
| Under 5 Years | 3,260 (5.7%) | 2,849 (4.8%) |
| 5 to 9 Years | 2,624 (4.6%) | 3,004 (5.0%) |
| 10 to 14 Years | 3,565 (6.2%) | 3,645 (6.1%) |
| 15 to 19 Years | 3,513 (6.1%) | 3,472 (5.8%) |
| 20 to 24 Years | 3,252 (5.7%) | 2,793 (4.7%) |
| 25 to 29 Years | 3,479 (6.1%) | 3,563 (6.0%) |
| 30 to 34 Years | 3,713 (6.5%) | 3,431 (5.7%) |
| 35 to 39 Years | 3,823 (6.7%) | 4,162 (7.0%) |
| 40 to 44 Years | 3,116 (5.5%) | 2,970 (5.0%) |
| 45 to 49 Years | 3,340 (5.9%) | 3,056 (5.1%) |
| 50 to 54 Years | 3,380 (5.9%) | 4,230 (7.1%) |
| 55 to 59 Years | 3,951 (6.9%) | 4,134 (6.9%) |
| 60 to 64 Years | 3,909 (6.9%) | 4,011 (6.7%) |
| 65 to 69 Years | 3,363 (5.9%) | 4,378 (7.3%) |
| 70 to 74 Years | 3,310 (5.8%) | 3,645 (6.1%) |
| 75 to 79 Years | 2,842 (5.0%) | 3,017 (5.1%) |
| 80 to 84 Years | 1,196 (2.1%) | 1,791 (3.0%) |
| 85 Years and over | 1,454 (2.5%) | 1,641 (2.7%) |
| Total | 57,090 (100.0%) | 59,792 (100.0%) |
Families and Households in Spring Hill
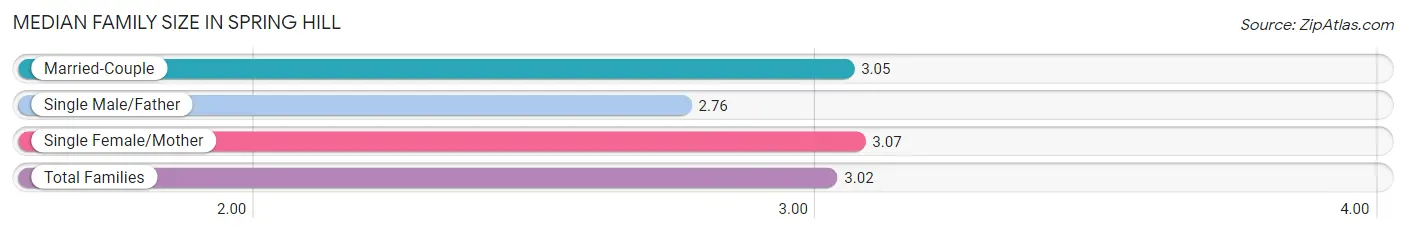
Median Family Size in Spring Hill
The median family size in Spring Hill is 3.02 persons per family, with single female/mother families (5,939 | 19.0%) accounting for the largest median family size of 3.07 persons per family. On the other hand, single male/father families (2,733 | 8.8%) represent the smallest median family size with 2.76 persons per family.
| Family Type | # Families | Family Size |
| Married-Couple | 22,541 (72.2%) | 3.05 |
| Single Male/Father | 2,733 (8.8%) | 2.76 |
| Single Female/Mother | 5,939 (19.0%) | 3.07 |
| Total Families | 31,213 (100.0%) | 3.02 |
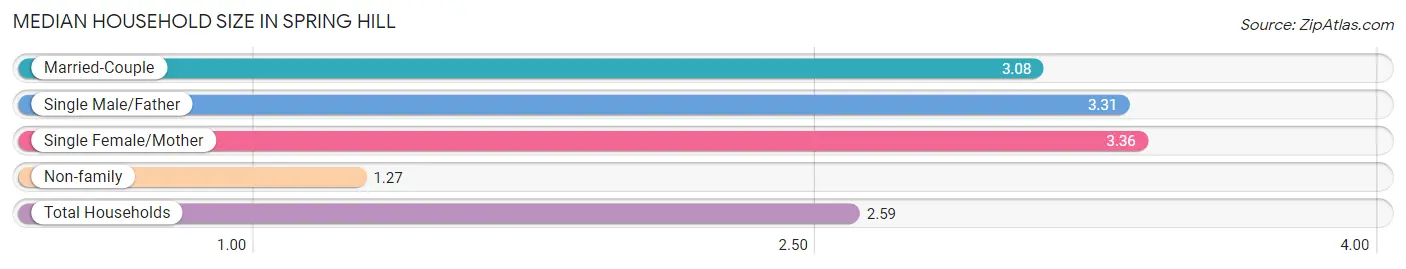
Median Household Size in Spring Hill
The median household size in Spring Hill is 2.59 persons per household, with single female/mother households (5,939 | 13.3%) accounting for the largest median household size of 3.36 persons per household. non-family households (13,412 | 30.0%) represent the smallest median household size with 1.27 persons per household.
| Household Type | # Households | Household Size |
| Married-Couple | 22,541 (50.5%) | 3.08 |
| Single Male/Father | 2,733 (6.1%) | 3.31 |
| Single Female/Mother | 5,939 (13.3%) | 3.36 |
| Non-family | 13,412 (30.0%) | 1.27 |
| Total Households | 44,625 (100.0%) | 2.59 |
Household Size by Marriage Status in Spring Hill
Out of a total of 44,625 households in Spring Hill, 31,213 (70.0%) are family households, while 13,412 (30.0%) are nonfamily households. The most numerous type of family households are 2-person households, comprising 14,286, and the most common type of nonfamily households are 1-person households, comprising 10,568.
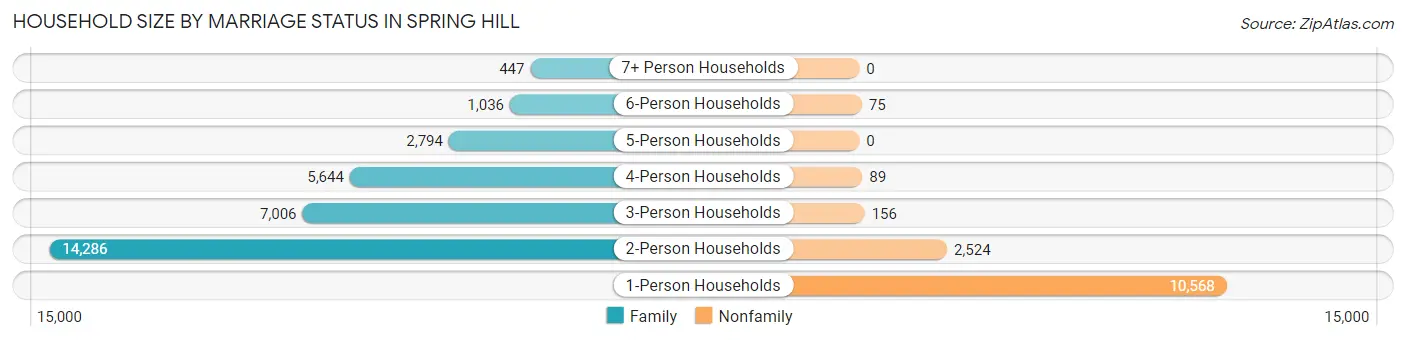
| Household Size | Family Households | Nonfamily Households |
| 1-Person Households | - | 10,568 (23.7%) |
| 2-Person Households | 14,286 (32.0%) | 2,524 (5.7%) |
| 3-Person Households | 7,006 (15.7%) | 156 (0.4%) |
| 4-Person Households | 5,644 (12.7%) | 89 (0.2%) |
| 5-Person Households | 2,794 (6.3%) | 0 (0.0%) |
| 6-Person Households | 1,036 (2.3%) | 75 (0.2%) |
| 7+ Person Households | 447 (1.0%) | 0 (0.0%) |
| Total | 31,213 (70.0%) | 13,412 (30.0%) |
Female Fertility in Spring Hill
Fertility by Age in Spring Hill
Average fertility rate in Spring Hill is 49.0 births per 1,000 women. Women in the age bracket of 20 to 34 years have the highest fertility rate with 89.0 births per 1,000 women. Women in the age bracket of 20 to 34 years acount for 74.0% of all women with births.
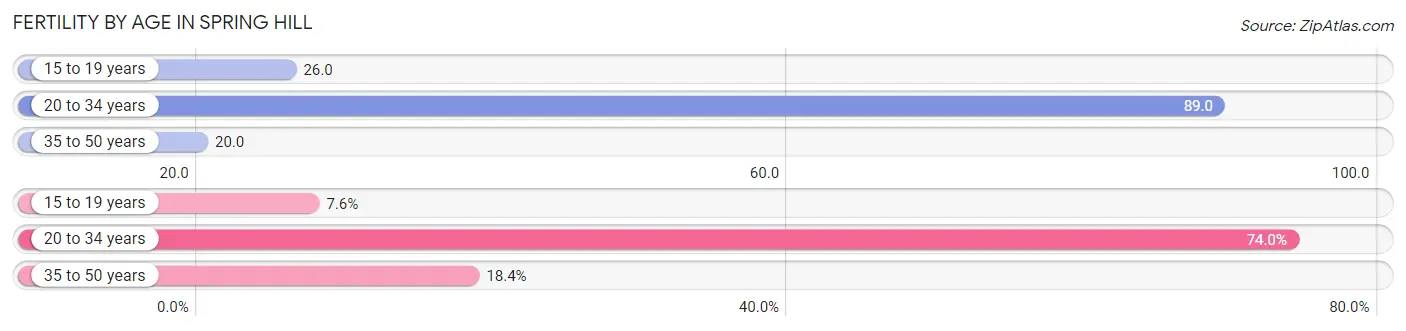
| Age Bracket | Women with Births | Births / 1,000 Women |
| 15 to 19 years | 89 (7.6%) | 26.0 |
| 20 to 34 years | 872 (74.0%) | 89.0 |
| 35 to 50 years | 217 (18.4%) | 20.0 |
| Total | 1,178 (100.0%) | 49.0 |
Fertility by Age by Marriage Status in Spring Hill
63.6% of women with births (1,178) in Spring Hill are married. The highest percentage of unmarried women with births falls into 20 to 34 years age bracket with 40.6% of them unmarried at the time of birth, while the lowest percentage of unmarried women with births belong to 35 to 50 years age bracket with 24.0% of them unmarried.
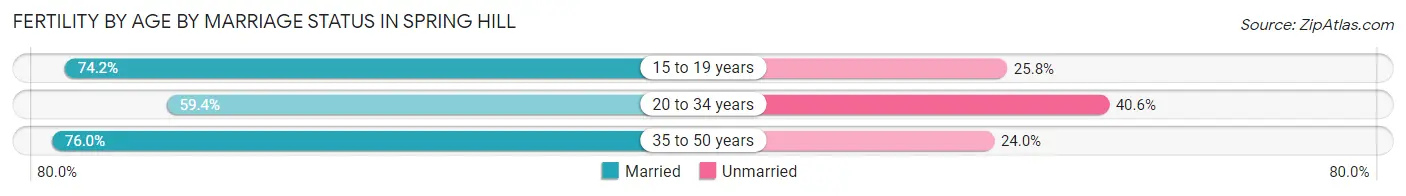
| Age Bracket | Married | Unmarried |
| 15 to 19 years | 66 (74.2%) | 23 (25.8%) |
| 20 to 34 years | 518 (59.4%) | 354 (40.6%) |
| 35 to 50 years | 165 (76.0%) | 52 (24.0%) |
| Total | 749 (63.6%) | 429 (36.4%) |
Fertility by Education in Spring Hill
Average fertility rate in Spring Hill is 49.0 births per 1,000 women. Women with the education attainment of graduate degree have the highest fertility rate of 93.0 births per 1,000 women, while women with the education attainment of college or associate's degree have the lowest fertility at 29.0 births per 1,000 women. Women with the education attainment of high school diploma represent 32.9% of all women with births.
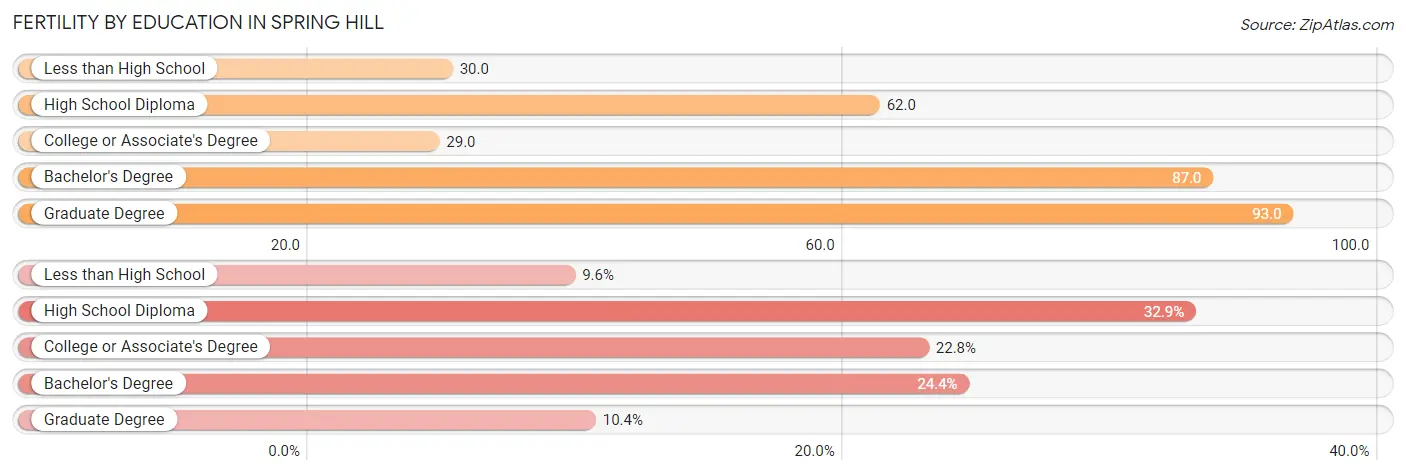
| Educational Attainment | Women with Births | Births / 1,000 Women |
| Less than High School | 113 (9.6%) | 30.0 |
| High School Diploma | 387 (32.9%) | 62.0 |
| College or Associate's Degree | 269 (22.8%) | 29.0 |
| Bachelor's Degree | 287 (24.4%) | 87.0 |
| Graduate Degree | 122 (10.4%) | 93.0 |
| Total | 1,178 (100.0%) | 49.0 |
Fertility by Education by Marriage Status in Spring Hill
36.4% of women with births in Spring Hill are unmarried. Women with the educational attainment of graduate degree are most likely to be married with 100.0% of them married at childbirth, while women with the educational attainment of college or associate's degree are least likely to be married with 54.3% of them unmarried at childbirth.
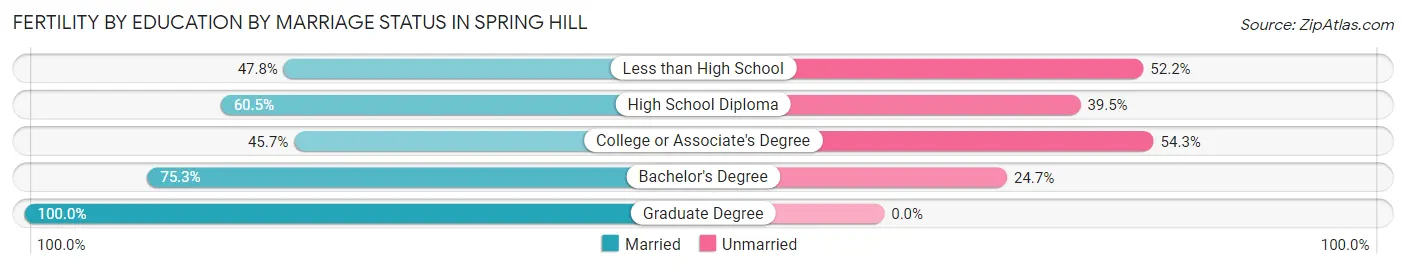
| Educational Attainment | Married | Unmarried |
| Less than High School | 54 (47.8%) | 59 (52.2%) |
| High School Diploma | 234 (60.5%) | 153 (39.5%) |
| College or Associate's Degree | 123 (45.7%) | 146 (54.3%) |
| Bachelor's Degree | 216 (75.3%) | 71 (24.7%) |
| Graduate Degree | 122 (100.0%) | 0 (0.0%) |
| Total | 749 (63.6%) | 429 (36.4%) |
Employment Characteristics in Spring Hill
Employment by Class of Employer in Spring Hill
Among the 47,258 employed individuals in Spring Hill, private company employees (34,651 | 73.3%), local government employees (4,376 | 9.3%), and self-employed (not incorporated) (2,459 | 5.2%) make up the most common classes of employment.
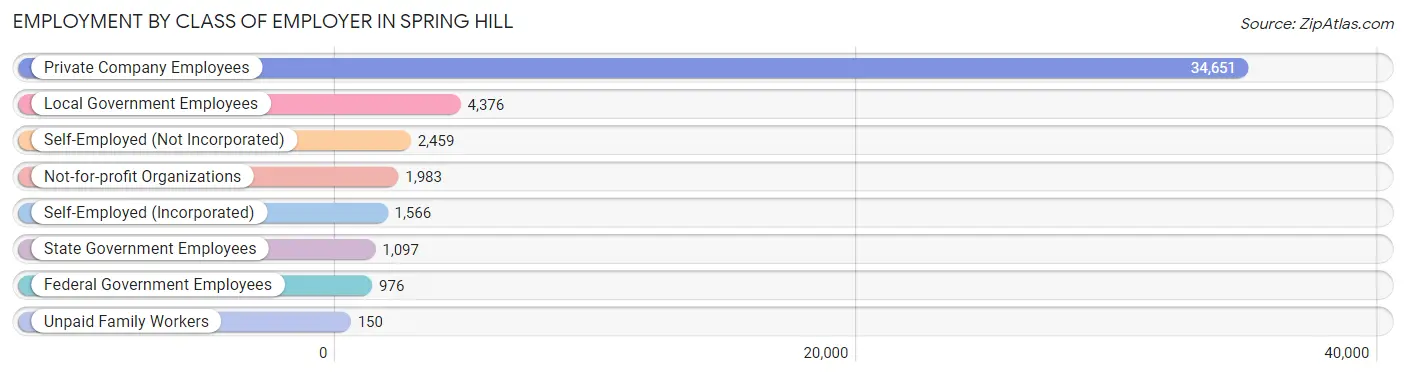
| Employer Class | # Employees | % Employees |
| Private Company Employees | 34,651 | 73.3% |
| Self-Employed (Incorporated) | 1,566 | 3.3% |
| Self-Employed (Not Incorporated) | 2,459 | 5.2% |
| Not-for-profit Organizations | 1,983 | 4.2% |
| Local Government Employees | 4,376 | 9.3% |
| State Government Employees | 1,097 | 2.3% |
| Federal Government Employees | 976 | 2.1% |
| Unpaid Family Workers | 150 | 0.3% |
| Total | 47,258 | 100.0% |
Employment Status by Age in Spring Hill
According to the labor force statistics for Spring Hill, out of the total population over 16 years of age (96,178), 53.5% or 51,455 individuals are in the labor force, with 6.4% or 3,293 of them unemployed. The age group with the highest labor force participation rate is 35 to 44 years, with 81.1% or 11,412 individuals in the labor force. Within the labor force, the 75 years and over age range has the highest percentage of unemployed individuals, with 14.0% or 40 of them being unemployed.
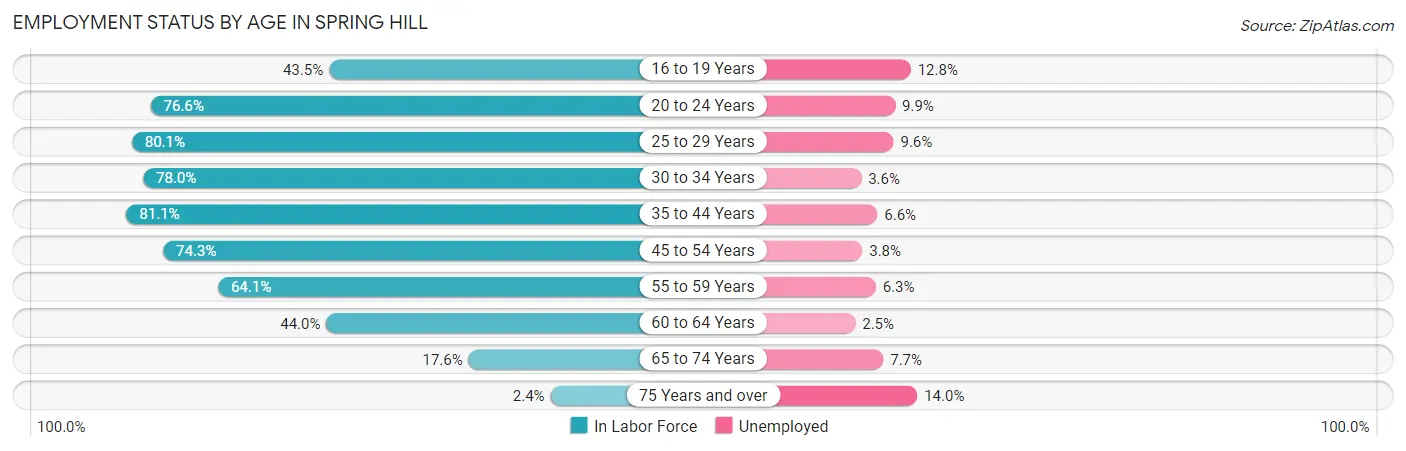
| Age Bracket | In Labor Force | Unemployed |
| 16 to 19 Years | 2,274 (43.5%) | 291 (12.8%) |
| 20 to 24 Years | 4,630 (76.6%) | 458 (9.9%) |
| 25 to 29 Years | 5,641 (80.1%) | 542 (9.6%) |
| 30 to 34 Years | 5,572 (78.0%) | 201 (3.6%) |
| 35 to 44 Years | 11,412 (81.1%) | 753 (6.6%) |
| 45 to 54 Years | 10,406 (74.3%) | 395 (3.8%) |
| 55 to 59 Years | 5,182 (64.1%) | 326 (6.3%) |
| 60 to 64 Years | 3,485 (44.0%) | 87 (2.5%) |
| 65 to 74 Years | 2,586 (17.6%) | 199 (7.7%) |
| 75 Years and over | 287 (2.4%) | 40 (14.0%) |
| Total | 51,455 (53.5%) | 3,293 (6.4%) |
Employment Status by Educational Attainment in Spring Hill
According to labor force statistics for Spring Hill, 71.6% of individuals (41,720) out of the total population between 25 and 64 years of age (58,268) are in the labor force, with 5.5% or 2,295 of them being unemployed. The group with the highest labor force participation rate are those with the educational attainment of bachelor's degree or higher, with 83.9% or 9,885 individuals in the labor force. Within the labor force, individuals with less than high school education have the highest percentage of unemployment, with 7.8% or 233 of them being unemployed.
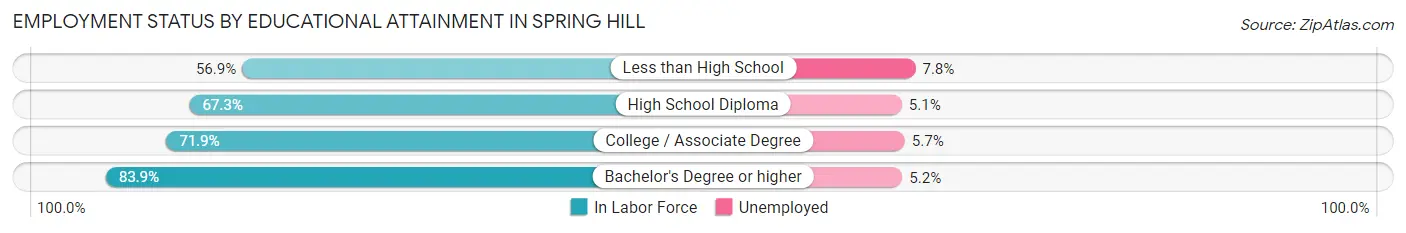
| Educational Attainment | In Labor Force | Unemployed |
| Less than High School | 2,988 (56.9%) | 410 (7.8%) |
| High School Diploma | 11,848 (67.3%) | 898 (5.1%) |
| College / Associate Degree | 16,990 (71.9%) | 1,347 (5.7%) |
| Bachelor's Degree or higher | 9,885 (83.9%) | 613 (5.2%) |
| Total | 41,720 (71.6%) | 3,205 (5.5%) |
Employment Occupations by Sex in Spring Hill
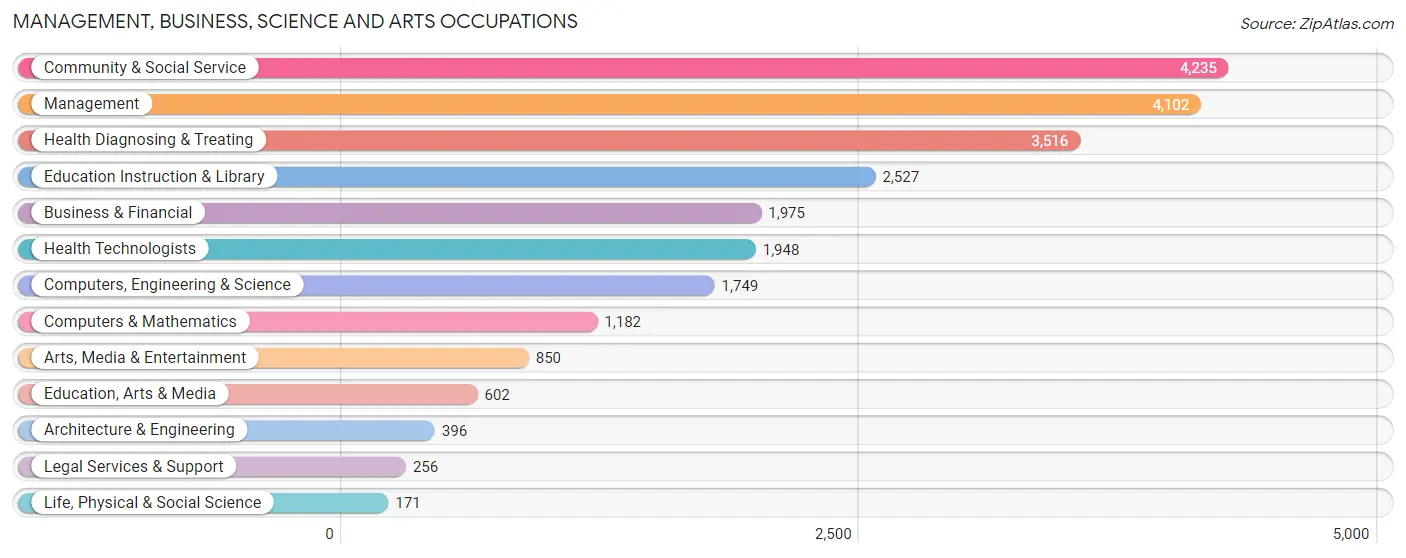
Management, Business, Science and Arts Occupations
The most common Management, Business, Science and Arts occupations in Spring Hill are Community & Social Service (4,235 | 8.8%), Management (4,102 | 8.5%), Health Diagnosing & Treating (3,516 | 7.3%), Education Instruction & Library (2,527 | 5.2%), and Business & Financial (1,975 | 4.1%).
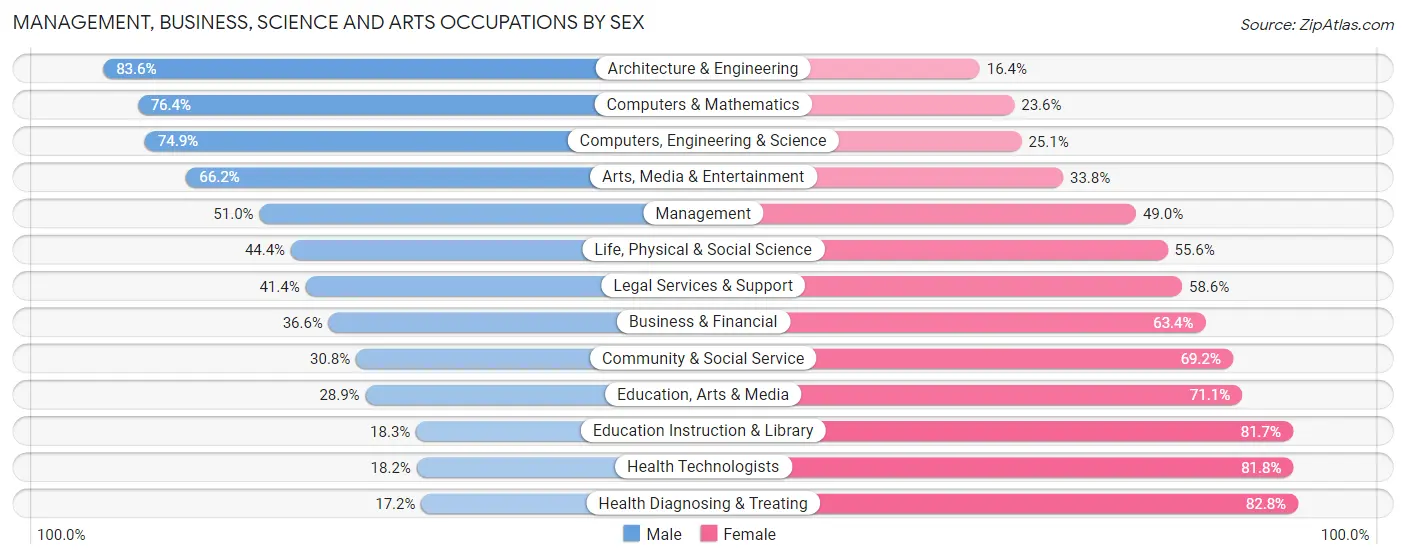
Management, Business, Science and Arts Occupations by Sex
Within the Management, Business, Science and Arts occupations in Spring Hill, the most male-oriented occupations are Architecture & Engineering (83.6%), Computers & Mathematics (76.4%), and Computers, Engineering & Science (74.9%), while the most female-oriented occupations are Health Diagnosing & Treating (82.8%), Health Technologists (81.8%), and Education Instruction & Library (81.7%).
| Occupation | Male | Female |
| Management | 2,093 (51.0%) | 2,009 (49.0%) |
| Business & Financial | 722 (36.6%) | 1,253 (63.4%) |
| Computers, Engineering & Science | 1,310 (74.9%) | 439 (25.1%) |
| Computers & Mathematics | 903 (76.4%) | 279 (23.6%) |
| Architecture & Engineering | 331 (83.6%) | 65 (16.4%) |
| Life, Physical & Social Science | 76 (44.4%) | 95 (55.6%) |
| Community & Social Service | 1,306 (30.8%) | 2,929 (69.2%) |
| Education, Arts & Media | 174 (28.9%) | 428 (71.1%) |
| Legal Services & Support | 106 (41.4%) | 150 (58.6%) |
| Education Instruction & Library | 463 (18.3%) | 2,064 (81.7%) |
| Arts, Media & Entertainment | 563 (66.2%) | 287 (33.8%) |
| Health Diagnosing & Treating | 606 (17.2%) | 2,910 (82.8%) |
| Health Technologists | 355 (18.2%) | 1,593 (81.8%) |
| Total (Category) | 6,037 (38.8%) | 9,540 (61.2%) |
| Total (Overall) | 24,798 (51.5%) | 23,333 (48.5%) |
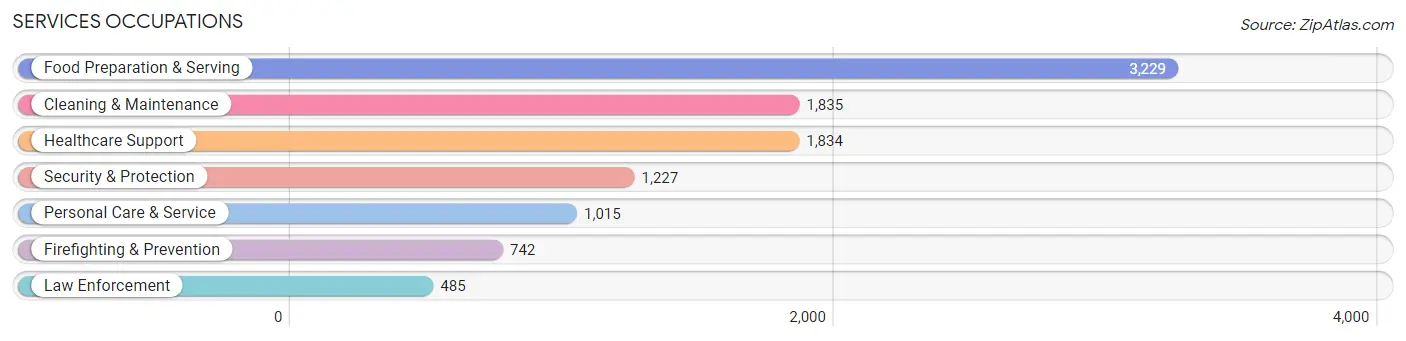
Services Occupations
The most common Services occupations in Spring Hill are Food Preparation & Serving (3,229 | 6.7%), Cleaning & Maintenance (1,835 | 3.8%), Healthcare Support (1,834 | 3.8%), Security & Protection (1,227 | 2.5%), and Personal Care & Service (1,015 | 2.1%).
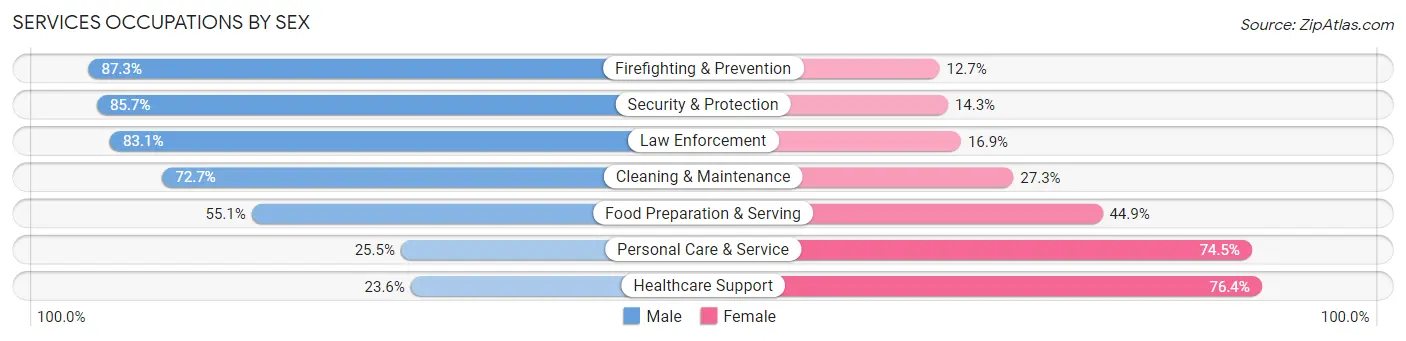
Services Occupations by Sex
Within the Services occupations in Spring Hill, the most male-oriented occupations are Firefighting & Prevention (87.3%), Security & Protection (85.7%), and Law Enforcement (83.1%), while the most female-oriented occupations are Healthcare Support (76.4%), Personal Care & Service (74.5%), and Food Preparation & Serving (44.9%).
| Occupation | Male | Female |
| Healthcare Support | 432 (23.6%) | 1,402 (76.4%) |
| Security & Protection | 1,051 (85.7%) | 176 (14.3%) |
| Firefighting & Prevention | 648 (87.3%) | 94 (12.7%) |
| Law Enforcement | 403 (83.1%) | 82 (16.9%) |
| Food Preparation & Serving | 1,778 (55.1%) | 1,451 (44.9%) |
| Cleaning & Maintenance | 1,334 (72.7%) | 501 (27.3%) |
| Personal Care & Service | 259 (25.5%) | 756 (74.5%) |
| Total (Category) | 4,854 (53.1%) | 4,286 (46.9%) |
| Total (Overall) | 24,798 (51.5%) | 23,333 (48.5%) |
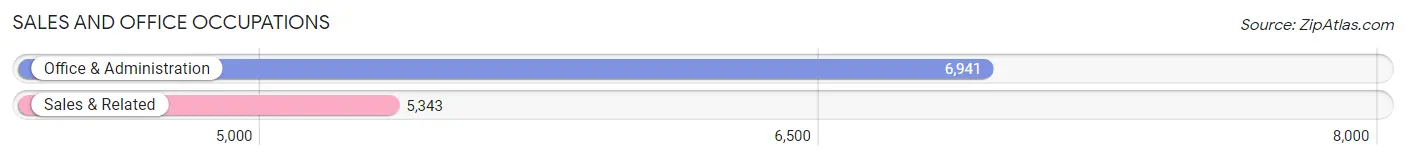
Sales and Office Occupations
The most common Sales and Office occupations in Spring Hill are Office & Administration (6,941 | 14.4%), and Sales & Related (5,343 | 11.1%).
Sales and Office Occupations by Sex
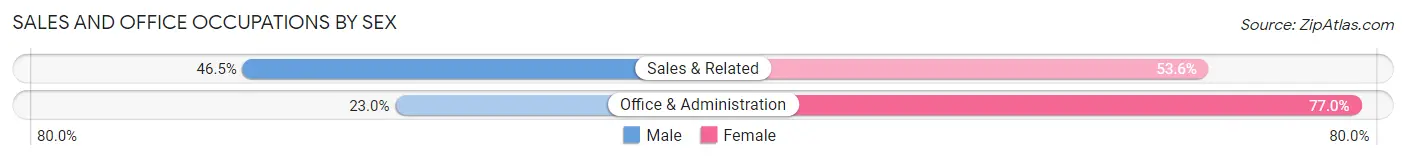
| Occupation | Male | Female |
| Sales & Related | 2,482 (46.5%) | 2,861 (53.5%) |
| Office & Administration | 1,595 (23.0%) | 5,346 (77.0%) |
| Total (Category) | 4,077 (33.2%) | 8,207 (66.8%) |
| Total (Overall) | 24,798 (51.5%) | 23,333 (48.5%) |
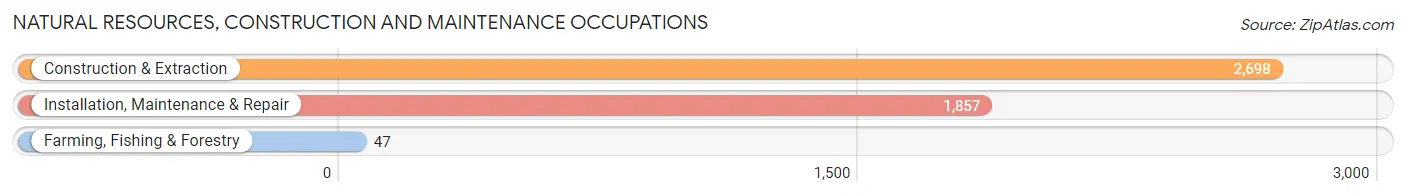
Natural Resources, Construction and Maintenance Occupations
The most common Natural Resources, Construction and Maintenance occupations in Spring Hill are Construction & Extraction (2,698 | 5.6%), Installation, Maintenance & Repair (1,857 | 3.9%), and Farming, Fishing & Forestry (47 | 0.1%).
Natural Resources, Construction and Maintenance Occupations by Sex
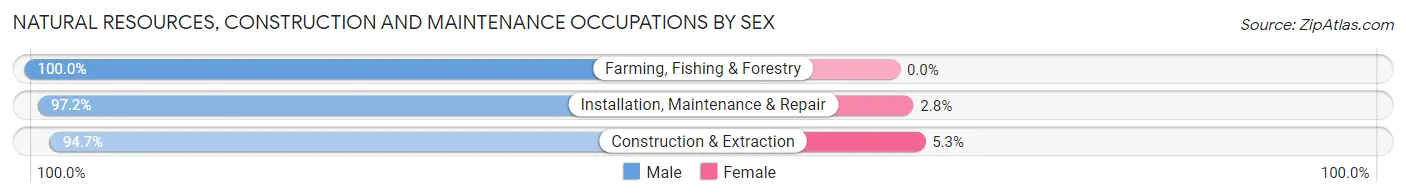
| Occupation | Male | Female |
| Farming, Fishing & Forestry | 47 (100.0%) | 0 (0.0%) |
| Construction & Extraction | 2,556 (94.7%) | 142 (5.3%) |
| Installation, Maintenance & Repair | 1,805 (97.2%) | 52 (2.8%) |
| Total (Category) | 4,408 (95.8%) | 194 (4.2%) |
| Total (Overall) | 24,798 (51.5%) | 23,333 (48.5%) |
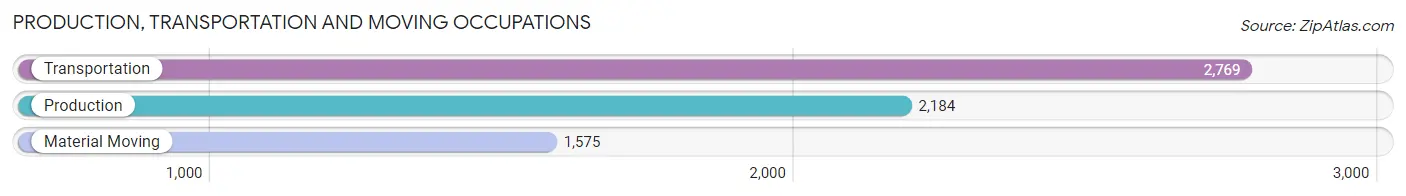
Production, Transportation and Moving Occupations
The most common Production, Transportation and Moving occupations in Spring Hill are Transportation (2,769 | 5.8%), Production (2,184 | 4.5%), and Material Moving (1,575 | 3.3%).
Production, Transportation and Moving Occupations by Sex
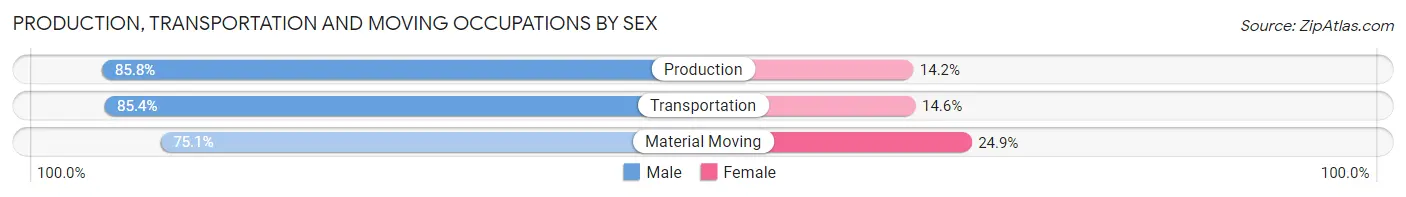
| Occupation | Male | Female |
| Production | 1,874 (85.8%) | 310 (14.2%) |
| Transportation | 2,365 (85.4%) | 404 (14.6%) |
| Material Moving | 1,183 (75.1%) | 392 (24.9%) |
| Total (Category) | 5,422 (83.1%) | 1,106 (16.9%) |
| Total (Overall) | 24,798 (51.5%) | 23,333 (48.5%) |
Employment Industries by Sex in Spring Hill
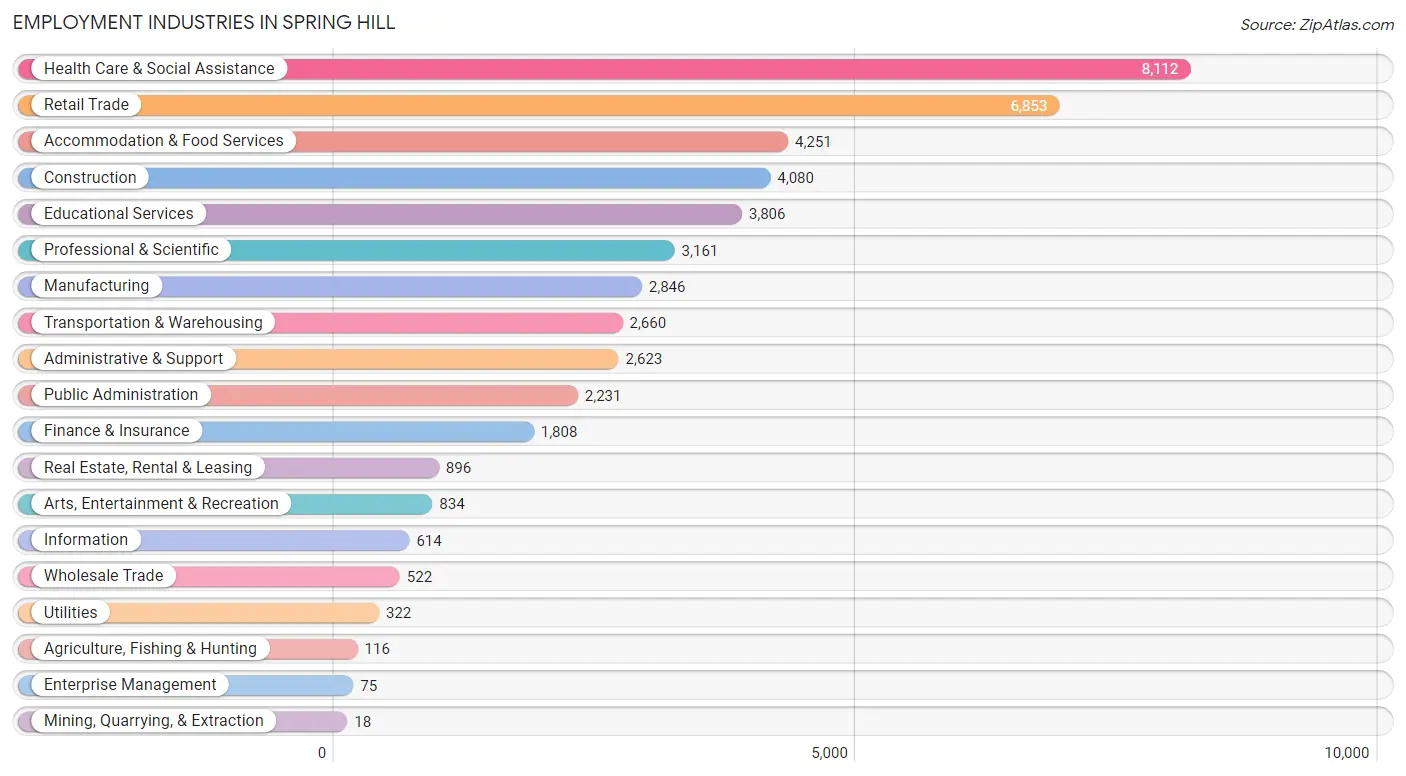
Employment Industries in Spring Hill
The major employment industries in Spring Hill include Health Care & Social Assistance (8,112 | 16.9%), Retail Trade (6,853 | 14.2%), Accommodation & Food Services (4,251 | 8.8%), Construction (4,080 | 8.5%), and Educational Services (3,806 | 7.9%).
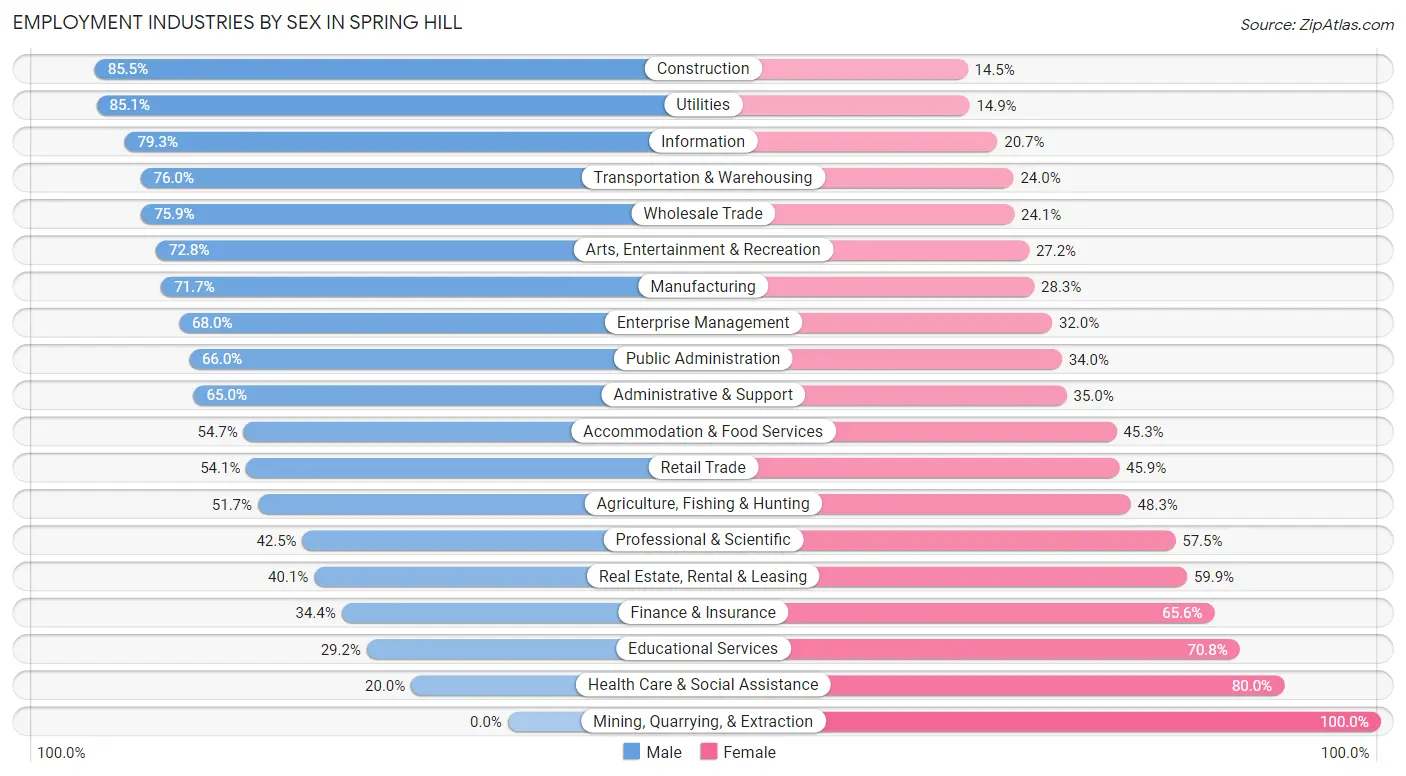
Employment Industries by Sex in Spring Hill
The Spring Hill industries that see more men than women are Construction (85.5%), Utilities (85.1%), and Information (79.3%), whereas the industries that tend to have a higher number of women are Mining, Quarrying, & Extraction (100.0%), Health Care & Social Assistance (80.0%), and Educational Services (70.8%).
| Industry | Male | Female |
| Agriculture, Fishing & Hunting | 60 (51.7%) | 56 (48.3%) |
| Mining, Quarrying, & Extraction | 0 (0.0%) | 18 (100.0%) |
| Construction | 3,487 (85.5%) | 593 (14.5%) |
| Manufacturing | 2,041 (71.7%) | 805 (28.3%) |
| Wholesale Trade | 396 (75.9%) | 126 (24.1%) |
| Retail Trade | 3,709 (54.1%) | 3,144 (45.9%) |
| Transportation & Warehousing | 2,021 (76.0%) | 639 (24.0%) |
| Utilities | 274 (85.1%) | 48 (14.9%) |
| Information | 487 (79.3%) | 127 (20.7%) |
| Finance & Insurance | 622 (34.4%) | 1,186 (65.6%) |
| Real Estate, Rental & Leasing | 359 (40.1%) | 537 (59.9%) |
| Professional & Scientific | 1,343 (42.5%) | 1,818 (57.5%) |
| Enterprise Management | 51 (68.0%) | 24 (32.0%) |
| Administrative & Support | 1,705 (65.0%) | 918 (35.0%) |
| Educational Services | 1,111 (29.2%) | 2,695 (70.8%) |
| Health Care & Social Assistance | 1,622 (20.0%) | 6,490 (80.0%) |
| Arts, Entertainment & Recreation | 607 (72.8%) | 227 (27.2%) |
| Accommodation & Food Services | 2,324 (54.7%) | 1,927 (45.3%) |
| Public Administration | 1,472 (66.0%) | 759 (34.0%) |
| Total | 24,798 (51.5%) | 23,333 (48.5%) |
Education in Spring Hill
School Enrollment in Spring Hill
The most common levels of schooling among the 24,381 students in Spring Hill are high school (5,841 | 24.0%), middle school (5,731 | 23.5%), and college / undergraduate (5,056 | 20.7%).
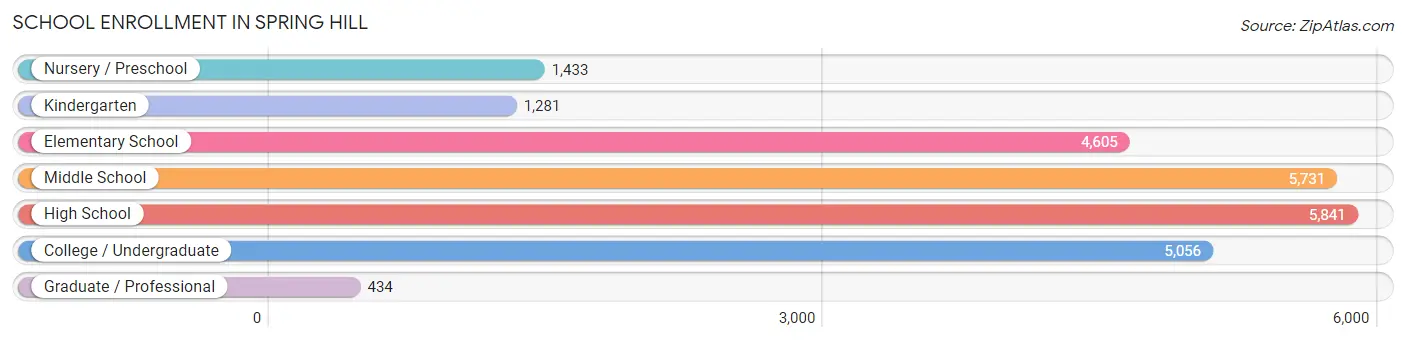
| School Level | # Students | % Students |
| Nursery / Preschool | 1,433 | 5.9% |
| Kindergarten | 1,281 | 5.2% |
| Elementary School | 4,605 | 18.9% |
| Middle School | 5,731 | 23.5% |
| High School | 5,841 | 24.0% |
| College / Undergraduate | 5,056 | 20.7% |
| Graduate / Professional | 434 | 1.8% |
| Total | 24,381 | 100.0% |
School Enrollment by Age by Funding Source in Spring Hill
Out of a total of 24,381 students who are enrolled in schools in Spring Hill, 4,047 (16.6%) attend a private institution, while the remaining 20,334 (83.4%) are enrolled in public schools. The age group of 3 to 4 year olds has the highest likelihood of being enrolled in private schools, with 424 (36.1% in the age bracket) enrolled. Conversely, the age group of 10 to 14 year olds has the lowest likelihood of being enrolled in a private school, with 6,457 (90.0% in the age bracket) attending a public institution.
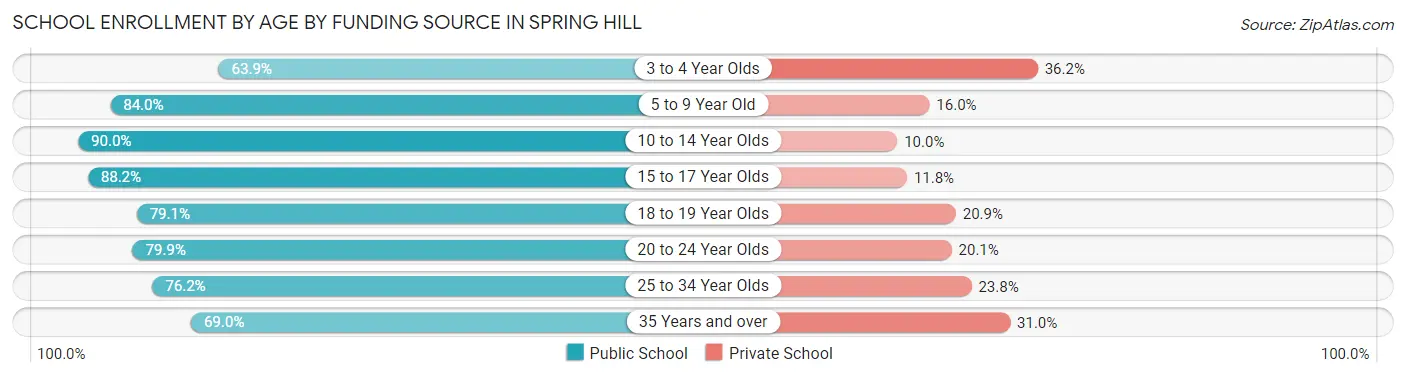
| Age Bracket | Public School | Private School |
| 3 to 4 Year Olds | 749 (63.8%) | 424 (36.1%) |
| 5 to 9 Year Old | 4,493 (84.0%) | 854 (16.0%) |
| 10 to 14 Year Olds | 6,457 (90.0%) | 716 (10.0%) |
| 15 to 17 Year Olds | 3,927 (88.2%) | 525 (11.8%) |
| 18 to 19 Year Olds | 1,193 (79.1%) | 315 (20.9%) |
| 20 to 24 Year Olds | 1,252 (79.9%) | 315 (20.1%) |
| 25 to 34 Year Olds | 973 (76.2%) | 304 (23.8%) |
| 35 Years and over | 1,300 (69.0%) | 584 (31.0%) |
| Total | 20,334 (83.4%) | 4,047 (16.6%) |
Educational Attainment by Field of Study in Spring Hill
Business (3,755 | 21.8%), education (2,775 | 16.1%), science & technology (2,280 | 13.2%), engineering (1,018 | 5.9%), and arts & humanities (980 | 5.7%) are the most common fields of study among 17,242 individuals in Spring Hill who have obtained a bachelor's degree or higher.
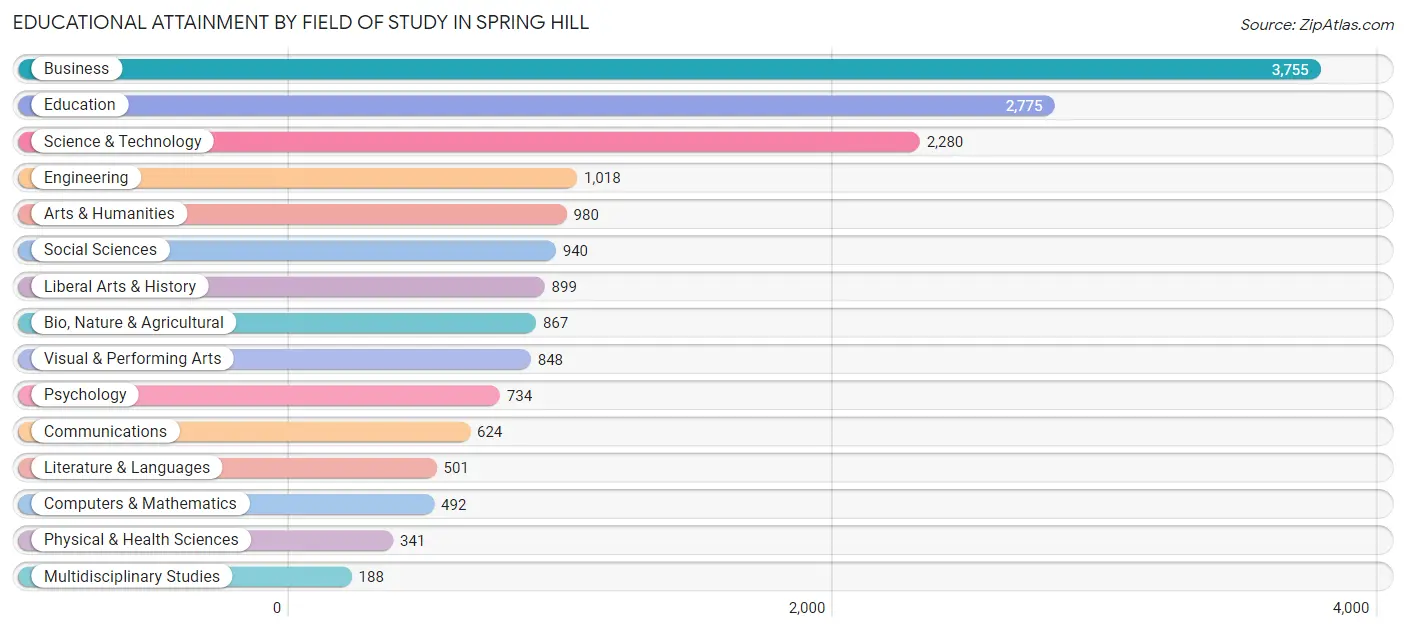
| Field of Study | # Graduates | % Graduates |
| Computers & Mathematics | 492 | 2.9% |
| Bio, Nature & Agricultural | 867 | 5.0% |
| Physical & Health Sciences | 341 | 2.0% |
| Psychology | 734 | 4.3% |
| Social Sciences | 940 | 5.4% |
| Engineering | 1,018 | 5.9% |
| Multidisciplinary Studies | 188 | 1.1% |
| Science & Technology | 2,280 | 13.2% |
| Business | 3,755 | 21.8% |
| Education | 2,775 | 16.1% |
| Literature & Languages | 501 | 2.9% |
| Liberal Arts & History | 899 | 5.2% |
| Visual & Performing Arts | 848 | 4.9% |
| Communications | 624 | 3.6% |
| Arts & Humanities | 980 | 5.7% |
| Total | 17,242 | 100.0% |
Transportation & Commute in Spring Hill
Vehicle Availability by Sex in Spring Hill
The most prevalent vehicle ownership categories in Spring Hill are males with 2 vehicles (10,920, accounting for 44.8%) and females with 2 vehicles (10,293, making up 47.8%).
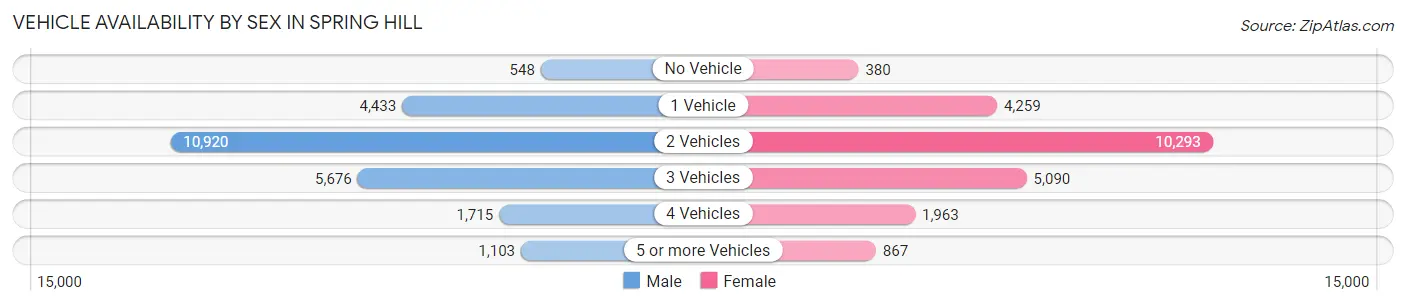
| Vehicles Available | Male | Female |
| No Vehicle | 548 (2.2%) | 380 (1.7%) |
| 1 Vehicle | 4,433 (18.2%) | 4,259 (18.6%) |
| 2 Vehicles | 10,920 (44.8%) | 10,293 (45.0%) |
| 3 Vehicles | 5,676 (23.3%) | 5,090 (22.3%) |
| 4 Vehicles | 1,715 (7.0%) | 1,963 (8.6%) |
| 5 or more Vehicles | 1,103 (4.5%) | 867 (3.8%) |
| Total | 24,395 (100.0%) | 22,852 (100.0%) |
Commute Time in Spring Hill
The most frequently occuring commute durations in Spring Hill are 15 to 19 minutes (7,491 commuters, 17.8%), 10 to 14 minutes (5,751 commuters, 13.7%), and 45 to 59 minutes (5,269 commuters, 12.5%).
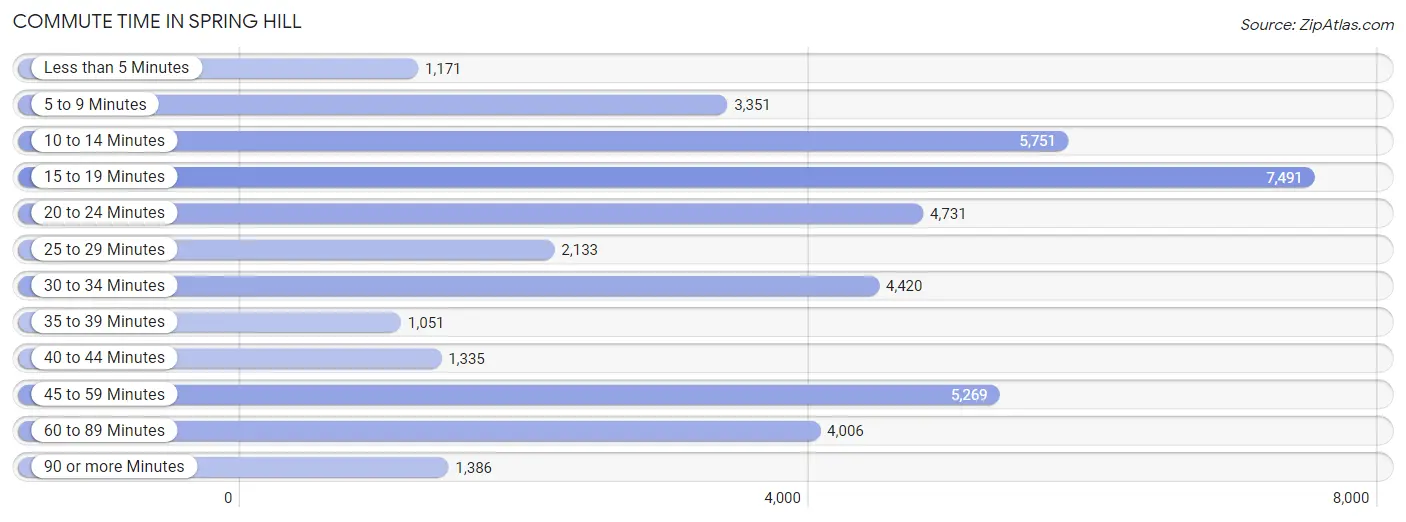
| Commute Time | # Commuters | % Commuters |
| Less than 5 Minutes | 1,171 | 2.8% |
| 5 to 9 Minutes | 3,351 | 8.0% |
| 10 to 14 Minutes | 5,751 | 13.7% |
| 15 to 19 Minutes | 7,491 | 17.8% |
| 20 to 24 Minutes | 4,731 | 11.2% |
| 25 to 29 Minutes | 2,133 | 5.1% |
| 30 to 34 Minutes | 4,420 | 10.5% |
| 35 to 39 Minutes | 1,051 | 2.5% |
| 40 to 44 Minutes | 1,335 | 3.2% |
| 45 to 59 Minutes | 5,269 | 12.5% |
| 60 to 89 Minutes | 4,006 | 9.5% |
| 90 or more Minutes | 1,386 | 3.3% |
Commute Time by Sex in Spring Hill
The most common commute times in Spring Hill are 15 to 19 minutes (3,710 commuters, 16.5%) for males and 15 to 19 minutes (3,781 commuters, 19.3%) for females.
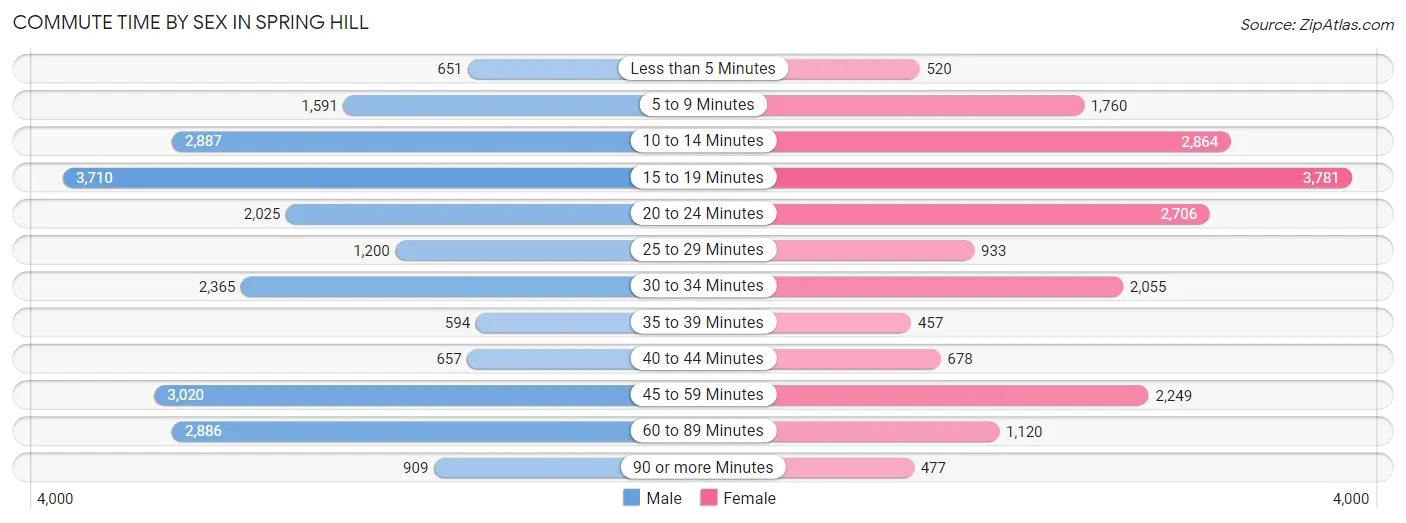
| Commute Time | Male | Female |
| Less than 5 Minutes | 651 (2.9%) | 520 (2.6%) |
| 5 to 9 Minutes | 1,591 (7.1%) | 1,760 (9.0%) |
| 10 to 14 Minutes | 2,887 (12.8%) | 2,864 (14.6%) |
| 15 to 19 Minutes | 3,710 (16.5%) | 3,781 (19.3%) |
| 20 to 24 Minutes | 2,025 (9.0%) | 2,706 (13.8%) |
| 25 to 29 Minutes | 1,200 (5.3%) | 933 (4.8%) |
| 30 to 34 Minutes | 2,365 (10.5%) | 2,055 (10.5%) |
| 35 to 39 Minutes | 594 (2.6%) | 457 (2.3%) |
| 40 to 44 Minutes | 657 (2.9%) | 678 (3.5%) |
| 45 to 59 Minutes | 3,020 (13.4%) | 2,249 (11.5%) |
| 60 to 89 Minutes | 2,886 (12.8%) | 1,120 (5.7%) |
| 90 or more Minutes | 909 (4.0%) | 477 (2.4%) |
Time of Departure to Work by Sex in Spring Hill
The most frequent times of departure to work in Spring Hill are 7:00 AM to 7:29 AM (2,962, 13.2%) for males and 7:00 AM to 7:29 AM (3,114, 15.9%) for females.
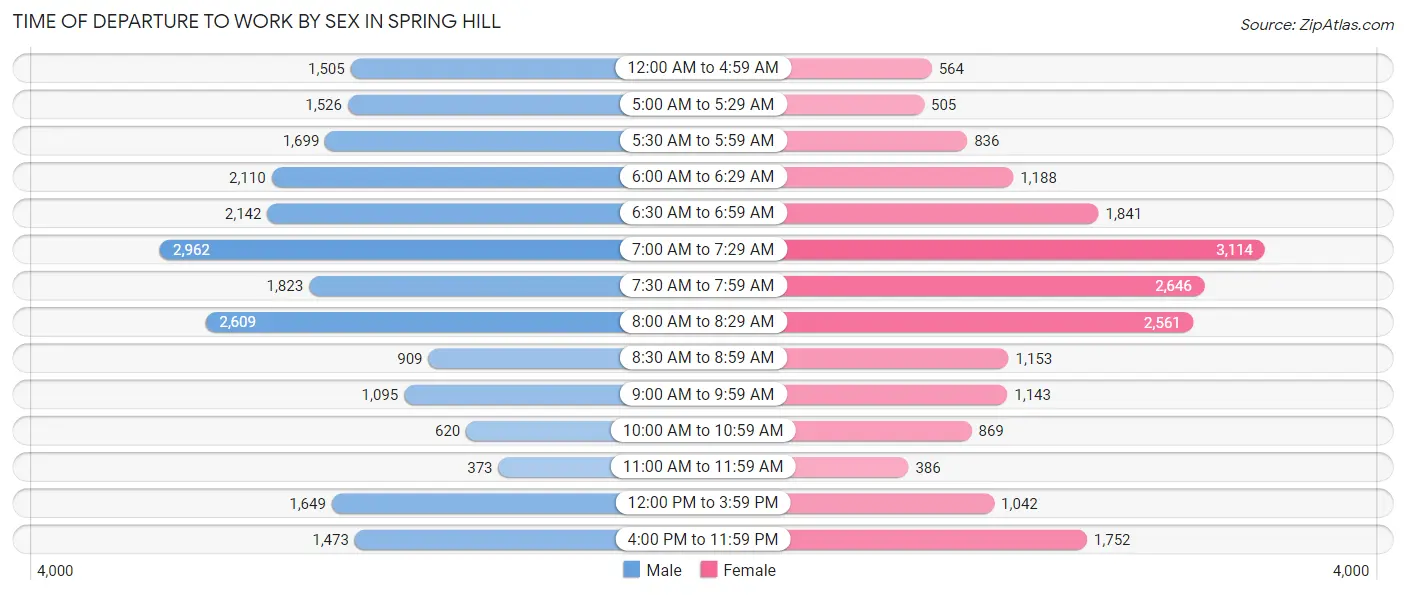
| Time of Departure | Male | Female |
| 12:00 AM to 4:59 AM | 1,505 (6.7%) | 564 (2.9%) |
| 5:00 AM to 5:29 AM | 1,526 (6.8%) | 505 (2.6%) |
| 5:30 AM to 5:59 AM | 1,699 (7.5%) | 836 (4.3%) |
| 6:00 AM to 6:29 AM | 2,110 (9.4%) | 1,188 (6.1%) |
| 6:30 AM to 6:59 AM | 2,142 (9.5%) | 1,841 (9.4%) |
| 7:00 AM to 7:29 AM | 2,962 (13.2%) | 3,114 (15.9%) |
| 7:30 AM to 7:59 AM | 1,823 (8.1%) | 2,646 (13.5%) |
| 8:00 AM to 8:29 AM | 2,609 (11.6%) | 2,561 (13.1%) |
| 8:30 AM to 8:59 AM | 909 (4.0%) | 1,153 (5.9%) |
| 9:00 AM to 9:59 AM | 1,095 (4.9%) | 1,143 (5.8%) |
| 10:00 AM to 10:59 AM | 620 (2.8%) | 869 (4.4%) |
| 11:00 AM to 11:59 AM | 373 (1.7%) | 386 (2.0%) |
| 12:00 PM to 3:59 PM | 1,649 (7.3%) | 1,042 (5.3%) |
| 4:00 PM to 11:59 PM | 1,473 (6.6%) | 1,752 (8.9%) |
| Total | 22,495 (100.0%) | 19,600 (100.0%) |
Housing Occupancy in Spring Hill
Occupancy by Ownership in Spring Hill
Of the total 44,625 dwellings in Spring Hill, owner-occupied units account for 34,772 (77.9%), while renter-occupied units make up 9,853 (22.1%).
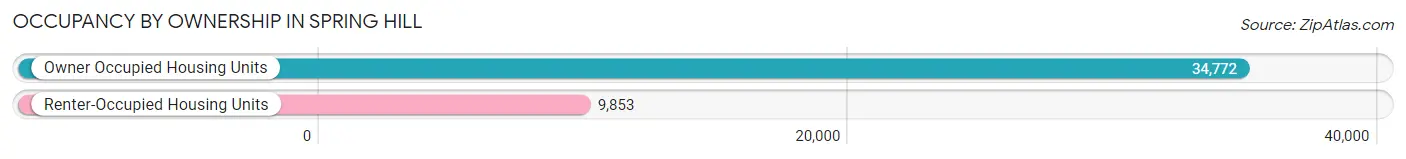
| Occupancy | # Housing Units | % Housing Units |
| Owner Occupied Housing Units | 34,772 | 77.9% |
| Renter-Occupied Housing Units | 9,853 | 22.1% |
| Total Occupied Housing Units | 44,625 | 100.0% |
Occupancy by Household Size in Spring Hill
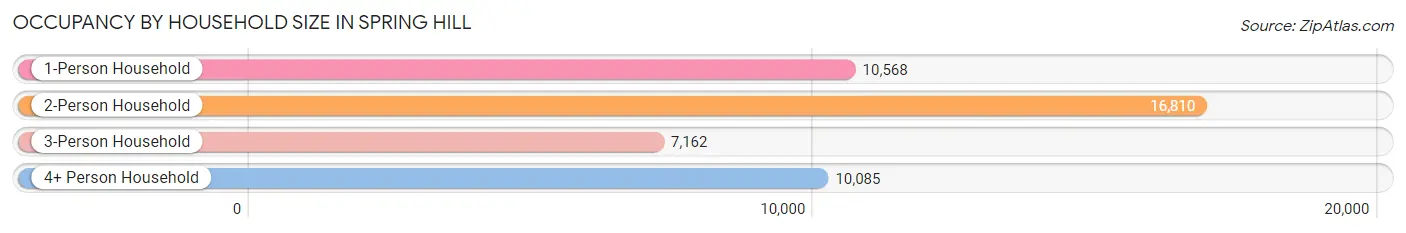
| Household Size | # Housing Units | % Housing Units |
| 1-Person Household | 10,568 | 23.7% |
| 2-Person Household | 16,810 | 37.7% |
| 3-Person Household | 7,162 | 16.1% |
| 4+ Person Household | 10,085 | 22.6% |
| Total Housing Units | 44,625 | 100.0% |
Occupancy by Ownership by Household Size in Spring Hill
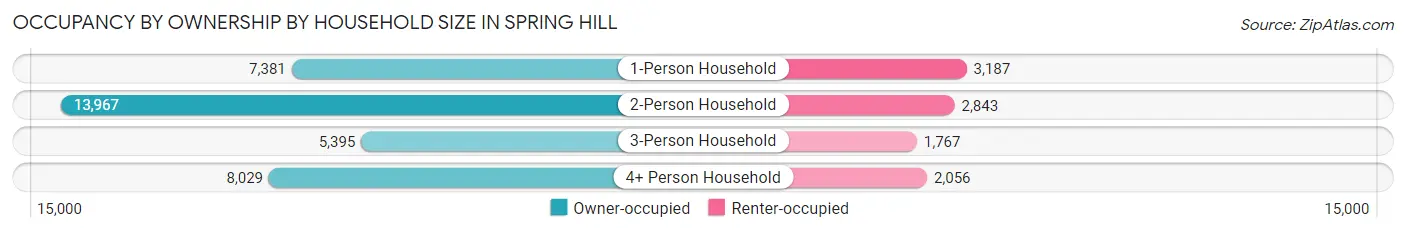
| Household Size | Owner-occupied | Renter-occupied |
| 1-Person Household | 7,381 (69.8%) | 3,187 (30.2%) |
| 2-Person Household | 13,967 (83.1%) | 2,843 (16.9%) |
| 3-Person Household | 5,395 (75.3%) | 1,767 (24.7%) |
| 4+ Person Household | 8,029 (79.6%) | 2,056 (20.4%) |
| Total Housing Units | 34,772 (77.9%) | 9,853 (22.1%) |
Occupancy by Educational Attainment in Spring Hill
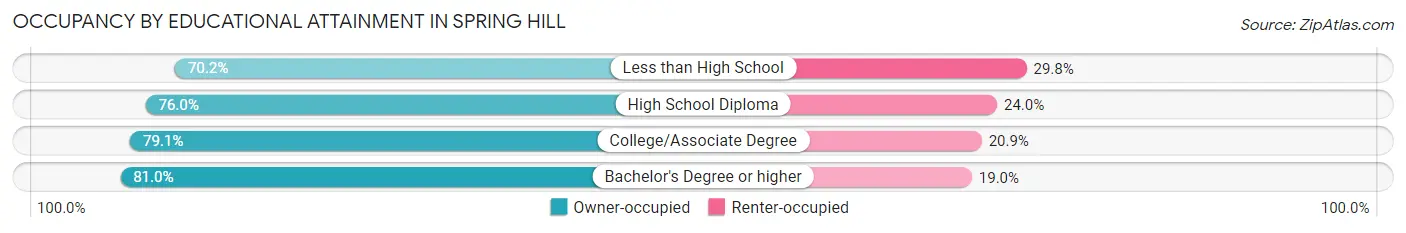
| Household Size | Owner-occupied | Renter-occupied |
| Less than High School | 2,405 (70.2%) | 1,022 (29.8%) |
| High School Diploma | 9,820 (76.0%) | 3,096 (24.0%) |
| College/Associate Degree | 15,041 (79.1%) | 3,978 (20.9%) |
| Bachelor's Degree or higher | 7,506 (81.0%) | 1,757 (19.0%) |
Occupancy by Age of Householder in Spring Hill
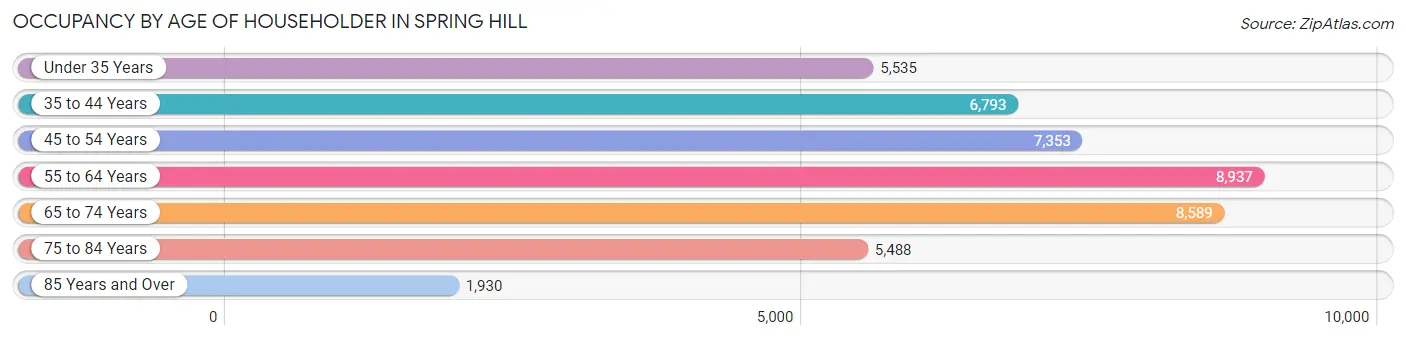
| Age Bracket | # Households | % Households |
| Under 35 Years | 5,535 | 12.4% |
| 35 to 44 Years | 6,793 | 15.2% |
| 45 to 54 Years | 7,353 | 16.5% |
| 55 to 64 Years | 8,937 | 20.0% |
| 65 to 74 Years | 8,589 | 19.3% |
| 75 to 84 Years | 5,488 | 12.3% |
| 85 Years and Over | 1,930 | 4.3% |
| Total | 44,625 | 100.0% |
Housing Finances in Spring Hill
Median Income by Occupancy in Spring Hill
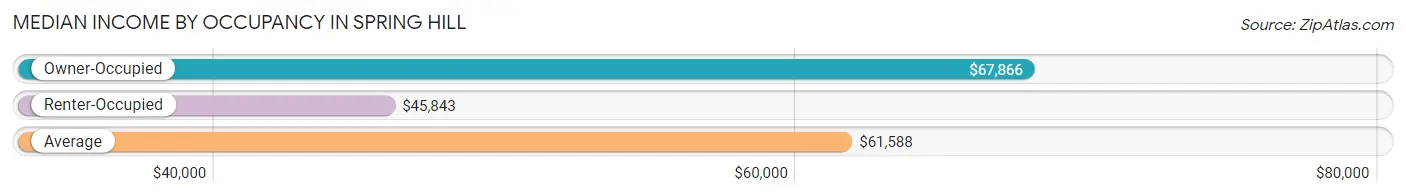
| Occupancy Type | # Households | Median Income |
| Owner-Occupied | 34,772 (77.9%) | $67,866 |
| Renter-Occupied | 9,853 (22.1%) | $45,843 |
| Average | 44,625 (100.0%) | $61,588 |
Occupancy by Householder Income Bracket in Spring Hill
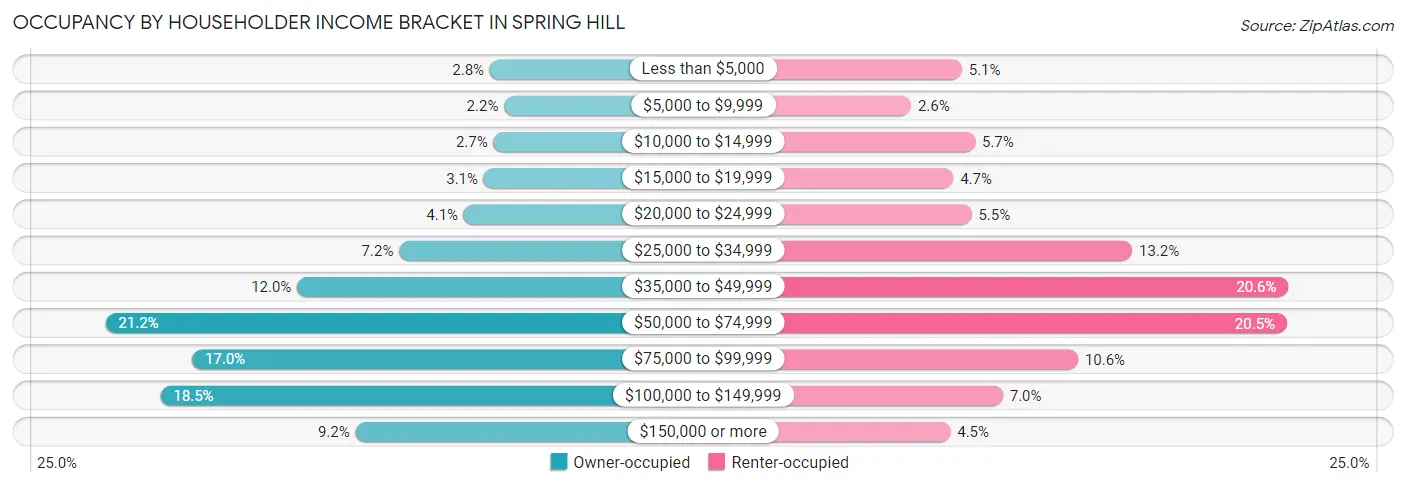
| Income Bracket | Owner-occupied | Renter-occupied |
| Less than $5,000 | 986 (2.8%) | 499 (5.1%) |
| $5,000 to $9,999 | 752 (2.2%) | 260 (2.6%) |
| $10,000 to $14,999 | 928 (2.7%) | 561 (5.7%) |
| $15,000 to $19,999 | 1,087 (3.1%) | 458 (4.6%) |
| $20,000 to $24,999 | 1,417 (4.1%) | 544 (5.5%) |
| $25,000 to $34,999 | 2,490 (7.2%) | 1,298 (13.2%) |
| $35,000 to $49,999 | 4,179 (12.0%) | 2,031 (20.6%) |
| $50,000 to $74,999 | 7,356 (21.1%) | 2,024 (20.5%) |
| $75,000 to $99,999 | 5,922 (17.0%) | 1,043 (10.6%) |
| $100,000 to $149,999 | 6,443 (18.5%) | 691 (7.0%) |
| $150,000 or more | 3,212 (9.2%) | 444 (4.5%) |
| Total | 34,772 (100.0%) | 9,853 (100.0%) |
Monthly Housing Cost Tiers in Spring Hill
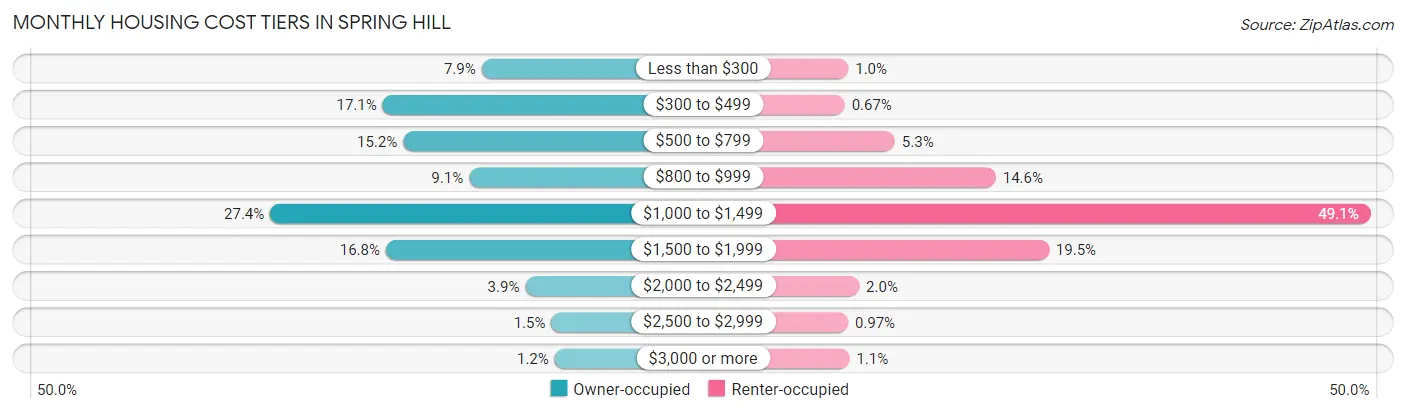
| Monthly Cost | Owner-occupied | Renter-occupied |
| Less than $300 | 2,757 (7.9%) | 99 (1.0%) |
| $300 to $499 | 5,927 (17.1%) | 66 (0.7%) |
| $500 to $799 | 5,271 (15.2%) | 521 (5.3%) |
| $800 to $999 | 3,162 (9.1%) | 1,437 (14.6%) |
| $1,000 to $1,499 | 9,527 (27.4%) | 4,835 (49.1%) |
| $1,500 to $1,999 | 5,823 (16.8%) | 1,918 (19.5%) |
| $2,000 to $2,499 | 1,360 (3.9%) | 197 (2.0%) |
| $2,500 to $2,999 | 525 (1.5%) | 96 (1.0%) |
| $3,000 or more | 420 (1.2%) | 109 (1.1%) |
| Total | 34,772 (100.0%) | 9,853 (100.0%) |
Physical Housing Characteristics in Spring Hill
Housing Structures in Spring Hill
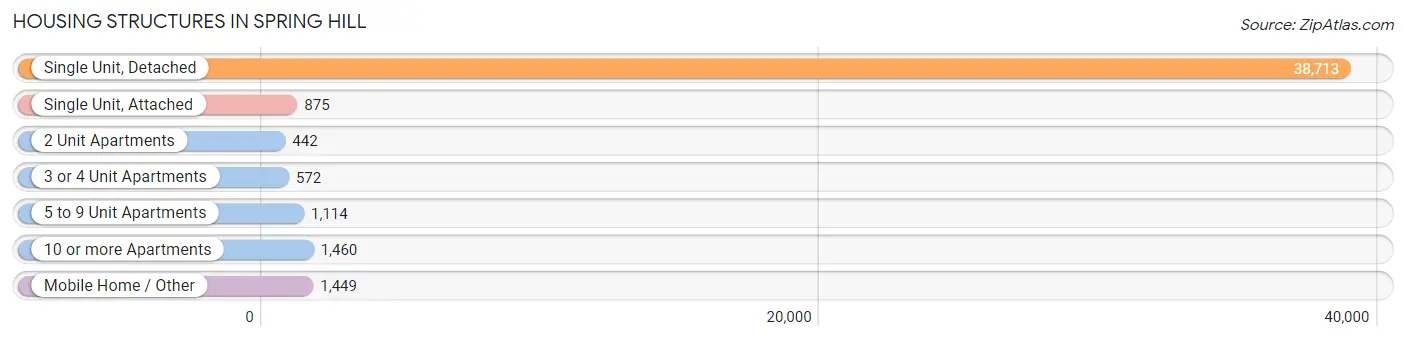
| Structure Type | # Housing Units | % Housing Units |
| Single Unit, Detached | 38,713 | 86.8% |
| Single Unit, Attached | 875 | 2.0% |
| 2 Unit Apartments | 442 | 1.0% |
| 3 or 4 Unit Apartments | 572 | 1.3% |
| 5 to 9 Unit Apartments | 1,114 | 2.5% |
| 10 or more Apartments | 1,460 | 3.3% |
| Mobile Home / Other | 1,449 | 3.3% |
| Total | 44,625 | 100.0% |
Housing Structures by Occupancy in Spring Hill
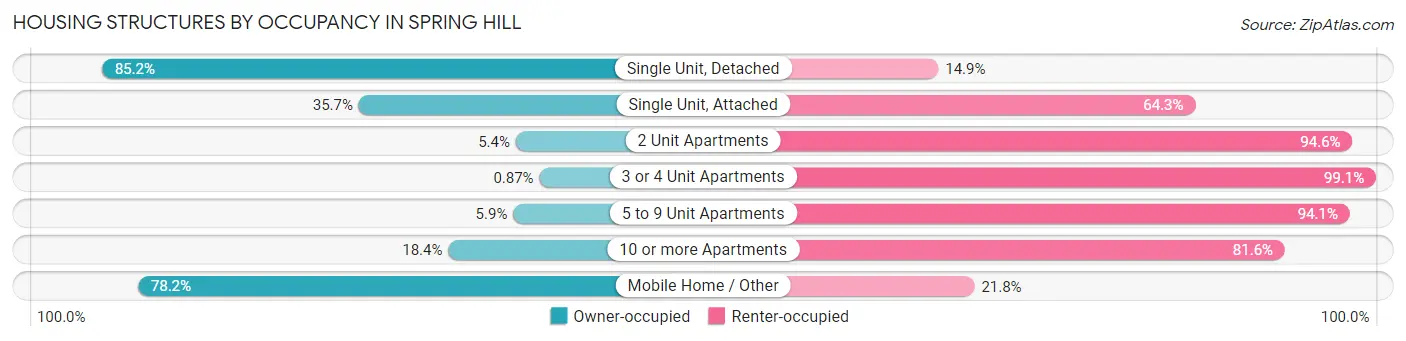
| Structure Type | Owner-occupied | Renter-occupied |
| Single Unit, Detached | 32,963 (85.2%) | 5,750 (14.8%) |
| Single Unit, Attached | 312 (35.7%) | 563 (64.3%) |
| 2 Unit Apartments | 24 (5.4%) | 418 (94.6%) |
| 3 or 4 Unit Apartments | 5 (0.9%) | 567 (99.1%) |
| 5 to 9 Unit Apartments | 66 (5.9%) | 1,048 (94.1%) |
| 10 or more Apartments | 269 (18.4%) | 1,191 (81.6%) |
| Mobile Home / Other | 1,133 (78.2%) | 316 (21.8%) |
| Total | 34,772 (77.9%) | 9,853 (22.1%) |
Housing Structures by Number of Rooms in Spring Hill
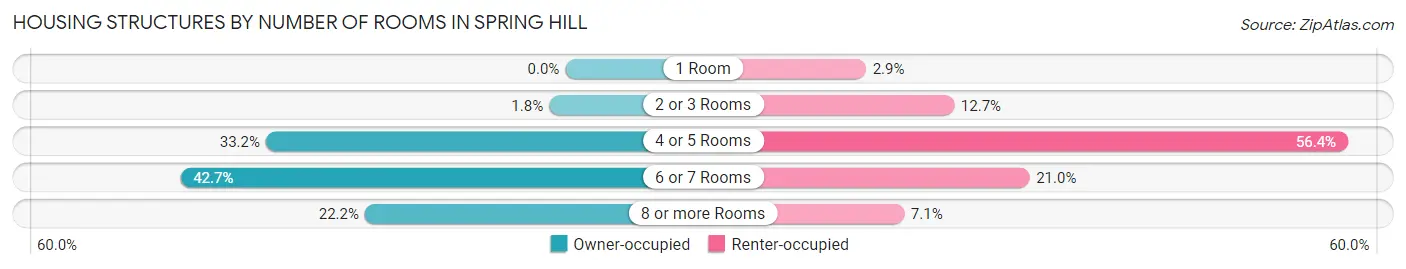
| Number of Rooms | Owner-occupied | Renter-occupied |
| 1 Room | 0 (0.0%) | 282 (2.9%) |
| 2 or 3 Rooms | 625 (1.8%) | 1,246 (12.7%) |
| 4 or 5 Rooms | 11,555 (33.2%) | 5,555 (56.4%) |
| 6 or 7 Rooms | 14,858 (42.7%) | 2,070 (21.0%) |
| 8 or more Rooms | 7,734 (22.2%) | 700 (7.1%) |
| Total | 34,772 (100.0%) | 9,853 (100.0%) |
Housing Structure by Heating Type in Spring Hill
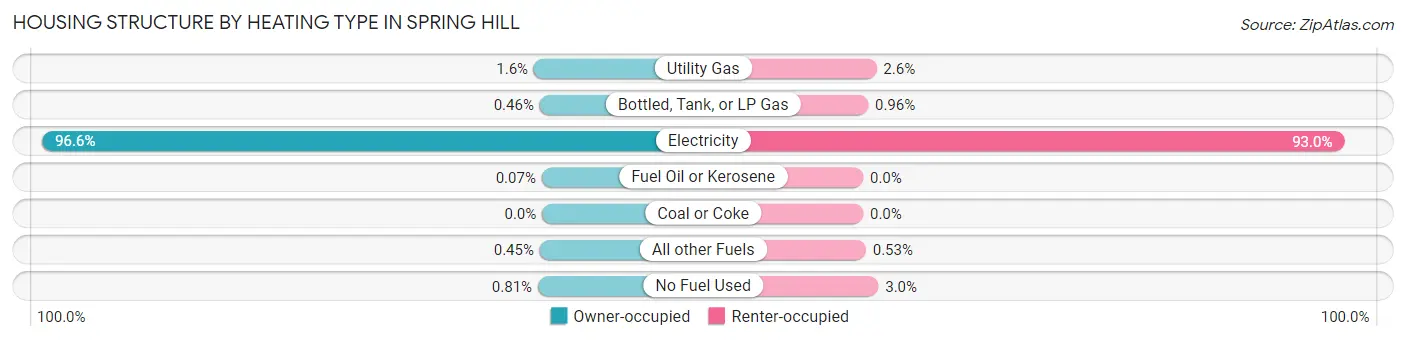
| Heating Type | Owner-occupied | Renter-occupied |
| Utility Gas | 548 (1.6%) | 254 (2.6%) |
| Bottled, Tank, or LP Gas | 159 (0.5%) | 95 (1.0%) |
| Electricity | 33,600 (96.6%) | 9,161 (93.0%) |
| Fuel Oil or Kerosene | 26 (0.1%) | 0 (0.0%) |
| Coal or Coke | 0 (0.0%) | 0 (0.0%) |
| All other Fuels | 158 (0.4%) | 52 (0.5%) |
| No Fuel Used | 281 (0.8%) | 291 (2.9%) |
| Total | 34,772 (100.0%) | 9,853 (100.0%) |
Household Vehicle Usage in Spring Hill
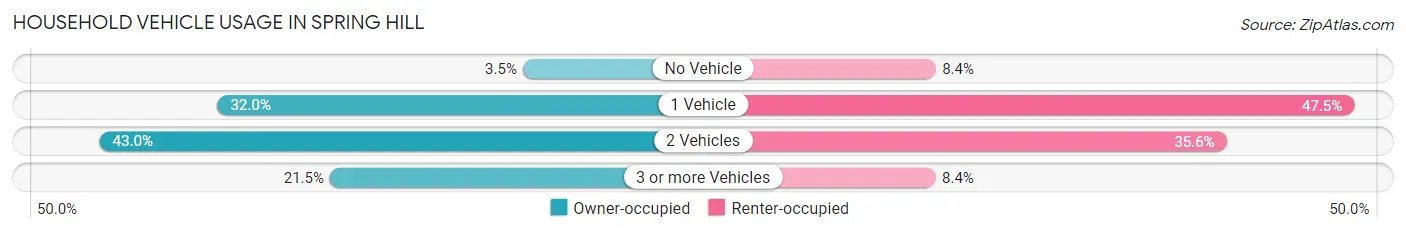
| Vehicles per Household | Owner-occupied | Renter-occupied |
| No Vehicle | 1,218 (3.5%) | 831 (8.4%) |
| 1 Vehicle | 11,125 (32.0%) | 4,683 (47.5%) |
| 2 Vehicles | 14,949 (43.0%) | 3,509 (35.6%) |
| 3 or more Vehicles | 7,480 (21.5%) | 830 (8.4%) |
| Total | 34,772 (100.0%) | 9,853 (100.0%) |
Real Estate & Mortgages in Spring Hill
Real Estate and Mortgage Overview in Spring Hill
| Characteristic | Without Mortgage | With Mortgage |
| Housing Units | 12,668 | 22,104 |
| Median Property Value | $206,600 | $228,800 |
| Median Household Income | $53,607 | $2,354 |
| Monthly Housing Costs | $420 | $420 |
| Real Estate Taxes | $1,414 | $849 |
Property Value by Mortgage Status in Spring Hill
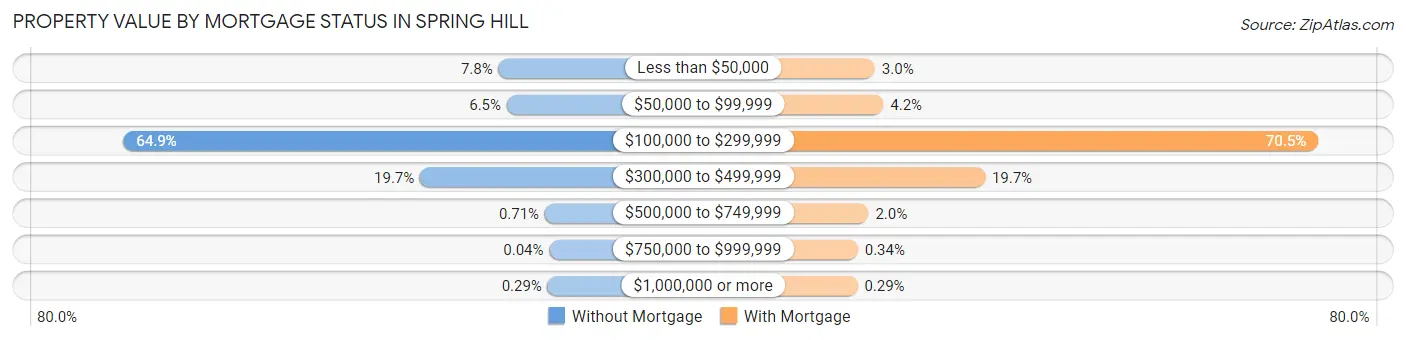
| Property Value | Without Mortgage | With Mortgage |
| Less than $50,000 | 986 (7.8%) | 652 (2.9%) |
| $50,000 to $99,999 | 825 (6.5%) | 937 (4.2%) |
| $100,000 to $299,999 | 8,226 (64.9%) | 15,582 (70.5%) |
| $300,000 to $499,999 | 2,499 (19.7%) | 4,359 (19.7%) |
| $500,000 to $749,999 | 90 (0.7%) | 436 (2.0%) |
| $750,000 to $999,999 | 5 (0.0%) | 75 (0.3%) |
| $1,000,000 or more | 37 (0.3%) | 63 (0.3%) |
| Total | 12,668 (100.0%) | 22,104 (100.0%) |
Household Income by Mortgage Status in Spring Hill
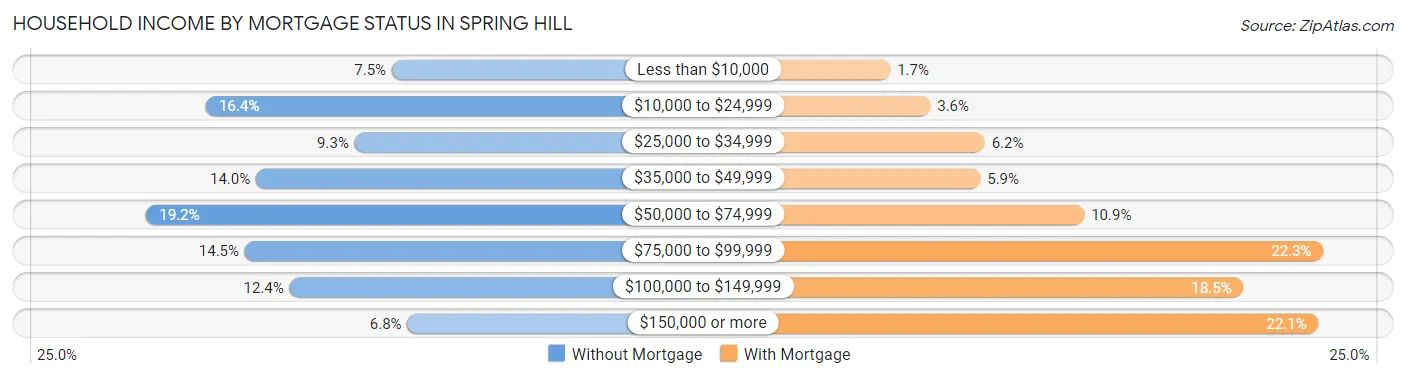
| Household Income | Without Mortgage | With Mortgage |
| Less than $10,000 | 952 (7.5%) | 365 (1.7%) |
| $10,000 to $24,999 | 2,073 (16.4%) | 786 (3.6%) |
| $25,000 to $34,999 | 1,176 (9.3%) | 1,359 (6.1%) |
| $35,000 to $49,999 | 1,771 (14.0%) | 1,314 (5.9%) |
| $50,000 to $74,999 | 2,432 (19.2%) | 2,408 (10.9%) |
| $75,000 to $99,999 | 1,838 (14.5%) | 4,924 (22.3%) |
| $100,000 to $149,999 | 1,568 (12.4%) | 4,084 (18.5%) |
| $150,000 or more | 858 (6.8%) | 4,875 (22.1%) |
| Total | 12,668 (100.0%) | 22,104 (100.0%) |
Property Value to Household Income Ratio in Spring Hill
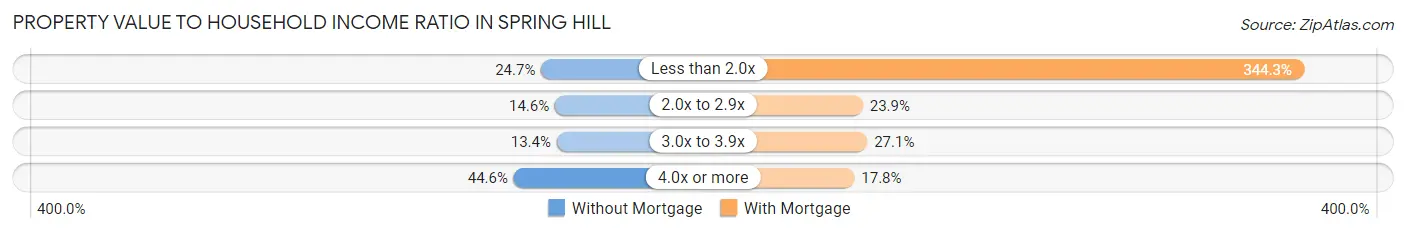
| Value-to-Income Ratio | Without Mortgage | With Mortgage |
| Less than 2.0x | 3,128 (24.7%) | 76,097 (344.3%) |
| 2.0x to 2.9x | 1,855 (14.6%) | 5,280 (23.9%) |
| 3.0x to 3.9x | 1,697 (13.4%) | 5,987 (27.1%) |
| 4.0x or more | 5,652 (44.6%) | 3,928 (17.8%) |
| Total | 12,668 (100.0%) | 22,104 (100.0%) |
Real Estate Taxes by Mortgage Status in Spring Hill
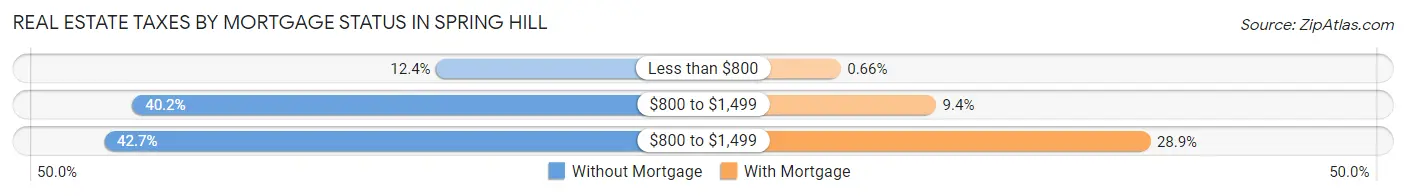
| Property Taxes | Without Mortgage | With Mortgage |
| Less than $800 | 1,570 (12.4%) | 145 (0.7%) |
| $800 to $1,499 | 5,088 (40.2%) | 2,071 (9.4%) |
| $800 to $1,499 | 5,413 (42.7%) | 6,397 (28.9%) |
| Total | 12,668 (100.0%) | 22,104 (100.0%) |
Health & Disability in Spring Hill
Health Insurance Coverage by Age in Spring Hill
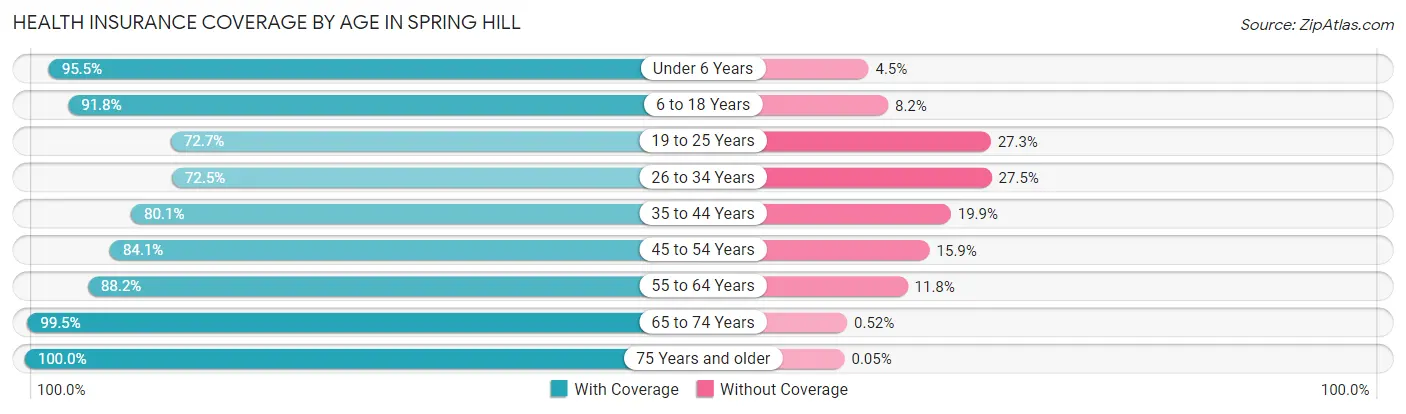
| Age Bracket | With Coverage | Without Coverage |
| Under 6 Years | 6,908 (95.5%) | 327 (4.5%) |
| 6 to 18 Years | 16,140 (91.8%) | 1,434 (8.2%) |
| 19 to 25 Years | 6,061 (72.7%) | 2,276 (27.3%) |
| 26 to 34 Years | 9,162 (72.5%) | 3,472 (27.5%) |
| 35 to 44 Years | 10,922 (80.1%) | 2,707 (19.9%) |
| 45 to 54 Years | 11,651 (84.1%) | 2,204 (15.9%) |
| 55 to 64 Years | 13,990 (88.2%) | 1,874 (11.8%) |
| 65 to 74 Years | 14,558 (99.5%) | 76 (0.5%) |
| 75 Years and older | 11,680 (100.0%) | 6 (0.1%) |
| Total | 101,072 (87.5%) | 14,376 (12.4%) |
Health Insurance Coverage by Citizenship Status in Spring Hill
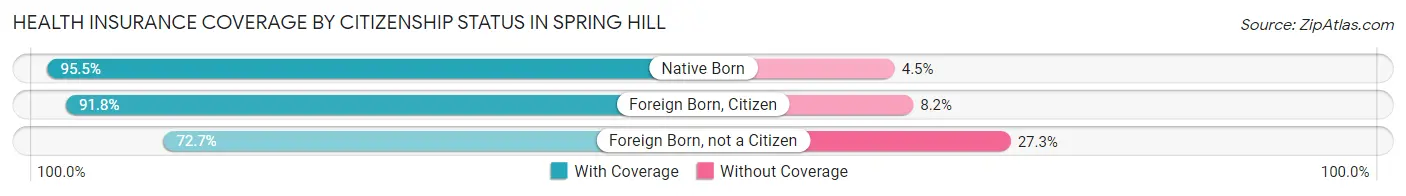
| Citizenship Status | With Coverage | Without Coverage |
| Native Born | 6,908 (95.5%) | 327 (4.5%) |
| Foreign Born, Citizen | 16,140 (91.8%) | 1,434 (8.2%) |
| Foreign Born, not a Citizen | 6,061 (72.7%) | 2,276 (27.3%) |
Health Insurance Coverage by Household Income in Spring Hill
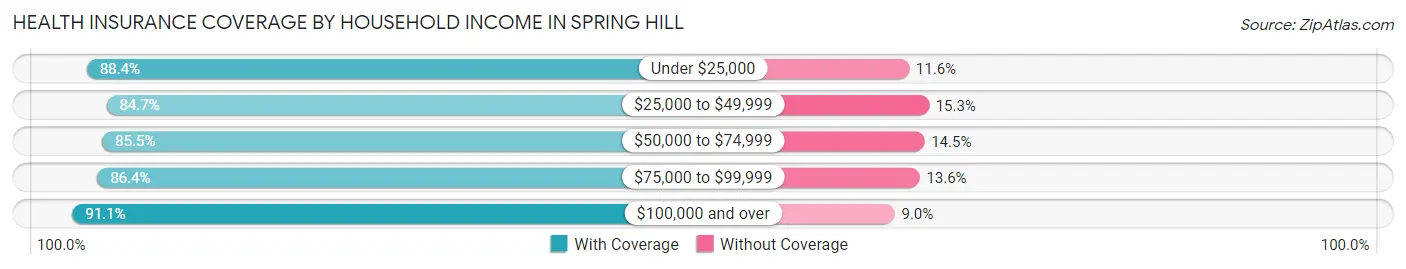
| Household Income | With Coverage | Without Coverage |
| Under $25,000 | 11,977 (88.4%) | 1,578 (11.6%) |
| $25,000 to $49,999 | 18,742 (84.7%) | 3,397 (15.3%) |
| $50,000 to $74,999 | 20,140 (85.5%) | 3,418 (14.5%) |
| $75,000 to $99,999 | 17,575 (86.4%) | 2,769 (13.6%) |
| $100,000 and over | 32,522 (91.0%) | 3,197 (8.9%) |
Public vs Private Health Insurance Coverage by Age in Spring Hill
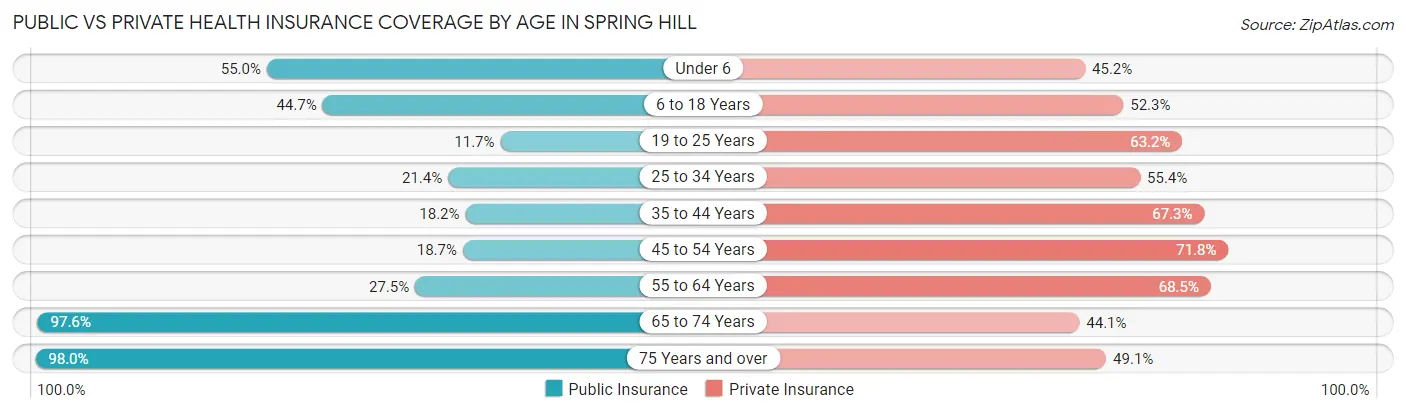
| Age Bracket | Public Insurance | Private Insurance |
| Under 6 | 3,982 (55.0%) | 3,267 (45.2%) |
| 6 to 18 Years | 7,858 (44.7%) | 9,183 (52.2%) |
| 19 to 25 Years | 975 (11.7%) | 5,268 (63.2%) |
| 25 to 34 Years | 2,704 (21.4%) | 6,995 (55.4%) |
| 35 to 44 Years | 2,479 (18.2%) | 9,171 (67.3%) |
| 45 to 54 Years | 2,585 (18.7%) | 9,941 (71.8%) |
| 55 to 64 Years | 4,365 (27.5%) | 10,866 (68.5%) |
| 65 to 74 Years | 14,280 (97.6%) | 6,454 (44.1%) |
| 75 Years and over | 11,452 (98.0%) | 5,734 (49.1%) |
| Total | 50,680 (43.9%) | 66,879 (57.9%) |
Disability Status by Sex by Age in Spring Hill
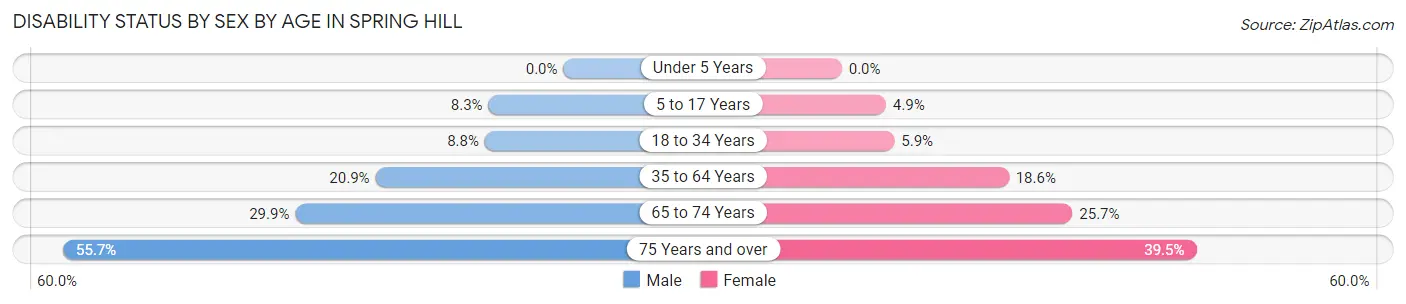
| Age Bracket | Male | Female |
| Under 5 Years | 0 (0.0%) | 0 (0.0%) |
| 5 to 17 Years | 717 (8.3%) | 435 (4.9%) |
| 18 to 34 Years | 995 (8.7%) | 634 (5.9%) |
| 35 to 64 Years | 4,442 (20.9%) | 4,112 (18.6%) |
| 65 to 74 Years | 1,986 (29.9%) | 2,050 (25.7%) |
| 75 Years and over | 3,026 (55.7%) | 2,470 (39.5%) |
Disability Class by Sex by Age in Spring Hill
Disability Class: Hearing Difficulty
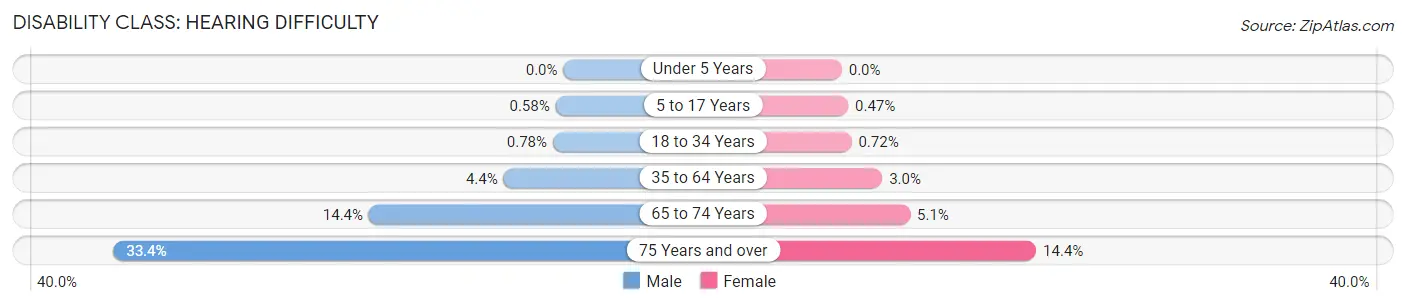
| Age Bracket | Male | Female |
| Under 5 Years | 0 (0.0%) | 0 (0.0%) |
| 5 to 17 Years | 50 (0.6%) | 42 (0.5%) |
| 18 to 34 Years | 89 (0.8%) | 78 (0.7%) |
| 35 to 64 Years | 942 (4.4%) | 663 (3.0%) |
| 65 to 74 Years | 960 (14.4%) | 405 (5.1%) |
| 75 Years and over | 1,814 (33.4%) | 903 (14.4%) |
Disability Class: Vision Difficulty
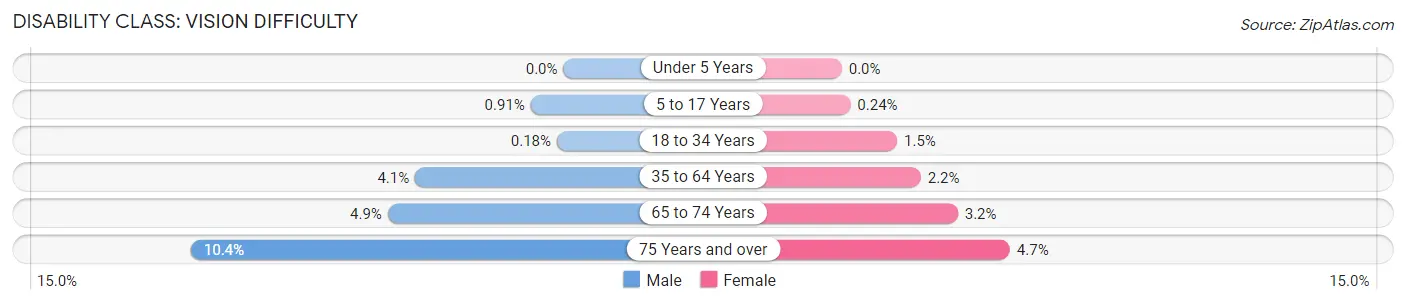
| Age Bracket | Male | Female |
| Under 5 Years | 0 (0.0%) | 0 (0.0%) |
| 5 to 17 Years | 78 (0.9%) | 21 (0.2%) |
| 18 to 34 Years | 21 (0.2%) | 167 (1.5%) |
| 35 to 64 Years | 877 (4.1%) | 487 (2.2%) |
| 65 to 74 Years | 325 (4.9%) | 258 (3.2%) |
| 75 Years and over | 563 (10.4%) | 293 (4.7%) |
Disability Class: Cognitive Difficulty
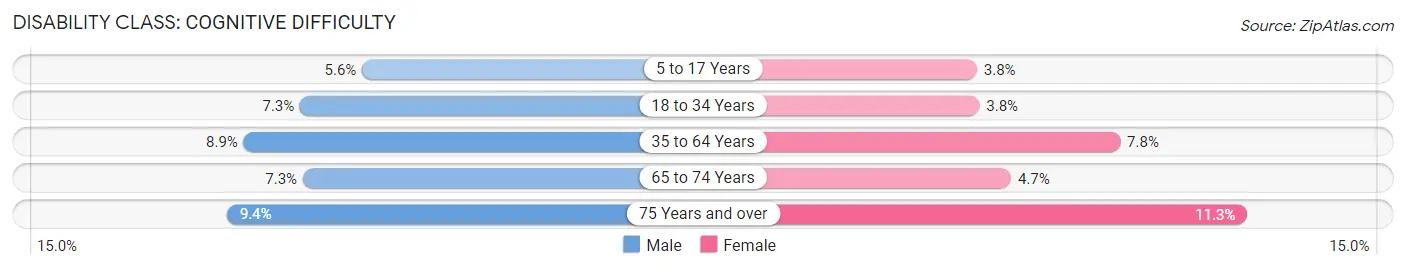
| Age Bracket | Male | Female |
| 5 to 17 Years | 481 (5.6%) | 333 (3.8%) |
| 18 to 34 Years | 834 (7.3%) | 415 (3.8%) |
| 35 to 64 Years | 1,888 (8.9%) | 1,715 (7.7%) |
| 65 to 74 Years | 482 (7.2%) | 376 (4.7%) |
| 75 Years and over | 509 (9.4%) | 706 (11.3%) |
Disability Class: Ambulatory Difficulty
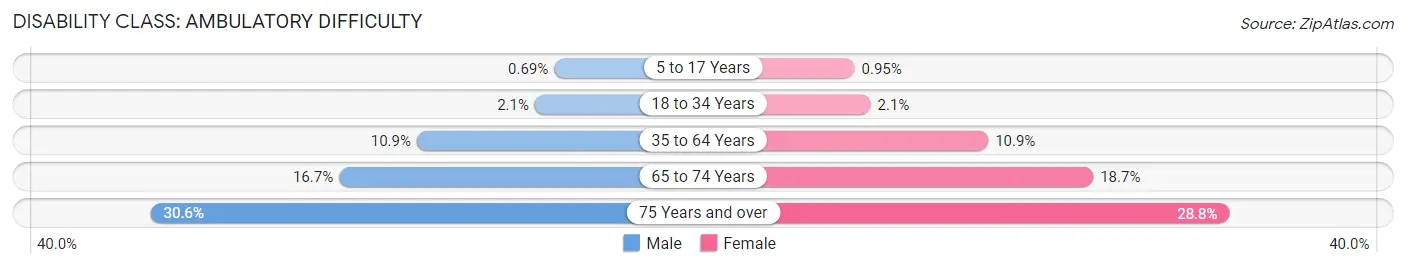
| Age Bracket | Male | Female |
| 5 to 17 Years | 59 (0.7%) | 84 (0.9%) |
| 18 to 34 Years | 241 (2.1%) | 232 (2.1%) |
| 35 to 64 Years | 2,309 (10.9%) | 2,405 (10.9%) |
| 65 to 74 Years | 1,108 (16.7%) | 1,491 (18.7%) |
| 75 Years and over | 1,664 (30.6%) | 1,800 (28.8%) |
Disability Class: Self-Care Difficulty
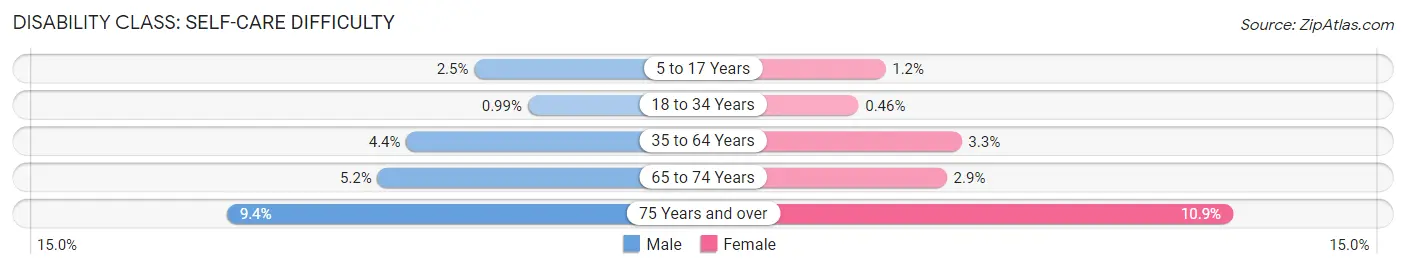
| Age Bracket | Male | Female |
| 5 to 17 Years | 213 (2.5%) | 107 (1.2%) |
| 18 to 34 Years | 113 (1.0%) | 50 (0.5%) |
| 35 to 64 Years | 927 (4.4%) | 737 (3.3%) |
| 65 to 74 Years | 344 (5.2%) | 233 (2.9%) |
| 75 Years and over | 509 (9.4%) | 681 (10.9%) |
Technology Access in Spring Hill
Computing Device Access in Spring Hill
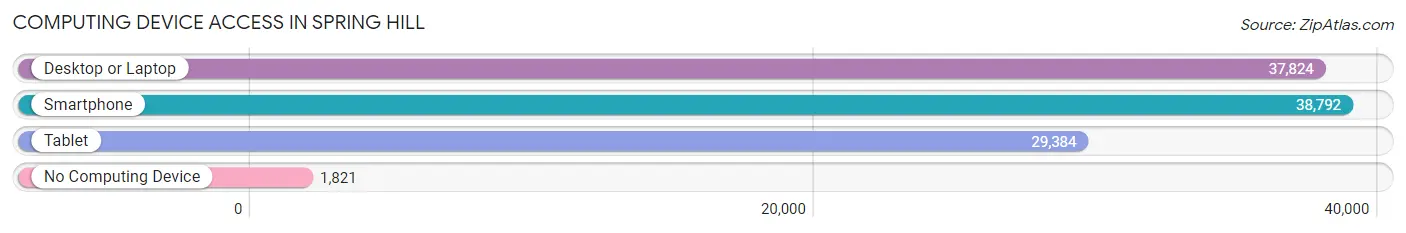
| Device Type | # Households | % Households |
| Desktop or Laptop | 37,824 | 84.8% |
| Smartphone | 38,792 | 86.9% |
| Tablet | 29,384 | 65.8% |
| No Computing Device | 1,821 | 4.1% |
| Total | 44,625 | 100.0% |
Internet Access in Spring Hill
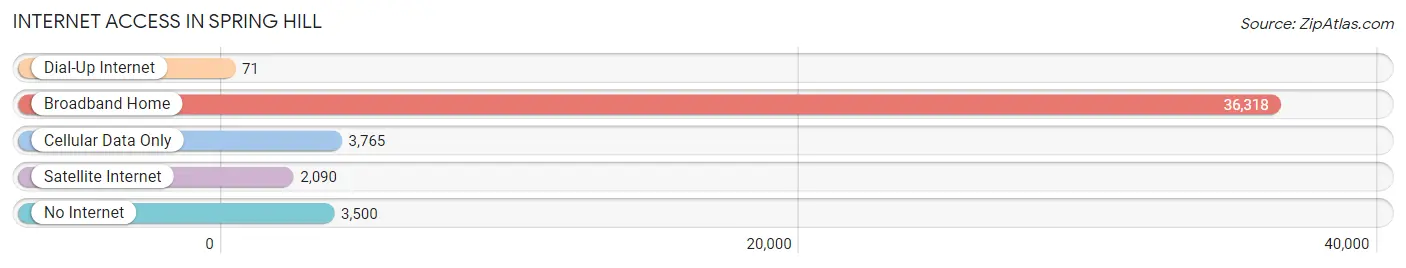
| Internet Type | # Households | % Households |
| Dial-Up Internet | 71 | 0.2% |
| Broadband Home | 36,318 | 81.4% |
| Cellular Data Only | 3,765 | 8.4% |
| Satellite Internet | 2,090 | 4.7% |
| No Internet | 3,500 | 7.8% |
| Total | 44,625 | 100.0% |
Spring Hill Summary
History
Spring Hill is an unincorporated community located in Hernando County, Florida. It is located approximately 40 miles north of Tampa and is part of the Tampa-St. Petersburg-Clearwater metropolitan area. The area was first settled in the late 1800s by settlers from the north, who were attracted to the area’s mild climate and abundant natural resources. The area was originally known as Spring Hill Station, and the first post office was established in 1884.
The area was largely agricultural until the 1950s, when the population began to grow rapidly due to the development of the Suncoast Parkway and the construction of the Weeki Wachee Springs State Park. The area was incorporated as a town in 1967, and the population continued to grow throughout the 1970s and 1980s. In the 1990s, the area experienced a population boom, with the population increasing from around 10,000 in 1990 to over 50,000 in 2000.
Geography
Spring Hill is located in Hernando County, Florida, approximately 40 miles north of Tampa. The area is located on the Gulf Coast, and is bordered by the Weeki Wachee River to the east and the Pithlachascotee River to the west. The area is characterized by rolling hills and is home to several natural springs, including Weeki Wachee Springs, Chassahowitzka Springs, and Weekiwachee Preserve.
The area is home to several state parks, including Weeki Wachee Springs State Park, Chassahowitzka National Wildlife Refuge, and Weekiwachee Preserve. The area is also home to several golf courses, including Silverthorn Country Club, Seven Hills Golf and Country Club, and Silverthorn Golf and Country Club.
Economy
The economy of Spring Hill is largely based on tourism and retail. The area is home to several large retail stores, including Walmart, Target, and Lowe’s. The area is also home to several restaurants, including Outback Steakhouse, Applebee’s, and Chili’s.
The area is also home to several manufacturing and industrial companies, including Lockheed Martin, Progress Energy, and USF Polytechnic. The area is also home to several medical facilities, including Oak Hill Hospital and Spring Hill Regional Hospital.
Demographics
As of the 2010 census, the population of Spring Hill was 98,621. The racial makeup of the city was 87.3% White, 6.2% African American, 0.7% Native American, 1.7% Asian, 0.1% Pacific Islander, 1.7% from other races, and 2.4% from two or more races. Hispanic or Latino of any race were 8.3% of the population.
The median income for a household in the city was $45,837, and the median income for a family was $51,837. The per capita income for the city was $22,837. About 8.3% of families and 10.7% of the population were below the poverty line, including 15.2% of those under age 18 and 6.2% of those age 65 or over.
Common Questions
What is Per Capita Income in Spring Hill?
Per Capita income in Spring Hill is $29,951.
What is the Median Family Income in Spring Hill?
Median Family Income in Spring Hill is $70,278.
What is the Median Household income in Spring Hill?
Median Household Income in Spring Hill is $61,588.
What is Income or Wage Gap in Spring Hill?
Income or Wage Gap in Spring Hill is 23.8%.
Women in Spring Hill earn 76.2 cents for every dollar earned by a man.
What is Family Income Deficit in Spring Hill?
Family Income Deficit in Spring Hill is $11,297.
Families that are below poverty line in Spring Hill earn $11,297 less on average than the poverty threshold level.
What is Inequality or Gini Index in Spring Hill?
Inequality or Gini Index in Spring Hill is 0.41.
What is the Total Population of Spring Hill?
Total Population of Spring Hill is 116,882.
What is the Total Male Population of Spring Hill?
Total Male Population of Spring Hill is 57,090.
What is the Total Female Population of Spring Hill?
Total Female Population of Spring Hill is 59,792.
What is the Ratio of Males per 100 Females in Spring Hill?
There are 95.48 Males per 100 Females in Spring Hill.
What is the Ratio of Females per 100 Males in Spring Hill?
There are 104.73 Females per 100 Males in Spring Hill.
What is the Median Population Age in Spring Hill?
Median Population Age in Spring Hill is 43.2 Years.
What is the Average Family Size in Spring Hill
Average Family Size in Spring Hill is 3.0 People.
What is the Average Household Size in Spring Hill
Average Household Size in Spring Hill is 2.6 People.
How Large is the Labor Force in Spring Hill?
There are 51,455 People in the Labor Forcein in Spring Hill.
What is the Percentage of People in the Labor Force in Spring Hill?
53.5% of People are in the Labor Force in Spring Hill.
What is the Unemployment Rate in Spring Hill?
Unemployment Rate in Spring Hill is 6.4%.