Atlanta, GA Map & Demographics
Atlanta Map
Atlanta Overview
$60,778
PER CAPITA INCOME
$103,886
AVG FAMILY INCOME
$77,655
AVG HOUSEHOLD INCOME
26.1%
WAGE / INCOME GAP [ % ]
73.9¢/ $1
WAGE / INCOME GAP [ $ ]
$11,835
FAMILY INCOME DEFICIT
0.57
INEQUALITY / GINI INDEX
494,838
TOTAL POPULATION
244,396
MALE POPULATION
250,442
FEMALE POPULATION
97.59
MALES / 100 FEMALES
102.47
FEMALES / 100 MALES
33.6
MEDIAN AGE
3.0
AVG FAMILY SIZE
2.0
AVG HOUSEHOLD SIZE
281,022
LABOR FORCE [ PEOPLE ]
67.3%
PERCENT IN LABOR FORCE
5.8%
UNEMPLOYMENT RATE
Atlanta Zip Codes
Income in Atlanta
Income Overview in Atlanta
Per Capita Income in Atlanta is $60,778, while median incomes of families and households are $103,886 and $77,655 respectively.
| Characteristic | Number | Measure |
| Per Capita Income | 494,838 | $60,778 |
| Median Family Income | 93,091 | $103,886 |
| Mean Family Income | 93,091 | $184,060 |
| Median Household Income | 227,388 | $77,655 |
| Mean Household Income | 227,388 | $128,965 |
| Income Deficit | 93,091 | $11,835 |
| Wage / Income Gap (%) | 494,838 | 26.11% |
| Wage / Income Gap ($) | 494,838 | 73.89¢ per $1 |
| Gini / Inequality Index | 494,838 | 0.57 |
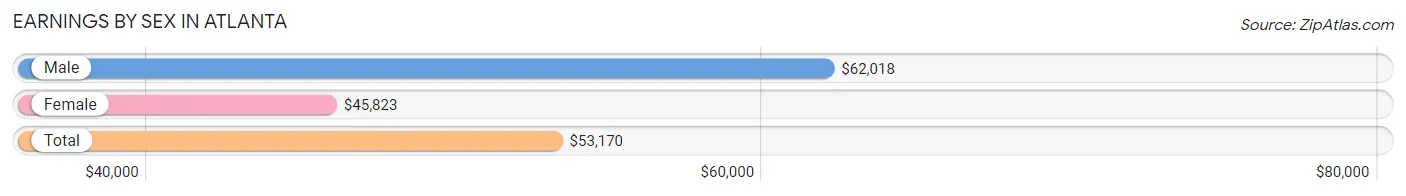
Earnings by Sex in Atlanta
Average Earnings in Atlanta are $53,170, $62,018 for men and $45,823 for women, a difference of 26.1%.
| Sex | Number | Average Earnings |
| Male | 153,735 (52.1%) | $62,018 |
| Female | 141,468 (47.9%) | $45,823 |
| Total | 295,203 (100.0%) | $53,170 |
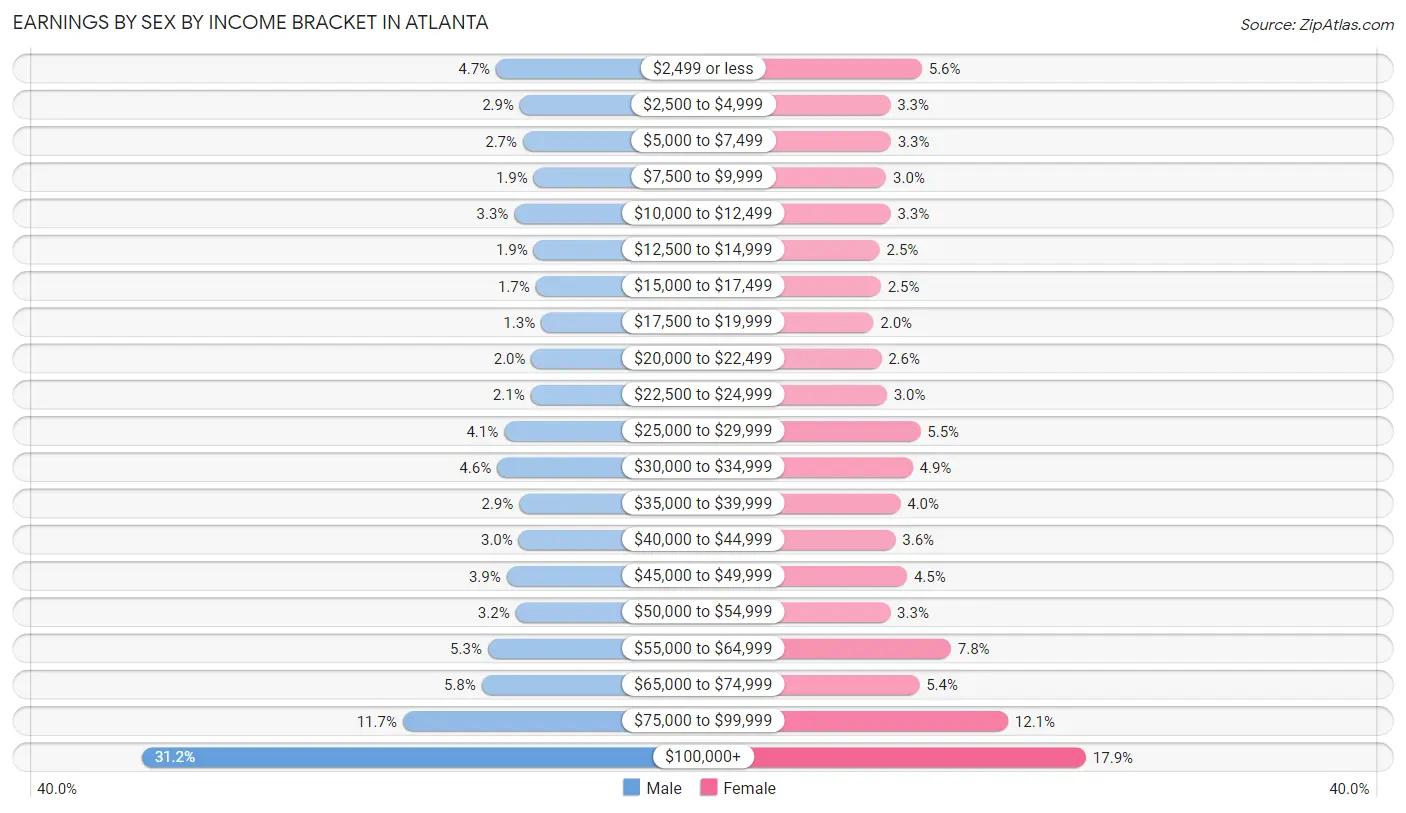
Earnings by Sex by Income Bracket in Atlanta
The most common earnings brackets in Atlanta are $100,000+ for men (47,995 | 31.2%) and $100,000+ for women (25,346 | 17.9%).
| Income | Male | Female |
| $2,499 or less | 7,199 (4.7%) | 7,953 (5.6%) |
| $2,500 to $4,999 | 4,447 (2.9%) | 4,611 (3.3%) |
| $5,000 to $7,499 | 4,092 (2.7%) | 4,658 (3.3%) |
| $7,500 to $9,999 | 2,859 (1.9%) | 4,180 (2.9%) |
| $10,000 to $12,499 | 5,086 (3.3%) | 4,620 (3.3%) |
| $12,500 to $14,999 | 2,864 (1.9%) | 3,477 (2.5%) |
| $15,000 to $17,499 | 2,636 (1.7%) | 3,596 (2.5%) |
| $17,500 to $19,999 | 2,002 (1.3%) | 2,810 (2.0%) |
| $20,000 to $22,499 | 3,107 (2.0%) | 3,651 (2.6%) |
| $22,500 to $24,999 | 3,219 (2.1%) | 4,230 (3.0%) |
| $25,000 to $29,999 | 6,259 (4.1%) | 7,789 (5.5%) |
| $30,000 to $34,999 | 7,079 (4.6%) | 6,972 (4.9%) |
| $35,000 to $39,999 | 4,518 (2.9%) | 5,670 (4.0%) |
| $40,000 to $44,999 | 4,586 (3.0%) | 5,149 (3.6%) |
| $45,000 to $49,999 | 5,964 (3.9%) | 6,374 (4.5%) |
| $50,000 to $54,999 | 4,930 (3.2%) | 4,591 (3.3%) |
| $55,000 to $64,999 | 8,135 (5.3%) | 11,031 (7.8%) |
| $65,000 to $74,999 | 8,836 (5.8%) | 7,682 (5.4%) |
| $75,000 to $99,999 | 17,922 (11.7%) | 17,078 (12.1%) |
| $100,000+ | 47,995 (31.2%) | 25,346 (17.9%) |
| Total | 153,735 (100.0%) | 141,468 (100.0%) |
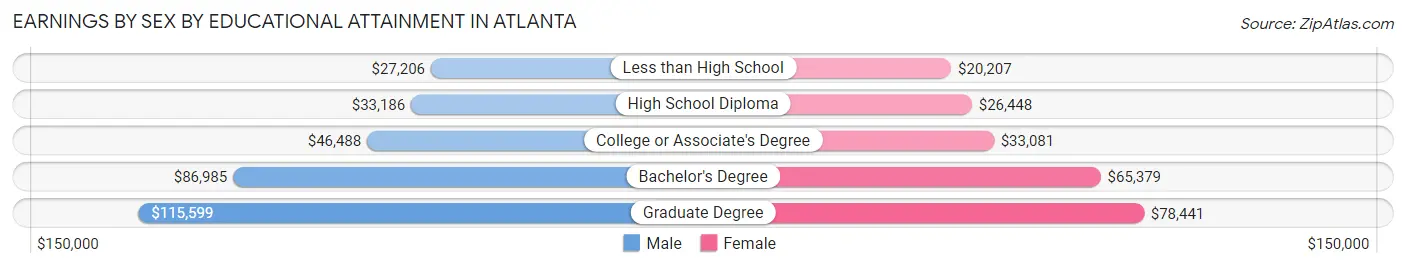
Earnings by Sex by Educational Attainment in Atlanta
Average earnings in Atlanta are $73,771 for men and $54,331 for women, a difference of 26.4%. Men with an educational attainment of graduate degree enjoy the highest average annual earnings of $115,599, while those with less than high school education earn the least with $27,206. Women with an educational attainment of graduate degree earn the most with the average annual earnings of $78,441, while those with less than high school education have the smallest earnings of $20,207.
| Educational Attainment | Male Income | Female Income |
| Less than High School | $27,206 | $20,207 |
| High School Diploma | $33,186 | $26,448 |
| College or Associate's Degree | $46,488 | $33,081 |
| Bachelor's Degree | $86,985 | $65,379 |
| Graduate Degree | $115,599 | $78,441 |
| Total | $73,771 | $54,331 |
Family Income in Atlanta
Family Income Brackets in Atlanta
According to the Atlanta family income data, there are 26,810 families falling into the $200,000+ income range, which is the most common income bracket and makes up 28.8% of all families. Conversely, the $10,000 to $14,999 income bracket is the least frequent group with only 2,979 families (3.2%) belonging to this category.
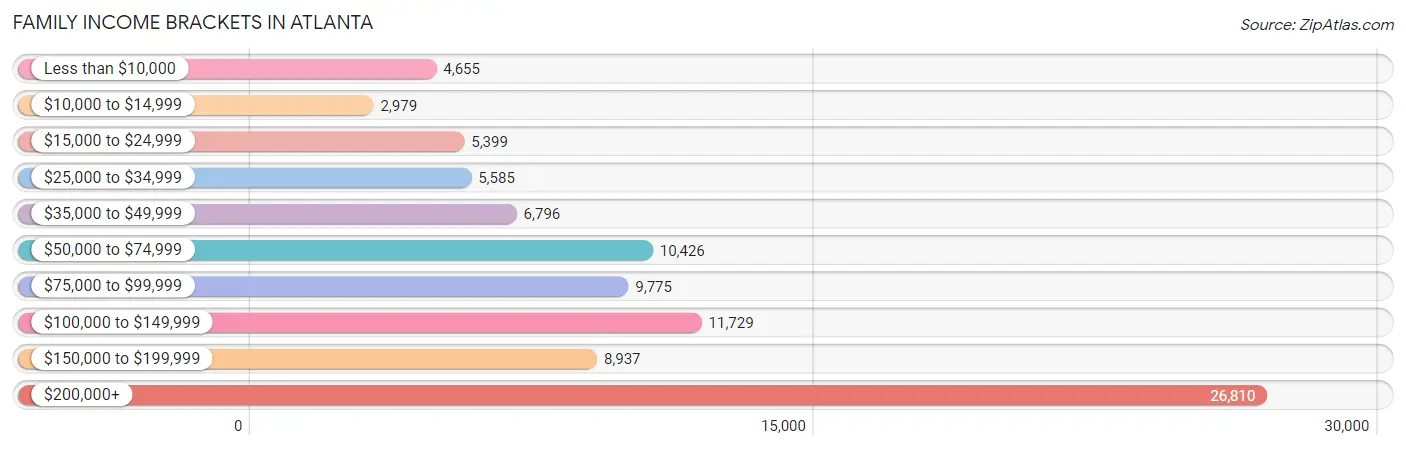
| Income Bracket | # Families | % Families |
| Less than $10,000 | 4,655 | 5.0% |
| $10,000 to $14,999 | 2,979 | 3.2% |
| $15,000 to $24,999 | 5,399 | 5.8% |
| $25,000 to $34,999 | 5,585 | 6.0% |
| $35,000 to $49,999 | 6,796 | 7.3% |
| $50,000 to $74,999 | 10,426 | 11.2% |
| $75,000 to $99,999 | 9,775 | 10.5% |
| $100,000 to $149,999 | 11,729 | 12.6% |
| $150,000 to $199,999 | 8,937 | 9.6% |
| $200,000+ | 26,810 | 28.8% |
Family Income by Famaliy Size in Atlanta
4-person families (13,534 | 14.5%) account for the highest median family income in Atlanta with $146,312 per family, while 2-person families (51,113 | 54.9%) have the highest median income of $52,906 per family member.
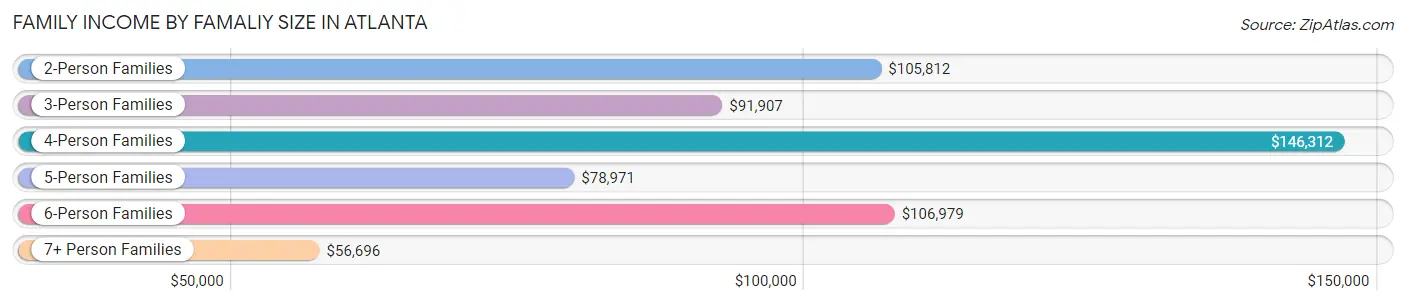
| Income Bracket | # Families | Median Income |
| 2-Person Families | 51,113 (54.9%) | $105,812 |
| 3-Person Families | 20,673 (22.2%) | $91,907 |
| 4-Person Families | 13,534 (14.5%) | $146,312 |
| 5-Person Families | 4,754 (5.1%) | $78,971 |
| 6-Person Families | 1,791 (1.9%) | $106,979 |
| 7+ Person Families | 1,226 (1.3%) | $56,696 |
| Total | 93,091 (100.0%) | $103,886 |
Family Income by Number of Earners in Atlanta
The median family income in Atlanta is $103,886, with families comprising 2 earners (42,389) having the highest median family income of $172,481, while families with no earners (10,650) have the lowest median family income of $33,861, accounting for 45.5% and 11.4% of families, respectively.
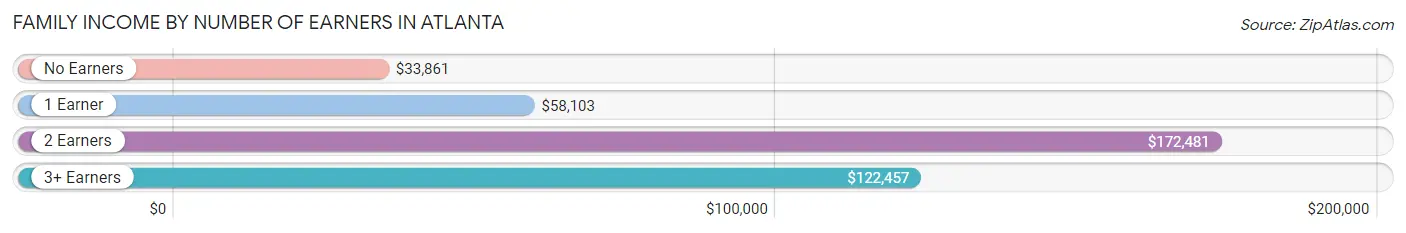
| Number of Earners | # Families | Median Income |
| No Earners | 10,650 (11.4%) | $33,861 |
| 1 Earner | 34,787 (37.4%) | $58,103 |
| 2 Earners | 42,389 (45.5%) | $172,481 |
| 3+ Earners | 5,265 (5.7%) | $122,457 |
| Total | 93,091 (100.0%) | $103,886 |
Household Income in Atlanta
Household Income Brackets in Atlanta
With 37,974 households falling in the category, the $200,000+ income range is the most frequent in Atlanta, accounting for 16.7% of all households. In contrast, only 12,279 households (5.4%) fall into the $10,000 to $14,999 income bracket, making it the least populous group.
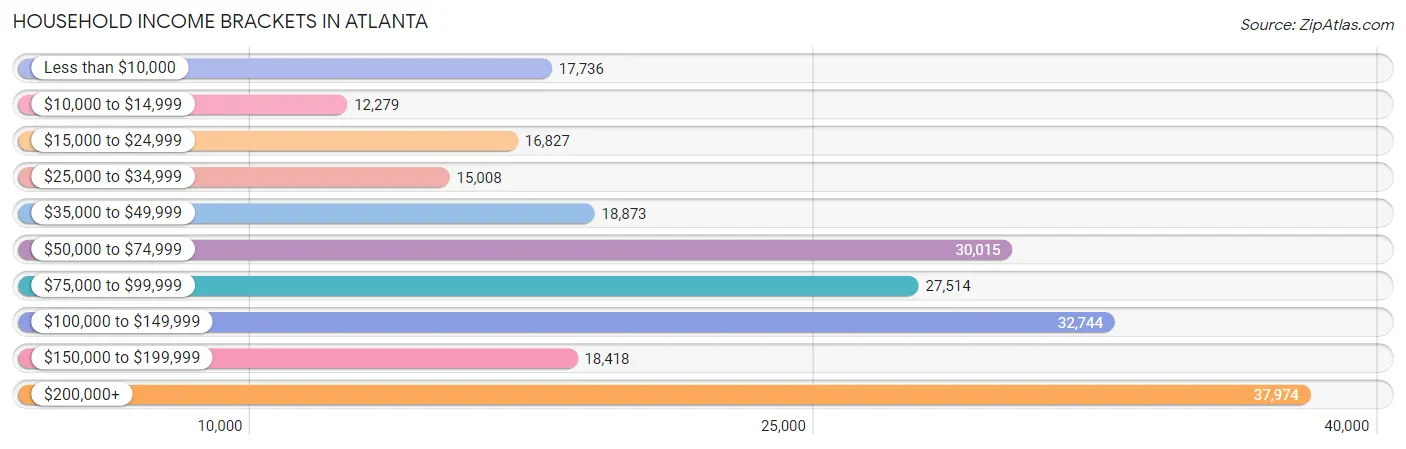
| Income Bracket | # Households | % Households |
| Less than $10,000 | 17,736 | 7.8% |
| $10,000 to $14,999 | 12,279 | 5.4% |
| $15,000 to $24,999 | 16,827 | 7.4% |
| $25,000 to $34,999 | 15,008 | 6.6% |
| $35,000 to $49,999 | 18,873 | 8.3% |
| $50,000 to $74,999 | 30,015 | 13.2% |
| $75,000 to $99,999 | 27,514 | 12.1% |
| $100,000 to $149,999 | 32,744 | 14.4% |
| $150,000 to $199,999 | 18,418 | 8.1% |
| $200,000+ | 37,974 | 16.7% |
Household Income by Householder Age in Atlanta
The median household income in Atlanta is $77,655, with the highest median household income of $91,475 found in the 25 to 44 years age bracket for the primary householder. A total of 104,967 households (46.2%) fall into this category. Meanwhile, the 15 to 24 years age bracket for the primary householder has the lowest median household income of $38,813, with 14,462 households (6.4%) in this group.
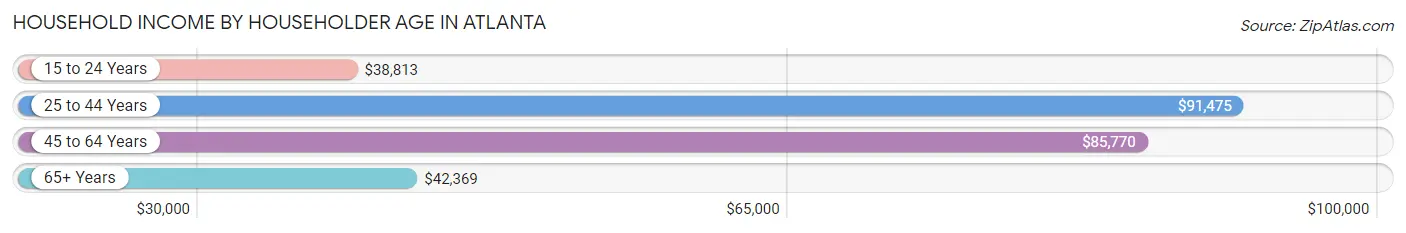
| Income Bracket | # Households | Median Income |
| 15 to 24 Years | 14,462 (6.4%) | $38,813 |
| 25 to 44 Years | 104,967 (46.2%) | $91,475 |
| 45 to 64 Years | 65,709 (28.9%) | $85,770 |
| 65+ Years | 42,250 (18.6%) | $42,369 |
| Total | 227,388 (100.0%) | $77,655 |
Poverty in Atlanta
Income Below Poverty by Sex and Age in Atlanta
With 15.7% poverty level for males and 19.7% for females among the residents of Atlanta, 18 to 24 year old males and 18 to 24 year old females are the most vulnerable to poverty, with 6,494 males (30.5%) and 7,563 females (34.1%) in their respective age groups living below the poverty level.
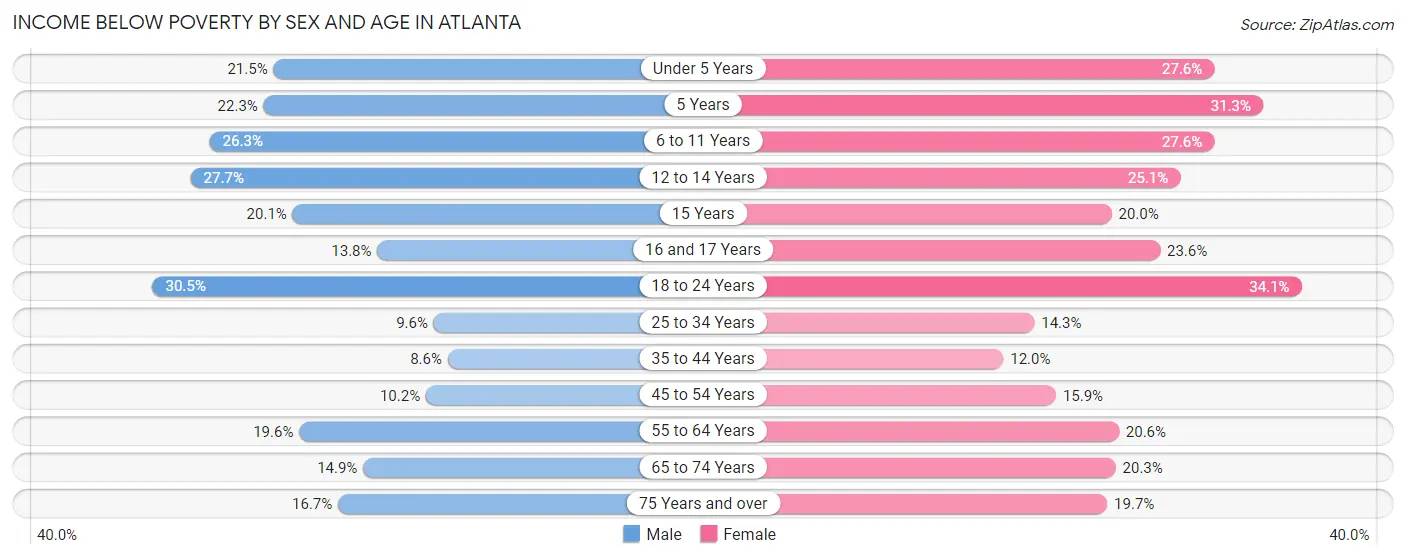
| Age Bracket | Male | Female |
| Under 5 Years | 2,922 (21.5%) | 3,448 (27.6%) |
| 5 Years | 378 (22.3%) | 815 (31.3%) |
| 6 to 11 Years | 3,751 (26.3%) | 4,324 (27.6%) |
| 12 to 14 Years | 1,560 (27.7%) | 1,549 (25.1%) |
| 15 Years | 452 (20.1%) | 420 (20.0%) |
| 16 and 17 Years | 501 (13.8%) | 916 (23.6%) |
| 18 to 24 Years | 6,494 (30.5%) | 7,563 (34.1%) |
| 25 to 34 Years | 5,157 (9.6%) | 7,558 (14.3%) |
| 35 to 44 Years | 2,882 (8.6%) | 4,248 (12.0%) |
| 45 to 54 Years | 2,914 (10.2%) | 4,195 (15.9%) |
| 55 to 64 Years | 4,734 (19.6%) | 4,951 (20.6%) |
| 65 to 74 Years | 2,225 (14.9%) | 4,022 (20.3%) |
| 75 Years and over | 1,466 (16.7%) | 2,737 (19.7%) |
| Total | 35,436 (15.7%) | 46,746 (19.7%) |
Income Above Poverty by Sex and Age in Atlanta
According to the poverty statistics in Atlanta, males aged 35 to 44 years and females aged 35 to 44 years are the age groups that are most secure financially, with 91.4% of males and 88.0% of females in these age groups living above the poverty line.
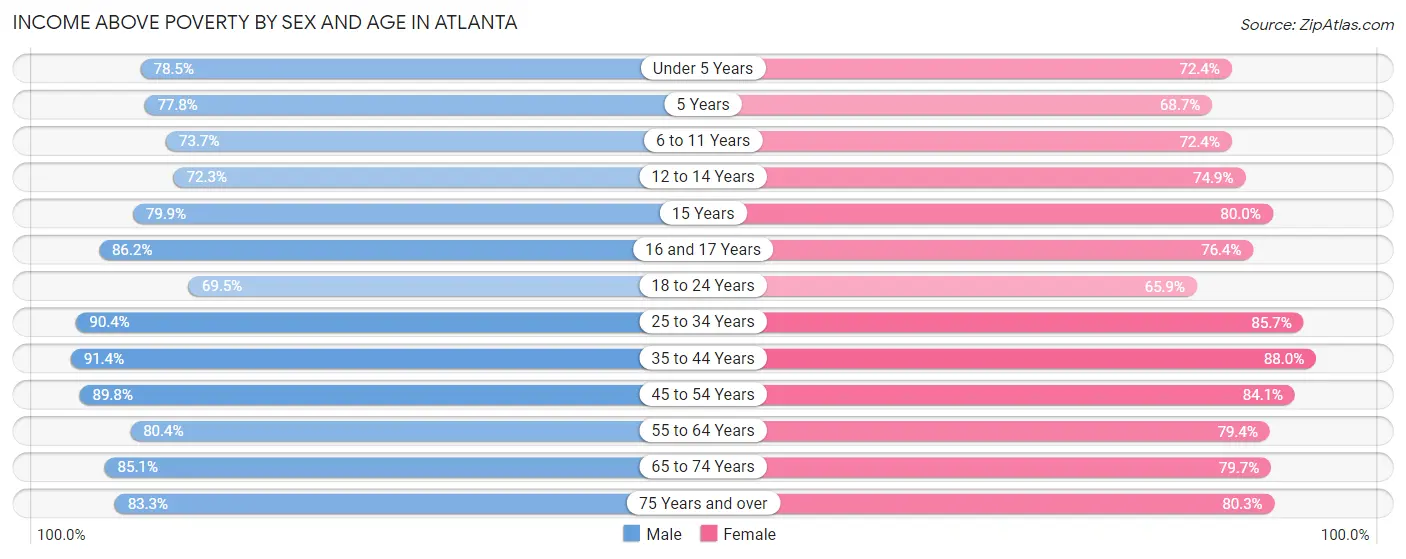
| Age Bracket | Male | Female |
| Under 5 Years | 10,658 (78.5%) | 9,028 (72.4%) |
| 5 Years | 1,321 (77.7%) | 1,792 (68.7%) |
| 6 to 11 Years | 10,531 (73.7%) | 11,327 (72.4%) |
| 12 to 14 Years | 4,077 (72.3%) | 4,620 (74.9%) |
| 15 Years | 1,797 (79.9%) | 1,677 (80.0%) |
| 16 and 17 Years | 3,128 (86.2%) | 2,961 (76.4%) |
| 18 to 24 Years | 14,796 (69.5%) | 14,602 (65.9%) |
| 25 to 34 Years | 48,433 (90.4%) | 45,338 (85.7%) |
| 35 to 44 Years | 30,706 (91.4%) | 31,196 (88.0%) |
| 45 to 54 Years | 25,650 (89.8%) | 22,195 (84.1%) |
| 55 to 64 Years | 19,409 (80.4%) | 19,118 (79.4%) |
| 65 to 74 Years | 12,751 (85.1%) | 15,762 (79.7%) |
| 75 Years and over | 7,299 (83.3%) | 11,159 (80.3%) |
| Total | 190,556 (84.3%) | 190,775 (80.3%) |
Income Below Poverty Among Married-Couple Families in Atlanta
The poverty statistics for married-couple families in Atlanta show that 4.3% or 2,418 of the total 55,896 families live below the poverty line. Families with 5 or more children have the highest poverty rate of 27.0%, comprising of 63 families. On the other hand, families with no children have the lowest poverty rate of 3.5%, which includes 1,222 families.
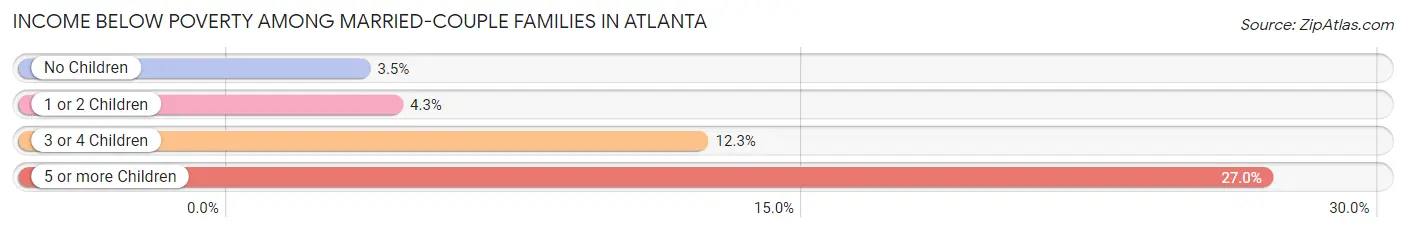
| Children | Above Poverty | Below Poverty |
| No Children | 34,047 (96.5%) | 1,222 (3.5%) |
| 1 or 2 Children | 16,464 (95.7%) | 741 (4.3%) |
| 3 or 4 Children | 2,797 (87.7%) | 392 (12.3%) |
| 5 or more Children | 170 (73.0%) | 63 (27.0%) |
| Total | 53,478 (95.7%) | 2,418 (4.3%) |
Income Below Poverty Among Single-Parent Households in Atlanta
According to the poverty data in Atlanta, 12.5% or 937 single-father households and 28.8% or 8,560 single-mother households are living below the poverty line. Among single-father households, those with 3 or 4 children have the highest poverty rate, with 74 households (26.4%) experiencing poverty. Likewise, among single-mother households, those with 3 or 4 children have the highest poverty rate, with 2,075 households (63.2%) falling below the poverty line.
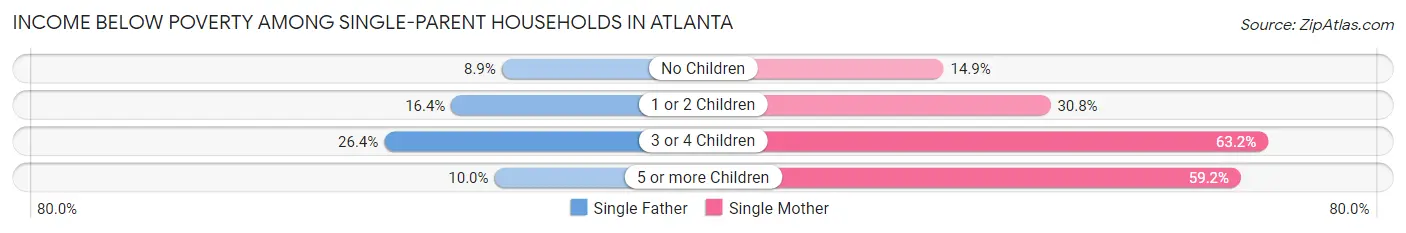
| Children | Single Father | Single Mother |
| No Children | 382 (8.9%) | 1,663 (14.9%) |
| 1 or 2 Children | 475 (16.4%) | 4,548 (30.8%) |
| 3 or 4 Children | 74 (26.4%) | 2,075 (63.2%) |
| 5 or more Children | 6 (10.0%) | 274 (59.2%) |
| Total | 937 (12.5%) | 8,560 (28.8%) |
Income Below Poverty Among Married-Couple vs Single-Parent Households in Atlanta
The poverty data for Atlanta shows that 2,418 of the married-couple family households (4.3%) and 9,497 of the single-parent households (25.5%) are living below the poverty level. Within the married-couple family households, those with 5 or more children have the highest poverty rate, with 63 households (27.0%) falling below the poverty line. Among the single-parent households, those with 3 or 4 children have the highest poverty rate, with 2,149 household (60.4%) living below poverty.
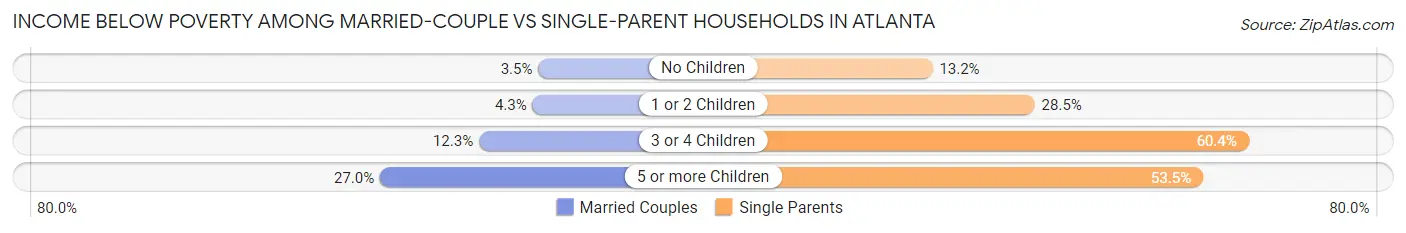
| Children | Married-Couple Families | Single-Parent Households |
| No Children | 1,222 (3.5%) | 2,045 (13.2%) |
| 1 or 2 Children | 741 (4.3%) | 5,023 (28.5%) |
| 3 or 4 Children | 392 (12.3%) | 2,149 (60.4%) |
| 5 or more Children | 63 (27.0%) | 280 (53.5%) |
| Total | 2,418 (4.3%) | 9,497 (25.5%) |
Race in Atlanta
The most populous races in Atlanta are Black / African American (235,308 | 47.5%), White / Caucasian (201,651 | 40.7%), and Hispanic or Latino (26,810 | 5.4%).
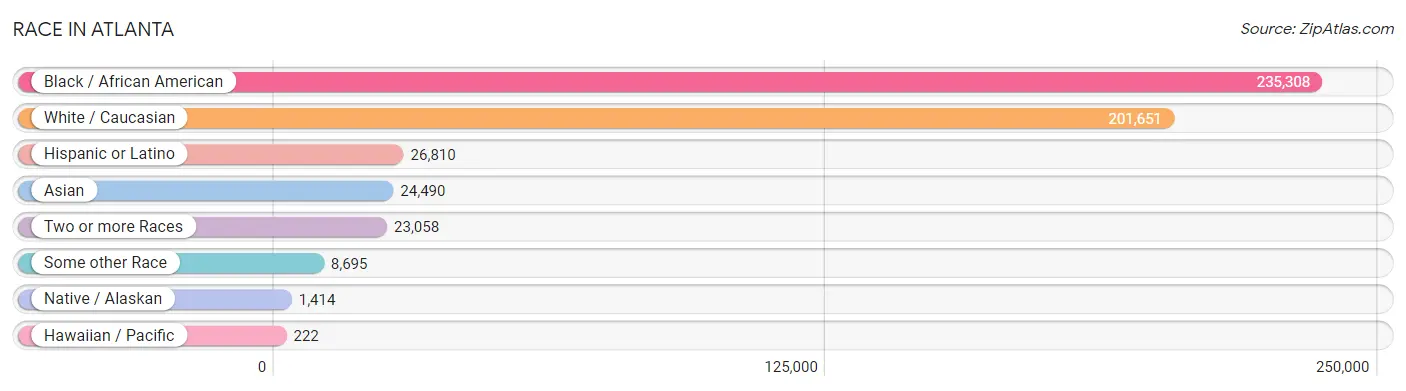
| Race | # Population | % Population |
| Asian | 24,490 | 5.0% |
| Black / African American | 235,308 | 47.5% |
| Hawaiian / Pacific | 222 | 0.0% |
| Hispanic or Latino | 26,810 | 5.4% |
| Native / Alaskan | 1,414 | 0.3% |
| White / Caucasian | 201,651 | 40.7% |
| Two or more Races | 23,058 | 4.7% |
| Some other Race | 8,695 | 1.8% |
| Total | 494,838 | 100.0% |
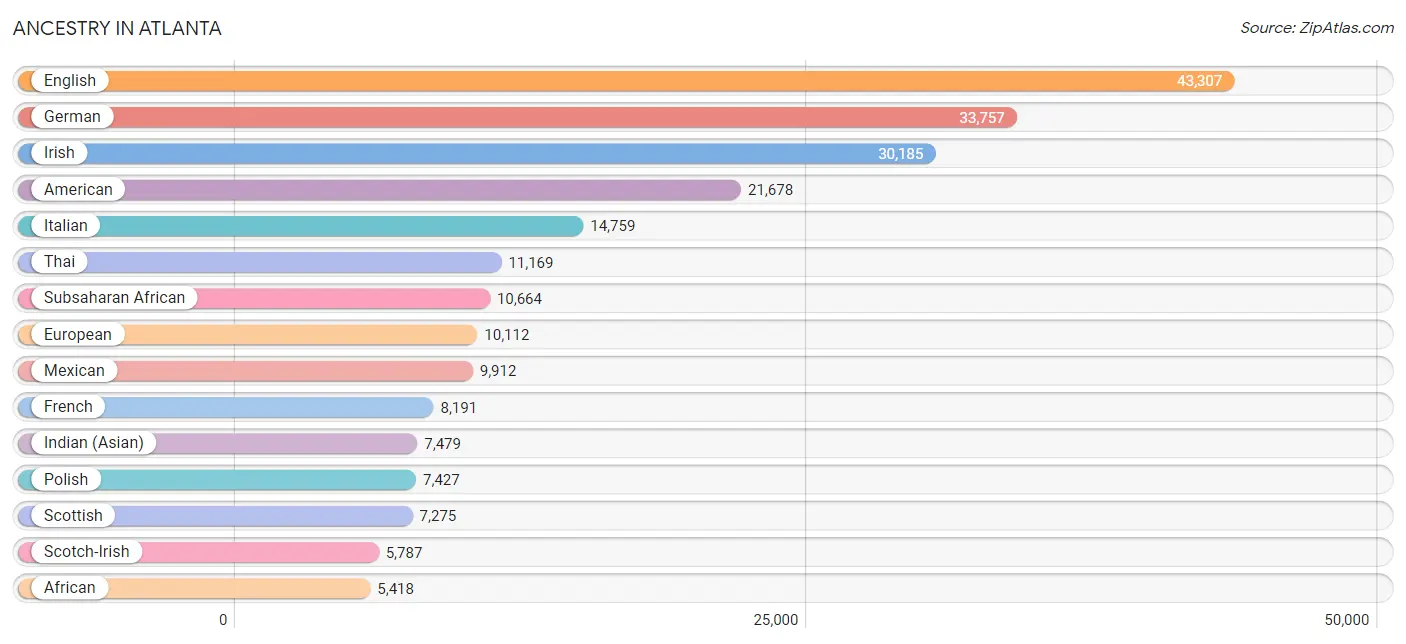
Ancestry in Atlanta
The most populous ancestries reported in Atlanta are English (43,307 | 8.7%), German (33,757 | 6.8%), Irish (30,185 | 6.1%), American (21,678 | 4.4%), and Italian (14,759 | 3.0%), together accounting for 29.0% of all Atlanta residents.
| Ancestry | # Population | % Population |
| Afghan | 63 | 0.0% |
| African | 5,418 | 1.1% |
| Albanian | 48 | 0.0% |
| Alsatian | 23 | 0.0% |
| American | 21,678 | 4.4% |
| Apache | 41 | 0.0% |
| Arab | 1,986 | 0.4% |
| Argentinean | 489 | 0.1% |
| Armenian | 296 | 0.1% |
| Assyrian / Chaldean / Syriac | 25 | 0.0% |
| Australian | 115 | 0.0% |
| Austrian | 1,067 | 0.2% |
| Bahamian | 188 | 0.0% |
| Bangladeshi | 59 | 0.0% |
| Barbadian | 130 | 0.0% |
| Belgian | 247 | 0.1% |
| Belizean | 85 | 0.0% |
| Bhutanese | 1,916 | 0.4% |
| Blackfeet | 316 | 0.1% |
| Bolivian | 42 | 0.0% |
| Brazilian | 675 | 0.1% |
| British | 3,822 | 0.8% |
| British West Indian | 387 | 0.1% |
| Bulgarian | 115 | 0.0% |
| Burmese | 3,398 | 0.7% |
| Cajun | 185 | 0.0% |
| Cambodian | 33 | 0.0% |
| Canadian | 683 | 0.1% |
| Cape Verdean | 132 | 0.0% |
| Celtic | 10 | 0.0% |
| Central American | 2,643 | 0.5% |
| Central American Indian | 128 | 0.0% |
| Cherokee | 1,408 | 0.3% |
| Chickasaw | 8 | 0.0% |
| Chilean | 239 | 0.1% |
| Chippewa | 37 | 0.0% |
| Choctaw | 80 | 0.0% |
| Colombian | 1,704 | 0.3% |
| Comanche | 8 | 0.0% |
| Costa Rican | 205 | 0.0% |
| Creek | 140 | 0.0% |
| Croatian | 430 | 0.1% |
| Cuban | 1,599 | 0.3% |
| Cypriot | 31 | 0.0% |
| Czech | 1,363 | 0.3% |
| Czechoslovakian | 149 | 0.0% |
| Danish | 1,190 | 0.2% |
| Delaware | 22 | 0.0% |
| Dominican | 1,391 | 0.3% |
| Dutch | 2,258 | 0.5% |
| Dutch West Indian | 32 | 0.0% |
| Eastern European | 2,273 | 0.5% |
| Ecuadorian | 506 | 0.1% |
| Egyptian | 294 | 0.1% |
| English | 43,307 | 8.7% |
| Estonian | 29 | 0.0% |
| Ethiopian | 975 | 0.2% |
| European | 10,112 | 2.0% |
| Filipino | 370 | 0.1% |
| Finnish | 412 | 0.1% |
| French | 8,191 | 1.7% |
| French American Indian | 6 | 0.0% |
| French Canadian | 744 | 0.2% |
| German | 33,757 | 6.8% |
| Ghanaian | 849 | 0.2% |
| Greek | 1,875 | 0.4% |
| Guamanian / Chamorro | 96 | 0.0% |
| Guatemalan | 444 | 0.1% |
| Guyanese | 435 | 0.1% |
| Haitian | 892 | 0.2% |
| Honduran | 775 | 0.2% |
| Hungarian | 1,075 | 0.2% |
| Icelander | 13 | 0.0% |
| Indian (Asian) | 7,479 | 1.5% |
| Inupiat | 42 | 0.0% |
| Iranian | 1,105 | 0.2% |
| Iraqi | 19 | 0.0% |
| Irish | 30,185 | 6.1% |
| Iroquois | 35 | 0.0% |
| Israeli | 101 | 0.0% |
| Italian | 14,759 | 3.0% |
| Jamaican | 3,687 | 0.7% |
| Japanese | 98 | 0.0% |
| Jordanian | 15 | 0.0% |
| Kenyan | 200 | 0.0% |
| Korean | 3,006 | 0.6% |
| Laotian | 121 | 0.0% |
| Latvian | 502 | 0.1% |
| Lebanese | 493 | 0.1% |
| Liberian | 241 | 0.1% |
| Lithuanian | 836 | 0.2% |
| Lumbee | 48 | 0.0% |
| Luxembourger | 64 | 0.0% |
| Malaysian | 134 | 0.0% |
| Maltese | 63 | 0.0% |
| Mexican | 9,912 | 2.0% |
| Mexican American Indian | 676 | 0.1% |
| Mongolian | 101 | 0.0% |
| Moroccan | 202 | 0.0% |
| Native Hawaiian | 162 | 0.0% |
| Navajo | 30 | 0.0% |
| Nicaraguan | 278 | 0.1% |
| Nigerian | 1,629 | 0.3% |
| Northern European | 969 | 0.2% |
| Norwegian | 2,266 | 0.5% |
| Osage | 9 | 0.0% |
| Pakistani | 448 | 0.1% |
| Palestinian | 63 | 0.0% |
| Panamanian | 705 | 0.1% |
| Paraguayan | 48 | 0.0% |
| Pennsylvania German | 17 | 0.0% |
| Peruvian | 571 | 0.1% |
| Polish | 7,427 | 1.5% |
| Portuguese | 1,054 | 0.2% |
| Puerto Rican | 4,319 | 0.9% |
| Romanian | 387 | 0.1% |
| Russian | 4,401 | 0.9% |
| Salvadoran | 236 | 0.1% |
| Samoan | 125 | 0.0% |
| Scandinavian | 845 | 0.2% |
| Scotch-Irish | 5,787 | 1.2% |
| Scottish | 7,275 | 1.5% |
| Seminole | 97 | 0.0% |
| Senegalese | 225 | 0.1% |
| Serbian | 208 | 0.0% |
| Sioux | 14 | 0.0% |
| Slavic | 62 | 0.0% |
| Slovak | 493 | 0.1% |
| Slovene | 81 | 0.0% |
| Somali | 54 | 0.0% |
| South African | 252 | 0.1% |
| South American | 4,235 | 0.9% |
| South American Indian | 199 | 0.0% |
| Soviet Union | 193 | 0.0% |
| Spaniard | 854 | 0.2% |
| Spanish | 555 | 0.1% |
| Spanish American | 5 | 0.0% |
| Sri Lankan | 1,490 | 0.3% |
| Subsaharan African | 10,664 | 2.2% |
| Sudanese | 26 | 0.0% |
| Swedish | 3,062 | 0.6% |
| Swiss | 811 | 0.2% |
| Syrian | 376 | 0.1% |
| Taiwanese | 9 | 0.0% |
| Thai | 11,169 | 2.3% |
| Trinidadian and Tobagonian | 1,033 | 0.2% |
| Turkish | 452 | 0.1% |
| U.S. Virgin Islander | 202 | 0.0% |
| Ugandan | 83 | 0.0% |
| Ukrainian | 976 | 0.2% |
| Uruguayan | 151 | 0.0% |
| Venezuelan | 485 | 0.1% |
| Vietnamese | 189 | 0.0% |
| Welsh | 2,387 | 0.5% |
| West Indian | 681 | 0.1% |
| Yugoslavian | 158 | 0.0% |
| Yup'ik | 4 | 0.0% | View All 157 Rows |
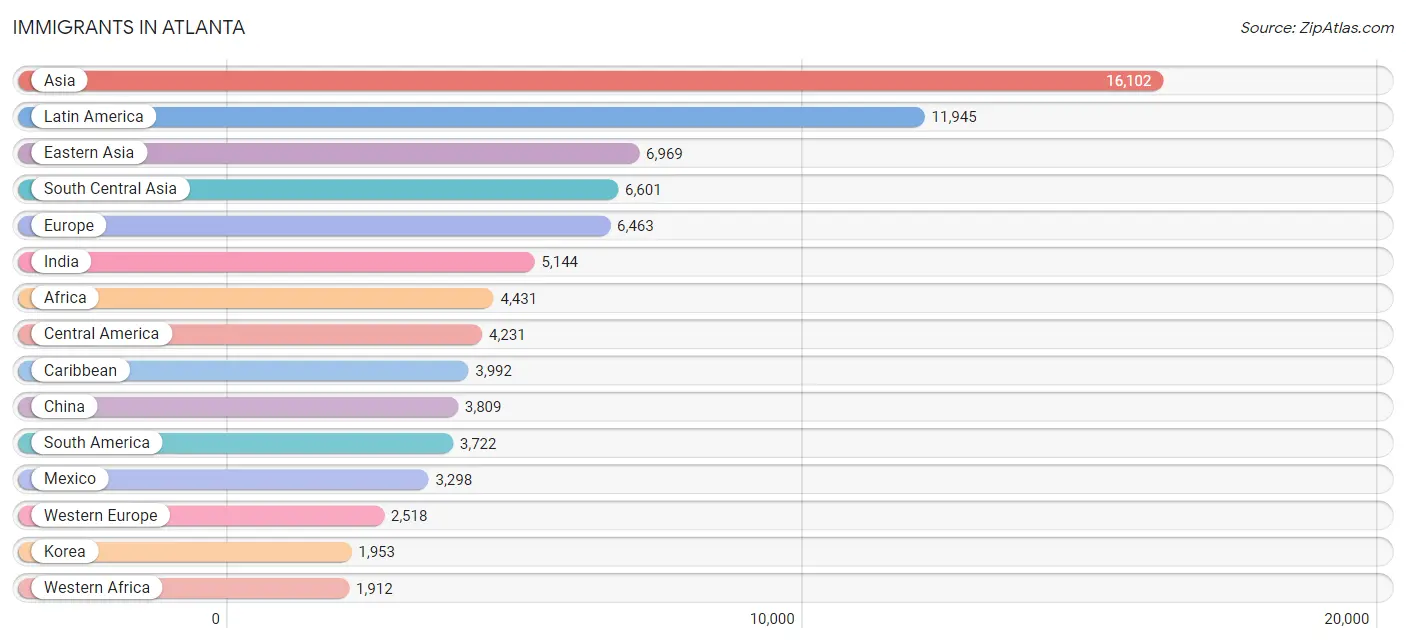
Immigrants in Atlanta
The most numerous immigrant groups reported in Atlanta came from Asia (16,102 | 3.3%), Latin America (11,945 | 2.4%), Eastern Asia (6,969 | 1.4%), South Central Asia (6,601 | 1.3%), and Europe (6,463 | 1.3%), together accounting for 9.7% of all Atlanta residents.
| Immigration Origin | # Population | % Population |
| Afghanistan | 48 | 0.0% |
| Africa | 4,431 | 0.9% |
| Argentina | 185 | 0.0% |
| Armenia | 10 | 0.0% |
| Asia | 16,102 | 3.3% |
| Australia | 307 | 0.1% |
| Austria | 74 | 0.0% |
| Bahamas | 162 | 0.0% |
| Bangladesh | 296 | 0.1% |
| Barbados | 92 | 0.0% |
| Belarus | 101 | 0.0% |
| Belgium | 70 | 0.0% |
| Bolivia | 7 | 0.0% |
| Bosnia and Herzegovina | 56 | 0.0% |
| Brazil | 811 | 0.2% |
| Bulgaria | 60 | 0.0% |
| Cameroon | 166 | 0.0% |
| Canada | 1,361 | 0.3% |
| Caribbean | 3,992 | 0.8% |
| Central America | 4,231 | 0.9% |
| Chile | 72 | 0.0% |
| China | 3,809 | 0.8% |
| Colombia | 1,036 | 0.2% |
| Costa Rica | 140 | 0.0% |
| Croatia | 11 | 0.0% |
| Cuba | 484 | 0.1% |
| Czechoslovakia | 25 | 0.0% |
| Denmark | 146 | 0.0% |
| Dominica | 157 | 0.0% |
| Dominican Republic | 398 | 0.1% |
| Eastern Africa | 1,238 | 0.3% |
| Eastern Asia | 6,969 | 1.4% |
| Eastern Europe | 1,513 | 0.3% |
| Ecuador | 304 | 0.1% |
| Egypt | 139 | 0.0% |
| El Salvador | 82 | 0.0% |
| England | 362 | 0.1% |
| Eritrea | 130 | 0.0% |
| Ethiopia | 707 | 0.1% |
| Europe | 6,463 | 1.3% |
| France | 1,118 | 0.2% |
| Germany | 1,098 | 0.2% |
| Ghana | 495 | 0.1% |
| Greece | 120 | 0.0% |
| Grenada | 42 | 0.0% |
| Guatemala | 234 | 0.1% |
| Guyana | 354 | 0.1% |
| Haiti | 317 | 0.1% |
| Honduras | 292 | 0.1% |
| Hong Kong | 157 | 0.0% |
| Hungary | 25 | 0.0% |
| India | 5,144 | 1.0% |
| Indonesia | 91 | 0.0% |
| Iran | 683 | 0.1% |
| Iraq | 8 | 0.0% |
| Ireland | 160 | 0.0% |
| Israel | 45 | 0.0% |
| Italy | 322 | 0.1% |
| Jamaica | 1,443 | 0.3% |
| Japan | 1,147 | 0.2% |
| Jordan | 12 | 0.0% |
| Kenya | 219 | 0.0% |
| Korea | 1,953 | 0.4% |
| Kuwait | 118 | 0.0% |
| Laos | 105 | 0.0% |
| Latin America | 11,945 | 2.4% |
| Latvia | 287 | 0.1% |
| Lebanon | 39 | 0.0% |
| Liberia | 177 | 0.0% |
| Lithuania | 49 | 0.0% |
| Malaysia | 239 | 0.1% |
| Mexico | 3,298 | 0.7% |
| Micronesia | 12 | 0.0% |
| Middle Africa | 189 | 0.0% |
| Moldova | 38 | 0.0% |
| Morocco | 222 | 0.0% |
| Nepal | 124 | 0.0% |
| Netherlands | 137 | 0.0% |
| Nicaragua | 39 | 0.0% |
| Nigeria | 645 | 0.1% |
| Northern Africa | 533 | 0.1% |
| Northern Europe | 1,587 | 0.3% |
| Oceania | 383 | 0.1% |
| Pakistan | 155 | 0.0% |
| Panama | 146 | 0.0% |
| Peru | 342 | 0.1% |
| Philippines | 642 | 0.1% |
| Poland | 154 | 0.0% |
| Portugal | 209 | 0.0% |
| Romania | 89 | 0.0% |
| Russia | 364 | 0.1% |
| Saudi Arabia | 96 | 0.0% |
| Scotland | 10 | 0.0% |
| Senegal | 290 | 0.1% |
| Serbia | 36 | 0.0% |
| Singapore | 98 | 0.0% |
| South Africa | 361 | 0.1% |
| South America | 3,722 | 0.7% |
| South Central Asia | 6,601 | 1.3% |
| South Eastern Asia | 1,892 | 0.4% |
| Southern Europe | 787 | 0.2% |
| Spain | 136 | 0.0% |
| Sri Lanka | 99 | 0.0% |
| St. Vincent and the Grenadines | 29 | 0.0% |
| Sudan | 55 | 0.0% |
| Sweden | 74 | 0.0% |
| Switzerland | 21 | 0.0% |
| Syria | 40 | 0.0% |
| Taiwan | 312 | 0.1% |
| Thailand | 167 | 0.0% |
| Trinidad and Tobago | 656 | 0.1% |
| Turkey | 196 | 0.0% |
| Uganda | 24 | 0.0% |
| Ukraine | 153 | 0.0% |
| Uruguay | 104 | 0.0% |
| Uzbekistan | 52 | 0.0% |
| Venezuela | 362 | 0.1% |
| Vietnam | 550 | 0.1% |
| West Indies | 31 | 0.0% |
| Western Africa | 1,912 | 0.4% |
| Western Asia | 640 | 0.1% |
| Western Europe | 2,518 | 0.5% |
| Zaire | 23 | 0.0% |
| Zimbabwe | 53 | 0.0% | View All 124 Rows |
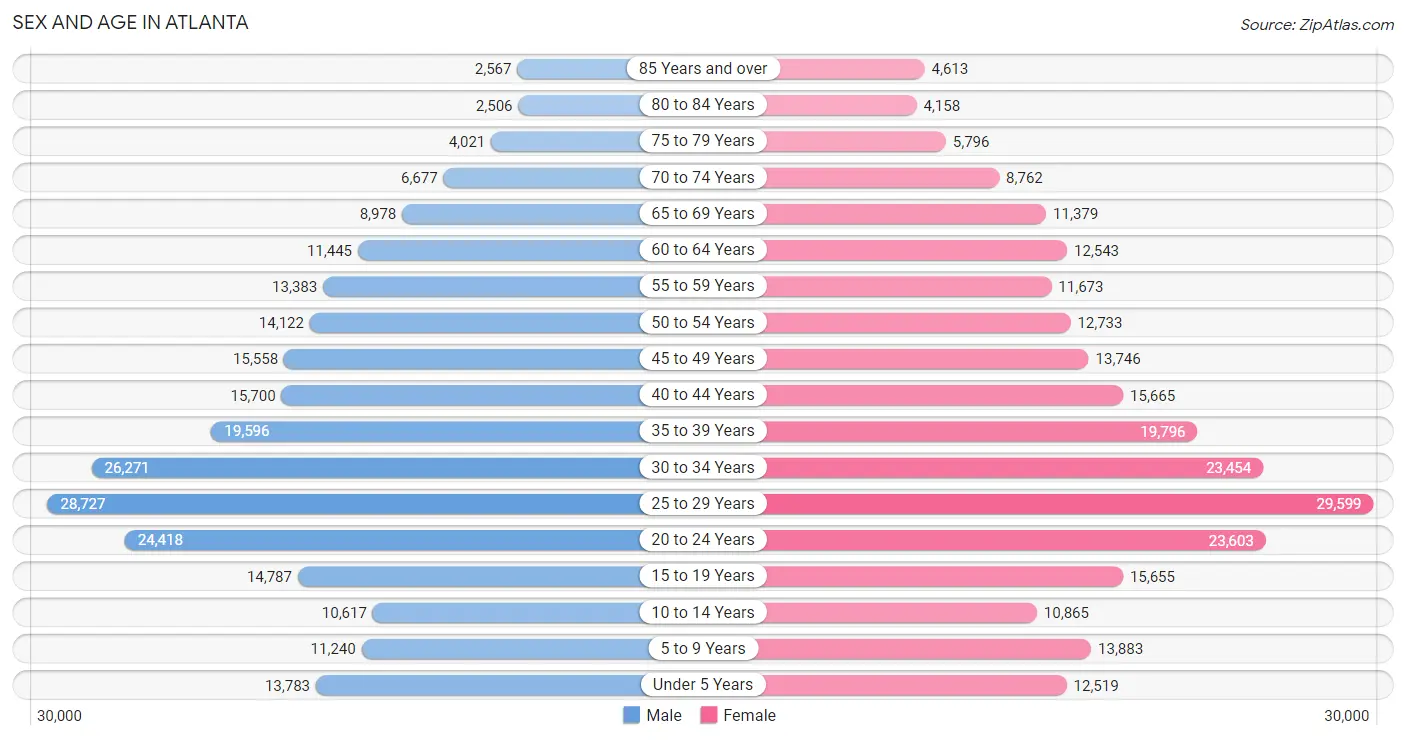
Sex and Age in Atlanta
Sex and Age in Atlanta
The most populous age groups in Atlanta are 25 to 29 Years (28,727 | 11.7%) for men and 25 to 29 Years (29,599 | 11.8%) for women.
| Age Bracket | Male | Female |
| Under 5 Years | 13,783 (5.6%) | 12,519 (5.0%) |
| 5 to 9 Years | 11,240 (4.6%) | 13,883 (5.5%) |
| 10 to 14 Years | 10,617 (4.3%) | 10,865 (4.3%) |
| 15 to 19 Years | 14,787 (6.0%) | 15,655 (6.2%) |
| 20 to 24 Years | 24,418 (10.0%) | 23,603 (9.4%) |
| 25 to 29 Years | 28,727 (11.7%) | 29,599 (11.8%) |
| 30 to 34 Years | 26,271 (10.7%) | 23,454 (9.4%) |
| 35 to 39 Years | 19,596 (8.0%) | 19,796 (7.9%) |
| 40 to 44 Years | 15,700 (6.4%) | 15,665 (6.2%) |
| 45 to 49 Years | 15,558 (6.4%) | 13,746 (5.5%) |
| 50 to 54 Years | 14,122 (5.8%) | 12,733 (5.1%) |
| 55 to 59 Years | 13,383 (5.5%) | 11,673 (4.7%) |
| 60 to 64 Years | 11,445 (4.7%) | 12,543 (5.0%) |
| 65 to 69 Years | 8,978 (3.7%) | 11,379 (4.5%) |
| 70 to 74 Years | 6,677 (2.7%) | 8,762 (3.5%) |
| 75 to 79 Years | 4,021 (1.7%) | 5,796 (2.3%) |
| 80 to 84 Years | 2,506 (1.0%) | 4,158 (1.7%) |
| 85 Years and over | 2,567 (1.1%) | 4,613 (1.8%) |
| Total | 244,396 (100.0%) | 250,442 (100.0%) |
Families and Households in Atlanta
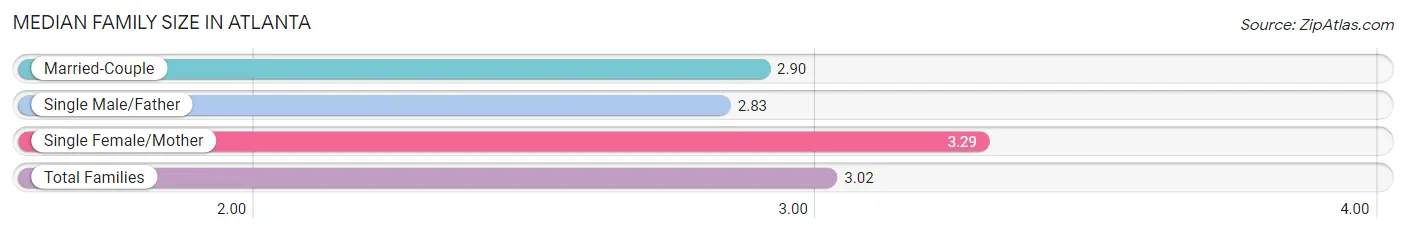
Median Family Size in Atlanta
The median family size in Atlanta is 3.02 persons per family, with single female/mother families (29,681 | 31.9%) accounting for the largest median family size of 3.29 persons per family. On the other hand, single male/father families (7,514 | 8.1%) represent the smallest median family size with 2.83 persons per family.
| Family Type | # Families | Family Size |
| Married-Couple | 55,896 (60.0%) | 2.90 |
| Single Male/Father | 7,514 (8.1%) | 2.83 |
| Single Female/Mother | 29,681 (31.9%) | 3.29 |
| Total Families | 93,091 (100.0%) | 3.02 |
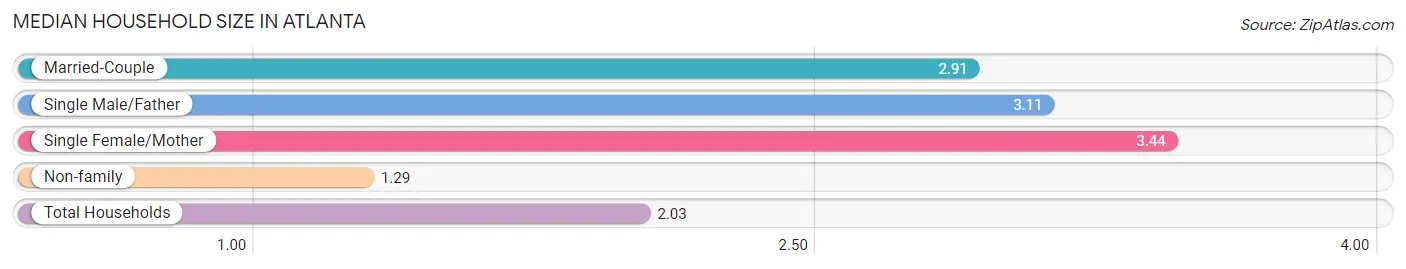
Median Household Size in Atlanta
The median household size in Atlanta is 2.03 persons per household, with single female/mother households (29,681 | 13.1%) accounting for the largest median household size of 3.44 persons per household. non-family households (134,297 | 59.1%) represent the smallest median household size with 1.29 persons per household.
| Household Type | # Households | Household Size |
| Married-Couple | 55,896 (24.6%) | 2.91 |
| Single Male/Father | 7,514 (3.3%) | 3.11 |
| Single Female/Mother | 29,681 (13.1%) | 3.44 |
| Non-family | 134,297 (59.1%) | 1.29 |
| Total Households | 227,388 (100.0%) | 2.03 |
Household Size by Marriage Status in Atlanta
Out of a total of 227,388 households in Atlanta, 93,091 (40.9%) are family households, while 134,297 (59.1%) are nonfamily households. The most numerous type of family households are 2-person households, comprising 48,358, and the most common type of nonfamily households are 1-person households, comprising 105,824.
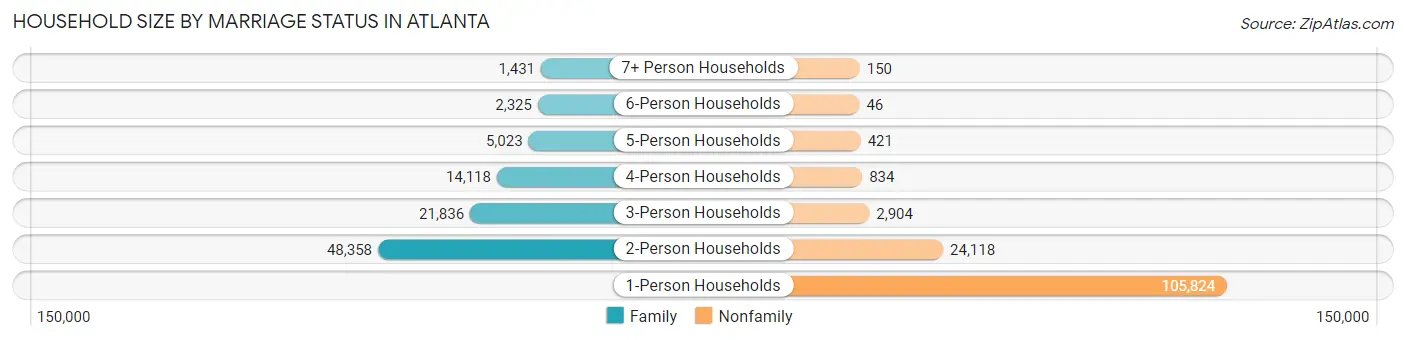
| Household Size | Family Households | Nonfamily Households |
| 1-Person Households | - | 105,824 (46.5%) |
| 2-Person Households | 48,358 (21.3%) | 24,118 (10.6%) |
| 3-Person Households | 21,836 (9.6%) | 2,904 (1.3%) |
| 4-Person Households | 14,118 (6.2%) | 834 (0.4%) |
| 5-Person Households | 5,023 (2.2%) | 421 (0.2%) |
| 6-Person Households | 2,325 (1.0%) | 46 (0.0%) |
| 7+ Person Households | 1,431 (0.6%) | 150 (0.1%) |
| Total | 93,091 (40.9%) | 134,297 (59.1%) |
Female Fertility in Atlanta
Fertility by Age in Atlanta
Average fertility rate in Atlanta is 41.0 births per 1,000 women. Women in the age bracket of 20 to 34 years have the highest fertility rate with 47.0 births per 1,000 women. Women in the age bracket of 20 to 34 years acount for 61.4% of all women with births.
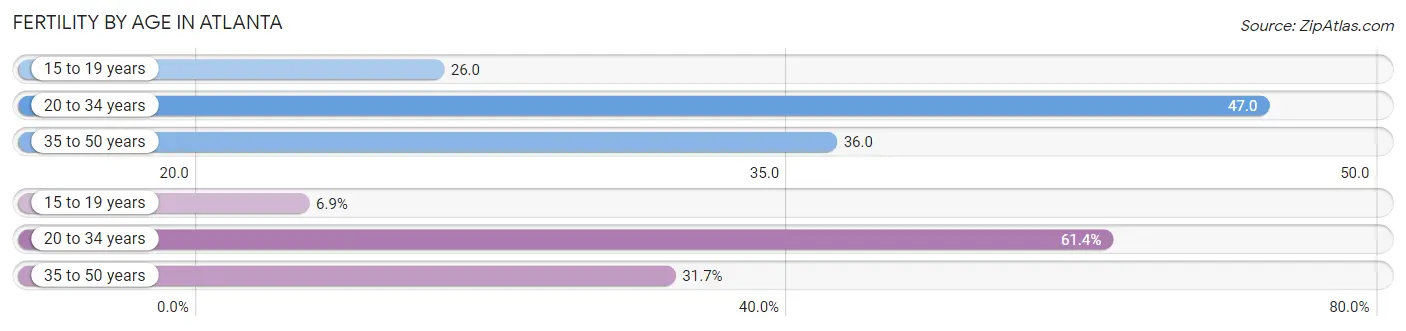
| Age Bracket | Women with Births | Births / 1,000 Women |
| 15 to 19 years | 401 (6.9%) | 26.0 |
| 20 to 34 years | 3,592 (61.4%) | 47.0 |
| 35 to 50 years | 1,855 (31.7%) | 36.0 |
| Total | 5,848 (100.0%) | 41.0 |
Fertility by Age by Marriage Status in Atlanta
56.5% of women with births (5,848) in Atlanta are married. The highest percentage of unmarried women with births falls into 15 to 19 years age bracket with 100.0% of them unmarried at the time of birth, while the lowest percentage of unmarried women with births belong to 35 to 50 years age bracket with 27.9% of them unmarried.
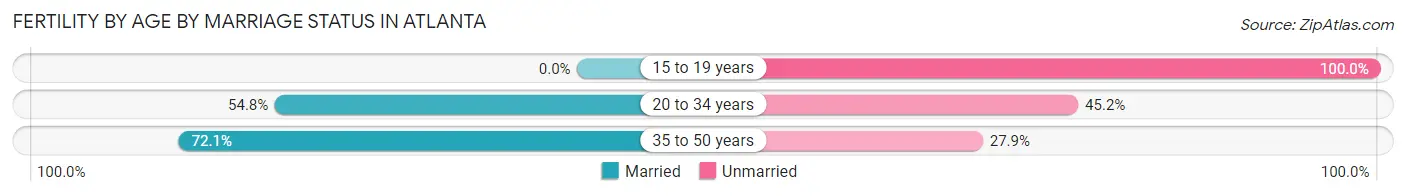
| Age Bracket | Married | Unmarried |
| 15 to 19 years | 0 (0.0%) | 401 (100.0%) |
| 20 to 34 years | 1,968 (54.8%) | 1,624 (45.2%) |
| 35 to 50 years | 1,337 (72.1%) | 518 (27.9%) |
| Total | 3,304 (56.5%) | 2,544 (43.5%) |
Fertility by Education in Atlanta
Average fertility rate in Atlanta is 41.0 births per 1,000 women. Women with the education attainment of high school diploma have the highest fertility rate of 48.0 births per 1,000 women, while women with the education attainment of college or associate's degree have the lowest fertility at 32.0 births per 1,000 women. Women with the education attainment of bachelor's degree represent 35.2% of all women with births.
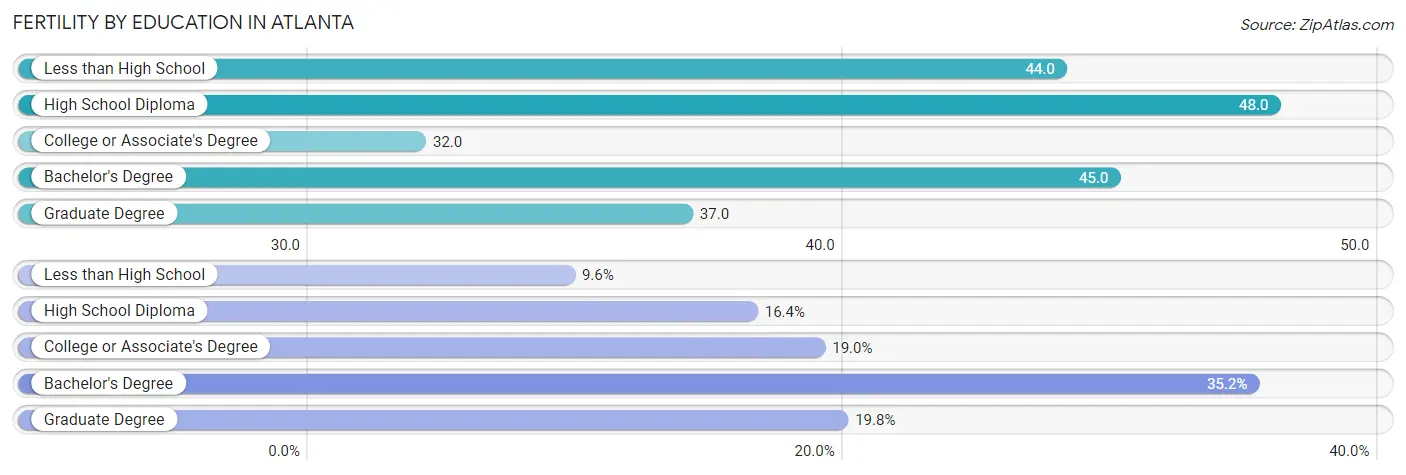
| Educational Attainment | Women with Births | Births / 1,000 Women |
| Less than High School | 560 (9.6%) | 44.0 |
| High School Diploma | 961 (16.4%) | 48.0 |
| College or Associate's Degree | 1,109 (19.0%) | 32.0 |
| Bachelor's Degree | 2,059 (35.2%) | 45.0 |
| Graduate Degree | 1,159 (19.8%) | 37.0 |
| Total | 5,848 (100.0%) | 41.0 |
Fertility by Education by Marriage Status in Atlanta
43.5% of women with births in Atlanta are unmarried. Women with the educational attainment of graduate degree are most likely to be married with 94.9% of them married at childbirth, while women with the educational attainment of high school diploma are least likely to be married with 82.9% of them unmarried at childbirth.
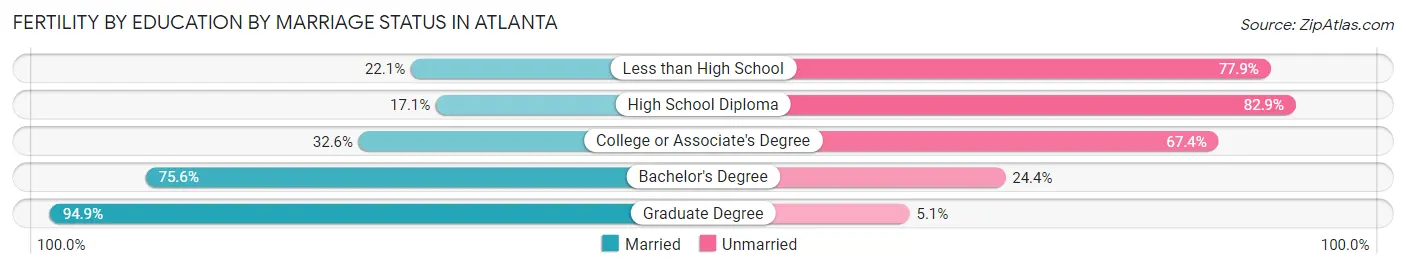
| Educational Attainment | Married | Unmarried |
| Less than High School | 124 (22.1%) | 436 (77.9%) |
| High School Diploma | 164 (17.1%) | 797 (82.9%) |
| College or Associate's Degree | 362 (32.6%) | 747 (67.4%) |
| Bachelor's Degree | 1,557 (75.6%) | 502 (24.4%) |
| Graduate Degree | 1,100 (94.9%) | 59 (5.1%) |
| Total | 3,304 (56.5%) | 2,544 (43.5%) |
Employment Characteristics in Atlanta
Employment by Class of Employer in Atlanta
Among the 258,815 employed individuals in Atlanta, private company employees (175,466 | 67.8%), not-for-profit organizations (21,743 | 8.4%), and self-employed (incorporated) (14,740 | 5.7%) make up the most common classes of employment.
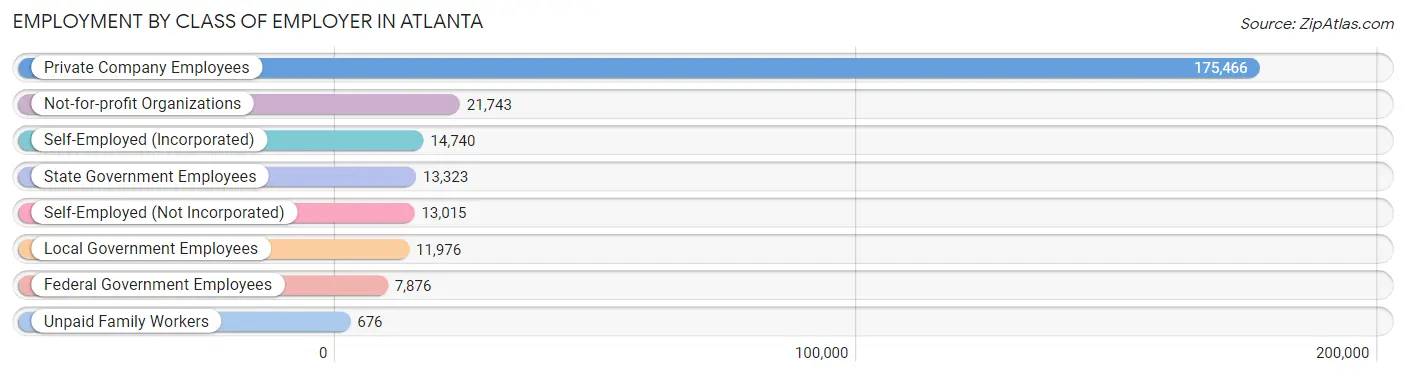
| Employer Class | # Employees | % Employees |
| Private Company Employees | 175,466 | 67.8% |
| Self-Employed (Incorporated) | 14,740 | 5.7% |
| Self-Employed (Not Incorporated) | 13,015 | 5.0% |
| Not-for-profit Organizations | 21,743 | 8.4% |
| Local Government Employees | 11,976 | 4.6% |
| State Government Employees | 13,323 | 5.1% |
| Federal Government Employees | 7,876 | 3.0% |
| Unpaid Family Workers | 676 | 0.3% |
| Total | 258,815 | 100.0% |
Employment Status by Age in Atlanta
According to the labor force statistics for Atlanta, out of the total population over 16 years of age (417,566), 67.3% or 281,022 individuals are in the labor force, with 5.8% or 16,299 of them unemployed. The age group with the highest labor force participation rate is 25 to 29 years, with 89.5% or 52,202 individuals in the labor force. Within the labor force, the 16 to 19 years age range has the highest percentage of unemployed individuals, with 26.8% or 1,845 of them being unemployed.
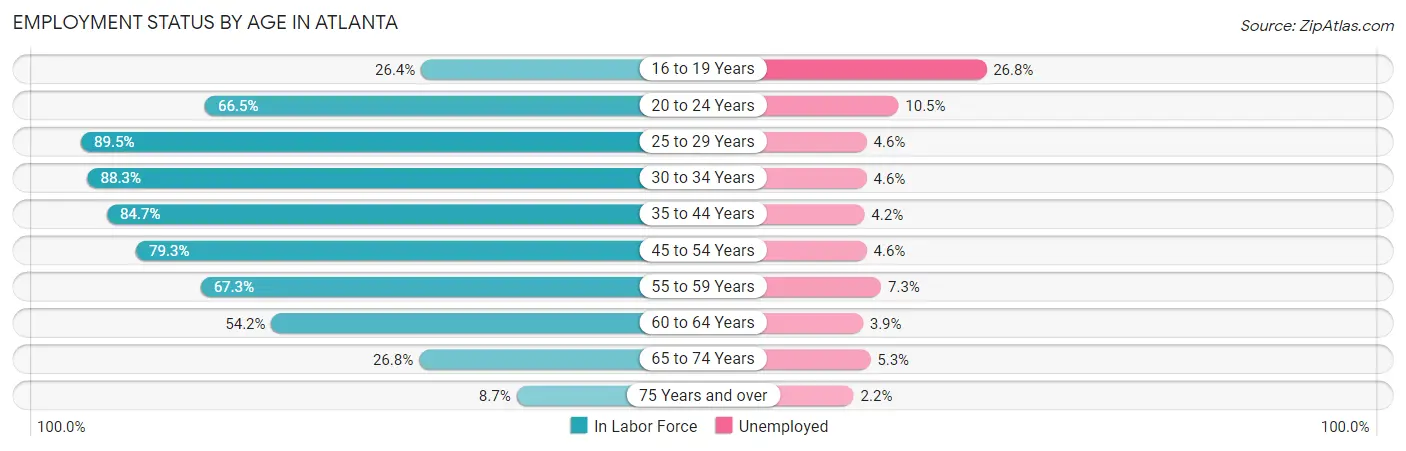
| Age Bracket | In Labor Force | Unemployed |
| 16 to 19 Years | 6,884 (26.4%) | 1,845 (26.8%) |
| 20 to 24 Years | 31,934 (66.5%) | 3,353 (10.5%) |
| 25 to 29 Years | 52,202 (89.5%) | 2,401 (4.6%) |
| 30 to 34 Years | 43,907 (88.3%) | 2,020 (4.6%) |
| 35 to 44 Years | 59,931 (84.7%) | 2,517 (4.2%) |
| 45 to 54 Years | 44,534 (79.3%) | 2,049 (4.6%) |
| 55 to 59 Years | 16,863 (67.3%) | 1,231 (7.3%) |
| 60 to 64 Years | 13,001 (54.2%) | 507 (3.9%) |
| 65 to 74 Years | 9,593 (26.8%) | 508 (5.3%) |
| 75 Years and over | 2,059 (8.7%) | 45 (2.2%) |
| Total | 281,022 (67.3%) | 16,299 (5.8%) |
Employment Status by Educational Attainment in Atlanta
According to labor force statistics for Atlanta, 81.1% of individuals (230,333) out of the total population between 25 and 64 years of age (284,011) are in the labor force, with 4.6% or 10,595 of them being unemployed. The group with the highest labor force participation rate are those with the educational attainment of bachelor's degree or higher, with 89.8% or 153,991 individuals in the labor force. Within the labor force, individuals with less than high school education have the highest percentage of unemployment, with 12.0% or 923 of them being unemployed.
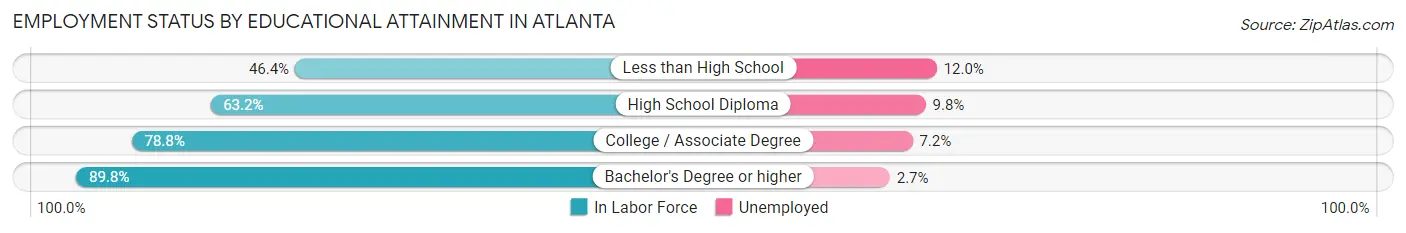
| Educational Attainment | In Labor Force | Unemployed |
| Less than High School | 7,688 (46.4%) | 1,988 (12.0%) |
| High School Diploma | 28,125 (63.2%) | 4,361 (9.8%) |
| College / Associate Degree | 40,550 (78.8%) | 3,705 (7.2%) |
| Bachelor's Degree or higher | 153,991 (89.8%) | 4,630 (2.7%) |
| Total | 230,333 (81.1%) | 13,065 (4.6%) |
Employment Occupations by Sex in Atlanta
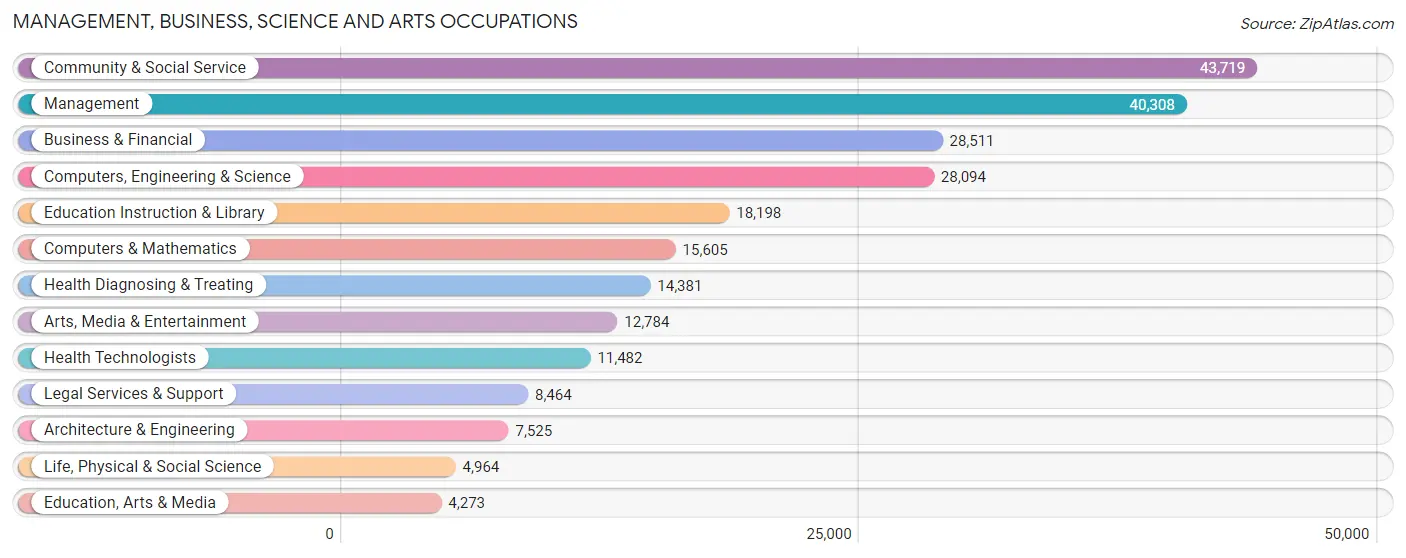
Management, Business, Science and Arts Occupations
The most common Management, Business, Science and Arts occupations in Atlanta are Community & Social Service (43,719 | 16.6%), Management (40,308 | 15.3%), Business & Financial (28,511 | 10.8%), Computers, Engineering & Science (28,094 | 10.6%), and Education Instruction & Library (18,198 | 6.9%).
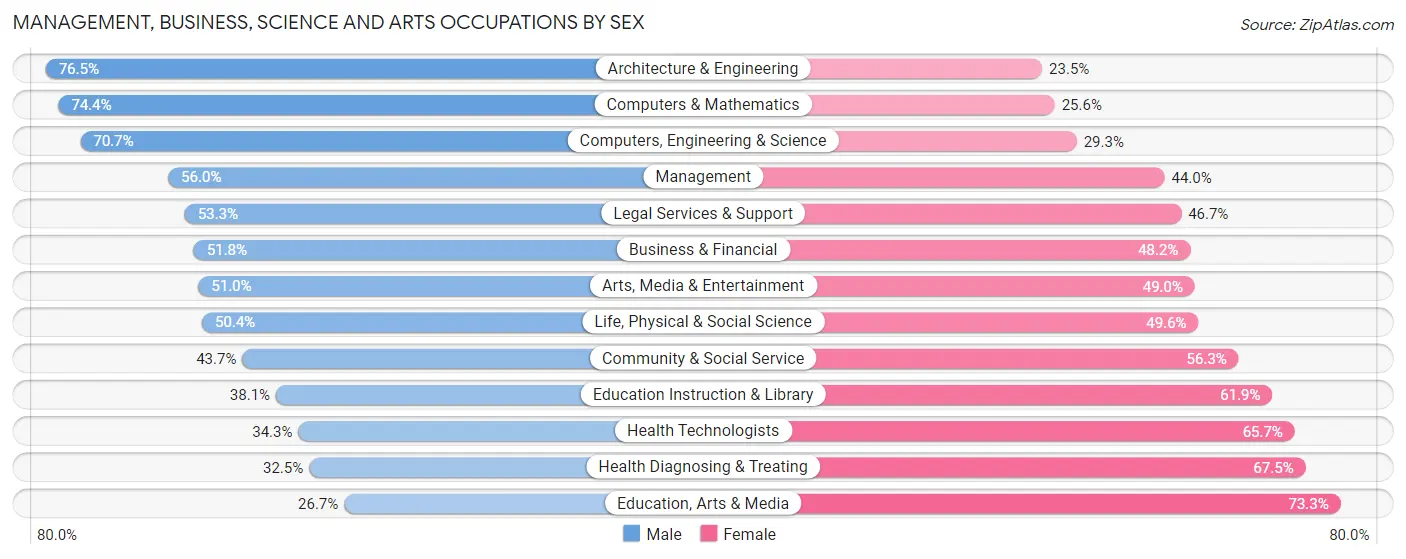
Management, Business, Science and Arts Occupations by Sex
Within the Management, Business, Science and Arts occupations in Atlanta, the most male-oriented occupations are Architecture & Engineering (76.5%), Computers & Mathematics (74.4%), and Computers, Engineering & Science (70.7%), while the most female-oriented occupations are Education, Arts & Media (73.3%), Health Diagnosing & Treating (67.5%), and Health Technologists (65.7%).
| Occupation | Male | Female |
| Management | 22,590 (56.0%) | 17,718 (44.0%) |
| Business & Financial | 14,761 (51.8%) | 13,750 (48.2%) |
| Computers, Engineering & Science | 19,862 (70.7%) | 8,232 (29.3%) |
| Computers & Mathematics | 11,606 (74.4%) | 3,999 (25.6%) |
| Architecture & Engineering | 5,754 (76.5%) | 1,771 (23.5%) |
| Life, Physical & Social Science | 2,502 (50.4%) | 2,462 (49.6%) |
| Community & Social Service | 19,096 (43.7%) | 24,623 (56.3%) |
| Education, Arts & Media | 1,140 (26.7%) | 3,133 (73.3%) |
| Legal Services & Support | 4,509 (53.3%) | 3,955 (46.7%) |
| Education Instruction & Library | 6,927 (38.1%) | 11,271 (61.9%) |
| Arts, Media & Entertainment | 6,520 (51.0%) | 6,264 (49.0%) |
| Health Diagnosing & Treating | 4,678 (32.5%) | 9,703 (67.5%) |
| Health Technologists | 3,942 (34.3%) | 7,540 (65.7%) |
| Total (Category) | 80,987 (52.2%) | 74,026 (47.7%) |
| Total (Overall) | 137,123 (51.9%) | 126,916 (48.1%) |
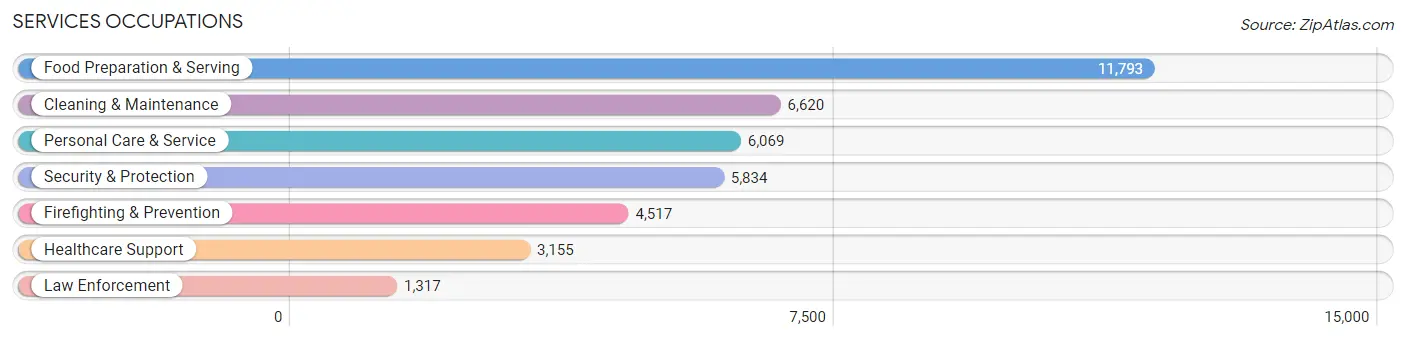
Services Occupations
The most common Services occupations in Atlanta are Food Preparation & Serving (11,793 | 4.5%), Cleaning & Maintenance (6,620 | 2.5%), Personal Care & Service (6,069 | 2.3%), Security & Protection (5,834 | 2.2%), and Firefighting & Prevention (4,517 | 1.7%).
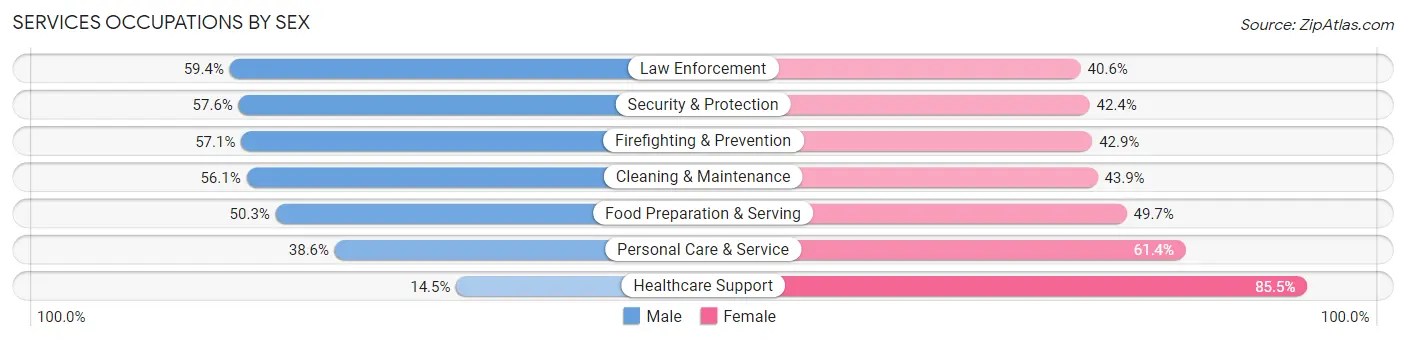
Services Occupations by Sex
Within the Services occupations in Atlanta, the most male-oriented occupations are Law Enforcement (59.4%), Security & Protection (57.6%), and Firefighting & Prevention (57.1%), while the most female-oriented occupations are Healthcare Support (85.5%), Personal Care & Service (61.4%), and Food Preparation & Serving (49.7%).
| Occupation | Male | Female |
| Healthcare Support | 458 (14.5%) | 2,697 (85.5%) |
| Security & Protection | 3,361 (57.6%) | 2,473 (42.4%) |
| Firefighting & Prevention | 2,579 (57.1%) | 1,938 (42.9%) |
| Law Enforcement | 782 (59.4%) | 535 (40.6%) |
| Food Preparation & Serving | 5,931 (50.3%) | 5,862 (49.7%) |
| Cleaning & Maintenance | 3,711 (56.1%) | 2,909 (43.9%) |
| Personal Care & Service | 2,340 (38.6%) | 3,729 (61.4%) |
| Total (Category) | 15,801 (47.2%) | 17,670 (52.8%) |
| Total (Overall) | 137,123 (51.9%) | 126,916 (48.1%) |
Sales and Office Occupations
The most common Sales and Office occupations in Atlanta are Sales & Related (25,959 | 9.8%), and Office & Administration (22,519 | 8.5%).

Sales and Office Occupations by Sex
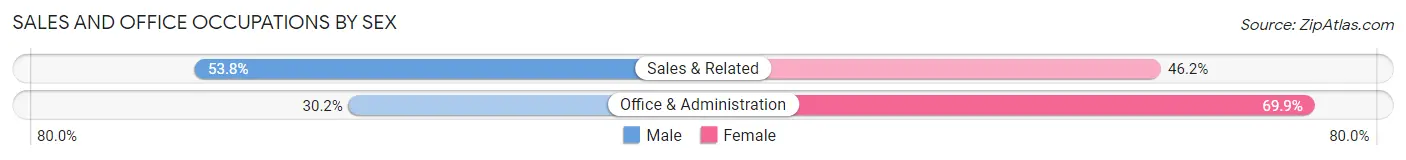
| Occupation | Male | Female |
| Sales & Related | 13,955 (53.8%) | 12,004 (46.2%) |
| Office & Administration | 6,789 (30.1%) | 15,730 (69.9%) |
| Total (Category) | 20,744 (42.8%) | 27,734 (57.2%) |
| Total (Overall) | 137,123 (51.9%) | 126,916 (48.1%) |
Natural Resources, Construction and Maintenance Occupations
The most common Natural Resources, Construction and Maintenance occupations in Atlanta are Construction & Extraction (3,428 | 1.3%), Installation, Maintenance & Repair (2,173 | 0.8%), and Farming, Fishing & Forestry (298 | 0.1%).

Natural Resources, Construction and Maintenance Occupations by Sex
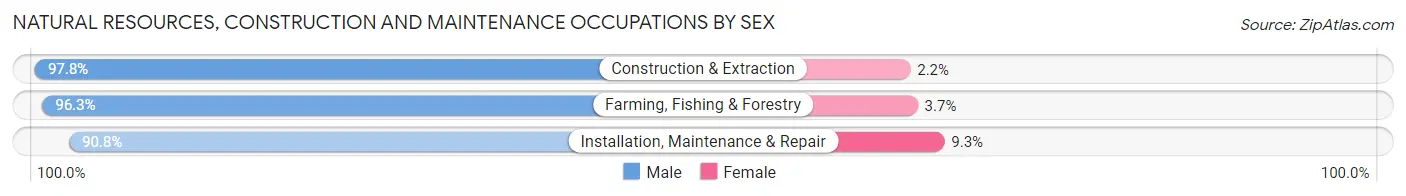
| Occupation | Male | Female |
| Farming, Fishing & Forestry | 287 (96.3%) | 11 (3.7%) |
| Construction & Extraction | 3,354 (97.8%) | 74 (2.2%) |
| Installation, Maintenance & Repair | 1,972 (90.7%) | 201 (9.2%) |
| Total (Category) | 5,613 (95.2%) | 286 (4.9%) |
| Total (Overall) | 137,123 (51.9%) | 126,916 (48.1%) |
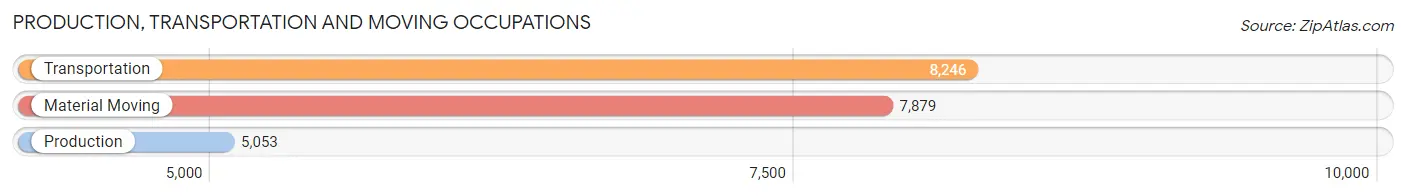
Production, Transportation and Moving Occupations
The most common Production, Transportation and Moving occupations in Atlanta are Transportation (8,246 | 3.1%), Material Moving (7,879 | 3.0%), and Production (5,053 | 1.9%).
Production, Transportation and Moving Occupations by Sex
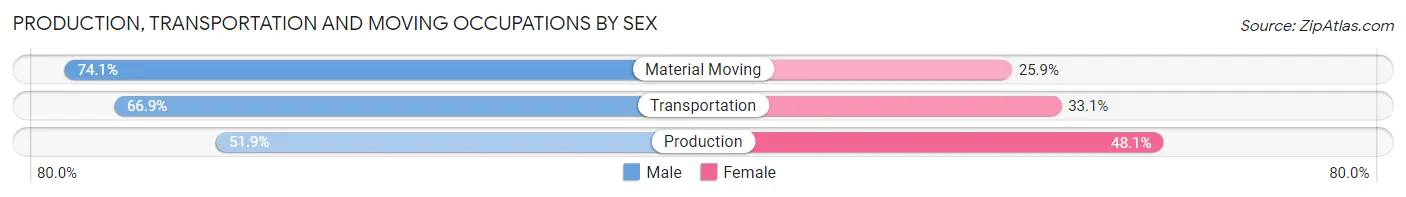
| Occupation | Male | Female |
| Production | 2,622 (51.9%) | 2,431 (48.1%) |
| Transportation | 5,515 (66.9%) | 2,731 (33.1%) |
| Material Moving | 5,841 (74.1%) | 2,038 (25.9%) |
| Total (Category) | 13,978 (66.0%) | 7,200 (34.0%) |
| Total (Overall) | 137,123 (51.9%) | 126,916 (48.1%) |
Employment Industries by Sex in Atlanta
Employment Industries in Atlanta
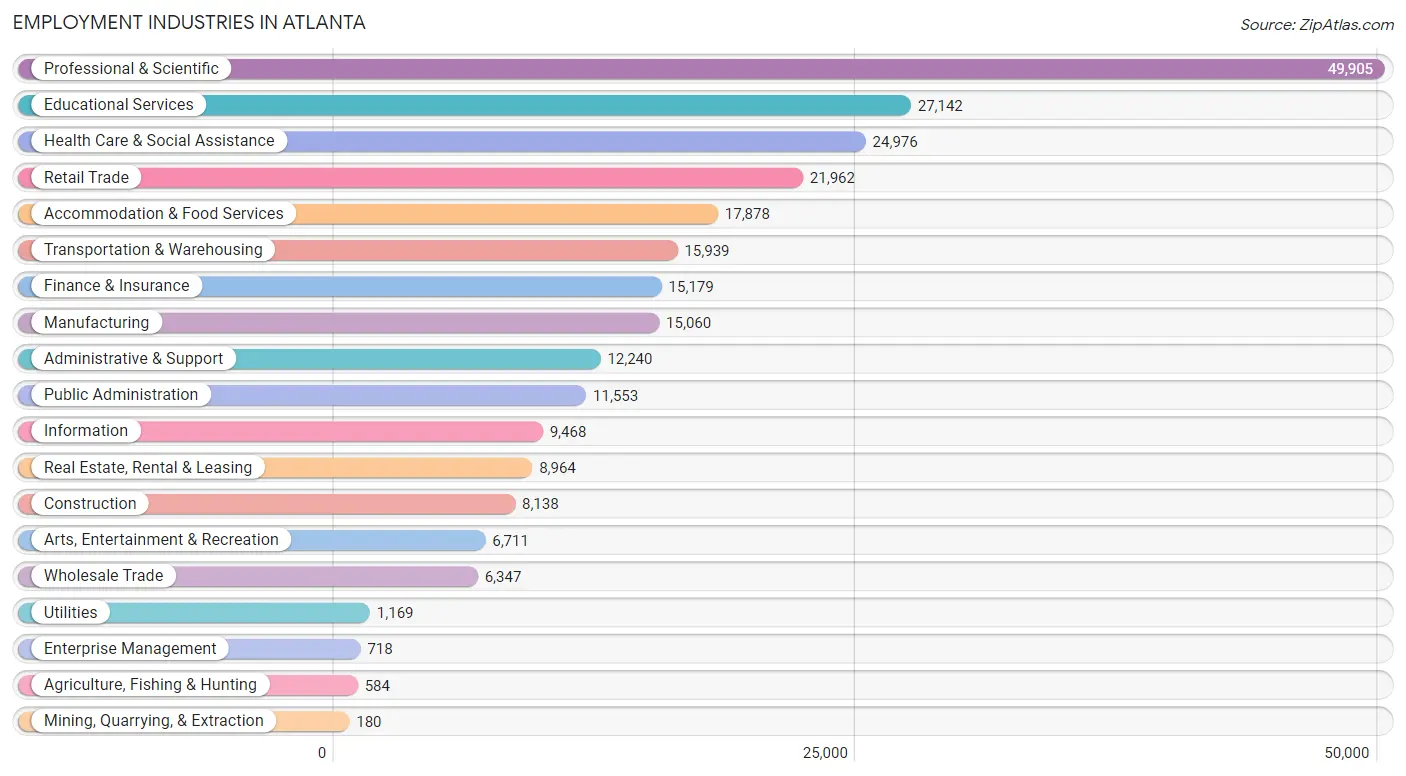
The major employment industries in Atlanta include Professional & Scientific (49,905 | 18.9%), Educational Services (27,142 | 10.3%), Health Care & Social Assistance (24,976 | 9.5%), Retail Trade (21,962 | 8.3%), and Accommodation & Food Services (17,878 | 6.8%).
Employment Industries by Sex in Atlanta
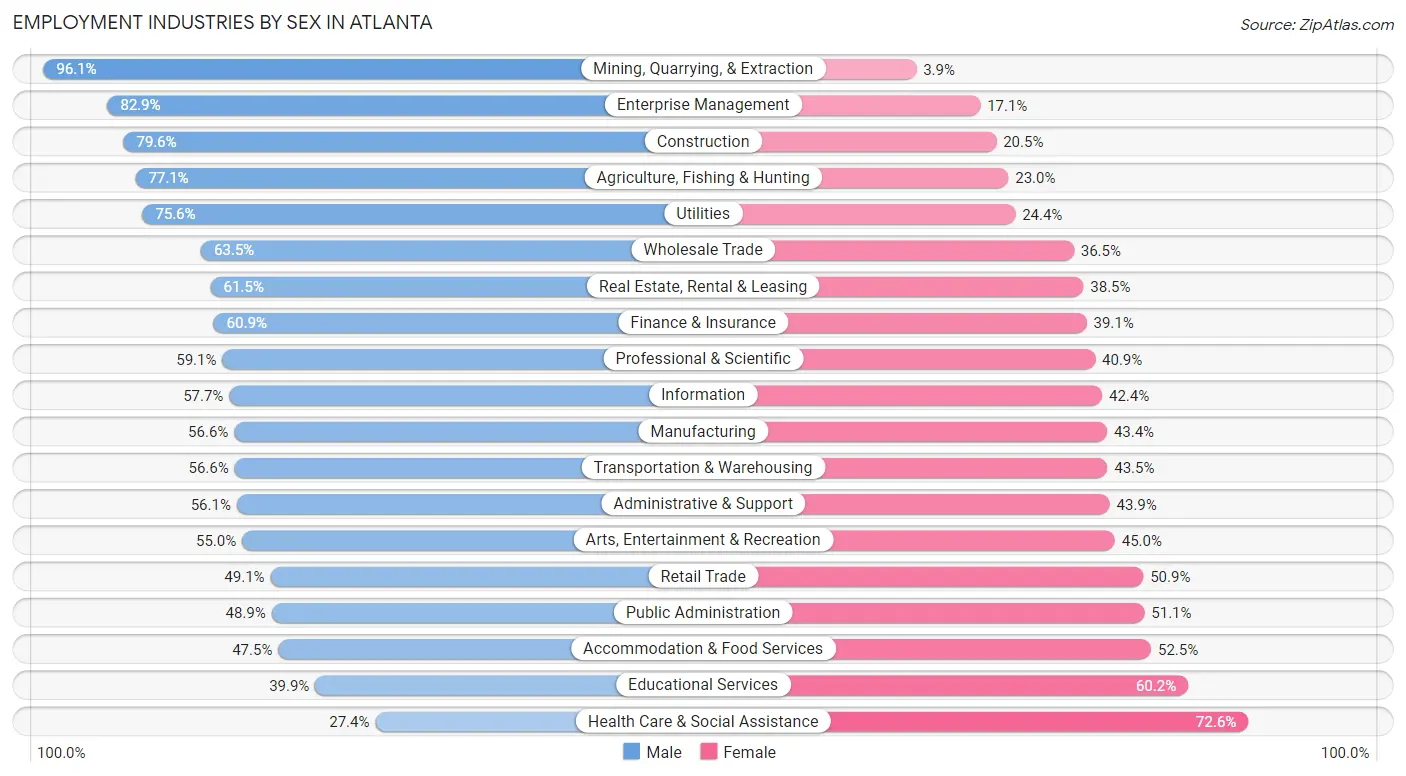
The Atlanta industries that see more men than women are Mining, Quarrying, & Extraction (96.1%), Enterprise Management (82.9%), and Construction (79.5%), whereas the industries that tend to have a higher number of women are Health Care & Social Assistance (72.6%), Educational Services (60.2%), and Accommodation & Food Services (52.5%).
| Industry | Male | Female |
| Agriculture, Fishing & Hunting | 450 (77.0%) | 134 (23.0%) |
| Mining, Quarrying, & Extraction | 173 (96.1%) | 7 (3.9%) |
| Construction | 6,474 (79.5%) | 1,664 (20.4%) |
| Manufacturing | 8,529 (56.6%) | 6,531 (43.4%) |
| Wholesale Trade | 4,030 (63.5%) | 2,317 (36.5%) |
| Retail Trade | 10,788 (49.1%) | 11,174 (50.9%) |
| Transportation & Warehousing | 9,013 (56.6%) | 6,926 (43.4%) |
| Utilities | 884 (75.6%) | 285 (24.4%) |
| Information | 5,458 (57.7%) | 4,010 (42.3%) |
| Finance & Insurance | 9,238 (60.9%) | 5,941 (39.1%) |
| Real Estate, Rental & Leasing | 5,514 (61.5%) | 3,450 (38.5%) |
| Professional & Scientific | 29,483 (59.1%) | 20,422 (40.9%) |
| Enterprise Management | 595 (82.9%) | 123 (17.1%) |
| Administrative & Support | 6,865 (56.1%) | 5,375 (43.9%) |
| Educational Services | 10,815 (39.9%) | 16,327 (60.2%) |
| Health Care & Social Assistance | 6,845 (27.4%) | 18,131 (72.6%) |
| Arts, Entertainment & Recreation | 3,691 (55.0%) | 3,020 (45.0%) |
| Accommodation & Food Services | 8,492 (47.5%) | 9,386 (52.5%) |
| Public Administration | 5,648 (48.9%) | 5,905 (51.1%) |
| Total | 137,123 (51.9%) | 126,916 (48.1%) |
Education in Atlanta
School Enrollment in Atlanta
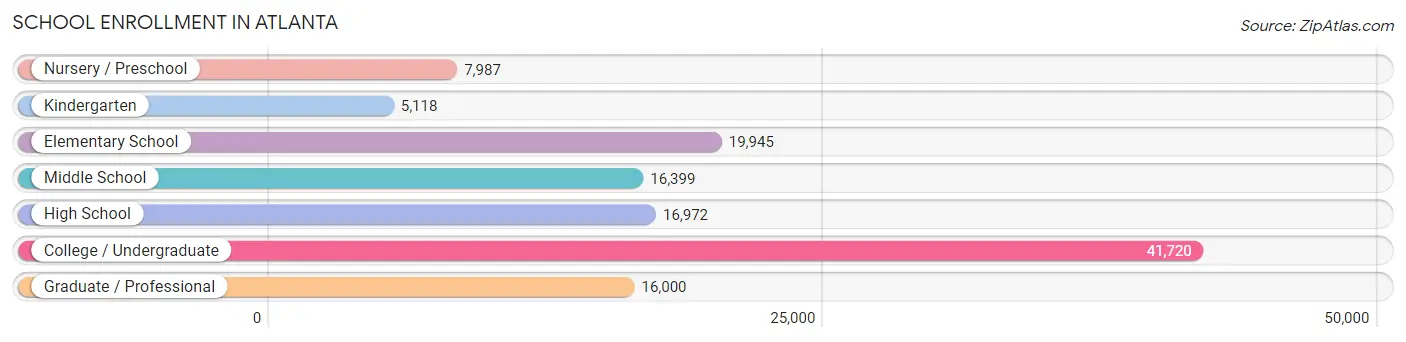
The most common levels of schooling among the 124,141 students in Atlanta are college / undergraduate (41,720 | 33.6%), elementary school (19,945 | 16.1%), and high school (16,972 | 13.7%).
| School Level | # Students | % Students |
| Nursery / Preschool | 7,987 | 6.4% |
| Kindergarten | 5,118 | 4.1% |
| Elementary School | 19,945 | 16.1% |
| Middle School | 16,399 | 13.2% |
| High School | 16,972 | 13.7% |
| College / Undergraduate | 41,720 | 33.6% |
| Graduate / Professional | 16,000 | 12.9% |
| Total | 124,141 | 100.0% |
School Enrollment by Age by Funding Source in Atlanta
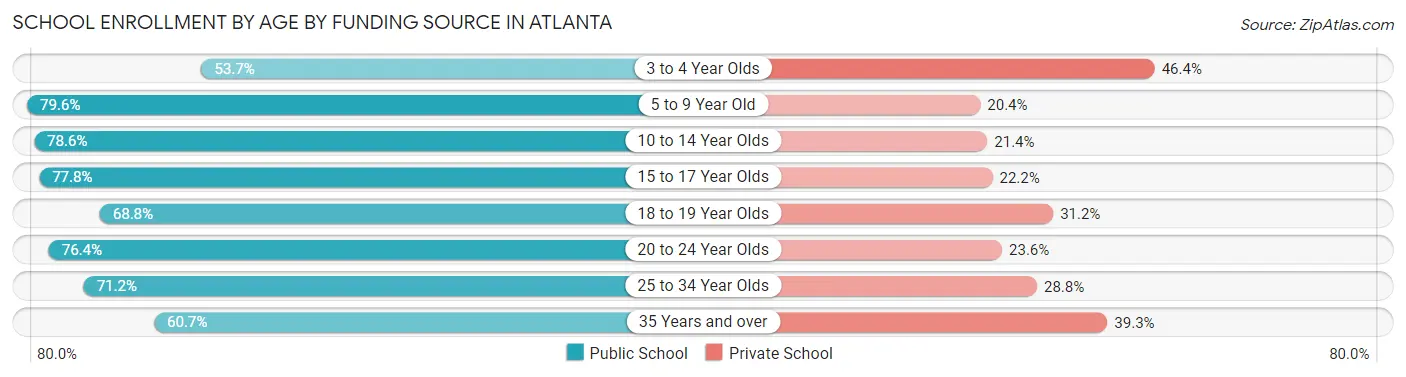
Out of a total of 124,141 students who are enrolled in schools in Atlanta, 32,401 (26.1%) attend a private institution, while the remaining 91,740 (73.9%) are enrolled in public schools. The age group of 3 to 4 year olds has the highest likelihood of being enrolled in private schools, with 3,153 (46.4% in the age bracket) enrolled. Conversely, the age group of 5 to 9 year old has the lowest likelihood of being enrolled in a private school, with 19,040 (79.6% in the age bracket) attending a public institution.
| Age Bracket | Public School | Private School |
| 3 to 4 Year Olds | 3,650 (53.6%) | 3,153 (46.4%) |
| 5 to 9 Year Old | 19,040 (79.6%) | 4,872 (20.4%) |
| 10 to 14 Year Olds | 16,153 (78.6%) | 4,400 (21.4%) |
| 15 to 17 Year Olds | 9,046 (77.8%) | 2,578 (22.2%) |
| 18 to 19 Year Olds | 11,036 (68.8%) | 5,009 (31.2%) |
| 20 to 24 Year Olds | 19,372 (76.4%) | 5,987 (23.6%) |
| 25 to 34 Year Olds | 9,306 (71.2%) | 3,766 (28.8%) |
| 35 Years and over | 4,111 (60.7%) | 2,662 (39.3%) |
| Total | 91,740 (73.9%) | 32,401 (26.1%) |
Educational Attainment by Field of Study in Atlanta
Business (48,647 | 22.6%), social sciences (23,376 | 10.8%), engineering (17,862 | 8.3%), science & technology (14,989 | 7.0%), and communications (14,924 | 6.9%) are the most common fields of study among 215,468 individuals in Atlanta who have obtained a bachelor's degree or higher.
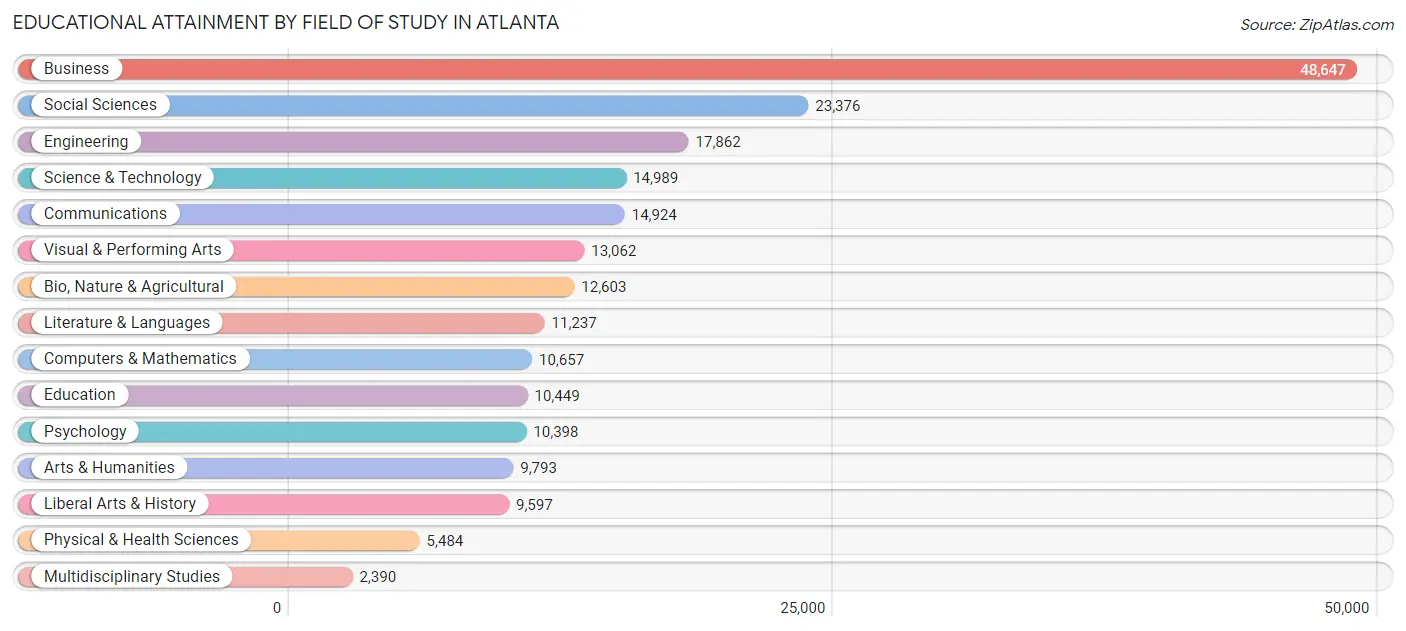
| Field of Study | # Graduates | % Graduates |
| Computers & Mathematics | 10,657 | 5.0% |
| Bio, Nature & Agricultural | 12,603 | 5.9% |
| Physical & Health Sciences | 5,484 | 2.5% |
| Psychology | 10,398 | 4.8% |
| Social Sciences | 23,376 | 10.8% |
| Engineering | 17,862 | 8.3% |
| Multidisciplinary Studies | 2,390 | 1.1% |
| Science & Technology | 14,989 | 7.0% |
| Business | 48,647 | 22.6% |
| Education | 10,449 | 4.9% |
| Literature & Languages | 11,237 | 5.2% |
| Liberal Arts & History | 9,597 | 4.4% |
| Visual & Performing Arts | 13,062 | 6.1% |
| Communications | 14,924 | 6.9% |
| Arts & Humanities | 9,793 | 4.5% |
| Total | 215,468 | 100.0% |
Transportation & Commute in Atlanta
Vehicle Availability by Sex in Atlanta
The most prevalent vehicle ownership categories in Atlanta are males with 2 vehicles (55,956, accounting for 42.3%) and females with 2 vehicles (46,351, making up 46.2%).
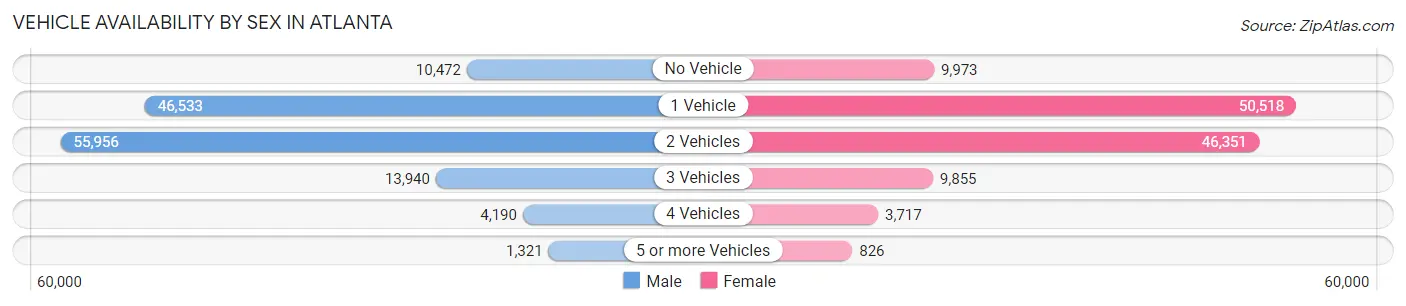
| Vehicles Available | Male | Female |
| No Vehicle | 10,472 (7.9%) | 9,973 (8.2%) |
| 1 Vehicle | 46,533 (35.1%) | 50,518 (41.7%) |
| 2 Vehicles | 55,956 (42.3%) | 46,351 (38.2%) |
| 3 Vehicles | 13,940 (10.5%) | 9,855 (8.1%) |
| 4 Vehicles | 4,190 (3.2%) | 3,717 (3.1%) |
| 5 or more Vehicles | 1,321 (1.0%) | 826 (0.7%) |
| Total | 132,412 (100.0%) | 121,240 (100.0%) |
Commute Time in Atlanta
The most frequently occuring commute durations in Atlanta are 20 to 24 minutes (35,533 commuters, 17.9%), 15 to 19 minutes (34,514 commuters, 17.4%), and 30 to 34 minutes (30,578 commuters, 15.4%).
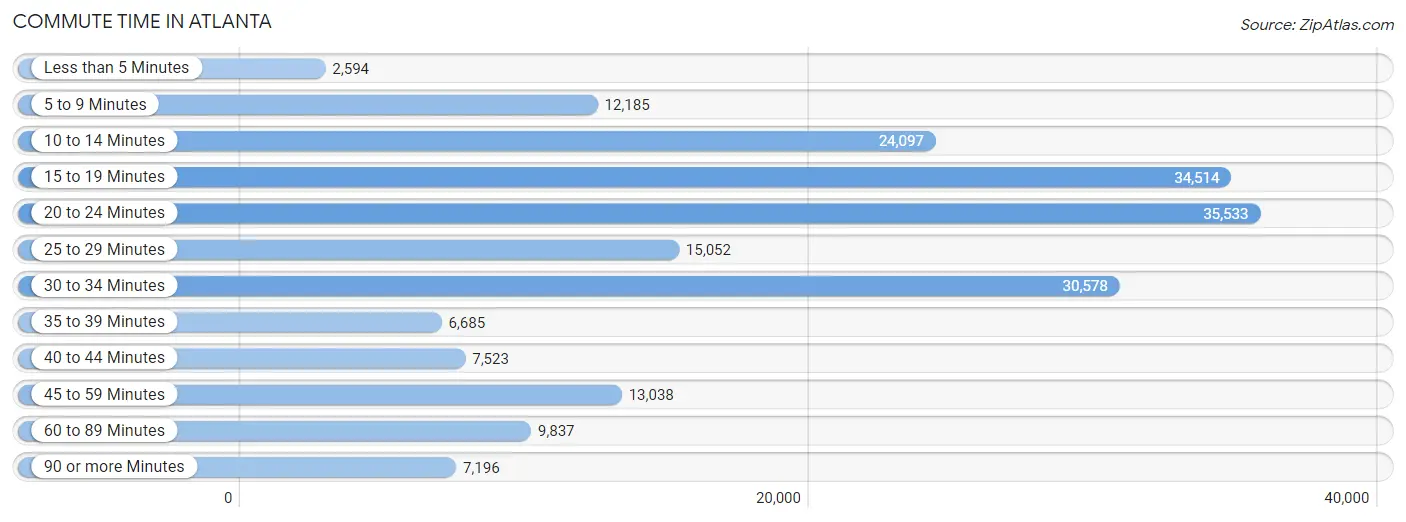
| Commute Time | # Commuters | % Commuters |
| Less than 5 Minutes | 2,594 | 1.3% |
| 5 to 9 Minutes | 12,185 | 6.1% |
| 10 to 14 Minutes | 24,097 | 12.1% |
| 15 to 19 Minutes | 34,514 | 17.4% |
| 20 to 24 Minutes | 35,533 | 17.9% |
| 25 to 29 Minutes | 15,052 | 7.6% |
| 30 to 34 Minutes | 30,578 | 15.4% |
| 35 to 39 Minutes | 6,685 | 3.4% |
| 40 to 44 Minutes | 7,523 | 3.8% |
| 45 to 59 Minutes | 13,038 | 6.6% |
| 60 to 89 Minutes | 9,837 | 5.0% |
| 90 or more Minutes | 7,196 | 3.6% |
Commute Time by Sex in Atlanta
The most common commute times in Atlanta are 20 to 24 minutes (17,953 commuters, 17.5%) for males and 20 to 24 minutes (17,580 commuters, 18.3%) for females.
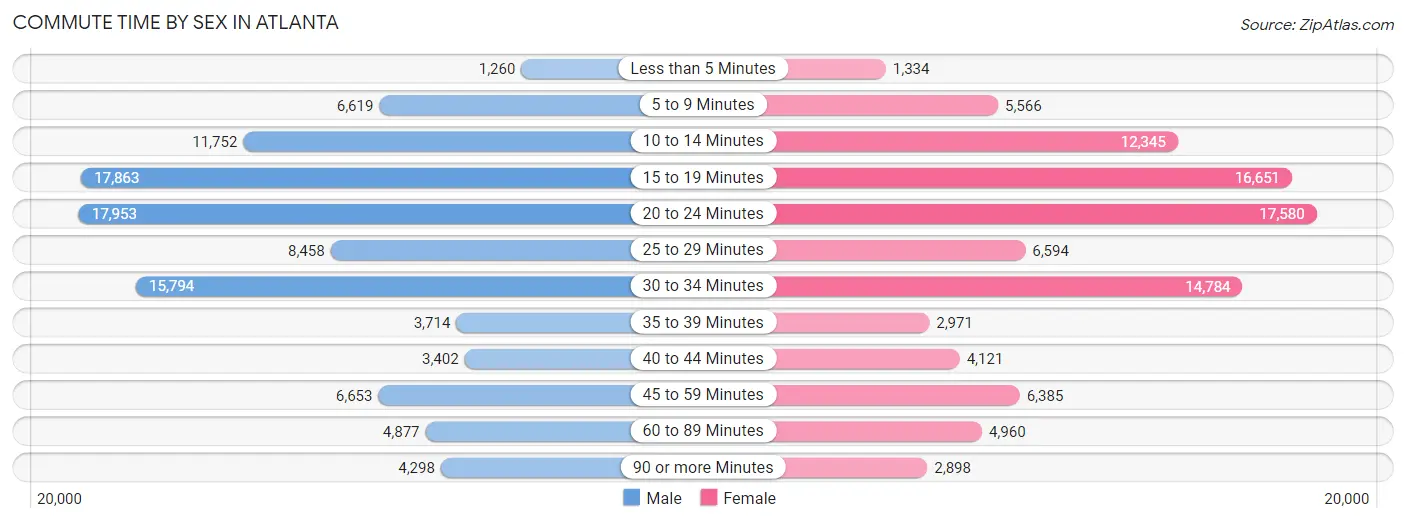
| Commute Time | Male | Female |
| Less than 5 Minutes | 1,260 (1.2%) | 1,334 (1.4%) |
| 5 to 9 Minutes | 6,619 (6.5%) | 5,566 (5.8%) |
| 10 to 14 Minutes | 11,752 (11.5%) | 12,345 (12.8%) |
| 15 to 19 Minutes | 17,863 (17.4%) | 16,651 (17.3%) |
| 20 to 24 Minutes | 17,953 (17.5%) | 17,580 (18.3%) |
| 25 to 29 Minutes | 8,458 (8.2%) | 6,594 (6.9%) |
| 30 to 34 Minutes | 15,794 (15.4%) | 14,784 (15.4%) |
| 35 to 39 Minutes | 3,714 (3.6%) | 2,971 (3.1%) |
| 40 to 44 Minutes | 3,402 (3.3%) | 4,121 (4.3%) |
| 45 to 59 Minutes | 6,653 (6.5%) | 6,385 (6.6%) |
| 60 to 89 Minutes | 4,877 (4.8%) | 4,960 (5.2%) |
| 90 or more Minutes | 4,298 (4.2%) | 2,898 (3.0%) |
Time of Departure to Work by Sex in Atlanta
The most frequent times of departure to work in Atlanta are 8:00 AM to 8:29 AM (17,459, 17.0%) for males and 8:00 AM to 8:29 AM (16,527, 17.2%) for females.
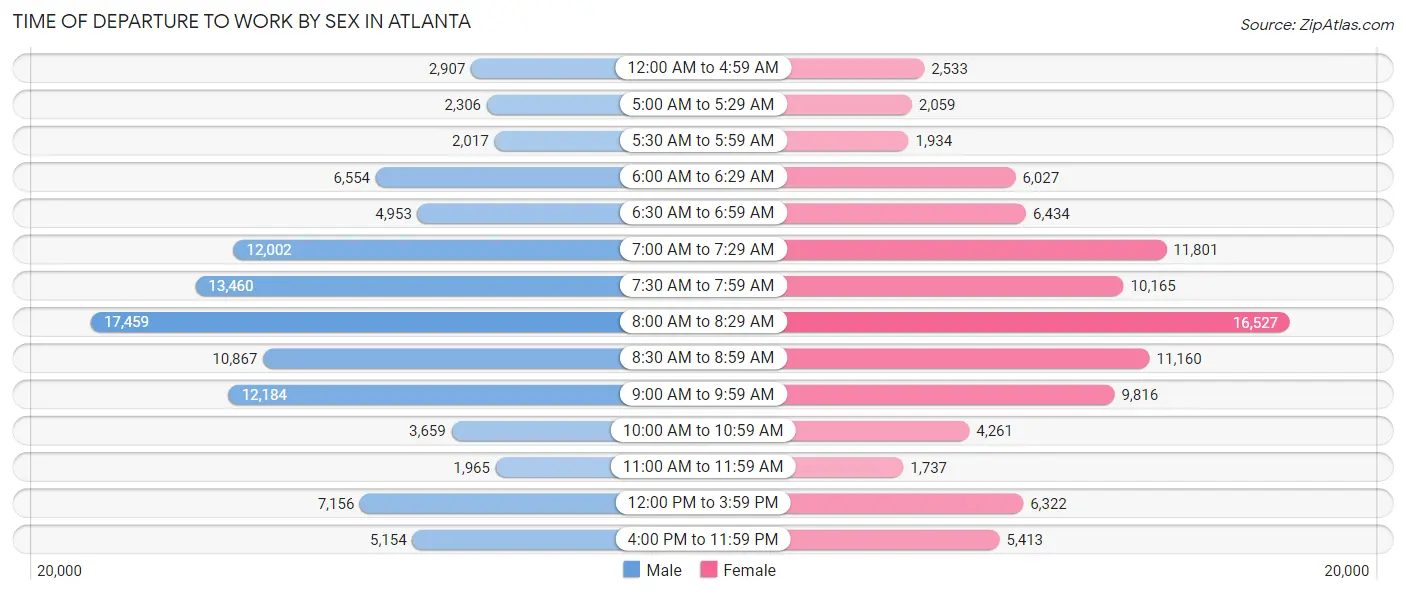
| Time of Departure | Male | Female |
| 12:00 AM to 4:59 AM | 2,907 (2.8%) | 2,533 (2.6%) |
| 5:00 AM to 5:29 AM | 2,306 (2.2%) | 2,059 (2.1%) |
| 5:30 AM to 5:59 AM | 2,017 (2.0%) | 1,934 (2.0%) |
| 6:00 AM to 6:29 AM | 6,554 (6.4%) | 6,027 (6.3%) |
| 6:30 AM to 6:59 AM | 4,953 (4.8%) | 6,434 (6.7%) |
| 7:00 AM to 7:29 AM | 12,002 (11.7%) | 11,801 (12.3%) |
| 7:30 AM to 7:59 AM | 13,460 (13.1%) | 10,165 (10.6%) |
| 8:00 AM to 8:29 AM | 17,459 (17.0%) | 16,527 (17.2%) |
| 8:30 AM to 8:59 AM | 10,867 (10.6%) | 11,160 (11.6%) |
| 9:00 AM to 9:59 AM | 12,184 (11.9%) | 9,816 (10.2%) |
| 10:00 AM to 10:59 AM | 3,659 (3.6%) | 4,261 (4.4%) |
| 11:00 AM to 11:59 AM | 1,965 (1.9%) | 1,737 (1.8%) |
| 12:00 PM to 3:59 PM | 7,156 (7.0%) | 6,322 (6.6%) |
| 4:00 PM to 11:59 PM | 5,154 (5.0%) | 5,413 (5.6%) |
| Total | 102,643 (100.0%) | 96,189 (100.0%) |
Housing Occupancy in Atlanta
Occupancy by Ownership in Atlanta
Of the total 227,388 dwellings in Atlanta, owner-occupied units account for 103,831 (45.7%), while renter-occupied units make up 123,557 (54.3%).
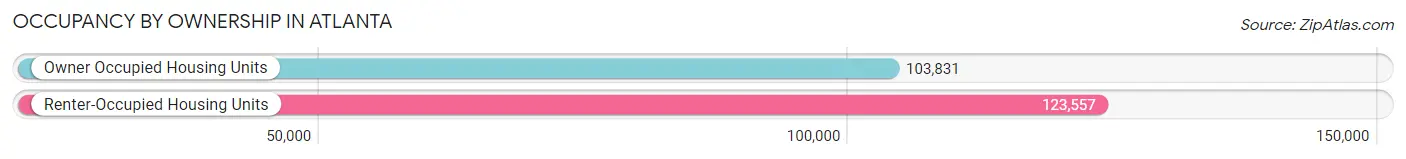
| Occupancy | # Housing Units | % Housing Units |
| Owner Occupied Housing Units | 103,831 | 45.7% |
| Renter-Occupied Housing Units | 123,557 | 54.3% |
| Total Occupied Housing Units | 227,388 | 100.0% |
Occupancy by Household Size in Atlanta
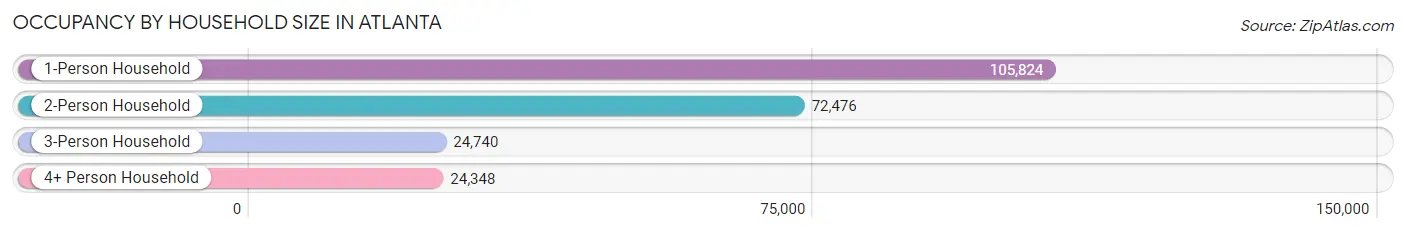
| Household Size | # Housing Units | % Housing Units |
| 1-Person Household | 105,824 | 46.5% |
| 2-Person Household | 72,476 | 31.9% |
| 3-Person Household | 24,740 | 10.9% |
| 4+ Person Household | 24,348 | 10.7% |
| Total Housing Units | 227,388 | 100.0% |
Occupancy by Ownership by Household Size in Atlanta
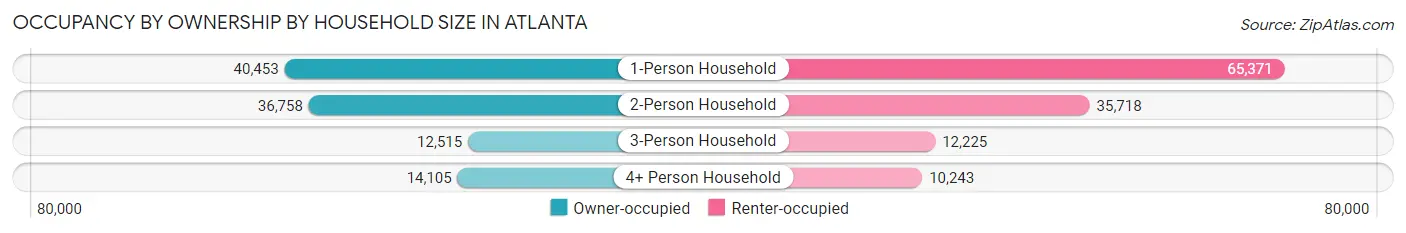
| Household Size | Owner-occupied | Renter-occupied |
| 1-Person Household | 40,453 (38.2%) | 65,371 (61.8%) |
| 2-Person Household | 36,758 (50.7%) | 35,718 (49.3%) |
| 3-Person Household | 12,515 (50.6%) | 12,225 (49.4%) |
| 4+ Person Household | 14,105 (57.9%) | 10,243 (42.1%) |
| Total Housing Units | 103,831 (45.7%) | 123,557 (54.3%) |
Occupancy by Educational Attainment in Atlanta
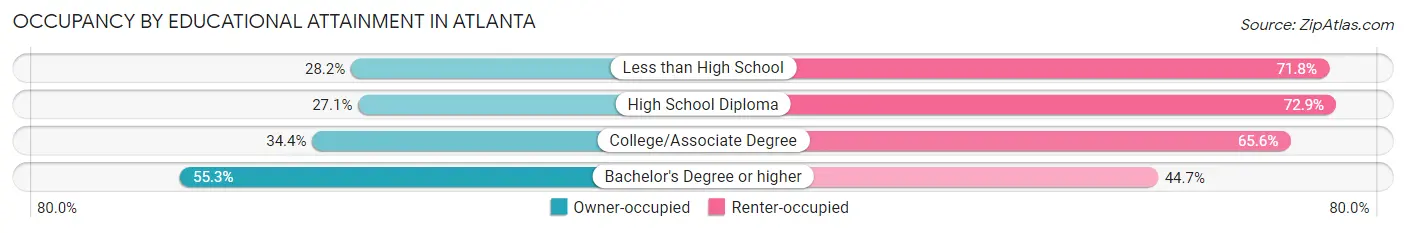
| Household Size | Owner-occupied | Renter-occupied |
| Less than High School | 3,472 (28.2%) | 8,830 (71.8%) |
| High School Diploma | 8,850 (27.1%) | 23,825 (72.9%) |
| College/Associate Degree | 15,469 (34.4%) | 29,535 (65.6%) |
| Bachelor's Degree or higher | 76,040 (55.3%) | 61,367 (44.7%) |
Occupancy by Age of Householder in Atlanta
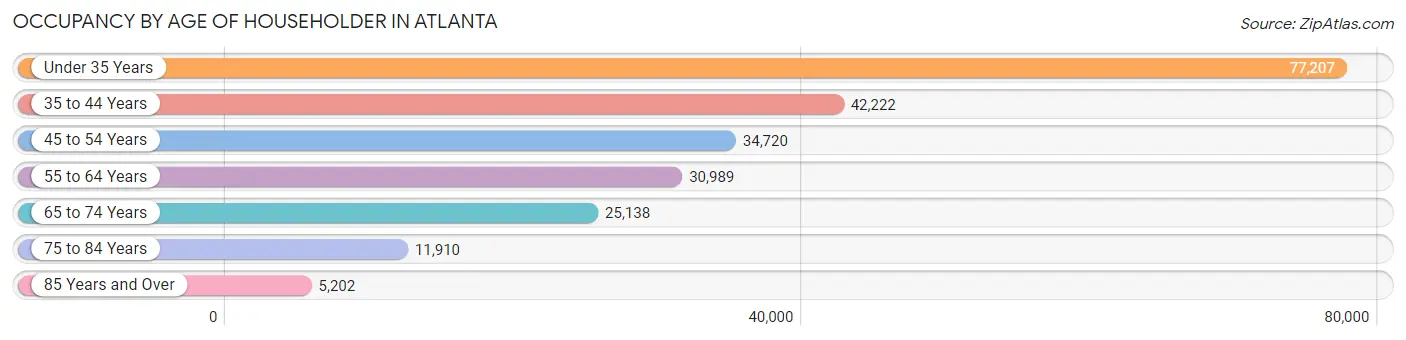
| Age Bracket | # Households | % Households |
| Under 35 Years | 77,207 | 34.0% |
| 35 to 44 Years | 42,222 | 18.6% |
| 45 to 54 Years | 34,720 | 15.3% |
| 55 to 64 Years | 30,989 | 13.6% |
| 65 to 74 Years | 25,138 | 11.1% |
| 75 to 84 Years | 11,910 | 5.2% |
| 85 Years and Over | 5,202 | 2.3% |
| Total | 227,388 | 100.0% |
Housing Finances in Atlanta
Median Income by Occupancy in Atlanta
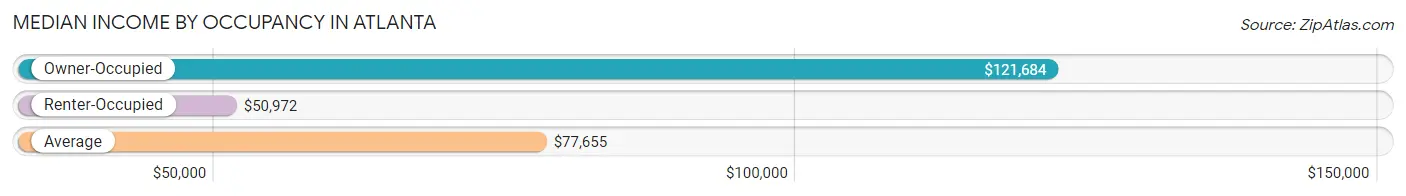
| Occupancy Type | # Households | Median Income |
| Owner-Occupied | 103,831 (45.7%) | $121,684 |
| Renter-Occupied | 123,557 (54.3%) | $50,972 |
| Average | 227,388 (100.0%) | $77,655 |
Occupancy by Householder Income Bracket in Atlanta
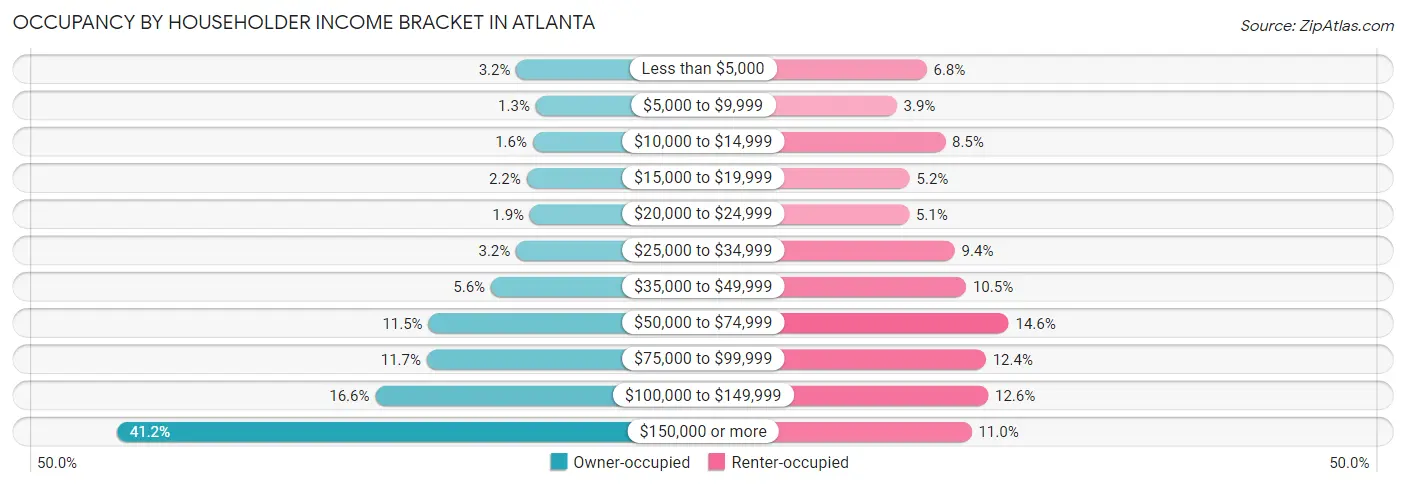
| Income Bracket | Owner-occupied | Renter-occupied |
| Less than $5,000 | 3,295 (3.2%) | 8,354 (6.8%) |
| $5,000 to $9,999 | 1,371 (1.3%) | 4,825 (3.9%) |
| $10,000 to $14,999 | 1,659 (1.6%) | 10,522 (8.5%) |
| $15,000 to $19,999 | 2,278 (2.2%) | 6,362 (5.1%) |
| $20,000 to $24,999 | 1,946 (1.9%) | 6,288 (5.1%) |
| $25,000 to $34,999 | 3,312 (3.2%) | 11,661 (9.4%) |
| $35,000 to $49,999 | 5,805 (5.6%) | 12,993 (10.5%) |
| $50,000 to $74,999 | 11,977 (11.5%) | 17,998 (14.6%) |
| $75,000 to $99,999 | 12,149 (11.7%) | 15,325 (12.4%) |
| $100,000 to $149,999 | 17,239 (16.6%) | 15,592 (12.6%) |
| $150,000 or more | 42,800 (41.2%) | 13,637 (11.0%) |
| Total | 103,831 (100.0%) | 123,557 (100.0%) |
Monthly Housing Cost Tiers in Atlanta
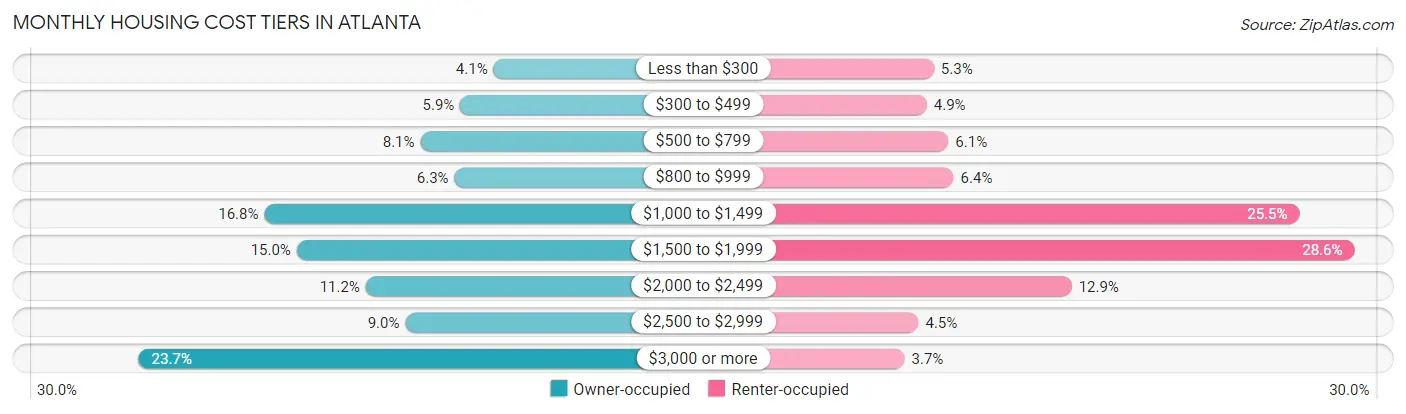
| Monthly Cost | Owner-occupied | Renter-occupied |
| Less than $300 | 4,252 (4.1%) | 6,581 (5.3%) |
| $300 to $499 | 6,166 (5.9%) | 6,108 (4.9%) |
| $500 to $799 | 8,452 (8.1%) | 7,579 (6.1%) |
| $800 to $999 | 6,505 (6.3%) | 7,934 (6.4%) |
| $1,000 to $1,499 | 17,400 (16.8%) | 31,524 (25.5%) |
| $1,500 to $1,999 | 15,544 (15.0%) | 35,270 (28.5%) |
| $2,000 to $2,499 | 11,588 (11.2%) | 15,991 (12.9%) |
| $2,500 to $2,999 | 9,316 (9.0%) | 5,532 (4.5%) |
| $3,000 or more | 24,608 (23.7%) | 4,590 (3.7%) |
| Total | 103,831 (100.0%) | 123,557 (100.0%) |
Physical Housing Characteristics in Atlanta
Housing Structures in Atlanta
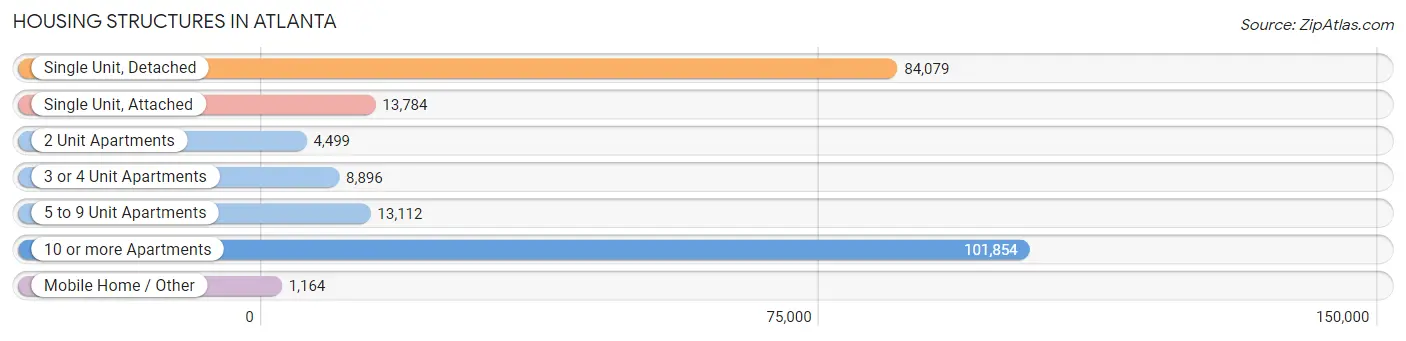
| Structure Type | # Housing Units | % Housing Units |
| Single Unit, Detached | 84,079 | 37.0% |
| Single Unit, Attached | 13,784 | 6.1% |
| 2 Unit Apartments | 4,499 | 2.0% |
| 3 or 4 Unit Apartments | 8,896 | 3.9% |
| 5 to 9 Unit Apartments | 13,112 | 5.8% |
| 10 or more Apartments | 101,854 | 44.8% |
| Mobile Home / Other | 1,164 | 0.5% |
| Total | 227,388 | 100.0% |
Housing Structures by Occupancy in Atlanta
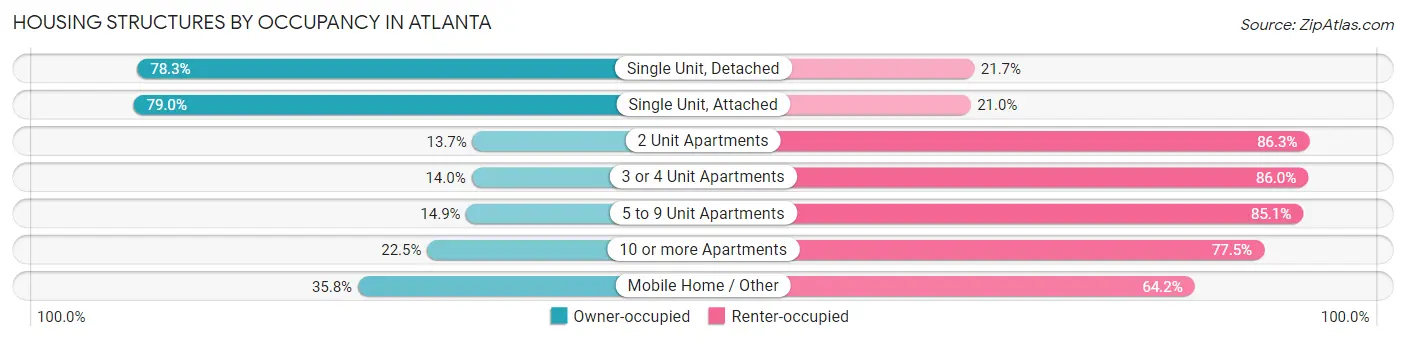
| Structure Type | Owner-occupied | Renter-occupied |
| Single Unit, Detached | 65,834 (78.3%) | 18,245 (21.7%) |
| Single Unit, Attached | 10,891 (79.0%) | 2,893 (21.0%) |
| 2 Unit Apartments | 618 (13.7%) | 3,881 (86.3%) |
| 3 or 4 Unit Apartments | 1,242 (14.0%) | 7,654 (86.0%) |
| 5 to 9 Unit Apartments | 1,957 (14.9%) | 11,155 (85.1%) |
| 10 or more Apartments | 22,872 (22.5%) | 78,982 (77.5%) |
| Mobile Home / Other | 417 (35.8%) | 747 (64.2%) |
| Total | 103,831 (45.7%) | 123,557 (54.3%) |
Housing Structures by Number of Rooms in Atlanta
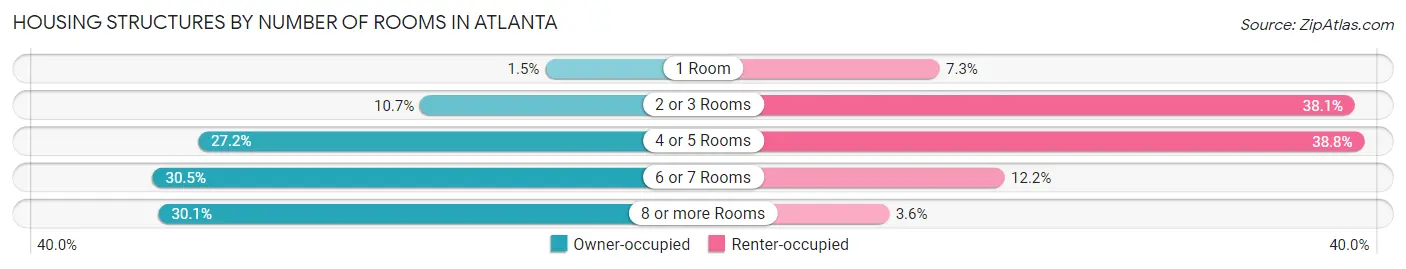
| Number of Rooms | Owner-occupied | Renter-occupied |
| 1 Room | 1,534 (1.5%) | 9,070 (7.3%) |
| 2 or 3 Rooms | 11,151 (10.7%) | 47,080 (38.1%) |
| 4 or 5 Rooms | 28,206 (27.2%) | 47,937 (38.8%) |
| 6 or 7 Rooms | 31,695 (30.5%) | 15,012 (12.1%) |
| 8 or more Rooms | 31,245 (30.1%) | 4,458 (3.6%) |
| Total | 103,831 (100.0%) | 123,557 (100.0%) |
Housing Structure by Heating Type in Atlanta
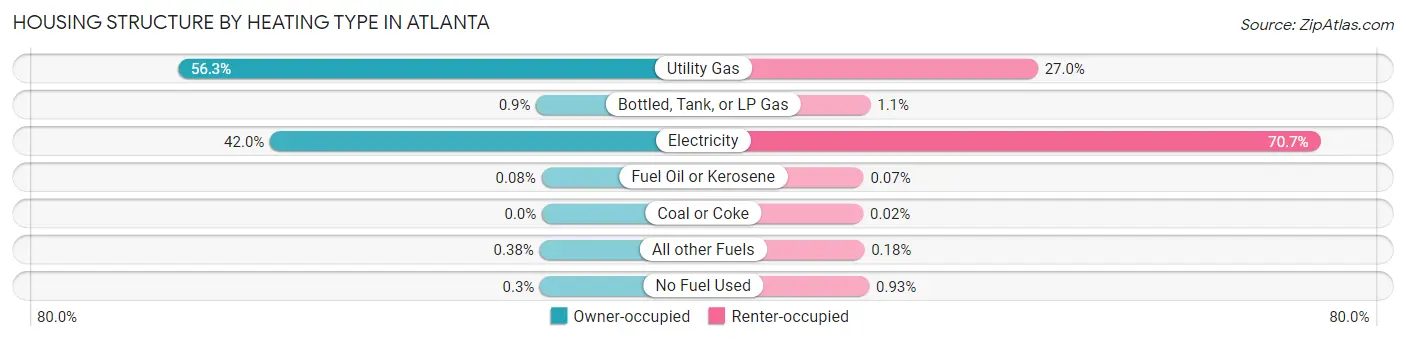
| Heating Type | Owner-occupied | Renter-occupied |
| Utility Gas | 58,461 (56.3%) | 33,356 (27.0%) |
| Bottled, Tank, or LP Gas | 935 (0.9%) | 1,380 (1.1%) |
| Electricity | 43,651 (42.0%) | 87,351 (70.7%) |
| Fuel Oil or Kerosene | 87 (0.1%) | 87 (0.1%) |
| Coal or Coke | 0 (0.0%) | 19 (0.0%) |
| All other Fuels | 390 (0.4%) | 218 (0.2%) |
| No Fuel Used | 307 (0.3%) | 1,146 (0.9%) |
| Total | 103,831 (100.0%) | 123,557 (100.0%) |
Household Vehicle Usage in Atlanta
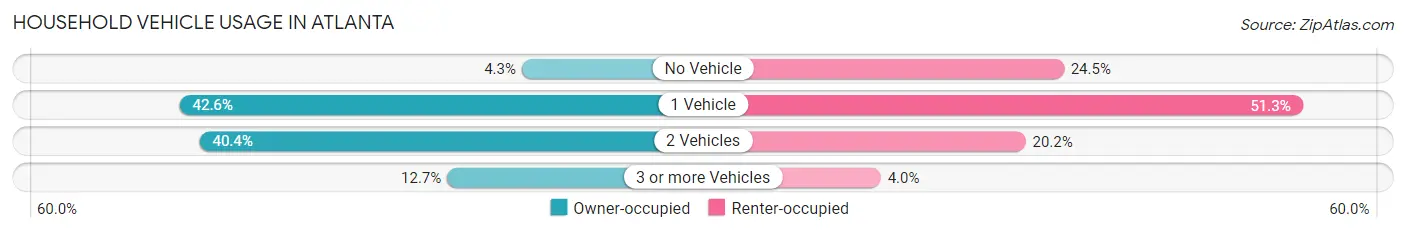
| Vehicles per Household | Owner-occupied | Renter-occupied |
| No Vehicle | 4,466 (4.3%) | 30,280 (24.5%) |
| 1 Vehicle | 44,259 (42.6%) | 63,326 (51.2%) |
| 2 Vehicles | 41,950 (40.4%) | 24,998 (20.2%) |
| 3 or more Vehicles | 13,156 (12.7%) | 4,953 (4.0%) |
| Total | 103,831 (100.0%) | 123,557 (100.0%) |
Real Estate & Mortgages in Atlanta
Real Estate and Mortgage Overview in Atlanta
| Characteristic | Without Mortgage | With Mortgage |
| Housing Units | 30,169 | 73,662 |
| Median Property Value | $325,400 | $419,500 |
| Median Household Income | $81,914 | $34,246 |
| Monthly Housing Costs | $747 | $23,376 |
| Real Estate Taxes | $2,863 | $1,517 |
Property Value by Mortgage Status in Atlanta
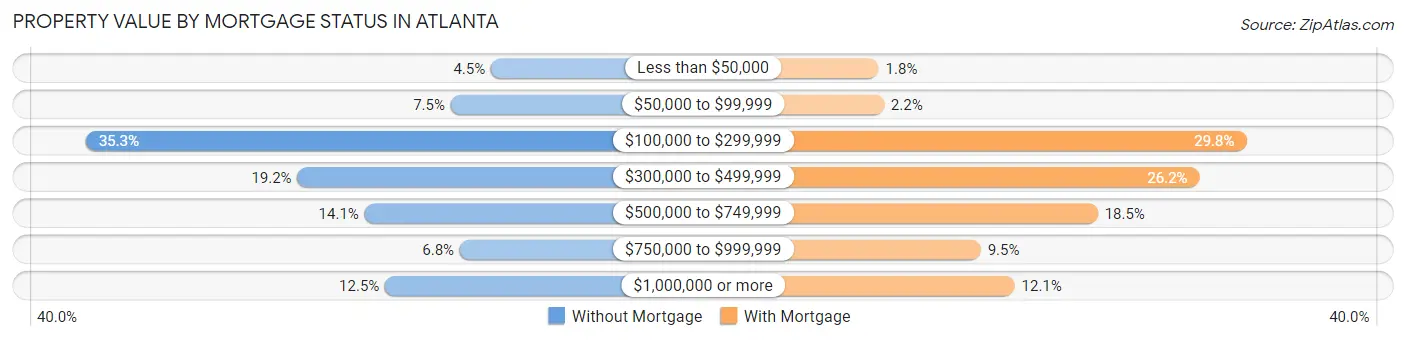
| Property Value | Without Mortgage | With Mortgage |
| Less than $50,000 | 1,345 (4.5%) | 1,297 (1.8%) |
| $50,000 to $99,999 | 2,272 (7.5%) | 1,588 (2.2%) |
| $100,000 to $299,999 | 10,662 (35.3%) | 21,927 (29.8%) |
| $300,000 to $499,999 | 5,796 (19.2%) | 19,303 (26.2%) |
| $500,000 to $749,999 | 4,251 (14.1%) | 13,589 (18.4%) |
| $750,000 to $999,999 | 2,062 (6.8%) | 7,027 (9.5%) |
| $1,000,000 or more | 3,781 (12.5%) | 8,931 (12.1%) |
| Total | 30,169 (100.0%) | 73,662 (100.0%) |
Household Income by Mortgage Status in Atlanta
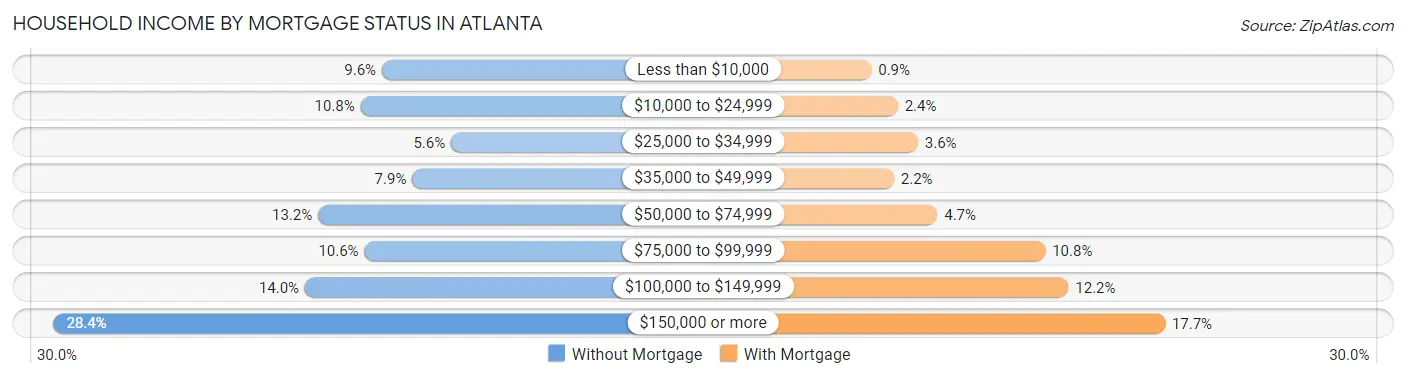
| Household Income | Without Mortgage | With Mortgage |
| Less than $10,000 | 2,890 (9.6%) | 665 (0.9%) |
| $10,000 to $24,999 | 3,257 (10.8%) | 1,776 (2.4%) |
| $25,000 to $34,999 | 1,699 (5.6%) | 2,626 (3.6%) |
| $35,000 to $49,999 | 2,368 (7.9%) | 1,613 (2.2%) |
| $50,000 to $74,999 | 3,991 (13.2%) | 3,437 (4.7%) |
| $75,000 to $99,999 | 3,193 (10.6%) | 7,986 (10.8%) |
| $100,000 to $149,999 | 4,217 (14.0%) | 8,956 (12.2%) |
| $150,000 or more | 8,554 (28.3%) | 13,022 (17.7%) |
| Total | 30,169 (100.0%) | 73,662 (100.0%) |
Property Value to Household Income Ratio in Atlanta
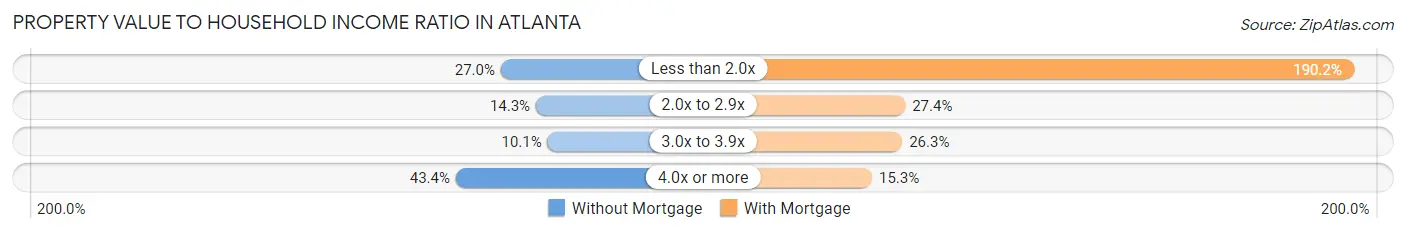
| Value-to-Income Ratio | Without Mortgage | With Mortgage |
| Less than 2.0x | 8,158 (27.0%) | 140,135 (190.2%) |
| 2.0x to 2.9x | 4,302 (14.3%) | 20,148 (27.4%) |
| 3.0x to 3.9x | 3,032 (10.1%) | 19,345 (26.3%) |
| 4.0x or more | 13,089 (43.4%) | 11,274 (15.3%) |
| Total | 30,169 (100.0%) | 73,662 (100.0%) |
Real Estate Taxes by Mortgage Status in Atlanta

| Property Taxes | Without Mortgage | With Mortgage |
| Less than $800 | 6,393 (21.2%) | 480 (0.6%) |
| $800 to $1,499 | 3,342 (11.1%) | 7,948 (10.8%) |
| $800 to $1,499 | 18,687 (61.9%) | 7,181 (9.8%) |
| Total | 30,169 (100.0%) | 73,662 (100.0%) |
Health & Disability in Atlanta
Health Insurance Coverage by Age in Atlanta
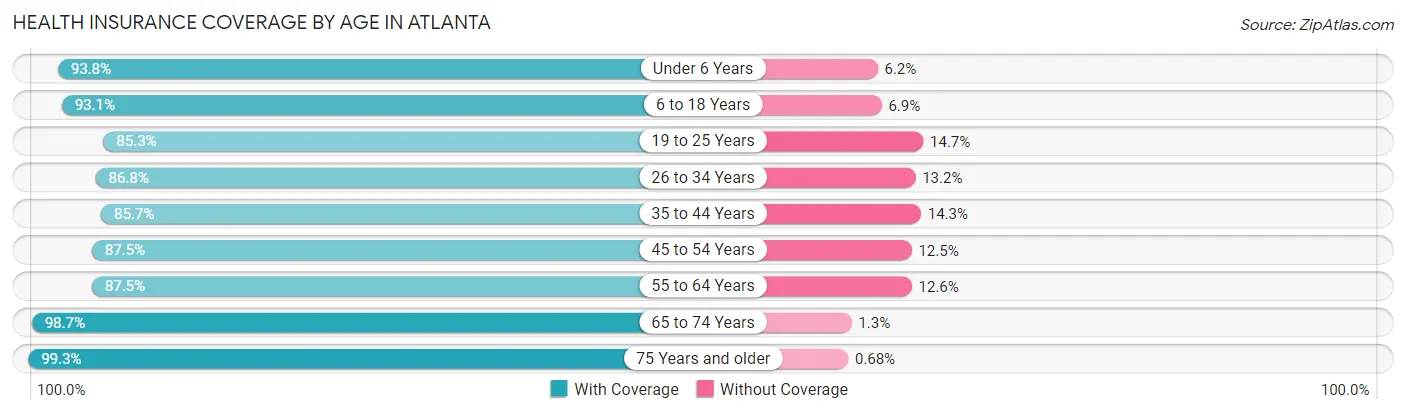
| Age Bracket | With Coverage | Without Coverage |
| Under 6 Years | 28,747 (93.8%) | 1,901 (6.2%) |
| 6 to 18 Years | 58,390 (93.1%) | 4,346 (6.9%) |
| 19 to 25 Years | 58,225 (85.3%) | 10,038 (14.7%) |
| 26 to 34 Years | 83,265 (86.8%) | 12,696 (13.2%) |
| 35 to 44 Years | 59,152 (85.7%) | 9,835 (14.3%) |
| 45 to 54 Years | 48,092 (87.5%) | 6,890 (12.5%) |
| 55 to 64 Years | 42,165 (87.5%) | 6,050 (12.6%) |
| 65 to 74 Years | 34,294 (98.7%) | 466 (1.3%) |
| 75 Years and older | 22,507 (99.3%) | 154 (0.7%) |
| Total | 434,837 (89.2%) | 52,376 (10.7%) |
Health Insurance Coverage by Citizenship Status in Atlanta

| Citizenship Status | With Coverage | Without Coverage |
| Native Born | 28,747 (93.8%) | 1,901 (6.2%) |
| Foreign Born, Citizen | 58,390 (93.1%) | 4,346 (6.9%) |
| Foreign Born, not a Citizen | 58,225 (85.3%) | 10,038 (14.7%) |
Health Insurance Coverage by Household Income in Atlanta
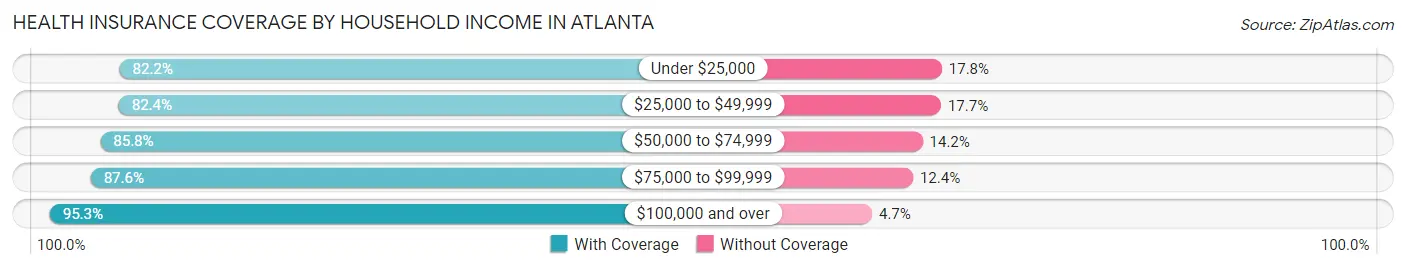
| Household Income | With Coverage | Without Coverage |
| Under $25,000 | 63,879 (82.2%) | 13,844 (17.8%) |
| $25,000 to $49,999 | 53,050 (82.4%) | 11,371 (17.6%) |
| $50,000 to $74,999 | 51,638 (85.8%) | 8,543 (14.2%) |
| $75,000 to $99,999 | 45,574 (87.6%) | 6,452 (12.4%) |
| $100,000 and over | 196,565 (95.3%) | 9,755 (4.7%) |
Public vs Private Health Insurance Coverage by Age in Atlanta
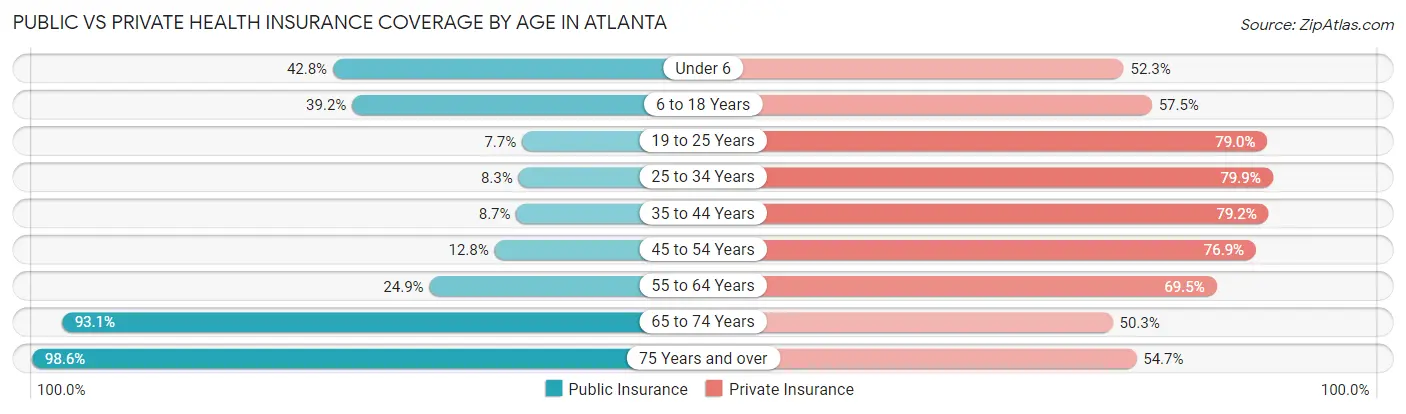
| Age Bracket | Public Insurance | Private Insurance |
| Under 6 | 13,109 (42.8%) | 16,030 (52.3%) |
| 6 to 18 Years | 24,590 (39.2%) | 36,086 (57.5%) |
| 19 to 25 Years | 5,233 (7.7%) | 53,906 (79.0%) |
| 25 to 34 Years | 7,976 (8.3%) | 76,712 (79.9%) |
| 35 to 44 Years | 6,017 (8.7%) | 54,636 (79.2%) |
| 45 to 54 Years | 7,021 (12.8%) | 42,261 (76.9%) |
| 55 to 64 Years | 11,986 (24.9%) | 33,530 (69.5%) |
| 65 to 74 Years | 32,364 (93.1%) | 17,472 (50.3%) |
| 75 Years and over | 22,353 (98.6%) | 12,387 (54.7%) |
| Total | 130,649 (26.8%) | 343,020 (70.4%) |
Disability Status by Sex by Age in Atlanta
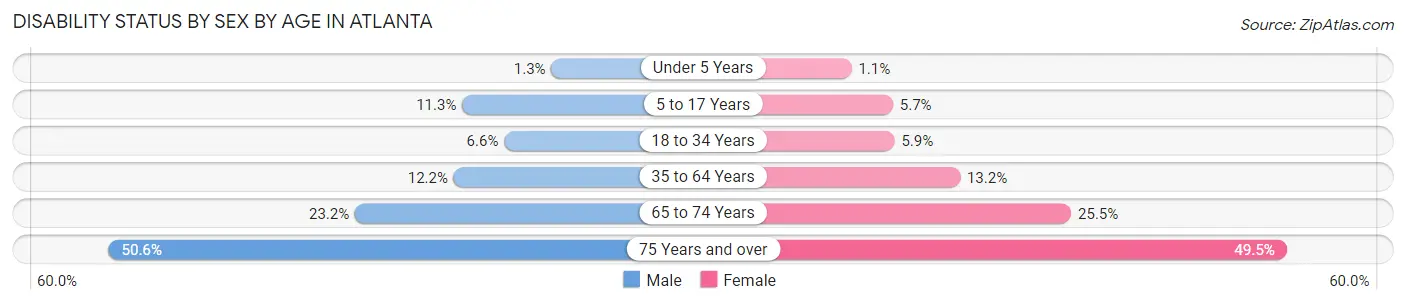
| Age Bracket | Male | Female |
| Under 5 Years | 183 (1.3%) | 135 (1.1%) |
| 5 to 17 Years | 3,133 (11.3%) | 1,755 (5.7%) |
| 18 to 34 Years | 5,692 (6.6%) | 5,052 (5.9%) |
| 35 to 64 Years | 10,525 (12.2%) | 11,306 (13.2%) |
| 65 to 74 Years | 3,475 (23.2%) | 5,052 (25.5%) |
| 75 Years and over | 4,439 (50.6%) | 6,884 (49.5%) |
Disability Class by Sex by Age in Atlanta
Disability Class: Hearing Difficulty
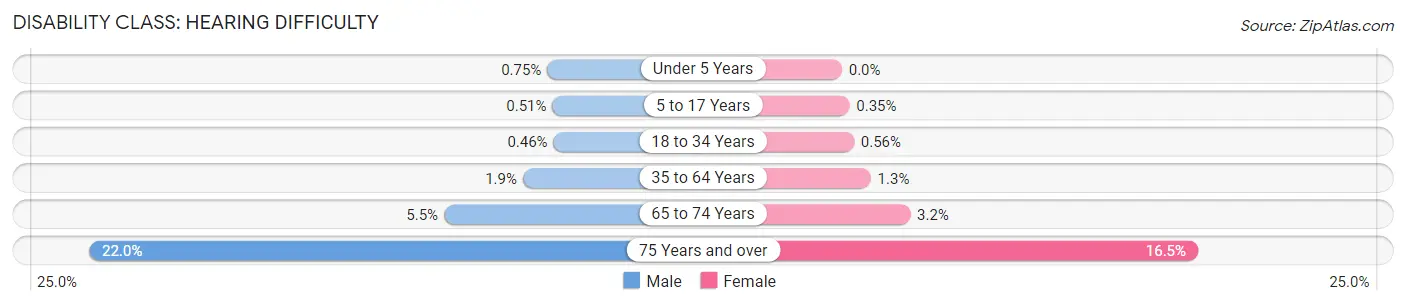
| Age Bracket | Male | Female |
| Under 5 Years | 104 (0.7%) | 0 (0.0%) |
| 5 to 17 Years | 143 (0.5%) | 108 (0.4%) |
| 18 to 34 Years | 396 (0.5%) | 486 (0.6%) |
| 35 to 64 Years | 1,623 (1.9%) | 1,148 (1.3%) |
| 65 to 74 Years | 830 (5.5%) | 628 (3.2%) |
| 75 Years and over | 1,929 (22.0%) | 2,296 (16.5%) |
Disability Class: Vision Difficulty
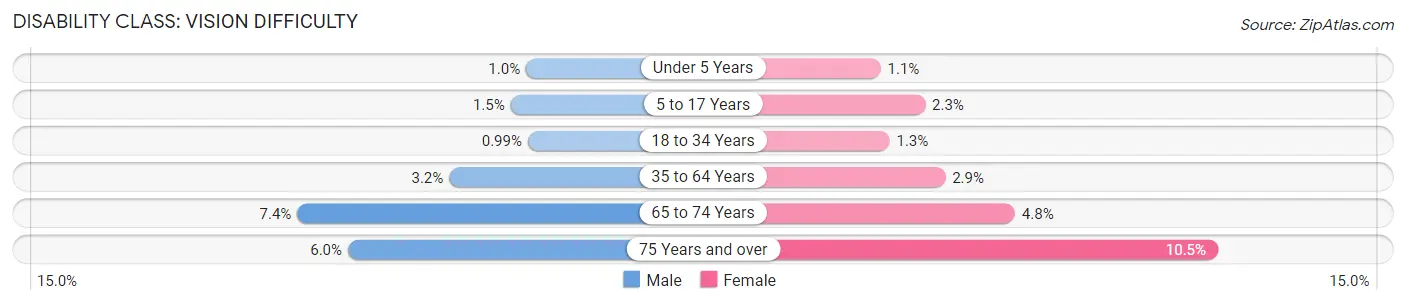
| Age Bracket | Male | Female |
| Under 5 Years | 143 (1.0%) | 135 (1.1%) |
| 5 to 17 Years | 410 (1.5%) | 714 (2.3%) |
| 18 to 34 Years | 856 (1.0%) | 1,149 (1.3%) |
| 35 to 64 Years | 2,745 (3.2%) | 2,478 (2.9%) |
| 65 to 74 Years | 1,109 (7.4%) | 954 (4.8%) |
| 75 Years and over | 526 (6.0%) | 1,455 (10.5%) |
Disability Class: Cognitive Difficulty
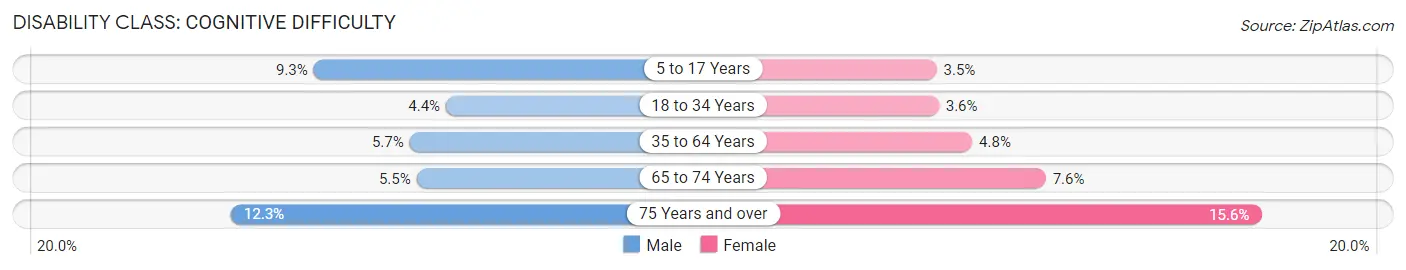
| Age Bracket | Male | Female |
| 5 to 17 Years | 2,578 (9.3%) | 1,084 (3.5%) |
| 18 to 34 Years | 3,770 (4.4%) | 3,096 (3.6%) |
| 35 to 64 Years | 4,924 (5.7%) | 4,158 (4.8%) |
| 65 to 74 Years | 816 (5.4%) | 1,497 (7.6%) |
| 75 Years and over | 1,082 (12.3%) | 2,163 (15.6%) |
Disability Class: Ambulatory Difficulty
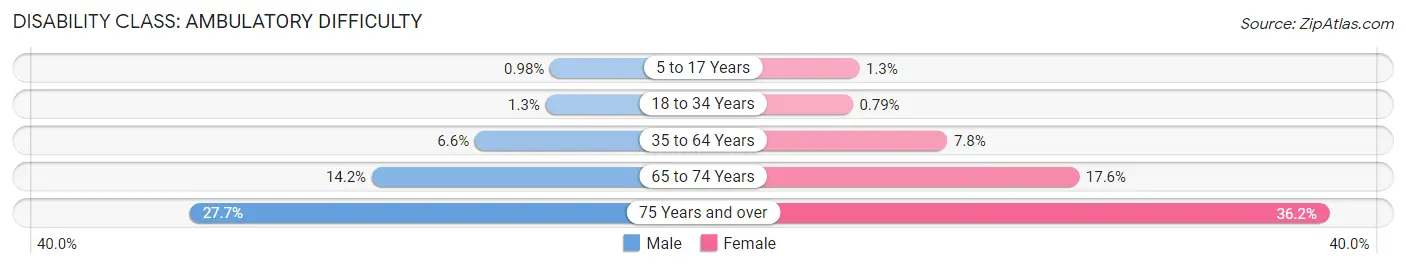
| Age Bracket | Male | Female |
| 5 to 17 Years | 272 (1.0%) | 396 (1.3%) |
| 18 to 34 Years | 1,131 (1.3%) | 683 (0.8%) |
| 35 to 64 Years | 5,664 (6.6%) | 6,710 (7.8%) |
| 65 to 74 Years | 2,128 (14.2%) | 3,482 (17.6%) |
| 75 Years and over | 2,431 (27.7%) | 5,024 (36.1%) |
Disability Class: Self-Care Difficulty
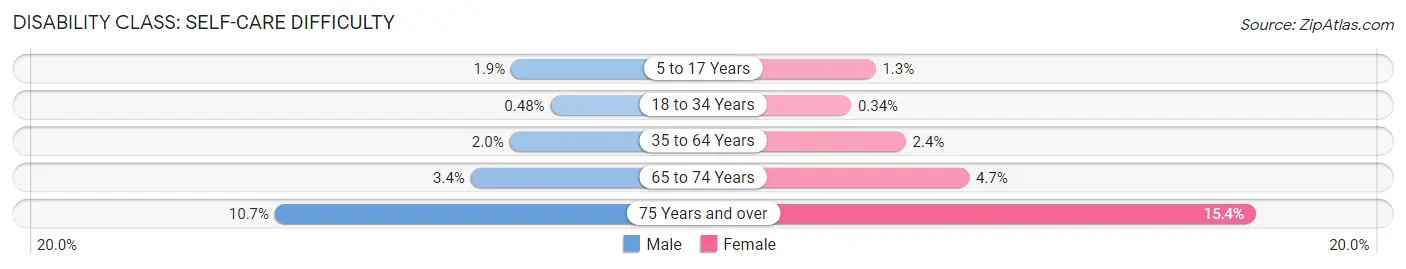
| Age Bracket | Male | Female |
| 5 to 17 Years | 539 (1.9%) | 386 (1.3%) |
| 18 to 34 Years | 418 (0.5%) | 290 (0.3%) |
| 35 to 64 Years | 1,728 (2.0%) | 2,040 (2.4%) |
| 65 to 74 Years | 515 (3.4%) | 933 (4.7%) |
| 75 Years and over | 939 (10.7%) | 2,136 (15.4%) |
Technology Access in Atlanta
Computing Device Access in Atlanta
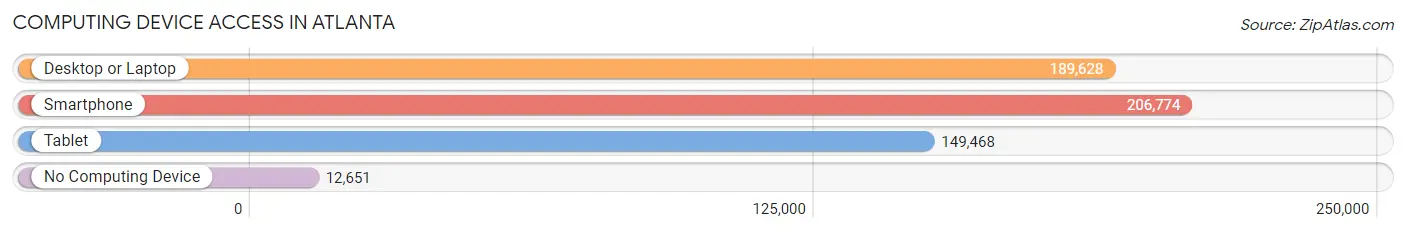
| Device Type | # Households | % Households |
| Desktop or Laptop | 189,628 | 83.4% |
| Smartphone | 206,774 | 90.9% |
| Tablet | 149,468 | 65.7% |
| No Computing Device | 12,651 | 5.6% |
| Total | 227,388 | 100.0% |
Internet Access in Atlanta
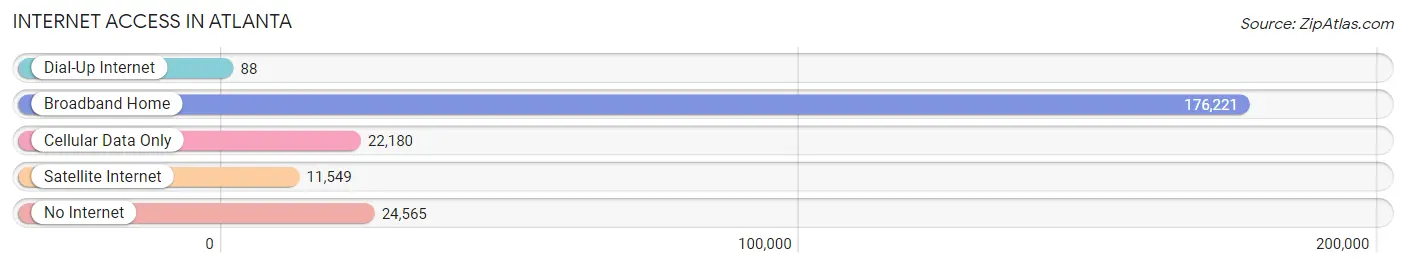
| Internet Type | # Households | % Households |
| Dial-Up Internet | 88 | 0.0% |
| Broadband Home | 176,221 | 77.5% |
| Cellular Data Only | 22,180 | 9.8% |
| Satellite Internet | 11,549 | 5.1% |
| No Internet | 24,565 | 10.8% |
| Total | 227,388 | 100.0% |
Atlanta Summary
Atlanta, Georgia is the capital and most populous city in the state of Georgia. It is the cultural and economic center of the Atlanta metropolitan area, home to more than 6 million people and the ninth-largest metropolitan area in the United States. Located in the foothills of the Appalachian Mountains, Atlanta is the county seat of Fulton County and a major transportation hub, with Hartsfield-Jackson Atlanta International Airport being the world's busiest airport by passenger traffic.
History
The area that is now Atlanta was originally inhabited by the Creek and Cherokee Native American tribes. In 1837, the city of Atlanta was founded at the intersection of two railroad lines, and the city quickly grew as a major transportation hub. During the Civil War, Atlanta was a major supply center for the Confederate Army, and the city was burned to the ground by Union forces in 1864. After the war, the city was rebuilt and quickly became a major center for commerce and industry.
In the late 19th century, Atlanta became a major center for the civil rights movement, and in the 20th century, the city was a major center for the civil rights movement. In the 1960s, Atlanta was the site of the Atlanta Child Murders, a series of racially motivated killings that shocked the nation.
Geography
Atlanta is located in the foothills of the Appalachian Mountains in north-central Georgia. The city is situated at the intersection of three major interstate highways, I-75, I-85, and I-20. The city is also located at the headwaters of the Chattahoochee River, which flows southward to the Gulf of Mexico.
The city of Atlanta covers an area of 132.4 square miles, and the metropolitan area covers an area of 8,376 square miles. The city is located at an elevation of 1,050 feet above sea level.
Economy
Atlanta is a major economic center in the southeastern United States. The city is home to the headquarters of many major corporations, including The Coca-Cola Company, Delta Air Lines, Home Depot, and UPS. The city is also home to the world's busiest airport, Hartsfield-Jackson Atlanta International Airport.
The city's economy is also driven by tourism, with more than 50 million visitors coming to the city each year. The city is home to many major attractions, including the Georgia Aquarium, the World of Coca-Cola, and the Martin Luther King Jr. National Historic Site.
Demographics
As of the 2010 census, the population of Atlanta was 420,003. The city is racially and ethnically diverse, with the largest racial groups being African American (54.0%), White (31.1%), and Hispanic or Latino (9.3%). The city is also home to a large number of immigrants, with the largest immigrant groups being from Mexico (4.2%), India (2.2%), and China (1.7%).
The median household income in Atlanta is $50,711, and the median home value is $179,700. The city has a poverty rate of 22.2%, and the unemployment rate is 5.2%.
Common Questions
What is Per Capita Income in Atlanta?
Per Capita income in Atlanta is $60,778.
What is the Median Family Income in Atlanta?
Median Family Income in Atlanta is $103,886.
What is the Median Household income in Atlanta?
Median Household Income in Atlanta is $77,655.
What is Income or Wage Gap in Atlanta?
Income or Wage Gap in Atlanta is 26.1%.
Women in Atlanta earn 73.9 cents for every dollar earned by a man.
What is Family Income Deficit in Atlanta?
Family Income Deficit in Atlanta is $11,835.
Families that are below poverty line in Atlanta earn $11,835 less on average than the poverty threshold level.
What is Inequality or Gini Index in Atlanta?
Inequality or Gini Index in Atlanta is 0.57.
What is the Total Population of Atlanta?
Total Population of Atlanta is 494,838.
What is the Total Male Population of Atlanta?
Total Male Population of Atlanta is 244,396.
What is the Total Female Population of Atlanta?
Total Female Population of Atlanta is 250,442.
What is the Ratio of Males per 100 Females in Atlanta?
There are 97.59 Males per 100 Females in Atlanta.
What is the Ratio of Females per 100 Males in Atlanta?
There are 102.47 Females per 100 Males in Atlanta.
What is the Median Population Age in Atlanta?
Median Population Age in Atlanta is 33.6 Years.
What is the Average Family Size in Atlanta
Average Family Size in Atlanta is 3.0 People.
What is the Average Household Size in Atlanta
Average Household Size in Atlanta is 2.0 People.
How Large is the Labor Force in Atlanta?
There are 281,022 People in the Labor Forcein in Atlanta.
What is the Percentage of People in the Labor Force in Atlanta?
67.3% of People are in the Labor Force in Atlanta.
What is the Unemployment Rate in Atlanta?
Unemployment Rate in Atlanta is 5.8%.