St Petersburg, FL Map & Demographics
St Petersburg Map
St Petersburg Overview
$46,755
PER CAPITA INCOME
$93,451
AVG FAMILY INCOME
$70,333
AVG HOUSEHOLD INCOME
15.6%
WAGE / INCOME GAP [ % ]
84.4¢/ $1
WAGE / INCOME GAP [ $ ]
$10,772
FAMILY INCOME DEFICIT
0.49
INEQUALITY / GINI INDEX
259,343
TOTAL POPULATION
125,050
MALE POPULATION
134,293
FEMALE POPULATION
93.12
MALES / 100 FEMALES
107.39
FEMALES / 100 MALES
42.9
MEDIAN AGE
3.0
AVG FAMILY SIZE
2.2
AVG HOUSEHOLD SIZE
143,639
LABOR FORCE [ PEOPLE ]
64.7%
PERCENT IN LABOR FORCE
4.6%
UNEMPLOYMENT RATE
St Petersburg Area Codes
Income in St Petersburg
Income Overview in St Petersburg
Per Capita Income in St Petersburg is $46,755, while median incomes of families and households are $93,451 and $70,333 respectively.
| Characteristic | Number | Measure |
| Per Capita Income | 259,343 | $46,755 |
| Median Family Income | 58,654 | $93,451 |
| Mean Family Income | 58,654 | $129,420 |
| Median Household Income | 113,817 | $70,333 |
| Mean Household Income | 113,817 | $101,809 |
| Income Deficit | 58,654 | $10,772 |
| Wage / Income Gap (%) | 259,343 | 15.60% |
| Wage / Income Gap ($) | 259,343 | 84.40¢ per $1 |
| Gini / Inequality Index | 259,343 | 0.49 |
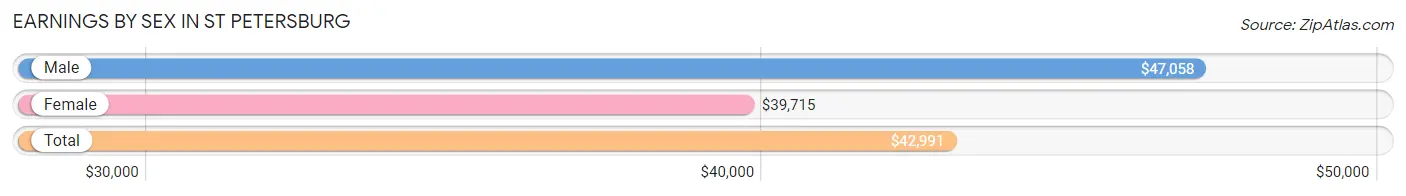
Earnings by Sex in St Petersburg
Average Earnings in St Petersburg are $42,991, $47,058 for men and $39,715 for women, a difference of 15.6%.
| Sex | Number | Average Earnings |
| Male | 73,260 (49.7%) | $47,058 |
| Female | 74,275 (50.3%) | $39,715 |
| Total | 147,535 (100.0%) | $42,991 |
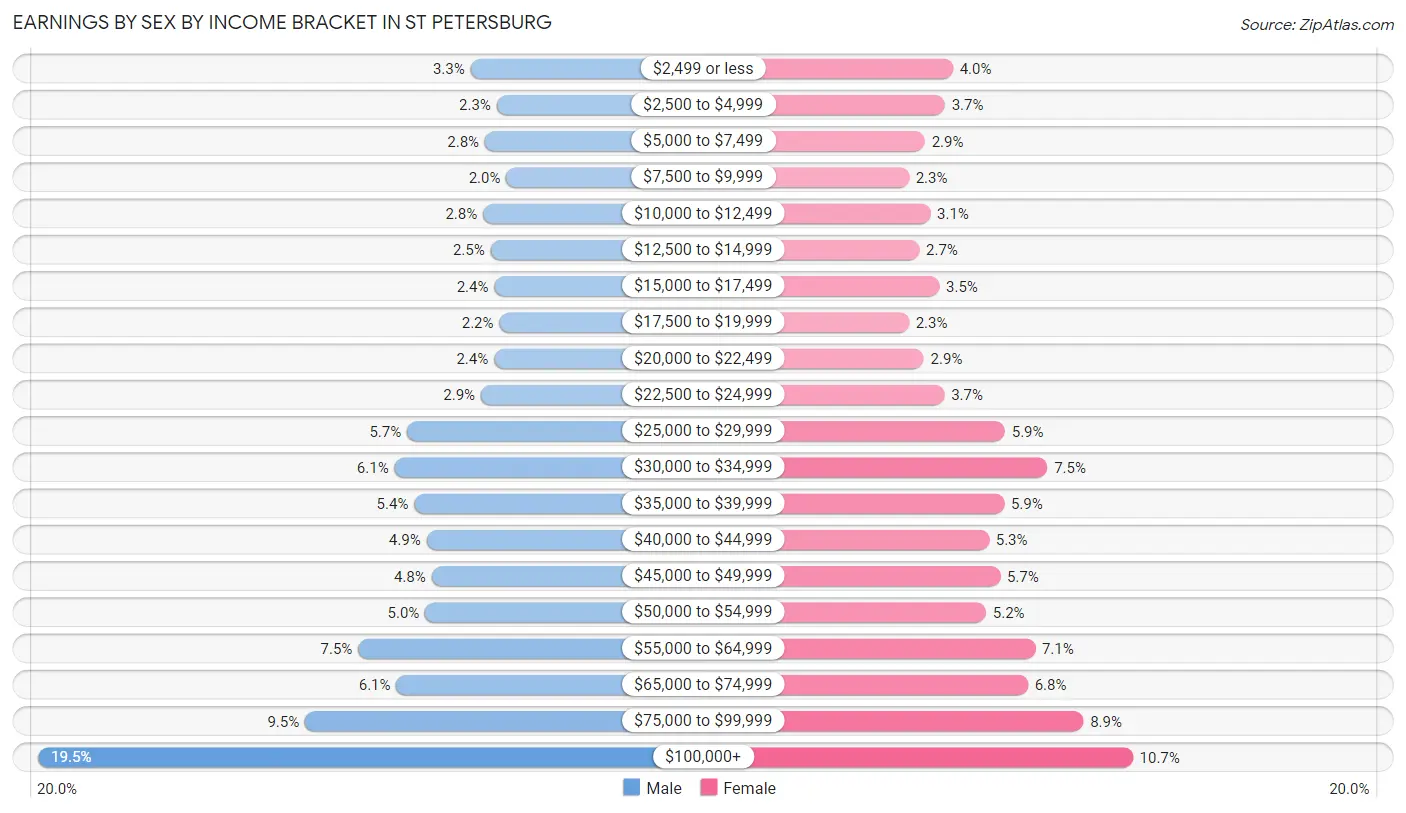
Earnings by Sex by Income Bracket in St Petersburg
The most common earnings brackets in St Petersburg are $100,000+ for men (14,275 | 19.5%) and $100,000+ for women (7,958 | 10.7%).
| Income | Male | Female |
| $2,499 or less | 2,411 (3.3%) | 2,947 (4.0%) |
| $2,500 to $4,999 | 1,692 (2.3%) | 2,726 (3.7%) |
| $5,000 to $7,499 | 2,012 (2.8%) | 2,172 (2.9%) |
| $7,500 to $9,999 | 1,425 (1.9%) | 1,724 (2.3%) |
| $10,000 to $12,499 | 2,067 (2.8%) | 2,315 (3.1%) |
| $12,500 to $14,999 | 1,861 (2.5%) | 2,016 (2.7%) |
| $15,000 to $17,499 | 1,758 (2.4%) | 2,567 (3.5%) |
| $17,500 to $19,999 | 1,617 (2.2%) | 1,724 (2.3%) |
| $20,000 to $22,499 | 1,769 (2.4%) | 2,139 (2.9%) |
| $22,500 to $24,999 | 2,124 (2.9%) | 2,708 (3.6%) |
| $25,000 to $29,999 | 4,151 (5.7%) | 4,395 (5.9%) |
| $30,000 to $34,999 | 4,498 (6.1%) | 5,577 (7.5%) |
| $35,000 to $39,999 | 3,956 (5.4%) | 4,378 (5.9%) |
| $40,000 to $44,999 | 3,616 (4.9%) | 3,951 (5.3%) |
| $45,000 to $49,999 | 3,482 (4.8%) | 4,262 (5.7%) |
| $50,000 to $54,999 | 3,655 (5.0%) | 3,867 (5.2%) |
| $55,000 to $64,999 | 5,491 (7.5%) | 5,234 (7.0%) |
| $65,000 to $74,999 | 4,446 (6.1%) | 5,034 (6.8%) |
| $75,000 to $99,999 | 6,954 (9.5%) | 6,581 (8.9%) |
| $100,000+ | 14,275 (19.5%) | 7,958 (10.7%) |
| Total | 73,260 (100.0%) | 74,275 (100.0%) |
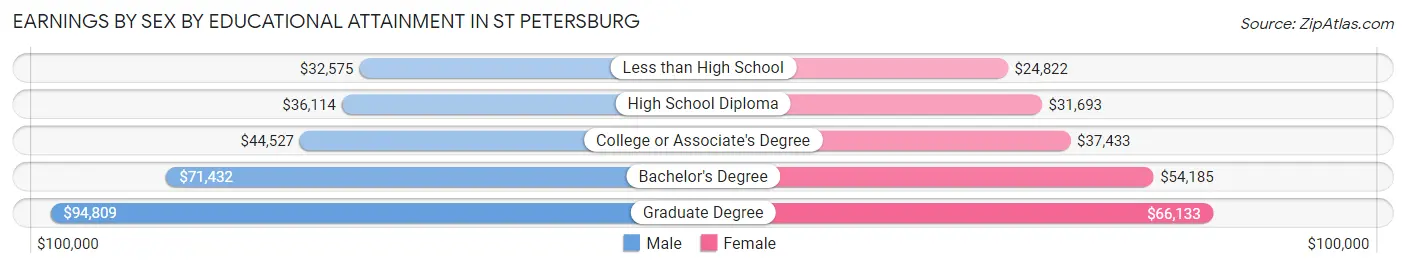
Earnings by Sex by Educational Attainment in St Petersburg
Average earnings in St Petersburg are $52,480 for men and $44,736 for women, a difference of 14.8%. Men with an educational attainment of graduate degree enjoy the highest average annual earnings of $94,809, while those with less than high school education earn the least with $32,575. Women with an educational attainment of graduate degree earn the most with the average annual earnings of $66,133, while those with less than high school education have the smallest earnings of $24,822.
| Educational Attainment | Male Income | Female Income |
| Less than High School | $32,575 | $24,822 |
| High School Diploma | $36,114 | $31,693 |
| College or Associate's Degree | $44,527 | $37,433 |
| Bachelor's Degree | $71,432 | $54,185 |
| Graduate Degree | $94,809 | $66,133 |
| Total | $52,480 | $44,736 |
Family Income in St Petersburg
Family Income Brackets in St Petersburg
According to the St Petersburg family income data, there are 11,848 families falling into the $100,000 to $149,999 income range, which is the most common income bracket and makes up 20.2% of all families. Conversely, the $10,000 to $14,999 income bracket is the least frequent group with only 1,114 families (1.9%) belonging to this category.
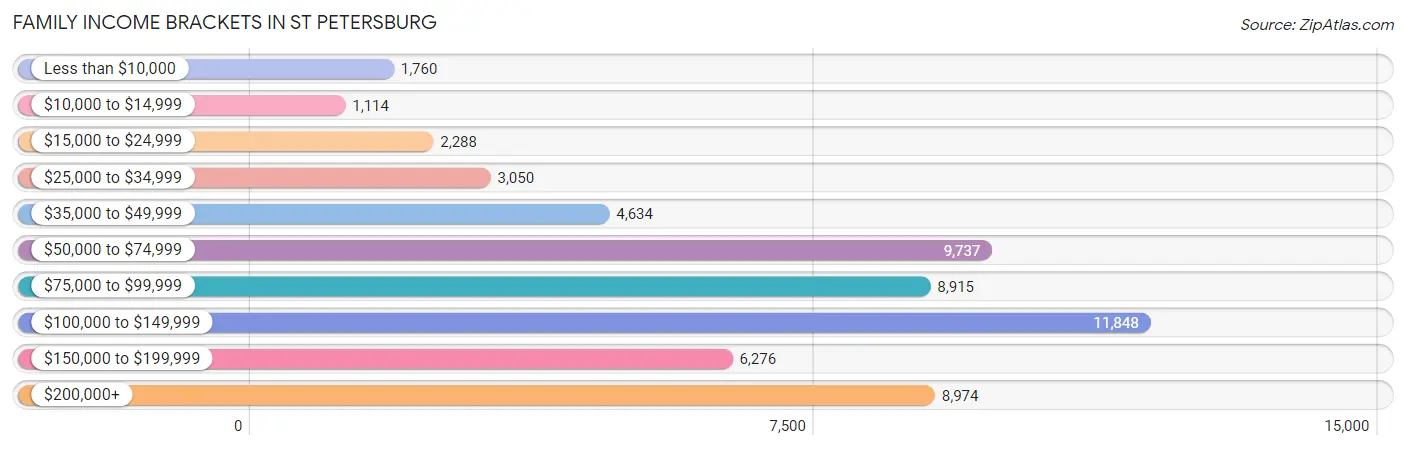
| Income Bracket | # Families | % Families |
| Less than $10,000 | 1,760 | 3.0% |
| $10,000 to $14,999 | 1,114 | 1.9% |
| $15,000 to $24,999 | 2,288 | 3.9% |
| $25,000 to $34,999 | 3,050 | 5.2% |
| $35,000 to $49,999 | 4,634 | 7.9% |
| $50,000 to $74,999 | 9,737 | 16.6% |
| $75,000 to $99,999 | 8,915 | 15.2% |
| $100,000 to $149,999 | 11,848 | 20.2% |
| $150,000 to $199,999 | 6,276 | 10.7% |
| $200,000+ | 8,974 | 15.3% |
Family Income by Famaliy Size in St Petersburg
4-person families (7,932 | 13.5%) account for the highest median family income in St Petersburg with $117,382 per family, while 2-person families (34,346 | 58.6%) have the highest median income of $43,566 per family member.
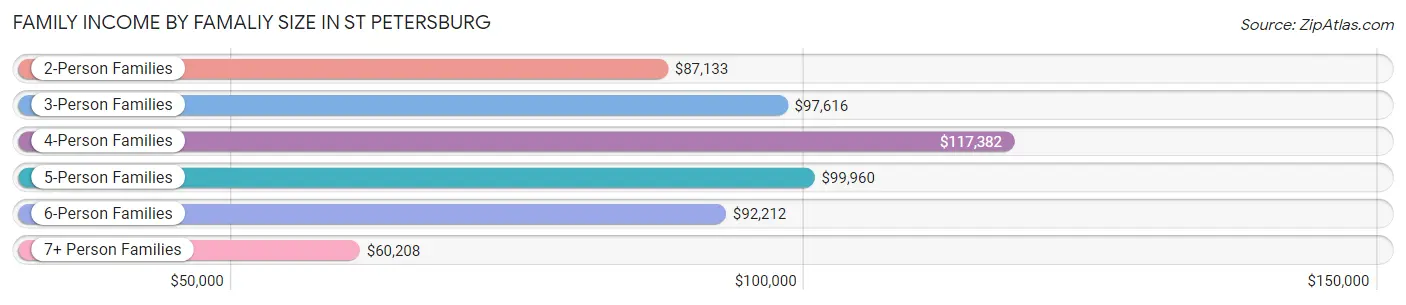
| Income Bracket | # Families | Median Income |
| 2-Person Families | 34,346 (58.6%) | $87,133 |
| 3-Person Families | 12,088 (20.6%) | $97,616 |
| 4-Person Families | 7,932 (13.5%) | $117,382 |
| 5-Person Families | 2,791 (4.8%) | $99,960 |
| 6-Person Families | 1,030 (1.8%) | $92,212 |
| 7+ Person Families | 467 (0.8%) | $60,208 |
| Total | 58,654 (100.0%) | $93,451 |
Family Income by Number of Earners in St Petersburg
The median family income in St Petersburg is $93,451, with families comprising 3+ earners (4,005) having the highest median family income of $127,987, while families with no earners (9,239) have the lowest median family income of $61,278, accounting for 6.8% and 15.8% of families, respectively.
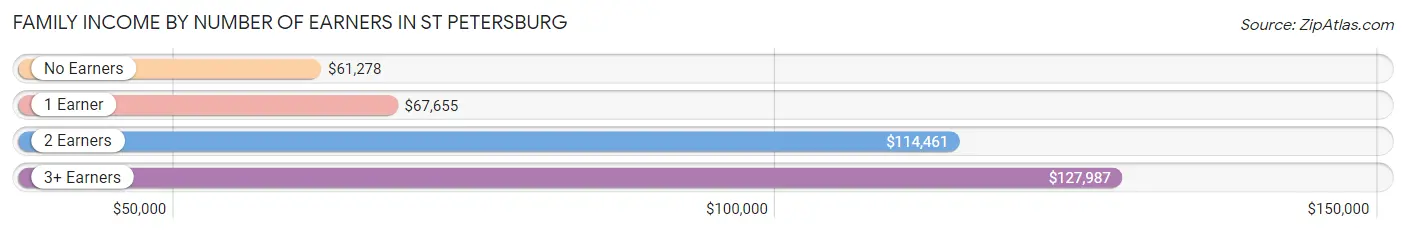
| Number of Earners | # Families | Median Income |
| No Earners | 9,239 (15.8%) | $61,278 |
| 1 Earner | 19,090 (32.6%) | $67,655 |
| 2 Earners | 26,320 (44.9%) | $114,461 |
| 3+ Earners | 4,005 (6.8%) | $127,987 |
| Total | 58,654 (100.0%) | $93,451 |
Household Income in St Petersburg
Household Income Brackets in St Petersburg
With 20,829 households falling in the category, the $50,000 to $74,999 income range is the most frequent in St Petersburg, accounting for 18.3% of all households. In contrast, only 4,097 households (3.6%) fall into the $10,000 to $14,999 income bracket, making it the least populous group.
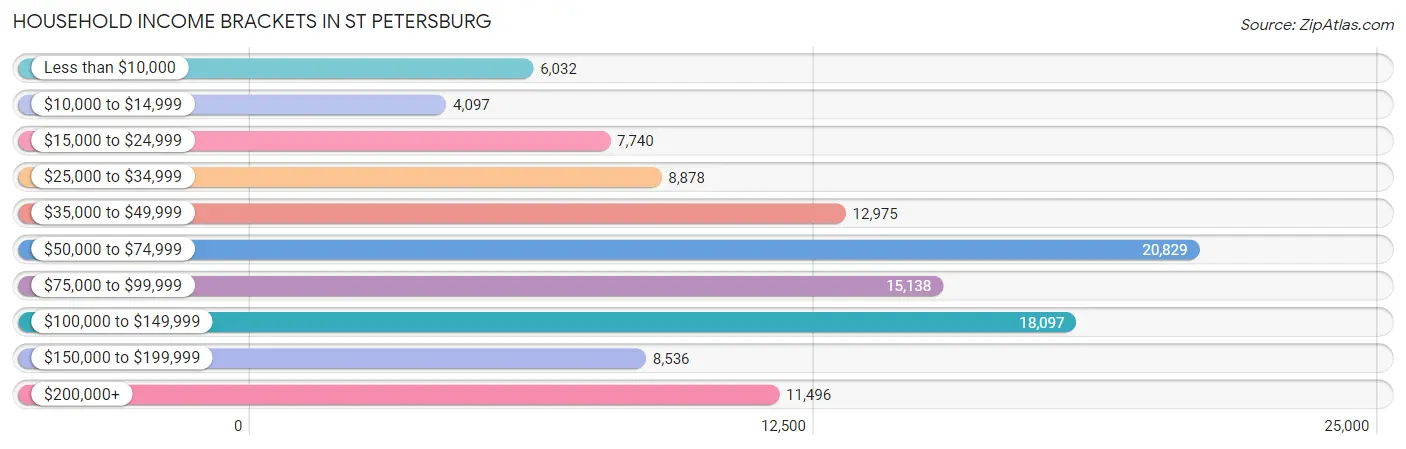
| Income Bracket | # Households | % Households |
| Less than $10,000 | 6,032 | 5.3% |
| $10,000 to $14,999 | 4,097 | 3.6% |
| $15,000 to $24,999 | 7,740 | 6.8% |
| $25,000 to $34,999 | 8,878 | 7.8% |
| $35,000 to $49,999 | 12,975 | 11.4% |
| $50,000 to $74,999 | 20,829 | 18.3% |
| $75,000 to $99,999 | 15,138 | 13.3% |
| $100,000 to $149,999 | 18,097 | 15.9% |
| $150,000 to $199,999 | 8,536 | 7.5% |
| $200,000+ | 11,496 | 10.1% |
Household Income by Householder Age in St Petersburg
The median household income in St Petersburg is $70,333, with the highest median household income of $82,287 found in the 45 to 64 years age bracket for the primary householder. A total of 42,128 households (37.0%) fall into this category. Meanwhile, the 15 to 24 years age bracket for the primary householder has the lowest median household income of $44,659, with 3,285 households (2.9%) in this group.
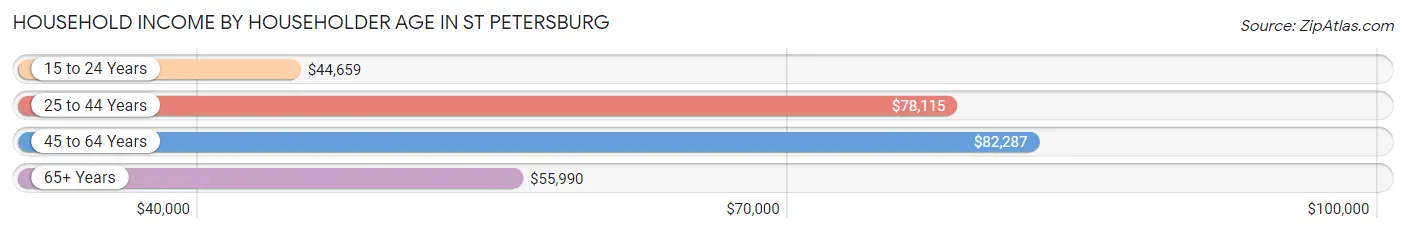
| Income Bracket | # Households | Median Income |
| 15 to 24 Years | 3,285 (2.9%) | $44,659 |
| 25 to 44 Years | 35,824 (31.5%) | $78,115 |
| 45 to 64 Years | 42,128 (37.0%) | $82,287 |
| 65+ Years | 32,580 (28.6%) | $55,990 |
| Total | 113,817 (100.0%) | $70,333 |
Poverty in St Petersburg
Income Below Poverty by Sex and Age in St Petersburg
With 11.0% poverty level for males and 12.8% for females among the residents of St Petersburg, 12 to 14 year old males and 18 to 24 year old females are the most vulnerable to poverty, with 692 males (23.3%) and 2,237 females (23.5%) in their respective age groups living below the poverty level.
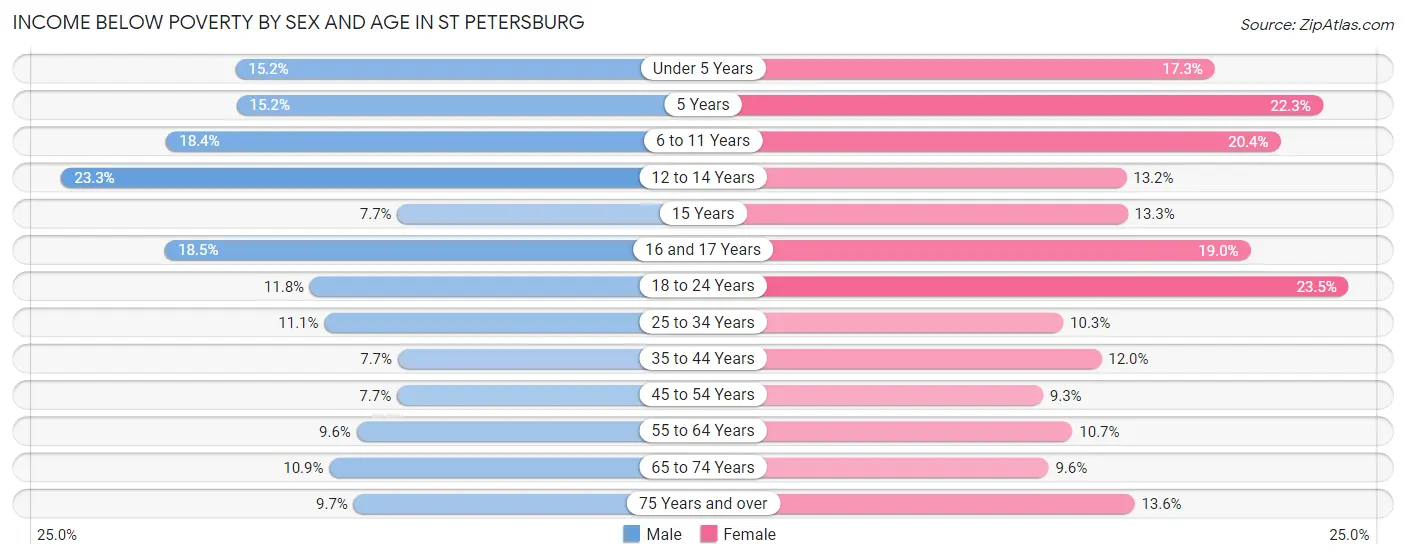
| Age Bracket | Male | Female |
| Under 5 Years | 946 (15.2%) | 973 (17.3%) |
| 5 Years | 181 (15.2%) | 191 (22.3%) |
| 6 to 11 Years | 1,307 (18.4%) | 1,379 (20.3%) |
| 12 to 14 Years | 692 (23.3%) | 456 (13.2%) |
| 15 Years | 88 (7.7%) | 146 (13.3%) |
| 16 and 17 Years | 476 (18.5%) | 436 (19.0%) |
| 18 to 24 Years | 984 (11.8%) | 2,237 (23.5%) |
| 25 to 34 Years | 2,188 (11.1%) | 2,100 (10.3%) |
| 35 to 44 Years | 1,252 (7.7%) | 2,003 (12.0%) |
| 45 to 54 Years | 1,199 (7.7%) | 1,547 (9.3%) |
| 55 to 64 Years | 1,790 (9.6%) | 2,151 (10.7%) |
| 65 to 74 Years | 1,523 (10.9%) | 1,483 (9.6%) |
| 75 Years and over | 825 (9.7%) | 1,542 (13.6%) |
| Total | 13,451 (11.0%) | 16,644 (12.8%) |
Income Above Poverty by Sex and Age in St Petersburg
According to the poverty statistics in St Petersburg, males aged 35 to 44 years and females aged 45 to 54 years are the age groups that are most secure financially, with 92.3% of males and 90.7% of females in these age groups living above the poverty line.
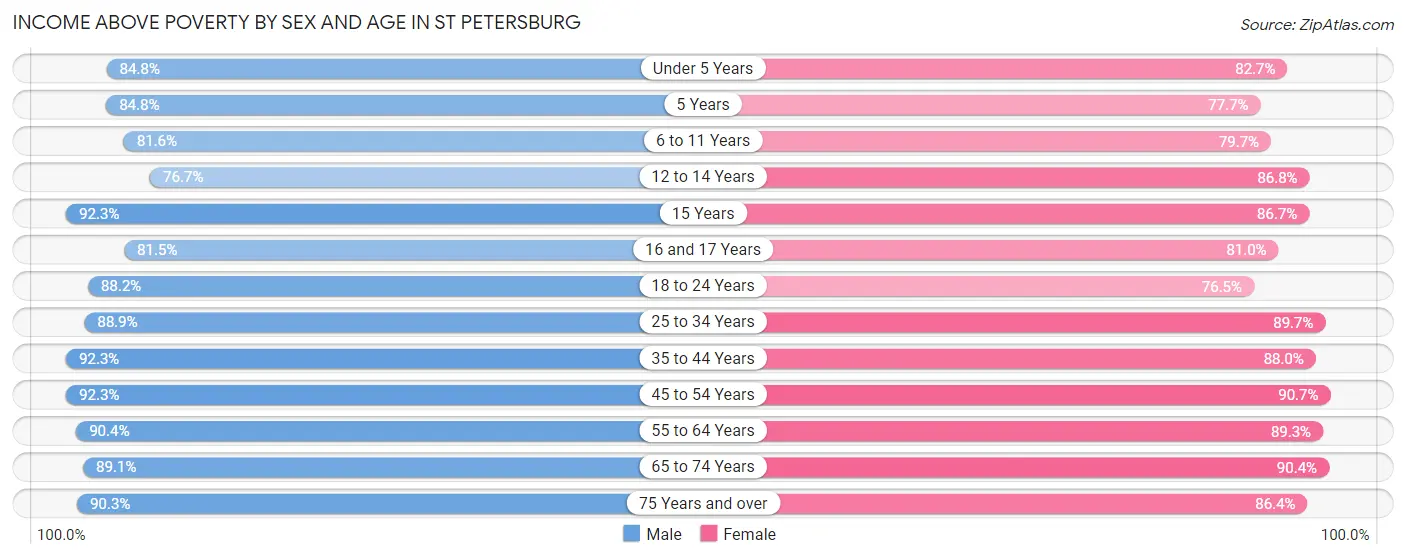
| Age Bracket | Male | Female |
| Under 5 Years | 5,269 (84.8%) | 4,652 (82.7%) |
| 5 Years | 1,013 (84.8%) | 665 (77.7%) |
| 6 to 11 Years | 5,790 (81.6%) | 5,397 (79.6%) |
| 12 to 14 Years | 2,279 (76.7%) | 2,999 (86.8%) |
| 15 Years | 1,055 (92.3%) | 955 (86.7%) |
| 16 and 17 Years | 2,100 (81.5%) | 1,863 (81.0%) |
| 18 to 24 Years | 7,386 (88.2%) | 7,274 (76.5%) |
| 25 to 34 Years | 17,549 (88.9%) | 18,356 (89.7%) |
| 35 to 44 Years | 15,050 (92.3%) | 14,635 (88.0%) |
| 45 to 54 Years | 14,329 (92.3%) | 15,042 (90.7%) |
| 55 to 64 Years | 16,868 (90.4%) | 17,951 (89.3%) |
| 65 to 74 Years | 12,503 (89.1%) | 13,981 (90.4%) |
| 75 Years and over | 7,657 (90.3%) | 9,811 (86.4%) |
| Total | 108,848 (89.0%) | 113,581 (87.2%) |
Income Below Poverty Among Married-Couple Families in St Petersburg
The poverty statistics for married-couple families in St Petersburg show that 3.4% or 1,412 of the total 42,058 families live below the poverty line. Families with 5 or more children have the highest poverty rate of 57.1%, comprising of 48 families. On the other hand, families with no children have the lowest poverty rate of 2.8%, which includes 792 families.
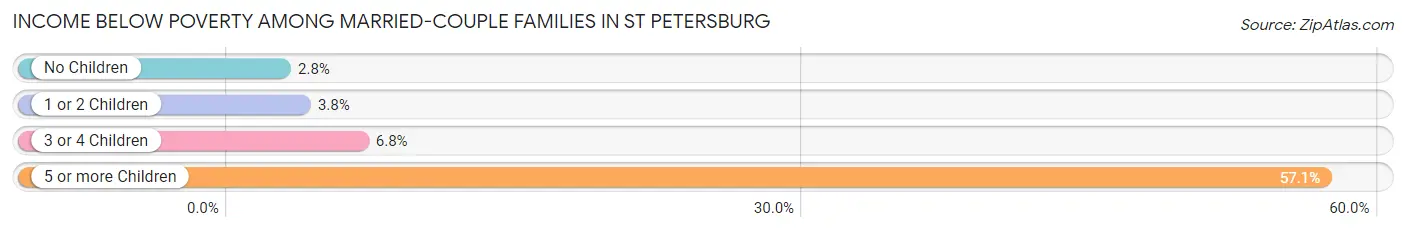
| Children | Above Poverty | Below Poverty |
| No Children | 27,749 (97.2%) | 792 (2.8%) |
| 1 or 2 Children | 11,005 (96.2%) | 436 (3.8%) |
| 3 or 4 Children | 1,856 (93.2%) | 136 (6.8%) |
| 5 or more Children | 36 (42.9%) | 48 (57.1%) |
| Total | 40,646 (96.6%) | 1,412 (3.4%) |
Income Below Poverty Among Single-Parent Households in St Petersburg
According to the poverty data in St Petersburg, 19.4% or 795 single-father households and 19.2% or 2,405 single-mother households are living below the poverty line. Among single-father households, those with 3 or 4 children have the highest poverty rate, with 26 households (56.5%) experiencing poverty. Likewise, among single-mother households, those with 5 or more children have the highest poverty rate, with 84 households (64.6%) falling below the poverty line.
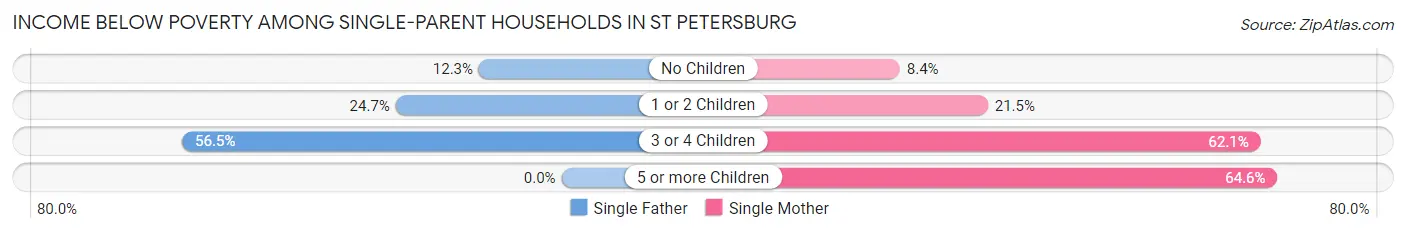
| Children | Single Father | Single Mother |
| No Children | 229 (12.3%) | 491 (8.4%) |
| 1 or 2 Children | 540 (24.7%) | 1,169 (21.5%) |
| 3 or 4 Children | 26 (56.5%) | 661 (62.1%) |
| 5 or more Children | 0 (0.0%) | 84 (64.6%) |
| Total | 795 (19.4%) | 2,405 (19.2%) |
Income Below Poverty Among Married-Couple vs Single-Parent Households in St Petersburg
The poverty data for St Petersburg shows that 1,412 of the married-couple family households (3.4%) and 3,200 of the single-parent households (19.3%) are living below the poverty level. Within the married-couple family households, those with 5 or more children have the highest poverty rate, with 48 households (57.1%) falling below the poverty line. Among the single-parent households, those with 5 or more children have the highest poverty rate, with 84 household (64.6%) living below poverty.
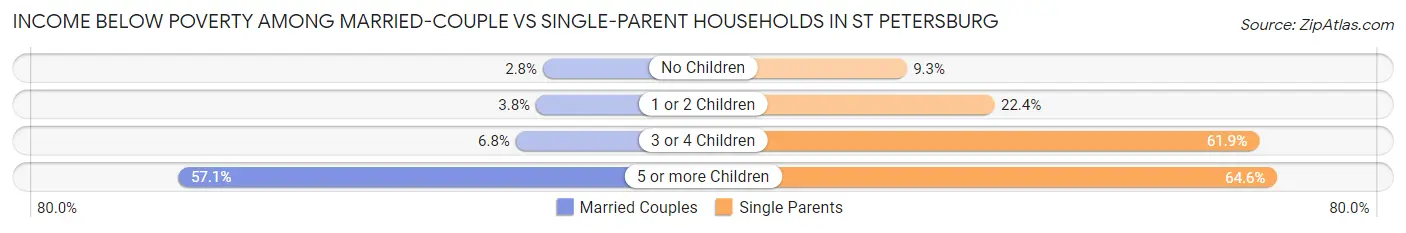
| Children | Married-Couple Families | Single-Parent Households |
| No Children | 792 (2.8%) | 720 (9.3%) |
| 1 or 2 Children | 436 (3.8%) | 1,709 (22.4%) |
| 3 or 4 Children | 136 (6.8%) | 687 (61.9%) |
| 5 or more Children | 48 (57.1%) | 84 (64.6%) |
| Total | 1,412 (3.4%) | 3,200 (19.3%) |
Race in St Petersburg
The most populous races in St Petersburg are White / Caucasian (173,639 | 66.9%), Black / African American (52,156 | 20.1%), and Hispanic or Latino (22,936 | 8.8%).
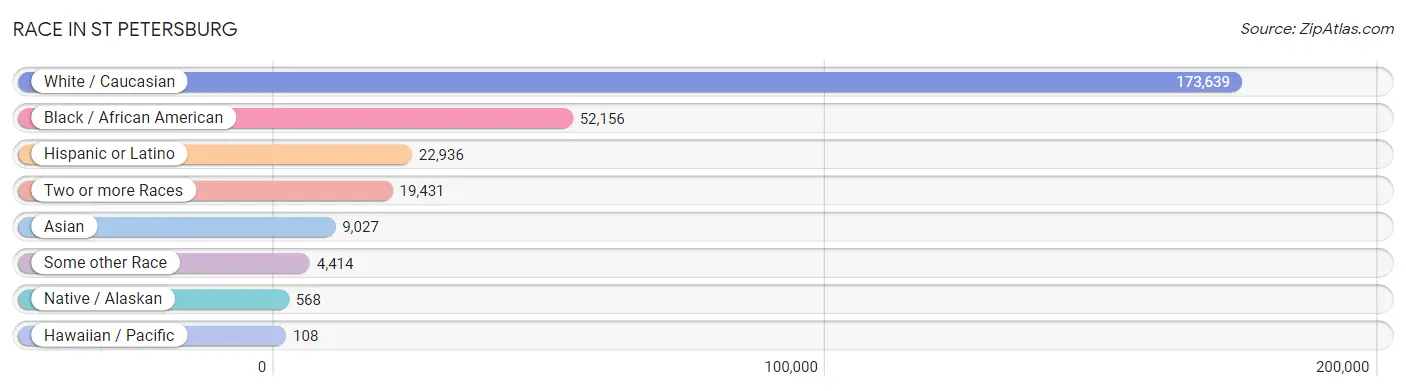
| Race | # Population | % Population |
| Asian | 9,027 | 3.5% |
| Black / African American | 52,156 | 20.1% |
| Hawaiian / Pacific | 108 | 0.0% |
| Hispanic or Latino | 22,936 | 8.8% |
| Native / Alaskan | 568 | 0.2% |
| White / Caucasian | 173,639 | 66.9% |
| Two or more Races | 19,431 | 7.5% |
| Some other Race | 4,414 | 1.7% |
| Total | 259,343 | 100.0% |
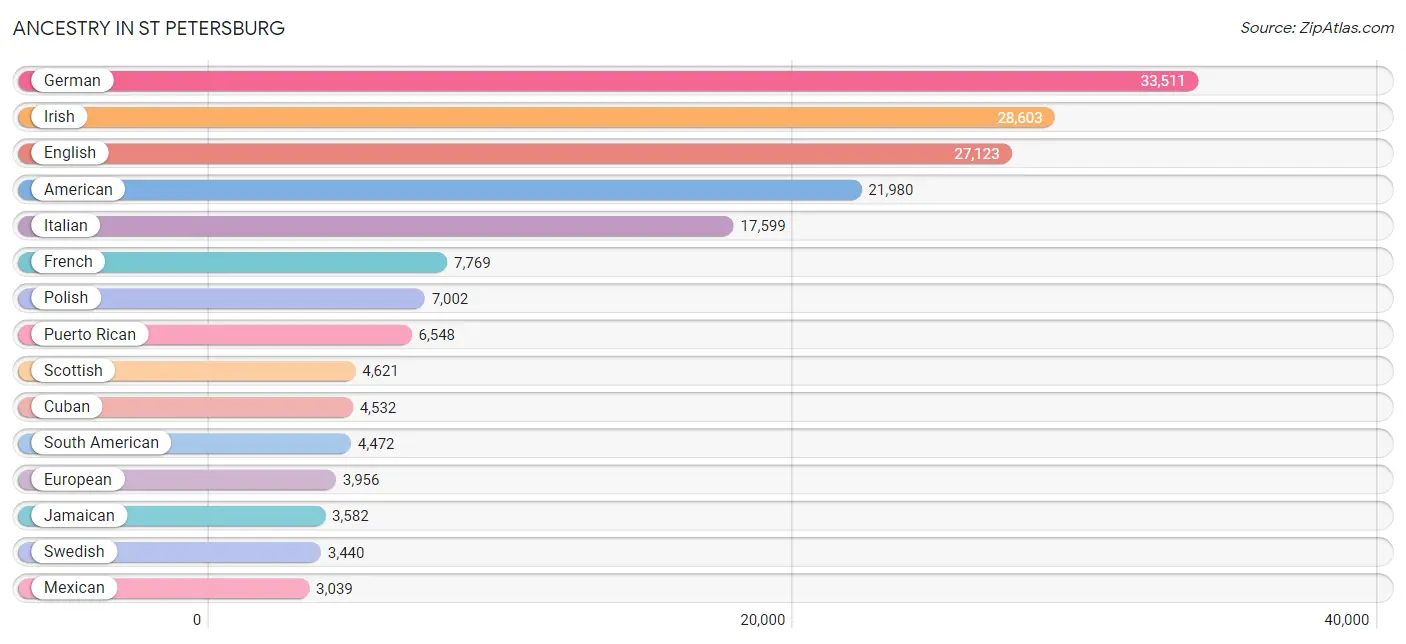
Ancestry in St Petersburg
The most populous ancestries reported in St Petersburg are German (33,511 | 12.9%), Irish (28,603 | 11.0%), English (27,123 | 10.5%), American (21,980 | 8.5%), and Italian (17,599 | 6.8%), together accounting for 49.7% of all St Petersburg residents.
| Ancestry | # Population | % Population |
| Afghan | 69 | 0.0% |
| African | 1,114 | 0.4% |
| Alaska Native | 16 | 0.0% |
| Albanian | 444 | 0.2% |
| Alsatian | 9 | 0.0% |
| American | 21,980 | 8.5% |
| Apache | 15 | 0.0% |
| Arab | 2,263 | 0.9% |
| Argentinean | 153 | 0.1% |
| Armenian | 154 | 0.1% |
| Australian | 34 | 0.0% |
| Austrian | 653 | 0.3% |
| Bahamian | 273 | 0.1% |
| Bangladeshi | 6 | 0.0% |
| Barbadian | 43 | 0.0% |
| Basque | 39 | 0.0% |
| Belgian | 423 | 0.2% |
| Belizean | 20 | 0.0% |
| Bermudan | 111 | 0.0% |
| Bhutanese | 413 | 0.2% |
| Blackfeet | 206 | 0.1% |
| Bolivian | 116 | 0.0% |
| Brazilian | 553 | 0.2% |
| British | 2,111 | 0.8% |
| British West Indian | 99 | 0.0% |
| Bulgarian | 124 | 0.1% |
| Burmese | 398 | 0.2% |
| Cajun | 12 | 0.0% |
| Cambodian | 9 | 0.0% |
| Canadian | 1,102 | 0.4% |
| Cape Verdean | 28 | 0.0% |
| Carpatho Rusyn | 44 | 0.0% |
| Celtic | 52 | 0.0% |
| Central American | 1,666 | 0.6% |
| Central American Indian | 272 | 0.1% |
| Cherokee | 768 | 0.3% |
| Chilean | 118 | 0.1% |
| Chippewa | 68 | 0.0% |
| Choctaw | 135 | 0.1% |
| Colombian | 1,454 | 0.6% |
| Costa Rican | 272 | 0.1% |
| Cree | 26 | 0.0% |
| Creek | 18 | 0.0% |
| Croatian | 561 | 0.2% |
| Crow | 11 | 0.0% |
| Cuban | 4,532 | 1.8% |
| Czech | 927 | 0.4% |
| Czechoslovakian | 237 | 0.1% |
| Danish | 1,142 | 0.4% |
| Delaware | 25 | 0.0% |
| Dominican | 1,070 | 0.4% |
| Dutch | 2,509 | 1.0% |
| Eastern European | 926 | 0.4% |
| Ecuadorian | 743 | 0.3% |
| Egyptian | 159 | 0.1% |
| English | 27,123 | 10.5% |
| Estonian | 48 | 0.0% |
| Ethiopian | 21 | 0.0% |
| European | 3,956 | 1.5% |
| Filipino | 63 | 0.0% |
| Finnish | 499 | 0.2% |
| French | 7,769 | 3.0% |
| French American Indian | 26 | 0.0% |
| French Canadian | 1,490 | 0.6% |
| German | 33,511 | 12.9% |
| German Russian | 6 | 0.0% |
| Ghanaian | 93 | 0.0% |
| Greek | 1,793 | 0.7% |
| Guamanian / Chamorro | 34 | 0.0% |
| Guatemalan | 166 | 0.1% |
| Guyanese | 48 | 0.0% |
| Haitian | 1,012 | 0.4% |
| Honduran | 161 | 0.1% |
| Hungarian | 1,537 | 0.6% |
| Indian (Asian) | 1,105 | 0.4% |
| Indonesian | 79 | 0.0% |
| Inupiat | 9 | 0.0% |
| Iranian | 153 | 0.1% |
| Iraqi | 17 | 0.0% |
| Irish | 28,603 | 11.0% |
| Iroquois | 95 | 0.0% |
| Israeli | 4 | 0.0% |
| Italian | 17,599 | 6.8% |
| Jamaican | 3,582 | 1.4% |
| Japanese | 941 | 0.4% |
| Jordanian | 56 | 0.0% |
| Kenyan | 15 | 0.0% |
| Korean | 2,166 | 0.8% |
| Laotian | 47 | 0.0% |
| Latvian | 229 | 0.1% |
| Lebanese | 745 | 0.3% |
| Liberian | 335 | 0.1% |
| Lithuanian | 661 | 0.3% |
| Luxembourger | 70 | 0.0% |
| Malaysian | 1,404 | 0.5% |
| Maltese | 39 | 0.0% |
| Mexican | 3,039 | 1.2% |
| Mexican American Indian | 9 | 0.0% |
| Moroccan | 81 | 0.0% |
| Native Hawaiian | 105 | 0.0% |
| New Zealander | 93 | 0.0% |
| Nicaraguan | 242 | 0.1% |
| Nigerian | 246 | 0.1% |
| Northern European | 508 | 0.2% |
| Norwegian | 2,334 | 0.9% |
| Osage | 53 | 0.0% |
| Pakistani | 214 | 0.1% |
| Palestinian | 105 | 0.0% |
| Panamanian | 586 | 0.2% |
| Pennsylvania German | 101 | 0.0% |
| Peruvian | 778 | 0.3% |
| Pima | 6 | 0.0% |
| Polish | 7,002 | 2.7% |
| Portuguese | 1,246 | 0.5% |
| Potawatomi | 14 | 0.0% |
| Pueblo | 6 | 0.0% |
| Puerto Rican | 6,548 | 2.5% |
| Romanian | 461 | 0.2% |
| Russian | 1,861 | 0.7% |
| Salvadoran | 239 | 0.1% |
| Samoan | 4 | 0.0% |
| Scandinavian | 688 | 0.3% |
| Scotch-Irish | 2,646 | 1.0% |
| Scottish | 4,621 | 1.8% |
| Seminole | 23 | 0.0% |
| Serbian | 743 | 0.3% |
| Slavic | 257 | 0.1% |
| Slovak | 563 | 0.2% |
| Slovene | 113 | 0.0% |
| South African | 33 | 0.0% |
| South American | 4,472 | 1.7% |
| South American Indian | 29 | 0.0% |
| Soviet Union | 34 | 0.0% |
| Spaniard | 712 | 0.3% |
| Spanish | 365 | 0.1% |
| Spanish American | 8 | 0.0% |
| Sri Lankan | 2,742 | 1.1% |
| Subsaharan African | 2,014 | 0.8% |
| Swedish | 3,440 | 1.3% |
| Swiss | 619 | 0.2% |
| Syrian | 175 | 0.1% |
| Taiwanese | 15 | 0.0% |
| Thai | 2,040 | 0.8% |
| Trinidadian and Tobagonian | 528 | 0.2% |
| Turkish | 124 | 0.1% |
| U.S. Virgin Islander | 43 | 0.0% |
| Ukrainian | 965 | 0.4% |
| Uruguayan | 27 | 0.0% |
| Venezuelan | 1,083 | 0.4% |
| Vietnamese | 24 | 0.0% |
| Welsh | 1,593 | 0.6% |
| West Indian | 574 | 0.2% |
| Yugoslavian | 622 | 0.2% | View All 153 Rows |
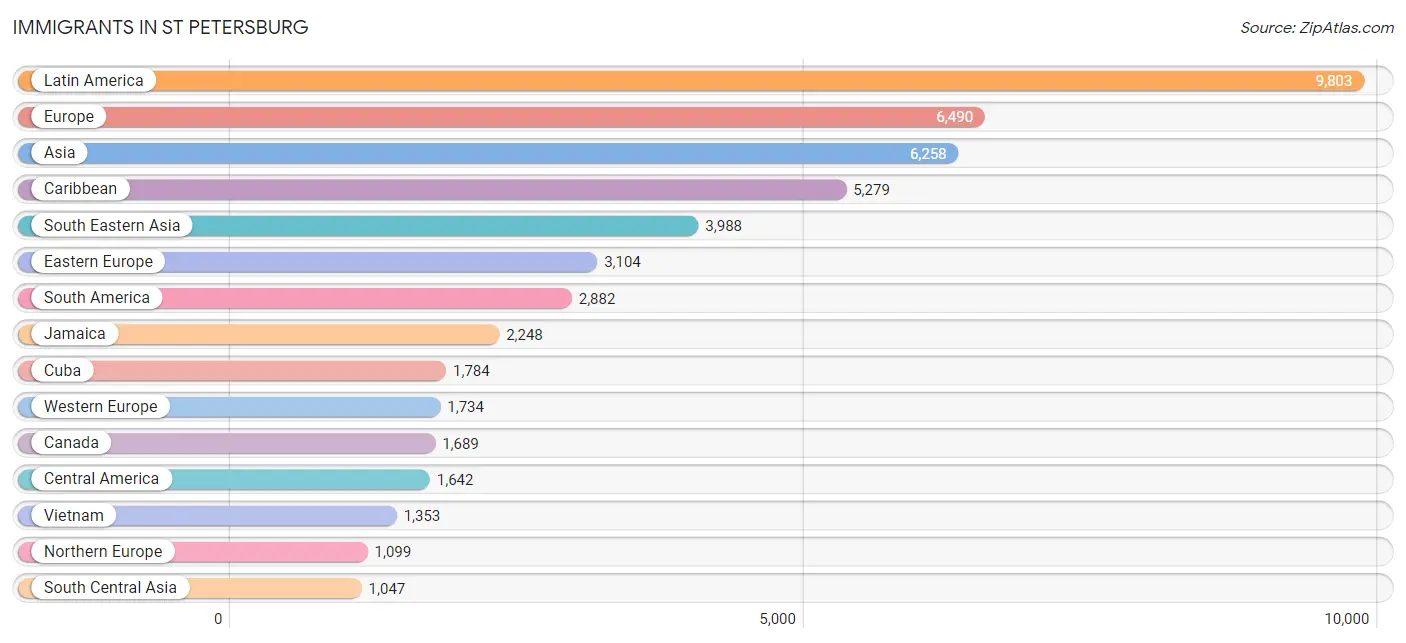
Immigrants in St Petersburg
The most numerous immigrant groups reported in St Petersburg came from Latin America (9,803 | 3.8%), Europe (6,490 | 2.5%), Asia (6,258 | 2.4%), Caribbean (5,279 | 2.0%), and South Eastern Asia (3,988 | 1.5%), together accounting for 12.3% of all St Petersburg residents.
| Immigration Origin | # Population | % Population |
| Africa | 831 | 0.3% |
| Albania | 405 | 0.2% |
| Argentina | 99 | 0.0% |
| Asia | 6,258 | 2.4% |
| Australia | 62 | 0.0% |
| Austria | 50 | 0.0% |
| Bahamas | 124 | 0.1% |
| Bangladesh | 77 | 0.0% |
| Barbados | 15 | 0.0% |
| Belgium | 61 | 0.0% |
| Belize | 57 | 0.0% |
| Bolivia | 38 | 0.0% |
| Bosnia and Herzegovina | 614 | 0.2% |
| Brazil | 321 | 0.1% |
| Bulgaria | 103 | 0.0% |
| Cambodia | 401 | 0.2% |
| Canada | 1,689 | 0.6% |
| Caribbean | 5,279 | 2.0% |
| Central America | 1,642 | 0.6% |
| Chile | 57 | 0.0% |
| China | 495 | 0.2% |
| Colombia | 572 | 0.2% |
| Costa Rica | 81 | 0.0% |
| Croatia | 253 | 0.1% |
| Cuba | 1,784 | 0.7% |
| Czechoslovakia | 88 | 0.0% |
| Denmark | 16 | 0.0% |
| Dominican Republic | 179 | 0.1% |
| Eastern Africa | 93 | 0.0% |
| Eastern Asia | 785 | 0.3% |
| Eastern Europe | 3,104 | 1.2% |
| Ecuador | 365 | 0.1% |
| Egypt | 66 | 0.0% |
| El Salvador | 77 | 0.0% |
| England | 409 | 0.2% |
| Europe | 6,490 | 2.5% |
| Fiji | 34 | 0.0% |
| France | 440 | 0.2% |
| Germany | 1,019 | 0.4% |
| Ghana | 83 | 0.0% |
| Greece | 66 | 0.0% |
| Grenada | 12 | 0.0% |
| Guatemala | 87 | 0.0% |
| Guyana | 220 | 0.1% |
| Haiti | 415 | 0.2% |
| Honduras | 203 | 0.1% |
| Hong Kong | 19 | 0.0% |
| Hungary | 85 | 0.0% |
| India | 716 | 0.3% |
| Indonesia | 168 | 0.1% |
| Iran | 83 | 0.0% |
| Iraq | 18 | 0.0% |
| Ireland | 63 | 0.0% |
| Israel | 17 | 0.0% |
| Italy | 225 | 0.1% |
| Jamaica | 2,248 | 0.9% |
| Japan | 107 | 0.0% |
| Jordan | 11 | 0.0% |
| Kazakhstan | 93 | 0.0% |
| Korea | 183 | 0.1% |
| Kuwait | 36 | 0.0% |
| Laos | 779 | 0.3% |
| Latin America | 9,803 | 3.8% |
| Latvia | 40 | 0.0% |
| Lebanon | 101 | 0.0% |
| Liberia | 108 | 0.0% |
| Lithuania | 43 | 0.0% |
| Malaysia | 20 | 0.0% |
| Mexico | 855 | 0.3% |
| Micronesia | 21 | 0.0% |
| Moldova | 34 | 0.0% |
| Morocco | 42 | 0.0% |
| Nepal | 30 | 0.0% |
| Netherlands | 79 | 0.0% |
| Nicaragua | 114 | 0.0% |
| Nigeria | 160 | 0.1% |
| Northern Africa | 122 | 0.1% |
| Northern Europe | 1,099 | 0.4% |
| Norway | 10 | 0.0% |
| Oceania | 297 | 0.1% |
| Pakistan | 15 | 0.0% |
| Panama | 168 | 0.1% |
| Peru | 456 | 0.2% |
| Philippines | 983 | 0.4% |
| Poland | 276 | 0.1% |
| Portugal | 219 | 0.1% |
| Romania | 139 | 0.1% |
| Russia | 217 | 0.1% |
| Saudi Arabia | 135 | 0.1% |
| Scotland | 78 | 0.0% |
| Serbia | 267 | 0.1% |
| Sierra Leone | 27 | 0.0% |
| Singapore | 7 | 0.0% |
| South Africa | 238 | 0.1% |
| South America | 2,882 | 1.1% |
| South Central Asia | 1,047 | 0.4% |
| South Eastern Asia | 3,988 | 1.5% |
| Southern Europe | 540 | 0.2% |
| Spain | 30 | 0.0% |
| Sri Lanka | 33 | 0.0% |
| St. Vincent and the Grenadines | 47 | 0.0% |
| Sweden | 124 | 0.1% |
| Switzerland | 60 | 0.0% |
| Taiwan | 157 | 0.1% |
| Thailand | 250 | 0.1% |
| Trinidad and Tobago | 383 | 0.2% |
| Turkey | 25 | 0.0% |
| Uganda | 29 | 0.0% |
| Ukraine | 192 | 0.1% |
| Uruguay | 27 | 0.0% |
| Venezuela | 613 | 0.2% |
| Vietnam | 1,353 | 0.5% |
| West Indies | 37 | 0.0% |
| Western Africa | 378 | 0.2% |
| Western Asia | 360 | 0.1% |
| Western Europe | 1,734 | 0.7% |
| Zimbabwe | 9 | 0.0% | View All 117 Rows |
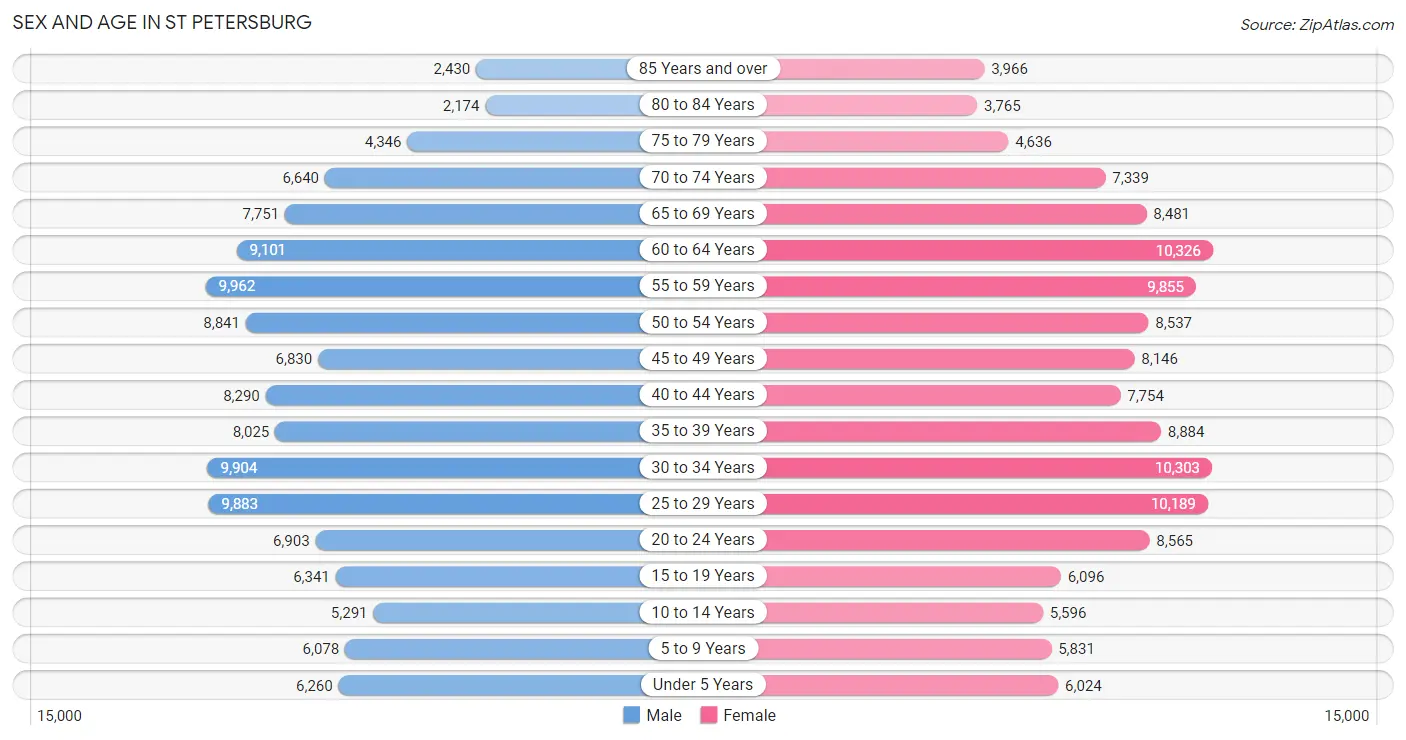
Sex and Age in St Petersburg
Sex and Age in St Petersburg
The most populous age groups in St Petersburg are 55 to 59 Years (9,962 | 8.0%) for men and 60 to 64 Years (10,326 | 7.7%) for women.
| Age Bracket | Male | Female |
| Under 5 Years | 6,260 (5.0%) | 6,024 (4.5%) |
| 5 to 9 Years | 6,078 (4.9%) | 5,831 (4.3%) |
| 10 to 14 Years | 5,291 (4.2%) | 5,596 (4.2%) |
| 15 to 19 Years | 6,341 (5.1%) | 6,096 (4.5%) |
| 20 to 24 Years | 6,903 (5.5%) | 8,565 (6.4%) |
| 25 to 29 Years | 9,883 (7.9%) | 10,189 (7.6%) |
| 30 to 34 Years | 9,904 (7.9%) | 10,303 (7.7%) |
| 35 to 39 Years | 8,025 (6.4%) | 8,884 (6.6%) |
| 40 to 44 Years | 8,290 (6.6%) | 7,754 (5.8%) |
| 45 to 49 Years | 6,830 (5.5%) | 8,146 (6.1%) |
| 50 to 54 Years | 8,841 (7.1%) | 8,537 (6.4%) |
| 55 to 59 Years | 9,962 (8.0%) | 9,855 (7.3%) |
| 60 to 64 Years | 9,101 (7.3%) | 10,326 (7.7%) |
| 65 to 69 Years | 7,751 (6.2%) | 8,481 (6.3%) |
| 70 to 74 Years | 6,640 (5.3%) | 7,339 (5.5%) |
| 75 to 79 Years | 4,346 (3.5%) | 4,636 (3.5%) |
| 80 to 84 Years | 2,174 (1.7%) | 3,765 (2.8%) |
| 85 Years and over | 2,430 (1.9%) | 3,966 (2.9%) |
| Total | 125,050 (100.0%) | 134,293 (100.0%) |
Families and Households in St Petersburg
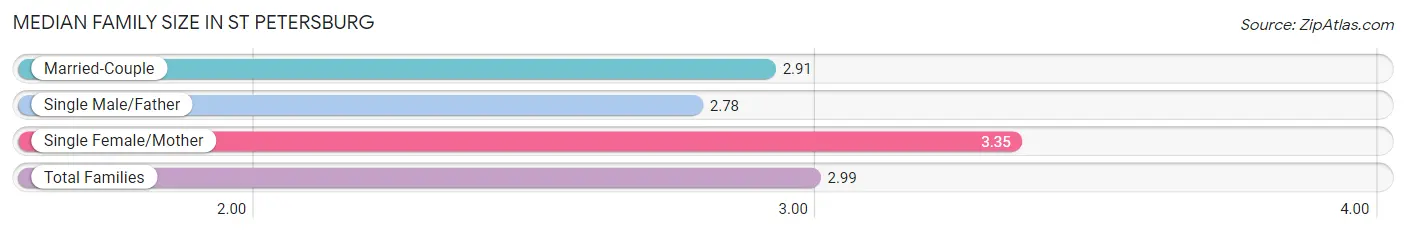
Median Family Size in St Petersburg
The median family size in St Petersburg is 2.99 persons per family, with single female/mother families (12,504 | 21.3%) accounting for the largest median family size of 3.35 persons per family. On the other hand, single male/father families (4,092 | 7.0%) represent the smallest median family size with 2.78 persons per family.
| Family Type | # Families | Family Size |
| Married-Couple | 42,058 (71.7%) | 2.91 |
| Single Male/Father | 4,092 (7.0%) | 2.78 |
| Single Female/Mother | 12,504 (21.3%) | 3.35 |
| Total Families | 58,654 (100.0%) | 2.99 |
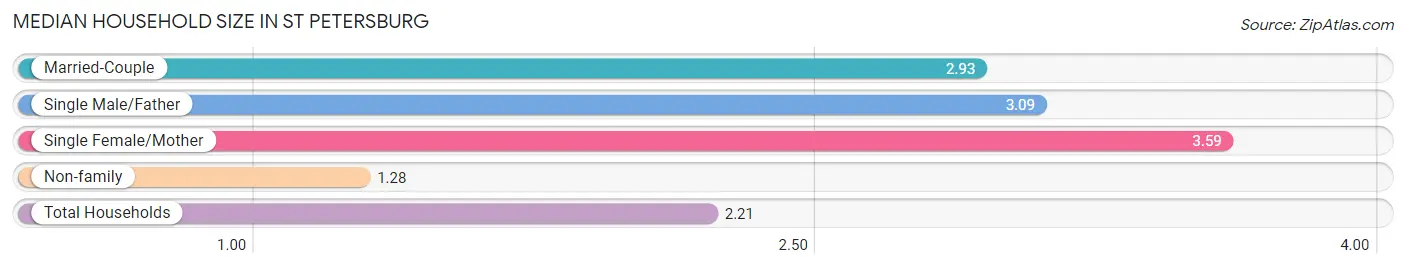
Median Household Size in St Petersburg
The median household size in St Petersburg is 2.21 persons per household, with single female/mother households (12,504 | 11.0%) accounting for the largest median household size of 3.59 persons per household. non-family households (55,163 | 48.5%) represent the smallest median household size with 1.28 persons per household.
| Household Type | # Households | Household Size |
| Married-Couple | 42,058 (36.9%) | 2.93 |
| Single Male/Father | 4,092 (3.6%) | 3.09 |
| Single Female/Mother | 12,504 (11.0%) | 3.59 |
| Non-family | 55,163 (48.5%) | 1.28 |
| Total Households | 113,817 (100.0%) | 2.21 |
Household Size by Marriage Status in St Petersburg
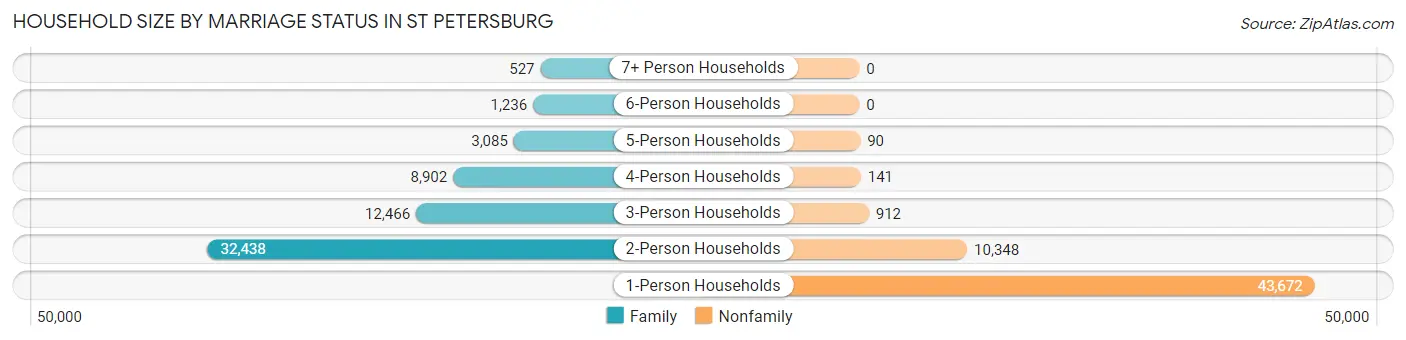
Out of a total of 113,817 households in St Petersburg, 58,654 (51.5%) are family households, while 55,163 (48.5%) are nonfamily households. The most numerous type of family households are 2-person households, comprising 32,438, and the most common type of nonfamily households are 1-person households, comprising 43,672.
| Household Size | Family Households | Nonfamily Households |
| 1-Person Households | - | 43,672 (38.4%) |
| 2-Person Households | 32,438 (28.5%) | 10,348 (9.1%) |
| 3-Person Households | 12,466 (11.0%) | 912 (0.8%) |
| 4-Person Households | 8,902 (7.8%) | 141 (0.1%) |
| 5-Person Households | 3,085 (2.7%) | 90 (0.1%) |
| 6-Person Households | 1,236 (1.1%) | 0 (0.0%) |
| 7+ Person Households | 527 (0.5%) | 0 (0.0%) |
| Total | 58,654 (51.5%) | 55,163 (48.5%) |
Female Fertility in St Petersburg
Fertility by Age in St Petersburg
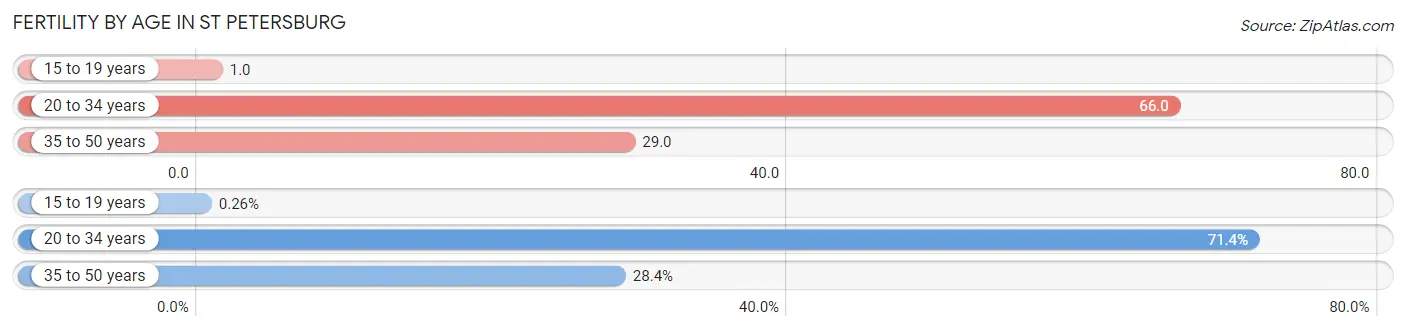
Average fertility rate in St Petersburg is 44.0 births per 1,000 women. Women in the age bracket of 20 to 34 years have the highest fertility rate with 66.0 births per 1,000 women. Women in the age bracket of 20 to 34 years acount for 71.4% of all women with births.
| Age Bracket | Women with Births | Births / 1,000 Women |
| 15 to 19 years | 7 (0.3%) | 1.0 |
| 20 to 34 years | 1,923 (71.4%) | 66.0 |
| 35 to 50 years | 764 (28.4%) | 29.0 |
| Total | 2,694 (100.0%) | 44.0 |
Fertility by Age by Marriage Status in St Petersburg
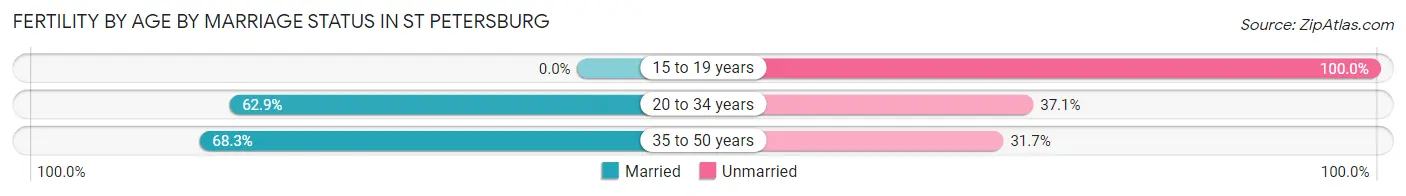
64.3% of women with births (2,694) in St Petersburg are married. The highest percentage of unmarried women with births falls into 15 to 19 years age bracket with 100.0% of them unmarried at the time of birth, while the lowest percentage of unmarried women with births belong to 35 to 50 years age bracket with 31.7% of them unmarried.
| Age Bracket | Married | Unmarried |
| 15 to 19 years | 0 (0.0%) | 7 (100.0%) |
| 20 to 34 years | 1,210 (62.9%) | 713 (37.1%) |
| 35 to 50 years | 522 (68.3%) | 242 (31.7%) |
| Total | 1,732 (64.3%) | 962 (35.7%) |
Fertility by Education in St Petersburg
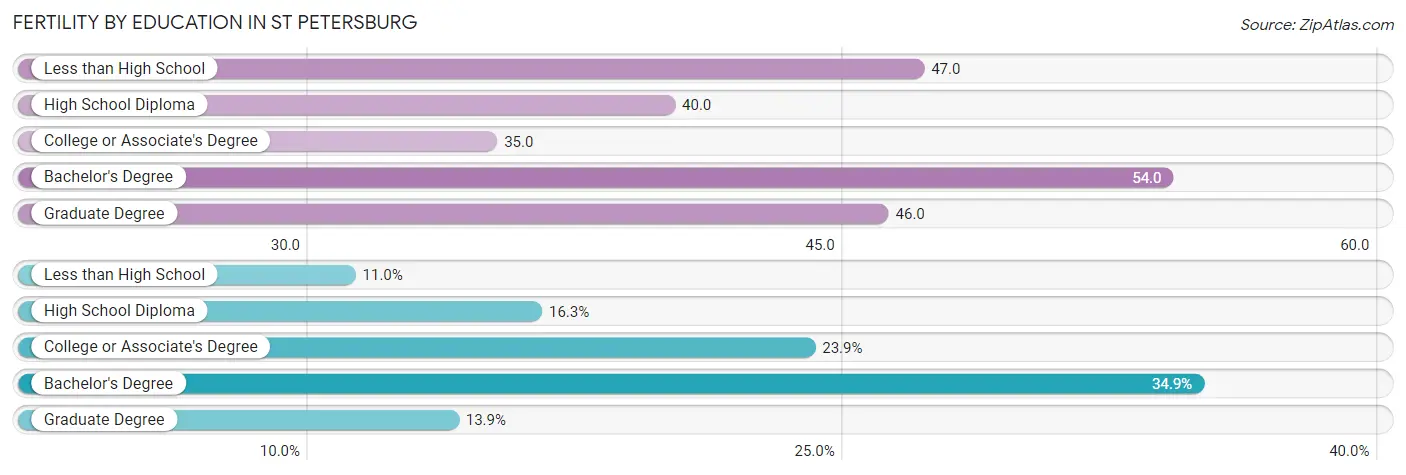
Average fertility rate in St Petersburg is 44.0 births per 1,000 women. Women with the education attainment of bachelor's degree have the highest fertility rate of 54.0 births per 1,000 women, while women with the education attainment of college or associate's degree have the lowest fertility at 35.0 births per 1,000 women. Women with the education attainment of bachelor's degree represent 34.9% of all women with births.
| Educational Attainment | Women with Births | Births / 1,000 Women |
| Less than High School | 297 (11.0%) | 47.0 |
| High School Diploma | 438 (16.3%) | 40.0 |
| College or Associate's Degree | 645 (23.9%) | 35.0 |
| Bachelor's Degree | 939 (34.9%) | 54.0 |
| Graduate Degree | 375 (13.9%) | 46.0 |
| Total | 2,694 (100.0%) | 44.0 |
Fertility by Education by Marriage Status in St Petersburg
35.7% of women with births in St Petersburg are unmarried. Women with the educational attainment of graduate degree are most likely to be married with 96.0% of them married at childbirth, while women with the educational attainment of less than high school are least likely to be married with 54.5% of them unmarried at childbirth.
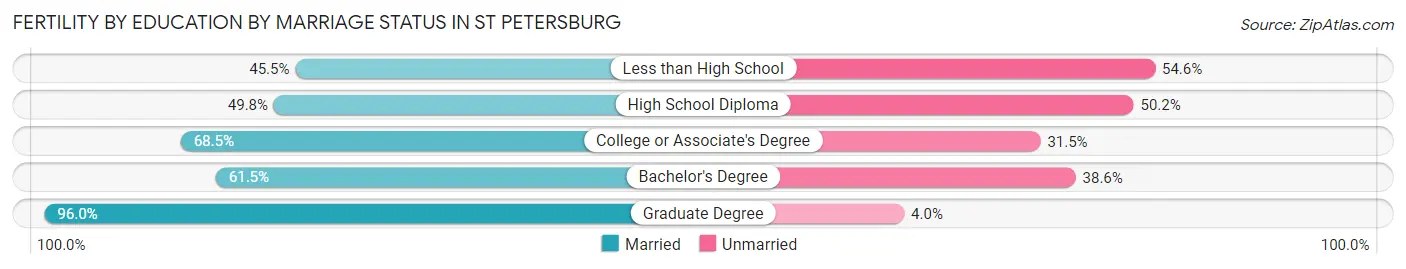
| Educational Attainment | Married | Unmarried |
| Less than High School | 135 (45.5%) | 162 (54.5%) |
| High School Diploma | 218 (49.8%) | 220 (50.2%) |
| College or Associate's Degree | 442 (68.5%) | 203 (31.5%) |
| Bachelor's Degree | 577 (61.5%) | 362 (38.6%) |
| Graduate Degree | 360 (96.0%) | 15 (4.0%) |
| Total | 1,732 (64.3%) | 962 (35.7%) |
Employment Characteristics in St Petersburg
Employment by Class of Employer in St Petersburg
Among the 134,793 employed individuals in St Petersburg, private company employees (92,102 | 68.3%), not-for-profit organizations (11,192 | 8.3%), and local government employees (9,040 | 6.7%) make up the most common classes of employment.
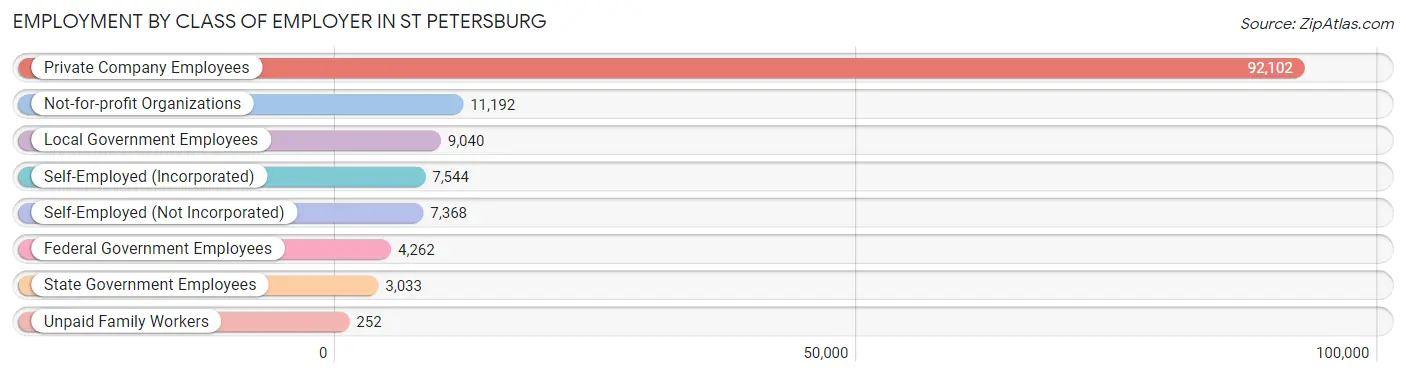
| Employer Class | # Employees | % Employees |
| Private Company Employees | 92,102 | 68.3% |
| Self-Employed (Incorporated) | 7,544 | 5.6% |
| Self-Employed (Not Incorporated) | 7,368 | 5.5% |
| Not-for-profit Organizations | 11,192 | 8.3% |
| Local Government Employees | 9,040 | 6.7% |
| State Government Employees | 3,033 | 2.2% |
| Federal Government Employees | 4,262 | 3.2% |
| Unpaid Family Workers | 252 | 0.2% |
| Total | 134,793 | 100.0% |
Employment Status by Age in St Petersburg
According to the labor force statistics for St Petersburg, out of the total population over 16 years of age (222,008), 64.7% or 143,639 individuals are in the labor force, with 4.6% or 6,607 of them unemployed. The age group with the highest labor force participation rate is 25 to 29 years, with 90.1% or 18,085 individuals in the labor force. Within the labor force, the 16 to 19 years age range has the highest percentage of unemployed individuals, with 20.4% or 791 of them being unemployed.
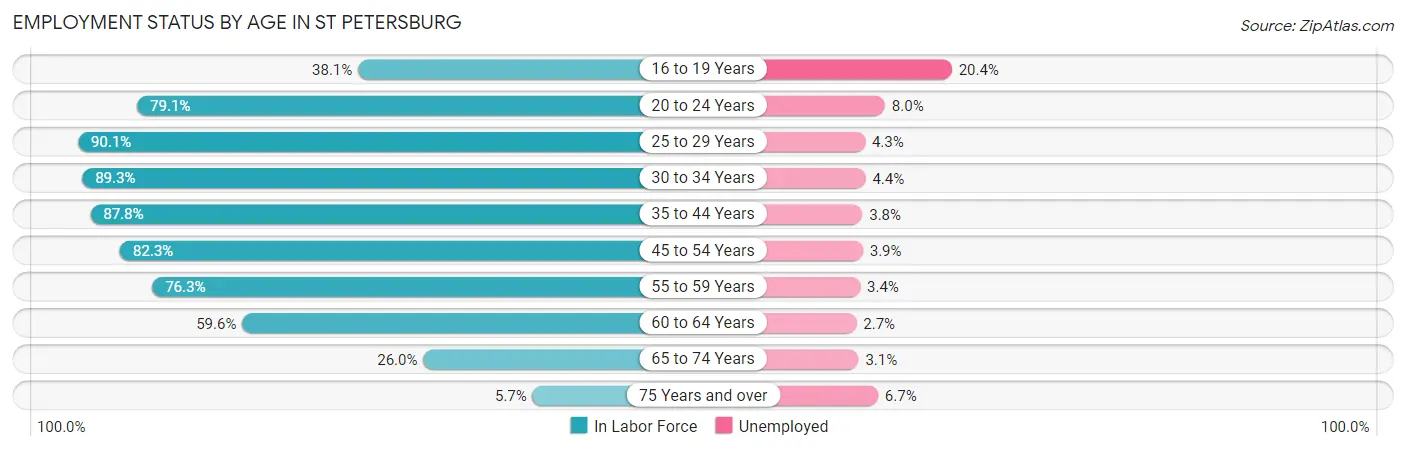
| Age Bracket | In Labor Force | Unemployed |
| 16 to 19 Years | 3,879 (38.1%) | 791 (20.4%) |
| 20 to 24 Years | 12,235 (79.1%) | 979 (8.0%) |
| 25 to 29 Years | 18,085 (90.1%) | 778 (4.3%) |
| 30 to 34 Years | 18,045 (89.3%) | 794 (4.4%) |
| 35 to 44 Years | 28,933 (87.8%) | 1,099 (3.8%) |
| 45 to 54 Years | 26,627 (82.3%) | 1,038 (3.9%) |
| 55 to 59 Years | 15,120 (76.3%) | 514 (3.4%) |
| 60 to 64 Years | 11,578 (59.6%) | 313 (2.7%) |
| 65 to 74 Years | 7,855 (26.0%) | 244 (3.1%) |
| 75 Years and over | 1,215 (5.7%) | 81 (6.7%) |
| Total | 143,639 (64.7%) | 6,607 (4.6%) |
Employment Status by Educational Attainment in St Petersburg
According to labor force statistics for St Petersburg, 81.7% of individuals (118,326) out of the total population between 25 and 64 years of age (144,830) are in the labor force, with 3.8% or 4,496 of them being unemployed. The group with the highest labor force participation rate are those with the educational attainment of bachelor's degree or higher, with 88.1% or 54,303 individuals in the labor force. Within the labor force, individuals with high school diploma education have the highest percentage of unemployment, with 6.0% or 1,421 of them being unemployed.
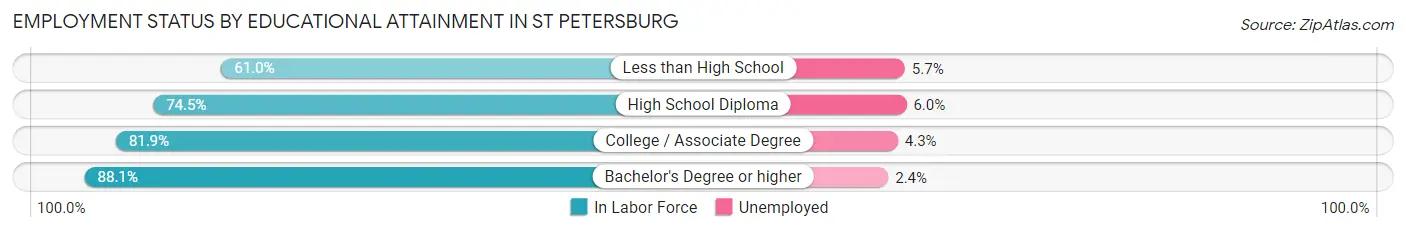
| Educational Attainment | In Labor Force | Unemployed |
| Less than High School | 4,858 (61.0%) | 454 (5.7%) |
| High School Diploma | 23,691 (74.5%) | 1,908 (6.0%) |
| College / Associate Degree | 35,568 (81.9%) | 1,867 (4.3%) |
| Bachelor's Degree or higher | 54,303 (88.1%) | 1,479 (2.4%) |
| Total | 118,326 (81.7%) | 5,504 (3.8%) |
Employment Occupations by Sex in St Petersburg
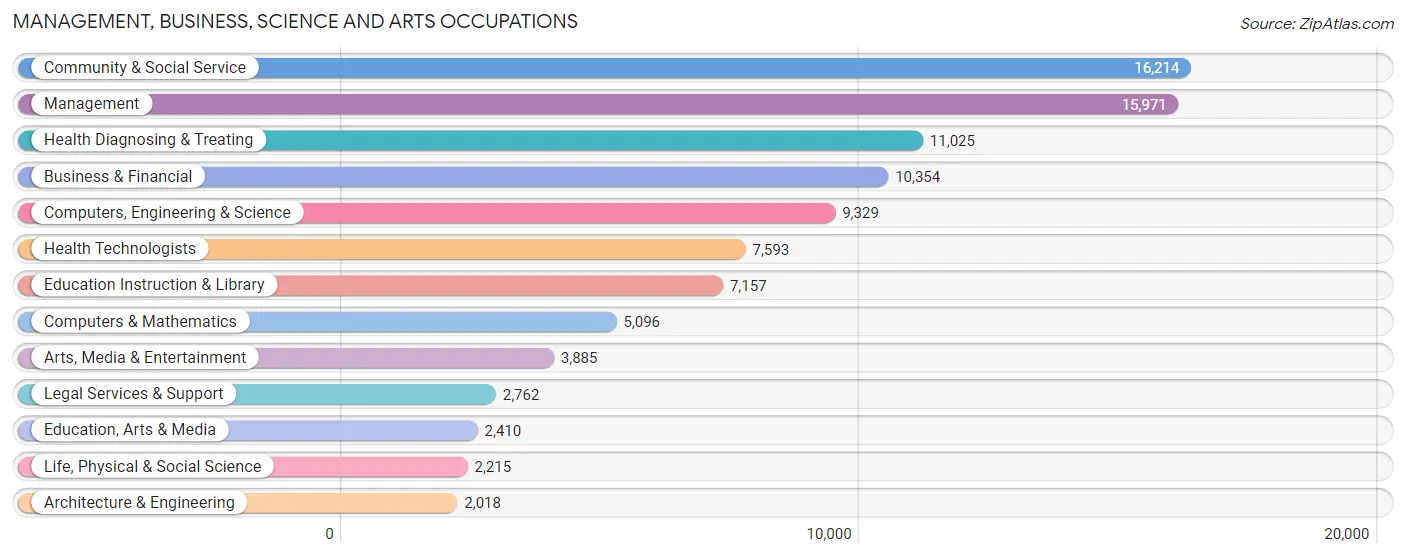
Management, Business, Science and Arts Occupations
The most common Management, Business, Science and Arts occupations in St Petersburg are Community & Social Service (16,214 | 11.9%), Management (15,971 | 11.8%), Health Diagnosing & Treating (11,025 | 8.1%), Business & Financial (10,354 | 7.6%), and Computers, Engineering & Science (9,329 | 6.9%).
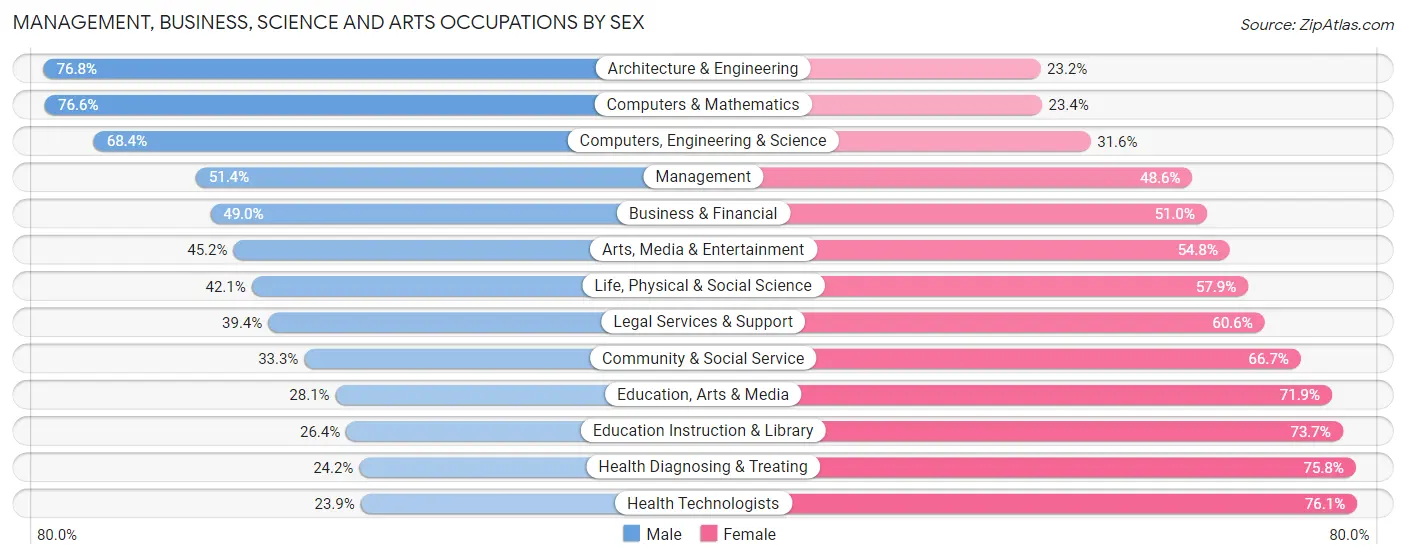
Management, Business, Science and Arts Occupations by Sex
Within the Management, Business, Science and Arts occupations in St Petersburg, the most male-oriented occupations are Architecture & Engineering (76.8%), Computers & Mathematics (76.6%), and Computers, Engineering & Science (68.4%), while the most female-oriented occupations are Health Technologists (76.1%), Health Diagnosing & Treating (75.8%), and Education Instruction & Library (73.7%).
| Occupation | Male | Female |
| Management | 8,210 (51.4%) | 7,761 (48.6%) |
| Business & Financial | 5,074 (49.0%) | 5,280 (51.0%) |
| Computers, Engineering & Science | 6,385 (68.4%) | 2,944 (31.6%) |
| Computers & Mathematics | 3,902 (76.6%) | 1,194 (23.4%) |
| Architecture & Engineering | 1,550 (76.8%) | 468 (23.2%) |
| Life, Physical & Social Science | 933 (42.1%) | 1,282 (57.9%) |
| Community & Social Service | 5,406 (33.3%) | 10,808 (66.7%) |
| Education, Arts & Media | 678 (28.1%) | 1,732 (71.9%) |
| Legal Services & Support | 1,087 (39.4%) | 1,675 (60.6%) |
| Education Instruction & Library | 1,886 (26.4%) | 5,271 (73.7%) |
| Arts, Media & Entertainment | 1,755 (45.2%) | 2,130 (54.8%) |
| Health Diagnosing & Treating | 2,664 (24.2%) | 8,361 (75.8%) |
| Health Technologists | 1,818 (23.9%) | 5,775 (76.1%) |
| Total (Category) | 27,739 (44.1%) | 35,154 (55.9%) |
| Total (Overall) | 66,718 (49.1%) | 69,124 (50.9%) |
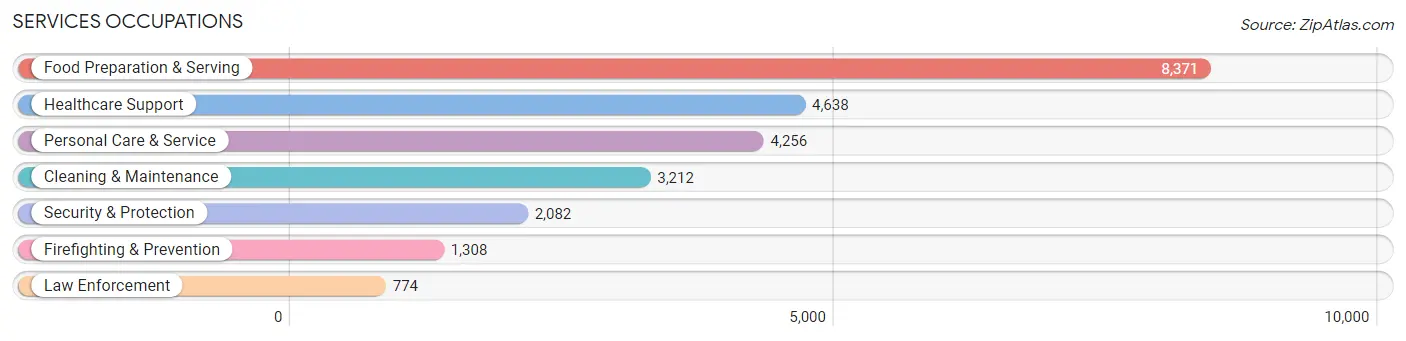
Services Occupations
The most common Services occupations in St Petersburg are Food Preparation & Serving (8,371 | 6.2%), Healthcare Support (4,638 | 3.4%), Personal Care & Service (4,256 | 3.1%), Cleaning & Maintenance (3,212 | 2.4%), and Security & Protection (2,082 | 1.5%).
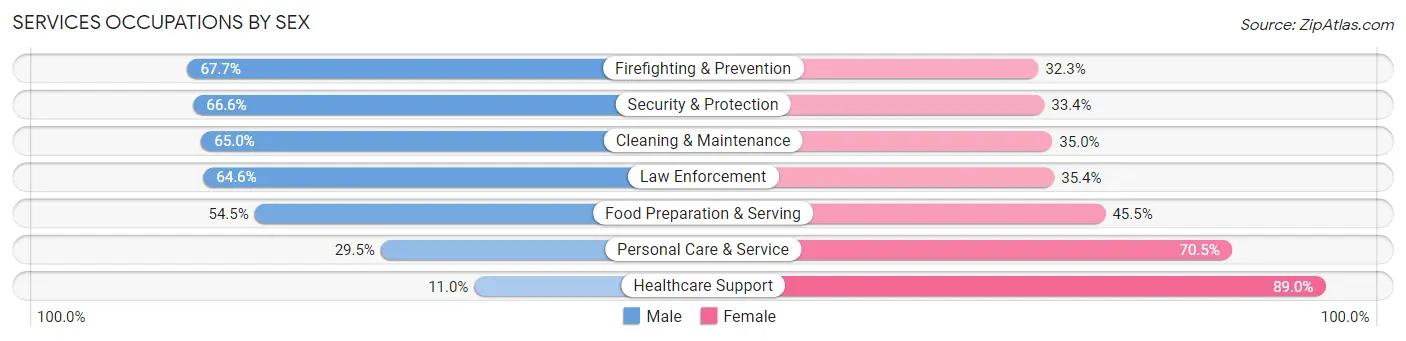
Services Occupations by Sex
Within the Services occupations in St Petersburg, the most male-oriented occupations are Firefighting & Prevention (67.7%), Security & Protection (66.6%), and Cleaning & Maintenance (65.0%), while the most female-oriented occupations are Healthcare Support (89.0%), Personal Care & Service (70.5%), and Food Preparation & Serving (45.5%).
| Occupation | Male | Female |
| Healthcare Support | 509 (11.0%) | 4,129 (89.0%) |
| Security & Protection | 1,386 (66.6%) | 696 (33.4%) |
| Firefighting & Prevention | 886 (67.7%) | 422 (32.3%) |
| Law Enforcement | 500 (64.6%) | 274 (35.4%) |
| Food Preparation & Serving | 4,560 (54.5%) | 3,811 (45.5%) |
| Cleaning & Maintenance | 2,087 (65.0%) | 1,125 (35.0%) |
| Personal Care & Service | 1,255 (29.5%) | 3,001 (70.5%) |
| Total (Category) | 9,797 (43.4%) | 12,762 (56.6%) |
| Total (Overall) | 66,718 (49.1%) | 69,124 (50.9%) |
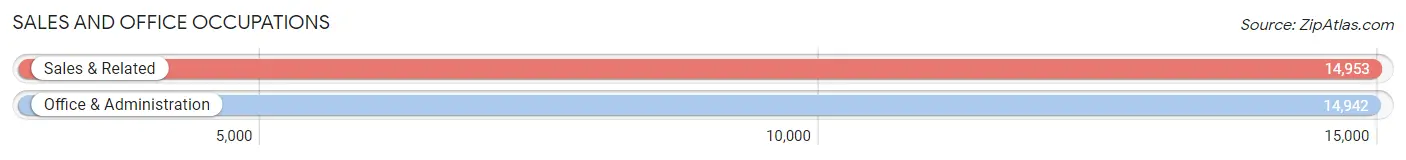
Sales and Office Occupations
The most common Sales and Office occupations in St Petersburg are Sales & Related (14,953 | 11.0%), and Office & Administration (14,942 | 11.0%).
Sales and Office Occupations by Sex
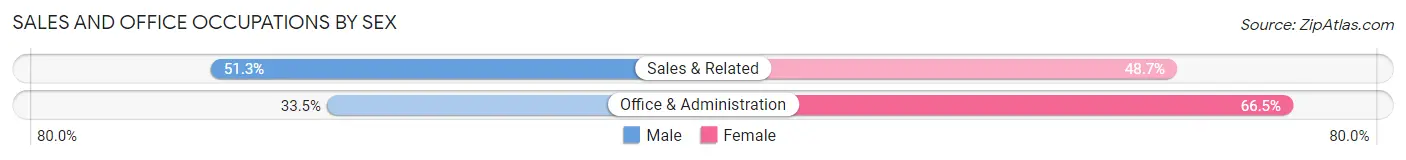
| Occupation | Male | Female |
| Sales & Related | 7,676 (51.3%) | 7,277 (48.7%) |
| Office & Administration | 5,006 (33.5%) | 9,936 (66.5%) |
| Total (Category) | 12,682 (42.4%) | 17,213 (57.6%) |
| Total (Overall) | 66,718 (49.1%) | 69,124 (50.9%) |
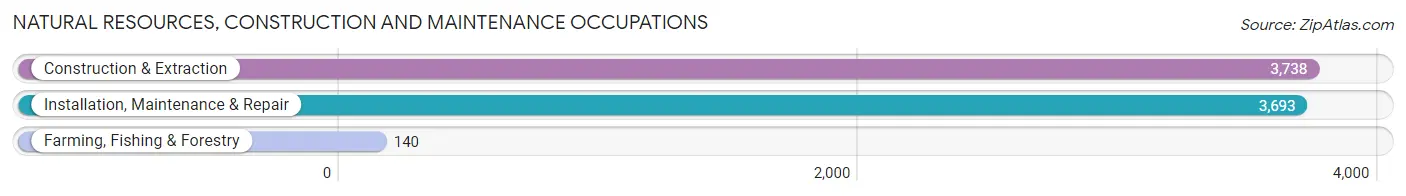
Natural Resources, Construction and Maintenance Occupations
The most common Natural Resources, Construction and Maintenance occupations in St Petersburg are Construction & Extraction (3,738 | 2.8%), Installation, Maintenance & Repair (3,693 | 2.7%), and Farming, Fishing & Forestry (140 | 0.1%).
Natural Resources, Construction and Maintenance Occupations by Sex
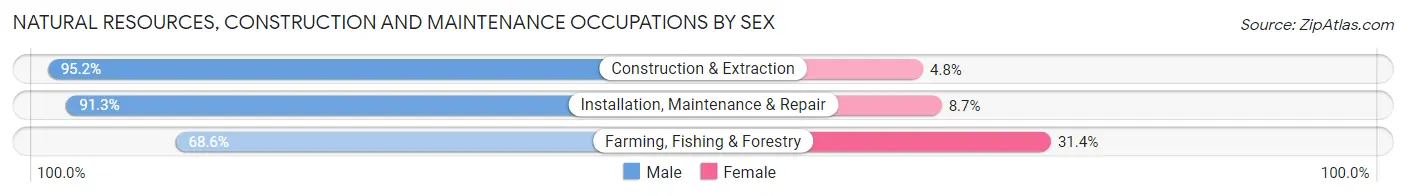
| Occupation | Male | Female |
| Farming, Fishing & Forestry | 96 (68.6%) | 44 (31.4%) |
| Construction & Extraction | 3,558 (95.2%) | 180 (4.8%) |
| Installation, Maintenance & Repair | 3,372 (91.3%) | 321 (8.7%) |
| Total (Category) | 7,026 (92.8%) | 545 (7.2%) |
| Total (Overall) | 66,718 (49.1%) | 69,124 (50.9%) |
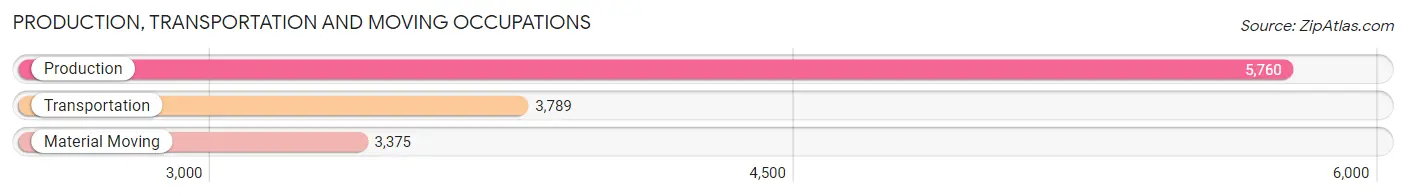
Production, Transportation and Moving Occupations
The most common Production, Transportation and Moving occupations in St Petersburg are Production (5,760 | 4.2%), Transportation (3,789 | 2.8%), and Material Moving (3,375 | 2.5%).
Production, Transportation and Moving Occupations by Sex
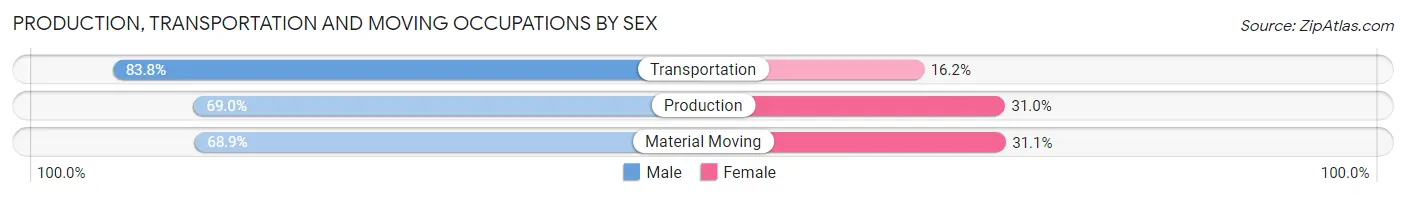
| Occupation | Male | Female |
| Production | 3,974 (69.0%) | 1,786 (31.0%) |
| Transportation | 3,176 (83.8%) | 613 (16.2%) |
| Material Moving | 2,324 (68.9%) | 1,051 (31.1%) |
| Total (Category) | 9,474 (73.3%) | 3,450 (26.7%) |
| Total (Overall) | 66,718 (49.1%) | 69,124 (50.9%) |
Employment Industries by Sex in St Petersburg
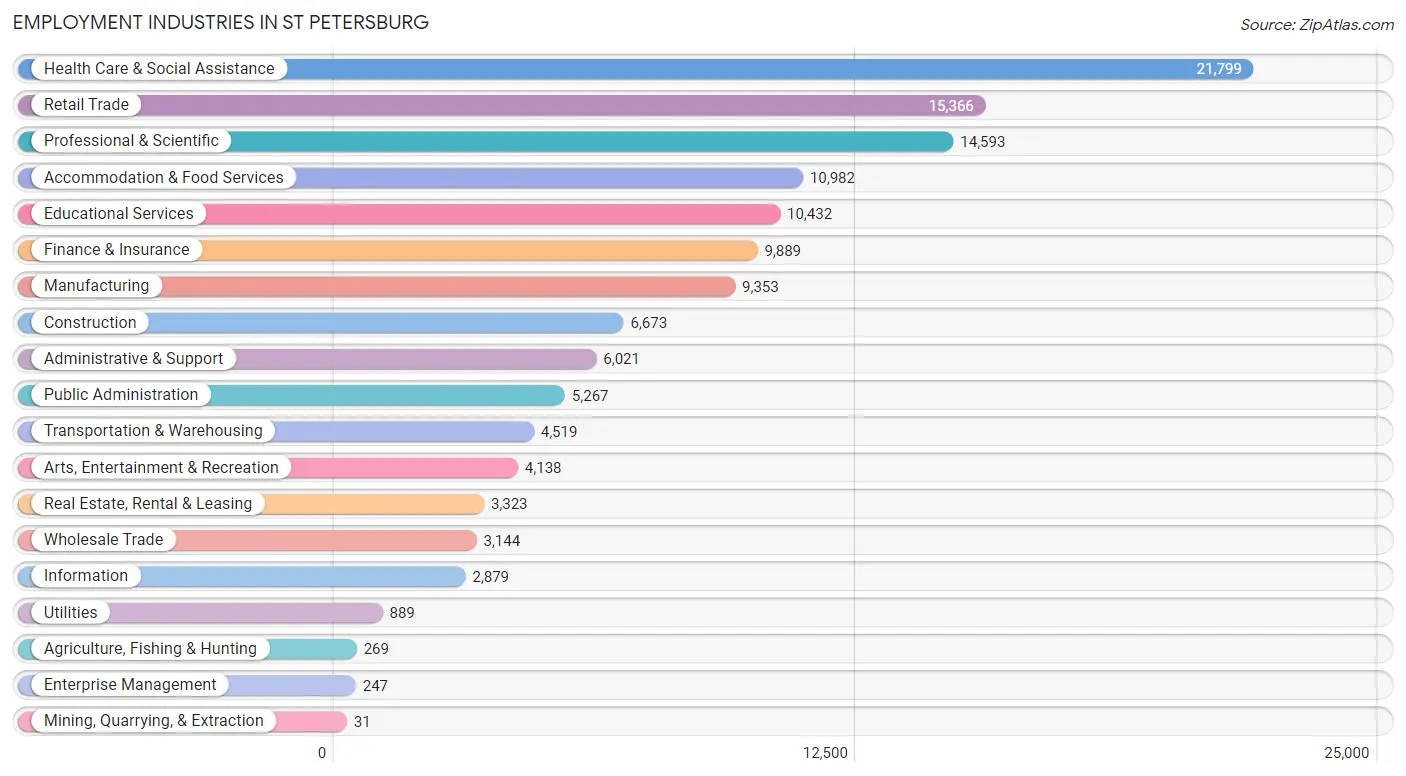
Employment Industries in St Petersburg
The major employment industries in St Petersburg include Health Care & Social Assistance (21,799 | 16.1%), Retail Trade (15,366 | 11.3%), Professional & Scientific (14,593 | 10.7%), Accommodation & Food Services (10,982 | 8.1%), and Educational Services (10,432 | 7.7%).
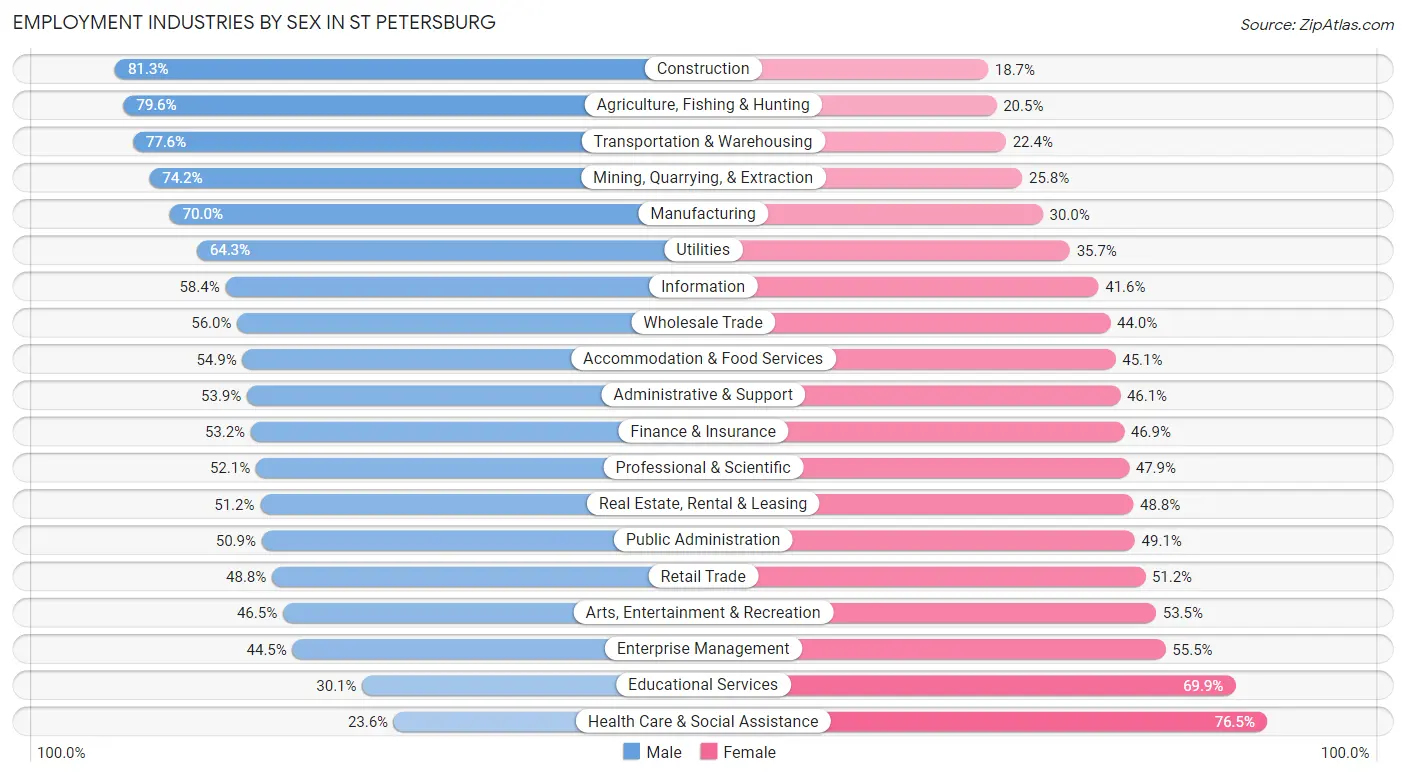
Employment Industries by Sex in St Petersburg
The St Petersburg industries that see more men than women are Construction (81.3%), Agriculture, Fishing & Hunting (79.5%), and Transportation & Warehousing (77.6%), whereas the industries that tend to have a higher number of women are Health Care & Social Assistance (76.4%), Educational Services (69.9%), and Enterprise Management (55.5%).
| Industry | Male | Female |
| Agriculture, Fishing & Hunting | 214 (79.5%) | 55 (20.4%) |
| Mining, Quarrying, & Extraction | 23 (74.2%) | 8 (25.8%) |
| Construction | 5,424 (81.3%) | 1,249 (18.7%) |
| Manufacturing | 6,544 (70.0%) | 2,809 (30.0%) |
| Wholesale Trade | 1,760 (56.0%) | 1,384 (44.0%) |
| Retail Trade | 7,494 (48.8%) | 7,872 (51.2%) |
| Transportation & Warehousing | 3,506 (77.6%) | 1,013 (22.4%) |
| Utilities | 572 (64.3%) | 317 (35.7%) |
| Information | 1,682 (58.4%) | 1,197 (41.6%) |
| Finance & Insurance | 5,256 (53.1%) | 4,633 (46.9%) |
| Real Estate, Rental & Leasing | 1,702 (51.2%) | 1,621 (48.8%) |
| Professional & Scientific | 7,605 (52.1%) | 6,988 (47.9%) |
| Enterprise Management | 110 (44.5%) | 137 (55.5%) |
| Administrative & Support | 3,248 (53.9%) | 2,773 (46.1%) |
| Educational Services | 3,139 (30.1%) | 7,293 (69.9%) |
| Health Care & Social Assistance | 5,134 (23.5%) | 16,665 (76.4%) |
| Arts, Entertainment & Recreation | 1,925 (46.5%) | 2,213 (53.5%) |
| Accommodation & Food Services | 6,029 (54.9%) | 4,953 (45.1%) |
| Public Administration | 2,681 (50.9%) | 2,586 (49.1%) |
| Total | 66,718 (49.1%) | 69,124 (50.9%) |
Education in St Petersburg
School Enrollment in St Petersburg
The most common levels of schooling among the 52,056 students in St Petersburg are college / undergraduate (14,058 | 27.0%), high school (9,526 | 18.3%), and elementary school (9,209 | 17.7%).
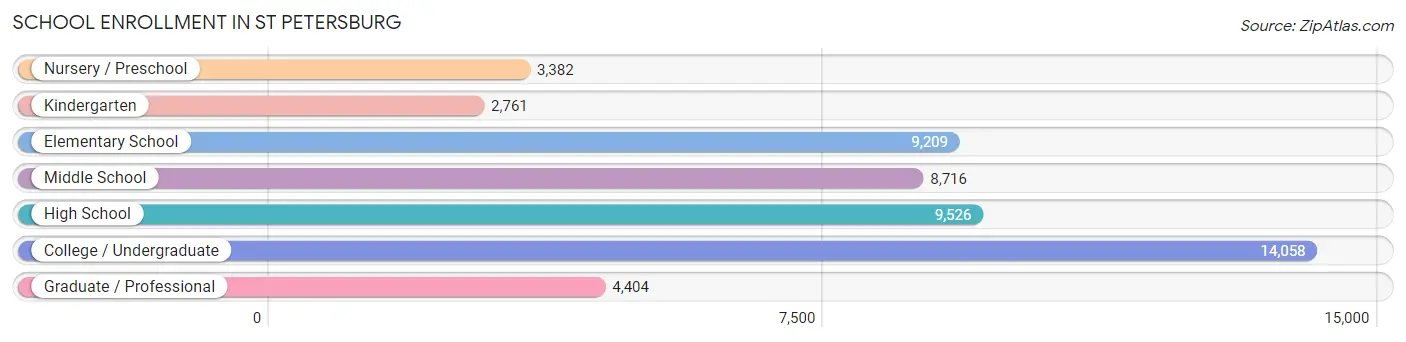
| School Level | # Students | % Students |
| Nursery / Preschool | 3,382 | 6.5% |
| Kindergarten | 2,761 | 5.3% |
| Elementary School | 9,209 | 17.7% |
| Middle School | 8,716 | 16.7% |
| High School | 9,526 | 18.3% |
| College / Undergraduate | 14,058 | 27.0% |
| Graduate / Professional | 4,404 | 8.5% |
| Total | 52,056 | 100.0% |
School Enrollment by Age by Funding Source in St Petersburg
Out of a total of 52,056 students who are enrolled in schools in St Petersburg, 12,441 (23.9%) attend a private institution, while the remaining 39,615 (76.1%) are enrolled in public schools. The age group of 3 to 4 year olds has the highest likelihood of being enrolled in private schools, with 1,409 (50.3% in the age bracket) enrolled. Conversely, the age group of 25 to 34 year olds has the lowest likelihood of being enrolled in a private school, with 3,744 (81.7% in the age bracket) attending a public institution.
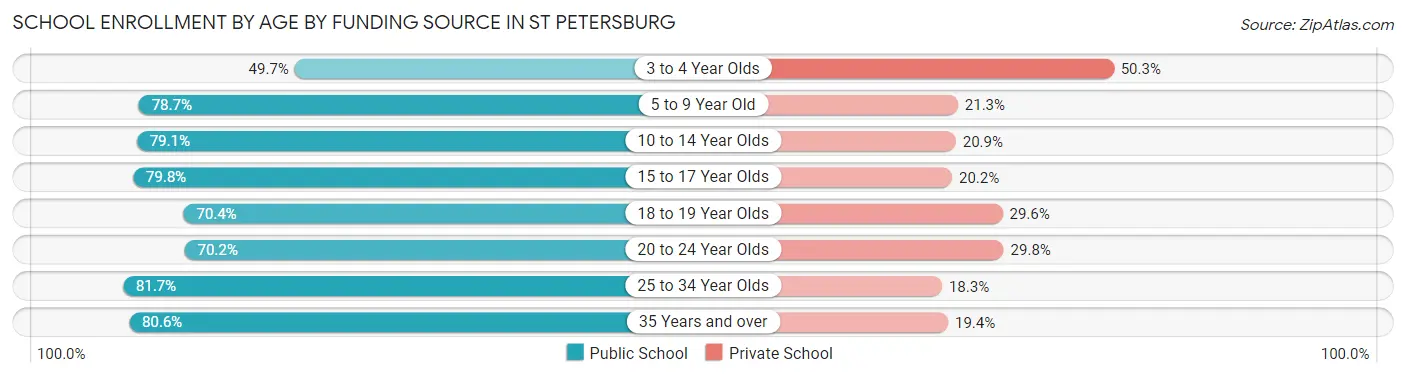
| Age Bracket | Public School | Private School |
| 3 to 4 Year Olds | 1,392 (49.7%) | 1,409 (50.3%) |
| 5 to 9 Year Old | 9,036 (78.7%) | 2,441 (21.3%) |
| 10 to 14 Year Olds | 8,458 (79.1%) | 2,234 (20.9%) |
| 15 to 17 Year Olds | 5,593 (79.8%) | 1,414 (20.2%) |
| 18 to 19 Year Olds | 2,915 (70.4%) | 1,225 (29.6%) |
| 20 to 24 Year Olds | 4,407 (70.2%) | 1,871 (29.8%) |
| 25 to 34 Year Olds | 3,744 (81.7%) | 839 (18.3%) |
| 35 Years and over | 4,091 (80.6%) | 987 (19.4%) |
| Total | 39,615 (76.1%) | 12,441 (23.9%) |
Educational Attainment by Field of Study in St Petersburg
Business (20,067 | 23.4%), science & technology (9,091 | 10.6%), education (8,362 | 9.7%), social sciences (7,637 | 8.9%), and bio, nature & agricultural (5,582 | 6.5%) are the most common fields of study among 85,887 individuals in St Petersburg who have obtained a bachelor's degree or higher.
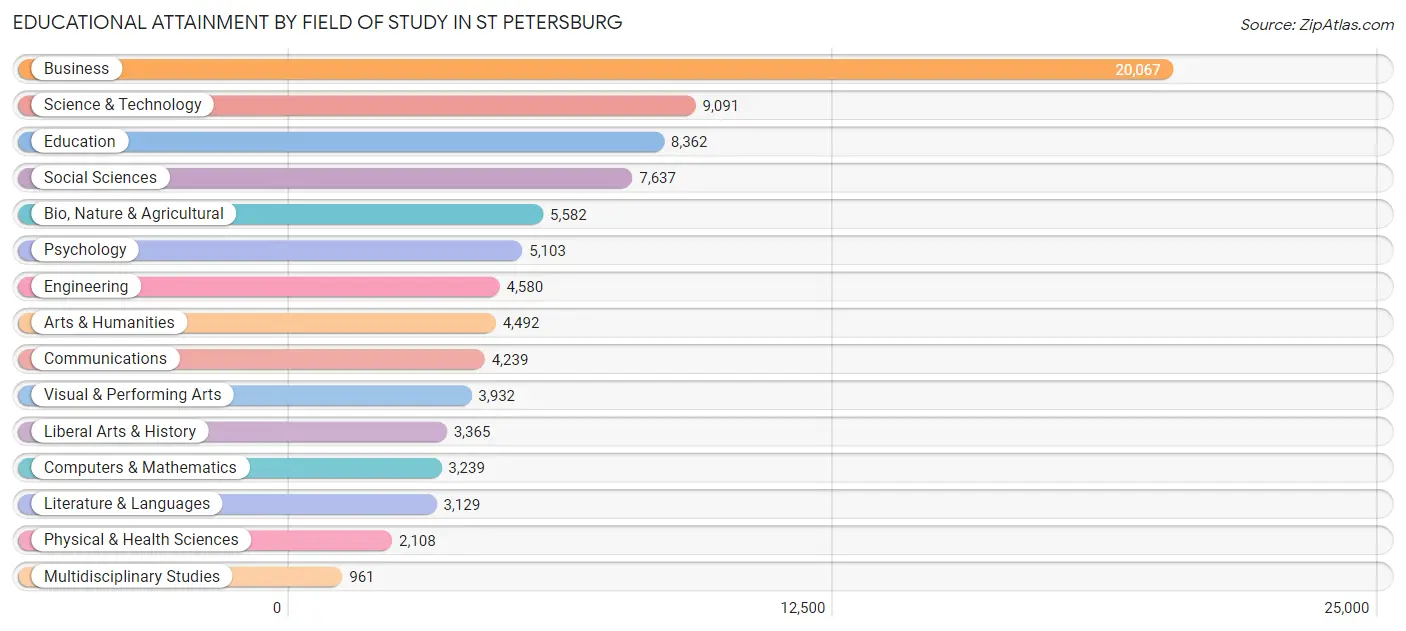
| Field of Study | # Graduates | % Graduates |
| Computers & Mathematics | 3,239 | 3.8% |
| Bio, Nature & Agricultural | 5,582 | 6.5% |
| Physical & Health Sciences | 2,108 | 2.5% |
| Psychology | 5,103 | 5.9% |
| Social Sciences | 7,637 | 8.9% |
| Engineering | 4,580 | 5.3% |
| Multidisciplinary Studies | 961 | 1.1% |
| Science & Technology | 9,091 | 10.6% |
| Business | 20,067 | 23.4% |
| Education | 8,362 | 9.7% |
| Literature & Languages | 3,129 | 3.6% |
| Liberal Arts & History | 3,365 | 3.9% |
| Visual & Performing Arts | 3,932 | 4.6% |
| Communications | 4,239 | 4.9% |
| Arts & Humanities | 4,492 | 5.2% |
| Total | 85,887 | 100.0% |
Transportation & Commute in St Petersburg
Vehicle Availability by Sex in St Petersburg
The most prevalent vehicle ownership categories in St Petersburg are males with 2 vehicles (31,879, accounting for 47.9%) and females with 2 vehicles (30,832, making up 47.7%).
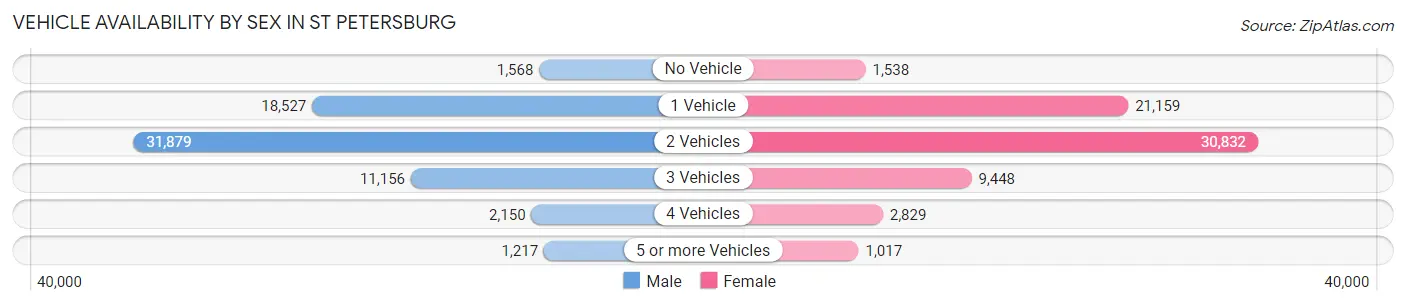
| Vehicles Available | Male | Female |
| No Vehicle | 1,568 (2.4%) | 1,538 (2.3%) |
| 1 Vehicle | 18,527 (27.9%) | 21,159 (31.7%) |
| 2 Vehicles | 31,879 (47.9%) | 30,832 (46.1%) |
| 3 Vehicles | 11,156 (16.8%) | 9,448 (14.1%) |
| 4 Vehicles | 2,150 (3.2%) | 2,829 (4.2%) |
| 5 or more Vehicles | 1,217 (1.8%) | 1,017 (1.5%) |
| Total | 66,497 (100.0%) | 66,823 (100.0%) |
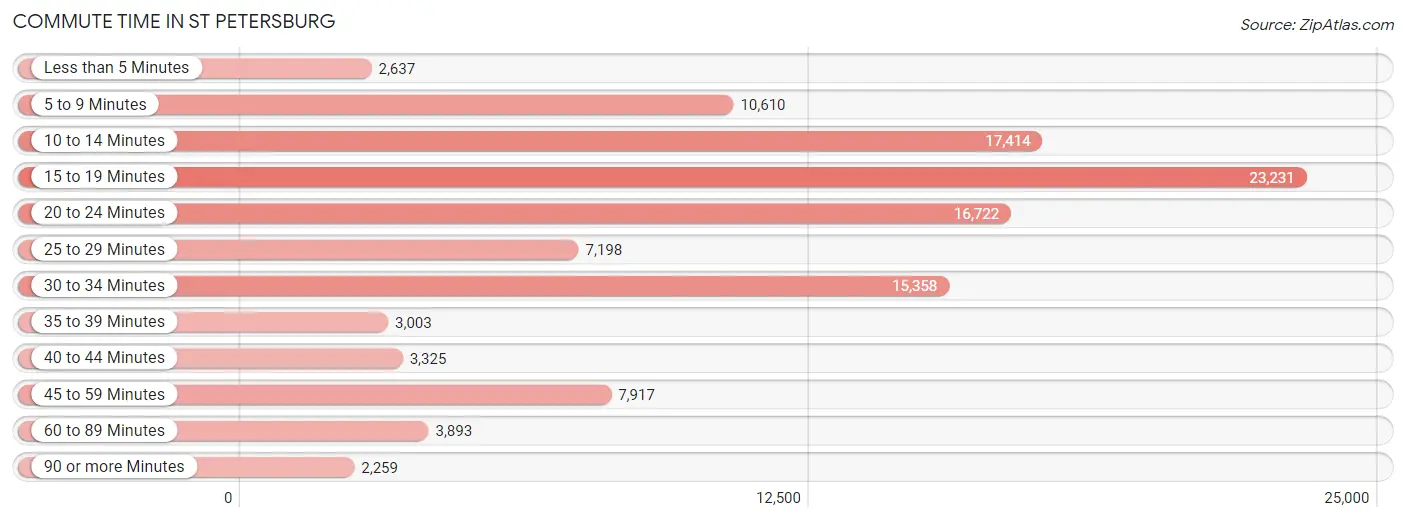
Commute Time in St Petersburg
The most frequently occuring commute durations in St Petersburg are 15 to 19 minutes (23,231 commuters, 20.5%), 10 to 14 minutes (17,414 commuters, 15.3%), and 20 to 24 minutes (16,722 commuters, 14.7%).
| Commute Time | # Commuters | % Commuters |
| Less than 5 Minutes | 2,637 | 2.3% |
| 5 to 9 Minutes | 10,610 | 9.3% |
| 10 to 14 Minutes | 17,414 | 15.3% |
| 15 to 19 Minutes | 23,231 | 20.5% |
| 20 to 24 Minutes | 16,722 | 14.7% |
| 25 to 29 Minutes | 7,198 | 6.3% |
| 30 to 34 Minutes | 15,358 | 13.5% |
| 35 to 39 Minutes | 3,003 | 2.6% |
| 40 to 44 Minutes | 3,325 | 2.9% |
| 45 to 59 Minutes | 7,917 | 7.0% |
| 60 to 89 Minutes | 3,893 | 3.4% |
| 90 or more Minutes | 2,259 | 2.0% |
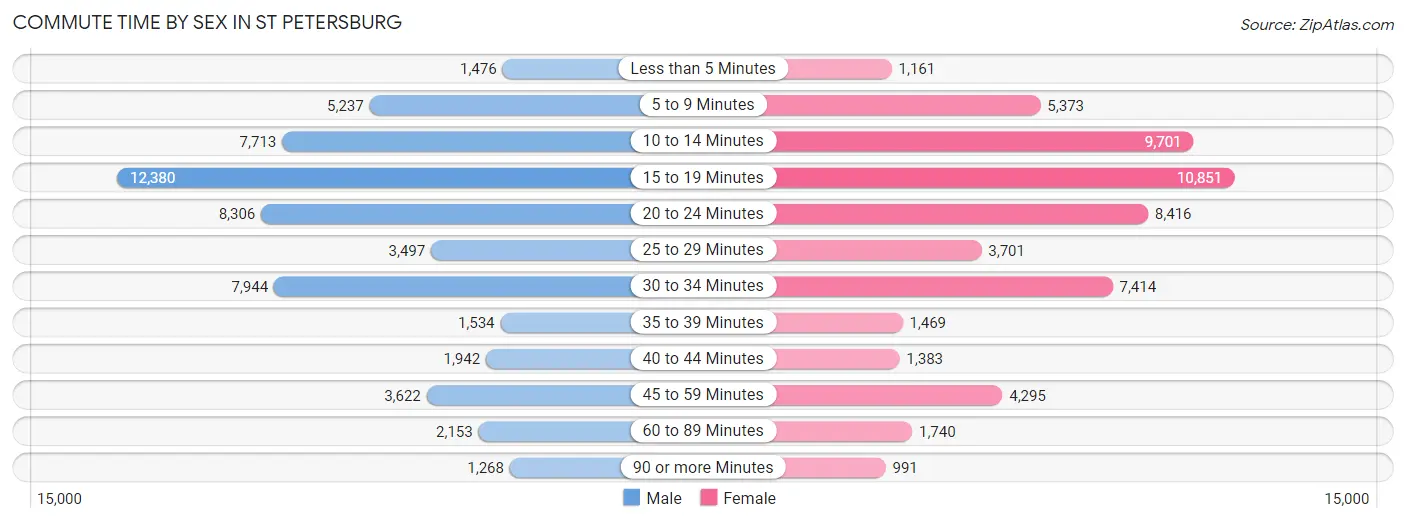
Commute Time by Sex in St Petersburg
The most common commute times in St Petersburg are 15 to 19 minutes (12,380 commuters, 21.7%) for males and 15 to 19 minutes (10,851 commuters, 19.2%) for females.
| Commute Time | Male | Female |
| Less than 5 Minutes | 1,476 (2.6%) | 1,161 (2.1%) |
| 5 to 9 Minutes | 5,237 (9.2%) | 5,373 (9.5%) |
| 10 to 14 Minutes | 7,713 (13.5%) | 9,701 (17.2%) |
| 15 to 19 Minutes | 12,380 (21.7%) | 10,851 (19.2%) |
| 20 to 24 Minutes | 8,306 (14.5%) | 8,416 (14.9%) |
| 25 to 29 Minutes | 3,497 (6.1%) | 3,701 (6.6%) |
| 30 to 34 Minutes | 7,944 (13.9%) | 7,414 (13.1%) |
| 35 to 39 Minutes | 1,534 (2.7%) | 1,469 (2.6%) |
| 40 to 44 Minutes | 1,942 (3.4%) | 1,383 (2.5%) |
| 45 to 59 Minutes | 3,622 (6.4%) | 4,295 (7.6%) |
| 60 to 89 Minutes | 2,153 (3.8%) | 1,740 (3.1%) |
| 90 or more Minutes | 1,268 (2.2%) | 991 (1.8%) |
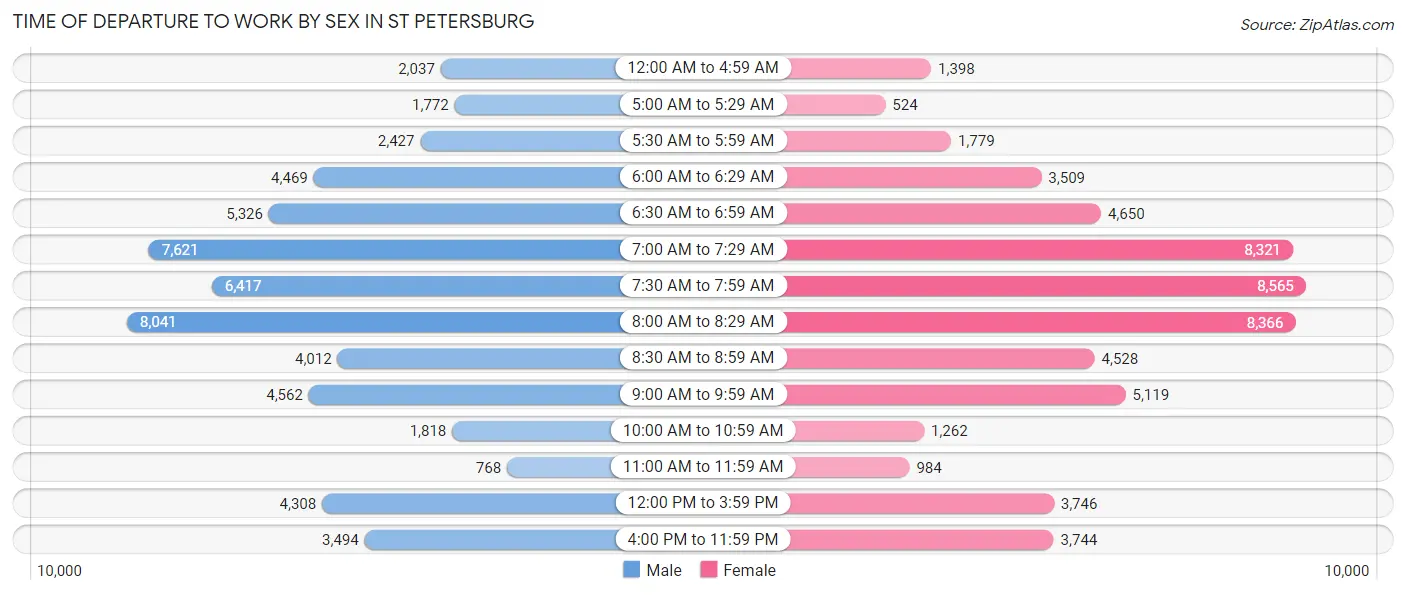
Time of Departure to Work by Sex in St Petersburg
The most frequent times of departure to work in St Petersburg are 8:00 AM to 8:29 AM (8,041, 14.1%) for males and 7:30 AM to 7:59 AM (8,565, 15.2%) for females.
| Time of Departure | Male | Female |
| 12:00 AM to 4:59 AM | 2,037 (3.6%) | 1,398 (2.5%) |
| 5:00 AM to 5:29 AM | 1,772 (3.1%) | 524 (0.9%) |
| 5:30 AM to 5:59 AM | 2,427 (4.3%) | 1,779 (3.2%) |
| 6:00 AM to 6:29 AM | 4,469 (7.8%) | 3,509 (6.2%) |
| 6:30 AM to 6:59 AM | 5,326 (9.3%) | 4,650 (8.2%) |
| 7:00 AM to 7:29 AM | 7,621 (13.4%) | 8,321 (14.7%) |
| 7:30 AM to 7:59 AM | 6,417 (11.2%) | 8,565 (15.2%) |
| 8:00 AM to 8:29 AM | 8,041 (14.1%) | 8,366 (14.8%) |
| 8:30 AM to 8:59 AM | 4,012 (7.0%) | 4,528 (8.0%) |
| 9:00 AM to 9:59 AM | 4,562 (8.0%) | 5,119 (9.1%) |
| 10:00 AM to 10:59 AM | 1,818 (3.2%) | 1,262 (2.2%) |
| 11:00 AM to 11:59 AM | 768 (1.3%) | 984 (1.7%) |
| 12:00 PM to 3:59 PM | 4,308 (7.5%) | 3,746 (6.6%) |
| 4:00 PM to 11:59 PM | 3,494 (6.1%) | 3,744 (6.6%) |
| Total | 57,072 (100.0%) | 56,495 (100.0%) |
Housing Occupancy in St Petersburg
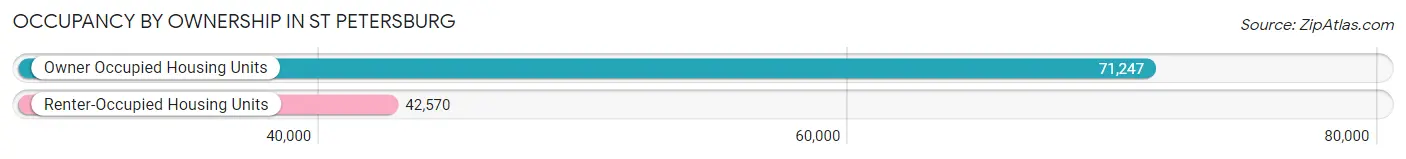
Occupancy by Ownership in St Petersburg
Of the total 113,817 dwellings in St Petersburg, owner-occupied units account for 71,247 (62.6%), while renter-occupied units make up 42,570 (37.4%).
| Occupancy | # Housing Units | % Housing Units |
| Owner Occupied Housing Units | 71,247 | 62.6% |
| Renter-Occupied Housing Units | 42,570 | 37.4% |
| Total Occupied Housing Units | 113,817 | 100.0% |
Occupancy by Household Size in St Petersburg
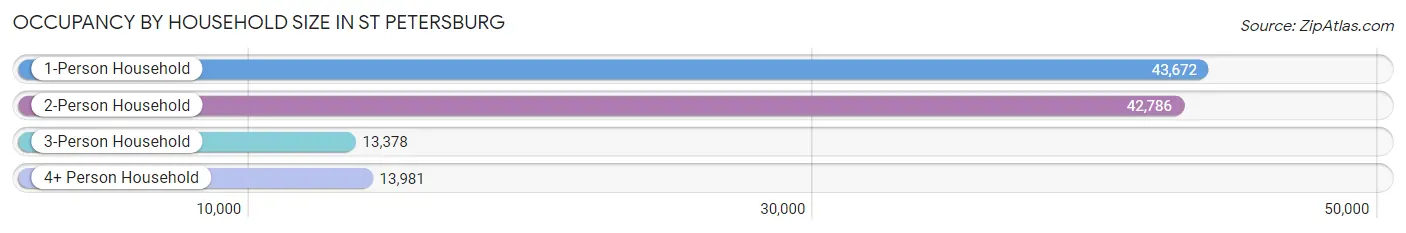
| Household Size | # Housing Units | % Housing Units |
| 1-Person Household | 43,672 | 38.4% |
| 2-Person Household | 42,786 | 37.6% |
| 3-Person Household | 13,378 | 11.7% |
| 4+ Person Household | 13,981 | 12.3% |
| Total Housing Units | 113,817 | 100.0% |
Occupancy by Ownership by Household Size in St Petersburg
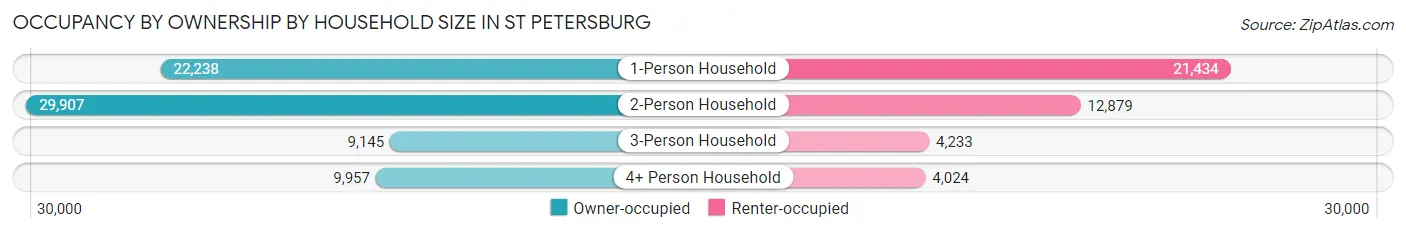
| Household Size | Owner-occupied | Renter-occupied |
| 1-Person Household | 22,238 (50.9%) | 21,434 (49.1%) |
| 2-Person Household | 29,907 (69.9%) | 12,879 (30.1%) |
| 3-Person Household | 9,145 (68.4%) | 4,233 (31.6%) |
| 4+ Person Household | 9,957 (71.2%) | 4,024 (28.8%) |
| Total Housing Units | 71,247 (62.6%) | 42,570 (37.4%) |
Occupancy by Educational Attainment in St Petersburg
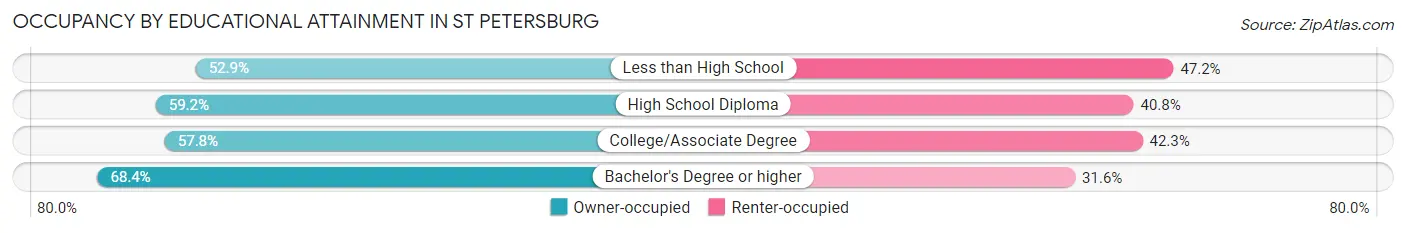
| Household Size | Owner-occupied | Renter-occupied |
| Less than High School | 2,771 (52.8%) | 2,472 (47.1%) |
| High School Diploma | 13,070 (59.2%) | 9,015 (40.8%) |
| College/Associate Degree | 20,470 (57.8%) | 14,975 (42.2%) |
| Bachelor's Degree or higher | 34,936 (68.4%) | 16,108 (31.6%) |
Occupancy by Age of Householder in St Petersburg
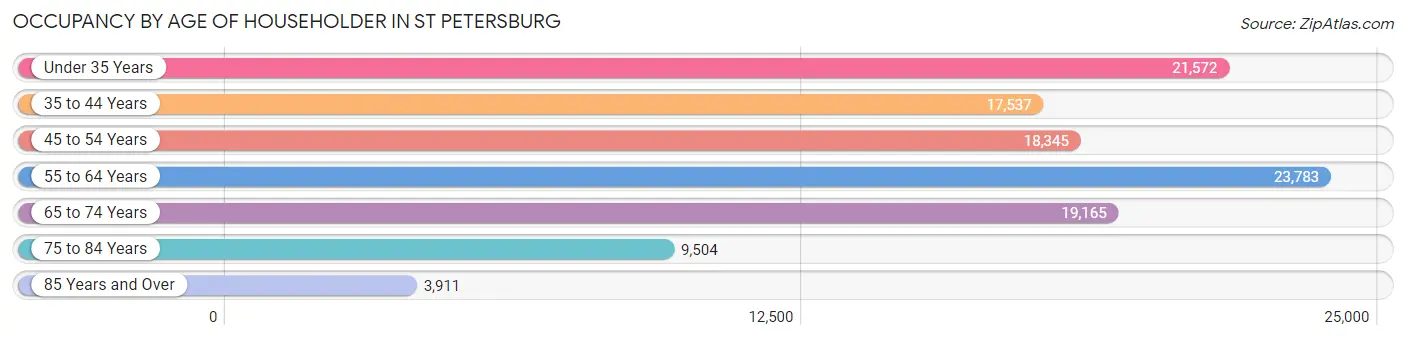
| Age Bracket | # Households | % Households |
| Under 35 Years | 21,572 | 19.0% |
| 35 to 44 Years | 17,537 | 15.4% |
| 45 to 54 Years | 18,345 | 16.1% |
| 55 to 64 Years | 23,783 | 20.9% |
| 65 to 74 Years | 19,165 | 16.8% |
| 75 to 84 Years | 9,504 | 8.4% |
| 85 Years and Over | 3,911 | 3.4% |
| Total | 113,817 | 100.0% |
Housing Finances in St Petersburg
Median Income by Occupancy in St Petersburg
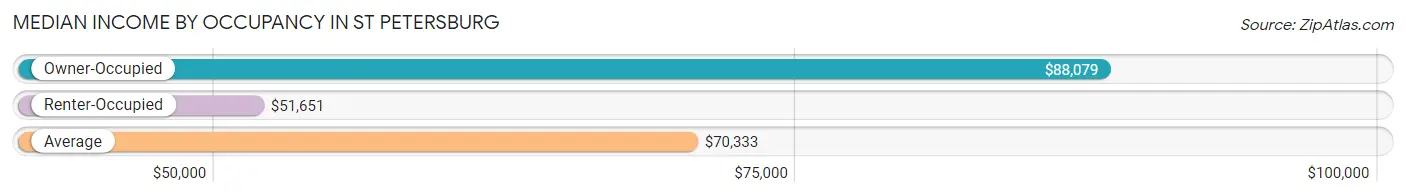
| Occupancy Type | # Households | Median Income |
| Owner-Occupied | 71,247 (62.6%) | $88,079 |
| Renter-Occupied | 42,570 (37.4%) | $51,651 |
| Average | 113,817 (100.0%) | $70,333 |
Occupancy by Householder Income Bracket in St Petersburg
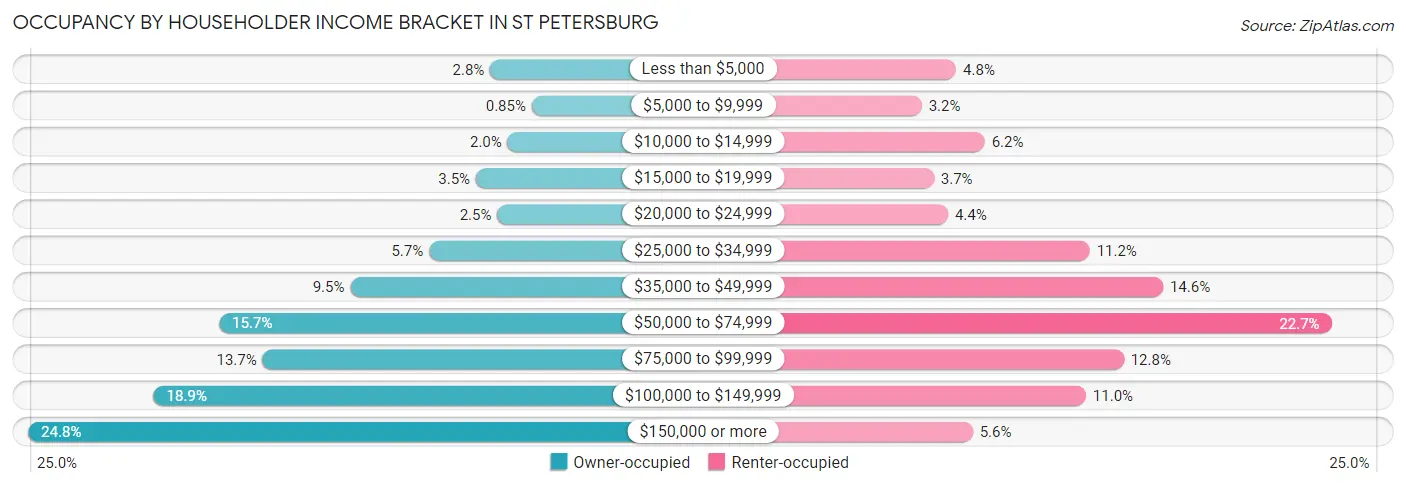
| Income Bracket | Owner-occupied | Renter-occupied |
| Less than $5,000 | 2,018 (2.8%) | 2,038 (4.8%) |
| $5,000 to $9,999 | 604 (0.9%) | 1,342 (3.2%) |
| $10,000 to $14,999 | 1,423 (2.0%) | 2,619 (6.1%) |
| $15,000 to $19,999 | 2,503 (3.5%) | 1,589 (3.7%) |
| $20,000 to $24,999 | 1,772 (2.5%) | 1,871 (4.4%) |
| $25,000 to $34,999 | 4,087 (5.7%) | 4,746 (11.2%) |
| $35,000 to $49,999 | 6,763 (9.5%) | 6,234 (14.6%) |
| $50,000 to $74,999 | 11,211 (15.7%) | 9,647 (22.7%) |
| $75,000 to $99,999 | 9,743 (13.7%) | 5,436 (12.8%) |
| $100,000 to $149,999 | 13,435 (18.9%) | 4,672 (11.0%) |
| $150,000 or more | 17,688 (24.8%) | 2,376 (5.6%) |
| Total | 71,247 (100.0%) | 42,570 (100.0%) |
Monthly Housing Cost Tiers in St Petersburg
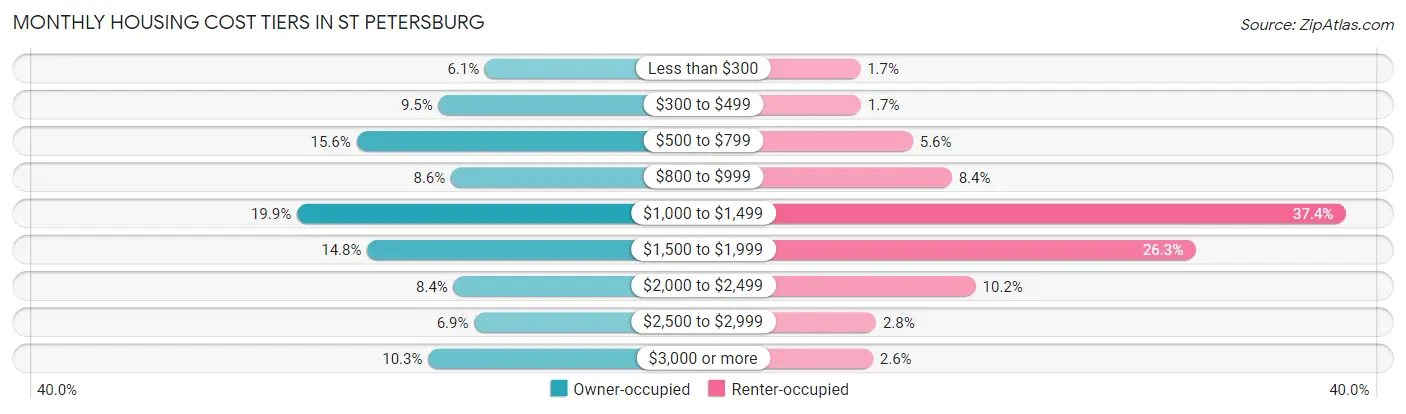
| Monthly Cost | Owner-occupied | Renter-occupied |
| Less than $300 | 4,342 (6.1%) | 717 (1.7%) |
| $300 to $499 | 6,779 (9.5%) | 731 (1.7%) |
| $500 to $799 | 11,078 (15.5%) | 2,363 (5.6%) |
| $800 to $999 | 6,120 (8.6%) | 3,585 (8.4%) |
| $1,000 to $1,499 | 14,210 (19.9%) | 15,915 (37.4%) |
| $1,500 to $1,999 | 10,514 (14.8%) | 11,207 (26.3%) |
| $2,000 to $2,499 | 5,986 (8.4%) | 4,335 (10.2%) |
| $2,500 to $2,999 | 4,900 (6.9%) | 1,211 (2.8%) |
| $3,000 or more | 7,318 (10.3%) | 1,110 (2.6%) |
| Total | 71,247 (100.0%) | 42,570 (100.0%) |
Physical Housing Characteristics in St Petersburg
Housing Structures in St Petersburg
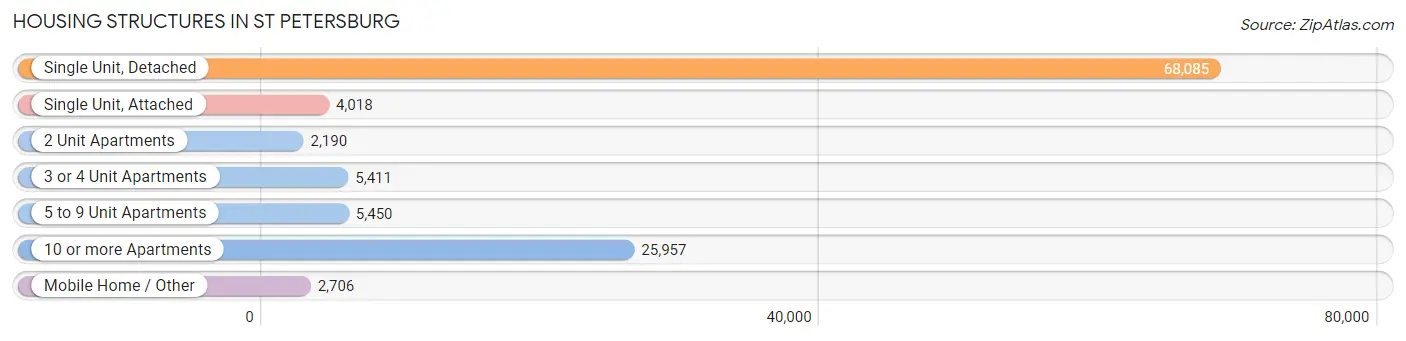
| Structure Type | # Housing Units | % Housing Units |
| Single Unit, Detached | 68,085 | 59.8% |
| Single Unit, Attached | 4,018 | 3.5% |
| 2 Unit Apartments | 2,190 | 1.9% |
| 3 or 4 Unit Apartments | 5,411 | 4.8% |
| 5 to 9 Unit Apartments | 5,450 | 4.8% |
| 10 or more Apartments | 25,957 | 22.8% |
| Mobile Home / Other | 2,706 | 2.4% |
| Total | 113,817 | 100.0% |
Housing Structures by Occupancy in St Petersburg
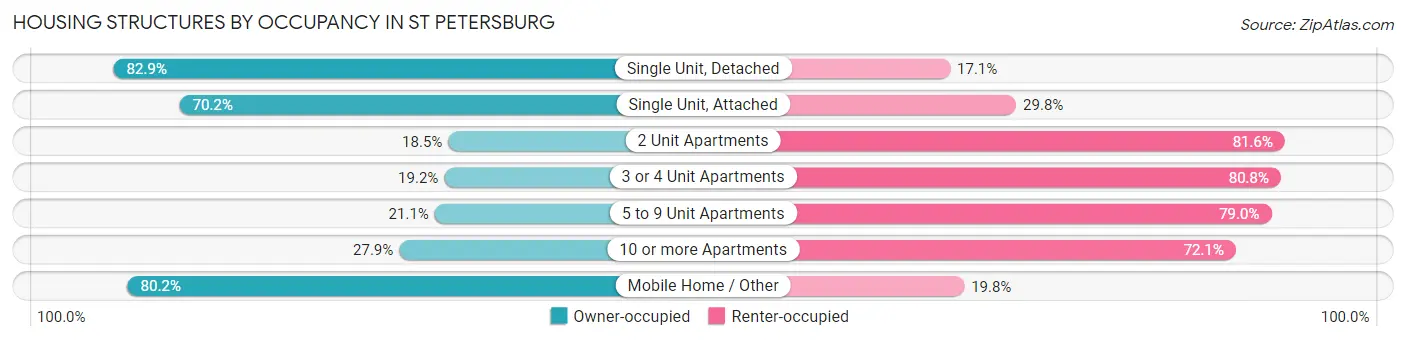
| Structure Type | Owner-occupied | Renter-occupied |
| Single Unit, Detached | 56,428 (82.9%) | 11,657 (17.1%) |
| Single Unit, Attached | 2,819 (70.2%) | 1,199 (29.8%) |
| 2 Unit Apartments | 404 (18.4%) | 1,786 (81.6%) |
| 3 or 4 Unit Apartments | 1,040 (19.2%) | 4,371 (80.8%) |
| 5 to 9 Unit Apartments | 1,147 (21.0%) | 4,303 (78.9%) |
| 10 or more Apartments | 7,240 (27.9%) | 18,717 (72.1%) |
| Mobile Home / Other | 2,169 (80.2%) | 537 (19.8%) |
| Total | 71,247 (62.6%) | 42,570 (37.4%) |
Housing Structures by Number of Rooms in St Petersburg
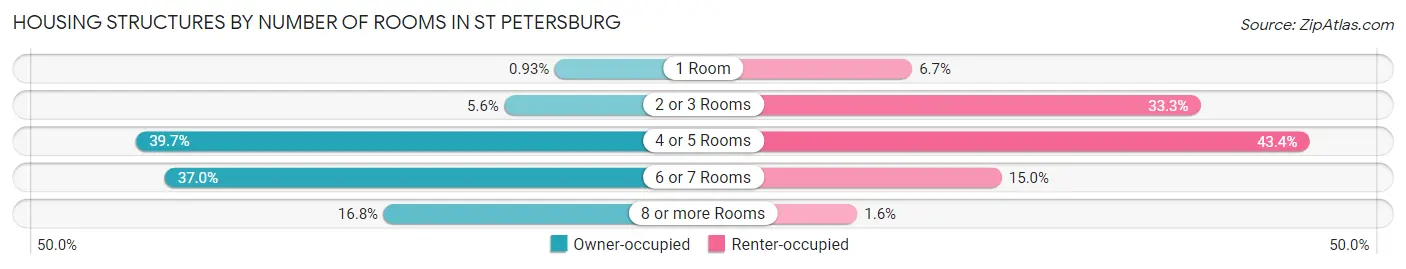
| Number of Rooms | Owner-occupied | Renter-occupied |
| 1 Room | 661 (0.9%) | 2,847 (6.7%) |
| 2 or 3 Rooms | 3,993 (5.6%) | 14,187 (33.3%) |
| 4 or 5 Rooms | 28,261 (39.7%) | 18,474 (43.4%) |
| 6 or 7 Rooms | 26,381 (37.0%) | 6,376 (15.0%) |
| 8 or more Rooms | 11,951 (16.8%) | 686 (1.6%) |
| Total | 71,247 (100.0%) | 42,570 (100.0%) |
Housing Structure by Heating Type in St Petersburg
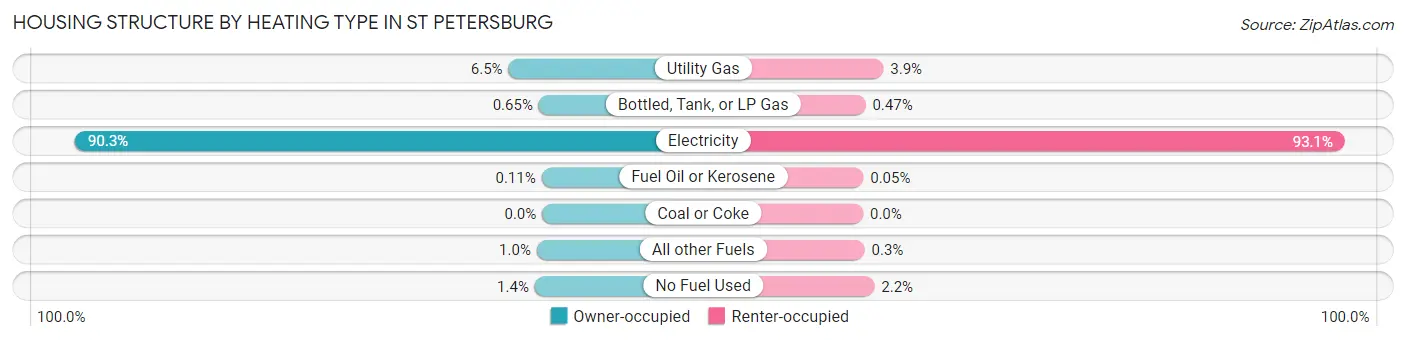
| Heating Type | Owner-occupied | Renter-occupied |
| Utility Gas | 4,640 (6.5%) | 1,667 (3.9%) |
| Bottled, Tank, or LP Gas | 461 (0.6%) | 202 (0.5%) |
| Electricity | 64,318 (90.3%) | 39,624 (93.1%) |
| Fuel Oil or Kerosene | 77 (0.1%) | 20 (0.1%) |
| Coal or Coke | 0 (0.0%) | 0 (0.0%) |
| All other Fuels | 740 (1.0%) | 126 (0.3%) |
| No Fuel Used | 1,011 (1.4%) | 931 (2.2%) |
| Total | 71,247 (100.0%) | 42,570 (100.0%) |
Household Vehicle Usage in St Petersburg
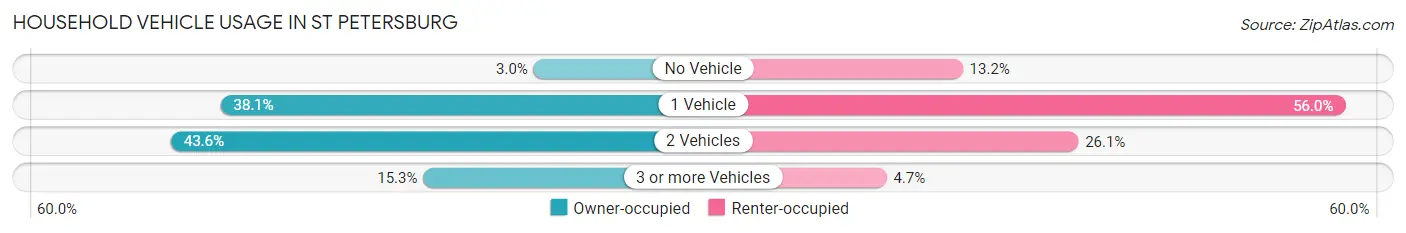
| Vehicles per Household | Owner-occupied | Renter-occupied |
| No Vehicle | 2,119 (3.0%) | 5,614 (13.2%) |
| 1 Vehicle | 27,126 (38.1%) | 23,855 (56.0%) |
| 2 Vehicles | 31,076 (43.6%) | 11,123 (26.1%) |
| 3 or more Vehicles | 10,926 (15.3%) | 1,978 (4.6%) |
| Total | 71,247 (100.0%) | 42,570 (100.0%) |
Real Estate & Mortgages in St Petersburg
Real Estate and Mortgage Overview in St Petersburg
| Characteristic | Without Mortgage | With Mortgage |
| Housing Units | 29,671 | 41,576 |
| Median Property Value | $260,600 | $308,300 |
| Median Household Income | $68,970 | $12,517 |
| Monthly Housing Costs | $612 | $6,696 |
| Real Estate Taxes | $1,664 | $1,647 |
Property Value by Mortgage Status in St Petersburg
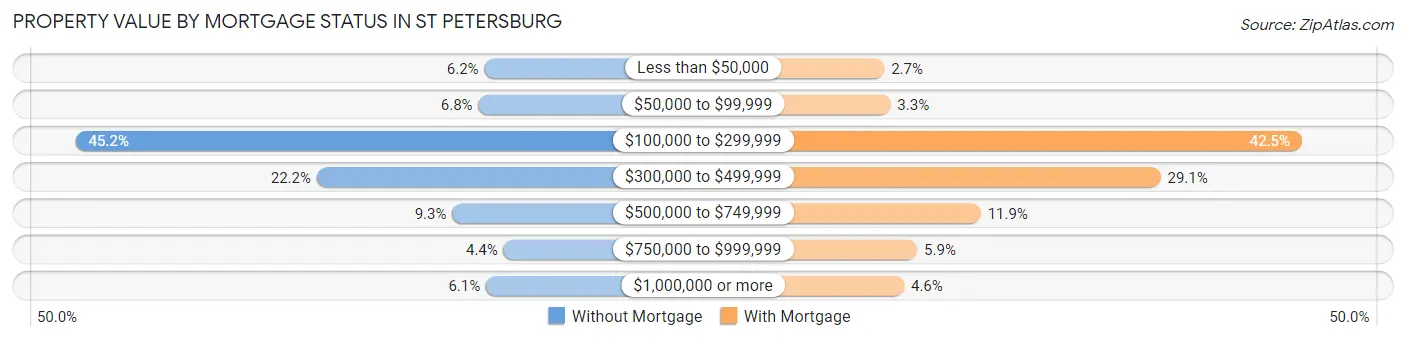
| Property Value | Without Mortgage | With Mortgage |
| Less than $50,000 | 1,843 (6.2%) | 1,136 (2.7%) |
| $50,000 to $99,999 | 2,013 (6.8%) | 1,380 (3.3%) |
| $100,000 to $299,999 | 13,395 (45.2%) | 17,670 (42.5%) |
| $300,000 to $499,999 | 6,577 (22.2%) | 12,076 (29.0%) |
| $500,000 to $749,999 | 2,750 (9.3%) | 4,955 (11.9%) |
| $750,000 to $999,999 | 1,299 (4.4%) | 2,440 (5.9%) |
| $1,000,000 or more | 1,794 (6.0%) | 1,919 (4.6%) |
| Total | 29,671 (100.0%) | 41,576 (100.0%) |
Household Income by Mortgage Status in St Petersburg
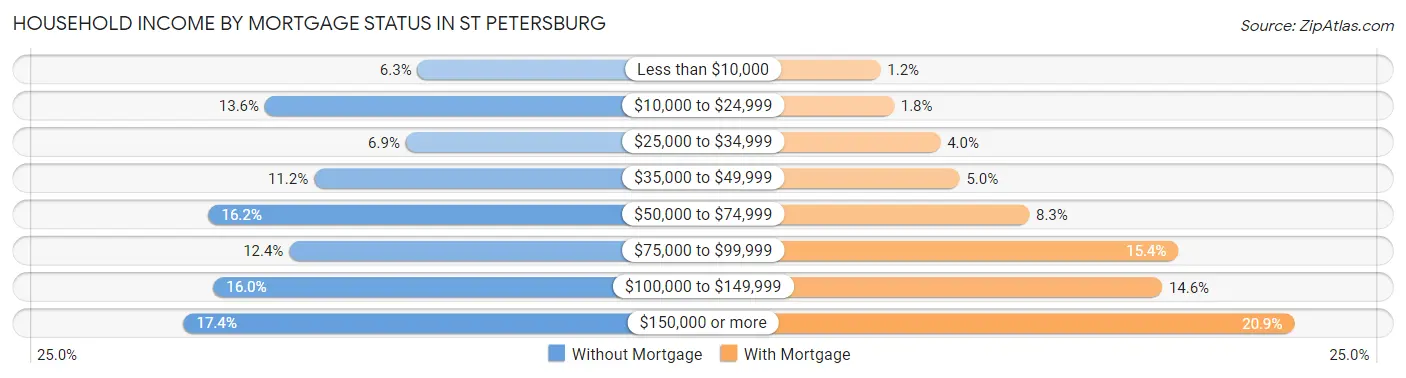
| Household Income | Without Mortgage | With Mortgage |
| Less than $10,000 | 1,867 (6.3%) | 490 (1.2%) |
| $10,000 to $24,999 | 4,024 (13.6%) | 755 (1.8%) |
| $25,000 to $34,999 | 2,031 (6.9%) | 1,674 (4.0%) |
| $35,000 to $49,999 | 3,329 (11.2%) | 2,056 (5.0%) |
| $50,000 to $74,999 | 4,820 (16.2%) | 3,434 (8.3%) |
| $75,000 to $99,999 | 3,678 (12.4%) | 6,391 (15.4%) |
| $100,000 to $149,999 | 4,751 (16.0%) | 6,065 (14.6%) |
| $150,000 or more | 5,171 (17.4%) | 8,684 (20.9%) |
| Total | 29,671 (100.0%) | 41,576 (100.0%) |
Property Value to Household Income Ratio in St Petersburg
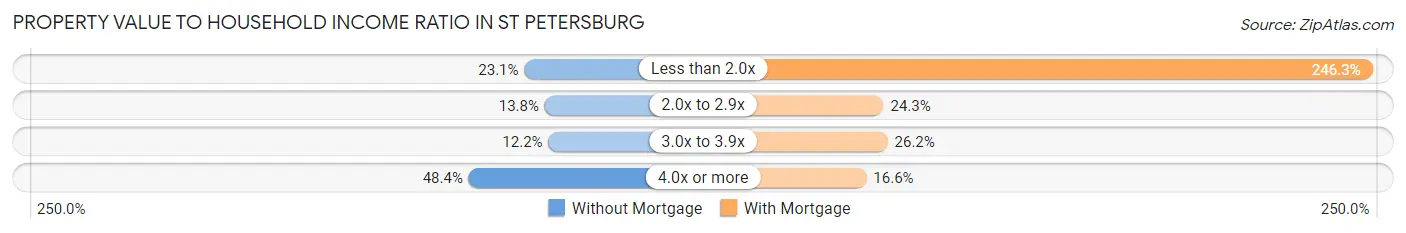
| Value-to-Income Ratio | Without Mortgage | With Mortgage |
| Less than 2.0x | 6,853 (23.1%) | 102,412 (246.3%) |
| 2.0x to 2.9x | 4,097 (13.8%) | 10,119 (24.3%) |
| 3.0x to 3.9x | 3,611 (12.2%) | 10,884 (26.2%) |
| 4.0x or more | 14,345 (48.3%) | 6,890 (16.6%) |
| Total | 29,671 (100.0%) | 41,576 (100.0%) |
Real Estate Taxes by Mortgage Status in St Petersburg
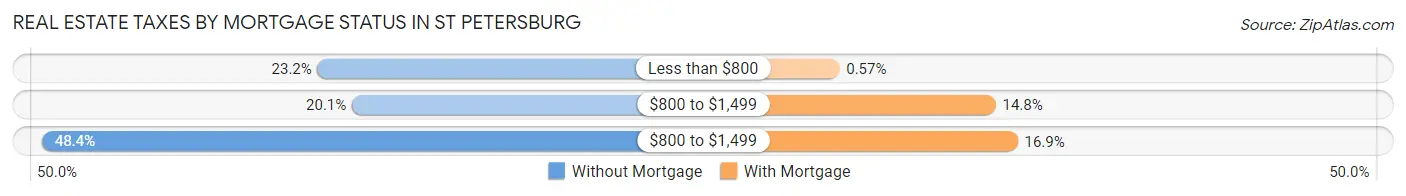
| Property Taxes | Without Mortgage | With Mortgage |
| Less than $800 | 6,896 (23.2%) | 239 (0.6%) |
| $800 to $1,499 | 5,960 (20.1%) | 6,171 (14.8%) |
| $800 to $1,499 | 14,369 (48.4%) | 7,004 (16.9%) |
| Total | 29,671 (100.0%) | 41,576 (100.0%) |
Health & Disability in St Petersburg
Health Insurance Coverage by Age in St Petersburg
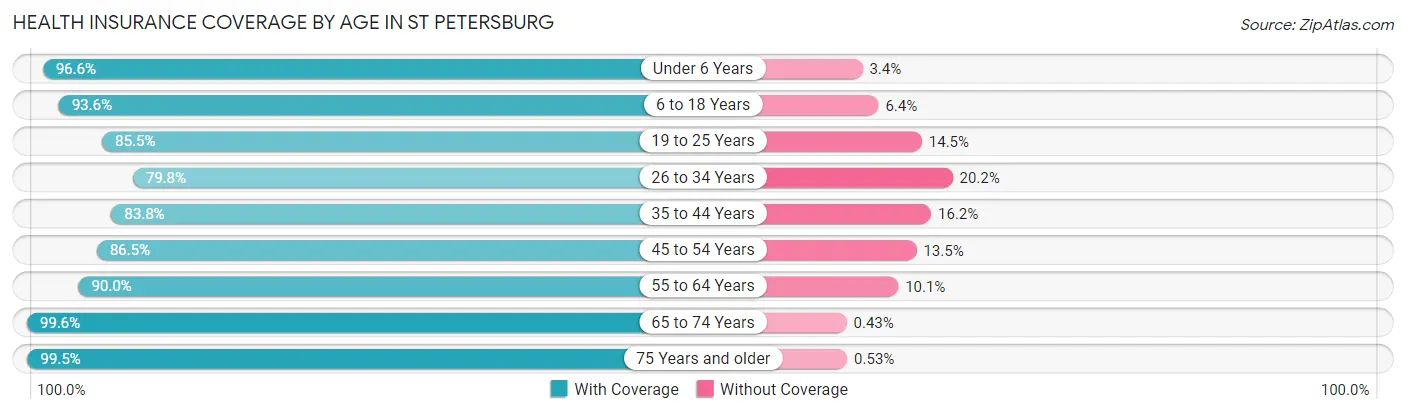
| Age Bracket | With Coverage | Without Coverage |
| Under 6 Years | 13,857 (96.6%) | 485 (3.4%) |
| 6 to 18 Years | 28,072 (93.6%) | 1,909 (6.4%) |
| 19 to 25 Years | 18,769 (85.5%) | 3,174 (14.5%) |
| 26 to 34 Years | 28,871 (79.8%) | 7,298 (20.2%) |
| 35 to 44 Years | 27,487 (83.8%) | 5,308 (16.2%) |
| 45 to 54 Years | 27,597 (86.5%) | 4,293 (13.5%) |
| 55 to 64 Years | 34,856 (89.9%) | 3,895 (10.1%) |
| 65 to 74 Years | 29,363 (99.6%) | 127 (0.4%) |
| 75 Years and older | 19,730 (99.5%) | 105 (0.5%) |
| Total | 228,602 (89.6%) | 26,594 (10.4%) |
Health Insurance Coverage by Citizenship Status in St Petersburg
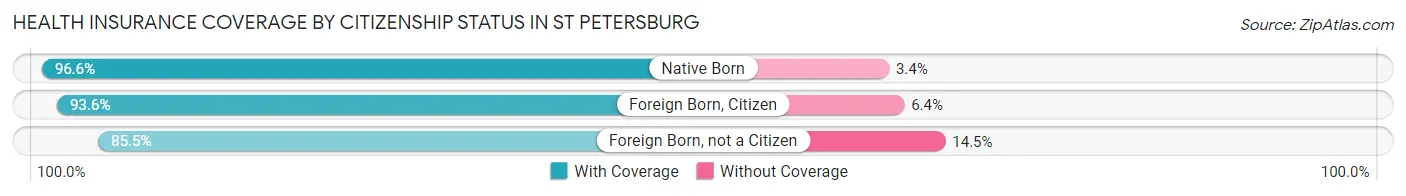
| Citizenship Status | With Coverage | Without Coverage |
| Native Born | 13,857 (96.6%) | 485 (3.4%) |
| Foreign Born, Citizen | 28,072 (93.6%) | 1,909 (6.4%) |
| Foreign Born, not a Citizen | 18,769 (85.5%) | 3,174 (14.5%) |
Health Insurance Coverage by Household Income in St Petersburg
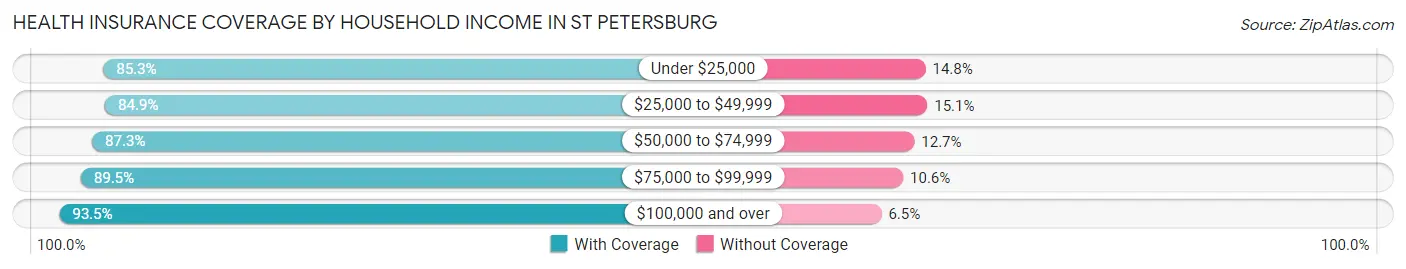
| Household Income | With Coverage | Without Coverage |
| Under $25,000 | 23,436 (85.3%) | 4,056 (14.7%) |
| $25,000 to $49,999 | 33,418 (84.9%) | 5,939 (15.1%) |
| $50,000 to $74,999 | 38,847 (87.3%) | 5,631 (12.7%) |
| $75,000 to $99,999 | 31,730 (89.4%) | 3,741 (10.5%) |
| $100,000 and over | 97,222 (93.5%) | 6,757 (6.5%) |
Public vs Private Health Insurance Coverage by Age in St Petersburg
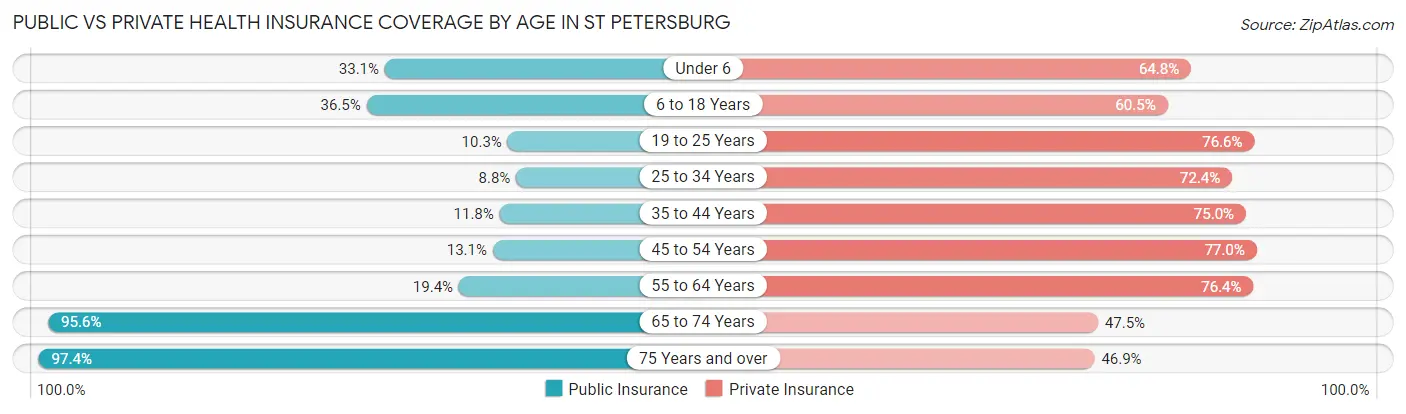
| Age Bracket | Public Insurance | Private Insurance |
| Under 6 | 4,752 (33.1%) | 9,296 (64.8%) |
| 6 to 18 Years | 10,950 (36.5%) | 18,124 (60.5%) |
| 19 to 25 Years | 2,268 (10.3%) | 16,802 (76.6%) |
| 25 to 34 Years | 3,163 (8.7%) | 26,201 (72.4%) |
| 35 to 44 Years | 3,880 (11.8%) | 24,597 (75.0%) |
| 45 to 54 Years | 4,179 (13.1%) | 24,560 (77.0%) |
| 55 to 64 Years | 7,513 (19.4%) | 29,603 (76.4%) |
| 65 to 74 Years | 28,200 (95.6%) | 14,019 (47.5%) |
| 75 Years and over | 19,316 (97.4%) | 9,303 (46.9%) |
| Total | 84,221 (33.0%) | 172,505 (67.6%) |
Disability Status by Sex by Age in St Petersburg
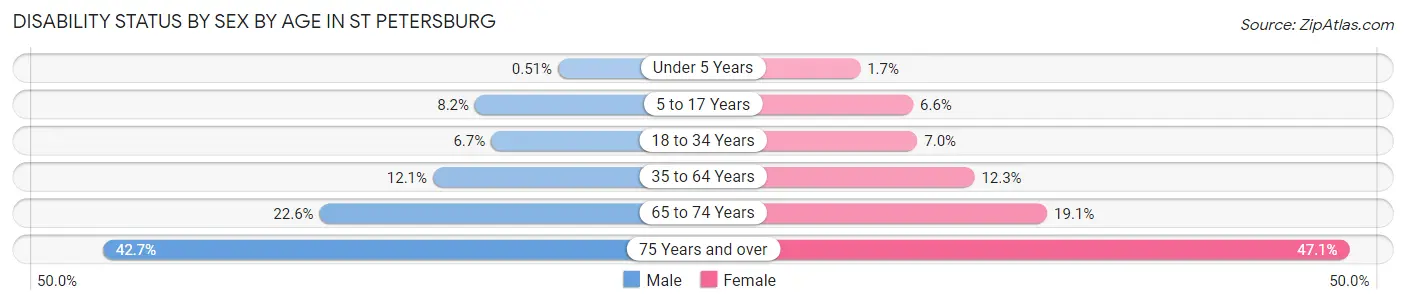
| Age Bracket | Male | Female |
| Under 5 Years | 32 (0.5%) | 103 (1.7%) |
| 5 to 17 Years | 1,240 (8.2%) | 982 (6.6%) |
| 18 to 34 Years | 1,918 (6.7%) | 2,218 (7.0%) |
| 35 to 64 Years | 6,070 (12.1%) | 6,563 (12.3%) |
| 65 to 74 Years | 3,176 (22.6%) | 2,948 (19.1%) |
| 75 Years and over | 3,625 (42.7%) | 5,347 (47.1%) |
Disability Class by Sex by Age in St Petersburg
Disability Class: Hearing Difficulty
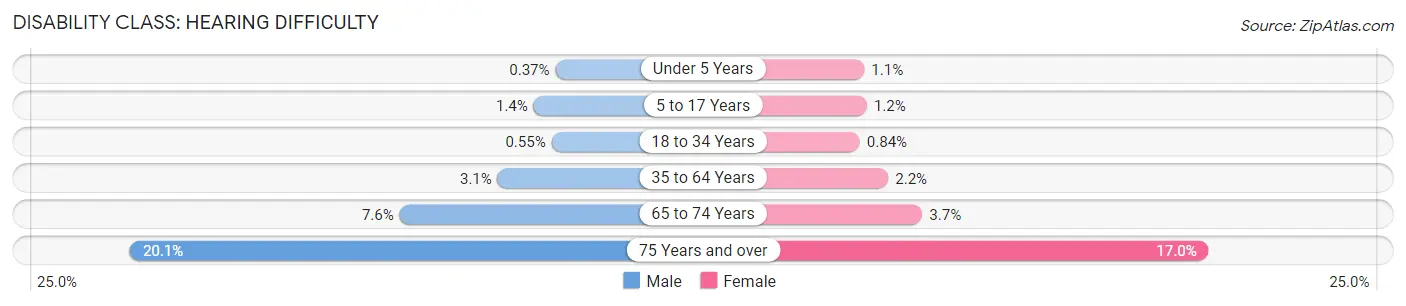
| Age Bracket | Male | Female |
| Under 5 Years | 23 (0.4%) | 63 (1.1%) |
| 5 to 17 Years | 208 (1.4%) | 173 (1.2%) |
| 18 to 34 Years | 156 (0.5%) | 267 (0.8%) |
| 35 to 64 Years | 1,527 (3.0%) | 1,150 (2.2%) |
| 65 to 74 Years | 1,066 (7.6%) | 578 (3.7%) |
| 75 Years and over | 1,706 (20.1%) | 1,932 (17.0%) |
Disability Class: Vision Difficulty
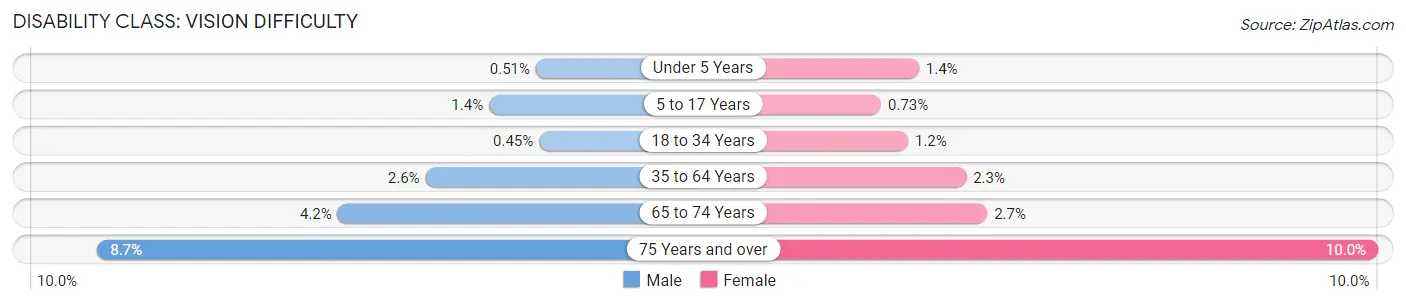
| Age Bracket | Male | Female |
| Under 5 Years | 32 (0.5%) | 86 (1.4%) |
| 5 to 17 Years | 209 (1.4%) | 108 (0.7%) |
| 18 to 34 Years | 129 (0.4%) | 388 (1.2%) |
| 35 to 64 Years | 1,285 (2.6%) | 1,231 (2.3%) |
| 65 to 74 Years | 587 (4.2%) | 417 (2.7%) |
| 75 Years and over | 734 (8.6%) | 1,130 (10.0%) |
Disability Class: Cognitive Difficulty
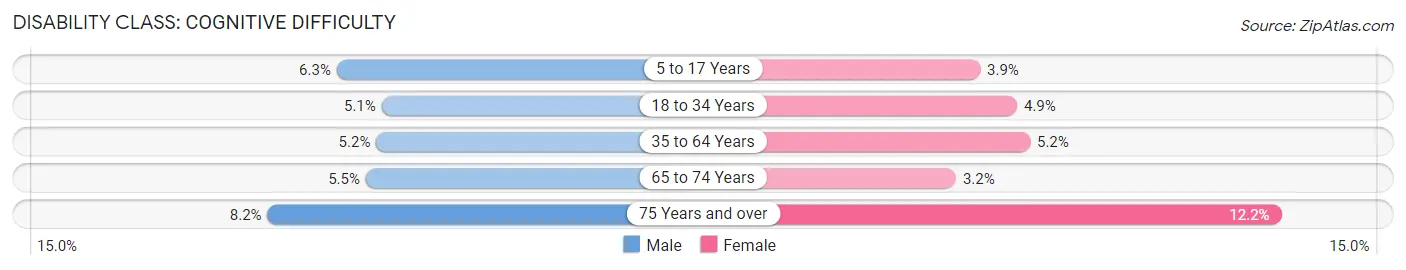
| Age Bracket | Male | Female |
| 5 to 17 Years | 953 (6.3%) | 571 (3.8%) |
| 18 to 34 Years | 1,445 (5.1%) | 1,545 (4.9%) |
| 35 to 64 Years | 2,613 (5.2%) | 2,794 (5.2%) |
| 65 to 74 Years | 771 (5.5%) | 492 (3.2%) |
| 75 Years and over | 699 (8.2%) | 1,390 (12.2%) |
Disability Class: Ambulatory Difficulty
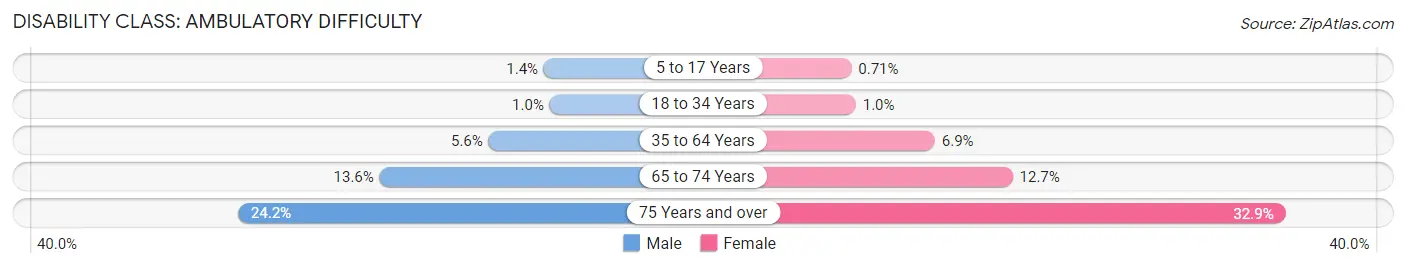
| Age Bracket | Male | Female |
| 5 to 17 Years | 217 (1.4%) | 105 (0.7%) |
| 18 to 34 Years | 288 (1.0%) | 330 (1.0%) |
| 35 to 64 Years | 2,782 (5.6%) | 3,681 (6.9%) |
| 65 to 74 Years | 1,913 (13.6%) | 1,961 (12.7%) |
| 75 Years and over | 2,049 (24.2%) | 3,740 (32.9%) |
Disability Class: Self-Care Difficulty
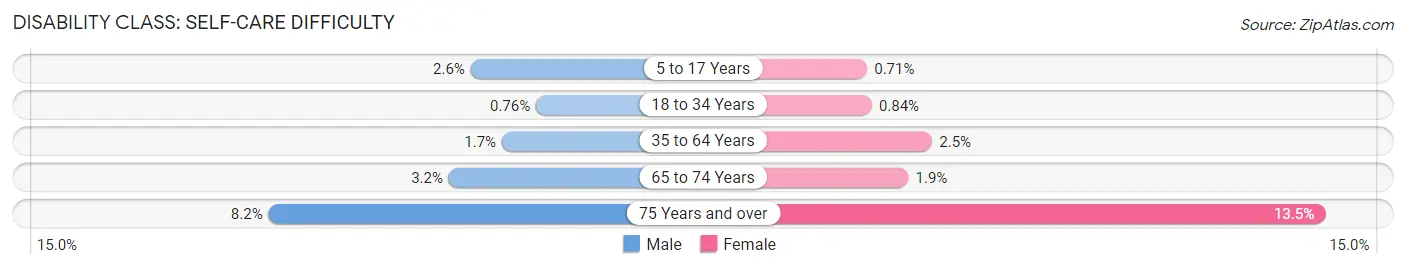
| Age Bracket | Male | Female |
| 5 to 17 Years | 390 (2.6%) | 105 (0.7%) |
| 18 to 34 Years | 218 (0.8%) | 266 (0.8%) |
| 35 to 64 Years | 857 (1.7%) | 1,343 (2.5%) |
| 65 to 74 Years | 448 (3.2%) | 288 (1.9%) |
| 75 Years and over | 696 (8.2%) | 1,530 (13.5%) |
Technology Access in St Petersburg
Computing Device Access in St Petersburg
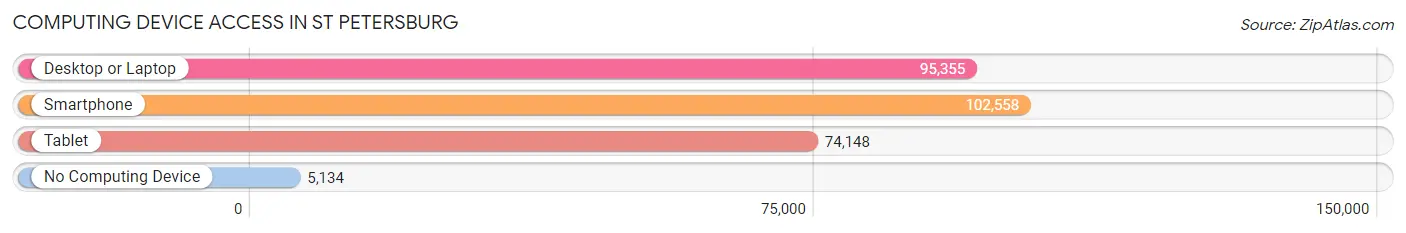
| Device Type | # Households | % Households |
| Desktop or Laptop | 95,355 | 83.8% |
| Smartphone | 102,558 | 90.1% |
| Tablet | 74,148 | 65.1% |
| No Computing Device | 5,134 | 4.5% |
| Total | 113,817 | 100.0% |
Internet Access in St Petersburg
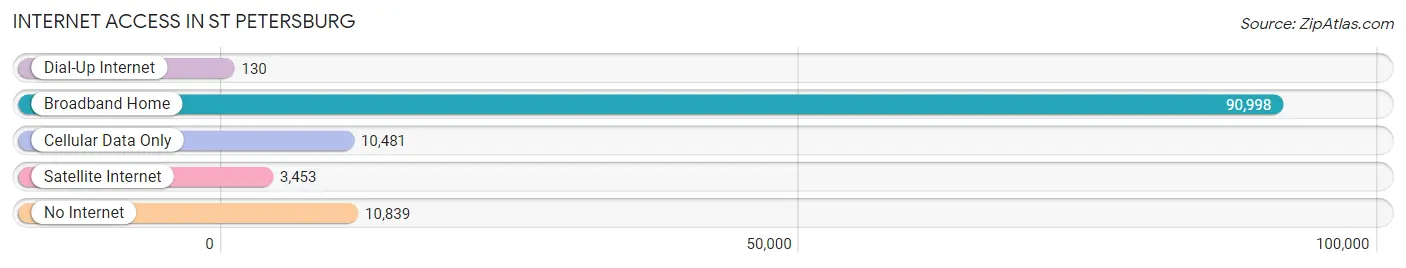
| Internet Type | # Households | % Households |
| Dial-Up Internet | 130 | 0.1% |
| Broadband Home | 90,998 | 79.9% |
| Cellular Data Only | 10,481 | 9.2% |
| Satellite Internet | 3,453 | 3.0% |
| No Internet | 10,839 | 9.5% |
| Total | 113,817 | 100.0% |
St Petersburg Summary
St Petersburg, Florida is a city located in Pinellas County, on the west coast of Florida. It is the fifth-largest city in the state, with a population of approximately 265,098 as of 2019. St Petersburg is known for its beautiful beaches, vibrant culture, and diverse economy.
Geography
St Petersburg is located on the west coast of Florida, on the Gulf of Mexico. It is bordered by Tampa Bay to the east, and the Gulf of Mexico to the west. The city is situated on a peninsula, with the bay to the east and the Gulf of Mexico to the west. The city is divided into several neighborhoods, including Downtown, Old Northeast, Midtown, and the Grand Central District.
The city has a humid subtropical climate, with hot and humid summers and mild winters. The average temperature in the summer is around 90°F, and the average temperature in the winter is around 60°F.
History
St Petersburg was founded in 1888 by John C. Williams, who purchased the land from the local Tocobaga Indians. The city was originally named “St. Petersburg” after the city of St. Petersburg, Russia. The city was incorporated in 1892, and the first mayor was John C. Williams.
The city grew rapidly in the early 20th century, and by the 1920s, it was the fifth-largest city in Florida. The city was a popular tourist destination, and it was known for its beautiful beaches and vibrant culture.
In the 1950s, the city began to decline, as many of its residents moved to the suburbs. The city was revitalized in the 1980s, and it has since become a popular tourist destination once again.
Economy
St Petersburg’s economy is diverse and vibrant. The city is home to several major corporations, including Raymond James Financial, Jabil Circuit, and Tech Data Corporation. The city is also home to several major hospitals, including Bayfront Health St. Petersburg and All Children’s Hospital.
The city is also a popular tourist destination, and it is home to several attractions, including the Salvador Dali Museum, the St. Petersburg Pier, and the Florida Holocaust Museum. The city is also home to several professional sports teams, including the Tampa Bay Rays and the Tampa Bay Rowdies.
Demographics
As of 2019, the population of St Petersburg was approximately 265,098. The city is racially diverse, with a population that is approximately 57.3% White, 28.2% African American, 8.2% Hispanic or Latino, and 6.3% Asian. The median household income in the city is $45,845, and the median home value is $179,400.
St Petersburg is a vibrant and diverse city, with a rich history and a thriving economy. The city is home to several major corporations, hospitals, and attractions, and it is a popular tourist destination. The city is also racially diverse, with a population that is comprised of a variety of ethnicities and backgrounds.
Common Questions
What is Per Capita Income in St Petersburg?
Per Capita income in St Petersburg is $46,755.
What is the Median Family Income in St Petersburg?
Median Family Income in St Petersburg is $93,451.
What is the Median Household income in St Petersburg?
Median Household Income in St Petersburg is $70,333.
What is Income or Wage Gap in St Petersburg?
Income or Wage Gap in St Petersburg is 15.6%.
Women in St Petersburg earn 84.4 cents for every dollar earned by a man.
What is Family Income Deficit in St Petersburg?
Family Income Deficit in St Petersburg is $10,772.
Families that are below poverty line in St Petersburg earn $10,772 less on average than the poverty threshold level.
What is Inequality or Gini Index in St Petersburg?
Inequality or Gini Index in St Petersburg is 0.49.
What is the Total Population of St Petersburg?
Total Population of St Petersburg is 259,343.
What is the Total Male Population of St Petersburg?
Total Male Population of St Petersburg is 125,050.
What is the Total Female Population of St Petersburg?
Total Female Population of St Petersburg is 134,293.
What is the Ratio of Males per 100 Females in St Petersburg?
There are 93.12 Males per 100 Females in St Petersburg.
What is the Ratio of Females per 100 Males in St Petersburg?
There are 107.39 Females per 100 Males in St Petersburg.
What is the Median Population Age in St Petersburg?
Median Population Age in St Petersburg is 42.9 Years.
What is the Average Family Size in St Petersburg
Average Family Size in St Petersburg is 3.0 People.
What is the Average Household Size in St Petersburg
Average Household Size in St Petersburg is 2.2 People.
How Large is the Labor Force in St Petersburg?
There are 143,639 People in the Labor Forcein in St Petersburg.
What is the Percentage of People in the Labor Force in St Petersburg?
64.7% of People are in the Labor Force in St Petersburg.
What is the Unemployment Rate in St Petersburg?
Unemployment Rate in St Petersburg is 4.6%.