Gilbert, AZ Map & Demographics
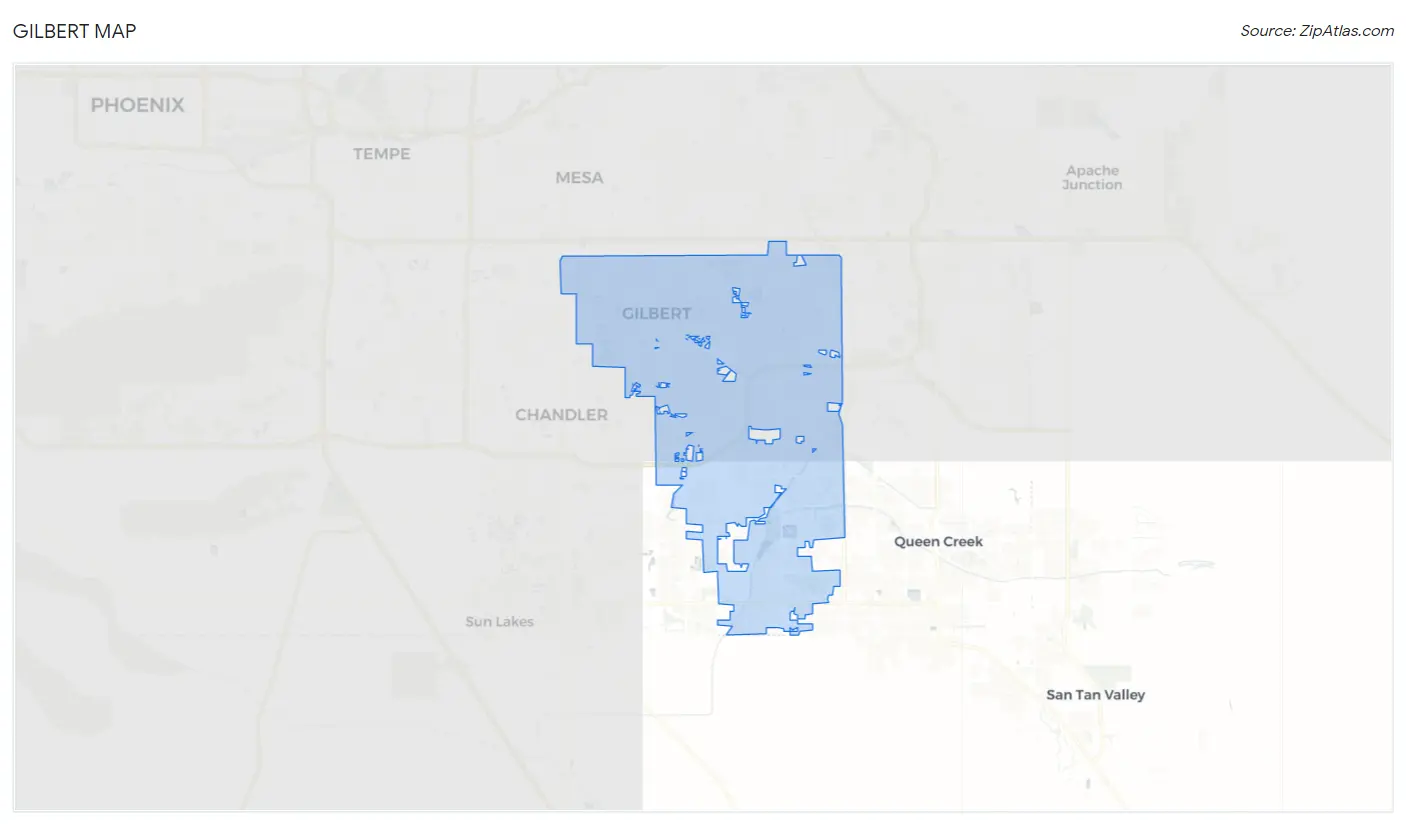
Gilbert Map
Gilbert Overview
$46,964
PER CAPITA INCOME
$127,707
AVG FAMILY INCOME
$115,179
AVG HOUSEHOLD INCOME
36.4%
WAGE / INCOME GAP [ % ]
63.6¢/ $1
WAGE / INCOME GAP [ $ ]
$11,646
FAMILY INCOME DEFICIT
0.38
INEQUALITY / GINI INDEX
267,267
TOTAL POPULATION
132,259
MALE POPULATION
135,008
FEMALE POPULATION
97.96
MALES / 100 FEMALES
102.08
FEMALES / 100 MALES
35.4
MEDIAN AGE
3.3
AVG FAMILY SIZE
3.0
AVG HOUSEHOLD SIZE
143,073
LABOR FORCE [ PEOPLE ]
72.0%
PERCENT IN LABOR FORCE
3.5%
UNEMPLOYMENT RATE
Gilbert Area Codes
Income in Gilbert
Income Overview in Gilbert
Per Capita Income in Gilbert is $46,964, while median incomes of families and households are $127,707 and $115,179 respectively.
| Characteristic | Number | Measure |
| Per Capita Income | 267,267 | $46,964 |
| Median Family Income | 69,836 | $127,707 |
| Mean Family Income | 69,836 | $149,818 |
| Median Household Income | 90,299 | $115,179 |
| Mean Household Income | 90,299 | $137,425 |
| Income Deficit | 69,836 | $11,646 |
| Wage / Income Gap (%) | 267,267 | 36.36% |
| Wage / Income Gap ($) | 267,267 | 63.64¢ per $1 |
| Gini / Inequality Index | 267,267 | 0.38 |
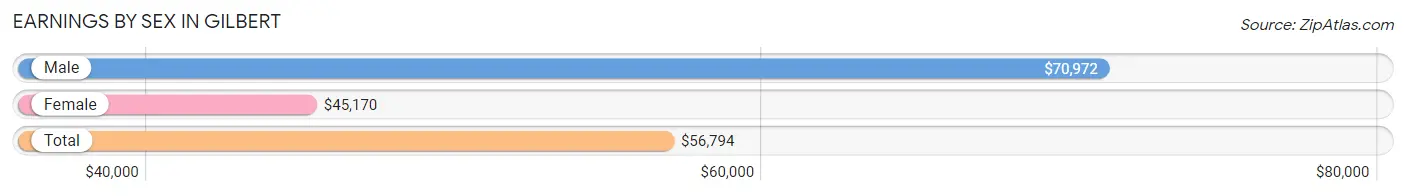
Earnings by Sex in Gilbert
Average Earnings in Gilbert are $56,794, $70,972 for men and $45,170 for women, a difference of 36.4%.
| Sex | Number | Average Earnings |
| Male | 78,970 (53.5%) | $70,972 |
| Female | 68,699 (46.5%) | $45,170 |
| Total | 147,669 (100.0%) | $56,794 |
Earnings by Sex by Income Bracket in Gilbert
The most common earnings brackets in Gilbert are $100,000+ for men (27,360 | 34.6%) and $100,000+ for women (9,751 | 14.2%).
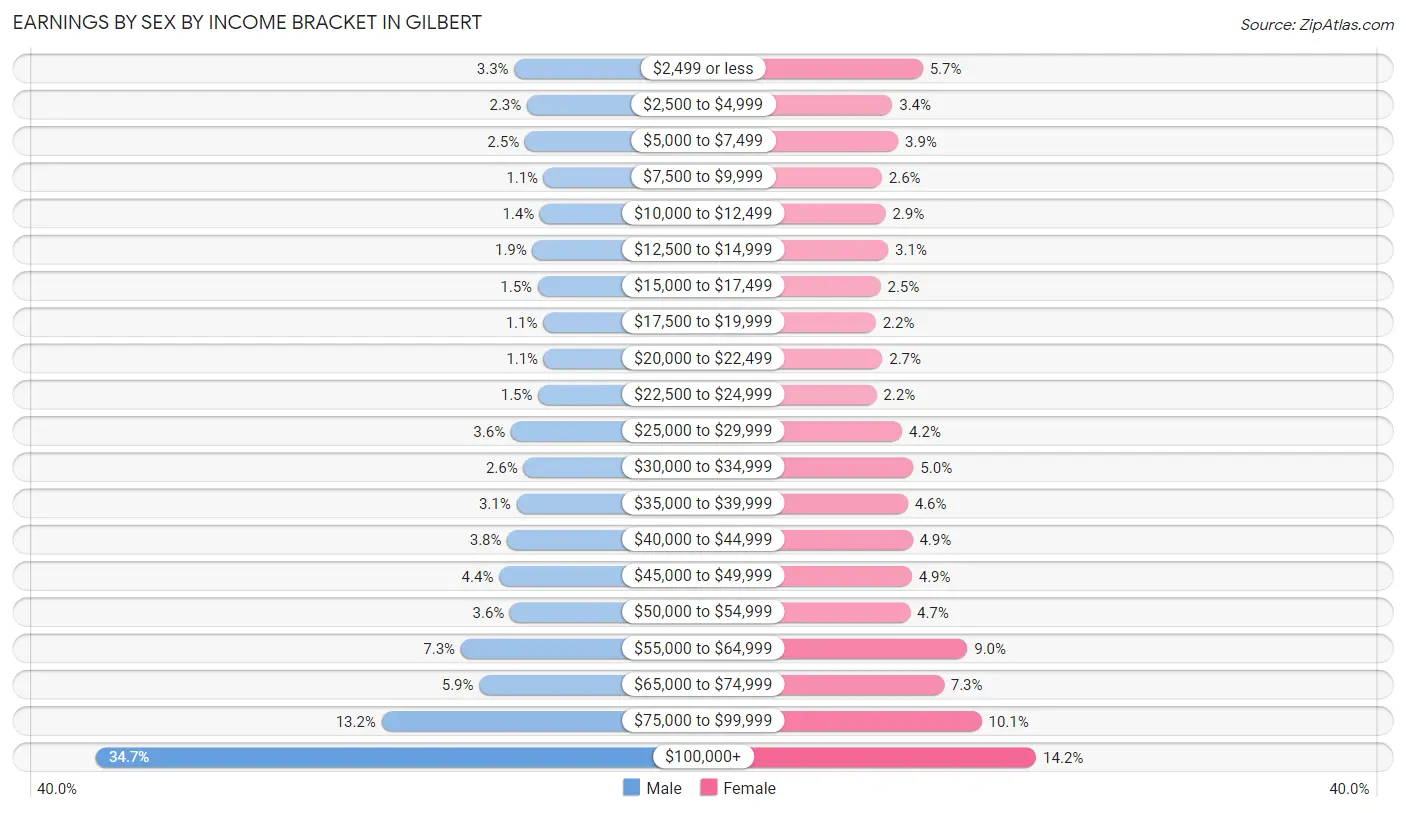
| Income | Male | Female |
| $2,499 or less | 2,597 (3.3%) | 3,912 (5.7%) |
| $2,500 to $4,999 | 1,851 (2.3%) | 2,340 (3.4%) |
| $5,000 to $7,499 | 1,978 (2.5%) | 2,646 (3.8%) |
| $7,500 to $9,999 | 850 (1.1%) | 1,805 (2.6%) |
| $10,000 to $12,499 | 1,082 (1.4%) | 1,992 (2.9%) |
| $12,500 to $14,999 | 1,523 (1.9%) | 2,131 (3.1%) |
| $15,000 to $17,499 | 1,209 (1.5%) | 1,741 (2.5%) |
| $17,500 to $19,999 | 890 (1.1%) | 1,492 (2.2%) |
| $20,000 to $22,499 | 851 (1.1%) | 1,828 (2.7%) |
| $22,500 to $24,999 | 1,183 (1.5%) | 1,524 (2.2%) |
| $25,000 to $29,999 | 2,804 (3.5%) | 2,851 (4.2%) |
| $30,000 to $34,999 | 2,059 (2.6%) | 3,425 (5.0%) |
| $35,000 to $39,999 | 2,472 (3.1%) | 3,140 (4.6%) |
| $40,000 to $44,999 | 3,018 (3.8%) | 3,378 (4.9%) |
| $45,000 to $49,999 | 3,501 (4.4%) | 3,349 (4.9%) |
| $50,000 to $54,999 | 2,847 (3.6%) | 3,259 (4.7%) |
| $55,000 to $64,999 | 5,764 (7.3%) | 6,205 (9.0%) |
| $65,000 to $74,999 | 4,672 (5.9%) | 4,994 (7.3%) |
| $75,000 to $99,999 | 10,459 (13.2%) | 6,936 (10.1%) |
| $100,000+ | 27,360 (34.6%) | 9,751 (14.2%) |
| Total | 78,970 (100.0%) | 68,699 (100.0%) |
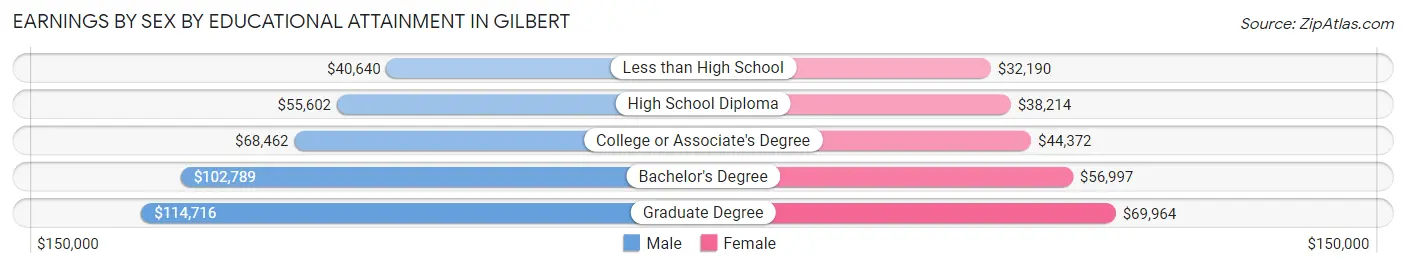
Earnings by Sex by Educational Attainment in Gilbert
Average earnings in Gilbert are $83,480 for men and $52,448 for women, a difference of 37.2%. Men with an educational attainment of graduate degree enjoy the highest average annual earnings of $114,716, while those with less than high school education earn the least with $40,640. Women with an educational attainment of graduate degree earn the most with the average annual earnings of $69,964, while those with less than high school education have the smallest earnings of $32,190.
| Educational Attainment | Male Income | Female Income |
| Less than High School | $40,640 | $32,190 |
| High School Diploma | $55,602 | $38,214 |
| College or Associate's Degree | $68,462 | $44,372 |
| Bachelor's Degree | $102,789 | $56,997 |
| Graduate Degree | $114,716 | $69,964 |
| Total | $83,480 | $52,448 |
Family Income in Gilbert
Family Income Brackets in Gilbert
According to the Gilbert family income data, there are 17,110 families falling into the $100,000 to $149,999 income range, which is the most common income bracket and makes up 24.5% of all families. Conversely, the $10,000 to $14,999 income bracket is the least frequent group with only 349 families (0.5%) belonging to this category.
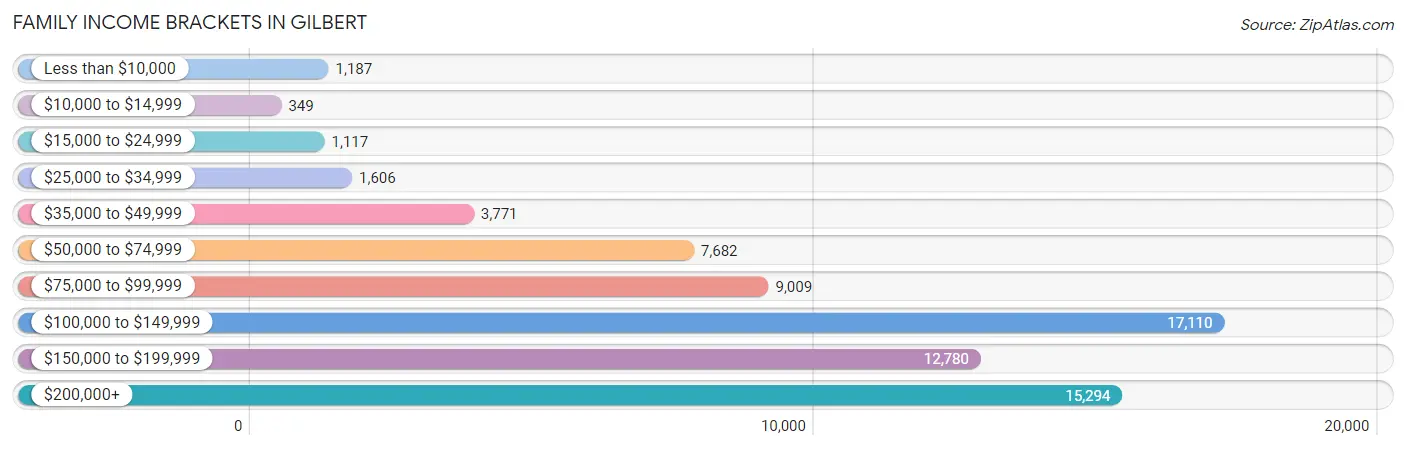
| Income Bracket | # Families | % Families |
| Less than $10,000 | 1,187 | 1.7% |
| $10,000 to $14,999 | 349 | 0.5% |
| $15,000 to $24,999 | 1,117 | 1.6% |
| $25,000 to $34,999 | 1,606 | 2.3% |
| $35,000 to $49,999 | 3,771 | 5.4% |
| $50,000 to $74,999 | 7,682 | 11.0% |
| $75,000 to $99,999 | 9,009 | 12.9% |
| $100,000 to $149,999 | 17,110 | 24.5% |
| $150,000 to $199,999 | 12,780 | 18.3% |
| $200,000+ | 15,294 | 21.9% |
Family Income by Famaliy Size in Gilbert
7+ person families (1,585 | 2.3%) account for the highest median family income in Gilbert with $181,582 per family, while 2-person families (25,891 | 37.1%) have the highest median income of $51,898 per family member.
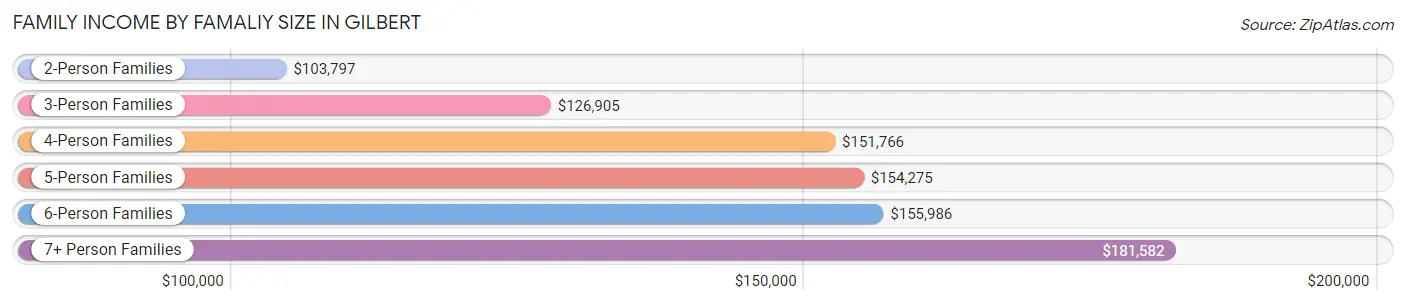
| Income Bracket | # Families | Median Income |
| 2-Person Families | 25,891 (37.1%) | $103,797 |
| 3-Person Families | 16,889 (24.2%) | $126,905 |
| 4-Person Families | 14,587 (20.9%) | $151,766 |
| 5-Person Families | 7,873 (11.3%) | $154,275 |
| 6-Person Families | 3,011 (4.3%) | $155,986 |
| 7+ Person Families | 1,585 (2.3%) | $181,582 |
| Total | 69,836 (100.0%) | $127,707 |
Family Income by Number of Earners in Gilbert
The median family income in Gilbert is $127,707, with families comprising 3+ earners (9,947) having the highest median family income of $178,261, while families with no earners (5,823) have the lowest median family income of $64,815, accounting for 14.2% and 8.3% of families, respectively.
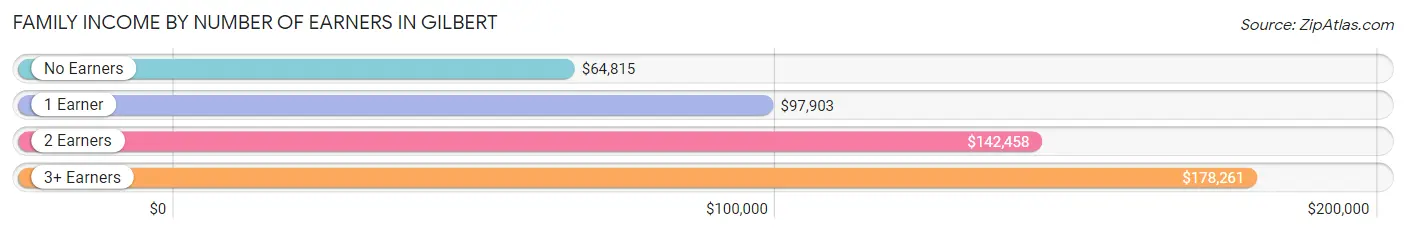
| Number of Earners | # Families | Median Income |
| No Earners | 5,823 (8.3%) | $64,815 |
| 1 Earner | 20,037 (28.7%) | $97,903 |
| 2 Earners | 34,029 (48.7%) | $142,458 |
| 3+ Earners | 9,947 (14.2%) | $178,261 |
| Total | 69,836 (100.0%) | $127,707 |
Household Income in Gilbert
Household Income Brackets in Gilbert
With 21,672 households falling in the category, the $100,000 to $149,999 income range is the most frequent in Gilbert, accounting for 24.0% of all households. In contrast, only 993 households (1.1%) fall into the $10,000 to $14,999 income bracket, making it the least populous group.
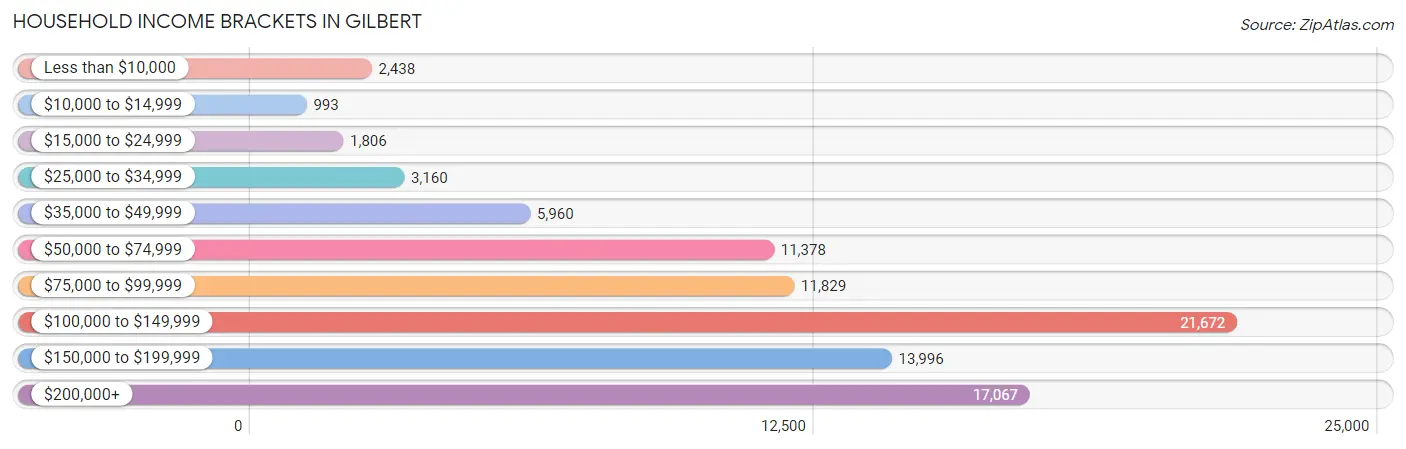
| Income Bracket | # Households | % Households |
| Less than $10,000 | 2,438 | 2.7% |
| $10,000 to $14,999 | 993 | 1.1% |
| $15,000 to $24,999 | 1,806 | 2.0% |
| $25,000 to $34,999 | 3,160 | 3.5% |
| $35,000 to $49,999 | 5,960 | 6.6% |
| $50,000 to $74,999 | 11,378 | 12.6% |
| $75,000 to $99,999 | 11,829 | 13.1% |
| $100,000 to $149,999 | 21,672 | 24.0% |
| $150,000 to $199,999 | 13,996 | 15.5% |
| $200,000+ | 17,067 | 18.9% |
Household Income by Householder Age in Gilbert
The median household income in Gilbert is $115,179, with the highest median household income of $136,089 found in the 45 to 64 years age bracket for the primary householder. A total of 37,003 households (41.0%) fall into this category. Meanwhile, the 15 to 24 years age bracket for the primary householder has the lowest median household income of $54,423, with 2,978 households (3.3%) in this group.
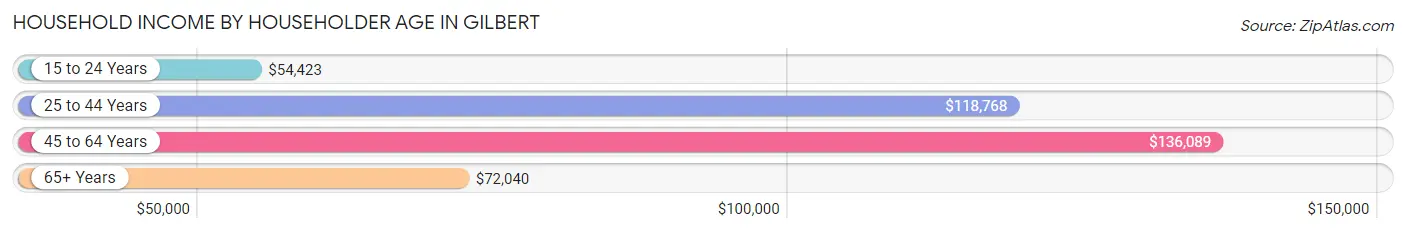
| Income Bracket | # Households | Median Income |
| 15 to 24 Years | 2,978 (3.3%) | $54,423 |
| 25 to 44 Years | 35,127 (38.9%) | $118,768 |
| 45 to 64 Years | 37,003 (41.0%) | $136,089 |
| 65+ Years | 15,191 (16.8%) | $72,040 |
| Total | 90,299 (100.0%) | $115,179 |
Poverty in Gilbert
Income Below Poverty by Sex and Age in Gilbert
With 4.8% poverty level for males and 6.2% for females among the residents of Gilbert, 18 to 24 year old males and 18 to 24 year old females are the most vulnerable to poverty, with 912 males (7.5%) and 1,036 females (10.1%) in their respective age groups living below the poverty level.
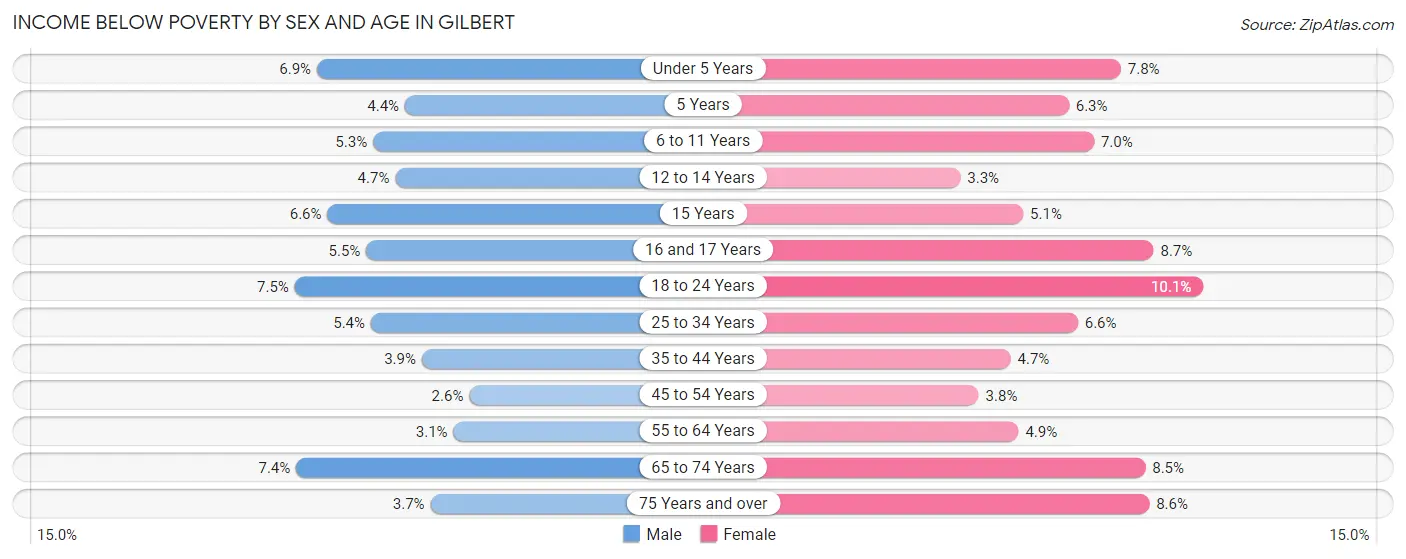
| Age Bracket | Male | Female |
| Under 5 Years | 567 (6.9%) | 709 (7.8%) |
| 5 Years | 90 (4.4%) | 131 (6.3%) |
| 6 to 11 Years | 757 (5.3%) | 909 (7.0%) |
| 12 to 14 Years | 324 (4.7%) | 225 (3.3%) |
| 15 Years | 133 (6.6%) | 129 (5.1%) |
| 16 and 17 Years | 274 (5.5%) | 425 (8.7%) |
| 18 to 24 Years | 912 (7.5%) | 1,036 (10.1%) |
| 25 to 34 Years | 821 (5.4%) | 1,025 (6.6%) |
| 35 to 44 Years | 809 (3.9%) | 1,031 (4.7%) |
| 45 to 54 Years | 509 (2.6%) | 726 (3.8%) |
| 55 to 64 Years | 424 (3.1%) | 651 (4.9%) |
| 65 to 74 Years | 566 (7.4%) | 791 (8.5%) |
| 75 Years and over | 157 (3.7%) | 516 (8.6%) |
| Total | 6,343 (4.8%) | 8,304 (6.2%) |
Income Above Poverty by Sex and Age in Gilbert
According to the poverty statistics in Gilbert, males aged 45 to 54 years and females aged 12 to 14 years are the age groups that are most secure financially, with 97.4% of males and 96.7% of females in these age groups living above the poverty line.
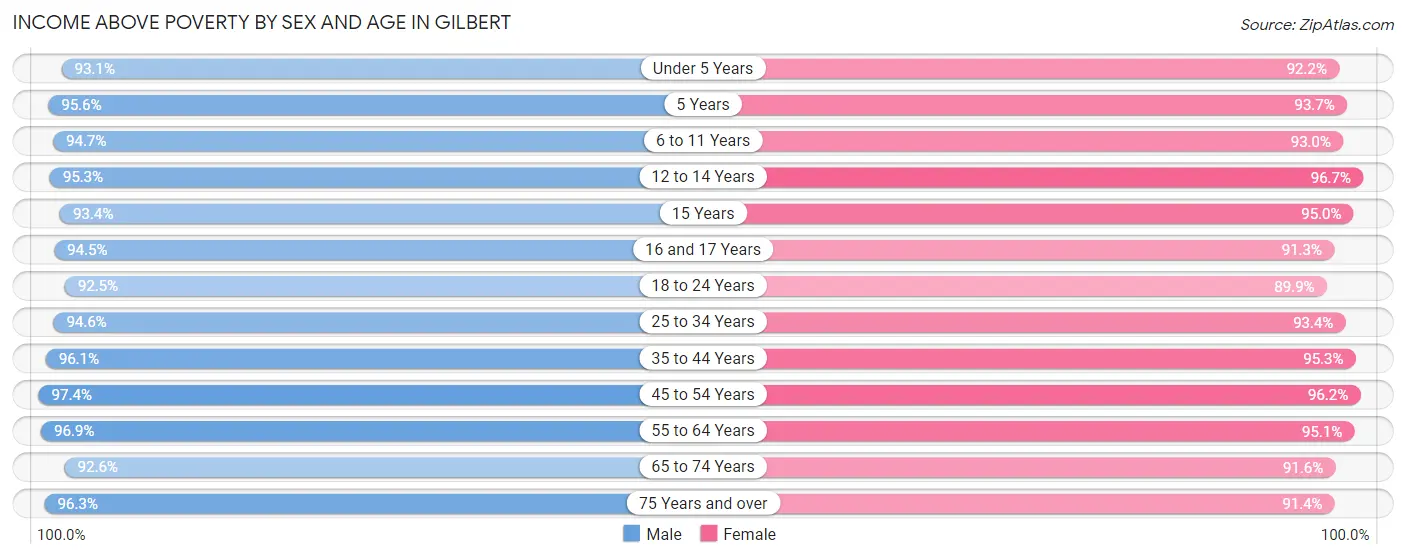
| Age Bracket | Male | Female |
| Under 5 Years | 7,699 (93.1%) | 8,410 (92.2%) |
| 5 Years | 1,949 (95.6%) | 1,942 (93.7%) |
| 6 to 11 Years | 13,528 (94.7%) | 12,044 (93.0%) |
| 12 to 14 Years | 6,602 (95.3%) | 6,591 (96.7%) |
| 15 Years | 1,892 (93.4%) | 2,425 (95.0%) |
| 16 and 17 Years | 4,716 (94.5%) | 4,473 (91.3%) |
| 18 to 24 Years | 11,287 (92.5%) | 9,264 (89.9%) |
| 25 to 34 Years | 14,486 (94.6%) | 14,588 (93.4%) |
| 35 to 44 Years | 19,716 (96.1%) | 20,896 (95.3%) |
| 45 to 54 Years | 18,908 (97.4%) | 18,351 (96.2%) |
| 55 to 64 Years | 13,410 (96.9%) | 12,573 (95.1%) |
| 65 to 74 Years | 7,037 (92.6%) | 8,567 (91.5%) |
| 75 Years and over | 4,084 (96.3%) | 5,509 (91.4%) |
| Total | 125,314 (95.2%) | 125,633 (93.8%) |
Income Below Poverty Among Married-Couple Families in Gilbert
The poverty statistics for married-couple families in Gilbert show that 2.7% or 1,496 of the total 55,458 families live below the poverty line. Families with 5 or more children have the highest poverty rate of 11.1%, comprising of 105 families. On the other hand, families with 1 or 2 children have the lowest poverty rate of 2.1%, which includes 454 families.
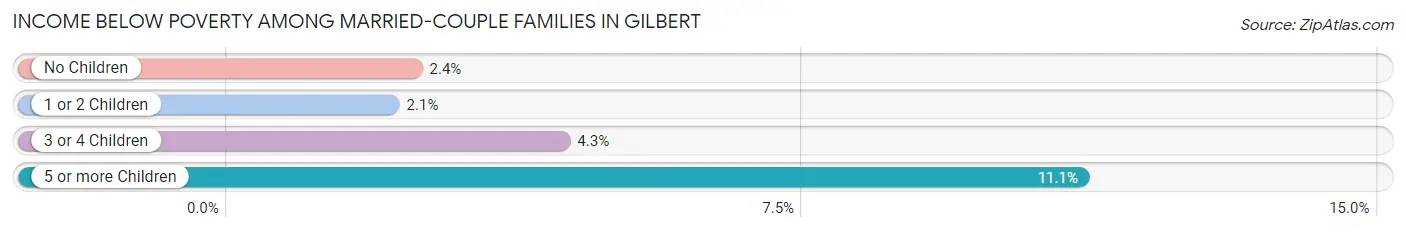
| Children | Above Poverty | Below Poverty |
| No Children | 25,060 (97.6%) | 618 (2.4%) |
| 1 or 2 Children | 21,029 (97.9%) | 454 (2.1%) |
| 3 or 4 Children | 7,034 (95.7%) | 319 (4.3%) |
| 5 or more Children | 839 (88.9%) | 105 (11.1%) |
| Total | 53,962 (97.3%) | 1,496 (2.7%) |
Income Below Poverty Among Single-Parent Households in Gilbert
According to the poverty data in Gilbert, 4.9% or 250 single-father households and 9.9% or 913 single-mother households are living below the poverty line. Among single-father households, those with 3 or 4 children have the highest poverty rate, with 39 households (10.6%) experiencing poverty. Likewise, among single-mother households, those with 5 or more children have the highest poverty rate, with 65 households (48.9%) falling below the poverty line.
| Children | Single Father | Single Mother |
| No Children | 49 (2.9%) | 92 (3.0%) |
| 1 or 2 Children | 162 (5.4%) | 655 (11.7%) |
| 3 or 4 Children | 39 (10.6%) | 101 (19.8%) |
| 5 or more Children | 0 (0.0%) | 65 (48.9%) |
| Total | 250 (4.9%) | 913 (9.9%) |
Income Below Poverty Among Married-Couple vs Single-Parent Households in Gilbert
The poverty data for Gilbert shows that 1,496 of the married-couple family households (2.7%) and 1,163 of the single-parent households (8.1%) are living below the poverty level. Within the married-couple family households, those with 5 or more children have the highest poverty rate, with 105 households (11.1%) falling below the poverty line. Among the single-parent households, those with 5 or more children have the highest poverty rate, with 65 household (34.2%) living below poverty.
| Children | Married-Couple Families | Single-Parent Households |
| No Children | 618 (2.4%) | 141 (3.0%) |
| 1 or 2 Children | 454 (2.1%) | 817 (9.6%) |
| 3 or 4 Children | 319 (4.3%) | 140 (15.9%) |
| 5 or more Children | 105 (11.1%) | 65 (34.2%) |
| Total | 1,496 (2.7%) | 1,163 (8.1%) |
Race in Gilbert
The most populous races in Gilbert are White / Caucasian (202,000 | 75.6%), Hispanic or Latino (46,916 | 17.5%), and Two or more Races (26,698 | 10.0%).
| Race | # Population | % Population |
| Asian | 16,291 | 6.1% |
| Black / African American | 10,847 | 4.1% |
| Hawaiian / Pacific | 164 | 0.1% |
| Hispanic or Latino | 46,916 | 17.5% |
| Native / Alaskan | 2,031 | 0.8% |
| White / Caucasian | 202,000 | 75.6% |
| Two or more Races | 26,698 | 10.0% |
| Some other Race | 9,236 | 3.5% |
| Total | 267,267 | 100.0% |
Ancestry in Gilbert
The most populous ancestries reported in Gilbert are German (41,515 | 15.5%), Mexican (36,436 | 13.6%), English (35,775 | 13.4%), Irish (25,634 | 9.6%), and Italian (15,662 | 5.9%), together accounting for 58.0% of all Gilbert residents.
| Ancestry | # Population | % Population |
| African | 1,141 | 0.4% |
| Albanian | 205 | 0.1% |
| Aleut | 64 | 0.0% |
| American | 13,748 | 5.1% |
| Apache | 440 | 0.2% |
| Arab | 1,548 | 0.6% |
| Argentinean | 208 | 0.1% |
| Armenian | 250 | 0.1% |
| Assyrian / Chaldean / Syriac | 274 | 0.1% |
| Australian | 201 | 0.1% |
| Austrian | 589 | 0.2% |
| Bahamian | 6 | 0.0% |
| Bangladeshi | 86 | 0.0% |
| Barbadian | 11 | 0.0% |
| Basque | 98 | 0.0% |
| Belgian | 321 | 0.1% |
| Belizean | 24 | 0.0% |
| Bhutanese | 2,565 | 1.0% |
| Blackfeet | 118 | 0.0% |
| Brazilian | 248 | 0.1% |
| British | 2,540 | 0.9% |
| Bulgarian | 221 | 0.1% |
| Burmese | 1,643 | 0.6% |
| Cajun | 11 | 0.0% |
| Canadian | 1,116 | 0.4% |
| Cape Verdean | 7 | 0.0% |
| Celtic | 6 | 0.0% |
| Central American | 2,121 | 0.8% |
| Central American Indian | 242 | 0.1% |
| Cherokee | 765 | 0.3% |
| Chickasaw | 14 | 0.0% |
| Chilean | 80 | 0.0% |
| Chippewa | 104 | 0.0% |
| Choctaw | 374 | 0.1% |
| Colombian | 728 | 0.3% |
| Costa Rican | 148 | 0.1% |
| Cree | 13 | 0.0% |
| Creek | 46 | 0.0% |
| Croatian | 401 | 0.2% |
| Cuban | 715 | 0.3% |
| Czech | 1,294 | 0.5% |
| Czechoslovakian | 290 | 0.1% |
| Danish | 3,030 | 1.1% |
| Delaware | 2 | 0.0% |
| Dominican | 51 | 0.0% |
| Dutch | 3,956 | 1.5% |
| Eastern European | 731 | 0.3% |
| Ecuadorian | 284 | 0.1% |
| Egyptian | 252 | 0.1% |
| English | 35,775 | 13.4% |
| Estonian | 56 | 0.0% |
| Ethiopian | 67 | 0.0% |
| European | 7,575 | 2.8% |
| Fijian | 8 | 0.0% |
| Filipino | 308 | 0.1% |
| Finnish | 449 | 0.2% |
| French | 5,493 | 2.1% |
| French American Indian | 88 | 0.0% |
| French Canadian | 1,007 | 0.4% |
| German | 41,515 | 15.5% |
| German Russian | 10 | 0.0% |
| Ghanaian | 120 | 0.0% |
| Greek | 1,181 | 0.4% |
| Guamanian / Chamorro | 298 | 0.1% |
| Guatemalan | 600 | 0.2% |
| Haitian | 258 | 0.1% |
| Honduran | 306 | 0.1% |
| Hopi | 24 | 0.0% |
| Hungarian | 850 | 0.3% |
| Icelander | 40 | 0.0% |
| Indian (Asian) | 4,831 | 1.8% |
| Indonesian | 104 | 0.0% |
| Iranian | 545 | 0.2% |
| Iraqi | 193 | 0.1% |
| Irish | 25,634 | 9.6% |
| Iroquois | 51 | 0.0% |
| Israeli | 75 | 0.0% |
| Italian | 15,662 | 5.9% |
| Jamaican | 88 | 0.0% |
| Japanese | 487 | 0.2% |
| Kenyan | 66 | 0.0% |
| Korean | 5,879 | 2.2% |
| Laotian | 348 | 0.1% |
| Latvian | 91 | 0.0% |
| Lebanese | 819 | 0.3% |
| Liberian | 121 | 0.1% |
| Lithuanian | 313 | 0.1% |
| Luxembourger | 16 | 0.0% |
| Macedonian | 20 | 0.0% |
| Malaysian | 15 | 0.0% |
| Maltese | 36 | 0.0% |
| Menominee | 21 | 0.0% |
| Mexican | 36,436 | 13.6% |
| Mexican American Indian | 584 | 0.2% |
| Moroccan | 22 | 0.0% |
| Native Hawaiian | 354 | 0.1% |
| Navajo | 1,014 | 0.4% |
| New Zealander | 35 | 0.0% |
| Nicaraguan | 208 | 0.1% |
| Nigerian | 229 | 0.1% |
| Northern European | 547 | 0.2% |
| Norwegian | 6,017 | 2.2% |
| Osage | 24 | 0.0% |
| Ottawa | 13 | 0.0% |
| Pakistani | 281 | 0.1% |
| Palestinian | 84 | 0.0% |
| Panamanian | 135 | 0.1% |
| Pennsylvania German | 54 | 0.0% |
| Peruvian | 224 | 0.1% |
| Pima | 103 | 0.0% |
| Polish | 7,735 | 2.9% |
| Portuguese | 1,039 | 0.4% |
| Potawatomi | 44 | 0.0% |
| Pueblo | 16 | 0.0% |
| Puerto Rican | 2,032 | 0.8% |
| Puget Sound Salish | 130 | 0.1% |
| Romanian | 342 | 0.1% |
| Russian | 1,995 | 0.7% |
| Salvadoran | 567 | 0.2% |
| Samoan | 142 | 0.1% |
| Scandinavian | 1,447 | 0.5% |
| Scotch-Irish | 1,833 | 0.7% |
| Scottish | 4,994 | 1.9% |
| Serbian | 416 | 0.2% |
| Sioux | 91 | 0.0% |
| Slavic | 234 | 0.1% |
| Slovak | 461 | 0.2% |
| Slovene | 78 | 0.0% |
| South African | 71 | 0.0% |
| South American | 1,877 | 0.7% |
| Spaniard | 1,392 | 0.5% |
| Spanish | 1,108 | 0.4% |
| Spanish American | 67 | 0.0% |
| Sri Lankan | 3,168 | 1.2% |
| Subsaharan African | 2,229 | 0.8% |
| Sudanese | 340 | 0.1% |
| Swedish | 5,649 | 2.1% |
| Swiss | 2,109 | 0.8% |
| Syrian | 47 | 0.0% |
| Thai | 3,404 | 1.3% |
| Tohono O'Odham | 152 | 0.1% |
| Tongan | 41 | 0.0% |
| Trinidadian and Tobagonian | 26 | 0.0% |
| Turkish | 262 | 0.1% |
| Ukrainian | 691 | 0.3% |
| Uruguayan | 44 | 0.0% |
| Ute | 42 | 0.0% |
| Venezuelan | 309 | 0.1% |
| Vietnamese | 89 | 0.0% |
| Welsh | 1,863 | 0.7% |
| Yaqui | 65 | 0.0% |
| Yugoslavian | 196 | 0.1% |
| Yuman | 38 | 0.0% |
| Yup'ik | 36 | 0.0% | View All 154 Rows |
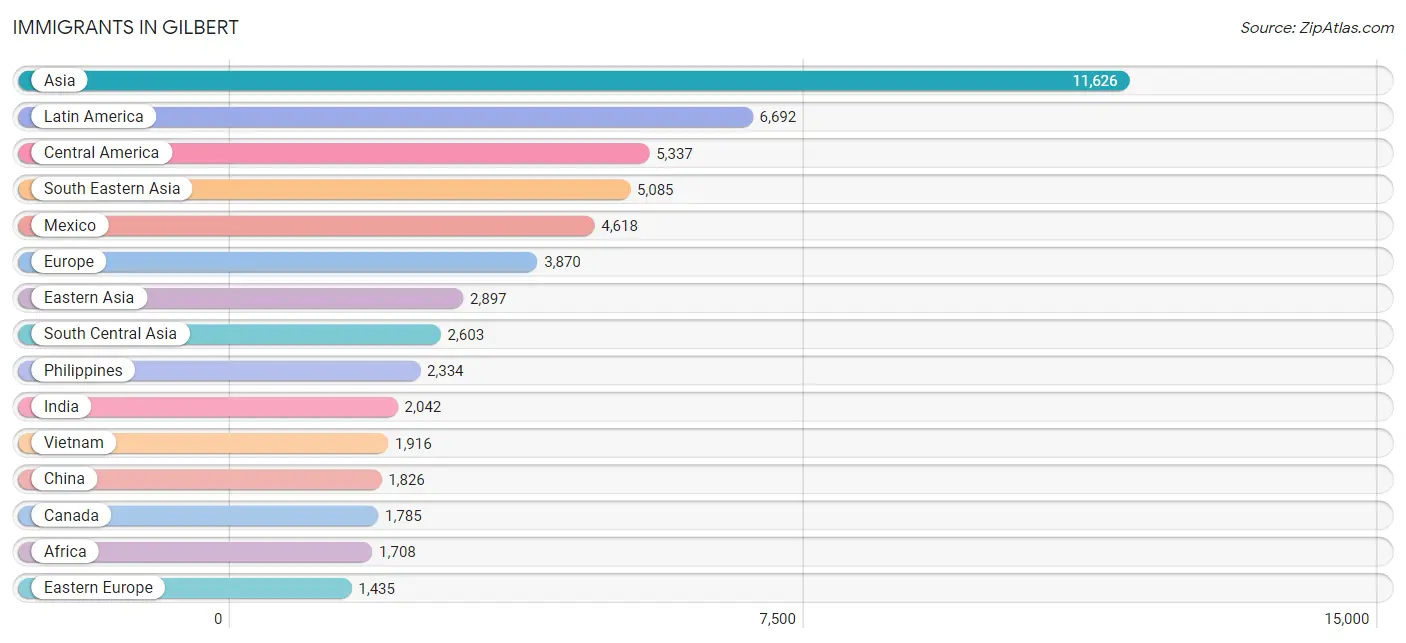
Immigrants in Gilbert
The most numerous immigrant groups reported in Gilbert came from Asia (11,626 | 4.3%), Latin America (6,692 | 2.5%), Central America (5,337 | 2.0%), South Eastern Asia (5,085 | 1.9%), and Mexico (4,618 | 1.7%), together accounting for 12.5% of all Gilbert residents.
| Immigration Origin | # Population | % Population |
| Africa | 1,708 | 0.6% |
| Albania | 9 | 0.0% |
| Argentina | 88 | 0.0% |
| Armenia | 10 | 0.0% |
| Asia | 11,626 | 4.3% |
| Australia | 199 | 0.1% |
| Austria | 12 | 0.0% |
| Bangladesh | 60 | 0.0% |
| Belarus | 66 | 0.0% |
| Belgium | 23 | 0.0% |
| Belize | 8 | 0.0% |
| Bosnia and Herzegovina | 104 | 0.0% |
| Brazil | 220 | 0.1% |
| Bulgaria | 64 | 0.0% |
| Cambodia | 87 | 0.0% |
| Cameroon | 44 | 0.0% |
| Canada | 1,785 | 0.7% |
| Caribbean | 364 | 0.1% |
| Central America | 5,337 | 2.0% |
| Chile | 14 | 0.0% |
| China | 1,826 | 0.7% |
| Colombia | 239 | 0.1% |
| Congo | 19 | 0.0% |
| Costa Rica | 6 | 0.0% |
| Cuba | 28 | 0.0% |
| Czechoslovakia | 154 | 0.1% |
| Denmark | 61 | 0.0% |
| Eastern Africa | 317 | 0.1% |
| Eastern Asia | 2,897 | 1.1% |
| Eastern Europe | 1,435 | 0.5% |
| Ecuador | 171 | 0.1% |
| Egypt | 193 | 0.1% |
| El Salvador | 187 | 0.1% |
| England | 675 | 0.3% |
| Eritrea | 11 | 0.0% |
| Ethiopia | 89 | 0.0% |
| Europe | 3,870 | 1.5% |
| France | 177 | 0.1% |
| Germany | 477 | 0.2% |
| Ghana | 41 | 0.0% |
| Greece | 182 | 0.1% |
| Guatemala | 175 | 0.1% |
| Guyana | 35 | 0.0% |
| Haiti | 297 | 0.1% |
| Honduras | 56 | 0.0% |
| Hong Kong | 112 | 0.0% |
| Hungary | 38 | 0.0% |
| India | 2,042 | 0.8% |
| Indonesia | 169 | 0.1% |
| Iran | 260 | 0.1% |
| Iraq | 363 | 0.1% |
| Ireland | 69 | 0.0% |
| Israel | 124 | 0.1% |
| Italy | 171 | 0.1% |
| Jamaica | 39 | 0.0% |
| Japan | 536 | 0.2% |
| Jordan | 12 | 0.0% |
| Kazakhstan | 15 | 0.0% |
| Kenya | 179 | 0.1% |
| Korea | 535 | 0.2% |
| Kuwait | 25 | 0.0% |
| Latin America | 6,692 | 2.5% |
| Lebanon | 289 | 0.1% |
| Liberia | 45 | 0.0% |
| Lithuania | 5 | 0.0% |
| Malaysia | 164 | 0.1% |
| Mexico | 4,618 | 1.7% |
| Middle Africa | 96 | 0.0% |
| Moldova | 27 | 0.0% |
| Morocco | 41 | 0.0% |
| Nepal | 15 | 0.0% |
| Netherlands | 198 | 0.1% |
| Nicaragua | 226 | 0.1% |
| Nigeria | 86 | 0.0% |
| Northern Africa | 424 | 0.2% |
| Northern Europe | 1,138 | 0.4% |
| Oceania | 260 | 0.1% |
| Pakistan | 102 | 0.0% |
| Panama | 61 | 0.0% |
| Peru | 122 | 0.1% |
| Philippines | 2,334 | 0.9% |
| Poland | 193 | 0.1% |
| Romania | 123 | 0.1% |
| Russia | 264 | 0.1% |
| Saudi Arabia | 6 | 0.0% |
| Scotland | 36 | 0.0% |
| Serbia | 17 | 0.0% |
| Singapore | 36 | 0.0% |
| South Africa | 234 | 0.1% |
| South America | 991 | 0.4% |
| South Central Asia | 2,603 | 1.0% |
| South Eastern Asia | 5,085 | 1.9% |
| Southern Europe | 377 | 0.1% |
| Spain | 24 | 0.0% |
| Sri Lanka | 103 | 0.0% |
| Sudan | 185 | 0.1% |
| Sweden | 8 | 0.0% |
| Switzerland | 19 | 0.0% |
| Syria | 2 | 0.0% |
| Taiwan | 222 | 0.1% |
| Thailand | 345 | 0.1% |
| Turkey | 148 | 0.1% |
| Ukraine | 92 | 0.0% |
| Uruguay | 44 | 0.0% |
| Uzbekistan | 6 | 0.0% |
| Venezuela | 58 | 0.0% |
| Vietnam | 1,916 | 0.7% |
| Western Africa | 172 | 0.1% |
| Western Asia | 1,032 | 0.4% |
| Western Europe | 906 | 0.3% |
| Zaire | 33 | 0.0% | View All 111 Rows |
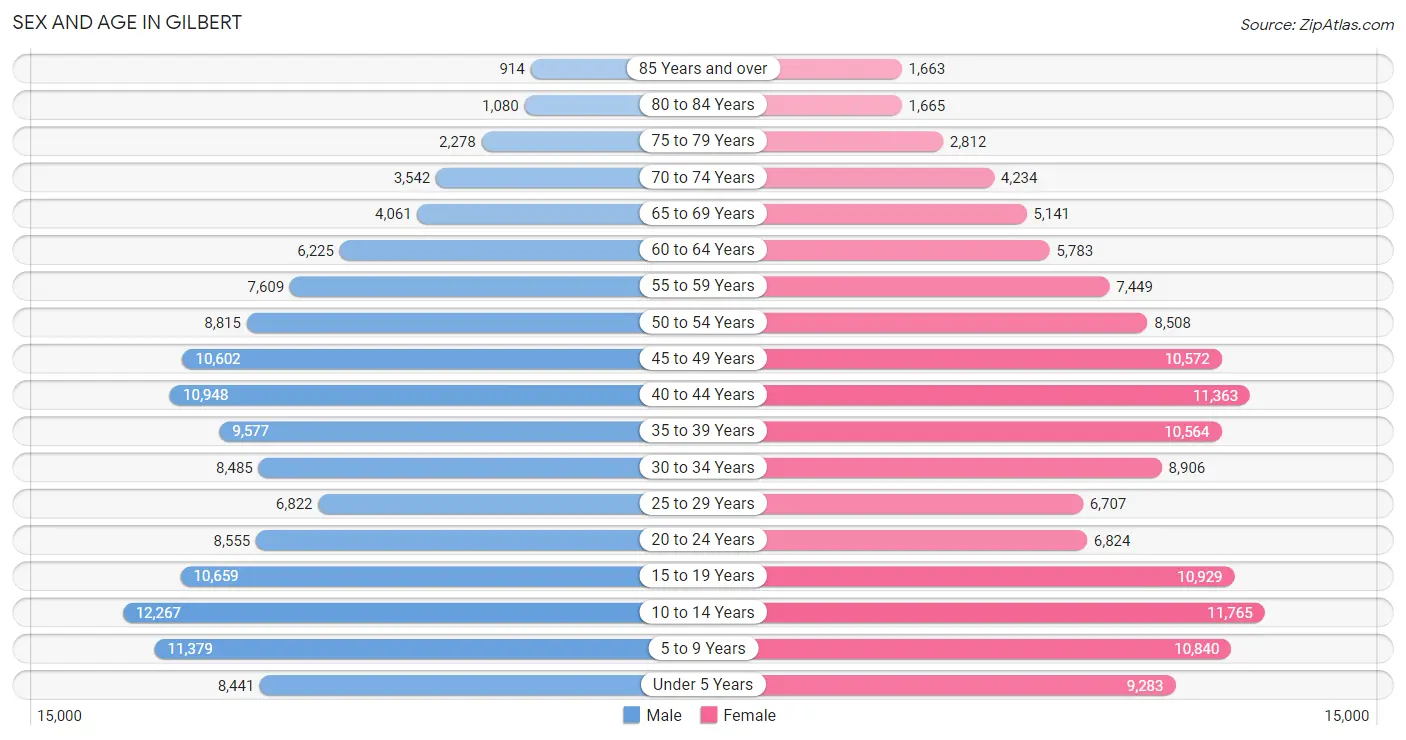
Sex and Age in Gilbert
Sex and Age in Gilbert
The most populous age groups in Gilbert are 10 to 14 Years (12,267 | 9.3%) for men and 10 to 14 Years (11,765 | 8.7%) for women.
| Age Bracket | Male | Female |
| Under 5 Years | 8,441 (6.4%) | 9,283 (6.9%) |
| 5 to 9 Years | 11,379 (8.6%) | 10,840 (8.0%) |
| 10 to 14 Years | 12,267 (9.3%) | 11,765 (8.7%) |
| 15 to 19 Years | 10,659 (8.1%) | 10,929 (8.1%) |
| 20 to 24 Years | 8,555 (6.5%) | 6,824 (5.1%) |
| 25 to 29 Years | 6,822 (5.2%) | 6,707 (5.0%) |
| 30 to 34 Years | 8,485 (6.4%) | 8,906 (6.6%) |
| 35 to 39 Years | 9,577 (7.2%) | 10,564 (7.8%) |
| 40 to 44 Years | 10,948 (8.3%) | 11,363 (8.4%) |
| 45 to 49 Years | 10,602 (8.0%) | 10,572 (7.8%) |
| 50 to 54 Years | 8,815 (6.7%) | 8,508 (6.3%) |
| 55 to 59 Years | 7,609 (5.8%) | 7,449 (5.5%) |
| 60 to 64 Years | 6,225 (4.7%) | 5,783 (4.3%) |
| 65 to 69 Years | 4,061 (3.1%) | 5,141 (3.8%) |
| 70 to 74 Years | 3,542 (2.7%) | 4,234 (3.1%) |
| 75 to 79 Years | 2,278 (1.7%) | 2,812 (2.1%) |
| 80 to 84 Years | 1,080 (0.8%) | 1,665 (1.2%) |
| 85 Years and over | 914 (0.7%) | 1,663 (1.2%) |
| Total | 132,259 (100.0%) | 135,008 (100.0%) |
Families and Households in Gilbert
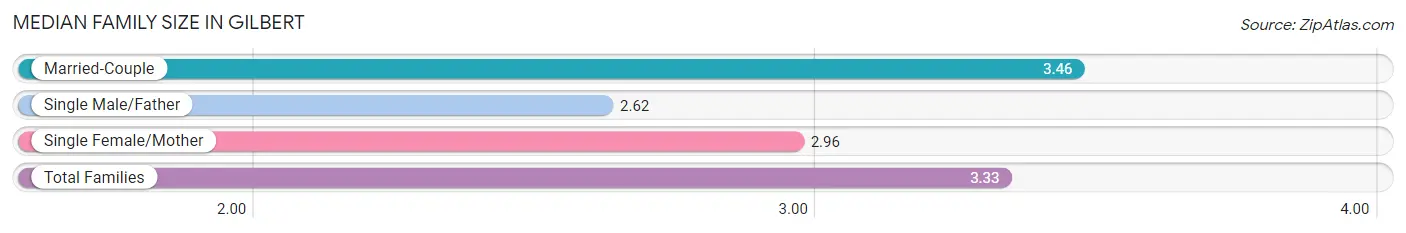
Median Family Size in Gilbert
The median family size in Gilbert is 3.33 persons per family, with married-couple families (55,458 | 79.4%) accounting for the largest median family size of 3.46 persons per family. On the other hand, single male/father families (5,105 | 7.3%) represent the smallest median family size with 2.62 persons per family.
| Family Type | # Families | Family Size |
| Married-Couple | 55,458 (79.4%) | 3.46 |
| Single Male/Father | 5,105 (7.3%) | 2.62 |
| Single Female/Mother | 9,273 (13.3%) | 2.96 |
| Total Families | 69,836 (100.0%) | 3.33 |
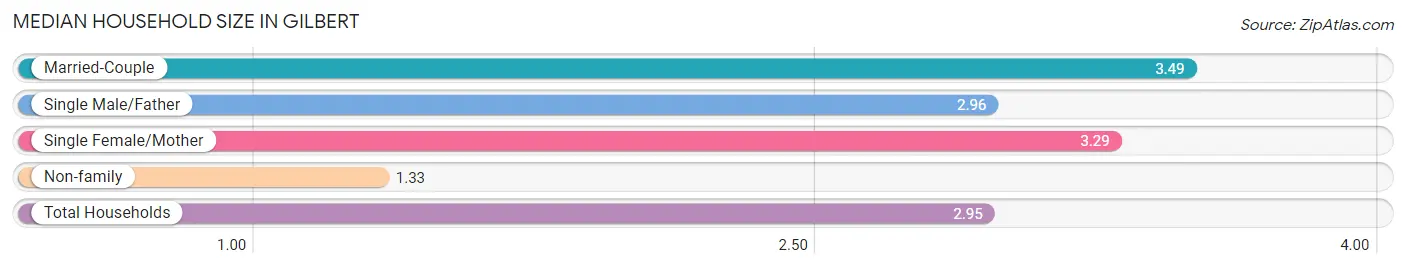
Median Household Size in Gilbert
The median household size in Gilbert is 2.95 persons per household, with married-couple households (55,458 | 61.4%) accounting for the largest median household size of 3.49 persons per household. non-family households (20,463 | 22.7%) represent the smallest median household size with 1.33 persons per household.
| Household Type | # Households | Household Size |
| Married-Couple | 55,458 (61.4%) | 3.49 |
| Single Male/Father | 5,105 (5.7%) | 2.96 |
| Single Female/Mother | 9,273 (10.3%) | 3.29 |
| Non-family | 20,463 (22.7%) | 1.33 |
| Total Households | 90,299 (100.0%) | 2.95 |
Household Size by Marriage Status in Gilbert
Out of a total of 90,299 households in Gilbert, 69,836 (77.3%) are family households, while 20,463 (22.7%) are nonfamily households. The most numerous type of family households are 2-person households, comprising 23,510, and the most common type of nonfamily households are 1-person households, comprising 15,434.
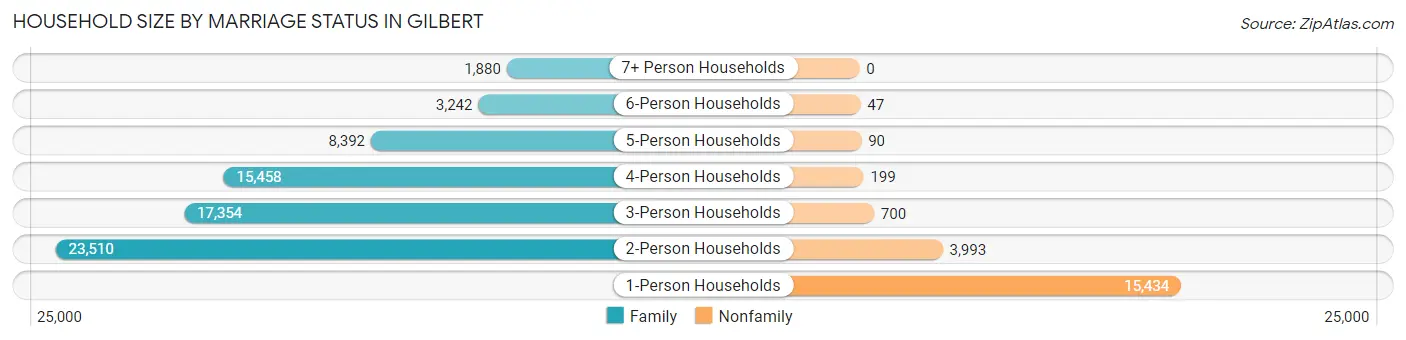
| Household Size | Family Households | Nonfamily Households |
| 1-Person Households | - | 15,434 (17.1%) |
| 2-Person Households | 23,510 (26.0%) | 3,993 (4.4%) |
| 3-Person Households | 17,354 (19.2%) | 700 (0.8%) |
| 4-Person Households | 15,458 (17.1%) | 199 (0.2%) |
| 5-Person Households | 8,392 (9.3%) | 90 (0.1%) |
| 6-Person Households | 3,242 (3.6%) | 47 (0.1%) |
| 7+ Person Households | 1,880 (2.1%) | 0 (0.0%) |
| Total | 69,836 (77.3%) | 20,463 (22.7%) |
Female Fertility in Gilbert
Fertility by Age in Gilbert
Average fertility rate in Gilbert is 53.0 births per 1,000 women. Women in the age bracket of 20 to 34 years have the highest fertility rate with 119.0 births per 1,000 women. Women in the age bracket of 20 to 34 years acount for 74.4% of all women with births.
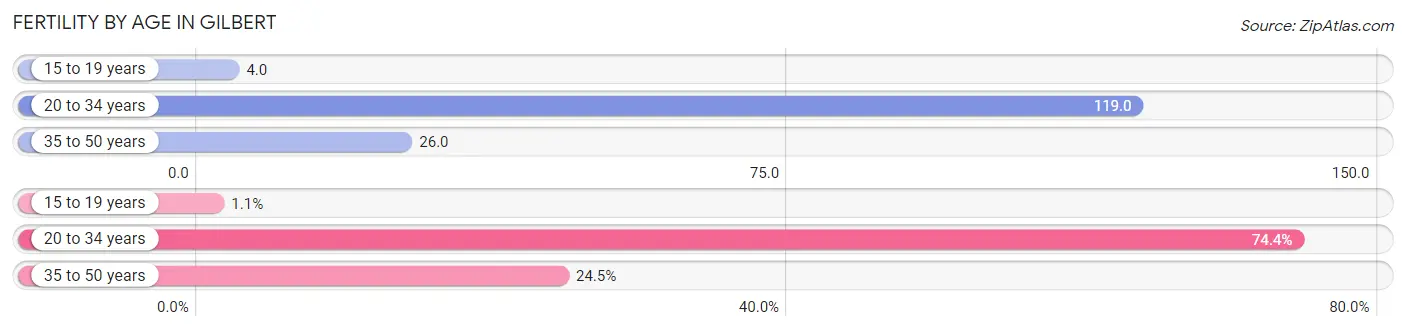
| Age Bracket | Women with Births | Births / 1,000 Women |
| 15 to 19 years | 40 (1.1%) | 4.0 |
| 20 to 34 years | 2,669 (74.4%) | 119.0 |
| 35 to 50 years | 879 (24.5%) | 26.0 |
| Total | 3,588 (100.0%) | 53.0 |
Fertility by Age by Marriage Status in Gilbert
86.4% of women with births (3,588) in Gilbert are married. The highest percentage of unmarried women with births falls into 15 to 19 years age bracket with 100.0% of them unmarried at the time of birth, while the lowest percentage of unmarried women with births belong to 20 to 34 years age bracket with 12.2% of them unmarried.
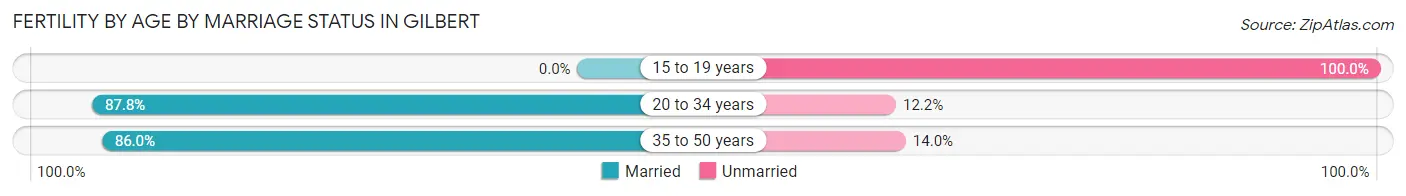
| Age Bracket | Married | Unmarried |
| 15 to 19 years | 0 (0.0%) | 40 (100.0%) |
| 20 to 34 years | 2,343 (87.8%) | 326 (12.2%) |
| 35 to 50 years | 756 (86.0%) | 123 (14.0%) |
| Total | 3,100 (86.4%) | 488 (13.6%) |
Fertility by Education in Gilbert
Average fertility rate in Gilbert is 53.0 births per 1,000 women. Women with the education attainment of bachelor's degree have the highest fertility rate of 73.0 births per 1,000 women, while women with the education attainment of less than high school have the lowest fertility at 6.0 births per 1,000 women. Women with the education attainment of bachelor's degree represent 39.0% of all women with births.
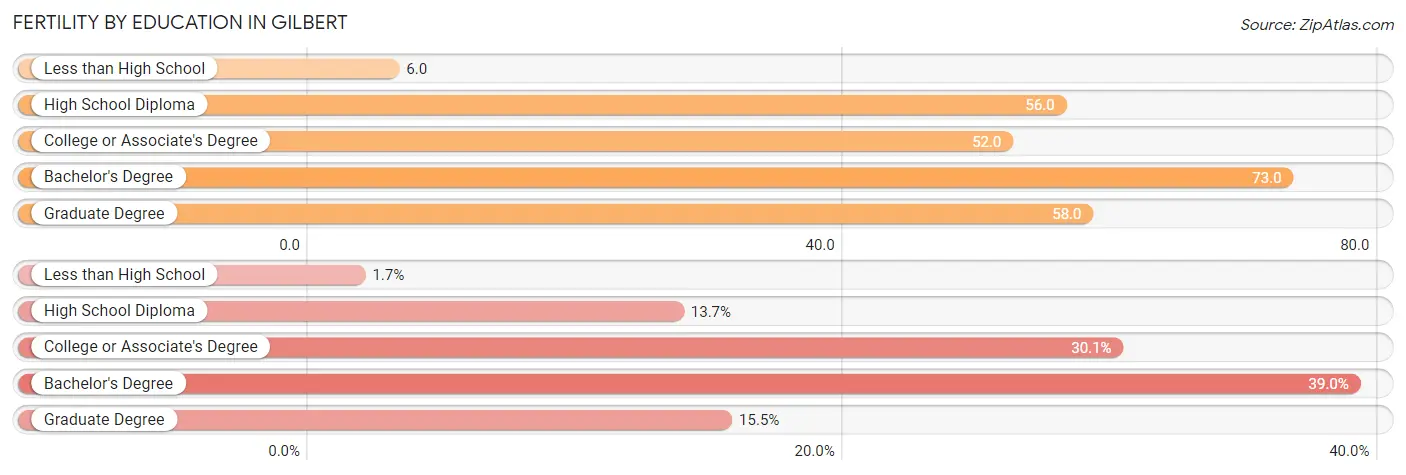
| Educational Attainment | Women with Births | Births / 1,000 Women |
| Less than High School | 62 (1.7%) | 6.0 |
| High School Diploma | 490 (13.7%) | 56.0 |
| College or Associate's Degree | 1,081 (30.1%) | 52.0 |
| Bachelor's Degree | 1,400 (39.0%) | 73.0 |
| Graduate Degree | 555 (15.5%) | 58.0 |
| Total | 3,588 (100.0%) | 53.0 |
Fertility by Education by Marriage Status in Gilbert
13.6% of women with births in Gilbert are unmarried. Women with the educational attainment of bachelor's degree are most likely to be married with 92.6% of them married at childbirth, while women with the educational attainment of less than high school are least likely to be married with 66.1% of them unmarried at childbirth.
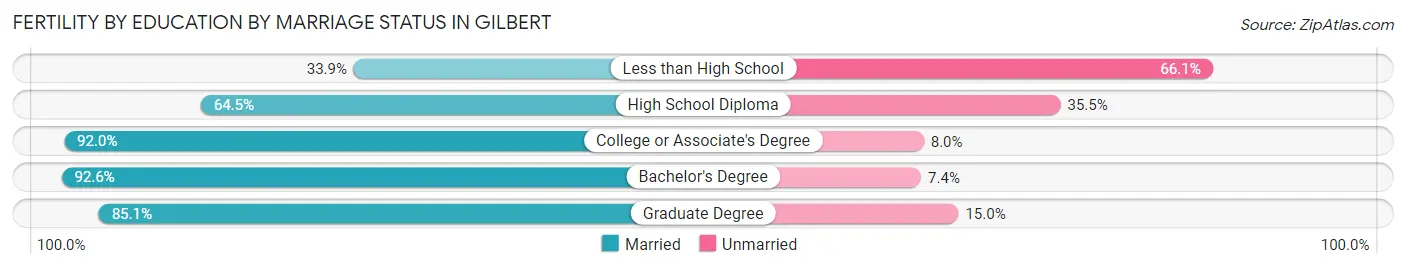
| Educational Attainment | Married | Unmarried |
| Less than High School | 21 (33.9%) | 41 (66.1%) |
| High School Diploma | 316 (64.5%) | 174 (35.5%) |
| College or Associate's Degree | 995 (92.0%) | 86 (8.0%) |
| Bachelor's Degree | 1,296 (92.6%) | 104 (7.4%) |
| Graduate Degree | 472 (85.1%) | 83 (14.9%) |
| Total | 3,100 (86.4%) | 488 (13.6%) |
Employment Characteristics in Gilbert
Employment by Class of Employer in Gilbert
Among the 136,387 employed individuals in Gilbert, private company employees (97,211 | 71.3%), local government employees (9,676 | 7.1%), and not-for-profit organizations (9,206 | 6.8%) make up the most common classes of employment.
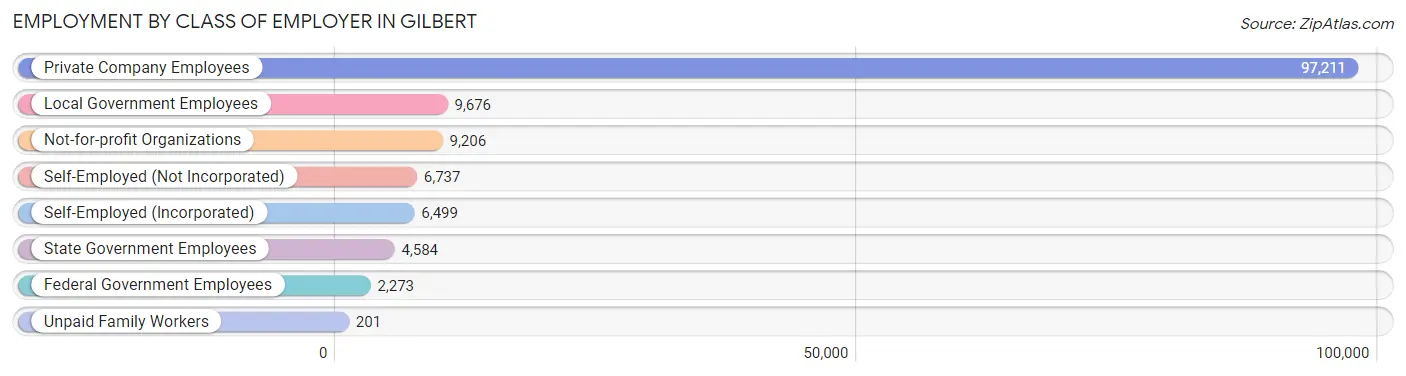
| Employer Class | # Employees | % Employees |
| Private Company Employees | 97,211 | 71.3% |
| Self-Employed (Incorporated) | 6,499 | 4.8% |
| Self-Employed (Not Incorporated) | 6,737 | 4.9% |
| Not-for-profit Organizations | 9,206 | 6.8% |
| Local Government Employees | 9,676 | 7.1% |
| State Government Employees | 4,584 | 3.4% |
| Federal Government Employees | 2,273 | 1.7% |
| Unpaid Family Workers | 201 | 0.2% |
| Total | 136,387 | 100.0% |
Employment Status by Age in Gilbert
According to the labor force statistics for Gilbert, out of the total population over 16 years of age (198,713), 72.0% or 143,073 individuals are in the labor force, with 3.5% or 5,008 of them unemployed. The age group with the highest labor force participation rate is 45 to 54 years, with 88.4% or 34,031 individuals in the labor force. Within the labor force, the 16 to 19 years age range has the highest percentage of unemployed individuals, with 15.0% or 1,209 of them being unemployed.
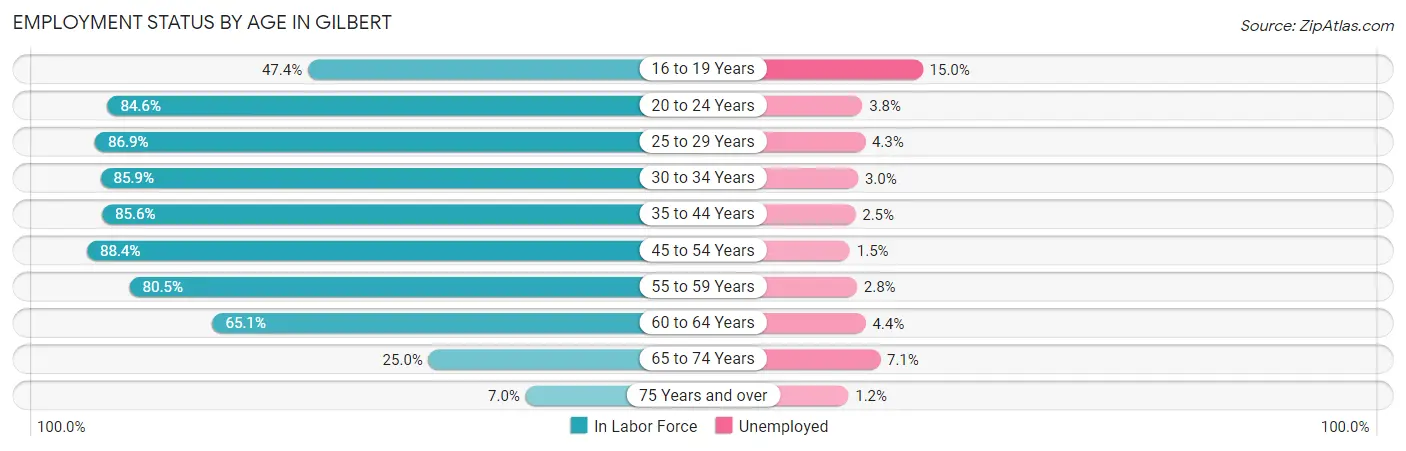
| Age Bracket | In Labor Force | Unemployed |
| 16 to 19 Years | 8,062 (47.4%) | 1,209 (15.0%) |
| 20 to 24 Years | 13,011 (84.6%) | 494 (3.8%) |
| 25 to 29 Years | 11,757 (86.9%) | 506 (4.3%) |
| 30 to 34 Years | 14,939 (85.9%) | 448 (3.0%) |
| 35 to 44 Years | 36,339 (85.6%) | 908 (2.5%) |
| 45 to 54 Years | 34,031 (88.4%) | 510 (1.5%) |
| 55 to 59 Years | 12,122 (80.5%) | 339 (2.8%) |
| 60 to 64 Years | 7,817 (65.1%) | 344 (4.4%) |
| 65 to 74 Years | 4,244 (25.0%) | 301 (7.1%) |
| 75 Years and over | 729 (7.0%) | 9 (1.2%) |
| Total | 143,073 (72.0%) | 5,008 (3.5%) |
Employment Status by Educational Attainment in Gilbert
According to labor force statistics for Gilbert, 84.2% of individuals (116,983) out of the total population between 25 and 64 years of age (138,935) are in the labor force, with 2.6% or 3,042 of them being unemployed. The group with the highest labor force participation rate are those with the educational attainment of bachelor's degree or higher, with 87.5% or 59,522 individuals in the labor force. Within the labor force, individuals with less than high school education have the highest percentage of unemployment, with 5.9% or 182 of them being unemployed.
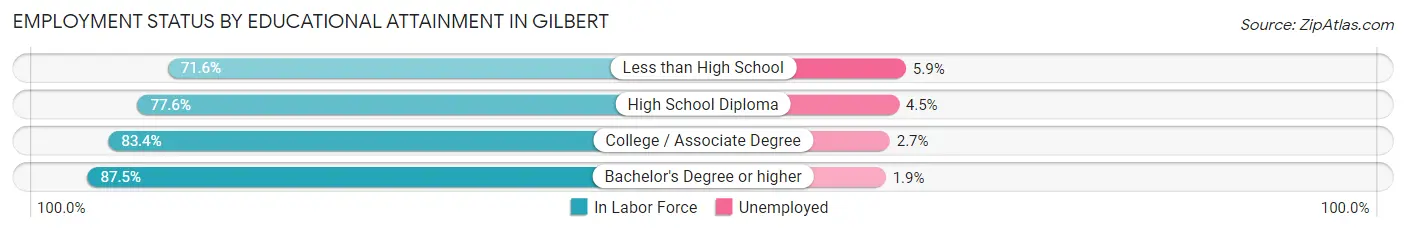
| Educational Attainment | In Labor Force | Unemployed |
| Less than High School | 3,081 (71.6%) | 254 (5.9%) |
| High School Diploma | 15,295 (77.6%) | 887 (4.5%) |
| College / Associate Degree | 39,112 (83.4%) | 1,266 (2.7%) |
| Bachelor's Degree or higher | 59,522 (87.5%) | 1,292 (1.9%) |
| Total | 116,983 (84.2%) | 3,612 (2.6%) |
Employment Occupations by Sex in Gilbert
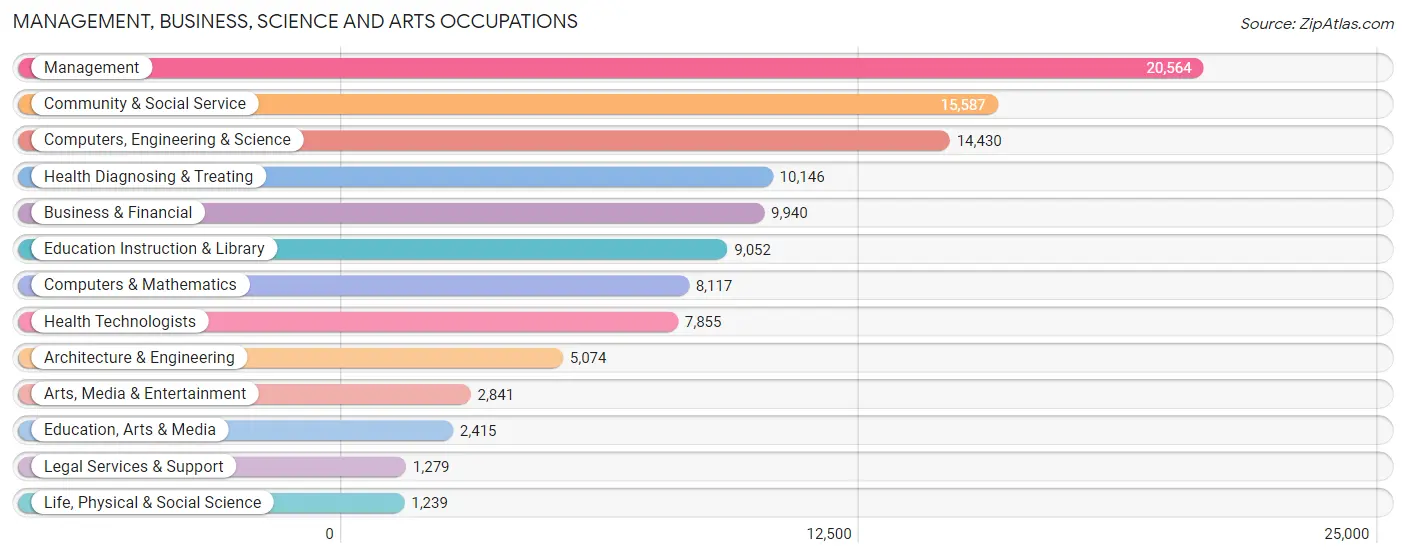
Management, Business, Science and Arts Occupations
The most common Management, Business, Science and Arts occupations in Gilbert are Management (20,564 | 14.9%), Community & Social Service (15,587 | 11.3%), Computers, Engineering & Science (14,430 | 10.5%), Health Diagnosing & Treating (10,146 | 7.4%), and Business & Financial (9,940 | 7.2%).
Management, Business, Science and Arts Occupations by Sex
Within the Management, Business, Science and Arts occupations in Gilbert, the most male-oriented occupations are Architecture & Engineering (88.7%), Computers, Engineering & Science (78.4%), and Computers & Mathematics (75.2%), while the most female-oriented occupations are Education Instruction & Library (79.1%), Health Technologists (71.6%), and Health Diagnosing & Treating (70.7%).
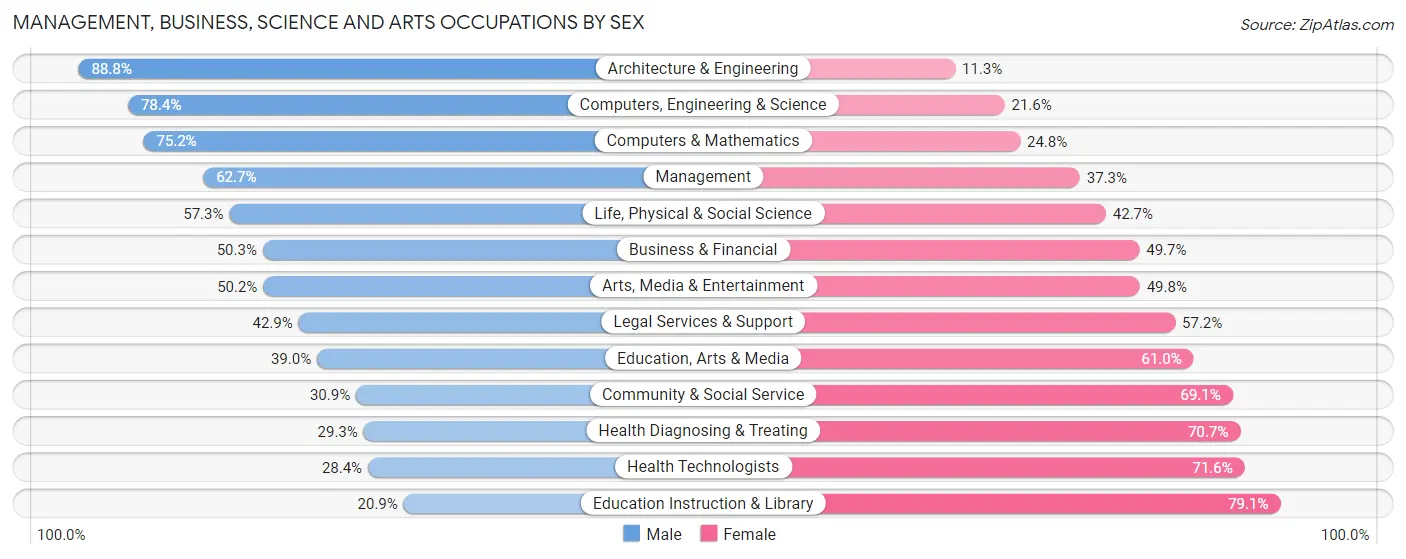
| Occupation | Male | Female |
| Management | 12,900 (62.7%) | 7,664 (37.3%) |
| Business & Financial | 5,002 (50.3%) | 4,938 (49.7%) |
| Computers, Engineering & Science | 11,318 (78.4%) | 3,112 (21.6%) |
| Computers & Mathematics | 6,105 (75.2%) | 2,012 (24.8%) |
| Architecture & Engineering | 4,503 (88.7%) | 571 (11.3%) |
| Life, Physical & Social Science | 710 (57.3%) | 529 (42.7%) |
| Community & Social Service | 4,812 (30.9%) | 10,775 (69.1%) |
| Education, Arts & Media | 942 (39.0%) | 1,473 (61.0%) |
| Legal Services & Support | 548 (42.8%) | 731 (57.2%) |
| Education Instruction & Library | 1,895 (20.9%) | 7,157 (79.1%) |
| Arts, Media & Entertainment | 1,427 (50.2%) | 1,414 (49.8%) |
| Health Diagnosing & Treating | 2,971 (29.3%) | 7,175 (70.7%) |
| Health Technologists | 2,229 (28.4%) | 5,626 (71.6%) |
| Total (Category) | 37,003 (52.4%) | 33,664 (47.6%) |
| Total (Overall) | 74,600 (54.1%) | 63,330 (45.9%) |
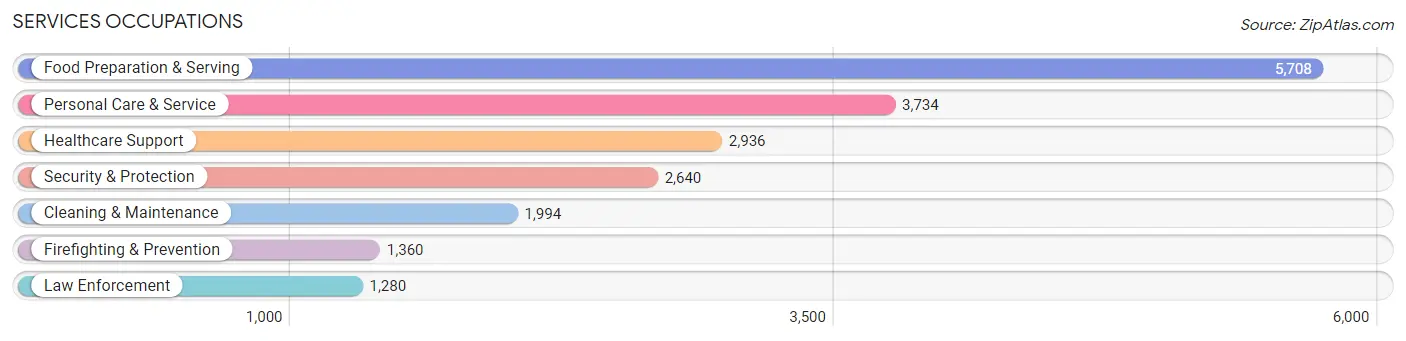
Services Occupations
The most common Services occupations in Gilbert are Food Preparation & Serving (5,708 | 4.1%), Personal Care & Service (3,734 | 2.7%), Healthcare Support (2,936 | 2.1%), Security & Protection (2,640 | 1.9%), and Cleaning & Maintenance (1,994 | 1.5%).
Services Occupations by Sex
Within the Services occupations in Gilbert, the most male-oriented occupations are Law Enforcement (91.1%), Security & Protection (89.5%), and Firefighting & Prevention (88.1%), while the most female-oriented occupations are Personal Care & Service (77.8%), Healthcare Support (77.5%), and Food Preparation & Serving (53.9%).
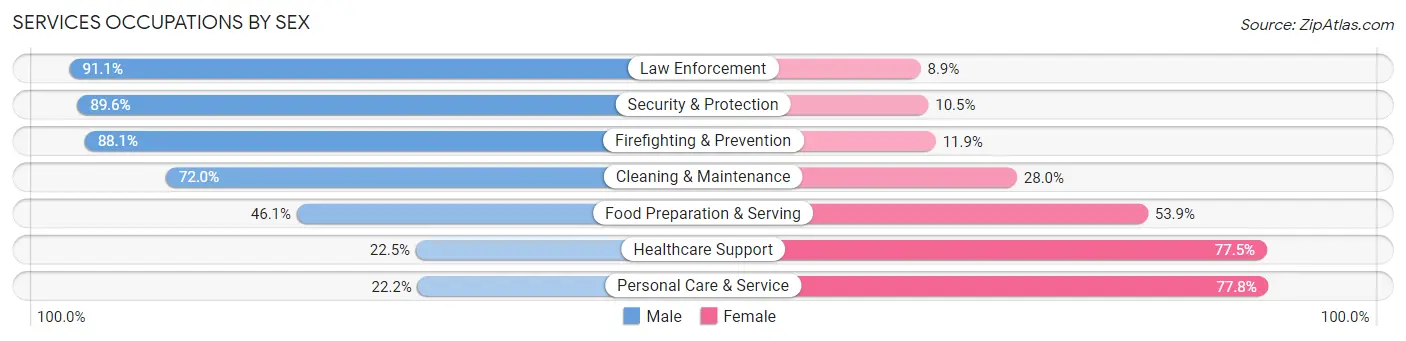
| Occupation | Male | Female |
| Healthcare Support | 661 (22.5%) | 2,275 (77.5%) |
| Security & Protection | 2,364 (89.5%) | 276 (10.4%) |
| Firefighting & Prevention | 1,198 (88.1%) | 162 (11.9%) |
| Law Enforcement | 1,166 (91.1%) | 114 (8.9%) |
| Food Preparation & Serving | 2,631 (46.1%) | 3,077 (53.9%) |
| Cleaning & Maintenance | 1,436 (72.0%) | 558 (28.0%) |
| Personal Care & Service | 828 (22.2%) | 2,906 (77.8%) |
| Total (Category) | 7,920 (46.6%) | 9,092 (53.4%) |
| Total (Overall) | 74,600 (54.1%) | 63,330 (45.9%) |
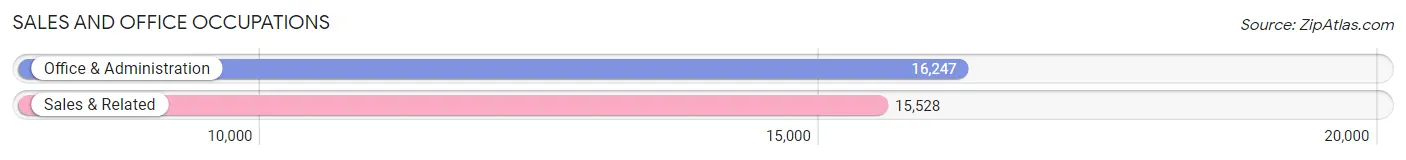
Sales and Office Occupations
The most common Sales and Office occupations in Gilbert are Office & Administration (16,247 | 11.8%), and Sales & Related (15,528 | 11.3%).
Sales and Office Occupations by Sex
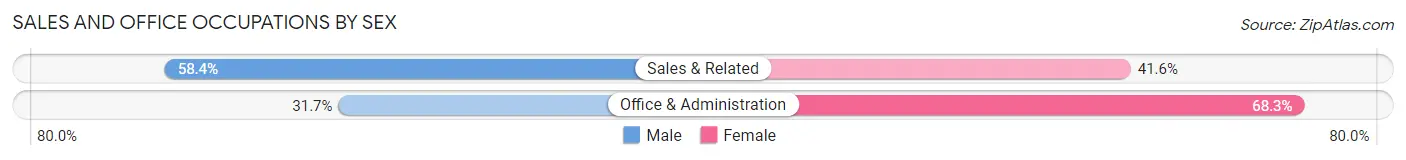
| Occupation | Male | Female |
| Sales & Related | 9,072 (58.4%) | 6,456 (41.6%) |
| Office & Administration | 5,155 (31.7%) | 11,092 (68.3%) |
| Total (Category) | 14,227 (44.8%) | 17,548 (55.2%) |
| Total (Overall) | 74,600 (54.1%) | 63,330 (45.9%) |
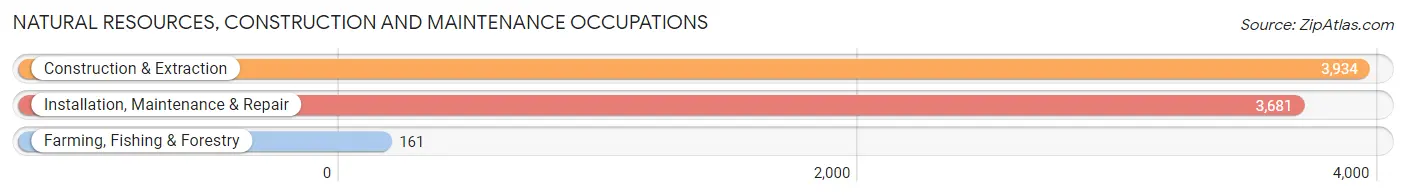
Natural Resources, Construction and Maintenance Occupations
The most common Natural Resources, Construction and Maintenance occupations in Gilbert are Construction & Extraction (3,934 | 2.9%), Installation, Maintenance & Repair (3,681 | 2.7%), and Farming, Fishing & Forestry (161 | 0.1%).
Natural Resources, Construction and Maintenance Occupations by Sex
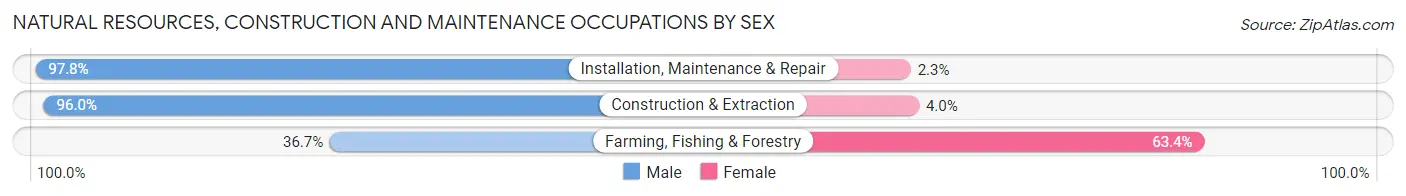
| Occupation | Male | Female |
| Farming, Fishing & Forestry | 59 (36.6%) | 102 (63.3%) |
| Construction & Extraction | 3,778 (96.0%) | 156 (4.0%) |
| Installation, Maintenance & Repair | 3,598 (97.8%) | 83 (2.2%) |
| Total (Category) | 7,435 (95.6%) | 341 (4.4%) |
| Total (Overall) | 74,600 (54.1%) | 63,330 (45.9%) |
Production, Transportation and Moving Occupations
The most common Production, Transportation and Moving occupations in Gilbert are Transportation (3,992 | 2.9%), Production (3,853 | 2.8%), and Material Moving (2,855 | 2.1%).
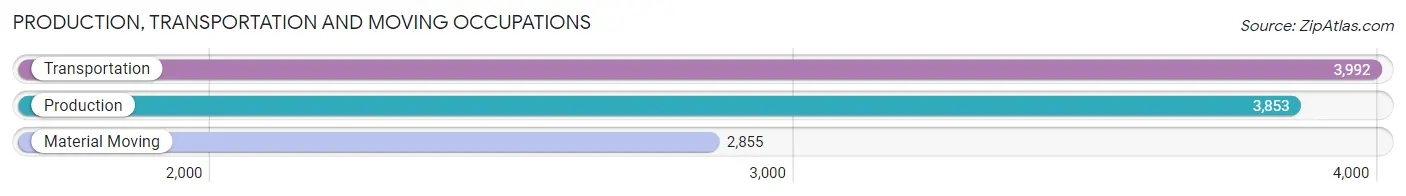
Production, Transportation and Moving Occupations by Sex
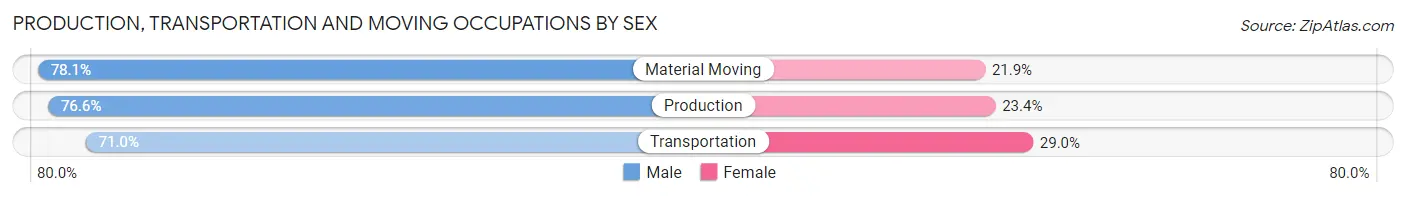
| Occupation | Male | Female |
| Production | 2,950 (76.6%) | 903 (23.4%) |
| Transportation | 2,836 (71.0%) | 1,156 (29.0%) |
| Material Moving | 2,229 (78.1%) | 626 (21.9%) |
| Total (Category) | 8,015 (74.9%) | 2,685 (25.1%) |
| Total (Overall) | 74,600 (54.1%) | 63,330 (45.9%) |
Employment Industries by Sex in Gilbert
Employment Industries in Gilbert
The major employment industries in Gilbert include Health Care & Social Assistance (18,031 | 13.1%), Manufacturing (14,933 | 10.8%), Educational Services (14,517 | 10.5%), Retail Trade (14,370 | 10.4%), and Finance & Insurance (12,470 | 9.0%).
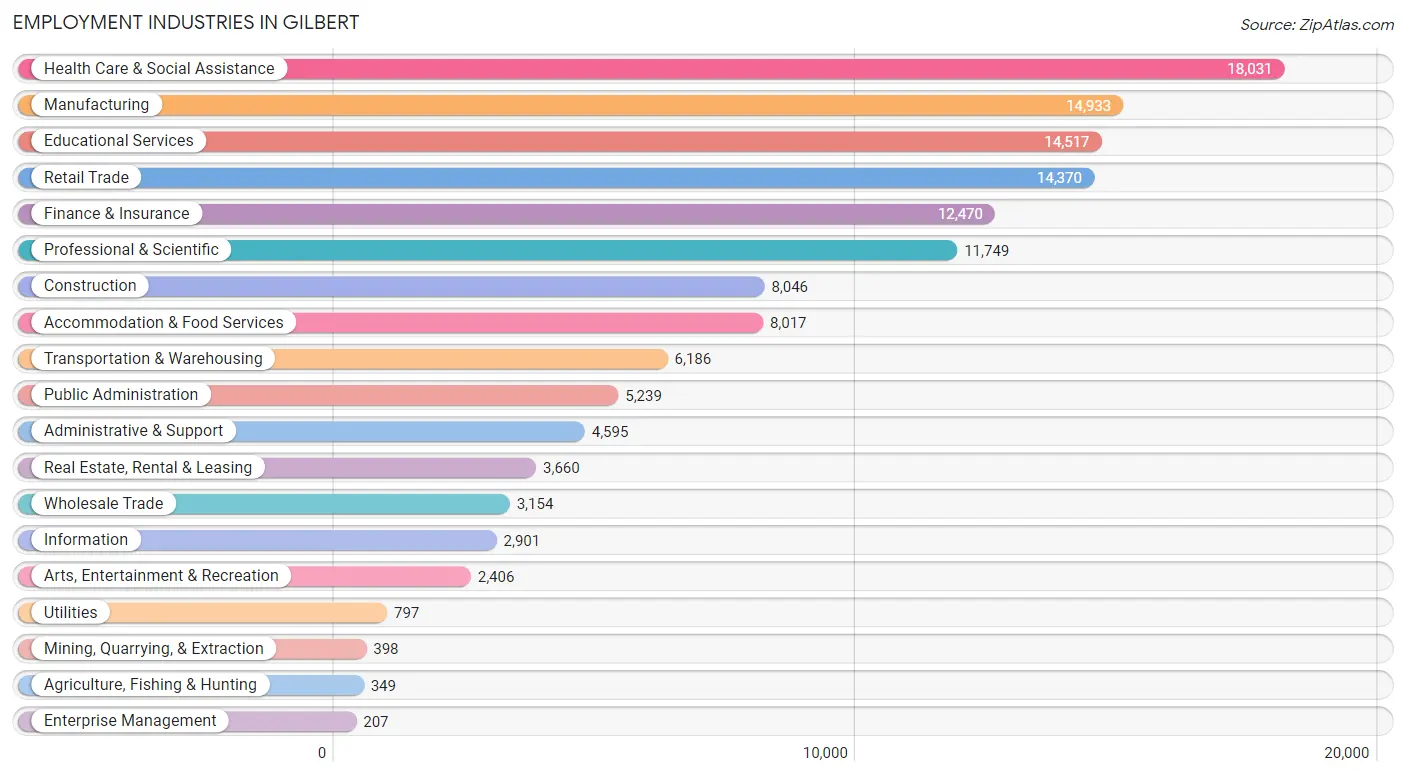
Employment Industries by Sex in Gilbert
The Gilbert industries that see more men than women are Mining, Quarrying, & Extraction (87.7%), Construction (84.0%), and Utilities (75.8%), whereas the industries that tend to have a higher number of women are Health Care & Social Assistance (72.7%), Educational Services (70.6%), and Enterprise Management (64.7%).
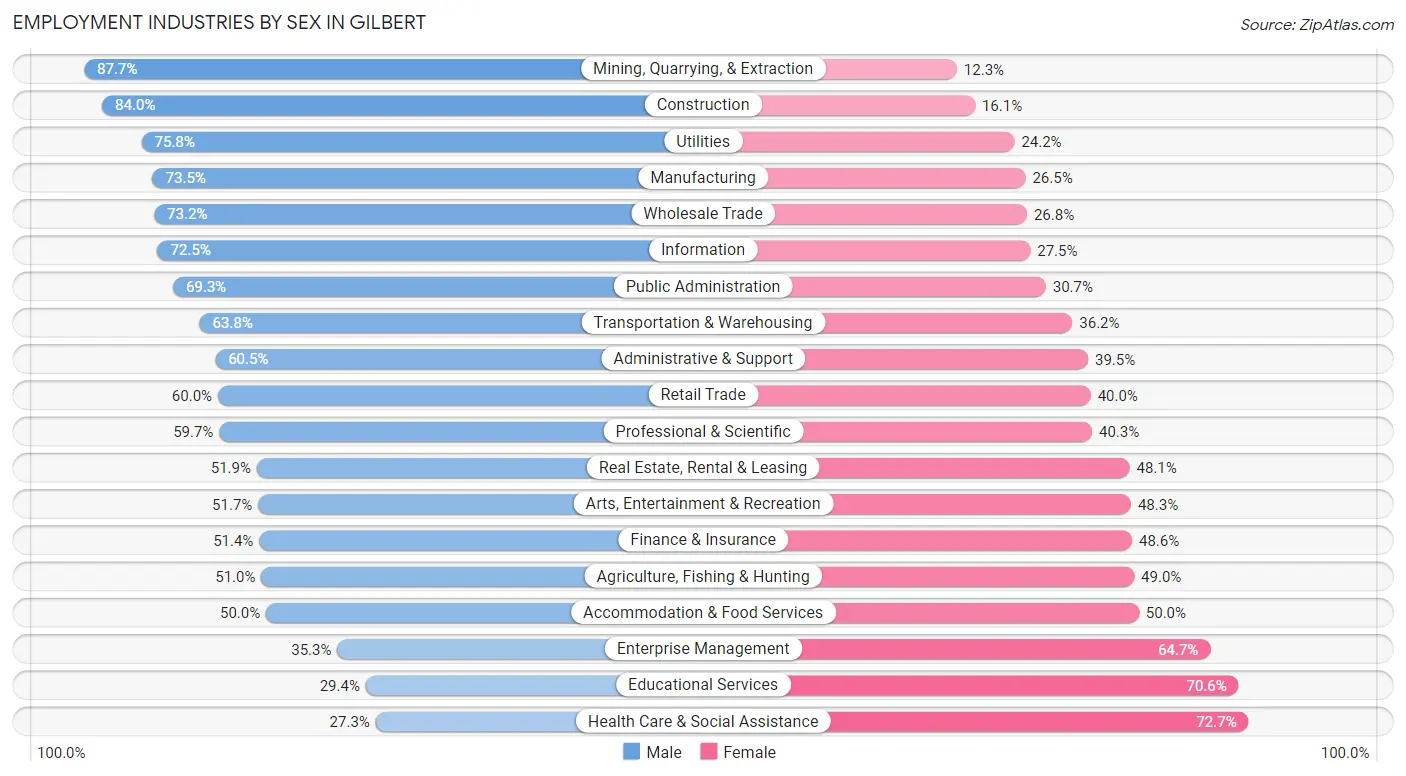
| Industry | Male | Female |
| Agriculture, Fishing & Hunting | 178 (51.0%) | 171 (49.0%) |
| Mining, Quarrying, & Extraction | 349 (87.7%) | 49 (12.3%) |
| Construction | 6,755 (84.0%) | 1,291 (16.1%) |
| Manufacturing | 10,975 (73.5%) | 3,958 (26.5%) |
| Wholesale Trade | 2,308 (73.2%) | 846 (26.8%) |
| Retail Trade | 8,620 (60.0%) | 5,750 (40.0%) |
| Transportation & Warehousing | 3,946 (63.8%) | 2,240 (36.2%) |
| Utilities | 604 (75.8%) | 193 (24.2%) |
| Information | 2,103 (72.5%) | 798 (27.5%) |
| Finance & Insurance | 6,415 (51.4%) | 6,055 (48.6%) |
| Real Estate, Rental & Leasing | 1,901 (51.9%) | 1,759 (48.1%) |
| Professional & Scientific | 7,017 (59.7%) | 4,732 (40.3%) |
| Enterprise Management | 73 (35.3%) | 134 (64.7%) |
| Administrative & Support | 2,782 (60.5%) | 1,813 (39.5%) |
| Educational Services | 4,266 (29.4%) | 10,251 (70.6%) |
| Health Care & Social Assistance | 4,929 (27.3%) | 13,102 (72.7%) |
| Arts, Entertainment & Recreation | 1,243 (51.7%) | 1,163 (48.3%) |
| Accommodation & Food Services | 4,011 (50.0%) | 4,006 (50.0%) |
| Public Administration | 3,630 (69.3%) | 1,609 (30.7%) |
| Total | 74,600 (54.1%) | 63,330 (45.9%) |
Education in Gilbert
School Enrollment in Gilbert
The most common levels of schooling among the 82,608 students in Gilbert are high school (19,637 | 23.8%), middle school (18,719 | 22.7%), and elementary school (17,718 | 21.4%).
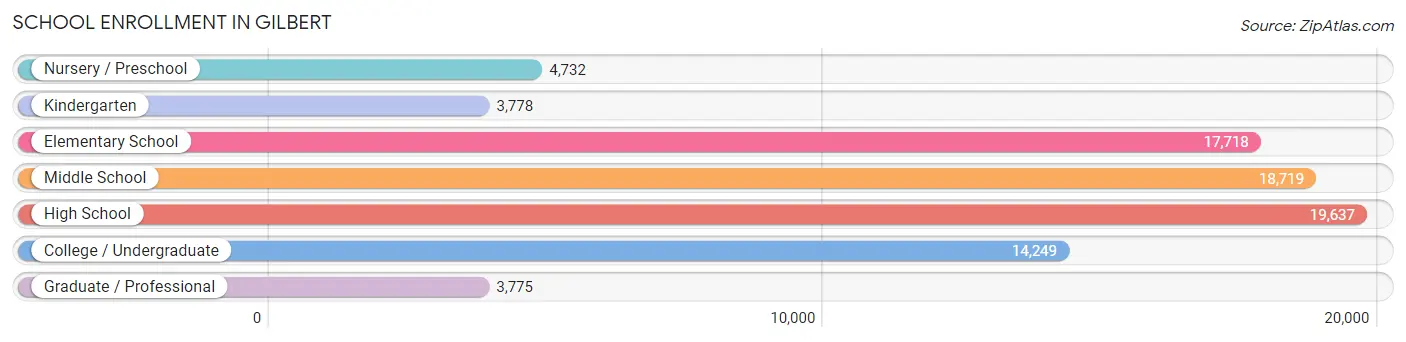
| School Level | # Students | % Students |
| Nursery / Preschool | 4,732 | 5.7% |
| Kindergarten | 3,778 | 4.6% |
| Elementary School | 17,718 | 21.4% |
| Middle School | 18,719 | 22.7% |
| High School | 19,637 | 23.8% |
| College / Undergraduate | 14,249 | 17.2% |
| Graduate / Professional | 3,775 | 4.6% |
| Total | 82,608 | 100.0% |
School Enrollment by Age by Funding Source in Gilbert
Out of a total of 82,608 students who are enrolled in schools in Gilbert, 11,400 (13.8%) attend a private institution, while the remaining 71,208 (86.2%) are enrolled in public schools. The age group of 3 to 4 year olds has the highest likelihood of being enrolled in private schools, with 1,593 (42.1% in the age bracket) enrolled. Conversely, the age group of 15 to 17 year olds has the lowest likelihood of being enrolled in a private school, with 13,239 (93.1% in the age bracket) attending a public institution.
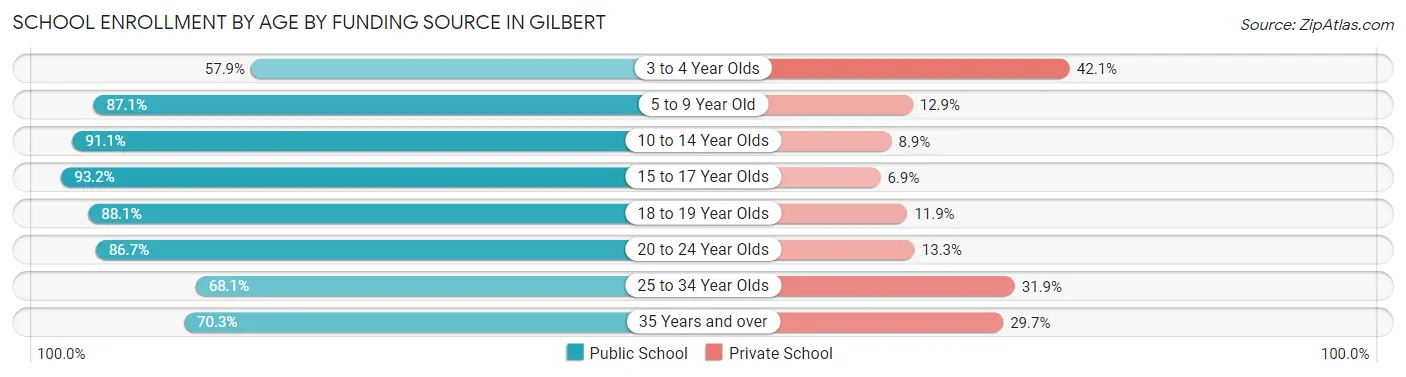
| Age Bracket | Public School | Private School |
| 3 to 4 Year Olds | 2,187 (57.9%) | 1,593 (42.1%) |
| 5 to 9 Year Old | 17,992 (87.1%) | 2,658 (12.9%) |
| 10 to 14 Year Olds | 21,497 (91.1%) | 2,102 (8.9%) |
| 15 to 17 Year Olds | 13,239 (93.1%) | 973 (6.9%) |
| 18 to 19 Year Olds | 4,597 (88.1%) | 619 (11.9%) |
| 20 to 24 Year Olds | 5,833 (86.7%) | 892 (13.3%) |
| 25 to 34 Year Olds | 2,311 (68.1%) | 1,082 (31.9%) |
| 35 Years and over | 3,537 (70.3%) | 1,496 (29.7%) |
| Total | 71,208 (86.2%) | 11,400 (13.8%) |
Educational Attainment by Field of Study in Gilbert
Business (19,159 | 22.8%), education (9,362 | 11.1%), science & technology (9,286 | 11.0%), engineering (7,450 | 8.9%), and arts & humanities (6,680 | 7.9%) are the most common fields of study among 84,104 individuals in Gilbert who have obtained a bachelor's degree or higher.
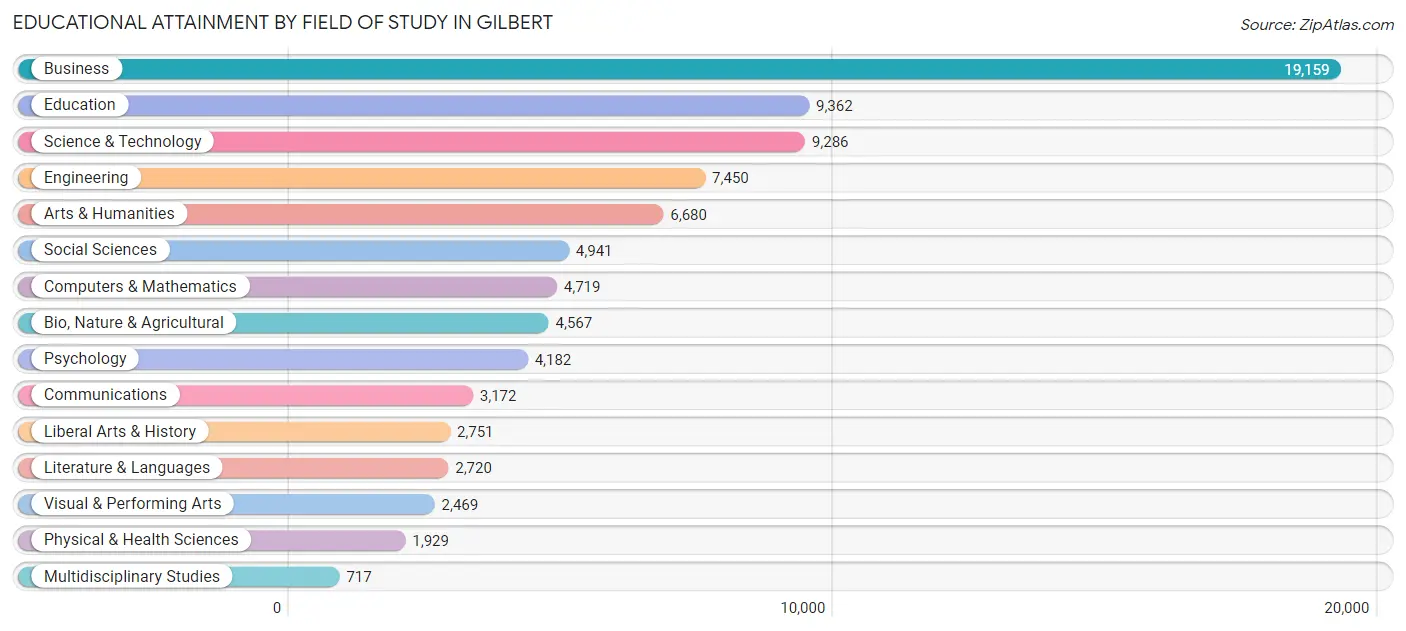
| Field of Study | # Graduates | % Graduates |
| Computers & Mathematics | 4,719 | 5.6% |
| Bio, Nature & Agricultural | 4,567 | 5.4% |
| Physical & Health Sciences | 1,929 | 2.3% |
| Psychology | 4,182 | 5.0% |
| Social Sciences | 4,941 | 5.9% |
| Engineering | 7,450 | 8.9% |
| Multidisciplinary Studies | 717 | 0.9% |
| Science & Technology | 9,286 | 11.0% |
| Business | 19,159 | 22.8% |
| Education | 9,362 | 11.1% |
| Literature & Languages | 2,720 | 3.2% |
| Liberal Arts & History | 2,751 | 3.3% |
| Visual & Performing Arts | 2,469 | 2.9% |
| Communications | 3,172 | 3.8% |
| Arts & Humanities | 6,680 | 7.9% |
| Total | 84,104 | 100.0% |
Transportation & Commute in Gilbert
Vehicle Availability by Sex in Gilbert
The most prevalent vehicle ownership categories in Gilbert are males with 2 vehicles (35,319, accounting for 47.8%) and females with 2 vehicles (28,863, making up 56.7%).
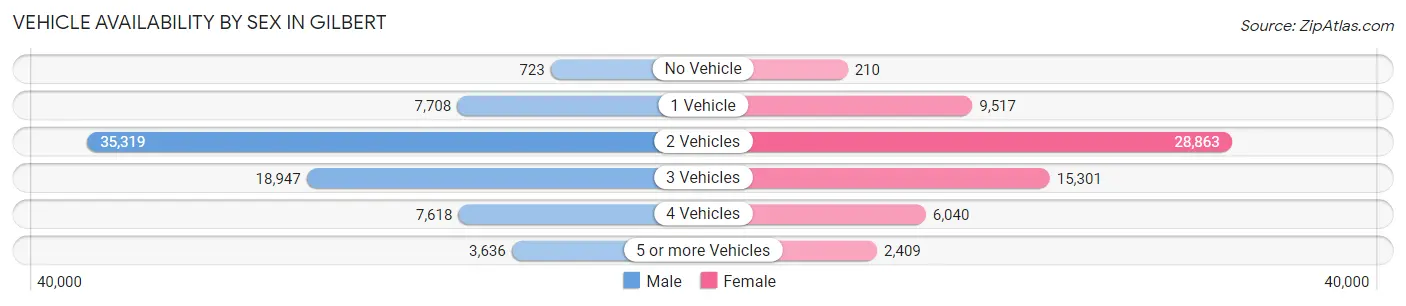
| Vehicles Available | Male | Female |
| No Vehicle | 723 (1.0%) | 210 (0.3%) |
| 1 Vehicle | 7,708 (10.4%) | 9,517 (15.3%) |
| 2 Vehicles | 35,319 (47.8%) | 28,863 (46.3%) |
| 3 Vehicles | 18,947 (25.6%) | 15,301 (24.5%) |
| 4 Vehicles | 7,618 (10.3%) | 6,040 (9.7%) |
| 5 or more Vehicles | 3,636 (4.9%) | 2,409 (3.9%) |
| Total | 73,951 (100.0%) | 62,340 (100.0%) |
Commute Time in Gilbert
The most frequently occuring commute durations in Gilbert are 20 to 24 minutes (17,099 commuters, 15.8%), 15 to 19 minutes (15,949 commuters, 14.7%), and 30 to 34 minutes (15,242 commuters, 14.1%).
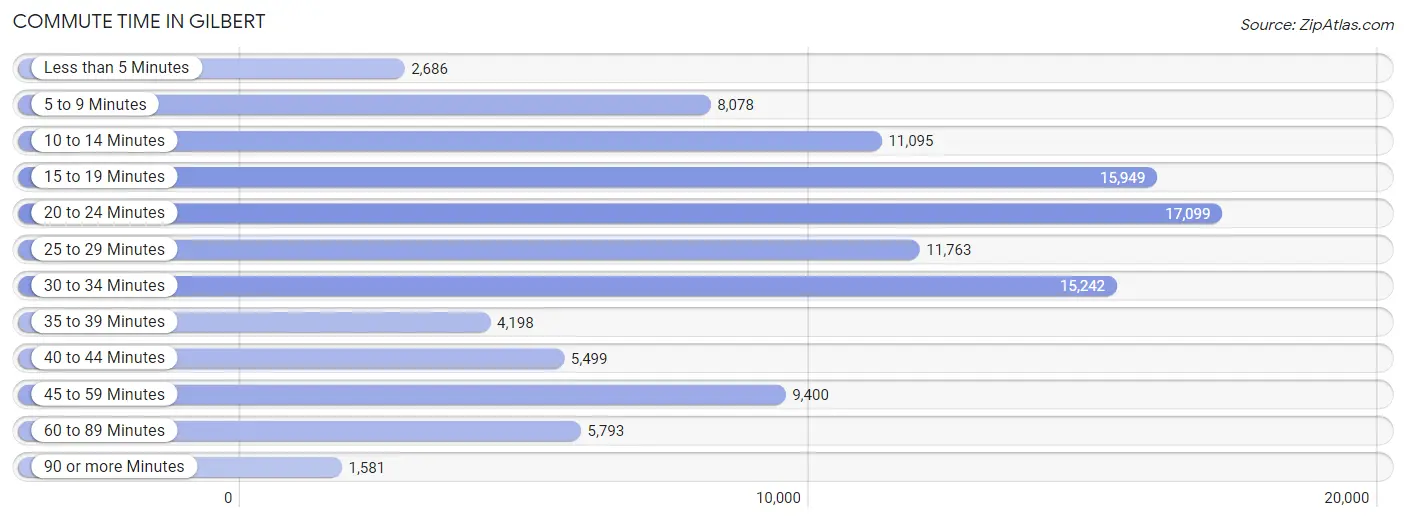
| Commute Time | # Commuters | % Commuters |
| Less than 5 Minutes | 2,686 | 2.5% |
| 5 to 9 Minutes | 8,078 | 7.4% |
| 10 to 14 Minutes | 11,095 | 10.2% |
| 15 to 19 Minutes | 15,949 | 14.7% |
| 20 to 24 Minutes | 17,099 | 15.8% |
| 25 to 29 Minutes | 11,763 | 10.8% |
| 30 to 34 Minutes | 15,242 | 14.1% |
| 35 to 39 Minutes | 4,198 | 3.9% |
| 40 to 44 Minutes | 5,499 | 5.1% |
| 45 to 59 Minutes | 9,400 | 8.7% |
| 60 to 89 Minutes | 5,793 | 5.3% |
| 90 or more Minutes | 1,581 | 1.5% |
Commute Time by Sex in Gilbert
The most common commute times in Gilbert are 20 to 24 minutes (9,407 commuters, 15.9%) for males and 15 to 19 minutes (7,847 commuters, 15.9%) for females.
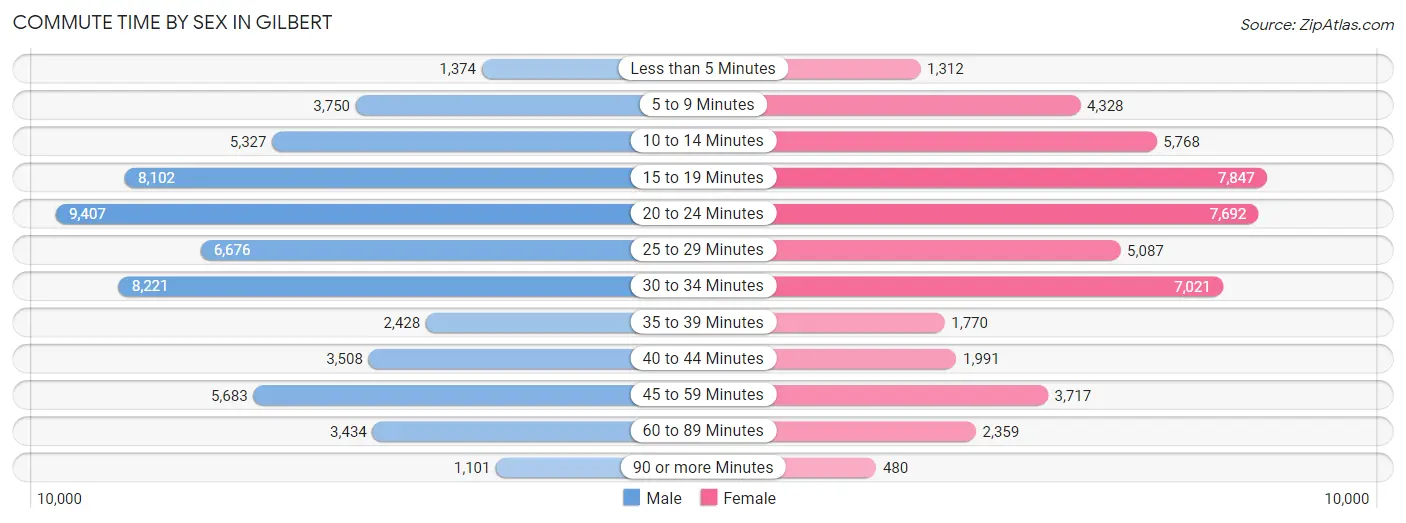
| Commute Time | Male | Female |
| Less than 5 Minutes | 1,374 (2.3%) | 1,312 (2.7%) |
| 5 to 9 Minutes | 3,750 (6.4%) | 4,328 (8.8%) |
| 10 to 14 Minutes | 5,327 (9.0%) | 5,768 (11.7%) |
| 15 to 19 Minutes | 8,102 (13.7%) | 7,847 (15.9%) |
| 20 to 24 Minutes | 9,407 (15.9%) | 7,692 (15.6%) |
| 25 to 29 Minutes | 6,676 (11.3%) | 5,087 (10.3%) |
| 30 to 34 Minutes | 8,221 (13.9%) | 7,021 (14.2%) |
| 35 to 39 Minutes | 2,428 (4.1%) | 1,770 (3.6%) |
| 40 to 44 Minutes | 3,508 (5.9%) | 1,991 (4.0%) |
| 45 to 59 Minutes | 5,683 (9.6%) | 3,717 (7.5%) |
| 60 to 89 Minutes | 3,434 (5.8%) | 2,359 (4.8%) |
| 90 or more Minutes | 1,101 (1.9%) | 480 (1.0%) |
Time of Departure to Work by Sex in Gilbert
The most frequent times of departure to work in Gilbert are 7:00 AM to 7:29 AM (7,724, 13.1%) for males and 7:00 AM to 7:29 AM (7,815, 15.8%) for females.
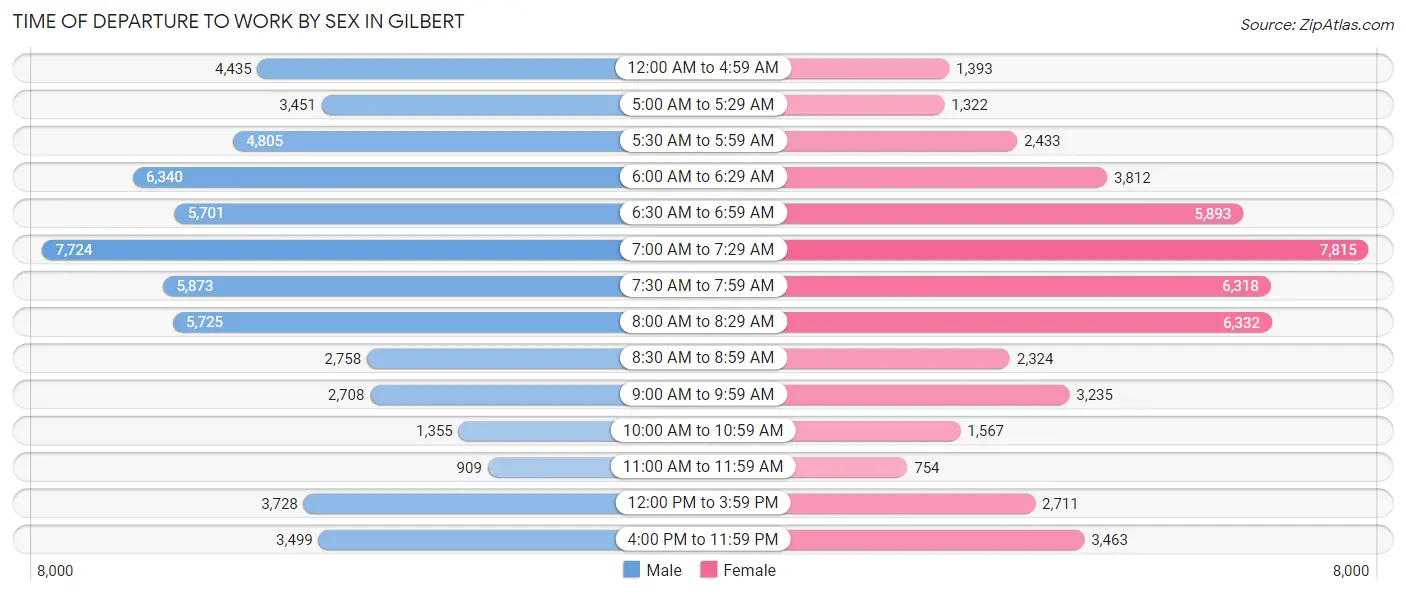
| Time of Departure | Male | Female |
| 12:00 AM to 4:59 AM | 4,435 (7.5%) | 1,393 (2.8%) |
| 5:00 AM to 5:29 AM | 3,451 (5.9%) | 1,322 (2.7%) |
| 5:30 AM to 5:59 AM | 4,805 (8.1%) | 2,433 (4.9%) |
| 6:00 AM to 6:29 AM | 6,340 (10.7%) | 3,812 (7.7%) |
| 6:30 AM to 6:59 AM | 5,701 (9.7%) | 5,893 (11.9%) |
| 7:00 AM to 7:29 AM | 7,724 (13.1%) | 7,815 (15.8%) |
| 7:30 AM to 7:59 AM | 5,873 (10.0%) | 6,318 (12.8%) |
| 8:00 AM to 8:29 AM | 5,725 (9.7%) | 6,332 (12.8%) |
| 8:30 AM to 8:59 AM | 2,758 (4.7%) | 2,324 (4.7%) |
| 9:00 AM to 9:59 AM | 2,708 (4.6%) | 3,235 (6.6%) |
| 10:00 AM to 10:59 AM | 1,355 (2.3%) | 1,567 (3.2%) |
| 11:00 AM to 11:59 AM | 909 (1.5%) | 754 (1.5%) |
| 12:00 PM to 3:59 PM | 3,728 (6.3%) | 2,711 (5.5%) |
| 4:00 PM to 11:59 PM | 3,499 (5.9%) | 3,463 (7.0%) |
| Total | 59,011 (100.0%) | 49,372 (100.0%) |
Housing Occupancy in Gilbert
Occupancy by Ownership in Gilbert
Of the total 90,299 dwellings in Gilbert, owner-occupied units account for 67,440 (74.7%), while renter-occupied units make up 22,859 (25.3%).
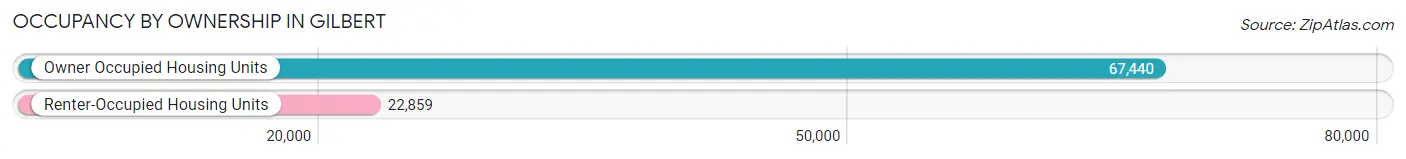
| Occupancy | # Housing Units | % Housing Units |
| Owner Occupied Housing Units | 67,440 | 74.7% |
| Renter-Occupied Housing Units | 22,859 | 25.3% |
| Total Occupied Housing Units | 90,299 | 100.0% |
Occupancy by Household Size in Gilbert
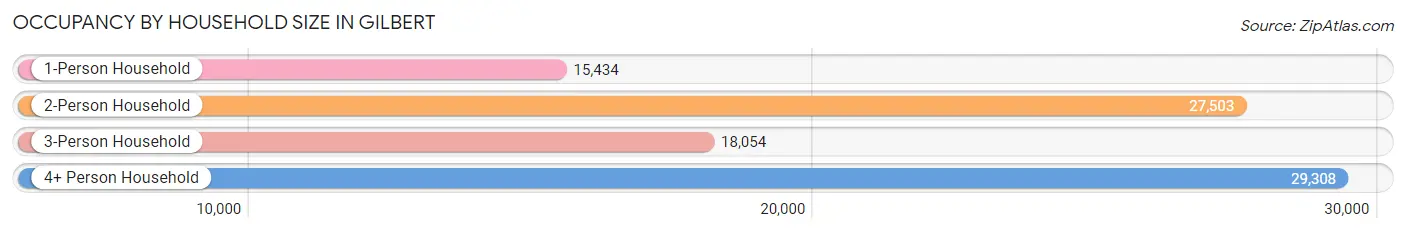
| Household Size | # Housing Units | % Housing Units |
| 1-Person Household | 15,434 | 17.1% |
| 2-Person Household | 27,503 | 30.5% |
| 3-Person Household | 18,054 | 20.0% |
| 4+ Person Household | 29,308 | 32.5% |
| Total Housing Units | 90,299 | 100.0% |
Occupancy by Ownership by Household Size in Gilbert
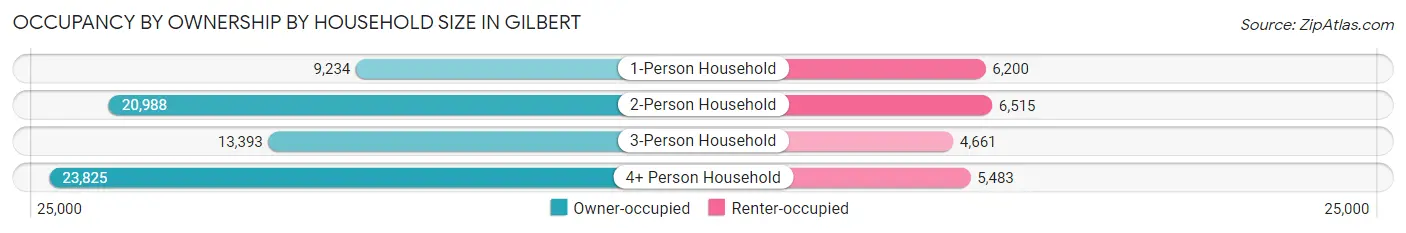
| Household Size | Owner-occupied | Renter-occupied |
| 1-Person Household | 9,234 (59.8%) | 6,200 (40.2%) |
| 2-Person Household | 20,988 (76.3%) | 6,515 (23.7%) |
| 3-Person Household | 13,393 (74.2%) | 4,661 (25.8%) |
| 4+ Person Household | 23,825 (81.3%) | 5,483 (18.7%) |
| Total Housing Units | 67,440 (74.7%) | 22,859 (25.3%) |
Occupancy by Educational Attainment in Gilbert
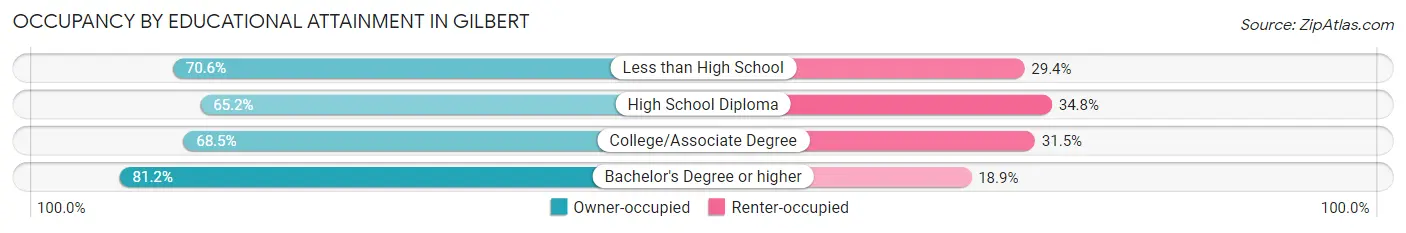
| Household Size | Owner-occupied | Renter-occupied |
| Less than High School | 1,594 (70.6%) | 663 (29.4%) |
| High School Diploma | 6,947 (65.2%) | 3,711 (34.8%) |
| College/Associate Degree | 21,171 (68.5%) | 9,720 (31.5%) |
| Bachelor's Degree or higher | 37,728 (81.1%) | 8,765 (18.9%) |
Occupancy by Age of Householder in Gilbert
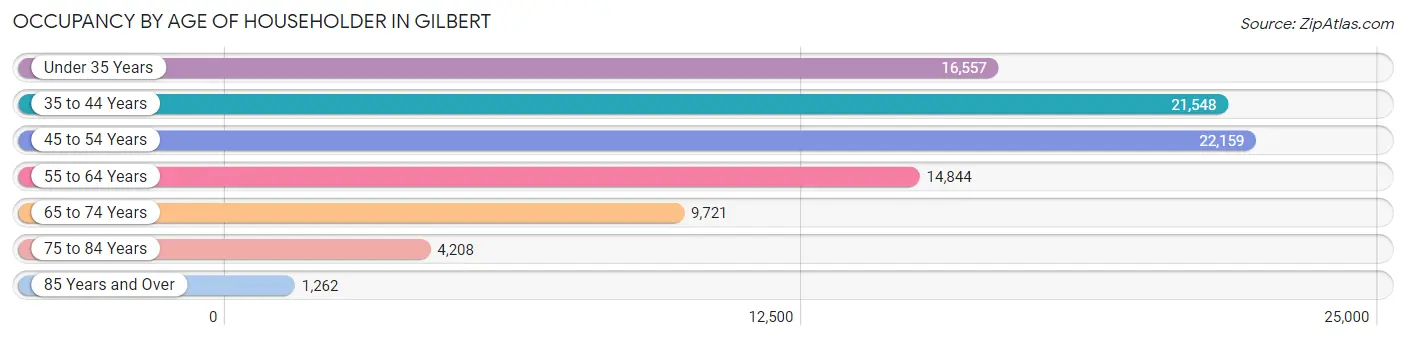
| Age Bracket | # Households | % Households |
| Under 35 Years | 16,557 | 18.3% |
| 35 to 44 Years | 21,548 | 23.9% |
| 45 to 54 Years | 22,159 | 24.5% |
| 55 to 64 Years | 14,844 | 16.4% |
| 65 to 74 Years | 9,721 | 10.8% |
| 75 to 84 Years | 4,208 | 4.7% |
| 85 Years and Over | 1,262 | 1.4% |
| Total | 90,299 | 100.0% |
Housing Finances in Gilbert
Median Income by Occupancy in Gilbert
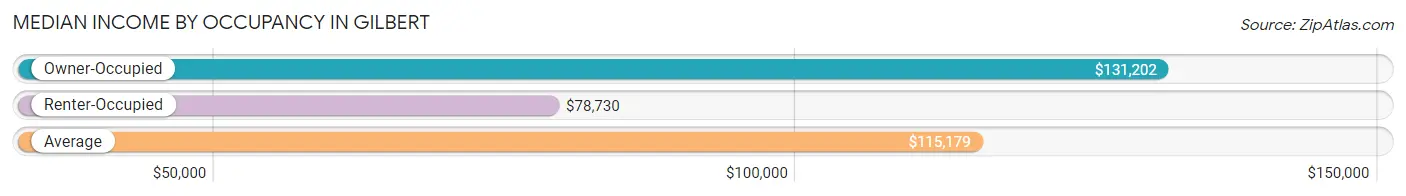
| Occupancy Type | # Households | Median Income |
| Owner-Occupied | 67,440 (74.7%) | $131,202 |
| Renter-Occupied | 22,859 (25.3%) | $78,730 |
| Average | 90,299 (100.0%) | $115,179 |
Occupancy by Householder Income Bracket in Gilbert
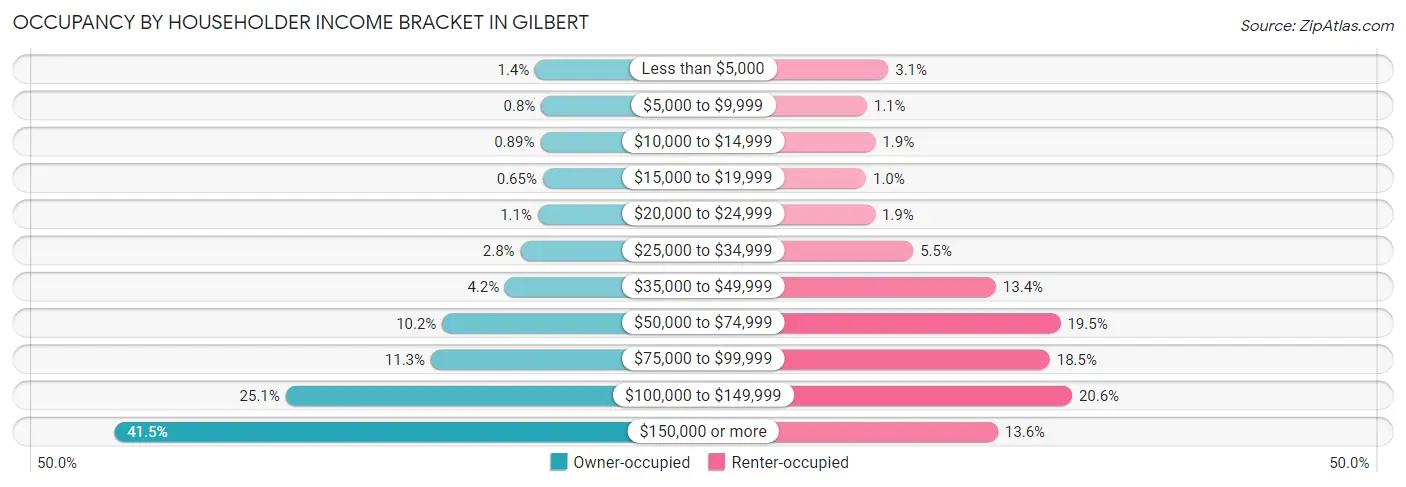
| Income Bracket | Owner-occupied | Renter-occupied |
| Less than $5,000 | 930 (1.4%) | 713 (3.1%) |
| $5,000 to $9,999 | 539 (0.8%) | 245 (1.1%) |
| $10,000 to $14,999 | 603 (0.9%) | 433 (1.9%) |
| $15,000 to $19,999 | 436 (0.6%) | 229 (1.0%) |
| $20,000 to $24,999 | 756 (1.1%) | 424 (1.8%) |
| $25,000 to $34,999 | 1,872 (2.8%) | 1,255 (5.5%) |
| $35,000 to $49,999 | 2,862 (4.2%) | 3,057 (13.4%) |
| $50,000 to $74,999 | 6,900 (10.2%) | 4,463 (19.5%) |
| $75,000 to $99,999 | 7,629 (11.3%) | 4,229 (18.5%) |
| $100,000 to $149,999 | 16,953 (25.1%) | 4,712 (20.6%) |
| $150,000 or more | 27,960 (41.5%) | 3,099 (13.6%) |
| Total | 67,440 (100.0%) | 22,859 (100.0%) |
Monthly Housing Cost Tiers in Gilbert
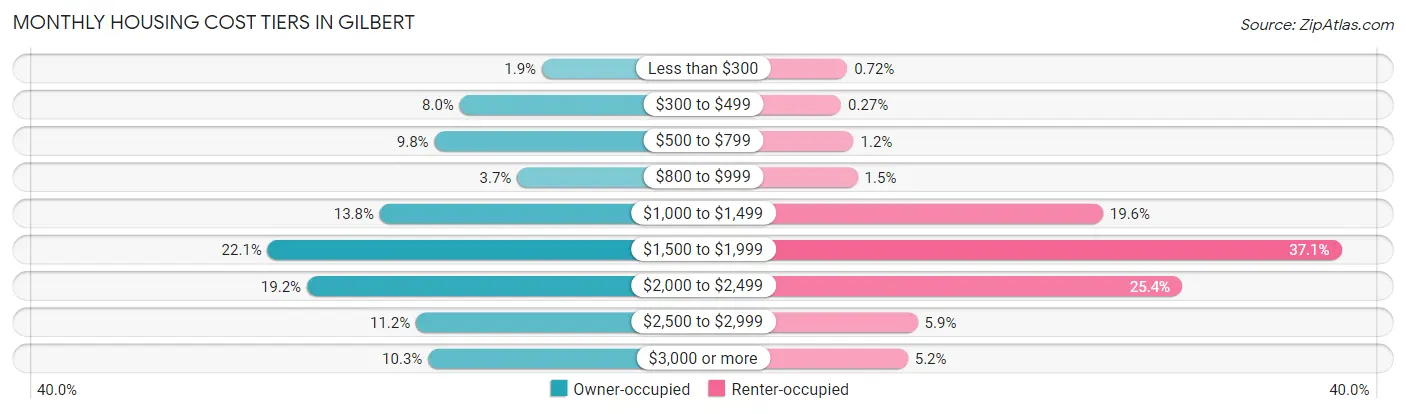
| Monthly Cost | Owner-occupied | Renter-occupied |
| Less than $300 | 1,282 (1.9%) | 165 (0.7%) |
| $300 to $499 | 5,365 (8.0%) | 62 (0.3%) |
| $500 to $799 | 6,621 (9.8%) | 273 (1.2%) |
| $800 to $999 | 2,507 (3.7%) | 340 (1.5%) |
| $1,000 to $1,499 | 9,334 (13.8%) | 4,470 (19.6%) |
| $1,500 to $1,999 | 14,905 (22.1%) | 8,484 (37.1%) |
| $2,000 to $2,499 | 12,957 (19.2%) | 5,800 (25.4%) |
| $2,500 to $2,999 | 7,535 (11.2%) | 1,350 (5.9%) |
| $3,000 or more | 6,934 (10.3%) | 1,183 (5.2%) |
| Total | 67,440 (100.0%) | 22,859 (100.0%) |
Physical Housing Characteristics in Gilbert
Housing Structures in Gilbert
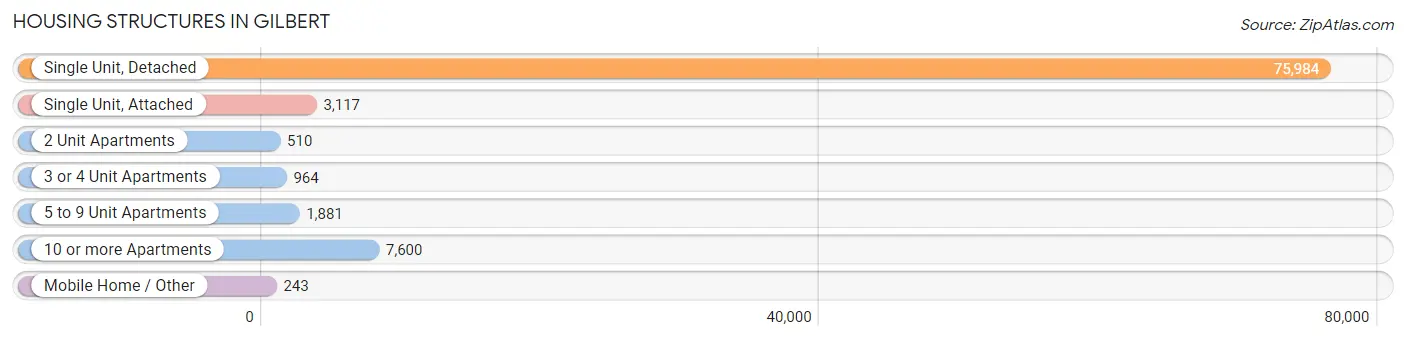
| Structure Type | # Housing Units | % Housing Units |
| Single Unit, Detached | 75,984 | 84.2% |
| Single Unit, Attached | 3,117 | 3.5% |
| 2 Unit Apartments | 510 | 0.6% |
| 3 or 4 Unit Apartments | 964 | 1.1% |
| 5 to 9 Unit Apartments | 1,881 | 2.1% |
| 10 or more Apartments | 7,600 | 8.4% |
| Mobile Home / Other | 243 | 0.3% |
| Total | 90,299 | 100.0% |
Housing Structures by Occupancy in Gilbert
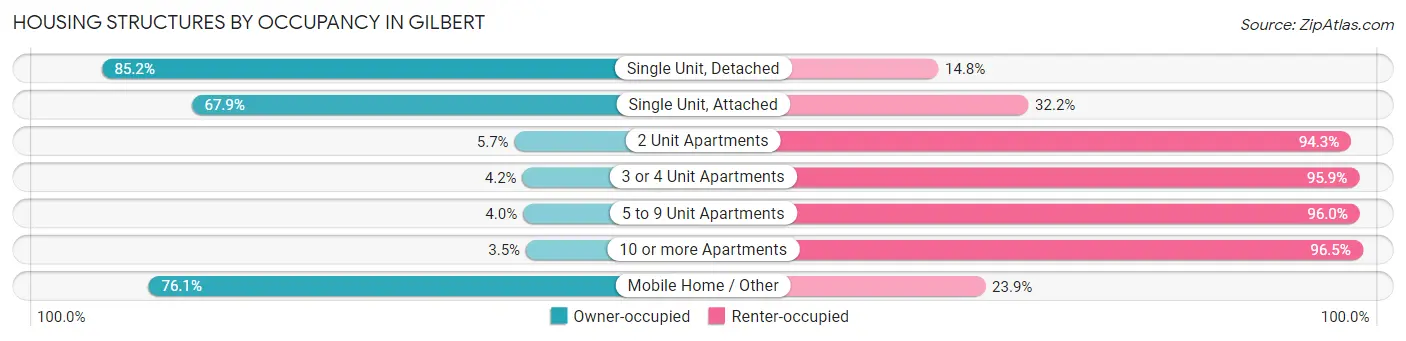
| Structure Type | Owner-occupied | Renter-occupied |
| Single Unit, Detached | 64,731 (85.2%) | 11,253 (14.8%) |
| Single Unit, Attached | 2,115 (67.8%) | 1,002 (32.2%) |
| 2 Unit Apartments | 29 (5.7%) | 481 (94.3%) |
| 3 or 4 Unit Apartments | 40 (4.2%) | 924 (95.9%) |
| 5 to 9 Unit Apartments | 76 (4.0%) | 1,805 (96.0%) |
| 10 or more Apartments | 264 (3.5%) | 7,336 (96.5%) |
| Mobile Home / Other | 185 (76.1%) | 58 (23.9%) |
| Total | 67,440 (74.7%) | 22,859 (25.3%) |
Housing Structures by Number of Rooms in Gilbert
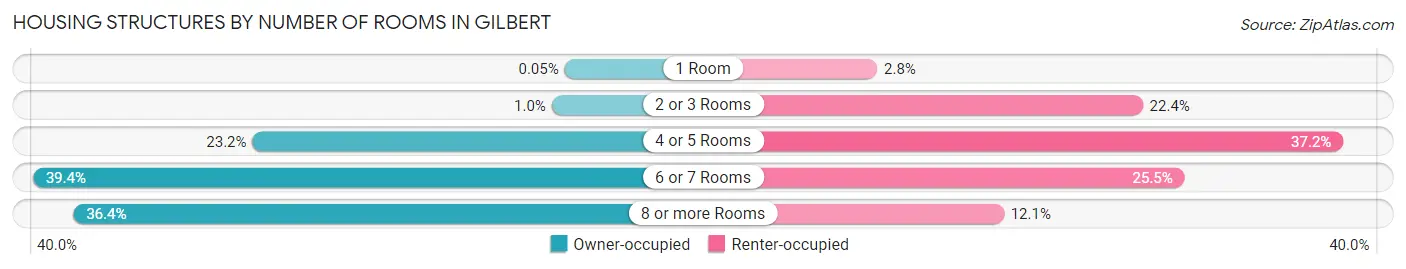
| Number of Rooms | Owner-occupied | Renter-occupied |
| 1 Room | 31 (0.1%) | 628 (2.8%) |
| 2 or 3 Rooms | 675 (1.0%) | 5,121 (22.4%) |
| 4 or 5 Rooms | 15,614 (23.2%) | 8,510 (37.2%) |
| 6 or 7 Rooms | 26,570 (39.4%) | 5,830 (25.5%) |
| 8 or more Rooms | 24,550 (36.4%) | 2,770 (12.1%) |
| Total | 67,440 (100.0%) | 22,859 (100.0%) |
Housing Structure by Heating Type in Gilbert
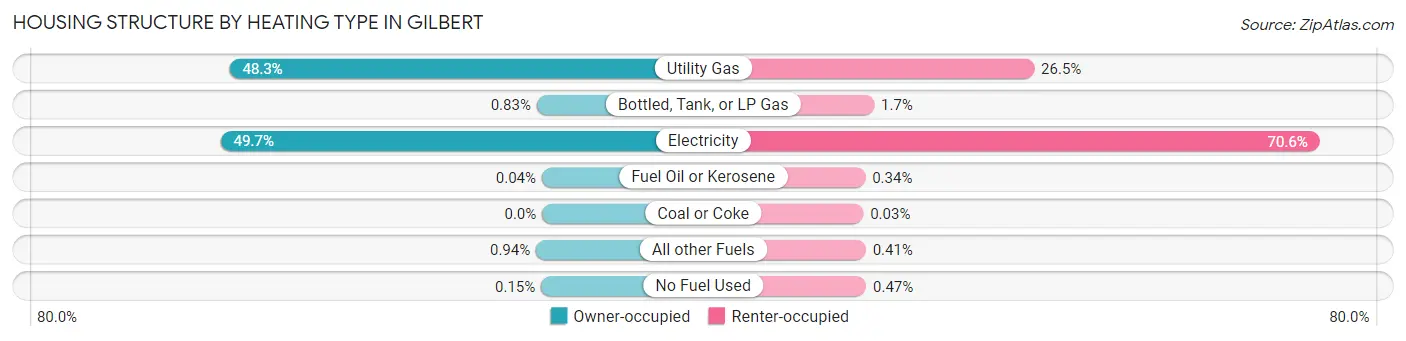
| Heating Type | Owner-occupied | Renter-occupied |
| Utility Gas | 32,591 (48.3%) | 6,046 (26.5%) |
| Bottled, Tank, or LP Gas | 561 (0.8%) | 392 (1.7%) |
| Electricity | 33,527 (49.7%) | 16,135 (70.6%) |
| Fuel Oil or Kerosene | 28 (0.0%) | 78 (0.3%) |
| Coal or Coke | 0 (0.0%) | 6 (0.0%) |
| All other Fuels | 633 (0.9%) | 94 (0.4%) |
| No Fuel Used | 100 (0.2%) | 108 (0.5%) |
| Total | 67,440 (100.0%) | 22,859 (100.0%) |
Household Vehicle Usage in Gilbert
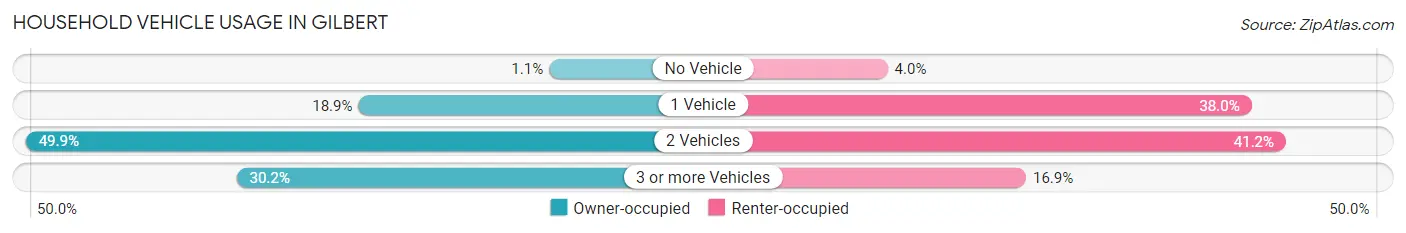
| Vehicles per Household | Owner-occupied | Renter-occupied |
| No Vehicle | 709 (1.1%) | 911 (4.0%) |
| 1 Vehicle | 12,713 (18.9%) | 8,675 (38.0%) |
| 2 Vehicles | 33,643 (49.9%) | 9,408 (41.2%) |
| 3 or more Vehicles | 20,375 (30.2%) | 3,865 (16.9%) |
| Total | 67,440 (100.0%) | 22,859 (100.0%) |
Real Estate & Mortgages in Gilbert
Real Estate and Mortgage Overview in Gilbert
| Characteristic | Without Mortgage | With Mortgage |
| Housing Units | 14,439 | 53,001 |
| Median Property Value | $444,000 | $457,100 |
| Median Household Income | $96,712 | $23,864 |
| Monthly Housing Costs | $538 | $6,934 |
| Real Estate Taxes | $2,373 | $1,519 |
Property Value by Mortgage Status in Gilbert
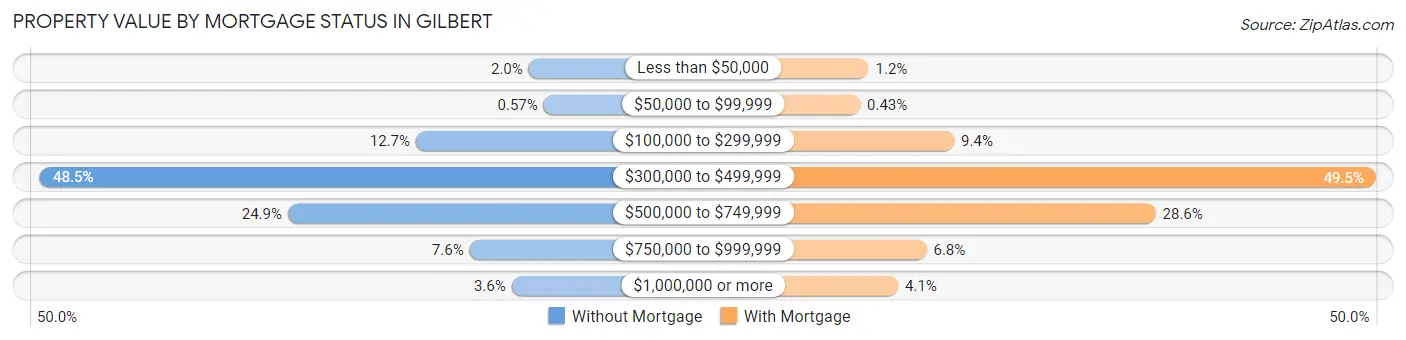
| Property Value | Without Mortgage | With Mortgage |
| Less than $50,000 | 289 (2.0%) | 659 (1.2%) |
| $50,000 to $99,999 | 82 (0.6%) | 230 (0.4%) |
| $100,000 to $299,999 | 1,839 (12.7%) | 4,976 (9.4%) |
| $300,000 to $499,999 | 7,006 (48.5%) | 26,258 (49.5%) |
| $500,000 to $749,999 | 3,599 (24.9%) | 15,149 (28.6%) |
| $750,000 to $999,999 | 1,101 (7.6%) | 3,581 (6.8%) |
| $1,000,000 or more | 523 (3.6%) | 2,148 (4.1%) |
| Total | 14,439 (100.0%) | 53,001 (100.0%) |
Household Income by Mortgage Status in Gilbert
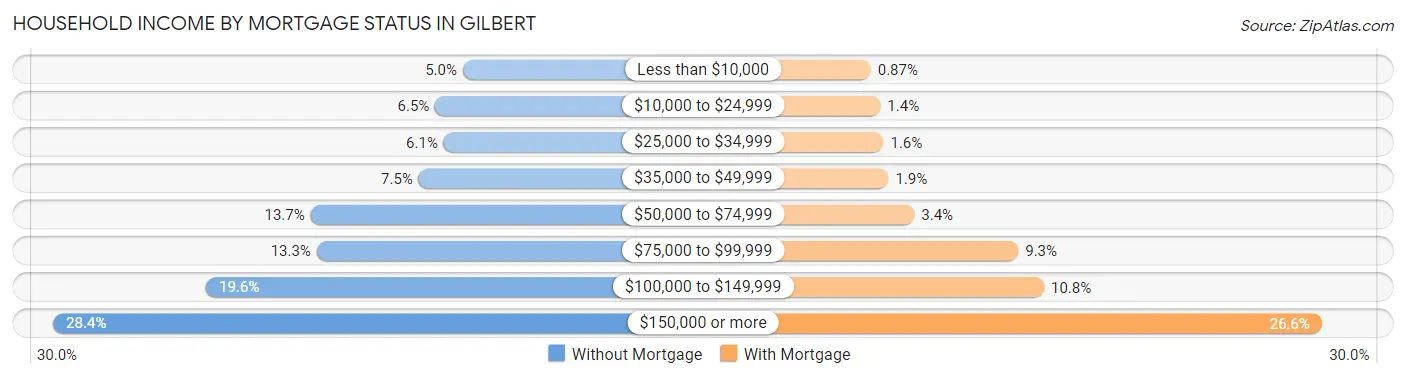
| Household Income | Without Mortgage | With Mortgage |
| Less than $10,000 | 716 (5.0%) | 461 (0.9%) |
| $10,000 to $24,999 | 945 (6.5%) | 753 (1.4%) |
| $25,000 to $34,999 | 874 (6.0%) | 850 (1.6%) |
| $35,000 to $49,999 | 1,080 (7.5%) | 998 (1.9%) |
| $50,000 to $74,999 | 1,972 (13.7%) | 1,782 (3.4%) |
| $75,000 to $99,999 | 1,922 (13.3%) | 4,928 (9.3%) |
| $100,000 to $149,999 | 2,834 (19.6%) | 5,707 (10.8%) |
| $150,000 or more | 4,096 (28.4%) | 14,119 (26.6%) |
| Total | 14,439 (100.0%) | 53,001 (100.0%) |
Property Value to Household Income Ratio in Gilbert
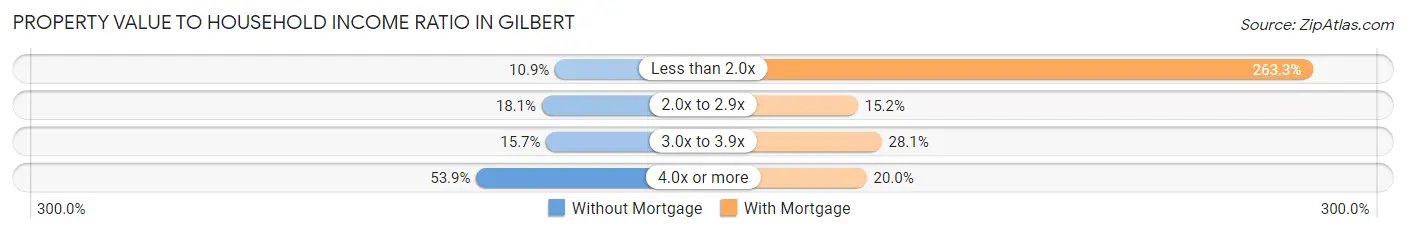
| Value-to-Income Ratio | Without Mortgage | With Mortgage |
| Less than 2.0x | 1,578 (10.9%) | 139,572 (263.3%) |
| 2.0x to 2.9x | 2,618 (18.1%) | 8,040 (15.2%) |
| 3.0x to 3.9x | 2,271 (15.7%) | 14,908 (28.1%) |
| 4.0x or more | 7,784 (53.9%) | 10,581 (20.0%) |
| Total | 14,439 (100.0%) | 53,001 (100.0%) |
Real Estate Taxes by Mortgage Status in Gilbert
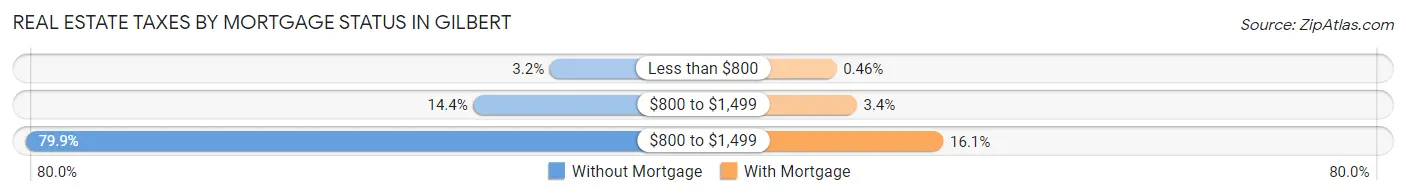
| Property Taxes | Without Mortgage | With Mortgage |
| Less than $800 | 467 (3.2%) | 244 (0.5%) |
| $800 to $1,499 | 2,079 (14.4%) | 1,816 (3.4%) |
| $800 to $1,499 | 11,532 (79.9%) | 8,522 (16.1%) |
| Total | 14,439 (100.0%) | 53,001 (100.0%) |
Health & Disability in Gilbert
Health Insurance Coverage by Age in Gilbert
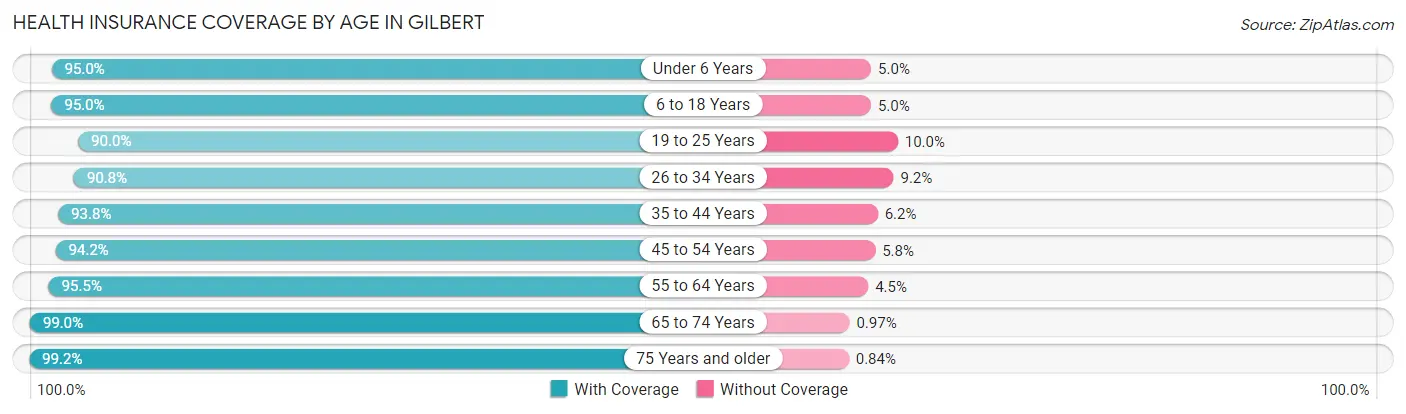
| Age Bracket | With Coverage | Without Coverage |
| Under 6 Years | 20,773 (95.0%) | 1,096 (5.0%) |
| 6 to 18 Years | 57,228 (95.0%) | 2,998 (5.0%) |
| 19 to 25 Years | 19,322 (90.0%) | 2,141 (10.0%) |
| 26 to 34 Years | 25,687 (90.8%) | 2,596 (9.2%) |
| 35 to 44 Years | 39,765 (93.8%) | 2,644 (6.2%) |
| 45 to 54 Years | 36,260 (94.2%) | 2,217 (5.8%) |
| 55 to 64 Years | 25,851 (95.5%) | 1,207 (4.5%) |
| 65 to 74 Years | 16,796 (99.0%) | 165 (1.0%) |
| 75 Years and older | 10,180 (99.2%) | 86 (0.8%) |
| Total | 251,862 (94.3%) | 15,150 (5.7%) |
Health Insurance Coverage by Citizenship Status in Gilbert
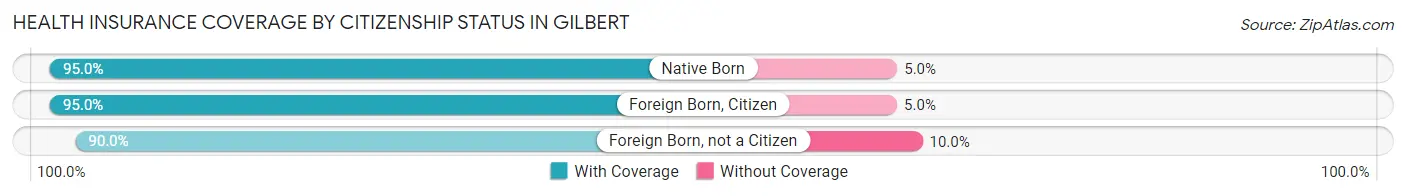
| Citizenship Status | With Coverage | Without Coverage |
| Native Born | 20,773 (95.0%) | 1,096 (5.0%) |
| Foreign Born, Citizen | 57,228 (95.0%) | 2,998 (5.0%) |
| Foreign Born, not a Citizen | 19,322 (90.0%) | 2,141 (10.0%) |
Health Insurance Coverage by Household Income in Gilbert
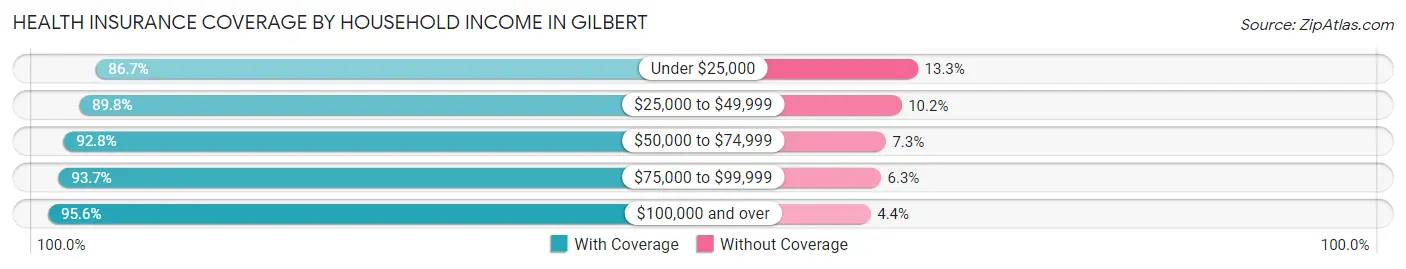
| Household Income | With Coverage | Without Coverage |
| Under $25,000 | 8,606 (86.7%) | 1,317 (13.3%) |
| $25,000 to $49,999 | 17,087 (89.8%) | 1,941 (10.2%) |
| $50,000 to $74,999 | 24,426 (92.7%) | 1,908 (7.2%) |
| $75,000 to $99,999 | 31,620 (93.7%) | 2,140 (6.3%) |
| $100,000 and over | 169,545 (95.6%) | 7,795 (4.4%) |
Public vs Private Health Insurance Coverage by Age in Gilbert
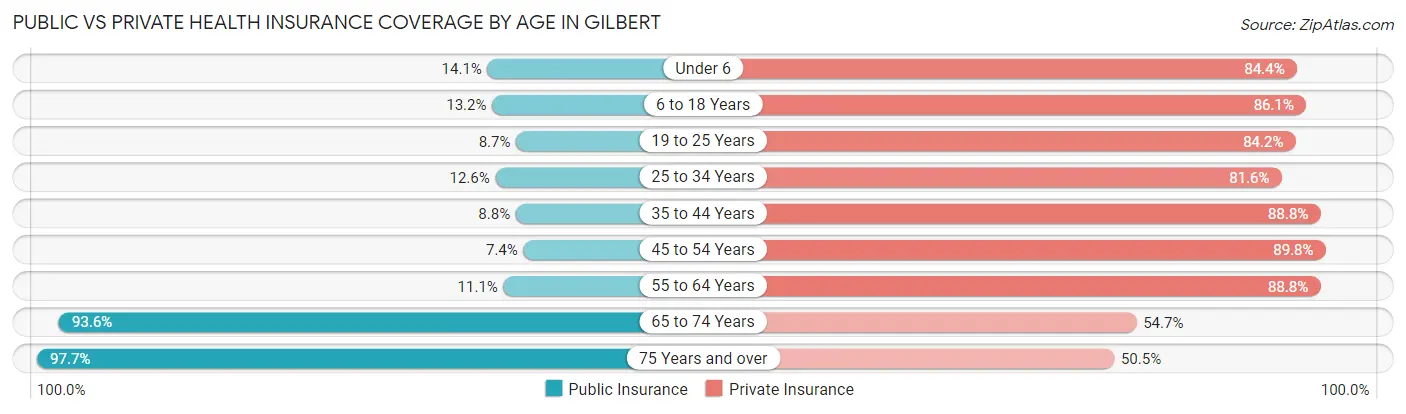
| Age Bracket | Public Insurance | Private Insurance |
| Under 6 | 3,072 (14.1%) | 18,458 (84.4%) |
| 6 to 18 Years | 7,944 (13.2%) | 51,860 (86.1%) |
| 19 to 25 Years | 1,876 (8.7%) | 18,063 (84.2%) |
| 25 to 34 Years | 3,558 (12.6%) | 23,073 (81.6%) |
| 35 to 44 Years | 3,727 (8.8%) | 37,651 (88.8%) |
| 45 to 54 Years | 2,838 (7.4%) | 34,534 (89.7%) |
| 55 to 64 Years | 2,999 (11.1%) | 24,020 (88.8%) |
| 65 to 74 Years | 15,880 (93.6%) | 9,270 (54.6%) |
| 75 Years and over | 10,026 (97.7%) | 5,186 (50.5%) |
| Total | 51,920 (19.4%) | 222,115 (83.2%) |
Disability Status by Sex by Age in Gilbert
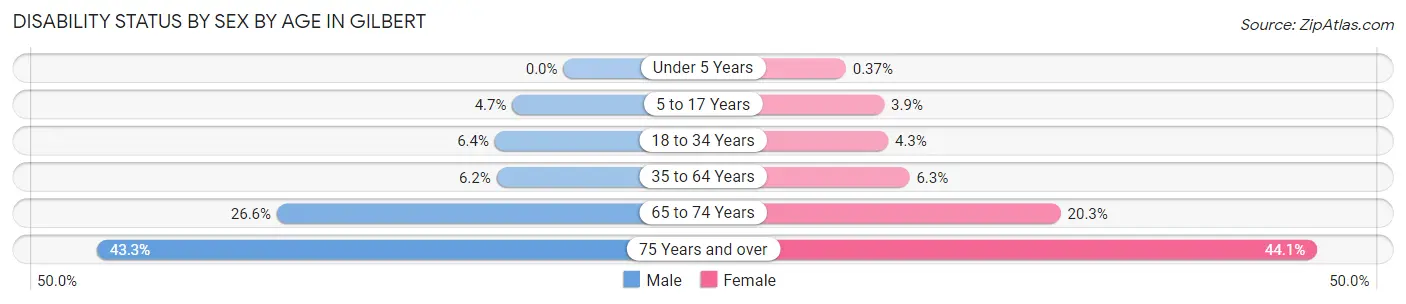
| Age Bracket | Male | Female |
| Under 5 Years | 0 (0.0%) | 34 (0.4%) |
| 5 to 17 Years | 1,452 (4.7%) | 1,181 (3.9%) |
| 18 to 34 Years | 1,747 (6.4%) | 1,112 (4.3%) |
| 35 to 64 Years | 3,332 (6.2%) | 3,404 (6.3%) |
| 65 to 74 Years | 2,022 (26.6%) | 1,901 (20.3%) |
| 75 Years and over | 1,836 (43.3%) | 2,657 (44.1%) |
Disability Class by Sex by Age in Gilbert
Disability Class: Hearing Difficulty
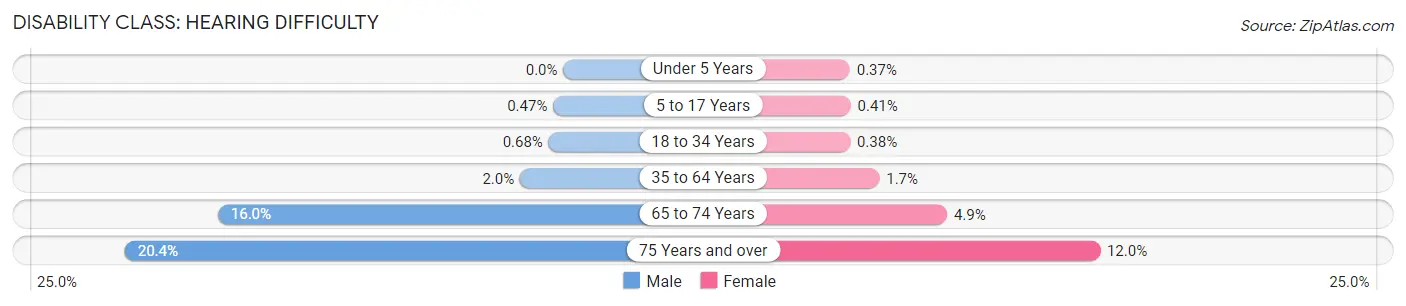
| Age Bracket | Male | Female |
| Under 5 Years | 0 (0.0%) | 34 (0.4%) |
| 5 to 17 Years | 145 (0.5%) | 124 (0.4%) |
| 18 to 34 Years | 188 (0.7%) | 99 (0.4%) |
| 35 to 64 Years | 1,081 (2.0%) | 943 (1.7%) |
| 65 to 74 Years | 1,219 (16.0%) | 457 (4.9%) |
| 75 Years and over | 863 (20.3%) | 722 (12.0%) |
Disability Class: Vision Difficulty
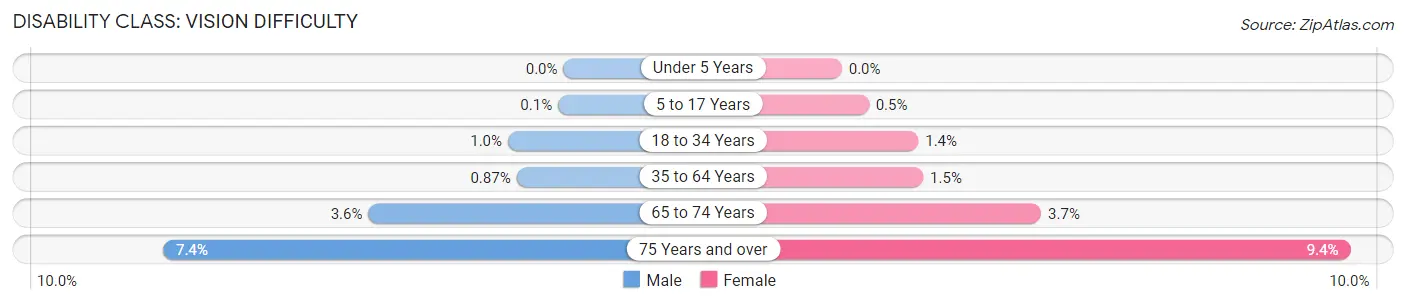
| Age Bracket | Male | Female |
| Under 5 Years | 0 (0.0%) | 0 (0.0%) |
| 5 to 17 Years | 32 (0.1%) | 149 (0.5%) |
| 18 to 34 Years | 283 (1.0%) | 369 (1.4%) |
| 35 to 64 Years | 466 (0.9%) | 819 (1.5%) |
| 65 to 74 Years | 275 (3.6%) | 346 (3.7%) |
| 75 Years and over | 315 (7.4%) | 569 (9.4%) |
Disability Class: Cognitive Difficulty
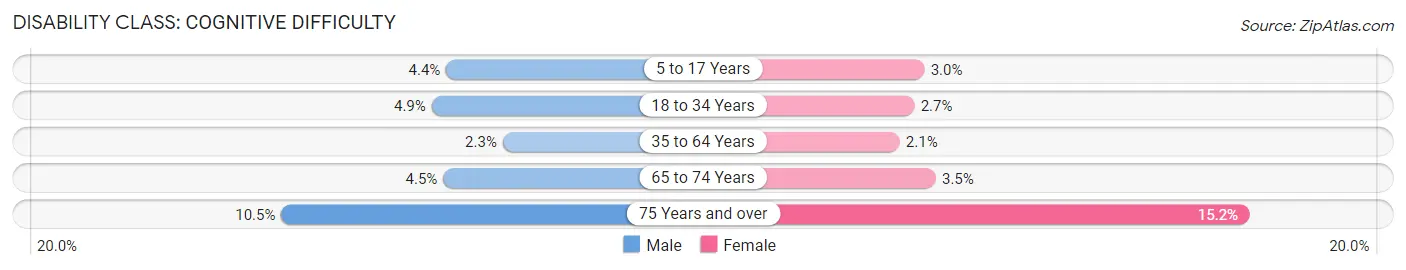
| Age Bracket | Male | Female |
| 5 to 17 Years | 1,335 (4.3%) | 914 (3.0%) |
| 18 to 34 Years | 1,343 (4.9%) | 693 (2.7%) |
| 35 to 64 Years | 1,211 (2.2%) | 1,150 (2.1%) |
| 65 to 74 Years | 339 (4.5%) | 324 (3.5%) |
| 75 Years and over | 444 (10.5%) | 913 (15.1%) |
Disability Class: Ambulatory Difficulty
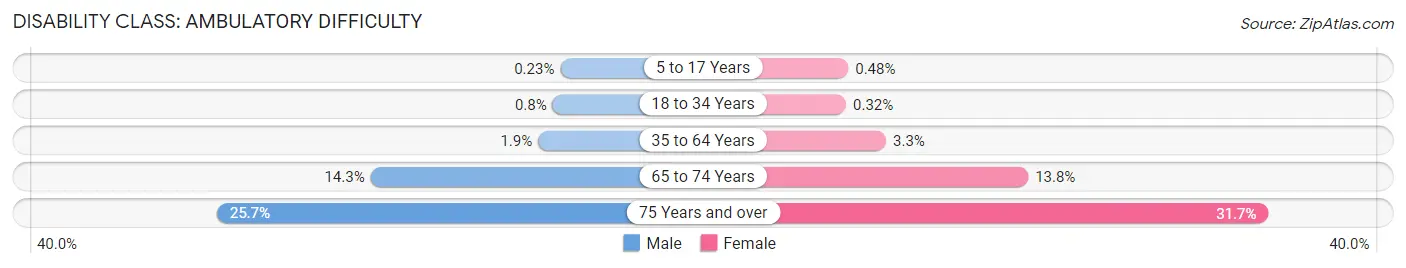
| Age Bracket | Male | Female |
| 5 to 17 Years | 69 (0.2%) | 145 (0.5%) |
| 18 to 34 Years | 220 (0.8%) | 84 (0.3%) |
| 35 to 64 Years | 1,010 (1.9%) | 1,783 (3.3%) |
| 65 to 74 Years | 1,089 (14.3%) | 1,295 (13.8%) |
| 75 Years and over | 1,091 (25.7%) | 1,908 (31.7%) |
Disability Class: Self-Care Difficulty
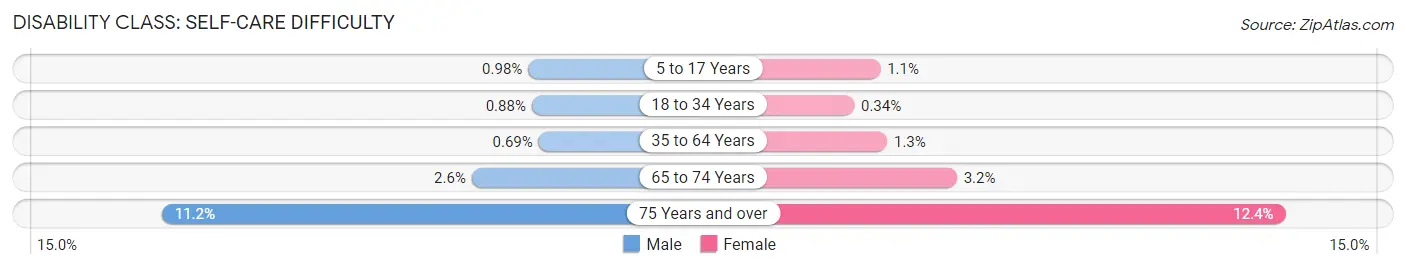
| Age Bracket | Male | Female |
| 5 to 17 Years | 299 (1.0%) | 322 (1.1%) |
| 18 to 34 Years | 243 (0.9%) | 88 (0.3%) |
| 35 to 64 Years | 369 (0.7%) | 685 (1.3%) |
| 65 to 74 Years | 194 (2.5%) | 299 (3.2%) |
| 75 Years and over | 474 (11.2%) | 744 (12.3%) |
Technology Access in Gilbert
Computing Device Access in Gilbert
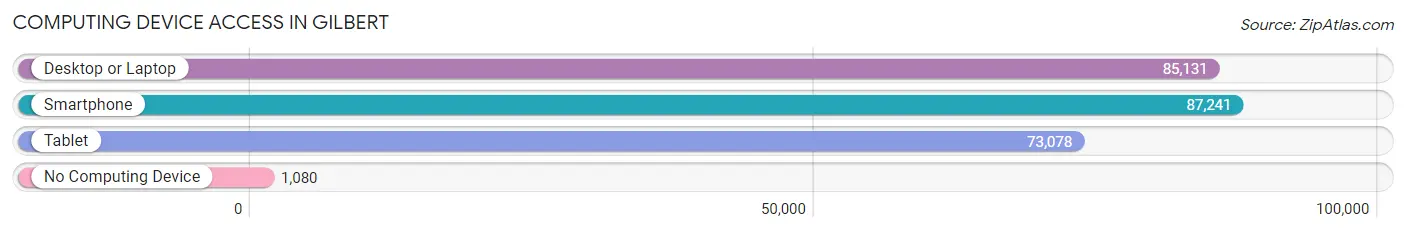
| Device Type | # Households | % Households |
| Desktop or Laptop | 85,131 | 94.3% |
| Smartphone | 87,241 | 96.6% |
| Tablet | 73,078 | 80.9% |
| No Computing Device | 1,080 | 1.2% |
| Total | 90,299 | 100.0% |
Internet Access in Gilbert
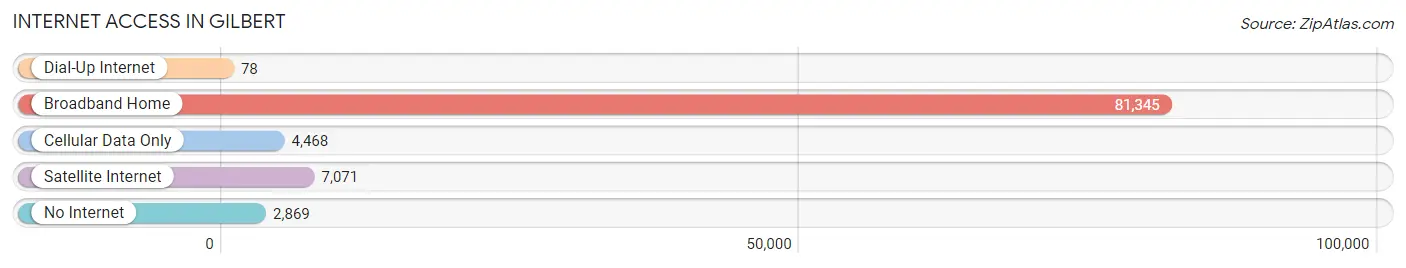
| Internet Type | # Households | % Households |
| Dial-Up Internet | 78 | 0.1% |
| Broadband Home | 81,345 | 90.1% |
| Cellular Data Only | 4,468 | 5.0% |
| Satellite Internet | 7,071 | 7.8% |
| No Internet | 2,869 | 3.2% |
| Total | 90,299 | 100.0% |
Gilbert Summary
Gilbert, Arizona is a town located in Maricopa County, Arizona, United States. It is a suburb of Phoenix and is the sixth-largest municipality in Arizona. The town was founded in 1902 and incorporated in 1920. As of the 2010 census, the population of Gilbert was 208,453, making it the most populous incorporated town in the United States.
Geography
Gilbert is located in the southeastern part of Maricopa County, Arizona, approximately 20 miles southeast of Phoenix. It is bordered by the cities of Mesa to the north, Chandler to the west, and Queen Creek to the south. The town is situated in the Salt River Valley, and is surrounded by the Superstition Mountains to the east and the San Tan Mountains to the west. The town has a total area of 76.6 square miles, of which 76.5 square miles is land and 0.1 square miles is water.
Climate
Gilbert has a hot desert climate, with hot summers and mild winters. The average high temperature in July is 106°F, and the average low temperature in January is 43°F. The town receives an average of 8.5 inches of precipitation per year, with the majority of it falling in the summer months.
Demographics
As of the 2010 census, there were 208,453 people, 68,739 households, and 54,117 families residing in the town. The population density was 2,717.2 people per square mile. The racial makeup of the town was 79.2% White, 4.2% African American, 0.8% Native American, 3.8% Asian, 0.1% Pacific Islander, 8.6% from other races, and 3.3% from two or more races. Hispanic or Latino of any race were 22.9% of the population.
Economy
Gilbert is home to a diverse economy, with a variety of industries represented. The town is home to several large employers, including Banner Health, GoDaddy, and Orbital ATK. The town is also home to a number of small businesses, including restaurants, retail stores, and professional services. The town is also home to a number of technology companies, including Intel, Honeywell, and Avnet.
The town has a strong tourism industry, with a number of attractions, including the Riparian Preserve at Water Ranch, the Gilbert Historical Museum, and the Gilbert Art Walk. The town is also home to a number of annual events, including the Gilbert Days Festival, the Gilbert Music Festival, and the Gilbert Global Village Festival.
Conclusion
Gilbert, Arizona is a vibrant and growing town located in Maricopa County, Arizona. The town has a diverse economy, with a variety of industries represented, and is home to several large employers. The town is also home to a number of small businesses, and is a popular tourist destination. The town has a hot desert climate, with hot summers and mild winters, and a population of 208,453 as of the 2010 census.
Common Questions
What is Per Capita Income in Gilbert?
Per Capita income in Gilbert is $46,964.
What is the Median Family Income in Gilbert?
Median Family Income in Gilbert is $127,707.
What is the Median Household income in Gilbert?
Median Household Income in Gilbert is $115,179.
What is Income or Wage Gap in Gilbert?
Income or Wage Gap in Gilbert is 36.4%.
Women in Gilbert earn 63.6 cents for every dollar earned by a man.
What is Family Income Deficit in Gilbert?
Family Income Deficit in Gilbert is $11,646.
Families that are below poverty line in Gilbert earn $11,646 less on average than the poverty threshold level.
What is Inequality or Gini Index in Gilbert?
Inequality or Gini Index in Gilbert is 0.38.
What is the Total Population of Gilbert?
Total Population of Gilbert is 267,267.
What is the Total Male Population of Gilbert?
Total Male Population of Gilbert is 132,259.
What is the Total Female Population of Gilbert?
Total Female Population of Gilbert is 135,008.
What is the Ratio of Males per 100 Females in Gilbert?
There are 97.96 Males per 100 Females in Gilbert.
What is the Ratio of Females per 100 Males in Gilbert?
There are 102.08 Females per 100 Males in Gilbert.
What is the Median Population Age in Gilbert?
Median Population Age in Gilbert is 35.4 Years.
What is the Average Family Size in Gilbert
Average Family Size in Gilbert is 3.3 People.
What is the Average Household Size in Gilbert
Average Household Size in Gilbert is 3.0 People.
How Large is the Labor Force in Gilbert?
There are 143,073 People in the Labor Forcein in Gilbert.
What is the Percentage of People in the Labor Force in Gilbert?
72.0% of People are in the Labor Force in Gilbert.
What is the Unemployment Rate in Gilbert?
Unemployment Rate in Gilbert is 3.5%.