Kansas City, MO Map & Demographics
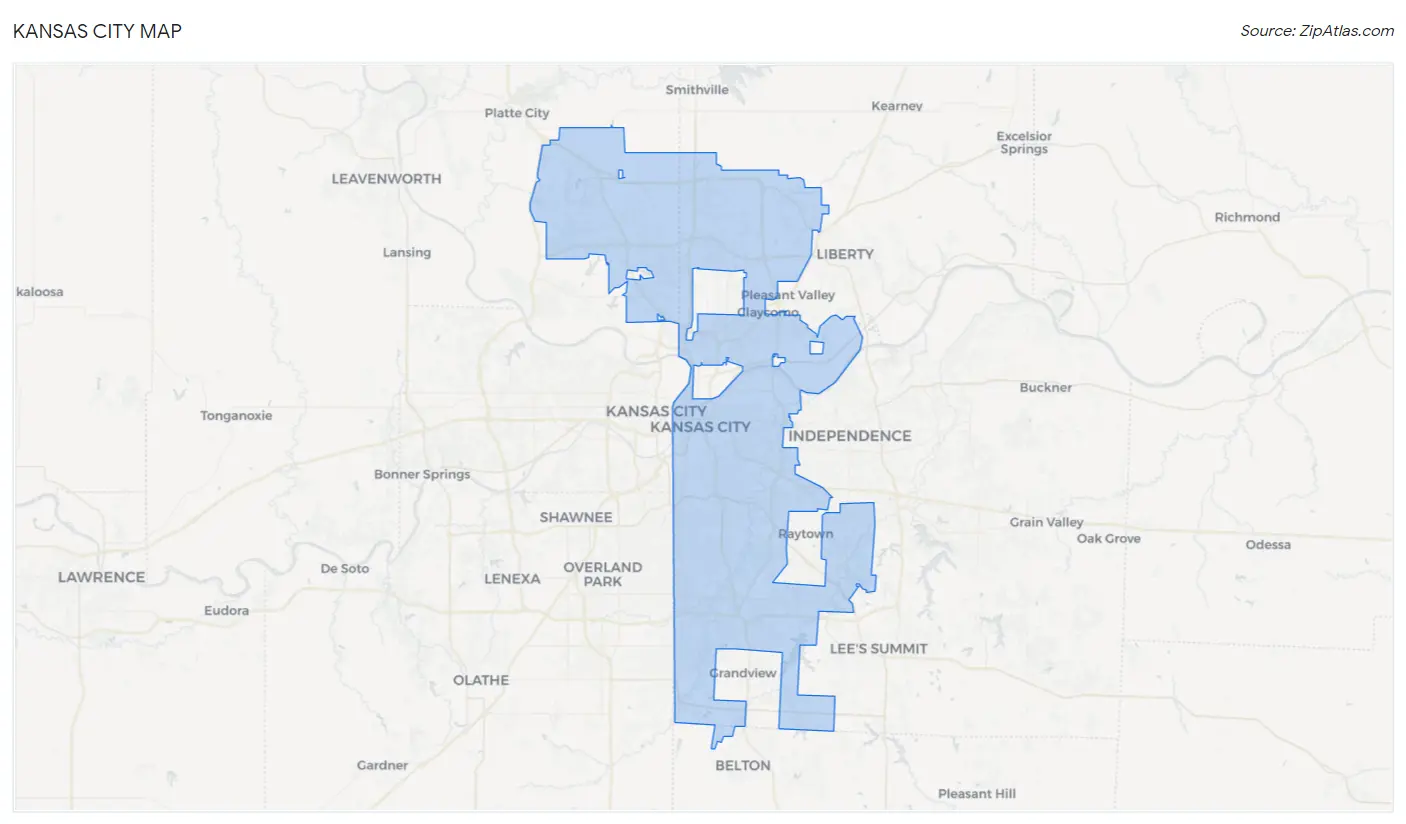
Kansas City Map
Kansas City Overview
$38,146
PER CAPITA INCOME
$85,631
AVG FAMILY INCOME
$65,256
AVG HOUSEHOLD INCOME
22.6%
WAGE / INCOME GAP [ % ]
77.4¢/ $1
WAGE / INCOME GAP [ $ ]
$11,225
FAMILY INCOME DEFICIT
0.47
INEQUALITY / GINI INDEX
505,958
TOTAL POPULATION
245,393
MALE POPULATION
260,565
FEMALE POPULATION
94.18
MALES / 100 FEMALES
106.18
FEMALES / 100 MALES
35.4
MEDIAN AGE
3.1
AVG FAMILY SIZE
2.3
AVG HOUSEHOLD SIZE
279,135
LABOR FORCE [ PEOPLE ]
69.0%
PERCENT IN LABOR FORCE
4.8%
UNEMPLOYMENT RATE
Kansas City Zip Codes
Kansas City Area Codes
Income in Kansas City
Income Overview in Kansas City
Per Capita Income in Kansas City is $38,146, while median incomes of families and households are $85,631 and $65,256 respectively.
| Characteristic | Number | Measure |
| Per Capita Income | 505,958 | $38,146 |
| Median Family Income | 115,353 | $85,631 |
| Mean Family Income | 115,353 | $108,224 |
| Median Household Income | 216,513 | $65,256 |
| Mean Household Income | 216,513 | $87,670 |
| Income Deficit | 115,353 | $11,225 |
| Wage / Income Gap (%) | 505,958 | 22.58% |
| Wage / Income Gap ($) | 505,958 | 77.42¢ per $1 |
| Gini / Inequality Index | 505,958 | 0.47 |
Earnings by Sex in Kansas City
Average Earnings in Kansas City are $41,731, $47,170 for men and $36,521 for women, a difference of 22.6%.
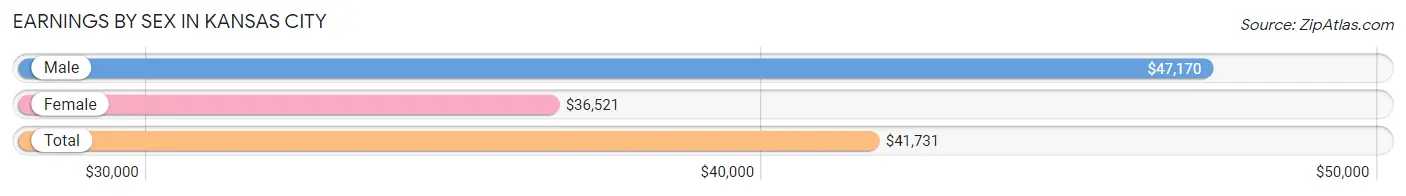
| Sex | Number | Average Earnings |
| Male | 146,075 (50.6%) | $47,170 |
| Female | 142,339 (49.3%) | $36,521 |
| Total | 288,414 (100.0%) | $41,731 |
Earnings by Sex by Income Bracket in Kansas City
The most common earnings brackets in Kansas City are $100,000+ for men (23,390 | 16.0%) and $75,000 to $99,999 for women (11,489 | 8.1%).
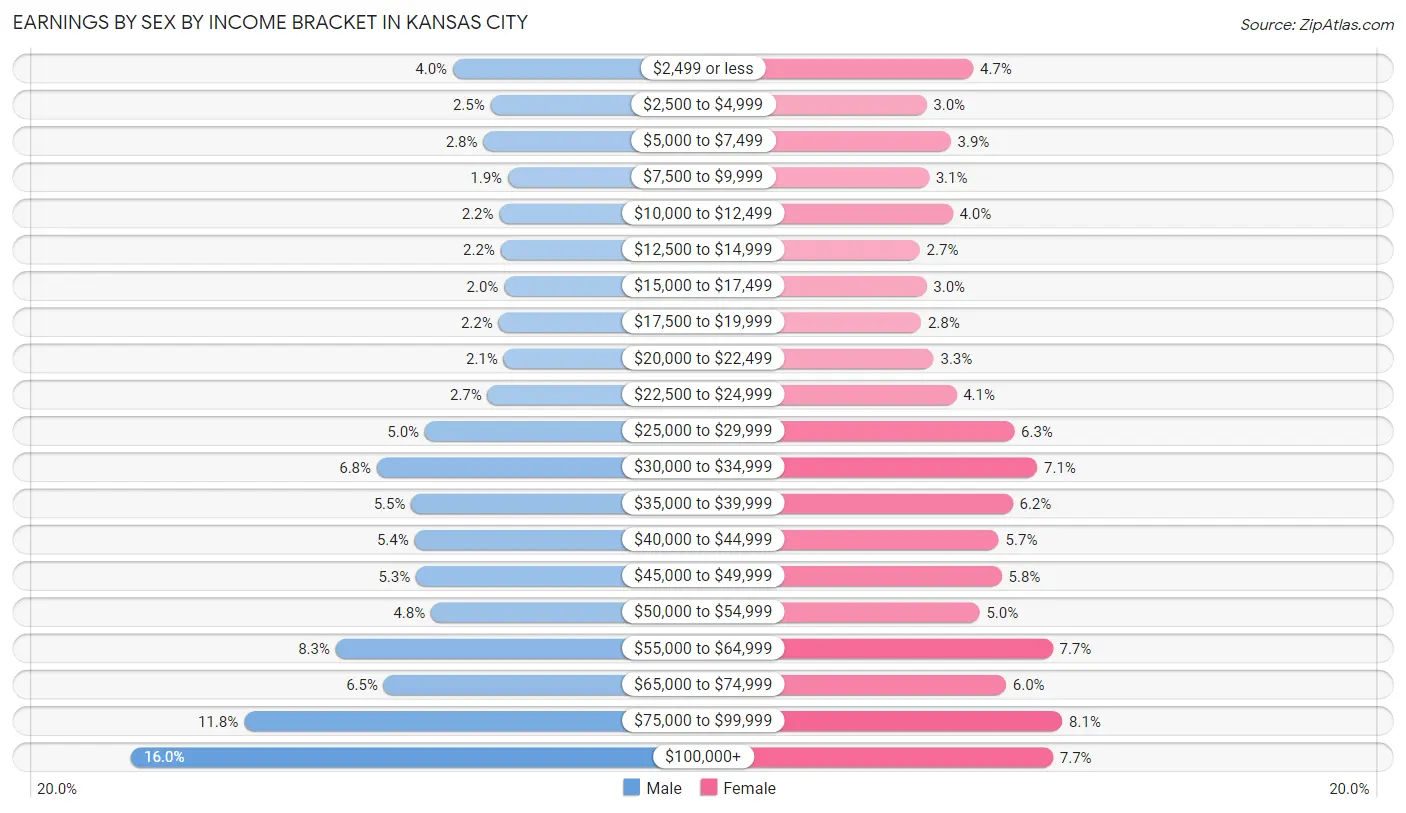
| Income | Male | Female |
| $2,499 or less | 5,769 (4.0%) | 6,730 (4.7%) |
| $2,500 to $4,999 | 3,713 (2.5%) | 4,244 (3.0%) |
| $5,000 to $7,499 | 4,107 (2.8%) | 5,544 (3.9%) |
| $7,500 to $9,999 | 2,758 (1.9%) | 4,373 (3.1%) |
| $10,000 to $12,499 | 3,233 (2.2%) | 5,639 (4.0%) |
| $12,500 to $14,999 | 3,156 (2.2%) | 3,881 (2.7%) |
| $15,000 to $17,499 | 2,963 (2.0%) | 4,239 (3.0%) |
| $17,500 to $19,999 | 3,266 (2.2%) | 3,950 (2.8%) |
| $20,000 to $22,499 | 3,001 (2.1%) | 4,631 (3.3%) |
| $22,500 to $24,999 | 3,868 (2.6%) | 5,838 (4.1%) |
| $25,000 to $29,999 | 7,306 (5.0%) | 8,922 (6.3%) |
| $30,000 to $34,999 | 9,937 (6.8%) | 10,146 (7.1%) |
| $35,000 to $39,999 | 8,049 (5.5%) | 8,837 (6.2%) |
| $40,000 to $44,999 | 7,868 (5.4%) | 8,092 (5.7%) |
| $45,000 to $49,999 | 7,780 (5.3%) | 8,260 (5.8%) |
| $50,000 to $54,999 | 6,969 (4.8%) | 7,080 (5.0%) |
| $55,000 to $64,999 | 12,182 (8.3%) | 10,972 (7.7%) |
| $65,000 to $74,999 | 9,554 (6.5%) | 8,482 (6.0%) |
| $75,000 to $99,999 | 17,206 (11.8%) | 11,489 (8.1%) |
| $100,000+ | 23,390 (16.0%) | 10,990 (7.7%) |
| Total | 146,075 (100.0%) | 142,339 (100.0%) |
Earnings by Sex by Educational Attainment in Kansas City
Average earnings in Kansas City are $53,171 for men and $41,330 for women, a difference of 22.3%. Men with an educational attainment of graduate degree enjoy the highest average annual earnings of $84,560, while those with less than high school education earn the least with $32,657. Women with an educational attainment of graduate degree earn the most with the average annual earnings of $64,783, while those with less than high school education have the smallest earnings of $22,070.
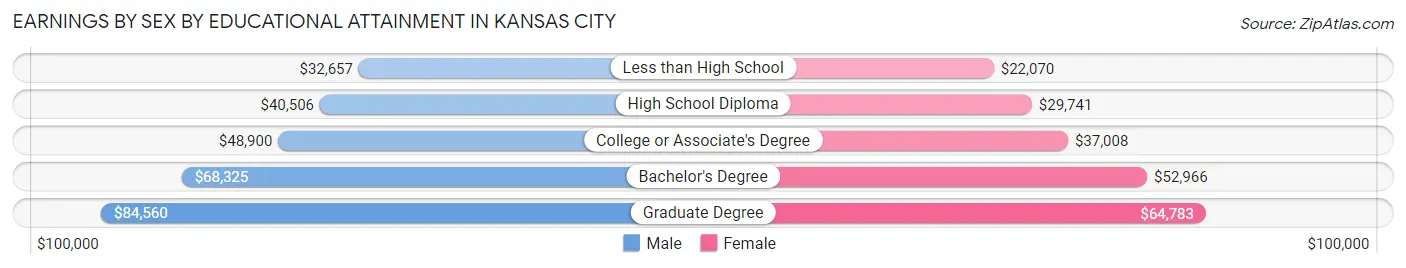
| Educational Attainment | Male Income | Female Income |
| Less than High School | $32,657 | $22,070 |
| High School Diploma | $40,506 | $29,741 |
| College or Associate's Degree | $48,900 | $37,008 |
| Bachelor's Degree | $68,325 | $52,966 |
| Graduate Degree | $84,560 | $64,783 |
| Total | $53,171 | $41,330 |
Family Income in Kansas City
Family Income Brackets in Kansas City
According to the Kansas City family income data, there are 23,301 families falling into the $100,000 to $149,999 income range, which is the most common income bracket and makes up 20.2% of all families. Conversely, the $10,000 to $14,999 income bracket is the least frequent group with only 2,538 families (2.2%) belonging to this category.
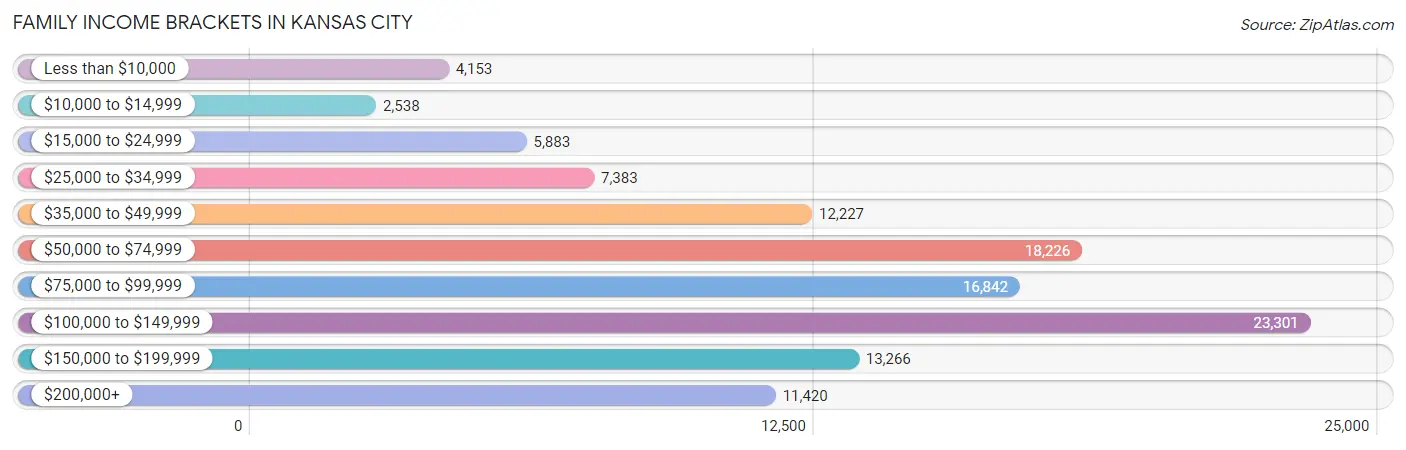
| Income Bracket | # Families | % Families |
| Less than $10,000 | 4,153 | 3.6% |
| $10,000 to $14,999 | 2,538 | 2.2% |
| $15,000 to $24,999 | 5,883 | 5.1% |
| $25,000 to $34,999 | 7,383 | 6.4% |
| $35,000 to $49,999 | 12,227 | 10.6% |
| $50,000 to $74,999 | 18,226 | 15.8% |
| $75,000 to $99,999 | 16,842 | 14.6% |
| $100,000 to $149,999 | 23,301 | 20.2% |
| $150,000 to $199,999 | 13,266 | 11.5% |
| $200,000+ | 11,420 | 9.9% |
Family Income by Famaliy Size in Kansas City
4-person families (20,132 | 17.4%) account for the highest median family income in Kansas City with $102,730 per family, while 2-person families (54,801 | 47.5%) have the highest median income of $39,572 per family member.
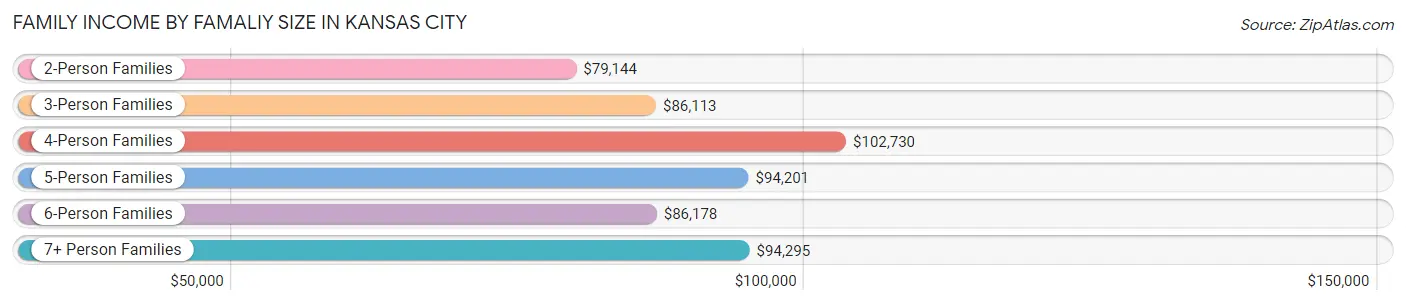
| Income Bracket | # Families | Median Income |
| 2-Person Families | 54,801 (47.5%) | $79,144 |
| 3-Person Families | 25,569 (22.2%) | $86,113 |
| 4-Person Families | 20,132 (17.4%) | $102,730 |
| 5-Person Families | 8,681 (7.5%) | $94,201 |
| 6-Person Families | 4,195 (3.6%) | $86,178 |
| 7+ Person Families | 1,975 (1.7%) | $94,295 |
| Total | 115,353 (100.0%) | $85,631 |
Family Income by Number of Earners in Kansas City
The median family income in Kansas City is $85,631, with families comprising 3+ earners (11,819) having the highest median family income of $137,254, while families with no earners (14,193) have the lowest median family income of $43,503, accounting for 10.2% and 12.3% of families, respectively.
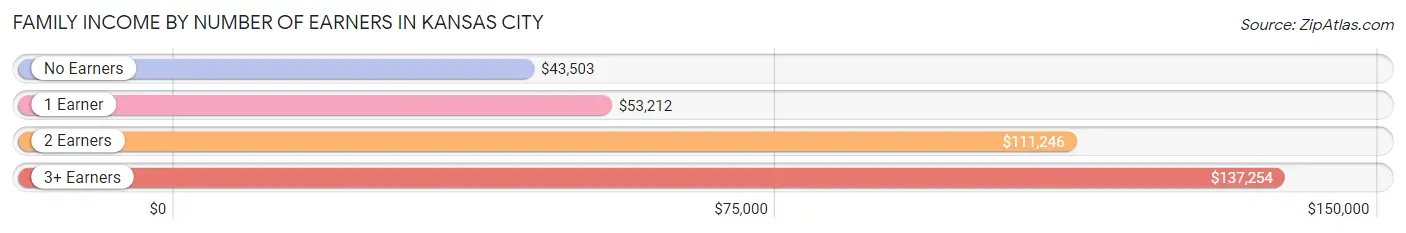
| Number of Earners | # Families | Median Income |
| No Earners | 14,193 (12.3%) | $43,503 |
| 1 Earner | 37,558 (32.6%) | $53,212 |
| 2 Earners | 51,783 (44.9%) | $111,246 |
| 3+ Earners | 11,819 (10.2%) | $137,254 |
| Total | 115,353 (100.0%) | $85,631 |
Household Income in Kansas City
Household Income Brackets in Kansas City
With 36,158 households falling in the category, the $50,000 to $74,999 income range is the most frequent in Kansas City, accounting for 16.7% of all households. In contrast, only 9,527 households (4.4%) fall into the $10,000 to $14,999 income bracket, making it the least populous group.
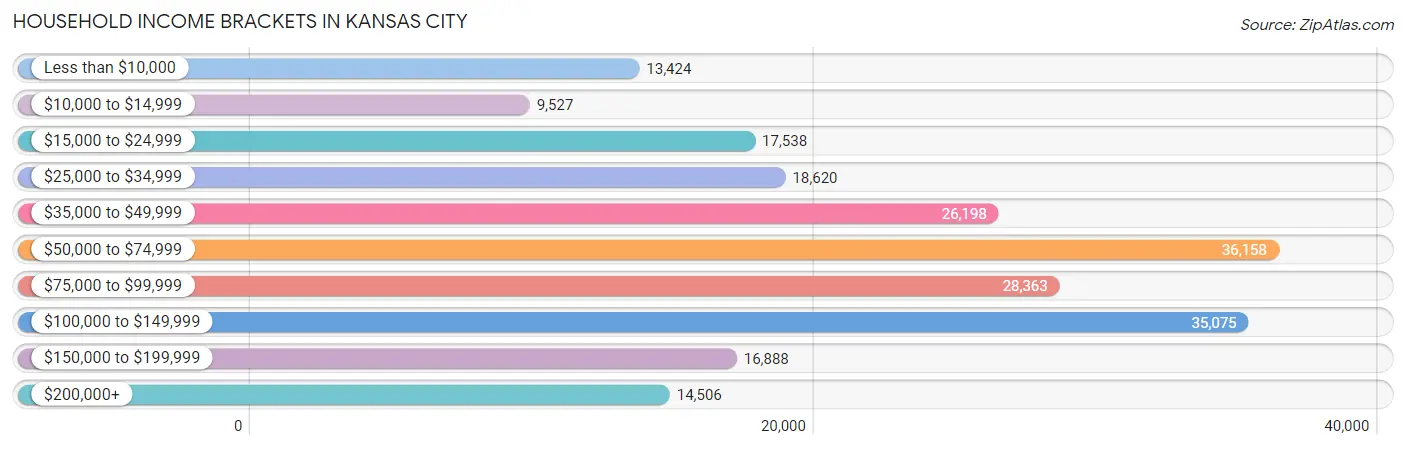
| Income Bracket | # Households | % Households |
| Less than $10,000 | 13,424 | 6.2% |
| $10,000 to $14,999 | 9,527 | 4.4% |
| $15,000 to $24,999 | 17,538 | 8.1% |
| $25,000 to $34,999 | 18,620 | 8.6% |
| $35,000 to $49,999 | 26,198 | 12.1% |
| $50,000 to $74,999 | 36,158 | 16.7% |
| $75,000 to $99,999 | 28,363 | 13.1% |
| $100,000 to $149,999 | 35,075 | 16.2% |
| $150,000 to $199,999 | 16,888 | 7.8% |
| $200,000+ | 14,506 | 6.7% |
Household Income by Householder Age in Kansas City
The median household income in Kansas City is $65,256, with the highest median household income of $74,283 found in the 25 to 44 years age bracket for the primary householder. A total of 85,940 households (39.7%) fall into this category. Meanwhile, the 15 to 24 years age bracket for the primary householder has the lowest median household income of $38,170, with 12,709 households (5.9%) in this group.
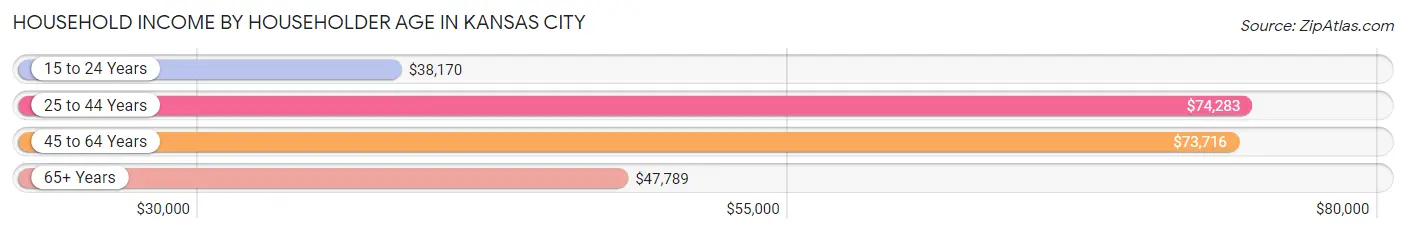
| Income Bracket | # Households | Median Income |
| 15 to 24 Years | 12,709 (5.9%) | $38,170 |
| 25 to 44 Years | 85,940 (39.7%) | $74,283 |
| 45 to 64 Years | 71,527 (33.0%) | $73,716 |
| 65+ Years | 46,337 (21.4%) | $47,789 |
| Total | 216,513 (100.0%) | $65,256 |
Poverty in Kansas City
Income Below Poverty by Sex and Age in Kansas City
With 13.5% poverty level for males and 16.2% for females among the residents of Kansas City, 5 year old males and 5 year old females are the most vulnerable to poverty, with 809 males (26.3%) and 844 females (25.7%) in their respective age groups living below the poverty level.
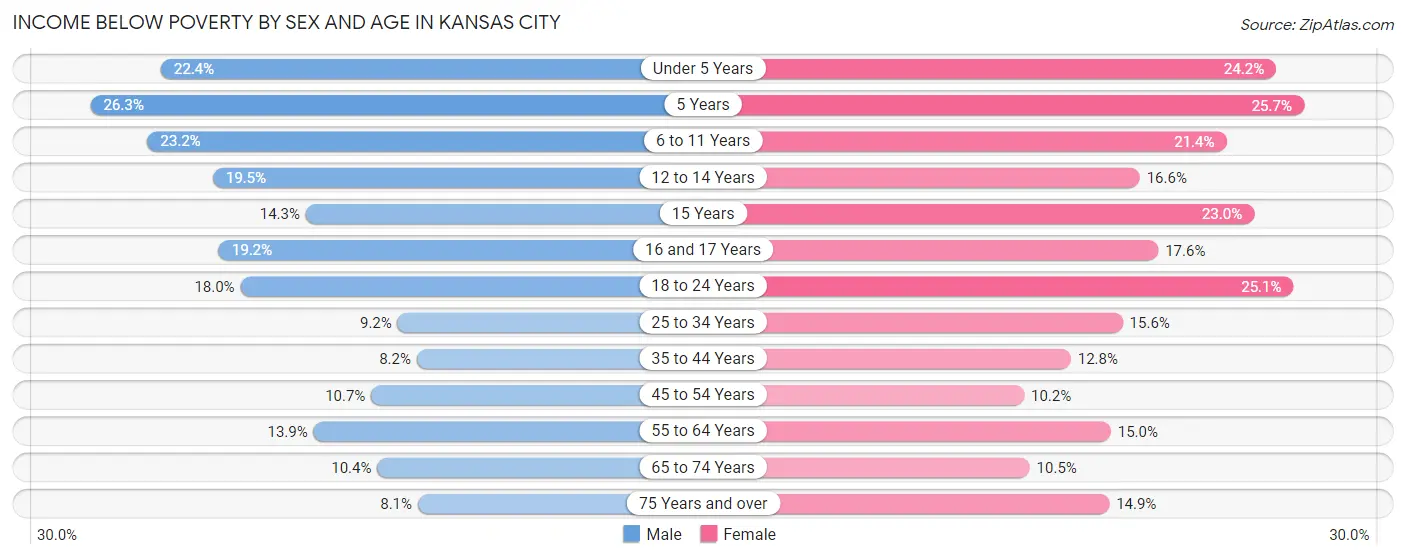
| Age Bracket | Male | Female |
| Under 5 Years | 3,528 (22.4%) | 3,672 (24.2%) |
| 5 Years | 809 (26.3%) | 844 (25.7%) |
| 6 to 11 Years | 4,512 (23.2%) | 4,033 (21.4%) |
| 12 to 14 Years | 1,739 (19.5%) | 1,453 (16.6%) |
| 15 Years | 453 (14.3%) | 752 (23.0%) |
| 16 and 17 Years | 1,210 (19.2%) | 1,008 (17.6%) |
| 18 to 24 Years | 3,747 (18.0%) | 5,968 (25.1%) |
| 25 to 34 Years | 3,964 (9.2%) | 7,066 (15.6%) |
| 35 to 44 Years | 2,798 (8.2%) | 4,281 (12.8%) |
| 45 to 54 Years | 2,981 (10.7%) | 2,936 (10.2%) |
| 55 to 64 Years | 4,055 (13.9%) | 4,659 (15.0%) |
| 65 to 74 Years | 1,996 (10.4%) | 2,413 (10.5%) |
| 75 Years and over | 795 (8.1%) | 2,429 (14.9%) |
| Total | 32,587 (13.5%) | 41,514 (16.2%) |
Income Above Poverty by Sex and Age in Kansas City
According to the poverty statistics in Kansas City, males aged 75 years and over and females aged 45 to 54 years are the age groups that are most secure financially, with 91.9% of males and 89.8% of females in these age groups living above the poverty line.
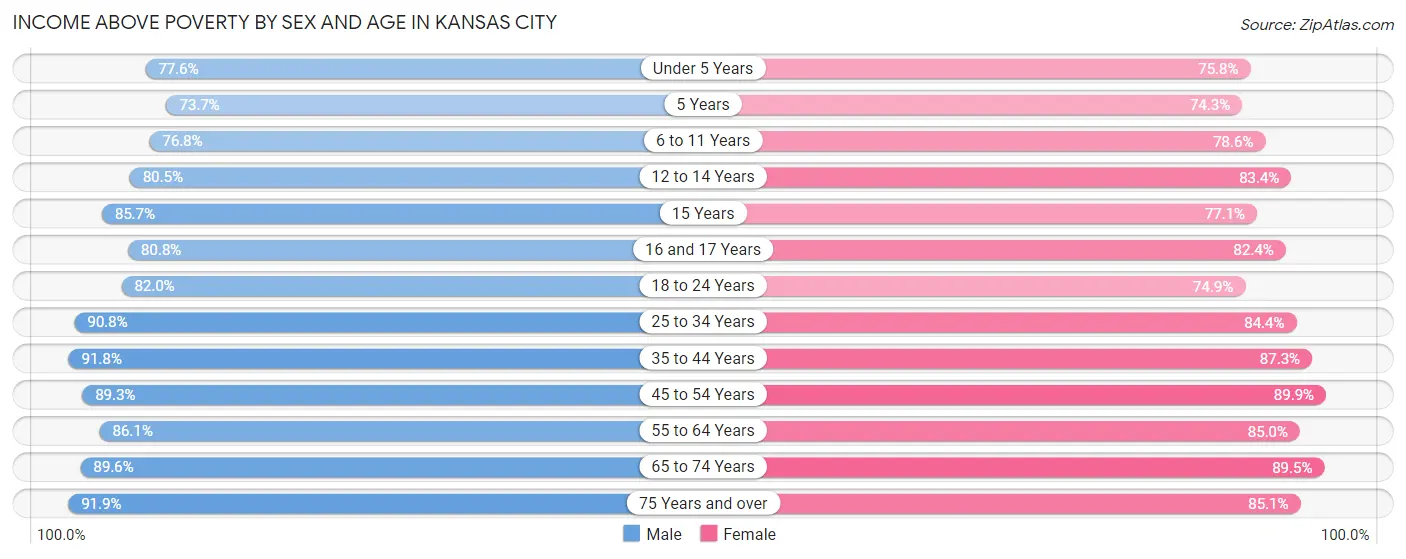
| Age Bracket | Male | Female |
| Under 5 Years | 12,216 (77.6%) | 11,512 (75.8%) |
| 5 Years | 2,263 (73.7%) | 2,438 (74.3%) |
| 6 to 11 Years | 14,967 (76.8%) | 14,807 (78.6%) |
| 12 to 14 Years | 7,169 (80.5%) | 7,306 (83.4%) |
| 15 Years | 2,707 (85.7%) | 2,524 (77.0%) |
| 16 and 17 Years | 5,098 (80.8%) | 4,712 (82.4%) |
| 18 to 24 Years | 17,089 (82.0%) | 17,769 (74.9%) |
| 25 to 34 Years | 38,985 (90.8%) | 38,108 (84.4%) |
| 35 to 44 Years | 31,473 (91.8%) | 29,284 (87.3%) |
| 45 to 54 Years | 24,867 (89.3%) | 25,981 (89.8%) |
| 55 to 64 Years | 25,107 (86.1%) | 26,441 (85.0%) |
| 65 to 74 Years | 17,275 (89.6%) | 20,650 (89.5%) |
| 75 Years and over | 9,024 (91.9%) | 13,881 (85.1%) |
| Total | 208,240 (86.5%) | 215,413 (83.8%) |
Income Below Poverty Among Married-Couple Families in Kansas City
The poverty statistics for married-couple families in Kansas City show that 4.3% or 3,326 of the total 77,314 families live below the poverty line. Families with 5 or more children have the highest poverty rate of 23.5%, comprising of 219 families. On the other hand, families with no children have the lowest poverty rate of 2.9%, which includes 1,277 families.
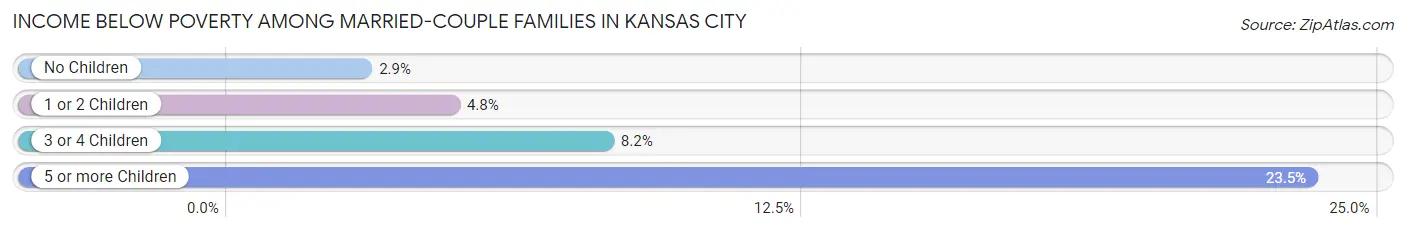
| Children | Above Poverty | Below Poverty |
| No Children | 42,426 (97.1%) | 1,277 (2.9%) |
| 1 or 2 Children | 23,981 (95.2%) | 1,218 (4.8%) |
| 3 or 4 Children | 6,868 (91.8%) | 612 (8.2%) |
| 5 or more Children | 713 (76.5%) | 219 (23.5%) |
| Total | 73,988 (95.7%) | 3,326 (4.3%) |
Income Below Poverty Among Single-Parent Households in Kansas City
According to the poverty data in Kansas City, 10.0% or 971 single-father households and 27.1% or 7,677 single-mother households are living below the poverty line. Among single-father households, those with 5 or more children have the highest poverty rate, with 71 households (78.9%) experiencing poverty. Likewise, among single-mother households, those with 5 or more children have the highest poverty rate, with 488 households (79.0%) falling below the poverty line.
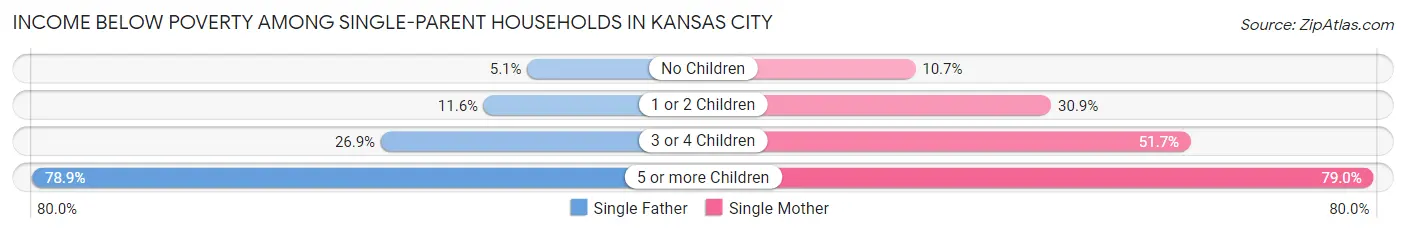
| Children | Single Father | Single Mother |
| No Children | 245 (5.1%) | 1,123 (10.7%) |
| 1 or 2 Children | 478 (11.6%) | 4,197 (30.9%) |
| 3 or 4 Children | 177 (26.9%) | 1,869 (51.7%) |
| 5 or more Children | 71 (78.9%) | 488 (79.0%) |
| Total | 971 (10.0%) | 7,677 (27.1%) |
Income Below Poverty Among Married-Couple vs Single-Parent Households in Kansas City
The poverty data for Kansas City shows that 3,326 of the married-couple family households (4.3%) and 8,648 of the single-parent households (22.7%) are living below the poverty level. Within the married-couple family households, those with 5 or more children have the highest poverty rate, with 219 households (23.5%) falling below the poverty line. Among the single-parent households, those with 5 or more children have the highest poverty rate, with 559 household (78.9%) living below poverty.
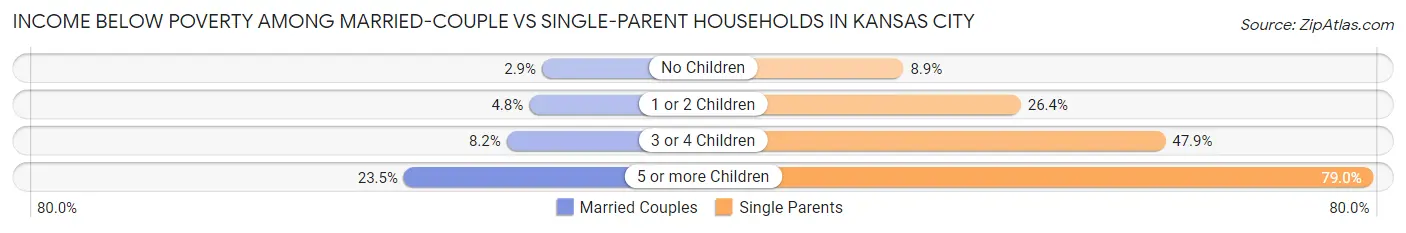
| Children | Married-Couple Families | Single-Parent Households |
| No Children | 1,277 (2.9%) | 1,368 (8.9%) |
| 1 or 2 Children | 1,218 (4.8%) | 4,675 (26.4%) |
| 3 or 4 Children | 612 (8.2%) | 2,046 (47.9%) |
| 5 or more Children | 219 (23.5%) | 559 (78.9%) |
| Total | 3,326 (4.3%) | 8,648 (22.7%) |
Race in Kansas City
The most populous races in Kansas City are White / Caucasian (298,718 | 59.0%), Black / African American (132,741 | 26.2%), and Hispanic or Latino (56,115 | 11.1%).
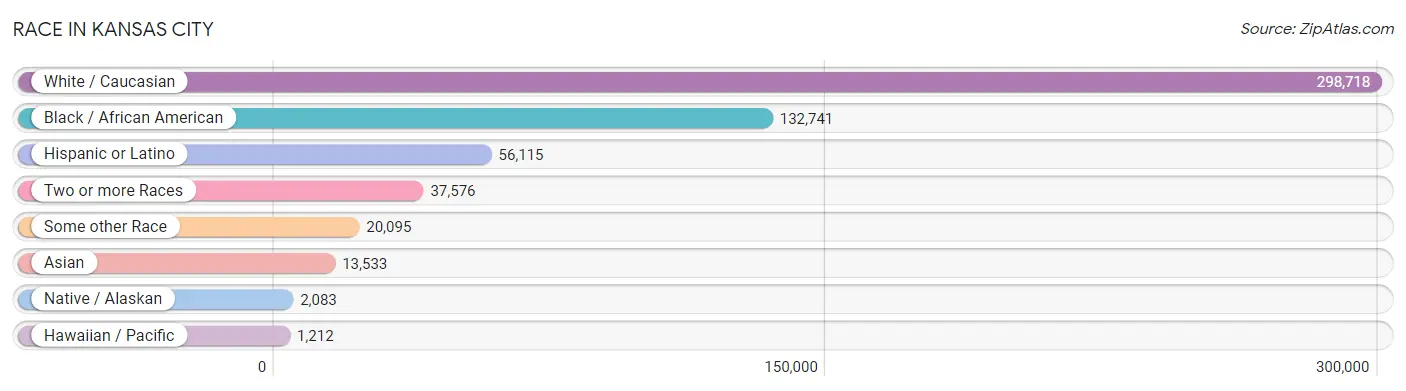
| Race | # Population | % Population |
| Asian | 13,533 | 2.7% |
| Black / African American | 132,741 | 26.2% |
| Hawaiian / Pacific | 1,212 | 0.2% |
| Hispanic or Latino | 56,115 | 11.1% |
| Native / Alaskan | 2,083 | 0.4% |
| White / Caucasian | 298,718 | 59.0% |
| Two or more Races | 37,576 | 7.4% |
| Some other Race | 20,095 | 4.0% |
| Total | 505,958 | 100.0% |
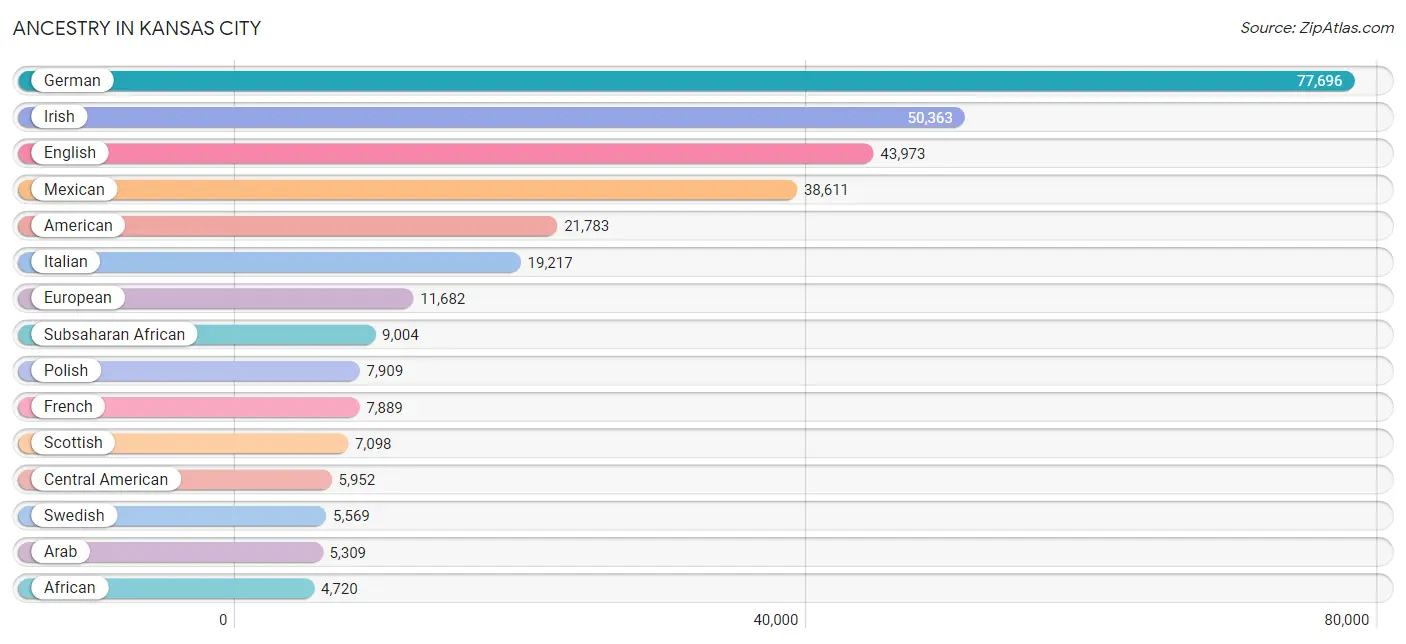
Ancestry in Kansas City
The most populous ancestries reported in Kansas City are German (77,696 | 15.4%), Irish (50,363 | 10.0%), English (43,973 | 8.7%), Mexican (38,611 | 7.6%), and American (21,783 | 4.3%), together accounting for 45.9% of all Kansas City residents.
| Ancestry | # Population | % Population |
| Afghan | 261 | 0.1% |
| African | 4,720 | 0.9% |
| Alaska Native | 13 | 0.0% |
| Albanian | 20 | 0.0% |
| Aleut | 8 | 0.0% |
| American | 21,783 | 4.3% |
| Apache | 79 | 0.0% |
| Arab | 5,309 | 1.1% |
| Argentinean | 130 | 0.0% |
| Armenian | 121 | 0.0% |
| Assyrian / Chaldean / Syriac | 7 | 0.0% |
| Australian | 266 | 0.1% |
| Austrian | 805 | 0.2% |
| Bahamian | 55 | 0.0% |
| Bangladeshi | 12 | 0.0% |
| Barbadian | 10 | 0.0% |
| Belgian | 934 | 0.2% |
| Belizean | 18 | 0.0% |
| Bhutanese | 1,298 | 0.3% |
| Blackfeet | 653 | 0.1% |
| Bolivian | 131 | 0.0% |
| Brazilian | 128 | 0.0% |
| British | 2,701 | 0.5% |
| British West Indian | 21 | 0.0% |
| Bulgarian | 76 | 0.0% |
| Burmese | 1,258 | 0.3% |
| Cajun | 7 | 0.0% |
| Cambodian | 30 | 0.0% |
| Canadian | 620 | 0.1% |
| Celtic | 33 | 0.0% |
| Central American | 5,952 | 1.2% |
| Central American Indian | 365 | 0.1% |
| Cherokee | 2,357 | 0.5% |
| Cheyenne | 31 | 0.0% |
| Chickasaw | 34 | 0.0% |
| Chilean | 173 | 0.0% |
| Chippewa | 121 | 0.0% |
| Choctaw | 565 | 0.1% |
| Colombian | 1,173 | 0.2% |
| Comanche | 67 | 0.0% |
| Costa Rican | 53 | 0.0% |
| Cree | 43 | 0.0% |
| Creek | 193 | 0.0% |
| Croatian | 1,116 | 0.2% |
| Crow | 14 | 0.0% |
| Cuban | 2,100 | 0.4% |
| Czech | 2,296 | 0.4% |
| Czechoslovakian | 196 | 0.0% |
| Danish | 1,408 | 0.3% |
| Delaware | 4 | 0.0% |
| Dominican | 412 | 0.1% |
| Dutch | 3,676 | 0.7% |
| Dutch West Indian | 32 | 0.0% |
| Eastern European | 982 | 0.2% |
| Ecuadorian | 112 | 0.0% |
| Egyptian | 693 | 0.1% |
| English | 43,973 | 8.7% |
| Estonian | 10 | 0.0% |
| Ethiopian | 625 | 0.1% |
| European | 11,682 | 2.3% |
| Fijian | 38 | 0.0% |
| Filipino | 89 | 0.0% |
| Finnish | 441 | 0.1% |
| French | 7,889 | 1.6% |
| French American Indian | 38 | 0.0% |
| French Canadian | 758 | 0.2% |
| German | 77,696 | 15.4% |
| German Russian | 156 | 0.0% |
| Ghanaian | 224 | 0.0% |
| Greek | 1,282 | 0.3% |
| Guamanian / Chamorro | 76 | 0.0% |
| Guatemalan | 1,728 | 0.3% |
| Guyanese | 28 | 0.0% |
| Haitian | 867 | 0.2% |
| Honduran | 1,980 | 0.4% |
| Hungarian | 551 | 0.1% |
| Icelander | 120 | 0.0% |
| Indian (Asian) | 2,854 | 0.6% |
| Indonesian | 396 | 0.1% |
| Inupiat | 7 | 0.0% |
| Iranian | 403 | 0.1% |
| Iraqi | 1,025 | 0.2% |
| Irish | 50,363 | 10.0% |
| Iroquois | 60 | 0.0% |
| Israeli | 32 | 0.0% |
| Italian | 19,217 | 3.8% |
| Jamaican | 763 | 0.2% |
| Japanese | 444 | 0.1% |
| Jordanian | 176 | 0.0% |
| Kenyan | 295 | 0.1% |
| Korean | 3,374 | 0.7% |
| Laotian | 67 | 0.0% |
| Latvian | 47 | 0.0% |
| Lebanese | 511 | 0.1% |
| Liberian | 119 | 0.0% |
| Lithuanian | 382 | 0.1% |
| Lumbee | 24 | 0.0% |
| Luxembourger | 83 | 0.0% |
| Malaysian | 171 | 0.0% |
| Mexican | 38,611 | 7.6% |
| Mexican American Indian | 772 | 0.2% |
| Mongolian | 127 | 0.0% |
| Moroccan | 336 | 0.1% |
| Native Hawaiian | 522 | 0.1% |
| Navajo | 122 | 0.0% |
| New Zealander | 69 | 0.0% |
| Nicaraguan | 173 | 0.0% |
| Nigerian | 921 | 0.2% |
| Northern European | 642 | 0.1% |
| Norwegian | 4,084 | 0.8% |
| Osage | 113 | 0.0% |
| Ottawa | 63 | 0.0% |
| Pakistani | 274 | 0.1% |
| Palestinian | 405 | 0.1% |
| Panamanian | 111 | 0.0% |
| Pennsylvania German | 126 | 0.0% |
| Peruvian | 285 | 0.1% |
| Polish | 7,909 | 1.6% |
| Portuguese | 180 | 0.0% |
| Potawatomi | 62 | 0.0% |
| Pueblo | 28 | 0.0% |
| Puerto Rican | 2,876 | 0.6% |
| Puget Sound Salish | 23 | 0.0% |
| Romanian | 64 | 0.0% |
| Russian | 1,925 | 0.4% |
| Salvadoran | 1,857 | 0.4% |
| Samoan | 387 | 0.1% |
| Scandinavian | 1,501 | 0.3% |
| Scotch-Irish | 4,443 | 0.9% |
| Scottish | 7,098 | 1.4% |
| Seminole | 95 | 0.0% |
| Serbian | 29 | 0.0% |
| Shoshone | 46 | 0.0% |
| Sierra Leonean | 147 | 0.0% |
| Sioux | 320 | 0.1% |
| Slavic | 133 | 0.0% |
| Slovak | 233 | 0.1% |
| Slovene | 75 | 0.0% |
| Somali | 722 | 0.1% |
| South African | 95 | 0.0% |
| South American | 2,555 | 0.5% |
| South American Indian | 20 | 0.0% |
| Spaniard | 599 | 0.1% |
| Spanish | 1,460 | 0.3% |
| Sri Lankan | 3,392 | 0.7% |
| Subsaharan African | 9,004 | 1.8% |
| Sudanese | 93 | 0.0% |
| Swedish | 5,569 | 1.1% |
| Swiss | 1,105 | 0.2% |
| Syrian | 499 | 0.1% |
| Thai | 3,747 | 0.7% |
| Tlingit-Haida | 5 | 0.0% |
| Trinidadian and Tobagonian | 188 | 0.0% |
| Turkish | 419 | 0.1% |
| U.S. Virgin Islander | 9 | 0.0% |
| Ugandan | 308 | 0.1% |
| Ukrainian | 640 | 0.1% |
| Uruguayan | 53 | 0.0% |
| Venezuelan | 490 | 0.1% |
| Vietnamese | 105 | 0.0% |
| Welsh | 2,763 | 0.5% |
| West Indian | 151 | 0.0% |
| Yaqui | 10 | 0.0% |
| Yugoslavian | 328 | 0.1% |
| Zimbabwean | 7 | 0.0% | View All 165 Rows |
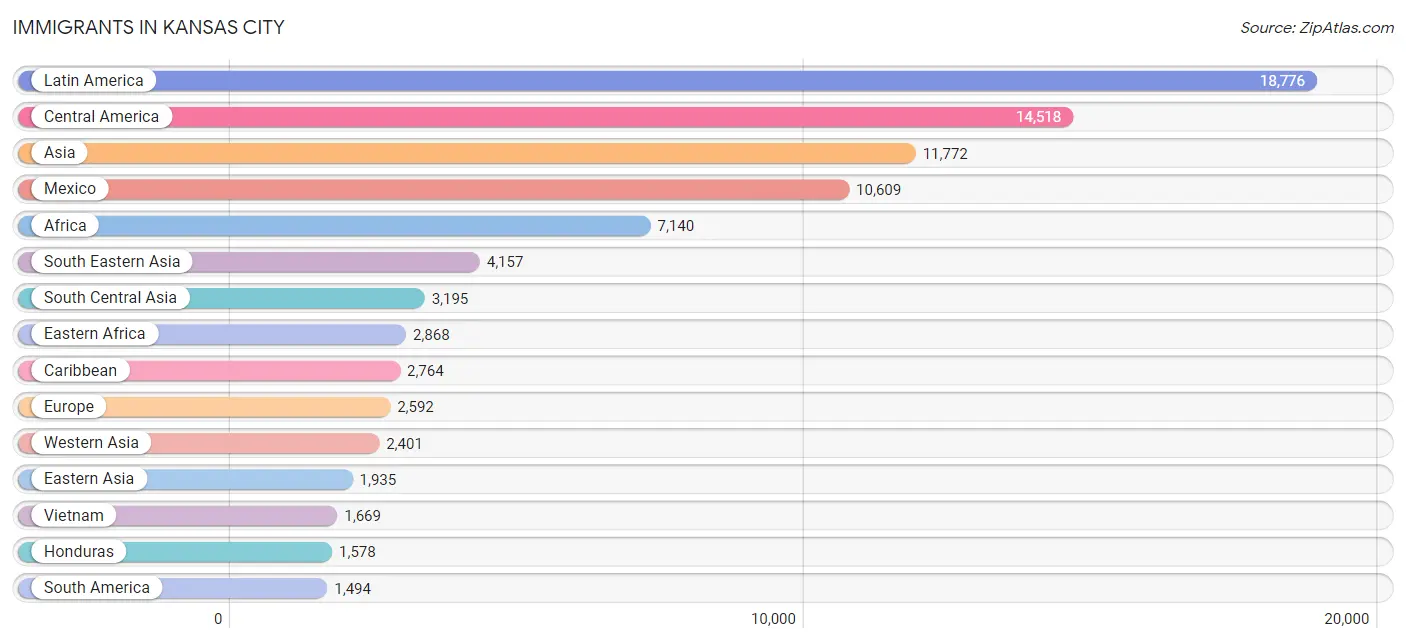
Immigrants in Kansas City
The most numerous immigrant groups reported in Kansas City came from Latin America (18,776 | 3.7%), Central America (14,518 | 2.9%), Asia (11,772 | 2.3%), Mexico (10,609 | 2.1%), and Africa (7,140 | 1.4%), together accounting for 12.4% of all Kansas City residents.
| Immigration Origin | # Population | % Population |
| Afghanistan | 213 | 0.0% |
| Africa | 7,140 | 1.4% |
| Argentina | 129 | 0.0% |
| Asia | 11,772 | 2.3% |
| Australia | 229 | 0.1% |
| Bahamas | 39 | 0.0% |
| Bangladesh | 553 | 0.1% |
| Belarus | 28 | 0.0% |
| Belgium | 9 | 0.0% |
| Belize | 15 | 0.0% |
| Bolivia | 135 | 0.0% |
| Bosnia and Herzegovina | 213 | 0.0% |
| Brazil | 155 | 0.0% |
| Bulgaria | 82 | 0.0% |
| Cambodia | 260 | 0.1% |
| Cameroon | 149 | 0.0% |
| Canada | 390 | 0.1% |
| Caribbean | 2,764 | 0.5% |
| Central America | 14,518 | 2.9% |
| Chile | 62 | 0.0% |
| China | 1,294 | 0.3% |
| Colombia | 336 | 0.1% |
| Congo | 305 | 0.1% |
| Costa Rica | 28 | 0.0% |
| Cuba | 1,346 | 0.3% |
| Czechoslovakia | 18 | 0.0% |
| Denmark | 19 | 0.0% |
| Dominican Republic | 305 | 0.1% |
| Eastern Africa | 2,868 | 0.6% |
| Eastern Asia | 1,935 | 0.4% |
| Eastern Europe | 819 | 0.2% |
| Ecuador | 41 | 0.0% |
| Egypt | 442 | 0.1% |
| El Salvador | 965 | 0.2% |
| England | 326 | 0.1% |
| Eritrea | 39 | 0.0% |
| Ethiopia | 700 | 0.1% |
| Europe | 2,592 | 0.5% |
| Fiji | 36 | 0.0% |
| France | 76 | 0.0% |
| Germany | 475 | 0.1% |
| Ghana | 151 | 0.0% |
| Greece | 76 | 0.0% |
| Guatemala | 1,215 | 0.2% |
| Guyana | 28 | 0.0% |
| Haiti | 385 | 0.1% |
| Honduras | 1,578 | 0.3% |
| Hong Kong | 62 | 0.0% |
| Hungary | 22 | 0.0% |
| India | 1,254 | 0.3% |
| Indonesia | 64 | 0.0% |
| Iran | 284 | 0.1% |
| Iraq | 1,392 | 0.3% |
| Ireland | 61 | 0.0% |
| Israel | 67 | 0.0% |
| Italy | 186 | 0.0% |
| Jamaica | 564 | 0.1% |
| Japan | 224 | 0.0% |
| Jordan | 162 | 0.0% |
| Kazakhstan | 40 | 0.0% |
| Kenya | 929 | 0.2% |
| Korea | 387 | 0.1% |
| Kuwait | 86 | 0.0% |
| Laos | 164 | 0.0% |
| Latin America | 18,776 | 3.7% |
| Lebanon | 40 | 0.0% |
| Liberia | 273 | 0.1% |
| Malaysia | 103 | 0.0% |
| Mexico | 10,609 | 2.1% |
| Micronesia | 315 | 0.1% |
| Middle Africa | 860 | 0.2% |
| Morocco | 236 | 0.1% |
| Nepal | 140 | 0.0% |
| Netherlands | 35 | 0.0% |
| Nicaragua | 108 | 0.0% |
| Nigeria | 686 | 0.1% |
| Northern Africa | 1,155 | 0.2% |
| Northern Europe | 711 | 0.1% |
| Oceania | 714 | 0.1% |
| Pakistan | 581 | 0.1% |
| Peru | 200 | 0.0% |
| Philippines | 1,193 | 0.2% |
| Poland | 164 | 0.0% |
| Portugal | 37 | 0.0% |
| Romania | 25 | 0.0% |
| Russia | 114 | 0.0% |
| Saudi Arabia | 63 | 0.0% |
| Scotland | 58 | 0.0% |
| Senegal | 30 | 0.0% |
| Serbia | 33 | 0.0% |
| Sierra Leone | 137 | 0.0% |
| Somalia | 737 | 0.2% |
| South Africa | 89 | 0.0% |
| South America | 1,494 | 0.3% |
| South Central Asia | 3,195 | 0.6% |
| South Eastern Asia | 4,157 | 0.8% |
| Southern Europe | 444 | 0.1% |
| Spain | 145 | 0.0% |
| Sri Lanka | 69 | 0.0% |
| Sudan | 386 | 0.1% |
| Sweden | 6 | 0.0% |
| Switzerland | 23 | 0.0% |
| Syria | 281 | 0.1% |
| Taiwan | 225 | 0.0% |
| Thailand | 423 | 0.1% |
| Trinidad and Tobago | 88 | 0.0% |
| Turkey | 191 | 0.0% |
| Uganda | 116 | 0.0% |
| Ukraine | 50 | 0.0% |
| Uruguay | 53 | 0.0% |
| Venezuela | 355 | 0.1% |
| Vietnam | 1,669 | 0.3% |
| Western Africa | 1,312 | 0.3% |
| Western Asia | 2,401 | 0.5% |
| Western Europe | 618 | 0.1% |
| Yemen | 71 | 0.0% |
| Zaire | 406 | 0.1% |
| Zimbabwe | 76 | 0.0% | View All 118 Rows |
Sex and Age in Kansas City
Sex and Age in Kansas City
The most populous age groups in Kansas City are 25 to 29 Years (22,615 | 9.2%) for men and 25 to 29 Years (23,063 | 8.8%) for women.
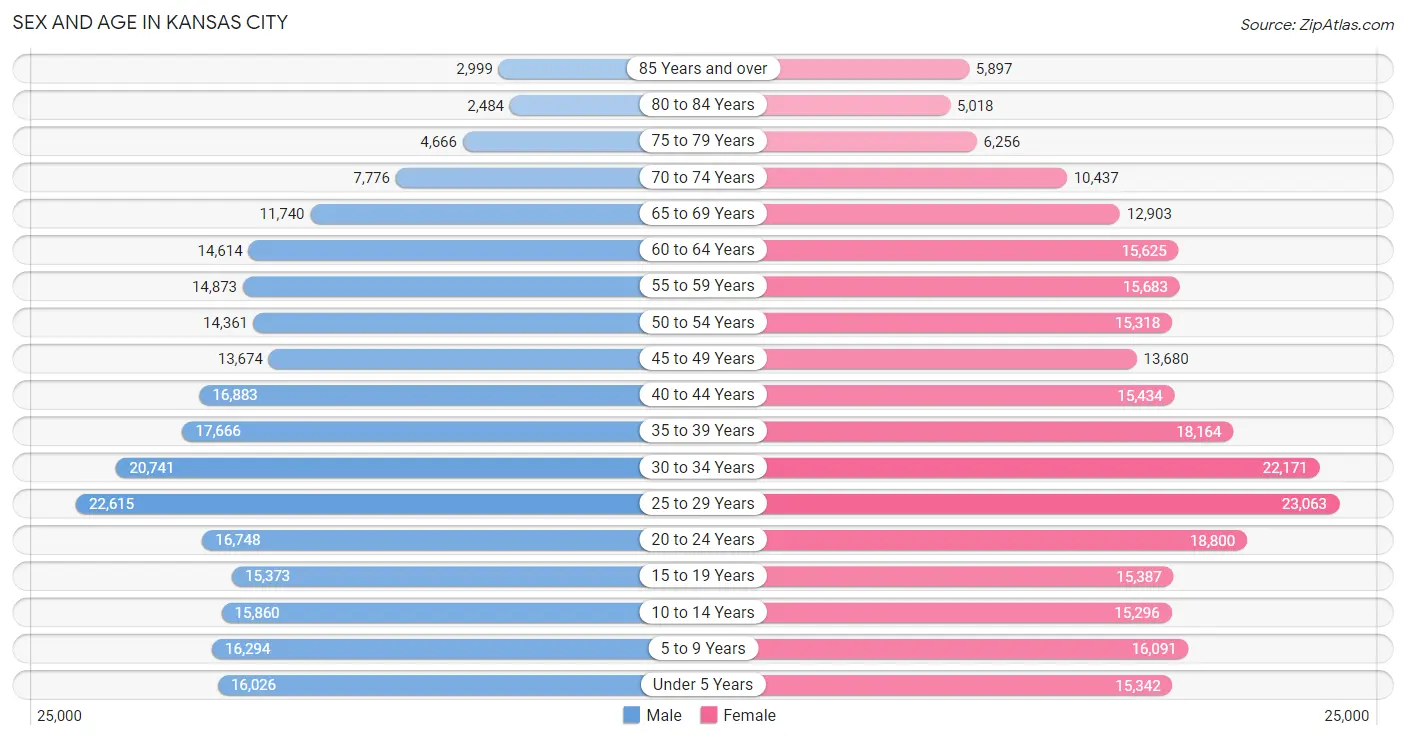
| Age Bracket | Male | Female |
| Under 5 Years | 16,026 (6.5%) | 15,342 (5.9%) |
| 5 to 9 Years | 16,294 (6.6%) | 16,091 (6.2%) |
| 10 to 14 Years | 15,860 (6.5%) | 15,296 (5.9%) |
| 15 to 19 Years | 15,373 (6.3%) | 15,387 (5.9%) |
| 20 to 24 Years | 16,748 (6.8%) | 18,800 (7.2%) |
| 25 to 29 Years | 22,615 (9.2%) | 23,063 (8.8%) |
| 30 to 34 Years | 20,741 (8.5%) | 22,171 (8.5%) |
| 35 to 39 Years | 17,666 (7.2%) | 18,164 (7.0%) |
| 40 to 44 Years | 16,883 (6.9%) | 15,434 (5.9%) |
| 45 to 49 Years | 13,674 (5.6%) | 13,680 (5.2%) |
| 50 to 54 Years | 14,361 (5.9%) | 15,318 (5.9%) |
| 55 to 59 Years | 14,873 (6.1%) | 15,683 (6.0%) |
| 60 to 64 Years | 14,614 (6.0%) | 15,625 (6.0%) |
| 65 to 69 Years | 11,740 (4.8%) | 12,903 (5.0%) |
| 70 to 74 Years | 7,776 (3.2%) | 10,437 (4.0%) |
| 75 to 79 Years | 4,666 (1.9%) | 6,256 (2.4%) |
| 80 to 84 Years | 2,484 (1.0%) | 5,018 (1.9%) |
| 85 Years and over | 2,999 (1.2%) | 5,897 (2.3%) |
| Total | 245,393 (100.0%) | 260,565 (100.0%) |
Families and Households in Kansas City
Median Family Size in Kansas City
The median family size in Kansas City is 3.11 persons per family, with married-couple families (77,314 | 67.0%) accounting for the largest median family size of 3.16 persons per family. On the other hand, single male/father families (9,705 | 8.4%) represent the smallest median family size with 2.70 persons per family.
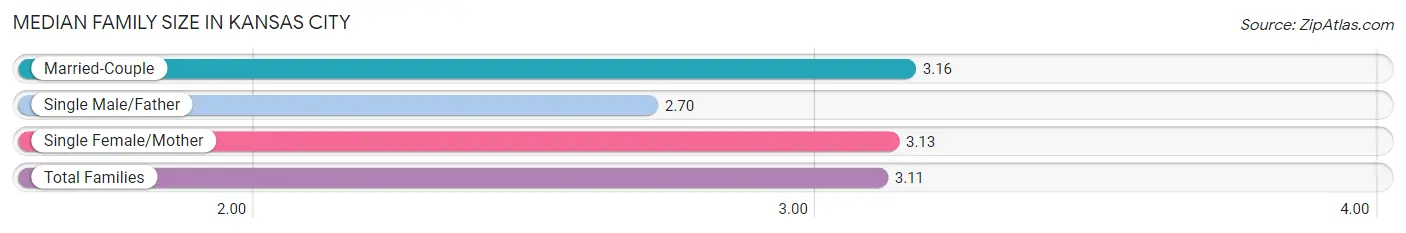
| Family Type | # Families | Family Size |
| Married-Couple | 77,314 (67.0%) | 3.16 |
| Single Male/Father | 9,705 (8.4%) | 2.70 |
| Single Female/Mother | 28,334 (24.6%) | 3.13 |
| Total Families | 115,353 (100.0%) | 3.11 |
Median Household Size in Kansas City
The median household size in Kansas City is 2.30 persons per household, with single female/mother households (28,334 | 13.1%) accounting for the largest median household size of 3.31 persons per household. non-family households (101,160 | 46.7%) represent the smallest median household size with 1.26 persons per household.
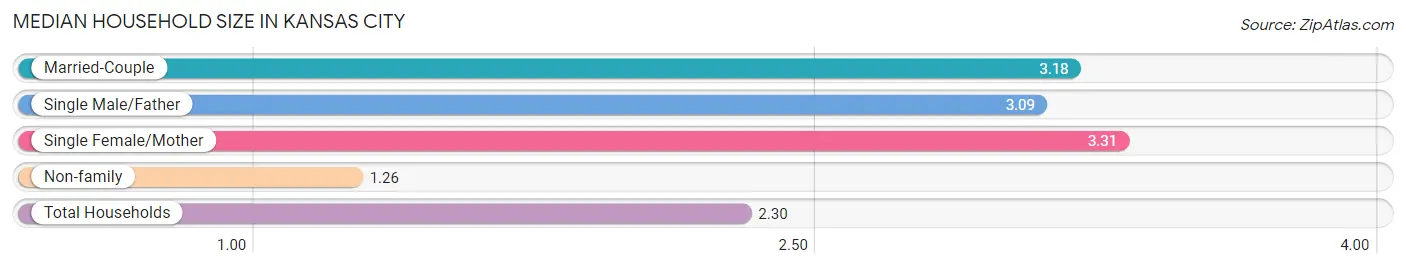
| Household Type | # Households | Household Size |
| Married-Couple | 77,314 (35.7%) | 3.18 |
| Single Male/Father | 9,705 (4.5%) | 3.09 |
| Single Female/Mother | 28,334 (13.1%) | 3.31 |
| Non-family | 101,160 (46.7%) | 1.26 |
| Total Households | 216,513 (100.0%) | 2.30 |
Household Size by Marriage Status in Kansas City
Out of a total of 216,513 households in Kansas City, 115,353 (53.3%) are family households, while 101,160 (46.7%) are nonfamily households. The most numerous type of family households are 2-person households, comprising 50,822, and the most common type of nonfamily households are 1-person households, comprising 80,826.
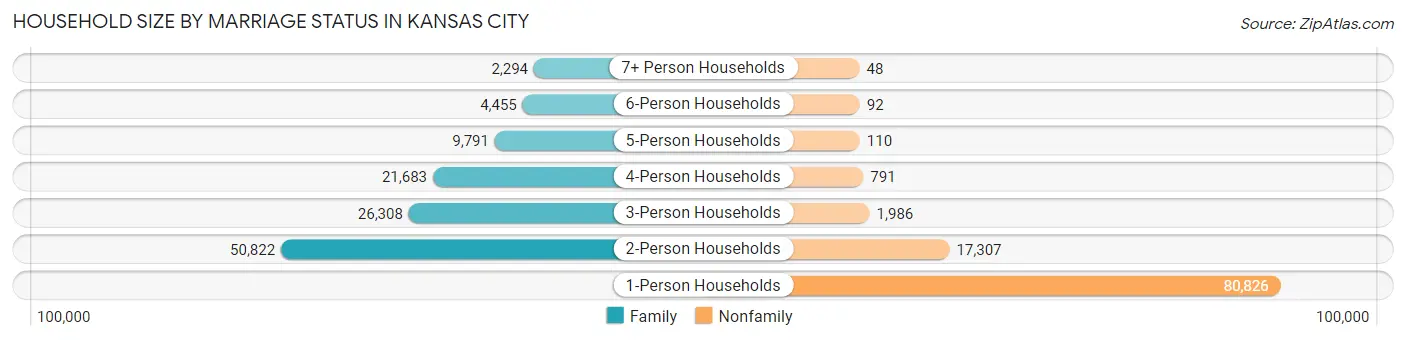
| Household Size | Family Households | Nonfamily Households |
| 1-Person Households | - | 80,826 (37.3%) |
| 2-Person Households | 50,822 (23.5%) | 17,307 (8.0%) |
| 3-Person Households | 26,308 (12.1%) | 1,986 (0.9%) |
| 4-Person Households | 21,683 (10.0%) | 791 (0.4%) |
| 5-Person Households | 9,791 (4.5%) | 110 (0.1%) |
| 6-Person Households | 4,455 (2.1%) | 92 (0.0%) |
| 7+ Person Households | 2,294 (1.1%) | 48 (0.0%) |
| Total | 115,353 (53.3%) | 101,160 (46.7%) |
Female Fertility in Kansas City
Fertility by Age in Kansas City
Average fertility rate in Kansas City is 52.0 births per 1,000 women. Women in the age bracket of 20 to 34 years have the highest fertility rate with 76.0 births per 1,000 women. Women in the age bracket of 20 to 34 years acount for 71.7% of all women with births.
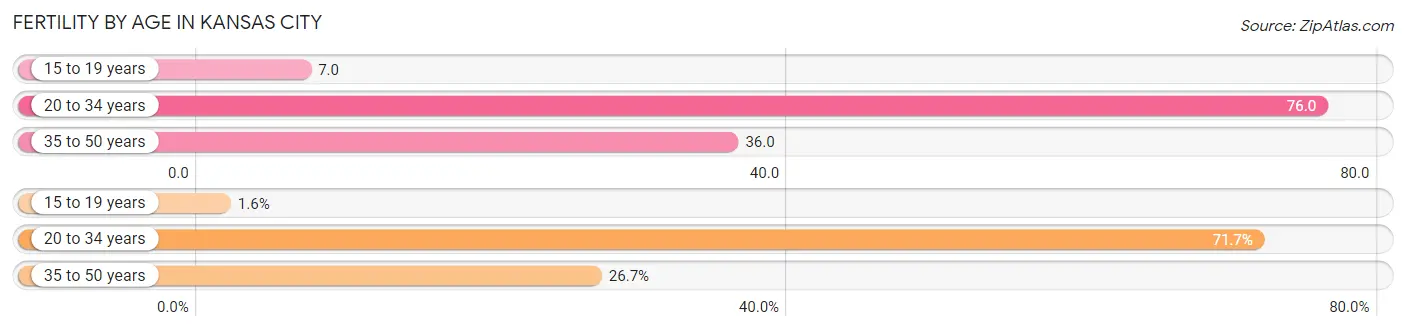
| Age Bracket | Women with Births | Births / 1,000 Women |
| 15 to 19 years | 105 (1.5%) | 7.0 |
| 20 to 34 years | 4,865 (71.7%) | 76.0 |
| 35 to 50 years | 1,813 (26.7%) | 36.0 |
| Total | 6,783 (100.0%) | 52.0 |
Fertility by Age by Marriage Status in Kansas City
65.6% of women with births (6,783) in Kansas City are married. The highest percentage of unmarried women with births falls into 15 to 19 years age bracket with 100.0% of them unmarried at the time of birth, while the lowest percentage of unmarried women with births belong to 35 to 50 years age bracket with 28.6% of them unmarried.
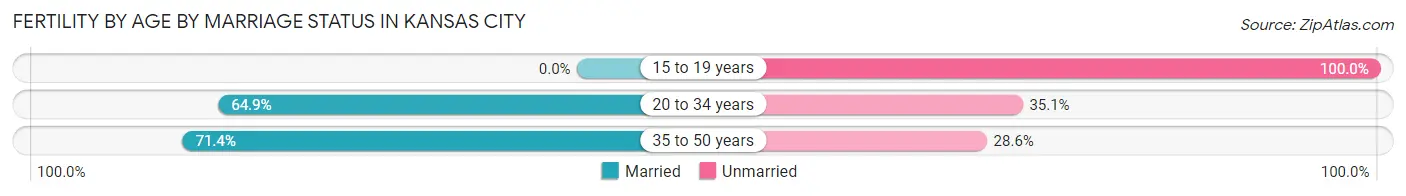
| Age Bracket | Married | Unmarried |
| 15 to 19 years | 0 (0.0%) | 105 (100.0%) |
| 20 to 34 years | 3,157 (64.9%) | 1,708 (35.1%) |
| 35 to 50 years | 1,294 (71.4%) | 519 (28.6%) |
| Total | 4,450 (65.6%) | 2,333 (34.4%) |
Fertility by Education in Kansas City
Average fertility rate in Kansas City is 52.0 births per 1,000 women. Women with the education attainment of bachelor's degree have the highest fertility rate of 63.0 births per 1,000 women, while women with the education attainment of graduate degree have the lowest fertility at 41.0 births per 1,000 women. Women with the education attainment of bachelor's degree represent 28.5% of all women with births.
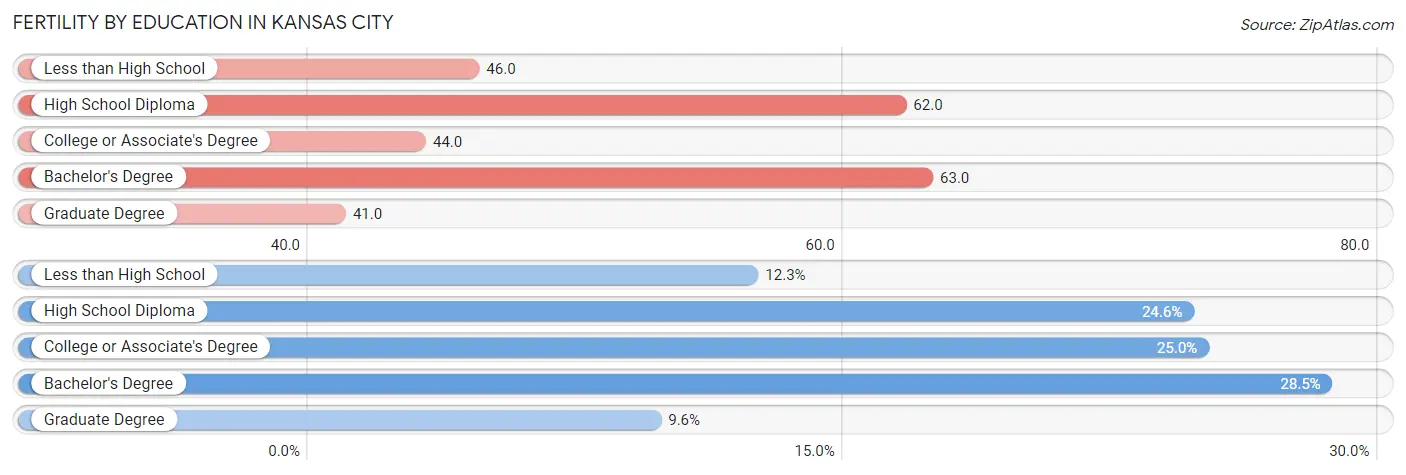
| Educational Attainment | Women with Births | Births / 1,000 Women |
| Less than High School | 837 (12.3%) | 46.0 |
| High School Diploma | 1,667 (24.6%) | 62.0 |
| College or Associate's Degree | 1,696 (25.0%) | 44.0 |
| Bachelor's Degree | 1,931 (28.5%) | 63.0 |
| Graduate Degree | 652 (9.6%) | 41.0 |
| Total | 6,783 (100.0%) | 52.0 |
Fertility by Education by Marriage Status in Kansas City
34.4% of women with births in Kansas City are unmarried. Women with the educational attainment of graduate degree are most likely to be married with 90.8% of them married at childbirth, while women with the educational attainment of less than high school are least likely to be married with 47.7% of them unmarried at childbirth.
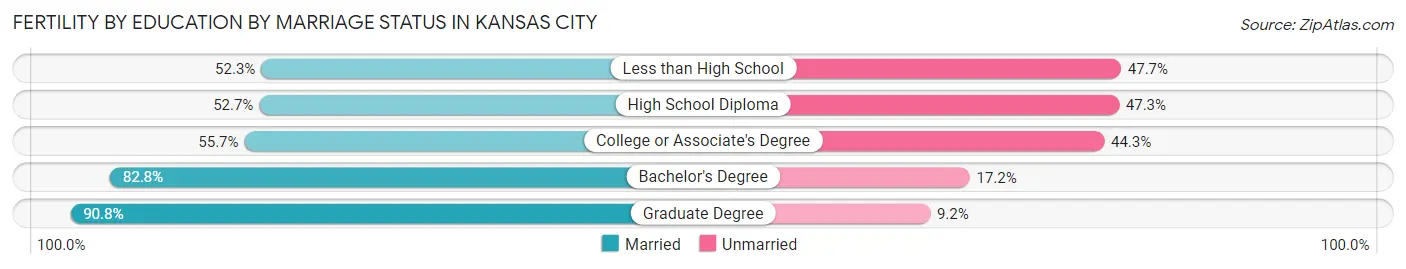
| Educational Attainment | Married | Unmarried |
| Less than High School | 438 (52.3%) | 399 (47.7%) |
| High School Diploma | 879 (52.7%) | 788 (47.3%) |
| College or Associate's Degree | 945 (55.7%) | 751 (44.3%) |
| Bachelor's Degree | 1,599 (82.8%) | 332 (17.2%) |
| Graduate Degree | 592 (90.8%) | 60 (9.2%) |
| Total | 4,450 (65.6%) | 2,333 (34.4%) |
Employment Characteristics in Kansas City
Employment by Class of Employer in Kansas City
Among the 261,493 employed individuals in Kansas City, private company employees (181,801 | 69.5%), not-for-profit organizations (27,625 | 10.6%), and local government employees (15,029 | 5.8%) make up the most common classes of employment.
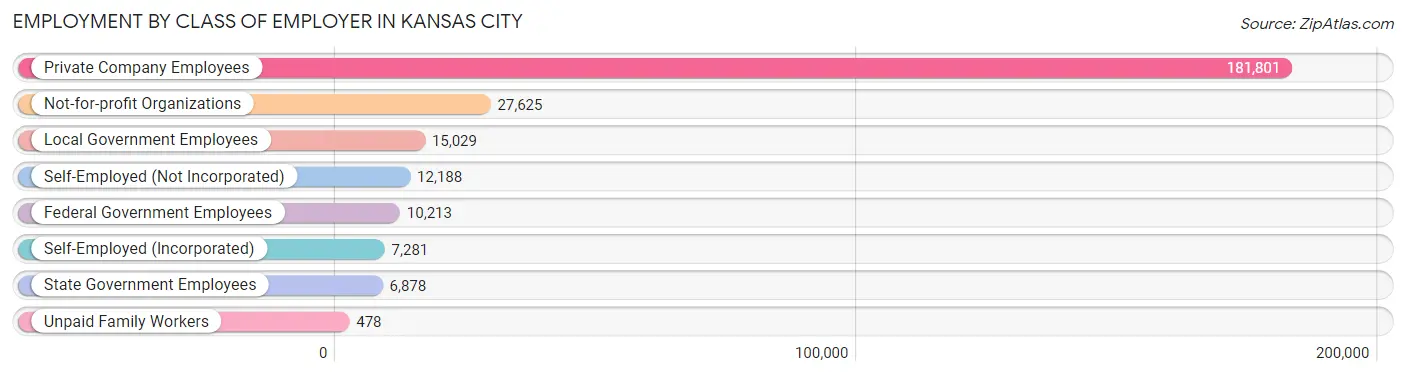
| Employer Class | # Employees | % Employees |
| Private Company Employees | 181,801 | 69.5% |
| Self-Employed (Incorporated) | 7,281 | 2.8% |
| Self-Employed (Not Incorporated) | 12,188 | 4.7% |
| Not-for-profit Organizations | 27,625 | 10.6% |
| Local Government Employees | 15,029 | 5.8% |
| State Government Employees | 6,878 | 2.6% |
| Federal Government Employees | 10,213 | 3.9% |
| Unpaid Family Workers | 478 | 0.2% |
| Total | 261,493 | 100.0% |
Employment Status by Age in Kansas City
According to the labor force statistics for Kansas City, out of the total population over 16 years of age (404,543), 69.0% or 279,135 individuals are in the labor force, with 4.8% or 13,398 of them unemployed. The age group with the highest labor force participation rate is 25 to 29 years, with 89.1% or 40,699 individuals in the labor force. Within the labor force, the 16 to 19 years age range has the highest percentage of unemployed individuals, with 10.9% or 1,174 of them being unemployed.
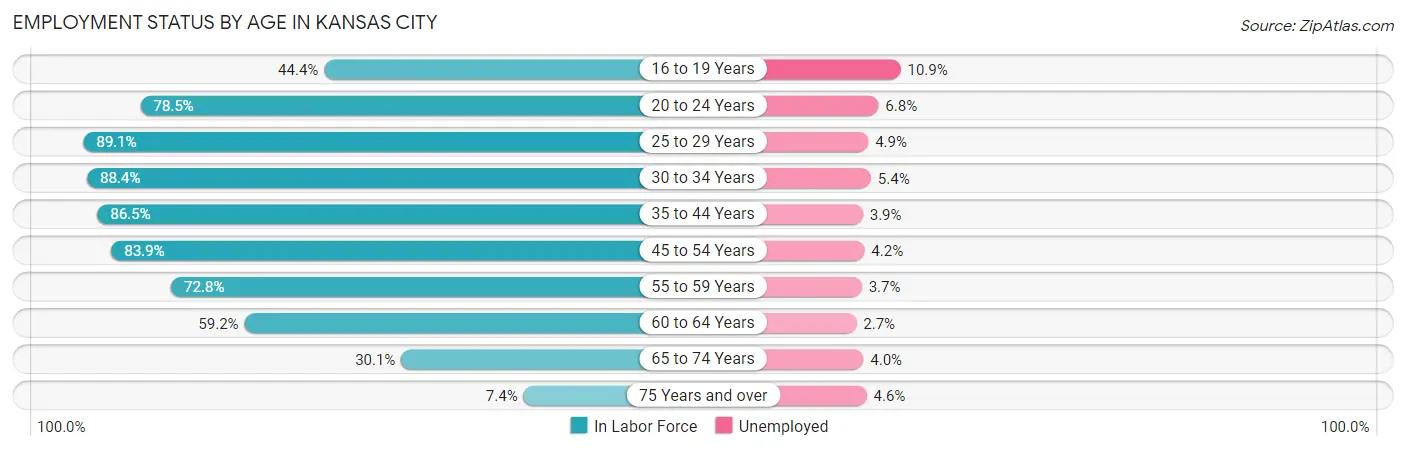
| Age Bracket | In Labor Force | Unemployed |
| 16 to 19 Years | 10,769 (44.4%) | 1,174 (10.9%) |
| 20 to 24 Years | 27,905 (78.5%) | 1,898 (6.8%) |
| 25 to 29 Years | 40,699 (89.1%) | 1,994 (4.9%) |
| 30 to 34 Years | 37,934 (88.4%) | 2,048 (5.4%) |
| 35 to 44 Years | 58,947 (86.5%) | 2,299 (3.9%) |
| 45 to 54 Years | 47,851 (83.9%) | 2,010 (4.2%) |
| 55 to 59 Years | 22,245 (72.8%) | 823 (3.7%) |
| 60 to 64 Years | 17,901 (59.2%) | 483 (2.7%) |
| 65 to 74 Years | 12,900 (30.1%) | 516 (4.0%) |
| 75 Years and over | 2,022 (7.4%) | 93 (4.6%) |
| Total | 279,135 (69.0%) | 13,398 (4.8%) |
Employment Status by Educational Attainment in Kansas City
According to labor force statistics for Kansas City, 82.2% of individuals (225,692) out of the total population between 25 and 64 years of age (274,565) are in the labor force, with 4.3% or 9,705 of them being unemployed. The group with the highest labor force participation rate are those with the educational attainment of bachelor's degree or higher, with 90.4% or 96,649 individuals in the labor force. Within the labor force, individuals with less than high school education have the highest percentage of unemployment, with 10.2% or 1,393 of them being unemployed.
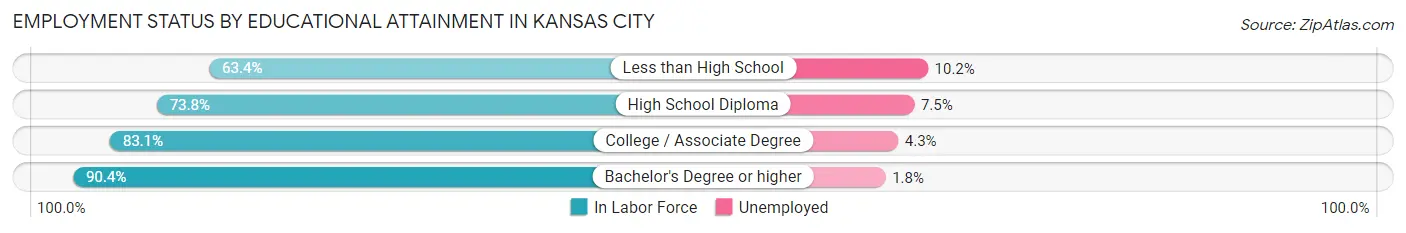
| Educational Attainment | In Labor Force | Unemployed |
| Less than High School | 13,658 (63.4%) | 2,197 (10.2%) |
| High School Diploma | 48,262 (73.8%) | 4,905 (7.5%) |
| College / Associate Degree | 67,073 (83.1%) | 3,471 (4.3%) |
| Bachelor's Degree or higher | 96,649 (90.4%) | 1,924 (1.8%) |
| Total | 225,692 (82.2%) | 11,806 (4.3%) |
Employment Occupations by Sex in Kansas City
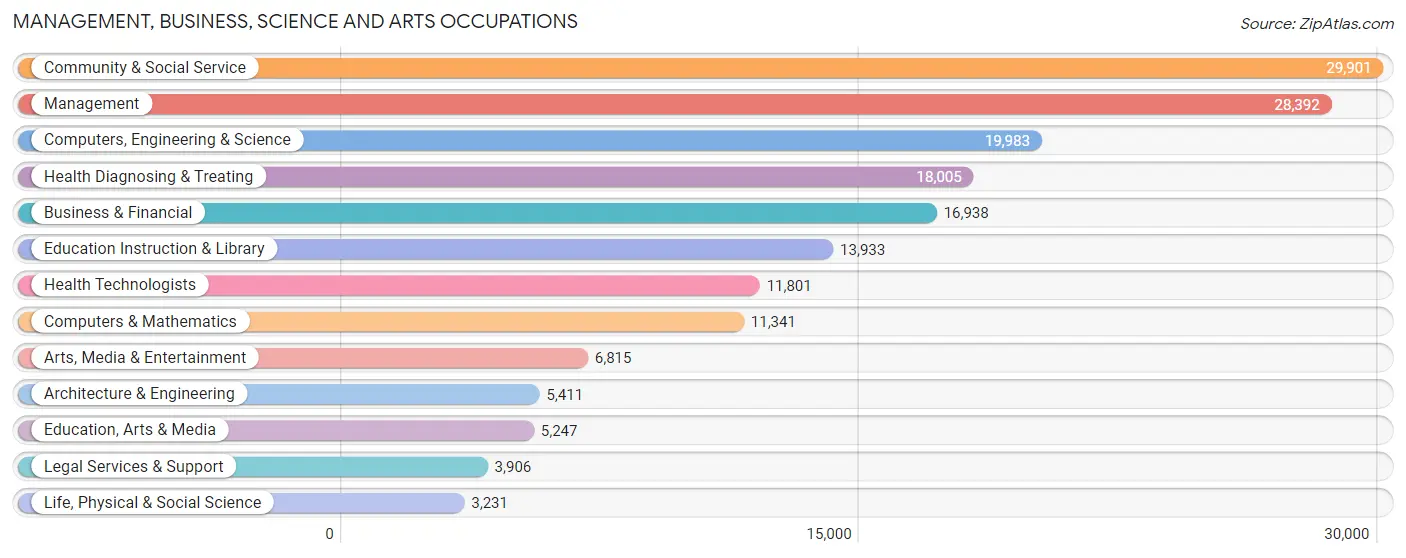
Management, Business, Science and Arts Occupations
The most common Management, Business, Science and Arts occupations in Kansas City are Community & Social Service (29,901 | 11.3%), Management (28,392 | 10.7%), Computers, Engineering & Science (19,983 | 7.5%), Health Diagnosing & Treating (18,005 | 6.8%), and Business & Financial (16,938 | 6.4%).
Management, Business, Science and Arts Occupations by Sex
Within the Management, Business, Science and Arts occupations in Kansas City, the most male-oriented occupations are Architecture & Engineering (83.9%), Computers, Engineering & Science (72.7%), and Computers & Mathematics (72.1%), while the most female-oriented occupations are Education Instruction & Library (75.3%), Health Diagnosing & Treating (74.7%), and Health Technologists (74.2%).
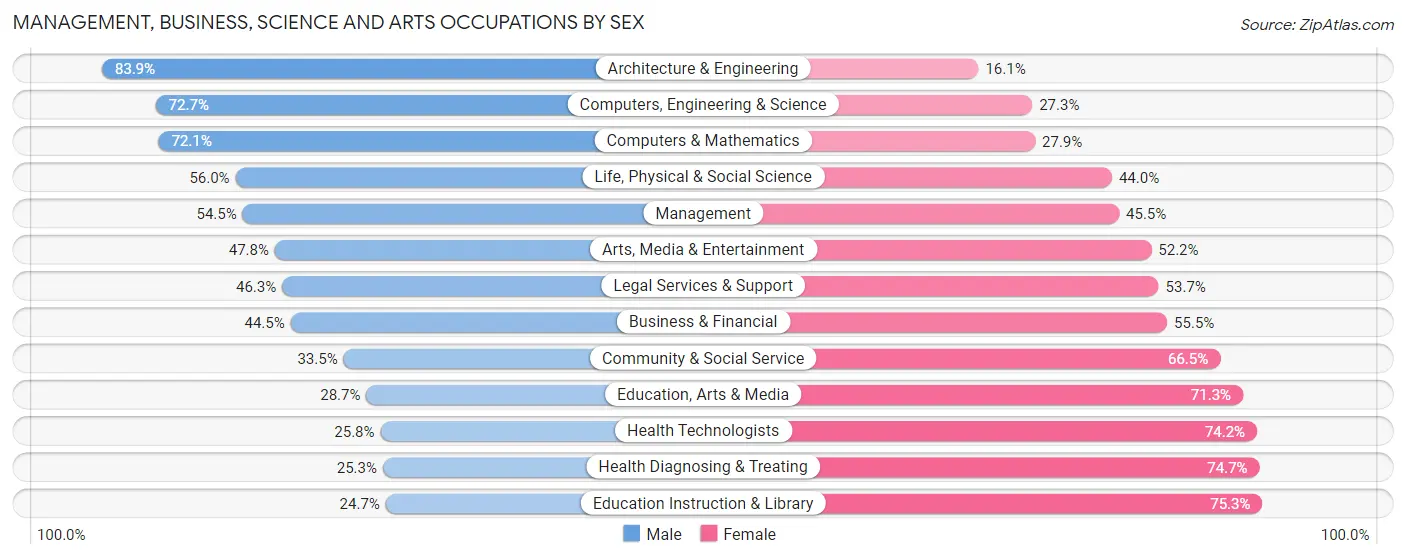
| Occupation | Male | Female |
| Management | 15,484 (54.5%) | 12,908 (45.5%) |
| Business & Financial | 7,540 (44.5%) | 9,398 (55.5%) |
| Computers, Engineering & Science | 14,520 (72.7%) | 5,463 (27.3%) |
| Computers & Mathematics | 8,172 (72.1%) | 3,169 (27.9%) |
| Architecture & Engineering | 4,538 (83.9%) | 873 (16.1%) |
| Life, Physical & Social Science | 1,810 (56.0%) | 1,421 (44.0%) |
| Community & Social Service | 10,011 (33.5%) | 19,890 (66.5%) |
| Education, Arts & Media | 1,507 (28.7%) | 3,740 (71.3%) |
| Legal Services & Support | 1,808 (46.3%) | 2,098 (53.7%) |
| Education Instruction & Library | 3,438 (24.7%) | 10,495 (75.3%) |
| Arts, Media & Entertainment | 3,258 (47.8%) | 3,557 (52.2%) |
| Health Diagnosing & Treating | 4,552 (25.3%) | 13,453 (74.7%) |
| Health Technologists | 3,043 (25.8%) | 8,758 (74.2%) |
| Total (Category) | 52,107 (46.0%) | 61,112 (54.0%) |
| Total (Overall) | 134,716 (50.8%) | 130,488 (49.2%) |
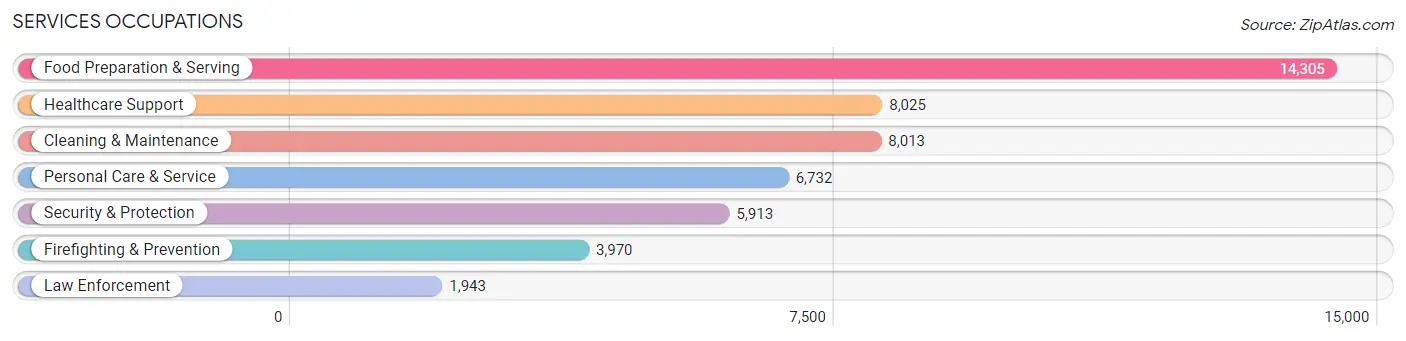
Services Occupations
The most common Services occupations in Kansas City are Food Preparation & Serving (14,305 | 5.4%), Healthcare Support (8,025 | 3.0%), Cleaning & Maintenance (8,013 | 3.0%), Personal Care & Service (6,732 | 2.5%), and Security & Protection (5,913 | 2.2%).
Services Occupations by Sex
Within the Services occupations in Kansas City, the most male-oriented occupations are Law Enforcement (85.7%), Security & Protection (77.8%), and Firefighting & Prevention (73.9%), while the most female-oriented occupations are Healthcare Support (90.0%), Personal Care & Service (72.7%), and Food Preparation & Serving (53.1%).
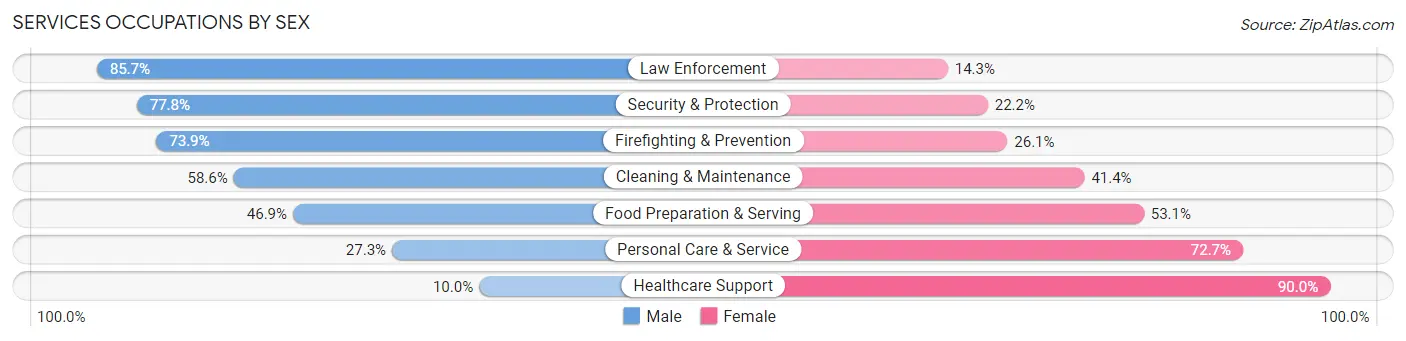
| Occupation | Male | Female |
| Healthcare Support | 804 (10.0%) | 7,221 (90.0%) |
| Security & Protection | 4,599 (77.8%) | 1,314 (22.2%) |
| Firefighting & Prevention | 2,934 (73.9%) | 1,036 (26.1%) |
| Law Enforcement | 1,665 (85.7%) | 278 (14.3%) |
| Food Preparation & Serving | 6,706 (46.9%) | 7,599 (53.1%) |
| Cleaning & Maintenance | 4,698 (58.6%) | 3,315 (41.4%) |
| Personal Care & Service | 1,836 (27.3%) | 4,896 (72.7%) |
| Total (Category) | 18,643 (43.4%) | 24,345 (56.6%) |
| Total (Overall) | 134,716 (50.8%) | 130,488 (49.2%) |
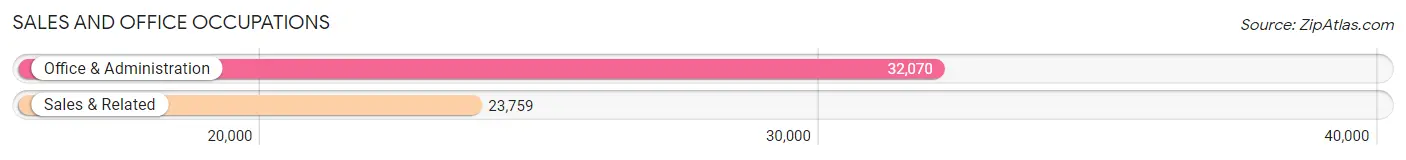
Sales and Office Occupations
The most common Sales and Office occupations in Kansas City are Office & Administration (32,070 | 12.1%), and Sales & Related (23,759 | 9.0%).
Sales and Office Occupations by Sex
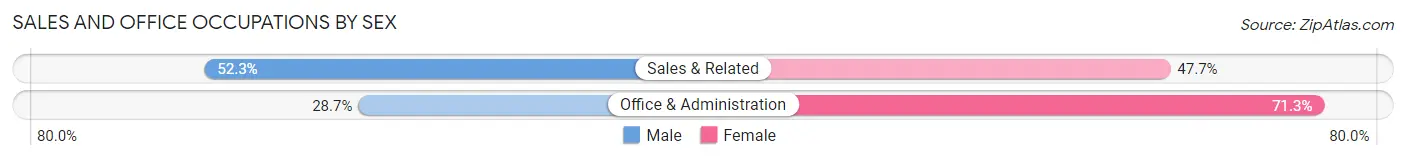
| Occupation | Male | Female |
| Sales & Related | 12,432 (52.3%) | 11,327 (47.7%) |
| Office & Administration | 9,195 (28.7%) | 22,875 (71.3%) |
| Total (Category) | 21,627 (38.7%) | 34,202 (61.3%) |
| Total (Overall) | 134,716 (50.8%) | 130,488 (49.2%) |
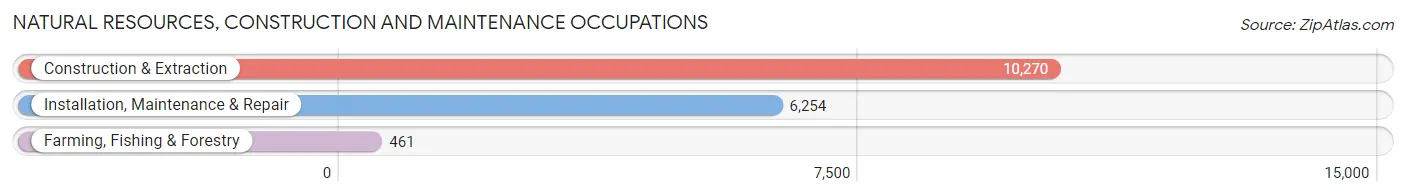
Natural Resources, Construction and Maintenance Occupations
The most common Natural Resources, Construction and Maintenance occupations in Kansas City are Construction & Extraction (10,270 | 3.9%), Installation, Maintenance & Repair (6,254 | 2.4%), and Farming, Fishing & Forestry (461 | 0.2%).
Natural Resources, Construction and Maintenance Occupations by Sex
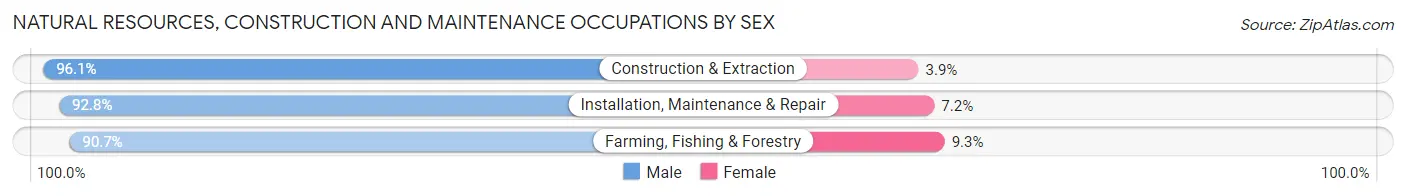
| Occupation | Male | Female |
| Farming, Fishing & Forestry | 418 (90.7%) | 43 (9.3%) |
| Construction & Extraction | 9,872 (96.1%) | 398 (3.9%) |
| Installation, Maintenance & Repair | 5,805 (92.8%) | 449 (7.2%) |
| Total (Category) | 16,095 (94.8%) | 890 (5.2%) |
| Total (Overall) | 134,716 (50.8%) | 130,488 (49.2%) |
Production, Transportation and Moving Occupations
The most common Production, Transportation and Moving occupations in Kansas City are Production (13,615 | 5.1%), Material Moving (12,455 | 4.7%), and Transportation (10,113 | 3.8%).
Production, Transportation and Moving Occupations by Sex
| Occupation | Male | Female |
| Production | 9,318 (68.4%) | 4,297 (31.6%) |
| Transportation | 8,396 (83.0%) | 1,717 (17.0%) |
| Material Moving | 8,530 (68.5%) | 3,925 (31.5%) |
| Total (Category) | 26,244 (72.5%) | 9,939 (27.5%) |
| Total (Overall) | 134,716 (50.8%) | 130,488 (49.2%) |
Employment Industries by Sex in Kansas City
Employment Industries in Kansas City
The major employment industries in Kansas City include Health Care & Social Assistance (39,184 | 14.8%), Professional & Scientific (27,791 | 10.5%), Retail Trade (25,995 | 9.8%), Manufacturing (22,066 | 8.3%), and Educational Services (20,160 | 7.6%).
Employment Industries by Sex in Kansas City
The Kansas City industries that see more men than women are Mining, Quarrying, & Extraction (100.0%), Construction (86.8%), and Agriculture, Fishing & Hunting (79.4%), whereas the industries that tend to have a higher number of women are Health Care & Social Assistance (78.1%), Educational Services (69.6%), and Enterprise Management (67.5%).
| Industry | Male | Female |
| Agriculture, Fishing & Hunting | 769 (79.4%) | 199 (20.6%) |
| Mining, Quarrying, & Extraction | 161 (100.0%) | 0 (0.0%) |
| Construction | 12,404 (86.8%) | 1,880 (13.2%) |
| Manufacturing | 15,428 (69.9%) | 6,638 (30.1%) |
| Wholesale Trade | 4,612 (69.2%) | 2,052 (30.8%) |
| Retail Trade | 13,337 (51.3%) | 12,658 (48.7%) |
| Transportation & Warehousing | 12,395 (71.1%) | 5,045 (28.9%) |
| Utilities | 915 (74.5%) | 313 (25.5%) |
| Information | 2,299 (49.1%) | 2,383 (50.9%) |
| Finance & Insurance | 7,762 (46.9%) | 8,799 (53.1%) |
| Real Estate, Rental & Leasing | 2,849 (55.1%) | 2,318 (44.9%) |
| Professional & Scientific | 15,692 (56.5%) | 12,099 (43.5%) |
| Enterprise Management | 88 (32.5%) | 183 (67.5%) |
| Administrative & Support | 5,576 (52.9%) | 4,968 (47.1%) |
| Educational Services | 6,132 (30.4%) | 14,028 (69.6%) |
| Health Care & Social Assistance | 8,579 (21.9%) | 30,605 (78.1%) |
| Arts, Entertainment & Recreation | 3,807 (58.5%) | 2,698 (41.5%) |
| Accommodation & Food Services | 8,984 (46.4%) | 10,398 (53.6%) |
| Public Administration | 7,539 (55.2%) | 6,121 (44.8%) |
| Total | 134,716 (50.8%) | 130,488 (49.2%) |
Education in Kansas City
School Enrollment in Kansas City
The most common levels of schooling among the 119,194 students in Kansas City are elementary school (24,990 | 21.0%), middle school (24,897 | 20.9%), and high school (24,138 | 20.3%).
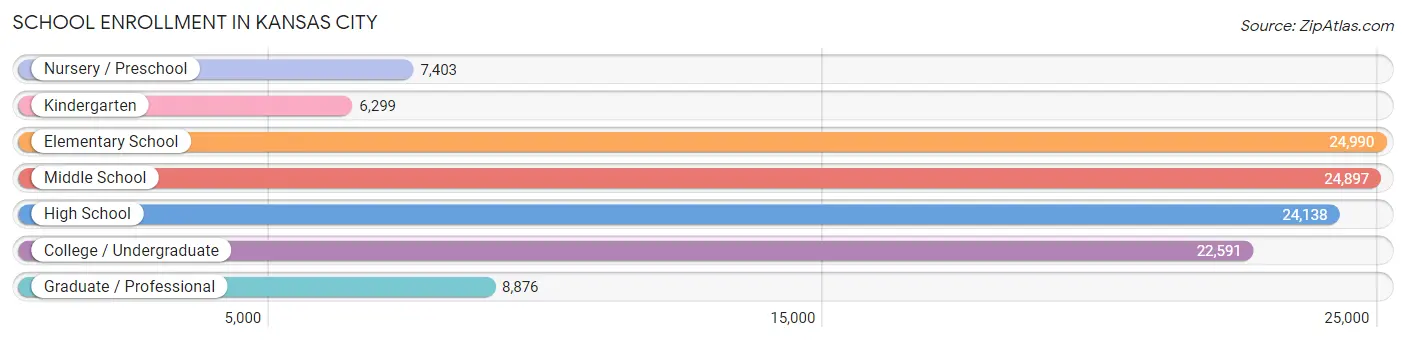
| School Level | # Students | % Students |
| Nursery / Preschool | 7,403 | 6.2% |
| Kindergarten | 6,299 | 5.3% |
| Elementary School | 24,990 | 21.0% |
| Middle School | 24,897 | 20.9% |
| High School | 24,138 | 20.3% |
| College / Undergraduate | 22,591 | 19.0% |
| Graduate / Professional | 8,876 | 7.4% |
| Total | 119,194 | 100.0% |
School Enrollment by Age by Funding Source in Kansas City
Out of a total of 119,194 students who are enrolled in schools in Kansas City, 23,004 (19.3%) attend a private institution, while the remaining 96,190 (80.7%) are enrolled in public schools. The age group of 3 to 4 year olds has the highest likelihood of being enrolled in private schools, with 2,081 (40.7% in the age bracket) enrolled. Conversely, the age group of 10 to 14 year olds has the lowest likelihood of being enrolled in a private school, with 26,397 (87.1% in the age bracket) attending a public institution.
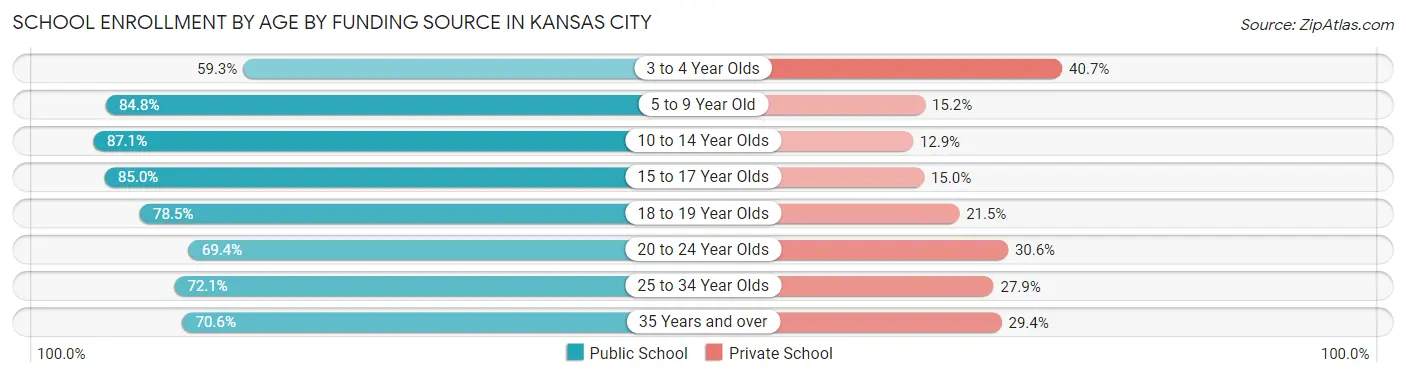
| Age Bracket | Public School | Private School |
| 3 to 4 Year Olds | 3,032 (59.3%) | 2,081 (40.7%) |
| 5 to 9 Year Old | 25,641 (84.8%) | 4,586 (15.2%) |
| 10 to 14 Year Olds | 26,397 (87.1%) | 3,911 (12.9%) |
| 15 to 17 Year Olds | 15,138 (85.0%) | 2,664 (15.0%) |
| 18 to 19 Year Olds | 6,960 (78.5%) | 1,909 (21.5%) |
| 20 to 24 Year Olds | 8,249 (69.4%) | 3,638 (30.6%) |
| 25 to 34 Year Olds | 6,427 (72.1%) | 2,489 (27.9%) |
| 35 Years and over | 4,286 (70.6%) | 1,786 (29.4%) |
| Total | 96,190 (80.7%) | 23,004 (19.3%) |
Educational Attainment by Field of Study in Kansas City
Business (29,380 | 20.9%), science & technology (14,649 | 10.4%), education (13,335 | 9.5%), social sciences (9,500 | 6.8%), and arts & humanities (9,141 | 6.5%) are the most common fields of study among 140,326 individuals in Kansas City who have obtained a bachelor's degree or higher.
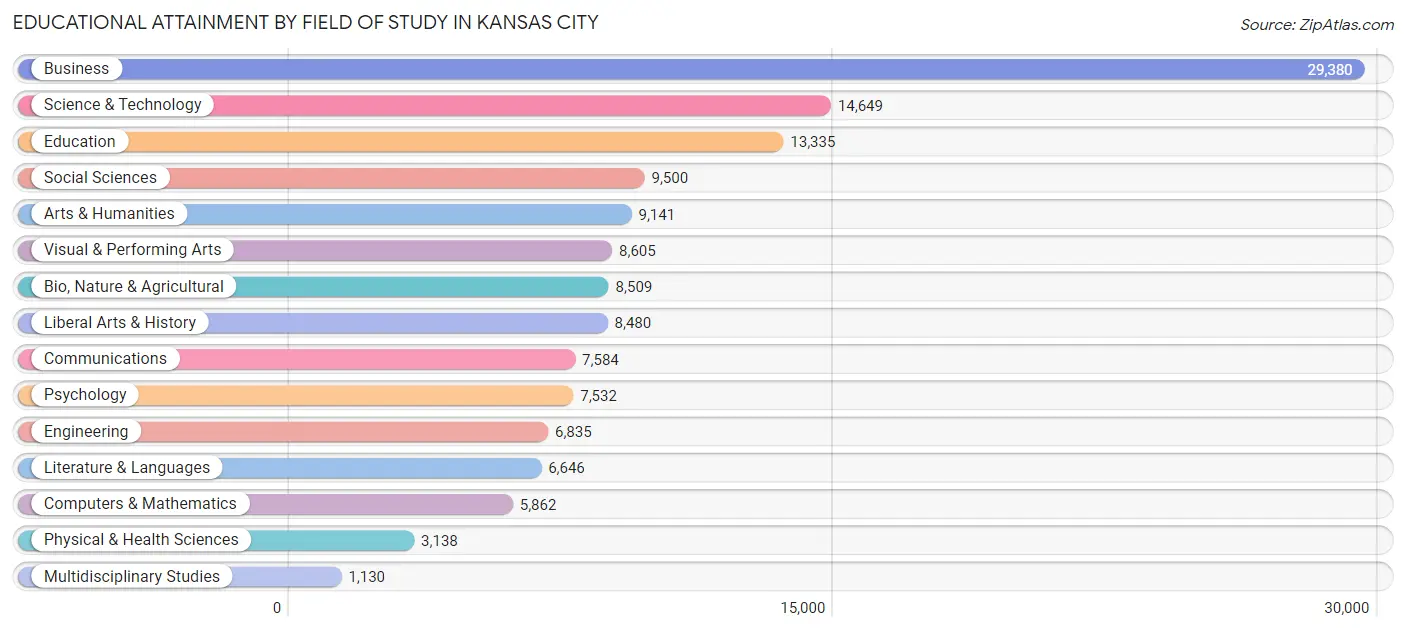
| Field of Study | # Graduates | % Graduates |
| Computers & Mathematics | 5,862 | 4.2% |
| Bio, Nature & Agricultural | 8,509 | 6.1% |
| Physical & Health Sciences | 3,138 | 2.2% |
| Psychology | 7,532 | 5.4% |
| Social Sciences | 9,500 | 6.8% |
| Engineering | 6,835 | 4.9% |
| Multidisciplinary Studies | 1,130 | 0.8% |
| Science & Technology | 14,649 | 10.4% |
| Business | 29,380 | 20.9% |
| Education | 13,335 | 9.5% |
| Literature & Languages | 6,646 | 4.7% |
| Liberal Arts & History | 8,480 | 6.0% |
| Visual & Performing Arts | 8,605 | 6.1% |
| Communications | 7,584 | 5.4% |
| Arts & Humanities | 9,141 | 6.5% |
| Total | 140,326 | 100.0% |
Transportation & Commute in Kansas City
Vehicle Availability by Sex in Kansas City
The most prevalent vehicle ownership categories in Kansas City are males with 2 vehicles (59,265, accounting for 44.7%) and females with 2 vehicles (53,621, making up 46.4%).
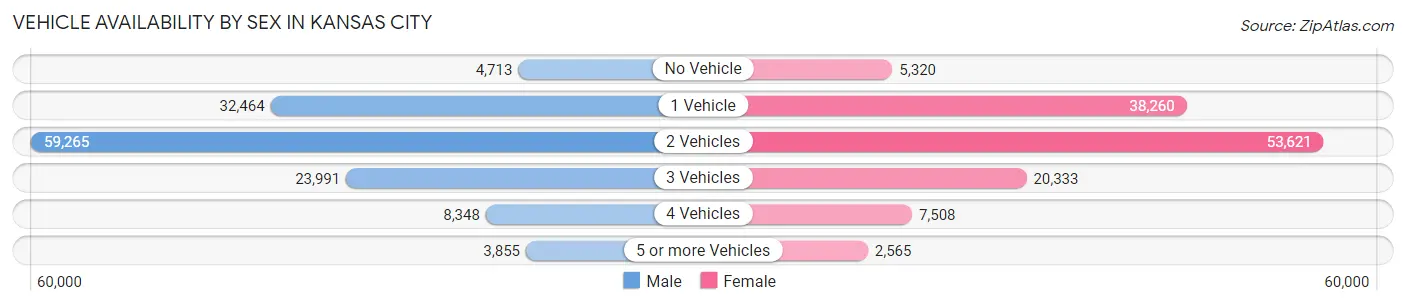
| Vehicles Available | Male | Female |
| No Vehicle | 4,713 (3.5%) | 5,320 (4.2%) |
| 1 Vehicle | 32,464 (24.5%) | 38,260 (30.0%) |
| 2 Vehicles | 59,265 (44.7%) | 53,621 (42.0%) |
| 3 Vehicles | 23,991 (18.1%) | 20,333 (15.9%) |
| 4 Vehicles | 8,348 (6.3%) | 7,508 (5.9%) |
| 5 or more Vehicles | 3,855 (2.9%) | 2,565 (2.0%) |
| Total | 132,636 (100.0%) | 127,607 (100.0%) |
Commute Time in Kansas City
The most frequently occuring commute durations in Kansas City are 15 to 19 minutes (45,441 commuters, 19.8%), 20 to 24 minutes (44,689 commuters, 19.5%), and 10 to 14 minutes (32,831 commuters, 14.3%).
| Commute Time | # Commuters | % Commuters |
| Less than 5 Minutes | 5,560 | 2.4% |
| 5 to 9 Minutes | 21,742 | 9.5% |
| 10 to 14 Minutes | 32,831 | 14.3% |
| 15 to 19 Minutes | 45,441 | 19.8% |
| 20 to 24 Minutes | 44,689 | 19.5% |
| 25 to 29 Minutes | 19,566 | 8.5% |
| 30 to 34 Minutes | 31,614 | 13.8% |
| 35 to 39 Minutes | 6,006 | 2.6% |
| 40 to 44 Minutes | 6,208 | 2.7% |
| 45 to 59 Minutes | 8,867 | 3.9% |
| 60 to 89 Minutes | 3,959 | 1.7% |
| 90 or more Minutes | 3,173 | 1.4% |
Commute Time by Sex in Kansas City
The most common commute times in Kansas City are 20 to 24 minutes (22,671 commuters, 19.3%) for males and 15 to 19 minutes (22,952 commuters, 20.5%) for females.
| Commute Time | Male | Female |
| Less than 5 Minutes | 2,662 (2.3%) | 2,898 (2.6%) |
| 5 to 9 Minutes | 10,062 (8.6%) | 11,680 (10.4%) |
| 10 to 14 Minutes | 16,030 (13.6%) | 16,801 (15.0%) |
| 15 to 19 Minutes | 22,489 (19.1%) | 22,952 (20.5%) |
| 20 to 24 Minutes | 22,671 (19.3%) | 22,018 (19.7%) |
| 25 to 29 Minutes | 10,631 (9.0%) | 8,935 (8.0%) |
| 30 to 34 Minutes | 17,348 (14.7%) | 14,266 (12.7%) |
| 35 to 39 Minutes | 3,564 (3.0%) | 2,442 (2.2%) |
| 40 to 44 Minutes | 3,625 (3.1%) | 2,583 (2.3%) |
| 45 to 59 Minutes | 4,588 (3.9%) | 4,279 (3.8%) |
| 60 to 89 Minutes | 2,466 (2.1%) | 1,493 (1.3%) |
| 90 or more Minutes | 1,517 (1.3%) | 1,656 (1.5%) |
Time of Departure to Work by Sex in Kansas City
The most frequent times of departure to work in Kansas City are 7:30 AM to 7:59 AM (18,528, 15.8%) for males and 7:30 AM to 7:59 AM (20,476, 18.3%) for females.
| Time of Departure | Male | Female |
| 12:00 AM to 4:59 AM | 5,655 (4.8%) | 2,827 (2.5%) |
| 5:00 AM to 5:29 AM | 4,936 (4.2%) | 2,155 (1.9%) |
| 5:30 AM to 5:59 AM | 6,067 (5.2%) | 4,319 (3.9%) |
| 6:00 AM to 6:29 AM | 9,791 (8.3%) | 6,069 (5.4%) |
| 6:30 AM to 6:59 AM | 13,021 (11.1%) | 11,005 (9.8%) |
| 7:00 AM to 7:29 AM | 15,309 (13.0%) | 14,797 (13.2%) |
| 7:30 AM to 7:59 AM | 18,528 (15.8%) | 20,476 (18.3%) |
| 8:00 AM to 8:29 AM | 11,188 (9.5%) | 11,818 (10.5%) |
| 8:30 AM to 8:59 AM | 4,981 (4.2%) | 7,101 (6.3%) |
| 9:00 AM to 9:59 AM | 6,246 (5.3%) | 8,755 (7.8%) |
| 10:00 AM to 10:59 AM | 3,166 (2.7%) | 3,861 (3.5%) |
| 11:00 AM to 11:59 AM | 1,611 (1.4%) | 1,830 (1.6%) |
| 12:00 PM to 3:59 PM | 8,402 (7.1%) | 8,167 (7.3%) |
| 4:00 PM to 11:59 PM | 8,752 (7.4%) | 8,823 (7.9%) |
| Total | 117,653 (100.0%) | 112,003 (100.0%) |
Housing Occupancy in Kansas City
Occupancy by Ownership in Kansas City
Of the total 216,513 dwellings in Kansas City, owner-occupied units account for 116,833 (54.0%), while renter-occupied units make up 99,680 (46.0%).
| Occupancy | # Housing Units | % Housing Units |
| Owner Occupied Housing Units | 116,833 | 54.0% |
| Renter-Occupied Housing Units | 99,680 | 46.0% |
| Total Occupied Housing Units | 216,513 | 100.0% |
Occupancy by Household Size in Kansas City
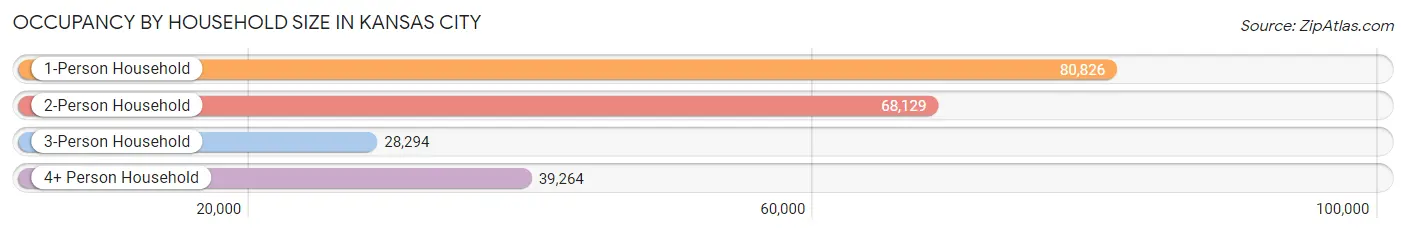
| Household Size | # Housing Units | % Housing Units |
| 1-Person Household | 80,826 | 37.3% |
| 2-Person Household | 68,129 | 31.5% |
| 3-Person Household | 28,294 | 13.1% |
| 4+ Person Household | 39,264 | 18.1% |
| Total Housing Units | 216,513 | 100.0% |
Occupancy by Ownership by Household Size in Kansas City
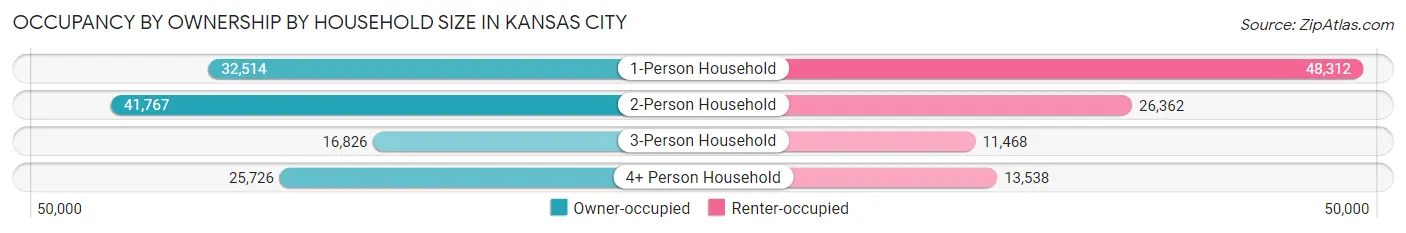
| Household Size | Owner-occupied | Renter-occupied |
| 1-Person Household | 32,514 (40.2%) | 48,312 (59.8%) |
| 2-Person Household | 41,767 (61.3%) | 26,362 (38.7%) |
| 3-Person Household | 16,826 (59.5%) | 11,468 (40.5%) |
| 4+ Person Household | 25,726 (65.5%) | 13,538 (34.5%) |
| Total Housing Units | 116,833 (54.0%) | 99,680 (46.0%) |
Occupancy by Educational Attainment in Kansas City
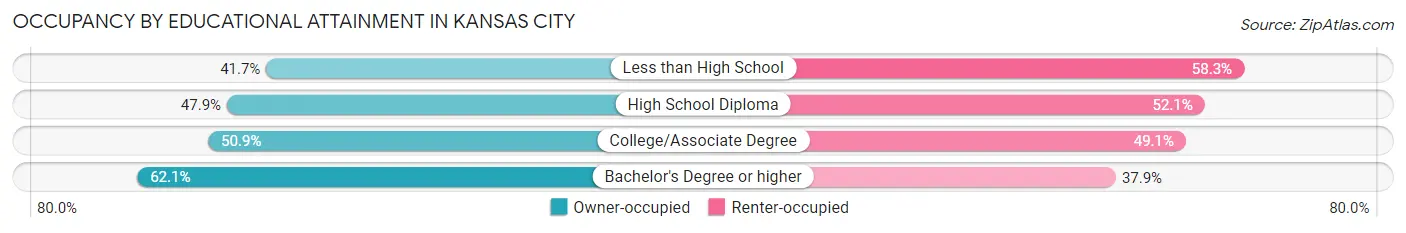
| Household Size | Owner-occupied | Renter-occupied |
| Less than High School | 6,561 (41.7%) | 9,179 (58.3%) |
| High School Diploma | 22,888 (47.9%) | 24,880 (52.1%) |
| College/Associate Degree | 34,800 (50.9%) | 33,565 (49.1%) |
| Bachelor's Degree or higher | 52,584 (62.1%) | 32,056 (37.9%) |
Occupancy by Age of Householder in Kansas City
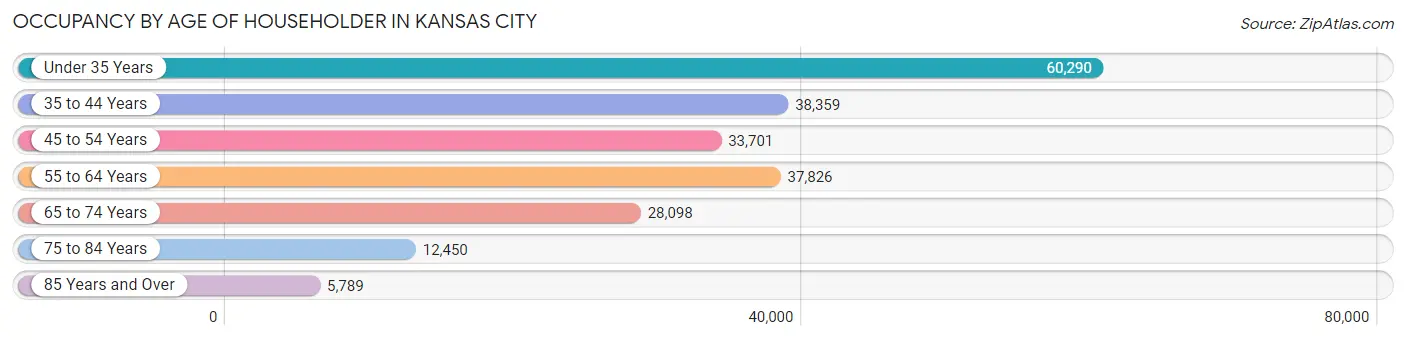
| Age Bracket | # Households | % Households |
| Under 35 Years | 60,290 | 27.9% |
| 35 to 44 Years | 38,359 | 17.7% |
| 45 to 54 Years | 33,701 | 15.6% |
| 55 to 64 Years | 37,826 | 17.5% |
| 65 to 74 Years | 28,098 | 13.0% |
| 75 to 84 Years | 12,450 | 5.8% |
| 85 Years and Over | 5,789 | 2.7% |
| Total | 216,513 | 100.0% |
Housing Finances in Kansas City
Median Income by Occupancy in Kansas City
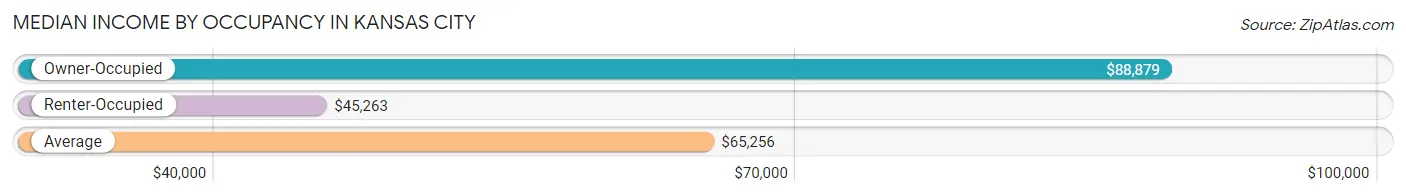
| Occupancy Type | # Households | Median Income |
| Owner-Occupied | 116,833 (54.0%) | $88,879 |
| Renter-Occupied | 99,680 (46.0%) | $45,263 |
| Average | 216,513 (100.0%) | $65,256 |
Occupancy by Householder Income Bracket in Kansas City
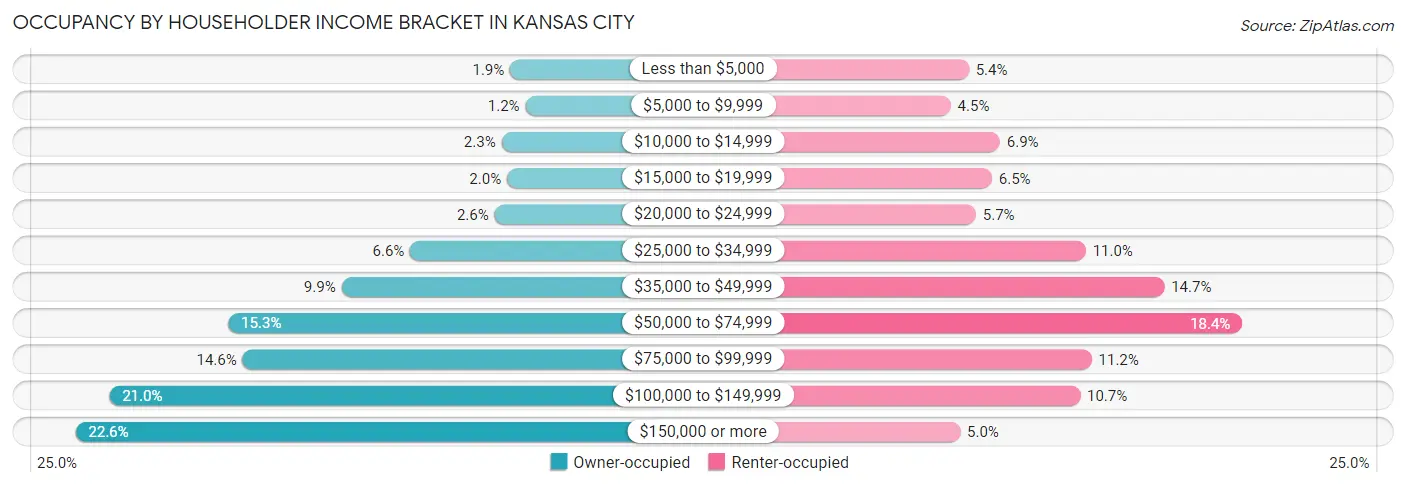
| Income Bracket | Owner-occupied | Renter-occupied |
| Less than $5,000 | 2,192 (1.9%) | 5,374 (5.4%) |
| $5,000 to $9,999 | 1,345 (1.1%) | 4,517 (4.5%) |
| $10,000 to $14,999 | 2,671 (2.3%) | 6,847 (6.9%) |
| $15,000 to $19,999 | 2,367 (2.0%) | 6,471 (6.5%) |
| $20,000 to $24,999 | 3,064 (2.6%) | 5,712 (5.7%) |
| $25,000 to $34,999 | 7,761 (6.6%) | 10,925 (11.0%) |
| $35,000 to $49,999 | 11,578 (9.9%) | 14,653 (14.7%) |
| $50,000 to $74,999 | 17,890 (15.3%) | 18,353 (18.4%) |
| $75,000 to $99,999 | 17,081 (14.6%) | 11,207 (11.2%) |
| $100,000 to $149,999 | 24,504 (21.0%) | 10,652 (10.7%) |
| $150,000 or more | 26,380 (22.6%) | 4,969 (5.0%) |
| Total | 116,833 (100.0%) | 99,680 (100.0%) |
Monthly Housing Cost Tiers in Kansas City
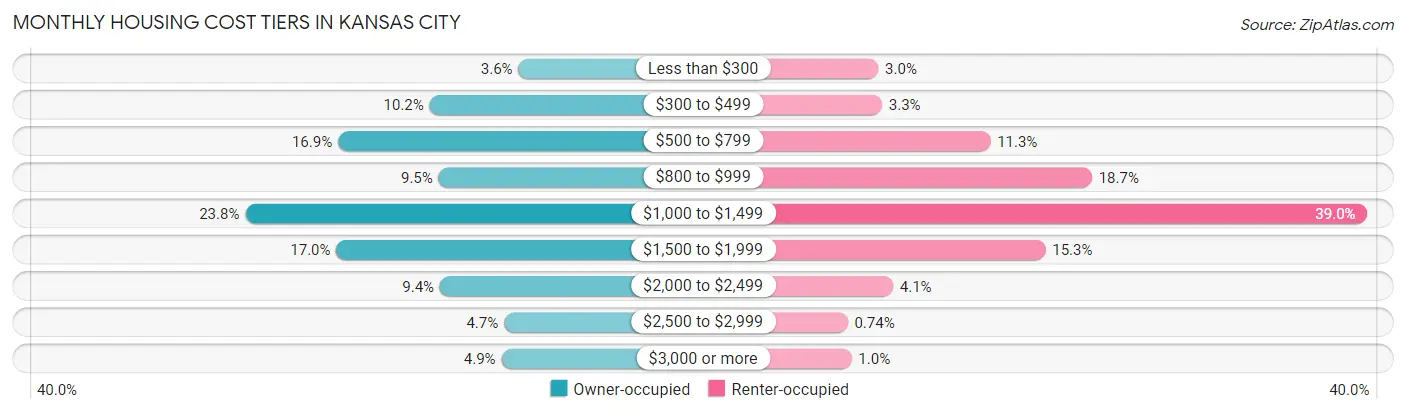
| Monthly Cost | Owner-occupied | Renter-occupied |
| Less than $300 | 4,245 (3.6%) | 2,987 (3.0%) |
| $300 to $499 | 11,878 (10.2%) | 3,259 (3.3%) |
| $500 to $799 | 19,770 (16.9%) | 11,211 (11.3%) |
| $800 to $999 | 11,105 (9.5%) | 18,667 (18.7%) |
| $1,000 to $1,499 | 27,749 (23.7%) | 38,902 (39.0%) |
| $1,500 to $1,999 | 19,908 (17.0%) | 15,257 (15.3%) |
| $2,000 to $2,499 | 10,996 (9.4%) | 4,064 (4.1%) |
| $2,500 to $2,999 | 5,479 (4.7%) | 738 (0.7%) |
| $3,000 or more | 5,703 (4.9%) | 1,027 (1.0%) |
| Total | 116,833 (100.0%) | 99,680 (100.0%) |
Physical Housing Characteristics in Kansas City
Housing Structures in Kansas City
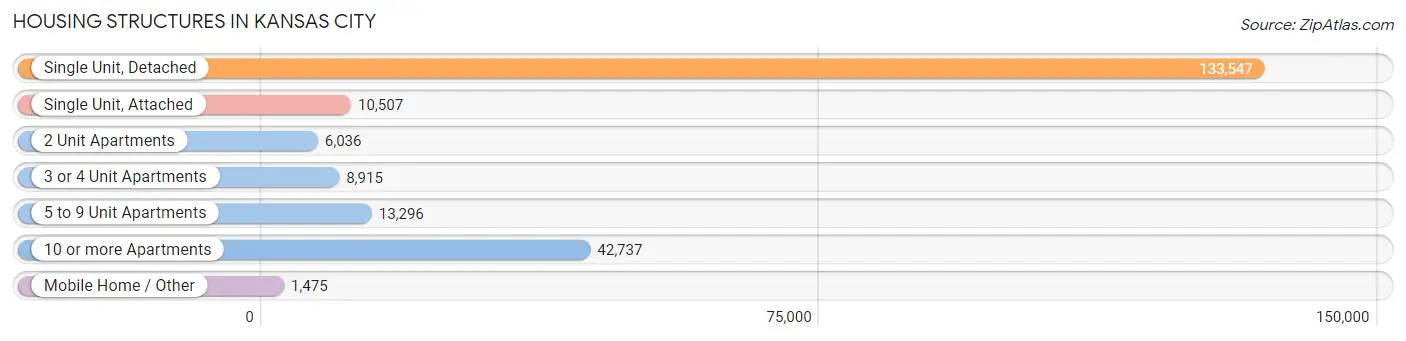
| Structure Type | # Housing Units | % Housing Units |
| Single Unit, Detached | 133,547 | 61.7% |
| Single Unit, Attached | 10,507 | 4.9% |
| 2 Unit Apartments | 6,036 | 2.8% |
| 3 or 4 Unit Apartments | 8,915 | 4.1% |
| 5 to 9 Unit Apartments | 13,296 | 6.1% |
| 10 or more Apartments | 42,737 | 19.7% |
| Mobile Home / Other | 1,475 | 0.7% |
| Total | 216,513 | 100.0% |
Housing Structures by Occupancy in Kansas City
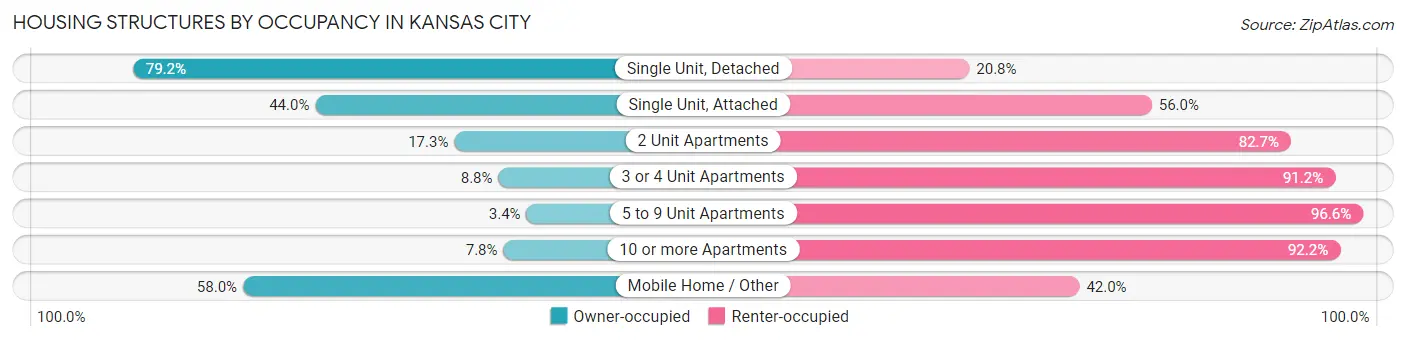
| Structure Type | Owner-occupied | Renter-occupied |
| Single Unit, Detached | 105,732 (79.2%) | 27,815 (20.8%) |
| Single Unit, Attached | 4,627 (44.0%) | 5,880 (56.0%) |
| 2 Unit Apartments | 1,043 (17.3%) | 4,993 (82.7%) |
| 3 or 4 Unit Apartments | 783 (8.8%) | 8,132 (91.2%) |
| 5 to 9 Unit Apartments | 449 (3.4%) | 12,847 (96.6%) |
| 10 or more Apartments | 3,344 (7.8%) | 39,393 (92.2%) |
| Mobile Home / Other | 855 (58.0%) | 620 (42.0%) |
| Total | 116,833 (54.0%) | 99,680 (46.0%) |
Housing Structures by Number of Rooms in Kansas City
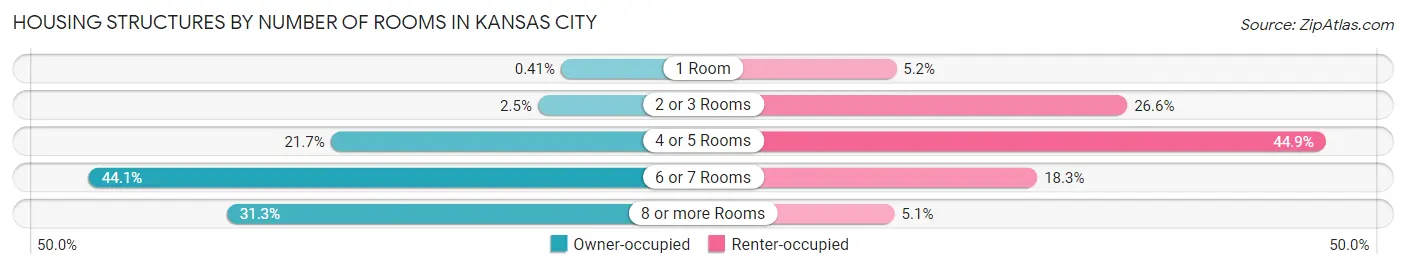
| Number of Rooms | Owner-occupied | Renter-occupied |
| 1 Room | 478 (0.4%) | 5,189 (5.2%) |
| 2 or 3 Rooms | 2,964 (2.5%) | 26,487 (26.6%) |
| 4 or 5 Rooms | 25,364 (21.7%) | 44,768 (44.9%) |
| 6 or 7 Rooms | 51,465 (44.1%) | 18,193 (18.2%) |
| 8 or more Rooms | 36,562 (31.3%) | 5,043 (5.1%) |
| Total | 116,833 (100.0%) | 99,680 (100.0%) |
Housing Structure by Heating Type in Kansas City
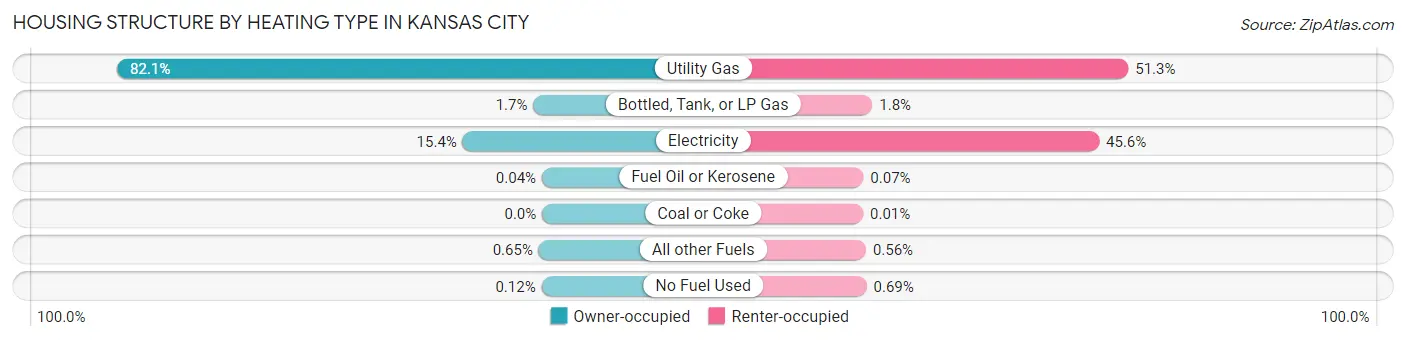
| Heating Type | Owner-occupied | Renter-occupied |
| Utility Gas | 95,967 (82.1%) | 51,095 (51.3%) |
| Bottled, Tank, or LP Gas | 1,986 (1.7%) | 1,790 (1.8%) |
| Electricity | 17,935 (15.3%) | 45,474 (45.6%) |
| Fuel Oil or Kerosene | 49 (0.0%) | 65 (0.1%) |
| Coal or Coke | 0 (0.0%) | 9 (0.0%) |
| All other Fuels | 756 (0.6%) | 556 (0.6%) |
| No Fuel Used | 140 (0.1%) | 691 (0.7%) |
| Total | 116,833 (100.0%) | 99,680 (100.0%) |
Household Vehicle Usage in Kansas City
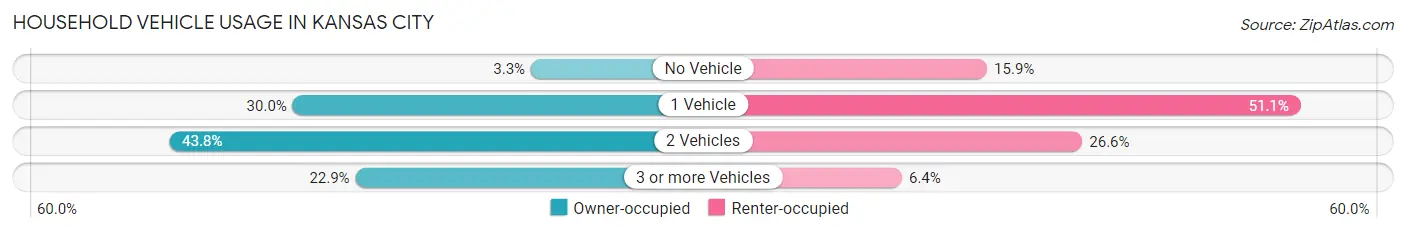
| Vehicles per Household | Owner-occupied | Renter-occupied |
| No Vehicle | 3,829 (3.3%) | 15,883 (15.9%) |
| 1 Vehicle | 35,017 (30.0%) | 50,897 (51.1%) |
| 2 Vehicles | 51,185 (43.8%) | 26,519 (26.6%) |
| 3 or more Vehicles | 26,802 (22.9%) | 6,381 (6.4%) |
| Total | 116,833 (100.0%) | 99,680 (100.0%) |
Real Estate & Mortgages in Kansas City
Real Estate and Mortgage Overview in Kansas City
| Characteristic | Without Mortgage | With Mortgage |
| Housing Units | 42,389 | 74,444 |
| Median Property Value | $166,000 | $231,100 |
| Median Household Income | $63,226 | $20,631 |
| Monthly Housing Costs | $588 | $5,459 |
| Real Estate Taxes | $2,030 | $1,343 |
Property Value by Mortgage Status in Kansas City
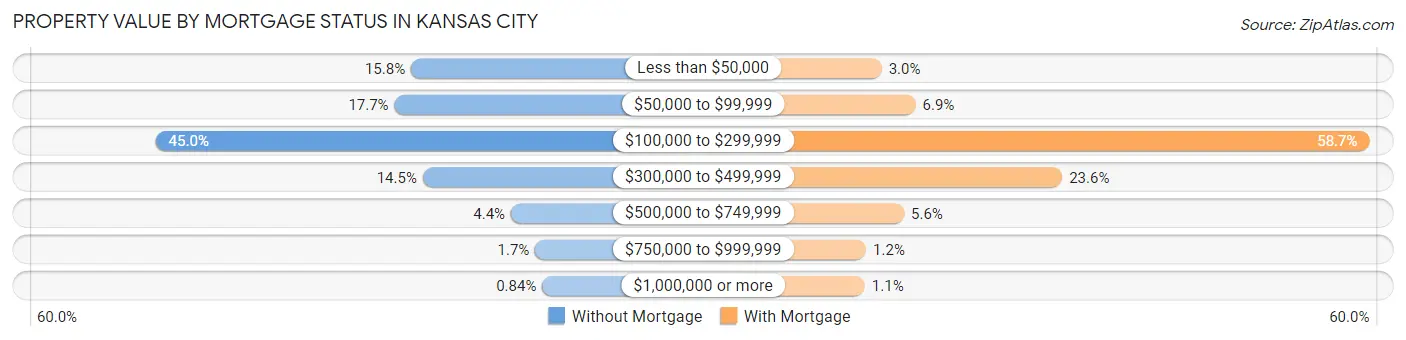
| Property Value | Without Mortgage | With Mortgage |
| Less than $50,000 | 6,713 (15.8%) | 2,225 (3.0%) |
| $50,000 to $99,999 | 7,517 (17.7%) | 5,104 (6.9%) |
| $100,000 to $299,999 | 19,083 (45.0%) | 43,704 (58.7%) |
| $300,000 to $499,999 | 6,145 (14.5%) | 17,580 (23.6%) |
| $500,000 to $749,999 | 1,874 (4.4%) | 4,130 (5.6%) |
| $750,000 to $999,999 | 700 (1.7%) | 901 (1.2%) |
| $1,000,000 or more | 357 (0.8%) | 800 (1.1%) |
| Total | 42,389 (100.0%) | 74,444 (100.0%) |
Household Income by Mortgage Status in Kansas City
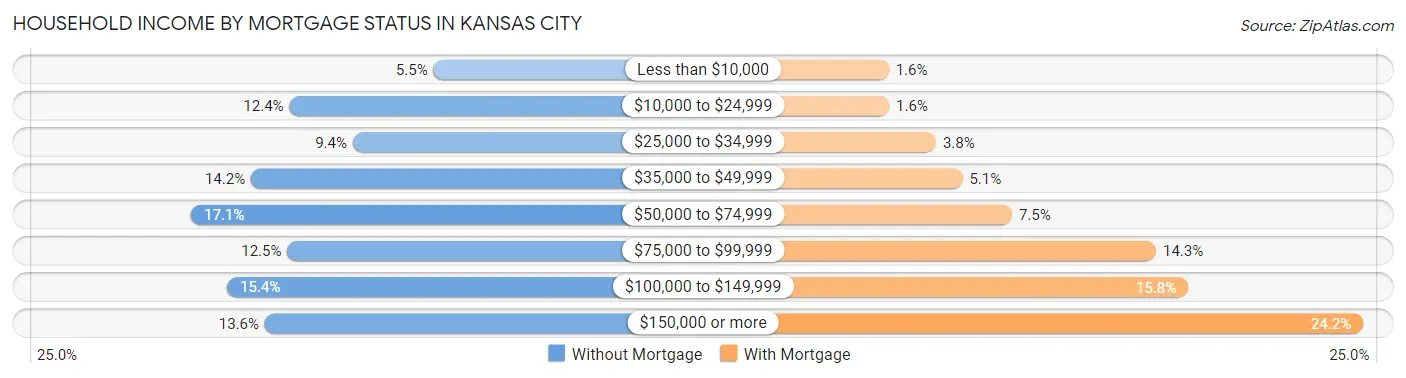
| Household Income | Without Mortgage | With Mortgage |
| Less than $10,000 | 2,345 (5.5%) | 1,173 (1.6%) |
| $10,000 to $24,999 | 5,253 (12.4%) | 1,192 (1.6%) |
| $25,000 to $34,999 | 3,970 (9.4%) | 2,849 (3.8%) |
| $35,000 to $49,999 | 6,029 (14.2%) | 3,791 (5.1%) |
| $50,000 to $74,999 | 7,237 (17.1%) | 5,549 (7.4%) |
| $75,000 to $99,999 | 5,296 (12.5%) | 10,653 (14.3%) |
| $100,000 to $149,999 | 6,510 (15.4%) | 11,785 (15.8%) |
| $150,000 or more | 5,749 (13.6%) | 17,994 (24.2%) |
| Total | 42,389 (100.0%) | 74,444 (100.0%) |
Property Value to Household Income Ratio in Kansas City
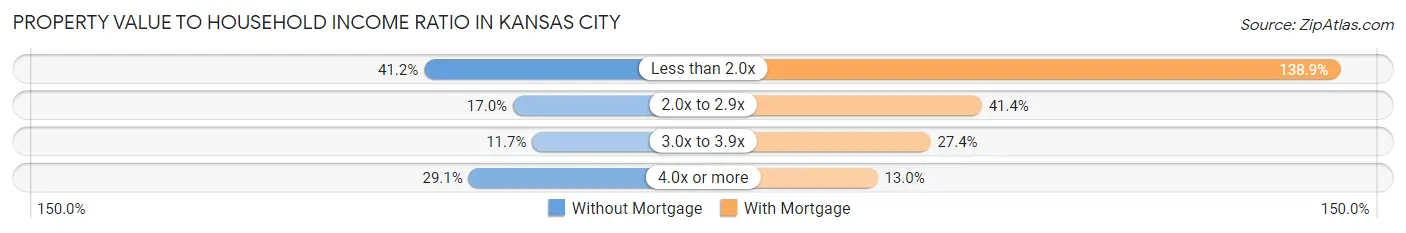
| Value-to-Income Ratio | Without Mortgage | With Mortgage |
| Less than 2.0x | 17,458 (41.2%) | 103,435 (138.9%) |
| 2.0x to 2.9x | 7,197 (17.0%) | 30,785 (41.3%) |
| 3.0x to 3.9x | 4,962 (11.7%) | 20,393 (27.4%) |
| 4.0x or more | 12,321 (29.1%) | 9,648 (13.0%) |
| Total | 42,389 (100.0%) | 74,444 (100.0%) |
Real Estate Taxes by Mortgage Status in Kansas City
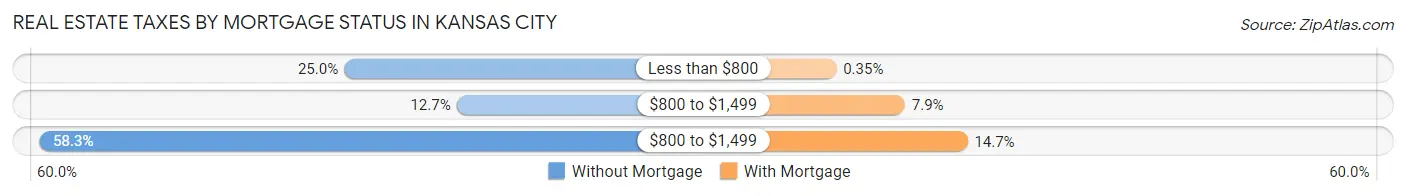
| Property Taxes | Without Mortgage | With Mortgage |
| Less than $800 | 10,596 (25.0%) | 259 (0.4%) |
| $800 to $1,499 | 5,370 (12.7%) | 5,856 (7.9%) |
| $800 to $1,499 | 24,715 (58.3%) | 10,964 (14.7%) |
| Total | 42,389 (100.0%) | 74,444 (100.0%) |
Health & Disability in Kansas City
Health Insurance Coverage by Age in Kansas City
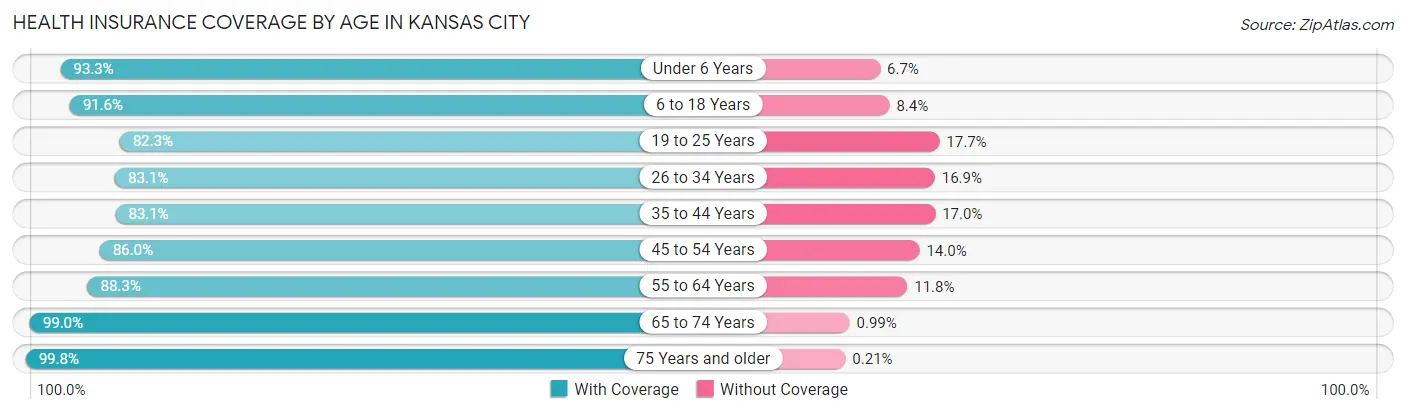
| Age Bracket | With Coverage | Without Coverage |
| Under 6 Years | 35,271 (93.3%) | 2,522 (6.7%) |
| 6 to 18 Years | 74,997 (91.6%) | 6,891 (8.4%) |
| 19 to 25 Years | 40,819 (82.3%) | 8,804 (17.7%) |
| 26 to 34 Years | 65,878 (83.1%) | 13,383 (16.9%) |
| 35 to 44 Years | 56,122 (83.1%) | 11,457 (17.0%) |
| 45 to 54 Years | 48,737 (86.0%) | 7,949 (14.0%) |
| 55 to 64 Years | 53,180 (88.2%) | 7,082 (11.7%) |
| 65 to 74 Years | 41,916 (99.0%) | 418 (1.0%) |
| 75 Years and older | 26,073 (99.8%) | 56 (0.2%) |
| Total | 442,993 (88.3%) | 58,562 (11.7%) |
Health Insurance Coverage by Citizenship Status in Kansas City
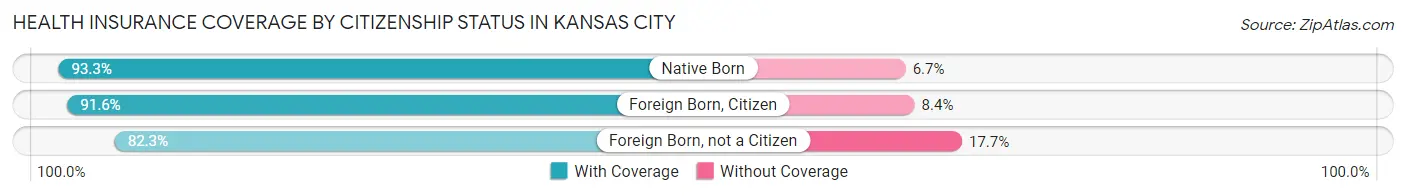
| Citizenship Status | With Coverage | Without Coverage |
| Native Born | 35,271 (93.3%) | 2,522 (6.7%) |
| Foreign Born, Citizen | 74,997 (91.6%) | 6,891 (8.4%) |
| Foreign Born, not a Citizen | 40,819 (82.3%) | 8,804 (17.7%) |
Health Insurance Coverage by Household Income in Kansas City
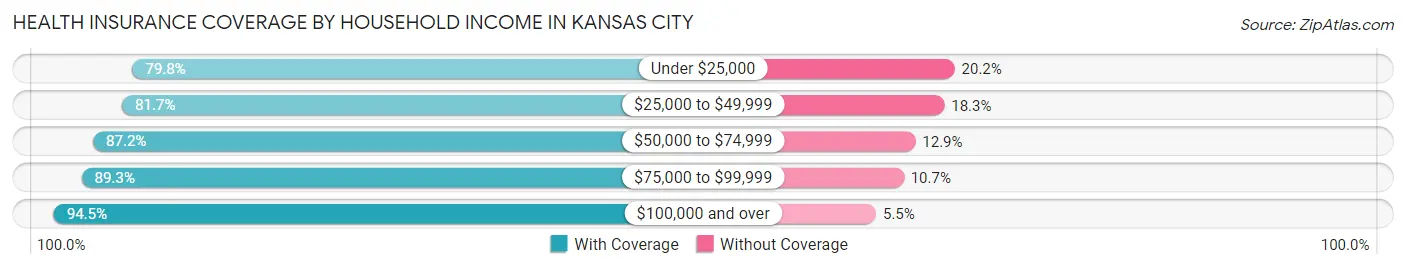
| Household Income | With Coverage | Without Coverage |
| Under $25,000 | 54,699 (79.8%) | 13,847 (20.2%) |
| $25,000 to $49,999 | 71,260 (81.7%) | 15,920 (18.3%) |
| $50,000 to $74,999 | 68,986 (87.2%) | 10,171 (12.9%) |
| $75,000 to $99,999 | 61,486 (89.3%) | 7,344 (10.7%) |
| $100,000 and over | 182,039 (94.5%) | 10,544 (5.5%) |
Public vs Private Health Insurance Coverage by Age in Kansas City
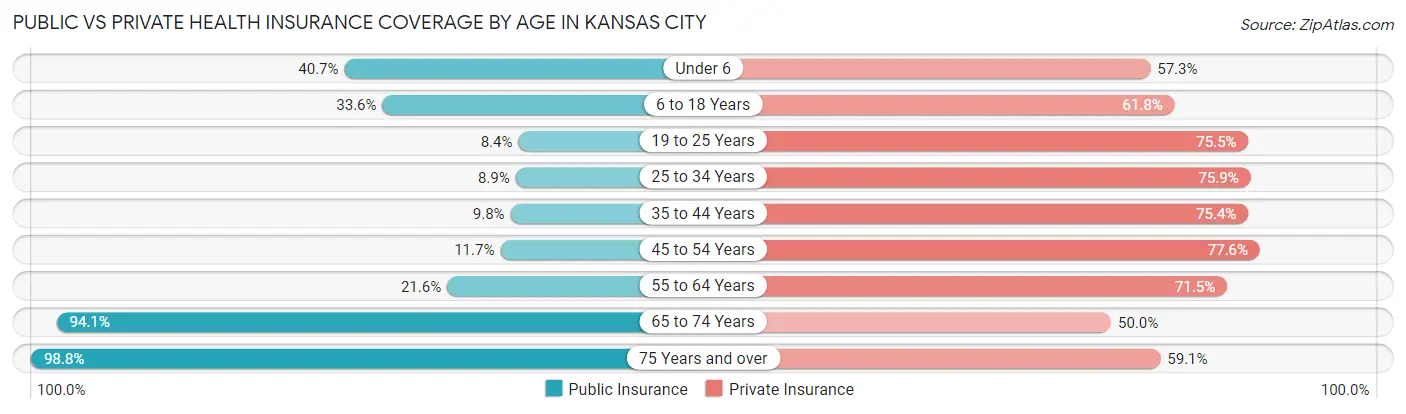
| Age Bracket | Public Insurance | Private Insurance |
| Under 6 | 15,364 (40.6%) | 21,639 (57.3%) |
| 6 to 18 Years | 27,508 (33.6%) | 50,587 (61.8%) |
| 19 to 25 Years | 4,155 (8.4%) | 37,451 (75.5%) |
| 25 to 34 Years | 7,034 (8.9%) | 60,143 (75.9%) |
| 35 to 44 Years | 6,636 (9.8%) | 50,972 (75.4%) |
| 45 to 54 Years | 6,644 (11.7%) | 43,985 (77.6%) |
| 55 to 64 Years | 13,018 (21.6%) | 43,093 (71.5%) |
| 65 to 74 Years | 39,818 (94.1%) | 21,162 (50.0%) |
| 75 Years and over | 25,818 (98.8%) | 15,450 (59.1%) |
| Total | 145,995 (29.1%) | 344,482 (68.7%) |
Disability Status by Sex by Age in Kansas City
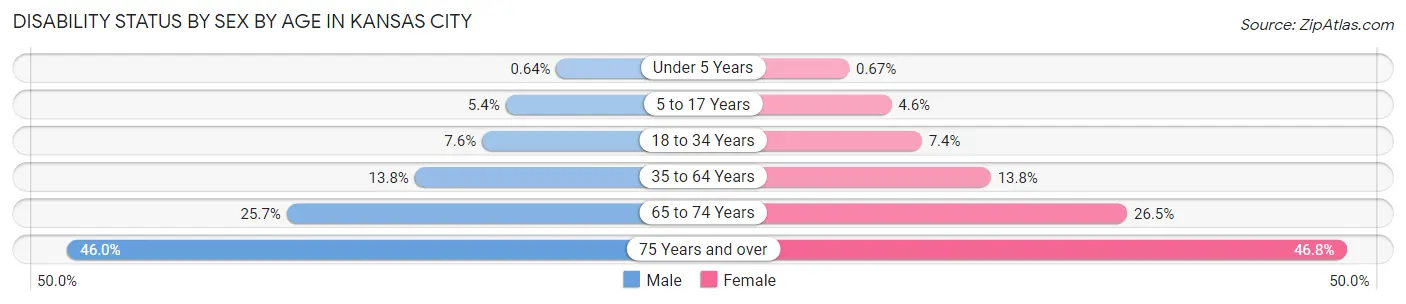
| Age Bracket | Male | Female |
| Under 5 Years | 102 (0.6%) | 103 (0.7%) |
| 5 to 17 Years | 2,234 (5.4%) | 1,857 (4.6%) |
| 18 to 34 Years | 4,912 (7.5%) | 5,211 (7.4%) |
| 35 to 64 Years | 12,558 (13.8%) | 12,924 (13.8%) |
| 65 to 74 Years | 4,949 (25.7%) | 6,107 (26.5%) |
| 75 Years and over | 4,520 (46.0%) | 7,634 (46.8%) |
Disability Class by Sex by Age in Kansas City
Disability Class: Hearing Difficulty
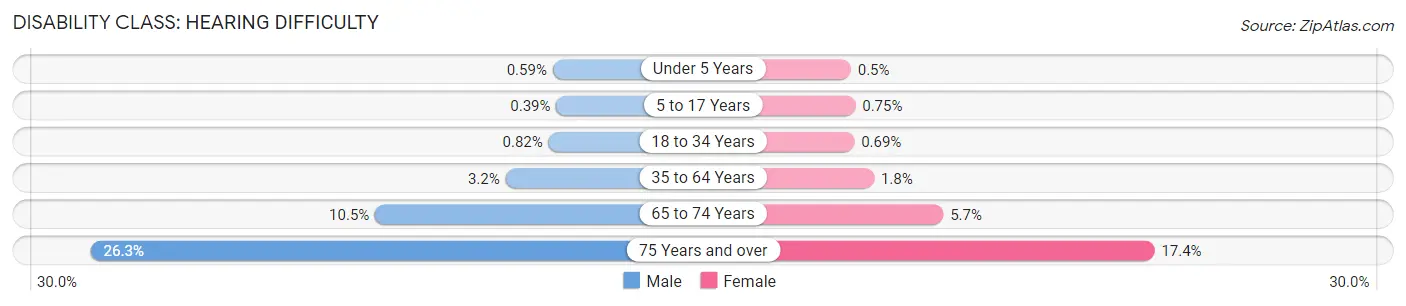
| Age Bracket | Male | Female |
| Under 5 Years | 95 (0.6%) | 77 (0.5%) |
| 5 to 17 Years | 164 (0.4%) | 302 (0.7%) |
| 18 to 34 Years | 532 (0.8%) | 485 (0.7%) |
| 35 to 64 Years | 2,928 (3.2%) | 1,674 (1.8%) |
| 65 to 74 Years | 2,019 (10.5%) | 1,302 (5.7%) |
| 75 Years and over | 2,584 (26.3%) | 2,839 (17.4%) |
Disability Class: Vision Difficulty
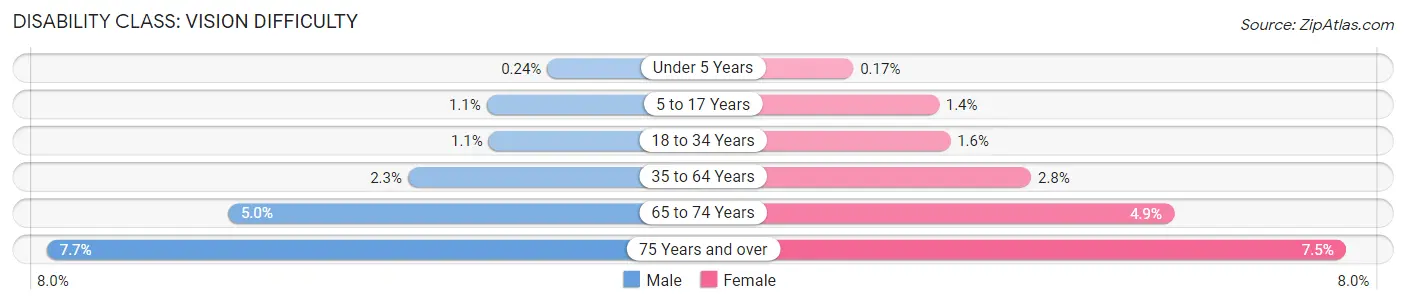
| Age Bracket | Male | Female |
| Under 5 Years | 38 (0.2%) | 26 (0.2%) |
| 5 to 17 Years | 475 (1.1%) | 581 (1.4%) |
| 18 to 34 Years | 719 (1.1%) | 1,131 (1.6%) |
| 35 to 64 Years | 2,101 (2.3%) | 2,630 (2.8%) |
| 65 to 74 Years | 959 (5.0%) | 1,136 (4.9%) |
| 75 Years and over | 753 (7.7%) | 1,220 (7.5%) |
Disability Class: Cognitive Difficulty
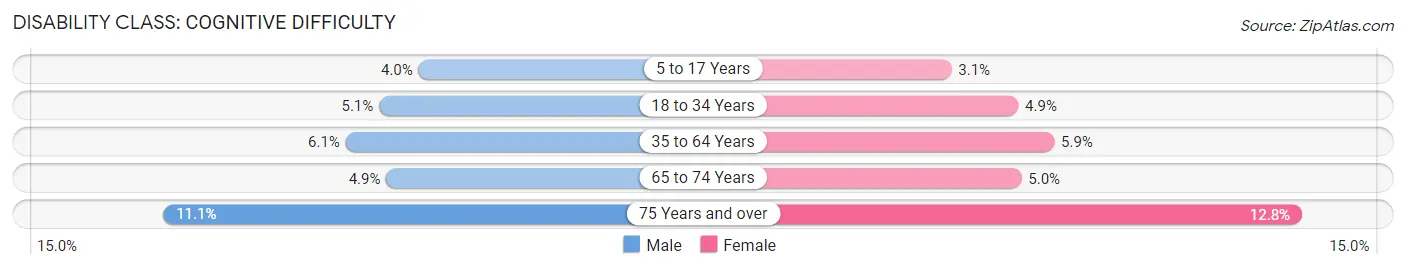
| Age Bracket | Male | Female |
| 5 to 17 Years | 1,674 (4.0%) | 1,230 (3.0%) |
| 18 to 34 Years | 3,339 (5.1%) | 3,447 (4.9%) |
| 35 to 64 Years | 5,512 (6.1%) | 5,523 (5.9%) |
| 65 to 74 Years | 950 (4.9%) | 1,153 (5.0%) |
| 75 Years and over | 1,094 (11.1%) | 2,089 (12.8%) |
Disability Class: Ambulatory Difficulty
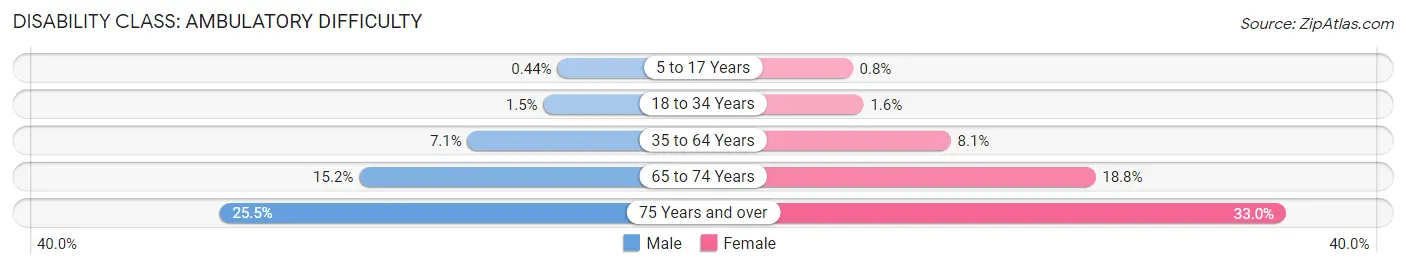
| Age Bracket | Male | Female |
| 5 to 17 Years | 183 (0.4%) | 324 (0.8%) |
| 18 to 34 Years | 962 (1.5%) | 1,128 (1.6%) |
| 35 to 64 Years | 6,469 (7.1%) | 7,557 (8.1%) |
| 65 to 74 Years | 2,921 (15.2%) | 4,341 (18.8%) |
| 75 Years and over | 2,507 (25.5%) | 5,377 (33.0%) |
Disability Class: Self-Care Difficulty
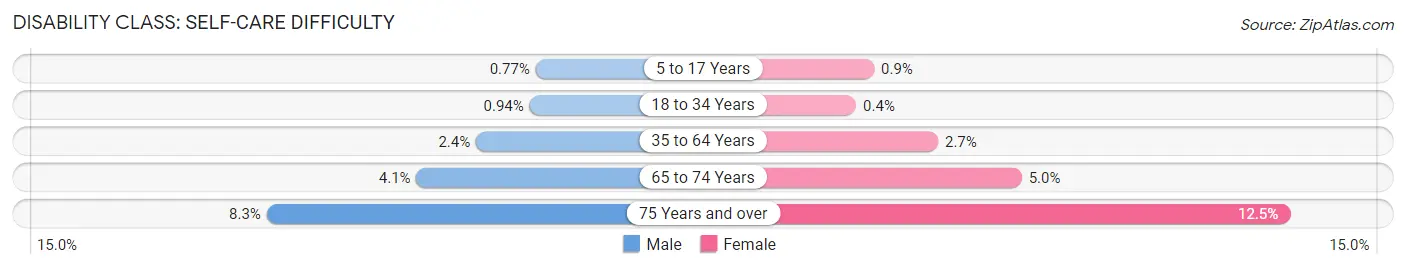
| Age Bracket | Male | Female |
| 5 to 17 Years | 320 (0.8%) | 362 (0.9%) |
| 18 to 34 Years | 610 (0.9%) | 283 (0.4%) |
| 35 to 64 Years | 2,212 (2.4%) | 2,503 (2.7%) |
| 65 to 74 Years | 789 (4.1%) | 1,155 (5.0%) |
| 75 Years and over | 811 (8.3%) | 2,036 (12.5%) |
Technology Access in Kansas City
Computing Device Access in Kansas City
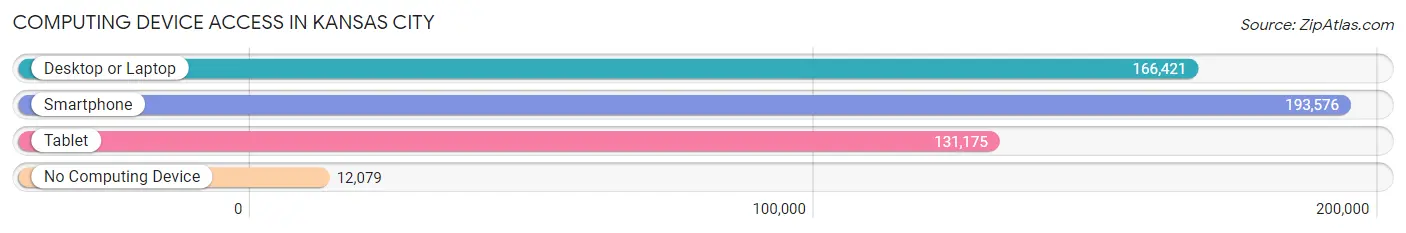
| Device Type | # Households | % Households |
| Desktop or Laptop | 166,421 | 76.9% |
| Smartphone | 193,576 | 89.4% |
| Tablet | 131,175 | 60.6% |
| No Computing Device | 12,079 | 5.6% |
| Total | 216,513 | 100.0% |
Internet Access in Kansas City
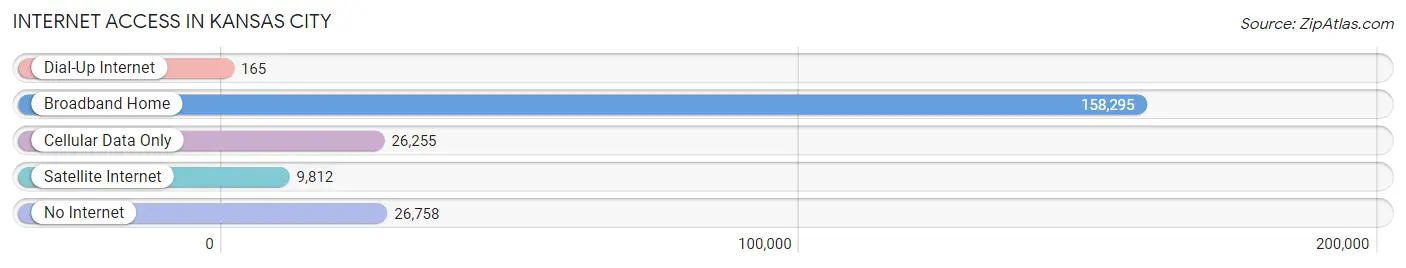
| Internet Type | # Households | % Households |
| Dial-Up Internet | 165 | 0.1% |
| Broadband Home | 158,295 | 73.1% |
| Cellular Data Only | 26,255 | 12.1% |
| Satellite Internet | 9,812 | 4.5% |
| No Internet | 26,758 | 12.4% |
| Total | 216,513 | 100.0% |
Kansas City Summary
Kansas City, Missouri is a major city located in the Midwestern United States. It is the largest city in the state of Missouri and the 37th largest city in the United States. It is located on the Missouri River and is the county seat of Jackson County. The city is known for its jazz and blues music, its cuisine, and its professional sports teams.
History
Kansas City was founded in 1838 as the Town of Kansas. It was named after the Kansas River, which flows through the city. The city was incorporated in 1853 and became a major transportation hub due to its location at the confluence of the Missouri and Kansas Rivers. The city grew rapidly in the late 19th century and early 20th century, becoming a major industrial center. It was also a major center for jazz and blues music.
Geography
Kansas City is located in the Midwestern United States, in the state of Missouri. It is situated on the Missouri River and is the county seat of Jackson County. The city is located at the confluence of the Missouri and Kansas Rivers. The city has an area of 319 square miles and a population of 488,943 as of the 2010 census.
Economy
Kansas City is a major economic center in the Midwest. It is home to several Fortune 500 companies, including Sprint, H&R Block, and Hallmark Cards. The city is also a major transportation hub, with two major airports, a major railway hub, and several major highways. The city is also a major center for the food processing industry, with several large food processing companies located in the city.
Demographics
As of the 2010 census, Kansas City had a population of 488,943. The racial makeup of the city was 63.2% White, 28.7% African American, 0.4% Native American, 2.2% Asian, 0.1% Pacific Islander, 2.7% from other races, and 2.7% from two or more races. The median household income was $41,939 and the median family income was $50,821. The per capita income was $25,945.
Conclusion
Kansas City, Missouri is a major city located in the Midwestern United States. It is the largest city in the state of Missouri and the 37th largest city in the United States. It is located on the Missouri River and is the county seat of Jackson County. The city is known for its jazz and blues music, its cuisine, and its professional sports teams. Kansas City is a major economic center in the Midwest, with several Fortune 500 companies, a major transportation hub, and a major center for the food processing industry. As of the 2010 census, the city had a population of 488,943, with a median household income of $41,939 and a median family income of $50,821.
Common Questions
What is Per Capita Income in Kansas City?
Per Capita income in Kansas City is $38,146.
What is the Median Family Income in Kansas City?
Median Family Income in Kansas City is $85,631.
What is the Median Household income in Kansas City?
Median Household Income in Kansas City is $65,256.
What is Income or Wage Gap in Kansas City?
Income or Wage Gap in Kansas City is 22.6%.
Women in Kansas City earn 77.4 cents for every dollar earned by a man.
What is Family Income Deficit in Kansas City?
Family Income Deficit in Kansas City is $11,225.
Families that are below poverty line in Kansas City earn $11,225 less on average than the poverty threshold level.
What is Inequality or Gini Index in Kansas City?
Inequality or Gini Index in Kansas City is 0.47.
What is the Total Population of Kansas City?
Total Population of Kansas City is 505,958.
What is the Total Male Population of Kansas City?
Total Male Population of Kansas City is 245,393.
What is the Total Female Population of Kansas City?
Total Female Population of Kansas City is 260,565.
What is the Ratio of Males per 100 Females in Kansas City?
There are 94.18 Males per 100 Females in Kansas City.
What is the Ratio of Females per 100 Males in Kansas City?
There are 106.18 Females per 100 Males in Kansas City.
What is the Median Population Age in Kansas City?
Median Population Age in Kansas City is 35.4 Years.
What is the Average Family Size in Kansas City
Average Family Size in Kansas City is 3.1 People.
What is the Average Household Size in Kansas City
Average Household Size in Kansas City is 2.3 People.
How Large is the Labor Force in Kansas City?
There are 279,135 People in the Labor Forcein in Kansas City.
What is the Percentage of People in the Labor Force in Kansas City?
69.0% of People are in the Labor Force in Kansas City.
What is the Unemployment Rate in Kansas City?
Unemployment Rate in Kansas City is 4.8%.