Cape Coral, FL Map & Demographics
Cape Coral Map
Cape Coral Overview
$37,621
PER CAPITA INCOME
$81,987
AVG FAMILY INCOME
$72,474
AVG HOUSEHOLD INCOME
21.4%
WAGE / INCOME GAP [ % ]
78.6¢/ $1
WAGE / INCOME GAP [ $ ]
$10,814
FAMILY INCOME DEFICIT
0.42
INEQUALITY / GINI INDEX
198,912
TOTAL POPULATION
99,587
MALE POPULATION
99,325
FEMALE POPULATION
100.26
MALES / 100 FEMALES
99.74
FEMALES / 100 MALES
48.2
MEDIAN AGE
3.0
AVG FAMILY SIZE
2.6
AVG HOUSEHOLD SIZE
97,676
LABOR FORCE [ PEOPLE ]
58.0%
PERCENT IN LABOR FORCE
4.4%
UNEMPLOYMENT RATE
Cape Coral Area Codes
Income in Cape Coral
Income Overview in Cape Coral
Per Capita Income in Cape Coral is $37,621, while median incomes of families and households are $81,987 and $72,474 respectively.
| Characteristic | Number | Measure |
| Per Capita Income | 198,912 | $37,621 |
| Median Family Income | 53,259 | $81,987 |
| Mean Family Income | 53,259 | $102,094 |
| Median Household Income | 76,882 | $72,474 |
| Mean Household Income | 76,882 | $91,771 |
| Income Deficit | 53,259 | $10,814 |
| Wage / Income Gap (%) | 198,912 | 21.40% |
| Wage / Income Gap ($) | 198,912 | 78.60¢ per $1 |
| Gini / Inequality Index | 198,912 | 0.42 |
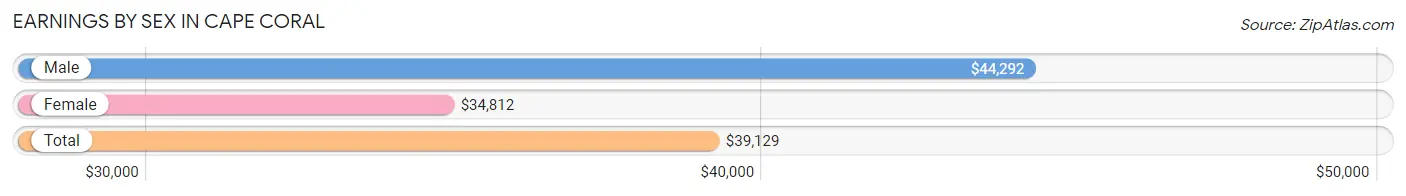
Earnings by Sex in Cape Coral
Average Earnings in Cape Coral are $39,129, $44,292 for men and $34,812 for women, a difference of 21.4%.
| Sex | Number | Average Earnings |
| Male | 52,255 (51.9%) | $44,292 |
| Female | 48,515 (48.1%) | $34,812 |
| Total | 100,770 (100.0%) | $39,129 |
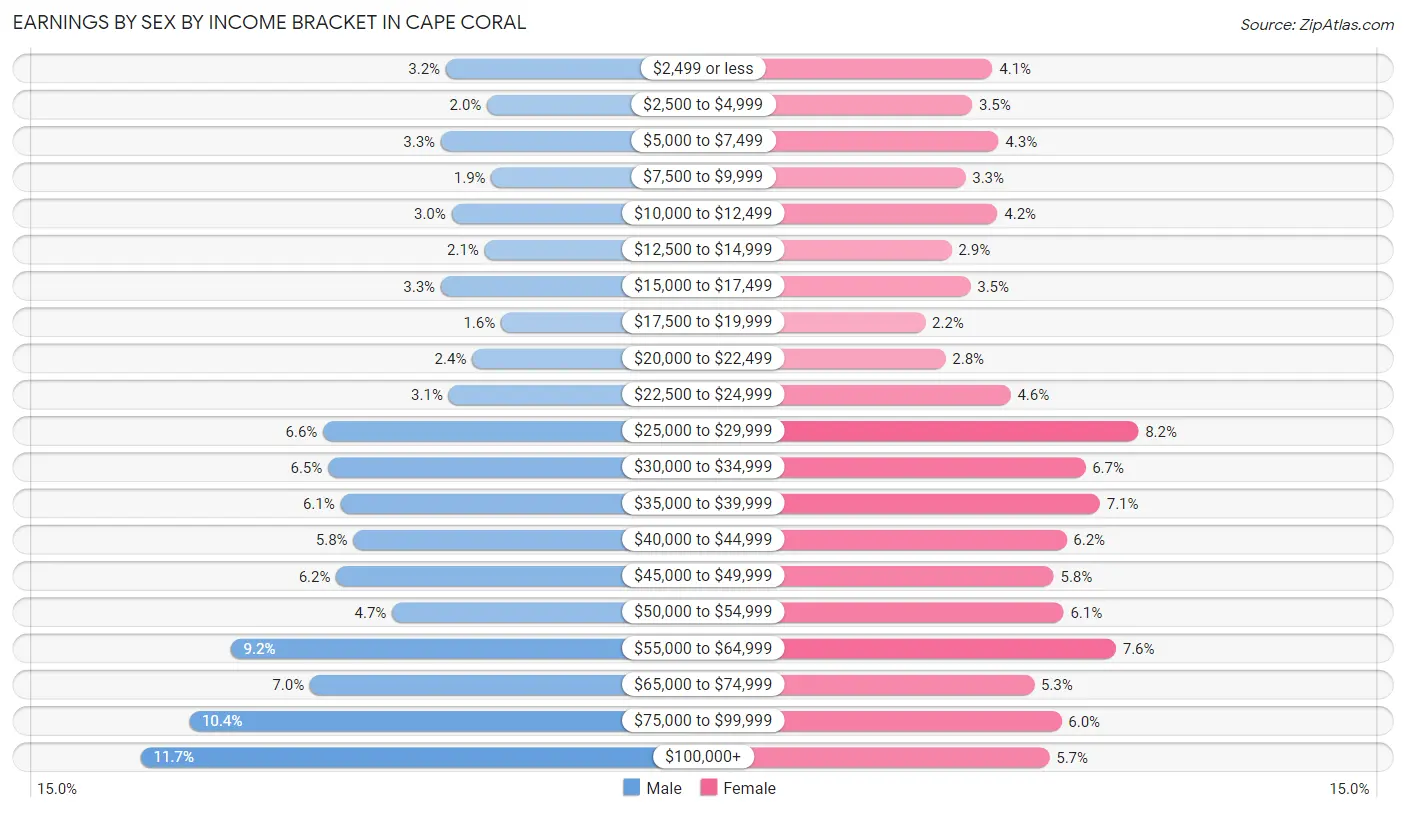
Earnings by Sex by Income Bracket in Cape Coral
The most common earnings brackets in Cape Coral are $100,000+ for men (6,135 | 11.7%) and $25,000 to $29,999 for women (3,975 | 8.2%).
| Income | Male | Female |
| $2,499 or less | 1,651 (3.2%) | 1,982 (4.1%) |
| $2,500 to $4,999 | 1,043 (2.0%) | 1,709 (3.5%) |
| $5,000 to $7,499 | 1,723 (3.3%) | 2,065 (4.3%) |
| $7,500 to $9,999 | 984 (1.9%) | 1,615 (3.3%) |
| $10,000 to $12,499 | 1,570 (3.0%) | 2,050 (4.2%) |
| $12,500 to $14,999 | 1,083 (2.1%) | 1,425 (2.9%) |
| $15,000 to $17,499 | 1,727 (3.3%) | 1,685 (3.5%) |
| $17,500 to $19,999 | 841 (1.6%) | 1,068 (2.2%) |
| $20,000 to $22,499 | 1,265 (2.4%) | 1,346 (2.8%) |
| $22,500 to $24,999 | 1,610 (3.1%) | 2,230 (4.6%) |
| $25,000 to $29,999 | 3,453 (6.6%) | 3,975 (8.2%) |
| $30,000 to $34,999 | 3,380 (6.5%) | 3,249 (6.7%) |
| $35,000 to $39,999 | 3,198 (6.1%) | 3,448 (7.1%) |
| $40,000 to $44,999 | 3,008 (5.8%) | 2,992 (6.2%) |
| $45,000 to $49,999 | 3,260 (6.2%) | 2,817 (5.8%) |
| $50,000 to $54,999 | 2,439 (4.7%) | 2,953 (6.1%) |
| $55,000 to $64,999 | 4,811 (9.2%) | 3,666 (7.6%) |
| $65,000 to $74,999 | 3,649 (7.0%) | 2,552 (5.3%) |
| $75,000 to $99,999 | 5,425 (10.4%) | 2,926 (6.0%) |
| $100,000+ | 6,135 (11.7%) | 2,762 (5.7%) |
| Total | 52,255 (100.0%) | 48,515 (100.0%) |
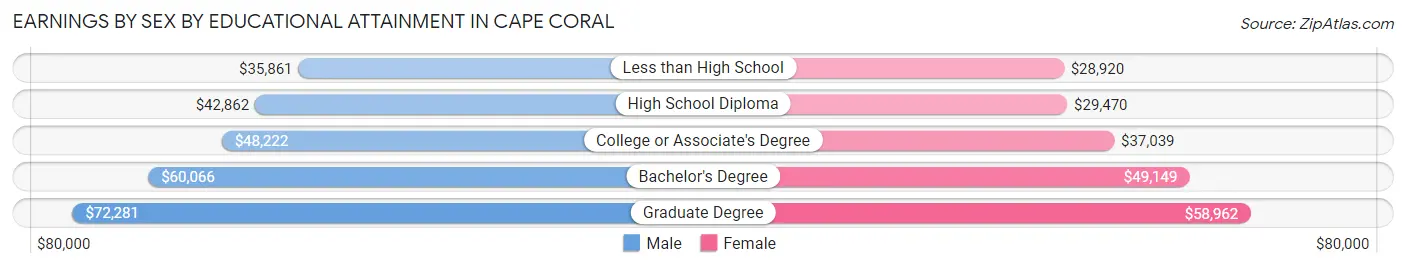
Earnings by Sex by Educational Attainment in Cape Coral
Average earnings in Cape Coral are $47,507 for men and $38,050 for women, a difference of 19.9%. Men with an educational attainment of graduate degree enjoy the highest average annual earnings of $72,281, while those with less than high school education earn the least with $35,861. Women with an educational attainment of graduate degree earn the most with the average annual earnings of $58,962, while those with less than high school education have the smallest earnings of $28,920.
| Educational Attainment | Male Income | Female Income |
| Less than High School | $35,861 | $28,920 |
| High School Diploma | $42,862 | $29,470 |
| College or Associate's Degree | $48,222 | $37,039 |
| Bachelor's Degree | $60,066 | $49,149 |
| Graduate Degree | $72,281 | $58,962 |
| Total | $47,507 | $38,050 |
Family Income in Cape Coral
Family Income Brackets in Cape Coral
According to the Cape Coral family income data, there are 11,344 families falling into the $100,000 to $149,999 income range, which is the most common income bracket and makes up 21.3% of all families. Conversely, the $10,000 to $14,999 income bracket is the least frequent group with only 746 families (1.4%) belonging to this category.
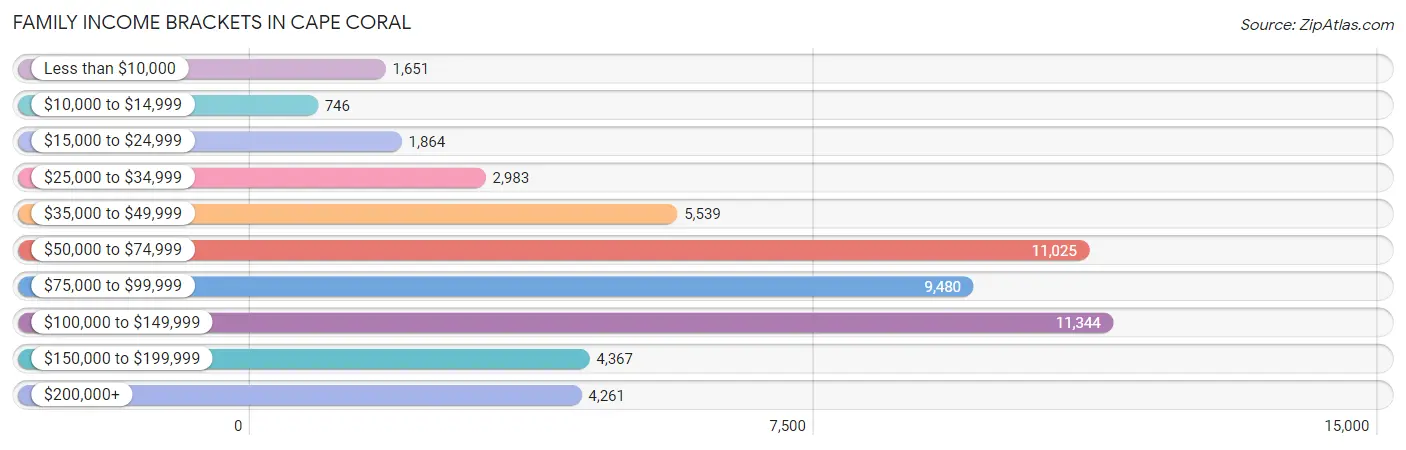
| Income Bracket | # Families | % Families |
| Less than $10,000 | 1,651 | 3.1% |
| $10,000 to $14,999 | 746 | 1.4% |
| $15,000 to $24,999 | 1,864 | 3.5% |
| $25,000 to $34,999 | 2,983 | 5.6% |
| $35,000 to $49,999 | 5,539 | 10.4% |
| $50,000 to $74,999 | 11,025 | 20.7% |
| $75,000 to $99,999 | 9,480 | 17.8% |
| $100,000 to $149,999 | 11,344 | 21.3% |
| $150,000 to $199,999 | 4,367 | 8.2% |
| $200,000+ | 4,261 | 8.0% |
Family Income by Famaliy Size in Cape Coral
6-person families (771 | 1.5%) account for the highest median family income in Cape Coral with $117,853 per family, while 2-person families (30,891 | 58.0%) have the highest median income of $38,092 per family member.
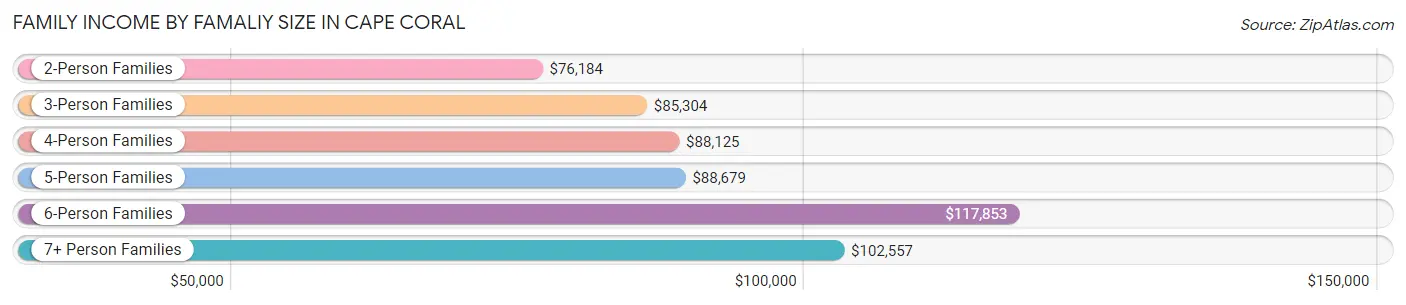
| Income Bracket | # Families | Median Income |
| 2-Person Families | 30,891 (58.0%) | $76,184 |
| 3-Person Families | 10,016 (18.8%) | $85,304 |
| 4-Person Families | 7,834 (14.7%) | $88,125 |
| 5-Person Families | 3,288 (6.2%) | $88,679 |
| 6-Person Families | 771 (1.5%) | $117,853 |
| 7+ Person Families | 459 (0.9%) | $102,557 |
| Total | 53,259 (100.0%) | $81,987 |
Family Income by Number of Earners in Cape Coral
The median family income in Cape Coral is $81,987, with families comprising 3+ earners (4,362) having the highest median family income of $124,567, while families with no earners (12,455) have the lowest median family income of $57,716, accounting for 8.2% and 23.4% of families, respectively.
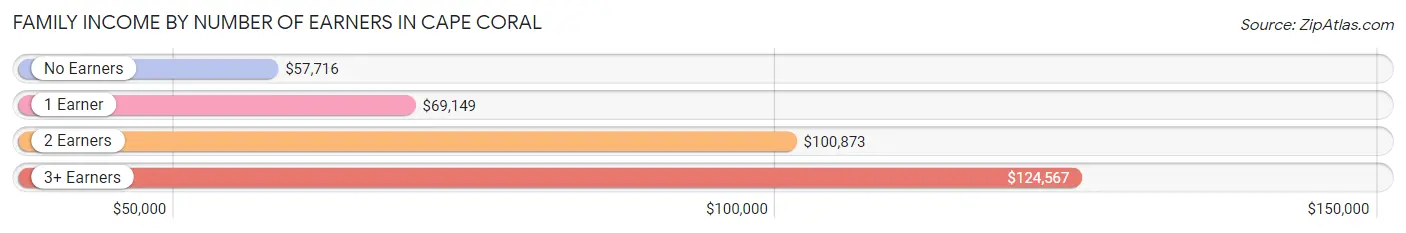
| Number of Earners | # Families | Median Income |
| No Earners | 12,455 (23.4%) | $57,716 |
| 1 Earner | 16,008 (30.1%) | $69,149 |
| 2 Earners | 20,434 (38.4%) | $100,873 |
| 3+ Earners | 4,362 (8.2%) | $124,567 |
| Total | 53,259 (100.0%) | $81,987 |
Household Income in Cape Coral
Household Income Brackets in Cape Coral
With 15,915 households falling in the category, the $50,000 to $74,999 income range is the most frequent in Cape Coral, accounting for 20.7% of all households. In contrast, only 1,845 households (2.4%) fall into the $10,000 to $14,999 income bracket, making it the least populous group.
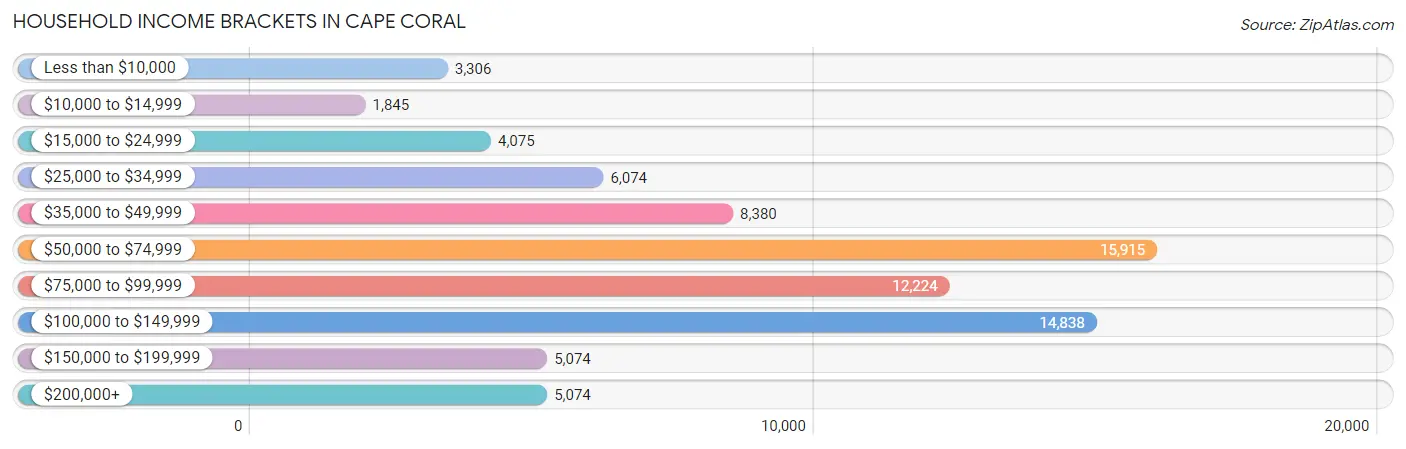
| Income Bracket | # Households | % Households |
| Less than $10,000 | 3,306 | 4.3% |
| $10,000 to $14,999 | 1,845 | 2.4% |
| $15,000 to $24,999 | 4,075 | 5.3% |
| $25,000 to $34,999 | 6,074 | 7.9% |
| $35,000 to $49,999 | 8,380 | 10.9% |
| $50,000 to $74,999 | 15,915 | 20.7% |
| $75,000 to $99,999 | 12,224 | 15.9% |
| $100,000 to $149,999 | 14,838 | 19.3% |
| $150,000 to $199,999 | 5,074 | 6.6% |
| $200,000+ | 5,074 | 6.6% |
Household Income by Householder Age in Cape Coral
The median household income in Cape Coral is $72,474, with the highest median household income of $82,220 found in the 45 to 64 years age bracket for the primary householder. A total of 30,879 households (40.2%) fall into this category. Meanwhile, the 65+ years age bracket for the primary householder has the lowest median household income of $57,988, with 28,683 households (37.3%) in this group.
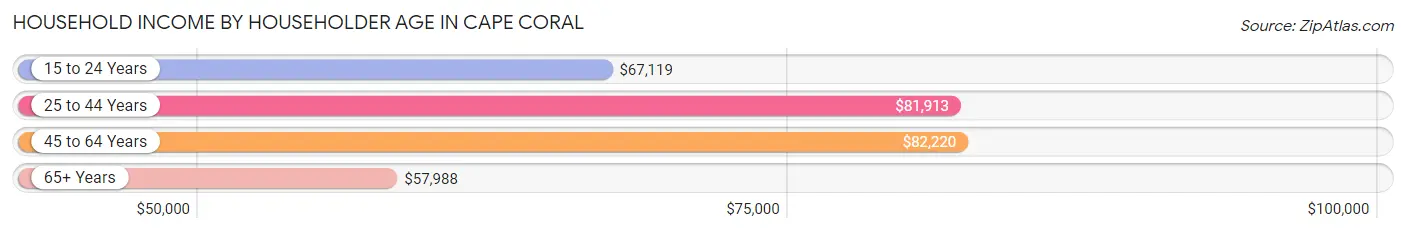
| Income Bracket | # Households | Median Income |
| 15 to 24 Years | 944 (1.2%) | $67,119 |
| 25 to 44 Years | 16,376 (21.3%) | $81,913 |
| 45 to 64 Years | 30,879 (40.2%) | $82,220 |
| 65+ Years | 28,683 (37.3%) | $57,988 |
| Total | 76,882 (100.0%) | $72,474 |
Poverty in Cape Coral
Income Below Poverty by Sex and Age in Cape Coral
With 8.9% poverty level for males and 10.8% for females among the residents of Cape Coral, 12 to 14 year old males and 15 year old females are the most vulnerable to poverty, with 594 males (19.0%) and 152 females (23.6%) in their respective age groups living below the poverty level.
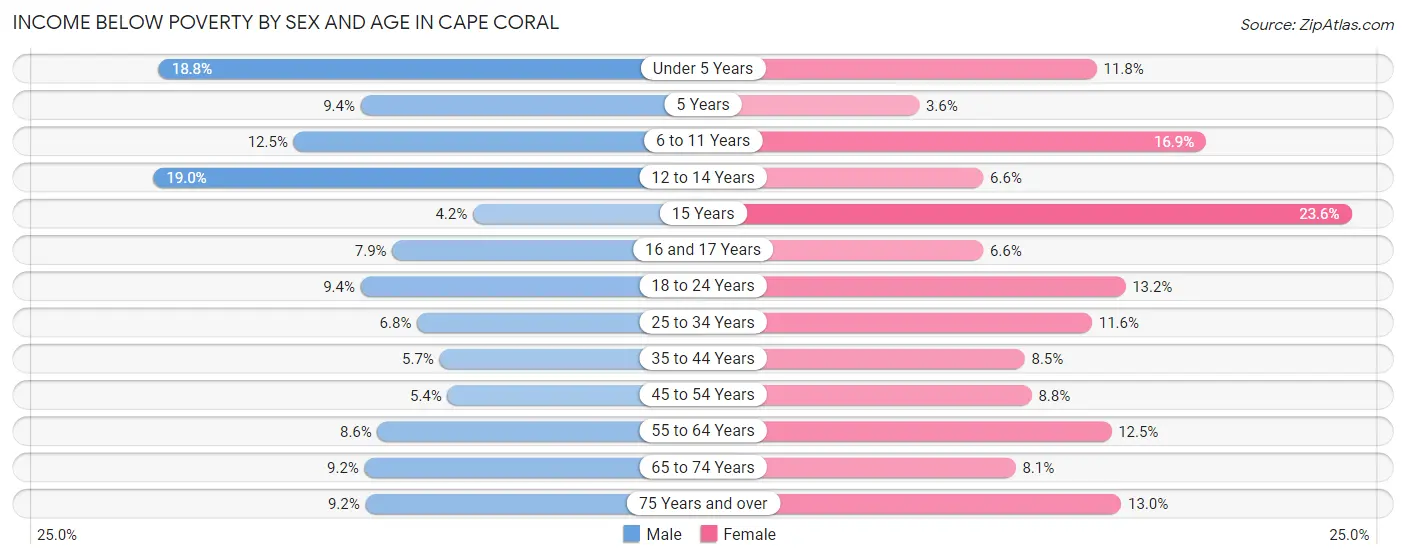
| Age Bracket | Male | Female |
| Under 5 Years | 884 (18.8%) | 484 (11.8%) |
| 5 Years | 82 (9.4%) | 30 (3.6%) |
| 6 to 11 Years | 822 (12.5%) | 938 (16.9%) |
| 12 to 14 Years | 594 (19.0%) | 175 (6.6%) |
| 15 Years | 44 (4.2%) | 152 (23.6%) |
| 16 and 17 Years | 170 (7.9%) | 136 (6.6%) |
| 18 to 24 Years | 609 (9.4%) | 809 (13.2%) |
| 25 to 34 Years | 674 (6.8%) | 1,405 (11.6%) |
| 35 to 44 Years | 653 (5.7%) | 866 (8.5%) |
| 45 to 54 Years | 725 (5.4%) | 1,209 (8.8%) |
| 55 to 64 Years | 1,328 (8.6%) | 2,000 (12.5%) |
| 65 to 74 Years | 1,308 (9.2%) | 1,172 (8.1%) |
| 75 Years and over | 902 (9.2%) | 1,326 (13.0%) |
| Total | 8,795 (8.9%) | 10,702 (10.8%) |
Income Above Poverty by Sex and Age in Cape Coral
According to the poverty statistics in Cape Coral, males aged 15 years and females aged 5 years are the age groups that are most secure financially, with 95.8% of males and 96.4% of females in these age groups living above the poverty line.
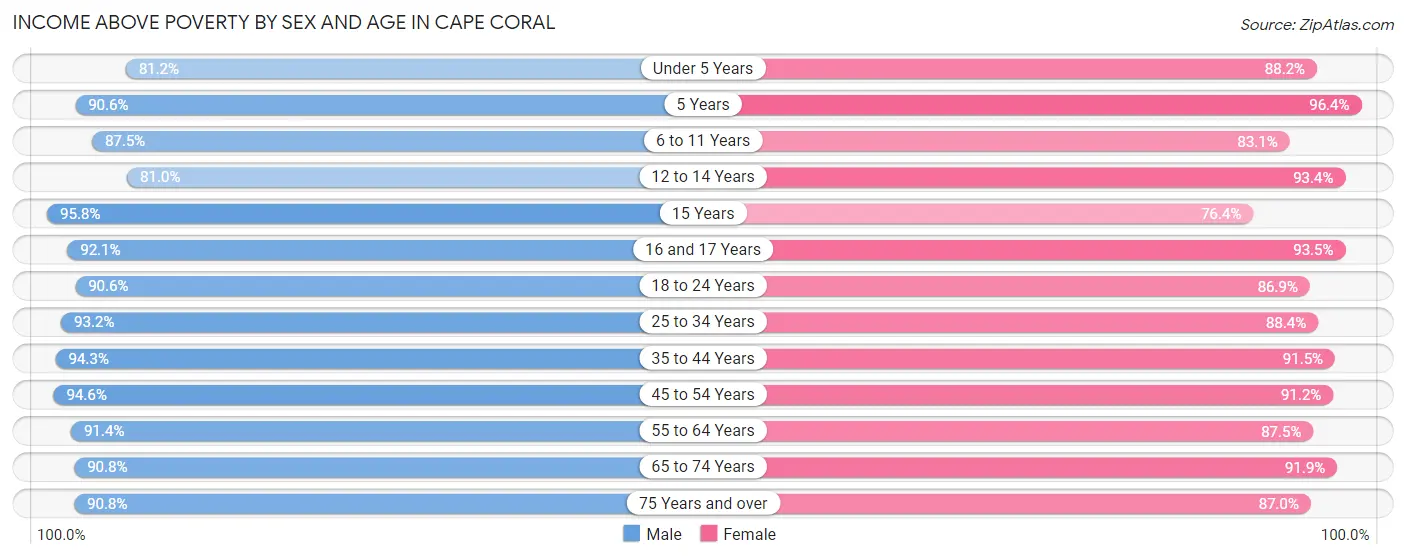
| Age Bracket | Male | Female |
| Under 5 Years | 3,825 (81.2%) | 3,611 (88.2%) |
| 5 Years | 790 (90.6%) | 808 (96.4%) |
| 6 to 11 Years | 5,749 (87.5%) | 4,613 (83.1%) |
| 12 to 14 Years | 2,529 (81.0%) | 2,492 (93.4%) |
| 15 Years | 1,007 (95.8%) | 491 (76.4%) |
| 16 and 17 Years | 1,975 (92.1%) | 1,941 (93.4%) |
| 18 to 24 Years | 5,868 (90.6%) | 5,342 (86.9%) |
| 25 to 34 Years | 9,274 (93.2%) | 10,709 (88.4%) |
| 35 to 44 Years | 10,728 (94.3%) | 9,345 (91.5%) |
| 45 to 54 Years | 12,779 (94.6%) | 12,534 (91.2%) |
| 55 to 64 Years | 14,081 (91.4%) | 13,995 (87.5%) |
| 65 to 74 Years | 12,881 (90.8%) | 13,369 (91.9%) |
| 75 Years and over | 8,919 (90.8%) | 8,902 (87.0%) |
| Total | 90,405 (91.1%) | 88,152 (89.2%) |
Income Below Poverty Among Married-Couple Families in Cape Coral
The poverty statistics for married-couple families in Cape Coral show that 4.3% or 1,804 of the total 42,017 families live below the poverty line. Families with 3 or 4 children have the highest poverty rate of 6.2%, comprising of 105 families. On the other hand, families with 5 or more children have the lowest poverty rate of 0.0%, which includes 0 families.
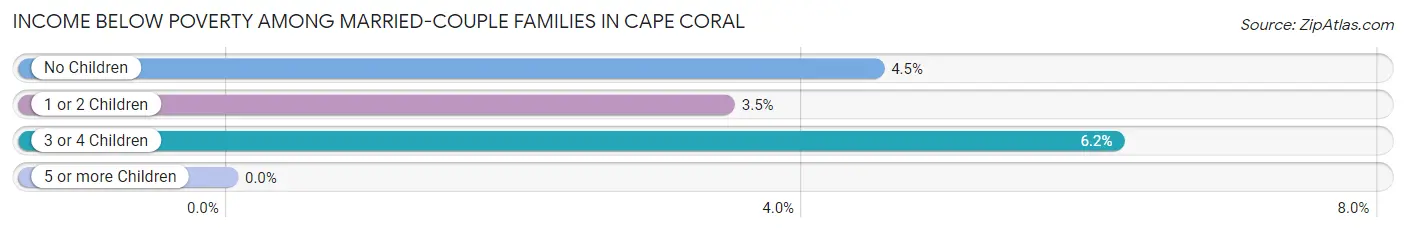
| Children | Above Poverty | Below Poverty |
| No Children | 28,237 (95.5%) | 1,329 (4.5%) |
| 1 or 2 Children | 10,322 (96.5%) | 370 (3.5%) |
| 3 or 4 Children | 1,596 (93.8%) | 105 (6.2%) |
| 5 or more Children | 58 (100.0%) | 0 (0.0%) |
| Total | 40,213 (95.7%) | 1,804 (4.3%) |
Income Below Poverty Among Single-Parent Households in Cape Coral
According to the poverty data in Cape Coral, 14.0% or 514 single-father households and 19.5% or 1,478 single-mother households are living below the poverty line. Among single-father households, those with 1 or 2 children have the highest poverty rate, with 427 households (20.9%) experiencing poverty. Likewise, among single-mother households, those with 5 or more children have the highest poverty rate, with 13 households (100.0%) falling below the poverty line.
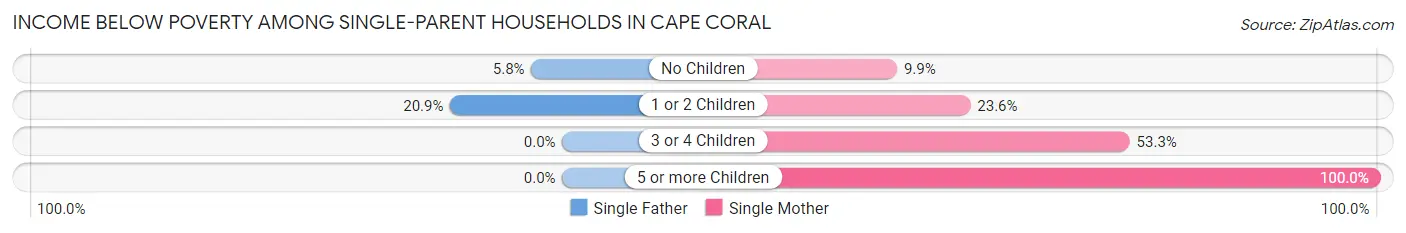
| Children | Single Father | Single Mother |
| No Children | 87 (5.8%) | 380 (9.9%) |
| 1 or 2 Children | 427 (20.9%) | 718 (23.6%) |
| 3 or 4 Children | 0 (0.0%) | 367 (53.3%) |
| 5 or more Children | 0 (0.0%) | 13 (100.0%) |
| Total | 514 (14.0%) | 1,478 (19.5%) |
Income Below Poverty Among Married-Couple vs Single-Parent Households in Cape Coral
The poverty data for Cape Coral shows that 1,804 of the married-couple family households (4.3%) and 1,992 of the single-parent households (17.7%) are living below the poverty level. Within the married-couple family households, those with 3 or 4 children have the highest poverty rate, with 105 households (6.2%) falling below the poverty line. Among the single-parent households, those with 5 or more children have the highest poverty rate, with 13 household (100.0%) living below poverty.
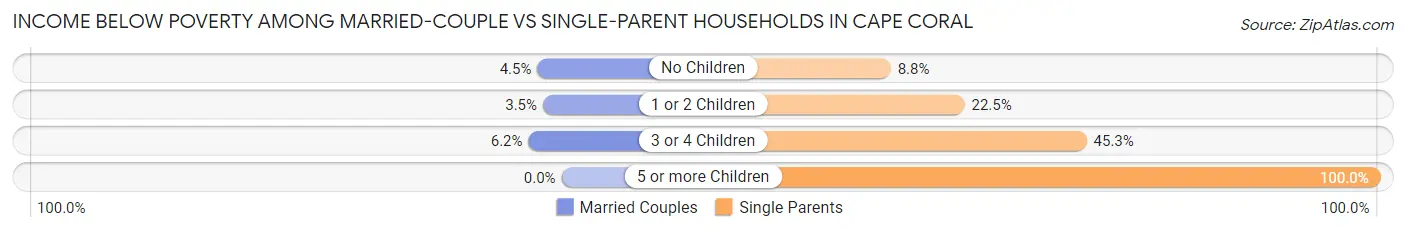
| Children | Married-Couple Families | Single-Parent Households |
| No Children | 1,329 (4.5%) | 467 (8.8%) |
| 1 or 2 Children | 370 (3.5%) | 1,145 (22.5%) |
| 3 or 4 Children | 105 (6.2%) | 367 (45.3%) |
| 5 or more Children | 0 (0.0%) | 13 (100.0%) |
| Total | 1,804 (4.3%) | 1,992 (17.7%) |
Race in Cape Coral
The most populous races in Cape Coral are White / Caucasian (153,427 | 77.1%), Hispanic or Latino (47,684 | 24.0%), and Two or more Races (26,330 | 13.2%).
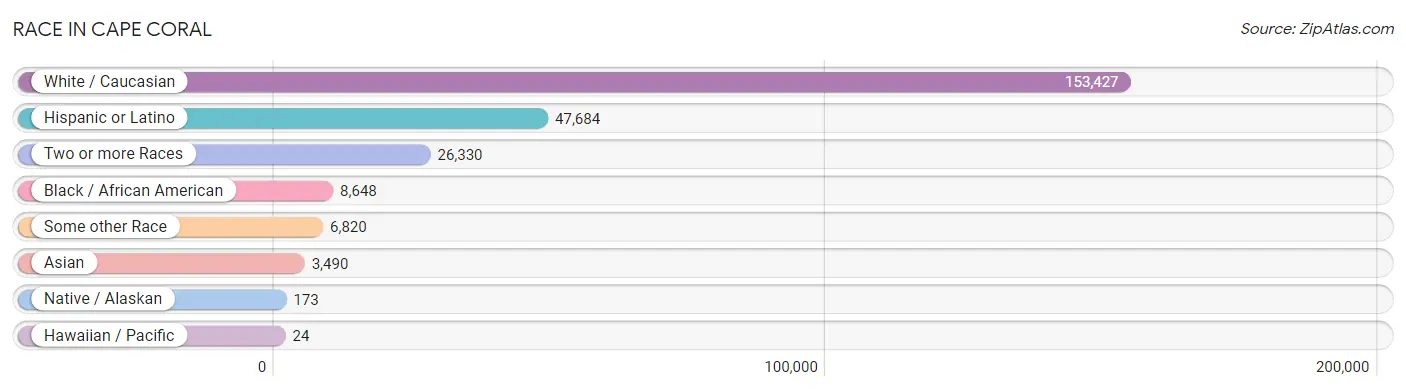
| Race | # Population | % Population |
| Asian | 3,490 | 1.8% |
| Black / African American | 8,648 | 4.3% |
| Hawaiian / Pacific | 24 | 0.0% |
| Hispanic or Latino | 47,684 | 24.0% |
| Native / Alaskan | 173 | 0.1% |
| White / Caucasian | 153,427 | 77.1% |
| Two or more Races | 26,330 | 13.2% |
| Some other Race | 6,820 | 3.4% |
| Total | 198,912 | 100.0% |
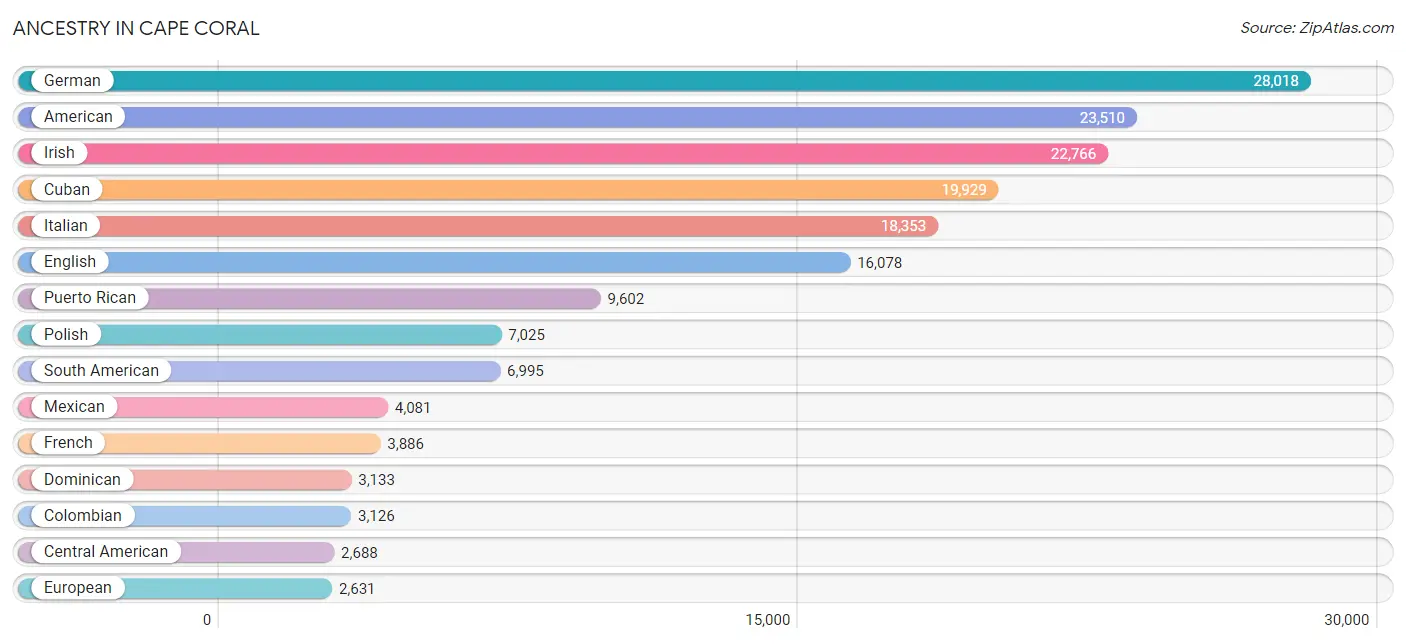
Ancestry in Cape Coral
The most populous ancestries reported in Cape Coral are German (28,018 | 14.1%), American (23,510 | 11.8%), Irish (22,766 | 11.5%), Cuban (19,929 | 10.0%), and Italian (18,353 | 9.2%), together accounting for 56.6% of all Cape Coral residents.
| Ancestry | # Population | % Population |
| African | 588 | 0.3% |
| American | 23,510 | 11.8% |
| Arab | 530 | 0.3% |
| Argentinean | 305 | 0.2% |
| Armenian | 115 | 0.1% |
| Australian | 14 | 0.0% |
| Austrian | 436 | 0.2% |
| Belgian | 263 | 0.1% |
| Belizean | 20 | 0.0% |
| Bhutanese | 260 | 0.1% |
| Blackfeet | 130 | 0.1% |
| Bolivian | 150 | 0.1% |
| Brazilian | 749 | 0.4% |
| British | 942 | 0.5% |
| British West Indian | 180 | 0.1% |
| Bulgarian | 27 | 0.0% |
| Burmese | 55 | 0.0% |
| Cajun | 45 | 0.0% |
| Cambodian | 22 | 0.0% |
| Canadian | 734 | 0.4% |
| Cape Verdean | 11 | 0.0% |
| Carpatho Rusyn | 6 | 0.0% |
| Central American | 2,688 | 1.3% |
| Central American Indian | 109 | 0.1% |
| Cherokee | 138 | 0.1% |
| Chilean | 145 | 0.1% |
| Chippewa | 33 | 0.0% |
| Choctaw | 7 | 0.0% |
| Colombian | 3,126 | 1.6% |
| Costa Rican | 394 | 0.2% |
| Cree | 2 | 0.0% |
| Croatian | 193 | 0.1% |
| Cuban | 19,929 | 10.0% |
| Czech | 798 | 0.4% |
| Czechoslovakian | 267 | 0.1% |
| Danish | 338 | 0.2% |
| Delaware | 3 | 0.0% |
| Dominican | 3,133 | 1.6% |
| Dutch | 1,537 | 0.8% |
| Dutch West Indian | 14 | 0.0% |
| Eastern European | 355 | 0.2% |
| Ecuadorian | 1,078 | 0.5% |
| Egyptian | 28 | 0.0% |
| English | 16,078 | 8.1% |
| European | 2,631 | 1.3% |
| Finnish | 346 | 0.2% |
| French | 3,886 | 1.9% |
| French American Indian | 60 | 0.0% |
| French Canadian | 1,442 | 0.7% |
| German | 28,018 | 14.1% |
| Greek | 609 | 0.3% |
| Guatemalan | 154 | 0.1% |
| Haitian | 1,344 | 0.7% |
| Honduran | 1,125 | 0.6% |
| Hungarian | 1,457 | 0.7% |
| Icelander | 43 | 0.0% |
| Indian (Asian) | 1,297 | 0.6% |
| Iranian | 40 | 0.0% |
| Iraqi | 32 | 0.0% |
| Irish | 22,766 | 11.5% |
| Iroquois | 36 | 0.0% |
| Israeli | 49 | 0.0% |
| Italian | 18,353 | 9.2% |
| Jamaican | 914 | 0.5% |
| Japanese | 18 | 0.0% |
| Korean | 1,820 | 0.9% |
| Laotian | 22 | 0.0% |
| Latvian | 21 | 0.0% |
| Lebanese | 369 | 0.2% |
| Lithuanian | 686 | 0.3% |
| Luxembourger | 15 | 0.0% |
| Macedonian | 6 | 0.0% |
| Malaysian | 14 | 0.0% |
| Mexican | 4,081 | 2.1% |
| Mongolian | 23 | 0.0% |
| Moroccan | 29 | 0.0% |
| Native Hawaiian | 32 | 0.0% |
| Nicaraguan | 861 | 0.4% |
| Nigerian | 107 | 0.1% |
| Northern European | 11 | 0.0% |
| Norwegian | 1,590 | 0.8% |
| Osage | 15 | 0.0% |
| Ottawa | 182 | 0.1% |
| Pakistani | 150 | 0.1% |
| Palestinian | 12 | 0.0% |
| Panamanian | 65 | 0.0% |
| Pennsylvania German | 118 | 0.1% |
| Peruvian | 872 | 0.4% |
| Polish | 7,025 | 3.5% |
| Portuguese | 1,094 | 0.5% |
| Potawatomi | 5 | 0.0% |
| Pueblo | 21 | 0.0% |
| Puerto Rican | 9,602 | 4.8% |
| Romanian | 346 | 0.2% |
| Russian | 1,381 | 0.7% |
| Salvadoran | 89 | 0.0% |
| Samoan | 5 | 0.0% |
| Scandinavian | 418 | 0.2% |
| Scotch-Irish | 1,548 | 0.8% |
| Scottish | 2,622 | 1.3% |
| Serbian | 42 | 0.0% |
| Slavic | 102 | 0.1% |
| Slovak | 438 | 0.2% |
| Slovene | 143 | 0.1% |
| South American | 6,995 | 3.5% |
| Spaniard | 233 | 0.1% |
| Spanish | 117 | 0.1% |
| Sri Lankan | 433 | 0.2% |
| Subsaharan African | 706 | 0.4% |
| Swedish | 1,829 | 0.9% |
| Swiss | 615 | 0.3% |
| Syrian | 33 | 0.0% |
| Thai | 438 | 0.2% |
| Trinidadian and Tobagonian | 135 | 0.1% |
| Turkish | 111 | 0.1% |
| Ukrainian | 643 | 0.3% |
| Uruguayan | 417 | 0.2% |
| Ute | 21 | 0.0% |
| Venezuelan | 902 | 0.4% |
| Welsh | 913 | 0.5% |
| West Indian | 109 | 0.1% |
| Yugoslavian | 384 | 0.2% | View All 122 Rows |
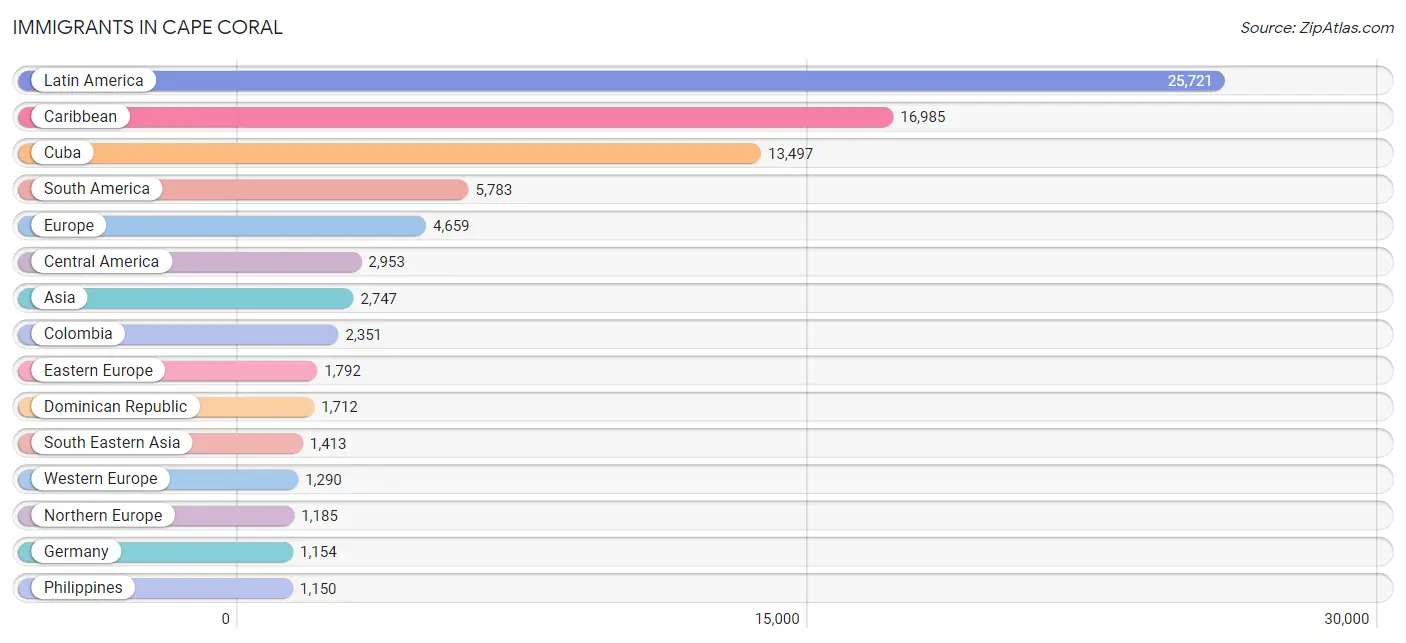
Immigrants in Cape Coral
The most numerous immigrant groups reported in Cape Coral came from Latin America (25,721 | 12.9%), Caribbean (16,985 | 8.5%), Cuba (13,497 | 6.8%), South America (5,783 | 2.9%), and Europe (4,659 | 2.3%), together accounting for 33.5% of all Cape Coral residents.
| Immigration Origin | # Population | % Population |
| Africa | 169 | 0.1% |
| Argentina | 122 | 0.1% |
| Asia | 2,747 | 1.4% |
| Australia | 6 | 0.0% |
| Austria | 44 | 0.0% |
| Bahamas | 42 | 0.0% |
| Barbados | 46 | 0.0% |
| Belarus | 18 | 0.0% |
| Belgium | 16 | 0.0% |
| Belize | 20 | 0.0% |
| Bolivia | 83 | 0.0% |
| Bosnia and Herzegovina | 177 | 0.1% |
| Brazil | 897 | 0.4% |
| Bulgaria | 11 | 0.0% |
| Cambodia | 18 | 0.0% |
| Canada | 1,061 | 0.5% |
| Caribbean | 16,985 | 8.5% |
| Central America | 2,953 | 1.5% |
| Chile | 118 | 0.1% |
| China | 605 | 0.3% |
| Colombia | 2,351 | 1.2% |
| Costa Rica | 158 | 0.1% |
| Croatia | 61 | 0.0% |
| Cuba | 13,497 | 6.8% |
| Czechoslovakia | 276 | 0.1% |
| Denmark | 43 | 0.0% |
| Dominican Republic | 1,712 | 0.9% |
| Eastern Africa | 45 | 0.0% |
| Eastern Asia | 626 | 0.3% |
| Eastern Europe | 1,792 | 0.9% |
| Ecuador | 369 | 0.2% |
| Egypt | 38 | 0.0% |
| El Salvador | 121 | 0.1% |
| England | 540 | 0.3% |
| Europe | 4,659 | 2.3% |
| France | 10 | 0.0% |
| Germany | 1,154 | 0.6% |
| Grenada | 62 | 0.0% |
| Guatemala | 89 | 0.0% |
| Guyana | 235 | 0.1% |
| Haiti | 504 | 0.3% |
| Honduras | 924 | 0.5% |
| Hungary | 206 | 0.1% |
| India | 202 | 0.1% |
| Iran | 25 | 0.0% |
| Iraq | 20 | 0.0% |
| Ireland | 214 | 0.1% |
| Israel | 56 | 0.0% |
| Italy | 305 | 0.2% |
| Jamaica | 910 | 0.5% |
| Japan | 4 | 0.0% |
| Korea | 17 | 0.0% |
| Kuwait | 12 | 0.0% |
| Laos | 27 | 0.0% |
| Latin America | 25,721 | 12.9% |
| Latvia | 11 | 0.0% |
| Lebanon | 266 | 0.1% |
| Lithuania | 33 | 0.0% |
| Mexico | 978 | 0.5% |
| Morocco | 29 | 0.0% |
| Netherlands | 66 | 0.0% |
| Nicaragua | 559 | 0.3% |
| Northern Africa | 67 | 0.0% |
| Northern Europe | 1,185 | 0.6% |
| Norway | 7 | 0.0% |
| Oceania | 6 | 0.0% |
| Pakistan | 115 | 0.1% |
| Panama | 104 | 0.1% |
| Peru | 771 | 0.4% |
| Philippines | 1,150 | 0.6% |
| Poland | 435 | 0.2% |
| Portugal | 46 | 0.0% |
| Romania | 206 | 0.1% |
| Russia | 138 | 0.1% |
| Scotland | 27 | 0.0% |
| South Africa | 39 | 0.0% |
| South America | 5,783 | 2.9% |
| South Central Asia | 342 | 0.2% |
| South Eastern Asia | 1,413 | 0.7% |
| Southern Europe | 392 | 0.2% |
| Spain | 41 | 0.0% |
| Sweden | 91 | 0.1% |
| Taiwan | 1 | 0.0% |
| Thailand | 11 | 0.0% |
| Trinidad and Tobago | 176 | 0.1% |
| Ukraine | 140 | 0.1% |
| Uruguay | 154 | 0.1% |
| Venezuela | 683 | 0.3% |
| Vietnam | 207 | 0.1% |
| Western Asia | 360 | 0.2% |
| Western Europe | 1,290 | 0.6% |
| Zimbabwe | 24 | 0.0% | View All 92 Rows |
Sex and Age in Cape Coral
Sex and Age in Cape Coral
The most populous age groups in Cape Coral are 60 to 64 Years (7,736 | 7.8%) for men and 60 to 64 Years (8,071 | 8.1%) for women.
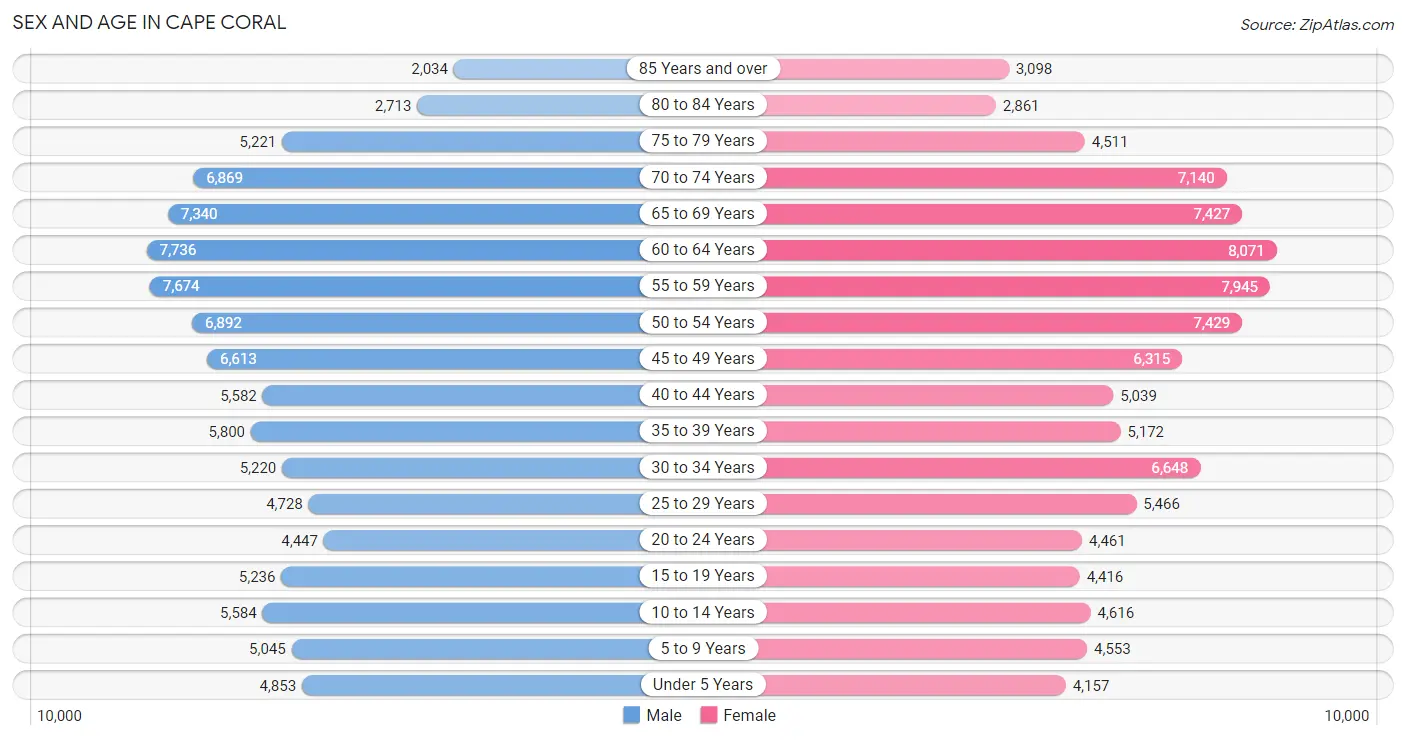
| Age Bracket | Male | Female |
| Under 5 Years | 4,853 (4.9%) | 4,157 (4.2%) |
| 5 to 9 Years | 5,045 (5.1%) | 4,553 (4.6%) |
| 10 to 14 Years | 5,584 (5.6%) | 4,616 (4.6%) |
| 15 to 19 Years | 5,236 (5.3%) | 4,416 (4.4%) |
| 20 to 24 Years | 4,447 (4.5%) | 4,461 (4.5%) |
| 25 to 29 Years | 4,728 (4.8%) | 5,466 (5.5%) |
| 30 to 34 Years | 5,220 (5.2%) | 6,648 (6.7%) |
| 35 to 39 Years | 5,800 (5.8%) | 5,172 (5.2%) |
| 40 to 44 Years | 5,582 (5.6%) | 5,039 (5.1%) |
| 45 to 49 Years | 6,613 (6.6%) | 6,315 (6.4%) |
| 50 to 54 Years | 6,892 (6.9%) | 7,429 (7.5%) |
| 55 to 59 Years | 7,674 (7.7%) | 7,945 (8.0%) |
| 60 to 64 Years | 7,736 (7.8%) | 8,071 (8.1%) |
| 65 to 69 Years | 7,340 (7.4%) | 7,427 (7.5%) |
| 70 to 74 Years | 6,869 (6.9%) | 7,140 (7.2%) |
| 75 to 79 Years | 5,221 (5.2%) | 4,511 (4.5%) |
| 80 to 84 Years | 2,713 (2.7%) | 2,861 (2.9%) |
| 85 Years and over | 2,034 (2.0%) | 3,098 (3.1%) |
| Total | 99,587 (100.0%) | 99,325 (100.0%) |
Families and Households in Cape Coral
Median Family Size in Cape Coral
The median family size in Cape Coral is 3.04 persons per family, with single female/mother families (7,570 | 14.2%) accounting for the largest median family size of 3.44 persons per family. On the other hand, single male/father families (3,672 | 6.9%) represent the smallest median family size with 2.96 persons per family.
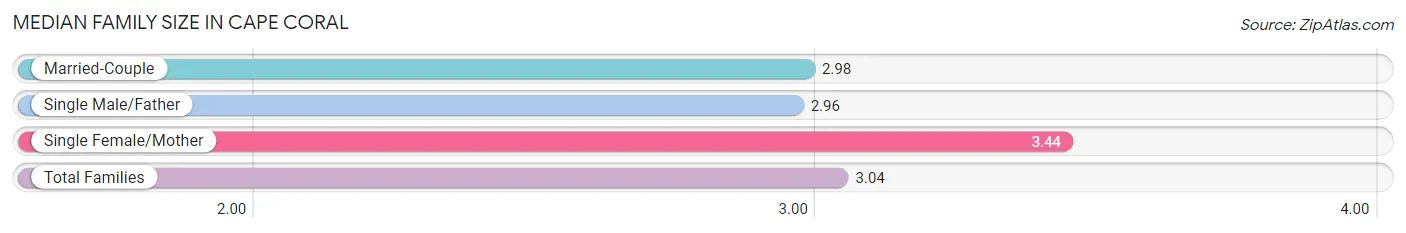
| Family Type | # Families | Family Size |
| Married-Couple | 42,017 (78.9%) | 2.98 |
| Single Male/Father | 3,672 (6.9%) | 2.96 |
| Single Female/Mother | 7,570 (14.2%) | 3.44 |
| Total Families | 53,259 (100.0%) | 3.04 |
Median Household Size in Cape Coral
The median household size in Cape Coral is 2.58 persons per household, with single female/mother households (7,570 | 9.9%) accounting for the largest median household size of 3.77 persons per household. non-family households (23,623 | 30.7%) represent the smallest median household size with 1.28 persons per household.
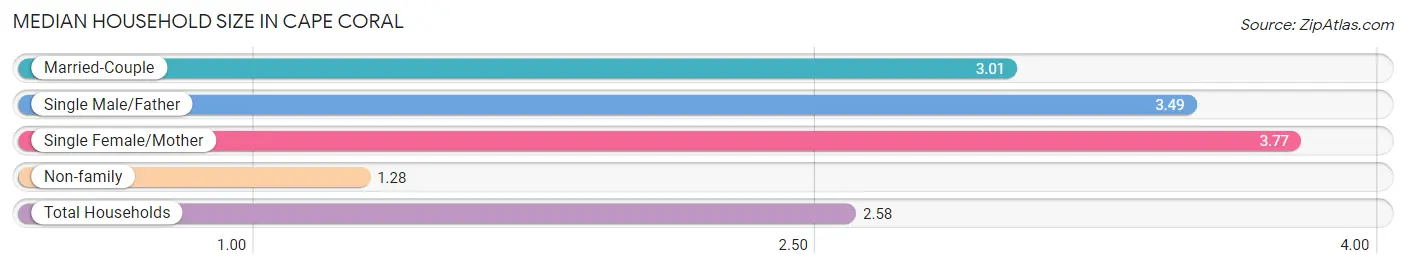
| Household Type | # Households | Household Size |
| Married-Couple | 42,017 (54.6%) | 3.01 |
| Single Male/Father | 3,672 (4.8%) | 3.49 |
| Single Female/Mother | 7,570 (9.9%) | 3.77 |
| Non-family | 23,623 (30.7%) | 1.28 |
| Total Households | 76,882 (100.0%) | 2.58 |
Household Size by Marriage Status in Cape Coral
Out of a total of 76,882 households in Cape Coral, 53,259 (69.3%) are family households, while 23,623 (30.7%) are nonfamily households. The most numerous type of family households are 2-person households, comprising 29,148, and the most common type of nonfamily households are 1-person households, comprising 18,994.
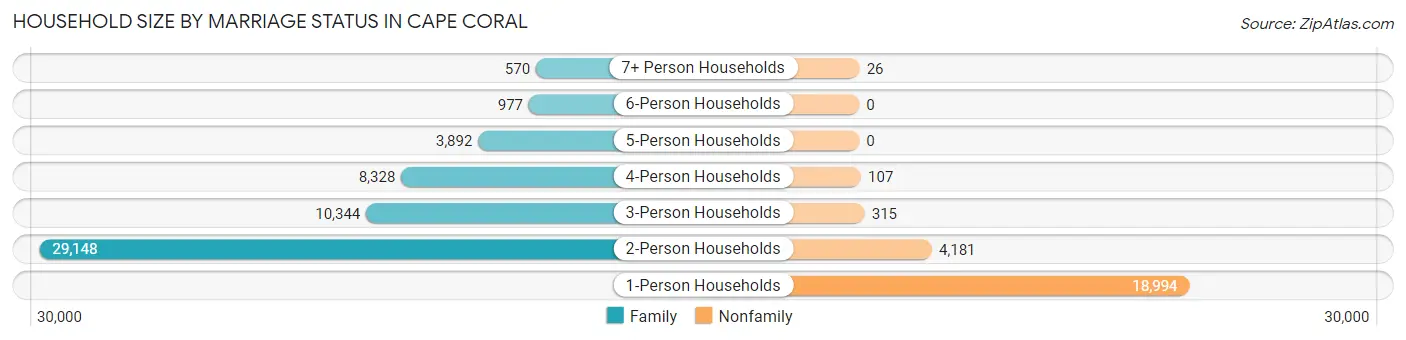
| Household Size | Family Households | Nonfamily Households |
| 1-Person Households | - | 18,994 (24.7%) |
| 2-Person Households | 29,148 (37.9%) | 4,181 (5.4%) |
| 3-Person Households | 10,344 (13.5%) | 315 (0.4%) |
| 4-Person Households | 8,328 (10.8%) | 107 (0.1%) |
| 5-Person Households | 3,892 (5.1%) | 0 (0.0%) |
| 6-Person Households | 977 (1.3%) | 0 (0.0%) |
| 7+ Person Households | 570 (0.7%) | 26 (0.0%) |
| Total | 53,259 (69.3%) | 23,623 (30.7%) |
Female Fertility in Cape Coral
Fertility by Age in Cape Coral
Average fertility rate in Cape Coral is 52.0 births per 1,000 women. Women in the age bracket of 20 to 34 years have the highest fertility rate with 97.0 births per 1,000 women. Women in the age bracket of 20 to 34 years acount for 78.6% of all women with births.

| Age Bracket | Women with Births | Births / 1,000 Women |
| 15 to 19 years | 29 (1.4%) | 7.0 |
| 20 to 34 years | 1,607 (78.6%) | 97.0 |
| 35 to 50 years | 409 (20.0%) | 23.0 |
| Total | 2,045 (100.0%) | 52.0 |
Fertility by Age by Marriage Status in Cape Coral
65.7% of women with births (2,045) in Cape Coral are married. The highest percentage of unmarried women with births falls into 15 to 19 years age bracket with 100.0% of them unmarried at the time of birth, while the lowest percentage of unmarried women with births belong to 35 to 50 years age bracket with 14.2% of them unmarried.
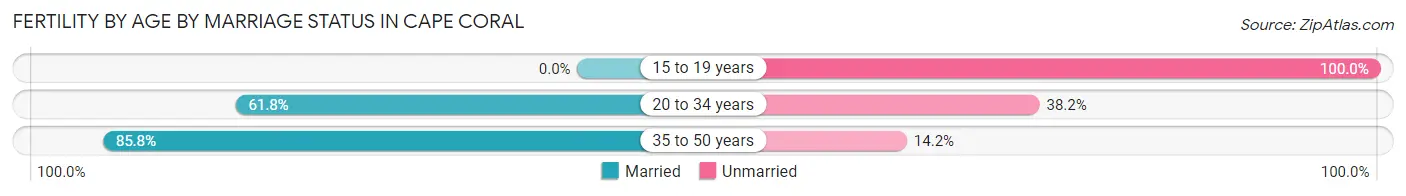
| Age Bracket | Married | Unmarried |
| 15 to 19 years | 0 (0.0%) | 29 (100.0%) |
| 20 to 34 years | 993 (61.8%) | 614 (38.2%) |
| 35 to 50 years | 351 (85.8%) | 58 (14.2%) |
| Total | 1,344 (65.7%) | 701 (34.3%) |
Fertility by Education in Cape Coral
Average fertility rate in Cape Coral is 52.0 births per 1,000 women. Women with the education attainment of college or associate's degree have the highest fertility rate of 73.0 births per 1,000 women, while women with the education attainment of high school diploma have the lowest fertility at 30.0 births per 1,000 women. Women with the education attainment of college or associate's degree represent 45.3% of all women with births.
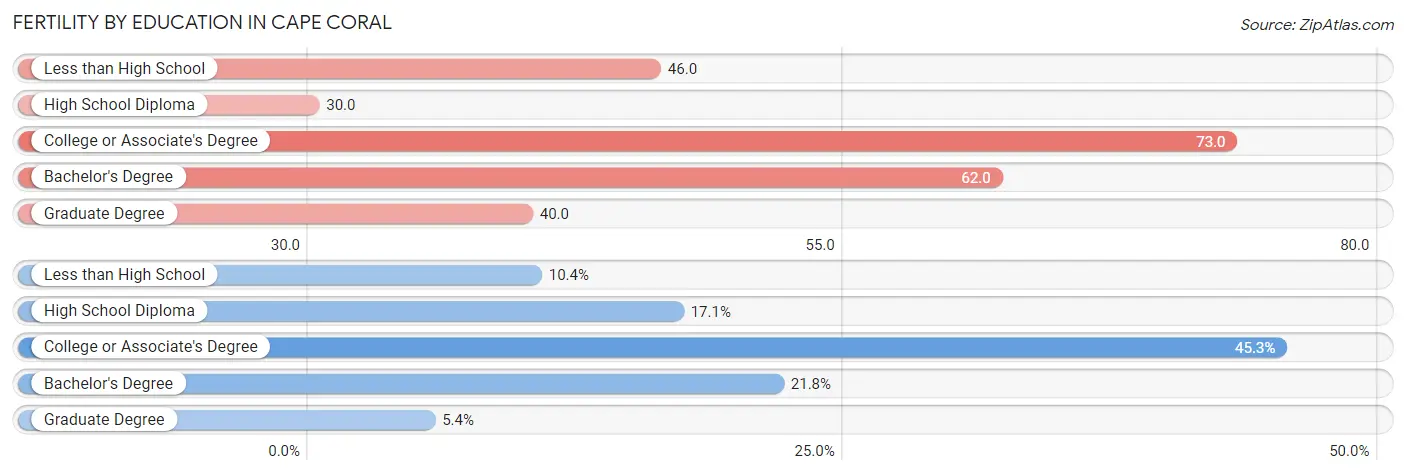
| Educational Attainment | Women with Births | Births / 1,000 Women |
| Less than High School | 213 (10.4%) | 46.0 |
| High School Diploma | 349 (17.1%) | 30.0 |
| College or Associate's Degree | 927 (45.3%) | 73.0 |
| Bachelor's Degree | 445 (21.8%) | 62.0 |
| Graduate Degree | 111 (5.4%) | 40.0 |
| Total | 2,045 (100.0%) | 52.0 |
Fertility by Education by Marriage Status in Cape Coral
34.3% of women with births in Cape Coral are unmarried. Women with the educational attainment of graduate degree are most likely to be married with 100.0% of them married at childbirth, while women with the educational attainment of high school diploma are least likely to be married with 87.4% of them unmarried at childbirth.
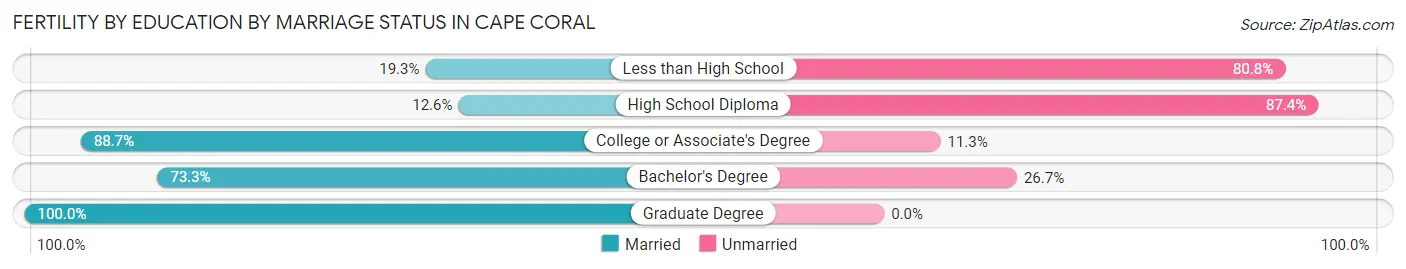
| Educational Attainment | Married | Unmarried |
| Less than High School | 41 (19.3%) | 172 (80.7%) |
| High School Diploma | 44 (12.6%) | 305 (87.4%) |
| College or Associate's Degree | 822 (88.7%) | 105 (11.3%) |
| Bachelor's Degree | 326 (73.3%) | 119 (26.7%) |
| Graduate Degree | 111 (100.0%) | 0 (0.0%) |
| Total | 1,344 (65.7%) | 701 (34.3%) |
Employment Characteristics in Cape Coral
Employment by Class of Employer in Cape Coral
Among the 91,911 employed individuals in Cape Coral, private company employees (62,556 | 68.1%), local government employees (7,866 | 8.6%), and self-employed (not incorporated) (6,509 | 7.1%) make up the most common classes of employment.
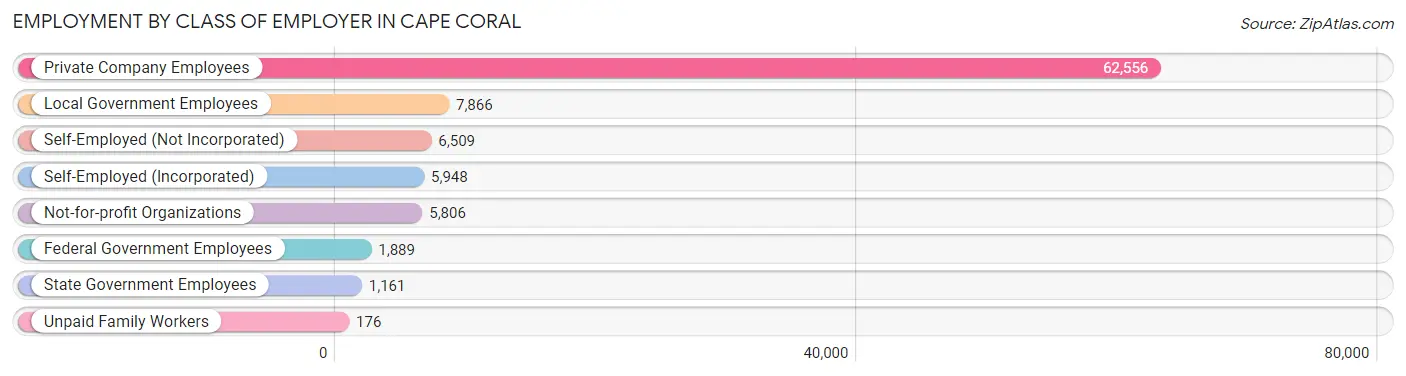
| Employer Class | # Employees | % Employees |
| Private Company Employees | 62,556 | 68.1% |
| Self-Employed (Incorporated) | 5,948 | 6.5% |
| Self-Employed (Not Incorporated) | 6,509 | 7.1% |
| Not-for-profit Organizations | 5,806 | 6.3% |
| Local Government Employees | 7,866 | 8.6% |
| State Government Employees | 1,161 | 1.3% |
| Federal Government Employees | 1,889 | 2.1% |
| Unpaid Family Workers | 176 | 0.2% |
| Total | 91,911 | 100.0% |
Employment Status by Age in Cape Coral
According to the labor force statistics for Cape Coral, out of the total population over 16 years of age (168,407), 58.0% or 97,676 individuals are in the labor force, with 4.4% or 4,298 of them unemployed. The age group with the highest labor force participation rate is 20 to 24 years, with 85.4% or 7,607 individuals in the labor force. Within the labor force, the 75 years and over age range has the highest percentage of unemployed individuals, with 13.6% or 156 of them being unemployed.
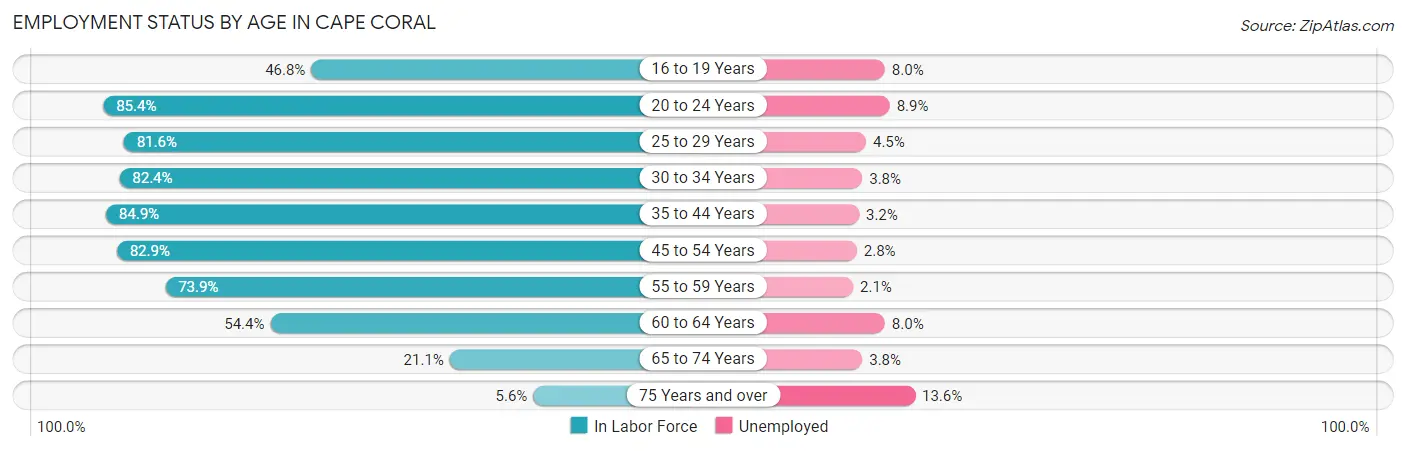
| Age Bracket | In Labor Force | Unemployed |
| 16 to 19 Years | 3,723 (46.8%) | 298 (8.0%) |
| 20 to 24 Years | 7,607 (85.4%) | 677 (8.9%) |
| 25 to 29 Years | 8,318 (81.6%) | 374 (4.5%) |
| 30 to 34 Years | 9,779 (82.4%) | 372 (3.8%) |
| 35 to 44 Years | 18,332 (84.9%) | 587 (3.2%) |
| 45 to 54 Years | 22,589 (82.9%) | 632 (2.8%) |
| 55 to 59 Years | 11,542 (73.9%) | 242 (2.1%) |
| 60 to 64 Years | 8,599 (54.4%) | 688 (8.0%) |
| 65 to 74 Years | 6,072 (21.1%) | 231 (3.8%) |
| 75 Years and over | 1,145 (5.6%) | 156 (13.6%) |
| Total | 97,676 (58.0%) | 4,298 (4.4%) |
Employment Status by Educational Attainment in Cape Coral
According to labor force statistics for Cape Coral, 77.4% of individuals (79,203) out of the total population between 25 and 64 years of age (102,330) are in the labor force, with 3.7% or 2,931 of them being unemployed. The group with the highest labor force participation rate are those with the educational attainment of bachelor's degree or higher, with 81.7% or 20,106 individuals in the labor force. Within the labor force, individuals with less than high school education have the highest percentage of unemployment, with 5.8% or 267 of them being unemployed.
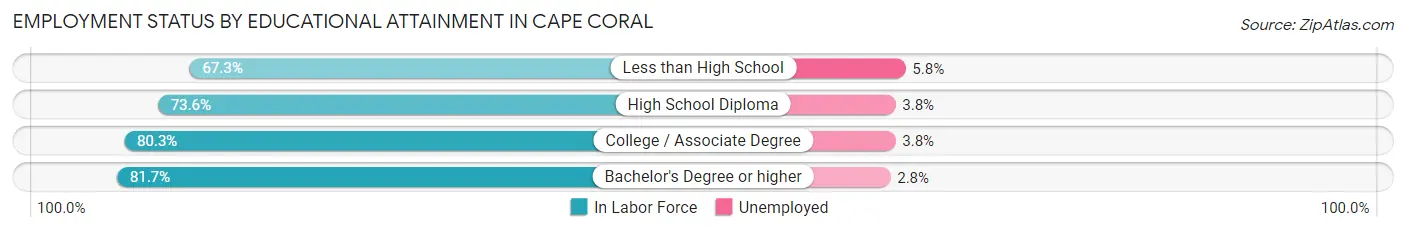
| Educational Attainment | In Labor Force | Unemployed |
| Less than High School | 4,595 (67.3%) | 396 (5.8%) |
| High School Diploma | 26,751 (73.6%) | 1,381 (3.8%) |
| College / Associate Degree | 27,741 (80.3%) | 1,313 (3.8%) |
| Bachelor's Degree or higher | 20,106 (81.7%) | 689 (2.8%) |
| Total | 79,203 (77.4%) | 3,786 (3.7%) |
Employment Occupations by Sex in Cape Coral
Management, Business, Science and Arts Occupations
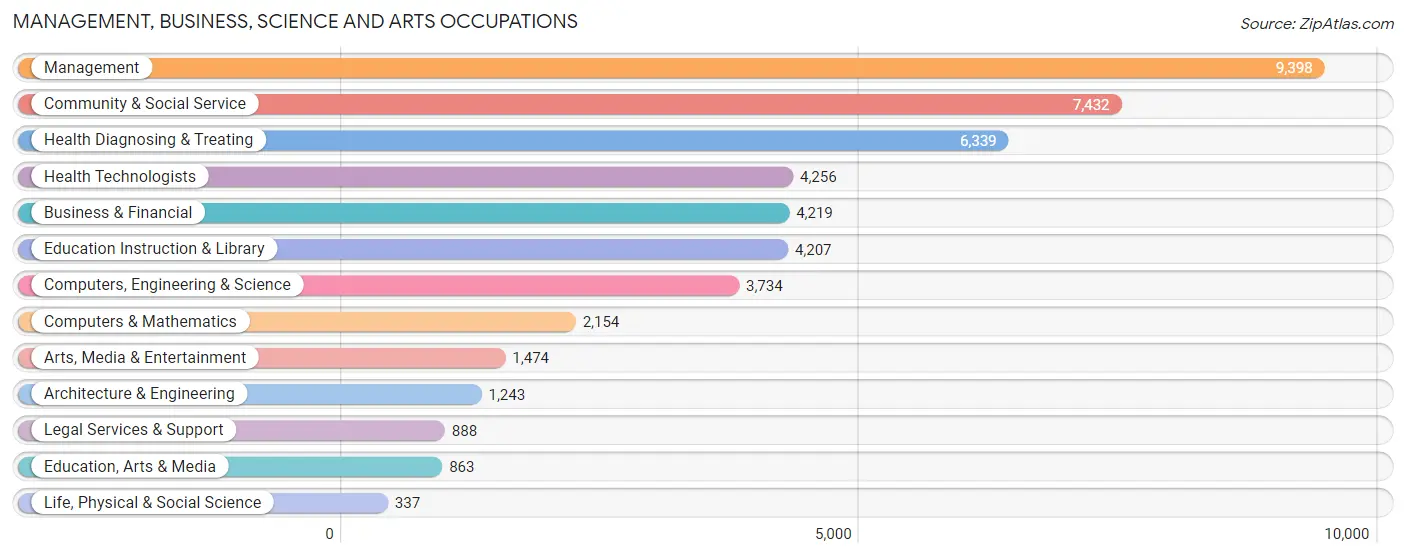
The most common Management, Business, Science and Arts occupations in Cape Coral are Management (9,398 | 10.1%), Community & Social Service (7,432 | 8.0%), Health Diagnosing & Treating (6,339 | 6.8%), Health Technologists (4,256 | 4.6%), and Business & Financial (4,219 | 4.5%).
Management, Business, Science and Arts Occupations by Sex
Within the Management, Business, Science and Arts occupations in Cape Coral, the most male-oriented occupations are Architecture & Engineering (85.5%), Computers, Engineering & Science (75.0%), and Computers & Mathematics (74.4%), while the most female-oriented occupations are Health Technologists (78.0%), Health Diagnosing & Treating (77.6%), and Education, Arts & Media (74.6%).
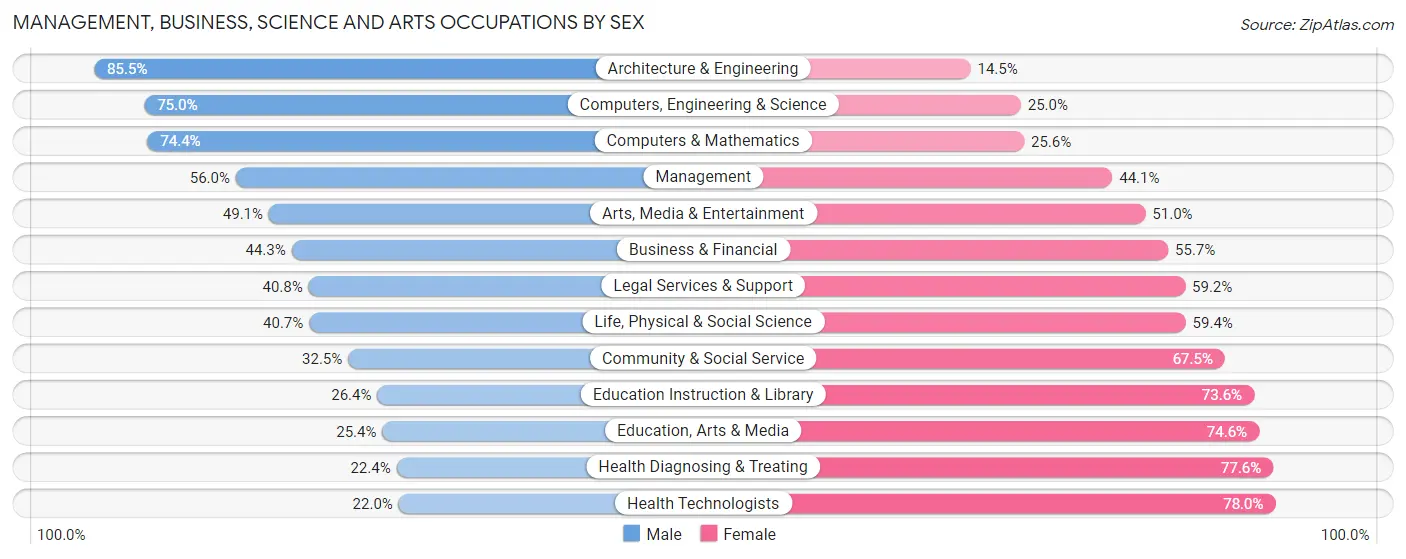
| Occupation | Male | Female |
| Management | 5,258 (55.9%) | 4,140 (44.1%) |
| Business & Financial | 1,870 (44.3%) | 2,349 (55.7%) |
| Computers, Engineering & Science | 2,802 (75.0%) | 932 (25.0%) |
| Computers & Mathematics | 1,602 (74.4%) | 552 (25.6%) |
| Architecture & Engineering | 1,063 (85.5%) | 180 (14.5%) |
| Life, Physical & Social Science | 137 (40.6%) | 200 (59.4%) |
| Community & Social Service | 2,416 (32.5%) | 5,016 (67.5%) |
| Education, Arts & Media | 219 (25.4%) | 644 (74.6%) |
| Legal Services & Support | 362 (40.8%) | 526 (59.2%) |
| Education Instruction & Library | 1,112 (26.4%) | 3,095 (73.6%) |
| Arts, Media & Entertainment | 723 (49.0%) | 751 (50.9%) |
| Health Diagnosing & Treating | 1,421 (22.4%) | 4,918 (77.6%) |
| Health Technologists | 935 (22.0%) | 3,321 (78.0%) |
| Total (Category) | 13,767 (44.2%) | 17,355 (55.8%) |
| Total (Overall) | 48,784 (52.3%) | 44,548 (47.7%) |
Services Occupations
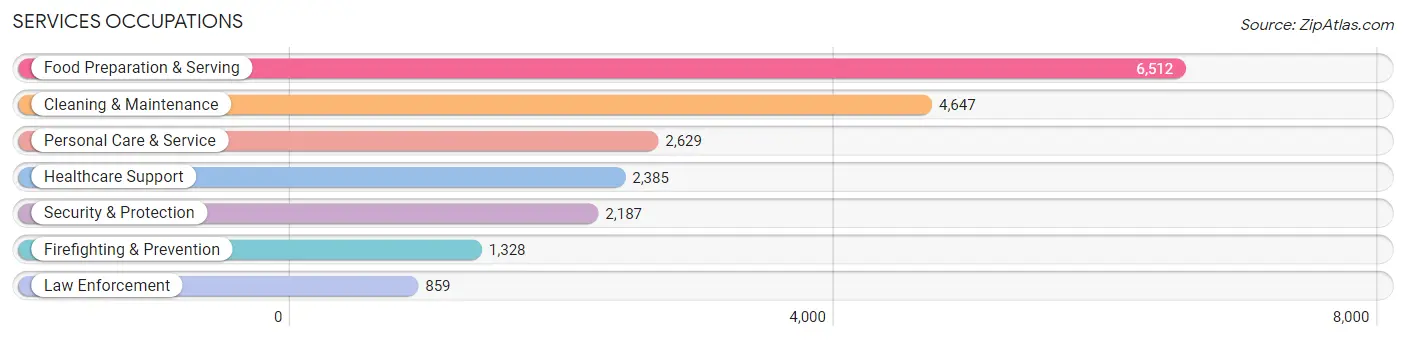
The most common Services occupations in Cape Coral are Food Preparation & Serving (6,512 | 7.0%), Cleaning & Maintenance (4,647 | 5.0%), Personal Care & Service (2,629 | 2.8%), Healthcare Support (2,385 | 2.6%), and Security & Protection (2,187 | 2.3%).
Services Occupations by Sex
Within the Services occupations in Cape Coral, the most male-oriented occupations are Law Enforcement (84.4%), Security & Protection (75.7%), and Firefighting & Prevention (70.0%), while the most female-oriented occupations are Healthcare Support (84.4%), Personal Care & Service (78.7%), and Food Preparation & Serving (62.0%).
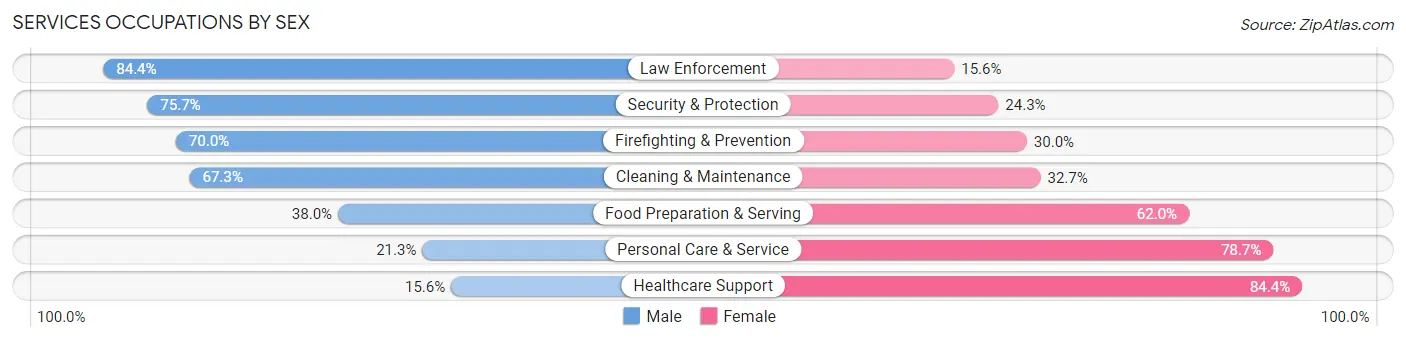
| Occupation | Male | Female |
| Healthcare Support | 371 (15.6%) | 2,014 (84.4%) |
| Security & Protection | 1,655 (75.7%) | 532 (24.3%) |
| Firefighting & Prevention | 930 (70.0%) | 398 (30.0%) |
| Law Enforcement | 725 (84.4%) | 134 (15.6%) |
| Food Preparation & Serving | 2,472 (38.0%) | 4,040 (62.0%) |
| Cleaning & Maintenance | 3,129 (67.3%) | 1,518 (32.7%) |
| Personal Care & Service | 559 (21.3%) | 2,070 (78.7%) |
| Total (Category) | 8,186 (44.6%) | 10,174 (55.4%) |
| Total (Overall) | 48,784 (52.3%) | 44,548 (47.7%) |
Sales and Office Occupations
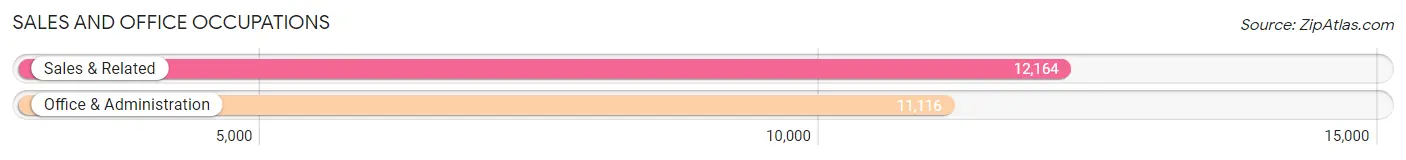
The most common Sales and Office occupations in Cape Coral are Sales & Related (12,164 | 13.0%), and Office & Administration (11,116 | 11.9%).
Sales and Office Occupations by Sex
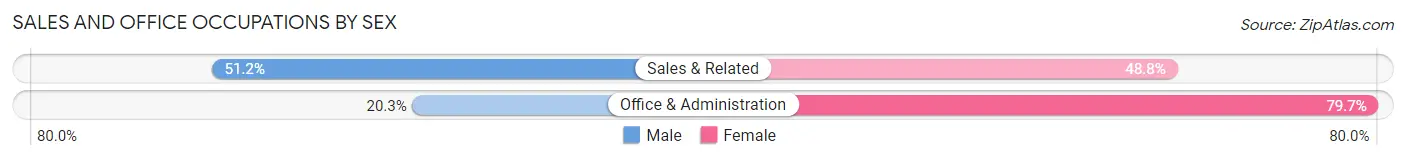
| Occupation | Male | Female |
| Sales & Related | 6,233 (51.2%) | 5,931 (48.8%) |
| Office & Administration | 2,259 (20.3%) | 8,857 (79.7%) |
| Total (Category) | 8,492 (36.5%) | 14,788 (63.5%) |
| Total (Overall) | 48,784 (52.3%) | 44,548 (47.7%) |
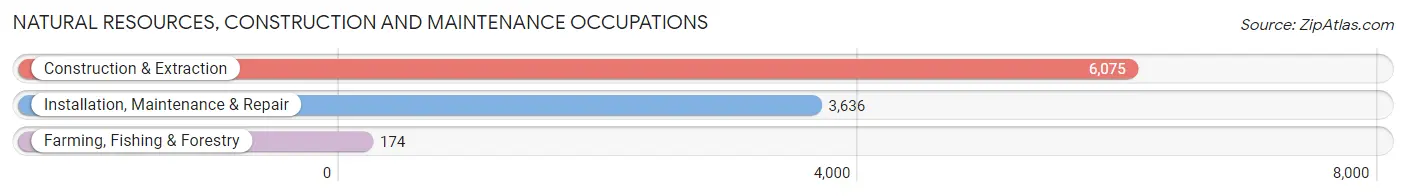
Natural Resources, Construction and Maintenance Occupations
The most common Natural Resources, Construction and Maintenance occupations in Cape Coral are Construction & Extraction (6,075 | 6.5%), Installation, Maintenance & Repair (3,636 | 3.9%), and Farming, Fishing & Forestry (174 | 0.2%).
Natural Resources, Construction and Maintenance Occupations by Sex
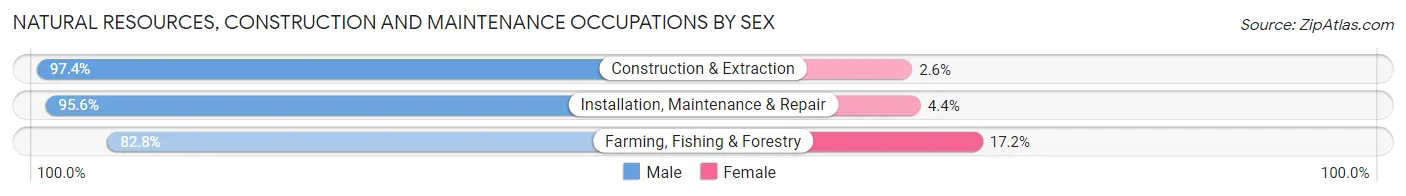
| Occupation | Male | Female |
| Farming, Fishing & Forestry | 144 (82.8%) | 30 (17.2%) |
| Construction & Extraction | 5,919 (97.4%) | 156 (2.6%) |
| Installation, Maintenance & Repair | 3,477 (95.6%) | 159 (4.4%) |
| Total (Category) | 9,540 (96.5%) | 345 (3.5%) |
| Total (Overall) | 48,784 (52.3%) | 44,548 (47.7%) |
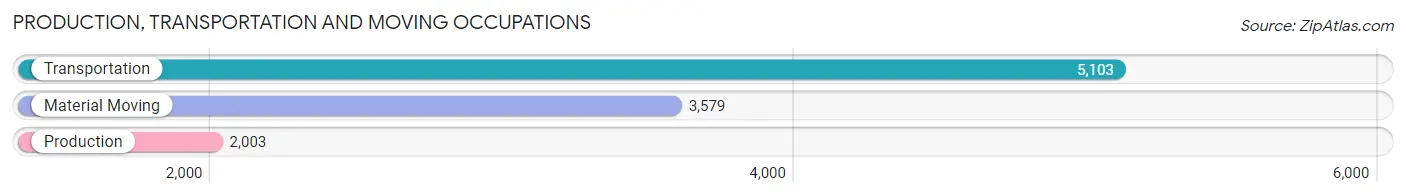
Production, Transportation and Moving Occupations
The most common Production, Transportation and Moving occupations in Cape Coral are Transportation (5,103 | 5.5%), Material Moving (3,579 | 3.8%), and Production (2,003 | 2.1%).
Production, Transportation and Moving Occupations by Sex
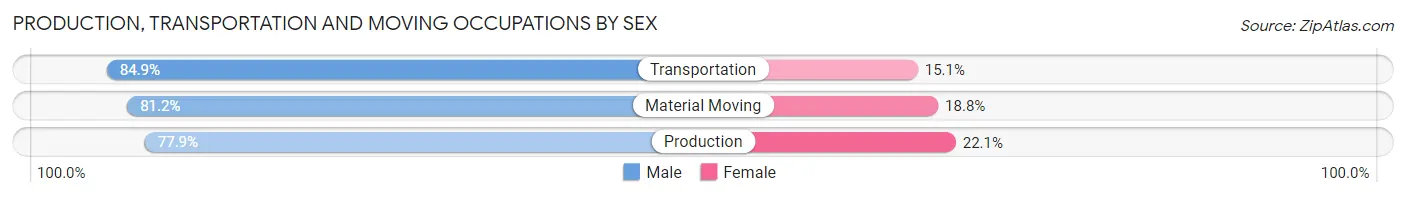
| Occupation | Male | Female |
| Production | 1,561 (77.9%) | 442 (22.1%) |
| Transportation | 4,333 (84.9%) | 770 (15.1%) |
| Material Moving | 2,905 (81.2%) | 674 (18.8%) |
| Total (Category) | 8,799 (82.4%) | 1,886 (17.6%) |
| Total (Overall) | 48,784 (52.3%) | 44,548 (47.7%) |
Employment Industries by Sex in Cape Coral
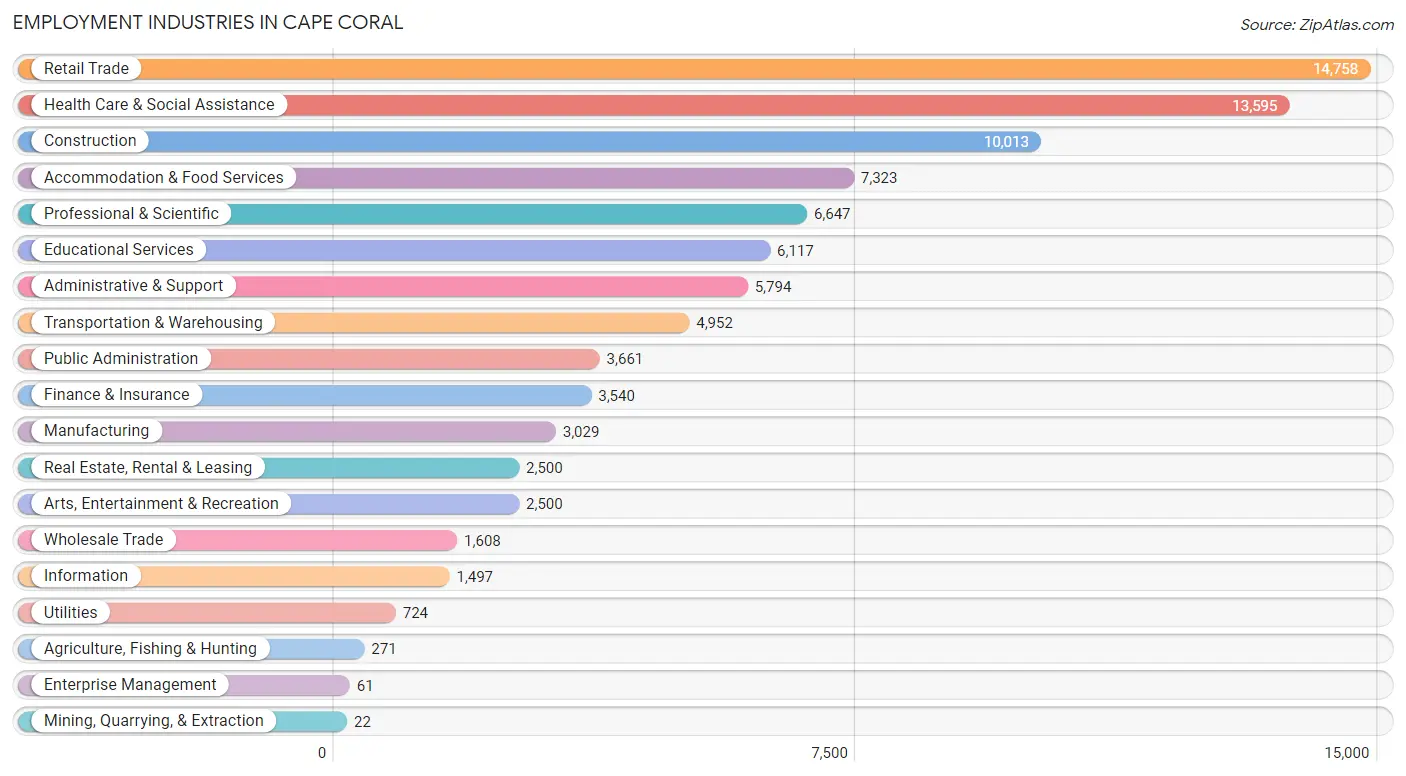
Employment Industries in Cape Coral
The major employment industries in Cape Coral include Retail Trade (14,758 | 15.8%), Health Care & Social Assistance (13,595 | 14.6%), Construction (10,013 | 10.7%), Accommodation & Food Services (7,323 | 7.9%), and Professional & Scientific (6,647 | 7.1%).
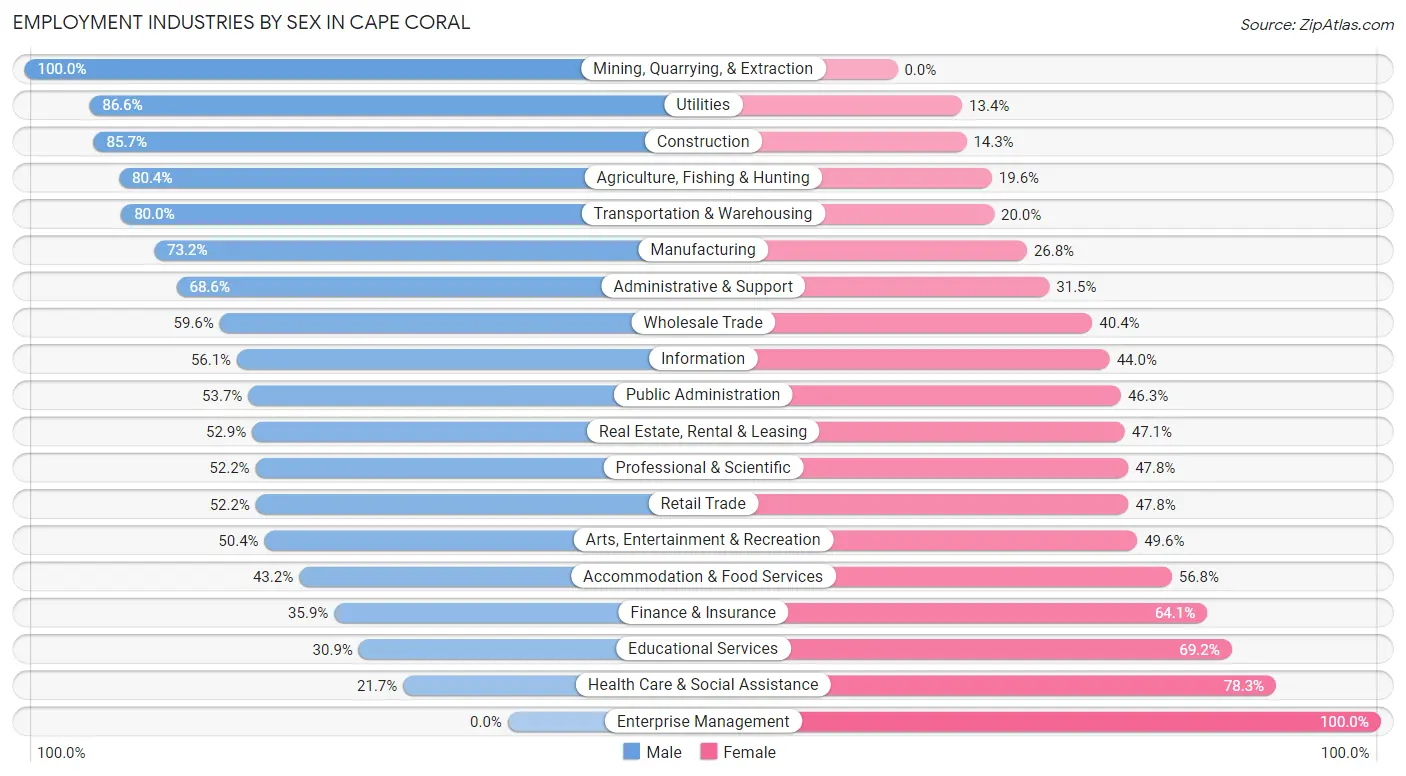
Employment Industries by Sex in Cape Coral
The Cape Coral industries that see more men than women are Mining, Quarrying, & Extraction (100.0%), Utilities (86.6%), and Construction (85.7%), whereas the industries that tend to have a higher number of women are Enterprise Management (100.0%), Health Care & Social Assistance (78.3%), and Educational Services (69.2%).
| Industry | Male | Female |
| Agriculture, Fishing & Hunting | 218 (80.4%) | 53 (19.6%) |
| Mining, Quarrying, & Extraction | 22 (100.0%) | 0 (0.0%) |
| Construction | 8,582 (85.7%) | 1,431 (14.3%) |
| Manufacturing | 2,217 (73.2%) | 812 (26.8%) |
| Wholesale Trade | 959 (59.6%) | 649 (40.4%) |
| Retail Trade | 7,699 (52.2%) | 7,059 (47.8%) |
| Transportation & Warehousing | 3,961 (80.0%) | 991 (20.0%) |
| Utilities | 627 (86.6%) | 97 (13.4%) |
| Information | 839 (56.0%) | 658 (44.0%) |
| Finance & Insurance | 1,272 (35.9%) | 2,268 (64.1%) |
| Real Estate, Rental & Leasing | 1,323 (52.9%) | 1,177 (47.1%) |
| Professional & Scientific | 3,472 (52.2%) | 3,175 (47.8%) |
| Enterprise Management | 0 (0.0%) | 61 (100.0%) |
| Administrative & Support | 3,972 (68.5%) | 1,822 (31.5%) |
| Educational Services | 1,887 (30.8%) | 4,230 (69.2%) |
| Health Care & Social Assistance | 2,945 (21.7%) | 10,650 (78.3%) |
| Arts, Entertainment & Recreation | 1,259 (50.4%) | 1,241 (49.6%) |
| Accommodation & Food Services | 3,164 (43.2%) | 4,159 (56.8%) |
| Public Administration | 1,967 (53.7%) | 1,694 (46.3%) |
| Total | 48,784 (52.3%) | 44,548 (47.7%) |
Education in Cape Coral
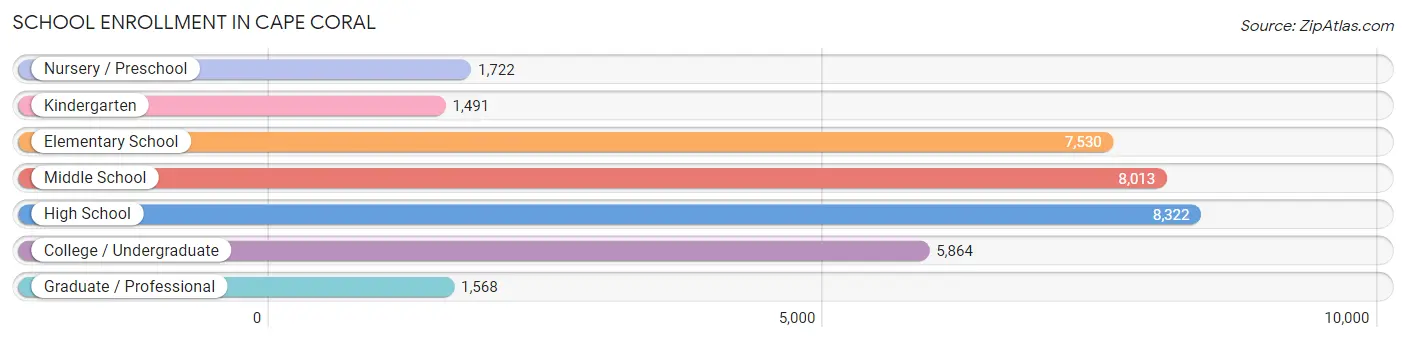
School Enrollment in Cape Coral
The most common levels of schooling among the 34,510 students in Cape Coral are high school (8,322 | 24.1%), middle school (8,013 | 23.2%), and elementary school (7,530 | 21.8%).
| School Level | # Students | % Students |
| Nursery / Preschool | 1,722 | 5.0% |
| Kindergarten | 1,491 | 4.3% |
| Elementary School | 7,530 | 21.8% |
| Middle School | 8,013 | 23.2% |
| High School | 8,322 | 24.1% |
| College / Undergraduate | 5,864 | 17.0% |
| Graduate / Professional | 1,568 | 4.5% |
| Total | 34,510 | 100.0% |
School Enrollment by Age by Funding Source in Cape Coral
Out of a total of 34,510 students who are enrolled in schools in Cape Coral, 4,107 (11.9%) attend a private institution, while the remaining 30,403 (88.1%) are enrolled in public schools. The age group of 35 years and over has the highest likelihood of being enrolled in private schools, with 732 (31.7% in the age bracket) enrolled. Conversely, the age group of 10 to 14 year olds has the lowest likelihood of being enrolled in a private school, with 9,555 (95.2% in the age bracket) attending a public institution.
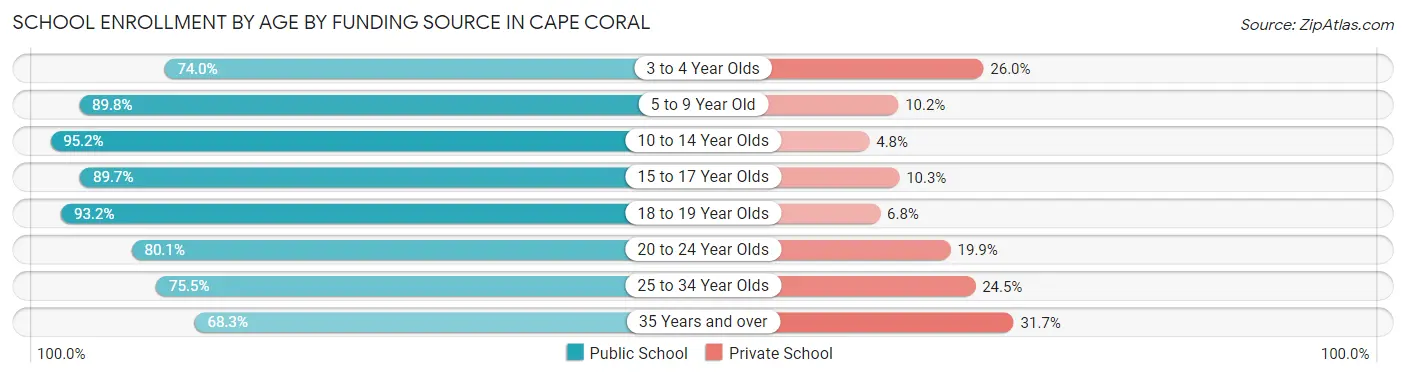
| Age Bracket | Public School | Private School |
| 3 to 4 Year Olds | 904 (74.0%) | 318 (26.0%) |
| 5 to 9 Year Old | 7,801 (89.8%) | 882 (10.2%) |
| 10 to 14 Year Olds | 9,555 (95.2%) | 479 (4.8%) |
| 15 to 17 Year Olds | 5,200 (89.7%) | 600 (10.3%) |
| 18 to 19 Year Olds | 1,882 (93.2%) | 137 (6.8%) |
| 20 to 24 Year Olds | 2,111 (80.1%) | 525 (19.9%) |
| 25 to 34 Year Olds | 1,362 (75.5%) | 442 (24.5%) |
| 35 Years and over | 1,580 (68.3%) | 732 (31.7%) |
| Total | 30,403 (88.1%) | 4,107 (11.9%) |
Educational Attainment by Field of Study in Cape Coral
Business (8,873 | 22.8%), education (6,200 | 15.9%), science & technology (4,986 | 12.8%), engineering (2,351 | 6.0%), and bio, nature & agricultural (2,287 | 5.9%) are the most common fields of study among 39,008 individuals in Cape Coral who have obtained a bachelor's degree or higher.
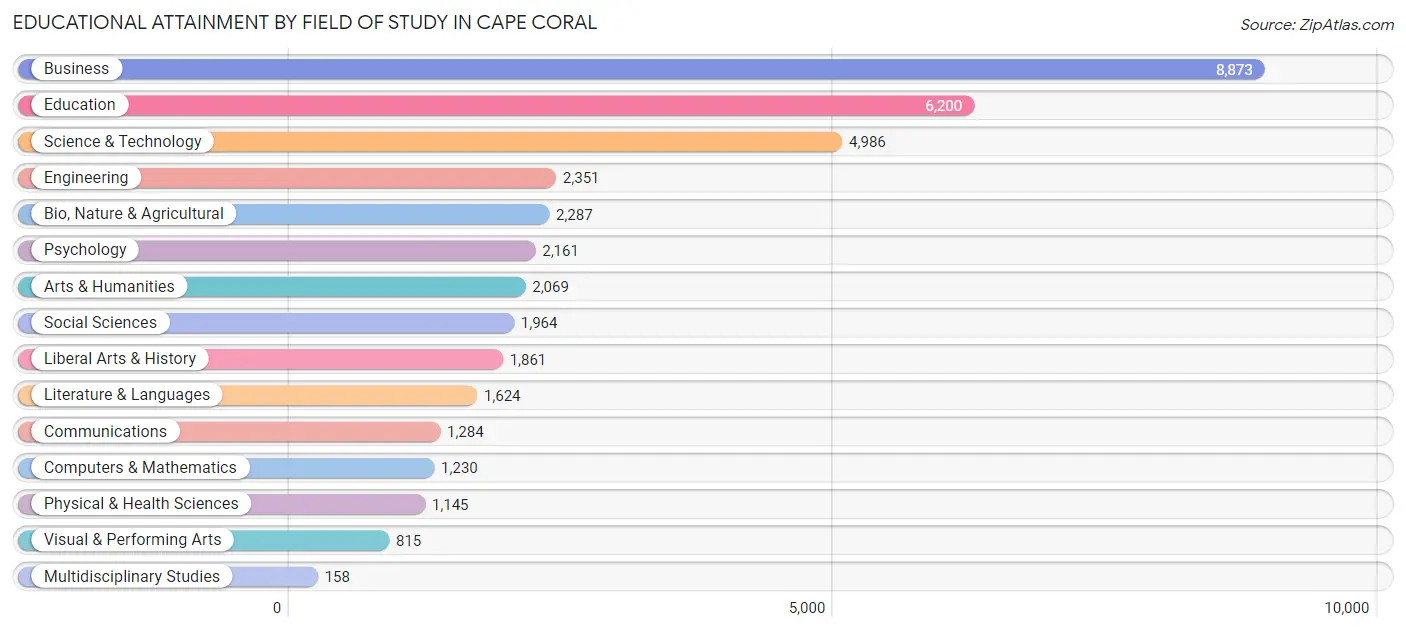
| Field of Study | # Graduates | % Graduates |
| Computers & Mathematics | 1,230 | 3.2% |
| Bio, Nature & Agricultural | 2,287 | 5.9% |
| Physical & Health Sciences | 1,145 | 2.9% |
| Psychology | 2,161 | 5.5% |
| Social Sciences | 1,964 | 5.0% |
| Engineering | 2,351 | 6.0% |
| Multidisciplinary Studies | 158 | 0.4% |
| Science & Technology | 4,986 | 12.8% |
| Business | 8,873 | 22.8% |
| Education | 6,200 | 15.9% |
| Literature & Languages | 1,624 | 4.2% |
| Liberal Arts & History | 1,861 | 4.8% |
| Visual & Performing Arts | 815 | 2.1% |
| Communications | 1,284 | 3.3% |
| Arts & Humanities | 2,069 | 5.3% |
| Total | 39,008 | 100.0% |
Transportation & Commute in Cape Coral
Vehicle Availability by Sex in Cape Coral
The most prevalent vehicle ownership categories in Cape Coral are males with 2 vehicles (22,997, accounting for 48.0%) and females with 2 vehicles (21,512, making up 52.3%).
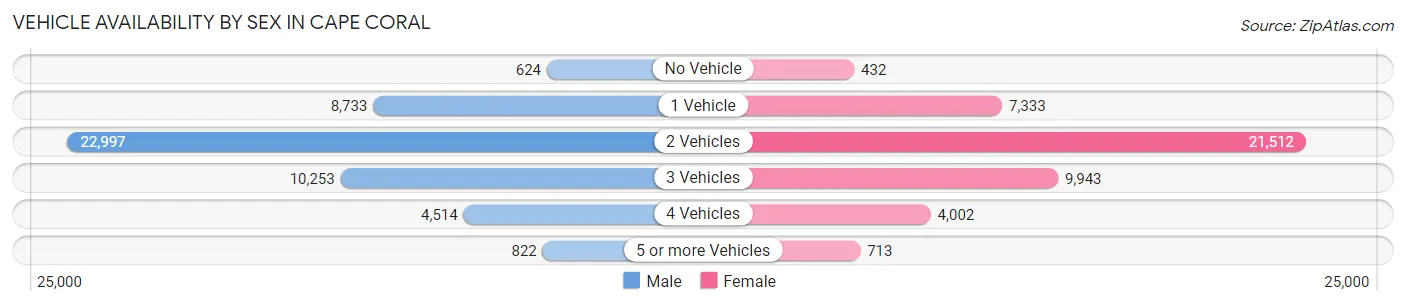
| Vehicles Available | Male | Female |
| No Vehicle | 624 (1.3%) | 432 (1.0%) |
| 1 Vehicle | 8,733 (18.2%) | 7,333 (16.7%) |
| 2 Vehicles | 22,997 (48.0%) | 21,512 (49.0%) |
| 3 Vehicles | 10,253 (21.4%) | 9,943 (22.6%) |
| 4 Vehicles | 4,514 (9.4%) | 4,002 (9.1%) |
| 5 or more Vehicles | 822 (1.7%) | 713 (1.6%) |
| Total | 47,943 (100.0%) | 43,935 (100.0%) |
Commute Time in Cape Coral
The most frequently occuring commute durations in Cape Coral are 30 to 34 minutes (13,468 commuters, 16.5%), 20 to 24 minutes (12,337 commuters, 15.1%), and 15 to 19 minutes (11,006 commuters, 13.5%).
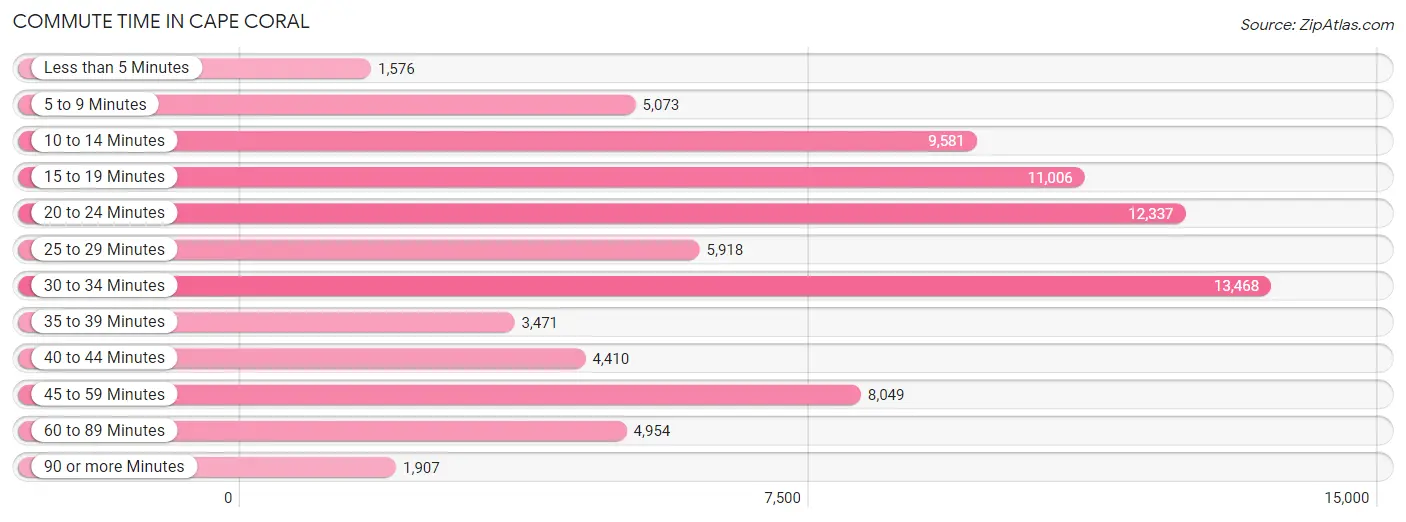
| Commute Time | # Commuters | % Commuters |
| Less than 5 Minutes | 1,576 | 1.9% |
| 5 to 9 Minutes | 5,073 | 6.2% |
| 10 to 14 Minutes | 9,581 | 11.7% |
| 15 to 19 Minutes | 11,006 | 13.5% |
| 20 to 24 Minutes | 12,337 | 15.1% |
| 25 to 29 Minutes | 5,918 | 7.2% |
| 30 to 34 Minutes | 13,468 | 16.5% |
| 35 to 39 Minutes | 3,471 | 4.3% |
| 40 to 44 Minutes | 4,410 | 5.4% |
| 45 to 59 Minutes | 8,049 | 9.9% |
| 60 to 89 Minutes | 4,954 | 6.1% |
| 90 or more Minutes | 1,907 | 2.3% |
Commute Time by Sex in Cape Coral
The most common commute times in Cape Coral are 30 to 34 minutes (7,891 commuters, 18.2%) for males and 15 to 19 minutes (6,426 commuters, 16.7%) for females.
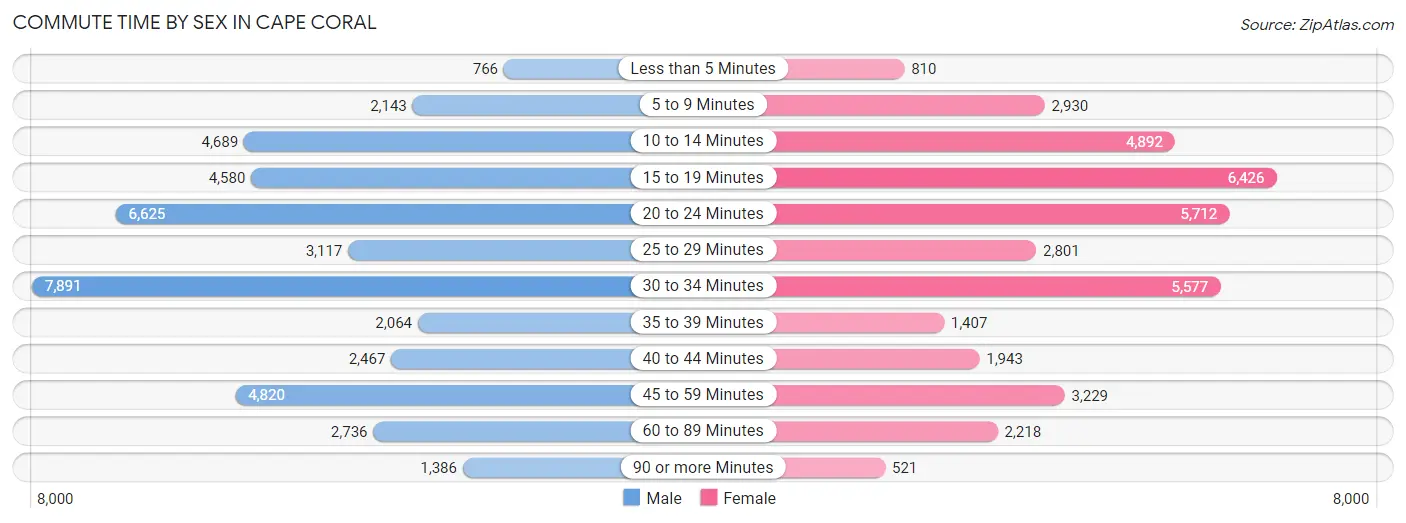
| Commute Time | Male | Female |
| Less than 5 Minutes | 766 (1.8%) | 810 (2.1%) |
| 5 to 9 Minutes | 2,143 (5.0%) | 2,930 (7.6%) |
| 10 to 14 Minutes | 4,689 (10.8%) | 4,892 (12.7%) |
| 15 to 19 Minutes | 4,580 (10.6%) | 6,426 (16.7%) |
| 20 to 24 Minutes | 6,625 (15.3%) | 5,712 (14.8%) |
| 25 to 29 Minutes | 3,117 (7.2%) | 2,801 (7.3%) |
| 30 to 34 Minutes | 7,891 (18.2%) | 5,577 (14.5%) |
| 35 to 39 Minutes | 2,064 (4.8%) | 1,407 (3.7%) |
| 40 to 44 Minutes | 2,467 (5.7%) | 1,943 (5.1%) |
| 45 to 59 Minutes | 4,820 (11.1%) | 3,229 (8.4%) |
| 60 to 89 Minutes | 2,736 (6.3%) | 2,218 (5.8%) |
| 90 or more Minutes | 1,386 (3.2%) | 521 (1.3%) |
Time of Departure to Work by Sex in Cape Coral
The most frequent times of departure to work in Cape Coral are 7:00 AM to 7:29 AM (7,837, 18.1%) for males and 8:00 AM to 8:29 AM (6,638, 17.3%) for females.
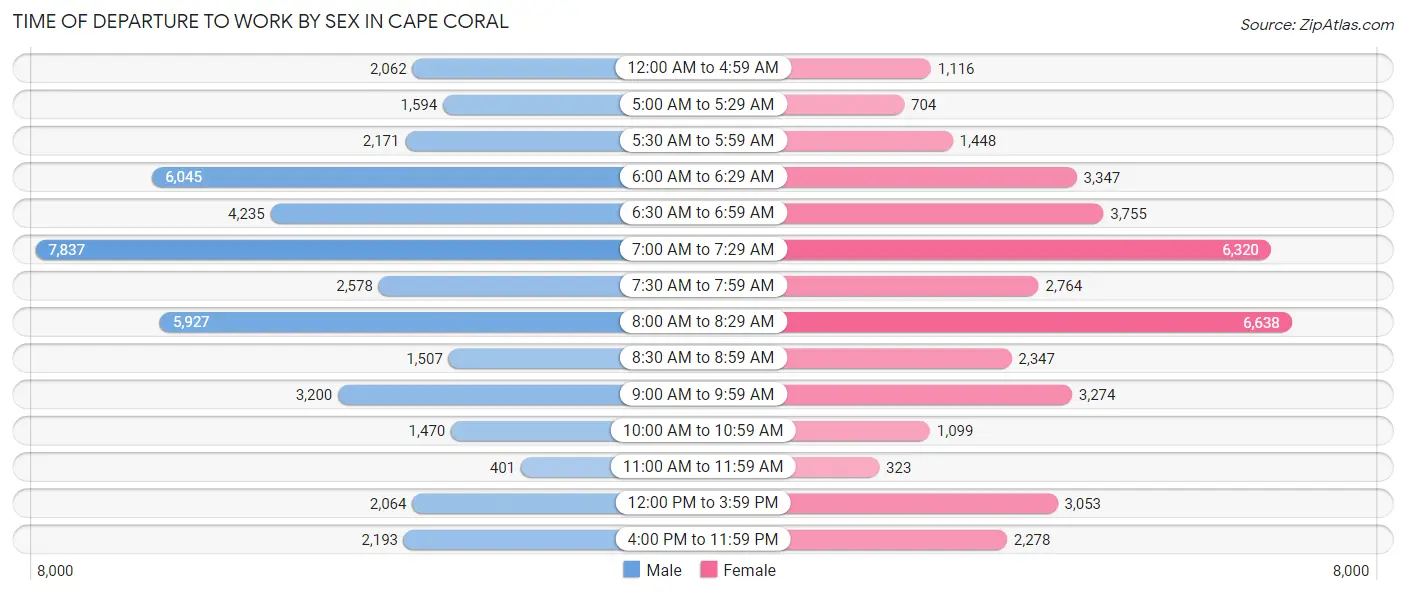
| Time of Departure | Male | Female |
| 12:00 AM to 4:59 AM | 2,062 (4.8%) | 1,116 (2.9%) |
| 5:00 AM to 5:29 AM | 1,594 (3.7%) | 704 (1.8%) |
| 5:30 AM to 5:59 AM | 2,171 (5.0%) | 1,448 (3.8%) |
| 6:00 AM to 6:29 AM | 6,045 (14.0%) | 3,347 (8.7%) |
| 6:30 AM to 6:59 AM | 4,235 (9.8%) | 3,755 (9.8%) |
| 7:00 AM to 7:29 AM | 7,837 (18.1%) | 6,320 (16.4%) |
| 7:30 AM to 7:59 AM | 2,578 (6.0%) | 2,764 (7.2%) |
| 8:00 AM to 8:29 AM | 5,927 (13.7%) | 6,638 (17.3%) |
| 8:30 AM to 8:59 AM | 1,507 (3.5%) | 2,347 (6.1%) |
| 9:00 AM to 9:59 AM | 3,200 (7.4%) | 3,274 (8.5%) |
| 10:00 AM to 10:59 AM | 1,470 (3.4%) | 1,099 (2.9%) |
| 11:00 AM to 11:59 AM | 401 (0.9%) | 323 (0.8%) |
| 12:00 PM to 3:59 PM | 2,064 (4.8%) | 3,053 (7.9%) |
| 4:00 PM to 11:59 PM | 2,193 (5.1%) | 2,278 (5.9%) |
| Total | 43,284 (100.0%) | 38,466 (100.0%) |
Housing Occupancy in Cape Coral
Occupancy by Ownership in Cape Coral
Of the total 76,882 dwellings in Cape Coral, owner-occupied units account for 59,536 (77.4%), while renter-occupied units make up 17,346 (22.6%).
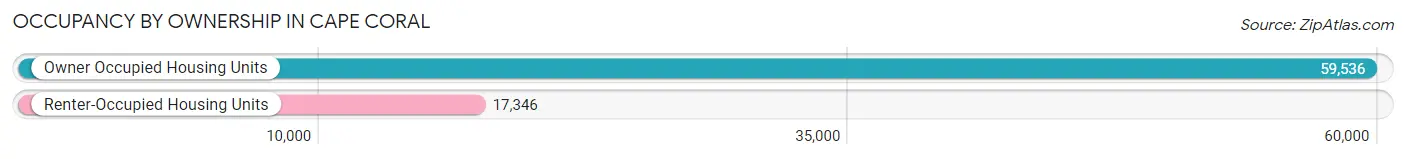
| Occupancy | # Housing Units | % Housing Units |
| Owner Occupied Housing Units | 59,536 | 77.4% |
| Renter-Occupied Housing Units | 17,346 | 22.6% |
| Total Occupied Housing Units | 76,882 | 100.0% |
Occupancy by Household Size in Cape Coral
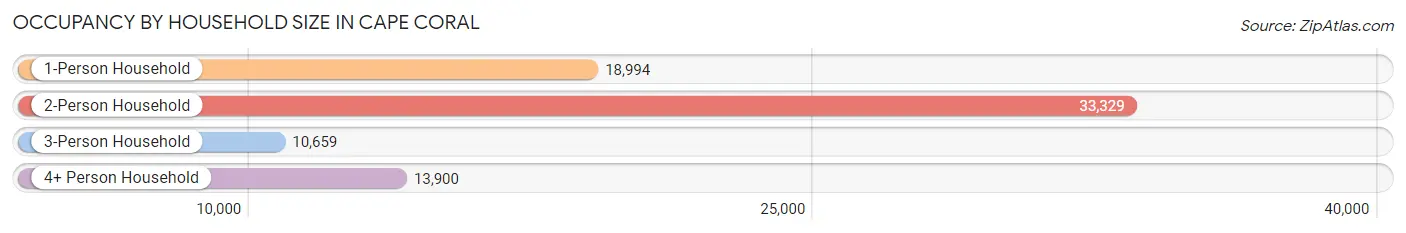
| Household Size | # Housing Units | % Housing Units |
| 1-Person Household | 18,994 | 24.7% |
| 2-Person Household | 33,329 | 43.3% |
| 3-Person Household | 10,659 | 13.9% |
| 4+ Person Household | 13,900 | 18.1% |
| Total Housing Units | 76,882 | 100.0% |
Occupancy by Ownership by Household Size in Cape Coral
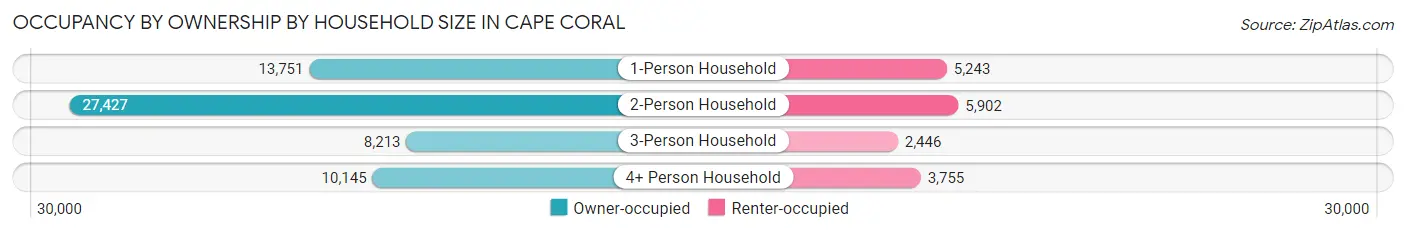
| Household Size | Owner-occupied | Renter-occupied |
| 1-Person Household | 13,751 (72.4%) | 5,243 (27.6%) |
| 2-Person Household | 27,427 (82.3%) | 5,902 (17.7%) |
| 3-Person Household | 8,213 (77.0%) | 2,446 (23.0%) |
| 4+ Person Household | 10,145 (73.0%) | 3,755 (27.0%) |
| Total Housing Units | 59,536 (77.4%) | 17,346 (22.6%) |
Occupancy by Educational Attainment in Cape Coral
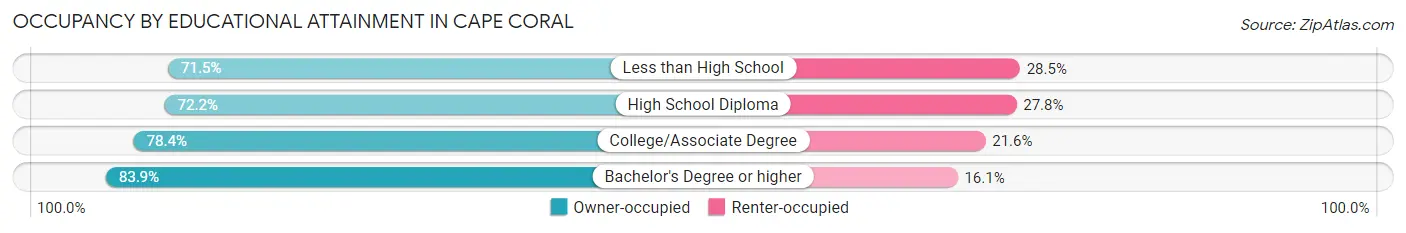
| Household Size | Owner-occupied | Renter-occupied |
| Less than High School | 3,110 (71.5%) | 1,237 (28.5%) |
| High School Diploma | 18,787 (72.2%) | 7,228 (27.8%) |
| College/Associate Degree | 19,668 (78.4%) | 5,427 (21.6%) |
| Bachelor's Degree or higher | 17,971 (83.9%) | 3,454 (16.1%) |
Occupancy by Age of Householder in Cape Coral
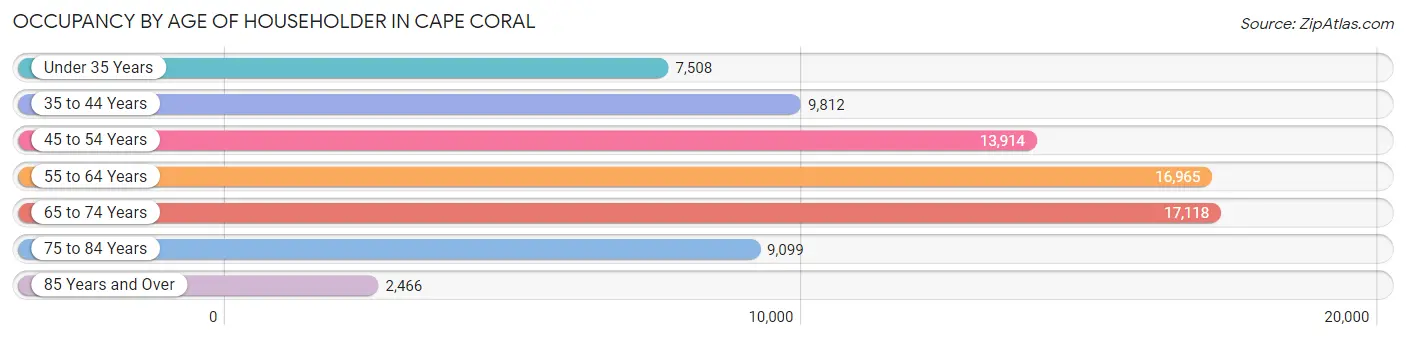
| Age Bracket | # Households | % Households |
| Under 35 Years | 7,508 | 9.8% |
| 35 to 44 Years | 9,812 | 12.8% |
| 45 to 54 Years | 13,914 | 18.1% |
| 55 to 64 Years | 16,965 | 22.1% |
| 65 to 74 Years | 17,118 | 22.3% |
| 75 to 84 Years | 9,099 | 11.8% |
| 85 Years and Over | 2,466 | 3.2% |
| Total | 76,882 | 100.0% |
Housing Finances in Cape Coral
Median Income by Occupancy in Cape Coral
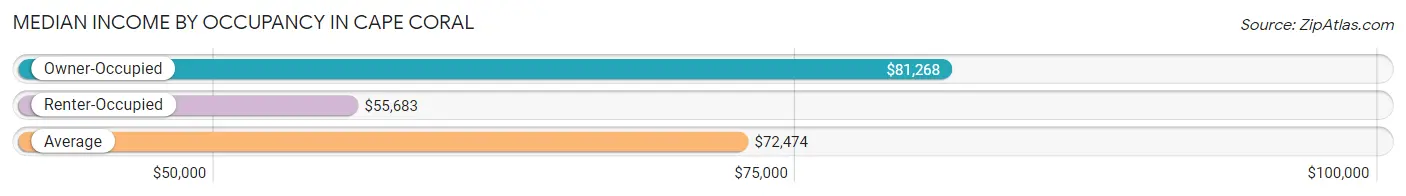
| Occupancy Type | # Households | Median Income |
| Owner-Occupied | 59,536 (77.4%) | $81,268 |
| Renter-Occupied | 17,346 (22.6%) | $55,683 |
| Average | 76,882 (100.0%) | $72,474 |
Occupancy by Householder Income Bracket in Cape Coral
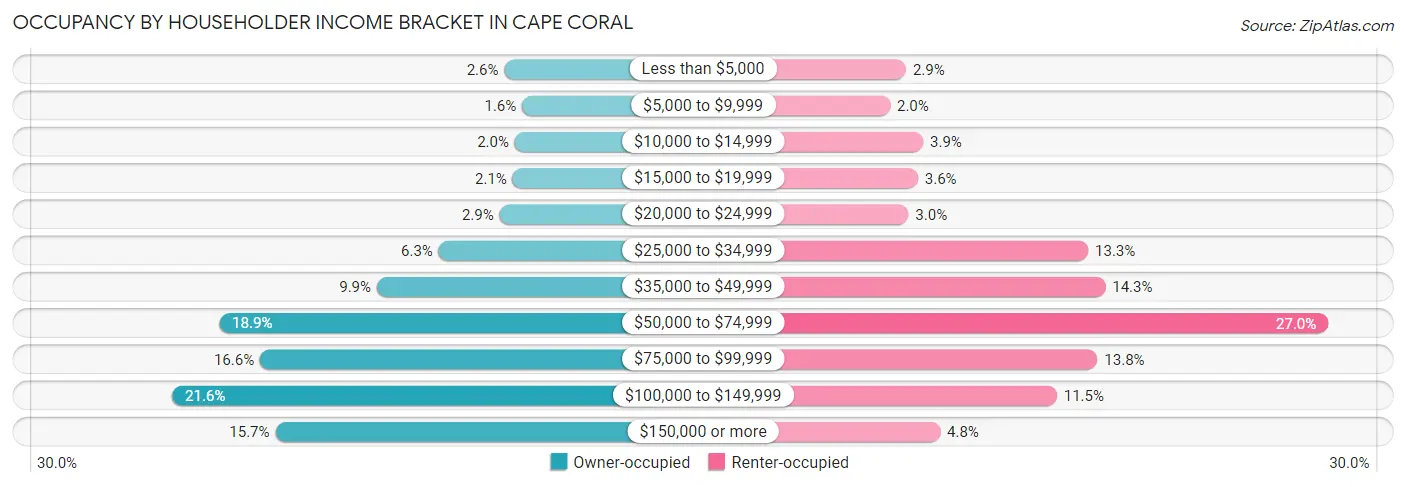
| Income Bracket | Owner-occupied | Renter-occupied |
| Less than $5,000 | 1,542 (2.6%) | 500 (2.9%) |
| $5,000 to $9,999 | 934 (1.6%) | 342 (2.0%) |
| $10,000 to $14,999 | 1,185 (2.0%) | 669 (3.9%) |
| $15,000 to $19,999 | 1,258 (2.1%) | 618 (3.6%) |
| $20,000 to $24,999 | 1,702 (2.9%) | 524 (3.0%) |
| $25,000 to $34,999 | 3,774 (6.3%) | 2,305 (13.3%) |
| $35,000 to $49,999 | 5,879 (9.9%) | 2,475 (14.3%) |
| $50,000 to $74,999 | 11,239 (18.9%) | 4,683 (27.0%) |
| $75,000 to $99,999 | 9,853 (16.6%) | 2,397 (13.8%) |
| $100,000 to $149,999 | 12,840 (21.6%) | 1,995 (11.5%) |
| $150,000 or more | 9,330 (15.7%) | 838 (4.8%) |
| Total | 59,536 (100.0%) | 17,346 (100.0%) |
Monthly Housing Cost Tiers in Cape Coral
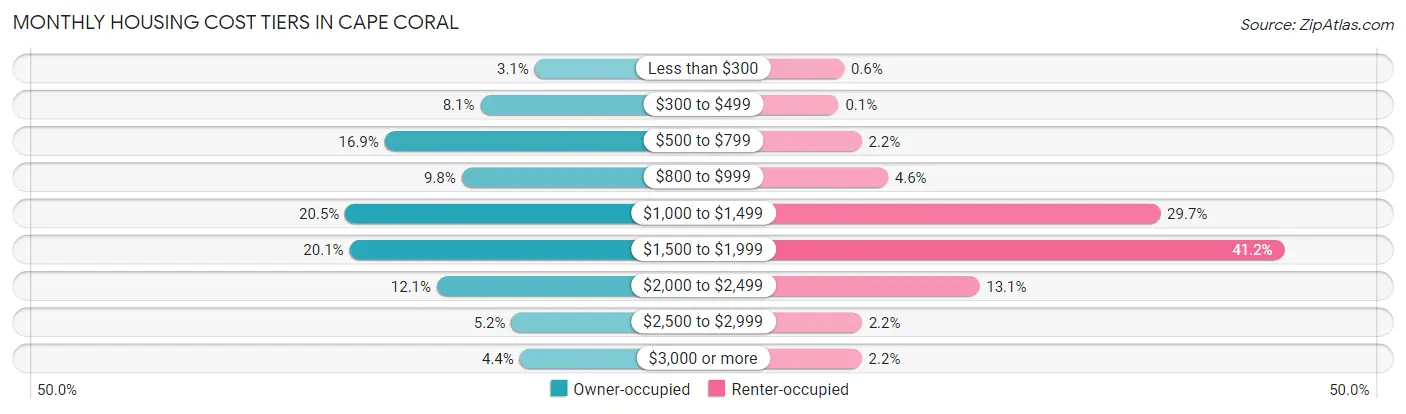
| Monthly Cost | Owner-occupied | Renter-occupied |
| Less than $300 | 1,817 (3.0%) | 104 (0.6%) |
| $300 to $499 | 4,795 (8.1%) | 17 (0.1%) |
| $500 to $799 | 10,039 (16.9%) | 385 (2.2%) |
| $800 to $999 | 5,819 (9.8%) | 805 (4.6%) |
| $1,000 to $1,499 | 12,198 (20.5%) | 5,154 (29.7%) |
| $1,500 to $1,999 | 11,968 (20.1%) | 7,138 (41.1%) |
| $2,000 to $2,499 | 7,173 (12.0%) | 2,266 (13.1%) |
| $2,500 to $2,999 | 3,090 (5.2%) | 388 (2.2%) |
| $3,000 or more | 2,637 (4.4%) | 387 (2.2%) |
| Total | 59,536 (100.0%) | 17,346 (100.0%) |
Physical Housing Characteristics in Cape Coral
Housing Structures in Cape Coral
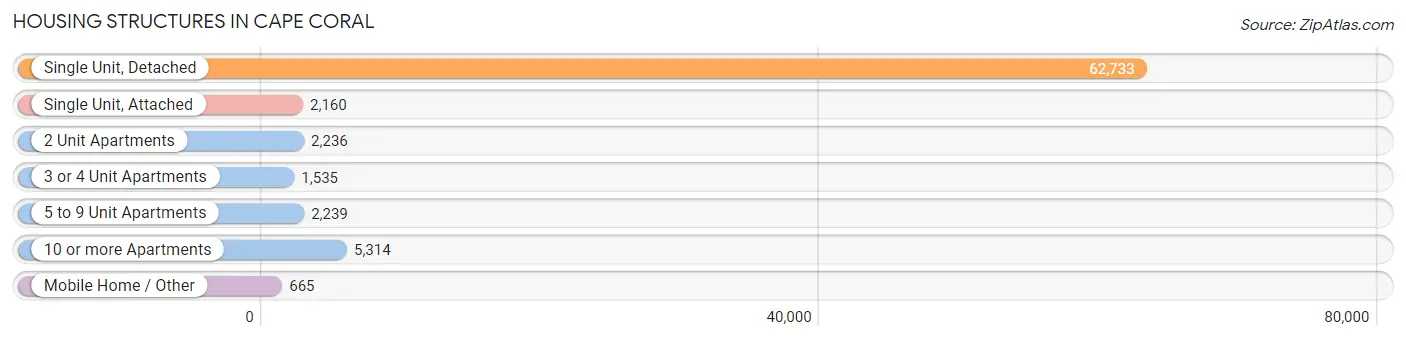
| Structure Type | # Housing Units | % Housing Units |
| Single Unit, Detached | 62,733 | 81.6% |
| Single Unit, Attached | 2,160 | 2.8% |
| 2 Unit Apartments | 2,236 | 2.9% |
| 3 or 4 Unit Apartments | 1,535 | 2.0% |
| 5 to 9 Unit Apartments | 2,239 | 2.9% |
| 10 or more Apartments | 5,314 | 6.9% |
| Mobile Home / Other | 665 | 0.9% |
| Total | 76,882 | 100.0% |
Housing Structures by Occupancy in Cape Coral
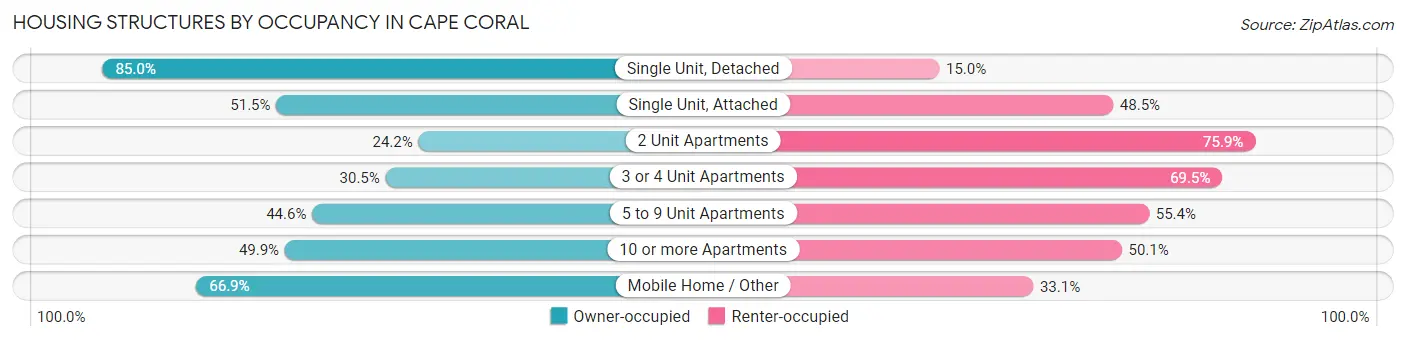
| Structure Type | Owner-occupied | Renter-occupied |
| Single Unit, Detached | 53,321 (85.0%) | 9,412 (15.0%) |
| Single Unit, Attached | 1,113 (51.5%) | 1,047 (48.5%) |
| 2 Unit Apartments | 540 (24.1%) | 1,696 (75.8%) |
| 3 or 4 Unit Apartments | 468 (30.5%) | 1,067 (69.5%) |
| 5 to 9 Unit Apartments | 999 (44.6%) | 1,240 (55.4%) |
| 10 or more Apartments | 2,650 (49.9%) | 2,664 (50.1%) |
| Mobile Home / Other | 445 (66.9%) | 220 (33.1%) |
| Total | 59,536 (77.4%) | 17,346 (22.6%) |
Housing Structures by Number of Rooms in Cape Coral
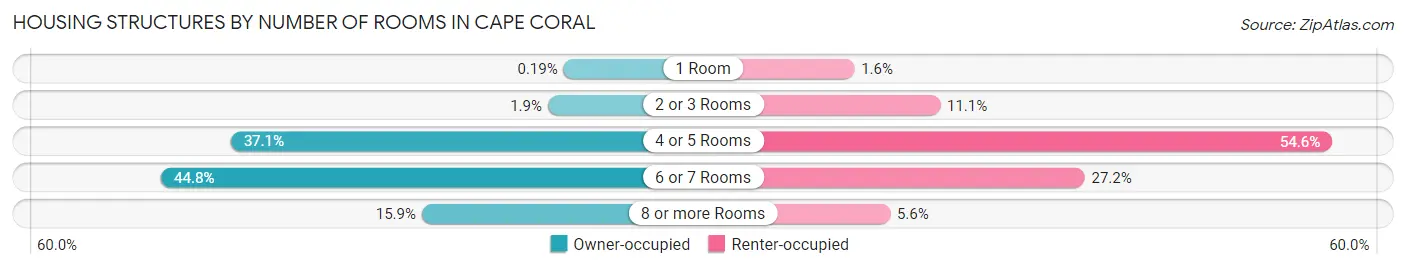
| Number of Rooms | Owner-occupied | Renter-occupied |
| 1 Room | 112 (0.2%) | 275 (1.6%) |
| 2 or 3 Rooms | 1,152 (1.9%) | 1,927 (11.1%) |
| 4 or 5 Rooms | 22,101 (37.1%) | 9,473 (54.6%) |
| 6 or 7 Rooms | 26,693 (44.8%) | 4,709 (27.2%) |
| 8 or more Rooms | 9,478 (15.9%) | 962 (5.6%) |
| Total | 59,536 (100.0%) | 17,346 (100.0%) |
Housing Structure by Heating Type in Cape Coral
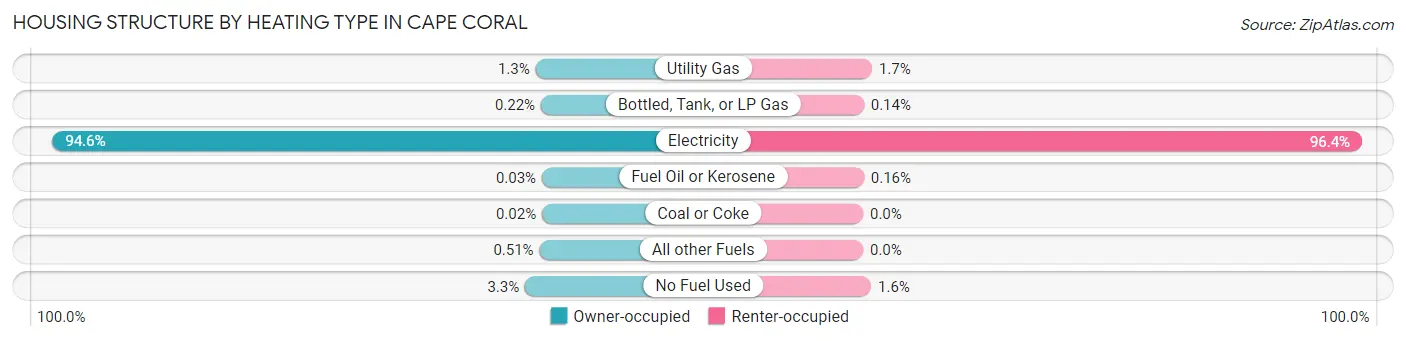
| Heating Type | Owner-occupied | Renter-occupied |
| Utility Gas | 759 (1.3%) | 300 (1.7%) |
| Bottled, Tank, or LP Gas | 133 (0.2%) | 25 (0.1%) |
| Electricity | 56,344 (94.6%) | 16,722 (96.4%) |
| Fuel Oil or Kerosene | 20 (0.0%) | 28 (0.2%) |
| Coal or Coke | 10 (0.0%) | 0 (0.0%) |
| All other Fuels | 303 (0.5%) | 0 (0.0%) |
| No Fuel Used | 1,967 (3.3%) | 271 (1.6%) |
| Total | 59,536 (100.0%) | 17,346 (100.0%) |
Household Vehicle Usage in Cape Coral
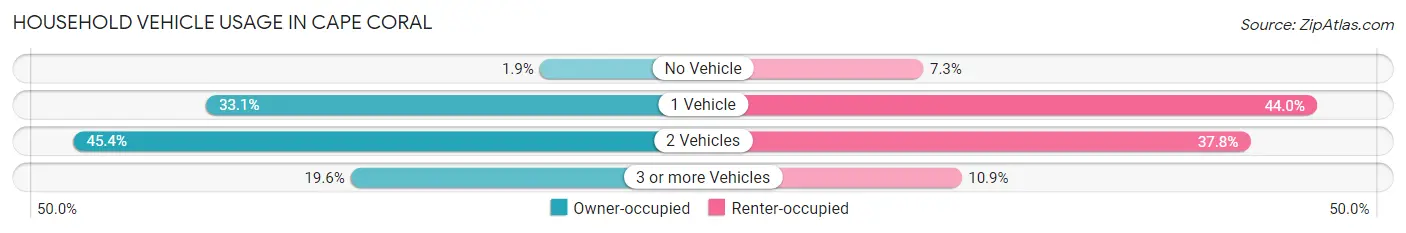
| Vehicles per Household | Owner-occupied | Renter-occupied |
| No Vehicle | 1,147 (1.9%) | 1,265 (7.3%) |
| 1 Vehicle | 19,684 (33.1%) | 7,640 (44.0%) |
| 2 Vehicles | 27,045 (45.4%) | 6,558 (37.8%) |
| 3 or more Vehicles | 11,660 (19.6%) | 1,883 (10.9%) |
| Total | 59,536 (100.0%) | 17,346 (100.0%) |
Real Estate & Mortgages in Cape Coral
Real Estate and Mortgage Overview in Cape Coral
| Characteristic | Without Mortgage | With Mortgage |
| Housing Units | 21,236 | 38,300 |
| Median Property Value | $308,900 | $299,300 |
| Median Household Income | $67,050 | $6,782 |
| Monthly Housing Costs | $647 | $2,598 |
| Real Estate Taxes | $2,708 | $866 |
Property Value by Mortgage Status in Cape Coral
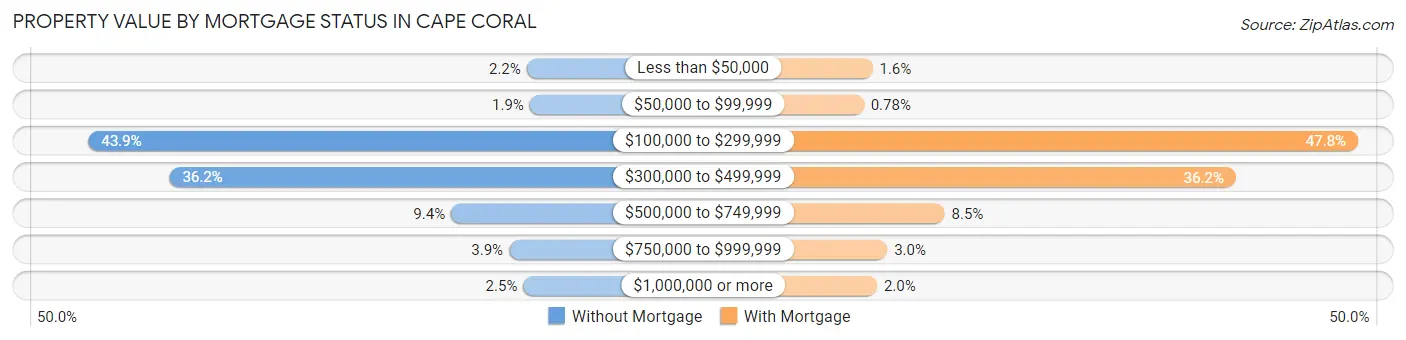
| Property Value | Without Mortgage | With Mortgage |
| Less than $50,000 | 465 (2.2%) | 619 (1.6%) |
| $50,000 to $99,999 | 404 (1.9%) | 300 (0.8%) |
| $100,000 to $299,999 | 9,330 (43.9%) | 18,324 (47.8%) |
| $300,000 to $499,999 | 7,688 (36.2%) | 13,869 (36.2%) |
| $500,000 to $749,999 | 1,994 (9.4%) | 3,249 (8.5%) |
| $750,000 to $999,999 | 822 (3.9%) | 1,156 (3.0%) |
| $1,000,000 or more | 533 (2.5%) | 783 (2.0%) |
| Total | 21,236 (100.0%) | 38,300 (100.0%) |
Household Income by Mortgage Status in Cape Coral
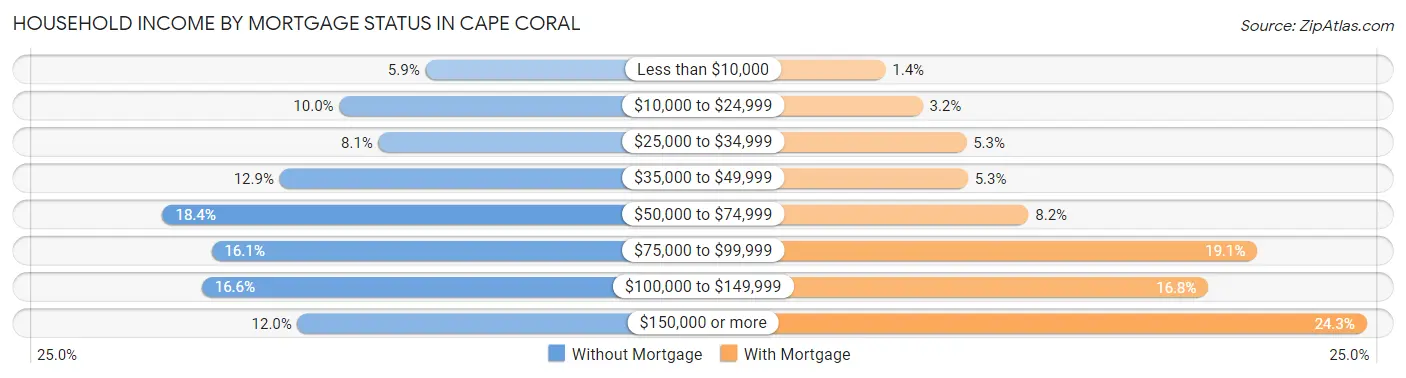
| Household Income | Without Mortgage | With Mortgage |
| Less than $10,000 | 1,255 (5.9%) | 544 (1.4%) |
| $10,000 to $24,999 | 2,125 (10.0%) | 1,221 (3.2%) |
| $25,000 to $34,999 | 1,729 (8.1%) | 2,020 (5.3%) |
| $35,000 to $49,999 | 2,728 (12.9%) | 2,045 (5.3%) |
| $50,000 to $74,999 | 3,914 (18.4%) | 3,151 (8.2%) |
| $75,000 to $99,999 | 3,420 (16.1%) | 7,325 (19.1%) |
| $100,000 to $149,999 | 3,517 (16.6%) | 6,433 (16.8%) |
| $150,000 or more | 2,548 (12.0%) | 9,323 (24.3%) |
| Total | 21,236 (100.0%) | 38,300 (100.0%) |
Property Value to Household Income Ratio in Cape Coral
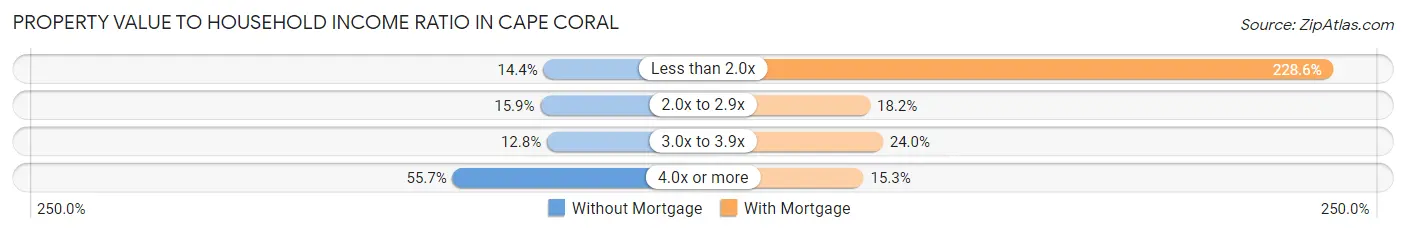
| Value-to-Income Ratio | Without Mortgage | With Mortgage |
| Less than 2.0x | 3,054 (14.4%) | 87,561 (228.6%) |
| 2.0x to 2.9x | 3,370 (15.9%) | 6,976 (18.2%) |
| 3.0x to 3.9x | 2,722 (12.8%) | 9,187 (24.0%) |
| 4.0x or more | 11,831 (55.7%) | 5,852 (15.3%) |
| Total | 21,236 (100.0%) | 38,300 (100.0%) |
Real Estate Taxes by Mortgage Status in Cape Coral
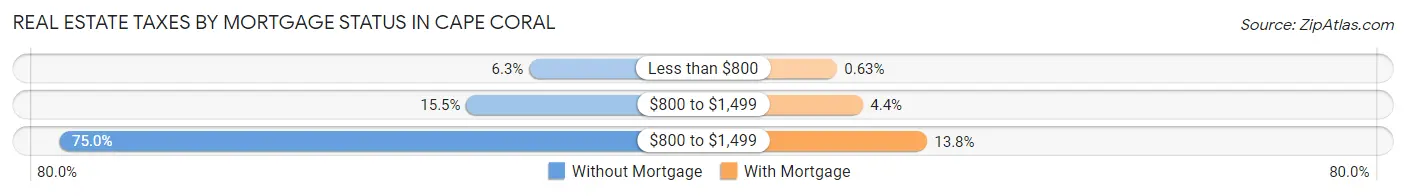
| Property Taxes | Without Mortgage | With Mortgage |
| Less than $800 | 1,332 (6.3%) | 243 (0.6%) |
| $800 to $1,499 | 3,280 (15.4%) | 1,697 (4.4%) |
| $800 to $1,499 | 15,916 (75.0%) | 5,278 (13.8%) |
| Total | 21,236 (100.0%) | 38,300 (100.0%) |
Health & Disability in Cape Coral
Health Insurance Coverage by Age in Cape Coral
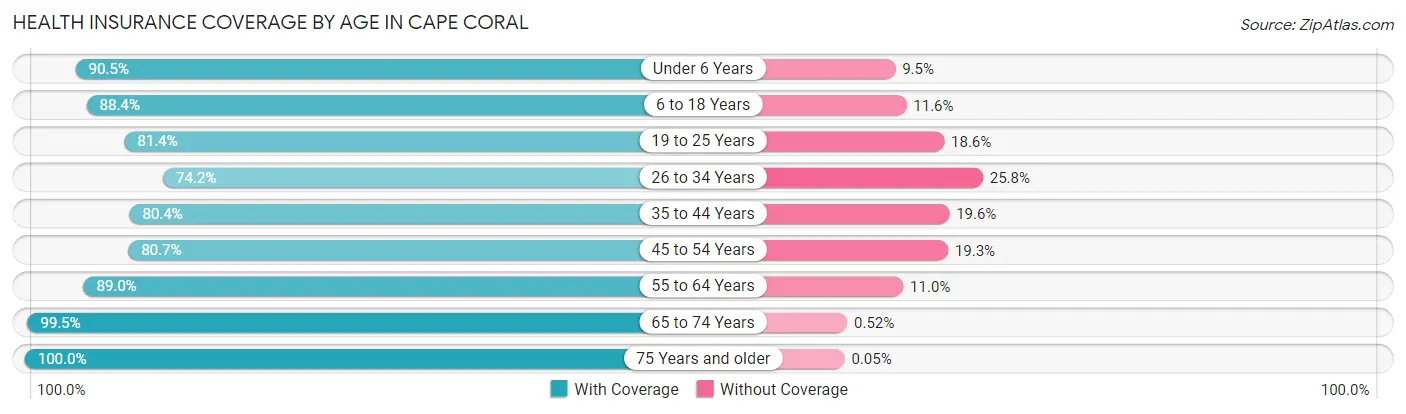
| Age Bracket | With Coverage | Without Coverage |
| Under 6 Years | 9,701 (90.5%) | 1,018 (9.5%) |
| 6 to 18 Years | 23,132 (88.4%) | 3,027 (11.6%) |
| 19 to 25 Years | 9,916 (81.4%) | 2,268 (18.6%) |
| 26 to 34 Years | 15,041 (74.2%) | 5,234 (25.8%) |
| 35 to 44 Years | 17,331 (80.4%) | 4,214 (19.6%) |
| 45 to 54 Years | 21,958 (80.7%) | 5,260 (19.3%) |
| 55 to 64 Years | 27,955 (89.0%) | 3,449 (11.0%) |
| 65 to 74 Years | 28,582 (99.5%) | 148 (0.5%) |
| 75 Years and older | 20,039 (100.0%) | 10 (0.1%) |
| Total | 173,655 (87.6%) | 24,628 (12.4%) |
Health Insurance Coverage by Citizenship Status in Cape Coral
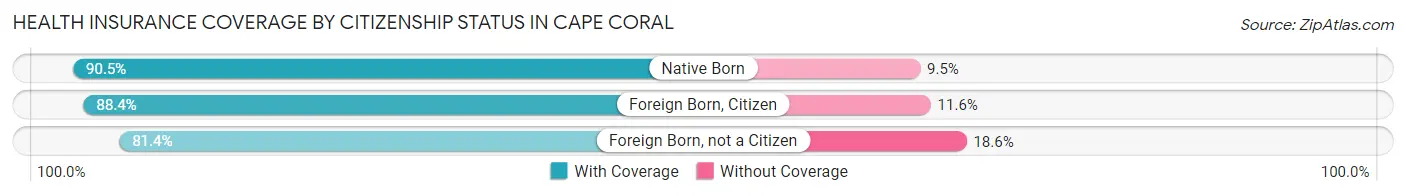
| Citizenship Status | With Coverage | Without Coverage |
| Native Born | 9,701 (90.5%) | 1,018 (9.5%) |
| Foreign Born, Citizen | 23,132 (88.4%) | 3,027 (11.6%) |
| Foreign Born, not a Citizen | 9,916 (81.4%) | 2,268 (18.6%) |
Health Insurance Coverage by Household Income in Cape Coral
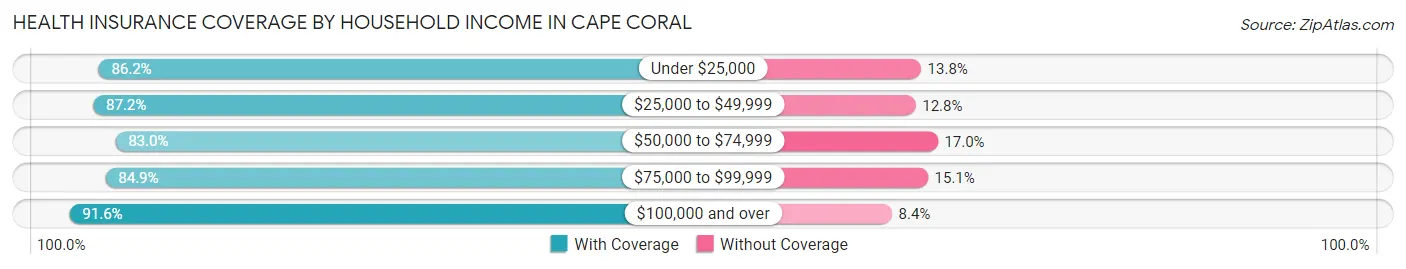
| Household Income | With Coverage | Without Coverage |
| Under $25,000 | 14,252 (86.2%) | 2,289 (13.8%) |
| $25,000 to $49,999 | 25,475 (87.2%) | 3,749 (12.8%) |
| $50,000 to $74,999 | 32,766 (83.0%) | 6,702 (17.0%) |
| $75,000 to $99,999 | 30,155 (84.9%) | 5,380 (15.1%) |
| $100,000 and over | 70,739 (91.6%) | 6,483 (8.4%) |
Public vs Private Health Insurance Coverage by Age in Cape Coral
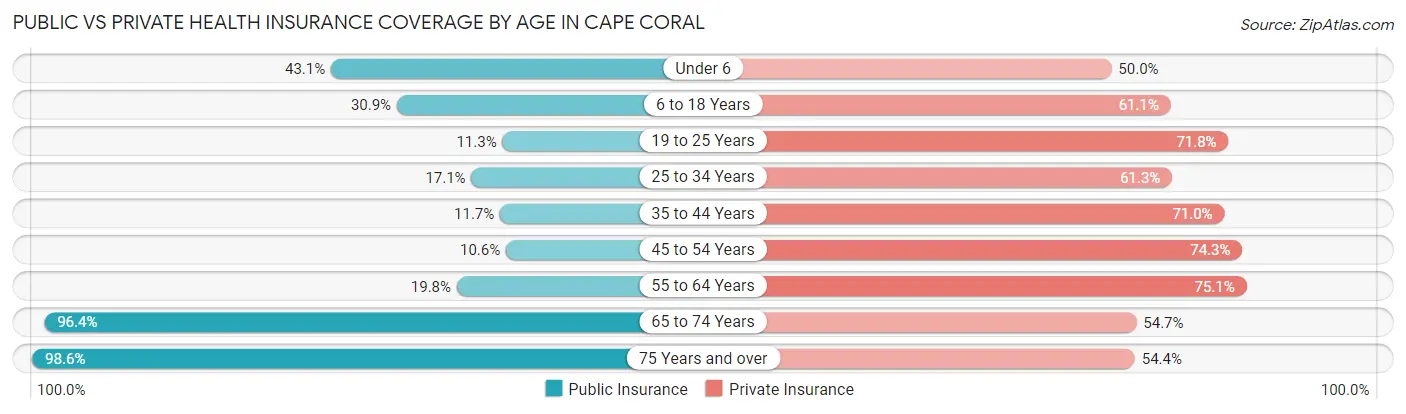
| Age Bracket | Public Insurance | Private Insurance |
| Under 6 | 4,622 (43.1%) | 5,364 (50.0%) |
| 6 to 18 Years | 8,080 (30.9%) | 15,970 (61.1%) |
| 19 to 25 Years | 1,377 (11.3%) | 8,743 (71.8%) |
| 25 to 34 Years | 3,459 (17.1%) | 12,432 (61.3%) |
| 35 to 44 Years | 2,529 (11.7%) | 15,301 (71.0%) |
| 45 to 54 Years | 2,896 (10.6%) | 20,232 (74.3%) |
| 55 to 64 Years | 6,209 (19.8%) | 23,594 (75.1%) |
| 65 to 74 Years | 27,685 (96.4%) | 15,708 (54.7%) |
| 75 Years and over | 19,767 (98.6%) | 10,902 (54.4%) |
| Total | 76,624 (38.6%) | 128,246 (64.7%) |
Disability Status by Sex by Age in Cape Coral
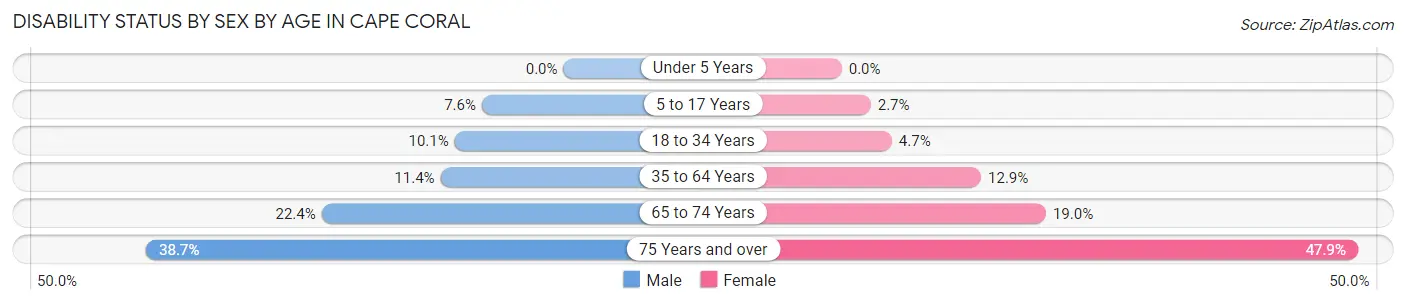
| Age Bracket | Male | Female |
| Under 5 Years | 0 (0.0%) | 0 (0.0%) |
| 5 to 17 Years | 1,047 (7.6%) | 320 (2.7%) |
| 18 to 34 Years | 1,653 (10.1%) | 848 (4.6%) |
| 35 to 64 Years | 4,594 (11.4%) | 5,161 (12.9%) |
| 65 to 74 Years | 3,184 (22.4%) | 2,755 (19.0%) |
| 75 Years and over | 3,803 (38.7%) | 4,897 (47.9%) |
Disability Class by Sex by Age in Cape Coral
Disability Class: Hearing Difficulty
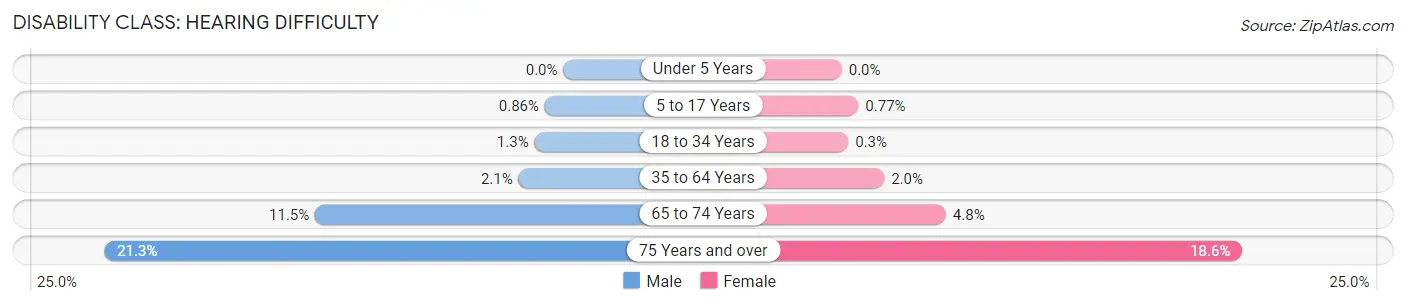
| Age Bracket | Male | Female |
| Under 5 Years | 0 (0.0%) | 0 (0.0%) |
| 5 to 17 Years | 119 (0.9%) | 91 (0.8%) |
| 18 to 34 Years | 219 (1.3%) | 55 (0.3%) |
| 35 to 64 Years | 838 (2.1%) | 786 (2.0%) |
| 65 to 74 Years | 1,635 (11.5%) | 702 (4.8%) |
| 75 Years and over | 2,093 (21.3%) | 1,900 (18.6%) |
Disability Class: Vision Difficulty
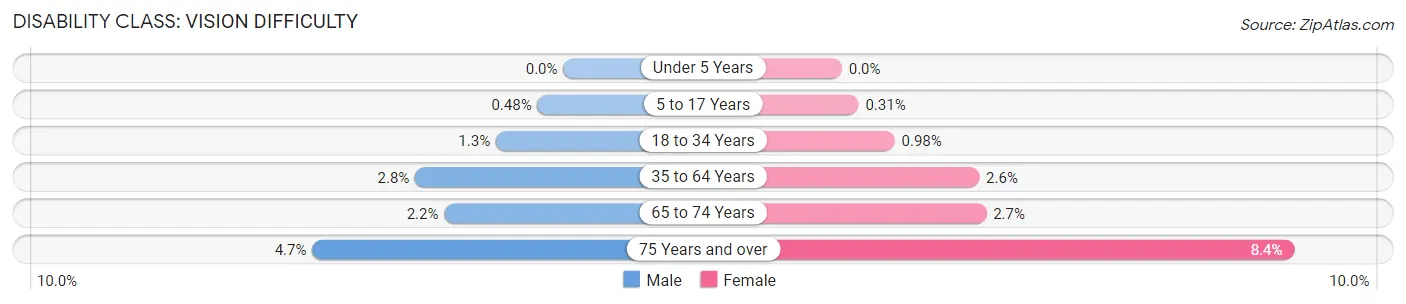
| Age Bracket | Male | Female |
| Under 5 Years | 0 (0.0%) | 0 (0.0%) |
| 5 to 17 Years | 67 (0.5%) | 37 (0.3%) |
| 18 to 34 Years | 205 (1.3%) | 178 (1.0%) |
| 35 to 64 Years | 1,107 (2.8%) | 1,016 (2.5%) |
| 65 to 74 Years | 313 (2.2%) | 390 (2.7%) |
| 75 Years and over | 458 (4.7%) | 859 (8.4%) |
Disability Class: Cognitive Difficulty
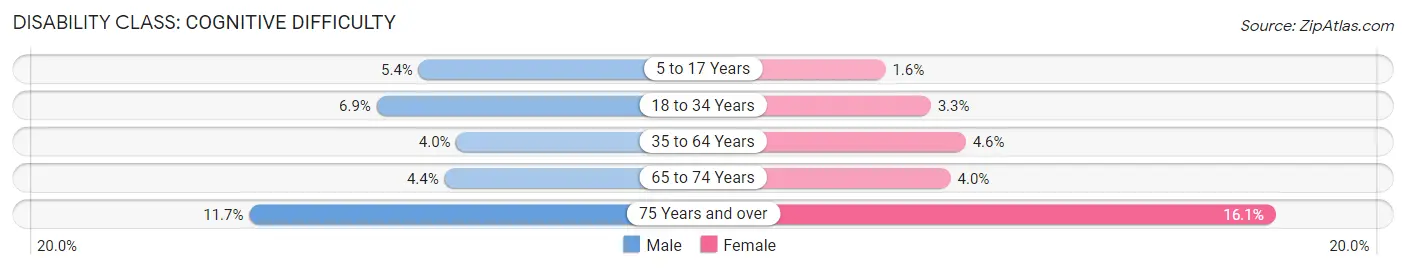
| Age Bracket | Male | Female |
| 5 to 17 Years | 743 (5.4%) | 192 (1.6%) |
| 18 to 34 Years | 1,135 (6.9%) | 602 (3.3%) |
| 35 to 64 Years | 1,598 (4.0%) | 1,838 (4.6%) |
| 65 to 74 Years | 626 (4.4%) | 588 (4.0%) |
| 75 Years and over | 1,145 (11.7%) | 1,647 (16.1%) |
Disability Class: Ambulatory Difficulty
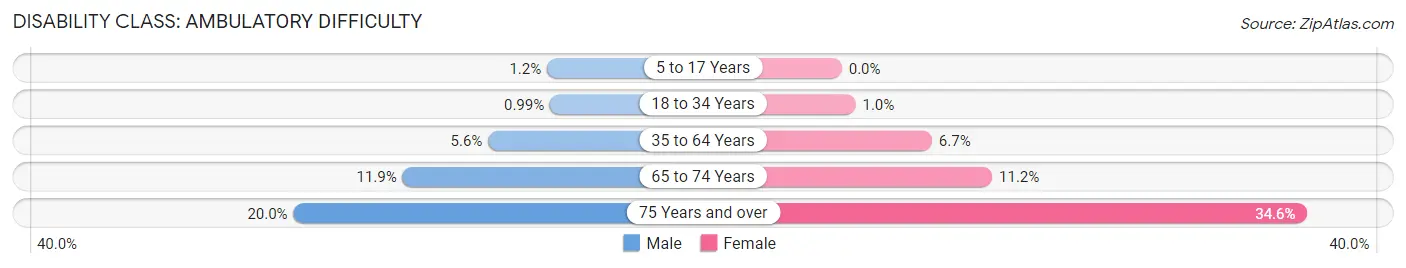
| Age Bracket | Male | Female |
| 5 to 17 Years | 167 (1.2%) | 0 (0.0%) |
| 18 to 34 Years | 162 (1.0%) | 187 (1.0%) |
| 35 to 64 Years | 2,244 (5.6%) | 2,669 (6.7%) |
| 65 to 74 Years | 1,694 (11.9%) | 1,623 (11.2%) |
| 75 Years and over | 1,968 (20.0%) | 3,535 (34.6%) |
Disability Class: Self-Care Difficulty
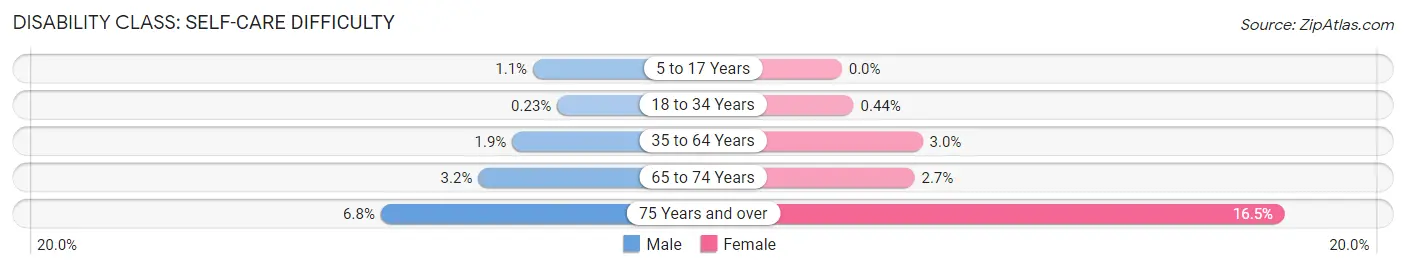
| Age Bracket | Male | Female |
| 5 to 17 Years | 156 (1.1%) | 0 (0.0%) |
| 18 to 34 Years | 38 (0.2%) | 80 (0.4%) |
| 35 to 64 Years | 766 (1.9%) | 1,197 (3.0%) |
| 65 to 74 Years | 449 (3.2%) | 393 (2.7%) |
| 75 Years and over | 666 (6.8%) | 1,683 (16.5%) |
Technology Access in Cape Coral
Computing Device Access in Cape Coral
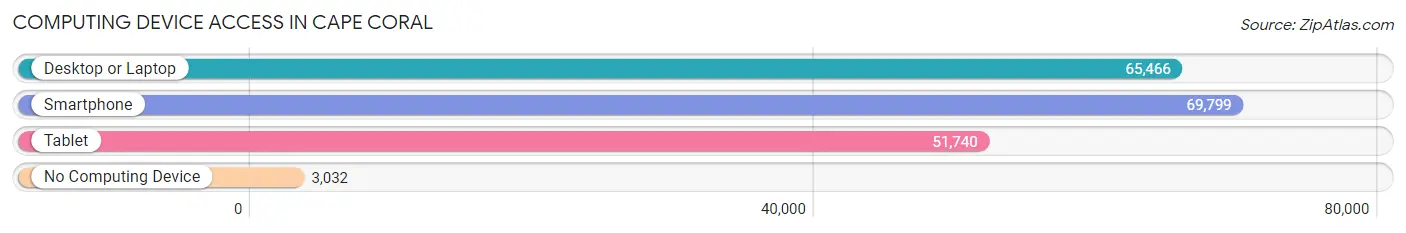
| Device Type | # Households | % Households |
| Desktop or Laptop | 65,466 | 85.2% |
| Smartphone | 69,799 | 90.8% |
| Tablet | 51,740 | 67.3% |
| No Computing Device | 3,032 | 3.9% |
| Total | 76,882 | 100.0% |
Internet Access in Cape Coral
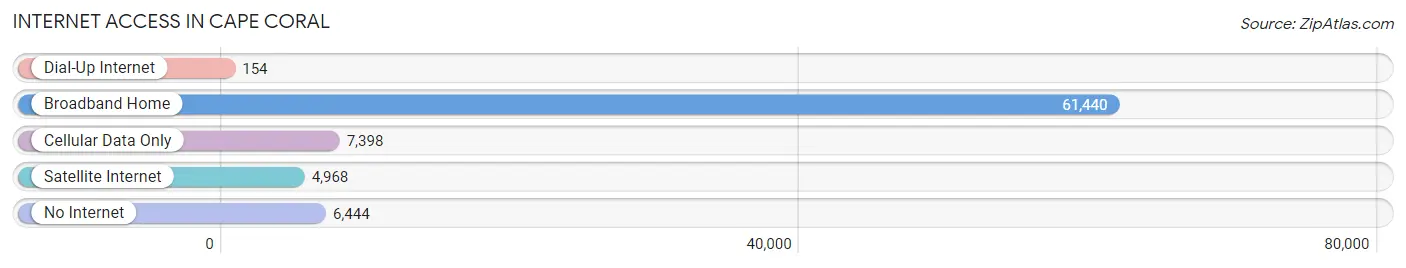
| Internet Type | # Households | % Households |
| Dial-Up Internet | 154 | 0.2% |
| Broadband Home | 61,440 | 79.9% |
| Cellular Data Only | 7,398 | 9.6% |
| Satellite Internet | 4,968 | 6.5% |
| No Internet | 6,444 | 8.4% |
| Total | 76,882 | 100.0% |
Cape Coral Summary
Cape Coral is a city located in Lee County, Florida, United States. It is the largest city between Tampa and Miami, with a population of over 180,000 people. The city is located on the Gulf of Mexico and is known for its canals, which make up over 400 miles of the city’s waterways.
Geography
Cape Coral is located in the southwestern part of Florida, on the Gulf of Mexico. It is bordered by the Caloosahatchee River to the north, Pine Island Sound to the east, and the Gulf of Mexico to the west. The city is divided into four quadrants, with the Caloosahatchee River running through the center. The city is made up of over 400 miles of canals, which are used for both recreational and commercial purposes. The city is also home to several lakes, including Lake Kennedy, Lake Alhambra, and Lake Saratoga.
Economy
Cape Coral’s economy is largely based on tourism and real estate. The city is home to several resorts and hotels, as well as a variety of restaurants and shopping centers. The city is also home to several large employers, including Lee Memorial Health System, Lee County Public Schools, and the Lee County Sheriff’s Office. The city is also home to several manufacturing companies, including Gulf Coast Marine, Gulf Coast Plastics, and Gulf Coast Steel.
Demographics
As of the 2010 census, Cape Coral had a population of 154,305. The racial makeup of the city was 79.2% White, 8.3% African American, 0.4% Native American, 1.7% Asian, 0.1% Pacific Islander, 8.2% from other races, and 2.1% from two or more races. Hispanic or Latino of any race were 20.5% of the population.
The median income for a household in the city was $45,844, and the median income for a family was $51,817. Males had a median income of $37,813 versus $27,817 for females. The per capita income for the city was $23,837. About 8.7% of families and 11.2% of the population were below the poverty line, including 15.2% of those under age 18 and 6.2% of those age 65 or over.
Conclusion
Cape Coral is a city located in Lee County, Florida, United States. It is the largest city between Tampa and Miami, with a population of over 180,000 people. The city is located on the Gulf of Mexico and is known for its canals, which make up over 400 miles of the city’s waterways. The city’s economy is largely based on tourism and real estate, and it is home to several large employers. The city’s population is diverse, with a majority of White, African American, and Hispanic or Latino residents. The median income for a household in the city is $45,844, and the per capita income is $23,837.
Common Questions
What is Per Capita Income in Cape Coral?
Per Capita income in Cape Coral is $37,621.
What is the Median Family Income in Cape Coral?
Median Family Income in Cape Coral is $81,987.
What is the Median Household income in Cape Coral?
Median Household Income in Cape Coral is $72,474.
What is Income or Wage Gap in Cape Coral?
Income or Wage Gap in Cape Coral is 21.4%.
Women in Cape Coral earn 78.6 cents for every dollar earned by a man.
What is Family Income Deficit in Cape Coral?
Family Income Deficit in Cape Coral is $10,814.
Families that are below poverty line in Cape Coral earn $10,814 less on average than the poverty threshold level.
What is Inequality or Gini Index in Cape Coral?
Inequality or Gini Index in Cape Coral is 0.42.
What is the Total Population of Cape Coral?
Total Population of Cape Coral is 198,912.
What is the Total Male Population of Cape Coral?
Total Male Population of Cape Coral is 99,587.
What is the Total Female Population of Cape Coral?
Total Female Population of Cape Coral is 99,325.
What is the Ratio of Males per 100 Females in Cape Coral?
There are 100.26 Males per 100 Females in Cape Coral.
What is the Ratio of Females per 100 Males in Cape Coral?
There are 99.74 Females per 100 Males in Cape Coral.
What is the Median Population Age in Cape Coral?
Median Population Age in Cape Coral is 48.2 Years.
What is the Average Family Size in Cape Coral
Average Family Size in Cape Coral is 3.0 People.
What is the Average Household Size in Cape Coral
Average Household Size in Cape Coral is 2.6 People.
How Large is the Labor Force in Cape Coral?
There are 97,676 People in the Labor Forcein in Cape Coral.
What is the Percentage of People in the Labor Force in Cape Coral?
58.0% of People are in the Labor Force in Cape Coral.
What is the Unemployment Rate in Cape Coral?
Unemployment Rate in Cape Coral is 4.4%.