St Louis, MO Map & Demographics
St Louis Map
St Louis Overview
$36,722
PER CAPITA INCOME
$72,655
AVG FAMILY INCOME
$52,941
AVG HOUSEHOLD INCOME
19.8%
WAGE / INCOME GAP [ % ]
80.2¢/ $1
WAGE / INCOME GAP [ $ ]
$11,963
FAMILY INCOME DEFICIT
0.50
INEQUALITY / GINI INDEX
298,018
TOTAL POPULATION
144,893
MALE POPULATION
153,125
FEMALE POPULATION
94.62
MALES / 100 FEMALES
105.68
FEMALES / 100 MALES
36.5
MEDIAN AGE
3.0
AVG FAMILY SIZE
2.0
AVG HOUSEHOLD SIZE
164,326
LABOR FORCE [ PEOPLE ]
66.2%
PERCENT IN LABOR FORCE
5.4%
UNEMPLOYMENT RATE
Income in St Louis
Income Overview in St Louis
Per Capita Income in St Louis is $36,722, while median incomes of families and households are $72,655 and $52,941 respectively.
| Characteristic | Number | Measure |
| Per Capita Income | 298,018 | $36,722 |
| Median Family Income | 61,303 | $72,655 |
| Mean Family Income | 61,303 | $96,795 |
| Median Household Income | 143,059 | $52,941 |
| Mean Household Income | 143,059 | $74,579 |
| Income Deficit | 61,303 | $11,963 |
| Wage / Income Gap (%) | 298,018 | 19.77% |
| Wage / Income Gap ($) | 298,018 | 80.23¢ per $1 |
| Gini / Inequality Index | 298,018 | 0.50 |
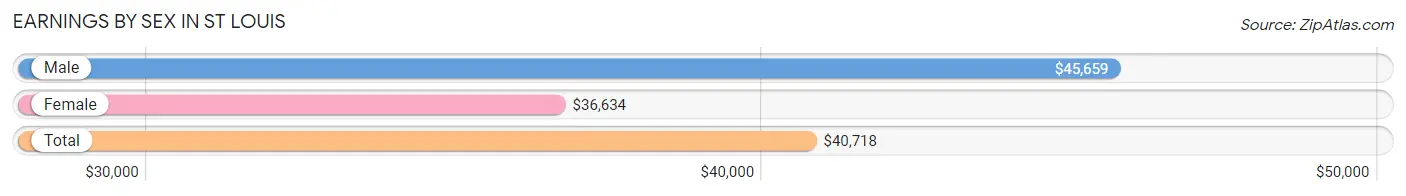
Earnings by Sex in St Louis
Average Earnings in St Louis are $40,718, $45,659 for men and $36,634 for women, a difference of 19.8%.
| Sex | Number | Average Earnings |
| Male | 83,441 (49.0%) | $45,659 |
| Female | 86,857 (51.0%) | $36,634 |
| Total | 170,298 (100.0%) | $40,718 |
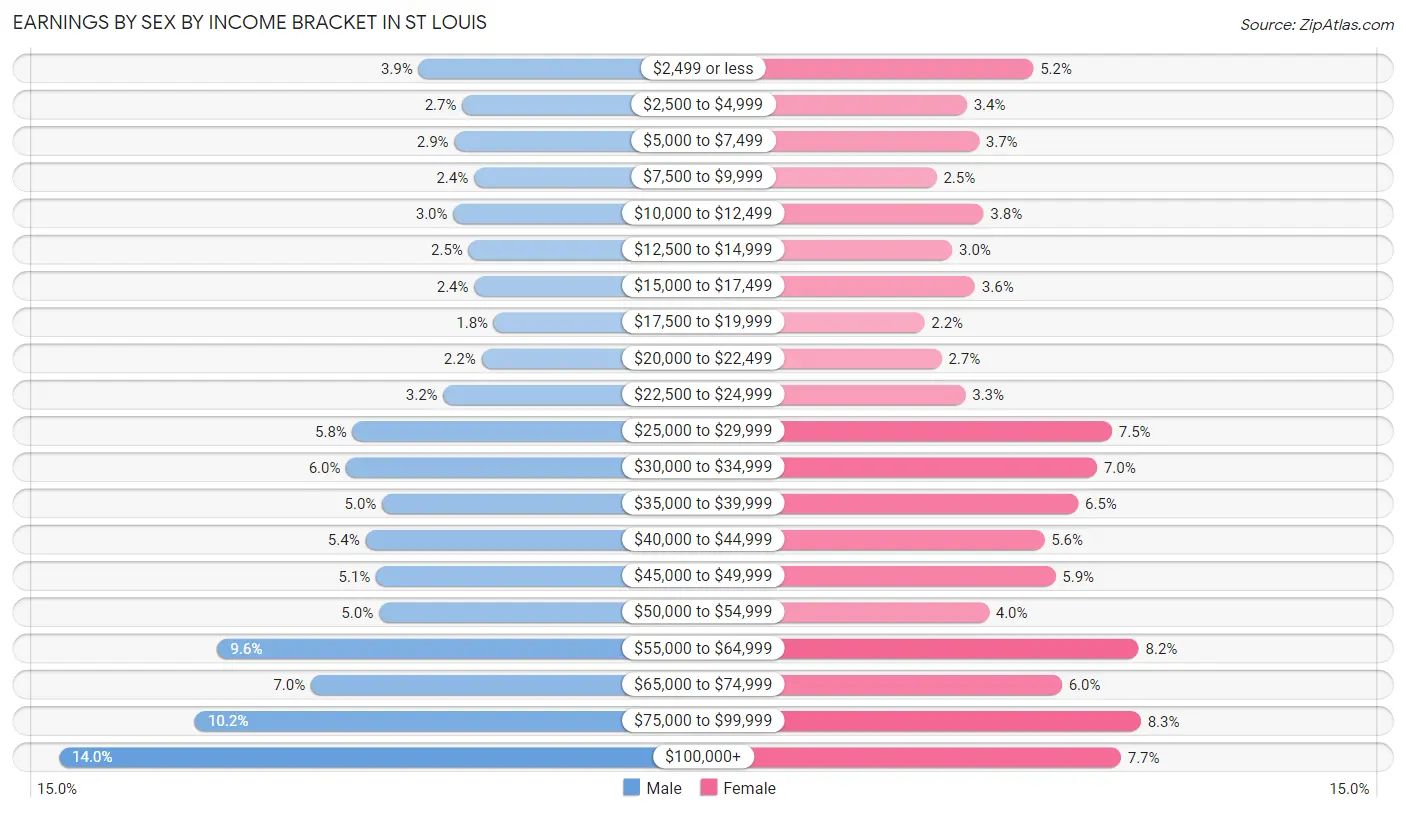
Earnings by Sex by Income Bracket in St Louis
The most common earnings brackets in St Louis are $100,000+ for men (11,708 | 14.0%) and $75,000 to $99,999 for women (7,176 | 8.3%).
| Income | Male | Female |
| $2,499 or less | 3,277 (3.9%) | 4,550 (5.2%) |
| $2,500 to $4,999 | 2,254 (2.7%) | 2,927 (3.4%) |
| $5,000 to $7,499 | 2,436 (2.9%) | 3,224 (3.7%) |
| $7,500 to $9,999 | 1,976 (2.4%) | 2,193 (2.5%) |
| $10,000 to $12,499 | 2,459 (2.9%) | 3,334 (3.8%) |
| $12,500 to $14,999 | 2,103 (2.5%) | 2,569 (3.0%) |
| $15,000 to $17,499 | 1,972 (2.4%) | 3,131 (3.6%) |
| $17,500 to $19,999 | 1,513 (1.8%) | 1,895 (2.2%) |
| $20,000 to $22,499 | 1,799 (2.2%) | 2,314 (2.7%) |
| $22,500 to $24,999 | 2,699 (3.2%) | 2,888 (3.3%) |
| $25,000 to $29,999 | 4,825 (5.8%) | 6,472 (7.4%) |
| $30,000 to $34,999 | 4,975 (6.0%) | 6,107 (7.0%) |
| $35,000 to $39,999 | 4,134 (5.0%) | 5,642 (6.5%) |
| $40,000 to $44,999 | 4,522 (5.4%) | 4,820 (5.6%) |
| $45,000 to $49,999 | 4,275 (5.1%) | 5,092 (5.9%) |
| $50,000 to $54,999 | 4,206 (5.0%) | 3,468 (4.0%) |
| $55,000 to $64,999 | 7,995 (9.6%) | 7,122 (8.2%) |
| $65,000 to $74,999 | 5,797 (7.0%) | 5,243 (6.0%) |
| $75,000 to $99,999 | 8,516 (10.2%) | 7,176 (8.3%) |
| $100,000+ | 11,708 (14.0%) | 6,690 (7.7%) |
| Total | 83,441 (100.0%) | 86,857 (100.0%) |
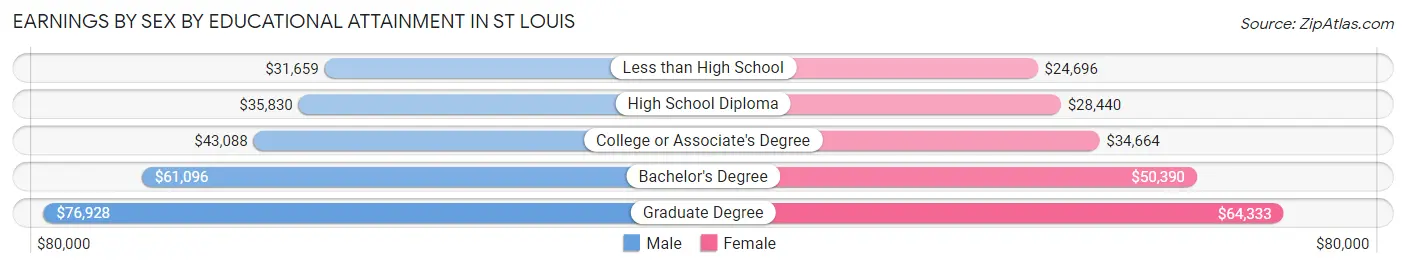
Earnings by Sex by Educational Attainment in St Louis
Average earnings in St Louis are $50,963 for men and $41,107 for women, a difference of 19.3%. Men with an educational attainment of graduate degree enjoy the highest average annual earnings of $76,928, while those with less than high school education earn the least with $31,659. Women with an educational attainment of graduate degree earn the most with the average annual earnings of $64,333, while those with less than high school education have the smallest earnings of $24,696.
| Educational Attainment | Male Income | Female Income |
| Less than High School | $31,659 | $24,696 |
| High School Diploma | $35,830 | $28,440 |
| College or Associate's Degree | $43,088 | $34,664 |
| Bachelor's Degree | $61,096 | $50,390 |
| Graduate Degree | $76,928 | $64,333 |
| Total | $50,963 | $41,107 |
Family Income in St Louis
Family Income Brackets in St Louis
According to the St Louis family income data, there are 10,851 families falling into the $50,000 to $74,999 income range, which is the most common income bracket and makes up 17.7% of all families. Conversely, the $10,000 to $14,999 income bracket is the least frequent group with only 2,146 families (3.5%) belonging to this category.
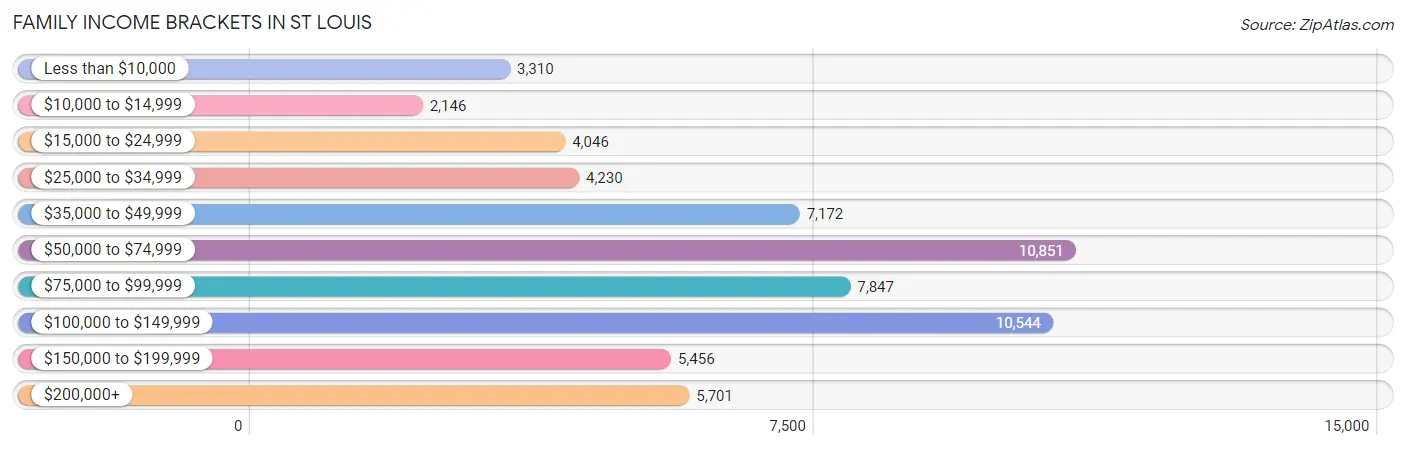
| Income Bracket | # Families | % Families |
| Less than $10,000 | 3,310 | 5.4% |
| $10,000 to $14,999 | 2,146 | 3.5% |
| $15,000 to $24,999 | 4,046 | 6.6% |
| $25,000 to $34,999 | 4,230 | 6.9% |
| $35,000 to $49,999 | 7,172 | 11.7% |
| $50,000 to $74,999 | 10,851 | 17.7% |
| $75,000 to $99,999 | 7,847 | 12.8% |
| $100,000 to $149,999 | 10,544 | 17.2% |
| $150,000 to $199,999 | 5,456 | 8.9% |
| $200,000+ | 5,701 | 9.3% |
Family Income by Famaliy Size in St Louis
6-person families (1,228 | 2.0%) account for the highest median family income in St Louis with $103,846 per family, while 2-person families (32,807 | 53.5%) have the highest median income of $35,076 per family member.
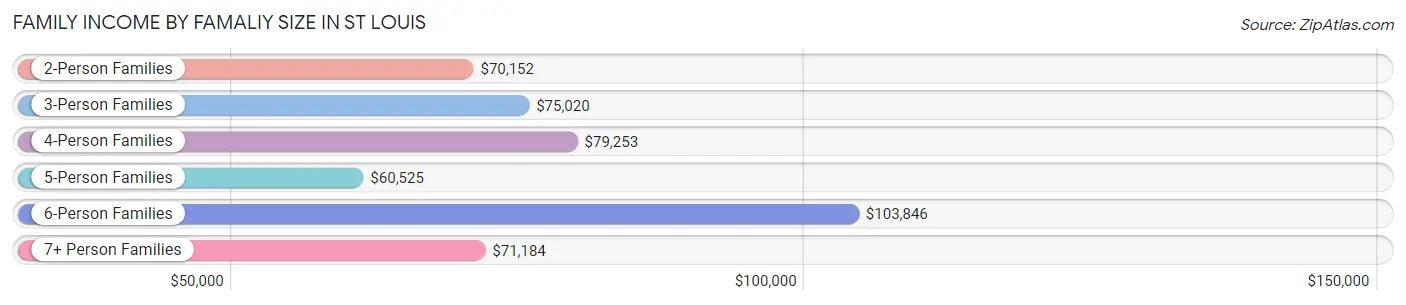
| Income Bracket | # Families | Median Income |
| 2-Person Families | 32,807 (53.5%) | $70,152 |
| 3-Person Families | 12,853 (21.0%) | $75,020 |
| 4-Person Families | 9,451 (15.4%) | $79,253 |
| 5-Person Families | 3,716 (6.1%) | $60,525 |
| 6-Person Families | 1,228 (2.0%) | $103,846 |
| 7+ Person Families | 1,248 (2.0%) | $71,184 |
| Total | 61,303 (100.0%) | $72,655 |
Family Income by Number of Earners in St Louis
The median family income in St Louis is $72,655, with families comprising 3+ earners (4,721) having the highest median family income of $107,109, while families with no earners (7,903) have the lowest median family income of $28,705, accounting for 7.7% and 12.9% of families, respectively.
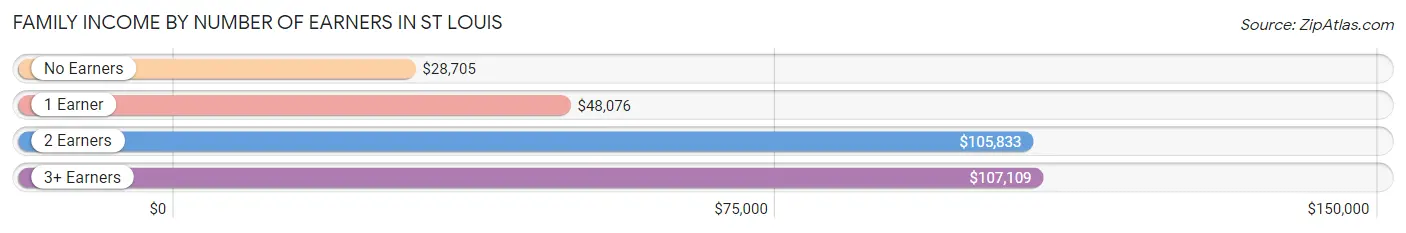
| Number of Earners | # Families | Median Income |
| No Earners | 7,903 (12.9%) | $28,705 |
| 1 Earner | 21,681 (35.4%) | $48,076 |
| 2 Earners | 26,998 (44.0%) | $105,833 |
| 3+ Earners | 4,721 (7.7%) | $107,109 |
| Total | 61,303 (100.0%) | $72,655 |
Household Income in St Louis
Household Income Brackets in St Louis
With 25,178 households falling in the category, the $50,000 to $74,999 income range is the most frequent in St Louis, accounting for 17.6% of all households. In contrast, only 7,868 households (5.5%) fall into the $200,000+ income bracket, making it the least populous group.
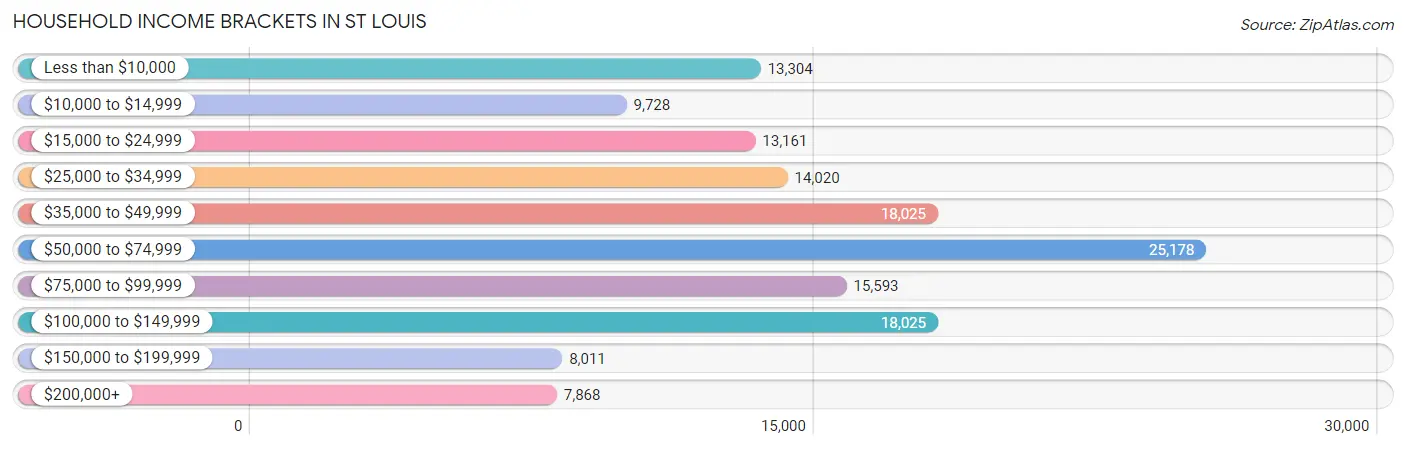
| Income Bracket | # Households | % Households |
| Less than $10,000 | 13,304 | 9.3% |
| $10,000 to $14,999 | 9,728 | 6.8% |
| $15,000 to $24,999 | 13,161 | 9.2% |
| $25,000 to $34,999 | 14,020 | 9.8% |
| $35,000 to $49,999 | 18,025 | 12.6% |
| $50,000 to $74,999 | 25,178 | 17.6% |
| $75,000 to $99,999 | 15,593 | 10.9% |
| $100,000 to $149,999 | 18,025 | 12.6% |
| $150,000 to $199,999 | 8,011 | 5.6% |
| $200,000+ | 7,868 | 5.5% |
Household Income by Householder Age in St Louis
The median household income in St Louis is $52,941, with the highest median household income of $64,424 found in the 25 to 44 years age bracket for the primary householder. A total of 59,125 households (41.3%) fall into this category. Meanwhile, the 15 to 24 years age bracket for the primary householder has the lowest median household income of $34,550, with 6,652 households (4.6%) in this group.
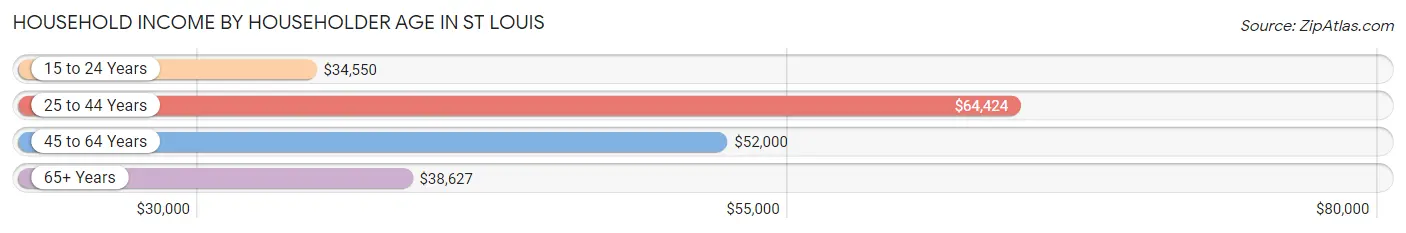
| Income Bracket | # Households | Median Income |
| 15 to 24 Years | 6,652 (4.6%) | $34,550 |
| 25 to 44 Years | 59,125 (41.3%) | $64,424 |
| 45 to 64 Years | 46,643 (32.6%) | $52,000 |
| 65+ Years | 30,639 (21.4%) | $38,627 |
| Total | 143,059 (100.0%) | $52,941 |
Poverty in St Louis
Income Below Poverty by Sex and Age in St Louis
With 18.6% poverty level for males and 21.7% for females among the residents of St Louis, 5 year old males and 6 to 11 year old females are the most vulnerable to poverty, with 539 males (35.7%) and 2,824 females (34.7%) in their respective age groups living below the poverty level.
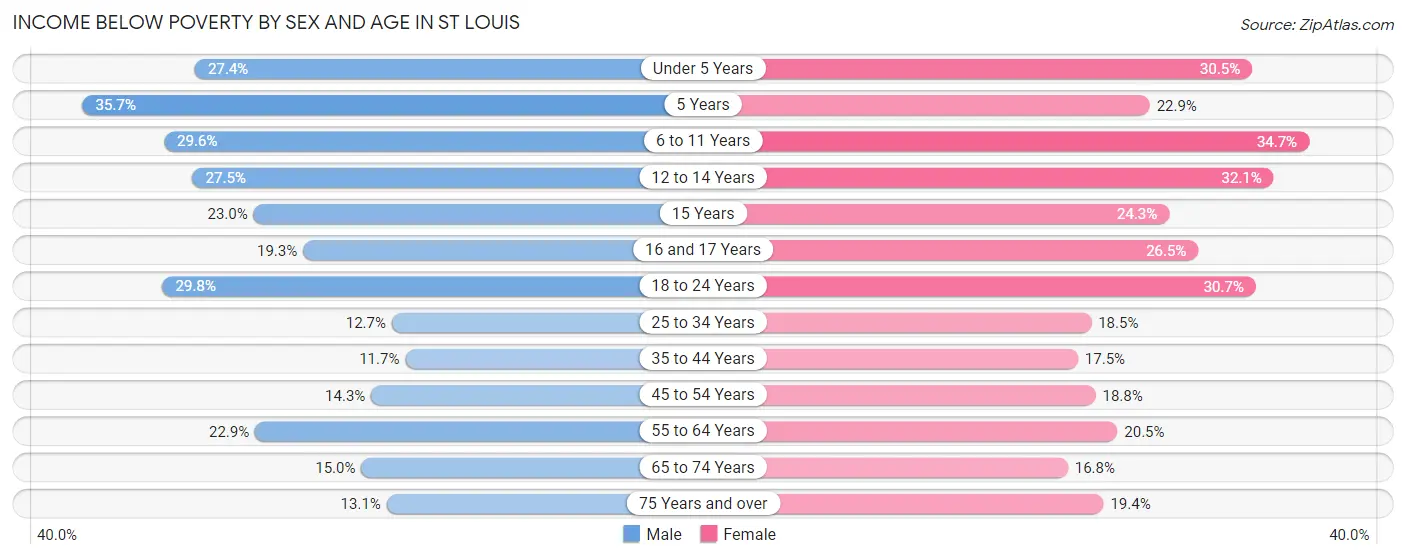
| Age Bracket | Male | Female |
| Under 5 Years | 2,404 (27.4%) | 2,594 (30.5%) |
| 5 Years | 539 (35.7%) | 363 (22.9%) |
| 6 to 11 Years | 2,411 (29.6%) | 2,824 (34.7%) |
| 12 to 14 Years | 1,376 (27.5%) | 1,371 (32.1%) |
| 15 Years | 261 (23.0%) | 362 (24.3%) |
| 16 and 17 Years | 548 (19.3%) | 669 (26.5%) |
| 18 to 24 Years | 3,390 (29.8%) | 3,531 (30.7%) |
| 25 to 34 Years | 3,644 (12.7%) | 5,571 (18.5%) |
| 35 to 44 Years | 2,408 (11.7%) | 3,611 (17.5%) |
| 45 to 54 Years | 2,330 (14.3%) | 3,162 (18.8%) |
| 55 to 64 Years | 4,193 (22.9%) | 3,939 (20.5%) |
| 65 to 74 Years | 1,861 (15.0%) | 2,413 (16.8%) |
| 75 Years and over | 738 (13.1%) | 1,860 (19.4%) |
| Total | 26,103 (18.6%) | 32,270 (21.7%) |
Income Above Poverty by Sex and Age in St Louis
According to the poverty statistics in St Louis, males aged 35 to 44 years and females aged 65 to 74 years are the age groups that are most secure financially, with 88.3% of males and 83.2% of females in these age groups living above the poverty line.
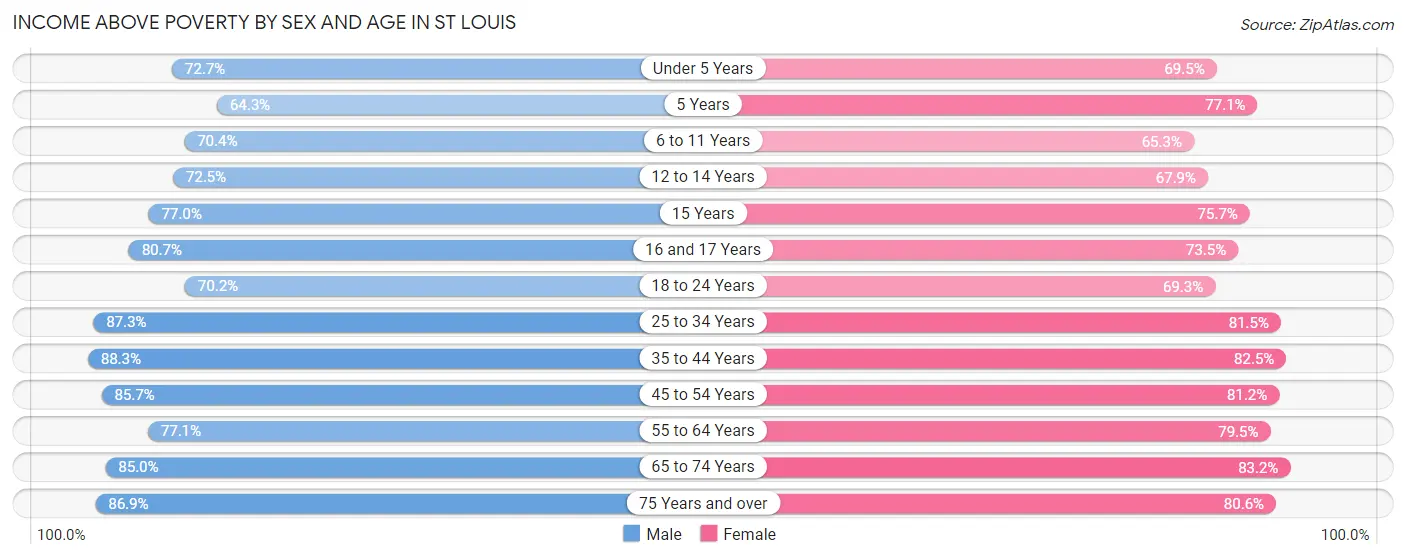
| Age Bracket | Male | Female |
| Under 5 Years | 6,387 (72.7%) | 5,921 (69.5%) |
| 5 Years | 971 (64.3%) | 1,225 (77.1%) |
| 6 to 11 Years | 5,724 (70.4%) | 5,320 (65.3%) |
| 12 to 14 Years | 3,624 (72.5%) | 2,905 (67.9%) |
| 15 Years | 874 (77.0%) | 1,128 (75.7%) |
| 16 and 17 Years | 2,287 (80.7%) | 1,859 (73.5%) |
| 18 to 24 Years | 8,003 (70.2%) | 7,958 (69.3%) |
| 25 to 34 Years | 24,968 (87.3%) | 24,502 (81.5%) |
| 35 to 44 Years | 18,096 (88.3%) | 16,992 (82.5%) |
| 45 to 54 Years | 13,998 (85.7%) | 13,622 (81.2%) |
| 55 to 64 Years | 14,126 (77.1%) | 15,310 (79.5%) |
| 65 to 74 Years | 10,547 (85.0%) | 11,968 (83.2%) |
| 75 Years and over | 4,885 (86.9%) | 7,711 (80.6%) |
| Total | 114,490 (81.4%) | 116,421 (78.3%) |
Income Below Poverty Among Married-Couple Families in St Louis
The poverty statistics for married-couple families in St Louis show that 5.2% or 1,794 of the total 34,698 families live below the poverty line. Families with 5 or more children have the highest poverty rate of 45.3%, comprising of 105 families. On the other hand, families with no children have the lowest poverty rate of 3.4%, which includes 748 families.
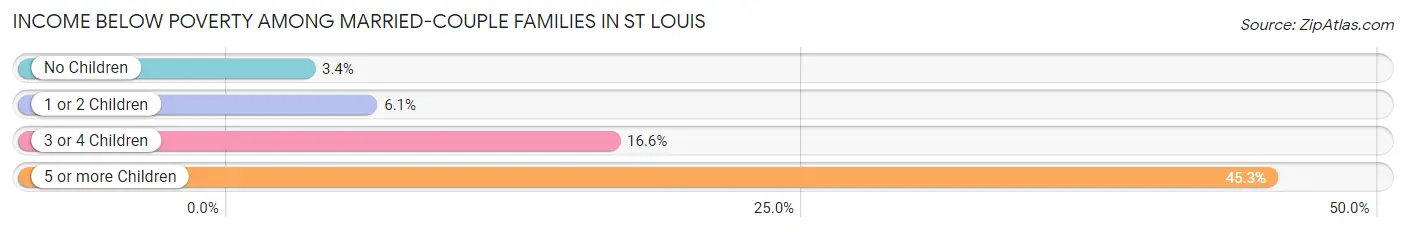
| Children | Above Poverty | Below Poverty |
| No Children | 21,603 (96.7%) | 748 (3.4%) |
| 1 or 2 Children | 9,545 (93.9%) | 616 (6.1%) |
| 3 or 4 Children | 1,629 (83.4%) | 325 (16.6%) |
| 5 or more Children | 127 (54.7%) | 105 (45.3%) |
| Total | 32,904 (94.8%) | 1,794 (5.2%) |
Income Below Poverty Among Single-Parent Households in St Louis
According to the poverty data in St Louis, 16.6% or 955 single-father households and 28.8% or 6,004 single-mother households are living below the poverty line. Among single-father households, those with 3 or 4 children have the highest poverty rate, with 156 households (43.4%) experiencing poverty. Likewise, among single-mother households, those with 5 or more children have the highest poverty rate, with 273 households (85.3%) falling below the poverty line.
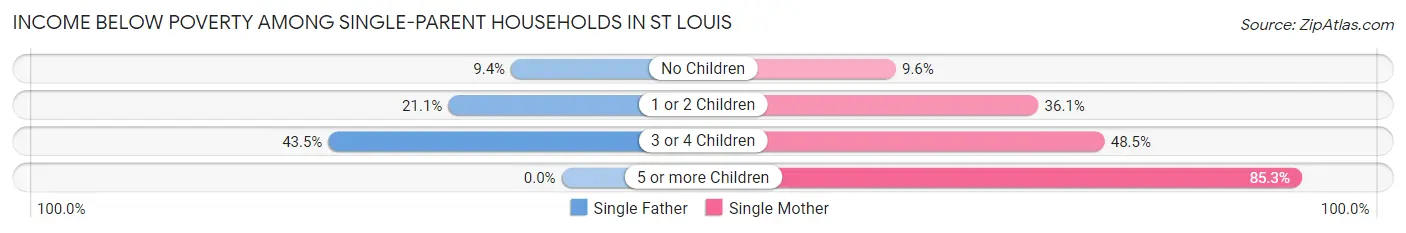
| Children | Single Father | Single Mother |
| No Children | 272 (9.4%) | 721 (9.6%) |
| 1 or 2 Children | 527 (21.1%) | 3,791 (36.1%) |
| 3 or 4 Children | 156 (43.4%) | 1,219 (48.4%) |
| 5 or more Children | 0 (0.0%) | 273 (85.3%) |
| Total | 955 (16.6%) | 6,004 (28.8%) |
Income Below Poverty Among Married-Couple vs Single-Parent Households in St Louis
The poverty data for St Louis shows that 1,794 of the married-couple family households (5.2%) and 6,959 of the single-parent households (26.2%) are living below the poverty level. Within the married-couple family households, those with 5 or more children have the highest poverty rate, with 105 households (45.3%) falling below the poverty line. Among the single-parent households, those with 5 or more children have the highest poverty rate, with 273 household (85.3%) living below poverty.
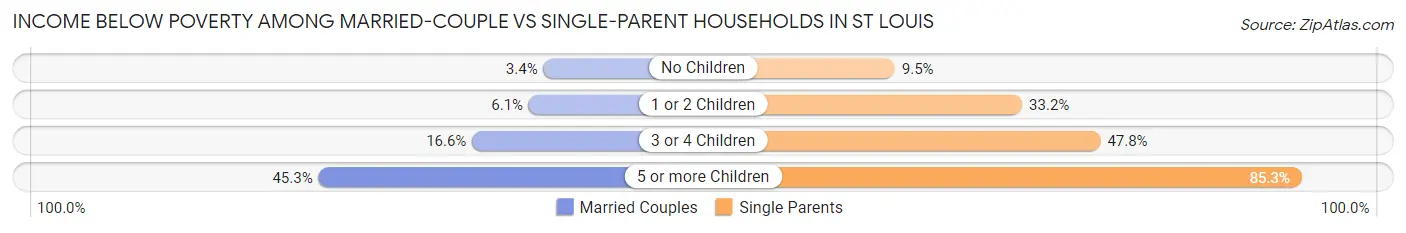
| Children | Married-Couple Families | Single-Parent Households |
| No Children | 748 (3.4%) | 993 (9.5%) |
| 1 or 2 Children | 616 (6.1%) | 4,318 (33.2%) |
| 3 or 4 Children | 325 (16.6%) | 1,375 (47.8%) |
| 5 or more Children | 105 (45.3%) | 273 (85.3%) |
| Total | 1,794 (5.2%) | 6,959 (26.2%) |
Race in St Louis
The most populous races in St Louis are White / Caucasian (137,897 | 46.3%), Black / African American (130,753 | 43.9%), and Two or more Races (14,039 | 4.7%).
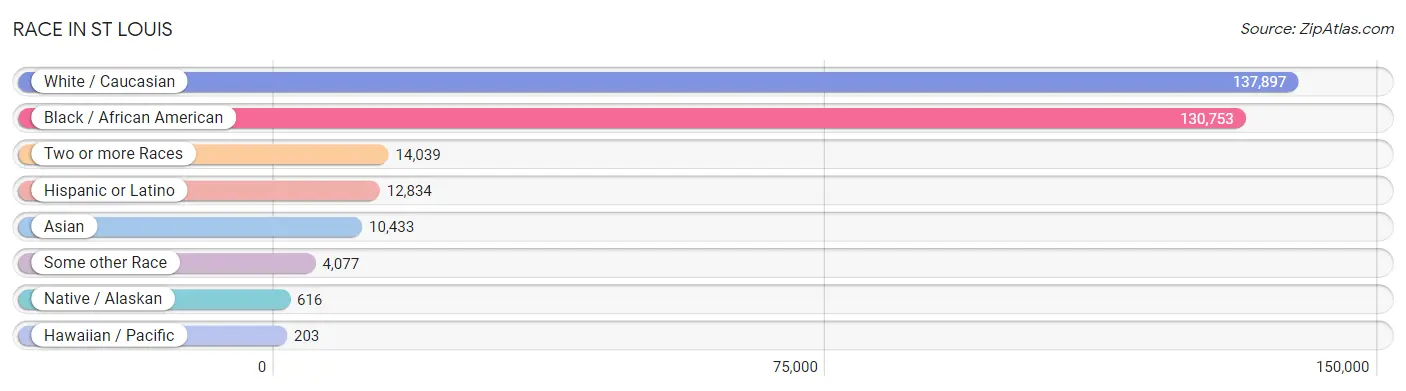
| Race | # Population | % Population |
| Asian | 10,433 | 3.5% |
| Black / African American | 130,753 | 43.9% |
| Hawaiian / Pacific | 203 | 0.1% |
| Hispanic or Latino | 12,834 | 4.3% |
| Native / Alaskan | 616 | 0.2% |
| White / Caucasian | 137,897 | 46.3% |
| Two or more Races | 14,039 | 4.7% |
| Some other Race | 4,077 | 1.4% |
| Total | 298,018 | 100.0% |
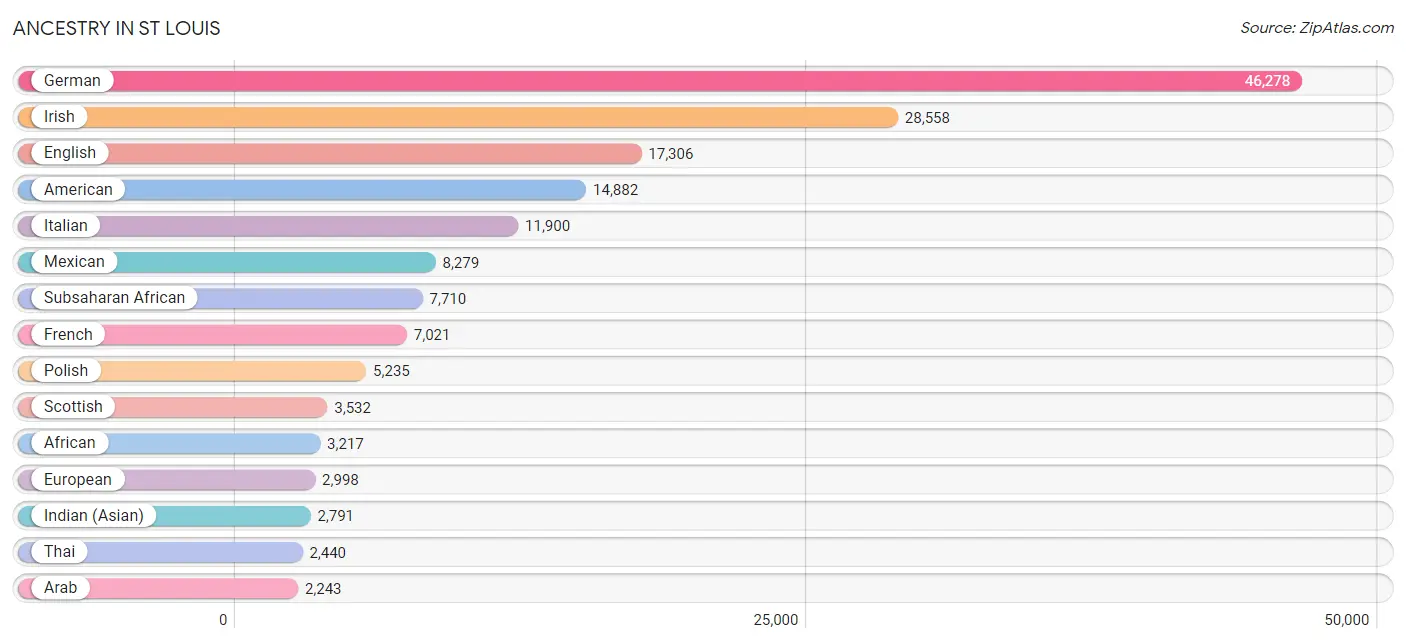
Ancestry in St Louis
The most populous ancestries reported in St Louis are German (46,278 | 15.5%), Irish (28,558 | 9.6%), English (17,306 | 5.8%), American (14,882 | 5.0%), and Italian (11,900 | 4.0%), together accounting for 39.9% of all St Louis residents.
| Ancestry | # Population | % Population |
| Afghan | 82 | 0.0% |
| African | 3,217 | 1.1% |
| Albanian | 386 | 0.1% |
| Alsatian | 17 | 0.0% |
| American | 14,882 | 5.0% |
| Arab | 2,243 | 0.7% |
| Argentinean | 70 | 0.0% |
| Armenian | 44 | 0.0% |
| Australian | 150 | 0.1% |
| Austrian | 593 | 0.2% |
| Bahamian | 29 | 0.0% |
| Belgian | 349 | 0.1% |
| Belizean | 7 | 0.0% |
| Bermudan | 18 | 0.0% |
| Bhutanese | 566 | 0.2% |
| Blackfeet | 277 | 0.1% |
| Bolivian | 62 | 0.0% |
| Brazilian | 104 | 0.0% |
| British | 1,452 | 0.5% |
| British West Indian | 55 | 0.0% |
| Bulgarian | 130 | 0.0% |
| Burmese | 1,103 | 0.4% |
| Cajun | 1 | 0.0% |
| Canadian | 248 | 0.1% |
| Cape Verdean | 23 | 0.0% |
| Celtic | 5 | 0.0% |
| Central American | 629 | 0.2% |
| Central American Indian | 196 | 0.1% |
| Cherokee | 1,268 | 0.4% |
| Chickasaw | 71 | 0.0% |
| Chilean | 32 | 0.0% |
| Chippewa | 61 | 0.0% |
| Choctaw | 156 | 0.1% |
| Colombian | 462 | 0.2% |
| Costa Rican | 33 | 0.0% |
| Creek | 29 | 0.0% |
| Croatian | 805 | 0.3% |
| Cuban | 471 | 0.2% |
| Cypriot | 8 | 0.0% |
| Czech | 1,078 | 0.4% |
| Czechoslovakian | 189 | 0.1% |
| Danish | 496 | 0.2% |
| Delaware | 7 | 0.0% |
| Dominican | 232 | 0.1% |
| Dutch | 2,145 | 0.7% |
| Eastern European | 661 | 0.2% |
| Ecuadorian | 140 | 0.1% |
| Egyptian | 44 | 0.0% |
| English | 17,306 | 5.8% |
| Ethiopian | 516 | 0.2% |
| European | 2,998 | 1.0% |
| Filipino | 266 | 0.1% |
| Finnish | 118 | 0.0% |
| French | 7,021 | 2.4% |
| French Canadian | 416 | 0.1% |
| German | 46,278 | 15.5% |
| German Russian | 10 | 0.0% |
| Ghanaian | 185 | 0.1% |
| Greek | 610 | 0.2% |
| Guamanian / Chamorro | 92 | 0.0% |
| Guatemalan | 161 | 0.1% |
| Guyanese | 5 | 0.0% |
| Haitian | 158 | 0.1% |
| Honduran | 177 | 0.1% |
| Houma | 6 | 0.0% |
| Hungarian | 680 | 0.2% |
| Icelander | 23 | 0.0% |
| Indian (Asian) | 2,791 | 0.9% |
| Indonesian | 413 | 0.1% |
| Iranian | 394 | 0.1% |
| Iraqi | 262 | 0.1% |
| Irish | 28,558 | 9.6% |
| Iroquois | 53 | 0.0% |
| Israeli | 248 | 0.1% |
| Italian | 11,900 | 4.0% |
| Jamaican | 192 | 0.1% |
| Japanese | 70 | 0.0% |
| Jordanian | 29 | 0.0% |
| Kenyan | 274 | 0.1% |
| Korean | 1,438 | 0.5% |
| Laotian | 14 | 0.0% |
| Latvian | 39 | 0.0% |
| Lebanese | 911 | 0.3% |
| Liberian | 231 | 0.1% |
| Lithuanian | 600 | 0.2% |
| Luxembourger | 32 | 0.0% |
| Macedonian | 36 | 0.0% |
| Malaysian | 182 | 0.1% |
| Maltese | 6 | 0.0% |
| Mexican | 8,279 | 2.8% |
| Mexican American Indian | 92 | 0.0% |
| Mongolian | 166 | 0.1% |
| Moroccan | 73 | 0.0% |
| Native Hawaiian | 100 | 0.0% |
| Navajo | 17 | 0.0% |
| New Zealander | 20 | 0.0% |
| Nicaraguan | 112 | 0.0% |
| Nigerian | 1,763 | 0.6% |
| Northern European | 256 | 0.1% |
| Norwegian | 1,552 | 0.5% |
| Osage | 9 | 0.0% |
| Pakistani | 198 | 0.1% |
| Palestinian | 88 | 0.0% |
| Panamanian | 56 | 0.0% |
| Pennsylvania German | 13 | 0.0% |
| Peruvian | 81 | 0.0% |
| Polish | 5,235 | 1.8% |
| Portuguese | 204 | 0.1% |
| Potawatomi | 40 | 0.0% |
| Puerto Rican | 725 | 0.2% |
| Romanian | 333 | 0.1% |
| Russian | 1,406 | 0.5% |
| Salvadoran | 50 | 0.0% |
| Samoan | 44 | 0.0% |
| Scandinavian | 768 | 0.3% |
| Scotch-Irish | 1,884 | 0.6% |
| Scottish | 3,532 | 1.2% |
| Serbian | 230 | 0.1% |
| Shoshone | 5 | 0.0% |
| Sierra Leonean | 119 | 0.0% |
| Sioux | 10 | 0.0% |
| Slavic | 76 | 0.0% |
| Slovak | 262 | 0.1% |
| Slovene | 201 | 0.1% |
| Somali | 1,164 | 0.4% |
| South African | 7 | 0.0% |
| South American | 1,245 | 0.4% |
| Spaniard | 447 | 0.2% |
| Spanish | 503 | 0.2% |
| Sri Lankan | 2,080 | 0.7% |
| Subsaharan African | 7,710 | 2.6% |
| Sudanese | 60 | 0.0% |
| Swedish | 1,622 | 0.5% |
| Swiss | 844 | 0.3% |
| Syrian | 441 | 0.2% |
| Thai | 2,440 | 0.8% |
| Trinidadian and Tobagonian | 95 | 0.0% |
| Turkish | 222 | 0.1% |
| Ukrainian | 365 | 0.1% |
| Uruguayan | 38 | 0.0% |
| Ute | 7 | 0.0% |
| Venezuelan | 360 | 0.1% |
| Welsh | 1,000 | 0.3% |
| West Indian | 185 | 0.1% |
| Yugoslavian | 1,243 | 0.4% | View All 145 Rows |
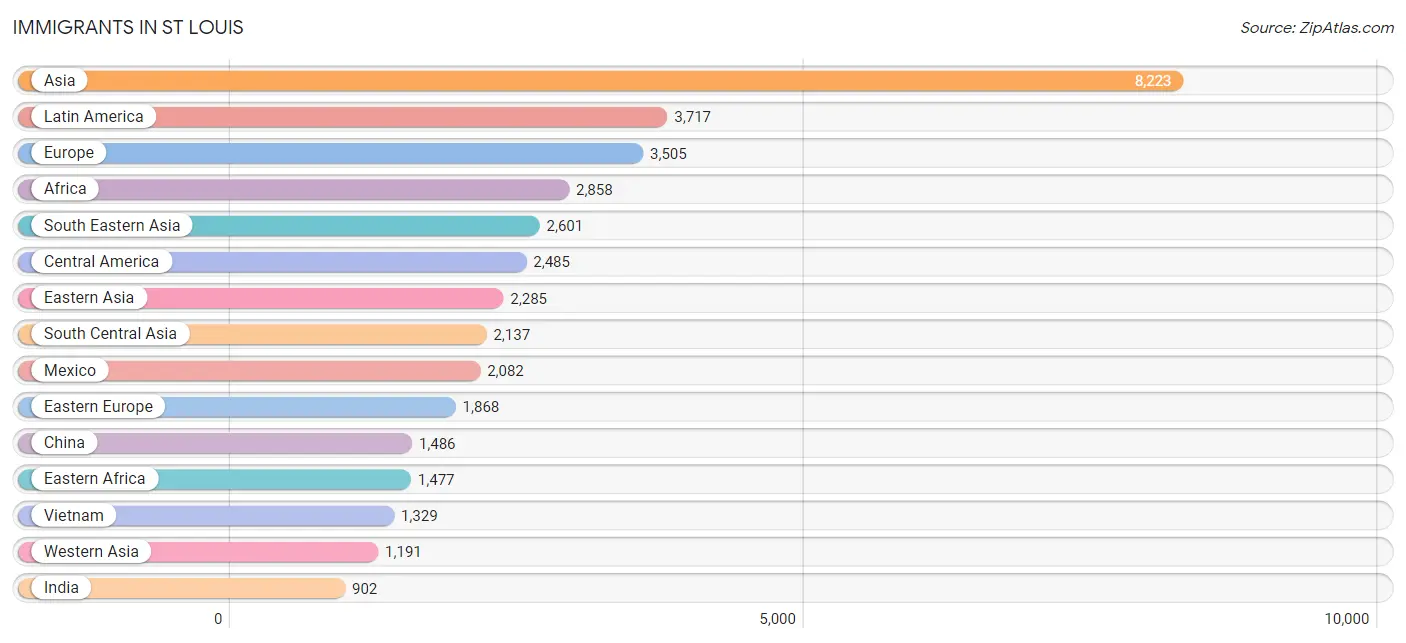
Immigrants in St Louis
The most numerous immigrant groups reported in St Louis came from Asia (8,223 | 2.8%), Latin America (3,717 | 1.3%), Europe (3,505 | 1.2%), Africa (2,858 | 1.0%), and South Eastern Asia (2,601 | 0.9%), together accounting for 7.0% of all St Louis residents.
| Immigration Origin | # Population | % Population |
| Afghanistan | 106 | 0.0% |
| Africa | 2,858 | 1.0% |
| Albania | 199 | 0.1% |
| Argentina | 14 | 0.0% |
| Asia | 8,223 | 2.8% |
| Australia | 92 | 0.0% |
| Austria | 67 | 0.0% |
| Bahamas | 65 | 0.0% |
| Belarus | 40 | 0.0% |
| Belgium | 36 | 0.0% |
| Bolivia | 18 | 0.0% |
| Bosnia and Herzegovina | 832 | 0.3% |
| Brazil | 142 | 0.1% |
| Bulgaria | 103 | 0.0% |
| Cambodia | 13 | 0.0% |
| Cameroon | 35 | 0.0% |
| Canada | 439 | 0.2% |
| Caribbean | 494 | 0.2% |
| Central America | 2,485 | 0.8% |
| Chile | 5 | 0.0% |
| China | 1,486 | 0.5% |
| Colombia | 299 | 0.1% |
| Congo | 168 | 0.1% |
| Costa Rica | 14 | 0.0% |
| Croatia | 56 | 0.0% |
| Cuba | 193 | 0.1% |
| Denmark | 10 | 0.0% |
| Eastern Africa | 1,477 | 0.5% |
| Eastern Asia | 2,285 | 0.8% |
| Eastern Europe | 1,868 | 0.6% |
| Ecuador | 44 | 0.0% |
| Egypt | 57 | 0.0% |
| El Salvador | 43 | 0.0% |
| England | 185 | 0.1% |
| Eritrea | 23 | 0.0% |
| Ethiopia | 285 | 0.1% |
| Europe | 3,505 | 1.2% |
| France | 213 | 0.1% |
| Germany | 429 | 0.1% |
| Ghana | 44 | 0.0% |
| Greece | 7 | 0.0% |
| Grenada | 39 | 0.0% |
| Guatemala | 171 | 0.1% |
| Haiti | 67 | 0.0% |
| Honduras | 96 | 0.0% |
| Hong Kong | 9 | 0.0% |
| Hungary | 21 | 0.0% |
| India | 902 | 0.3% |
| Indonesia | 14 | 0.0% |
| Iran | 340 | 0.1% |
| Iraq | 351 | 0.1% |
| Ireland | 21 | 0.0% |
| Israel | 151 | 0.1% |
| Italy | 251 | 0.1% |
| Jamaica | 89 | 0.0% |
| Japan | 229 | 0.1% |
| Jordan | 89 | 0.0% |
| Kazakhstan | 7 | 0.0% |
| Kenya | 524 | 0.2% |
| Korea | 570 | 0.2% |
| Laos | 149 | 0.1% |
| Latin America | 3,717 | 1.3% |
| Latvia | 12 | 0.0% |
| Lebanon | 58 | 0.0% |
| Liberia | 124 | 0.0% |
| Malaysia | 44 | 0.0% |
| Mexico | 2,082 | 0.7% |
| Middle Africa | 257 | 0.1% |
| Moldova | 29 | 0.0% |
| Morocco | 67 | 0.0% |
| Nepal | 194 | 0.1% |
| Netherlands | 72 | 0.0% |
| Nicaragua | 29 | 0.0% |
| Nigeria | 350 | 0.1% |
| North Macedonia | 34 | 0.0% |
| Northern Africa | 303 | 0.1% |
| Northern Europe | 431 | 0.1% |
| Norway | 32 | 0.0% |
| Oceania | 119 | 0.0% |
| Pakistan | 197 | 0.1% |
| Panama | 50 | 0.0% |
| Peru | 59 | 0.0% |
| Philippines | 674 | 0.2% |
| Poland | 161 | 0.1% |
| Romania | 142 | 0.1% |
| Russia | 67 | 0.0% |
| Saudi Arabia | 192 | 0.1% |
| Scotland | 80 | 0.0% |
| Serbia | 45 | 0.0% |
| Sierra Leone | 72 | 0.0% |
| Somalia | 566 | 0.2% |
| South Africa | 18 | 0.0% |
| South America | 738 | 0.3% |
| South Central Asia | 2,137 | 0.7% |
| South Eastern Asia | 2,601 | 0.9% |
| Southern Europe | 389 | 0.1% |
| Spain | 131 | 0.0% |
| Sri Lanka | 59 | 0.0% |
| Sudan | 98 | 0.0% |
| Syria | 304 | 0.1% |
| Taiwan | 220 | 0.1% |
| Thailand | 177 | 0.1% |
| Trinidad and Tobago | 41 | 0.0% |
| Turkey | 28 | 0.0% |
| Ukraine | 28 | 0.0% |
| Venezuela | 157 | 0.1% |
| Vietnam | 1,329 | 0.4% |
| Western Africa | 744 | 0.3% |
| Western Asia | 1,191 | 0.4% |
| Western Europe | 817 | 0.3% |
| Zaire | 54 | 0.0% |
| Zimbabwe | 10 | 0.0% | View All 112 Rows |
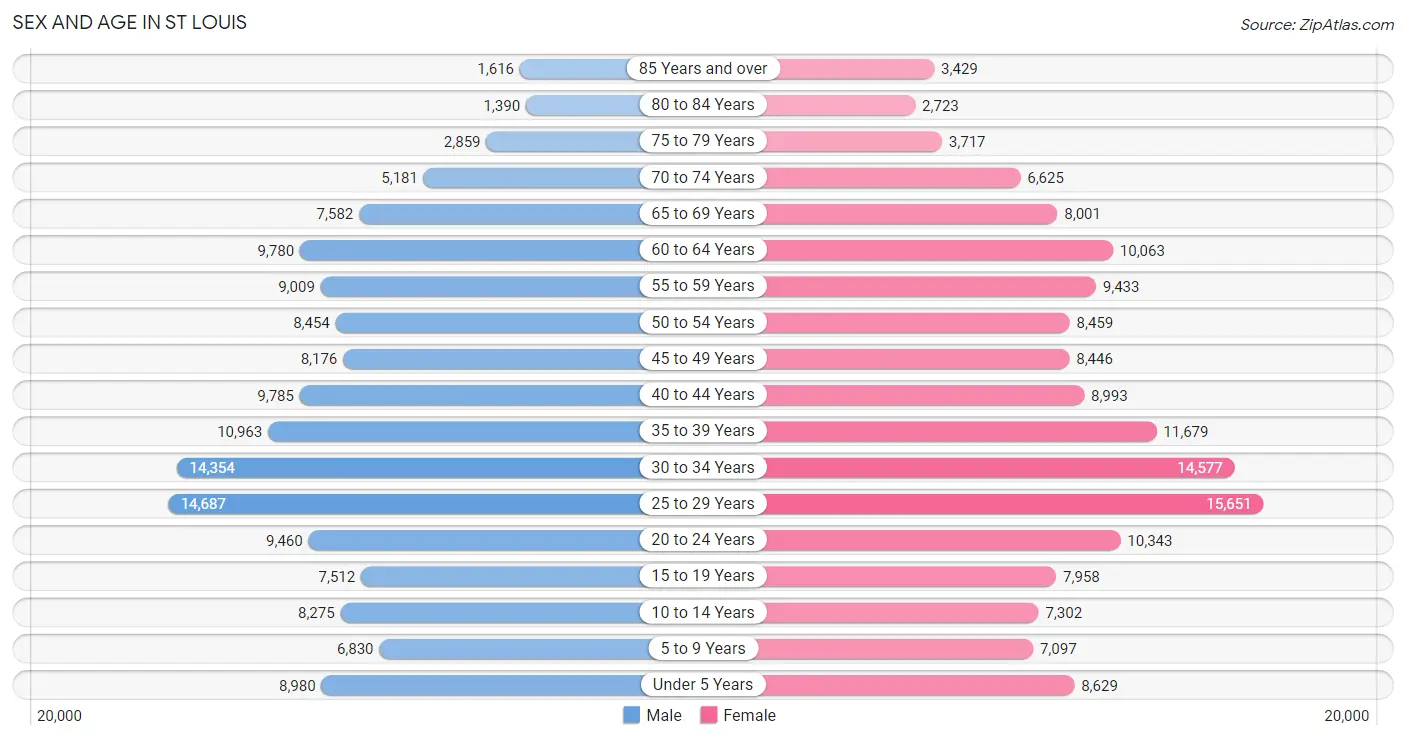
Sex and Age in St Louis
Sex and Age in St Louis
The most populous age groups in St Louis are 25 to 29 Years (14,687 | 10.1%) for men and 25 to 29 Years (15,651 | 10.2%) for women.
| Age Bracket | Male | Female |
| Under 5 Years | 8,980 (6.2%) | 8,629 (5.6%) |
| 5 to 9 Years | 6,830 (4.7%) | 7,097 (4.6%) |
| 10 to 14 Years | 8,275 (5.7%) | 7,302 (4.8%) |
| 15 to 19 Years | 7,512 (5.2%) | 7,958 (5.2%) |
| 20 to 24 Years | 9,460 (6.5%) | 10,343 (6.8%) |
| 25 to 29 Years | 14,687 (10.1%) | 15,651 (10.2%) |
| 30 to 34 Years | 14,354 (9.9%) | 14,577 (9.5%) |
| 35 to 39 Years | 10,963 (7.6%) | 11,679 (7.6%) |
| 40 to 44 Years | 9,785 (6.8%) | 8,993 (5.9%) |
| 45 to 49 Years | 8,176 (5.6%) | 8,446 (5.5%) |
| 50 to 54 Years | 8,454 (5.8%) | 8,459 (5.5%) |
| 55 to 59 Years | 9,009 (6.2%) | 9,433 (6.2%) |
| 60 to 64 Years | 9,780 (6.8%) | 10,063 (6.6%) |
| 65 to 69 Years | 7,582 (5.2%) | 8,001 (5.2%) |
| 70 to 74 Years | 5,181 (3.6%) | 6,625 (4.3%) |
| 75 to 79 Years | 2,859 (2.0%) | 3,717 (2.4%) |
| 80 to 84 Years | 1,390 (1.0%) | 2,723 (1.8%) |
| 85 Years and over | 1,616 (1.1%) | 3,429 (2.2%) |
| Total | 144,893 (100.0%) | 153,125 (100.0%) |
Families and Households in St Louis
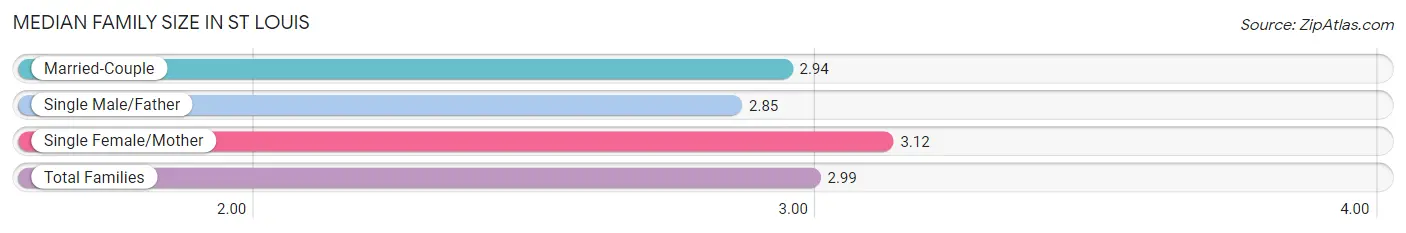
Median Family Size in St Louis
The median family size in St Louis is 2.99 persons per family, with single female/mother families (20,862 | 34.0%) accounting for the largest median family size of 3.12 persons per family. On the other hand, single male/father families (5,743 | 9.4%) represent the smallest median family size with 2.85 persons per family.
| Family Type | # Families | Family Size |
| Married-Couple | 34,698 (56.6%) | 2.94 |
| Single Male/Father | 5,743 (9.4%) | 2.85 |
| Single Female/Mother | 20,862 (34.0%) | 3.12 |
| Total Families | 61,303 (100.0%) | 2.99 |
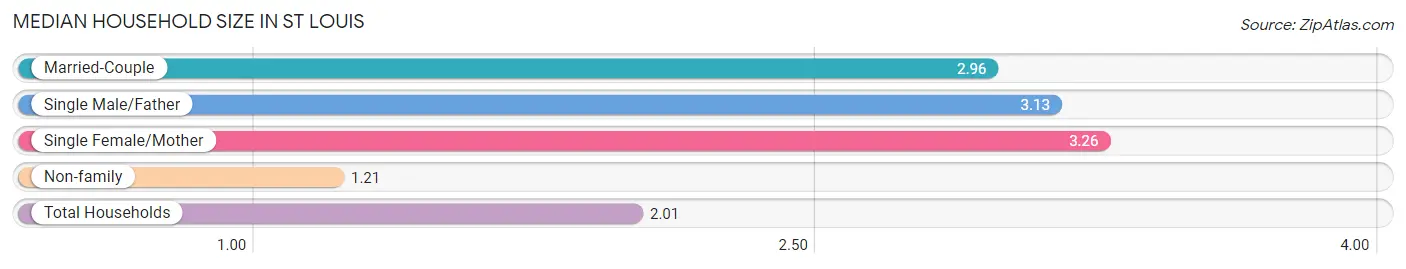
Median Household Size in St Louis
The median household size in St Louis is 2.01 persons per household, with single female/mother households (20,862 | 14.6%) accounting for the largest median household size of 3.26 persons per household. non-family households (81,756 | 57.2%) represent the smallest median household size with 1.21 persons per household.
| Household Type | # Households | Household Size |
| Married-Couple | 34,698 (24.2%) | 2.96 |
| Single Male/Father | 5,743 (4.0%) | 3.13 |
| Single Female/Mother | 20,862 (14.6%) | 3.26 |
| Non-family | 81,756 (57.2%) | 1.21 |
| Total Households | 143,059 (100.0%) | 2.01 |
Household Size by Marriage Status in St Louis
Out of a total of 143,059 households in St Louis, 61,303 (42.8%) are family households, while 81,756 (57.2%) are nonfamily households. The most numerous type of family households are 2-person households, comprising 30,677, and the most common type of nonfamily households are 1-person households, comprising 68,049.
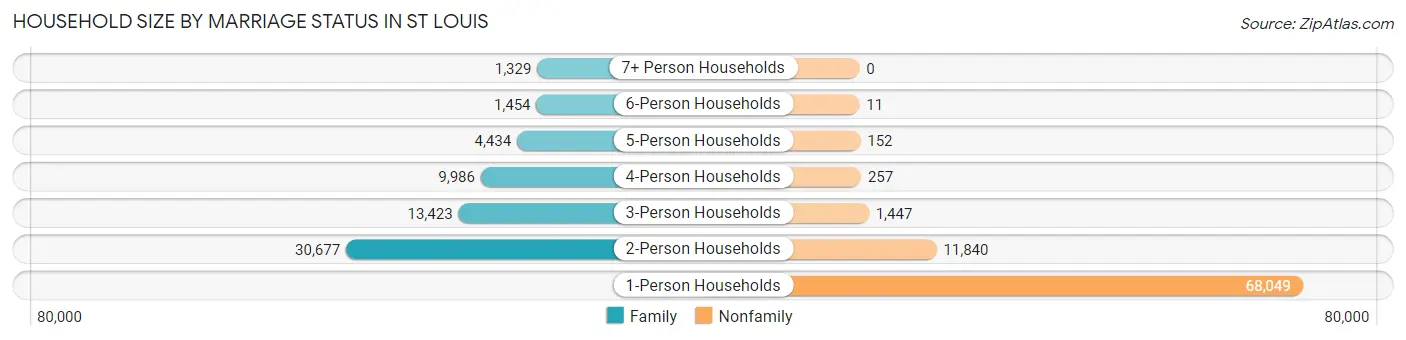
| Household Size | Family Households | Nonfamily Households |
| 1-Person Households | - | 68,049 (47.6%) |
| 2-Person Households | 30,677 (21.4%) | 11,840 (8.3%) |
| 3-Person Households | 13,423 (9.4%) | 1,447 (1.0%) |
| 4-Person Households | 9,986 (7.0%) | 257 (0.2%) |
| 5-Person Households | 4,434 (3.1%) | 152 (0.1%) |
| 6-Person Households | 1,454 (1.0%) | 11 (0.0%) |
| 7+ Person Households | 1,329 (0.9%) | 0 (0.0%) |
| Total | 61,303 (42.8%) | 81,756 (57.2%) |
Female Fertility in St Louis
Fertility by Age in St Louis
Average fertility rate in St Louis is 43.0 births per 1,000 women. Women in the age bracket of 20 to 34 years have the highest fertility rate with 65.0 births per 1,000 women. Women in the age bracket of 20 to 34 years acount for 76.4% of all women with births.
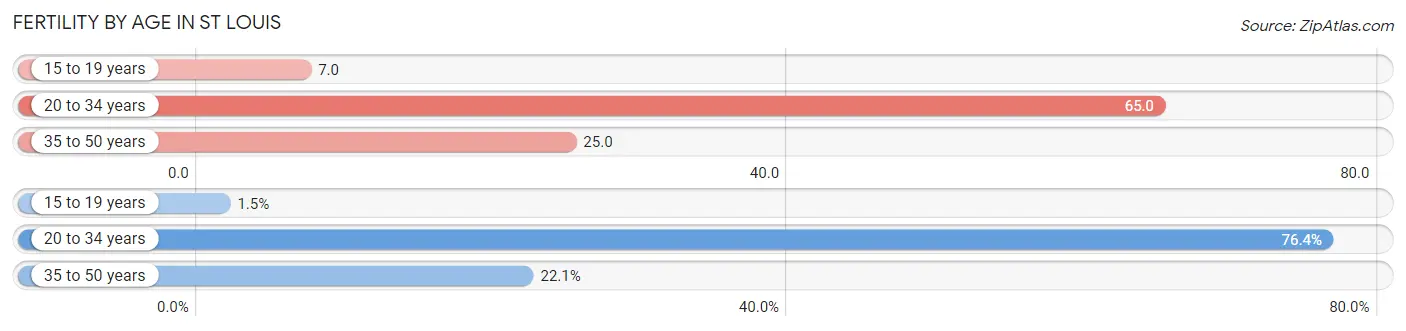
| Age Bracket | Women with Births | Births / 1,000 Women |
| 15 to 19 years | 52 (1.5%) | 7.0 |
| 20 to 34 years | 2,618 (76.4%) | 65.0 |
| 35 to 50 years | 757 (22.1%) | 25.0 |
| Total | 3,427 (100.0%) | 43.0 |
Fertility by Age by Marriage Status in St Louis
54.2% of women with births (3,427) in St Louis are married. The highest percentage of unmarried women with births falls into 15 to 19 years age bracket with 100.0% of them unmarried at the time of birth, while the lowest percentage of unmarried women with births belong to 35 to 50 years age bracket with 26.9% of them unmarried.
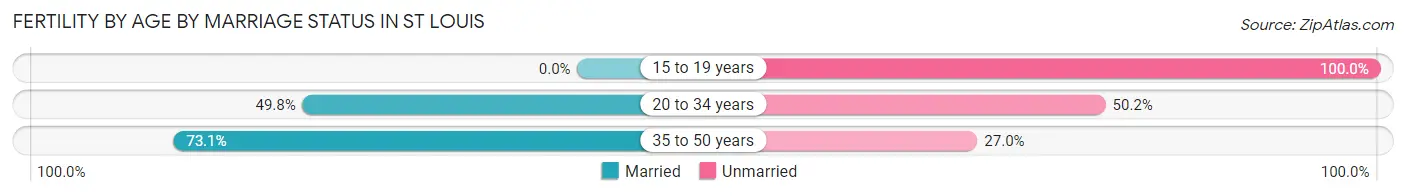
| Age Bracket | Married | Unmarried |
| 15 to 19 years | 0 (0.0%) | 52 (100.0%) |
| 20 to 34 years | 1,304 (49.8%) | 1,314 (50.2%) |
| 35 to 50 years | 553 (73.1%) | 204 (27.0%) |
| Total | 1,857 (54.2%) | 1,570 (45.8%) |
Fertility by Education in St Louis
Average fertility rate in St Louis is 43.0 births per 1,000 women. Women with the education attainment of graduate degree have the highest fertility rate of 55.0 births per 1,000 women, while women with the education attainment of high school diploma have the lowest fertility at 36.0 births per 1,000 women. Women with the education attainment of college or associate's degree represent 27.5% of all women with births.
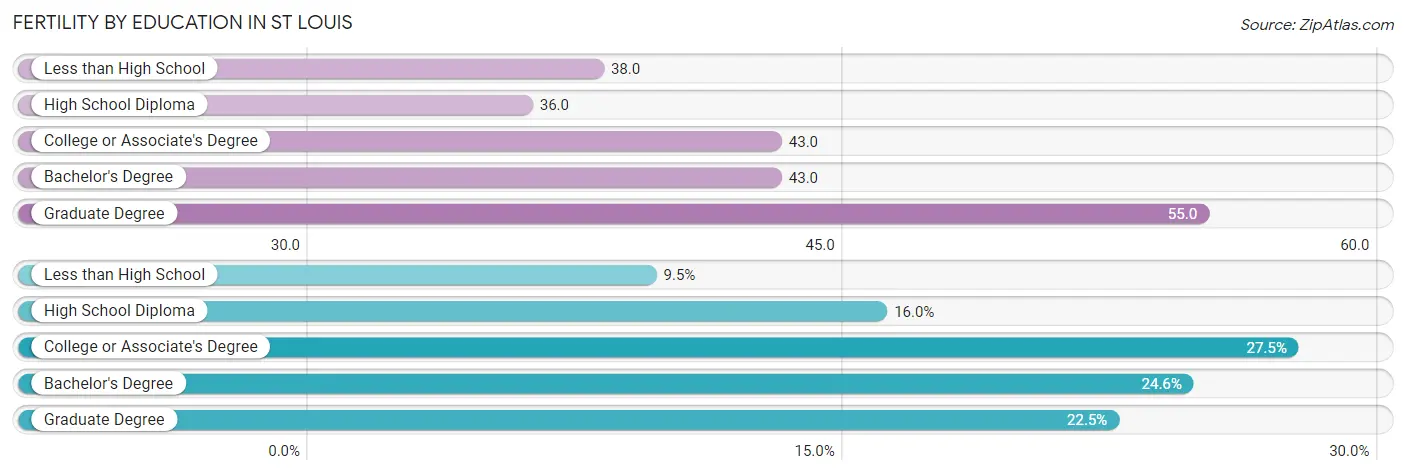
| Educational Attainment | Women with Births | Births / 1,000 Women |
| Less than High School | 325 (9.5%) | 38.0 |
| High School Diploma | 547 (16.0%) | 36.0 |
| College or Associate's Degree | 943 (27.5%) | 43.0 |
| Bachelor's Degree | 842 (24.6%) | 43.0 |
| Graduate Degree | 770 (22.5%) | 55.0 |
| Total | 3,427 (100.0%) | 43.0 |
Fertility by Education by Marriage Status in St Louis
45.8% of women with births in St Louis are unmarried. Women with the educational attainment of graduate degree are most likely to be married with 89.3% of them married at childbirth, while women with the educational attainment of high school diploma are least likely to be married with 86.5% of them unmarried at childbirth.
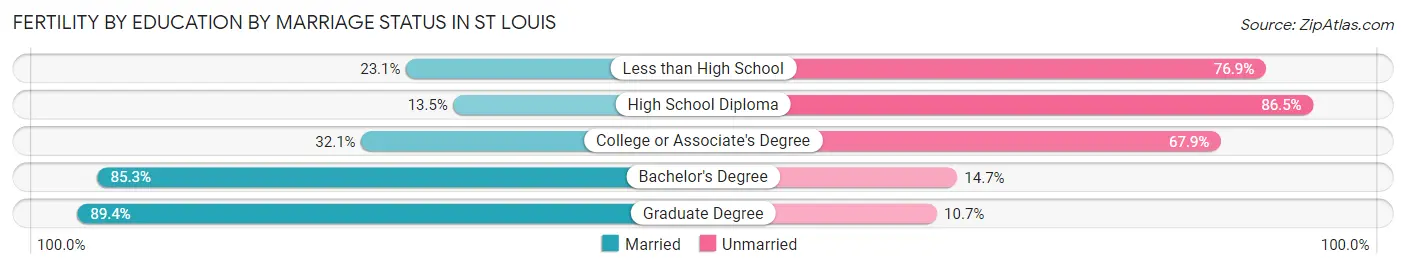
| Educational Attainment | Married | Unmarried |
| Less than High School | 75 (23.1%) | 250 (76.9%) |
| High School Diploma | 74 (13.5%) | 473 (86.5%) |
| College or Associate's Degree | 303 (32.1%) | 640 (67.9%) |
| Bachelor's Degree | 718 (85.3%) | 124 (14.7%) |
| Graduate Degree | 688 (89.3%) | 82 (10.6%) |
| Total | 1,857 (54.2%) | 1,570 (45.8%) |
Employment Characteristics in St Louis
Employment by Class of Employer in St Louis
Among the 151,829 employed individuals in St Louis, private company employees (98,987 | 65.2%), not-for-profit organizations (25,684 | 16.9%), and local government employees (8,451 | 5.6%) make up the most common classes of employment.
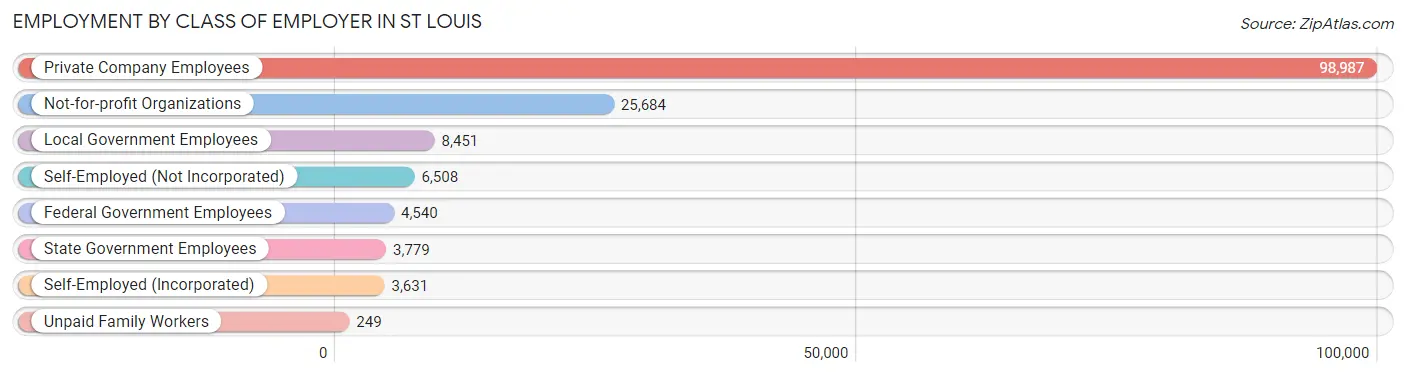
| Employer Class | # Employees | % Employees |
| Private Company Employees | 98,987 | 65.2% |
| Self-Employed (Incorporated) | 3,631 | 2.4% |
| Self-Employed (Not Incorporated) | 6,508 | 4.3% |
| Not-for-profit Organizations | 25,684 | 16.9% |
| Local Government Employees | 8,451 | 5.6% |
| State Government Employees | 3,779 | 2.5% |
| Federal Government Employees | 4,540 | 3.0% |
| Unpaid Family Workers | 249 | 0.2% |
| Total | 151,829 | 100.0% |
Employment Status by Age in St Louis
According to the labor force statistics for St Louis, out of the total population over 16 years of age (248,226), 66.2% or 164,326 individuals are in the labor force, with 5.4% or 8,874 of them unemployed. The age group with the highest labor force participation rate is 30 to 34 years, with 89.3% or 25,835 individuals in the labor force. Within the labor force, the 16 to 19 years age range has the highest percentage of unemployed individuals, with 17.0% or 850 of them being unemployed.
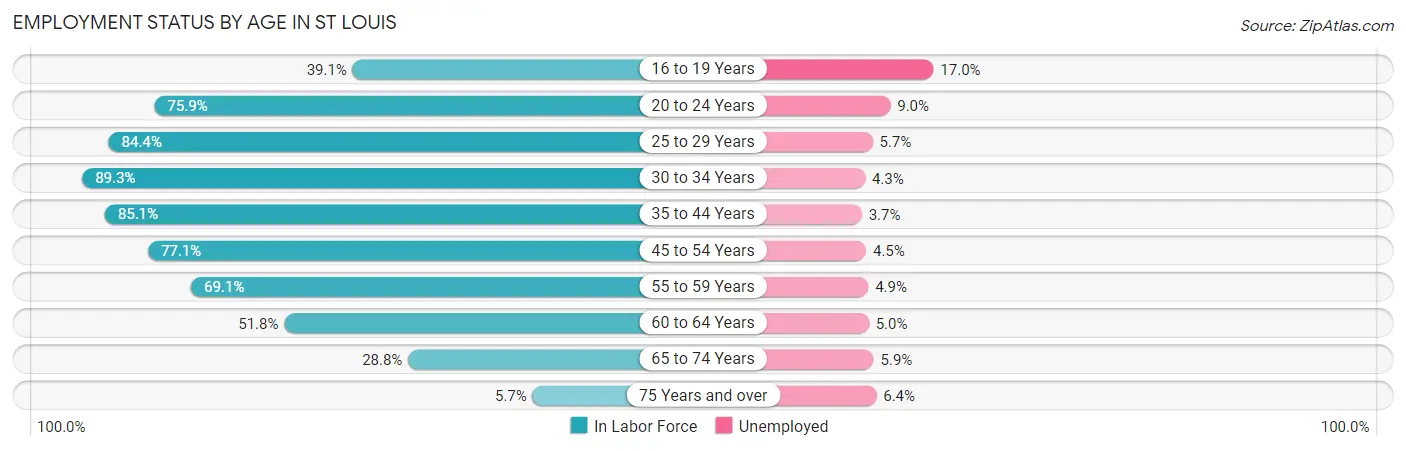
| Age Bracket | In Labor Force | Unemployed |
| 16 to 19 Years | 5,001 (39.1%) | 850 (17.0%) |
| 20 to 24 Years | 15,030 (75.9%) | 1,353 (9.0%) |
| 25 to 29 Years | 25,605 (84.4%) | 1,459 (5.7%) |
| 30 to 34 Years | 25,835 (89.3%) | 1,111 (4.3%) |
| 35 to 44 Years | 35,248 (85.1%) | 1,304 (3.7%) |
| 45 to 54 Years | 25,855 (77.1%) | 1,163 (4.5%) |
| 55 to 59 Years | 12,743 (69.1%) | 624 (4.9%) |
| 60 to 64 Years | 10,279 (51.8%) | 514 (5.0%) |
| 65 to 74 Years | 7,888 (28.8%) | 465 (5.9%) |
| 75 Years and over | 897 (5.7%) | 57 (6.4%) |
| Total | 164,326 (66.2%) | 8,874 (5.4%) |
Employment Status by Educational Attainment in St Louis
According to labor force statistics for St Louis, 78.6% of individuals (135,592) out of the total population between 25 and 64 years of age (172,509) are in the labor force, with 4.6% or 6,237 of them being unemployed. The group with the highest labor force participation rate are those with the educational attainment of bachelor's degree or higher, with 90.6% or 65,059 individuals in the labor force. Within the labor force, individuals with less than high school education have the highest percentage of unemployment, with 11.9% or 903 of them being unemployed.
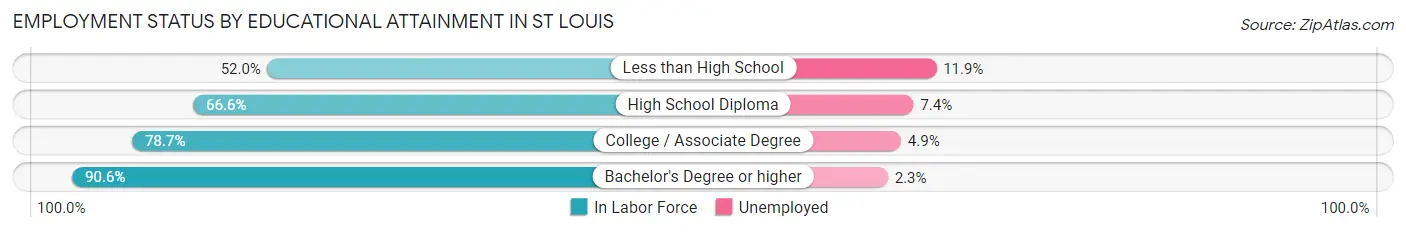
| Educational Attainment | In Labor Force | Unemployed |
| Less than High School | 7,587 (52.0%) | 1,736 (11.9%) |
| High School Diploma | 26,973 (66.6%) | 2,997 (7.4%) |
| College / Associate Degree | 35,894 (78.7%) | 2,235 (4.9%) |
| Bachelor's Degree or higher | 65,059 (90.6%) | 1,652 (2.3%) |
| Total | 135,592 (78.6%) | 7,935 (4.6%) |
Employment Occupations by Sex in St Louis
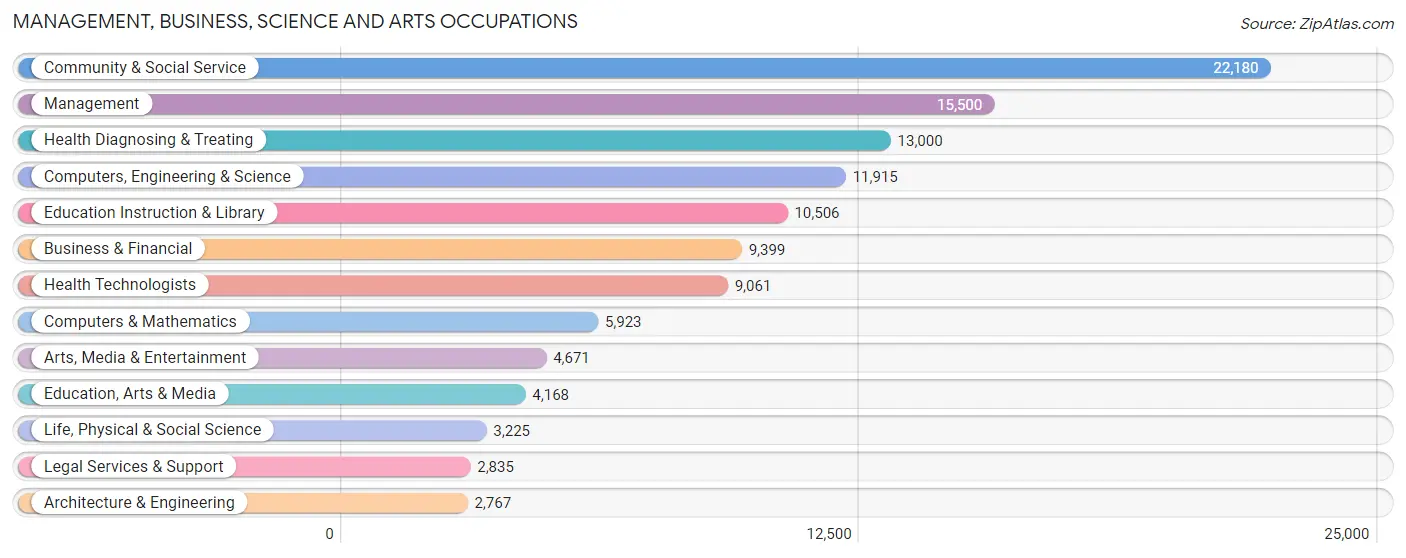
Management, Business, Science and Arts Occupations
The most common Management, Business, Science and Arts occupations in St Louis are Community & Social Service (22,180 | 14.3%), Management (15,500 | 10.0%), Health Diagnosing & Treating (13,000 | 8.4%), Computers, Engineering & Science (11,915 | 7.7%), and Education Instruction & Library (10,506 | 6.8%).
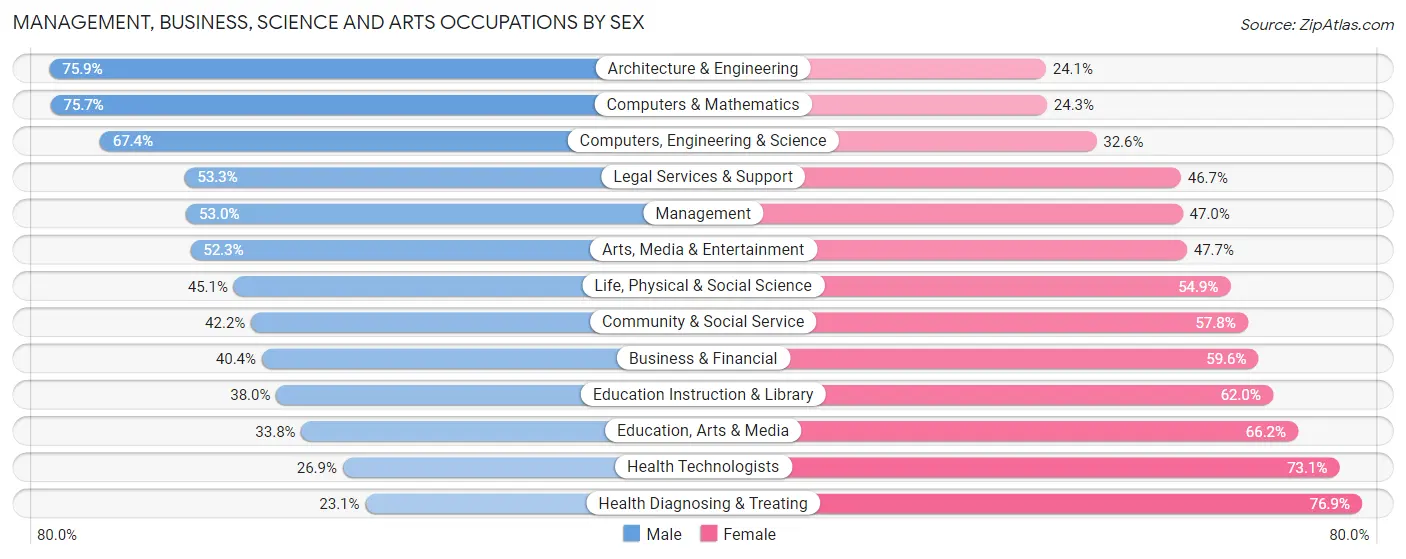
Management, Business, Science and Arts Occupations by Sex
Within the Management, Business, Science and Arts occupations in St Louis, the most male-oriented occupations are Architecture & Engineering (75.9%), Computers & Mathematics (75.7%), and Computers, Engineering & Science (67.4%), while the most female-oriented occupations are Health Diagnosing & Treating (76.9%), Health Technologists (73.1%), and Education, Arts & Media (66.2%).
| Occupation | Male | Female |
| Management | 8,219 (53.0%) | 7,281 (47.0%) |
| Business & Financial | 3,798 (40.4%) | 5,601 (59.6%) |
| Computers, Engineering & Science | 8,036 (67.4%) | 3,879 (32.6%) |
| Computers & Mathematics | 4,483 (75.7%) | 1,440 (24.3%) |
| Architecture & Engineering | 2,099 (75.9%) | 668 (24.1%) |
| Life, Physical & Social Science | 1,454 (45.1%) | 1,771 (54.9%) |
| Community & Social Service | 9,358 (42.2%) | 12,822 (57.8%) |
| Education, Arts & Media | 1,409 (33.8%) | 2,759 (66.2%) |
| Legal Services & Support | 1,512 (53.3%) | 1,323 (46.7%) |
| Education Instruction & Library | 3,992 (38.0%) | 6,514 (62.0%) |
| Arts, Media & Entertainment | 2,445 (52.3%) | 2,226 (47.7%) |
| Health Diagnosing & Treating | 3,007 (23.1%) | 9,993 (76.9%) |
| Health Technologists | 2,437 (26.9%) | 6,624 (73.1%) |
| Total (Category) | 32,418 (45.0%) | 39,576 (55.0%) |
| Total (Overall) | 75,984 (49.1%) | 78,705 (50.9%) |
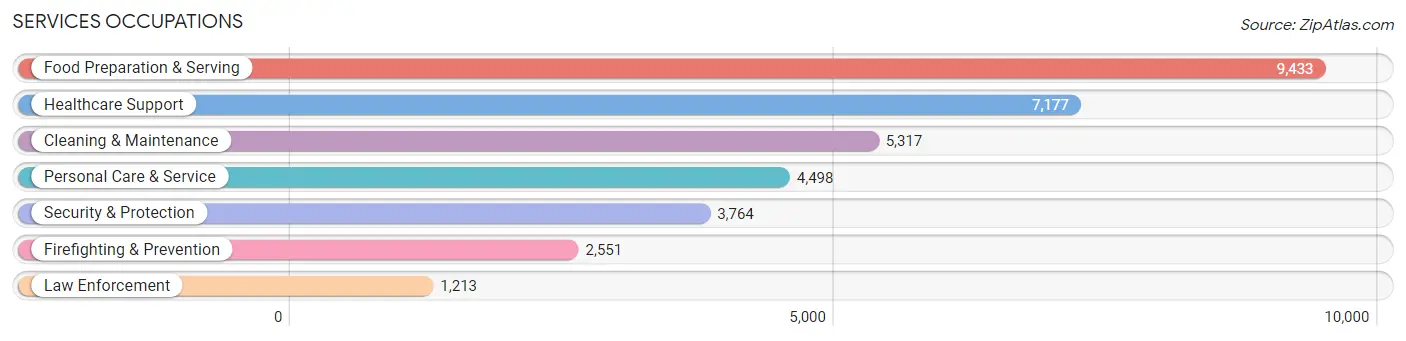
Services Occupations
The most common Services occupations in St Louis are Food Preparation & Serving (9,433 | 6.1%), Healthcare Support (7,177 | 4.6%), Cleaning & Maintenance (5,317 | 3.4%), Personal Care & Service (4,498 | 2.9%), and Security & Protection (3,764 | 2.4%).
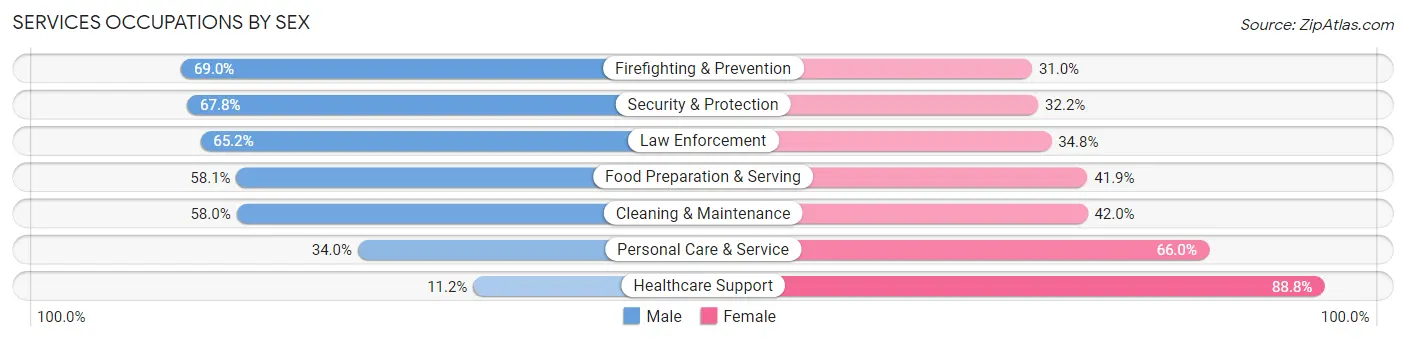
Services Occupations by Sex
Within the Services occupations in St Louis, the most male-oriented occupations are Firefighting & Prevention (69.0%), Security & Protection (67.8%), and Law Enforcement (65.2%), while the most female-oriented occupations are Healthcare Support (88.8%), Personal Care & Service (66.0%), and Cleaning & Maintenance (42.0%).
| Occupation | Male | Female |
| Healthcare Support | 802 (11.2%) | 6,375 (88.8%) |
| Security & Protection | 2,552 (67.8%) | 1,212 (32.2%) |
| Firefighting & Prevention | 1,761 (69.0%) | 790 (31.0%) |
| Law Enforcement | 791 (65.2%) | 422 (34.8%) |
| Food Preparation & Serving | 5,477 (58.1%) | 3,956 (41.9%) |
| Cleaning & Maintenance | 3,086 (58.0%) | 2,231 (42.0%) |
| Personal Care & Service | 1,530 (34.0%) | 2,968 (66.0%) |
| Total (Category) | 13,447 (44.5%) | 16,742 (55.5%) |
| Total (Overall) | 75,984 (49.1%) | 78,705 (50.9%) |
Sales and Office Occupations
The most common Sales and Office occupations in St Louis are Office & Administration (15,440 | 10.0%), and Sales & Related (12,356 | 8.0%).

Sales and Office Occupations by Sex
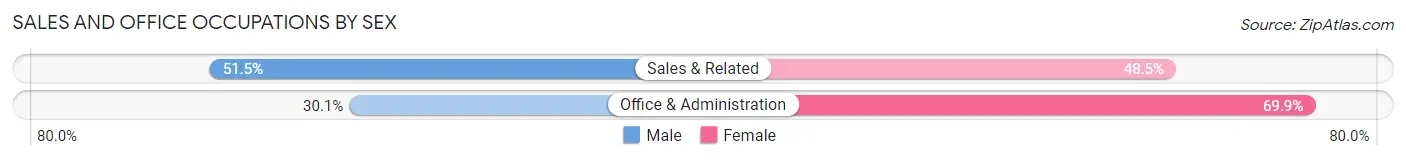
| Occupation | Male | Female |
| Sales & Related | 6,363 (51.5%) | 5,993 (48.5%) |
| Office & Administration | 4,643 (30.1%) | 10,797 (69.9%) |
| Total (Category) | 11,006 (39.6%) | 16,790 (60.4%) |
| Total (Overall) | 75,984 (49.1%) | 78,705 (50.9%) |
Natural Resources, Construction and Maintenance Occupations
The most common Natural Resources, Construction and Maintenance occupations in St Louis are Construction & Extraction (4,538 | 2.9%), Installation, Maintenance & Repair (2,624 | 1.7%), and Farming, Fishing & Forestry (193 | 0.1%).

Natural Resources, Construction and Maintenance Occupations by Sex
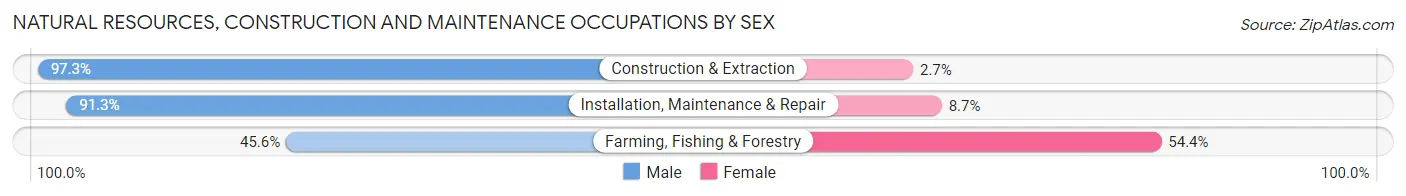
| Occupation | Male | Female |
| Farming, Fishing & Forestry | 88 (45.6%) | 105 (54.4%) |
| Construction & Extraction | 4,414 (97.3%) | 124 (2.7%) |
| Installation, Maintenance & Repair | 2,396 (91.3%) | 228 (8.7%) |
| Total (Category) | 6,898 (93.8%) | 457 (6.2%) |
| Total (Overall) | 75,984 (49.1%) | 78,705 (50.9%) |
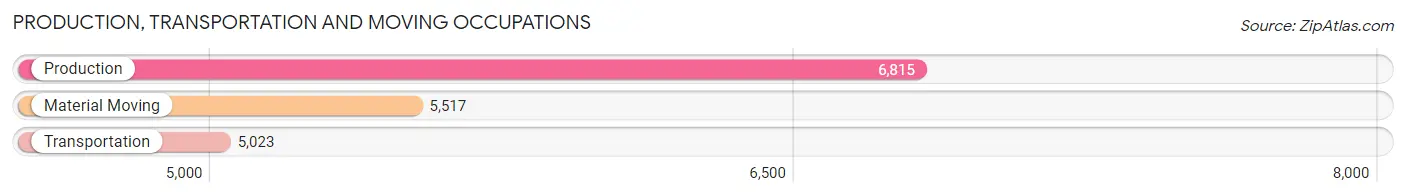
Production, Transportation and Moving Occupations
The most common Production, Transportation and Moving occupations in St Louis are Production (6,815 | 4.4%), Material Moving (5,517 | 3.6%), and Transportation (5,023 | 3.3%).
Production, Transportation and Moving Occupations by Sex
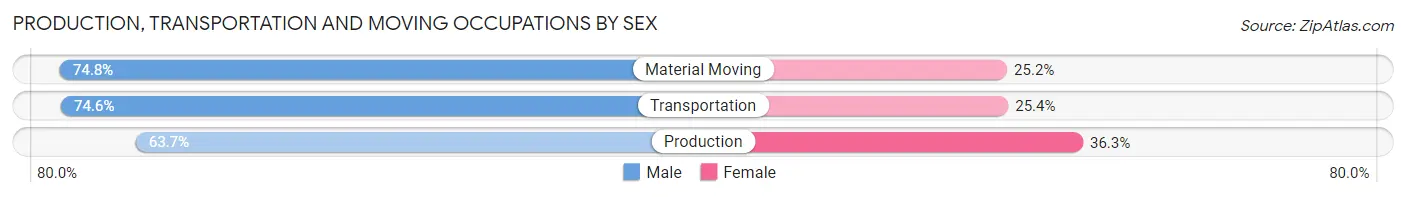
| Occupation | Male | Female |
| Production | 4,339 (63.7%) | 2,476 (36.3%) |
| Transportation | 3,749 (74.6%) | 1,274 (25.4%) |
| Material Moving | 4,127 (74.8%) | 1,390 (25.2%) |
| Total (Category) | 12,215 (70.4%) | 5,140 (29.6%) |
| Total (Overall) | 75,984 (49.1%) | 78,705 (50.9%) |
Employment Industries by Sex in St Louis
Employment Industries in St Louis
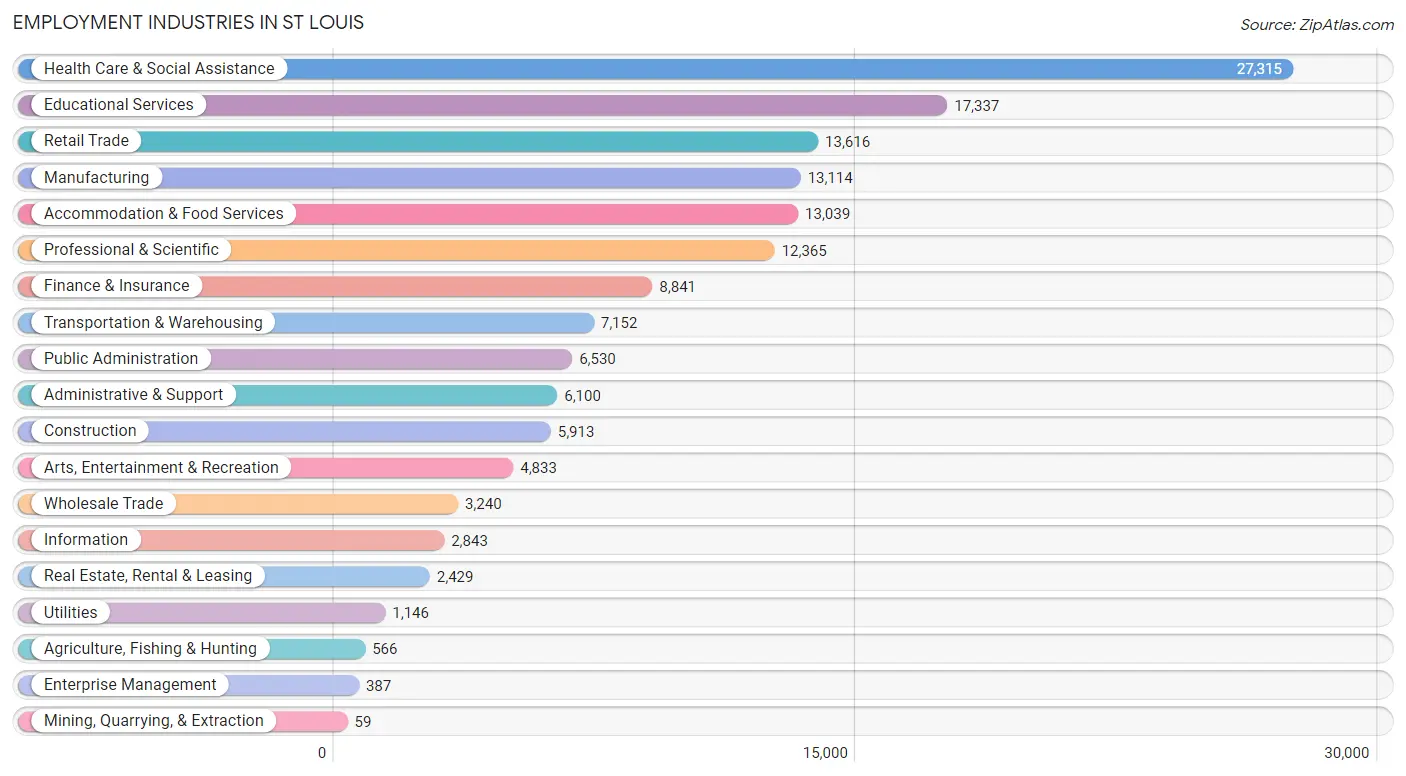
The major employment industries in St Louis include Health Care & Social Assistance (27,315 | 17.7%), Educational Services (17,337 | 11.2%), Retail Trade (13,616 | 8.8%), Manufacturing (13,114 | 8.5%), and Accommodation & Food Services (13,039 | 8.4%).
Employment Industries by Sex in St Louis
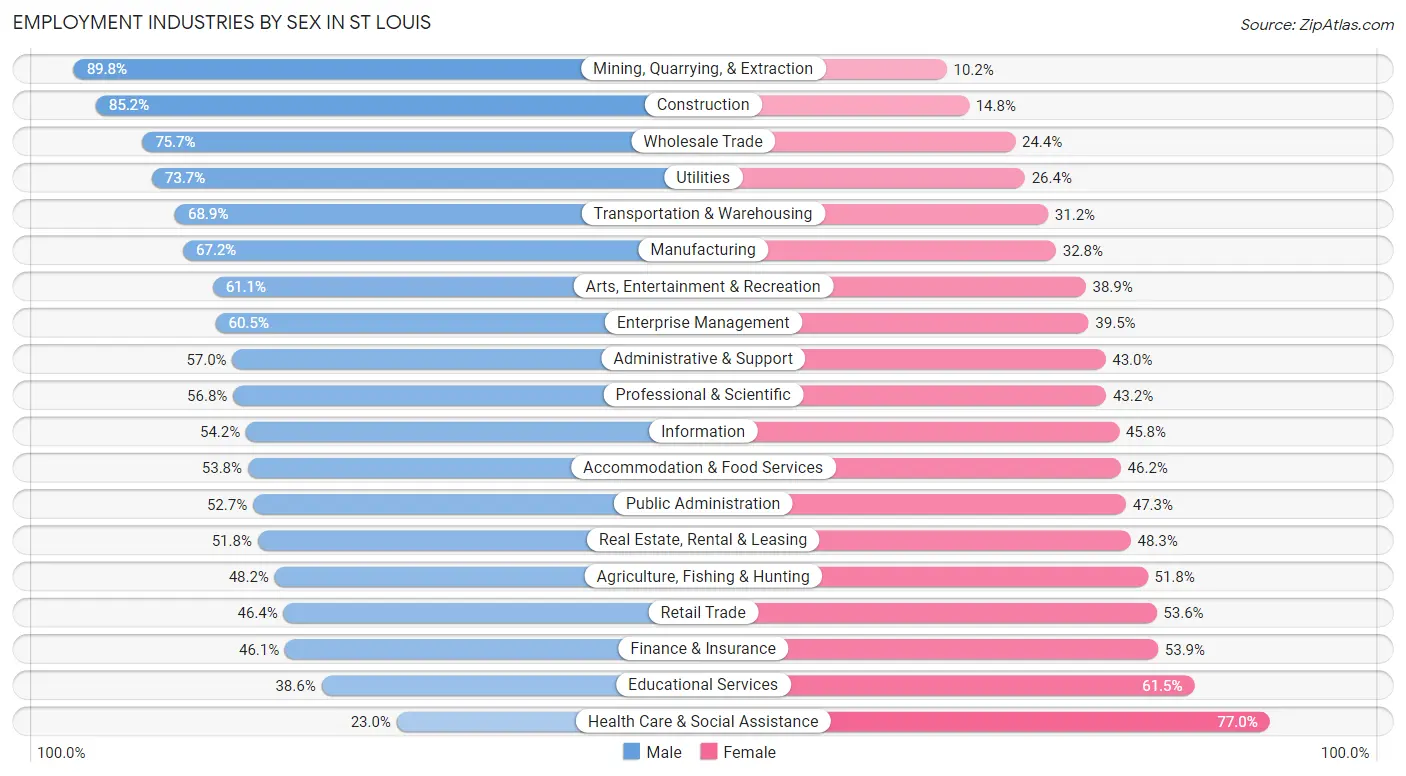
The St Louis industries that see more men than women are Mining, Quarrying, & Extraction (89.8%), Construction (85.2%), and Wholesale Trade (75.6%), whereas the industries that tend to have a higher number of women are Health Care & Social Assistance (77.0%), Educational Services (61.5%), and Finance & Insurance (53.9%).
| Industry | Male | Female |
| Agriculture, Fishing & Hunting | 273 (48.2%) | 293 (51.8%) |
| Mining, Quarrying, & Extraction | 53 (89.8%) | 6 (10.2%) |
| Construction | 5,040 (85.2%) | 873 (14.8%) |
| Manufacturing | 8,815 (67.2%) | 4,299 (32.8%) |
| Wholesale Trade | 2,451 (75.6%) | 789 (24.3%) |
| Retail Trade | 6,317 (46.4%) | 7,299 (53.6%) |
| Transportation & Warehousing | 4,924 (68.9%) | 2,228 (31.1%) |
| Utilities | 844 (73.7%) | 302 (26.4%) |
| Information | 1,540 (54.2%) | 1,303 (45.8%) |
| Finance & Insurance | 4,075 (46.1%) | 4,766 (53.9%) |
| Real Estate, Rental & Leasing | 1,257 (51.7%) | 1,172 (48.2%) |
| Professional & Scientific | 7,027 (56.8%) | 5,338 (43.2%) |
| Enterprise Management | 234 (60.5%) | 153 (39.5%) |
| Administrative & Support | 3,476 (57.0%) | 2,624 (43.0%) |
| Educational Services | 6,683 (38.6%) | 10,654 (61.5%) |
| Health Care & Social Assistance | 6,276 (23.0%) | 21,039 (77.0%) |
| Arts, Entertainment & Recreation | 2,951 (61.1%) | 1,882 (38.9%) |
| Accommodation & Food Services | 7,014 (53.8%) | 6,025 (46.2%) |
| Public Administration | 3,443 (52.7%) | 3,087 (47.3%) |
| Total | 75,984 (49.1%) | 78,705 (50.9%) |
Education in St Louis
School Enrollment in St Louis
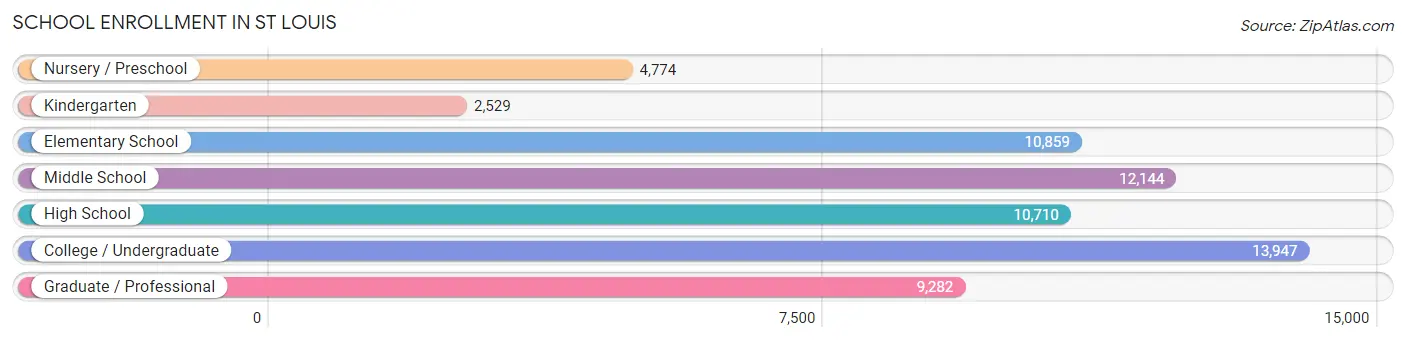
The most common levels of schooling among the 64,245 students in St Louis are college / undergraduate (13,947 | 21.7%), middle school (12,144 | 18.9%), and elementary school (10,859 | 16.9%).
| School Level | # Students | % Students |
| Nursery / Preschool | 4,774 | 7.4% |
| Kindergarten | 2,529 | 3.9% |
| Elementary School | 10,859 | 16.9% |
| Middle School | 12,144 | 18.9% |
| High School | 10,710 | 16.7% |
| College / Undergraduate | 13,947 | 21.7% |
| Graduate / Professional | 9,282 | 14.4% |
| Total | 64,245 | 100.0% |
School Enrollment by Age by Funding Source in St Louis
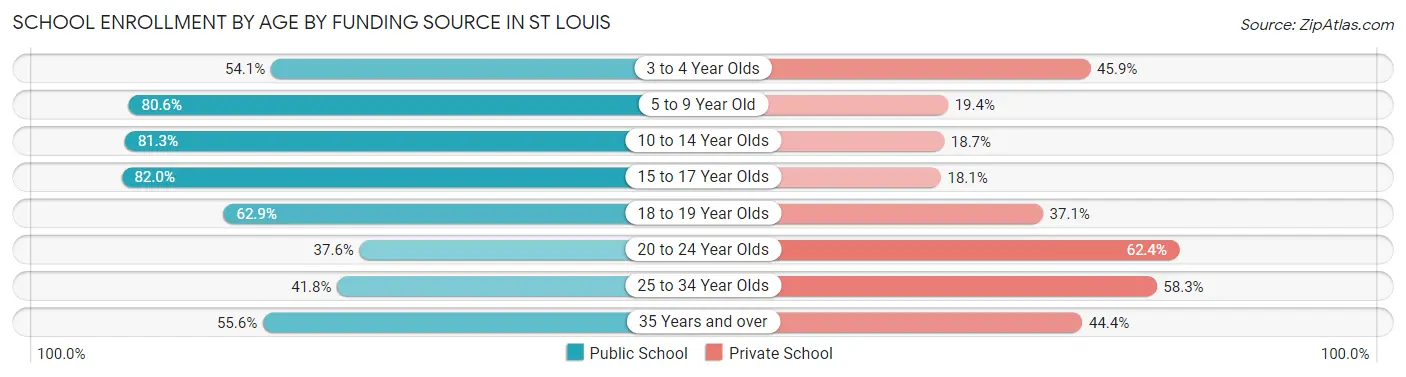
Out of a total of 64,245 students who are enrolled in schools in St Louis, 21,586 (33.6%) attend a private institution, while the remaining 42,659 (66.4%) are enrolled in public schools. The age group of 20 to 24 year olds has the highest likelihood of being enrolled in private schools, with 5,020 (62.4% in the age bracket) enrolled. Conversely, the age group of 15 to 17 year olds has the lowest likelihood of being enrolled in a private school, with 6,240 (82.0% in the age bracket) attending a public institution.
| Age Bracket | Public School | Private School |
| 3 to 4 Year Olds | 1,897 (54.1%) | 1,610 (45.9%) |
| 5 to 9 Year Old | 10,168 (80.6%) | 2,444 (19.4%) |
| 10 to 14 Year Olds | 12,342 (81.3%) | 2,832 (18.7%) |
| 15 to 17 Year Olds | 6,240 (82.0%) | 1,374 (18.0%) |
| 18 to 19 Year Olds | 3,574 (62.9%) | 2,104 (37.1%) |
| 20 to 24 Year Olds | 3,023 (37.6%) | 5,020 (62.4%) |
| 25 to 34 Year Olds | 3,168 (41.7%) | 4,420 (58.3%) |
| 35 Years and over | 2,240 (55.6%) | 1,789 (44.4%) |
| Total | 42,659 (66.4%) | 21,586 (33.6%) |
Educational Attainment by Field of Study in St Louis
Business (15,975 | 17.3%), social sciences (9,156 | 9.9%), science & technology (8,951 | 9.7%), bio, nature & agricultural (7,381 | 8.0%), and education (7,278 | 7.9%) are the most common fields of study among 92,160 individuals in St Louis who have obtained a bachelor's degree or higher.
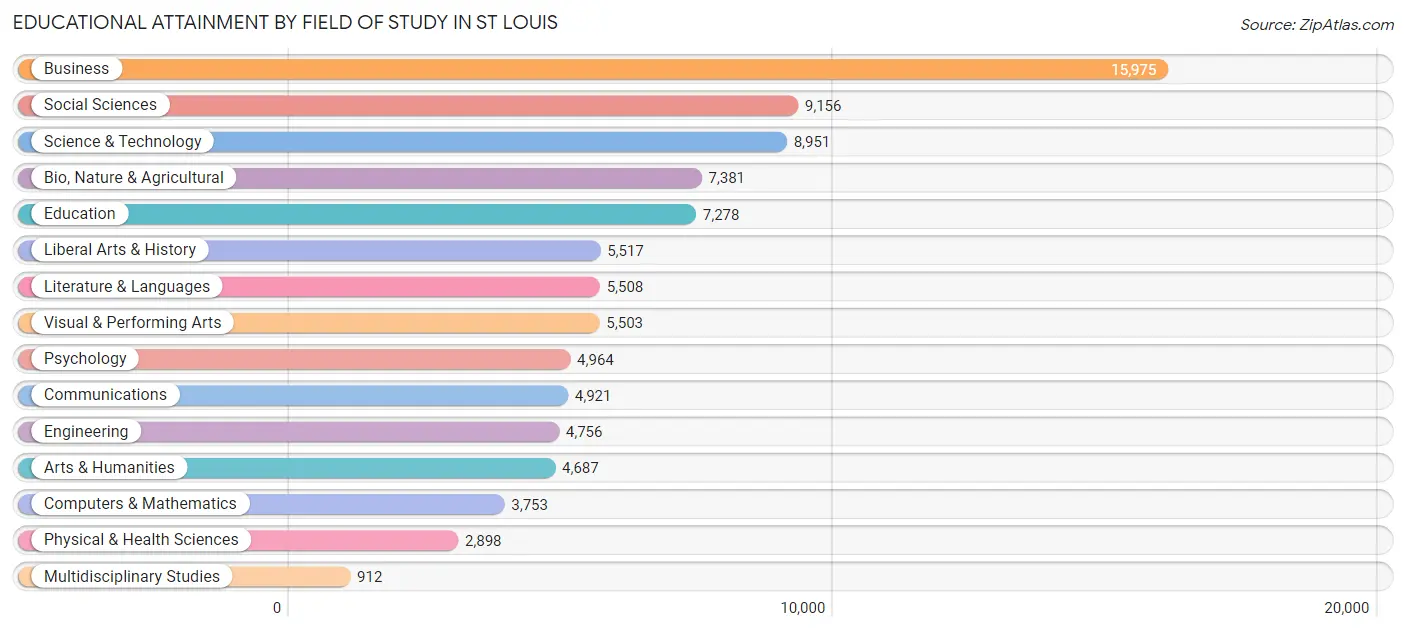
| Field of Study | # Graduates | % Graduates |
| Computers & Mathematics | 3,753 | 4.1% |
| Bio, Nature & Agricultural | 7,381 | 8.0% |
| Physical & Health Sciences | 2,898 | 3.1% |
| Psychology | 4,964 | 5.4% |
| Social Sciences | 9,156 | 9.9% |
| Engineering | 4,756 | 5.2% |
| Multidisciplinary Studies | 912 | 1.0% |
| Science & Technology | 8,951 | 9.7% |
| Business | 15,975 | 17.3% |
| Education | 7,278 | 7.9% |
| Literature & Languages | 5,508 | 6.0% |
| Liberal Arts & History | 5,517 | 6.0% |
| Visual & Performing Arts | 5,503 | 6.0% |
| Communications | 4,921 | 5.3% |
| Arts & Humanities | 4,687 | 5.1% |
| Total | 92,160 | 100.0% |
Transportation & Commute in St Louis
Vehicle Availability by Sex in St Louis
The most prevalent vehicle ownership categories in St Louis are males with 2 vehicles (30,887, accounting for 41.6%) and females with 2 vehicles (30,112, making up 40.9%).
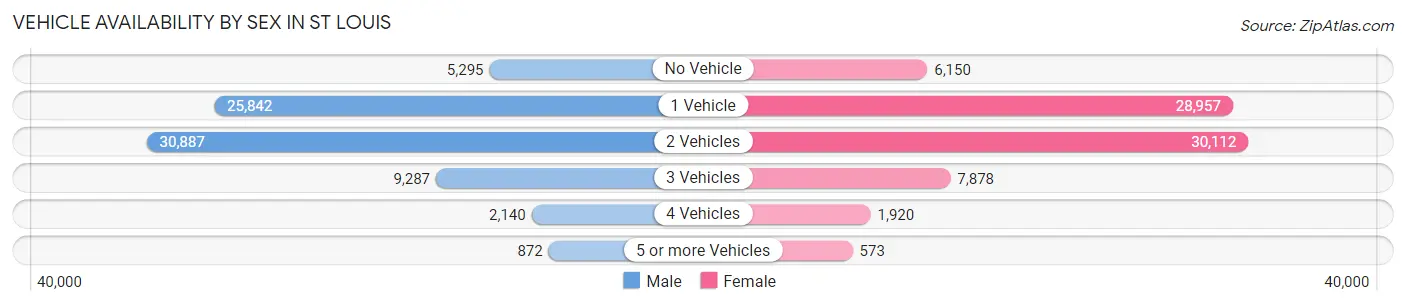
| Vehicles Available | Male | Female |
| No Vehicle | 5,295 (7.1%) | 6,150 (8.1%) |
| 1 Vehicle | 25,842 (34.8%) | 28,957 (38.3%) |
| 2 Vehicles | 30,887 (41.6%) | 30,112 (39.8%) |
| 3 Vehicles | 9,287 (12.5%) | 7,878 (10.4%) |
| 4 Vehicles | 2,140 (2.9%) | 1,920 (2.5%) |
| 5 or more Vehicles | 872 (1.2%) | 573 (0.8%) |
| Total | 74,323 (100.0%) | 75,590 (100.0%) |
Commute Time in St Louis
The most frequently occuring commute durations in St Louis are 15 to 19 minutes (26,362 commuters, 19.9%), 20 to 24 minutes (25,752 commuters, 19.4%), and 10 to 14 minutes (21,051 commuters, 15.9%).
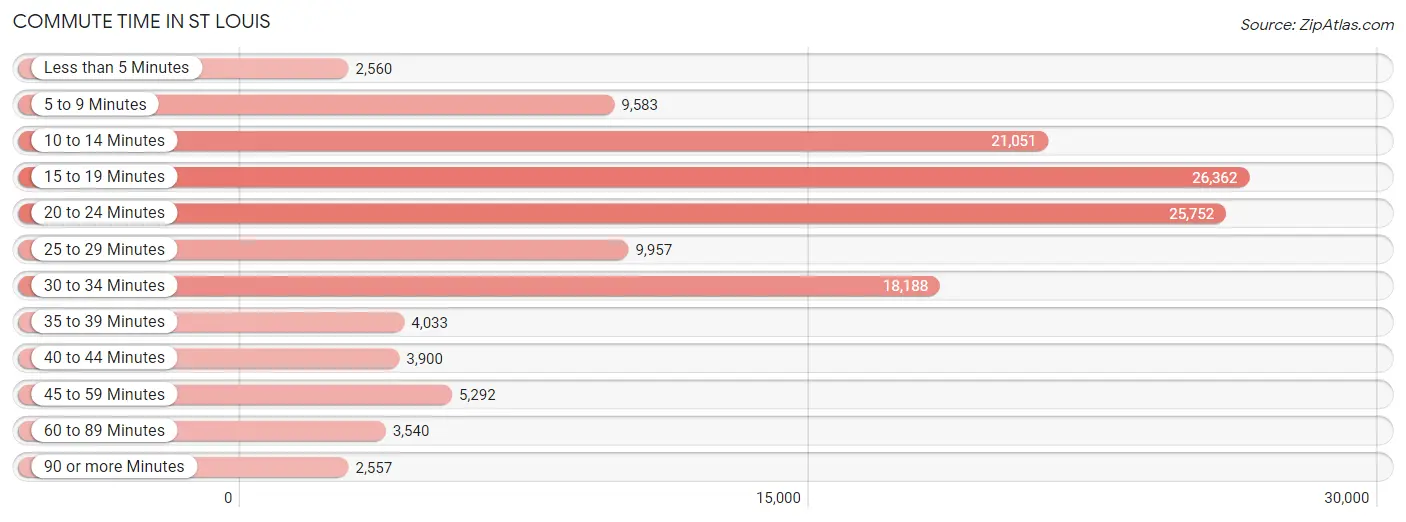
| Commute Time | # Commuters | % Commuters |
| Less than 5 Minutes | 2,560 | 1.9% |
| 5 to 9 Minutes | 9,583 | 7.2% |
| 10 to 14 Minutes | 21,051 | 15.9% |
| 15 to 19 Minutes | 26,362 | 19.9% |
| 20 to 24 Minutes | 25,752 | 19.4% |
| 25 to 29 Minutes | 9,957 | 7.5% |
| 30 to 34 Minutes | 18,188 | 13.7% |
| 35 to 39 Minutes | 4,033 | 3.0% |
| 40 to 44 Minutes | 3,900 | 2.9% |
| 45 to 59 Minutes | 5,292 | 4.0% |
| 60 to 89 Minutes | 3,540 | 2.7% |
| 90 or more Minutes | 2,557 | 1.9% |
Commute Time by Sex in St Louis
The most common commute times in St Louis are 15 to 19 minutes (12,519 commuters, 19.0%) for males and 15 to 19 minutes (13,843 commuters, 20.7%) for females.
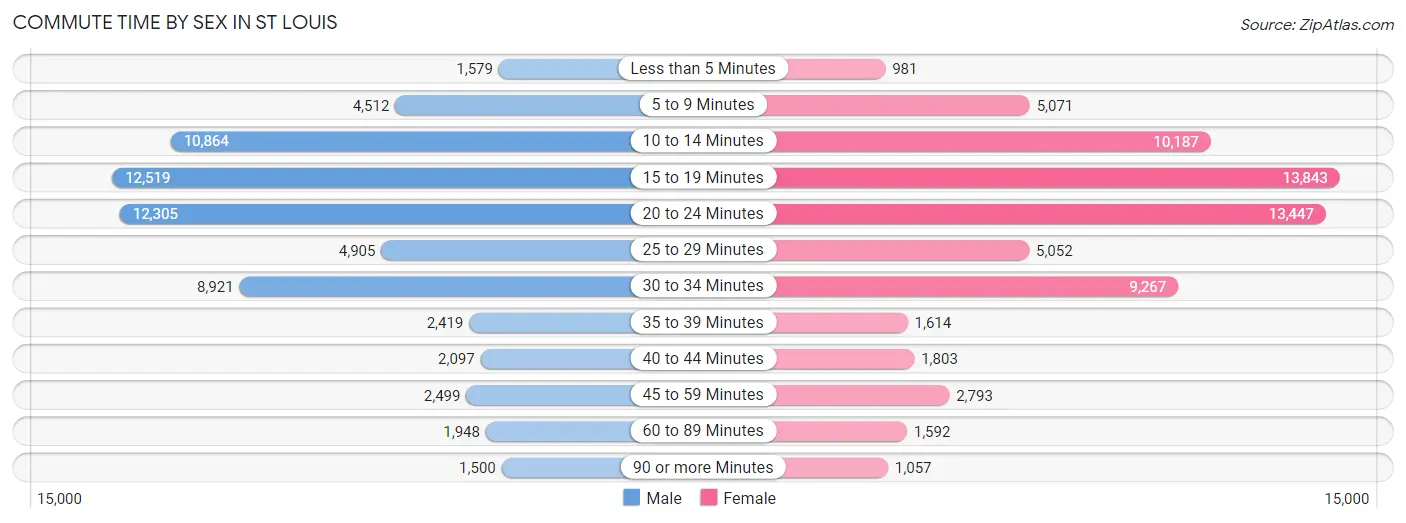
| Commute Time | Male | Female |
| Less than 5 Minutes | 1,579 (2.4%) | 981 (1.5%) |
| 5 to 9 Minutes | 4,512 (6.8%) | 5,071 (7.6%) |
| 10 to 14 Minutes | 10,864 (16.4%) | 10,187 (15.3%) |
| 15 to 19 Minutes | 12,519 (19.0%) | 13,843 (20.7%) |
| 20 to 24 Minutes | 12,305 (18.6%) | 13,447 (20.2%) |
| 25 to 29 Minutes | 4,905 (7.4%) | 5,052 (7.6%) |
| 30 to 34 Minutes | 8,921 (13.5%) | 9,267 (13.9%) |
| 35 to 39 Minutes | 2,419 (3.7%) | 1,614 (2.4%) |
| 40 to 44 Minutes | 2,097 (3.2%) | 1,803 (2.7%) |
| 45 to 59 Minutes | 2,499 (3.8%) | 2,793 (4.2%) |
| 60 to 89 Minutes | 1,948 (2.9%) | 1,592 (2.4%) |
| 90 or more Minutes | 1,500 (2.3%) | 1,057 (1.6%) |
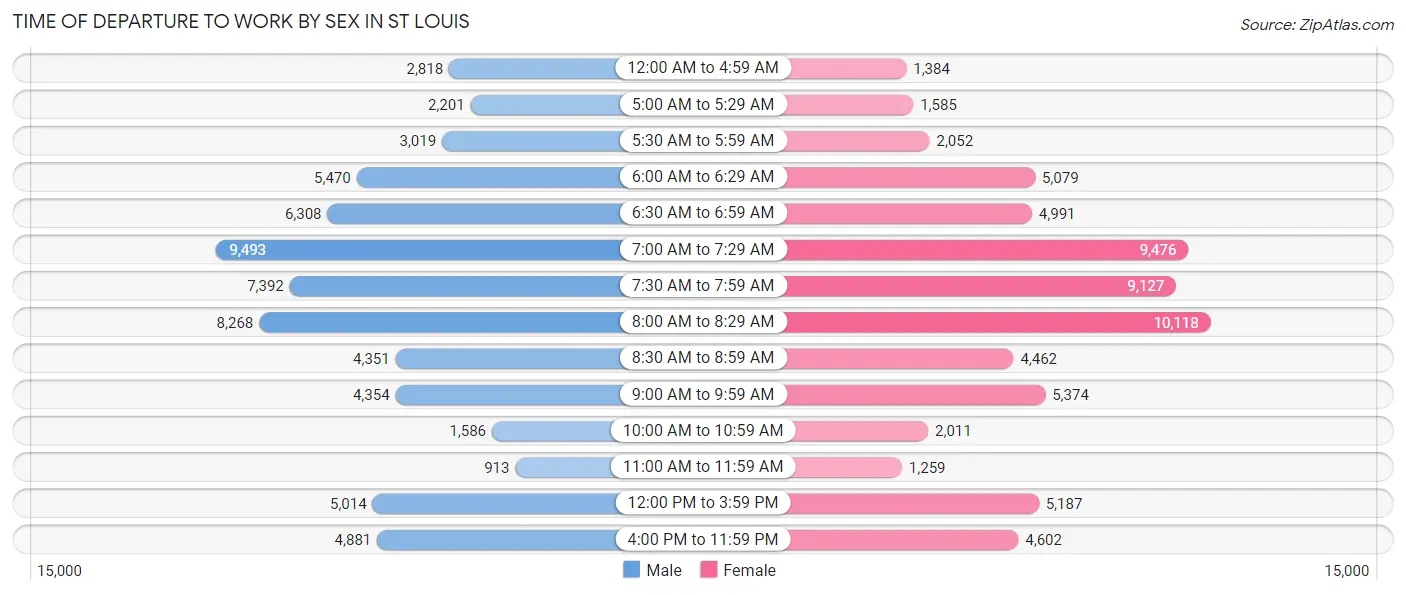
Time of Departure to Work by Sex in St Louis
The most frequent times of departure to work in St Louis are 7:00 AM to 7:29 AM (9,493, 14.4%) for males and 8:00 AM to 8:29 AM (10,118, 15.2%) for females.
| Time of Departure | Male | Female |
| 12:00 AM to 4:59 AM | 2,818 (4.3%) | 1,384 (2.1%) |
| 5:00 AM to 5:29 AM | 2,201 (3.3%) | 1,585 (2.4%) |
| 5:30 AM to 5:59 AM | 3,019 (4.6%) | 2,052 (3.1%) |
| 6:00 AM to 6:29 AM | 5,470 (8.3%) | 5,079 (7.6%) |
| 6:30 AM to 6:59 AM | 6,308 (9.6%) | 4,991 (7.5%) |
| 7:00 AM to 7:29 AM | 9,493 (14.4%) | 9,476 (14.2%) |
| 7:30 AM to 7:59 AM | 7,392 (11.2%) | 9,127 (13.7%) |
| 8:00 AM to 8:29 AM | 8,268 (12.5%) | 10,118 (15.2%) |
| 8:30 AM to 8:59 AM | 4,351 (6.6%) | 4,462 (6.7%) |
| 9:00 AM to 9:59 AM | 4,354 (6.6%) | 5,374 (8.1%) |
| 10:00 AM to 10:59 AM | 1,586 (2.4%) | 2,011 (3.0%) |
| 11:00 AM to 11:59 AM | 913 (1.4%) | 1,259 (1.9%) |
| 12:00 PM to 3:59 PM | 5,014 (7.6%) | 5,187 (7.8%) |
| 4:00 PM to 11:59 PM | 4,881 (7.4%) | 4,602 (6.9%) |
| Total | 66,068 (100.0%) | 66,707 (100.0%) |
Housing Occupancy in St Louis
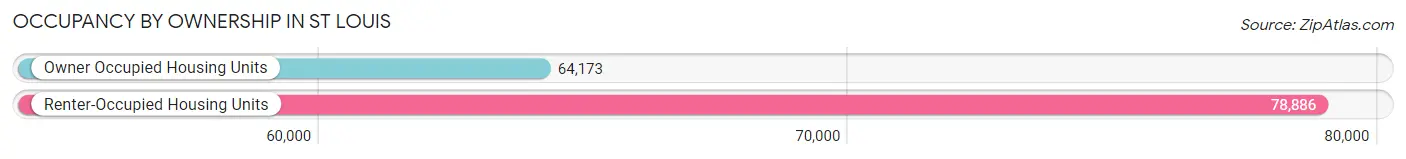
Occupancy by Ownership in St Louis
Of the total 143,059 dwellings in St Louis, owner-occupied units account for 64,173 (44.9%), while renter-occupied units make up 78,886 (55.1%).
| Occupancy | # Housing Units | % Housing Units |
| Owner Occupied Housing Units | 64,173 | 44.9% |
| Renter-Occupied Housing Units | 78,886 | 55.1% |
| Total Occupied Housing Units | 143,059 | 100.0% |
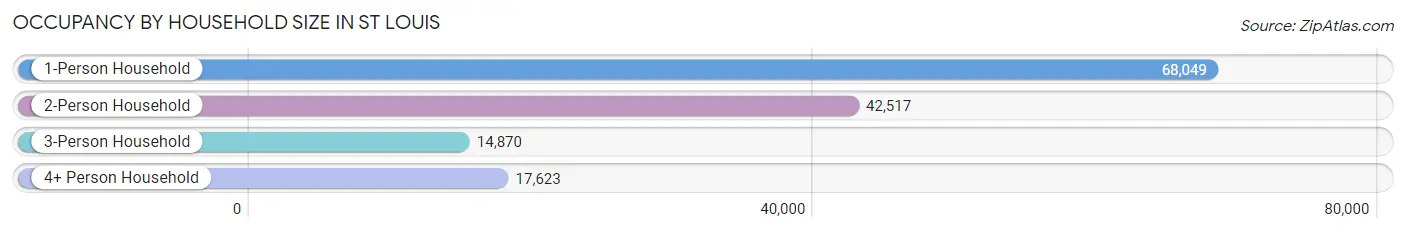
Occupancy by Household Size in St Louis
| Household Size | # Housing Units | % Housing Units |
| 1-Person Household | 68,049 | 47.6% |
| 2-Person Household | 42,517 | 29.7% |
| 3-Person Household | 14,870 | 10.4% |
| 4+ Person Household | 17,623 | 12.3% |
| Total Housing Units | 143,059 | 100.0% |
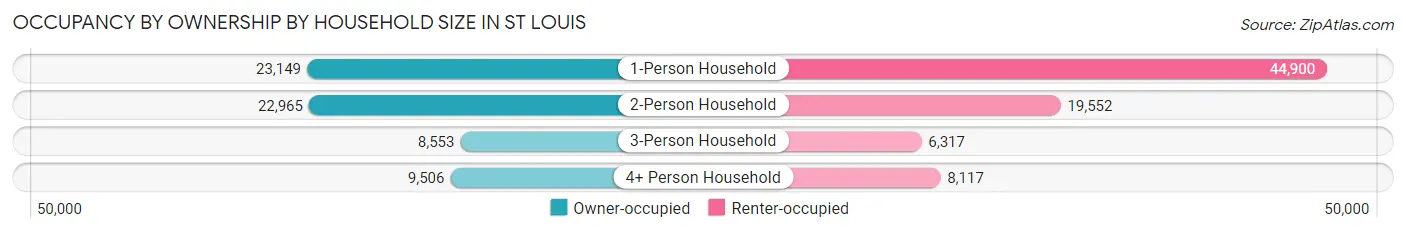
Occupancy by Ownership by Household Size in St Louis
| Household Size | Owner-occupied | Renter-occupied |
| 1-Person Household | 23,149 (34.0%) | 44,900 (66.0%) |
| 2-Person Household | 22,965 (54.0%) | 19,552 (46.0%) |
| 3-Person Household | 8,553 (57.5%) | 6,317 (42.5%) |
| 4+ Person Household | 9,506 (53.9%) | 8,117 (46.1%) |
| Total Housing Units | 64,173 (44.9%) | 78,886 (55.1%) |
Occupancy by Educational Attainment in St Louis
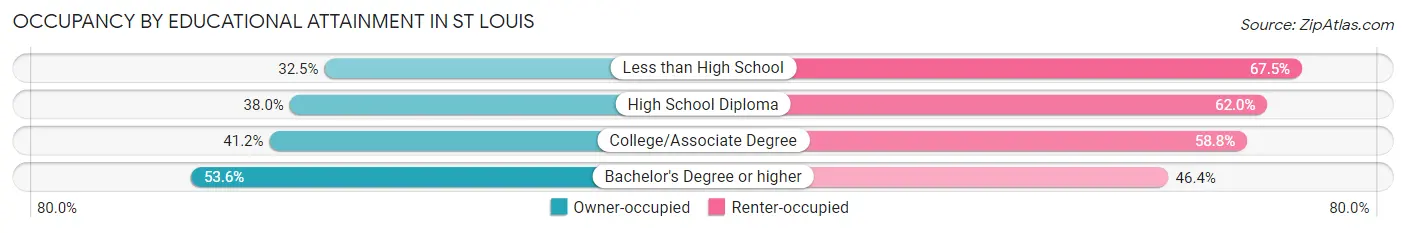
| Household Size | Owner-occupied | Renter-occupied |
| Less than High School | 4,089 (32.5%) | 8,504 (67.5%) |
| High School Diploma | 12,068 (38.0%) | 19,723 (62.0%) |
| College/Associate Degree | 16,167 (41.2%) | 23,095 (58.8%) |
| Bachelor's Degree or higher | 31,849 (53.6%) | 27,564 (46.4%) |
Occupancy by Age of Householder in St Louis
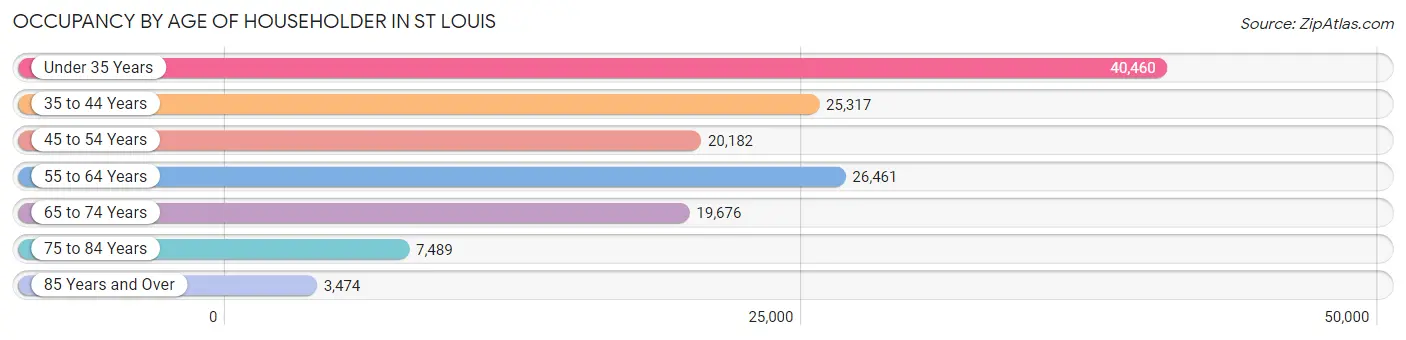
| Age Bracket | # Households | % Households |
| Under 35 Years | 40,460 | 28.3% |
| 35 to 44 Years | 25,317 | 17.7% |
| 45 to 54 Years | 20,182 | 14.1% |
| 55 to 64 Years | 26,461 | 18.5% |
| 65 to 74 Years | 19,676 | 13.8% |
| 75 to 84 Years | 7,489 | 5.2% |
| 85 Years and Over | 3,474 | 2.4% |
| Total | 143,059 | 100.0% |
Housing Finances in St Louis
Median Income by Occupancy in St Louis
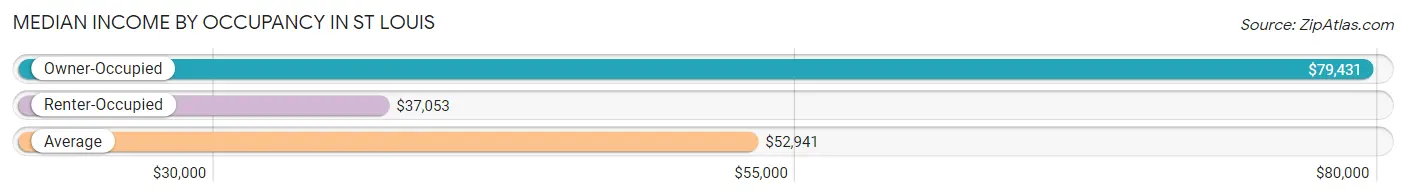
| Occupancy Type | # Households | Median Income |
| Owner-Occupied | 64,173 (44.9%) | $79,431 |
| Renter-Occupied | 78,886 (55.1%) | $37,053 |
| Average | 143,059 (100.0%) | $52,941 |
Occupancy by Householder Income Bracket in St Louis
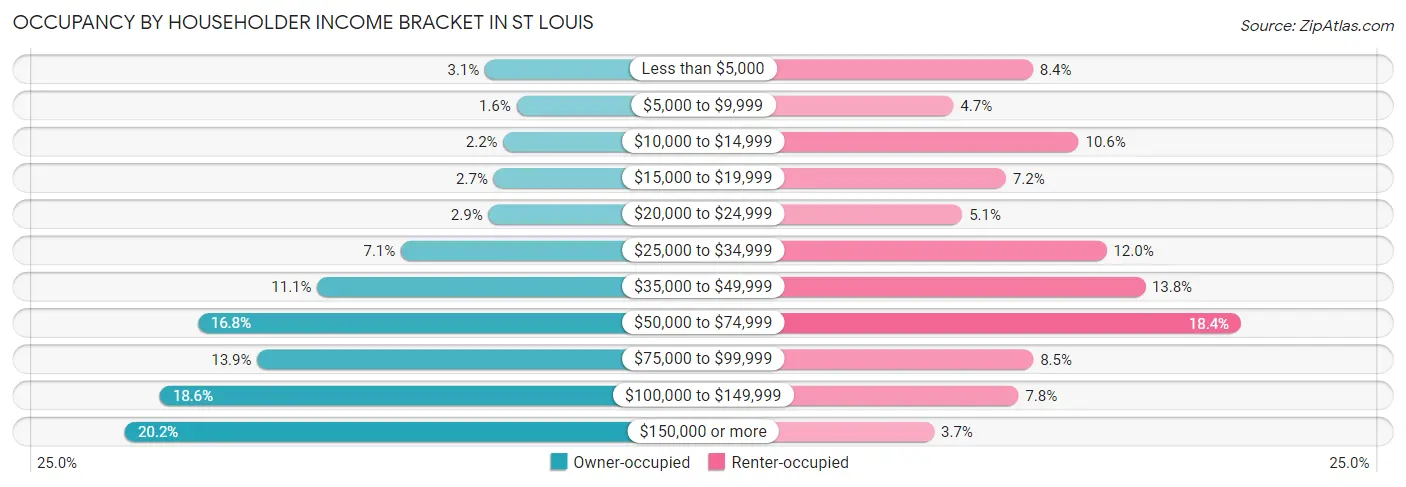
| Income Bracket | Owner-occupied | Renter-occupied |
| Less than $5,000 | 1,972 (3.1%) | 6,658 (8.4%) |
| $5,000 to $9,999 | 1,008 (1.6%) | 3,676 (4.7%) |
| $10,000 to $14,999 | 1,414 (2.2%) | 8,378 (10.6%) |
| $15,000 to $19,999 | 1,706 (2.7%) | 5,648 (7.2%) |
| $20,000 to $24,999 | 1,868 (2.9%) | 4,007 (5.1%) |
| $25,000 to $34,999 | 4,537 (7.1%) | 9,430 (11.9%) |
| $35,000 to $49,999 | 7,097 (11.1%) | 10,871 (13.8%) |
| $50,000 to $74,999 | 10,749 (16.8%) | 14,472 (18.3%) |
| $75,000 to $99,999 | 8,934 (13.9%) | 6,672 (8.5%) |
| $100,000 to $149,999 | 11,911 (18.6%) | 6,121 (7.8%) |
| $150,000 or more | 12,977 (20.2%) | 2,953 (3.7%) |
| Total | 64,173 (100.0%) | 78,886 (100.0%) |
Monthly Housing Cost Tiers in St Louis
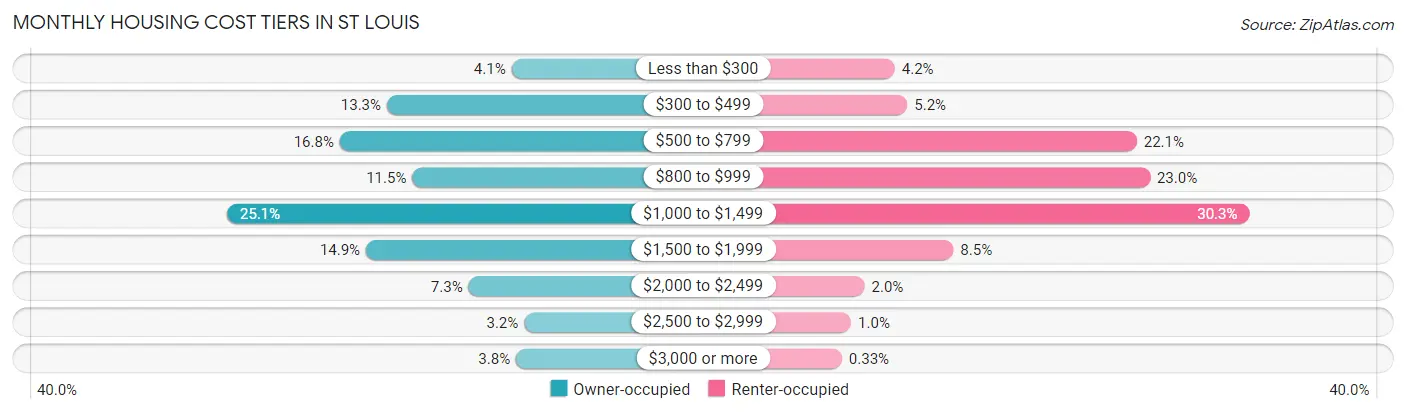
| Monthly Cost | Owner-occupied | Renter-occupied |
| Less than $300 | 2,658 (4.1%) | 3,338 (4.2%) |
| $300 to $499 | 8,548 (13.3%) | 4,061 (5.1%) |
| $500 to $799 | 10,774 (16.8%) | 17,393 (22.1%) |
| $800 to $999 | 7,350 (11.5%) | 18,163 (23.0%) |
| $1,000 to $1,499 | 16,106 (25.1%) | 23,926 (30.3%) |
| $1,500 to $1,999 | 9,534 (14.9%) | 6,735 (8.5%) |
| $2,000 to $2,499 | 4,694 (7.3%) | 1,580 (2.0%) |
| $2,500 to $2,999 | 2,063 (3.2%) | 799 (1.0%) |
| $3,000 or more | 2,446 (3.8%) | 263 (0.3%) |
| Total | 64,173 (100.0%) | 78,886 (100.0%) |
Physical Housing Characteristics in St Louis
Housing Structures in St Louis
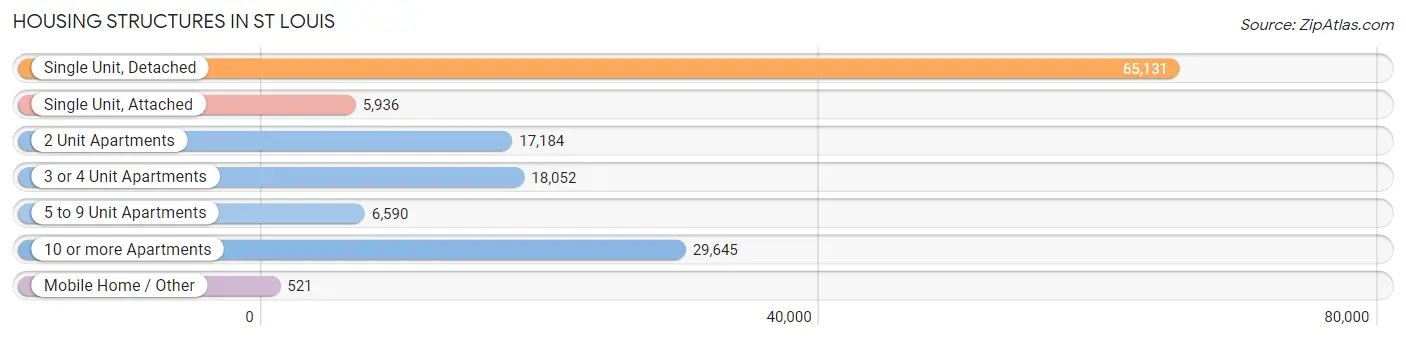
| Structure Type | # Housing Units | % Housing Units |
| Single Unit, Detached | 65,131 | 45.5% |
| Single Unit, Attached | 5,936 | 4.2% |
| 2 Unit Apartments | 17,184 | 12.0% |
| 3 or 4 Unit Apartments | 18,052 | 12.6% |
| 5 to 9 Unit Apartments | 6,590 | 4.6% |
| 10 or more Apartments | 29,645 | 20.7% |
| Mobile Home / Other | 521 | 0.4% |
| Total | 143,059 | 100.0% |
Housing Structures by Occupancy in St Louis
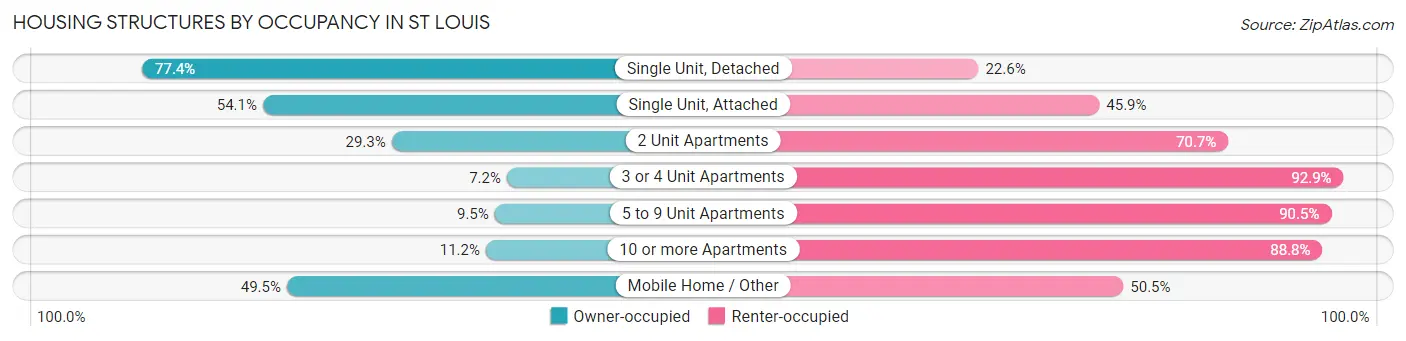
| Structure Type | Owner-occupied | Renter-occupied |
| Single Unit, Detached | 50,420 (77.4%) | 14,711 (22.6%) |
| Single Unit, Attached | 3,214 (54.1%) | 2,722 (45.9%) |
| 2 Unit Apartments | 5,042 (29.3%) | 12,142 (70.7%) |
| 3 or 4 Unit Apartments | 1,290 (7.1%) | 16,762 (92.8%) |
| 5 to 9 Unit Apartments | 626 (9.5%) | 5,964 (90.5%) |
| 10 or more Apartments | 3,323 (11.2%) | 26,322 (88.8%) |
| Mobile Home / Other | 258 (49.5%) | 263 (50.5%) |
| Total | 64,173 (44.9%) | 78,886 (55.1%) |
Housing Structures by Number of Rooms in St Louis
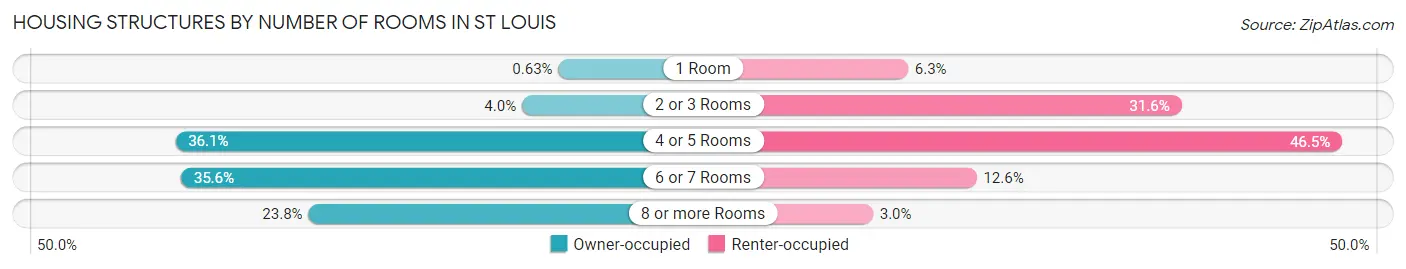
| Number of Rooms | Owner-occupied | Renter-occupied |
| 1 Room | 406 (0.6%) | 4,955 (6.3%) |
| 2 or 3 Rooms | 2,568 (4.0%) | 24,930 (31.6%) |
| 4 or 5 Rooms | 23,145 (36.1%) | 36,639 (46.5%) |
| 6 or 7 Rooms | 22,811 (35.5%) | 9,963 (12.6%) |
| 8 or more Rooms | 15,243 (23.7%) | 2,399 (3.0%) |
| Total | 64,173 (100.0%) | 78,886 (100.0%) |
Housing Structure by Heating Type in St Louis
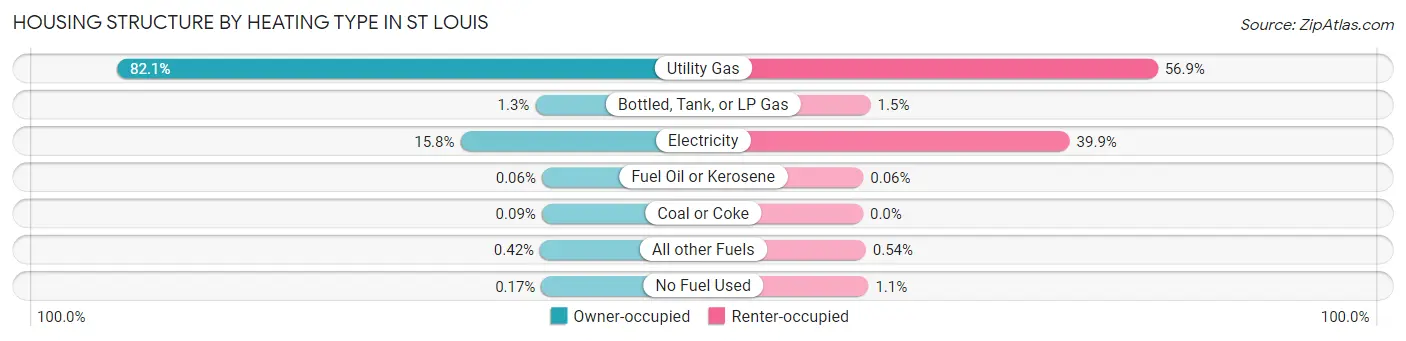
| Heating Type | Owner-occupied | Renter-occupied |
| Utility Gas | 52,704 (82.1%) | 44,920 (56.9%) |
| Bottled, Tank, or LP Gas | 854 (1.3%) | 1,162 (1.5%) |
| Electricity | 10,145 (15.8%) | 31,498 (39.9%) |
| Fuel Oil or Kerosene | 37 (0.1%) | 51 (0.1%) |
| Coal or Coke | 55 (0.1%) | 0 (0.0%) |
| All other Fuels | 272 (0.4%) | 427 (0.5%) |
| No Fuel Used | 106 (0.2%) | 828 (1.1%) |
| Total | 64,173 (100.0%) | 78,886 (100.0%) |
Household Vehicle Usage in St Louis
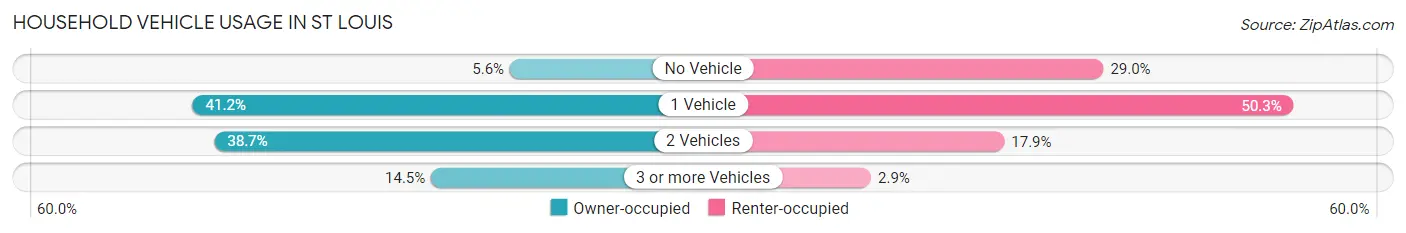
| Vehicles per Household | Owner-occupied | Renter-occupied |
| No Vehicle | 3,613 (5.6%) | 22,844 (29.0%) |
| 1 Vehicle | 26,422 (41.2%) | 39,639 (50.2%) |
| 2 Vehicles | 24,861 (38.7%) | 14,091 (17.9%) |
| 3 or more Vehicles | 9,277 (14.5%) | 2,312 (2.9%) |
| Total | 64,173 (100.0%) | 78,886 (100.0%) |
Real Estate & Mortgages in St Louis
Real Estate and Mortgage Overview in St Louis
| Characteristic | Without Mortgage | With Mortgage |
| Housing Units | 23,416 | 40,757 |
| Median Property Value | $130,600 | $194,200 |
| Median Household Income | $54,718 | $10,222 |
| Monthly Housing Costs | $528 | $2,320 |
| Real Estate Taxes | $1,420 | $779 |
Property Value by Mortgage Status in St Louis
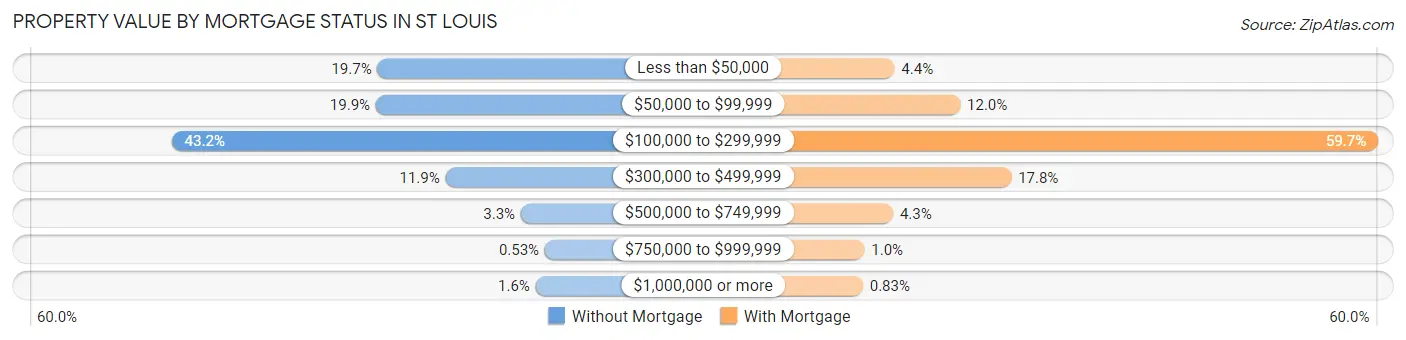
| Property Value | Without Mortgage | With Mortgage |
| Less than $50,000 | 4,605 (19.7%) | 1,811 (4.4%) |
| $50,000 to $99,999 | 4,649 (19.9%) | 4,870 (11.9%) |
| $100,000 to $299,999 | 10,114 (43.2%) | 24,334 (59.7%) |
| $300,000 to $499,999 | 2,784 (11.9%) | 7,252 (17.8%) |
| $500,000 to $749,999 | 769 (3.3%) | 1,743 (4.3%) |
| $750,000 to $999,999 | 123 (0.5%) | 410 (1.0%) |
| $1,000,000 or more | 372 (1.6%) | 337 (0.8%) |
| Total | 23,416 (100.0%) | 40,757 (100.0%) |
Household Income by Mortgage Status in St Louis
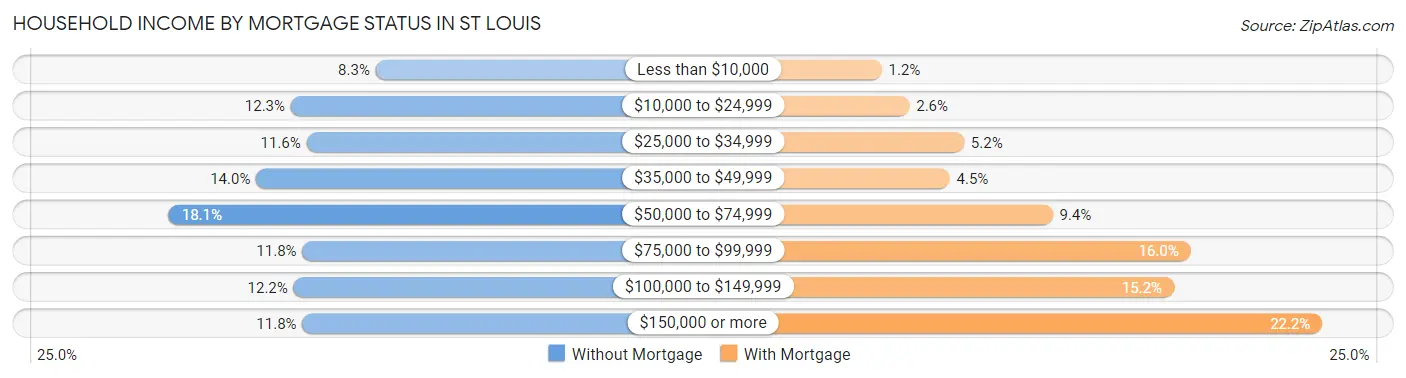
| Household Income | Without Mortgage | With Mortgage |
| Less than $10,000 | 1,938 (8.3%) | 505 (1.2%) |
| $10,000 to $24,999 | 2,886 (12.3%) | 1,042 (2.6%) |
| $25,000 to $34,999 | 2,710 (11.6%) | 2,102 (5.2%) |
| $35,000 to $49,999 | 3,272 (14.0%) | 1,827 (4.5%) |
| $50,000 to $74,999 | 4,245 (18.1%) | 3,825 (9.4%) |
| $75,000 to $99,999 | 2,755 (11.8%) | 6,504 (16.0%) |
| $100,000 to $149,999 | 2,855 (12.2%) | 6,179 (15.2%) |
| $150,000 or more | 2,755 (11.8%) | 9,056 (22.2%) |
| Total | 23,416 (100.0%) | 40,757 (100.0%) |
Property Value to Household Income Ratio in St Louis
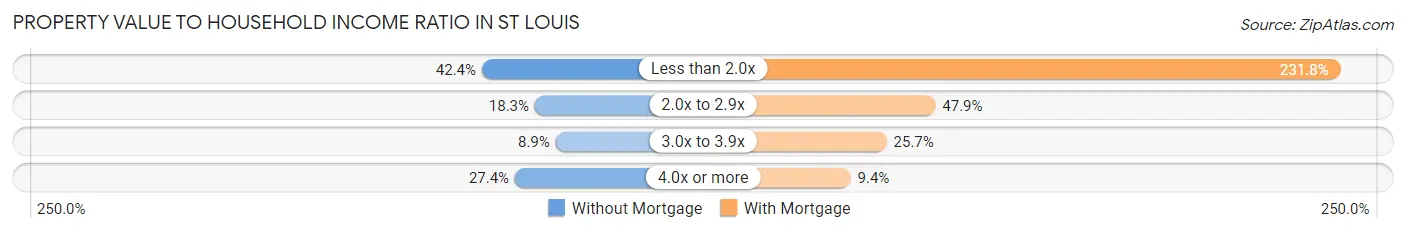
| Value-to-Income Ratio | Without Mortgage | With Mortgage |
| Less than 2.0x | 9,928 (42.4%) | 94,480 (231.8%) |
| 2.0x to 2.9x | 4,290 (18.3%) | 19,510 (47.9%) |
| 3.0x to 3.9x | 2,087 (8.9%) | 10,490 (25.7%) |
| 4.0x or more | 6,409 (27.4%) | 3,831 (9.4%) |
| Total | 23,416 (100.0%) | 40,757 (100.0%) |
Real Estate Taxes by Mortgage Status in St Louis
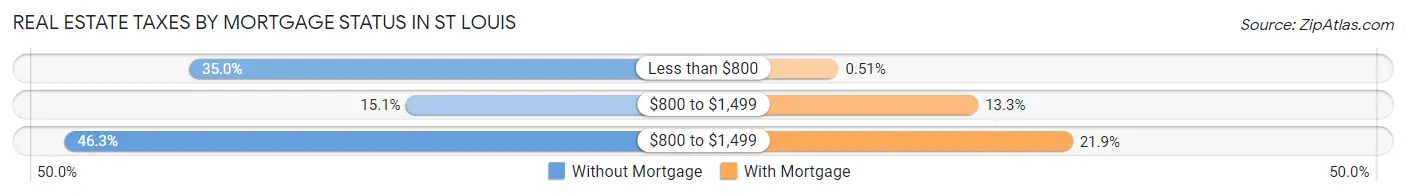
| Property Taxes | Without Mortgage | With Mortgage |
| Less than $800 | 8,190 (35.0%) | 206 (0.5%) |
| $800 to $1,499 | 3,544 (15.1%) | 5,404 (13.3%) |
| $800 to $1,499 | 10,851 (46.3%) | 8,922 (21.9%) |
| Total | 23,416 (100.0%) | 40,757 (100.0%) |
Health & Disability in St Louis
Health Insurance Coverage by Age in St Louis
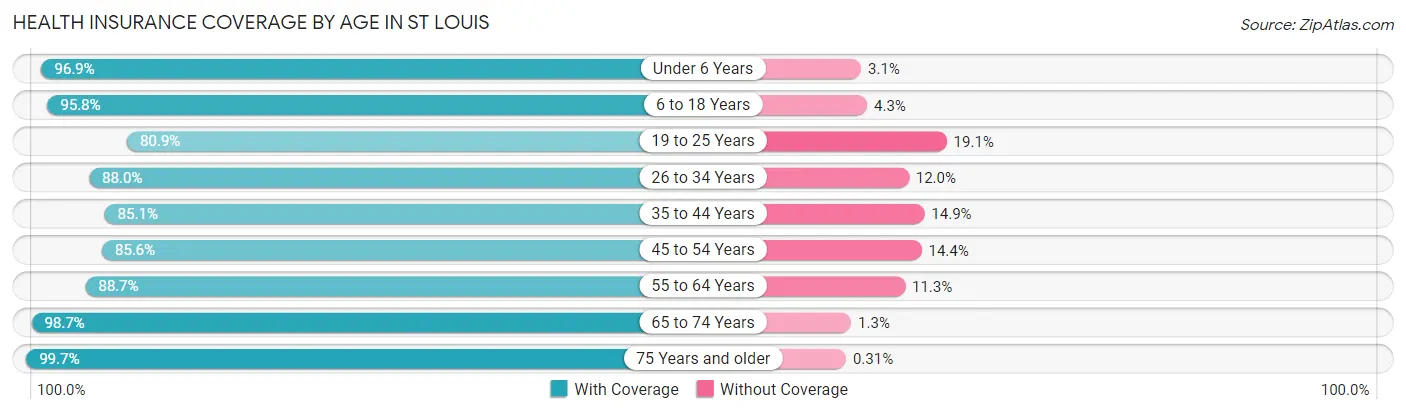
| Age Bracket | With Coverage | Without Coverage |
| Under 6 Years | 20,146 (96.9%) | 652 (3.1%) |
| 6 to 18 Years | 36,165 (95.8%) | 1,607 (4.3%) |
| 19 to 25 Years | 23,465 (80.9%) | 5,537 (19.1%) |
| 26 to 34 Years | 46,378 (88.0%) | 6,340 (12.0%) |
| 35 to 44 Years | 34,831 (85.1%) | 6,118 (14.9%) |
| 45 to 54 Years | 28,313 (85.6%) | 4,768 (14.4%) |
| 55 to 64 Years | 33,250 (88.7%) | 4,243 (11.3%) |
| 65 to 74 Years | 26,445 (98.7%) | 344 (1.3%) |
| 75 Years and older | 15,147 (99.7%) | 47 (0.3%) |
| Total | 264,140 (89.9%) | 29,656 (10.1%) |
Health Insurance Coverage by Citizenship Status in St Louis
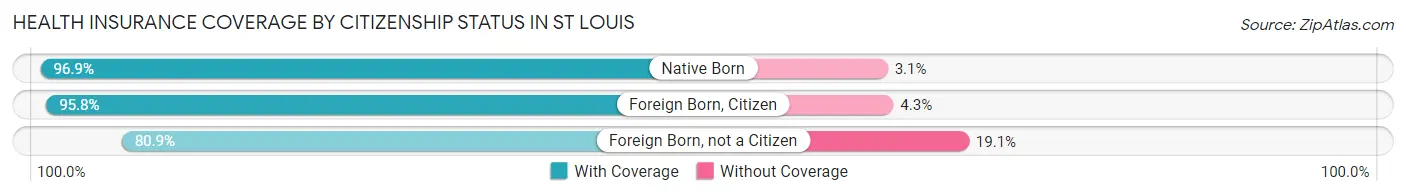
| Citizenship Status | With Coverage | Without Coverage |
| Native Born | 20,146 (96.9%) | 652 (3.1%) |
| Foreign Born, Citizen | 36,165 (95.8%) | 1,607 (4.3%) |
| Foreign Born, not a Citizen | 23,465 (80.9%) | 5,537 (19.1%) |
Health Insurance Coverage by Household Income in St Louis
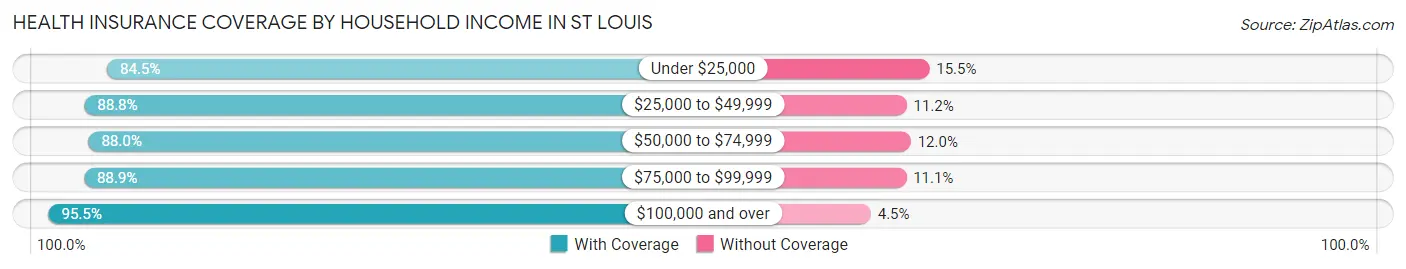
| Household Income | With Coverage | Without Coverage |
| Under $25,000 | 48,155 (84.5%) | 8,808 (15.5%) |
| $25,000 to $49,999 | 50,325 (88.8%) | 6,346 (11.2%) |
| $50,000 to $74,999 | 43,689 (88.0%) | 5,946 (12.0%) |
| $75,000 to $99,999 | 31,564 (88.9%) | 3,953 (11.1%) |
| $100,000 and over | 84,398 (95.5%) | 3,974 (4.5%) |
Public vs Private Health Insurance Coverage by Age in St Louis
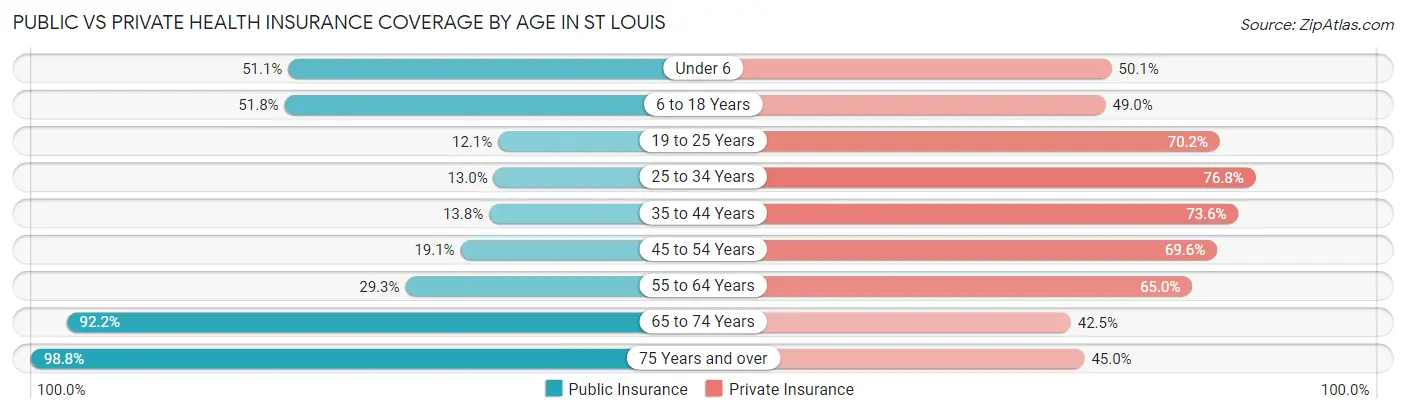
| Age Bracket | Public Insurance | Private Insurance |
| Under 6 | 10,622 (51.1%) | 10,415 (50.1%) |
| 6 to 18 Years | 19,560 (51.8%) | 18,490 (48.9%) |
| 19 to 25 Years | 3,519 (12.1%) | 20,352 (70.2%) |
| 25 to 34 Years | 6,839 (13.0%) | 40,492 (76.8%) |
| 35 to 44 Years | 5,650 (13.8%) | 30,147 (73.6%) |
| 45 to 54 Years | 6,320 (19.1%) | 23,039 (69.6%) |
| 55 to 64 Years | 11,002 (29.3%) | 24,386 (65.0%) |
| 65 to 74 Years | 24,698 (92.2%) | 11,384 (42.5%) |
| 75 Years and over | 15,016 (98.8%) | 6,843 (45.0%) |
| Total | 103,226 (35.1%) | 185,548 (63.2%) |
Disability Status by Sex by Age in St Louis
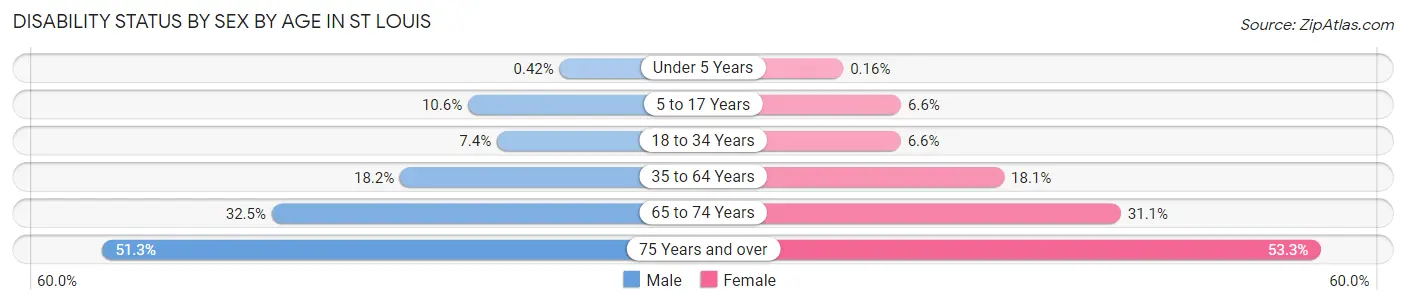
| Age Bracket | Male | Female |
| Under 5 Years | 38 (0.4%) | 14 (0.2%) |
| 5 to 17 Years | 2,022 (10.6%) | 1,215 (6.6%) |
| 18 to 34 Years | 3,021 (7.4%) | 2,910 (6.6%) |
| 35 to 64 Years | 9,987 (18.2%) | 10,236 (18.1%) |
| 65 to 74 Years | 4,029 (32.5%) | 4,469 (31.1%) |
| 75 Years and over | 2,886 (51.3%) | 5,098 (53.3%) |
Disability Class by Sex by Age in St Louis
Disability Class: Hearing Difficulty
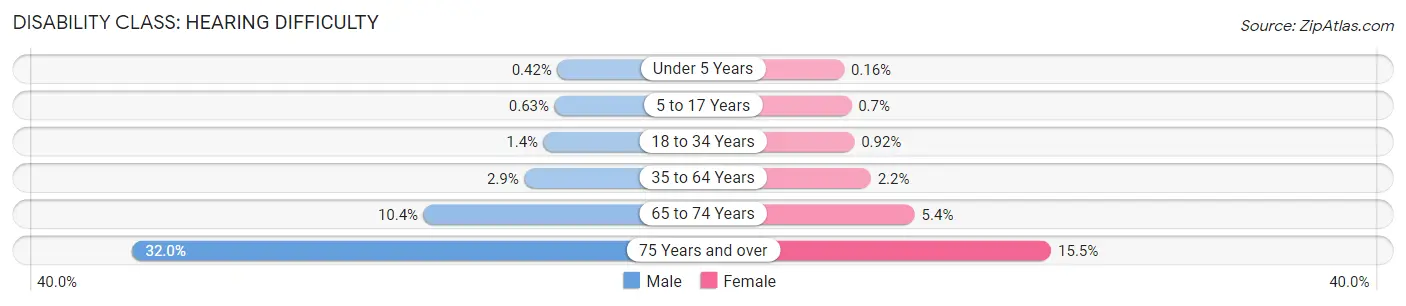
| Age Bracket | Male | Female |
| Under 5 Years | 38 (0.4%) | 14 (0.2%) |
| 5 to 17 Years | 120 (0.6%) | 129 (0.7%) |
| 18 to 34 Years | 589 (1.4%) | 406 (0.9%) |
| 35 to 64 Years | 1,580 (2.9%) | 1,218 (2.1%) |
| 65 to 74 Years | 1,284 (10.3%) | 778 (5.4%) |
| 75 Years and over | 1,798 (32.0%) | 1,487 (15.5%) |
Disability Class: Vision Difficulty
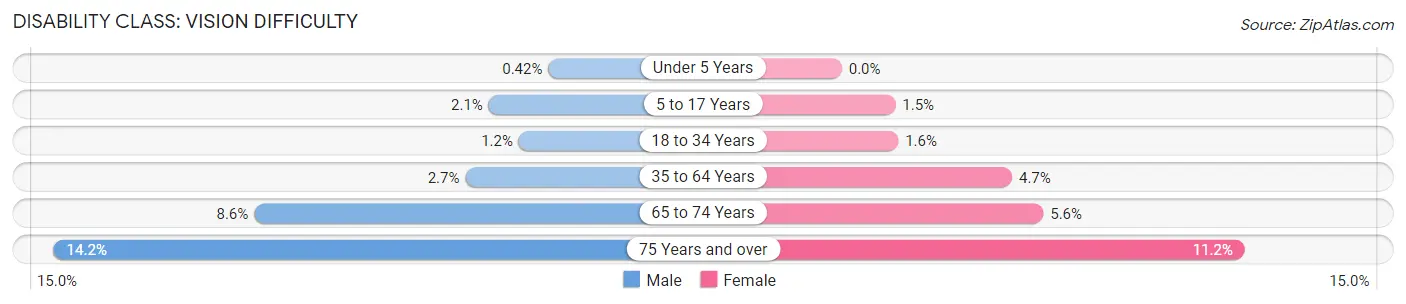
| Age Bracket | Male | Female |
| Under 5 Years | 38 (0.4%) | 0 (0.0%) |
| 5 to 17 Years | 397 (2.1%) | 275 (1.5%) |
| 18 to 34 Years | 505 (1.2%) | 695 (1.6%) |
| 35 to 64 Years | 1,499 (2.7%) | 2,683 (4.7%) |
| 65 to 74 Years | 1,068 (8.6%) | 807 (5.6%) |
| 75 Years and over | 798 (14.2%) | 1,074 (11.2%) |
Disability Class: Cognitive Difficulty
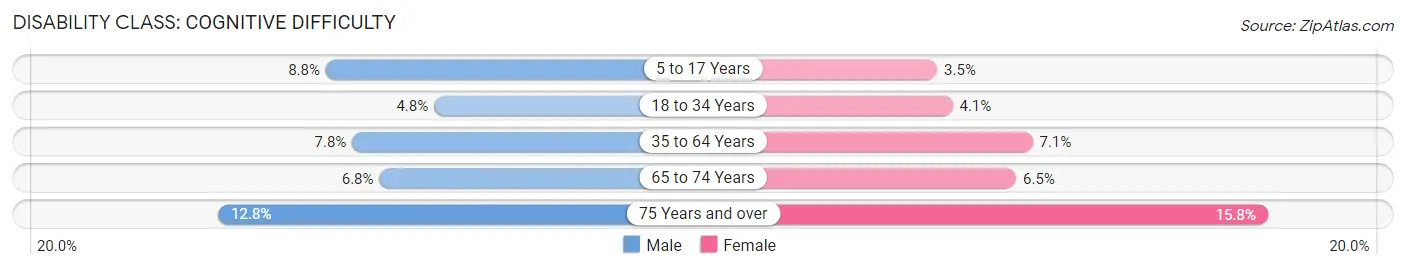
| Age Bracket | Male | Female |
| 5 to 17 Years | 1,679 (8.8%) | 651 (3.5%) |
| 18 to 34 Years | 1,964 (4.8%) | 1,824 (4.1%) |
| 35 to 64 Years | 4,302 (7.8%) | 4,009 (7.1%) |
| 65 to 74 Years | 848 (6.8%) | 931 (6.5%) |
| 75 Years and over | 721 (12.8%) | 1,513 (15.8%) |
Disability Class: Ambulatory Difficulty
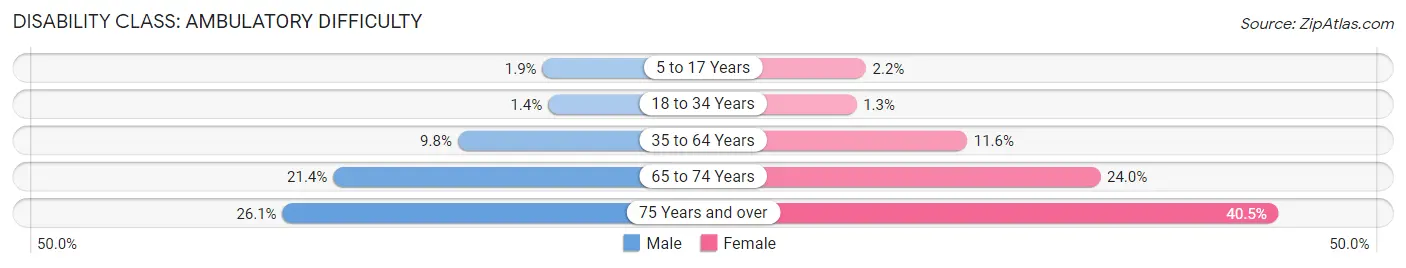
| Age Bracket | Male | Female |
| 5 to 17 Years | 370 (1.9%) | 407 (2.2%) |
| 18 to 34 Years | 579 (1.4%) | 594 (1.3%) |
| 35 to 64 Years | 5,381 (9.8%) | 6,569 (11.6%) |
| 65 to 74 Years | 2,651 (21.4%) | 3,447 (24.0%) |
| 75 Years and over | 1,466 (26.1%) | 3,880 (40.5%) |
Disability Class: Self-Care Difficulty
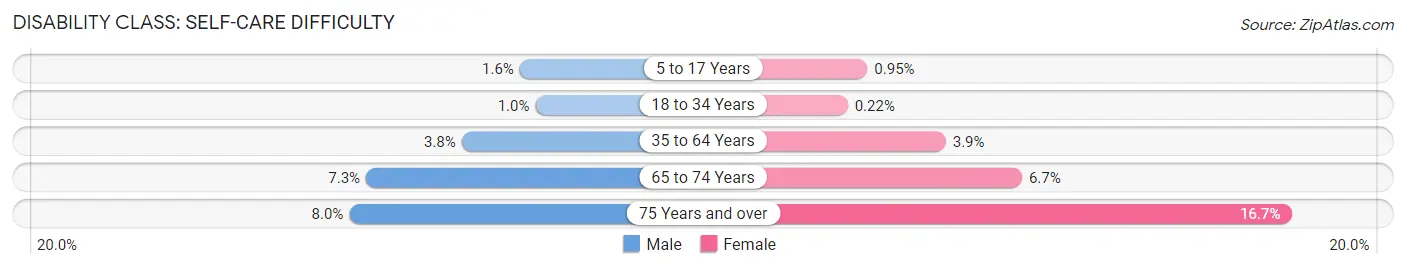
| Age Bracket | Male | Female |
| 5 to 17 Years | 309 (1.6%) | 175 (0.9%) |
| 18 to 34 Years | 425 (1.0%) | 96 (0.2%) |
| 35 to 64 Years | 2,074 (3.8%) | 2,185 (3.9%) |
| 65 to 74 Years | 909 (7.3%) | 962 (6.7%) |
| 75 Years and over | 447 (8.0%) | 1,600 (16.7%) |
Technology Access in St Louis
Computing Device Access in St Louis
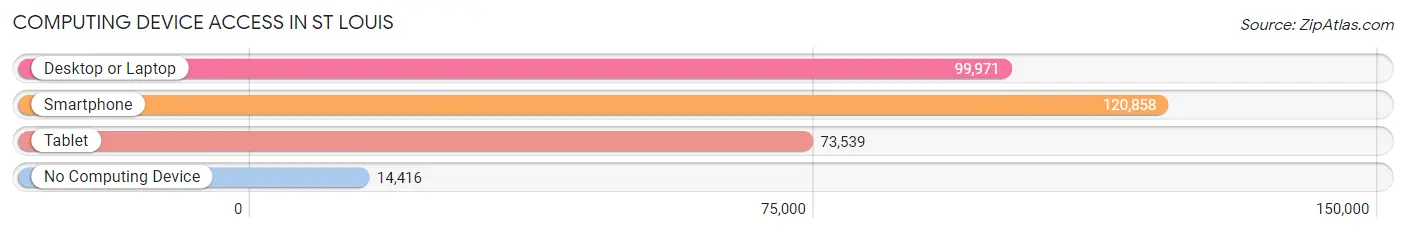
| Device Type | # Households | % Households |
| Desktop or Laptop | 99,971 | 69.9% |
| Smartphone | 120,858 | 84.5% |
| Tablet | 73,539 | 51.4% |
| No Computing Device | 14,416 | 10.1% |
| Total | 143,059 | 100.0% |
Internet Access in St Louis
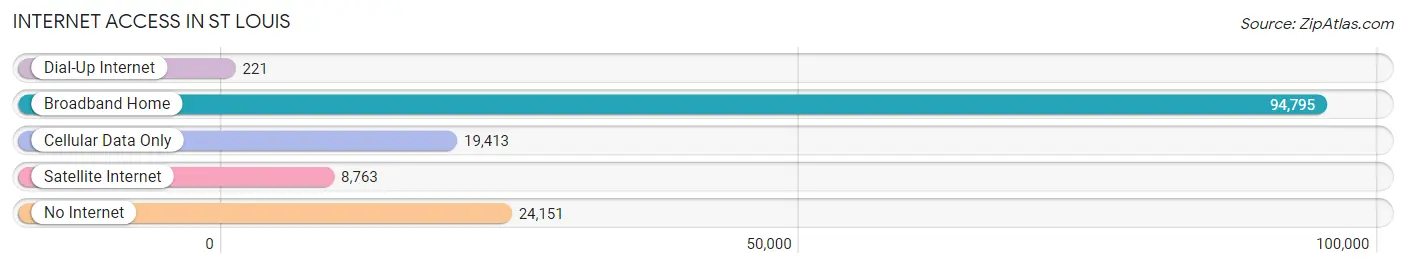
| Internet Type | # Households | % Households |
| Dial-Up Internet | 221 | 0.2% |
| Broadband Home | 94,795 | 66.3% |
| Cellular Data Only | 19,413 | 13.6% |
| Satellite Internet | 8,763 | 6.1% |
| No Internet | 24,151 | 16.9% |
| Total | 143,059 | 100.0% |
St Louis Summary
St. Louis, Missouri is a city located in the eastern part of the state, along the Mississippi River. It is the second-largest city in Missouri and the largest metropolitan area in the state. St. Louis is known for its rich history, vibrant culture, and diverse economy.
History
St. Louis was founded in 1764 by Pierre Laclede and Auguste Chouteau, two French fur traders. The city was named after King Louis IX of France and was originally a trading post for fur and other goods. In 1804, the city was incorporated as a city and became the first major city west of the Mississippi River.
Throughout the 19th century, St. Louis grew rapidly and became an important port city. It was a major hub for the steamboat industry and was home to the first steamboat to travel the Mississippi River. The city was also a major center for the railroad industry and was the starting point for the first transcontinental railroad.
In the 20th century, St. Louis became a major industrial center. The city was home to several large companies, including Anheuser-Busch, Ralston Purina, and McDonnell Douglas. The city also became a major center for the aerospace industry and was home to the first commercial airline.
Geography
St. Louis is located in the eastern part of Missouri, along the Mississippi River. The city is situated on the western bank of the river and is bordered by the states of Illinois and Iowa. The city is located in the Central Lowland region of the United States and is part of the larger Midwestern region.
The city has a total area of 66.2 square miles, of which 62.2 square miles is land and 4.0 square miles is water. The city is located at an elevation of 486 feet above sea level.
Economy
St. Louis has a diverse economy that is driven by several industries. The city is home to several large companies, including Anheuser-Busch, Ralston Purina, and McDonnell Douglas. The city is also a major center for the aerospace industry and is home to the first commercial airline.
The city is also a major center for the financial services industry and is home to several large banks and financial institutions. The city is also a major center for the healthcare industry and is home to several large hospitals and medical centers.
Demographics
As of the 2010 census, St. Louis had a population of 319,294. The city has a population density of 4,817 people per square mile. The racial makeup of the city is 57.2% White, 33.7% African American, 0.3% Native American, 2.2% Asian, 0.1% Pacific Islander, and 5.5% from other races.
The median household income in St. Louis is $37,722 and the median family income is $45,945. The city has a poverty rate of 27.2%. The city has a high rate of educational attainment, with 87.3% of the population having a high school diploma or higher and 33.2% having a bachelor's degree or higher.
Common Questions
What is Per Capita Income in St Louis?
Per Capita income in St Louis is $36,722.
What is the Median Family Income in St Louis?
Median Family Income in St Louis is $72,655.
What is the Median Household income in St Louis?
Median Household Income in St Louis is $52,941.
What is Income or Wage Gap in St Louis?
Income or Wage Gap in St Louis is 19.8%.
Women in St Louis earn 80.2 cents for every dollar earned by a man.
What is Family Income Deficit in St Louis?
Family Income Deficit in St Louis is $11,963.
Families that are below poverty line in St Louis earn $11,963 less on average than the poverty threshold level.
What is Inequality or Gini Index in St Louis?
Inequality or Gini Index in St Louis is 0.50.
What is the Total Population of St Louis?
Total Population of St Louis is 298,018.
What is the Total Male Population of St Louis?
Total Male Population of St Louis is 144,893.
What is the Total Female Population of St Louis?
Total Female Population of St Louis is 153,125.
What is the Ratio of Males per 100 Females in St Louis?
There are 94.62 Males per 100 Females in St Louis.
What is the Ratio of Females per 100 Males in St Louis?
There are 105.68 Females per 100 Males in St Louis.
What is the Median Population Age in St Louis?
Median Population Age in St Louis is 36.5 Years.
What is the Average Family Size in St Louis
Average Family Size in St Louis is 3.0 People.
What is the Average Household Size in St Louis
Average Household Size in St Louis is 2.0 People.
How Large is the Labor Force in St Louis?
There are 164,326 People in the Labor Forcein in St Louis.
What is the Percentage of People in the Labor Force in St Louis?
66.2% of People are in the Labor Force in St Louis.
What is the Unemployment Rate in St Louis?
Unemployment Rate in St Louis is 5.4%.