New Orleans, LA Map & Demographics
New Orleans Map
New Orleans Overview
$37,013
PER CAPITA INCOME
$73,549
AVG FAMILY INCOME
$51,116
AVG HOUSEHOLD INCOME
25.2%
WAGE / INCOME GAP [ % ]
74.8¢/ $1
WAGE / INCOME GAP [ $ ]
$11,648
FAMILY INCOME DEFICIT
0.56
INEQUALITY / GINI INDEX
380,408
TOTAL POPULATION
179,688
MALE POPULATION
200,720
FEMALE POPULATION
89.52
MALES / 100 FEMALES
111.70
FEMALES / 100 MALES
37.9
MEDIAN AGE
3.5
AVG FAMILY SIZE
2.4
AVG HOUSEHOLD SIZE
191,782
LABOR FORCE [ PEOPLE ]
61.2%
PERCENT IN LABOR FORCE
8.4%
UNEMPLOYMENT RATE
New Orleans Zip Codes
Income in New Orleans
Income Overview in New Orleans
Per Capita Income in New Orleans is $37,013, while median incomes of families and households are $73,549 and $51,116 respectively.
| Characteristic | Number | Measure |
| Per Capita Income | 380,408 | $37,013 |
| Median Family Income | 72,544 | $73,549 |
| Mean Family Income | 72,544 | $114,432 |
| Median Household Income | 155,669 | $51,116 |
| Mean Household Income | 155,669 | $84,158 |
| Income Deficit | 72,544 | $11,648 |
| Wage / Income Gap (%) | 380,408 | 25.15% |
| Wage / Income Gap ($) | 380,408 | 74.85¢ per $1 |
| Gini / Inequality Index | 380,408 | 0.56 |
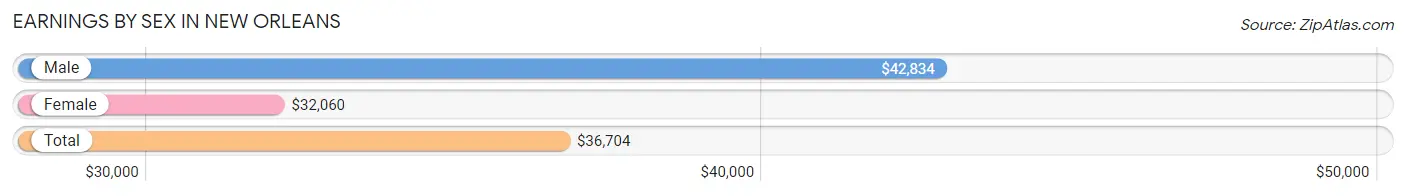
Earnings by Sex in New Orleans
Average Earnings in New Orleans are $36,704, $42,834 for men and $32,060 for women, a difference of 25.2%.
| Sex | Number | Average Earnings |
| Male | 95,271 (47.8%) | $42,834 |
| Female | 104,177 (52.2%) | $32,060 |
| Total | 199,448 (100.0%) | $36,704 |
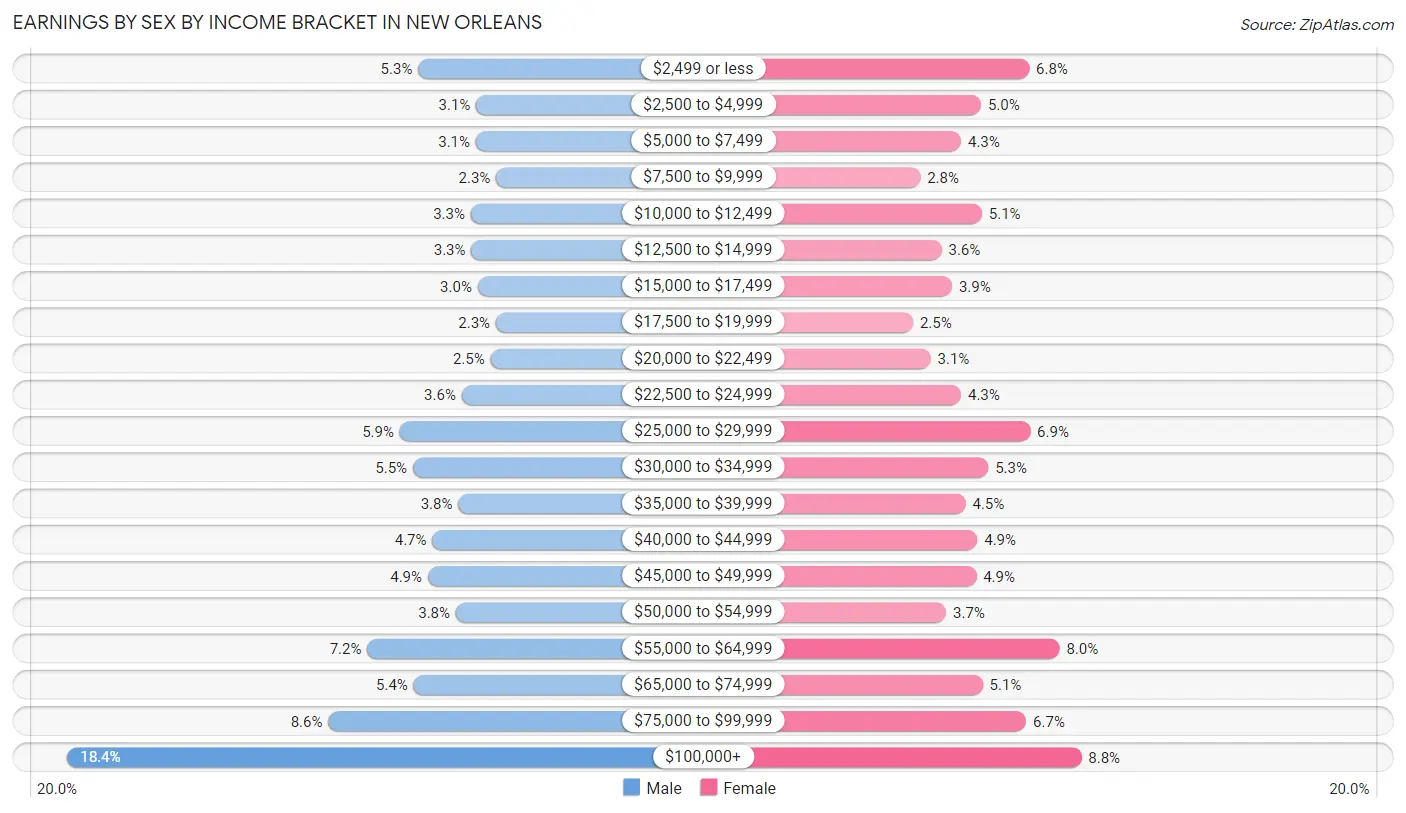
Earnings by Sex by Income Bracket in New Orleans
The most common earnings brackets in New Orleans are $100,000+ for men (17,533 | 18.4%) and $100,000+ for women (9,160 | 8.8%).
| Income | Male | Female |
| $2,499 or less | 5,006 (5.2%) | 7,115 (6.8%) |
| $2,500 to $4,999 | 2,932 (3.1%) | 5,235 (5.0%) |
| $5,000 to $7,499 | 2,942 (3.1%) | 4,461 (4.3%) |
| $7,500 to $9,999 | 2,222 (2.3%) | 2,865 (2.8%) |
| $10,000 to $12,499 | 3,126 (3.3%) | 5,275 (5.1%) |
| $12,500 to $14,999 | 3,104 (3.3%) | 3,698 (3.5%) |
| $15,000 to $17,499 | 2,876 (3.0%) | 4,101 (3.9%) |
| $17,500 to $19,999 | 2,225 (2.3%) | 2,586 (2.5%) |
| $20,000 to $22,499 | 2,422 (2.5%) | 3,272 (3.1%) |
| $22,500 to $24,999 | 3,448 (3.6%) | 4,460 (4.3%) |
| $25,000 to $29,999 | 5,663 (5.9%) | 7,162 (6.9%) |
| $30,000 to $34,999 | 5,191 (5.4%) | 5,522 (5.3%) |
| $35,000 to $39,999 | 3,569 (3.7%) | 4,639 (4.4%) |
| $40,000 to $44,999 | 4,494 (4.7%) | 5,095 (4.9%) |
| $45,000 to $49,999 | 4,662 (4.9%) | 5,048 (4.9%) |
| $50,000 to $54,999 | 3,662 (3.8%) | 3,878 (3.7%) |
| $55,000 to $64,999 | 6,817 (7.2%) | 8,299 (8.0%) |
| $65,000 to $74,999 | 5,164 (5.4%) | 5,301 (5.1%) |
| $75,000 to $99,999 | 8,213 (8.6%) | 7,005 (6.7%) |
| $100,000+ | 17,533 (18.4%) | 9,160 (8.8%) |
| Total | 95,271 (100.0%) | 104,177 (100.0%) |
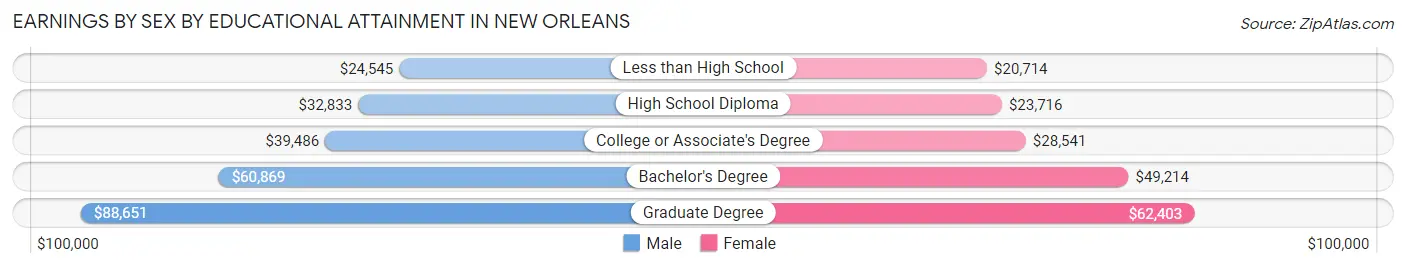
Earnings by Sex by Educational Attainment in New Orleans
Average earnings in New Orleans are $47,401 for men and $37,405 for women, a difference of 21.1%. Men with an educational attainment of graduate degree enjoy the highest average annual earnings of $88,651, while those with less than high school education earn the least with $24,545. Women with an educational attainment of graduate degree earn the most with the average annual earnings of $62,403, while those with less than high school education have the smallest earnings of $20,714.
| Educational Attainment | Male Income | Female Income |
| Less than High School | $24,545 | $20,714 |
| High School Diploma | $32,833 | $23,716 |
| College or Associate's Degree | $39,486 | $28,541 |
| Bachelor's Degree | $60,869 | $49,214 |
| Graduate Degree | $88,651 | $62,403 |
| Total | $47,401 | $37,405 |
Family Income in New Orleans
Family Income Brackets in New Orleans
According to the New Orleans family income data, there are 11,172 families falling into the $100,000 to $149,999 income range, which is the most common income bracket and makes up 15.4% of all families. Conversely, the $10,000 to $14,999 income bracket is the least frequent group with only 2,829 families (3.9%) belonging to this category.
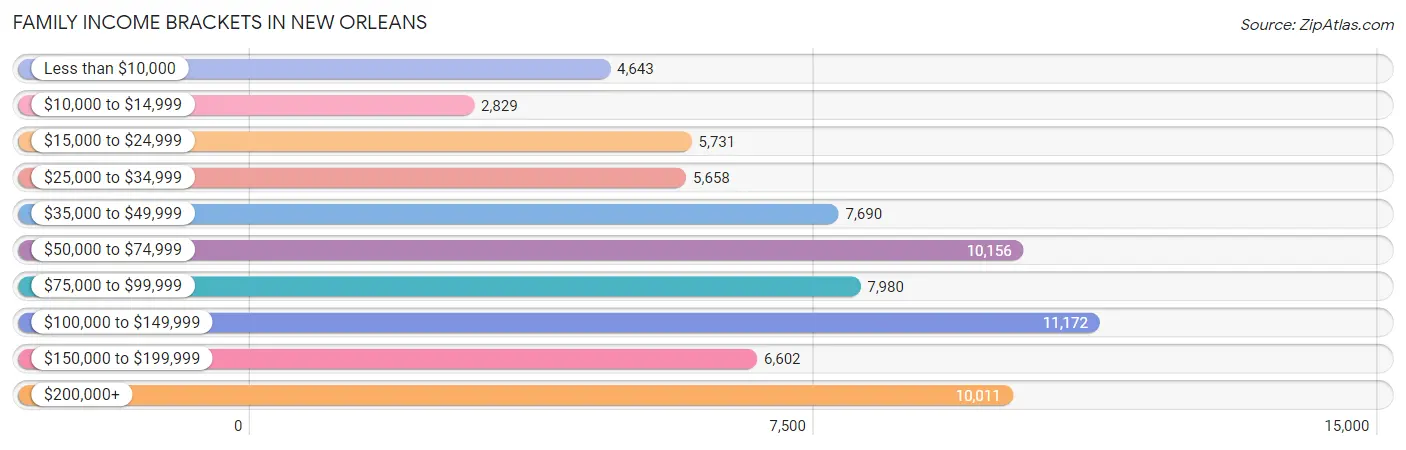
| Income Bracket | # Families | % Families |
| Less than $10,000 | 4,643 | 6.4% |
| $10,000 to $14,999 | 2,829 | 3.9% |
| $15,000 to $24,999 | 5,731 | 7.9% |
| $25,000 to $34,999 | 5,658 | 7.8% |
| $35,000 to $49,999 | 7,690 | 10.6% |
| $50,000 to $74,999 | 10,156 | 14.0% |
| $75,000 to $99,999 | 7,980 | 11.0% |
| $100,000 to $149,999 | 11,172 | 15.4% |
| $150,000 to $199,999 | 6,602 | 9.1% |
| $200,000+ | 10,011 | 13.8% |
Family Income by Famaliy Size in New Orleans
7+ person families (633 | 0.9%) account for the highest median family income in New Orleans with $88,472 per family, while 2-person families (36,775 | 50.7%) have the highest median income of $35,602 per family member.
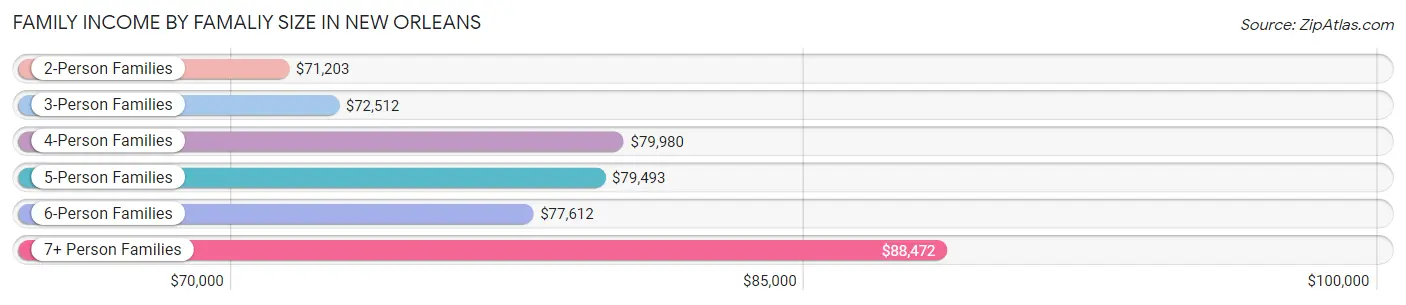
| Income Bracket | # Families | Median Income |
| 2-Person Families | 36,775 (50.7%) | $71,203 |
| 3-Person Families | 18,200 (25.1%) | $72,512 |
| 4-Person Families | 11,476 (15.8%) | $79,980 |
| 5-Person Families | 4,001 (5.5%) | $79,493 |
| 6-Person Families | 1,459 (2.0%) | $77,612 |
| 7+ Person Families | 633 (0.9%) | $88,472 |
| Total | 72,544 (100.0%) | $73,549 |
Family Income by Number of Earners in New Orleans
The median family income in New Orleans is $73,549, with families comprising 3+ earners (4,739) having the highest median family income of $132,208, while families with no earners (11,492) have the lowest median family income of $24,311, accounting for 6.5% and 15.8% of families, respectively.
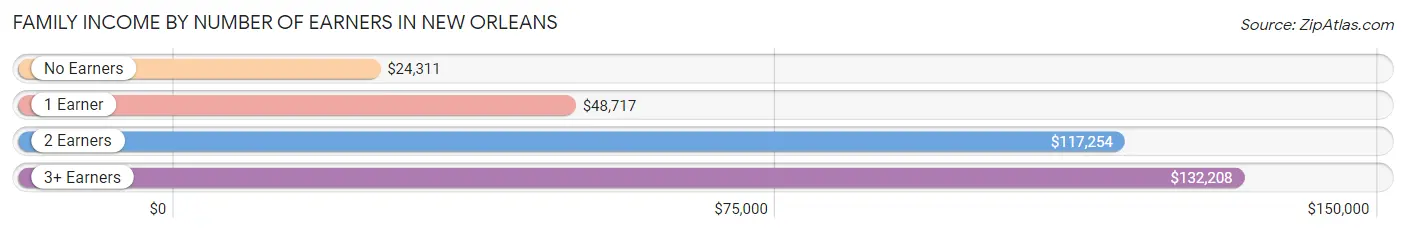
| Number of Earners | # Families | Median Income |
| No Earners | 11,492 (15.8%) | $24,311 |
| 1 Earner | 26,846 (37.0%) | $48,717 |
| 2 Earners | 29,467 (40.6%) | $117,254 |
| 3+ Earners | 4,739 (6.5%) | $132,208 |
| Total | 72,544 (100.0%) | $73,549 |
Household Income in New Orleans
Household Income Brackets in New Orleans
With 23,195 households falling in the category, the $50,000 to $74,999 income range is the most frequent in New Orleans, accounting for 14.9% of all households. In contrast, only 9,340 households (6.0%) fall into the $150,000 to $199,999 income bracket, making it the least populous group.
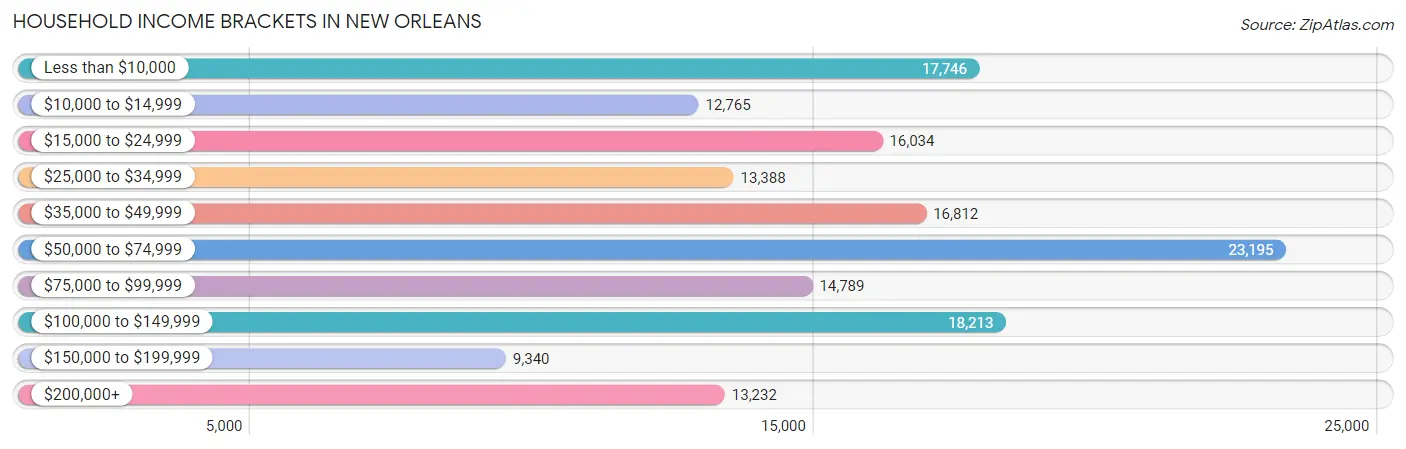
| Income Bracket | # Households | % Households |
| Less than $10,000 | 17,746 | 11.4% |
| $10,000 to $14,999 | 12,765 | 8.2% |
| $15,000 to $24,999 | 16,034 | 10.3% |
| $25,000 to $34,999 | 13,388 | 8.6% |
| $35,000 to $49,999 | 16,812 | 10.8% |
| $50,000 to $74,999 | 23,195 | 14.9% |
| $75,000 to $99,999 | 14,789 | 9.5% |
| $100,000 to $149,999 | 18,213 | 11.7% |
| $150,000 to $199,999 | 9,340 | 6.0% |
| $200,000+ | 13,232 | 8.5% |
Household Income by Householder Age in New Orleans
The median household income in New Orleans is $51,116, with the highest median household income of $60,649 found in the 25 to 44 years age bracket for the primary householder. A total of 56,550 households (36.3%) fall into this category. Meanwhile, the 15 to 24 years age bracket for the primary householder has the lowest median household income of $19,263, with 3,634 households (2.3%) in this group.
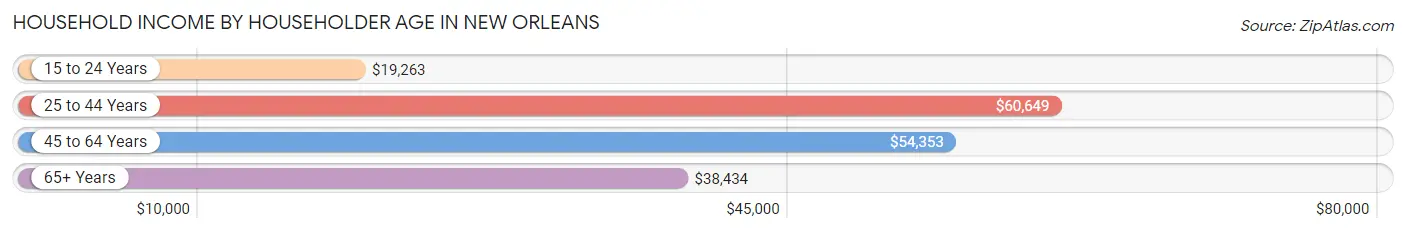
| Income Bracket | # Households | Median Income |
| 15 to 24 Years | 3,634 (2.3%) | $19,263 |
| 25 to 44 Years | 56,550 (36.3%) | $60,649 |
| 45 to 64 Years | 56,581 (36.3%) | $54,353 |
| 65+ Years | 38,904 (25.0%) | $38,434 |
| Total | 155,669 (100.0%) | $51,116 |
Poverty in New Orleans
Income Below Poverty by Sex and Age in New Orleans
With 21.3% poverty level for males and 24.4% for females among the residents of New Orleans, 12 to 14 year old males and 16 and 17 year old females are the most vulnerable to poverty, with 2,401 males (36.9%) and 1,606 females (38.9%) in their respective age groups living below the poverty level.
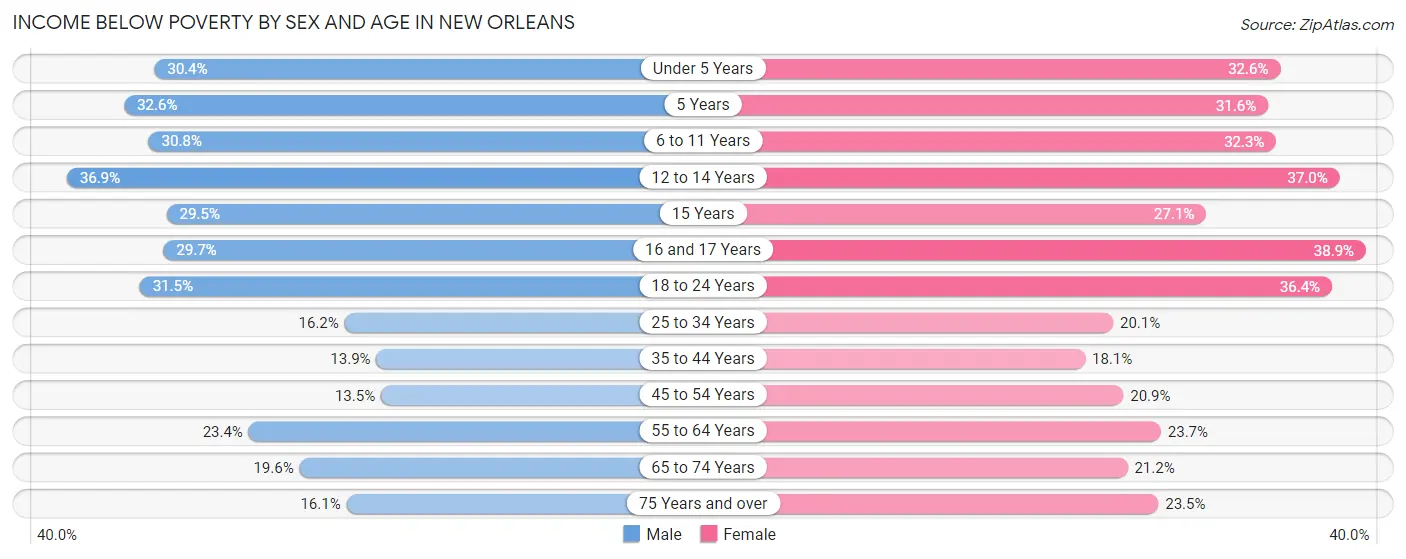
| Age Bracket | Male | Female |
| Under 5 Years | 3,261 (30.4%) | 3,314 (32.6%) |
| 5 Years | 608 (32.6%) | 584 (31.6%) |
| 6 to 11 Years | 3,800 (30.8%) | 3,876 (32.3%) |
| 12 to 14 Years | 2,401 (36.9%) | 2,368 (37.0%) |
| 15 Years | 723 (29.5%) | 497 (27.1%) |
| 16 and 17 Years | 1,029 (29.7%) | 1,606 (38.9%) |
| 18 to 24 Years | 4,177 (31.5%) | 4,812 (36.4%) |
| 25 to 34 Years | 4,605 (16.2%) | 6,613 (20.1%) |
| 35 to 44 Years | 3,543 (13.9%) | 5,172 (18.1%) |
| 45 to 54 Years | 2,825 (13.5%) | 4,774 (20.9%) |
| 55 to 64 Years | 5,332 (23.4%) | 6,142 (23.7%) |
| 65 to 74 Years | 3,329 (19.6%) | 4,345 (21.2%) |
| 75 Years and over | 1,375 (16.1%) | 3,022 (23.5%) |
| Total | 37,008 (21.3%) | 47,125 (24.4%) |
Income Above Poverty by Sex and Age in New Orleans
According to the poverty statistics in New Orleans, males aged 45 to 54 years and females aged 35 to 44 years are the age groups that are most secure financially, with 86.5% of males and 81.9% of females in these age groups living above the poverty line.
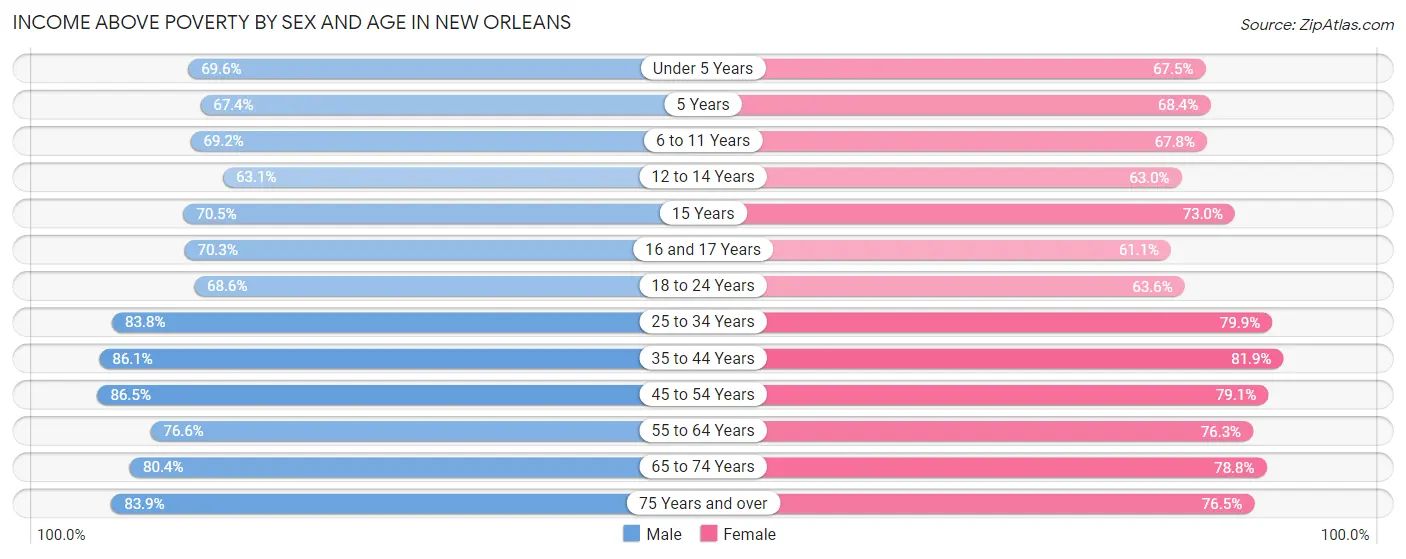
| Age Bracket | Male | Female |
| Under 5 Years | 7,476 (69.6%) | 6,867 (67.4%) |
| 5 Years | 1,256 (67.4%) | 1,262 (68.4%) |
| 6 to 11 Years | 8,541 (69.2%) | 8,143 (67.7%) |
| 12 to 14 Years | 4,112 (63.1%) | 4,039 (63.0%) |
| 15 Years | 1,731 (70.5%) | 1,340 (73.0%) |
| 16 and 17 Years | 2,437 (70.3%) | 2,521 (61.1%) |
| 18 to 24 Years | 9,106 (68.5%) | 8,410 (63.6%) |
| 25 to 34 Years | 23,750 (83.8%) | 26,224 (79.9%) |
| 35 to 44 Years | 21,981 (86.1%) | 23,466 (81.9%) |
| 45 to 54 Years | 18,035 (86.5%) | 18,073 (79.1%) |
| 55 to 64 Years | 17,492 (76.6%) | 19,790 (76.3%) |
| 65 to 74 Years | 13,664 (80.4%) | 16,140 (78.8%) |
| 75 Years and over | 7,168 (83.9%) | 9,836 (76.5%) |
| Total | 136,749 (78.7%) | 146,111 (75.6%) |
Income Below Poverty Among Married-Couple Families in New Orleans
The poverty statistics for married-couple families in New Orleans show that 5.3% or 2,227 of the total 42,015 families live below the poverty line. Families with 5 or more children have the highest poverty rate of 21.1%, comprising of 34 families. On the other hand, families with no children have the lowest poverty rate of 4.3%, which includes 1,157 families.
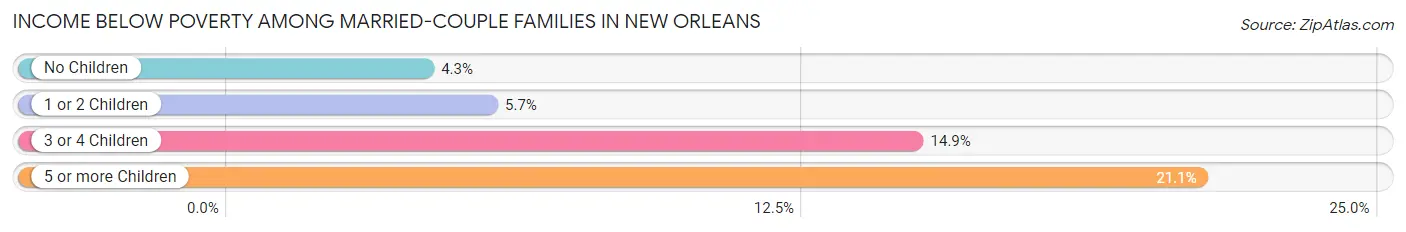
| Children | Above Poverty | Below Poverty |
| No Children | 25,935 (95.7%) | 1,157 (4.3%) |
| 1 or 2 Children | 11,884 (94.3%) | 713 (5.7%) |
| 3 or 4 Children | 1,842 (85.1%) | 323 (14.9%) |
| 5 or more Children | 127 (78.9%) | 34 (21.1%) |
| Total | 39,788 (94.7%) | 2,227 (5.3%) |
Income Below Poverty Among Single-Parent Households in New Orleans
According to the poverty data in New Orleans, 20.8% or 1,178 single-father households and 34.5% or 8,583 single-mother households are living below the poverty line. Among single-father households, those with 5 or more children have the highest poverty rate, with 10 households (100.0%) experiencing poverty. Likewise, among single-mother households, those with 5 or more children have the highest poverty rate, with 222 households (76.0%) falling below the poverty line.
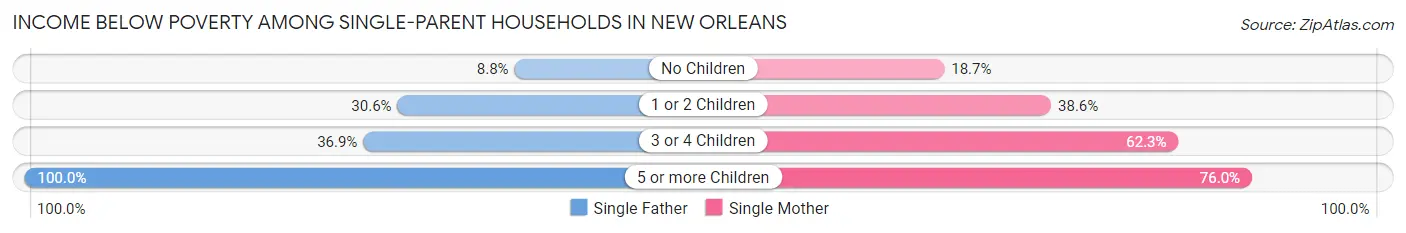
| Children | Single Father | Single Mother |
| No Children | 236 (8.8%) | 1,740 (18.7%) |
| 1 or 2 Children | 785 (30.6%) | 4,738 (38.6%) |
| 3 or 4 Children | 147 (36.9%) | 1,883 (62.3%) |
| 5 or more Children | 10 (100.0%) | 222 (76.0%) |
| Total | 1,178 (20.8%) | 8,583 (34.5%) |
Income Below Poverty Among Married-Couple vs Single-Parent Households in New Orleans
The poverty data for New Orleans shows that 2,227 of the married-couple family households (5.3%) and 9,761 of the single-parent households (32.0%) are living below the poverty level. Within the married-couple family households, those with 5 or more children have the highest poverty rate, with 34 households (21.1%) falling below the poverty line. Among the single-parent households, those with 5 or more children have the highest poverty rate, with 232 household (76.8%) living below poverty.
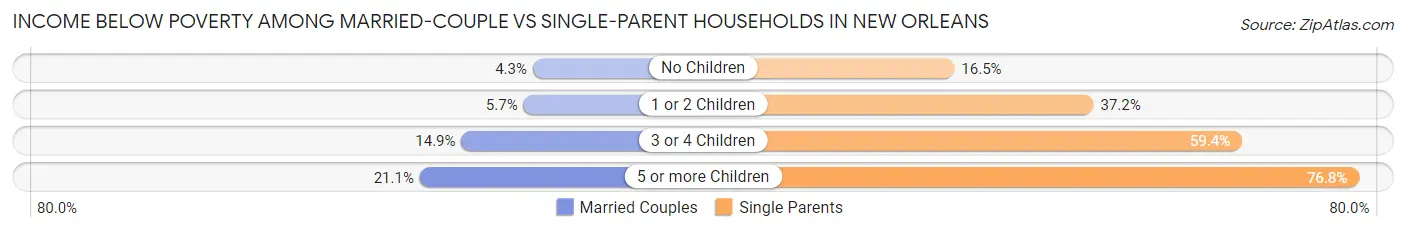
| Children | Married-Couple Families | Single-Parent Households |
| No Children | 1,157 (4.3%) | 1,976 (16.5%) |
| 1 or 2 Children | 713 (5.7%) | 5,523 (37.2%) |
| 3 or 4 Children | 323 (14.9%) | 2,030 (59.4%) |
| 5 or more Children | 34 (21.1%) | 232 (76.8%) |
| Total | 2,227 (5.3%) | 9,761 (32.0%) |
Race in New Orleans
The most populous races in New Orleans are Black / African American (216,866 | 57.0%), White / Caucasian (123,390 | 32.4%), and Hispanic or Latino (21,528 | 5.7%).
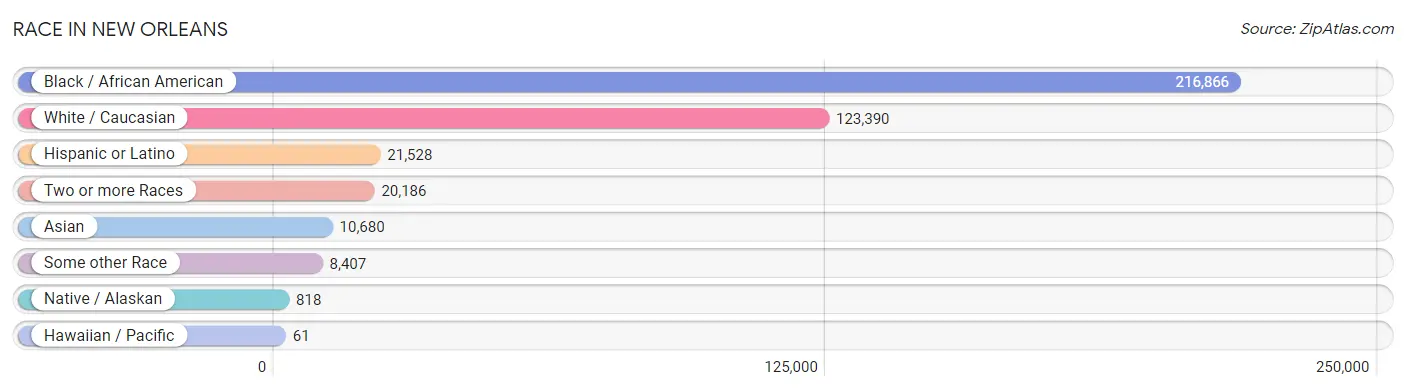
| Race | # Population | % Population |
| Asian | 10,680 | 2.8% |
| Black / African American | 216,866 | 57.0% |
| Hawaiian / Pacific | 61 | 0.0% |
| Hispanic or Latino | 21,528 | 5.7% |
| Native / Alaskan | 818 | 0.2% |
| White / Caucasian | 123,390 | 32.4% |
| Two or more Races | 20,186 | 5.3% |
| Some other Race | 8,407 | 2.2% |
| Total | 380,408 | 100.0% |
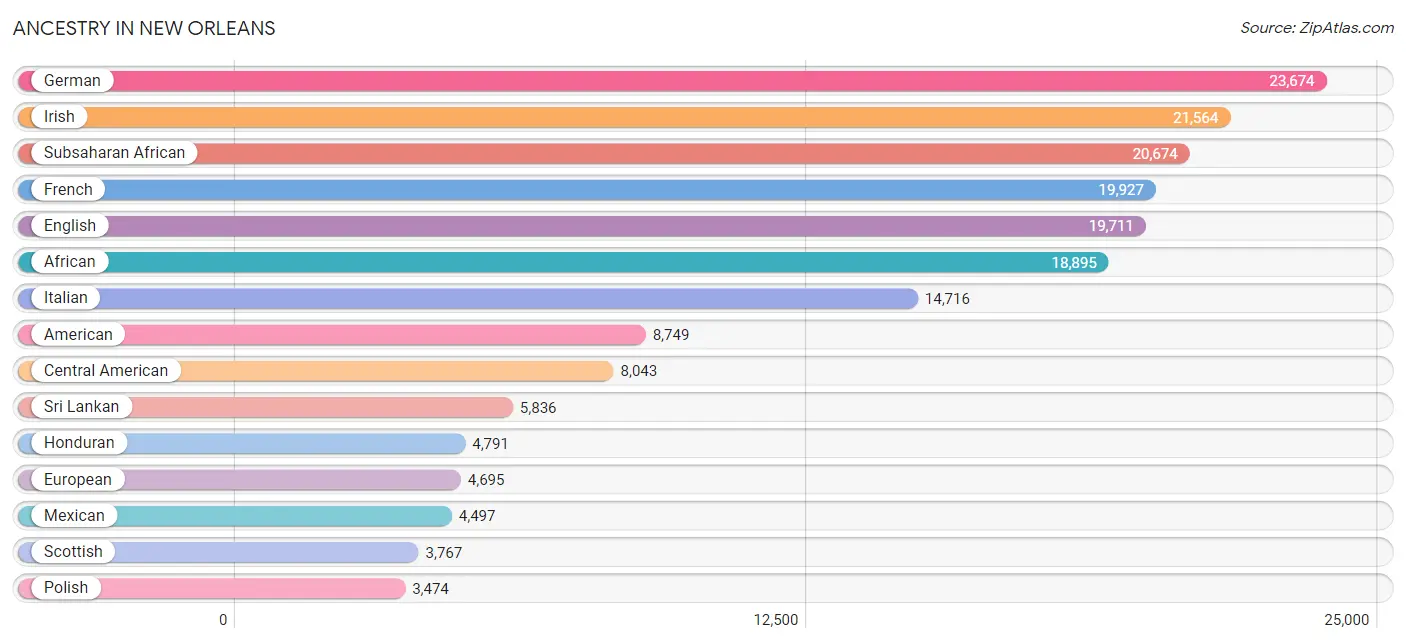
Ancestry in New Orleans
The most populous ancestries reported in New Orleans are German (23,674 | 6.2%), Irish (21,564 | 5.7%), Subsaharan African (20,674 | 5.4%), French (19,927 | 5.2%), and English (19,711 | 5.2%), together accounting for 27.7% of all New Orleans residents.
| Ancestry | # Population | % Population |
| African | 18,895 | 5.0% |
| Alaska Native | 19 | 0.0% |
| Alaskan Athabascan | 2 | 0.0% |
| Albanian | 81 | 0.0% |
| Aleut | 6 | 0.0% |
| Alsatian | 34 | 0.0% |
| American | 8,749 | 2.3% |
| Apache | 47 | 0.0% |
| Arab | 937 | 0.3% |
| Arapaho | 4 | 0.0% |
| Argentinean | 237 | 0.1% |
| Armenian | 195 | 0.1% |
| Australian | 58 | 0.0% |
| Austrian | 368 | 0.1% |
| Bahamian | 7 | 0.0% |
| Barbadian | 52 | 0.0% |
| Basque | 118 | 0.0% |
| Belgian | 367 | 0.1% |
| Belizean | 75 | 0.0% |
| Bhutanese | 773 | 0.2% |
| Blackfeet | 173 | 0.1% |
| Bolivian | 88 | 0.0% |
| Brazilian | 194 | 0.1% |
| British | 1,995 | 0.5% |
| British West Indian | 61 | 0.0% |
| Bulgarian | 63 | 0.0% |
| Burmese | 657 | 0.2% |
| Cajun | 1,064 | 0.3% |
| Cambodian | 6 | 0.0% |
| Canadian | 383 | 0.1% |
| Celtic | 23 | 0.0% |
| Central American | 8,043 | 2.1% |
| Central American Indian | 366 | 0.1% |
| Cherokee | 803 | 0.2% |
| Chickasaw | 49 | 0.0% |
| Chilean | 134 | 0.0% |
| Chippewa | 29 | 0.0% |
| Choctaw | 451 | 0.1% |
| Colombian | 637 | 0.2% |
| Costa Rican | 243 | 0.1% |
| Creek | 77 | 0.0% |
| Croatian | 344 | 0.1% |
| Cuban | 2,100 | 0.5% |
| Cypriot | 8 | 0.0% |
| Czech | 372 | 0.1% |
| Czechoslovakian | 89 | 0.0% |
| Danish | 462 | 0.1% |
| Dominican | 614 | 0.2% |
| Dutch | 1,467 | 0.4% |
| Eastern European | 1,084 | 0.3% |
| Ecuadorian | 389 | 0.1% |
| Egyptian | 30 | 0.0% |
| English | 19,711 | 5.2% |
| Estonian | 28 | 0.0% |
| Ethiopian | 548 | 0.1% |
| European | 4,695 | 1.2% |
| Filipino | 73 | 0.0% |
| Finnish | 214 | 0.1% |
| French | 19,927 | 5.2% |
| French Canadian | 2,070 | 0.5% |
| German | 23,674 | 6.2% |
| German Russian | 9 | 0.0% |
| Ghanaian | 80 | 0.0% |
| Greek | 933 | 0.3% |
| Guamanian / Chamorro | 35 | 0.0% |
| Guatemalan | 1,007 | 0.3% |
| Guyanese | 52 | 0.0% |
| Haitian | 771 | 0.2% |
| Honduran | 4,791 | 1.3% |
| Hopi | 11 | 0.0% |
| Houma | 110 | 0.0% |
| Hungarian | 653 | 0.2% |
| Indian (Asian) | 2,499 | 0.7% |
| Indonesian | 75 | 0.0% |
| Inupiat | 1 | 0.0% |
| Iranian | 413 | 0.1% |
| Iraqi | 14 | 0.0% |
| Irish | 21,564 | 5.7% |
| Iroquois | 32 | 0.0% |
| Israeli | 205 | 0.1% |
| Italian | 14,716 | 3.9% |
| Jamaican | 893 | 0.2% |
| Japanese | 92 | 0.0% |
| Kenyan | 143 | 0.0% |
| Korean | 1,574 | 0.4% |
| Laotian | 30 | 0.0% |
| Latvian | 130 | 0.0% |
| Lebanese | 461 | 0.1% |
| Lithuanian | 291 | 0.1% |
| Luxembourger | 8 | 0.0% |
| Macedonian | 20 | 0.0% |
| Malaysian | 45 | 0.0% |
| Maltese | 7 | 0.0% |
| Mexican | 4,497 | 1.2% |
| Mexican American Indian | 100 | 0.0% |
| Mongolian | 44 | 0.0% |
| Moroccan | 52 | 0.0% |
| Native Hawaiian | 146 | 0.0% |
| Navajo | 81 | 0.0% |
| New Zealander | 4 | 0.0% |
| Nicaraguan | 1,047 | 0.3% |
| Nigerian | 404 | 0.1% |
| Northern European | 407 | 0.1% |
| Norwegian | 1,048 | 0.3% |
| Paiute | 3 | 0.0% |
| Pakistani | 253 | 0.1% |
| Palestinian | 139 | 0.0% |
| Panamanian | 153 | 0.0% |
| Paraguayan | 5 | 0.0% |
| Pennsylvania German | 66 | 0.0% |
| Peruvian | 305 | 0.1% |
| Polish | 3,474 | 0.9% |
| Portuguese | 748 | 0.2% |
| Pueblo | 25 | 0.0% |
| Puerto Rican | 1,144 | 0.3% |
| Romanian | 296 | 0.1% |
| Russian | 1,633 | 0.4% |
| Salvadoran | 494 | 0.1% |
| Samoan | 14 | 0.0% |
| Scandinavian | 492 | 0.1% |
| Scotch-Irish | 2,317 | 0.6% |
| Scottish | 3,767 | 1.0% |
| Seminole | 70 | 0.0% |
| Senegalese | 78 | 0.0% |
| Serbian | 136 | 0.0% |
| Sioux | 136 | 0.0% |
| Slavic | 40 | 0.0% |
| Slovak | 115 | 0.0% |
| Slovene | 163 | 0.0% |
| Somali | 9 | 0.0% |
| South African | 51 | 0.0% |
| South American | 2,091 | 0.5% |
| South American Indian | 33 | 0.0% |
| Spaniard | 920 | 0.2% |
| Spanish | 1,219 | 0.3% |
| Spanish American | 16 | 0.0% |
| Sri Lankan | 5,836 | 1.5% |
| Subsaharan African | 20,674 | 5.4% |
| Swedish | 1,518 | 0.4% |
| Swiss | 324 | 0.1% |
| Syrian | 79 | 0.0% |
| Thai | 1,686 | 0.4% |
| Trinidadian and Tobagonian | 249 | 0.1% |
| Tsimshian | 12 | 0.0% |
| Turkish | 143 | 0.0% |
| U.S. Virgin Islander | 14 | 0.0% |
| Ugandan | 13 | 0.0% |
| Ukrainian | 314 | 0.1% |
| Uruguayan | 15 | 0.0% |
| Venezuelan | 241 | 0.1% |
| Vietnamese | 45 | 0.0% |
| Welsh | 1,404 | 0.4% |
| West Indian | 648 | 0.2% |
| Yaqui | 24 | 0.0% |
| Yugoslavian | 70 | 0.0% |
| Zimbabwean | 39 | 0.0% | View All 156 Rows |
Immigrants in New Orleans
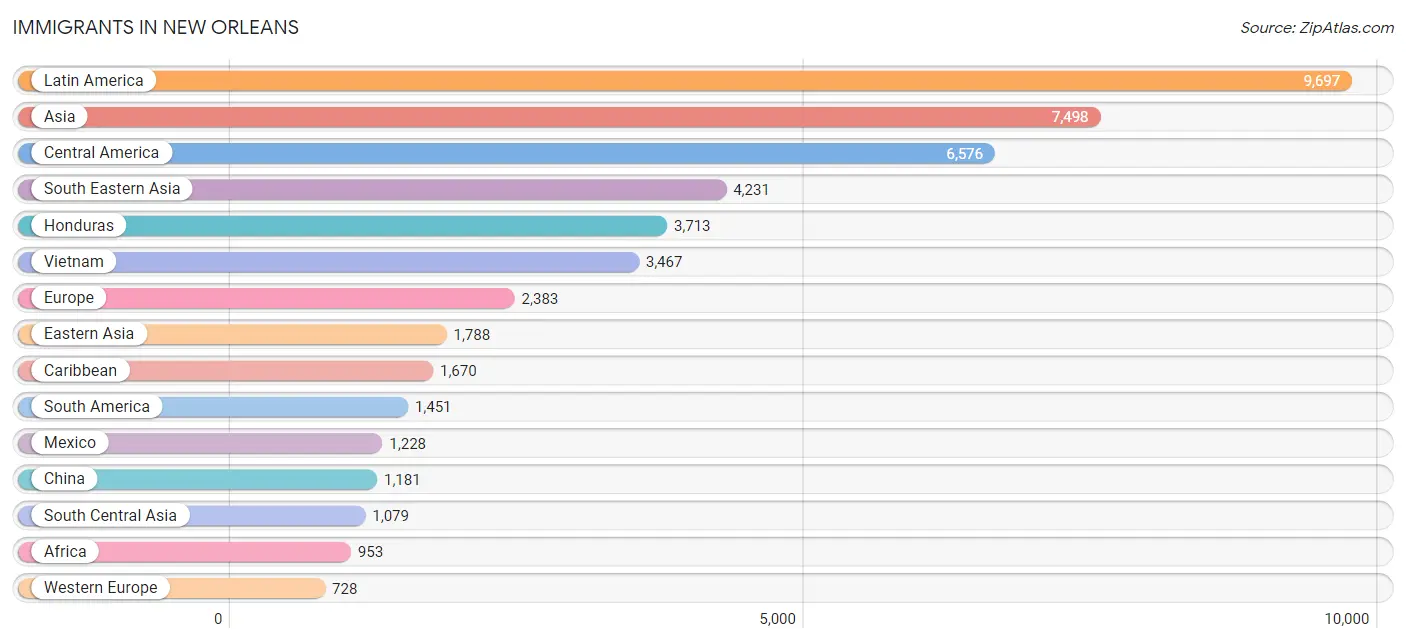
The most numerous immigrant groups reported in New Orleans came from Latin America (9,697 | 2.5%), Asia (7,498 | 2.0%), Central America (6,576 | 1.7%), South Eastern Asia (4,231 | 1.1%), and Honduras (3,713 | 1.0%), together accounting for 8.3% of all New Orleans residents.
| Immigration Origin | # Population | % Population |
| Africa | 953 | 0.3% |
| Albania | 51 | 0.0% |
| Argentina | 94 | 0.0% |
| Asia | 7,498 | 2.0% |
| Australia | 52 | 0.0% |
| Austria | 18 | 0.0% |
| Bangladesh | 68 | 0.0% |
| Barbados | 51 | 0.0% |
| Belarus | 15 | 0.0% |
| Belgium | 20 | 0.0% |
| Belize | 83 | 0.0% |
| Bolivia | 37 | 0.0% |
| Brazil | 370 | 0.1% |
| Bulgaria | 42 | 0.0% |
| Cambodia | 51 | 0.0% |
| Cameroon | 68 | 0.0% |
| Canada | 612 | 0.2% |
| Caribbean | 1,670 | 0.4% |
| Central America | 6,576 | 1.7% |
| Chile | 23 | 0.0% |
| China | 1,181 | 0.3% |
| Colombia | 347 | 0.1% |
| Costa Rica | 61 | 0.0% |
| Croatia | 24 | 0.0% |
| Cuba | 416 | 0.1% |
| Czechoslovakia | 59 | 0.0% |
| Denmark | 6 | 0.0% |
| Dominica | 43 | 0.0% |
| Dominican Republic | 182 | 0.1% |
| Eastern Africa | 488 | 0.1% |
| Eastern Asia | 1,788 | 0.5% |
| Eastern Europe | 594 | 0.2% |
| Ecuador | 181 | 0.1% |
| Egypt | 30 | 0.0% |
| El Salvador | 160 | 0.0% |
| England | 242 | 0.1% |
| Eritrea | 29 | 0.0% |
| Ethiopia | 259 | 0.1% |
| Europe | 2,383 | 0.6% |
| France | 290 | 0.1% |
| Germany | 265 | 0.1% |
| Ghana | 11 | 0.0% |
| Greece | 91 | 0.0% |
| Guatemala | 688 | 0.2% |
| Guyana | 56 | 0.0% |
| Haiti | 264 | 0.1% |
| Honduras | 3,713 | 1.0% |
| Hong Kong | 56 | 0.0% |
| Hungary | 42 | 0.0% |
| India | 667 | 0.2% |
| Indonesia | 23 | 0.0% |
| Iran | 259 | 0.1% |
| Iraq | 23 | 0.0% |
| Ireland | 43 | 0.0% |
| Israel | 43 | 0.0% |
| Italy | 153 | 0.0% |
| Jamaica | 540 | 0.1% |
| Japan | 195 | 0.1% |
| Jordan | 1 | 0.0% |
| Kazakhstan | 16 | 0.0% |
| Kenya | 50 | 0.0% |
| Korea | 406 | 0.1% |
| Laos | 59 | 0.0% |
| Latin America | 9,697 | 2.5% |
| Lebanon | 75 | 0.0% |
| Lithuania | 9 | 0.0% |
| Malaysia | 48 | 0.0% |
| Mexico | 1,228 | 0.3% |
| Middle Africa | 90 | 0.0% |
| Netherlands | 121 | 0.0% |
| Nicaragua | 347 | 0.1% |
| Nigeria | 156 | 0.0% |
| Northern Africa | 52 | 0.0% |
| Northern Europe | 709 | 0.2% |
| Norway | 42 | 0.0% |
| Oceania | 56 | 0.0% |
| Pakistan | 69 | 0.0% |
| Panama | 106 | 0.0% |
| Peru | 199 | 0.1% |
| Philippines | 403 | 0.1% |
| Poland | 85 | 0.0% |
| Portugal | 10 | 0.0% |
| Romania | 112 | 0.0% |
| Russia | 79 | 0.0% |
| Saudi Arabia | 25 | 0.0% |
| Scotland | 23 | 0.0% |
| Senegal | 35 | 0.0% |
| South Africa | 36 | 0.0% |
| South America | 1,451 | 0.4% |
| South Central Asia | 1,079 | 0.3% |
| South Eastern Asia | 4,231 | 1.1% |
| Southern Europe | 349 | 0.1% |
| Spain | 95 | 0.0% |
| St. Vincent and the Grenadines | 7 | 0.0% |
| Sudan | 12 | 0.0% |
| Sweden | 35 | 0.0% |
| Switzerland | 12 | 0.0% |
| Syria | 39 | 0.0% |
| Taiwan | 105 | 0.0% |
| Thailand | 105 | 0.0% |
| Trinidad and Tobago | 100 | 0.0% |
| Turkey | 127 | 0.0% |
| Uganda | 8 | 0.0% |
| Ukraine | 57 | 0.0% |
| Uruguay | 11 | 0.0% |
| Venezuela | 103 | 0.0% |
| Vietnam | 3,467 | 0.9% |
| West Indies | 23 | 0.0% |
| Western Africa | 251 | 0.1% |
| Western Asia | 364 | 0.1% |
| Western Europe | 728 | 0.2% |
| Zaire | 3 | 0.0% |
| Zimbabwe | 39 | 0.0% | View All 113 Rows |
Sex and Age in New Orleans
Sex and Age in New Orleans
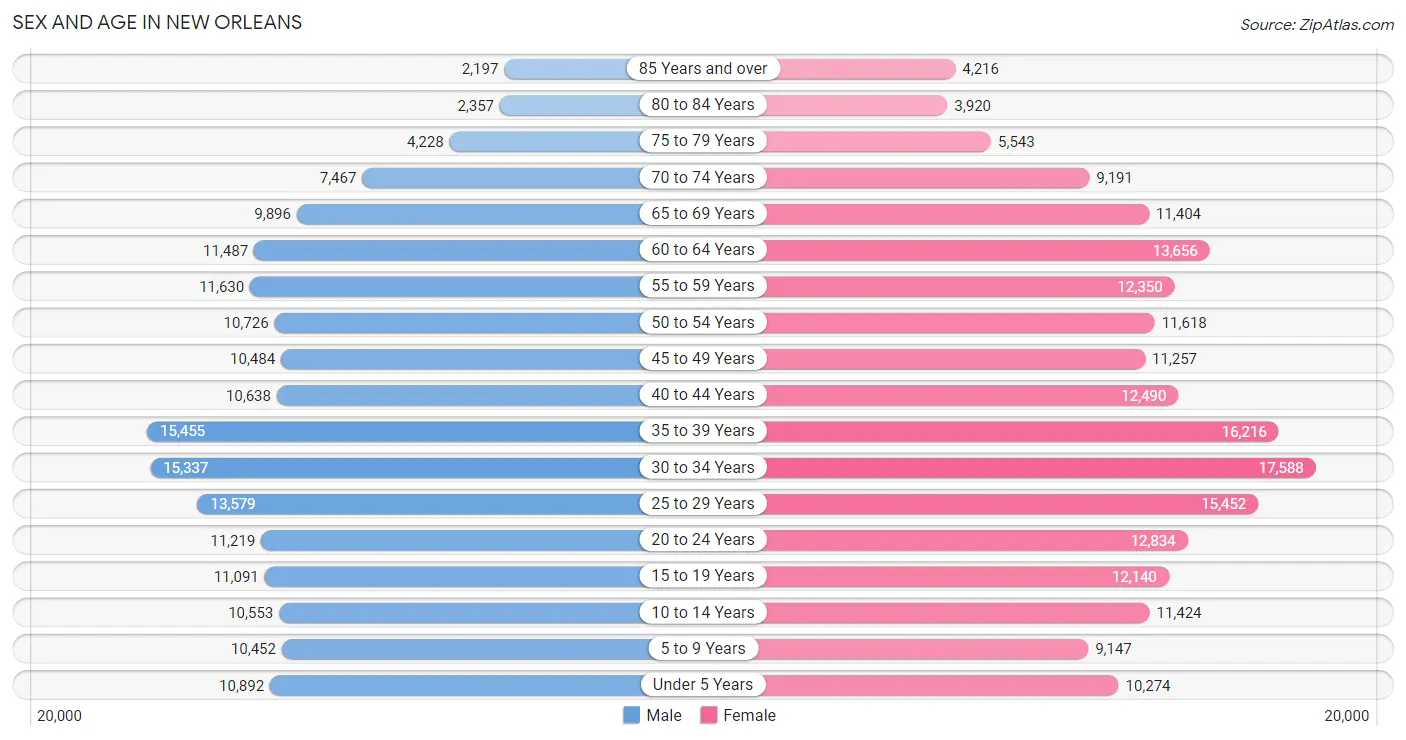
The most populous age groups in New Orleans are 35 to 39 Years (15,455 | 8.6%) for men and 30 to 34 Years (17,588 | 8.8%) for women.
| Age Bracket | Male | Female |
| Under 5 Years | 10,892 (6.1%) | 10,274 (5.1%) |
| 5 to 9 Years | 10,452 (5.8%) | 9,147 (4.6%) |
| 10 to 14 Years | 10,553 (5.9%) | 11,424 (5.7%) |
| 15 to 19 Years | 11,091 (6.2%) | 12,140 (6.0%) |
| 20 to 24 Years | 11,219 (6.2%) | 12,834 (6.4%) |
| 25 to 29 Years | 13,579 (7.6%) | 15,452 (7.7%) |
| 30 to 34 Years | 15,337 (8.5%) | 17,588 (8.8%) |
| 35 to 39 Years | 15,455 (8.6%) | 16,216 (8.1%) |
| 40 to 44 Years | 10,638 (5.9%) | 12,490 (6.2%) |
| 45 to 49 Years | 10,484 (5.8%) | 11,257 (5.6%) |
| 50 to 54 Years | 10,726 (6.0%) | 11,618 (5.8%) |
| 55 to 59 Years | 11,630 (6.5%) | 12,350 (6.1%) |
| 60 to 64 Years | 11,487 (6.4%) | 13,656 (6.8%) |
| 65 to 69 Years | 9,896 (5.5%) | 11,404 (5.7%) |
| 70 to 74 Years | 7,467 (4.2%) | 9,191 (4.6%) |
| 75 to 79 Years | 4,228 (2.4%) | 5,543 (2.8%) |
| 80 to 84 Years | 2,357 (1.3%) | 3,920 (1.9%) |
| 85 Years and over | 2,197 (1.2%) | 4,216 (2.1%) |
| Total | 179,688 (100.0%) | 200,720 (100.0%) |
Families and Households in New Orleans
Median Family Size in New Orleans
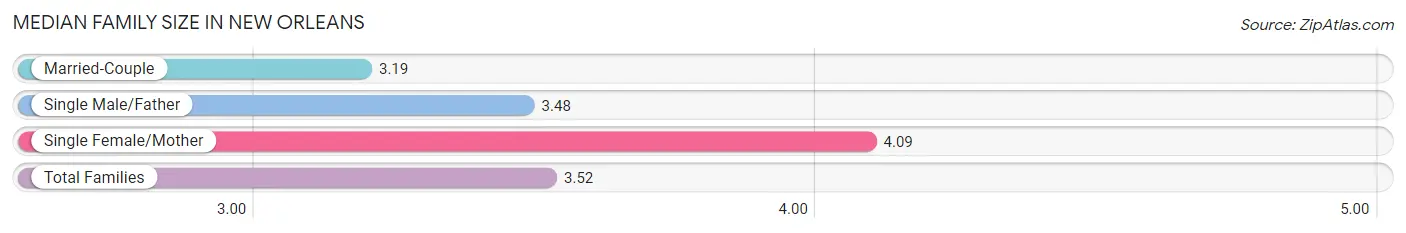
The median family size in New Orleans is 3.52 persons per family, with single female/mother families (24,859 | 34.3%) accounting for the largest median family size of 4.09 persons per family. On the other hand, married-couple families (42,015 | 57.9%) represent the smallest median family size with 3.19 persons per family.
| Family Type | # Families | Family Size |
| Married-Couple | 42,015 (57.9%) | 3.19 |
| Single Male/Father | 5,670 (7.8%) | 3.48 |
| Single Female/Mother | 24,859 (34.3%) | 4.09 |
| Total Families | 72,544 (100.0%) | 3.52 |
Median Household Size in New Orleans
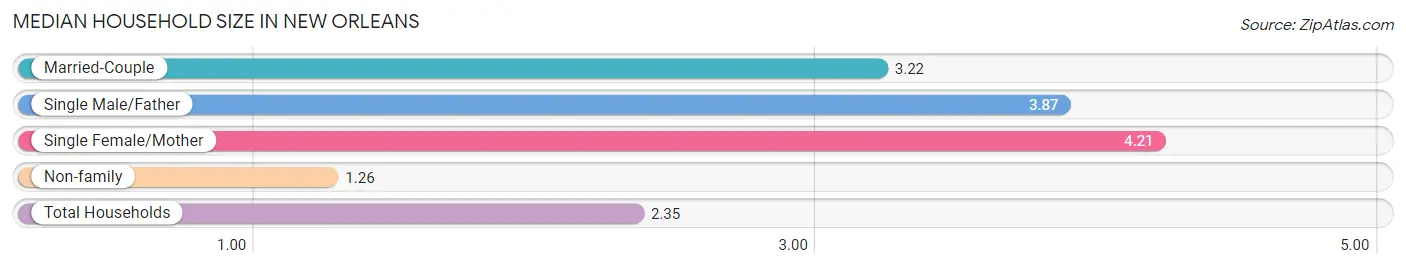
The median household size in New Orleans is 2.35 persons per household, with single female/mother households (24,859 | 16.0%) accounting for the largest median household size of 4.21 persons per household. non-family households (83,125 | 53.4%) represent the smallest median household size with 1.26 persons per household.
| Household Type | # Households | Household Size |
| Married-Couple | 42,015 (27.0%) | 3.22 |
| Single Male/Father | 5,670 (3.6%) | 3.87 |
| Single Female/Mother | 24,859 (16.0%) | 4.21 |
| Non-family | 83,125 (53.4%) | 1.26 |
| Total Households | 155,669 (100.0%) | 2.35 |
Household Size by Marriage Status in New Orleans
Out of a total of 155,669 households in New Orleans, 72,544 (46.6%) are family households, while 83,125 (53.4%) are nonfamily households. The most numerous type of family households are 2-person households, comprising 34,889, and the most common type of nonfamily households are 1-person households, comprising 71,283.
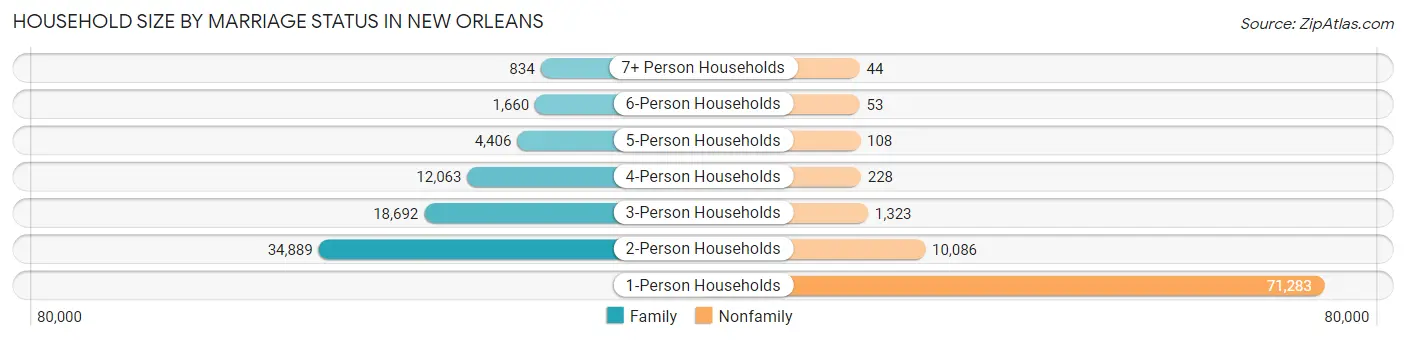
| Household Size | Family Households | Nonfamily Households |
| 1-Person Households | - | 71,283 (45.8%) |
| 2-Person Households | 34,889 (22.4%) | 10,086 (6.5%) |
| 3-Person Households | 18,692 (12.0%) | 1,323 (0.9%) |
| 4-Person Households | 12,063 (7.7%) | 228 (0.2%) |
| 5-Person Households | 4,406 (2.8%) | 108 (0.1%) |
| 6-Person Households | 1,660 (1.1%) | 53 (0.0%) |
| 7+ Person Households | 834 (0.5%) | 44 (0.0%) |
| Total | 72,544 (46.6%) | 83,125 (53.4%) |
Female Fertility in New Orleans
Fertility by Age in New Orleans
Average fertility rate in New Orleans is 46.0 births per 1,000 women. Women in the age bracket of 20 to 34 years have the highest fertility rate with 66.0 births per 1,000 women. Women in the age bracket of 20 to 34 years acount for 66.0% of all women with births.
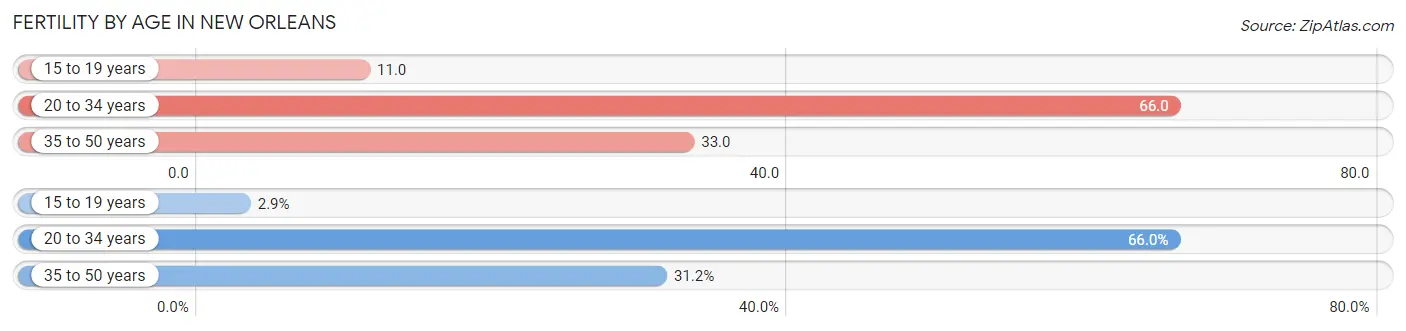
| Age Bracket | Women with Births | Births / 1,000 Women |
| 15 to 19 years | 133 (2.9%) | 11.0 |
| 20 to 34 years | 3,028 (66.0%) | 66.0 |
| 35 to 50 years | 1,430 (31.1%) | 33.0 |
| Total | 4,591 (100.0%) | 46.0 |
Fertility by Age by Marriage Status in New Orleans
40.1% of women with births (4,591) in New Orleans are married. The highest percentage of unmarried women with births falls into 15 to 19 years age bracket with 94.0% of them unmarried at the time of birth, while the lowest percentage of unmarried women with births belong to 35 to 50 years age bracket with 46.8% of them unmarried.
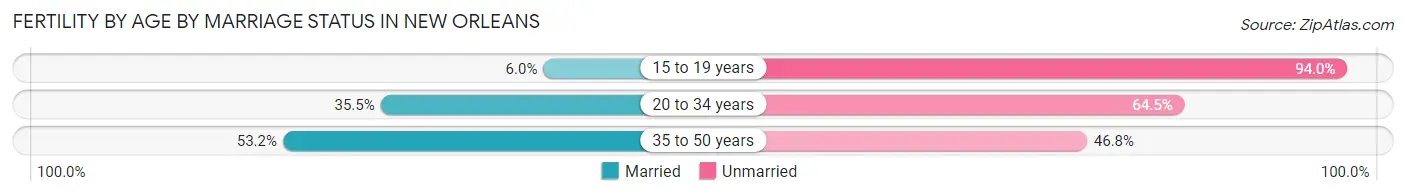
| Age Bracket | Married | Unmarried |
| 15 to 19 years | 8 (6.0%) | 125 (94.0%) |
| 20 to 34 years | 1,075 (35.5%) | 1,953 (64.5%) |
| 35 to 50 years | 761 (53.2%) | 669 (46.8%) |
| Total | 1,841 (40.1%) | 2,750 (59.9%) |
Fertility by Education in New Orleans
Average fertility rate in New Orleans is 46.0 births per 1,000 women. Women with the education attainment of graduate degree have the highest fertility rate of 57.0 births per 1,000 women, while women with the education attainment of bachelor's degree have the lowest fertility at 35.0 births per 1,000 women. Women with the education attainment of college or associate's degree represent 33.1% of all women with births.
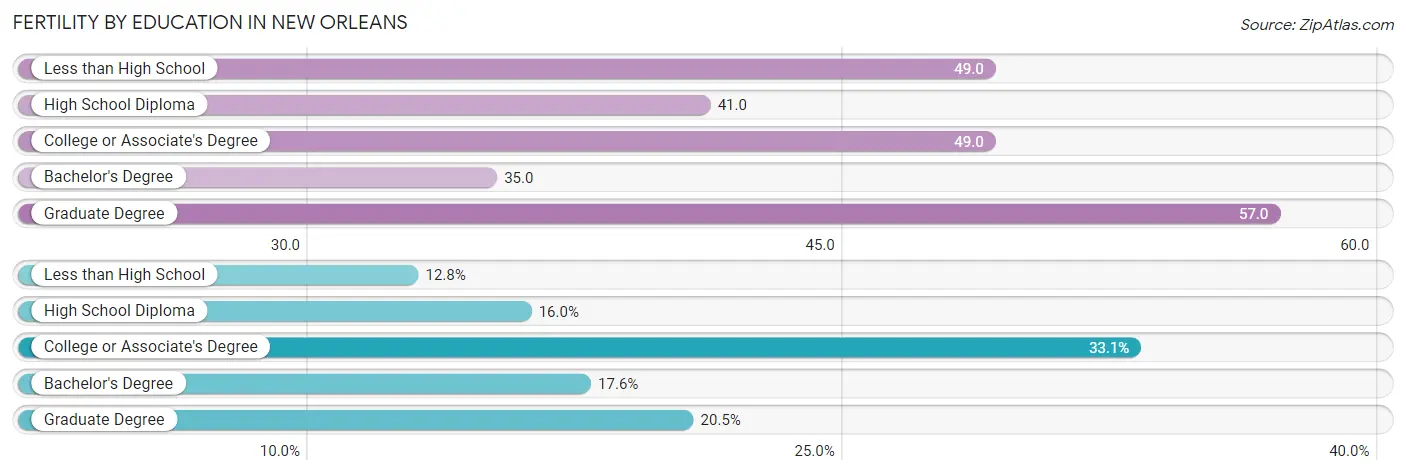
| Educational Attainment | Women with Births | Births / 1,000 Women |
| Less than High School | 587 (12.8%) | 49.0 |
| High School Diploma | 733 (16.0%) | 41.0 |
| College or Associate's Degree | 1,519 (33.1%) | 49.0 |
| Bachelor's Degree | 810 (17.6%) | 35.0 |
| Graduate Degree | 942 (20.5%) | 57.0 |
| Total | 4,591 (100.0%) | 46.0 |
Fertility by Education by Marriage Status in New Orleans
59.9% of women with births in New Orleans are unmarried. Women with the educational attainment of graduate degree are most likely to be married with 95.0% of them married at childbirth, while women with the educational attainment of less than high school are least likely to be married with 88.1% of them unmarried at childbirth.
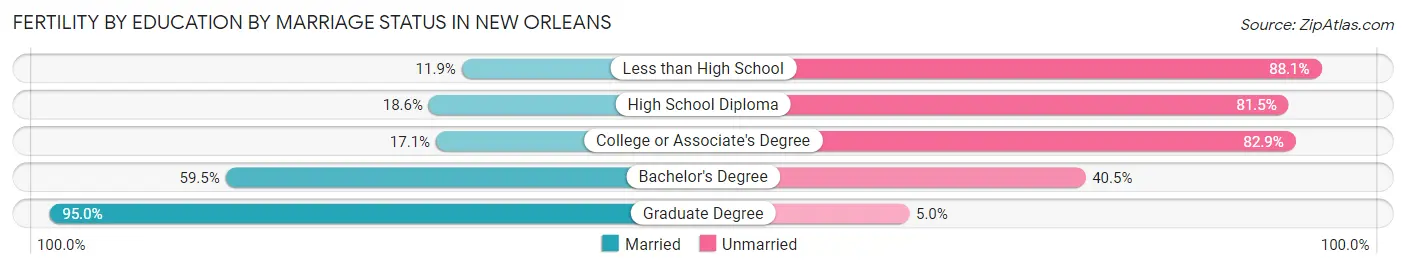
| Educational Attainment | Married | Unmarried |
| Less than High School | 70 (11.9%) | 517 (88.1%) |
| High School Diploma | 136 (18.5%) | 597 (81.5%) |
| College or Associate's Degree | 260 (17.1%) | 1,259 (82.9%) |
| Bachelor's Degree | 482 (59.5%) | 328 (40.5%) |
| Graduate Degree | 895 (95.0%) | 47 (5.0%) |
| Total | 1,841 (40.1%) | 2,750 (59.9%) |
Employment Characteristics in New Orleans
Employment by Class of Employer in New Orleans
Among the 171,424 employed individuals in New Orleans, private company employees (102,459 | 59.8%), not-for-profit organizations (23,791 | 13.9%), and self-employed (not incorporated) (11,656 | 6.8%) make up the most common classes of employment.
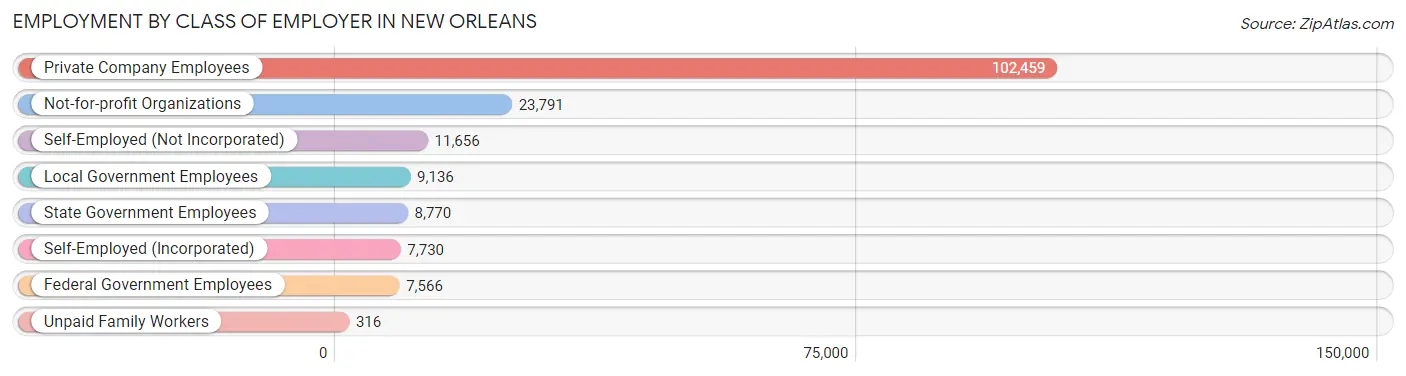
| Employer Class | # Employees | % Employees |
| Private Company Employees | 102,459 | 59.8% |
| Self-Employed (Incorporated) | 7,730 | 4.5% |
| Self-Employed (Not Incorporated) | 11,656 | 6.8% |
| Not-for-profit Organizations | 23,791 | 13.9% |
| Local Government Employees | 9,136 | 5.3% |
| State Government Employees | 8,770 | 5.1% |
| Federal Government Employees | 7,566 | 4.4% |
| Unpaid Family Workers | 316 | 0.2% |
| Total | 171,424 | 100.0% |
Employment Status by Age in New Orleans
According to the labor force statistics for New Orleans, out of the total population over 16 years of age (313,370), 61.2% or 191,782 individuals are in the labor force, with 8.4% or 16,110 of them unemployed. The age group with the highest labor force participation rate is 30 to 34 years, with 84.0% or 27,657 individuals in the labor force. Within the labor force, the 16 to 19 years age range has the highest percentage of unemployed individuals, with 22.1% or 1,255 of them being unemployed.
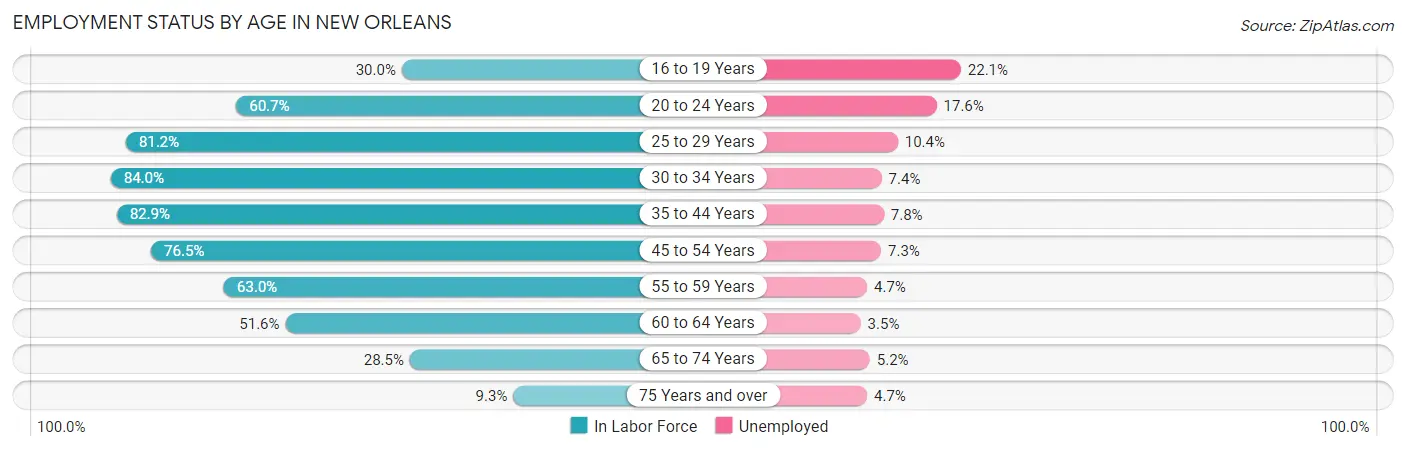
| Age Bracket | In Labor Force | Unemployed |
| 16 to 19 Years | 5,680 (30.0%) | 1,255 (22.1%) |
| 20 to 24 Years | 14,600 (60.7%) | 2,570 (17.6%) |
| 25 to 29 Years | 23,573 (81.2%) | 2,452 (10.4%) |
| 30 to 34 Years | 27,657 (84.0%) | 2,047 (7.4%) |
| 35 to 44 Years | 45,428 (82.9%) | 3,543 (7.8%) |
| 45 to 54 Years | 33,725 (76.5%) | 2,462 (7.3%) |
| 55 to 59 Years | 15,107 (63.0%) | 710 (4.7%) |
| 60 to 64 Years | 12,974 (51.6%) | 454 (3.5%) |
| 65 to 74 Years | 10,818 (28.5%) | 563 (5.2%) |
| 75 Years and over | 2,089 (9.3%) | 98 (4.7%) |
| Total | 191,782 (61.2%) | 16,110 (8.4%) |
Employment Status by Educational Attainment in New Orleans
According to labor force statistics for New Orleans, 75.5% of individuals (158,522) out of the total population between 25 and 64 years of age (209,963) are in the labor force, with 7.4% or 11,731 of them being unemployed. The group with the highest labor force participation rate are those with the educational attainment of bachelor's degree or higher, with 86.2% or 76,299 individuals in the labor force. Within the labor force, individuals with less than high school education have the highest percentage of unemployment, with 19.0% or 2,018 of them being unemployed.
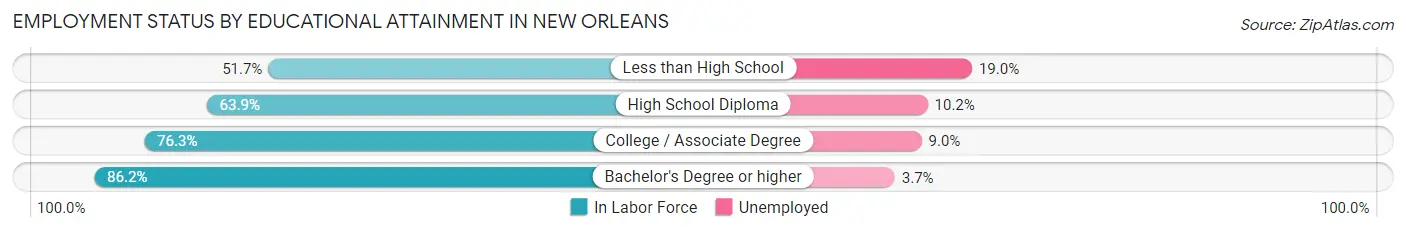
| Educational Attainment | In Labor Force | Unemployed |
| Less than High School | 10,619 (51.7%) | 3,903 (19.0%) |
| High School Diploma | 28,049 (63.9%) | 4,477 (10.2%) |
| College / Associate Degree | 43,502 (76.3%) | 5,131 (9.0%) |
| Bachelor's Degree or higher | 76,299 (86.2%) | 3,275 (3.7%) |
| Total | 158,522 (75.5%) | 15,537 (7.4%) |
Employment Occupations by Sex in New Orleans
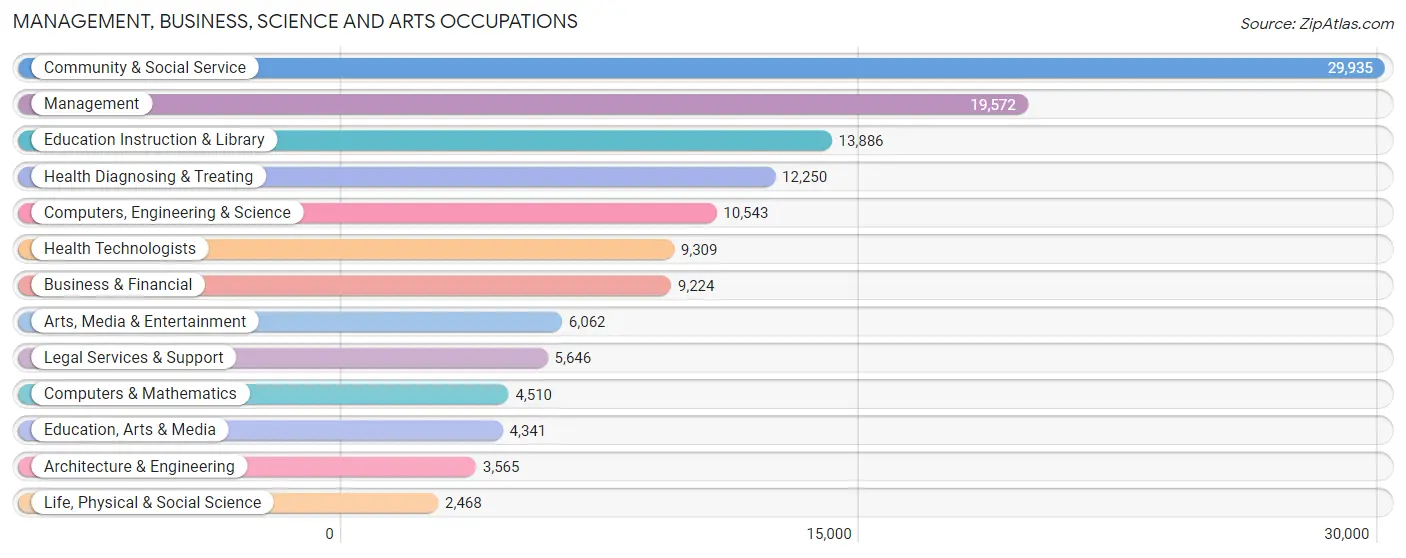
Management, Business, Science and Arts Occupations
The most common Management, Business, Science and Arts occupations in New Orleans are Community & Social Service (29,935 | 17.2%), Management (19,572 | 11.2%), Education Instruction & Library (13,886 | 8.0%), Health Diagnosing & Treating (12,250 | 7.0%), and Computers, Engineering & Science (10,543 | 6.0%).
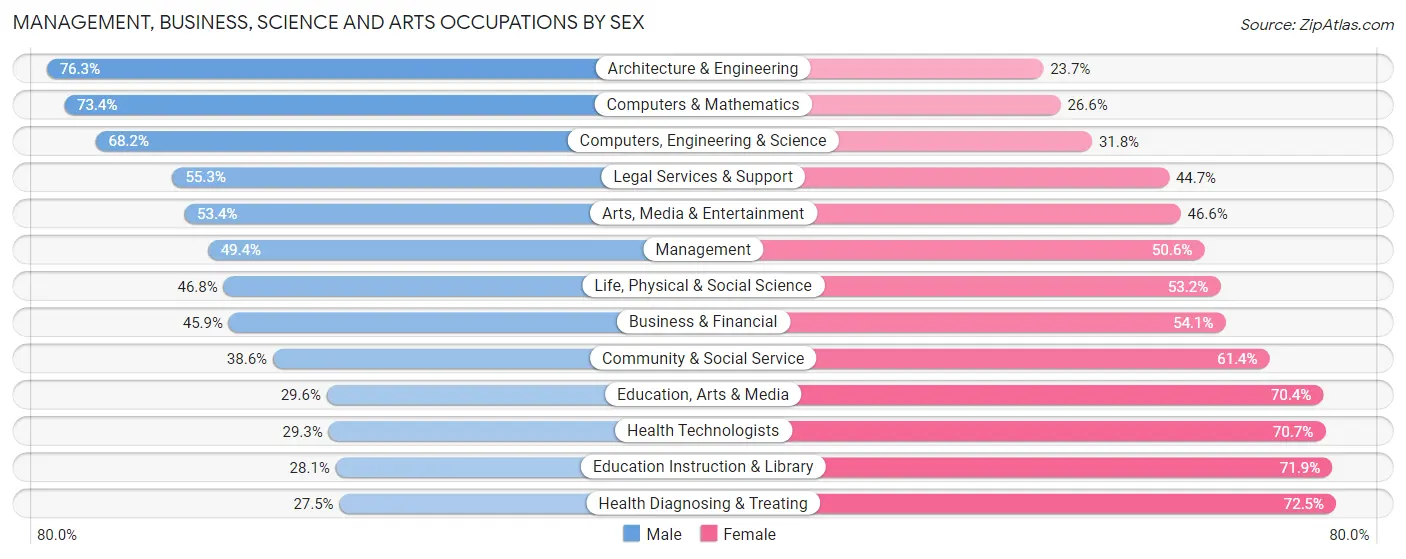
Management, Business, Science and Arts Occupations by Sex
Within the Management, Business, Science and Arts occupations in New Orleans, the most male-oriented occupations are Architecture & Engineering (76.3%), Computers & Mathematics (73.4%), and Computers, Engineering & Science (68.2%), while the most female-oriented occupations are Health Diagnosing & Treating (72.5%), Education Instruction & Library (71.9%), and Health Technologists (70.7%).
| Occupation | Male | Female |
| Management | 9,677 (49.4%) | 9,895 (50.6%) |
| Business & Financial | 4,236 (45.9%) | 4,988 (54.1%) |
| Computers, Engineering & Science | 7,186 (68.2%) | 3,357 (31.8%) |
| Computers & Mathematics | 3,311 (73.4%) | 1,199 (26.6%) |
| Architecture & Engineering | 2,720 (76.3%) | 845 (23.7%) |
| Life, Physical & Social Science | 1,155 (46.8%) | 1,313 (53.2%) |
| Community & Social Service | 11,543 (38.6%) | 18,392 (61.4%) |
| Education, Arts & Media | 1,284 (29.6%) | 3,057 (70.4%) |
| Legal Services & Support | 3,123 (55.3%) | 2,523 (44.7%) |
| Education Instruction & Library | 3,901 (28.1%) | 9,985 (71.9%) |
| Arts, Media & Entertainment | 3,235 (53.4%) | 2,827 (46.6%) |
| Health Diagnosing & Treating | 3,364 (27.5%) | 8,886 (72.5%) |
| Health Technologists | 2,725 (29.3%) | 6,584 (70.7%) |
| Total (Category) | 36,006 (44.2%) | 45,518 (55.8%) |
| Total (Overall) | 82,945 (47.6%) | 91,388 (52.4%) |
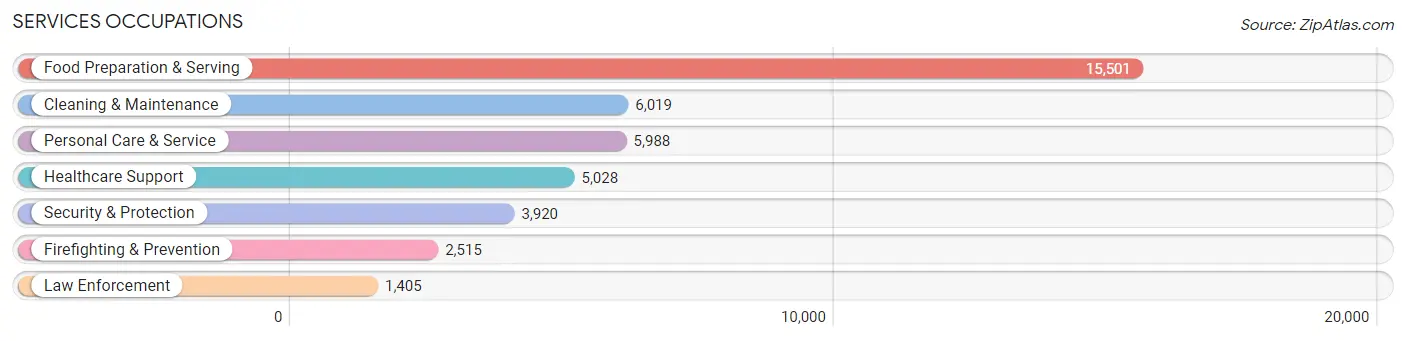
Services Occupations
The most common Services occupations in New Orleans are Food Preparation & Serving (15,501 | 8.9%), Cleaning & Maintenance (6,019 | 3.5%), Personal Care & Service (5,988 | 3.4%), Healthcare Support (5,028 | 2.9%), and Security & Protection (3,920 | 2.2%).
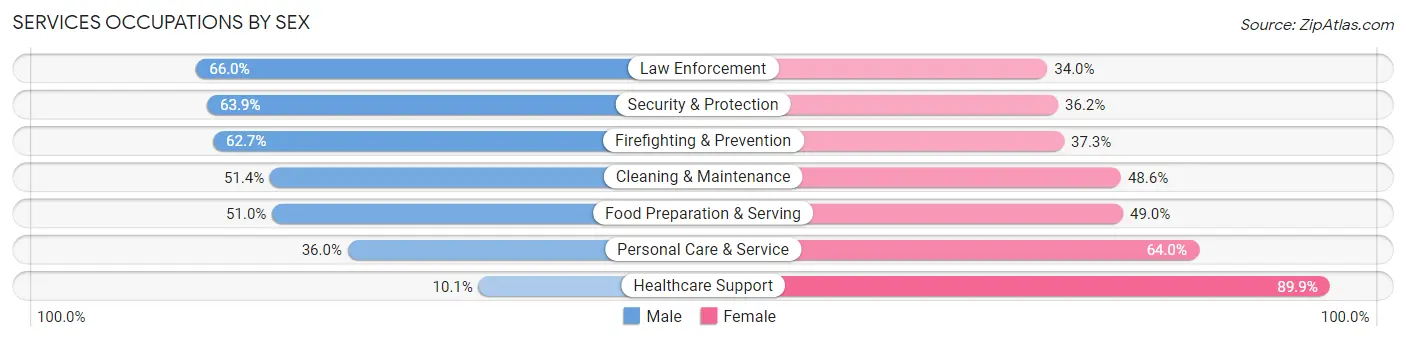
Services Occupations by Sex
Within the Services occupations in New Orleans, the most male-oriented occupations are Law Enforcement (66.0%), Security & Protection (63.8%), and Firefighting & Prevention (62.7%), while the most female-oriented occupations are Healthcare Support (89.9%), Personal Care & Service (64.0%), and Food Preparation & Serving (49.0%).
| Occupation | Male | Female |
| Healthcare Support | 508 (10.1%) | 4,520 (89.9%) |
| Security & Protection | 2,503 (63.8%) | 1,417 (36.1%) |
| Firefighting & Prevention | 1,576 (62.7%) | 939 (37.3%) |
| Law Enforcement | 927 (66.0%) | 478 (34.0%) |
| Food Preparation & Serving | 7,902 (51.0%) | 7,599 (49.0%) |
| Cleaning & Maintenance | 3,094 (51.4%) | 2,925 (48.6%) |
| Personal Care & Service | 2,156 (36.0%) | 3,832 (64.0%) |
| Total (Category) | 16,163 (44.3%) | 20,293 (55.7%) |
| Total (Overall) | 82,945 (47.6%) | 91,388 (52.4%) |
Sales and Office Occupations
The most common Sales and Office occupations in New Orleans are Office & Administration (16,935 | 9.7%), and Sales & Related (15,568 | 8.9%).

Sales and Office Occupations by Sex
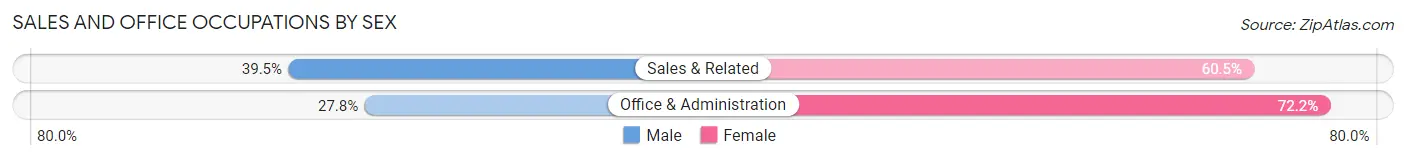
| Occupation | Male | Female |
| Sales & Related | 6,149 (39.5%) | 9,419 (60.5%) |
| Office & Administration | 4,705 (27.8%) | 12,230 (72.2%) |
| Total (Category) | 10,854 (33.4%) | 21,649 (66.6%) |
| Total (Overall) | 82,945 (47.6%) | 91,388 (52.4%) |
Natural Resources, Construction and Maintenance Occupations
The most common Natural Resources, Construction and Maintenance occupations in New Orleans are Construction & Extraction (6,719 | 3.8%), Installation, Maintenance & Repair (2,969 | 1.7%), and Farming, Fishing & Forestry (499 | 0.3%).

Natural Resources, Construction and Maintenance Occupations by Sex
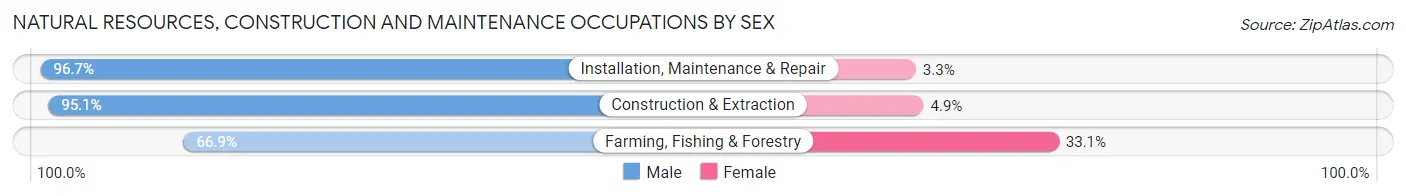
| Occupation | Male | Female |
| Farming, Fishing & Forestry | 334 (66.9%) | 165 (33.1%) |
| Construction & Extraction | 6,388 (95.1%) | 331 (4.9%) |
| Installation, Maintenance & Repair | 2,870 (96.7%) | 99 (3.3%) |
| Total (Category) | 9,592 (94.2%) | 595 (5.8%) |
| Total (Overall) | 82,945 (47.6%) | 91,388 (52.4%) |
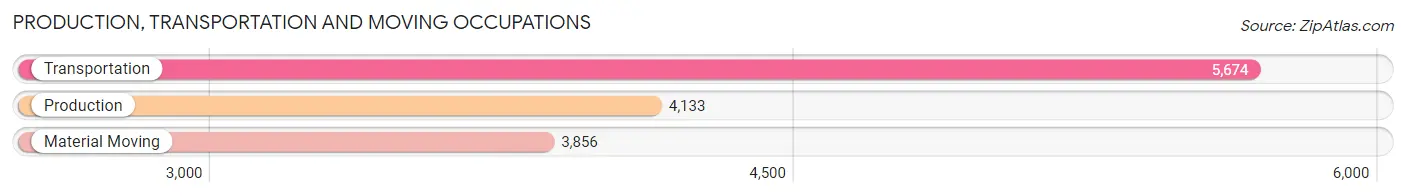
Production, Transportation and Moving Occupations
The most common Production, Transportation and Moving occupations in New Orleans are Transportation (5,674 | 3.3%), Production (4,133 | 2.4%), and Material Moving (3,856 | 2.2%).
Production, Transportation and Moving Occupations by Sex
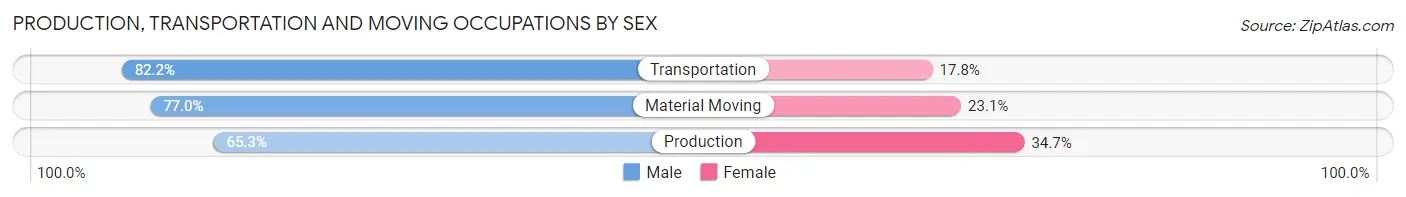
| Occupation | Male | Female |
| Production | 2,700 (65.3%) | 1,433 (34.7%) |
| Transportation | 4,663 (82.2%) | 1,011 (17.8%) |
| Material Moving | 2,967 (76.9%) | 889 (23.1%) |
| Total (Category) | 10,330 (75.6%) | 3,333 (24.4%) |
| Total (Overall) | 82,945 (47.6%) | 91,388 (52.4%) |
Employment Industries by Sex in New Orleans
Employment Industries in New Orleans
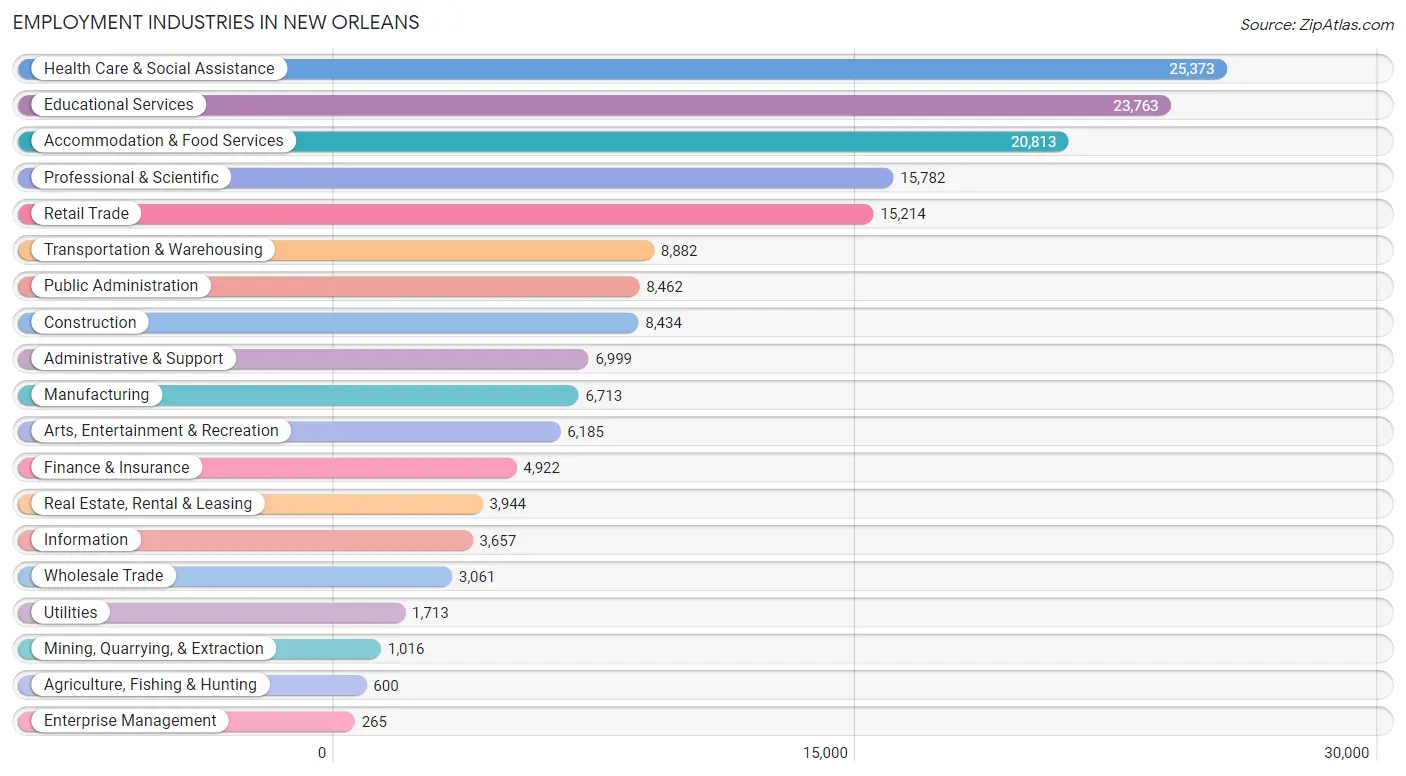
The major employment industries in New Orleans include Health Care & Social Assistance (25,373 | 14.5%), Educational Services (23,763 | 13.6%), Accommodation & Food Services (20,813 | 11.9%), Professional & Scientific (15,782 | 9.0%), and Retail Trade (15,214 | 8.7%).
Employment Industries by Sex in New Orleans
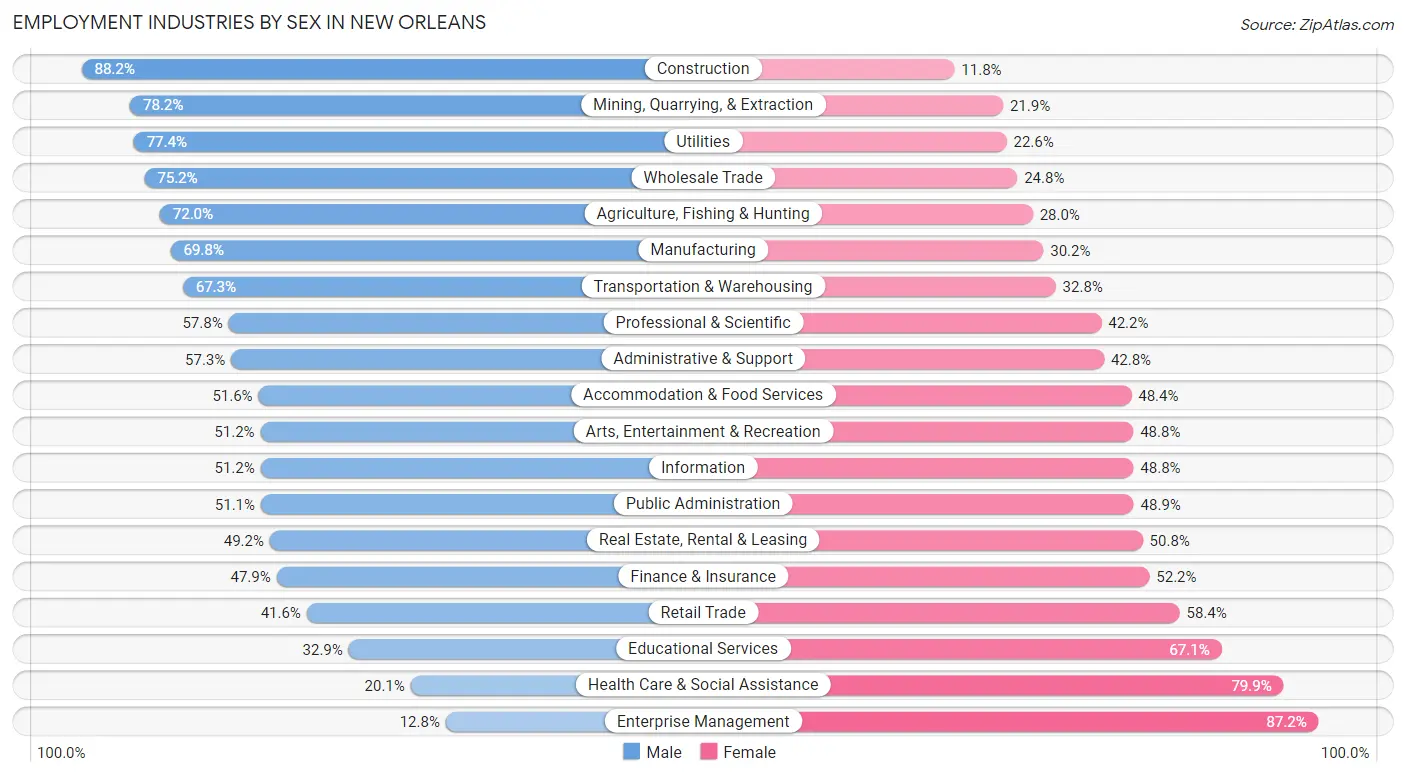
The New Orleans industries that see more men than women are Construction (88.2%), Mining, Quarrying, & Extraction (78.1%), and Utilities (77.4%), whereas the industries that tend to have a higher number of women are Enterprise Management (87.2%), Health Care & Social Assistance (79.9%), and Educational Services (67.1%).
| Industry | Male | Female |
| Agriculture, Fishing & Hunting | 432 (72.0%) | 168 (28.0%) |
| Mining, Quarrying, & Extraction | 794 (78.1%) | 222 (21.8%) |
| Construction | 7,439 (88.2%) | 995 (11.8%) |
| Manufacturing | 4,686 (69.8%) | 2,027 (30.2%) |
| Wholesale Trade | 2,302 (75.2%) | 759 (24.8%) |
| Retail Trade | 6,331 (41.6%) | 8,883 (58.4%) |
| Transportation & Warehousing | 5,973 (67.2%) | 2,909 (32.8%) |
| Utilities | 1,326 (77.4%) | 387 (22.6%) |
| Information | 1,871 (51.2%) | 1,786 (48.8%) |
| Finance & Insurance | 2,355 (47.8%) | 2,567 (52.1%) |
| Real Estate, Rental & Leasing | 1,942 (49.2%) | 2,002 (50.8%) |
| Professional & Scientific | 9,122 (57.8%) | 6,660 (42.2%) |
| Enterprise Management | 34 (12.8%) | 231 (87.2%) |
| Administrative & Support | 4,007 (57.3%) | 2,992 (42.7%) |
| Educational Services | 7,826 (32.9%) | 15,937 (67.1%) |
| Health Care & Social Assistance | 5,101 (20.1%) | 20,272 (79.9%) |
| Arts, Entertainment & Recreation | 3,166 (51.2%) | 3,019 (48.8%) |
| Accommodation & Food Services | 10,739 (51.6%) | 10,074 (48.4%) |
| Public Administration | 4,324 (51.1%) | 4,138 (48.9%) |
| Total | 82,945 (47.6%) | 91,388 (52.4%) |
Education in New Orleans
School Enrollment in New Orleans
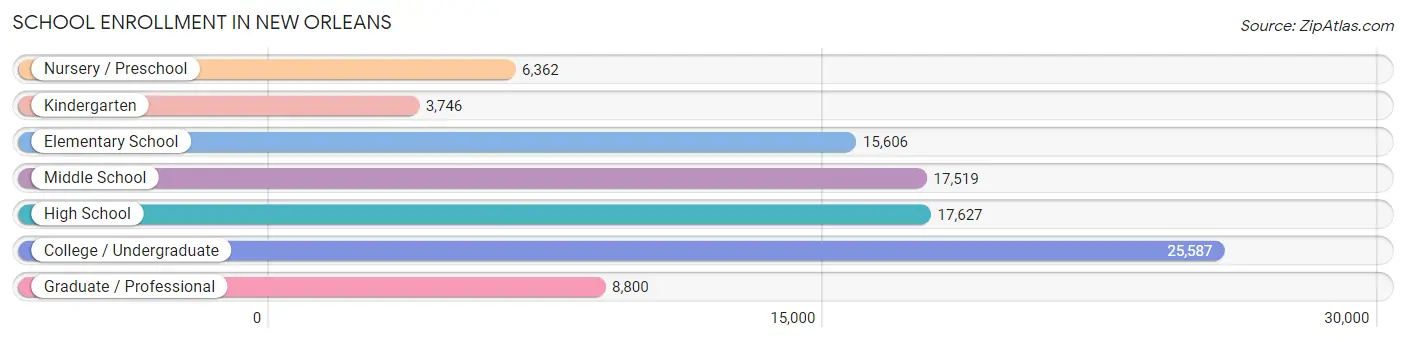
The most common levels of schooling among the 95,247 students in New Orleans are college / undergraduate (25,587 | 26.9%), high school (17,627 | 18.5%), and middle school (17,519 | 18.4%).
| School Level | # Students | % Students |
| Nursery / Preschool | 6,362 | 6.7% |
| Kindergarten | 3,746 | 3.9% |
| Elementary School | 15,606 | 16.4% |
| Middle School | 17,519 | 18.4% |
| High School | 17,627 | 18.5% |
| College / Undergraduate | 25,587 | 26.9% |
| Graduate / Professional | 8,800 | 9.2% |
| Total | 95,247 | 100.0% |
School Enrollment by Age by Funding Source in New Orleans
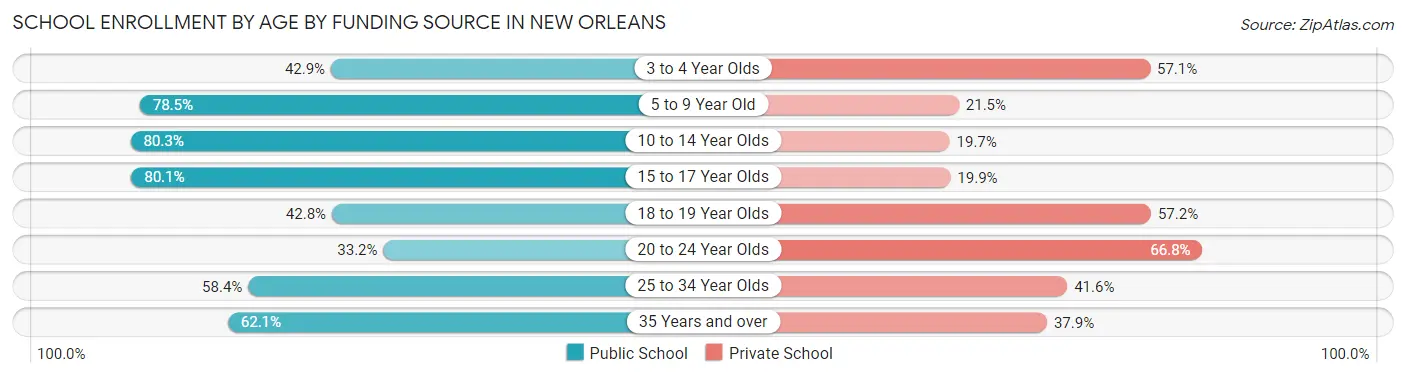
Out of a total of 95,247 students who are enrolled in schools in New Orleans, 34,003 (35.7%) attend a private institution, while the remaining 61,244 (64.3%) are enrolled in public schools. The age group of 20 to 24 year olds has the highest likelihood of being enrolled in private schools, with 8,862 (66.8% in the age bracket) enrolled. Conversely, the age group of 10 to 14 year olds has the lowest likelihood of being enrolled in a private school, with 17,063 (80.3% in the age bracket) attending a public institution.
| Age Bracket | Public School | Private School |
| 3 to 4 Year Olds | 2,249 (42.9%) | 2,989 (57.1%) |
| 5 to 9 Year Old | 14,911 (78.5%) | 4,075 (21.5%) |
| 10 to 14 Year Olds | 17,063 (80.3%) | 4,193 (19.7%) |
| 15 to 17 Year Olds | 9,449 (80.1%) | 2,345 (19.9%) |
| 18 to 19 Year Olds | 3,953 (42.8%) | 5,292 (57.2%) |
| 20 to 24 Year Olds | 4,401 (33.2%) | 8,862 (66.8%) |
| 25 to 34 Year Olds | 5,555 (58.4%) | 3,963 (41.6%) |
| 35 Years and over | 3,695 (62.1%) | 2,252 (37.9%) |
| Total | 61,244 (64.3%) | 34,003 (35.7%) |
Educational Attainment by Field of Study in New Orleans
Business (19,704 | 16.4%), social sciences (11,517 | 9.6%), science & technology (10,948 | 9.1%), education (10,830 | 9.0%), and visual & performing arts (9,336 | 7.8%) are the most common fields of study among 119,893 individuals in New Orleans who have obtained a bachelor's degree or higher.
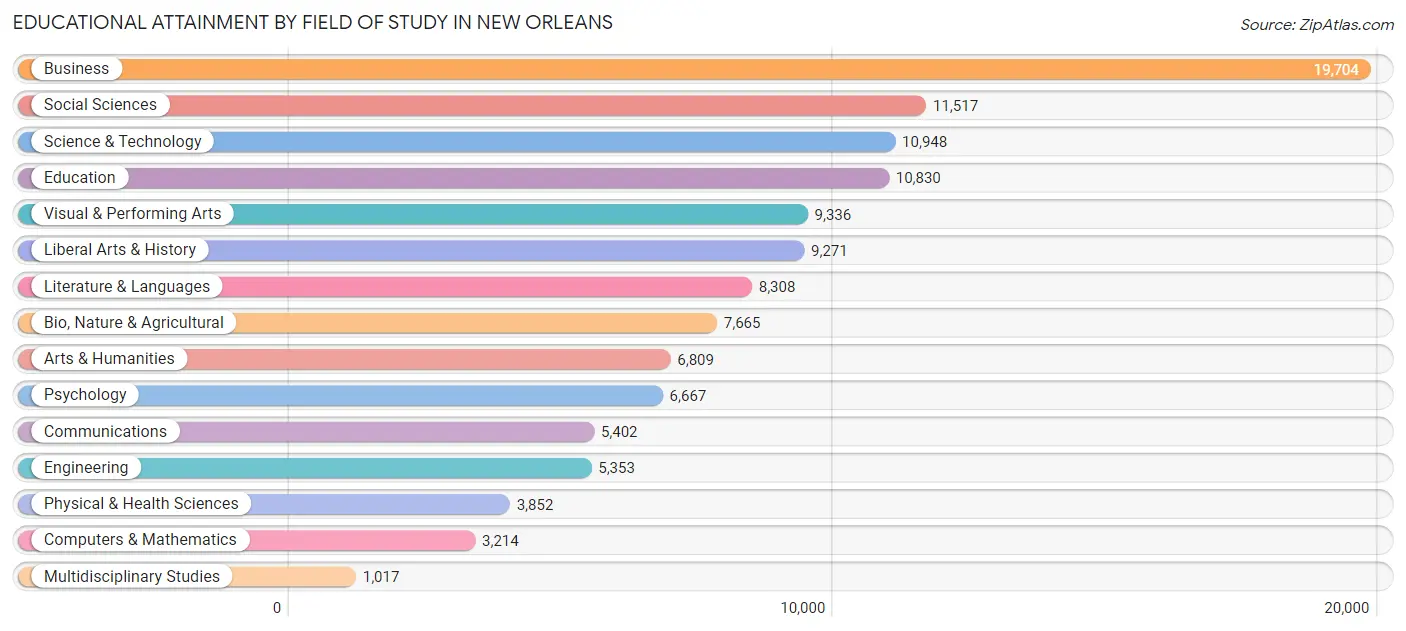
| Field of Study | # Graduates | % Graduates |
| Computers & Mathematics | 3,214 | 2.7% |
| Bio, Nature & Agricultural | 7,665 | 6.4% |
| Physical & Health Sciences | 3,852 | 3.2% |
| Psychology | 6,667 | 5.6% |
| Social Sciences | 11,517 | 9.6% |
| Engineering | 5,353 | 4.5% |
| Multidisciplinary Studies | 1,017 | 0.9% |
| Science & Technology | 10,948 | 9.1% |
| Business | 19,704 | 16.4% |
| Education | 10,830 | 9.0% |
| Literature & Languages | 8,308 | 6.9% |
| Liberal Arts & History | 9,271 | 7.7% |
| Visual & Performing Arts | 9,336 | 7.8% |
| Communications | 5,402 | 4.5% |
| Arts & Humanities | 6,809 | 5.7% |
| Total | 119,893 | 100.0% |
Transportation & Commute in New Orleans
Vehicle Availability by Sex in New Orleans
The most prevalent vehicle ownership categories in New Orleans are males with 2 vehicles (33,760, accounting for 41.9%) and females with 2 vehicles (31,148, making up 38.9%).
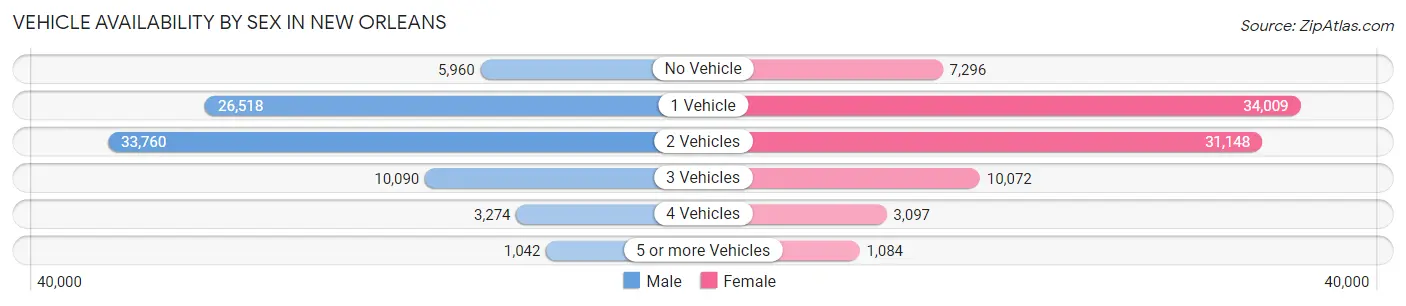
| Vehicles Available | Male | Female |
| No Vehicle | 5,960 (7.4%) | 7,296 (8.4%) |
| 1 Vehicle | 26,518 (32.9%) | 34,009 (39.2%) |
| 2 Vehicles | 33,760 (41.9%) | 31,148 (35.9%) |
| 3 Vehicles | 10,090 (12.5%) | 10,072 (11.6%) |
| 4 Vehicles | 3,274 (4.1%) | 3,097 (3.6%) |
| 5 or more Vehicles | 1,042 (1.3%) | 1,084 (1.3%) |
| Total | 80,644 (100.0%) | 86,706 (100.0%) |
Commute Time in New Orleans
The most frequently occuring commute durations in New Orleans are 15 to 19 minutes (31,276 commuters, 20.6%), 20 to 24 minutes (27,168 commuters, 17.9%), and 30 to 34 minutes (23,145 commuters, 15.2%).
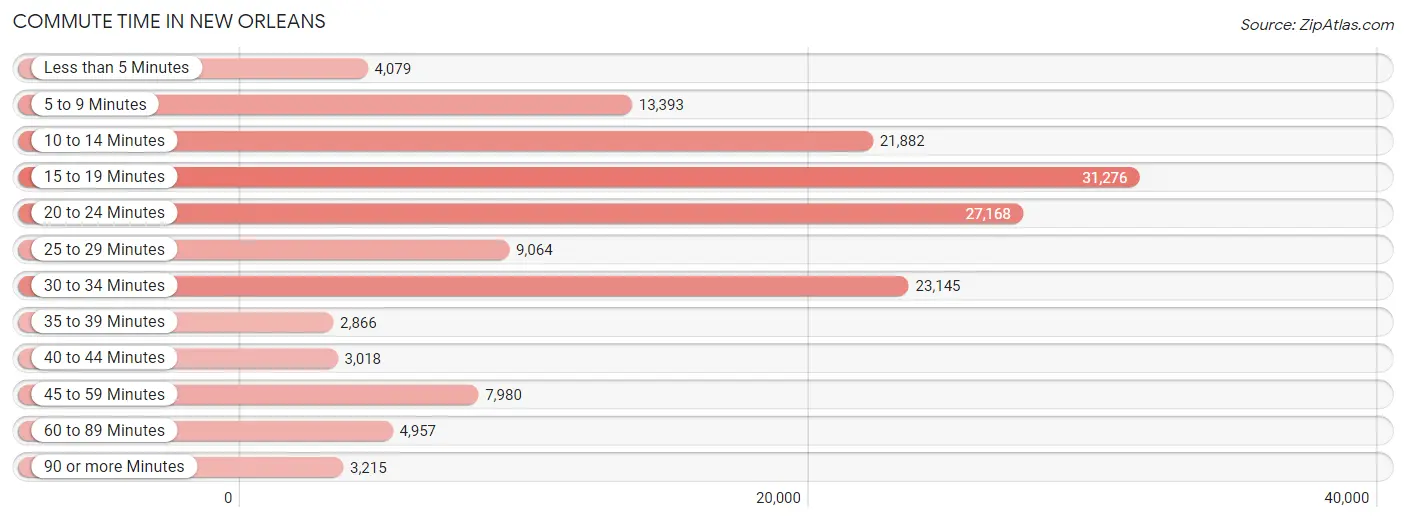
| Commute Time | # Commuters | % Commuters |
| Less than 5 Minutes | 4,079 | 2.7% |
| 5 to 9 Minutes | 13,393 | 8.8% |
| 10 to 14 Minutes | 21,882 | 14.4% |
| 15 to 19 Minutes | 31,276 | 20.6% |
| 20 to 24 Minutes | 27,168 | 17.9% |
| 25 to 29 Minutes | 9,064 | 6.0% |
| 30 to 34 Minutes | 23,145 | 15.2% |
| 35 to 39 Minutes | 2,866 | 1.9% |
| 40 to 44 Minutes | 3,018 | 2.0% |
| 45 to 59 Minutes | 7,980 | 5.2% |
| 60 to 89 Minutes | 4,957 | 3.3% |
| 90 or more Minutes | 3,215 | 2.1% |
Commute Time by Sex in New Orleans
The most common commute times in New Orleans are 15 to 19 minutes (15,054 commuters, 20.7%) for males and 15 to 19 minutes (16,222 commuters, 20.4%) for females.
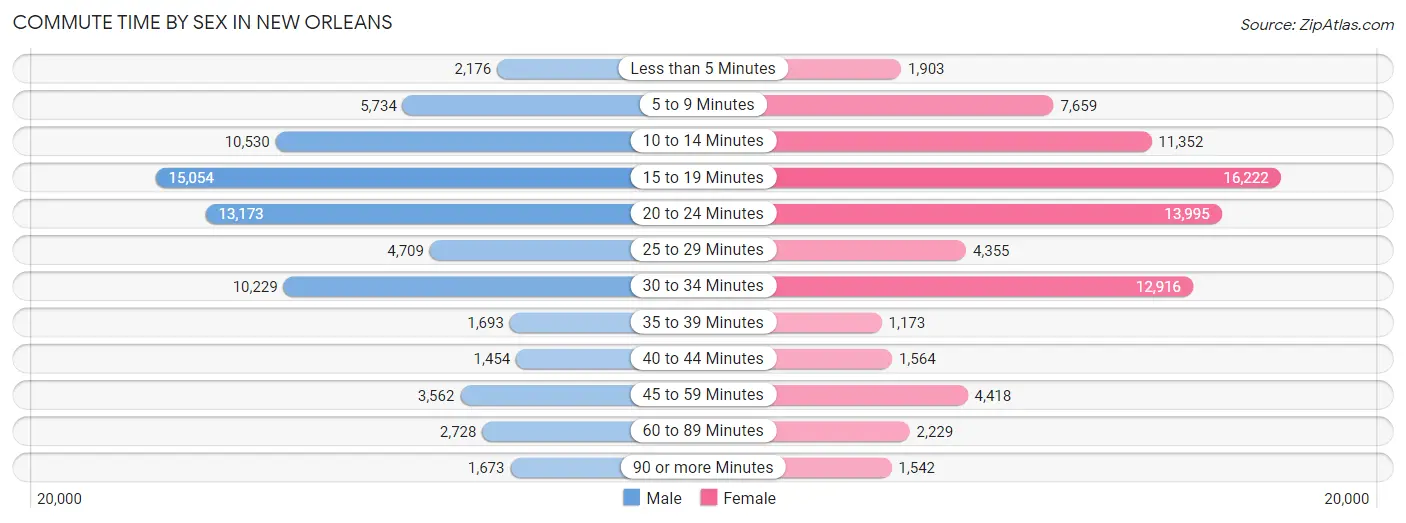
| Commute Time | Male | Female |
| Less than 5 Minutes | 2,176 (3.0%) | 1,903 (2.4%) |
| 5 to 9 Minutes | 5,734 (7.9%) | 7,659 (9.7%) |
| 10 to 14 Minutes | 10,530 (14.5%) | 11,352 (14.3%) |
| 15 to 19 Minutes | 15,054 (20.7%) | 16,222 (20.4%) |
| 20 to 24 Minutes | 13,173 (18.1%) | 13,995 (17.6%) |
| 25 to 29 Minutes | 4,709 (6.5%) | 4,355 (5.5%) |
| 30 to 34 Minutes | 10,229 (14.1%) | 12,916 (16.3%) |
| 35 to 39 Minutes | 1,693 (2.3%) | 1,173 (1.5%) |
| 40 to 44 Minutes | 1,454 (2.0%) | 1,564 (2.0%) |
| 45 to 59 Minutes | 3,562 (4.9%) | 4,418 (5.6%) |
| 60 to 89 Minutes | 2,728 (3.7%) | 2,229 (2.8%) |
| 90 or more Minutes | 1,673 (2.3%) | 1,542 (1.9%) |
Time of Departure to Work by Sex in New Orleans
The most frequent times of departure to work in New Orleans are 7:00 AM to 7:29 AM (9,588, 13.2%) for males and 7:00 AM to 7:29 AM (12,232, 15.4%) for females.
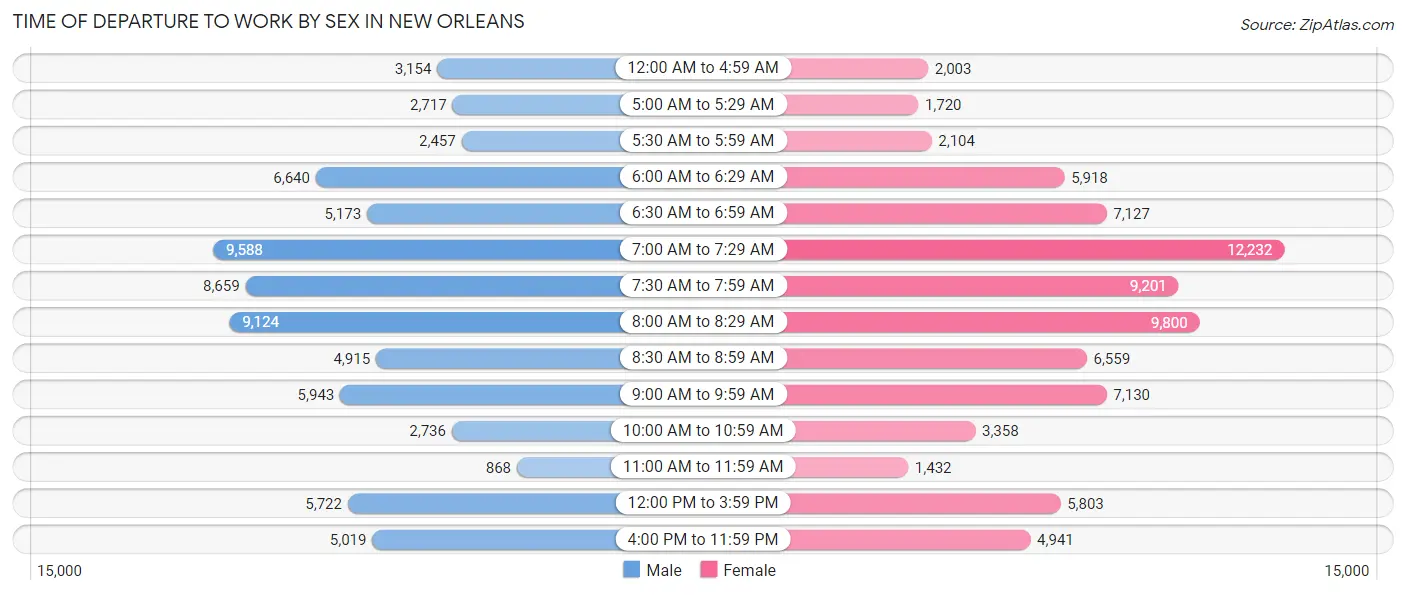
| Time of Departure | Male | Female |
| 12:00 AM to 4:59 AM | 3,154 (4.3%) | 2,003 (2.5%) |
| 5:00 AM to 5:29 AM | 2,717 (3.7%) | 1,720 (2.2%) |
| 5:30 AM to 5:59 AM | 2,457 (3.4%) | 2,104 (2.6%) |
| 6:00 AM to 6:29 AM | 6,640 (9.1%) | 5,918 (7.5%) |
| 6:30 AM to 6:59 AM | 5,173 (7.1%) | 7,127 (9.0%) |
| 7:00 AM to 7:29 AM | 9,588 (13.2%) | 12,232 (15.4%) |
| 7:30 AM to 7:59 AM | 8,659 (11.9%) | 9,201 (11.6%) |
| 8:00 AM to 8:29 AM | 9,124 (12.6%) | 9,800 (12.3%) |
| 8:30 AM to 8:59 AM | 4,915 (6.8%) | 6,559 (8.3%) |
| 9:00 AM to 9:59 AM | 5,943 (8.2%) | 7,130 (9.0%) |
| 10:00 AM to 10:59 AM | 2,736 (3.8%) | 3,358 (4.2%) |
| 11:00 AM to 11:59 AM | 868 (1.2%) | 1,432 (1.8%) |
| 12:00 PM to 3:59 PM | 5,722 (7.9%) | 5,803 (7.3%) |
| 4:00 PM to 11:59 PM | 5,019 (6.9%) | 4,941 (6.2%) |
| Total | 72,715 (100.0%) | 79,328 (100.0%) |
Housing Occupancy in New Orleans
Occupancy by Ownership in New Orleans
Of the total 155,669 dwellings in New Orleans, owner-occupied units account for 76,725 (49.3%), while renter-occupied units make up 78,944 (50.7%).
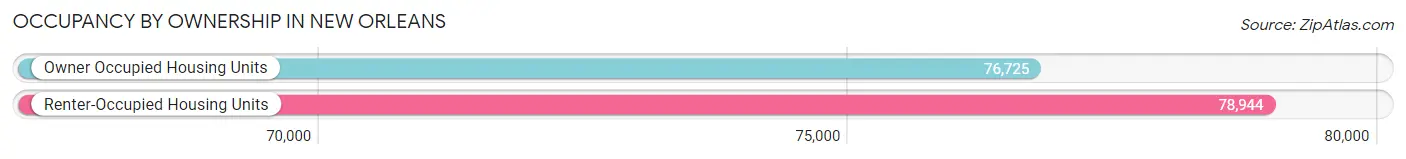
| Occupancy | # Housing Units | % Housing Units |
| Owner Occupied Housing Units | 76,725 | 49.3% |
| Renter-Occupied Housing Units | 78,944 | 50.7% |
| Total Occupied Housing Units | 155,669 | 100.0% |
Occupancy by Household Size in New Orleans
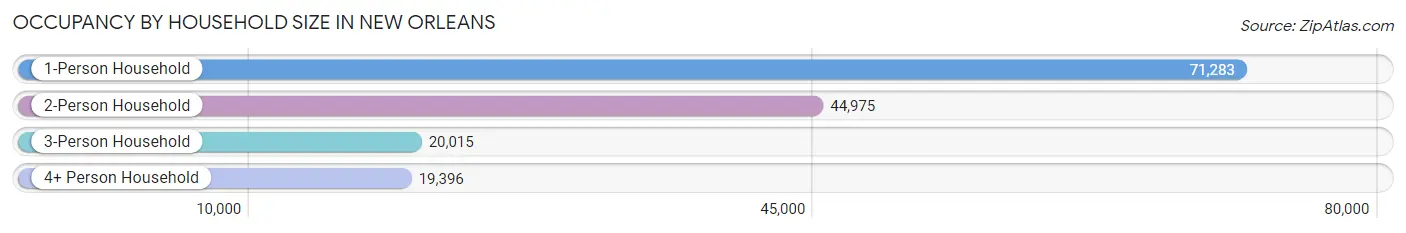
| Household Size | # Housing Units | % Housing Units |
| 1-Person Household | 71,283 | 45.8% |
| 2-Person Household | 44,975 | 28.9% |
| 3-Person Household | 20,015 | 12.9% |
| 4+ Person Household | 19,396 | 12.5% |
| Total Housing Units | 155,669 | 100.0% |
Occupancy by Ownership by Household Size in New Orleans
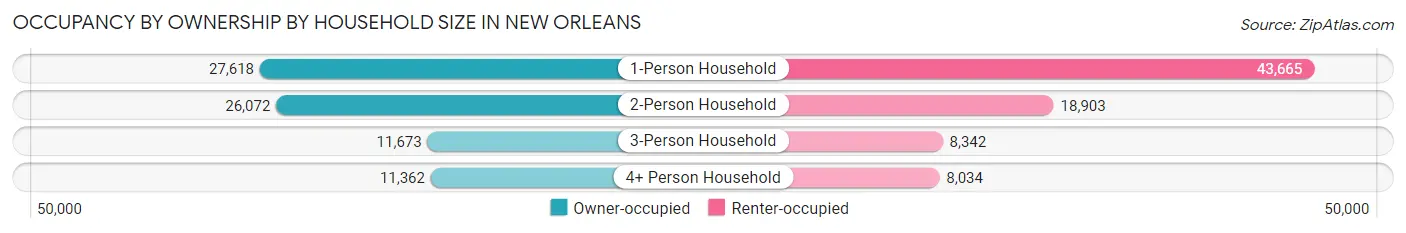
| Household Size | Owner-occupied | Renter-occupied |
| 1-Person Household | 27,618 (38.7%) | 43,665 (61.3%) |
| 2-Person Household | 26,072 (58.0%) | 18,903 (42.0%) |
| 3-Person Household | 11,673 (58.3%) | 8,342 (41.7%) |
| 4+ Person Household | 11,362 (58.6%) | 8,034 (41.4%) |
| Total Housing Units | 76,725 (49.3%) | 78,944 (50.7%) |
Occupancy by Educational Attainment in New Orleans
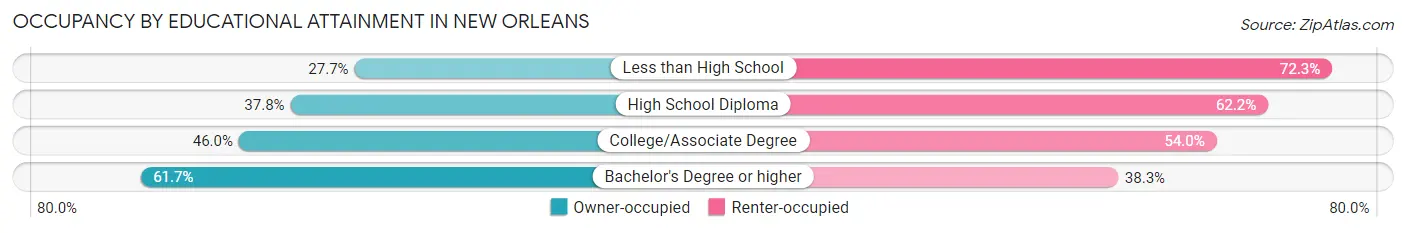
| Household Size | Owner-occupied | Renter-occupied |
| Less than High School | 4,326 (27.7%) | 11,298 (72.3%) |
| High School Diploma | 11,508 (37.8%) | 18,907 (62.2%) |
| College/Associate Degree | 19,726 (46.0%) | 23,138 (54.0%) |
| Bachelor's Degree or higher | 41,165 (61.7%) | 25,601 (38.3%) |
Occupancy by Age of Householder in New Orleans
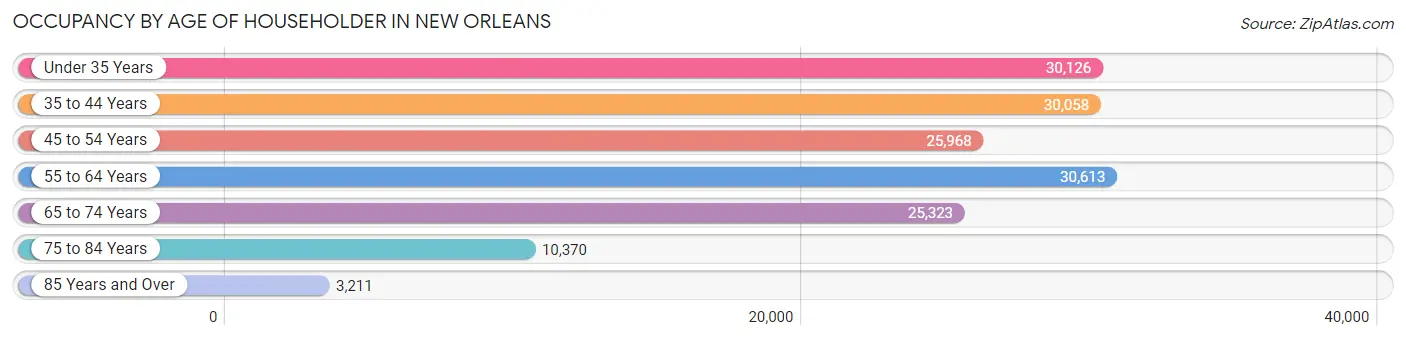
| Age Bracket | # Households | % Households |
| Under 35 Years | 30,126 | 19.4% |
| 35 to 44 Years | 30,058 | 19.3% |
| 45 to 54 Years | 25,968 | 16.7% |
| 55 to 64 Years | 30,613 | 19.7% |
| 65 to 74 Years | 25,323 | 16.3% |
| 75 to 84 Years | 10,370 | 6.7% |
| 85 Years and Over | 3,211 | 2.1% |
| Total | 155,669 | 100.0% |
Housing Finances in New Orleans
Median Income by Occupancy in New Orleans
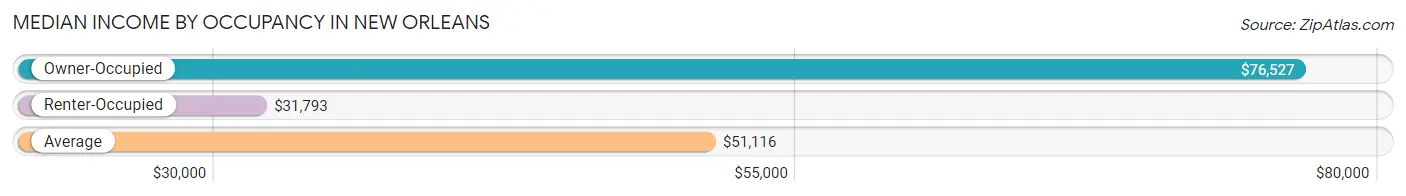
| Occupancy Type | # Households | Median Income |
| Owner-Occupied | 76,725 (49.3%) | $76,527 |
| Renter-Occupied | 78,944 (50.7%) | $31,793 |
| Average | 155,669 (100.0%) | $51,116 |
Occupancy by Householder Income Bracket in New Orleans
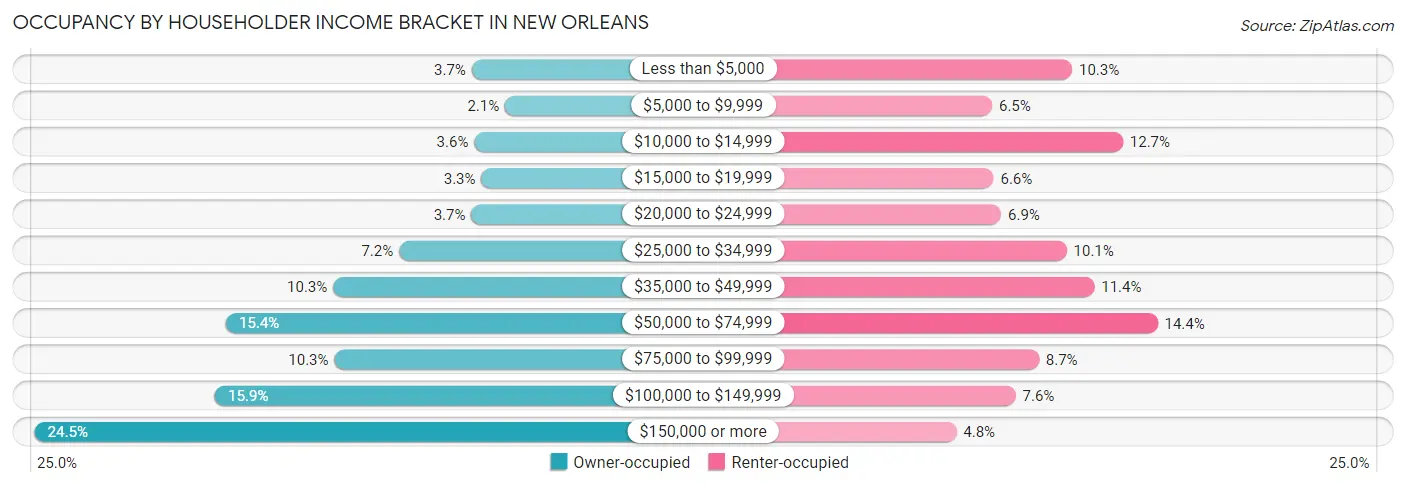
| Income Bracket | Owner-occupied | Renter-occupied |
| Less than $5,000 | 2,850 (3.7%) | 8,136 (10.3%) |
| $5,000 to $9,999 | 1,630 (2.1%) | 5,132 (6.5%) |
| $10,000 to $14,999 | 2,755 (3.6%) | 10,047 (12.7%) |
| $15,000 to $19,999 | 2,494 (3.3%) | 5,187 (6.6%) |
| $20,000 to $24,999 | 2,860 (3.7%) | 5,473 (6.9%) |
| $25,000 to $34,999 | 5,500 (7.2%) | 7,933 (10.1%) |
| $35,000 to $49,999 | 7,912 (10.3%) | 8,978 (11.4%) |
| $50,000 to $74,999 | 11,826 (15.4%) | 11,354 (14.4%) |
| $75,000 to $99,999 | 7,865 (10.2%) | 6,894 (8.7%) |
| $100,000 to $149,999 | 12,220 (15.9%) | 6,018 (7.6%) |
| $150,000 or more | 18,813 (24.5%) | 3,792 (4.8%) |
| Total | 76,725 (100.0%) | 78,944 (100.0%) |
Monthly Housing Cost Tiers in New Orleans
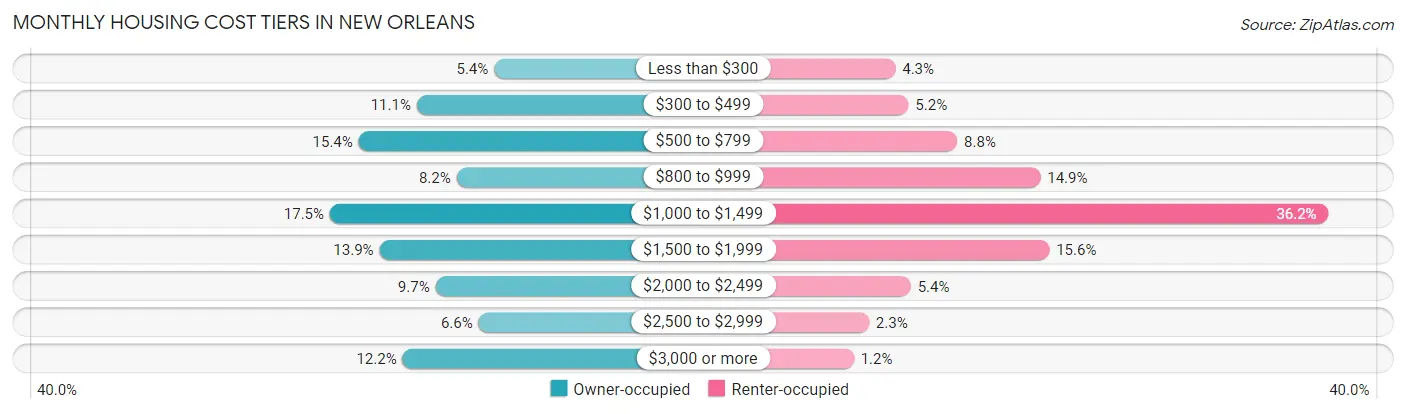
| Monthly Cost | Owner-occupied | Renter-occupied |
| Less than $300 | 4,157 (5.4%) | 3,360 (4.3%) |
| $300 to $499 | 8,532 (11.1%) | 4,125 (5.2%) |
| $500 to $799 | 11,819 (15.4%) | 6,962 (8.8%) |
| $800 to $999 | 6,284 (8.2%) | 11,797 (14.9%) |
| $1,000 to $1,499 | 13,440 (17.5%) | 28,546 (36.2%) |
| $1,500 to $1,999 | 10,640 (13.9%) | 12,314 (15.6%) |
| $2,000 to $2,499 | 7,475 (9.7%) | 4,264 (5.4%) |
| $2,500 to $2,999 | 5,039 (6.6%) | 1,831 (2.3%) |
| $3,000 or more | 9,339 (12.2%) | 951 (1.2%) |
| Total | 76,725 (100.0%) | 78,944 (100.0%) |
Physical Housing Characteristics in New Orleans
Housing Structures in New Orleans
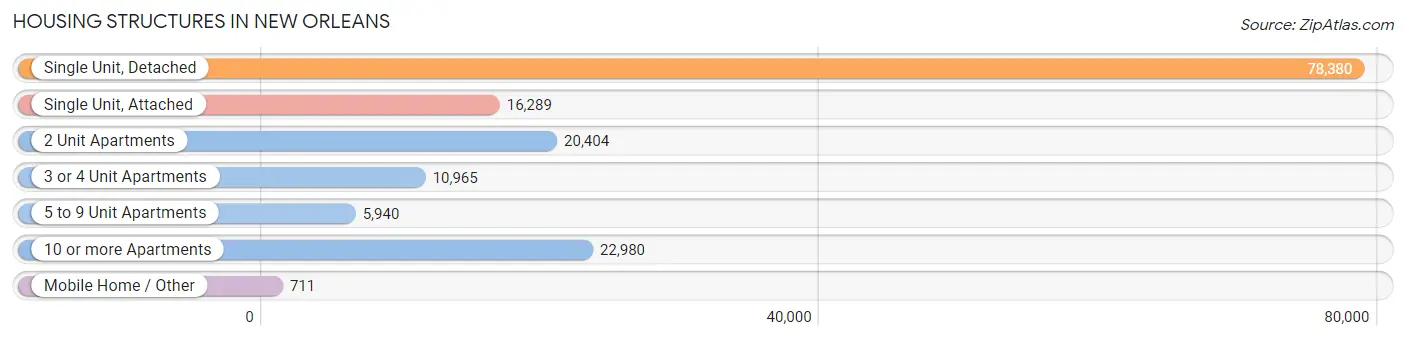
| Structure Type | # Housing Units | % Housing Units |
| Single Unit, Detached | 78,380 | 50.3% |
| Single Unit, Attached | 16,289 | 10.5% |
| 2 Unit Apartments | 20,404 | 13.1% |
| 3 or 4 Unit Apartments | 10,965 | 7.0% |
| 5 to 9 Unit Apartments | 5,940 | 3.8% |
| 10 or more Apartments | 22,980 | 14.8% |
| Mobile Home / Other | 711 | 0.5% |
| Total | 155,669 | 100.0% |
Housing Structures by Occupancy in New Orleans
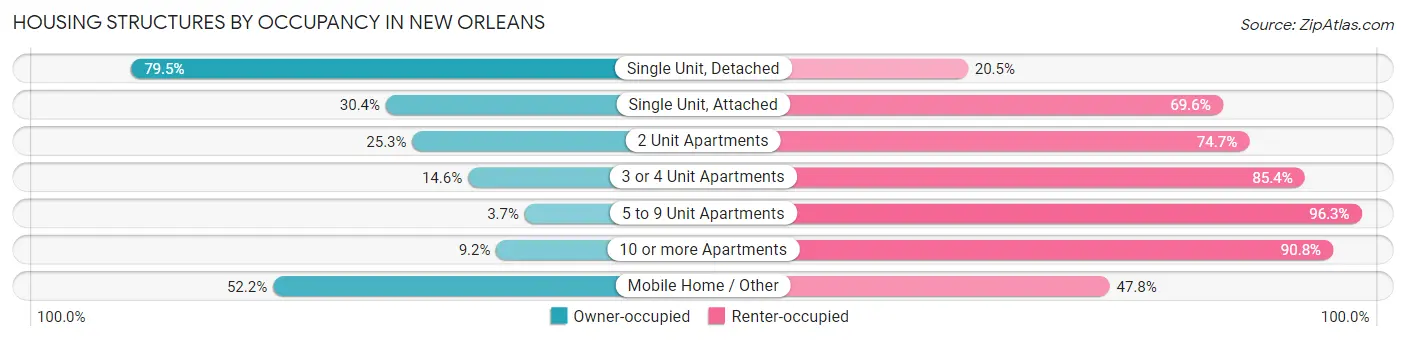
| Structure Type | Owner-occupied | Renter-occupied |
| Single Unit, Detached | 62,291 (79.5%) | 16,089 (20.5%) |
| Single Unit, Attached | 4,959 (30.4%) | 11,330 (69.6%) |
| 2 Unit Apartments | 5,171 (25.3%) | 15,233 (74.7%) |
| 3 or 4 Unit Apartments | 1,604 (14.6%) | 9,361 (85.4%) |
| 5 to 9 Unit Apartments | 220 (3.7%) | 5,720 (96.3%) |
| 10 or more Apartments | 2,109 (9.2%) | 20,871 (90.8%) |
| Mobile Home / Other | 371 (52.2%) | 340 (47.8%) |
| Total | 76,725 (49.3%) | 78,944 (50.7%) |
Housing Structures by Number of Rooms in New Orleans
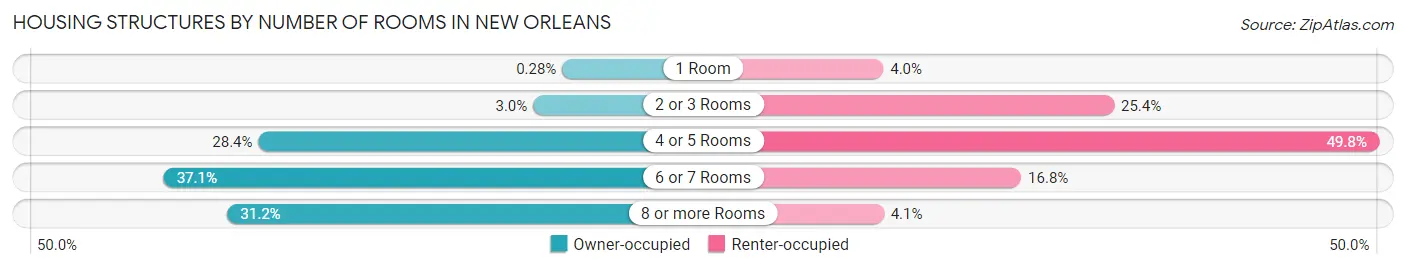
| Number of Rooms | Owner-occupied | Renter-occupied |
| 1 Room | 213 (0.3%) | 3,169 (4.0%) |
| 2 or 3 Rooms | 2,280 (3.0%) | 20,014 (25.4%) |
| 4 or 5 Rooms | 21,773 (28.4%) | 39,335 (49.8%) |
| 6 or 7 Rooms | 28,491 (37.1%) | 13,228 (16.8%) |
| 8 or more Rooms | 23,968 (31.2%) | 3,198 (4.1%) |
| Total | 76,725 (100.0%) | 78,944 (100.0%) |
Housing Structure by Heating Type in New Orleans
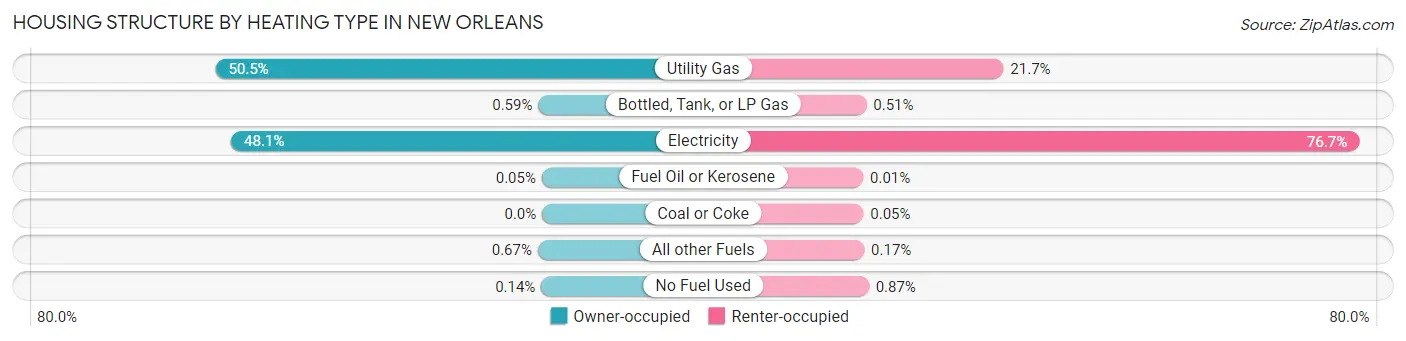
| Heating Type | Owner-occupied | Renter-occupied |
| Utility Gas | 38,735 (50.5%) | 17,133 (21.7%) |
| Bottled, Tank, or LP Gas | 449 (0.6%) | 404 (0.5%) |
| Electricity | 36,885 (48.1%) | 60,538 (76.7%) |
| Fuel Oil or Kerosene | 36 (0.1%) | 11 (0.0%) |
| Coal or Coke | 0 (0.0%) | 39 (0.1%) |
| All other Fuels | 515 (0.7%) | 135 (0.2%) |
| No Fuel Used | 105 (0.1%) | 684 (0.9%) |
| Total | 76,725 (100.0%) | 78,944 (100.0%) |
Household Vehicle Usage in New Orleans
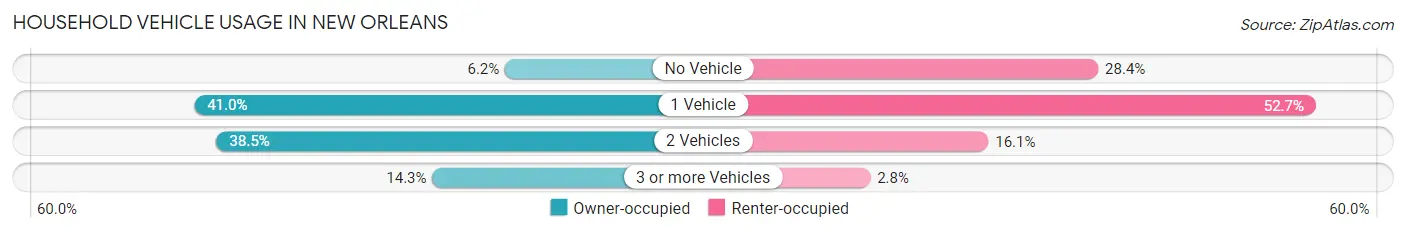
| Vehicles per Household | Owner-occupied | Renter-occupied |
| No Vehicle | 4,735 (6.2%) | 22,399 (28.4%) |
| 1 Vehicle | 31,457 (41.0%) | 41,635 (52.7%) |
| 2 Vehicles | 29,548 (38.5%) | 12,678 (16.1%) |
| 3 or more Vehicles | 10,985 (14.3%) | 2,232 (2.8%) |
| Total | 76,725 (100.0%) | 78,944 (100.0%) |
Real Estate & Mortgages in New Orleans
Real Estate and Mortgage Overview in New Orleans
| Characteristic | Without Mortgage | With Mortgage |
| Housing Units | 34,531 | 42,194 |
| Median Property Value | $243,300 | $316,600 |
| Median Household Income | $57,686 | $13,171 |
| Monthly Housing Costs | $611 | $8,923 |
| Real Estate Taxes | $1,634 | $1,147 |
Property Value by Mortgage Status in New Orleans
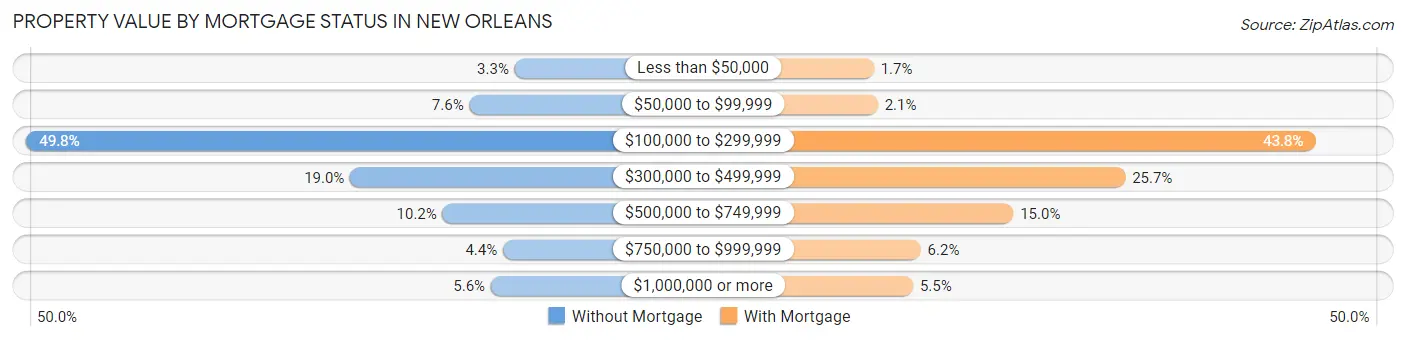
| Property Value | Without Mortgage | With Mortgage |
| Less than $50,000 | 1,148 (3.3%) | 732 (1.7%) |
| $50,000 to $99,999 | 2,636 (7.6%) | 892 (2.1%) |
| $100,000 to $299,999 | 17,208 (49.8%) | 18,473 (43.8%) |
| $300,000 to $499,999 | 6,558 (19.0%) | 10,834 (25.7%) |
| $500,000 to $749,999 | 3,520 (10.2%) | 6,337 (15.0%) |
| $750,000 to $999,999 | 1,530 (4.4%) | 2,618 (6.2%) |
| $1,000,000 or more | 1,931 (5.6%) | 2,308 (5.5%) |
| Total | 34,531 (100.0%) | 42,194 (100.0%) |
Household Income by Mortgage Status in New Orleans
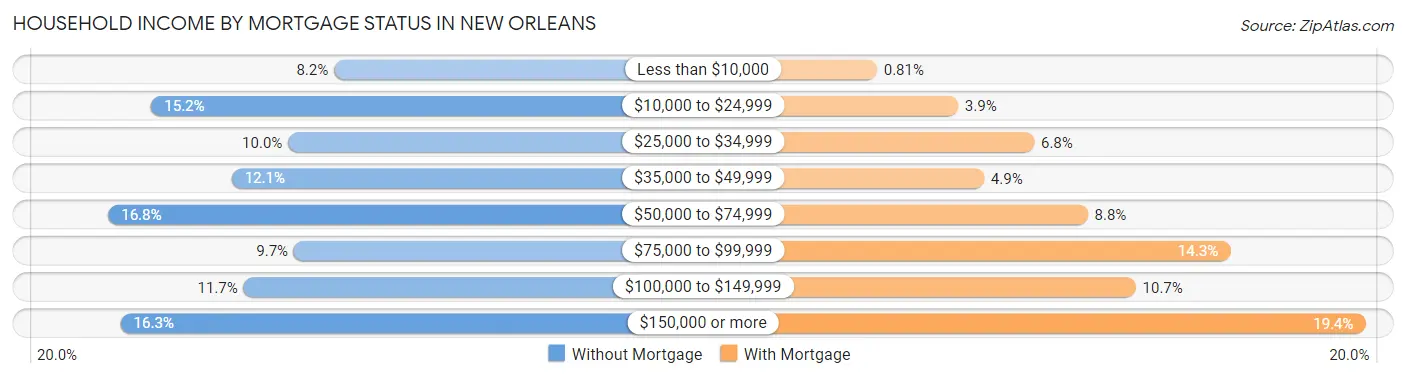
| Household Income | Without Mortgage | With Mortgage |
| Less than $10,000 | 2,834 (8.2%) | 340 (0.8%) |
| $10,000 to $24,999 | 5,239 (15.2%) | 1,646 (3.9%) |
| $25,000 to $34,999 | 3,438 (10.0%) | 2,870 (6.8%) |
| $35,000 to $49,999 | 4,180 (12.1%) | 2,062 (4.9%) |
| $50,000 to $74,999 | 5,805 (16.8%) | 3,732 (8.8%) |
| $75,000 to $99,999 | 3,365 (9.7%) | 6,021 (14.3%) |
| $100,000 to $149,999 | 4,028 (11.7%) | 4,500 (10.7%) |
| $150,000 or more | 5,642 (16.3%) | 8,192 (19.4%) |
| Total | 34,531 (100.0%) | 42,194 (100.0%) |
Property Value to Household Income Ratio in New Orleans
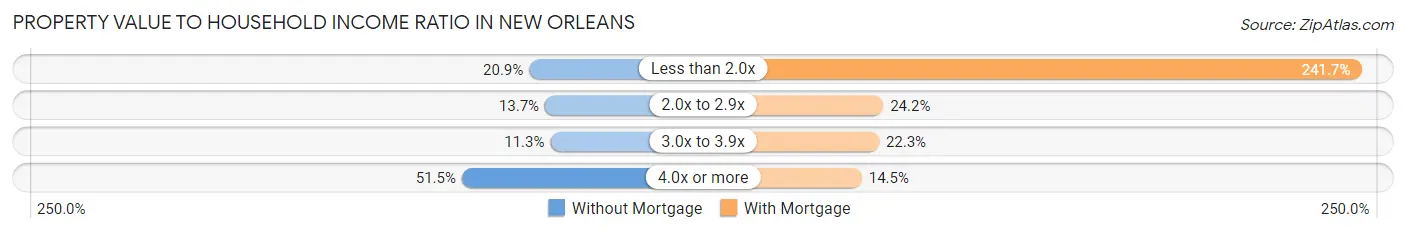
| Value-to-Income Ratio | Without Mortgage | With Mortgage |
| Less than 2.0x | 7,226 (20.9%) | 101,973 (241.7%) |
| 2.0x to 2.9x | 4,746 (13.7%) | 10,215 (24.2%) |
| 3.0x to 3.9x | 3,914 (11.3%) | 9,388 (22.3%) |
| 4.0x or more | 17,790 (51.5%) | 6,105 (14.5%) |
| Total | 34,531 (100.0%) | 42,194 (100.0%) |
Real Estate Taxes by Mortgage Status in New Orleans
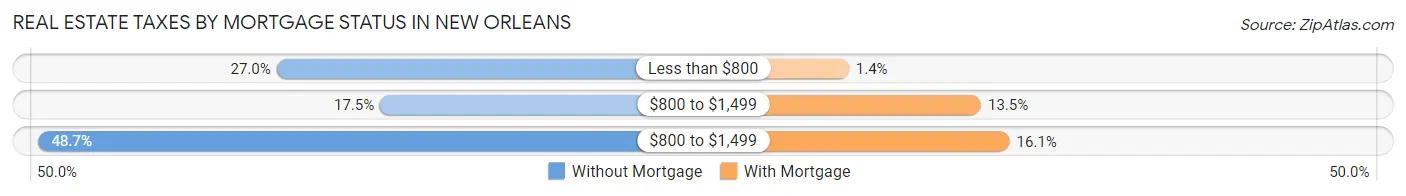
| Property Taxes | Without Mortgage | With Mortgage |
| Less than $800 | 9,319 (27.0%) | 609 (1.4%) |
| $800 to $1,499 | 6,057 (17.5%) | 5,704 (13.5%) |
| $800 to $1,499 | 16,828 (48.7%) | 6,804 (16.1%) |
| Total | 34,531 (100.0%) | 42,194 (100.0%) |
Health & Disability in New Orleans
Health Insurance Coverage by Age in New Orleans
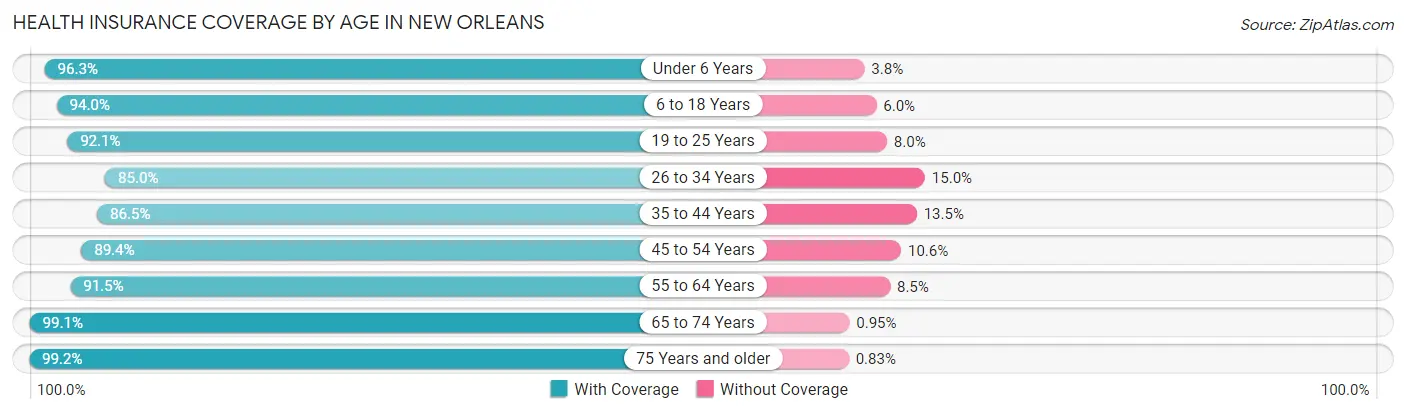
| Age Bracket | With Coverage | Without Coverage |
| Under 6 Years | 23,970 (96.3%) | 935 (3.7%) |
| 6 to 18 Years | 51,186 (94.0%) | 3,256 (6.0%) |
| 19 to 25 Years | 31,959 (92.0%) | 2,759 (8.0%) |
| 26 to 34 Years | 47,579 (85.0%) | 8,417 (15.0%) |
| 35 to 44 Years | 46,529 (86.5%) | 7,270 (13.5%) |
| 45 to 54 Years | 38,954 (89.4%) | 4,609 (10.6%) |
| 55 to 64 Years | 44,583 (91.5%) | 4,160 (8.5%) |
| 65 to 74 Years | 37,123 (99.1%) | 355 (0.9%) |
| 75 Years and older | 21,224 (99.2%) | 177 (0.8%) |
| Total | 343,107 (91.5%) | 31,938 (8.5%) |
Health Insurance Coverage by Citizenship Status in New Orleans
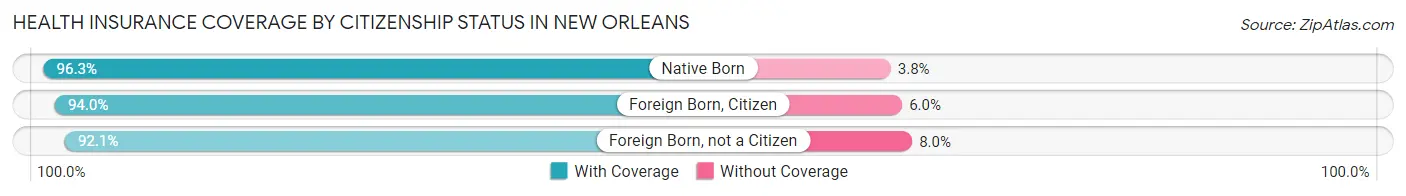
| Citizenship Status | With Coverage | Without Coverage |
| Native Born | 23,970 (96.3%) | 935 (3.7%) |
| Foreign Born, Citizen | 51,186 (94.0%) | 3,256 (6.0%) |
| Foreign Born, not a Citizen | 31,959 (92.0%) | 2,759 (8.0%) |
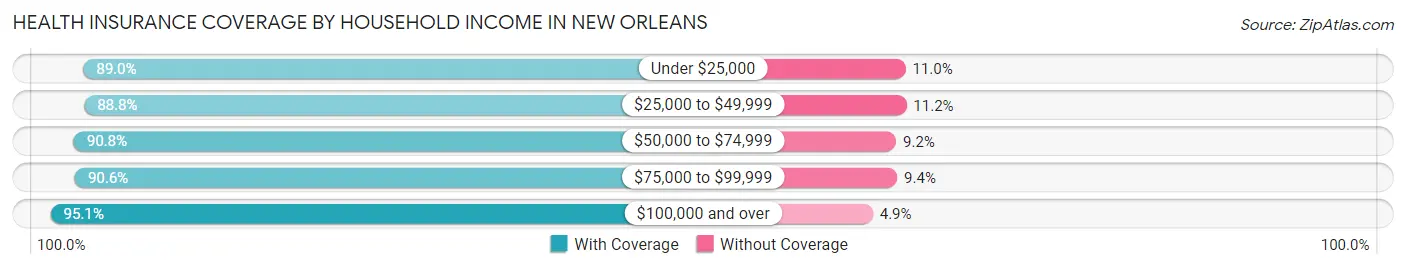
Health Insurance Coverage by Household Income in New Orleans
| Household Income | With Coverage | Without Coverage |
| Under $25,000 | 75,184 (89.0%) | 9,297 (11.0%) |
| $25,000 to $49,999 | 60,803 (88.8%) | 7,642 (11.2%) |
| $50,000 to $74,999 | 49,624 (90.8%) | 5,048 (9.2%) |
| $75,000 to $99,999 | 33,805 (90.6%) | 3,524 (9.4%) |
| $100,000 and over | 114,151 (95.1%) | 5,848 (4.9%) |
Public vs Private Health Insurance Coverage by Age in New Orleans
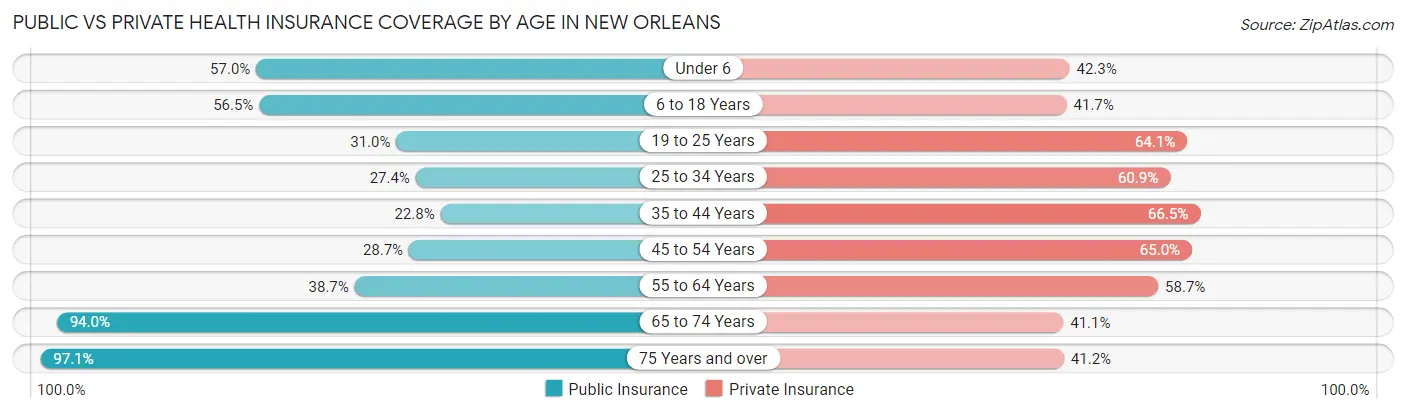
| Age Bracket | Public Insurance | Private Insurance |
| Under 6 | 14,201 (57.0%) | 10,528 (42.3%) |
| 6 to 18 Years | 30,736 (56.5%) | 22,717 (41.7%) |
| 19 to 25 Years | 10,767 (31.0%) | 22,255 (64.1%) |
| 25 to 34 Years | 15,346 (27.4%) | 34,119 (60.9%) |
| 35 to 44 Years | 12,272 (22.8%) | 35,782 (66.5%) |
| 45 to 54 Years | 12,486 (28.7%) | 28,306 (65.0%) |
| 55 to 64 Years | 18,883 (38.7%) | 28,622 (58.7%) |
| 65 to 74 Years | 35,243 (94.0%) | 15,406 (41.1%) |
| 75 Years and over | 20,774 (97.1%) | 8,824 (41.2%) |
| Total | 170,708 (45.5%) | 206,559 (55.1%) |
Disability Status by Sex by Age in New Orleans
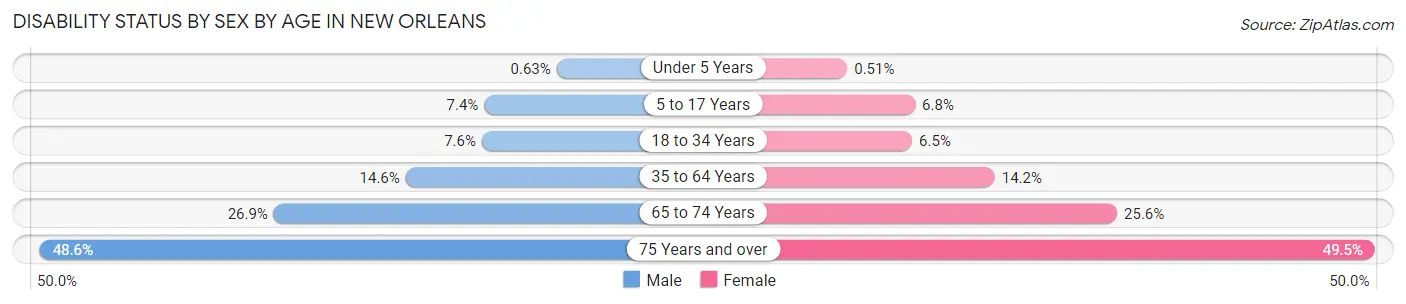
| Age Bracket | Male | Female |
| Under 5 Years | 69 (0.6%) | 52 (0.5%) |
| 5 to 17 Years | 1,978 (7.3%) | 1,808 (6.8%) |
| 18 to 34 Years | 3,310 (7.6%) | 3,374 (6.5%) |
| 35 to 64 Years | 10,063 (14.6%) | 10,985 (14.2%) |
| 65 to 74 Years | 4,568 (26.9%) | 5,233 (25.6%) |
| 75 Years and over | 4,151 (48.6%) | 6,360 (49.5%) |
Disability Class by Sex by Age in New Orleans
Disability Class: Hearing Difficulty
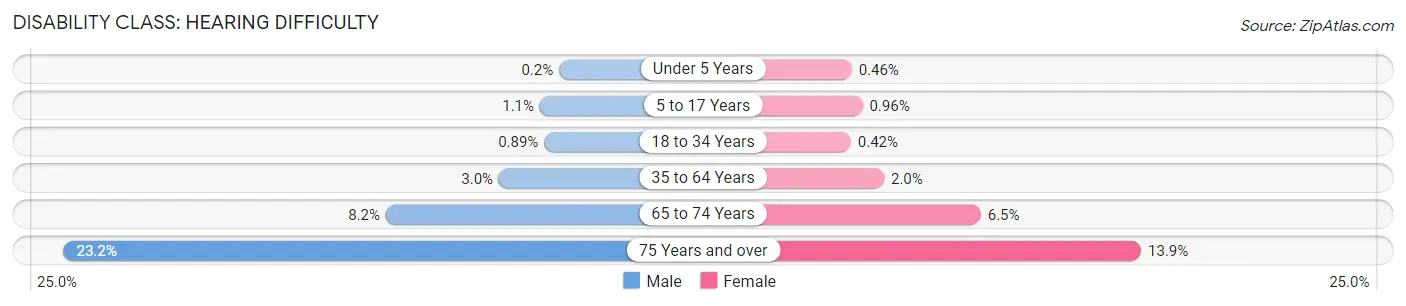
| Age Bracket | Male | Female |
| Under 5 Years | 22 (0.2%) | 47 (0.5%) |
| 5 to 17 Years | 293 (1.1%) | 254 (1.0%) |
| 18 to 34 Years | 388 (0.9%) | 215 (0.4%) |
| 35 to 64 Years | 2,057 (3.0%) | 1,518 (2.0%) |
| 65 to 74 Years | 1,400 (8.2%) | 1,322 (6.5%) |
| 75 Years and over | 1,981 (23.2%) | 1,786 (13.9%) |
Disability Class: Vision Difficulty
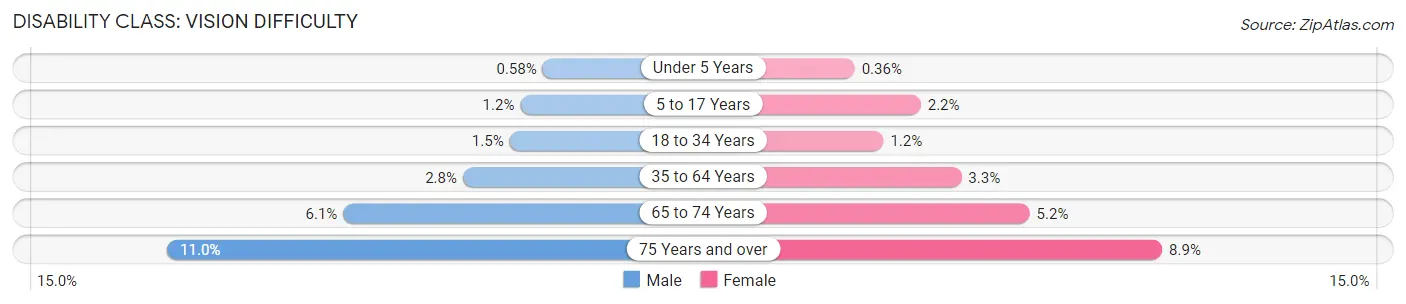
| Age Bracket | Male | Female |
| Under 5 Years | 63 (0.6%) | 37 (0.4%) |
| 5 to 17 Years | 323 (1.2%) | 585 (2.2%) |
| 18 to 34 Years | 657 (1.5%) | 601 (1.2%) |
| 35 to 64 Years | 1,926 (2.8%) | 2,577 (3.3%) |
| 65 to 74 Years | 1,041 (6.1%) | 1,071 (5.2%) |
| 75 Years and over | 942 (11.0%) | 1,147 (8.9%) |
Disability Class: Cognitive Difficulty
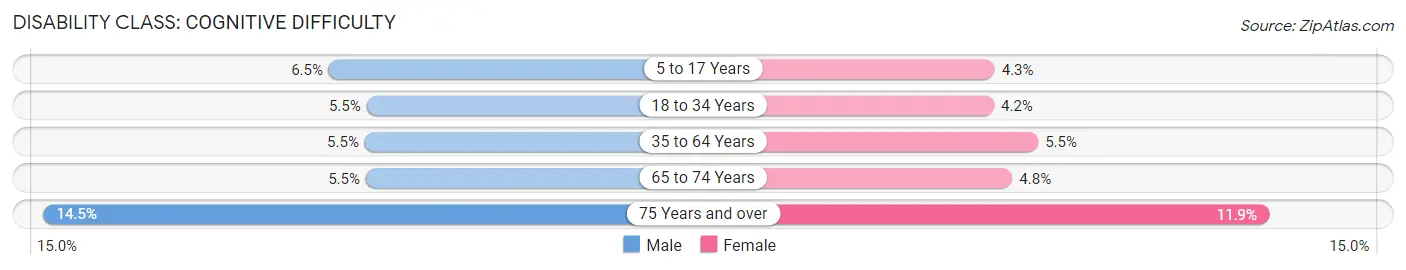
| Age Bracket | Male | Female |
| 5 to 17 Years | 1,757 (6.5%) | 1,131 (4.3%) |
| 18 to 34 Years | 2,399 (5.5%) | 2,192 (4.2%) |
| 35 to 64 Years | 3,803 (5.5%) | 4,230 (5.5%) |
| 65 to 74 Years | 934 (5.5%) | 973 (4.8%) |
| 75 Years and over | 1,236 (14.5%) | 1,529 (11.9%) |
Disability Class: Ambulatory Difficulty
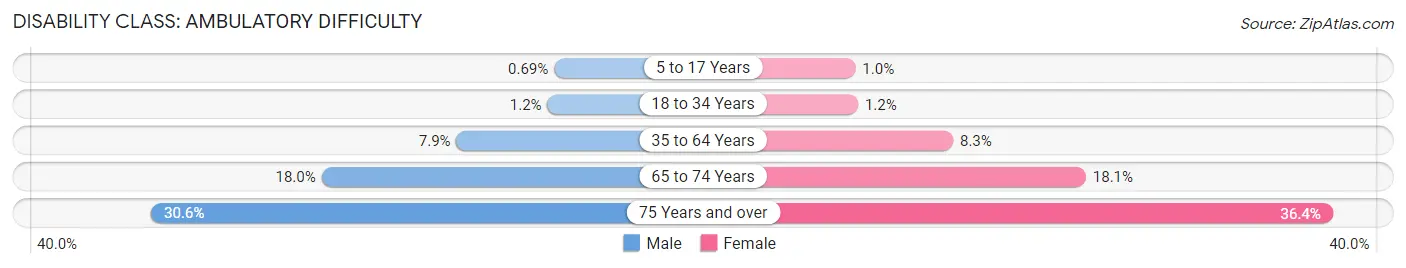
| Age Bracket | Male | Female |
| 5 to 17 Years | 186 (0.7%) | 268 (1.0%) |
| 18 to 34 Years | 516 (1.2%) | 620 (1.2%) |
| 35 to 64 Years | 5,459 (7.9%) | 6,390 (8.3%) |
| 65 to 74 Years | 3,050 (17.9%) | 3,712 (18.1%) |
| 75 Years and over | 2,615 (30.6%) | 4,685 (36.4%) |
Disability Class: Self-Care Difficulty
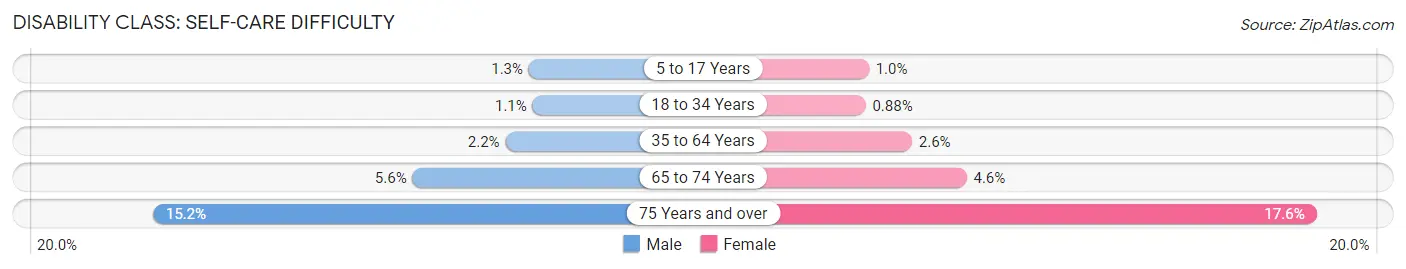
| Age Bracket | Male | Female |
| 5 to 17 Years | 345 (1.3%) | 266 (1.0%) |
| 18 to 34 Years | 498 (1.1%) | 457 (0.9%) |
| 35 to 64 Years | 1,481 (2.1%) | 2,015 (2.6%) |
| 65 to 74 Years | 951 (5.6%) | 949 (4.6%) |
| 75 Years and over | 1,302 (15.2%) | 2,266 (17.6%) |
Technology Access in New Orleans
Computing Device Access in New Orleans
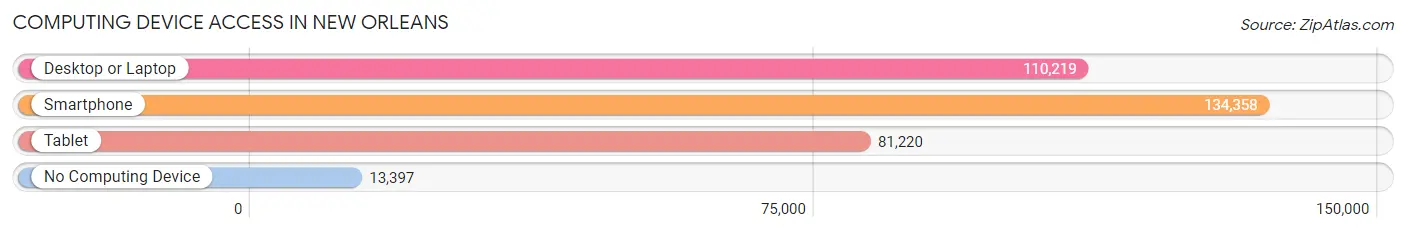
| Device Type | # Households | % Households |
| Desktop or Laptop | 110,219 | 70.8% |
| Smartphone | 134,358 | 86.3% |
| Tablet | 81,220 | 52.2% |
| No Computing Device | 13,397 | 8.6% |
| Total | 155,669 | 100.0% |
Internet Access in New Orleans
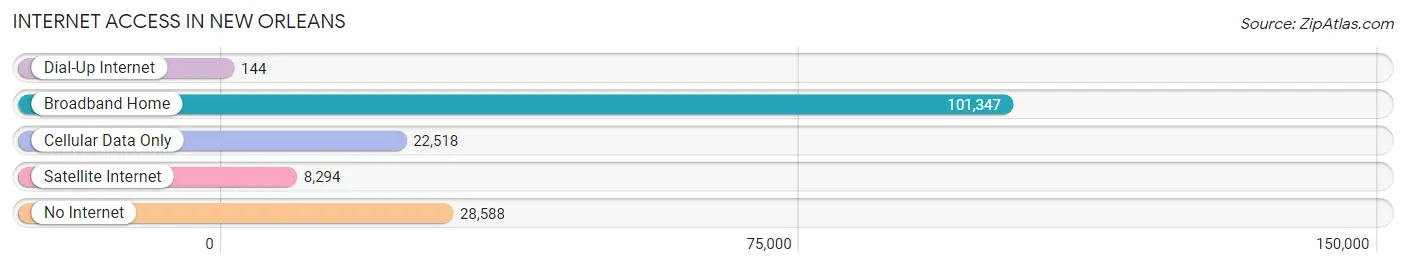
| Internet Type | # Households | % Households |
| Dial-Up Internet | 144 | 0.1% |
| Broadband Home | 101,347 | 65.1% |
| Cellular Data Only | 22,518 | 14.5% |
| Satellite Internet | 8,294 | 5.3% |
| No Internet | 28,588 | 18.4% |
| Total | 155,669 | 100.0% |
New Orleans Summary
New Orleans, Louisiana is a city with a rich history, diverse geography, and a unique economy and demographics. Located in the southeastern corner of Louisiana, New Orleans is the largest city in the state and the most populous city in the Gulf Coast region. It is known for its vibrant culture, unique cuisine, and its annual Mardi Gras celebration.
History
New Orleans was founded in 1718 by French explorer Jean-Baptiste Le Moyne de Bienville. The city was named after the Duke of Orleans, who was the Regent of France at the time. The city was originally a French colony, but it was ceded to the Spanish in 1763. The Spanish held control of the city until 1803, when it was sold to the United States as part of the Louisiana Purchase.
New Orleans quickly became an important port city and a major center of trade. It was a major port for the import and export of goods, including cotton, sugar, and coffee. The city was also a major center of the slave trade.
In the early 19th century, New Orleans was a major center of the cotton industry. The city was also a major center of the jazz music scene, and it was home to many of the early jazz musicians.
In the late 19th century, New Orleans was a major center of the oil industry. The city was also a major center of the shipping industry, and it was home to many of the major shipping companies.
In the early 20th century, New Orleans was a major center of the tourism industry. The city was home to many of the major tourist attractions, including the French Quarter and the Garden District.
In 2005, New Orleans was devastated by Hurricane Katrina. The city was flooded, and many of its residents were displaced. The city has since recovered, and it is now a major center of culture, tourism, and industry.
Geography
New Orleans is located in the southeastern corner of Louisiana, on the banks of the Mississippi River. The city is bordered by Lake Pontchartrain to the north and the Gulf of Mexico to the south. The city is divided into several distinct neighborhoods, including the French Quarter, the Garden District, and the Central Business District.
The city is located in a humid subtropical climate zone, and it experiences hot, humid summers and mild winters. The city is prone to hurricanes and tropical storms, and it is often affected by flooding.
Economy
New Orleans is a major center of industry and commerce. The city is home to many of the major oil and gas companies, as well as the Port of New Orleans, one of the busiest ports in the United States. The city is also a major center of tourism, and it is home to many of the major tourist attractions, including the French Quarter and the Garden District.
The city is also a major center of culture and the arts. The city is home to many of the major museums, galleries, and performing arts venues.
Demographics
As of the 2010 census, the population of New Orleans was 343,829. The city is majority African American, with a population that is 63.7% African American, 30.2% White, 3.0% Hispanic or Latino, and 2.7% Asian. The median household income in the city is $37,716, and the median home value is $164,400.
New Orleans is a diverse city, with a rich culture and a unique history. The city is a major center of industry, commerce, and tourism, and it is home to many of the major tourist attractions. The city is also a major center of culture and the arts, and it is home to many of the major museums, galleries, and performing arts venues.
Common Questions
What is Per Capita Income in New Orleans?
Per Capita income in New Orleans is $37,013.
What is the Median Family Income in New Orleans?
Median Family Income in New Orleans is $73,549.
What is the Median Household income in New Orleans?
Median Household Income in New Orleans is $51,116.
What is Income or Wage Gap in New Orleans?
Income or Wage Gap in New Orleans is 25.2%.
Women in New Orleans earn 74.8 cents for every dollar earned by a man.
What is Family Income Deficit in New Orleans?
Family Income Deficit in New Orleans is $11,648.
Families that are below poverty line in New Orleans earn $11,648 less on average than the poverty threshold level.
What is Inequality or Gini Index in New Orleans?
Inequality or Gini Index in New Orleans is 0.56.
What is the Total Population of New Orleans?
Total Population of New Orleans is 380,408.
What is the Total Male Population of New Orleans?
Total Male Population of New Orleans is 179,688.
What is the Total Female Population of New Orleans?
Total Female Population of New Orleans is 200,720.
What is the Ratio of Males per 100 Females in New Orleans?
There are 89.52 Males per 100 Females in New Orleans.
What is the Ratio of Females per 100 Males in New Orleans?
There are 111.70 Females per 100 Males in New Orleans.
What is the Median Population Age in New Orleans?
Median Population Age in New Orleans is 37.9 Years.
What is the Average Family Size in New Orleans
Average Family Size in New Orleans is 3.5 People.
What is the Average Household Size in New Orleans
Average Household Size in New Orleans is 2.4 People.
How Large is the Labor Force in New Orleans?
There are 191,782 People in the Labor Forcein in New Orleans.
What is the Percentage of People in the Labor Force in New Orleans?
61.2% of People are in the Labor Force in New Orleans.
What is the Unemployment Rate in New Orleans?
Unemployment Rate in New Orleans is 8.4%.