Portland, OR Map & Demographics
Portland Map
Portland Overview
$52,577
PER CAPITA INCOME
$116,103
AVG FAMILY INCOME
$85,876
AVG HOUSEHOLD INCOME
16.6%
WAGE / INCOME GAP [ % ]
83.4¢/ $1
WAGE / INCOME GAP [ $ ]
$10,440
FAMILY INCOME DEFICIT
0.47
INEQUALITY / GINI INDEX
646,101
TOTAL POPULATION
321,981
MALE POPULATION
324,120
FEMALE POPULATION
99.34
MALES / 100 FEMALES
100.66
FEMALES / 100 MALES
38.3
MEDIAN AGE
2.9
AVG FAMILY SIZE
2.2
AVG HOUSEHOLD SIZE
389,749
LABOR FORCE [ PEOPLE ]
70.9%
PERCENT IN LABOR FORCE
5.6%
UNEMPLOYMENT RATE
Portland Zip Codes
Income in Portland
Income Overview in Portland
Per Capita Income in Portland is $52,577, while median incomes of families and households are $116,103 and $85,876 respectively.
| Characteristic | Number | Measure |
| Per Capita Income | 646,101 | $52,577 |
| Median Family Income | 138,927 | $116,103 |
| Mean Family Income | 138,927 | $150,063 |
| Median Household Income | 283,896 | $85,876 |
| Mean Household Income | 283,896 | $117,687 |
| Income Deficit | 138,927 | $10,440 |
| Wage / Income Gap (%) | 646,101 | 16.61% |
| Wage / Income Gap ($) | 646,101 | 83.39¢ per $1 |
| Gini / Inequality Index | 646,101 | 0.47 |
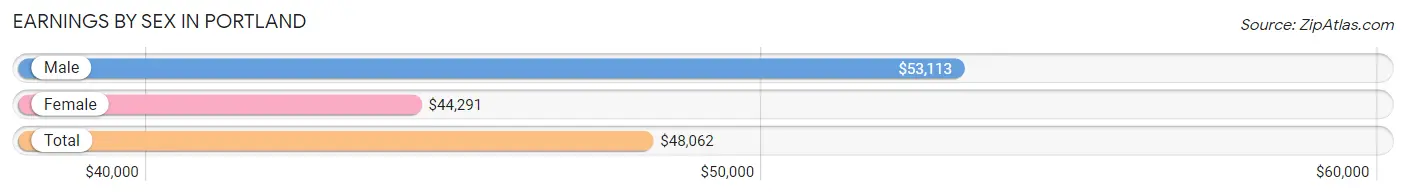
Earnings by Sex in Portland
Average Earnings in Portland are $48,062, $53,113 for men and $44,291 for women, a difference of 16.6%.
| Sex | Number | Average Earnings |
| Male | 207,195 (51.2%) | $53,113 |
| Female | 197,442 (48.8%) | $44,291 |
| Total | 404,637 (100.0%) | $48,062 |
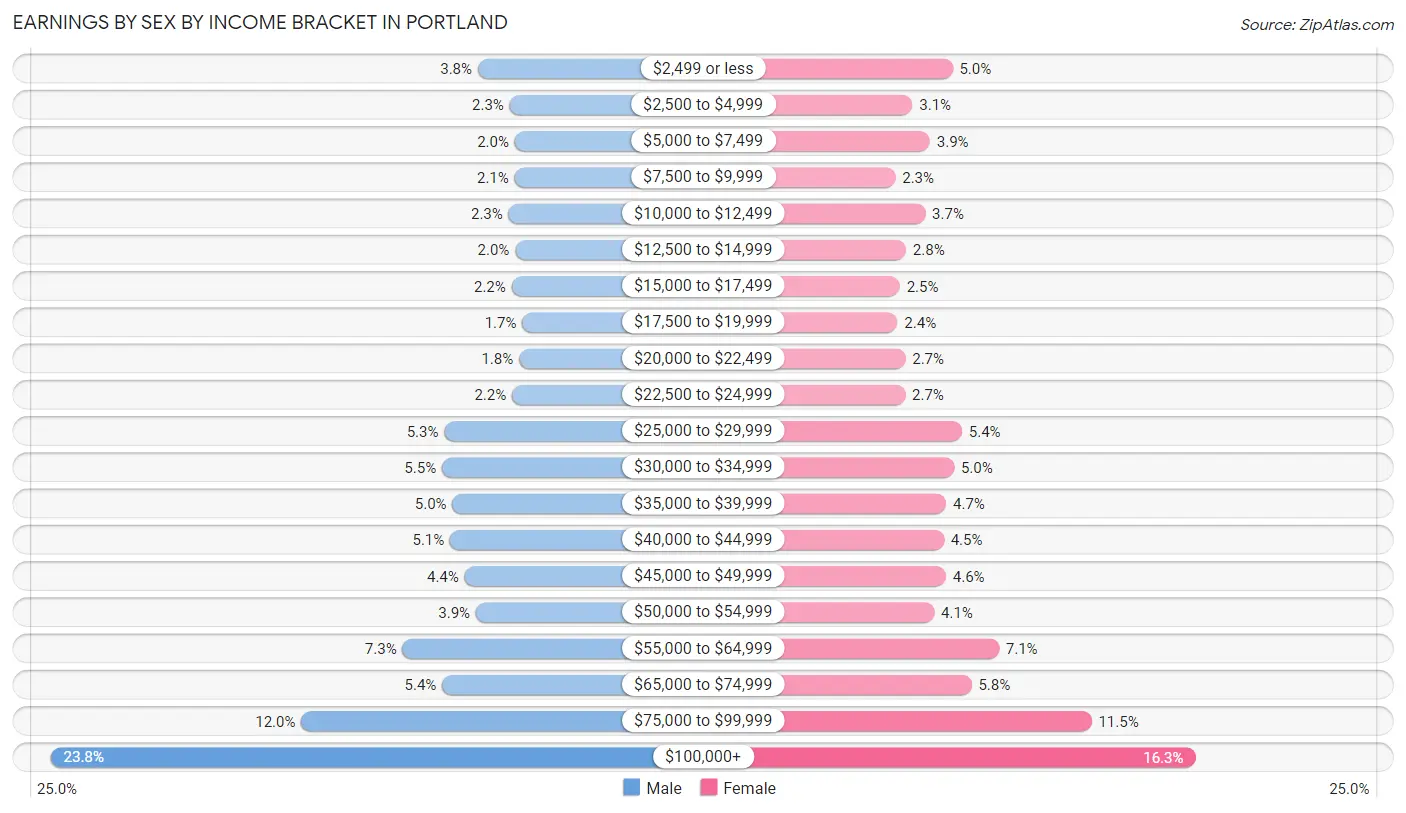
Earnings by Sex by Income Bracket in Portland
The most common earnings brackets in Portland are $100,000+ for men (49,275 | 23.8%) and $100,000+ for women (32,218 | 16.3%).
| Income | Male | Female |
| $2,499 or less | 7,804 (3.8%) | 9,773 (5.0%) |
| $2,500 to $4,999 | 4,717 (2.3%) | 6,062 (3.1%) |
| $5,000 to $7,499 | 4,224 (2.0%) | 7,680 (3.9%) |
| $7,500 to $9,999 | 4,250 (2.1%) | 4,487 (2.3%) |
| $10,000 to $12,499 | 4,832 (2.3%) | 7,247 (3.7%) |
| $12,500 to $14,999 | 4,188 (2.0%) | 5,464 (2.8%) |
| $15,000 to $17,499 | 4,536 (2.2%) | 4,902 (2.5%) |
| $17,500 to $19,999 | 3,494 (1.7%) | 4,676 (2.4%) |
| $20,000 to $22,499 | 3,819 (1.8%) | 5,417 (2.7%) |
| $22,500 to $24,999 | 4,491 (2.2%) | 5,399 (2.7%) |
| $25,000 to $29,999 | 11,071 (5.3%) | 10,643 (5.4%) |
| $30,000 to $34,999 | 11,296 (5.4%) | 9,905 (5.0%) |
| $35,000 to $39,999 | 10,269 (5.0%) | 9,172 (4.6%) |
| $40,000 to $44,999 | 10,513 (5.1%) | 8,968 (4.5%) |
| $45,000 to $49,999 | 9,088 (4.4%) | 9,163 (4.6%) |
| $50,000 to $54,999 | 7,991 (3.9%) | 8,069 (4.1%) |
| $55,000 to $64,999 | 15,119 (7.3%) | 14,052 (7.1%) |
| $65,000 to $74,999 | 11,263 (5.4%) | 11,523 (5.8%) |
| $75,000 to $99,999 | 24,955 (12.0%) | 22,622 (11.5%) |
| $100,000+ | 49,275 (23.8%) | 32,218 (16.3%) |
| Total | 207,195 (100.0%) | 197,442 (100.0%) |
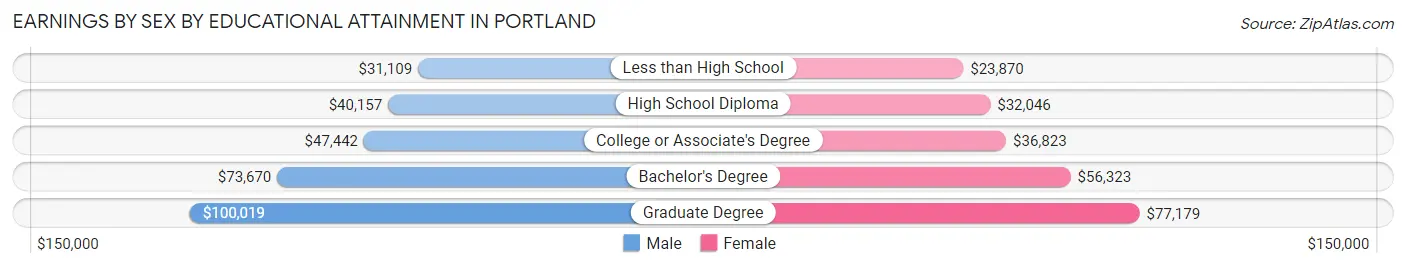
Earnings by Sex by Educational Attainment in Portland
Average earnings in Portland are $58,044 for men and $50,103 for women, a difference of 13.7%. Men with an educational attainment of graduate degree enjoy the highest average annual earnings of $100,019, while those with less than high school education earn the least with $31,109. Women with an educational attainment of graduate degree earn the most with the average annual earnings of $77,179, while those with less than high school education have the smallest earnings of $23,870.
| Educational Attainment | Male Income | Female Income |
| Less than High School | $31,109 | $23,870 |
| High School Diploma | $40,157 | $32,046 |
| College or Associate's Degree | $47,442 | $36,823 |
| Bachelor's Degree | $73,670 | $56,323 |
| Graduate Degree | $100,019 | $77,179 |
| Total | $58,044 | $50,103 |
Family Income in Portland
Family Income Brackets in Portland
According to the Portland family income data, there are 30,425 families falling into the $200,000+ income range, which is the most common income bracket and makes up 21.9% of all families. Conversely, the $10,000 to $14,999 income bracket is the least frequent group with only 1,667 families (1.2%) belonging to this category.
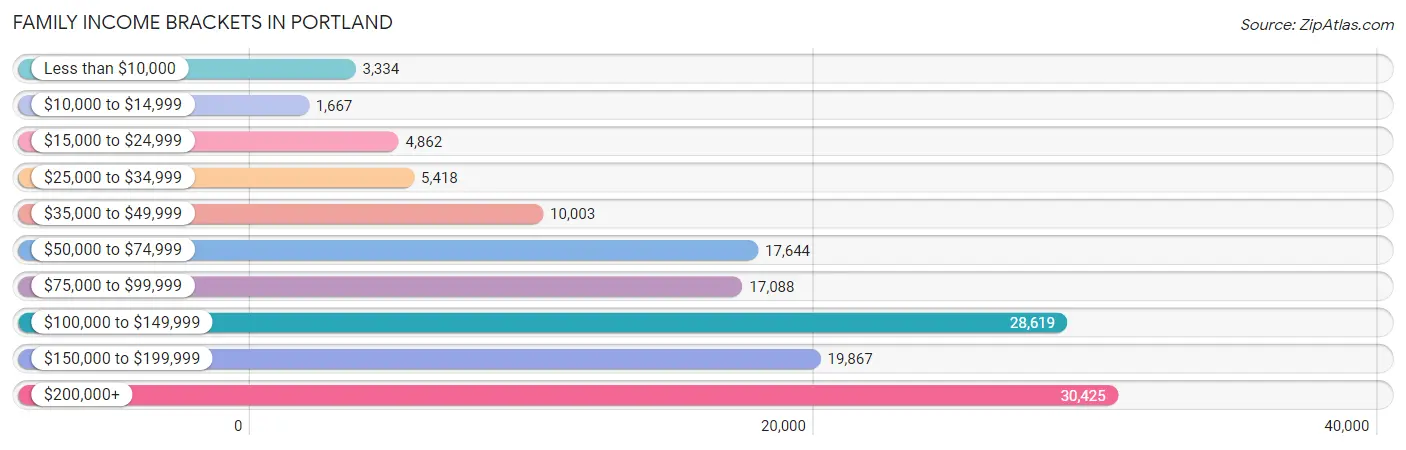
| Income Bracket | # Families | % Families |
| Less than $10,000 | 3,334 | 2.4% |
| $10,000 to $14,999 | 1,667 | 1.2% |
| $15,000 to $24,999 | 4,862 | 3.5% |
| $25,000 to $34,999 | 5,418 | 3.9% |
| $35,000 to $49,999 | 10,003 | 7.2% |
| $50,000 to $74,999 | 17,644 | 12.7% |
| $75,000 to $99,999 | 17,088 | 12.3% |
| $100,000 to $149,999 | 28,619 | 20.6% |
| $150,000 to $199,999 | 19,867 | 14.3% |
| $200,000+ | 30,425 | 21.9% |
Family Income by Famaliy Size in Portland
4-person families (24,473 | 17.6%) account for the highest median family income in Portland with $148,305 per family, while 2-person families (70,682 | 50.9%) have the highest median income of $51,888 per family member.
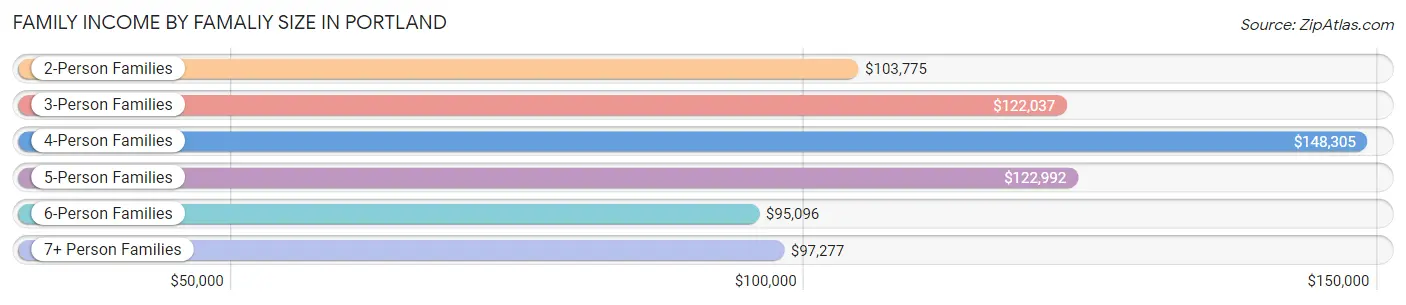
| Income Bracket | # Families | Median Income |
| 2-Person Families | 70,682 (50.9%) | $103,775 |
| 3-Person Families | 31,954 (23.0%) | $122,037 |
| 4-Person Families | 24,473 (17.6%) | $148,305 |
| 5-Person Families | 7,576 (5.4%) | $122,992 |
| 6-Person Families | 2,568 (1.8%) | $95,096 |
| 7+ Person Families | 1,674 (1.2%) | $97,277 |
| Total | 138,927 (100.0%) | $116,103 |
Family Income by Number of Earners in Portland
The median family income in Portland is $116,103, with families comprising 3+ earners (13,370) having the highest median family income of $154,327, while families with no earners (16,430) have the lowest median family income of $68,162, accounting for 9.6% and 11.8% of families, respectively.
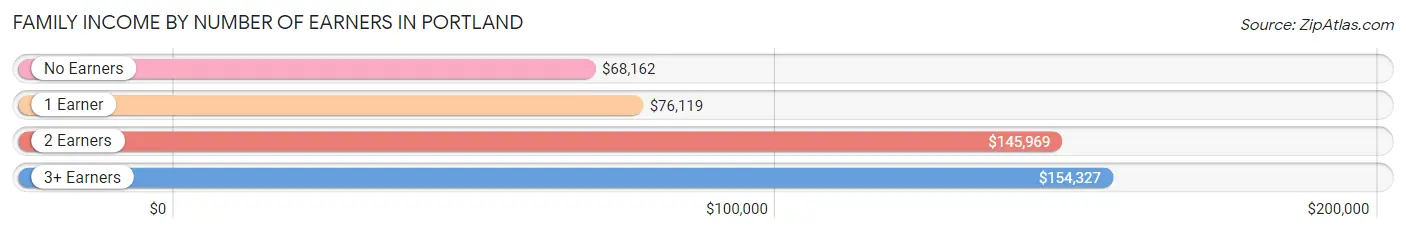
| Number of Earners | # Families | Median Income |
| No Earners | 16,430 (11.8%) | $68,162 |
| 1 Earner | 39,923 (28.7%) | $76,119 |
| 2 Earners | 69,204 (49.8%) | $145,969 |
| 3+ Earners | 13,370 (9.6%) | $154,327 |
| Total | 138,927 (100.0%) | $116,103 |
Household Income in Portland
Household Income Brackets in Portland
With 51,669 households falling in the category, the $100,000 to $149,999 income range is the most frequent in Portland, accounting for 18.2% of all households. In contrast, only 11,356 households (4.0%) fall into the $10,000 to $14,999 income bracket, making it the least populous group.
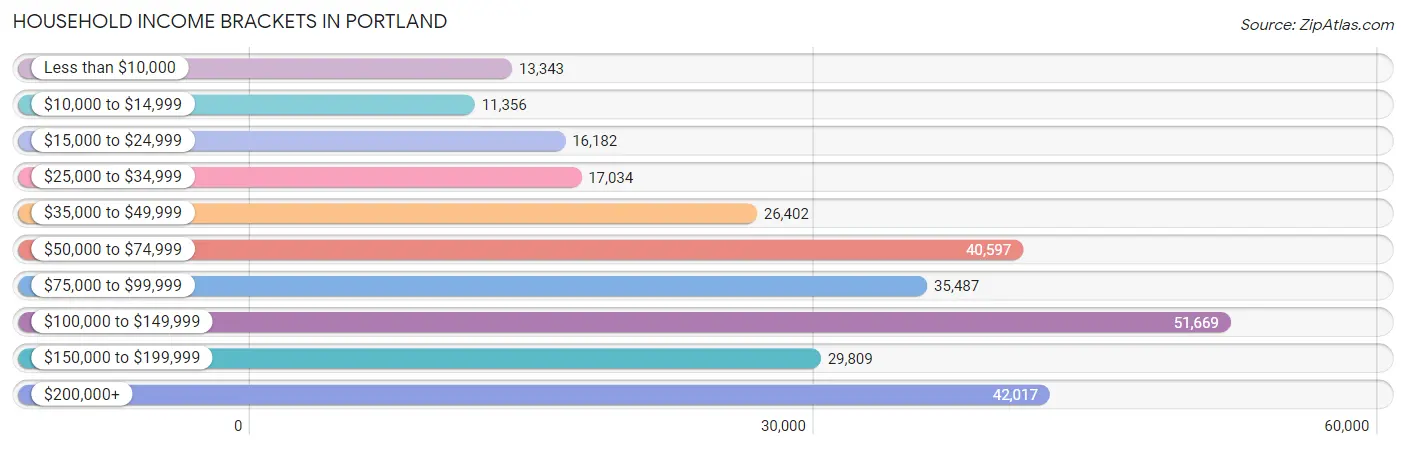
| Income Bracket | # Households | % Households |
| Less than $10,000 | 13,343 | 4.7% |
| $10,000 to $14,999 | 11,356 | 4.0% |
| $15,000 to $24,999 | 16,182 | 5.7% |
| $25,000 to $34,999 | 17,034 | 6.0% |
| $35,000 to $49,999 | 26,402 | 9.3% |
| $50,000 to $74,999 | 40,597 | 14.3% |
| $75,000 to $99,999 | 35,487 | 12.5% |
| $100,000 to $149,999 | 51,669 | 18.2% |
| $150,000 to $199,999 | 29,809 | 10.5% |
| $200,000+ | 42,017 | 14.8% |
Household Income by Householder Age in Portland
The median household income in Portland is $85,876, with the highest median household income of $97,798 found in the 45 to 64 years age bracket for the primary householder. A total of 92,481 households (32.6%) fall into this category. Meanwhile, the 15 to 24 years age bracket for the primary householder has the lowest median household income of $40,887, with 10,699 households (3.8%) in this group.
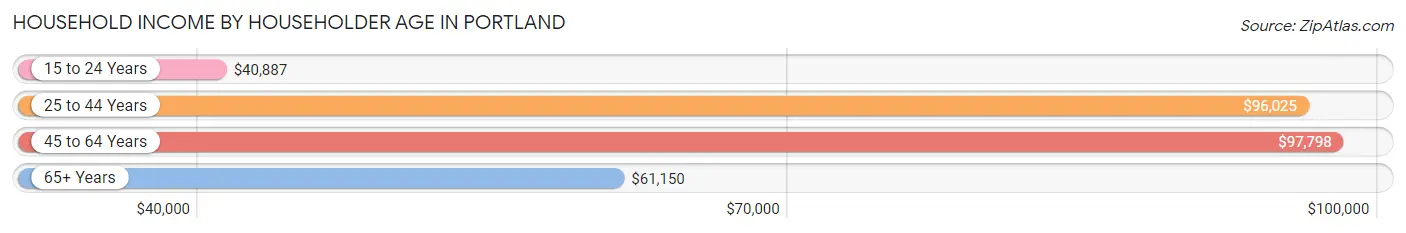
| Income Bracket | # Households | Median Income |
| 15 to 24 Years | 10,699 (3.8%) | $40,887 |
| 25 to 44 Years | 122,645 (43.2%) | $96,025 |
| 45 to 64 Years | 92,481 (32.6%) | $97,798 |
| 65+ Years | 58,071 (20.5%) | $61,150 |
| Total | 283,896 (100.0%) | $85,876 |
Poverty in Portland
Income Below Poverty by Sex and Age in Portland
With 11.9% poverty level for males and 12.5% for females among the residents of Portland, 18 to 24 year old males and 18 to 24 year old females are the most vulnerable to poverty, with 5,084 males (22.9%) and 6,115 females (28.6%) in their respective age groups living below the poverty level.
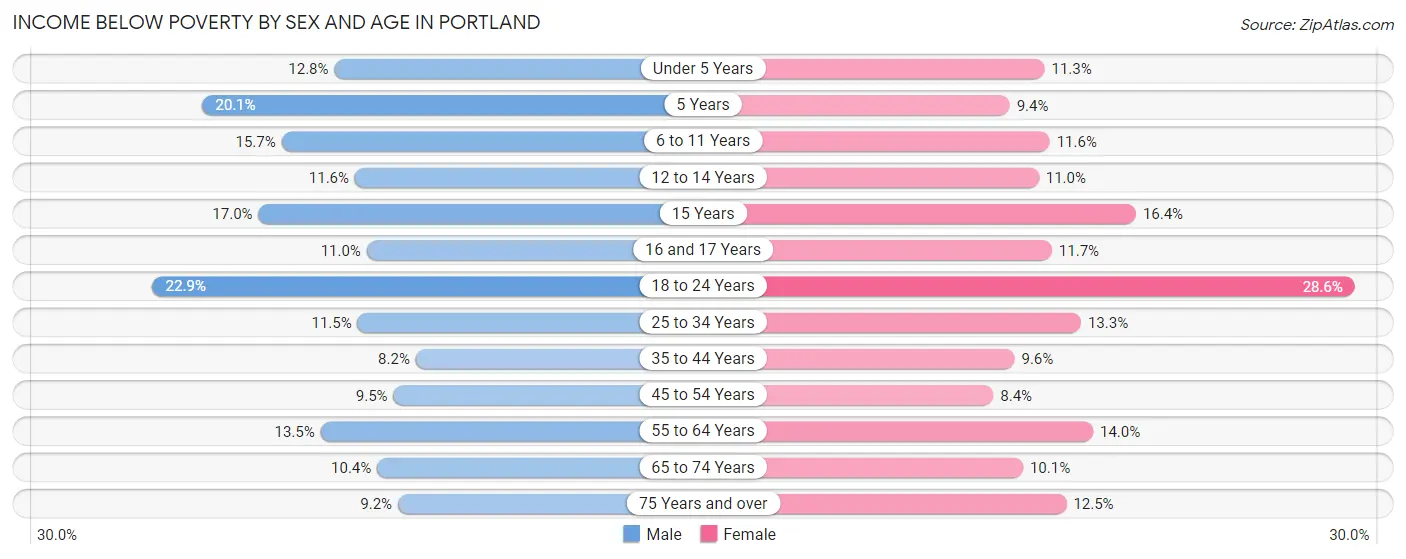
| Age Bracket | Male | Female |
| Under 5 Years | 1,866 (12.8%) | 1,534 (11.3%) |
| 5 Years | 669 (20.1%) | 246 (9.3%) |
| 6 to 11 Years | 2,952 (15.7%) | 2,094 (11.6%) |
| 12 to 14 Years | 1,003 (11.6%) | 977 (11.0%) |
| 15 Years | 517 (17.0%) | 498 (16.4%) |
| 16 and 17 Years | 697 (11.0%) | 644 (11.7%) |
| 18 to 24 Years | 5,084 (22.9%) | 6,115 (28.6%) |
| 25 to 34 Years | 6,880 (11.5%) | 8,347 (13.3%) |
| 35 to 44 Years | 4,808 (8.2%) | 5,354 (9.6%) |
| 45 to 54 Years | 4,387 (9.5%) | 3,564 (8.4%) |
| 55 to 64 Years | 4,731 (13.5%) | 4,796 (14.0%) |
| 65 to 74 Years | 2,716 (10.4%) | 2,979 (10.1%) |
| 75 Years and over | 1,206 (9.2%) | 2,403 (12.5%) |
| Total | 37,516 (11.9%) | 39,551 (12.5%) |
Income Above Poverty by Sex and Age in Portland
According to the poverty statistics in Portland, males aged 35 to 44 years and females aged 45 to 54 years are the age groups that are most secure financially, with 91.8% of males and 91.6% of females in these age groups living above the poverty line.
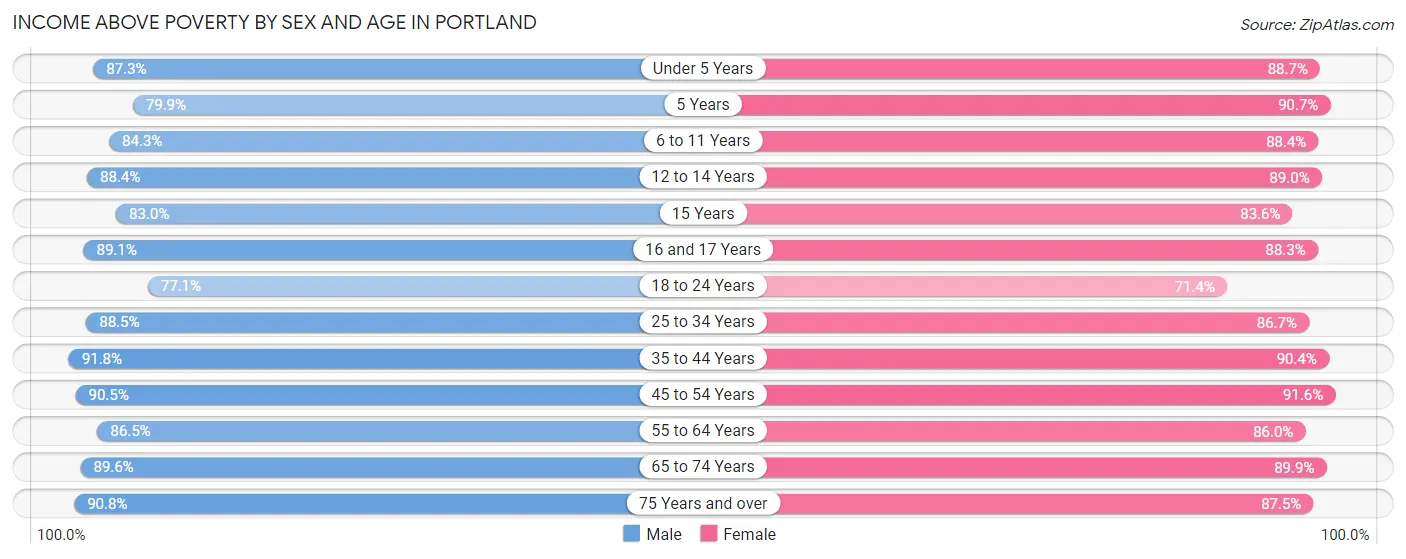
| Age Bracket | Male | Female |
| Under 5 Years | 12,775 (87.3%) | 12,049 (88.7%) |
| 5 Years | 2,660 (79.9%) | 2,384 (90.6%) |
| 6 to 11 Years | 15,862 (84.3%) | 15,984 (88.4%) |
| 12 to 14 Years | 7,638 (88.4%) | 7,926 (89.0%) |
| 15 Years | 2,528 (83.0%) | 2,543 (83.6%) |
| 16 and 17 Years | 5,666 (89.0%) | 4,858 (88.3%) |
| 18 to 24 Years | 17,148 (77.1%) | 15,299 (71.4%) |
| 25 to 34 Years | 53,177 (88.5%) | 54,325 (86.7%) |
| 35 to 44 Years | 53,680 (91.8%) | 50,280 (90.4%) |
| 45 to 54 Years | 42,001 (90.5%) | 38,676 (91.6%) |
| 55 to 64 Years | 30,255 (86.5%) | 29,497 (86.0%) |
| 65 to 74 Years | 23,469 (89.6%) | 26,557 (89.9%) |
| 75 Years and over | 11,885 (90.8%) | 16,802 (87.5%) |
| Total | 278,744 (88.1%) | 277,180 (87.5%) |
Income Below Poverty Among Married-Couple Families in Portland
The poverty statistics for married-couple families in Portland show that 3.2% or 3,393 of the total 105,290 families live below the poverty line. Families with 5 or more children have the highest poverty rate of 13.2%, comprising of 45 families. On the other hand, families with no children have the lowest poverty rate of 2.5%, which includes 1,575 families.
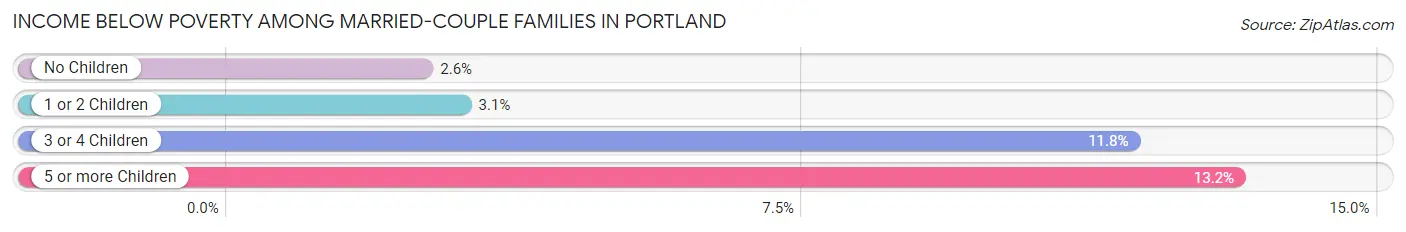
| Children | Above Poverty | Below Poverty |
| No Children | 60,275 (97.5%) | 1,575 (2.5%) |
| 1 or 2 Children | 36,690 (97.0%) | 1,154 (3.0%) |
| 3 or 4 Children | 4,635 (88.2%) | 619 (11.8%) |
| 5 or more Children | 297 (86.8%) | 45 (13.2%) |
| Total | 101,897 (96.8%) | 3,393 (3.2%) |
Income Below Poverty Among Single-Parent Households in Portland
According to the poverty data in Portland, 12.2% or 1,313 single-father households and 18.1% or 4,149 single-mother households are living below the poverty line. Among single-father households, those with 5 or more children have the highest poverty rate, with 13 households (100.0%) experiencing poverty. Likewise, among single-mother households, those with 5 or more children have the highest poverty rate, with 59 households (50.4%) falling below the poverty line.
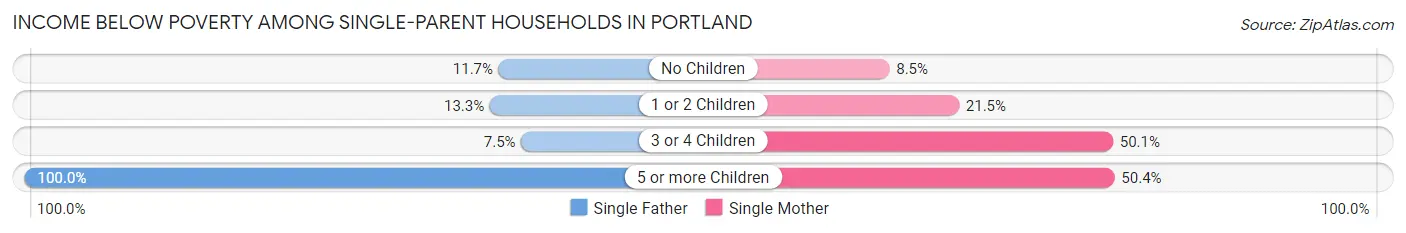
| Children | Single Father | Single Mother |
| No Children | 564 (11.7%) | 803 (8.5%) |
| 1 or 2 Children | 676 (13.3%) | 2,542 (21.5%) |
| 3 or 4 Children | 60 (7.5%) | 745 (50.1%) |
| 5 or more Children | 13 (100.0%) | 59 (50.4%) |
| Total | 1,313 (12.2%) | 4,149 (18.1%) |
Income Below Poverty Among Married-Couple vs Single-Parent Households in Portland
The poverty data for Portland shows that 3,393 of the married-couple family households (3.2%) and 5,462 of the single-parent households (16.2%) are living below the poverty level. Within the married-couple family households, those with 5 or more children have the highest poverty rate, with 45 households (13.2%) falling below the poverty line. Among the single-parent households, those with 5 or more children have the highest poverty rate, with 72 household (55.4%) living below poverty.
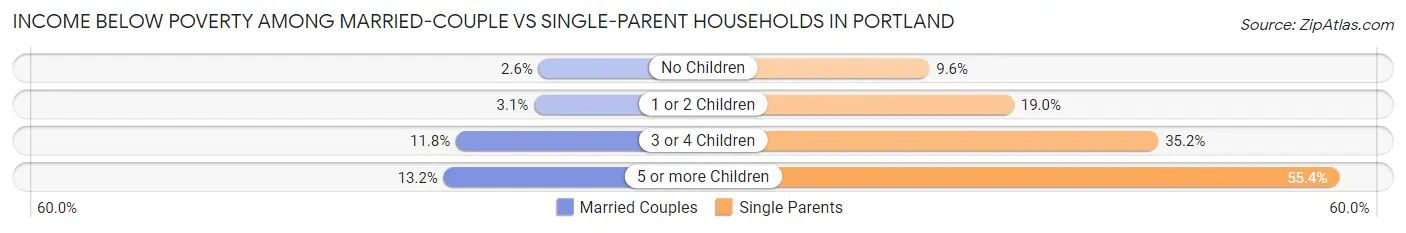
| Children | Married-Couple Families | Single-Parent Households |
| No Children | 1,575 (2.5%) | 1,367 (9.6%) |
| 1 or 2 Children | 1,154 (3.0%) | 3,218 (19.0%) |
| 3 or 4 Children | 619 (11.8%) | 805 (35.1%) |
| 5 or more Children | 45 (13.2%) | 72 (55.4%) |
| Total | 3,393 (3.2%) | 5,462 (16.2%) |
Race in Portland
The most populous races in Portland are White / Caucasian (465,878 | 72.1%), Hispanic or Latino (66,368 | 10.3%), and Two or more Races (59,598 | 9.2%).
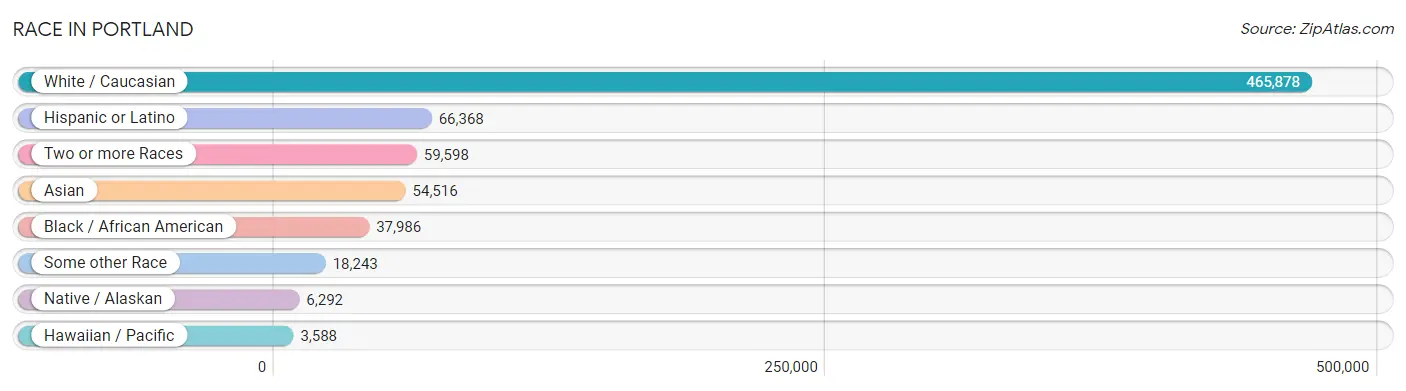
| Race | # Population | % Population |
| Asian | 54,516 | 8.4% |
| Black / African American | 37,986 | 5.9% |
| Hawaiian / Pacific | 3,588 | 0.6% |
| Hispanic or Latino | 66,368 | 10.3% |
| Native / Alaskan | 6,292 | 1.0% |
| White / Caucasian | 465,878 | 72.1% |
| Two or more Races | 59,598 | 9.2% |
| Some other Race | 18,243 | 2.8% |
| Total | 646,101 | 100.0% |
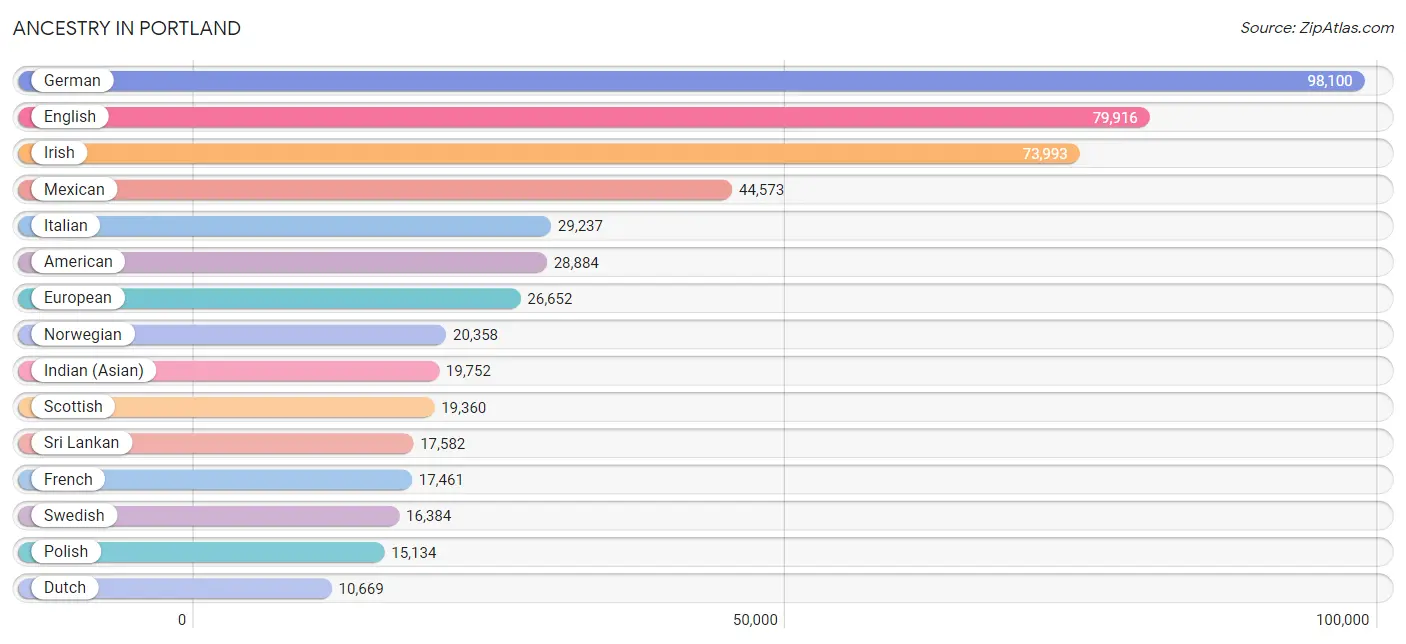
Ancestry in Portland
The most populous ancestries reported in Portland are German (98,100 | 15.2%), English (79,916 | 12.4%), Irish (73,993 | 11.5%), Mexican (44,573 | 6.9%), and Italian (29,237 | 4.5%), together accounting for 50.4% of all Portland residents.
| Ancestry | # Population | % Population |
| Afghan | 315 | 0.1% |
| African | 2,325 | 0.4% |
| Alaska Native | 46 | 0.0% |
| Alaskan Athabascan | 103 | 0.0% |
| Albanian | 21 | 0.0% |
| Aleut | 76 | 0.0% |
| Alsatian | 34 | 0.0% |
| American | 28,884 | 4.5% |
| Apache | 648 | 0.1% |
| Arab | 4,608 | 0.7% |
| Argentinean | 515 | 0.1% |
| Armenian | 619 | 0.1% |
| Assyrian / Chaldean / Syriac | 62 | 0.0% |
| Australian | 397 | 0.1% |
| Austrian | 2,378 | 0.4% |
| Bahamian | 25 | 0.0% |
| Bangladeshi | 1,089 | 0.2% |
| Basque | 332 | 0.1% |
| Belgian | 1,011 | 0.2% |
| Belizean | 228 | 0.0% |
| Bermudan | 9 | 0.0% |
| Bhutanese | 7,855 | 1.2% |
| Blackfeet | 779 | 0.1% |
| Bolivian | 115 | 0.0% |
| Brazilian | 667 | 0.1% |
| British | 8,027 | 1.2% |
| British West Indian | 22 | 0.0% |
| Bulgarian | 322 | 0.1% |
| Burmese | 4,057 | 0.6% |
| Cajun | 120 | 0.0% |
| Cambodian | 5 | 0.0% |
| Canadian | 2,509 | 0.4% |
| Carpatho Rusyn | 6 | 0.0% |
| Celtic | 261 | 0.0% |
| Central American | 5,455 | 0.8% |
| Central American Indian | 722 | 0.1% |
| Cherokee | 2,222 | 0.3% |
| Cheyenne | 113 | 0.0% |
| Chickasaw | 60 | 0.0% |
| Chilean | 281 | 0.0% |
| Chinese | 258 | 0.0% |
| Chippewa | 957 | 0.2% |
| Choctaw | 552 | 0.1% |
| Colombian | 1,199 | 0.2% |
| Colville | 91 | 0.0% |
| Comanche | 41 | 0.0% |
| Costa Rican | 128 | 0.0% |
| Cree | 80 | 0.0% |
| Creek | 172 | 0.0% |
| Croatian | 1,948 | 0.3% |
| Cuban | 2,521 | 0.4% |
| Cypriot | 10 | 0.0% |
| Czech | 3,921 | 0.6% |
| Czechoslovakian | 597 | 0.1% |
| Danish | 6,273 | 1.0% |
| Delaware | 23 | 0.0% |
| Dominican | 402 | 0.1% |
| Dutch | 10,669 | 1.7% |
| Eastern European | 3,572 | 0.5% |
| Ecuadorian | 602 | 0.1% |
| Egyptian | 241 | 0.0% |
| English | 79,916 | 12.4% |
| Estonian | 485 | 0.1% |
| Ethiopian | 2,269 | 0.4% |
| European | 26,652 | 4.1% |
| Filipino | 947 | 0.2% |
| Finnish | 3,576 | 0.5% |
| French | 17,461 | 2.7% |
| French American Indian | 44 | 0.0% |
| French Canadian | 3,344 | 0.5% |
| German | 98,100 | 15.2% |
| German Russian | 122 | 0.0% |
| Ghanaian | 470 | 0.1% |
| Greek | 2,712 | 0.4% |
| Guamanian / Chamorro | 754 | 0.1% |
| Guatemalan | 2,014 | 0.3% |
| Guyanese | 265 | 0.0% |
| Haitian | 389 | 0.1% |
| Honduran | 638 | 0.1% |
| Hopi | 178 | 0.0% |
| Hungarian | 3,052 | 0.5% |
| Icelander | 455 | 0.1% |
| Indian (Asian) | 19,752 | 3.1% |
| Indonesian | 960 | 0.2% |
| Inupiat | 158 | 0.0% |
| Iranian | 1,241 | 0.2% |
| Iraqi | 259 | 0.0% |
| Irish | 73,993 | 11.5% |
| Iroquois | 87 | 0.0% |
| Israeli | 347 | 0.1% |
| Italian | 29,237 | 4.5% |
| Jamaican | 722 | 0.1% |
| Japanese | 1,334 | 0.2% |
| Jordanian | 89 | 0.0% |
| Kenyan | 347 | 0.1% |
| Korean | 9,008 | 1.4% |
| Laotian | 440 | 0.1% |
| Latvian | 701 | 0.1% |
| Lebanese | 1,214 | 0.2% |
| Liberian | 162 | 0.0% |
| Lithuanian | 1,727 | 0.3% |
| Lumbee | 24 | 0.0% |
| Luxembourger | 165 | 0.0% |
| Macedonian | 141 | 0.0% |
| Malaysian | 2,564 | 0.4% |
| Maltese | 36 | 0.0% |
| Marshallese | 417 | 0.1% |
| Mexican | 44,573 | 6.9% |
| Mexican American Indian | 1,294 | 0.2% |
| Mongolian | 66 | 0.0% |
| Moroccan | 75 | 0.0% |
| Native Hawaiian | 1,839 | 0.3% |
| Navajo | 358 | 0.1% |
| Nepalese | 415 | 0.1% |
| New Zealander | 71 | 0.0% |
| Nicaraguan | 482 | 0.1% |
| Nigerian | 696 | 0.1% |
| Northern European | 3,901 | 0.6% |
| Norwegian | 20,358 | 3.2% |
| Okinawan | 27 | 0.0% |
| Osage | 53 | 0.0% |
| Paiute | 197 | 0.0% |
| Pakistani | 1,255 | 0.2% |
| Palestinian | 240 | 0.0% |
| Panamanian | 380 | 0.1% |
| Paraguayan | 34 | 0.0% |
| Pennsylvania German | 118 | 0.0% |
| Peruvian | 1,009 | 0.2% |
| Pima | 131 | 0.0% |
| Polish | 15,134 | 2.3% |
| Portuguese | 2,420 | 0.4% |
| Potawatomi | 85 | 0.0% |
| Pueblo | 101 | 0.0% |
| Puerto Rican | 3,197 | 0.5% |
| Puget Sound Salish | 63 | 0.0% |
| Romanian | 2,178 | 0.3% |
| Russian | 10,443 | 1.6% |
| Salvadoran | 1,585 | 0.3% |
| Samoan | 366 | 0.1% |
| Scandinavian | 5,418 | 0.8% |
| Scotch-Irish | 6,963 | 1.1% |
| Scottish | 19,360 | 3.0% |
| Seminole | 8 | 0.0% |
| Senegalese | 294 | 0.1% |
| Serbian | 307 | 0.1% |
| Shoshone | 318 | 0.1% |
| Sierra Leonean | 20 | 0.0% |
| Sioux | 1,174 | 0.2% |
| Slavic | 450 | 0.1% |
| Slovak | 719 | 0.1% |
| Slovene | 314 | 0.1% |
| Somali | 1,080 | 0.2% |
| South African | 187 | 0.0% |
| South American | 4,238 | 0.7% |
| South American Indian | 40 | 0.0% |
| Soviet Union | 18 | 0.0% |
| Spaniard | 2,026 | 0.3% |
| Spanish | 1,614 | 0.3% |
| Spanish American | 162 | 0.0% |
| Spanish American Indian | 11 | 0.0% |
| Sri Lankan | 17,582 | 2.7% |
| Subsaharan African | 8,481 | 1.3% |
| Swedish | 16,384 | 2.5% |
| Swiss | 4,319 | 0.7% |
| Syrian | 790 | 0.1% |
| Thai | 5,693 | 0.9% |
| Tlingit-Haida | 509 | 0.1% |
| Tongan | 430 | 0.1% |
| Trinidadian and Tobagonian | 432 | 0.1% |
| Tsimshian | 37 | 0.0% |
| Turkish | 868 | 0.1% |
| Ugandan | 89 | 0.0% |
| Ukrainian | 6,854 | 1.1% |
| Uruguayan | 45 | 0.0% |
| Ute | 35 | 0.0% |
| Venezuelan | 409 | 0.1% |
| Vietnamese | 14 | 0.0% |
| Welsh | 6,244 | 1.0% |
| West Indian | 135 | 0.0% |
| Yakama | 83 | 0.0% |
| Yaqui | 94 | 0.0% |
| Yugoslavian | 1,258 | 0.2% |
| Yup'ik | 304 | 0.1% | View All 183 Rows |
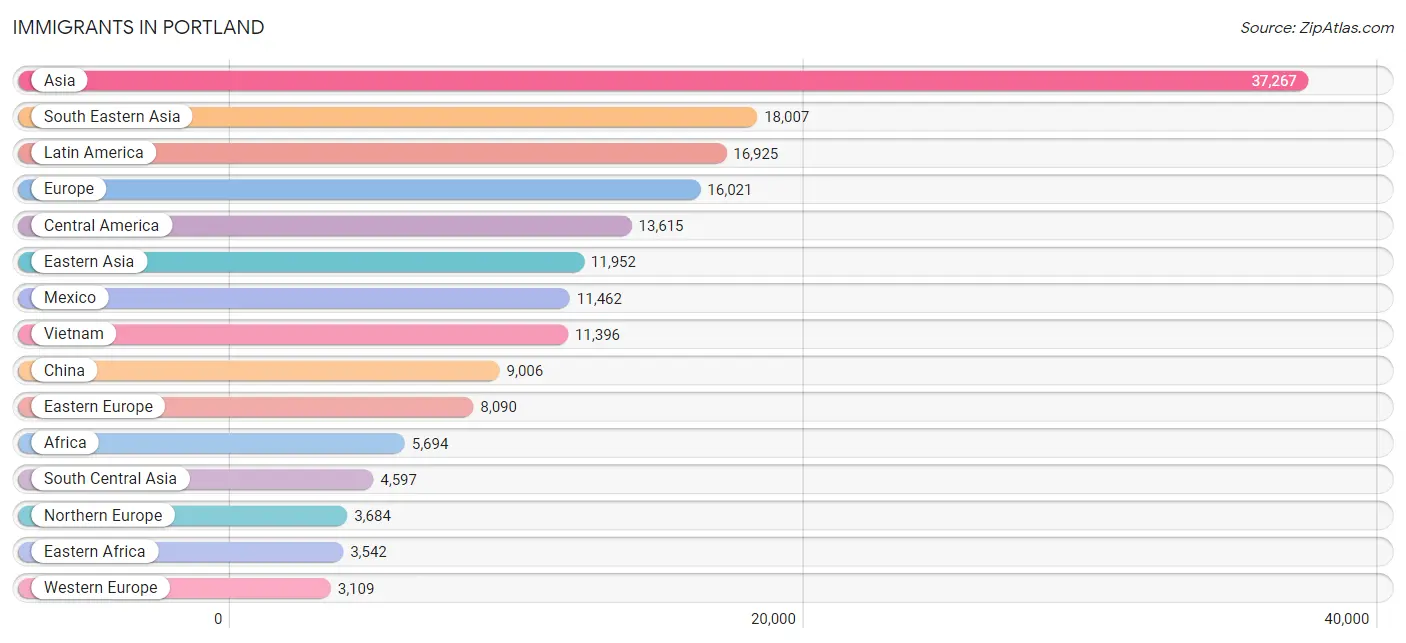
Immigrants in Portland
The most numerous immigrant groups reported in Portland came from Asia (37,267 | 5.8%), South Eastern Asia (18,007 | 2.8%), Latin America (16,925 | 2.6%), Europe (16,021 | 2.5%), and Central America (13,615 | 2.1%), together accounting for 15.8% of all Portland residents.
| Immigration Origin | # Population | % Population |
| Afghanistan | 337 | 0.1% |
| Africa | 5,694 | 0.9% |
| Argentina | 195 | 0.0% |
| Armenia | 8 | 0.0% |
| Asia | 37,267 | 5.8% |
| Australia | 553 | 0.1% |
| Austria | 137 | 0.0% |
| Azores | 9 | 0.0% |
| Bahamas | 11 | 0.0% |
| Bangladesh | 14 | 0.0% |
| Barbados | 28 | 0.0% |
| Belarus | 350 | 0.1% |
| Belgium | 184 | 0.0% |
| Belize | 67 | 0.0% |
| Bolivia | 3 | 0.0% |
| Bosnia and Herzegovina | 391 | 0.1% |
| Brazil | 540 | 0.1% |
| Bulgaria | 122 | 0.0% |
| Cambodia | 490 | 0.1% |
| Cameroon | 110 | 0.0% |
| Canada | 3,065 | 0.5% |
| Caribbean | 1,302 | 0.2% |
| Central America | 13,615 | 2.1% |
| Chile | 116 | 0.0% |
| China | 9,006 | 1.4% |
| Colombia | 443 | 0.1% |
| Congo | 140 | 0.0% |
| Costa Rica | 46 | 0.0% |
| Croatia | 35 | 0.0% |
| Cuba | 853 | 0.1% |
| Czechoslovakia | 114 | 0.0% |
| Denmark | 165 | 0.0% |
| Dominica | 15 | 0.0% |
| Dominican Republic | 48 | 0.0% |
| Eastern Africa | 3,542 | 0.5% |
| Eastern Asia | 11,952 | 1.8% |
| Eastern Europe | 8,090 | 1.3% |
| Egypt | 106 | 0.0% |
| El Salvador | 628 | 0.1% |
| England | 1,151 | 0.2% |
| Eritrea | 378 | 0.1% |
| Ethiopia | 1,851 | 0.3% |
| Europe | 16,021 | 2.5% |
| Fiji | 838 | 0.1% |
| France | 830 | 0.1% |
| Germany | 1,472 | 0.2% |
| Ghana | 478 | 0.1% |
| Greece | 316 | 0.1% |
| Guatemala | 877 | 0.1% |
| Guyana | 43 | 0.0% |
| Haiti | 101 | 0.0% |
| Honduras | 412 | 0.1% |
| Hong Kong | 982 | 0.2% |
| Hungary | 150 | 0.0% |
| India | 2,235 | 0.4% |
| Indonesia | 164 | 0.0% |
| Iran | 722 | 0.1% |
| Iraq | 886 | 0.1% |
| Ireland | 297 | 0.1% |
| Israel | 230 | 0.0% |
| Italy | 395 | 0.1% |
| Jamaica | 156 | 0.0% |
| Japan | 1,406 | 0.2% |
| Jordan | 35 | 0.0% |
| Kazakhstan | 329 | 0.1% |
| Kenya | 806 | 0.1% |
| Korea | 1,540 | 0.2% |
| Kuwait | 245 | 0.0% |
| Laos | 1,326 | 0.2% |
| Latin America | 16,925 | 2.6% |
| Latvia | 34 | 0.0% |
| Lebanon | 93 | 0.0% |
| Liberia | 216 | 0.0% |
| Lithuania | 93 | 0.0% |
| Malaysia | 348 | 0.1% |
| Mexico | 11,462 | 1.8% |
| Micronesia | 581 | 0.1% |
| Middle Africa | 267 | 0.0% |
| Moldova | 707 | 0.1% |
| Morocco | 68 | 0.0% |
| Nepal | 132 | 0.0% |
| Netherlands | 330 | 0.1% |
| Nicaragua | 51 | 0.0% |
| Nigeria | 304 | 0.1% |
| North Macedonia | 76 | 0.0% |
| Northern Africa | 213 | 0.0% |
| Northern Europe | 3,684 | 0.6% |
| Norway | 116 | 0.0% |
| Oceania | 2,680 | 0.4% |
| Pakistan | 239 | 0.0% |
| Panama | 31 | 0.0% |
| Peru | 343 | 0.1% |
| Philippines | 2,507 | 0.4% |
| Poland | 322 | 0.1% |
| Portugal | 99 | 0.0% |
| Romania | 976 | 0.2% |
| Russia | 1,642 | 0.3% |
| Saudi Arabia | 138 | 0.0% |
| Scotland | 149 | 0.0% |
| Senegal | 75 | 0.0% |
| Serbia | 101 | 0.0% |
| Sierra Leone | 65 | 0.0% |
| Singapore | 200 | 0.0% |
| Somalia | 339 | 0.1% |
| South Africa | 304 | 0.1% |
| South America | 2,008 | 0.3% |
| South Central Asia | 4,597 | 0.7% |
| South Eastern Asia | 18,007 | 2.8% |
| Southern Europe | 1,088 | 0.2% |
| Spain | 278 | 0.0% |
| Sri Lanka | 11 | 0.0% |
| Sudan | 5 | 0.0% |
| Sweden | 280 | 0.0% |
| Switzerland | 156 | 0.0% |
| Syria | 297 | 0.1% |
| Taiwan | 630 | 0.1% |
| Thailand | 1,062 | 0.2% |
| Trinidad and Tobago | 73 | 0.0% |
| Turkey | 503 | 0.1% |
| Uganda | 40 | 0.0% |
| Ukraine | 2,626 | 0.4% |
| Uruguay | 18 | 0.0% |
| Uzbekistan | 313 | 0.1% |
| Venezuela | 307 | 0.1% |
| Vietnam | 11,396 | 1.8% |
| Western Africa | 1,259 | 0.2% |
| Western Asia | 2,602 | 0.4% |
| Western Europe | 3,109 | 0.5% |
| Yemen | 5 | 0.0% |
| Zaire | 17 | 0.0% | View All 130 Rows |
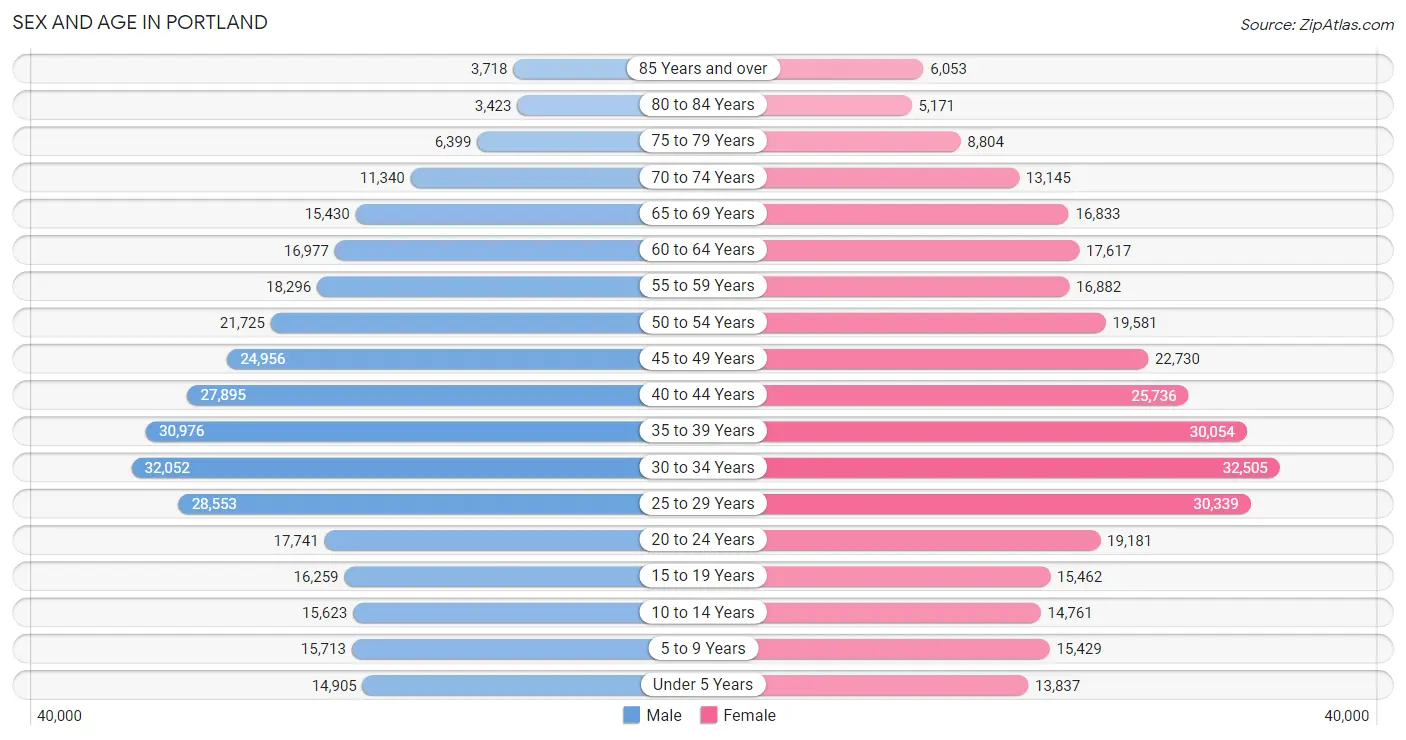
Sex and Age in Portland
Sex and Age in Portland
The most populous age groups in Portland are 30 to 34 Years (32,052 | 10.0%) for men and 30 to 34 Years (32,505 | 10.0%) for women.
| Age Bracket | Male | Female |
| Under 5 Years | 14,905 (4.6%) | 13,837 (4.3%) |
| 5 to 9 Years | 15,713 (4.9%) | 15,429 (4.8%) |
| 10 to 14 Years | 15,623 (4.9%) | 14,761 (4.5%) |
| 15 to 19 Years | 16,259 (5.1%) | 15,462 (4.8%) |
| 20 to 24 Years | 17,741 (5.5%) | 19,181 (5.9%) |
| 25 to 29 Years | 28,553 (8.9%) | 30,339 (9.4%) |
| 30 to 34 Years | 32,052 (10.0%) | 32,505 (10.0%) |
| 35 to 39 Years | 30,976 (9.6%) | 30,054 (9.3%) |
| 40 to 44 Years | 27,895 (8.7%) | 25,736 (7.9%) |
| 45 to 49 Years | 24,956 (7.7%) | 22,730 (7.0%) |
| 50 to 54 Years | 21,725 (6.8%) | 19,581 (6.0%) |
| 55 to 59 Years | 18,296 (5.7%) | 16,882 (5.2%) |
| 60 to 64 Years | 16,977 (5.3%) | 17,617 (5.4%) |
| 65 to 69 Years | 15,430 (4.8%) | 16,833 (5.2%) |
| 70 to 74 Years | 11,340 (3.5%) | 13,145 (4.1%) |
| 75 to 79 Years | 6,399 (2.0%) | 8,804 (2.7%) |
| 80 to 84 Years | 3,423 (1.1%) | 5,171 (1.6%) |
| 85 Years and over | 3,718 (1.1%) | 6,053 (1.9%) |
| Total | 321,981 (100.0%) | 324,120 (100.0%) |
Families and Households in Portland
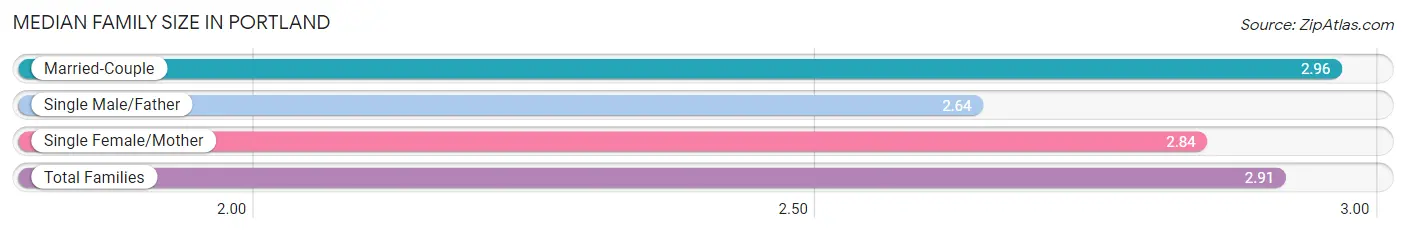
Median Family Size in Portland
The median family size in Portland is 2.91 persons per family, with married-couple families (105,290 | 75.8%) accounting for the largest median family size of 2.96 persons per family. On the other hand, single male/father families (10,736 | 7.7%) represent the smallest median family size with 2.64 persons per family.
| Family Type | # Families | Family Size |
| Married-Couple | 105,290 (75.8%) | 2.96 |
| Single Male/Father | 10,736 (7.7%) | 2.64 |
| Single Female/Mother | 22,901 (16.5%) | 2.84 |
| Total Families | 138,927 (100.0%) | 2.91 |
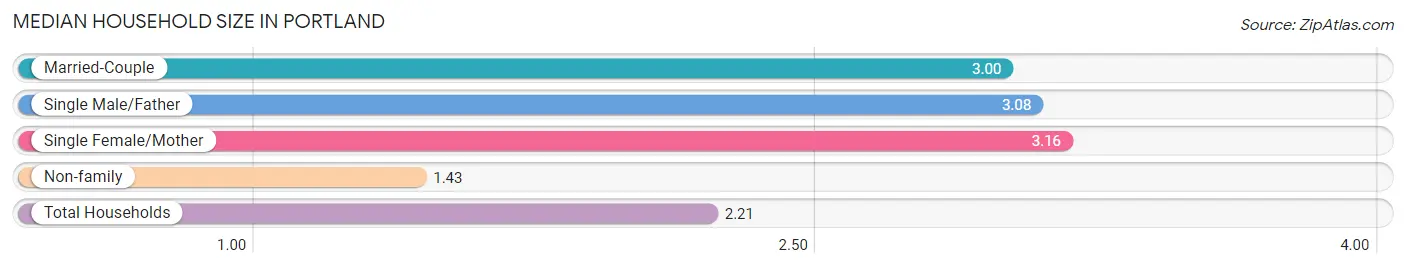
Median Household Size in Portland
The median household size in Portland is 2.21 persons per household, with single female/mother households (22,901 | 8.1%) accounting for the largest median household size of 3.16 persons per household. non-family households (144,969 | 51.1%) represent the smallest median household size with 1.43 persons per household.
| Household Type | # Households | Household Size |
| Married-Couple | 105,290 (37.1%) | 3.00 |
| Single Male/Father | 10,736 (3.8%) | 3.08 |
| Single Female/Mother | 22,901 (8.1%) | 3.16 |
| Non-family | 144,969 (51.1%) | 1.43 |
| Total Households | 283,896 (100.0%) | 2.21 |
Household Size by Marriage Status in Portland
Out of a total of 283,896 households in Portland, 138,927 (48.9%) are family households, while 144,969 (51.1%) are nonfamily households. The most numerous type of family households are 2-person households, comprising 64,585, and the most common type of nonfamily households are 1-person households, comprising 100,382.
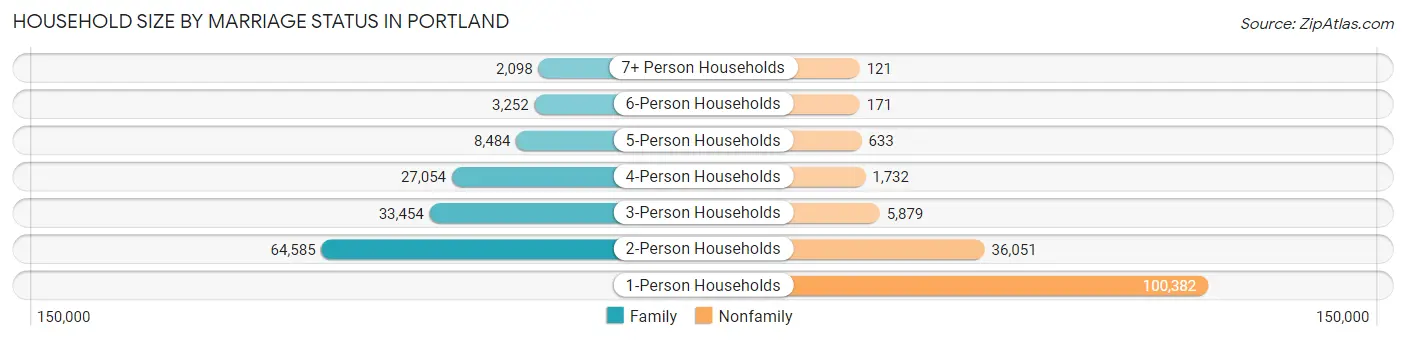
| Household Size | Family Households | Nonfamily Households |
| 1-Person Households | - | 100,382 (35.4%) |
| 2-Person Households | 64,585 (22.8%) | 36,051 (12.7%) |
| 3-Person Households | 33,454 (11.8%) | 5,879 (2.1%) |
| 4-Person Households | 27,054 (9.5%) | 1,732 (0.6%) |
| 5-Person Households | 8,484 (3.0%) | 633 (0.2%) |
| 6-Person Households | 3,252 (1.1%) | 171 (0.1%) |
| 7+ Person Households | 2,098 (0.7%) | 121 (0.0%) |
| Total | 138,927 (48.9%) | 144,969 (51.1%) |
Female Fertility in Portland
Fertility by Age in Portland
Average fertility rate in Portland is 32.0 births per 1,000 women. Women in the age bracket of 20 to 34 years have the highest fertility rate with 39.0 births per 1,000 women. Women in the age bracket of 20 to 34 years acount for 55.9% of all women with births.
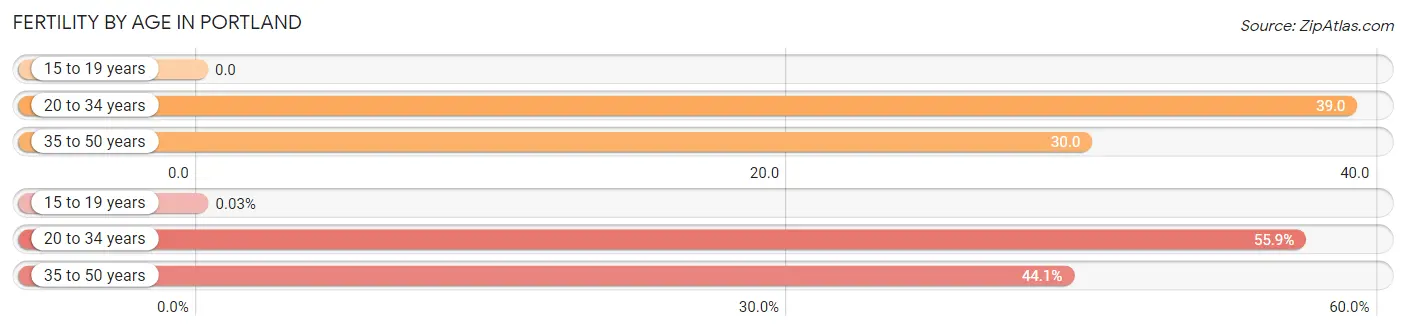
| Age Bracket | Women with Births | Births / 1,000 Women |
| 15 to 19 years | 2 (0.0%) | 0.0 |
| 20 to 34 years | 3,214 (55.9%) | 39.0 |
| 35 to 50 years | 2,535 (44.1%) | 30.0 |
| Total | 5,751 (100.0%) | 32.0 |
Fertility by Age by Marriage Status in Portland
80.1% of women with births (5,751) in Portland are married. The highest percentage of unmarried women with births falls into 15 to 19 years age bracket with 100.0% of them unmarried at the time of birth, while the lowest percentage of unmarried women with births belong to 20 to 34 years age bracket with 17.0% of them unmarried.
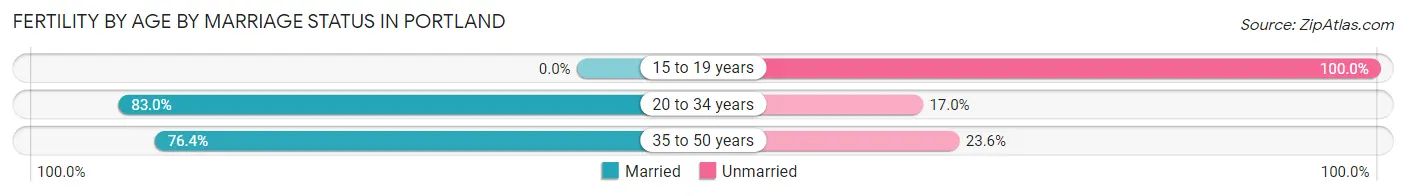
| Age Bracket | Married | Unmarried |
| 15 to 19 years | 0 (0.0%) | 2 (100.0%) |
| 20 to 34 years | 2,668 (83.0%) | 546 (17.0%) |
| 35 to 50 years | 1,937 (76.4%) | 598 (23.6%) |
| Total | 4,607 (80.1%) | 1,144 (19.9%) |
Fertility by Education in Portland
Average fertility rate in Portland is 32.0 births per 1,000 women. Women with the education attainment of graduate degree have the highest fertility rate of 42.0 births per 1,000 women, while women with the education attainment of less than high school have the lowest fertility at 24.0 births per 1,000 women. Women with the education attainment of bachelor's degree represent 33.0% of all women with births.
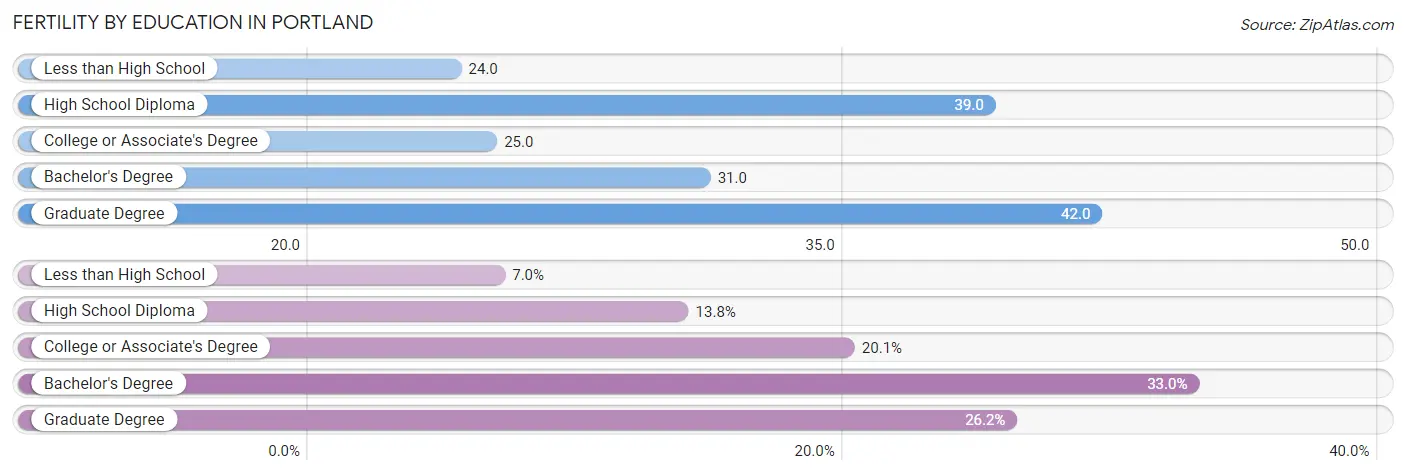
| Educational Attainment | Women with Births | Births / 1,000 Women |
| Less than High School | 401 (7.0%) | 24.0 |
| High School Diploma | 796 (13.8%) | 39.0 |
| College or Associate's Degree | 1,154 (20.1%) | 25.0 |
| Bachelor's Degree | 1,896 (33.0%) | 31.0 |
| Graduate Degree | 1,504 (26.2%) | 42.0 |
| Total | 5,751 (100.0%) | 32.0 |
Fertility by Education by Marriage Status in Portland
19.9% of women with births in Portland are unmarried. Women with the educational attainment of bachelor's degree are most likely to be married with 93.9% of them married at childbirth, while women with the educational attainment of high school diploma are least likely to be married with 41.6% of them unmarried at childbirth.
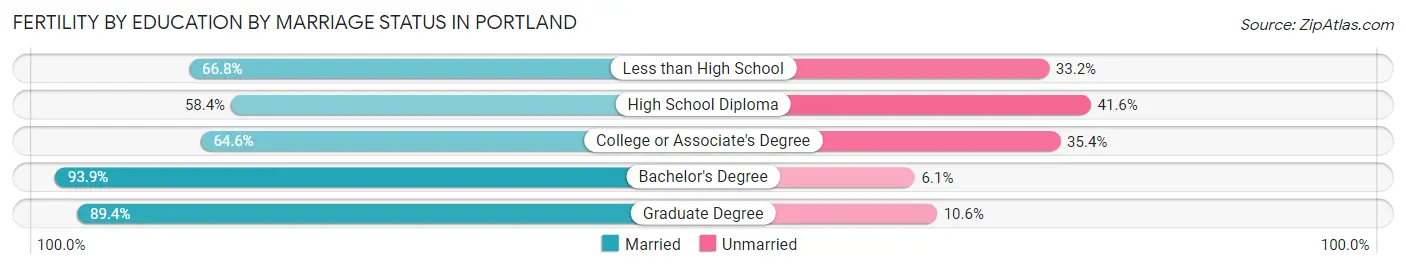
| Educational Attainment | Married | Unmarried |
| Less than High School | 268 (66.8%) | 133 (33.2%) |
| High School Diploma | 465 (58.4%) | 331 (41.6%) |
| College or Associate's Degree | 745 (64.6%) | 409 (35.4%) |
| Bachelor's Degree | 1,780 (93.9%) | 116 (6.1%) |
| Graduate Degree | 1,345 (89.4%) | 159 (10.6%) |
| Total | 4,607 (80.1%) | 1,144 (19.9%) |
Employment Characteristics in Portland
Employment by Class of Employer in Portland
Among the 360,671 employed individuals in Portland, private company employees (229,220 | 63.5%), not-for-profit organizations (45,680 | 12.7%), and self-employed (not incorporated) (25,506 | 7.1%) make up the most common classes of employment.
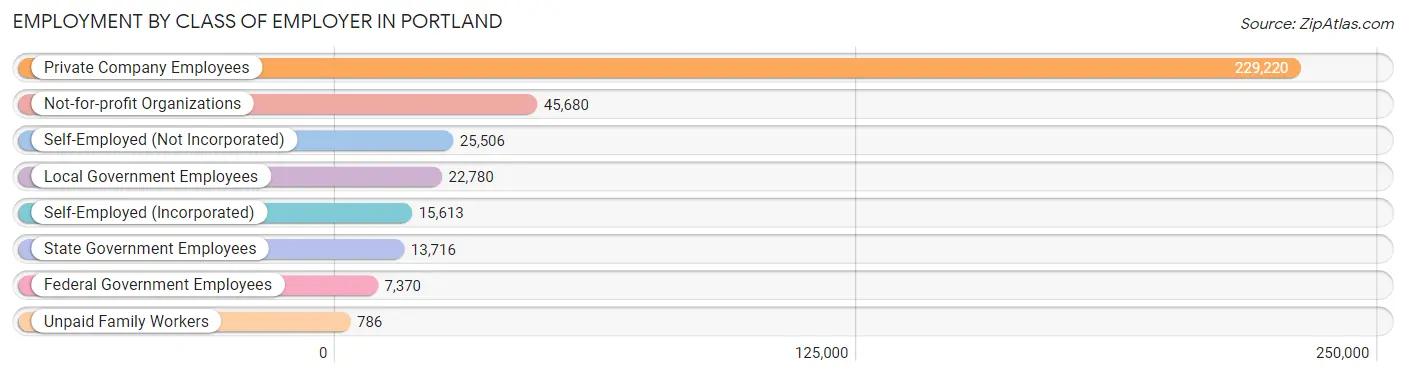
| Employer Class | # Employees | % Employees |
| Private Company Employees | 229,220 | 63.5% |
| Self-Employed (Incorporated) | 15,613 | 4.3% |
| Self-Employed (Not Incorporated) | 25,506 | 7.1% |
| Not-for-profit Organizations | 45,680 | 12.7% |
| Local Government Employees | 22,780 | 6.3% |
| State Government Employees | 13,716 | 3.8% |
| Federal Government Employees | 7,370 | 2.0% |
| Unpaid Family Workers | 786 | 0.2% |
| Total | 360,671 | 100.0% |
Employment Status by Age in Portland
According to the labor force statistics for Portland, out of the total population over 16 years of age (549,716), 70.9% or 389,749 individuals are in the labor force, with 5.6% or 21,826 of them unemployed. The age group with the highest labor force participation rate is 30 to 34 years, with 88.8% or 57,327 individuals in the labor force. Within the labor force, the 16 to 19 years age range has the highest percentage of unemployed individuals, with 18.6% or 1,829 of them being unemployed.
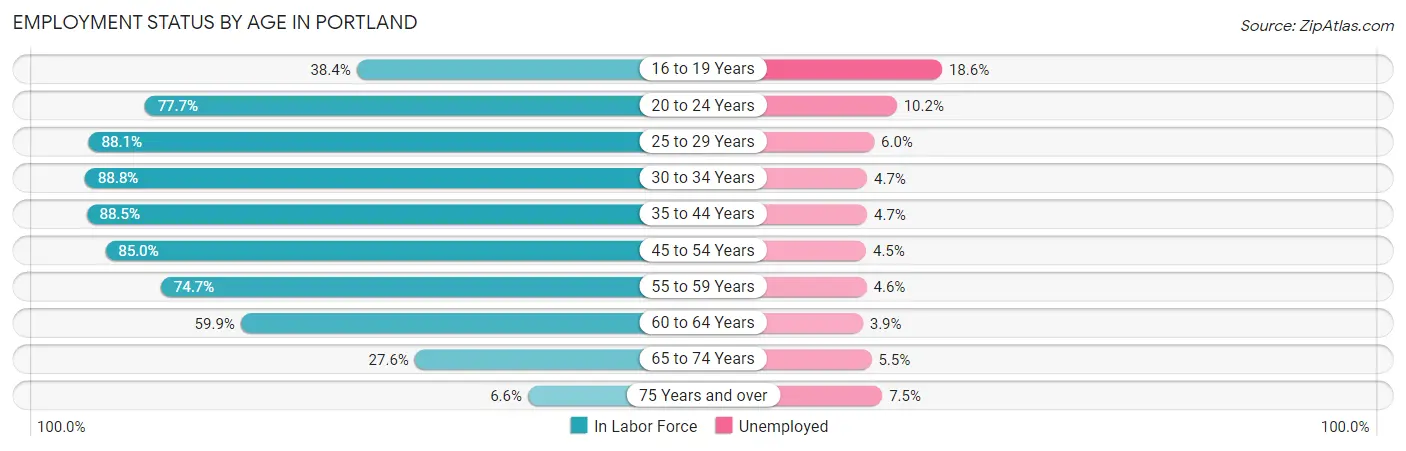
| Age Bracket | In Labor Force | Unemployed |
| 16 to 19 Years | 9,832 (38.4%) | 1,829 (18.6%) |
| 20 to 24 Years | 28,688 (77.7%) | 2,926 (10.2%) |
| 25 to 29 Years | 51,884 (88.1%) | 3,113 (6.0%) |
| 30 to 34 Years | 57,327 (88.8%) | 2,694 (4.7%) |
| 35 to 44 Years | 101,475 (88.5%) | 4,769 (4.7%) |
| 45 to 54 Years | 75,643 (85.0%) | 3,404 (4.5%) |
| 55 to 59 Years | 26,278 (74.7%) | 1,209 (4.6%) |
| 60 to 64 Years | 20,722 (59.9%) | 808 (3.9%) |
| 65 to 74 Years | 15,662 (27.6%) | 861 (5.5%) |
| 75 Years and over | 2,215 (6.6%) | 166 (7.5%) |
| Total | 389,749 (70.9%) | 21,826 (5.6%) |
Employment Status by Educational Attainment in Portland
According to labor force statistics for Portland, 84.0% of individuals (333,374) out of the total population between 25 and 64 years of age (396,874) are in the labor force, with 4.8% or 16,002 of them being unemployed. The group with the highest labor force participation rate are those with the educational attainment of bachelor's degree or higher, with 90.3% or 195,096 individuals in the labor force. Within the labor force, individuals with less than high school education have the highest percentage of unemployment, with 8.2% or 1,357 of them being unemployed.
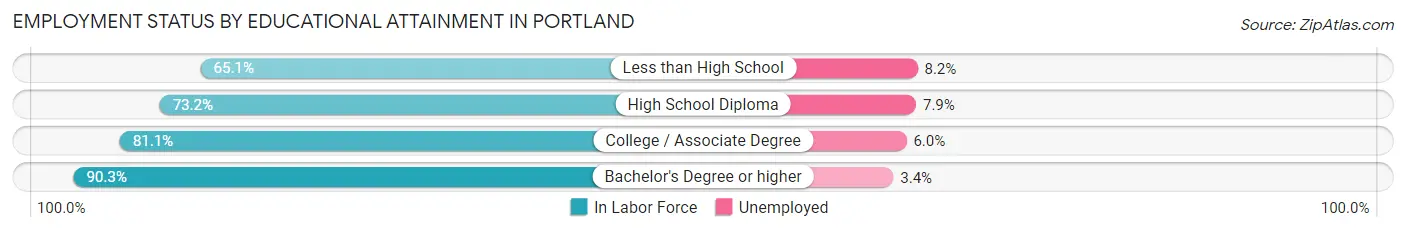
| Educational Attainment | In Labor Force | Unemployed |
| Less than High School | 16,550 (65.1%) | 2,085 (8.2%) |
| High School Diploma | 40,794 (73.2%) | 4,403 (7.9%) |
| College / Associate Degree | 80,832 (81.1%) | 5,980 (6.0%) |
| Bachelor's Degree or higher | 195,096 (90.3%) | 7,346 (3.4%) |
| Total | 333,374 (84.0%) | 19,050 (4.8%) |
Employment Occupations by Sex in Portland
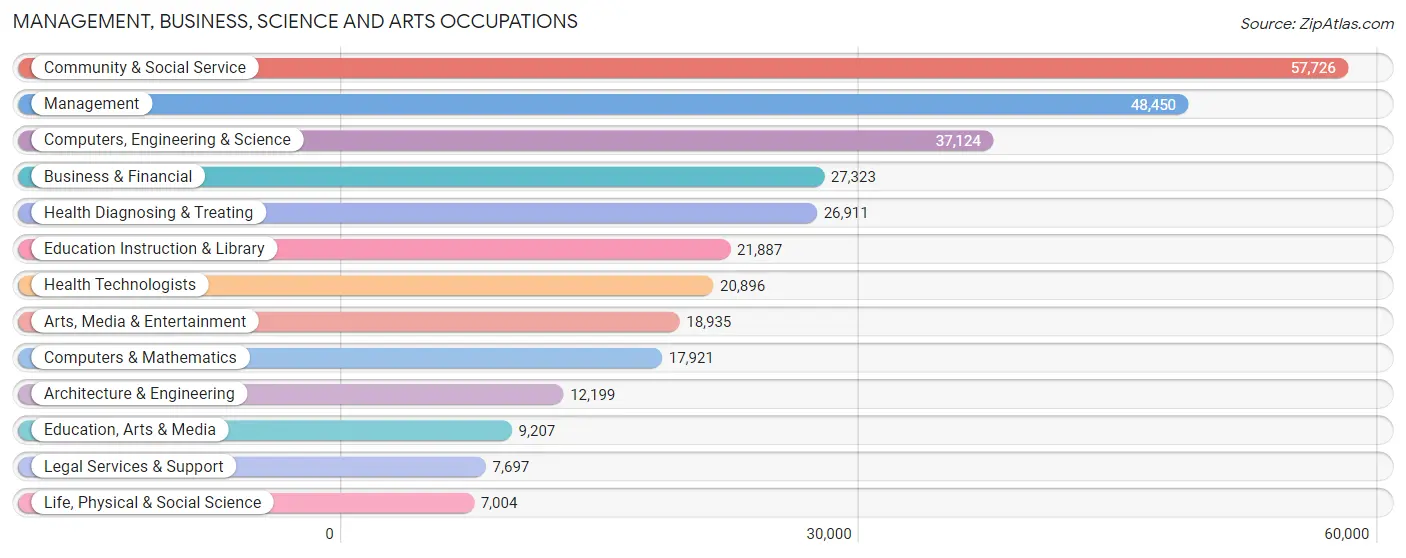
Management, Business, Science and Arts Occupations
The most common Management, Business, Science and Arts occupations in Portland are Community & Social Service (57,726 | 15.7%), Management (48,450 | 13.2%), Computers, Engineering & Science (37,124 | 10.1%), Business & Financial (27,323 | 7.4%), and Health Diagnosing & Treating (26,911 | 7.3%).
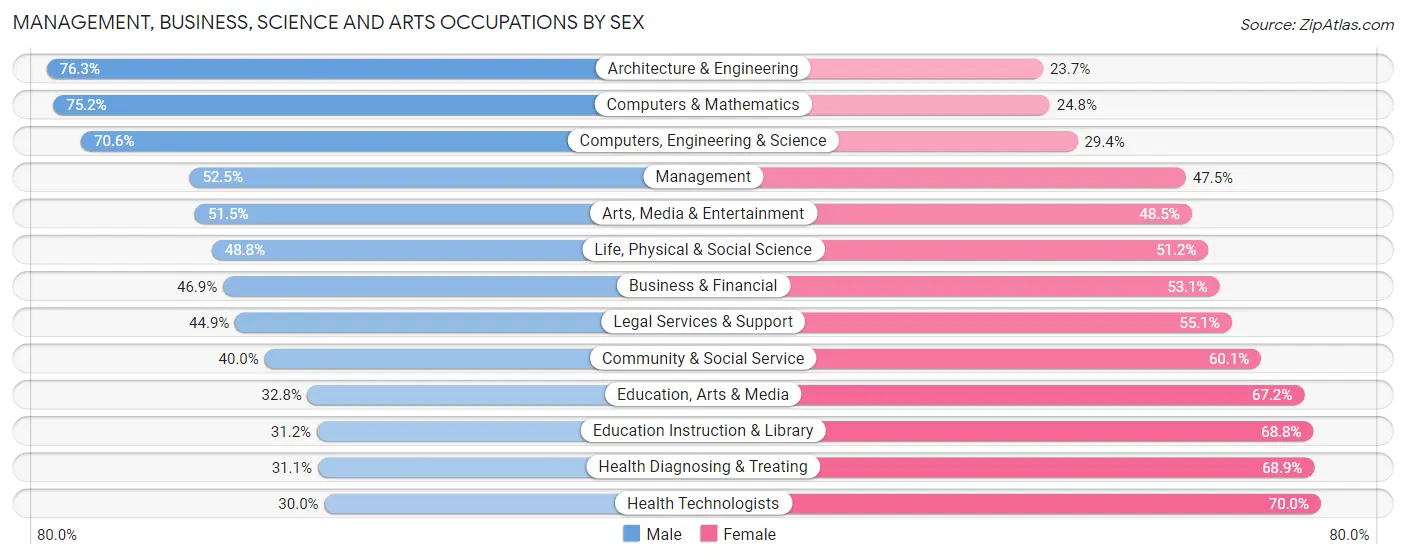
Management, Business, Science and Arts Occupations by Sex
Within the Management, Business, Science and Arts occupations in Portland, the most male-oriented occupations are Architecture & Engineering (76.3%), Computers & Mathematics (75.2%), and Computers, Engineering & Science (70.6%), while the most female-oriented occupations are Health Technologists (70.0%), Health Diagnosing & Treating (68.9%), and Education Instruction & Library (68.8%).
| Occupation | Male | Female |
| Management | 25,425 (52.5%) | 23,025 (47.5%) |
| Business & Financial | 12,813 (46.9%) | 14,510 (53.1%) |
| Computers, Engineering & Science | 26,203 (70.6%) | 10,921 (29.4%) |
| Computers & Mathematics | 13,477 (75.2%) | 4,444 (24.8%) |
| Architecture & Engineering | 9,311 (76.3%) | 2,888 (23.7%) |
| Life, Physical & Social Science | 3,415 (48.8%) | 3,589 (51.2%) |
| Community & Social Service | 23,061 (40.0%) | 34,665 (60.1%) |
| Education, Arts & Media | 3,016 (32.8%) | 6,191 (67.2%) |
| Legal Services & Support | 3,453 (44.9%) | 4,244 (55.1%) |
| Education Instruction & Library | 6,834 (31.2%) | 15,053 (68.8%) |
| Arts, Media & Entertainment | 9,758 (51.5%) | 9,177 (48.5%) |
| Health Diagnosing & Treating | 8,364 (31.1%) | 18,547 (68.9%) |
| Health Technologists | 6,263 (30.0%) | 14,633 (70.0%) |
| Total (Category) | 95,866 (48.5%) | 101,668 (51.5%) |
| Total (Overall) | 188,050 (51.1%) | 179,683 (48.9%) |
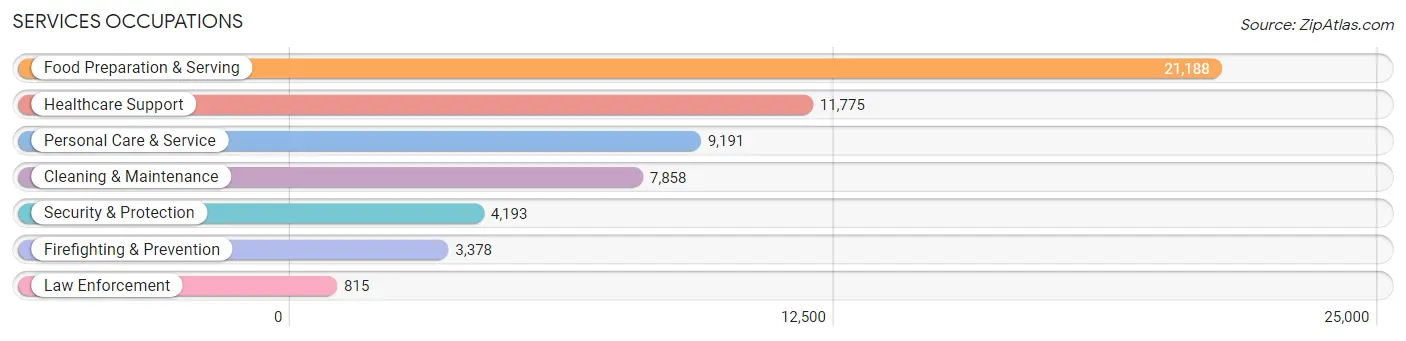
Services Occupations
The most common Services occupations in Portland are Food Preparation & Serving (21,188 | 5.8%), Healthcare Support (11,775 | 3.2%), Personal Care & Service (9,191 | 2.5%), Cleaning & Maintenance (7,858 | 2.1%), and Security & Protection (4,193 | 1.1%).
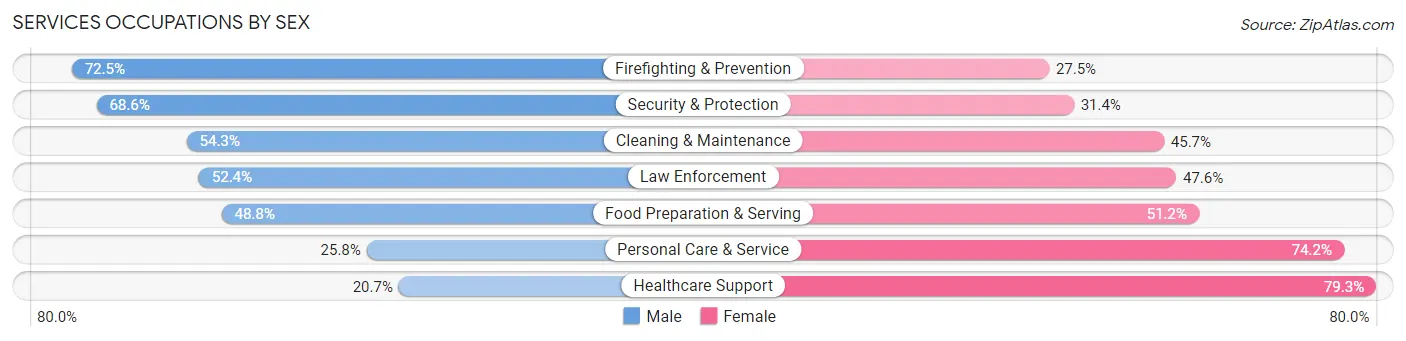
Services Occupations by Sex
Within the Services occupations in Portland, the most male-oriented occupations are Firefighting & Prevention (72.5%), Security & Protection (68.6%), and Cleaning & Maintenance (54.3%), while the most female-oriented occupations are Healthcare Support (79.3%), Personal Care & Service (74.2%), and Food Preparation & Serving (51.2%).
| Occupation | Male | Female |
| Healthcare Support | 2,441 (20.7%) | 9,334 (79.3%) |
| Security & Protection | 2,877 (68.6%) | 1,316 (31.4%) |
| Firefighting & Prevention | 2,450 (72.5%) | 928 (27.5%) |
| Law Enforcement | 427 (52.4%) | 388 (47.6%) |
| Food Preparation & Serving | 10,340 (48.8%) | 10,848 (51.2%) |
| Cleaning & Maintenance | 4,269 (54.3%) | 3,589 (45.7%) |
| Personal Care & Service | 2,373 (25.8%) | 6,818 (74.2%) |
| Total (Category) | 22,300 (41.1%) | 31,905 (58.9%) |
| Total (Overall) | 188,050 (51.1%) | 179,683 (48.9%) |
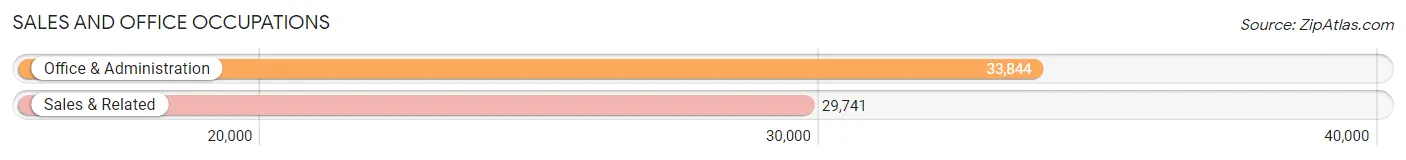
Sales and Office Occupations
The most common Sales and Office occupations in Portland are Office & Administration (33,844 | 9.2%), and Sales & Related (29,741 | 8.1%).
Sales and Office Occupations by Sex
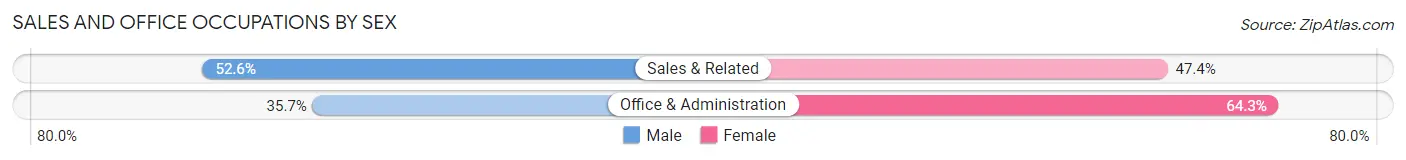
| Occupation | Male | Female |
| Sales & Related | 15,649 (52.6%) | 14,092 (47.4%) |
| Office & Administration | 12,076 (35.7%) | 21,768 (64.3%) |
| Total (Category) | 27,725 (43.6%) | 35,860 (56.4%) |
| Total (Overall) | 188,050 (51.1%) | 179,683 (48.9%) |
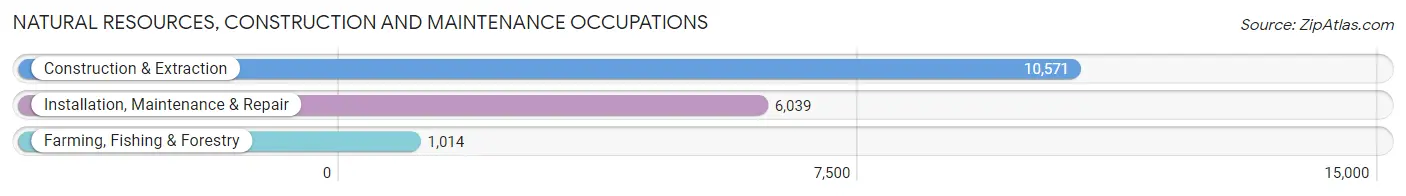
Natural Resources, Construction and Maintenance Occupations
The most common Natural Resources, Construction and Maintenance occupations in Portland are Construction & Extraction (10,571 | 2.9%), Installation, Maintenance & Repair (6,039 | 1.6%), and Farming, Fishing & Forestry (1,014 | 0.3%).
Natural Resources, Construction and Maintenance Occupations by Sex
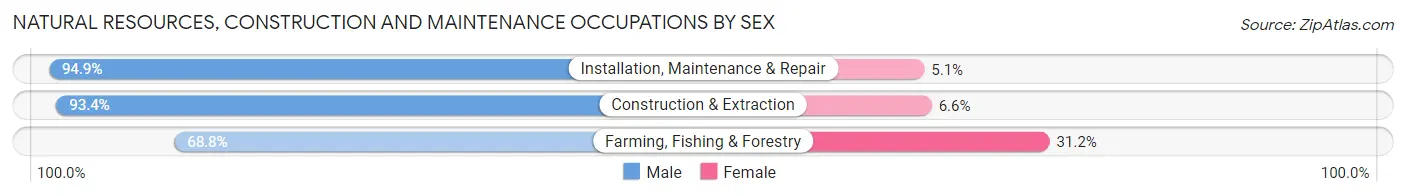
| Occupation | Male | Female |
| Farming, Fishing & Forestry | 698 (68.8%) | 316 (31.2%) |
| Construction & Extraction | 9,871 (93.4%) | 700 (6.6%) |
| Installation, Maintenance & Repair | 5,732 (94.9%) | 307 (5.1%) |
| Total (Category) | 16,301 (92.5%) | 1,323 (7.5%) |
| Total (Overall) | 188,050 (51.1%) | 179,683 (48.9%) |
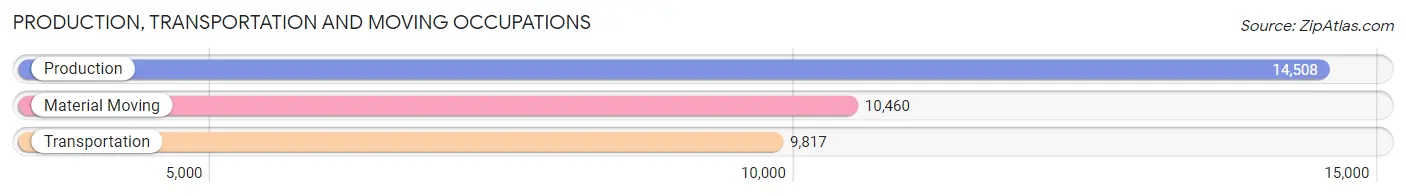
Production, Transportation and Moving Occupations
The most common Production, Transportation and Moving occupations in Portland are Production (14,508 | 4.0%), Material Moving (10,460 | 2.8%), and Transportation (9,817 | 2.7%).
Production, Transportation and Moving Occupations by Sex
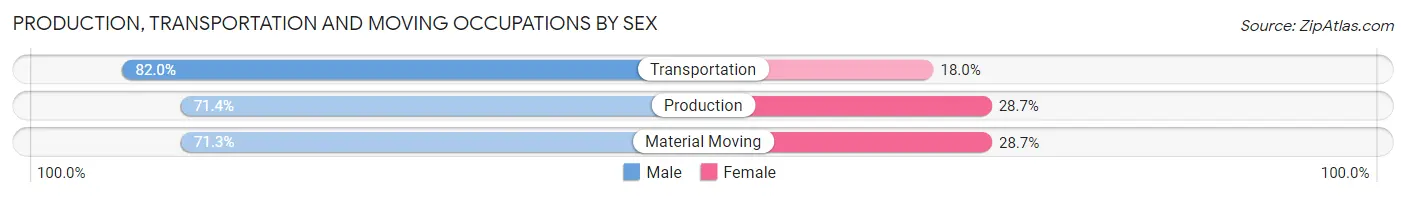
| Occupation | Male | Female |
| Production | 10,351 (71.4%) | 4,157 (28.6%) |
| Transportation | 8,051 (82.0%) | 1,766 (18.0%) |
| Material Moving | 7,456 (71.3%) | 3,004 (28.7%) |
| Total (Category) | 25,858 (74.3%) | 8,927 (25.7%) |
| Total (Overall) | 188,050 (51.1%) | 179,683 (48.9%) |
Employment Industries by Sex in Portland
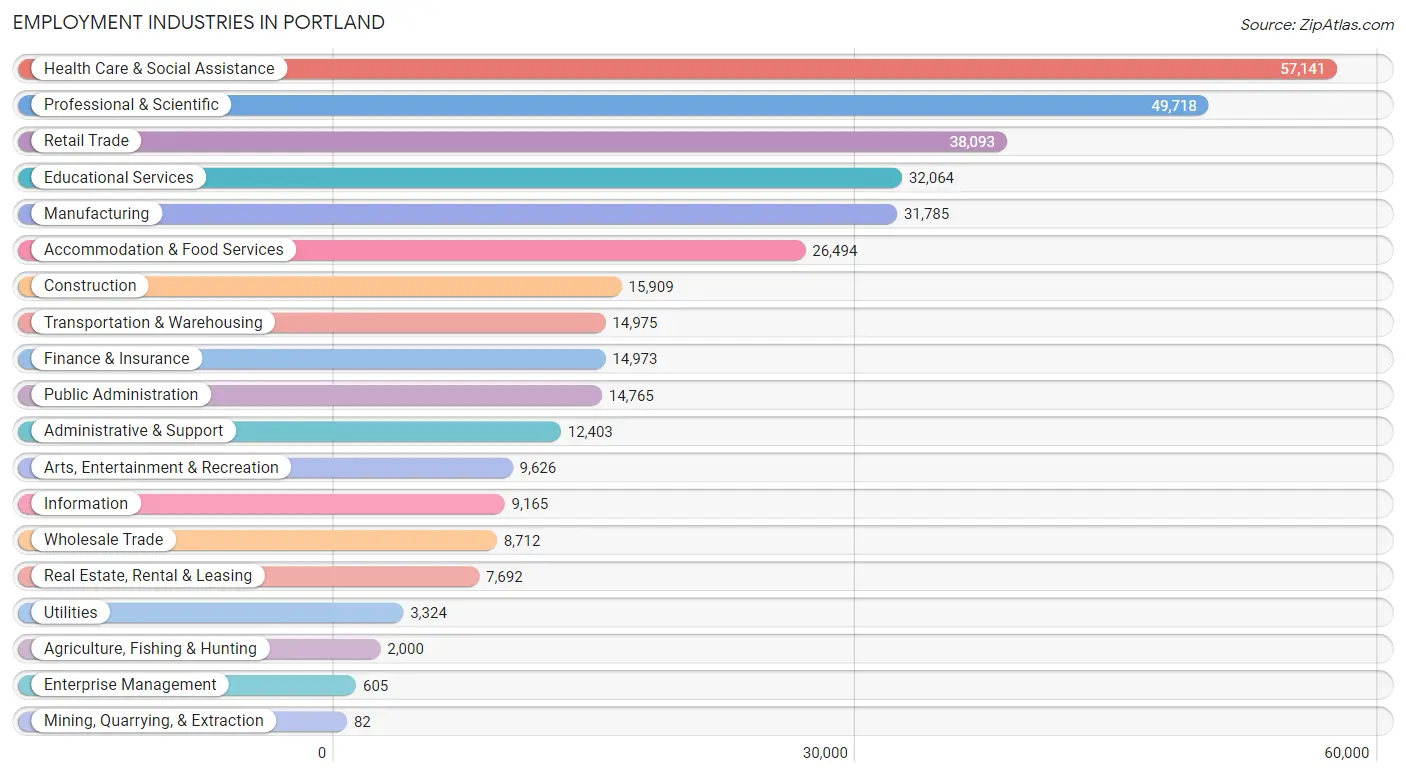
Employment Industries in Portland
The major employment industries in Portland include Health Care & Social Assistance (57,141 | 15.5%), Professional & Scientific (49,718 | 13.5%), Retail Trade (38,093 | 10.4%), Educational Services (32,064 | 8.7%), and Manufacturing (31,785 | 8.6%).
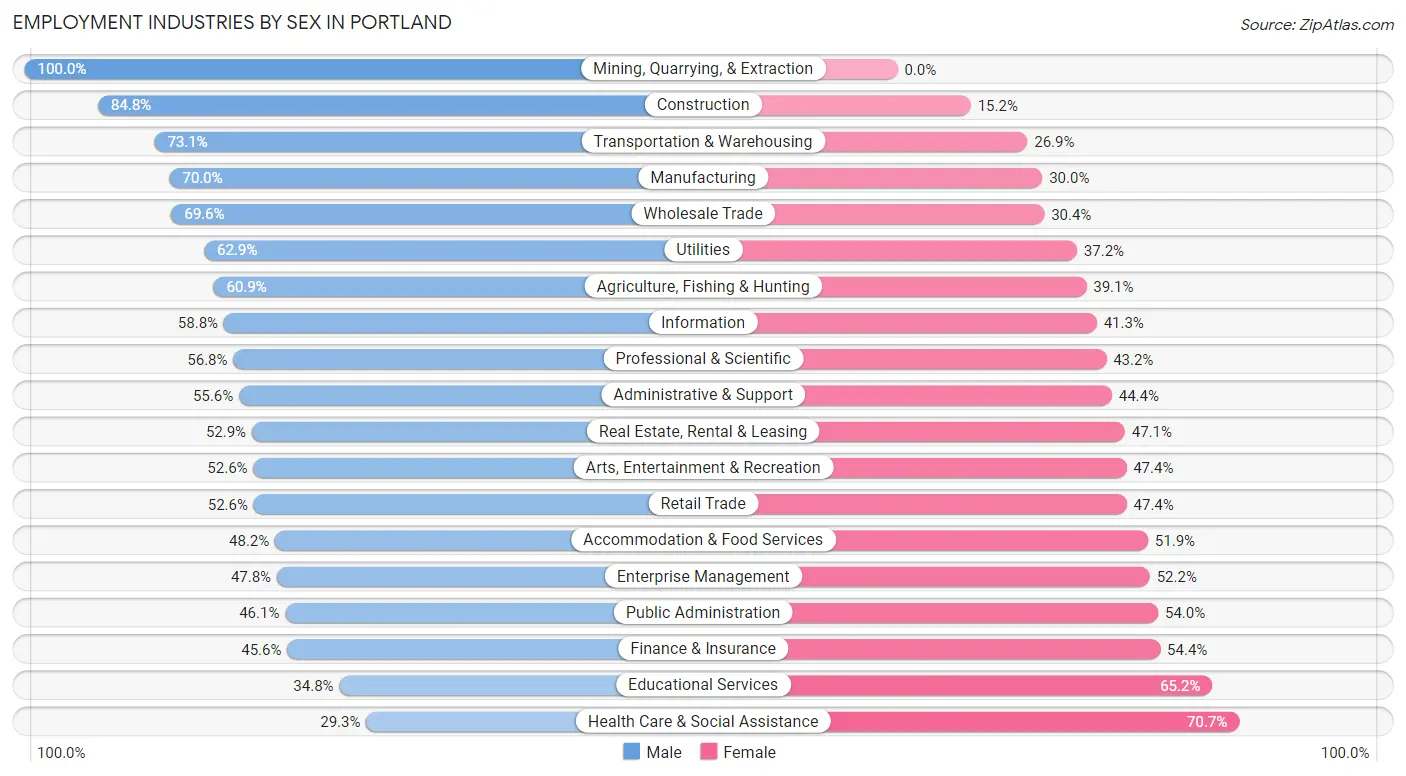
Employment Industries by Sex in Portland
The Portland industries that see more men than women are Mining, Quarrying, & Extraction (100.0%), Construction (84.8%), and Transportation & Warehousing (73.1%), whereas the industries that tend to have a higher number of women are Health Care & Social Assistance (70.7%), Educational Services (65.2%), and Finance & Insurance (54.4%).
| Industry | Male | Female |
| Agriculture, Fishing & Hunting | 1,218 (60.9%) | 782 (39.1%) |
| Mining, Quarrying, & Extraction | 82 (100.0%) | 0 (0.0%) |
| Construction | 13,494 (84.8%) | 2,415 (15.2%) |
| Manufacturing | 22,260 (70.0%) | 9,525 (30.0%) |
| Wholesale Trade | 6,065 (69.6%) | 2,647 (30.4%) |
| Retail Trade | 20,023 (52.6%) | 18,070 (47.4%) |
| Transportation & Warehousing | 10,950 (73.1%) | 4,025 (26.9%) |
| Utilities | 2,089 (62.8%) | 1,235 (37.1%) |
| Information | 5,384 (58.8%) | 3,781 (41.2%) |
| Finance & Insurance | 6,831 (45.6%) | 8,142 (54.4%) |
| Real Estate, Rental & Leasing | 4,072 (52.9%) | 3,620 (47.1%) |
| Professional & Scientific | 28,237 (56.8%) | 21,481 (43.2%) |
| Enterprise Management | 289 (47.8%) | 316 (52.2%) |
| Administrative & Support | 6,900 (55.6%) | 5,503 (44.4%) |
| Educational Services | 11,172 (34.8%) | 20,892 (65.2%) |
| Health Care & Social Assistance | 16,728 (29.3%) | 40,413 (70.7%) |
| Arts, Entertainment & Recreation | 5,067 (52.6%) | 4,559 (47.4%) |
| Accommodation & Food Services | 12,757 (48.1%) | 13,737 (51.8%) |
| Public Administration | 6,800 (46.1%) | 7,965 (53.9%) |
| Total | 188,050 (51.1%) | 179,683 (48.9%) |
Education in Portland
School Enrollment in Portland
The most common levels of schooling among the 134,812 students in Portland are college / undergraduate (34,793 | 25.8%), elementary school (24,871 | 18.4%), and high school (24,614 | 18.3%).
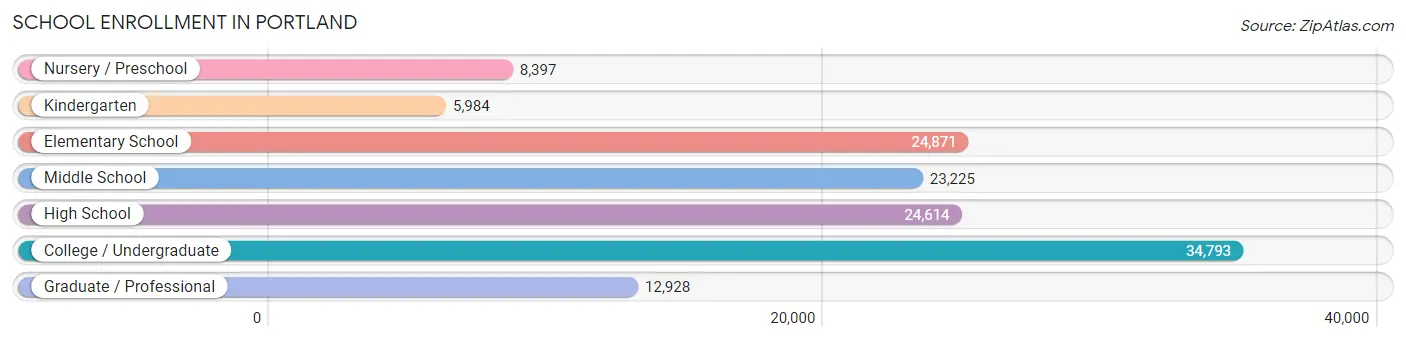
| School Level | # Students | % Students |
| Nursery / Preschool | 8,397 | 6.2% |
| Kindergarten | 5,984 | 4.4% |
| Elementary School | 24,871 | 18.4% |
| Middle School | 23,225 | 17.2% |
| High School | 24,614 | 18.3% |
| College / Undergraduate | 34,793 | 25.8% |
| Graduate / Professional | 12,928 | 9.6% |
| Total | 134,812 | 100.0% |
School Enrollment by Age by Funding Source in Portland
Out of a total of 134,812 students who are enrolled in schools in Portland, 29,659 (22.0%) attend a private institution, while the remaining 105,153 (78.0%) are enrolled in public schools. The age group of 3 to 4 year olds has the highest likelihood of being enrolled in private schools, with 4,261 (64.0% in the age bracket) enrolled. Conversely, the age group of 10 to 14 year olds has the lowest likelihood of being enrolled in a private school, with 25,738 (86.7% in the age bracket) attending a public institution.
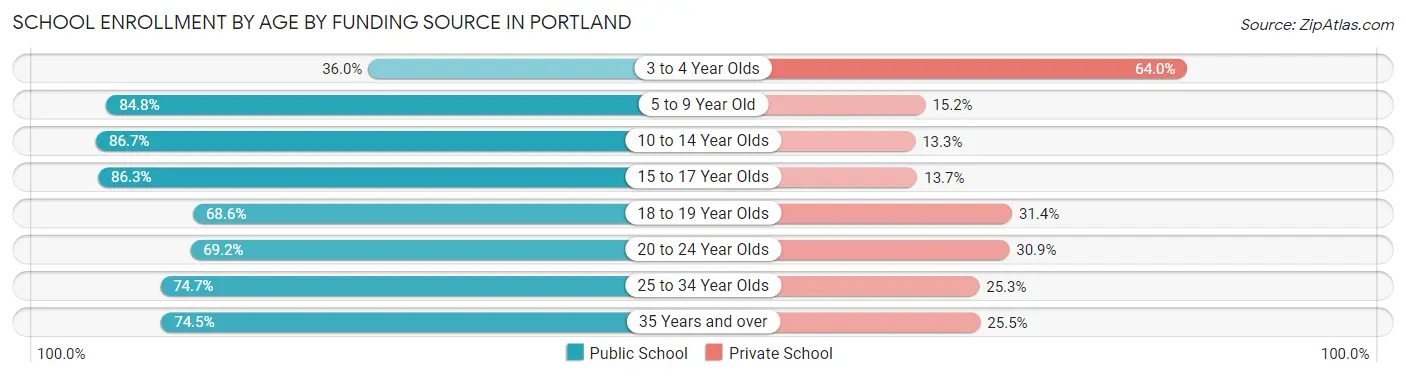
| Age Bracket | Public School | Private School |
| 3 to 4 Year Olds | 2,397 (36.0%) | 4,261 (64.0%) |
| 5 to 9 Year Old | 24,739 (84.8%) | 4,446 (15.2%) |
| 10 to 14 Year Olds | 25,738 (86.7%) | 3,959 (13.3%) |
| 15 to 17 Year Olds | 15,163 (86.3%) | 2,410 (13.7%) |
| 18 to 19 Year Olds | 7,732 (68.6%) | 3,534 (31.4%) |
| 20 to 24 Year Olds | 10,741 (69.2%) | 4,792 (30.8%) |
| 25 to 34 Year Olds | 11,085 (74.7%) | 3,746 (25.3%) |
| 35 Years and over | 7,504 (74.5%) | 2,565 (25.5%) |
| Total | 105,153 (78.0%) | 29,659 (22.0%) |
Educational Attainment by Field of Study in Portland
Social sciences (35,470 | 12.5%), business (33,590 | 11.8%), literature & languages (25,640 | 9.0%), visual & performing arts (25,289 | 8.9%), and bio, nature & agricultural (23,380 | 8.2%) are the most common fields of study among 283,834 individuals in Portland who have obtained a bachelor's degree or higher.
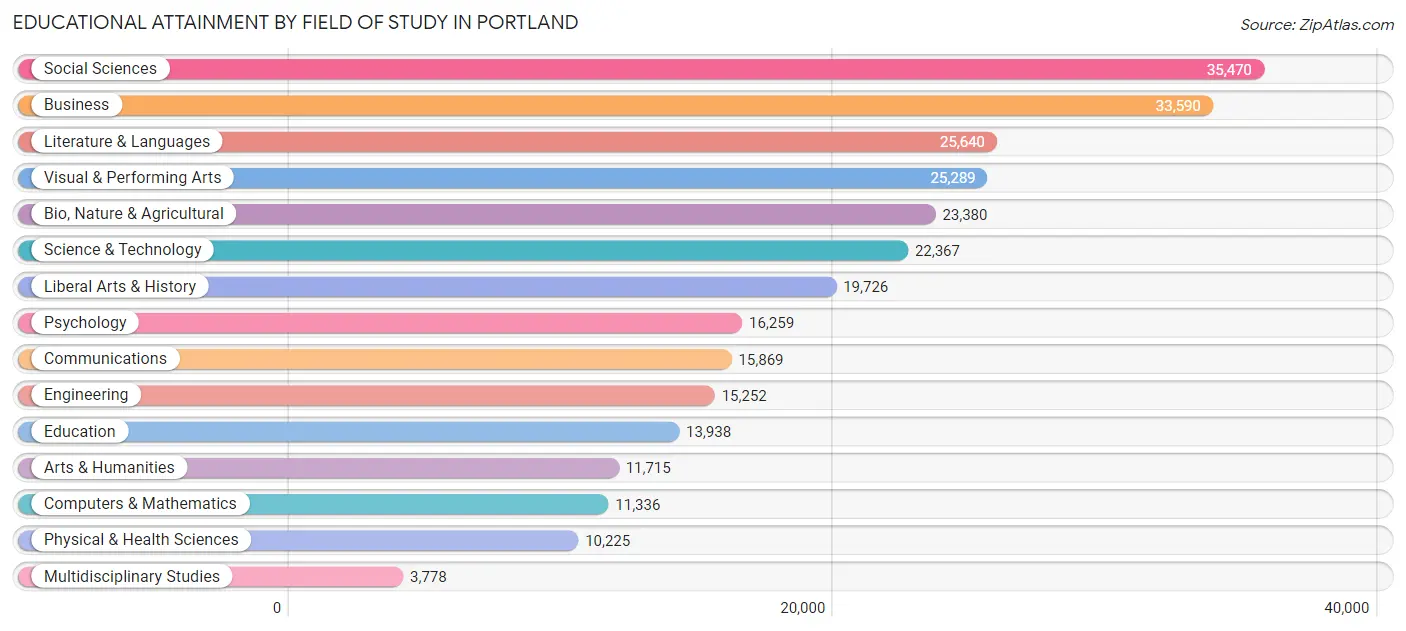
| Field of Study | # Graduates | % Graduates |
| Computers & Mathematics | 11,336 | 4.0% |
| Bio, Nature & Agricultural | 23,380 | 8.2% |
| Physical & Health Sciences | 10,225 | 3.6% |
| Psychology | 16,259 | 5.7% |
| Social Sciences | 35,470 | 12.5% |
| Engineering | 15,252 | 5.4% |
| Multidisciplinary Studies | 3,778 | 1.3% |
| Science & Technology | 22,367 | 7.9% |
| Business | 33,590 | 11.8% |
| Education | 13,938 | 4.9% |
| Literature & Languages | 25,640 | 9.0% |
| Liberal Arts & History | 19,726 | 7.0% |
| Visual & Performing Arts | 25,289 | 8.9% |
| Communications | 15,869 | 5.6% |
| Arts & Humanities | 11,715 | 4.1% |
| Total | 283,834 | 100.0% |
Transportation & Commute in Portland
Vehicle Availability by Sex in Portland
The most prevalent vehicle ownership categories in Portland are males with 2 vehicles (71,761, accounting for 39.1%) and females with 2 vehicles (66,811, making up 41.5%).
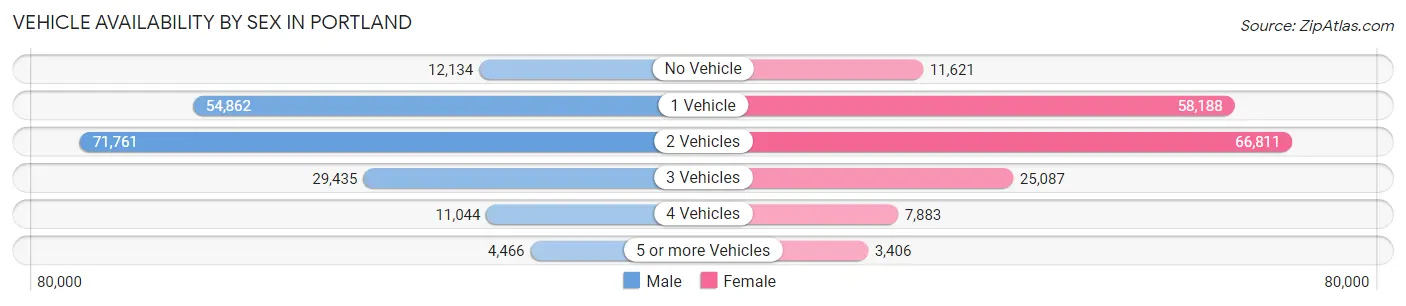
| Vehicles Available | Male | Female |
| No Vehicle | 12,134 (6.6%) | 11,621 (6.7%) |
| 1 Vehicle | 54,862 (29.9%) | 58,188 (33.6%) |
| 2 Vehicles | 71,761 (39.1%) | 66,811 (38.6%) |
| 3 Vehicles | 29,435 (16.0%) | 25,087 (14.5%) |
| 4 Vehicles | 11,044 (6.0%) | 7,883 (4.6%) |
| 5 or more Vehicles | 4,466 (2.4%) | 3,406 (2.0%) |
| Total | 183,702 (100.0%) | 172,996 (100.0%) |
Commute Time in Portland
The most frequently occuring commute durations in Portland are 20 to 24 minutes (52,092 commuters, 18.5%), 15 to 19 minutes (50,135 commuters, 17.8%), and 30 to 34 minutes (45,936 commuters, 16.3%).
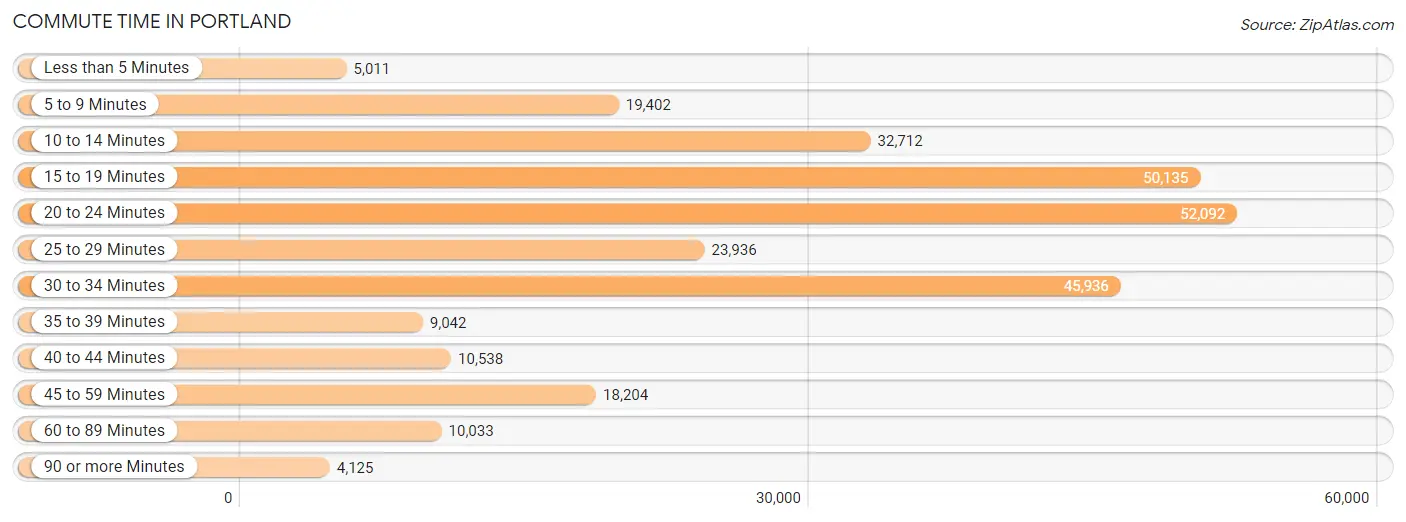
| Commute Time | # Commuters | % Commuters |
| Less than 5 Minutes | 5,011 | 1.8% |
| 5 to 9 Minutes | 19,402 | 6.9% |
| 10 to 14 Minutes | 32,712 | 11.6% |
| 15 to 19 Minutes | 50,135 | 17.8% |
| 20 to 24 Minutes | 52,092 | 18.5% |
| 25 to 29 Minutes | 23,936 | 8.5% |
| 30 to 34 Minutes | 45,936 | 16.3% |
| 35 to 39 Minutes | 9,042 | 3.2% |
| 40 to 44 Minutes | 10,538 | 3.7% |
| 45 to 59 Minutes | 18,204 | 6.5% |
| 60 to 89 Minutes | 10,033 | 3.6% |
| 90 or more Minutes | 4,125 | 1.5% |
Commute Time by Sex in Portland
The most common commute times in Portland are 20 to 24 minutes (27,605 commuters, 18.7%) for males and 20 to 24 minutes (24,487 commuters, 18.3%) for females.
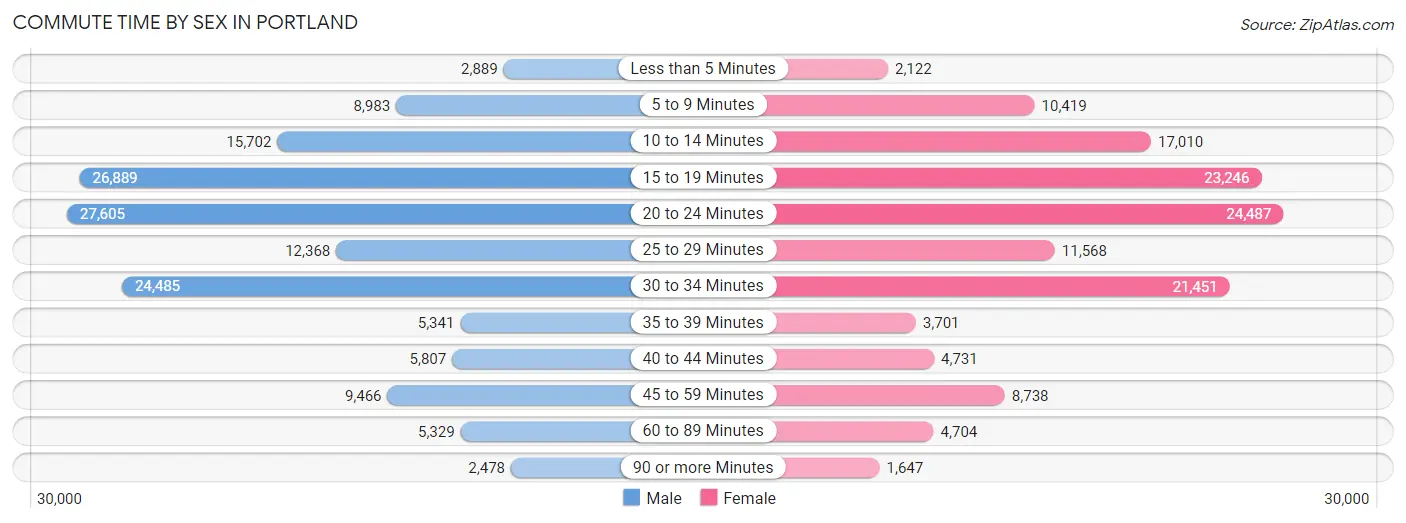
| Commute Time | Male | Female |
| Less than 5 Minutes | 2,889 (2.0%) | 2,122 (1.6%) |
| 5 to 9 Minutes | 8,983 (6.1%) | 10,419 (7.8%) |
| 10 to 14 Minutes | 15,702 (10.7%) | 17,010 (12.7%) |
| 15 to 19 Minutes | 26,889 (18.2%) | 23,246 (17.4%) |
| 20 to 24 Minutes | 27,605 (18.7%) | 24,487 (18.3%) |
| 25 to 29 Minutes | 12,368 (8.4%) | 11,568 (8.6%) |
| 30 to 34 Minutes | 24,485 (16.6%) | 21,451 (16.0%) |
| 35 to 39 Minutes | 5,341 (3.6%) | 3,701 (2.8%) |
| 40 to 44 Minutes | 5,807 (3.9%) | 4,731 (3.5%) |
| 45 to 59 Minutes | 9,466 (6.4%) | 8,738 (6.5%) |
| 60 to 89 Minutes | 5,329 (3.6%) | 4,704 (3.5%) |
| 90 or more Minutes | 2,478 (1.7%) | 1,647 (1.2%) |
Time of Departure to Work by Sex in Portland
The most frequent times of departure to work in Portland are 7:00 AM to 7:29 AM (17,777, 12.1%) for males and 7:30 AM to 7:59 AM (18,949, 14.2%) for females.
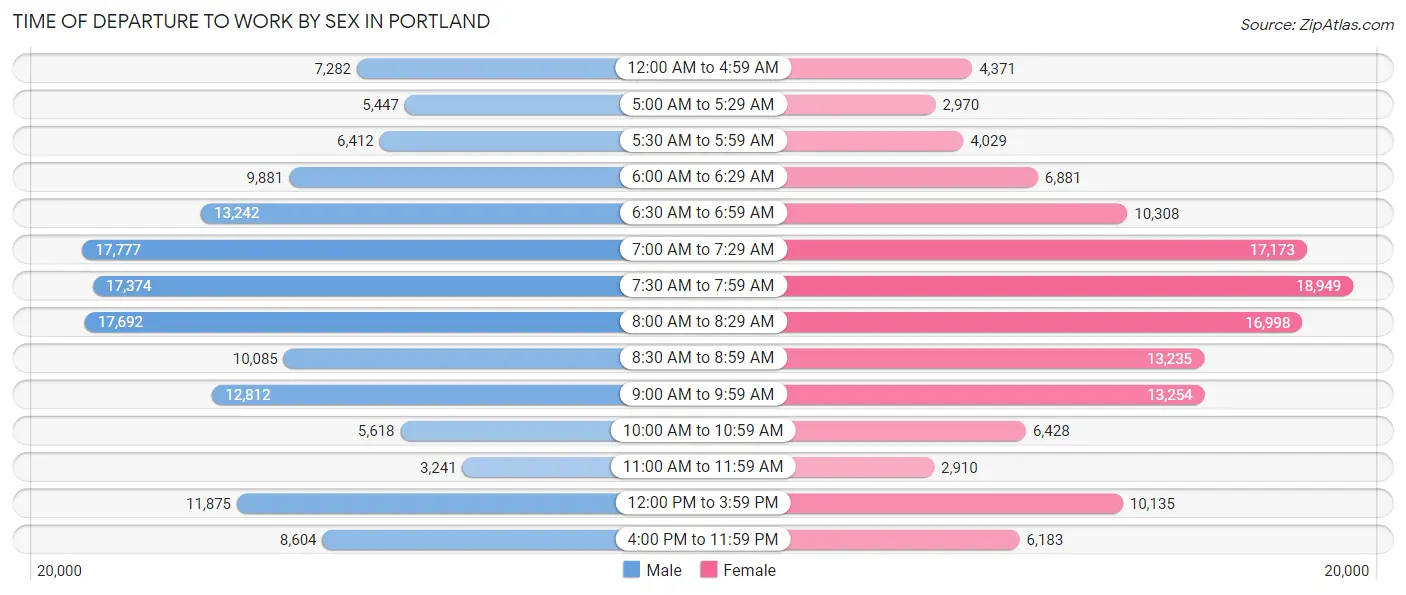
| Time of Departure | Male | Female |
| 12:00 AM to 4:59 AM | 7,282 (4.9%) | 4,371 (3.3%) |
| 5:00 AM to 5:29 AM | 5,447 (3.7%) | 2,970 (2.2%) |
| 5:30 AM to 5:59 AM | 6,412 (4.3%) | 4,029 (3.0%) |
| 6:00 AM to 6:29 AM | 9,881 (6.7%) | 6,881 (5.1%) |
| 6:30 AM to 6:59 AM | 13,242 (9.0%) | 10,308 (7.7%) |
| 7:00 AM to 7:29 AM | 17,777 (12.1%) | 17,173 (12.8%) |
| 7:30 AM to 7:59 AM | 17,374 (11.8%) | 18,949 (14.2%) |
| 8:00 AM to 8:29 AM | 17,692 (12.0%) | 16,998 (12.7%) |
| 8:30 AM to 8:59 AM | 10,085 (6.8%) | 13,235 (9.9%) |
| 9:00 AM to 9:59 AM | 12,812 (8.7%) | 13,254 (9.9%) |
| 10:00 AM to 10:59 AM | 5,618 (3.8%) | 6,428 (4.8%) |
| 11:00 AM to 11:59 AM | 3,241 (2.2%) | 2,910 (2.2%) |
| 12:00 PM to 3:59 PM | 11,875 (8.1%) | 10,135 (7.6%) |
| 4:00 PM to 11:59 PM | 8,604 (5.8%) | 6,183 (4.6%) |
| Total | 147,342 (100.0%) | 133,824 (100.0%) |
Housing Occupancy in Portland
Occupancy by Ownership in Portland
Of the total 283,896 dwellings in Portland, owner-occupied units account for 151,284 (53.3%), while renter-occupied units make up 132,612 (46.7%).
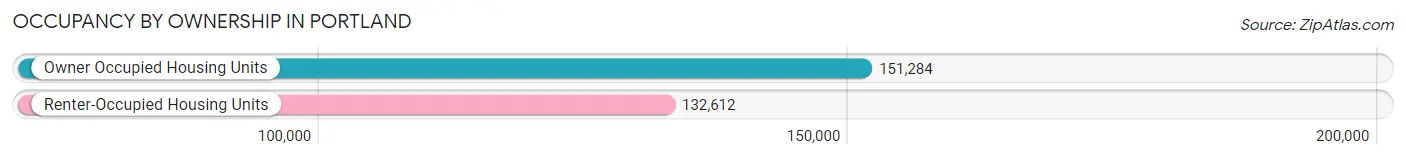
| Occupancy | # Housing Units | % Housing Units |
| Owner Occupied Housing Units | 151,284 | 53.3% |
| Renter-Occupied Housing Units | 132,612 | 46.7% |
| Total Occupied Housing Units | 283,896 | 100.0% |
Occupancy by Household Size in Portland
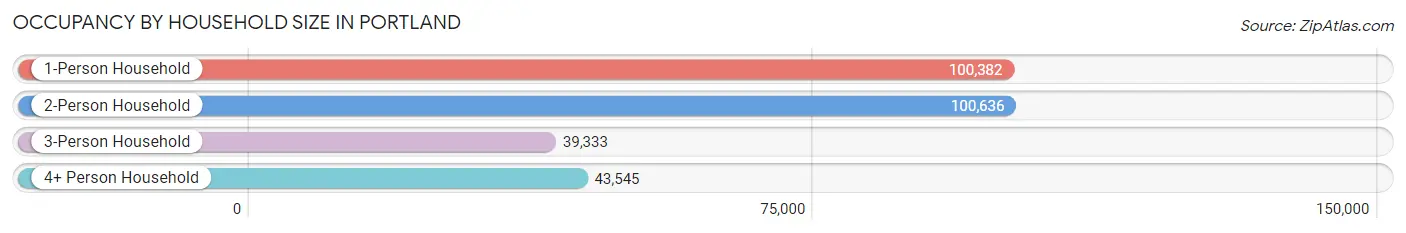
| Household Size | # Housing Units | % Housing Units |
| 1-Person Household | 100,382 | 35.4% |
| 2-Person Household | 100,636 | 35.4% |
| 3-Person Household | 39,333 | 13.9% |
| 4+ Person Household | 43,545 | 15.3% |
| Total Housing Units | 283,896 | 100.0% |
Occupancy by Ownership by Household Size in Portland
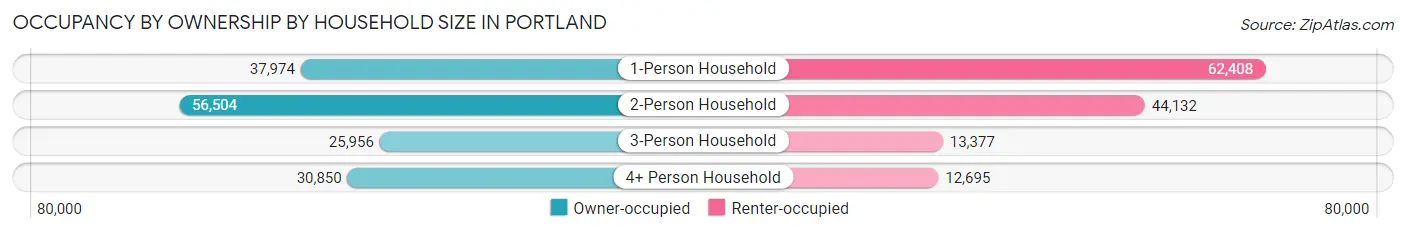
| Household Size | Owner-occupied | Renter-occupied |
| 1-Person Household | 37,974 (37.8%) | 62,408 (62.2%) |
| 2-Person Household | 56,504 (56.1%) | 44,132 (43.9%) |
| 3-Person Household | 25,956 (66.0%) | 13,377 (34.0%) |
| 4+ Person Household | 30,850 (70.9%) | 12,695 (29.1%) |
| Total Housing Units | 151,284 (53.3%) | 132,612 (46.7%) |
Occupancy by Educational Attainment in Portland
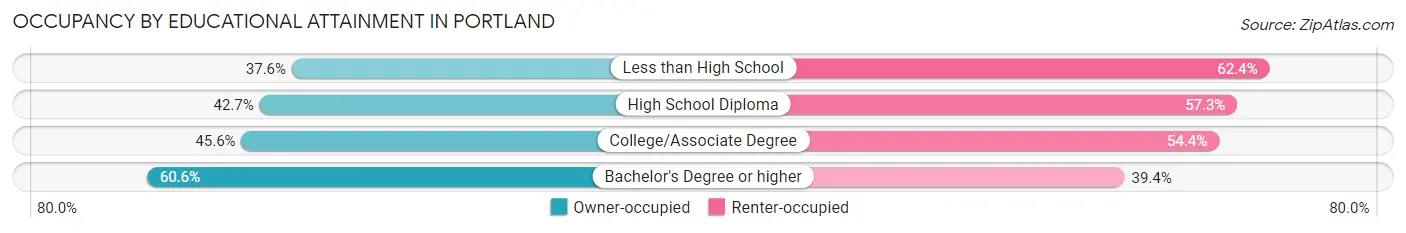
| Household Size | Owner-occupied | Renter-occupied |
| Less than High School | 5,327 (37.6%) | 8,836 (62.4%) |
| High School Diploma | 14,437 (42.7%) | 19,343 (57.3%) |
| College/Associate Degree | 34,940 (45.6%) | 41,665 (54.4%) |
| Bachelor's Degree or higher | 96,580 (60.6%) | 62,768 (39.4%) |
Occupancy by Age of Householder in Portland
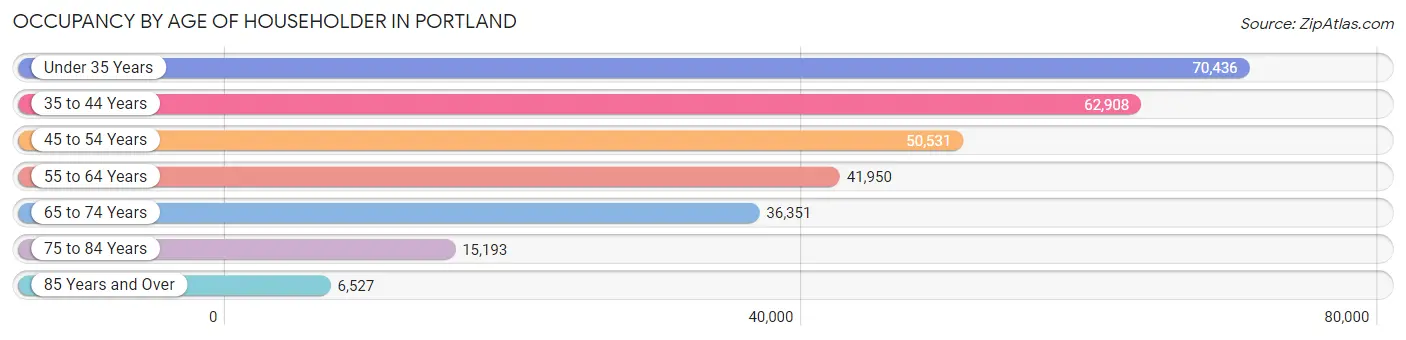
| Age Bracket | # Households | % Households |
| Under 35 Years | 70,436 | 24.8% |
| 35 to 44 Years | 62,908 | 22.2% |
| 45 to 54 Years | 50,531 | 17.8% |
| 55 to 64 Years | 41,950 | 14.8% |
| 65 to 74 Years | 36,351 | 12.8% |
| 75 to 84 Years | 15,193 | 5.3% |
| 85 Years and Over | 6,527 | 2.3% |
| Total | 283,896 | 100.0% |
Housing Finances in Portland
Median Income by Occupancy in Portland
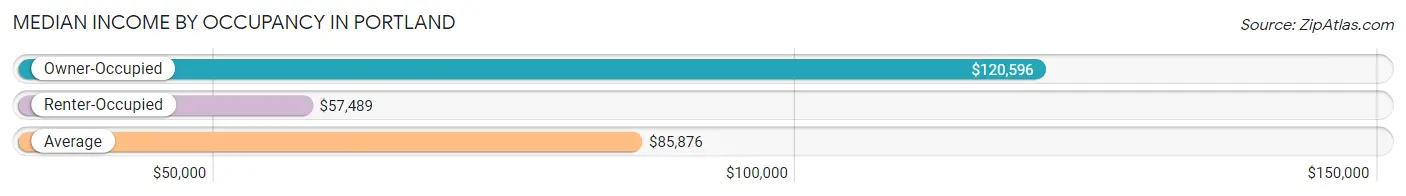
| Occupancy Type | # Households | Median Income |
| Owner-Occupied | 151,284 (53.3%) | $120,596 |
| Renter-Occupied | 132,612 (46.7%) | $57,489 |
| Average | 283,896 (100.0%) | $85,876 |
Occupancy by Householder Income Bracket in Portland
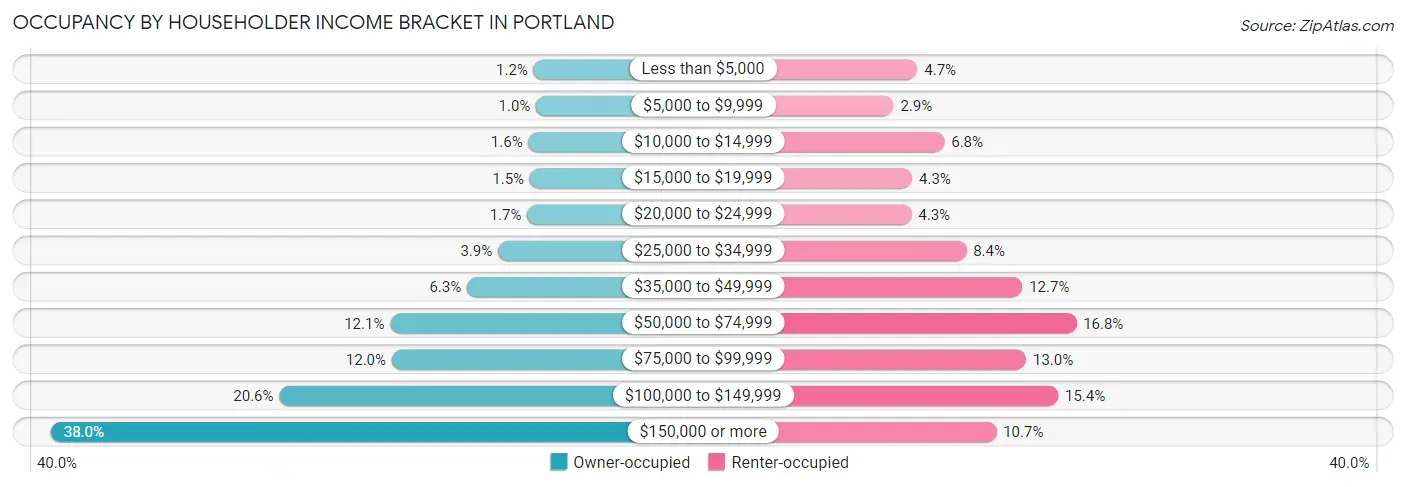
| Income Bracket | Owner-occupied | Renter-occupied |
| Less than $5,000 | 1,831 (1.2%) | 6,250 (4.7%) |
| $5,000 to $9,999 | 1,548 (1.0%) | 3,827 (2.9%) |
| $10,000 to $14,999 | 2,429 (1.6%) | 8,971 (6.8%) |
| $15,000 to $19,999 | 2,264 (1.5%) | 5,721 (4.3%) |
| $20,000 to $24,999 | 2,575 (1.7%) | 5,631 (4.3%) |
| $25,000 to $34,999 | 5,939 (3.9%) | 11,176 (8.4%) |
| $35,000 to $49,999 | 9,513 (6.3%) | 16,842 (12.7%) |
| $50,000 to $74,999 | 18,359 (12.1%) | 22,293 (16.8%) |
| $75,000 to $99,999 | 18,187 (12.0%) | 17,230 (13.0%) |
| $100,000 to $149,999 | 31,145 (20.6%) | 20,456 (15.4%) |
| $150,000 or more | 57,494 (38.0%) | 14,215 (10.7%) |
| Total | 151,284 (100.0%) | 132,612 (100.0%) |
Monthly Housing Cost Tiers in Portland
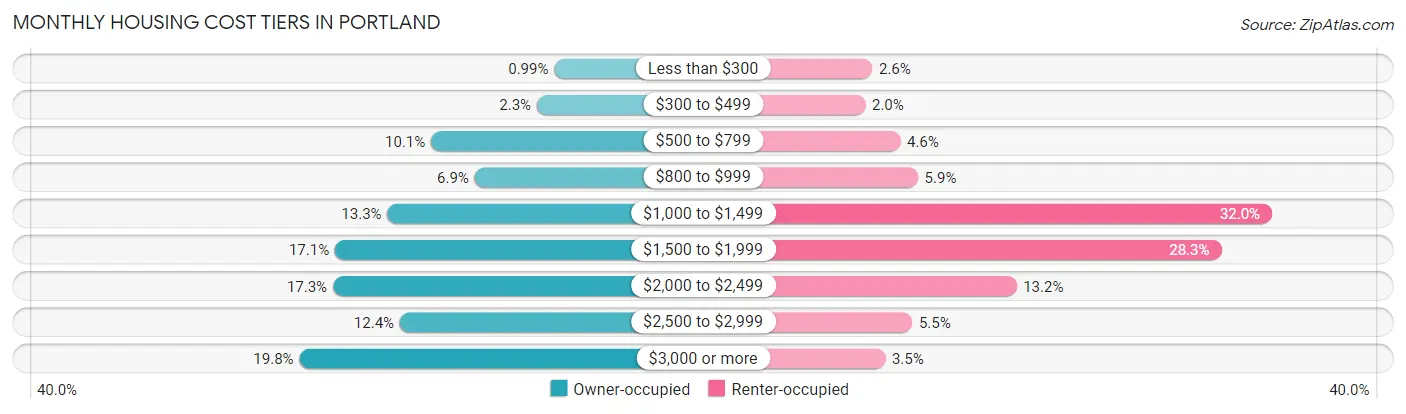
| Monthly Cost | Owner-occupied | Renter-occupied |
| Less than $300 | 1,503 (1.0%) | 3,385 (2.5%) |
| $300 to $499 | 3,441 (2.3%) | 2,686 (2.0%) |
| $500 to $799 | 15,212 (10.1%) | 6,110 (4.6%) |
| $800 to $999 | 10,358 (6.9%) | 7,832 (5.9%) |
| $1,000 to $1,499 | 20,088 (13.3%) | 42,436 (32.0%) |
| $1,500 to $1,999 | 25,932 (17.1%) | 37,495 (28.3%) |
| $2,000 to $2,499 | 26,157 (17.3%) | 17,464 (13.2%) |
| $2,500 to $2,999 | 18,702 (12.4%) | 7,284 (5.5%) |
| $3,000 or more | 29,891 (19.8%) | 4,642 (3.5%) |
| Total | 151,284 (100.0%) | 132,612 (100.0%) |
Physical Housing Characteristics in Portland
Housing Structures in Portland
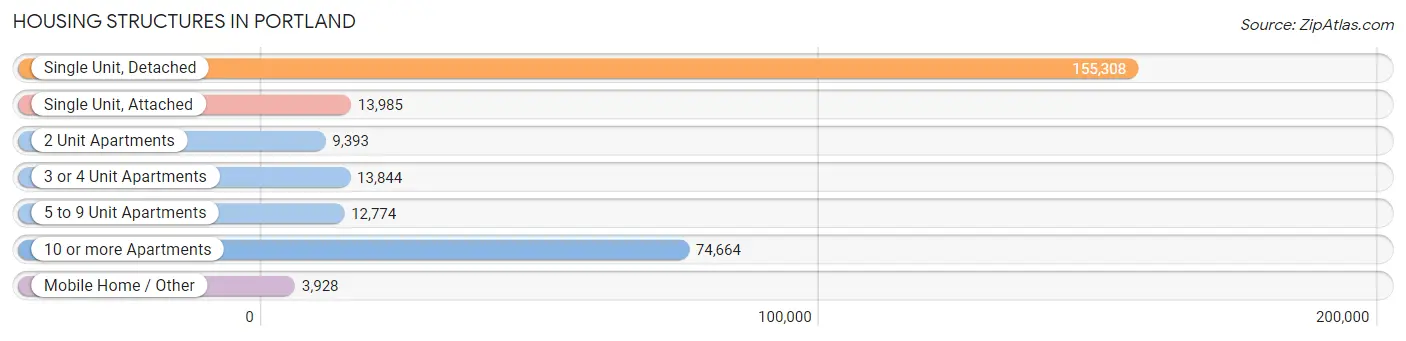
| Structure Type | # Housing Units | % Housing Units |
| Single Unit, Detached | 155,308 | 54.7% |
| Single Unit, Attached | 13,985 | 4.9% |
| 2 Unit Apartments | 9,393 | 3.3% |
| 3 or 4 Unit Apartments | 13,844 | 4.9% |
| 5 to 9 Unit Apartments | 12,774 | 4.5% |
| 10 or more Apartments | 74,664 | 26.3% |
| Mobile Home / Other | 3,928 | 1.4% |
| Total | 283,896 | 100.0% |
Housing Structures by Occupancy in Portland
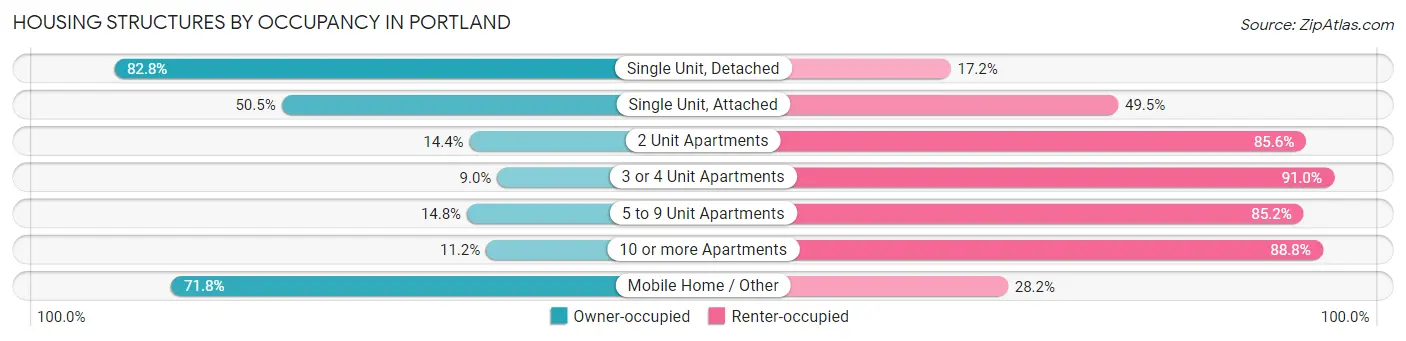
| Structure Type | Owner-occupied | Renter-occupied |
| Single Unit, Detached | 128,577 (82.8%) | 26,731 (17.2%) |
| Single Unit, Attached | 7,068 (50.5%) | 6,917 (49.5%) |
| 2 Unit Apartments | 1,349 (14.4%) | 8,044 (85.6%) |
| 3 or 4 Unit Apartments | 1,247 (9.0%) | 12,597 (91.0%) |
| 5 to 9 Unit Apartments | 1,894 (14.8%) | 10,880 (85.2%) |
| 10 or more Apartments | 8,330 (11.2%) | 66,334 (88.8%) |
| Mobile Home / Other | 2,819 (71.8%) | 1,109 (28.2%) |
| Total | 151,284 (53.3%) | 132,612 (46.7%) |
Housing Structures by Number of Rooms in Portland
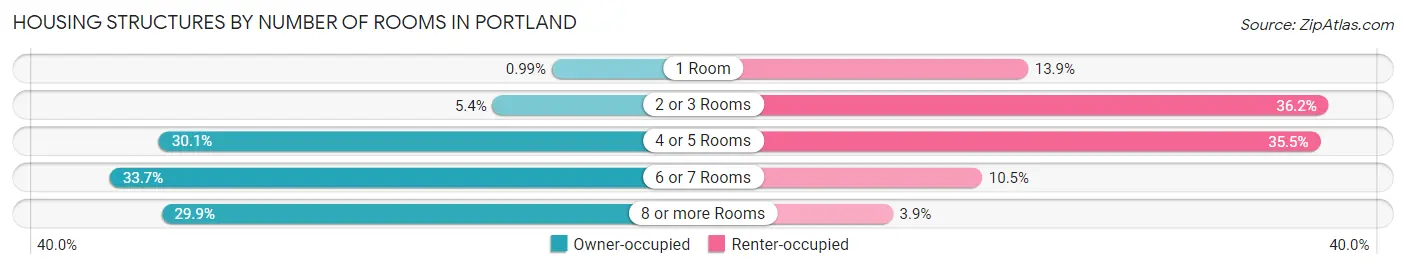
| Number of Rooms | Owner-occupied | Renter-occupied |
| 1 Room | 1,501 (1.0%) | 18,435 (13.9%) |
| 2 or 3 Rooms | 8,137 (5.4%) | 47,944 (36.1%) |
| 4 or 5 Rooms | 45,483 (30.1%) | 47,136 (35.5%) |
| 6 or 7 Rooms | 50,968 (33.7%) | 13,930 (10.5%) |
| 8 or more Rooms | 45,195 (29.9%) | 5,167 (3.9%) |
| Total | 151,284 (100.0%) | 132,612 (100.0%) |
Housing Structure by Heating Type in Portland
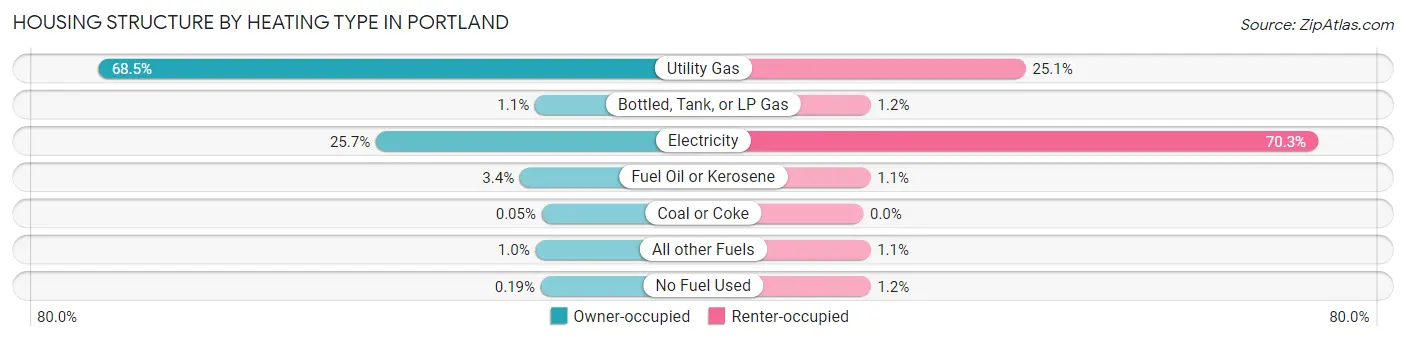
| Heating Type | Owner-occupied | Renter-occupied |
| Utility Gas | 103,695 (68.5%) | 33,317 (25.1%) |
| Bottled, Tank, or LP Gas | 1,665 (1.1%) | 1,565 (1.2%) |
| Electricity | 38,846 (25.7%) | 93,252 (70.3%) |
| Fuel Oil or Kerosene | 5,179 (3.4%) | 1,485 (1.1%) |
| Coal or Coke | 73 (0.1%) | 0 (0.0%) |
| All other Fuels | 1,546 (1.0%) | 1,466 (1.1%) |
| No Fuel Used | 280 (0.2%) | 1,527 (1.1%) |
| Total | 151,284 (100.0%) | 132,612 (100.0%) |
Household Vehicle Usage in Portland
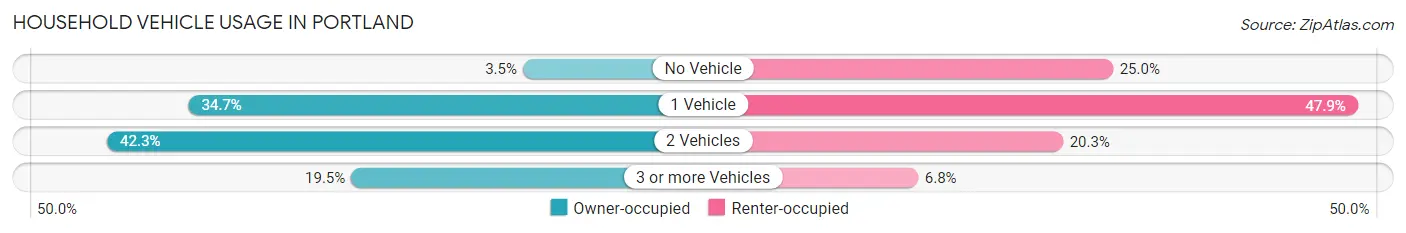
| Vehicles per Household | Owner-occupied | Renter-occupied |
| No Vehicle | 5,284 (3.5%) | 33,152 (25.0%) |
| 1 Vehicle | 52,498 (34.7%) | 63,469 (47.9%) |
| 2 Vehicles | 63,978 (42.3%) | 26,960 (20.3%) |
| 3 or more Vehicles | 29,524 (19.5%) | 9,031 (6.8%) |
| Total | 151,284 (100.0%) | 132,612 (100.0%) |
Real Estate & Mortgages in Portland
Real Estate and Mortgage Overview in Portland
| Characteristic | Without Mortgage | With Mortgage |
| Housing Units | 41,727 | 109,557 |
| Median Property Value | $499,700 | $530,900 |
| Median Household Income | $82,726 | $47,270 |
| Monthly Housing Costs | $838 | $29,384 |
| Real Estate Taxes | $5,517 | $952 |
Property Value by Mortgage Status in Portland
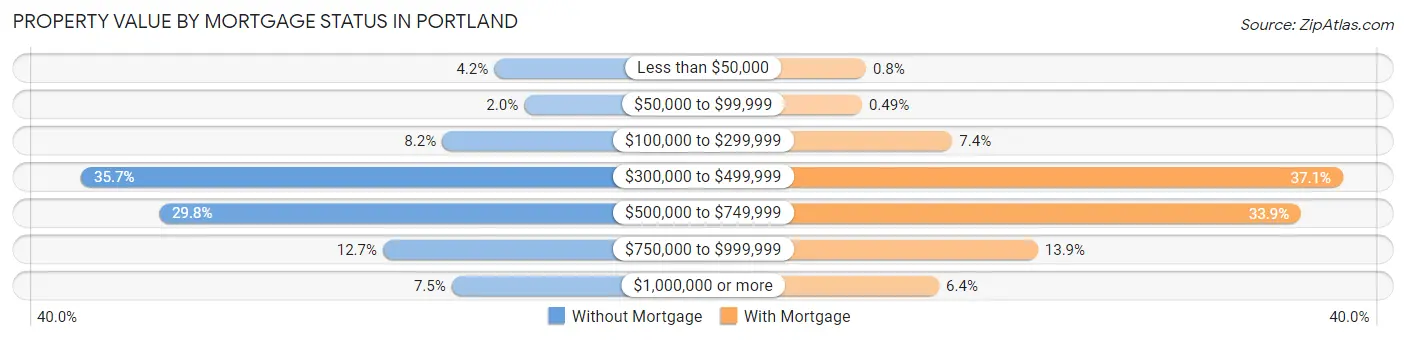
| Property Value | Without Mortgage | With Mortgage |
| Less than $50,000 | 1,763 (4.2%) | 876 (0.8%) |
| $50,000 to $99,999 | 813 (1.9%) | 538 (0.5%) |
| $100,000 to $299,999 | 3,421 (8.2%) | 8,088 (7.4%) |
| $300,000 to $499,999 | 14,893 (35.7%) | 40,676 (37.1%) |
| $500,000 to $749,999 | 12,418 (29.8%) | 37,187 (33.9%) |
| $750,000 to $999,999 | 5,304 (12.7%) | 15,215 (13.9%) |
| $1,000,000 or more | 3,115 (7.5%) | 6,977 (6.4%) |
| Total | 41,727 (100.0%) | 109,557 (100.0%) |
Household Income by Mortgage Status in Portland
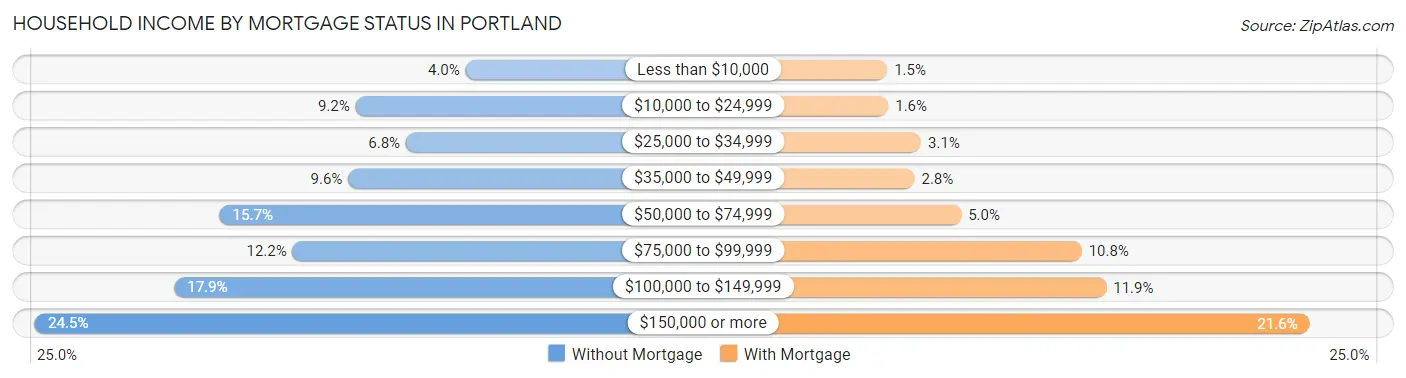
| Household Income | Without Mortgage | With Mortgage |
| Less than $10,000 | 1,667 (4.0%) | 1,655 (1.5%) |
| $10,000 to $24,999 | 3,855 (9.2%) | 1,712 (1.6%) |
| $25,000 to $34,999 | 2,855 (6.8%) | 3,413 (3.1%) |
| $35,000 to $49,999 | 4,003 (9.6%) | 3,084 (2.8%) |
| $50,000 to $74,999 | 6,557 (15.7%) | 5,510 (5.0%) |
| $75,000 to $99,999 | 5,108 (12.2%) | 11,802 (10.8%) |
| $100,000 to $149,999 | 7,458 (17.9%) | 13,079 (11.9%) |
| $150,000 or more | 10,224 (24.5%) | 23,687 (21.6%) |
| Total | 41,727 (100.0%) | 109,557 (100.0%) |
Property Value to Household Income Ratio in Portland
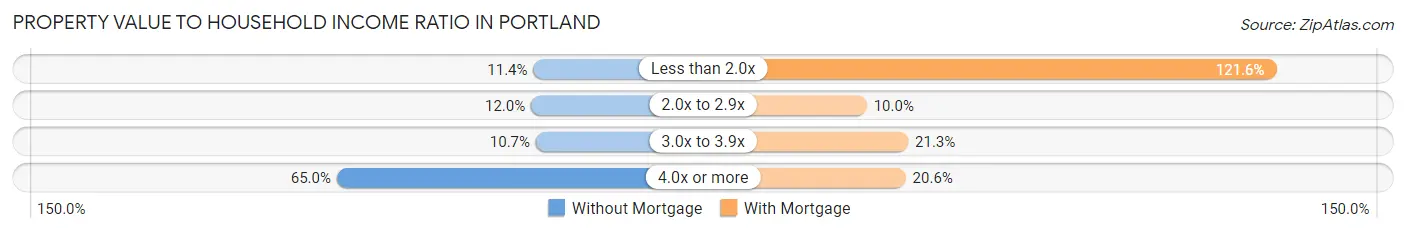
| Value-to-Income Ratio | Without Mortgage | With Mortgage |
| Less than 2.0x | 4,755 (11.4%) | 133,228 (121.6%) |
| 2.0x to 2.9x | 5,023 (12.0%) | 10,990 (10.0%) |
| 3.0x to 3.9x | 4,478 (10.7%) | 23,334 (21.3%) |
| 4.0x or more | 27,103 (64.9%) | 22,599 (20.6%) |
| Total | 41,727 (100.0%) | 109,557 (100.0%) |
Real Estate Taxes by Mortgage Status in Portland
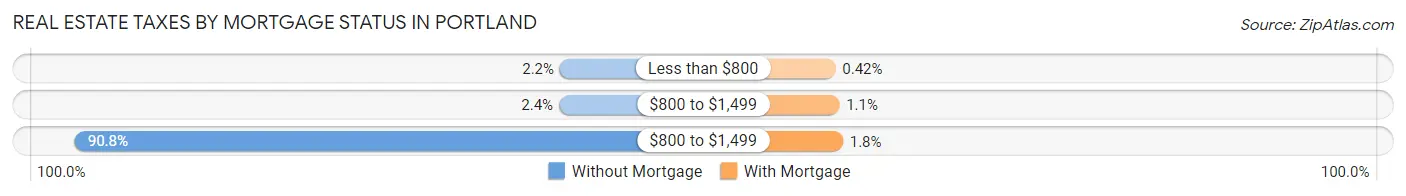
| Property Taxes | Without Mortgage | With Mortgage |
| Less than $800 | 930 (2.2%) | 458 (0.4%) |
| $800 to $1,499 | 1,001 (2.4%) | 1,240 (1.1%) |
| $800 to $1,499 | 37,896 (90.8%) | 1,952 (1.8%) |
| Total | 41,727 (100.0%) | 109,557 (100.0%) |
Health & Disability in Portland
Health Insurance Coverage by Age in Portland
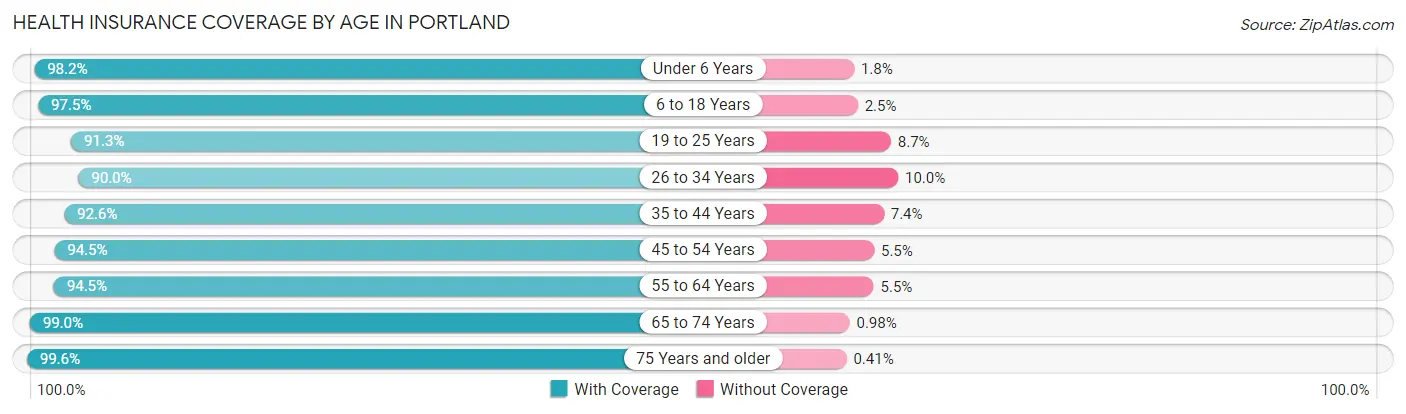
| Age Bracket | With Coverage | Without Coverage |
| Under 6 Years | 34,186 (98.2%) | 625 (1.8%) |
| 6 to 18 Years | 78,434 (97.5%) | 2,012 (2.5%) |
| 19 to 25 Years | 49,543 (91.3%) | 4,710 (8.7%) |
| 26 to 34 Years | 100,578 (90.0%) | 11,210 (10.0%) |
| 35 to 44 Years | 105,756 (92.6%) | 8,405 (7.4%) |
| 45 to 54 Years | 83,683 (94.5%) | 4,912 (5.5%) |
| 55 to 64 Years | 65,494 (94.5%) | 3,785 (5.5%) |
| 65 to 74 Years | 55,176 (99.0%) | 545 (1.0%) |
| 75 Years and older | 32,162 (99.6%) | 134 (0.4%) |
| Total | 605,012 (94.3%) | 36,338 (5.7%) |
Health Insurance Coverage by Citizenship Status in Portland
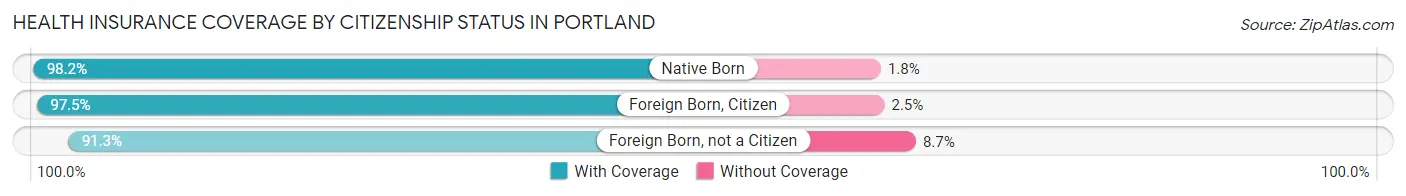
| Citizenship Status | With Coverage | Without Coverage |
| Native Born | 34,186 (98.2%) | 625 (1.8%) |
| Foreign Born, Citizen | 78,434 (97.5%) | 2,012 (2.5%) |
| Foreign Born, not a Citizen | 49,543 (91.3%) | 4,710 (8.7%) |
Health Insurance Coverage by Household Income in Portland
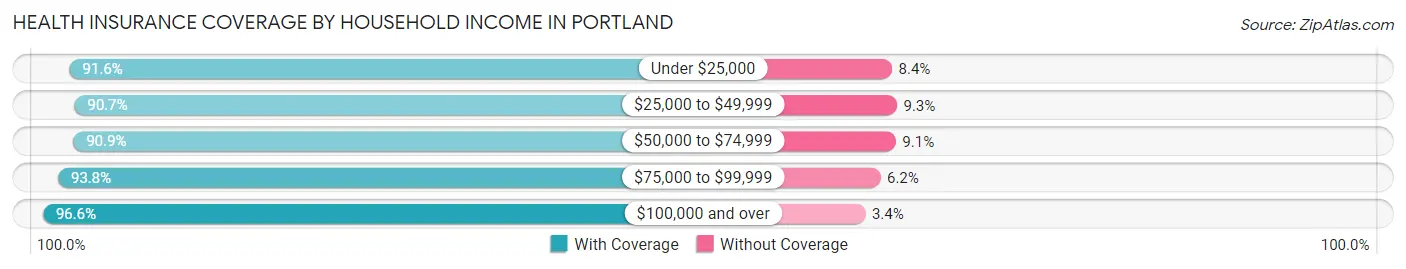
| Household Income | With Coverage | Without Coverage |
| Under $25,000 | 56,288 (91.6%) | 5,161 (8.4%) |
| $25,000 to $49,999 | 71,388 (90.7%) | 7,335 (9.3%) |
| $50,000 to $74,999 | 75,199 (90.9%) | 7,533 (9.1%) |
| $75,000 to $99,999 | 71,533 (93.8%) | 4,751 (6.2%) |
| $100,000 and over | 317,422 (96.6%) | 11,175 (3.4%) |
Public vs Private Health Insurance Coverage by Age in Portland
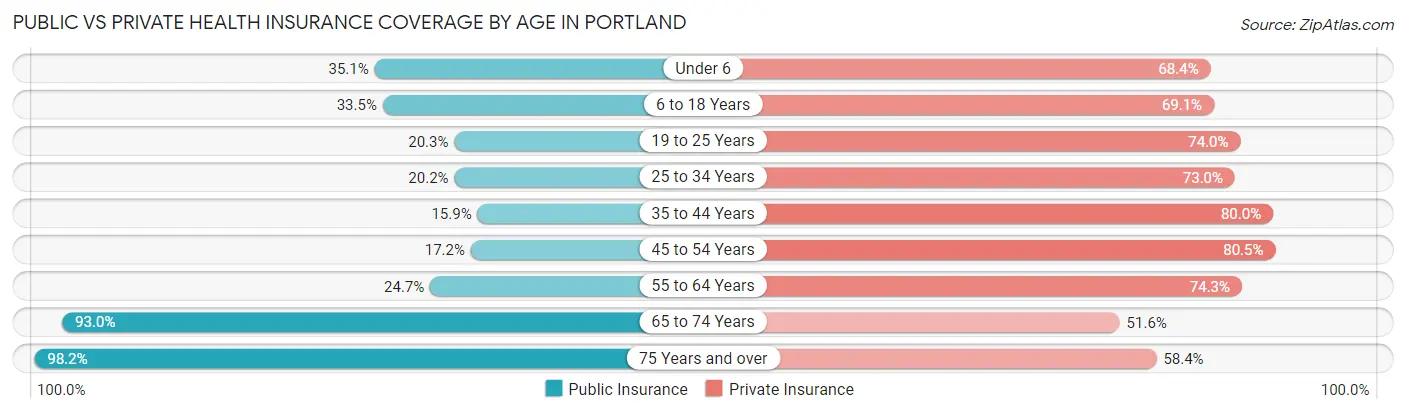
| Age Bracket | Public Insurance | Private Insurance |
| Under 6 | 12,201 (35.0%) | 23,820 (68.4%) |
| 6 to 18 Years | 26,974 (33.5%) | 55,566 (69.1%) |
| 19 to 25 Years | 10,988 (20.3%) | 40,131 (74.0%) |
| 25 to 34 Years | 22,602 (20.2%) | 81,547 (73.0%) |
| 35 to 44 Years | 18,194 (15.9%) | 91,365 (80.0%) |
| 45 to 54 Years | 15,223 (17.2%) | 71,274 (80.4%) |
| 55 to 64 Years | 17,135 (24.7%) | 51,442 (74.3%) |
| 65 to 74 Years | 51,844 (93.0%) | 28,738 (51.6%) |
| 75 Years and over | 31,713 (98.2%) | 18,861 (58.4%) |
| Total | 206,874 (32.3%) | 462,744 (72.2%) |
Disability Status by Sex by Age in Portland
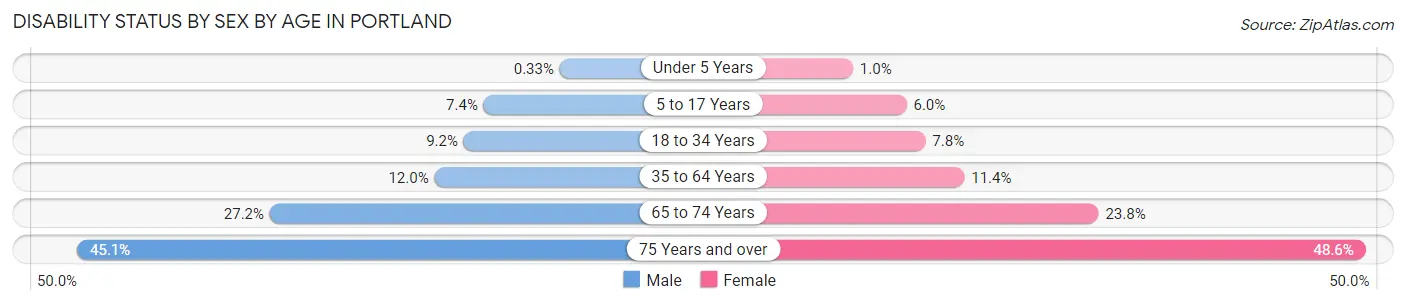
| Age Bracket | Male | Female |
| Under 5 Years | 49 (0.3%) | 143 (1.0%) |
| 5 to 17 Years | 3,012 (7.4%) | 2,329 (6.0%) |
| 18 to 34 Years | 7,796 (9.2%) | 6,883 (7.8%) |
| 35 to 64 Years | 16,722 (12.0%) | 15,034 (11.4%) |
| 65 to 74 Years | 7,133 (27.2%) | 7,034 (23.8%) |
| 75 Years and over | 5,909 (45.1%) | 9,335 (48.6%) |
Disability Class by Sex by Age in Portland
Disability Class: Hearing Difficulty
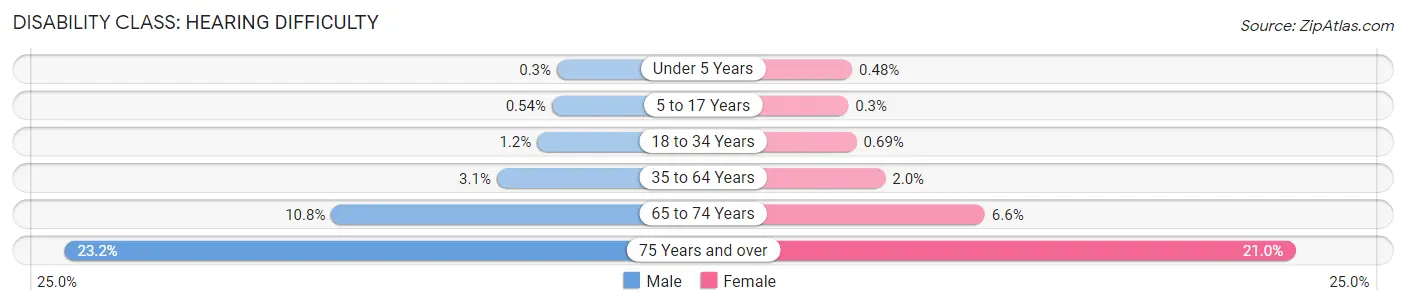
| Age Bracket | Male | Female |
| Under 5 Years | 44 (0.3%) | 67 (0.5%) |
| 5 to 17 Years | 221 (0.5%) | 115 (0.3%) |
| 18 to 34 Years | 1,027 (1.2%) | 613 (0.7%) |
| 35 to 64 Years | 4,322 (3.1%) | 2,665 (2.0%) |
| 65 to 74 Years | 2,821 (10.8%) | 1,961 (6.6%) |
| 75 Years and over | 3,031 (23.2%) | 4,039 (21.0%) |
Disability Class: Vision Difficulty
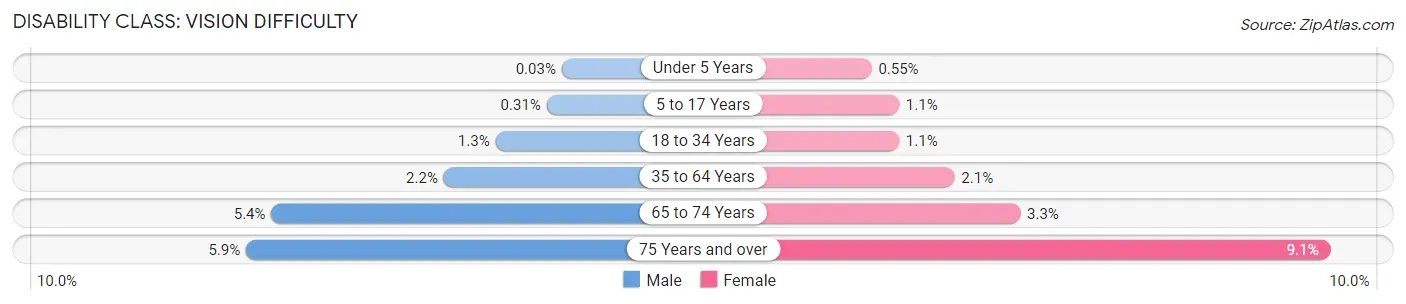
| Age Bracket | Male | Female |
| Under 5 Years | 5 (0.0%) | 76 (0.5%) |
| 5 to 17 Years | 126 (0.3%) | 410 (1.1%) |
| 18 to 34 Years | 1,065 (1.3%) | 941 (1.1%) |
| 35 to 64 Years | 3,109 (2.2%) | 2,768 (2.1%) |
| 65 to 74 Years | 1,419 (5.4%) | 977 (3.3%) |
| 75 Years and over | 771 (5.9%) | 1,741 (9.1%) |
Disability Class: Cognitive Difficulty
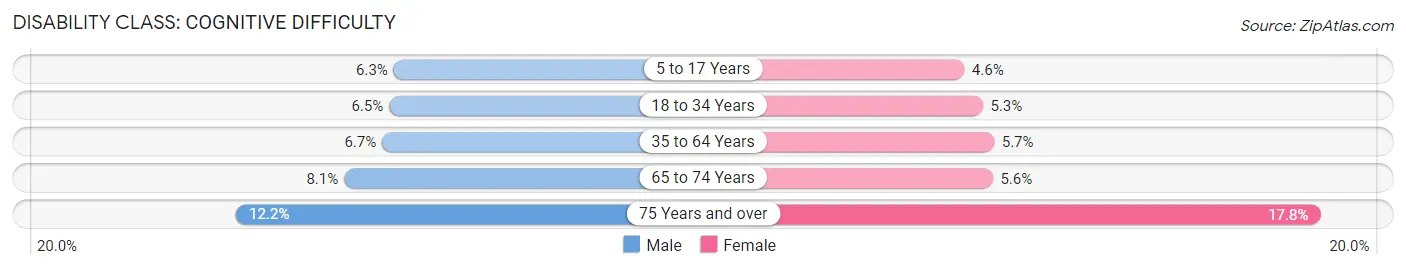
| Age Bracket | Male | Female |
| 5 to 17 Years | 2,566 (6.3%) | 1,770 (4.6%) |
| 18 to 34 Years | 5,456 (6.5%) | 4,664 (5.3%) |
| 35 to 64 Years | 9,412 (6.7%) | 7,511 (5.7%) |
| 65 to 74 Years | 2,131 (8.1%) | 1,664 (5.6%) |
| 75 Years and over | 1,591 (12.1%) | 3,411 (17.8%) |
Disability Class: Ambulatory Difficulty
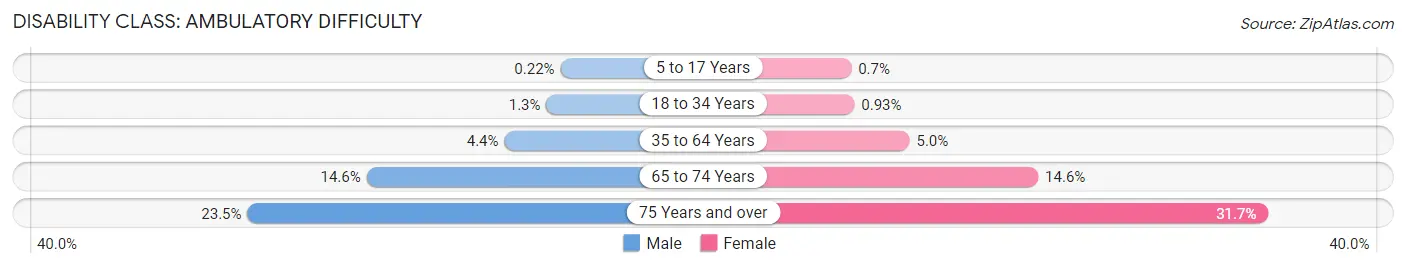
| Age Bracket | Male | Female |
| 5 to 17 Years | 91 (0.2%) | 271 (0.7%) |
| 18 to 34 Years | 1,066 (1.3%) | 824 (0.9%) |
| 35 to 64 Years | 6,126 (4.4%) | 6,646 (5.0%) |
| 65 to 74 Years | 3,825 (14.6%) | 4,307 (14.6%) |
| 75 Years and over | 3,071 (23.5%) | 6,081 (31.7%) |
Disability Class: Self-Care Difficulty
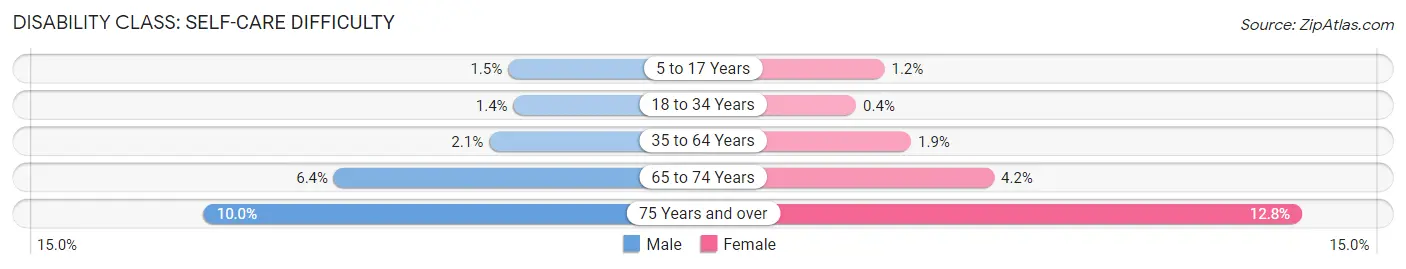
| Age Bracket | Male | Female |
| 5 to 17 Years | 628 (1.5%) | 460 (1.2%) |
| 18 to 34 Years | 1,174 (1.4%) | 355 (0.4%) |
| 35 to 64 Years | 2,890 (2.1%) | 2,546 (1.9%) |
| 65 to 74 Years | 1,673 (6.4%) | 1,252 (4.2%) |
| 75 Years and over | 1,310 (10.0%) | 2,460 (12.8%) |
Technology Access in Portland
Computing Device Access in Portland
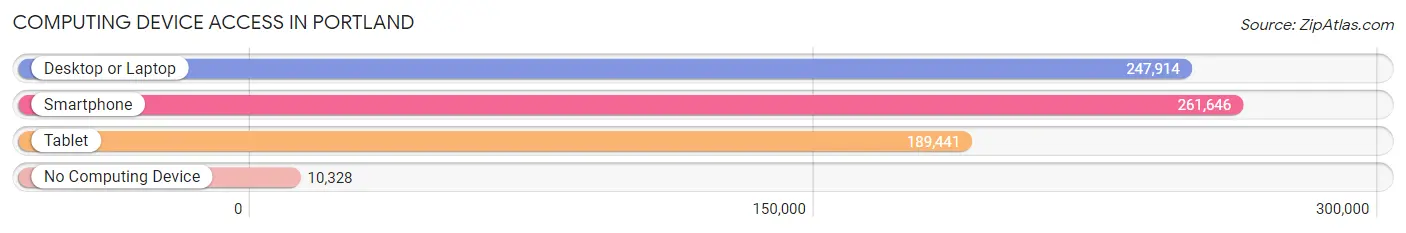
| Device Type | # Households | % Households |
| Desktop or Laptop | 247,914 | 87.3% |
| Smartphone | 261,646 | 92.2% |
| Tablet | 189,441 | 66.7% |
| No Computing Device | 10,328 | 3.6% |
| Total | 283,896 | 100.0% |
Internet Access in Portland
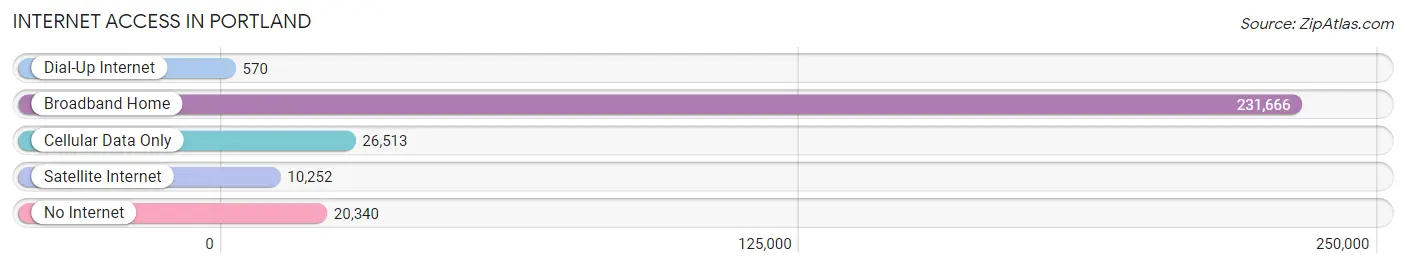
| Internet Type | # Households | % Households |
| Dial-Up Internet | 570 | 0.2% |
| Broadband Home | 231,666 | 81.6% |
| Cellular Data Only | 26,513 | 9.3% |
| Satellite Internet | 10,252 | 3.6% |
| No Internet | 20,340 | 7.2% |
| Total | 283,896 | 100.0% |
Portland Summary
Portland, Oregon is a city located in the Pacific Northwest region of the United States. It is the largest city in the state of Oregon and the county seat of Multnomah County. Portland is known for its vibrant culture, diverse population, and unique natural beauty.
Geography
Portland is located in the Willamette Valley, a region of the Pacific Northwest that is known for its lush green landscape and mild climate. The city is situated on the banks of the Willamette River, which flows through the city and divides it into east and west sections. The city is surrounded by the Cascade Mountains to the east and the Coast Range to the west. The city is also home to several parks and green spaces, including Forest Park, the largest urban park in the United States.
Climate
Portland has a mild climate, with warm summers and cool, wet winters. The average temperature in the summer is around 70 degrees Fahrenheit, while the average temperature in the winter is around 40 degrees Fahrenheit. The city receives an average of 37 inches of rain per year, with most of the rain falling between October and April.
Demographics
As of the 2010 census, Portland had a population of 583,776, making it the 25th largest city in the United States. The city is racially and ethnically diverse, with the largest racial groups being White (77.2%), African American (7.2%), Asian (6.2%), and Hispanic or Latino (5.7%). The median household income in Portland is $54,817, and the median age is 37.
Economy
Portland is a major economic center in the Pacific Northwest. The city is home to several Fortune 500 companies, including Nike, Intel, and Columbia Sportswear. The city is also a major hub for the technology industry, with many tech companies, such as Amazon, Oracle, and Salesforce, having a presence in the city. Additionally, Portland is home to several major universities, including Portland State University, the University of Portland, and Oregon Health & Science University.
The city is also a major tourist destination, with many attractions, such as the Portland Japanese Garden, the Oregon Zoo, and the International Rose Test Garden. Additionally, the city is home to several major sports teams, including the Portland Trail Blazers of the NBA, the Portland Timbers of MLS, and the Portland Thorns of the NWSL.
Conclusion
Portland, Oregon is a vibrant city with a diverse population, unique natural beauty, and a thriving economy. The city is home to several Fortune 500 companies, major universities, and popular tourist attractions. Additionally, the city is home to several major sports teams and is a major hub for the technology industry. Portland is a great place to live, work, and visit.
Common Questions
What is Per Capita Income in Portland?
Per Capita income in Portland is $52,577.
What is the Median Family Income in Portland?
Median Family Income in Portland is $116,103.
What is the Median Household income in Portland?
Median Household Income in Portland is $85,876.
What is Income or Wage Gap in Portland?
Income or Wage Gap in Portland is 16.6%.
Women in Portland earn 83.4 cents for every dollar earned by a man.
What is Family Income Deficit in Portland?
Family Income Deficit in Portland is $10,440.
Families that are below poverty line in Portland earn $10,440 less on average than the poverty threshold level.
What is Inequality or Gini Index in Portland?
Inequality or Gini Index in Portland is 0.47.
What is the Total Population of Portland?
Total Population of Portland is 646,101.
What is the Total Male Population of Portland?
Total Male Population of Portland is 321,981.
What is the Total Female Population of Portland?
Total Female Population of Portland is 324,120.
What is the Ratio of Males per 100 Females in Portland?
There are 99.34 Males per 100 Females in Portland.
What is the Ratio of Females per 100 Males in Portland?
There are 100.66 Females per 100 Males in Portland.
What is the Median Population Age in Portland?
Median Population Age in Portland is 38.3 Years.
What is the Average Family Size in Portland
Average Family Size in Portland is 2.9 People.
What is the Average Household Size in Portland
Average Household Size in Portland is 2.2 People.
How Large is the Labor Force in Portland?
There are 389,749 People in the Labor Forcein in Portland.
What is the Percentage of People in the Labor Force in Portland?
70.9% of People are in the Labor Force in Portland.
What is the Unemployment Rate in Portland?
Unemployment Rate in Portland is 5.6%.