Madison, WI Map & Demographics
Madison Map
Madison Overview
$46,652
PER CAPITA INCOME
$111,576
AVG FAMILY INCOME
$74,895
AVG HOUSEHOLD INCOME
20.6%
WAGE / INCOME GAP [ % ]
79.4¢/ $1
WAGE / INCOME GAP [ $ ]
$9,994
FAMILY INCOME DEFICIT
0.47
INEQUALITY / GINI INDEX
268,516
TOTAL POPULATION
134,672
MALE POPULATION
133,844
FEMALE POPULATION
100.62
MALES / 100 FEMALES
99.39
FEMALES / 100 MALES
31.6
MEDIAN AGE
2.9
AVG FAMILY SIZE
2.1
AVG HOUSEHOLD SIZE
161,229
LABOR FORCE [ PEOPLE ]
70.4%
PERCENT IN LABOR FORCE
2.6%
UNEMPLOYMENT RATE
Madison Zip Codes
Madison Area Codes
Income in Madison
Income Overview in Madison
Per Capita Income in Madison is $46,652, while median incomes of families and households are $111,576 and $74,895 respectively.
| Characteristic | Number | Measure |
| Per Capita Income | 268,516 | $46,652 |
| Median Family Income | 53,394 | $111,576 |
| Mean Family Income | 53,394 | $142,931 |
| Median Household Income | 120,509 | $74,895 |
| Mean Household Income | 120,509 | $102,296 |
| Income Deficit | 53,394 | $9,994 |
| Wage / Income Gap (%) | 268,516 | 20.55% |
| Wage / Income Gap ($) | 268,516 | 79.45¢ per $1 |
| Gini / Inequality Index | 268,516 | 0.47 |
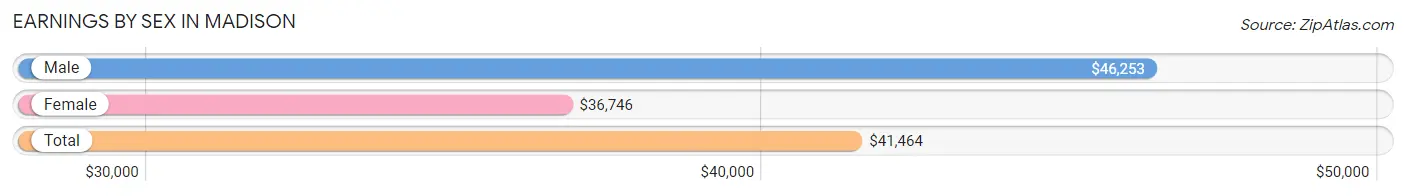
Earnings by Sex in Madison
Average Earnings in Madison are $41,464, $46,253 for men and $36,746 for women, a difference of 20.5%.
| Sex | Number | Average Earnings |
| Male | 90,732 (52.0%) | $46,253 |
| Female | 83,824 (48.0%) | $36,746 |
| Total | 174,556 (100.0%) | $41,464 |
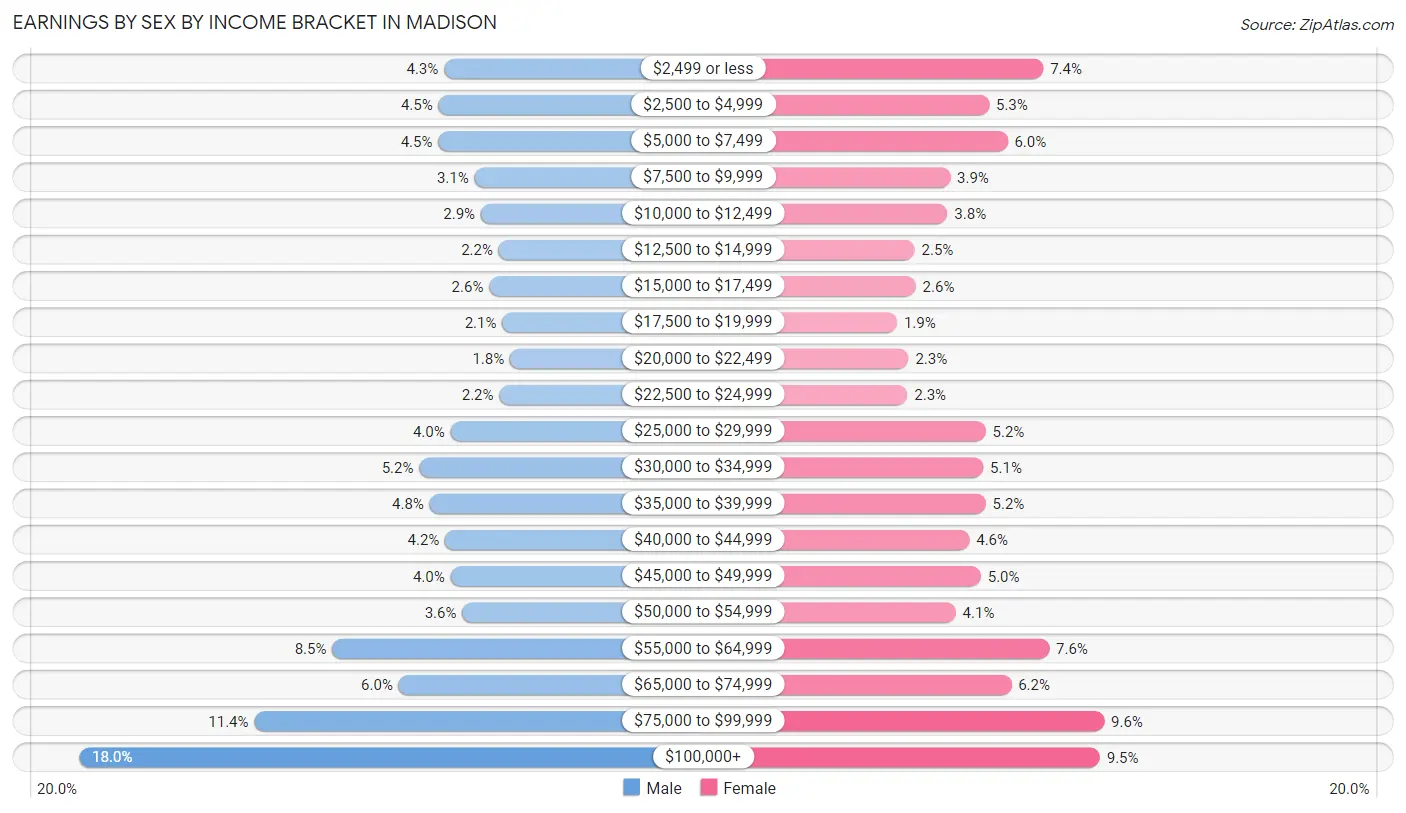
Earnings by Sex by Income Bracket in Madison
The most common earnings brackets in Madison are $100,000+ for men (16,298 | 18.0%) and $75,000 to $99,999 for women (8,078 | 9.6%).
| Income | Male | Female |
| $2,499 or less | 3,883 (4.3%) | 6,173 (7.4%) |
| $2,500 to $4,999 | 4,078 (4.5%) | 4,467 (5.3%) |
| $5,000 to $7,499 | 4,081 (4.5%) | 5,049 (6.0%) |
| $7,500 to $9,999 | 2,852 (3.1%) | 3,240 (3.9%) |
| $10,000 to $12,499 | 2,634 (2.9%) | 3,163 (3.8%) |
| $12,500 to $14,999 | 2,022 (2.2%) | 2,129 (2.5%) |
| $15,000 to $17,499 | 2,353 (2.6%) | 2,161 (2.6%) |
| $17,500 to $19,999 | 1,908 (2.1%) | 1,574 (1.9%) |
| $20,000 to $22,499 | 1,643 (1.8%) | 1,940 (2.3%) |
| $22,500 to $24,999 | 2,004 (2.2%) | 1,906 (2.3%) |
| $25,000 to $29,999 | 3,662 (4.0%) | 4,360 (5.2%) |
| $30,000 to $34,999 | 4,728 (5.2%) | 4,284 (5.1%) |
| $35,000 to $39,999 | 4,371 (4.8%) | 4,360 (5.2%) |
| $40,000 to $44,999 | 3,847 (4.2%) | 3,851 (4.6%) |
| $45,000 to $49,999 | 3,666 (4.0%) | 4,206 (5.0%) |
| $50,000 to $54,999 | 3,263 (3.6%) | 3,416 (4.1%) |
| $55,000 to $64,999 | 7,684 (8.5%) | 6,355 (7.6%) |
| $65,000 to $74,999 | 5,424 (6.0%) | 5,166 (6.2%) |
| $75,000 to $99,999 | 10,331 (11.4%) | 8,078 (9.6%) |
| $100,000+ | 16,298 (18.0%) | 7,946 (9.5%) |
| Total | 90,732 (100.0%) | 83,824 (100.0%) |
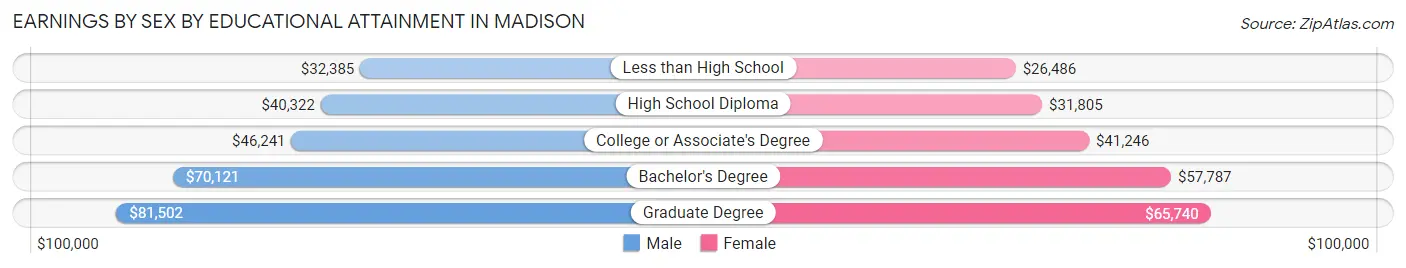
Earnings by Sex by Educational Attainment in Madison
Average earnings in Madison are $59,554 for men and $50,029 for women, a difference of 16.0%. Men with an educational attainment of graduate degree enjoy the highest average annual earnings of $81,502, while those with less than high school education earn the least with $32,385. Women with an educational attainment of graduate degree earn the most with the average annual earnings of $65,740, while those with less than high school education have the smallest earnings of $26,486.
| Educational Attainment | Male Income | Female Income |
| Less than High School | $32,385 | $26,486 |
| High School Diploma | $40,322 | $31,805 |
| College or Associate's Degree | $46,241 | $41,246 |
| Bachelor's Degree | $70,121 | $57,787 |
| Graduate Degree | $81,502 | $65,740 |
| Total | $59,554 | $50,029 |
Family Income in Madison
Family Income Brackets in Madison
According to the Madison family income data, there are 12,601 families falling into the $100,000 to $149,999 income range, which is the most common income bracket and makes up 23.6% of all families. Conversely, the $10,000 to $14,999 income bracket is the least frequent group with only 587 families (1.1%) belonging to this category.
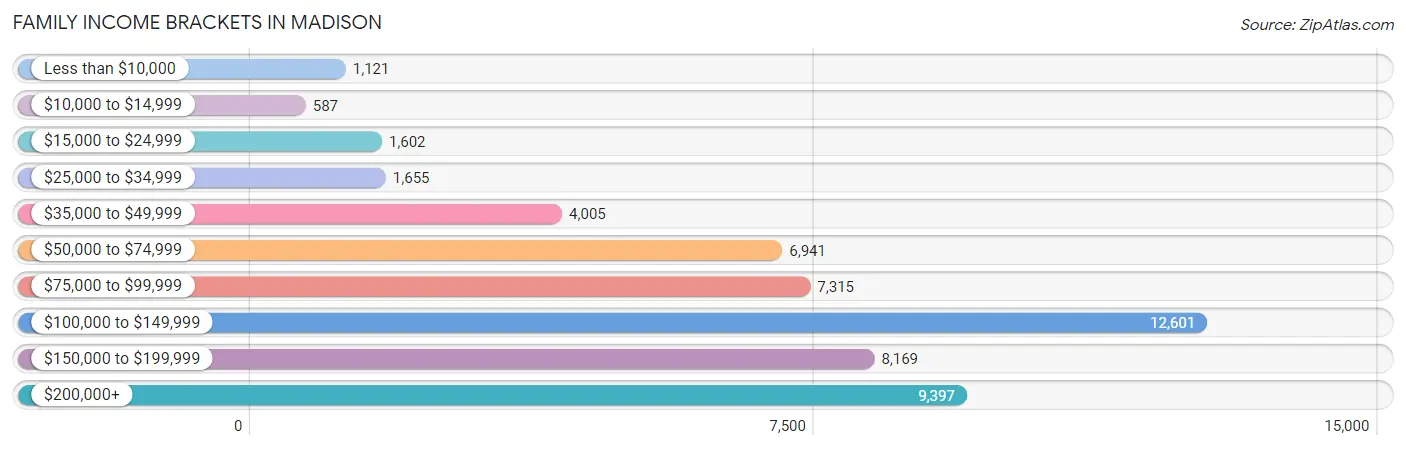
| Income Bracket | # Families | % Families |
| Less than $10,000 | 1,121 | 2.1% |
| $10,000 to $14,999 | 587 | 1.1% |
| $15,000 to $24,999 | 1,602 | 3.0% |
| $25,000 to $34,999 | 1,655 | 3.1% |
| $35,000 to $49,999 | 4,005 | 7.5% |
| $50,000 to $74,999 | 6,941 | 13.0% |
| $75,000 to $99,999 | 7,315 | 13.7% |
| $100,000 to $149,999 | 12,601 | 23.6% |
| $150,000 to $199,999 | 8,169 | 15.3% |
| $200,000+ | 9,397 | 17.6% |
Family Income by Famaliy Size in Madison
7+ person families (403 | 0.7%) account for the highest median family income in Madison with $250,001 per family, while 2-person families (28,652 | 53.7%) have the highest median income of $51,738 per family member.
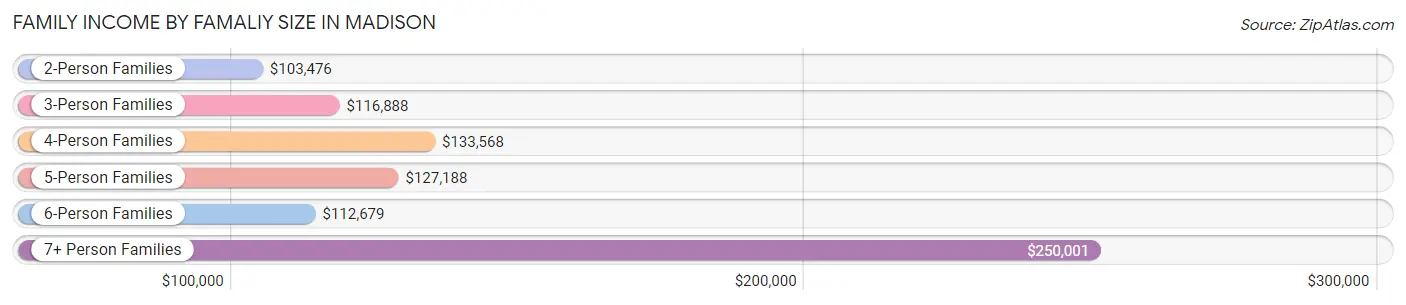
| Income Bracket | # Families | Median Income |
| 2-Person Families | 28,652 (53.7%) | $103,476 |
| 3-Person Families | 11,677 (21.9%) | $116,888 |
| 4-Person Families | 8,613 (16.1%) | $133,568 |
| 5-Person Families | 3,172 (5.9%) | $127,188 |
| 6-Person Families | 877 (1.6%) | $112,679 |
| 7+ Person Families | 403 (0.7%) | $250,001 |
| Total | 53,394 (100.0%) | $111,576 |
Family Income by Number of Earners in Madison
The median family income in Madison is $111,576, with families comprising 3+ earners (4,490) having the highest median family income of $148,915, while families with 1 earner (15,249) have the lowest median family income of $74,305, accounting for 8.4% and 28.6% of families, respectively.
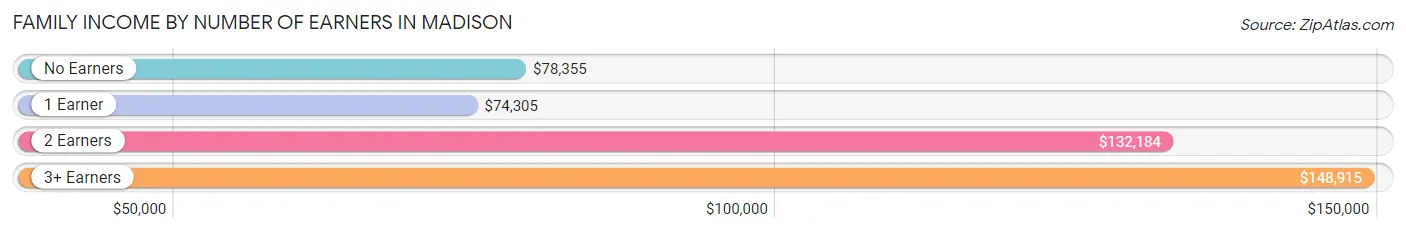
| Number of Earners | # Families | Median Income |
| No Earners | 6,830 (12.8%) | $78,355 |
| 1 Earner | 15,249 (28.6%) | $74,305 |
| 2 Earners | 26,825 (50.2%) | $132,184 |
| 3+ Earners | 4,490 (8.4%) | $148,915 |
| Total | 53,394 (100.0%) | $111,576 |
Household Income in Madison
Household Income Brackets in Madison
With 21,210 households falling in the category, the $100,000 to $149,999 income range is the most frequent in Madison, accounting for 17.6% of all households. In contrast, only 3,856 households (3.2%) fall into the $10,000 to $14,999 income bracket, making it the least populous group.
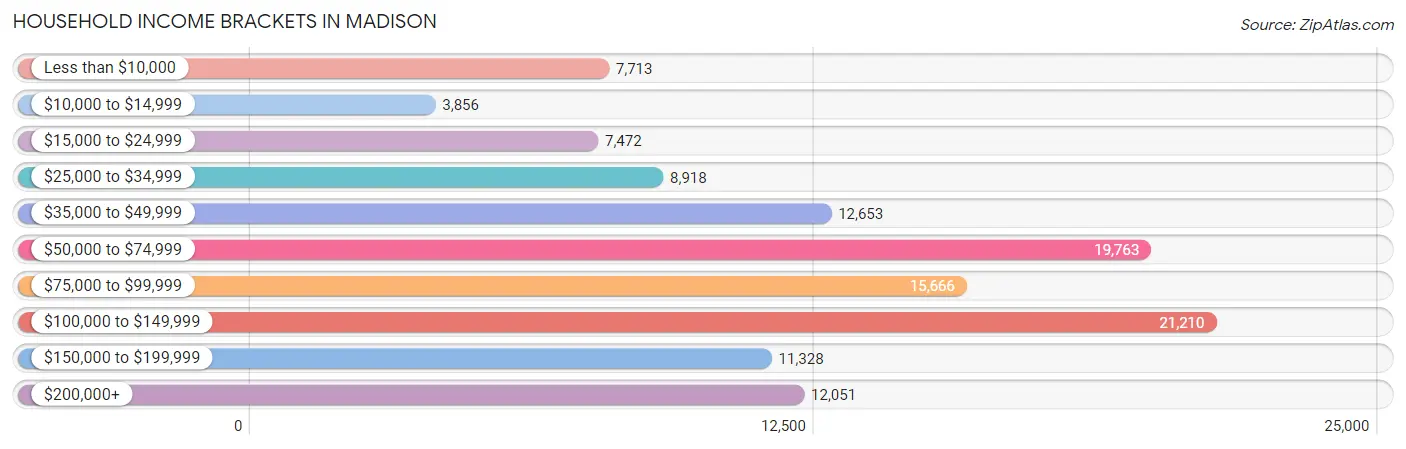
| Income Bracket | # Households | % Households |
| Less than $10,000 | 7,713 | 6.4% |
| $10,000 to $14,999 | 3,856 | 3.2% |
| $15,000 to $24,999 | 7,472 | 6.2% |
| $25,000 to $34,999 | 8,918 | 7.4% |
| $35,000 to $49,999 | 12,653 | 10.5% |
| $50,000 to $74,999 | 19,763 | 16.4% |
| $75,000 to $99,999 | 15,666 | 13.0% |
| $100,000 to $149,999 | 21,210 | 17.6% |
| $150,000 to $199,999 | 11,328 | 9.4% |
| $200,000+ | 12,051 | 10.0% |
Household Income by Householder Age in Madison
The median household income in Madison is $74,895, with the highest median household income of $93,320 found in the 45 to 64 years age bracket for the primary householder. A total of 31,278 households (26.0%) fall into this category. Meanwhile, the 15 to 24 years age bracket for the primary householder has the lowest median household income of $29,779, with 18,319 households (15.2%) in this group.
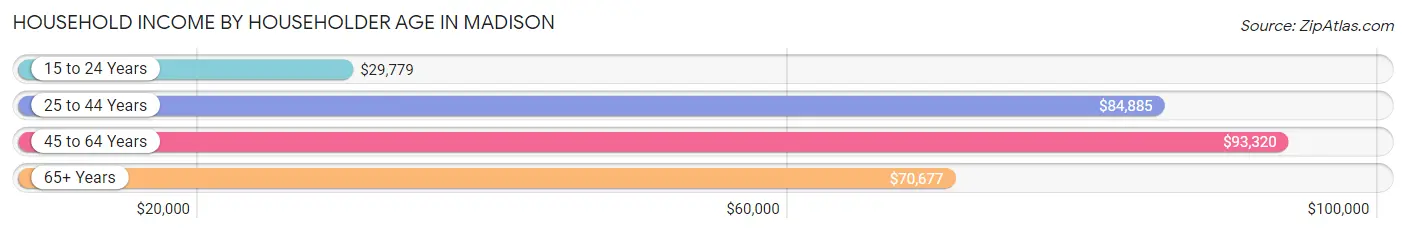
| Income Bracket | # Households | Median Income |
| 15 to 24 Years | 18,319 (15.2%) | $29,779 |
| 25 to 44 Years | 47,954 (39.8%) | $84,885 |
| 45 to 64 Years | 31,278 (26.0%) | $93,320 |
| 65+ Years | 22,958 (19.1%) | $70,677 |
| Total | 120,509 (100.0%) | $74,895 |
Poverty in Madison
Income Below Poverty by Sex and Age in Madison
With 16.0% poverty level for males and 17.7% for females among the residents of Madison, 18 to 24 year old males and 18 to 24 year old females are the most vulnerable to poverty, with 11,027 males (46.9%) and 13,019 females (56.3%) in their respective age groups living below the poverty level.
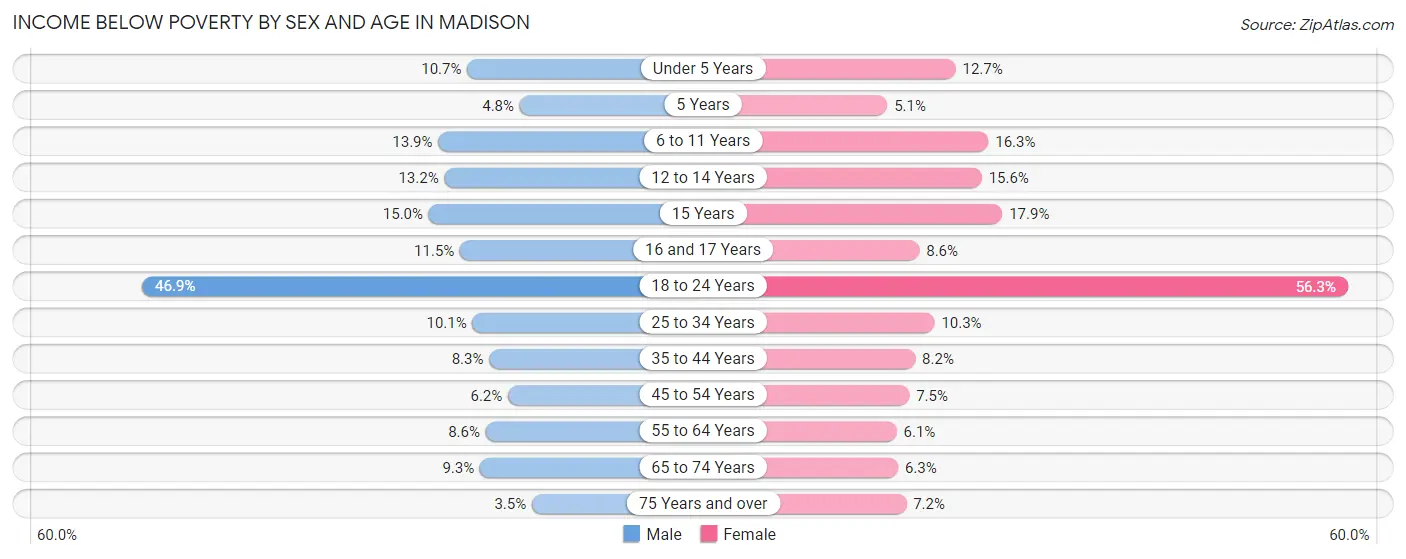
| Age Bracket | Male | Female |
| Under 5 Years | 734 (10.7%) | 809 (12.7%) |
| 5 Years | 66 (4.8%) | 48 (5.1%) |
| 6 to 11 Years | 944 (13.9%) | 1,170 (16.3%) |
| 12 to 14 Years | 456 (13.2%) | 623 (15.6%) |
| 15 Years | 179 (15.0%) | 213 (17.9%) |
| 16 and 17 Years | 228 (11.5%) | 163 (8.6%) |
| 18 to 24 Years | 11,027 (46.9%) | 13,019 (56.3%) |
| 25 to 34 Years | 2,712 (10.1%) | 2,361 (10.3%) |
| 35 to 44 Years | 1,406 (8.3%) | 1,326 (8.2%) |
| 45 to 54 Years | 811 (6.1%) | 933 (7.5%) |
| 55 to 64 Years | 1,044 (8.6%) | 804 (6.1%) |
| 65 to 74 Years | 885 (9.3%) | 684 (6.3%) |
| 75 Years and over | 196 (3.5%) | 544 (7.2%) |
| Total | 20,688 (16.0%) | 22,697 (17.7%) |
Income Above Poverty by Sex and Age in Madison
According to the poverty statistics in Madison, males aged 75 years and over and females aged 5 years are the age groups that are most secure financially, with 96.5% of males and 94.9% of females in these age groups living above the poverty line.
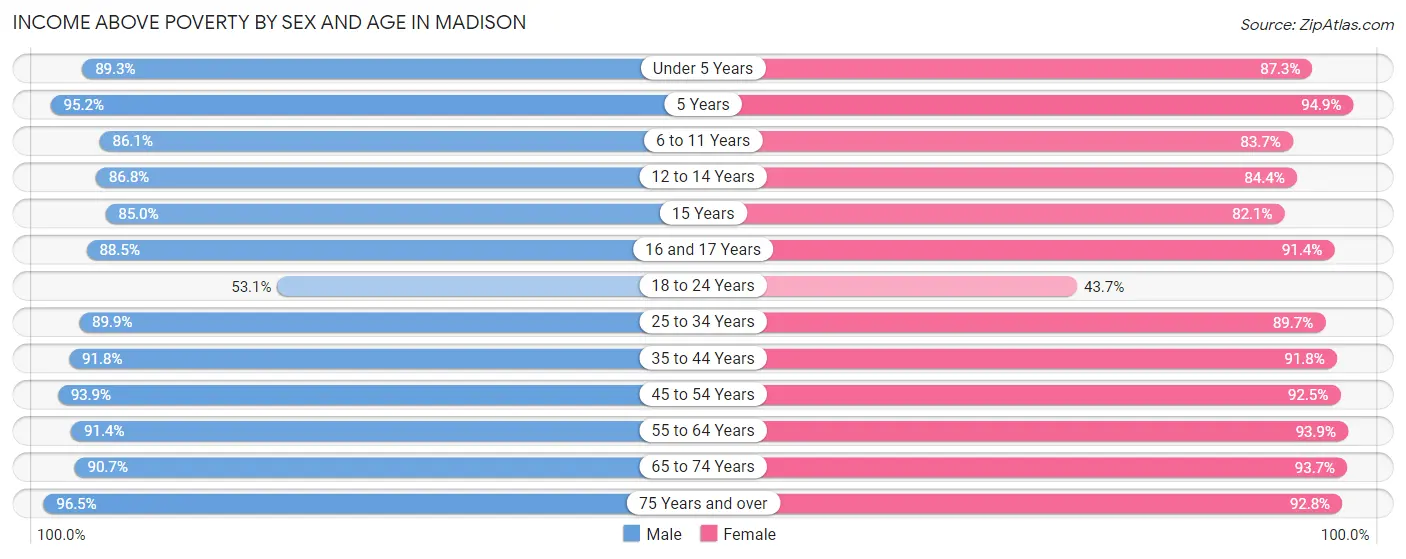
| Age Bracket | Male | Female |
| Under 5 Years | 6,123 (89.3%) | 5,576 (87.3%) |
| 5 Years | 1,299 (95.2%) | 900 (94.9%) |
| 6 to 11 Years | 5,838 (86.1%) | 5,997 (83.7%) |
| 12 to 14 Years | 2,989 (86.8%) | 3,376 (84.4%) |
| 15 Years | 1,016 (85.0%) | 979 (82.1%) |
| 16 and 17 Years | 1,756 (88.5%) | 1,725 (91.4%) |
| 18 to 24 Years | 12,481 (53.1%) | 10,087 (43.7%) |
| 25 to 34 Years | 24,105 (89.9%) | 20,511 (89.7%) |
| 35 to 44 Years | 15,636 (91.7%) | 14,901 (91.8%) |
| 45 to 54 Years | 12,382 (93.9%) | 11,488 (92.5%) |
| 55 to 64 Years | 11,045 (91.4%) | 12,372 (93.9%) |
| 65 to 74 Years | 8,653 (90.7%) | 10,238 (93.7%) |
| 75 Years and over | 5,427 (96.5%) | 7,039 (92.8%) |
| Total | 108,750 (84.0%) | 105,189 (82.3%) |
Income Below Poverty Among Married-Couple Families in Madison
The poverty statistics for married-couple families in Madison show that 2.4% or 969 of the total 41,295 families live below the poverty line. Families with 5 or more children have the highest poverty rate of 30.1%, comprising of 52 families. On the other hand, families with no children have the lowest poverty rate of 1.5%, which includes 382 families.
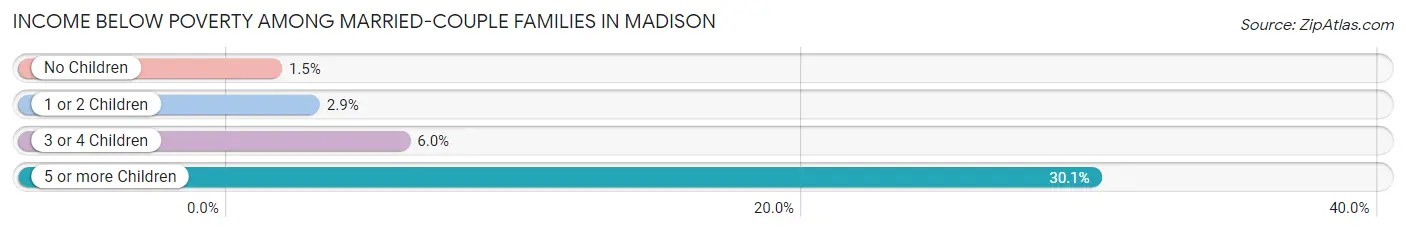
| Children | Above Poverty | Below Poverty |
| No Children | 24,539 (98.5%) | 382 (1.5%) |
| 1 or 2 Children | 13,473 (97.2%) | 395 (2.9%) |
| 3 or 4 Children | 2,193 (94.0%) | 140 (6.0%) |
| 5 or more Children | 121 (69.9%) | 52 (30.1%) |
| Total | 40,326 (97.7%) | 969 (2.4%) |
Income Below Poverty Among Single-Parent Households in Madison
According to the poverty data in Madison, 16.5% or 603 single-father households and 19.2% or 1,616 single-mother households are living below the poverty line. Among single-father households, those with 5 or more children have the highest poverty rate, with 21 households (100.0%) experiencing poverty. Likewise, among single-mother households, those with 5 or more children have the highest poverty rate, with 27 households (81.8%) falling below the poverty line.
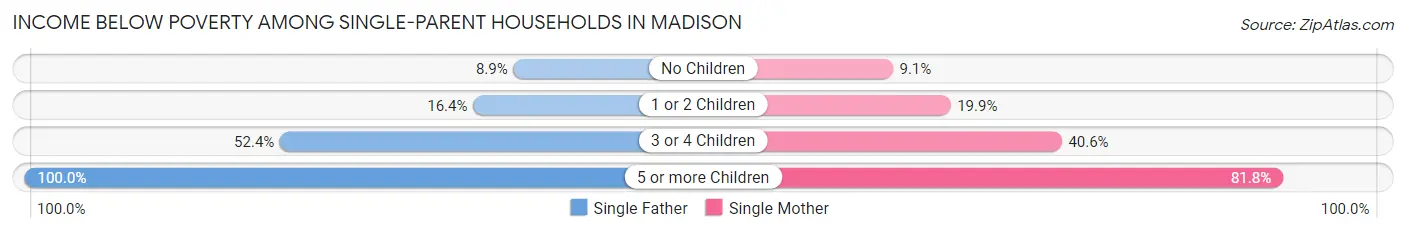
| Children | Single Father | Single Mother |
| No Children | 108 (8.9%) | 248 (9.1%) |
| 1 or 2 Children | 365 (16.4%) | 922 (19.9%) |
| 3 or 4 Children | 109 (52.4%) | 419 (40.6%) |
| 5 or more Children | 21 (100.0%) | 27 (81.8%) |
| Total | 603 (16.5%) | 1,616 (19.2%) |
Income Below Poverty Among Married-Couple vs Single-Parent Households in Madison
The poverty data for Madison shows that 969 of the married-couple family households (2.4%) and 2,219 of the single-parent households (18.3%) are living below the poverty level. Within the married-couple family households, those with 5 or more children have the highest poverty rate, with 52 households (30.1%) falling below the poverty line. Among the single-parent households, those with 5 or more children have the highest poverty rate, with 48 household (88.9%) living below poverty.
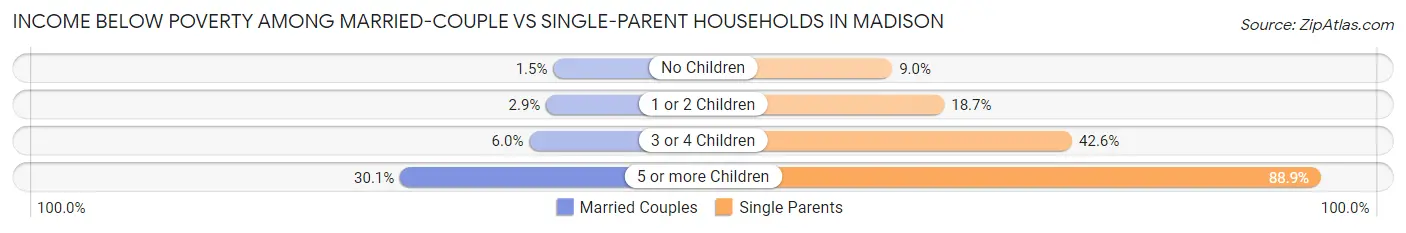
| Children | Married-Couple Families | Single-Parent Households |
| No Children | 382 (1.5%) | 356 (9.0%) |
| 1 or 2 Children | 395 (2.9%) | 1,287 (18.7%) |
| 3 or 4 Children | 140 (6.0%) | 528 (42.5%) |
| 5 or more Children | 52 (30.1%) | 48 (88.9%) |
| Total | 969 (2.4%) | 2,219 (18.3%) |
Race in Madison
The most populous races in Madison are White / Caucasian (200,384 | 74.6%), Asian (22,519 | 8.4%), and Hispanic or Latino (20,976 | 7.8%).
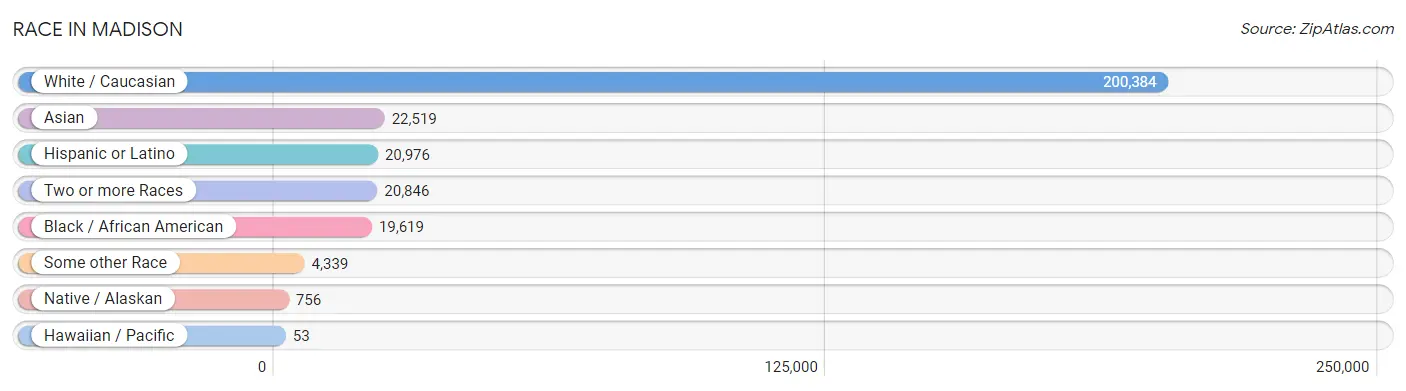
| Race | # Population | % Population |
| Asian | 22,519 | 8.4% |
| Black / African American | 19,619 | 7.3% |
| Hawaiian / Pacific | 53 | 0.0% |
| Hispanic or Latino | 20,976 | 7.8% |
| Native / Alaskan | 756 | 0.3% |
| White / Caucasian | 200,384 | 74.6% |
| Two or more Races | 20,846 | 7.8% |
| Some other Race | 4,339 | 1.6% |
| Total | 268,516 | 100.0% |
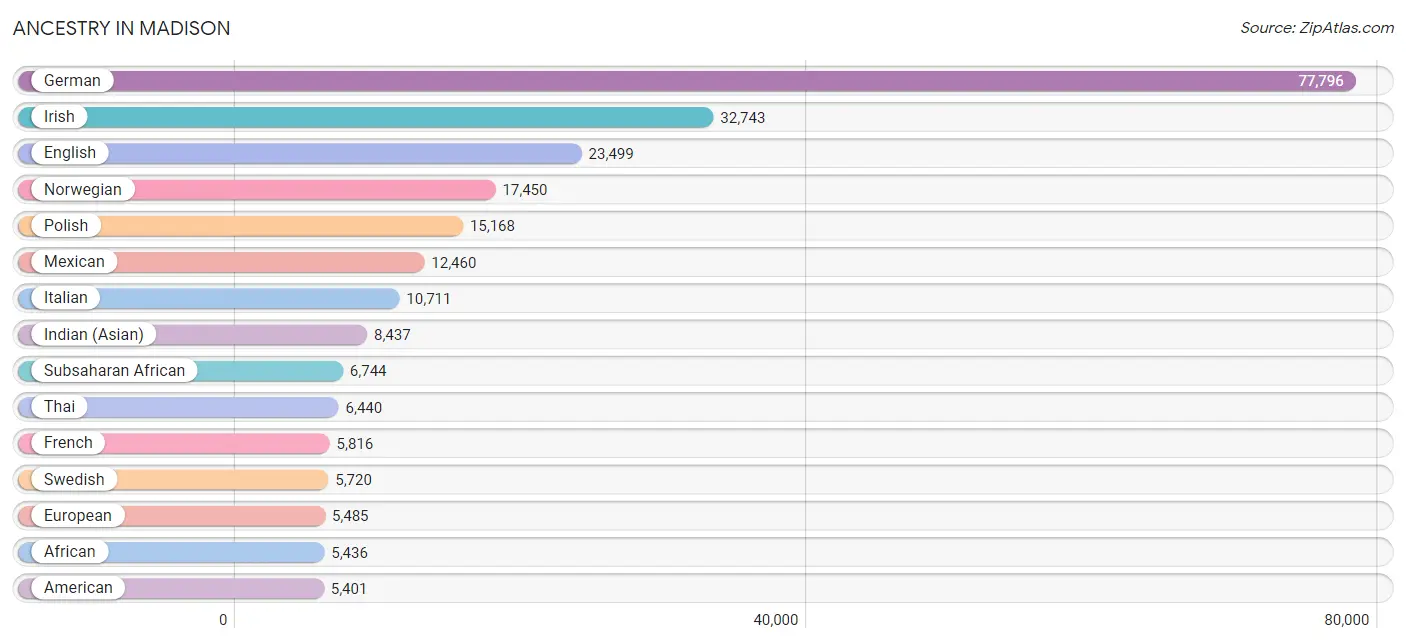
Ancestry in Madison
The most populous ancestries reported in Madison are German (77,796 | 29.0%), Irish (32,743 | 12.2%), English (23,499 | 8.7%), Norwegian (17,450 | 6.5%), and Polish (15,168 | 5.7%), together accounting for 62.1% of all Madison residents.
| Ancestry | # Population | % Population |
| Afghan | 33 | 0.0% |
| African | 5,436 | 2.0% |
| Albanian | 151 | 0.1% |
| Aleut | 11 | 0.0% |
| American | 5,401 | 2.0% |
| Apache | 89 | 0.0% |
| Arab | 1,671 | 0.6% |
| Argentinean | 396 | 0.2% |
| Armenian | 64 | 0.0% |
| Assyrian / Chaldean / Syriac | 8 | 0.0% |
| Australian | 74 | 0.0% |
| Austrian | 768 | 0.3% |
| Bahamian | 71 | 0.0% |
| Bangladeshi | 2,516 | 0.9% |
| Barbadian | 25 | 0.0% |
| Basque | 38 | 0.0% |
| Belgian | 759 | 0.3% |
| Belizean | 27 | 0.0% |
| Bhutanese | 1,274 | 0.5% |
| Bolivian | 35 | 0.0% |
| Brazilian | 339 | 0.1% |
| British | 2,115 | 0.8% |
| Bulgarian | 80 | 0.0% |
| Burmese | 2,061 | 0.8% |
| Cajun | 18 | 0.0% |
| Cambodian | 59 | 0.0% |
| Canadian | 489 | 0.2% |
| Cape Verdean | 9 | 0.0% |
| Celtic | 27 | 0.0% |
| Central American | 1,229 | 0.5% |
| Central American Indian | 81 | 0.0% |
| Cherokee | 463 | 0.2% |
| Cheyenne | 2 | 0.0% |
| Chickasaw | 235 | 0.1% |
| Chilean | 122 | 0.1% |
| Chinese | 15 | 0.0% |
| Chippewa | 444 | 0.2% |
| Choctaw | 27 | 0.0% |
| Colombian | 1,199 | 0.4% |
| Costa Rican | 173 | 0.1% |
| Creek | 5 | 0.0% |
| Croatian | 617 | 0.2% |
| Crow | 1 | 0.0% |
| Cuban | 466 | 0.2% |
| Cypriot | 6 | 0.0% |
| Czech | 3,051 | 1.1% |
| Czechoslovakian | 320 | 0.1% |
| Danish | 2,082 | 0.8% |
| Delaware | 4 | 0.0% |
| Dominican | 194 | 0.1% |
| Dutch | 4,728 | 1.8% |
| Eastern European | 1,365 | 0.5% |
| Ecuadorian | 143 | 0.1% |
| Egyptian | 354 | 0.1% |
| English | 23,499 | 8.7% |
| Estonian | 18 | 0.0% |
| Ethiopian | 86 | 0.0% |
| European | 5,485 | 2.0% |
| Fijian | 9 | 0.0% |
| Filipino | 538 | 0.2% |
| Finnish | 1,172 | 0.4% |
| French | 5,816 | 2.2% |
| French Canadian | 1,197 | 0.4% |
| German | 77,796 | 29.0% |
| German Russian | 77 | 0.0% |
| Ghanaian | 88 | 0.0% |
| Greek | 1,118 | 0.4% |
| Guamanian / Chamorro | 19 | 0.0% |
| Guatemalan | 295 | 0.1% |
| Guyanese | 116 | 0.0% |
| Haitian | 131 | 0.1% |
| Honduran | 208 | 0.1% |
| Hopi | 9 | 0.0% |
| Hungarian | 1,094 | 0.4% |
| Icelander | 82 | 0.0% |
| Indian (Asian) | 8,437 | 3.1% |
| Indonesian | 68 | 0.0% |
| Inupiat | 22 | 0.0% |
| Iranian | 519 | 0.2% |
| Iraqi | 53 | 0.0% |
| Irish | 32,743 | 12.2% |
| Iroquois | 81 | 0.0% |
| Israeli | 128 | 0.1% |
| Italian | 10,711 | 4.0% |
| Jamaican | 289 | 0.1% |
| Japanese | 328 | 0.1% |
| Jordanian | 85 | 0.0% |
| Kenyan | 6 | 0.0% |
| Korean | 1,581 | 0.6% |
| Laotian | 188 | 0.1% |
| Latvian | 113 | 0.0% |
| Lebanese | 229 | 0.1% |
| Liberian | 231 | 0.1% |
| Lithuanian | 1,077 | 0.4% |
| Lumbee | 12 | 0.0% |
| Luxembourger | 340 | 0.1% |
| Macedonian | 69 | 0.0% |
| Malaysian | 682 | 0.3% |
| Menominee | 153 | 0.1% |
| Mexican | 12,460 | 4.6% |
| Mexican American Indian | 186 | 0.1% |
| Mongolian | 56 | 0.0% |
| Native Hawaiian | 159 | 0.1% |
| Navajo | 14 | 0.0% |
| New Zealander | 11 | 0.0% |
| Nicaraguan | 456 | 0.2% |
| Nigerian | 322 | 0.1% |
| Northern European | 986 | 0.4% |
| Norwegian | 17,450 | 6.5% |
| Okinawan | 13 | 0.0% |
| Osage | 5 | 0.0% |
| Ottawa | 27 | 0.0% |
| Pakistani | 404 | 0.2% |
| Palestinian | 181 | 0.1% |
| Panamanian | 21 | 0.0% |
| Pennsylvania German | 39 | 0.0% |
| Peruvian | 204 | 0.1% |
| Polish | 15,168 | 5.7% |
| Portuguese | 431 | 0.2% |
| Potawatomi | 60 | 0.0% |
| Pueblo | 225 | 0.1% |
| Puerto Rican | 2,029 | 0.8% |
| Romanian | 449 | 0.2% |
| Russian | 2,638 | 1.0% |
| Salvadoran | 76 | 0.0% |
| Samoan | 79 | 0.0% |
| Scandinavian | 1,277 | 0.5% |
| Scotch-Irish | 1,468 | 0.5% |
| Scottish | 4,831 | 1.8% |
| Senegalese | 126 | 0.1% |
| Serbian | 203 | 0.1% |
| Sioux | 52 | 0.0% |
| Slavic | 325 | 0.1% |
| Slovak | 632 | 0.2% |
| Slovene | 299 | 0.1% |
| Somali | 105 | 0.0% |
| South African | 51 | 0.0% |
| South American | 3,120 | 1.2% |
| South American Indian | 54 | 0.0% |
| Spaniard | 825 | 0.3% |
| Spanish | 270 | 0.1% |
| Sri Lankan | 1,260 | 0.5% |
| Subsaharan African | 6,744 | 2.5% |
| Sudanese | 40 | 0.0% |
| Swedish | 5,720 | 2.1% |
| Swiss | 3,479 | 1.3% |
| Syrian | 62 | 0.0% |
| Taiwanese | 16 | 0.0% |
| Thai | 6,440 | 2.4% |
| Turkish | 274 | 0.1% |
| Ukrainian | 839 | 0.3% |
| Uruguayan | 365 | 0.1% |
| Venezuelan | 641 | 0.2% |
| Vietnamese | 169 | 0.1% |
| Welsh | 1,815 | 0.7% |
| West Indian | 76 | 0.0% |
| Yugoslavian | 72 | 0.0% |
| Zimbabwean | 6 | 0.0% | View All 158 Rows |
Immigrants in Madison
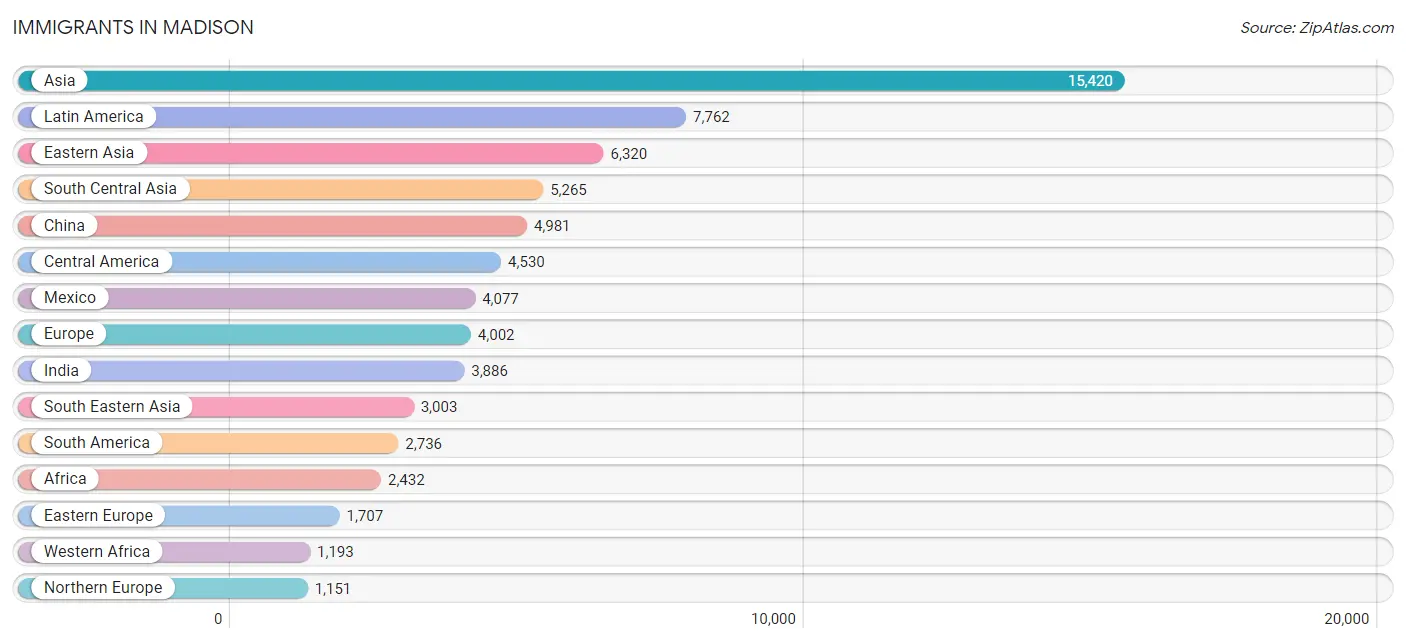
The most numerous immigrant groups reported in Madison came from Asia (15,420 | 5.7%), Latin America (7,762 | 2.9%), Eastern Asia (6,320 | 2.4%), South Central Asia (5,265 | 2.0%), and China (4,981 | 1.9%), together accounting for 14.8% of all Madison residents.
| Immigration Origin | # Population | % Population |
| Afghanistan | 33 | 0.0% |
| Africa | 2,432 | 0.9% |
| Albania | 9 | 0.0% |
| Argentina | 308 | 0.1% |
| Asia | 15,420 | 5.7% |
| Australia | 99 | 0.0% |
| Austria | 51 | 0.0% |
| Bahamas | 39 | 0.0% |
| Bangladesh | 209 | 0.1% |
| Barbados | 64 | 0.0% |
| Belarus | 73 | 0.0% |
| Belgium | 56 | 0.0% |
| Bolivia | 49 | 0.0% |
| Bosnia and Herzegovina | 24 | 0.0% |
| Brazil | 423 | 0.2% |
| Bulgaria | 38 | 0.0% |
| Cambodia | 159 | 0.1% |
| Cameroon | 131 | 0.1% |
| Canada | 694 | 0.3% |
| Caribbean | 496 | 0.2% |
| Central America | 4,530 | 1.7% |
| Chile | 66 | 0.0% |
| China | 4,981 | 1.9% |
| Colombia | 864 | 0.3% |
| Cuba | 132 | 0.1% |
| Czechoslovakia | 72 | 0.0% |
| Denmark | 50 | 0.0% |
| Dominican Republic | 35 | 0.0% |
| Eastern Africa | 270 | 0.1% |
| Eastern Asia | 6,320 | 2.4% |
| Eastern Europe | 1,707 | 0.6% |
| Ecuador | 55 | 0.0% |
| Egypt | 184 | 0.1% |
| El Salvador | 6 | 0.0% |
| England | 371 | 0.1% |
| Eritrea | 8 | 0.0% |
| Ethiopia | 67 | 0.0% |
| Europe | 4,002 | 1.5% |
| France | 95 | 0.0% |
| Germany | 366 | 0.1% |
| Ghana | 69 | 0.0% |
| Greece | 90 | 0.0% |
| Guatemala | 200 | 0.1% |
| Guyana | 82 | 0.0% |
| Haiti | 95 | 0.0% |
| Honduras | 120 | 0.0% |
| Hong Kong | 133 | 0.1% |
| Hungary | 30 | 0.0% |
| India | 3,886 | 1.5% |
| Indonesia | 130 | 0.1% |
| Iran | 305 | 0.1% |
| Iraq | 82 | 0.0% |
| Ireland | 39 | 0.0% |
| Israel | 61 | 0.0% |
| Italy | 191 | 0.1% |
| Jamaica | 131 | 0.1% |
| Japan | 441 | 0.2% |
| Jordan | 123 | 0.1% |
| Kazakhstan | 5 | 0.0% |
| Kenya | 47 | 0.0% |
| Korea | 839 | 0.3% |
| Kuwait | 52 | 0.0% |
| Laos | 733 | 0.3% |
| Latin America | 7,762 | 2.9% |
| Latvia | 29 | 0.0% |
| Lebanon | 10 | 0.0% |
| Liberia | 200 | 0.1% |
| Lithuania | 8 | 0.0% |
| Malaysia | 267 | 0.1% |
| Mexico | 4,077 | 1.5% |
| Middle Africa | 188 | 0.1% |
| Moldova | 32 | 0.0% |
| Morocco | 19 | 0.0% |
| Nepal | 238 | 0.1% |
| Netherlands | 16 | 0.0% |
| Nicaragua | 81 | 0.0% |
| Nigeria | 84 | 0.0% |
| Northern Africa | 372 | 0.1% |
| Northern Europe | 1,151 | 0.4% |
| Oceania | 124 | 0.1% |
| Pakistan | 293 | 0.1% |
| Panama | 46 | 0.0% |
| Peru | 128 | 0.1% |
| Philippines | 506 | 0.2% |
| Poland | 533 | 0.2% |
| Portugal | 16 | 0.0% |
| Romania | 142 | 0.1% |
| Russia | 478 | 0.2% |
| Saudi Arabia | 63 | 0.0% |
| Scotland | 172 | 0.1% |
| Senegal | 126 | 0.1% |
| Sierra Leone | 140 | 0.1% |
| Singapore | 21 | 0.0% |
| Somalia | 96 | 0.0% |
| South Africa | 102 | 0.0% |
| South America | 2,736 | 1.0% |
| South Central Asia | 5,265 | 2.0% |
| South Eastern Asia | 3,003 | 1.1% |
| Southern Europe | 532 | 0.2% |
| Spain | 235 | 0.1% |
| Sri Lanka | 199 | 0.1% |
| Sudan | 40 | 0.0% |
| Sweden | 75 | 0.0% |
| Switzerland | 28 | 0.0% |
| Syria | 134 | 0.1% |
| Taiwan | 527 | 0.2% |
| Thailand | 693 | 0.3% |
| Turkey | 215 | 0.1% |
| Ukraine | 82 | 0.0% |
| Uruguay | 244 | 0.1% |
| Venezuela | 500 | 0.2% |
| Vietnam | 371 | 0.1% |
| Western Africa | 1,193 | 0.4% |
| Western Asia | 778 | 0.3% |
| Western Europe | 612 | 0.2% |
| Zaire | 57 | 0.0% |
| Zimbabwe | 30 | 0.0% | View All 117 Rows |
Sex and Age in Madison
Sex and Age in Madison
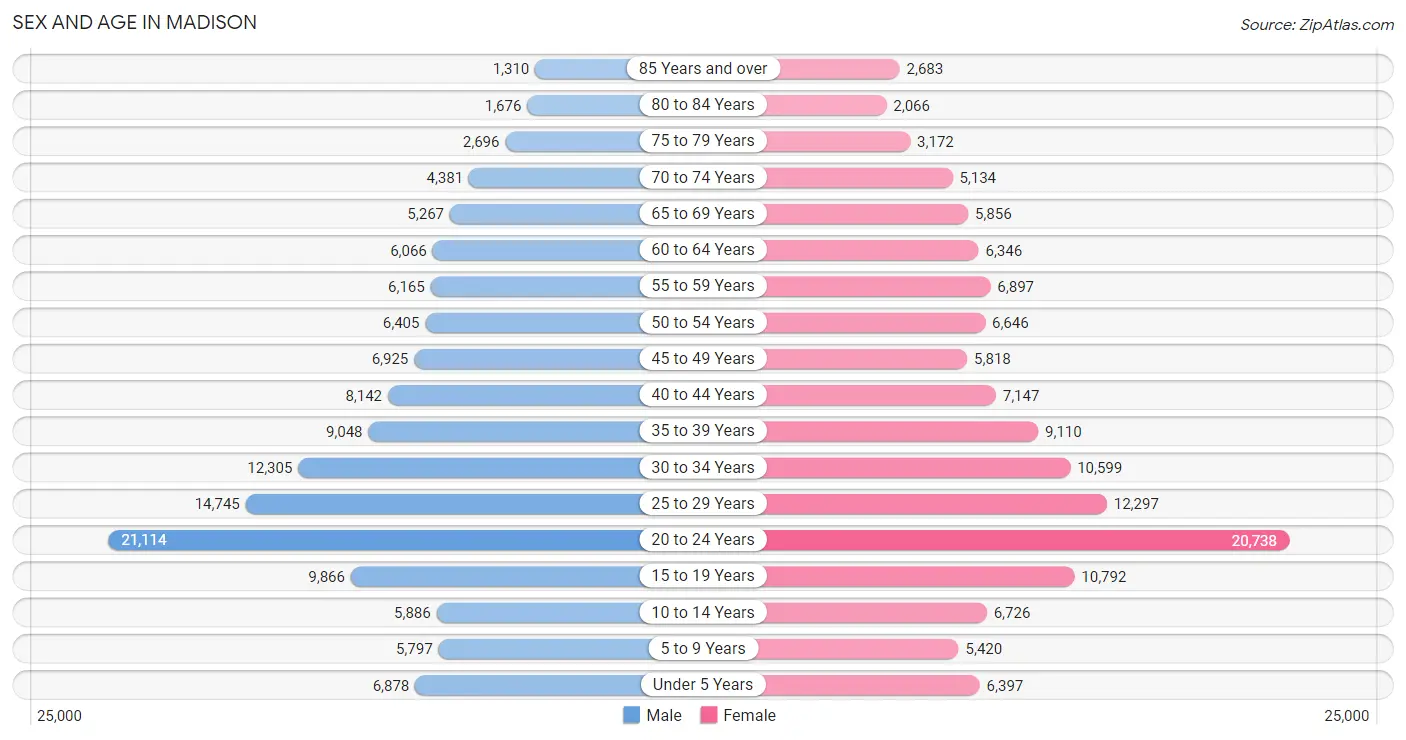
The most populous age groups in Madison are 20 to 24 Years (21,114 | 15.7%) for men and 20 to 24 Years (20,738 | 15.5%) for women.
| Age Bracket | Male | Female |
| Under 5 Years | 6,878 (5.1%) | 6,397 (4.8%) |
| 5 to 9 Years | 5,797 (4.3%) | 5,420 (4.1%) |
| 10 to 14 Years | 5,886 (4.4%) | 6,726 (5.0%) |
| 15 to 19 Years | 9,866 (7.3%) | 10,792 (8.1%) |
| 20 to 24 Years | 21,114 (15.7%) | 20,738 (15.5%) |
| 25 to 29 Years | 14,745 (11.0%) | 12,297 (9.2%) |
| 30 to 34 Years | 12,305 (9.1%) | 10,599 (7.9%) |
| 35 to 39 Years | 9,048 (6.7%) | 9,110 (6.8%) |
| 40 to 44 Years | 8,142 (6.0%) | 7,147 (5.3%) |
| 45 to 49 Years | 6,925 (5.1%) | 5,818 (4.3%) |
| 50 to 54 Years | 6,405 (4.8%) | 6,646 (5.0%) |
| 55 to 59 Years | 6,165 (4.6%) | 6,897 (5.1%) |
| 60 to 64 Years | 6,066 (4.5%) | 6,346 (4.7%) |
| 65 to 69 Years | 5,267 (3.9%) | 5,856 (4.4%) |
| 70 to 74 Years | 4,381 (3.3%) | 5,134 (3.8%) |
| 75 to 79 Years | 2,696 (2.0%) | 3,172 (2.4%) |
| 80 to 84 Years | 1,676 (1.2%) | 2,066 (1.5%) |
| 85 Years and over | 1,310 (1.0%) | 2,683 (2.0%) |
| Total | 134,672 (100.0%) | 133,844 (100.0%) |
Families and Households in Madison
Median Family Size in Madison
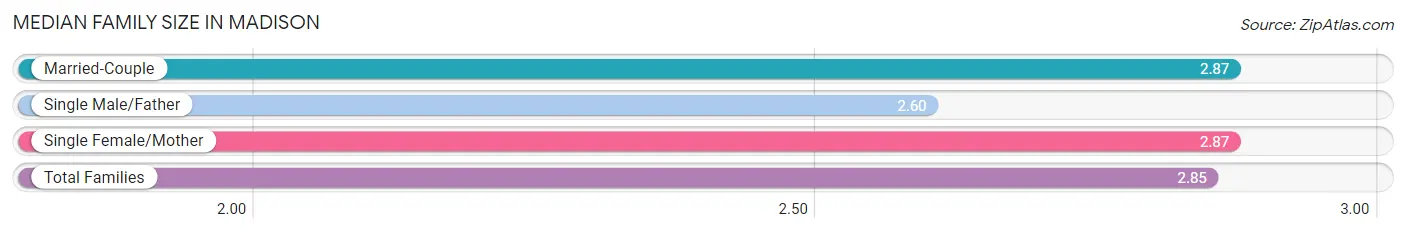
The median family size in Madison is 2.85 persons per family, with married-couple families (41,295 | 77.3%) accounting for the largest median family size of 2.87 persons per family. On the other hand, single male/father families (3,662 | 6.9%) represent the smallest median family size with 2.60 persons per family.
| Family Type | # Families | Family Size |
| Married-Couple | 41,295 (77.3%) | 2.87 |
| Single Male/Father | 3,662 (6.9%) | 2.60 |
| Single Female/Mother | 8,437 (15.8%) | 2.87 |
| Total Families | 53,394 (100.0%) | 2.85 |
Median Household Size in Madison
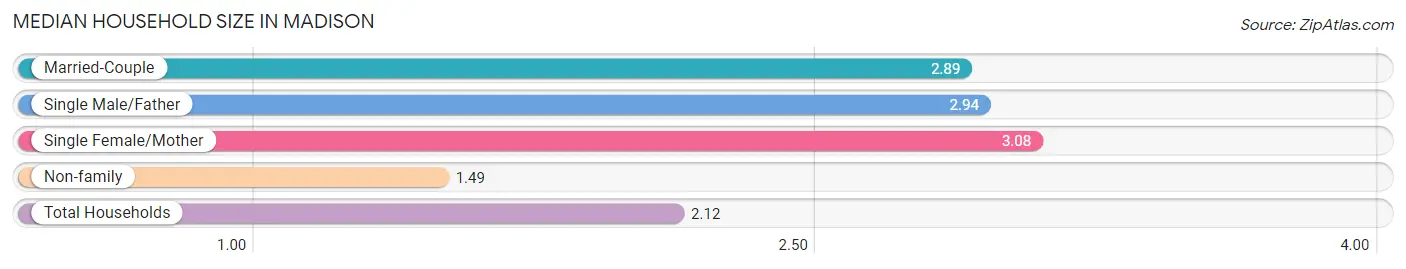
The median household size in Madison is 2.12 persons per household, with single female/mother households (8,437 | 7.0%) accounting for the largest median household size of 3.08 persons per household. non-family households (67,115 | 55.7%) represent the smallest median household size with 1.49 persons per household.
| Household Type | # Households | Household Size |
| Married-Couple | 41,295 (34.3%) | 2.89 |
| Single Male/Father | 3,662 (3.0%) | 2.94 |
| Single Female/Mother | 8,437 (7.0%) | 3.08 |
| Non-family | 67,115 (55.7%) | 1.49 |
| Total Households | 120,509 (100.0%) | 2.12 |
Household Size by Marriage Status in Madison
Out of a total of 120,509 households in Madison, 53,394 (44.3%) are family households, while 67,115 (55.7%) are nonfamily households. The most numerous type of family households are 2-person households, comprising 27,161, and the most common type of nonfamily households are 1-person households, comprising 46,092.
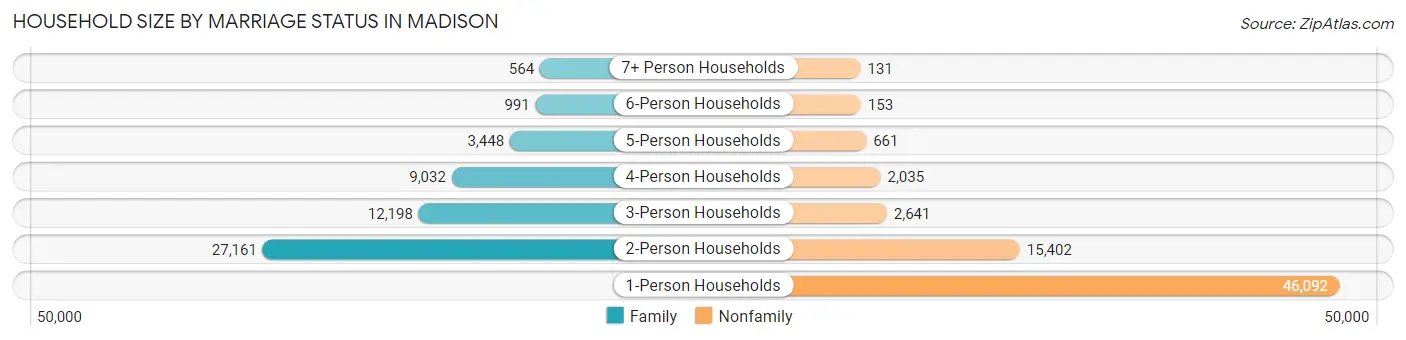
| Household Size | Family Households | Nonfamily Households |
| 1-Person Households | - | 46,092 (38.3%) |
| 2-Person Households | 27,161 (22.5%) | 15,402 (12.8%) |
| 3-Person Households | 12,198 (10.1%) | 2,641 (2.2%) |
| 4-Person Households | 9,032 (7.5%) | 2,035 (1.7%) |
| 5-Person Households | 3,448 (2.9%) | 661 (0.5%) |
| 6-Person Households | 991 (0.8%) | 153 (0.1%) |
| 7+ Person Households | 564 (0.5%) | 131 (0.1%) |
| Total | 53,394 (44.3%) | 67,115 (55.7%) |
Female Fertility in Madison
Fertility by Age in Madison
Average fertility rate in Madison is 36.0 births per 1,000 women. Women in the age bracket of 20 to 34 years have the highest fertility rate with 45.0 births per 1,000 women. Women in the age bracket of 20 to 34 years acount for 68.7% of all women with births.
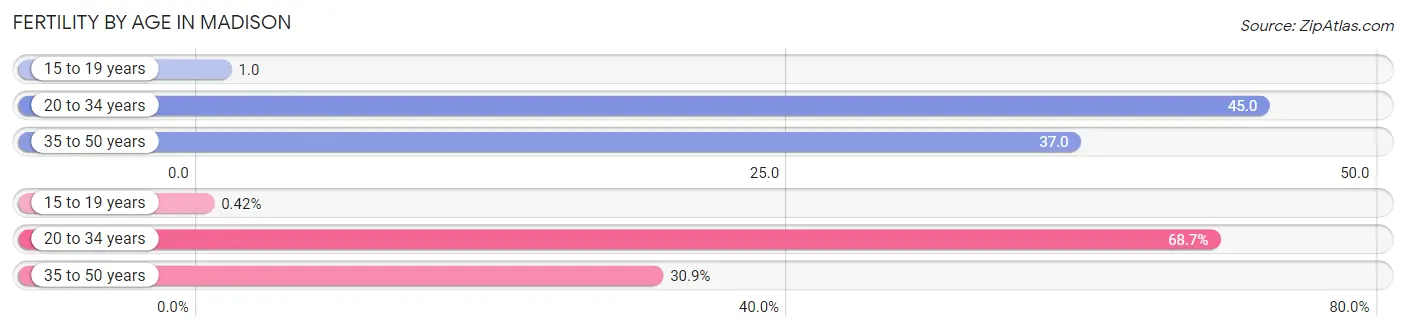
| Age Bracket | Women with Births | Births / 1,000 Women |
| 15 to 19 years | 12 (0.4%) | 1.0 |
| 20 to 34 years | 1,950 (68.7%) | 45.0 |
| 35 to 50 years | 877 (30.9%) | 37.0 |
| Total | 2,839 (100.0%) | 36.0 |
Fertility by Age by Marriage Status in Madison
82.1% of women with births (2,839) in Madison are married. The highest percentage of unmarried women with births falls into 15 to 19 years age bracket with 100.0% of them unmarried at the time of birth, while the lowest percentage of unmarried women with births belong to 35 to 50 years age bracket with 9.4% of them unmarried.
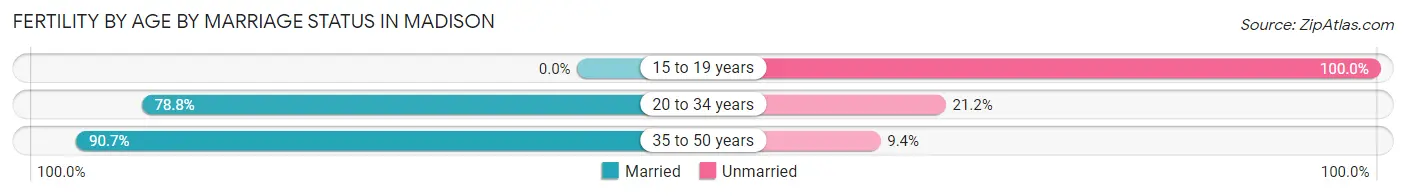
| Age Bracket | Married | Unmarried |
| 15 to 19 years | 0 (0.0%) | 12 (100.0%) |
| 20 to 34 years | 1,537 (78.8%) | 413 (21.2%) |
| 35 to 50 years | 795 (90.6%) | 82 (9.3%) |
| Total | 2,331 (82.1%) | 508 (17.9%) |
Fertility by Education in Madison
Average fertility rate in Madison is 36.0 births per 1,000 women. Women with the education attainment of graduate degree have the highest fertility rate of 77.0 births per 1,000 women, while women with the education attainment of less than high school have the lowest fertility at 13.0 births per 1,000 women. Women with the education attainment of graduate degree represent 39.9% of all women with births.
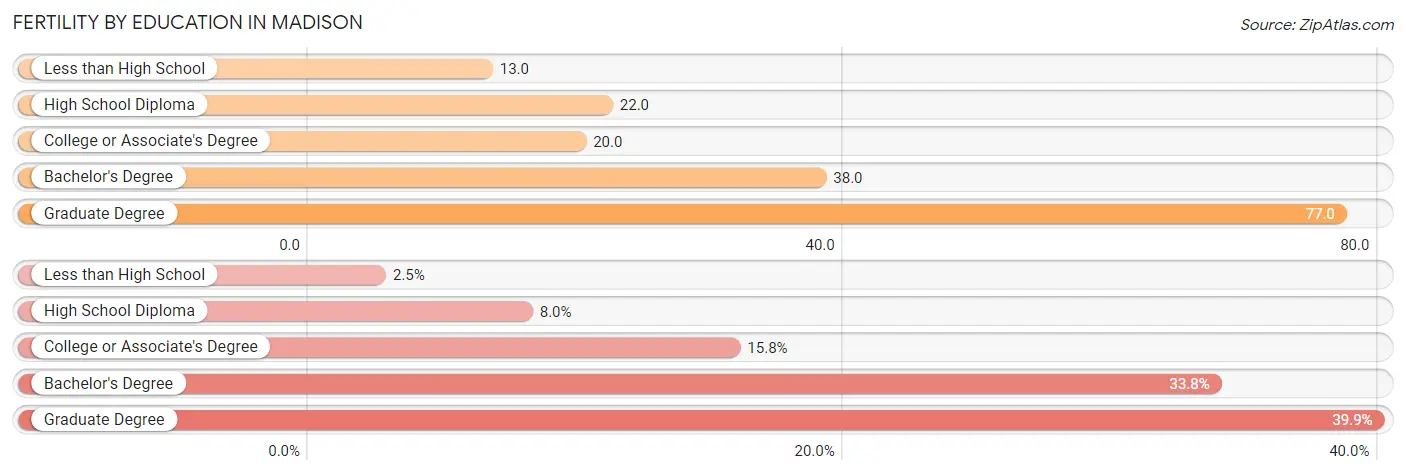
| Educational Attainment | Women with Births | Births / 1,000 Women |
| Less than High School | 71 (2.5%) | 13.0 |
| High School Diploma | 227 (8.0%) | 22.0 |
| College or Associate's Degree | 448 (15.8%) | 20.0 |
| Bachelor's Degree | 960 (33.8%) | 38.0 |
| Graduate Degree | 1,133 (39.9%) | 77.0 |
| Total | 2,839 (100.0%) | 36.0 |
Fertility by Education by Marriage Status in Madison
17.9% of women with births in Madison are unmarried. Women with the educational attainment of bachelor's degree are most likely to be married with 94.6% of them married at childbirth, while women with the educational attainment of high school diploma are least likely to be married with 73.1% of them unmarried at childbirth.
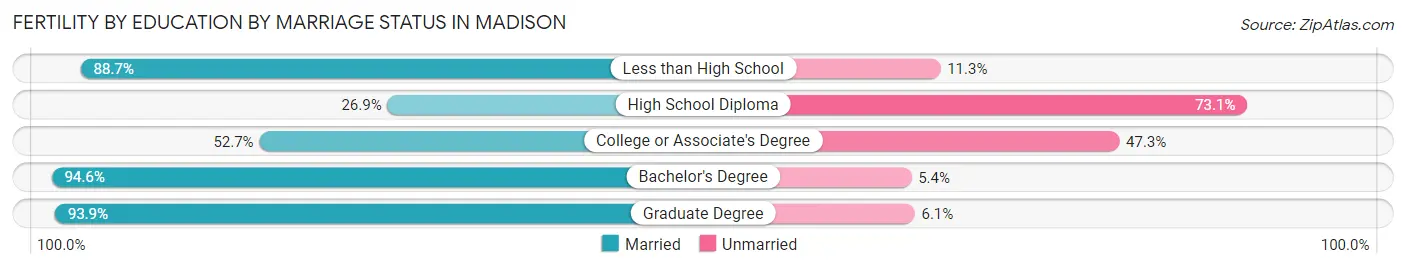
| Educational Attainment | Married | Unmarried |
| Less than High School | 63 (88.7%) | 8 (11.3%) |
| High School Diploma | 61 (26.9%) | 166 (73.1%) |
| College or Associate's Degree | 236 (52.7%) | 212 (47.3%) |
| Bachelor's Degree | 908 (94.6%) | 52 (5.4%) |
| Graduate Degree | 1,064 (93.9%) | 69 (6.1%) |
| Total | 2,331 (82.1%) | 508 (17.9%) |
Employment Characteristics in Madison
Employment by Class of Employer in Madison
Among the 154,669 employed individuals in Madison, private company employees (92,248 | 59.6%), state government employees (26,512 | 17.1%), and not-for-profit organizations (15,732 | 10.2%) make up the most common classes of employment.
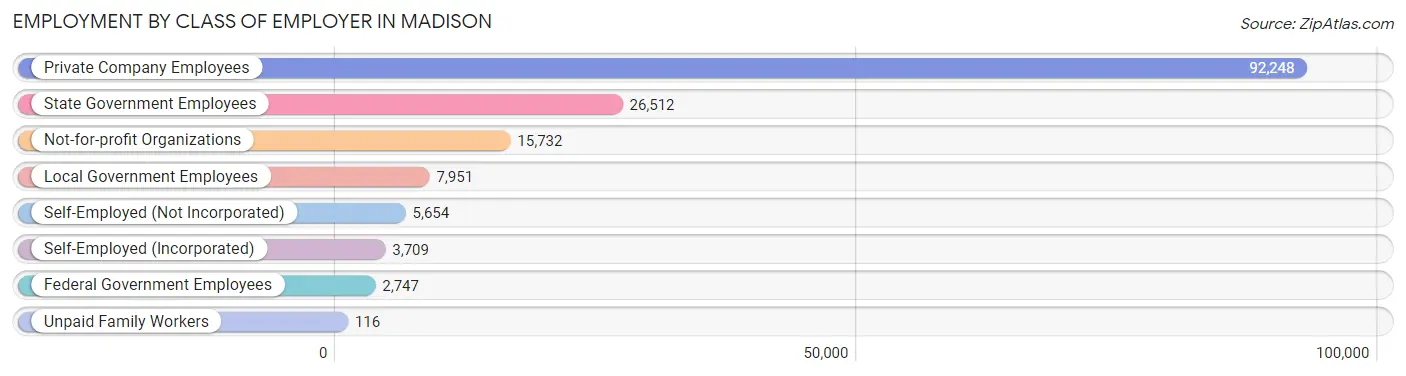
| Employer Class | # Employees | % Employees |
| Private Company Employees | 92,248 | 59.6% |
| Self-Employed (Incorporated) | 3,709 | 2.4% |
| Self-Employed (Not Incorporated) | 5,654 | 3.7% |
| Not-for-profit Organizations | 15,732 | 10.2% |
| Local Government Employees | 7,951 | 5.1% |
| State Government Employees | 26,512 | 17.1% |
| Federal Government Employees | 2,747 | 1.8% |
| Unpaid Family Workers | 116 | 0.1% |
| Total | 154,669 | 100.0% |
Employment Status by Age in Madison
According to the labor force statistics for Madison, out of the total population over 16 years of age (229,019), 70.4% or 161,229 individuals are in the labor force, with 2.6% or 4,192 of them unemployed. The age group with the highest labor force participation rate is 30 to 34 years, with 90.2% or 20,659 individuals in the labor force. Within the labor force, the 16 to 19 years age range has the highest percentage of unemployed individuals, with 4.6% or 379 of them being unemployed.
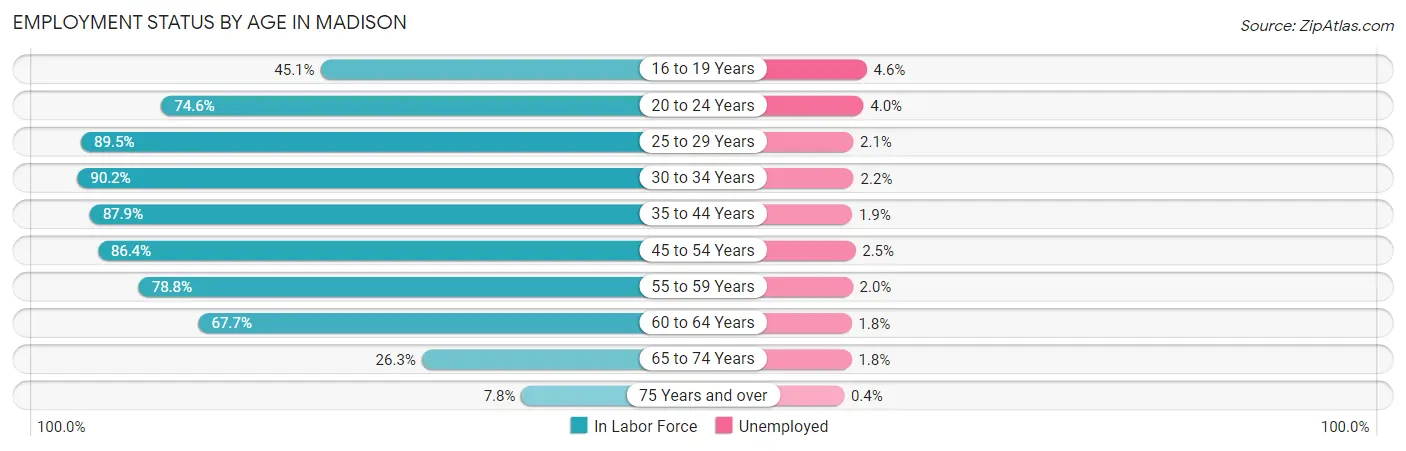
| Age Bracket | In Labor Force | Unemployed |
| 16 to 19 Years | 8,238 (45.1%) | 379 (4.6%) |
| 20 to 24 Years | 31,222 (74.6%) | 1,249 (4.0%) |
| 25 to 29 Years | 24,203 (89.5%) | 508 (2.1%) |
| 30 to 34 Years | 20,659 (90.2%) | 454 (2.2%) |
| 35 to 44 Years | 29,400 (87.9%) | 559 (1.9%) |
| 45 to 54 Years | 22,286 (86.4%) | 557 (2.5%) |
| 55 to 59 Years | 10,293 (78.8%) | 206 (2.0%) |
| 60 to 64 Years | 8,403 (67.7%) | 151 (1.8%) |
| 65 to 74 Years | 5,428 (26.3%) | 98 (1.8%) |
| 75 Years and over | 1,061 (7.8%) | 4 (0.4%) |
| Total | 161,229 (70.4%) | 4,192 (2.6%) |
Employment Status by Educational Attainment in Madison
According to labor force statistics for Madison, 85.6% of individuals (115,270) out of the total population between 25 and 64 years of age (134,661) are in the labor force, with 2.1% or 2,421 of them being unemployed. The group with the highest labor force participation rate are those with the educational attainment of bachelor's degree or higher, with 90.5% or 73,906 individuals in the labor force. Within the labor force, individuals with high school diploma education have the highest percentage of unemployment, with 4.0% or 528 of them being unemployed.
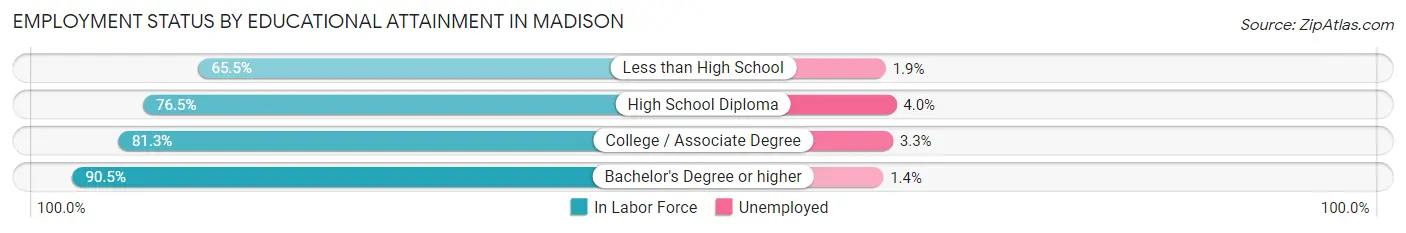
| Educational Attainment | In Labor Force | Unemployed |
| Less than High School | 3,756 (65.5%) | 109 (1.9%) |
| High School Diploma | 13,195 (76.5%) | 690 (4.0%) |
| College / Associate Degree | 24,401 (81.3%) | 990 (3.3%) |
| Bachelor's Degree or higher | 73,906 (90.5%) | 1,143 (1.4%) |
| Total | 115,270 (85.6%) | 2,828 (2.1%) |
Employment Occupations by Sex in Madison
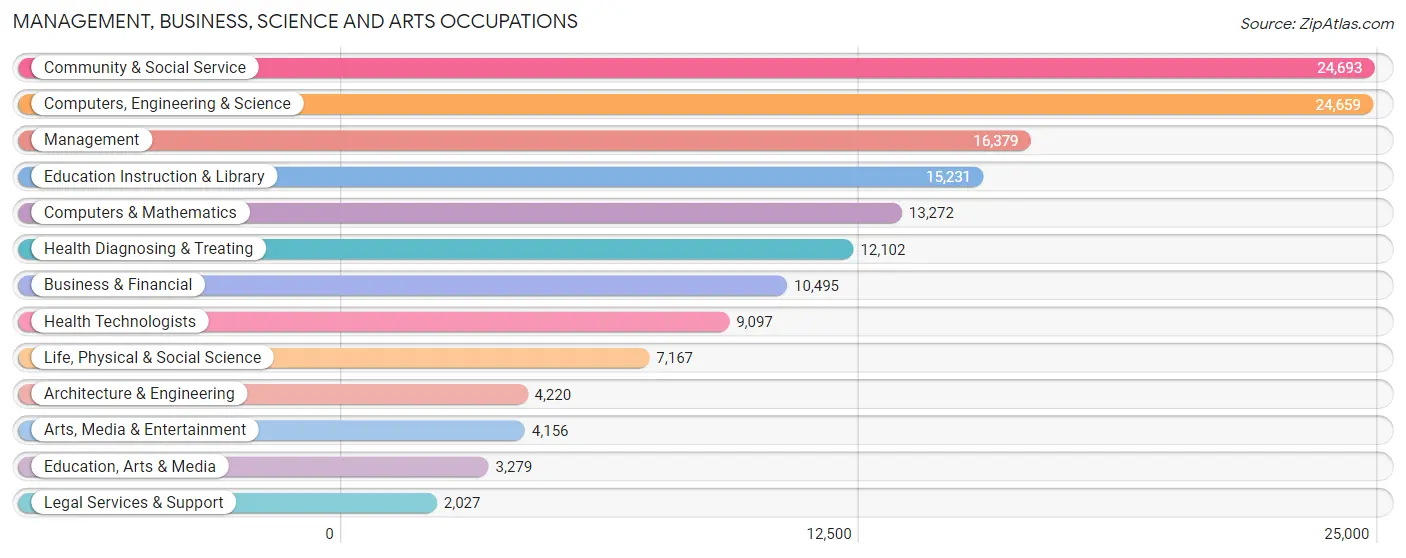
Management, Business, Science and Arts Occupations
The most common Management, Business, Science and Arts occupations in Madison are Community & Social Service (24,693 | 15.8%), Computers, Engineering & Science (24,659 | 15.7%), Management (16,379 | 10.4%), Education Instruction & Library (15,231 | 9.7%), and Computers & Mathematics (13,272 | 8.5%).
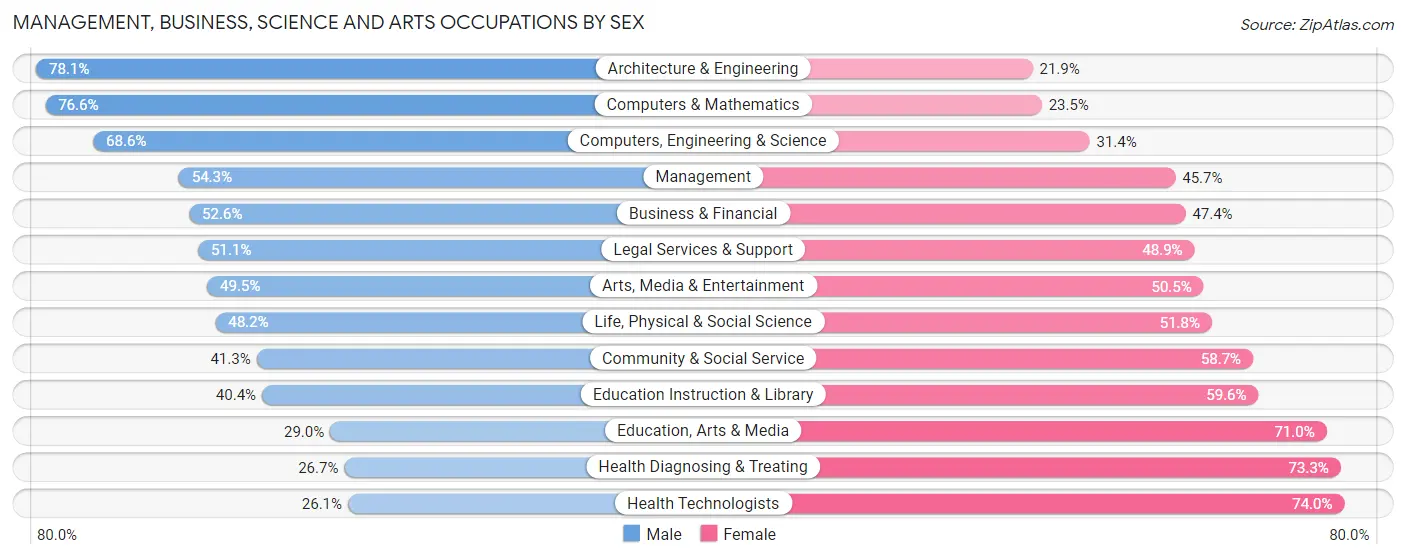
Management, Business, Science and Arts Occupations by Sex
Within the Management, Business, Science and Arts occupations in Madison, the most male-oriented occupations are Architecture & Engineering (78.1%), Computers & Mathematics (76.5%), and Computers, Engineering & Science (68.6%), while the most female-oriented occupations are Health Technologists (74.0%), Health Diagnosing & Treating (73.3%), and Education, Arts & Media (71.0%).
| Occupation | Male | Female |
| Management | 8,887 (54.3%) | 7,492 (45.7%) |
| Business & Financial | 5,516 (52.6%) | 4,979 (47.4%) |
| Computers, Engineering & Science | 16,907 (68.6%) | 7,752 (31.4%) |
| Computers & Mathematics | 10,160 (76.5%) | 3,112 (23.4%) |
| Architecture & Engineering | 3,295 (78.1%) | 925 (21.9%) |
| Life, Physical & Social Science | 3,452 (48.2%) | 3,715 (51.8%) |
| Community & Social Service | 10,199 (41.3%) | 14,494 (58.7%) |
| Education, Arts & Media | 952 (29.0%) | 2,327 (71.0%) |
| Legal Services & Support | 1,035 (51.1%) | 992 (48.9%) |
| Education Instruction & Library | 6,153 (40.4%) | 9,078 (59.6%) |
| Arts, Media & Entertainment | 2,059 (49.5%) | 2,097 (50.5%) |
| Health Diagnosing & Treating | 3,226 (26.7%) | 8,876 (73.3%) |
| Health Technologists | 2,370 (26.1%) | 6,727 (74.0%) |
| Total (Category) | 44,735 (50.6%) | 43,593 (49.3%) |
| Total (Overall) | 81,414 (51.9%) | 75,343 (48.1%) |
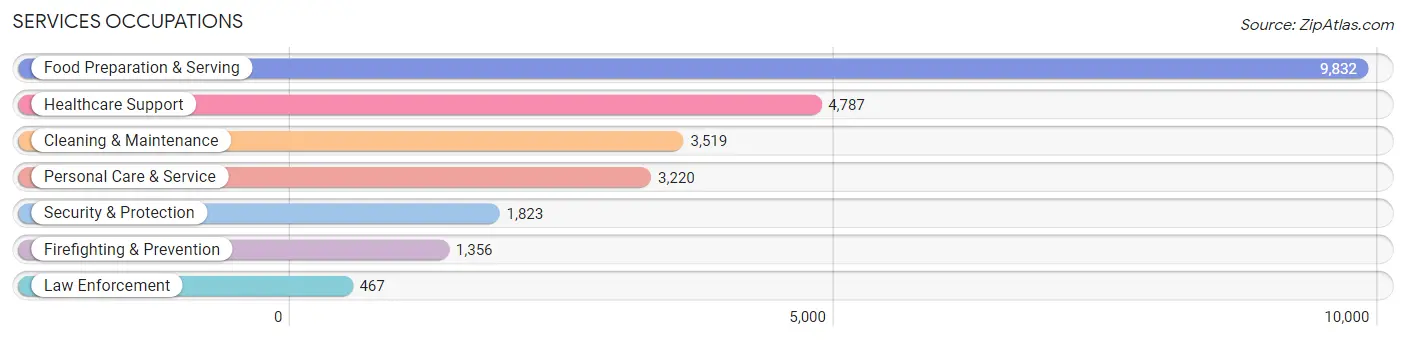
Services Occupations
The most common Services occupations in Madison are Food Preparation & Serving (9,832 | 6.3%), Healthcare Support (4,787 | 3.0%), Cleaning & Maintenance (3,519 | 2.2%), Personal Care & Service (3,220 | 2.1%), and Security & Protection (1,823 | 1.2%).
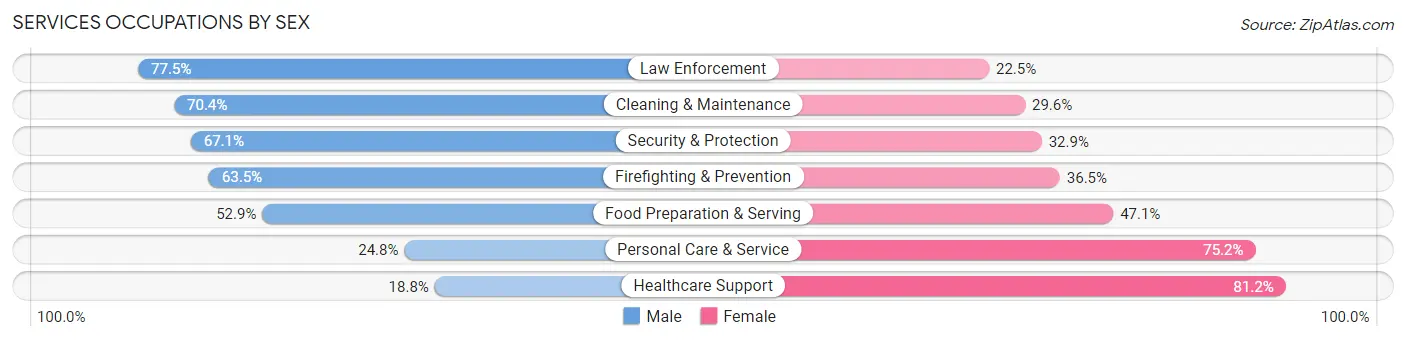
Services Occupations by Sex
Within the Services occupations in Madison, the most male-oriented occupations are Law Enforcement (77.5%), Cleaning & Maintenance (70.4%), and Security & Protection (67.1%), while the most female-oriented occupations are Healthcare Support (81.2%), Personal Care & Service (75.2%), and Food Preparation & Serving (47.1%).
| Occupation | Male | Female |
| Healthcare Support | 900 (18.8%) | 3,887 (81.2%) |
| Security & Protection | 1,223 (67.1%) | 600 (32.9%) |
| Firefighting & Prevention | 861 (63.5%) | 495 (36.5%) |
| Law Enforcement | 362 (77.5%) | 105 (22.5%) |
| Food Preparation & Serving | 5,205 (52.9%) | 4,627 (47.1%) |
| Cleaning & Maintenance | 2,477 (70.4%) | 1,042 (29.6%) |
| Personal Care & Service | 799 (24.8%) | 2,421 (75.2%) |
| Total (Category) | 10,604 (45.7%) | 12,577 (54.3%) |
| Total (Overall) | 81,414 (51.9%) | 75,343 (48.1%) |
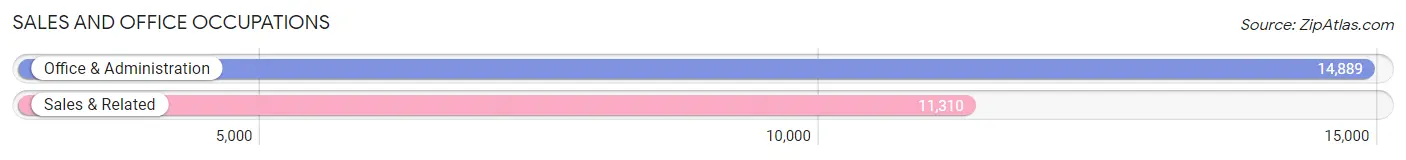
Sales and Office Occupations
The most common Sales and Office occupations in Madison are Office & Administration (14,889 | 9.5%), and Sales & Related (11,310 | 7.2%).
Sales and Office Occupations by Sex
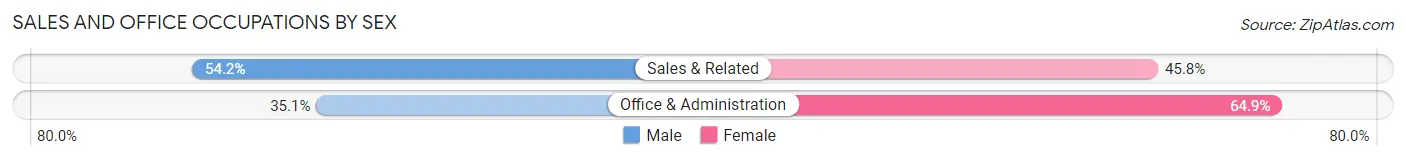
| Occupation | Male | Female |
| Sales & Related | 6,132 (54.2%) | 5,178 (45.8%) |
| Office & Administration | 5,231 (35.1%) | 9,658 (64.9%) |
| Total (Category) | 11,363 (43.4%) | 14,836 (56.6%) |
| Total (Overall) | 81,414 (51.9%) | 75,343 (48.1%) |
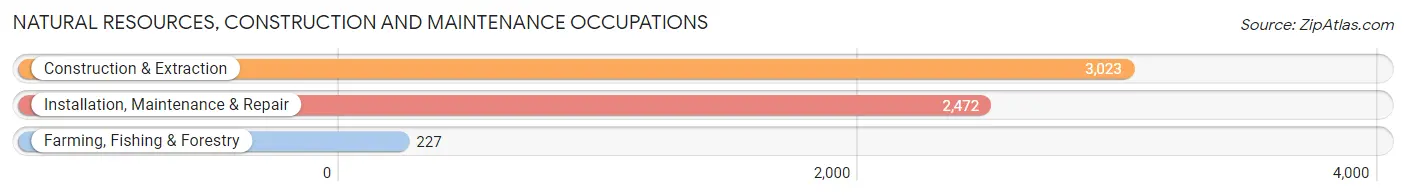
Natural Resources, Construction and Maintenance Occupations
The most common Natural Resources, Construction and Maintenance occupations in Madison are Construction & Extraction (3,023 | 1.9%), Installation, Maintenance & Repair (2,472 | 1.6%), and Farming, Fishing & Forestry (227 | 0.1%).
Natural Resources, Construction and Maintenance Occupations by Sex
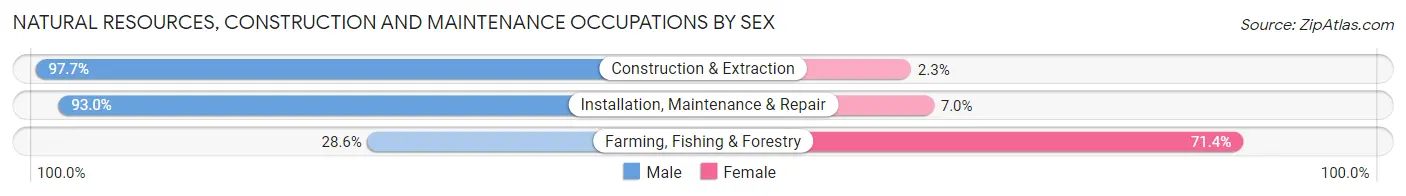
| Occupation | Male | Female |
| Farming, Fishing & Forestry | 65 (28.6%) | 162 (71.4%) |
| Construction & Extraction | 2,954 (97.7%) | 69 (2.3%) |
| Installation, Maintenance & Repair | 2,298 (93.0%) | 174 (7.0%) |
| Total (Category) | 5,317 (92.9%) | 405 (7.1%) |
| Total (Overall) | 81,414 (51.9%) | 75,343 (48.1%) |
Production, Transportation and Moving Occupations
The most common Production, Transportation and Moving occupations in Madison are Production (6,640 | 4.2%), Material Moving (4,083 | 2.6%), and Transportation (2,604 | 1.7%).
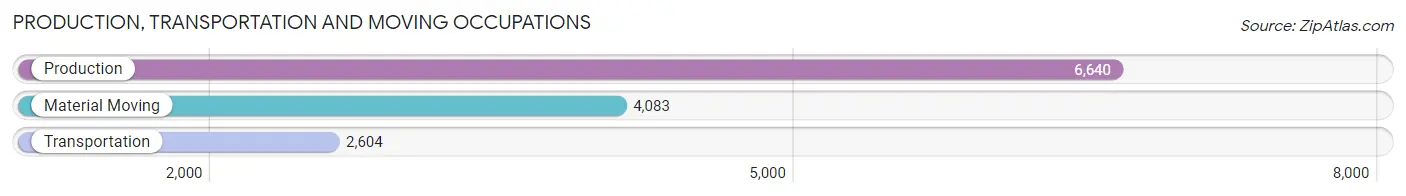
Production, Transportation and Moving Occupations by Sex
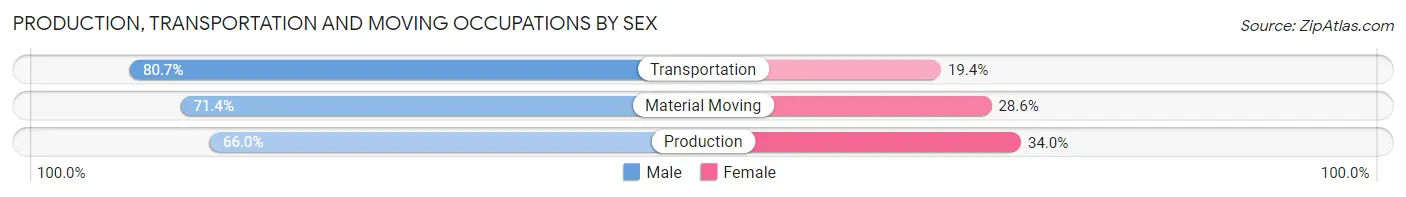
| Occupation | Male | Female |
| Production | 4,380 (66.0%) | 2,260 (34.0%) |
| Transportation | 2,100 (80.6%) | 504 (19.4%) |
| Material Moving | 2,915 (71.4%) | 1,168 (28.6%) |
| Total (Category) | 9,395 (70.5%) | 3,932 (29.5%) |
| Total (Overall) | 81,414 (51.9%) | 75,343 (48.1%) |
Employment Industries by Sex in Madison
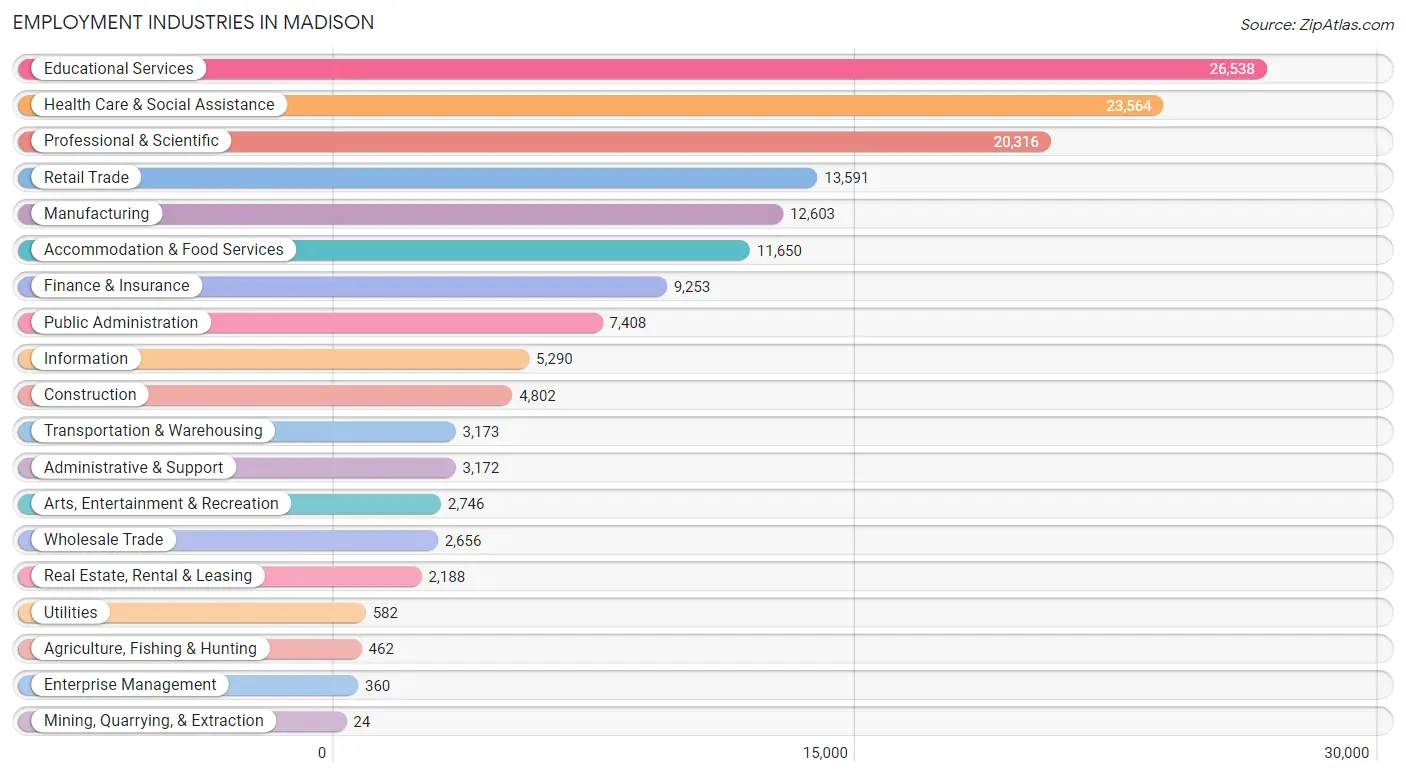
Employment Industries in Madison
The major employment industries in Madison include Educational Services (26,538 | 16.9%), Health Care & Social Assistance (23,564 | 15.0%), Professional & Scientific (20,316 | 13.0%), Retail Trade (13,591 | 8.7%), and Manufacturing (12,603 | 8.0%).
Employment Industries by Sex in Madison
The Madison industries that see more men than women are Construction (91.8%), Transportation & Warehousing (78.2%), and Wholesale Trade (72.5%), whereas the industries that tend to have a higher number of women are Health Care & Social Assistance (73.8%), Mining, Quarrying, & Extraction (62.5%), and Educational Services (56.2%).
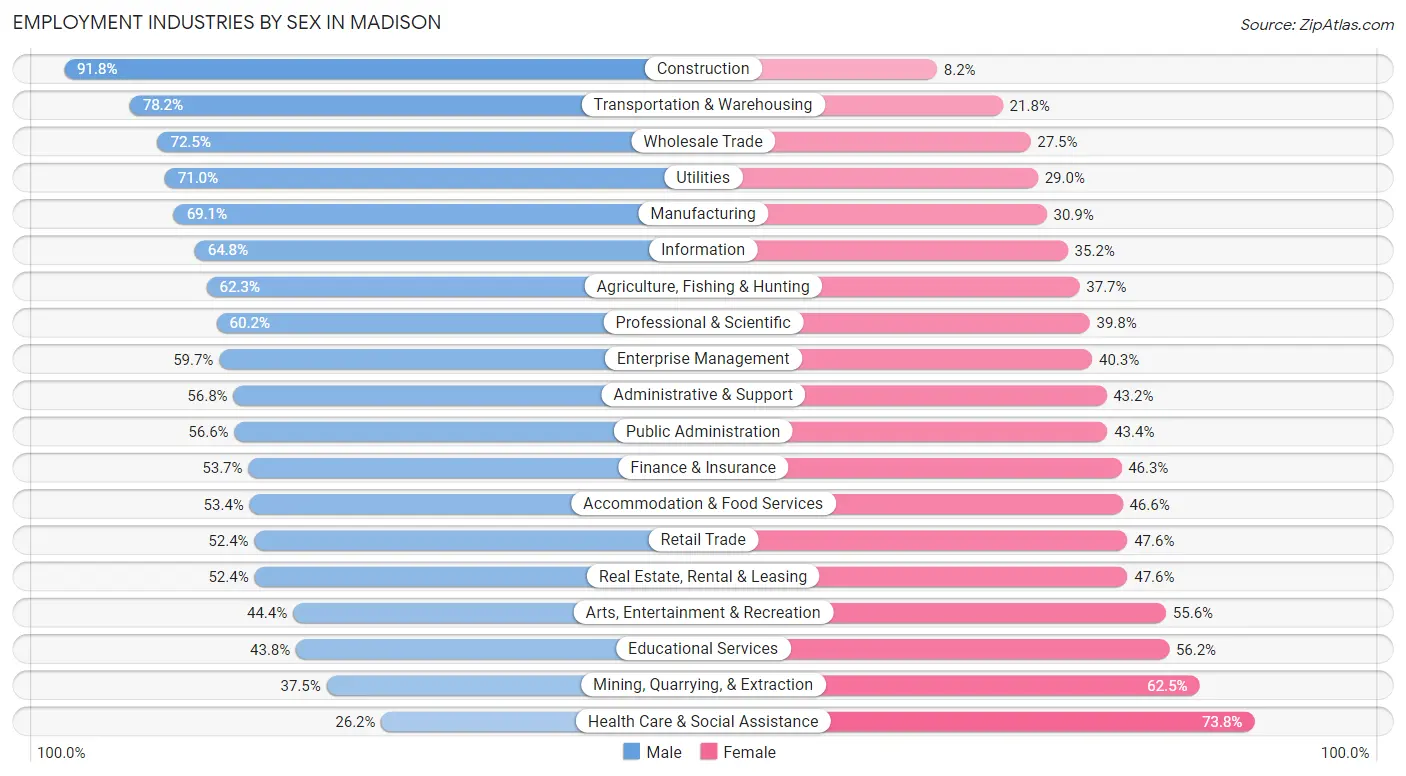
| Industry | Male | Female |
| Agriculture, Fishing & Hunting | 288 (62.3%) | 174 (37.7%) |
| Mining, Quarrying, & Extraction | 9 (37.5%) | 15 (62.5%) |
| Construction | 4,410 (91.8%) | 392 (8.2%) |
| Manufacturing | 8,713 (69.1%) | 3,890 (30.9%) |
| Wholesale Trade | 1,925 (72.5%) | 731 (27.5%) |
| Retail Trade | 7,126 (52.4%) | 6,465 (47.6%) |
| Transportation & Warehousing | 2,482 (78.2%) | 691 (21.8%) |
| Utilities | 413 (71.0%) | 169 (29.0%) |
| Information | 3,426 (64.8%) | 1,864 (35.2%) |
| Finance & Insurance | 4,967 (53.7%) | 4,286 (46.3%) |
| Real Estate, Rental & Leasing | 1,147 (52.4%) | 1,041 (47.6%) |
| Professional & Scientific | 12,239 (60.2%) | 8,077 (39.8%) |
| Enterprise Management | 215 (59.7%) | 145 (40.3%) |
| Administrative & Support | 1,801 (56.8%) | 1,371 (43.2%) |
| Educational Services | 11,624 (43.8%) | 14,914 (56.2%) |
| Health Care & Social Assistance | 6,164 (26.2%) | 17,400 (73.8%) |
| Arts, Entertainment & Recreation | 1,220 (44.4%) | 1,526 (55.6%) |
| Accommodation & Food Services | 6,224 (53.4%) | 5,426 (46.6%) |
| Public Administration | 4,191 (56.6%) | 3,217 (43.4%) |
| Total | 81,414 (51.9%) | 75,343 (48.1%) |
Education in Madison
School Enrollment in Madison
The most common levels of schooling among the 83,680 students in Madison are college / undergraduate (38,001 | 45.4%), graduate / professional (12,679 | 15.1%), and middle school (9,963 | 11.9%).
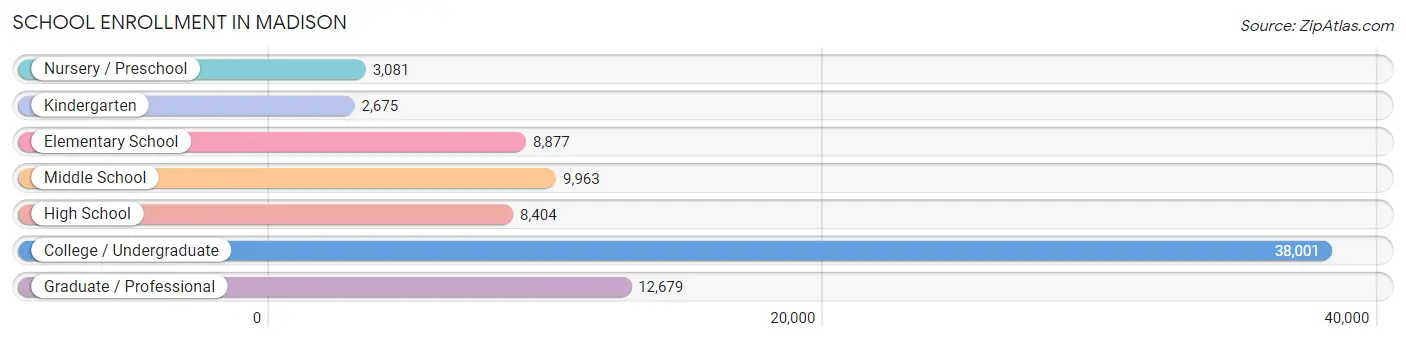
| School Level | # Students | % Students |
| Nursery / Preschool | 3,081 | 3.7% |
| Kindergarten | 2,675 | 3.2% |
| Elementary School | 8,877 | 10.6% |
| Middle School | 9,963 | 11.9% |
| High School | 8,404 | 10.0% |
| College / Undergraduate | 38,001 | 45.4% |
| Graduate / Professional | 12,679 | 15.1% |
| Total | 83,680 | 100.0% |
School Enrollment by Age by Funding Source in Madison
Out of a total of 83,680 students who are enrolled in schools in Madison, 8,452 (10.1%) attend a private institution, while the remaining 75,228 (89.9%) are enrolled in public schools. The age group of 3 to 4 year olds has the highest likelihood of being enrolled in private schools, with 1,330 (50.4% in the age bracket) enrolled. Conversely, the age group of 20 to 24 year olds has the lowest likelihood of being enrolled in a private school, with 25,253 (94.5% in the age bracket) attending a public institution.
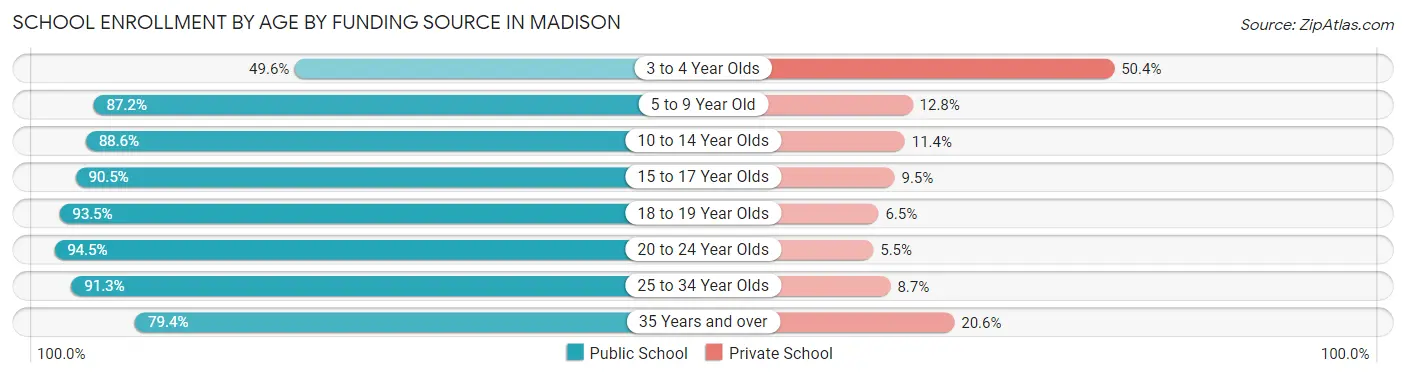
| Age Bracket | Public School | Private School |
| 3 to 4 Year Olds | 1,309 (49.6%) | 1,330 (50.4%) |
| 5 to 9 Year Old | 9,346 (87.2%) | 1,377 (12.8%) |
| 10 to 14 Year Olds | 10,980 (88.6%) | 1,411 (11.4%) |
| 15 to 17 Year Olds | 5,578 (90.5%) | 584 (9.5%) |
| 18 to 19 Year Olds | 12,317 (93.5%) | 853 (6.5%) |
| 20 to 24 Year Olds | 25,253 (94.5%) | 1,476 (5.5%) |
| 25 to 34 Year Olds | 8,107 (91.3%) | 774 (8.7%) |
| 35 Years and over | 2,370 (79.4%) | 615 (20.6%) |
| Total | 75,228 (89.9%) | 8,452 (10.1%) |
Educational Attainment by Field of Study in Madison
Bio, nature & agricultural (13,717 | 12.2%), business (12,820 | 11.4%), social sciences (11,652 | 10.4%), education (9,133 | 8.2%), and science & technology (8,450 | 7.5%) are the most common fields of study among 112,021 individuals in Madison who have obtained a bachelor's degree or higher.
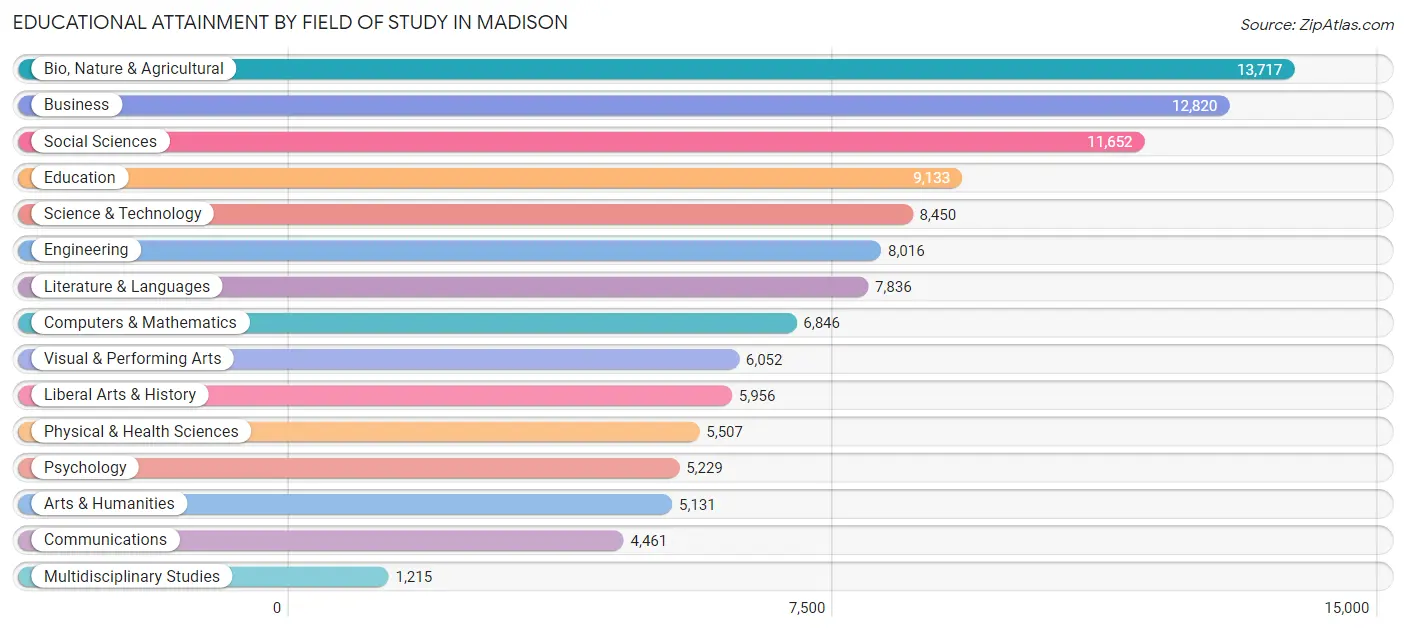
| Field of Study | # Graduates | % Graduates |
| Computers & Mathematics | 6,846 | 6.1% |
| Bio, Nature & Agricultural | 13,717 | 12.2% |
| Physical & Health Sciences | 5,507 | 4.9% |
| Psychology | 5,229 | 4.7% |
| Social Sciences | 11,652 | 10.4% |
| Engineering | 8,016 | 7.2% |
| Multidisciplinary Studies | 1,215 | 1.1% |
| Science & Technology | 8,450 | 7.5% |
| Business | 12,820 | 11.4% |
| Education | 9,133 | 8.2% |
| Literature & Languages | 7,836 | 7.0% |
| Liberal Arts & History | 5,956 | 5.3% |
| Visual & Performing Arts | 6,052 | 5.4% |
| Communications | 4,461 | 4.0% |
| Arts & Humanities | 5,131 | 4.6% |
| Total | 112,021 | 100.0% |
Transportation & Commute in Madison
Vehicle Availability by Sex in Madison
The most prevalent vehicle ownership categories in Madison are males with 2 vehicles (35,523, accounting for 45.1%) and females with 2 vehicles (32,370, making up 49.3%).
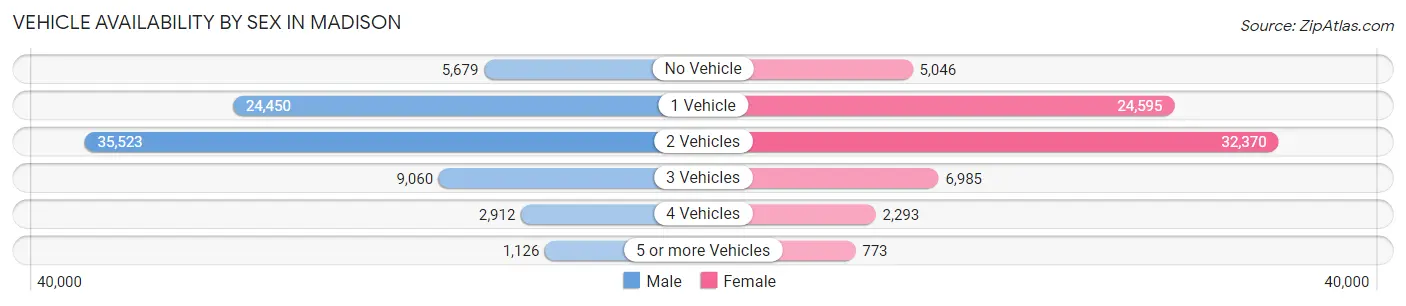
| Vehicles Available | Male | Female |
| No Vehicle | 5,679 (7.2%) | 5,046 (7.0%) |
| 1 Vehicle | 24,450 (31.0%) | 24,595 (34.1%) |
| 2 Vehicles | 35,523 (45.1%) | 32,370 (44.9%) |
| 3 Vehicles | 9,060 (11.5%) | 6,985 (9.7%) |
| 4 Vehicles | 2,912 (3.7%) | 2,293 (3.2%) |
| 5 or more Vehicles | 1,126 (1.4%) | 773 (1.1%) |
| Total | 78,750 (100.0%) | 72,062 (100.0%) |
Commute Time in Madison
The most frequently occuring commute durations in Madison are 15 to 19 minutes (27,476 commuters, 21.0%), 10 to 14 minutes (24,609 commuters, 18.8%), and 20 to 24 minutes (23,049 commuters, 17.6%).
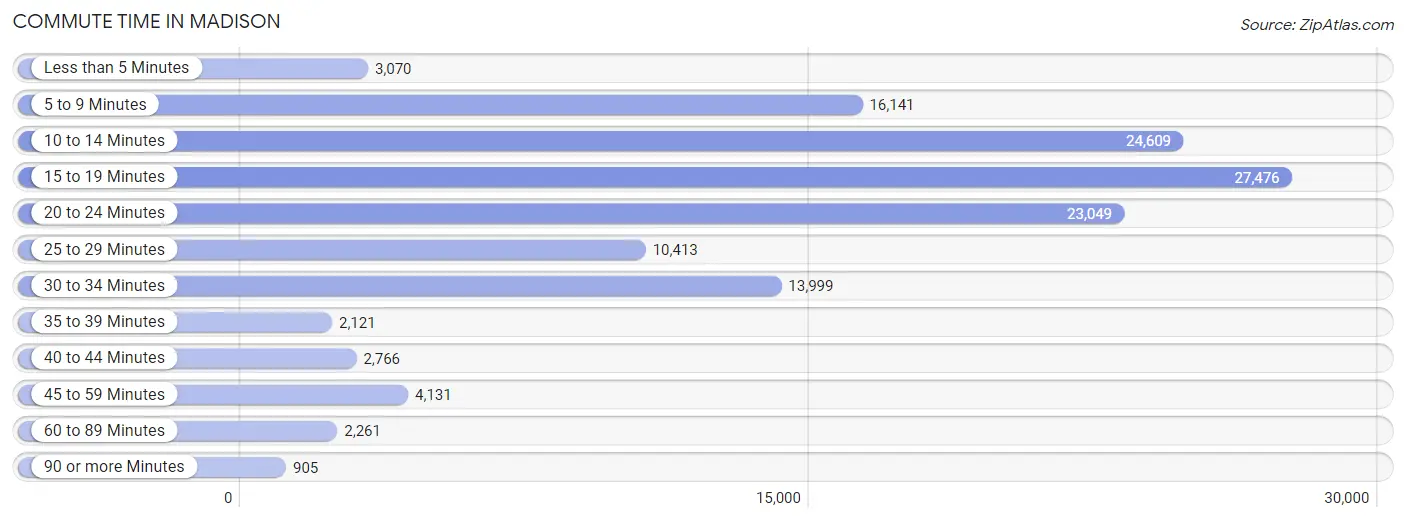
| Commute Time | # Commuters | % Commuters |
| Less than 5 Minutes | 3,070 | 2.3% |
| 5 to 9 Minutes | 16,141 | 12.3% |
| 10 to 14 Minutes | 24,609 | 18.8% |
| 15 to 19 Minutes | 27,476 | 21.0% |
| 20 to 24 Minutes | 23,049 | 17.6% |
| 25 to 29 Minutes | 10,413 | 8.0% |
| 30 to 34 Minutes | 13,999 | 10.7% |
| 35 to 39 Minutes | 2,121 | 1.6% |
| 40 to 44 Minutes | 2,766 | 2.1% |
| 45 to 59 Minutes | 4,131 | 3.2% |
| 60 to 89 Minutes | 2,261 | 1.7% |
| 90 or more Minutes | 905 | 0.7% |
Commute Time by Sex in Madison
The most common commute times in Madison are 15 to 19 minutes (14,889 commuters, 21.8%) for males and 15 to 19 minutes (12,587 commuters, 20.1%) for females.
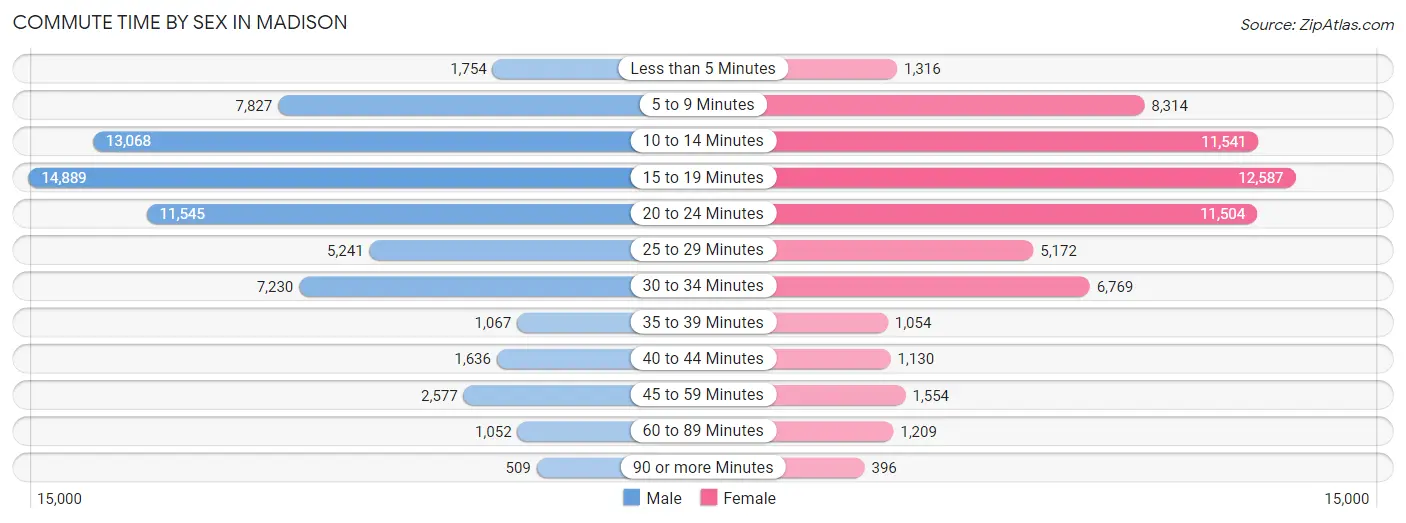
| Commute Time | Male | Female |
| Less than 5 Minutes | 1,754 (2.6%) | 1,316 (2.1%) |
| 5 to 9 Minutes | 7,827 (11.4%) | 8,314 (13.3%) |
| 10 to 14 Minutes | 13,068 (19.1%) | 11,541 (18.4%) |
| 15 to 19 Minutes | 14,889 (21.8%) | 12,587 (20.1%) |
| 20 to 24 Minutes | 11,545 (16.9%) | 11,504 (18.4%) |
| 25 to 29 Minutes | 5,241 (7.7%) | 5,172 (8.3%) |
| 30 to 34 Minutes | 7,230 (10.6%) | 6,769 (10.8%) |
| 35 to 39 Minutes | 1,067 (1.6%) | 1,054 (1.7%) |
| 40 to 44 Minutes | 1,636 (2.4%) | 1,130 (1.8%) |
| 45 to 59 Minutes | 2,577 (3.8%) | 1,554 (2.5%) |
| 60 to 89 Minutes | 1,052 (1.5%) | 1,209 (1.9%) |
| 90 or more Minutes | 509 (0.7%) | 396 (0.6%) |
Time of Departure to Work by Sex in Madison
The most frequent times of departure to work in Madison are 7:30 AM to 7:59 AM (10,530, 15.4%) for males and 7:30 AM to 7:59 AM (9,938, 15.9%) for females.
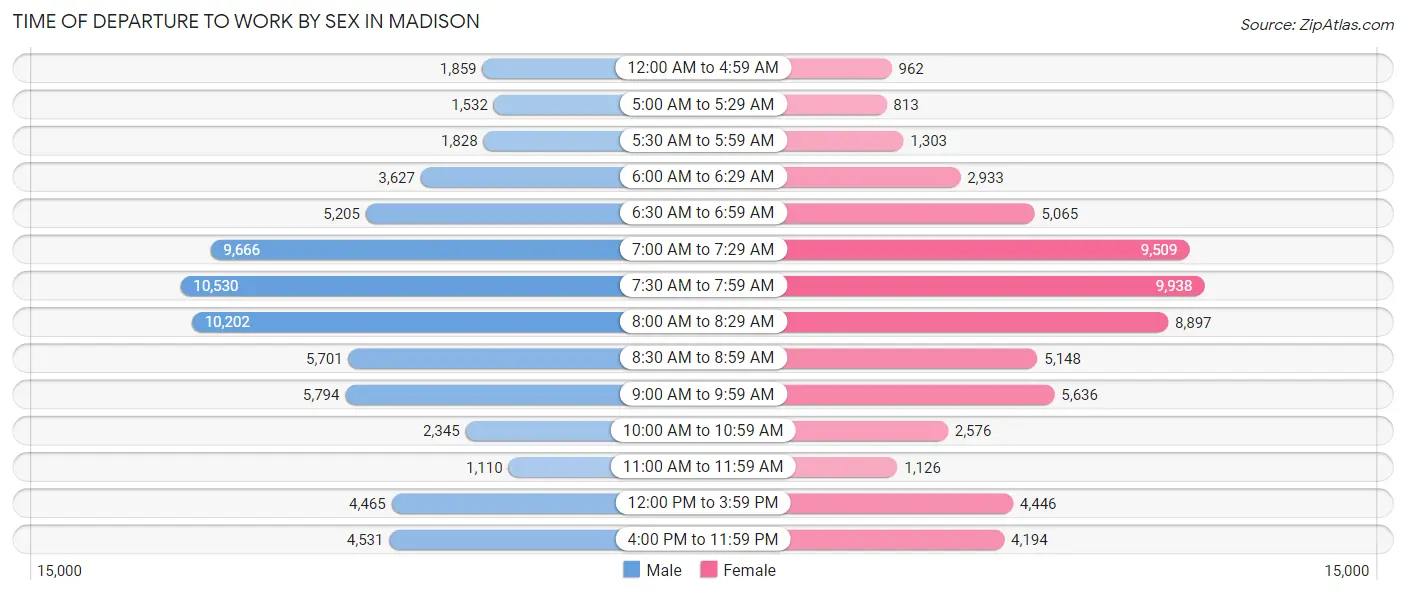
| Time of Departure | Male | Female |
| 12:00 AM to 4:59 AM | 1,859 (2.7%) | 962 (1.5%) |
| 5:00 AM to 5:29 AM | 1,532 (2.2%) | 813 (1.3%) |
| 5:30 AM to 5:59 AM | 1,828 (2.7%) | 1,303 (2.1%) |
| 6:00 AM to 6:29 AM | 3,627 (5.3%) | 2,933 (4.7%) |
| 6:30 AM to 6:59 AM | 5,205 (7.6%) | 5,065 (8.1%) |
| 7:00 AM to 7:29 AM | 9,666 (14.1%) | 9,509 (15.2%) |
| 7:30 AM to 7:59 AM | 10,530 (15.4%) | 9,938 (15.9%) |
| 8:00 AM to 8:29 AM | 10,202 (14.9%) | 8,897 (14.2%) |
| 8:30 AM to 8:59 AM | 5,701 (8.3%) | 5,148 (8.2%) |
| 9:00 AM to 9:59 AM | 5,794 (8.5%) | 5,636 (9.0%) |
| 10:00 AM to 10:59 AM | 2,345 (3.4%) | 2,576 (4.1%) |
| 11:00 AM to 11:59 AM | 1,110 (1.6%) | 1,126 (1.8%) |
| 12:00 PM to 3:59 PM | 4,465 (6.5%) | 4,446 (7.1%) |
| 4:00 PM to 11:59 PM | 4,531 (6.6%) | 4,194 (6.7%) |
| Total | 68,395 (100.0%) | 62,546 (100.0%) |
Housing Occupancy in Madison
Occupancy by Ownership in Madison
Of the total 120,509 dwellings in Madison, owner-occupied units account for 56,660 (47.0%), while renter-occupied units make up 63,849 (53.0%).
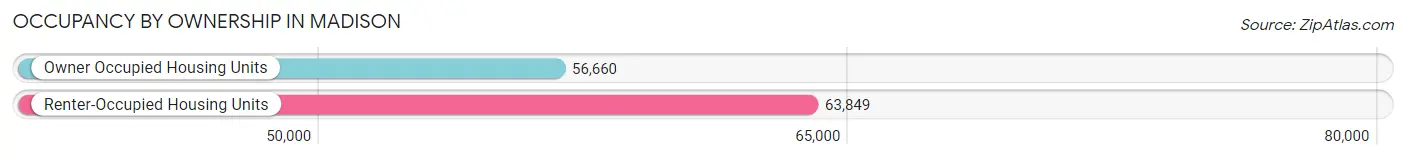
| Occupancy | # Housing Units | % Housing Units |
| Owner Occupied Housing Units | 56,660 | 47.0% |
| Renter-Occupied Housing Units | 63,849 | 53.0% |
| Total Occupied Housing Units | 120,509 | 100.0% |
Occupancy by Household Size in Madison
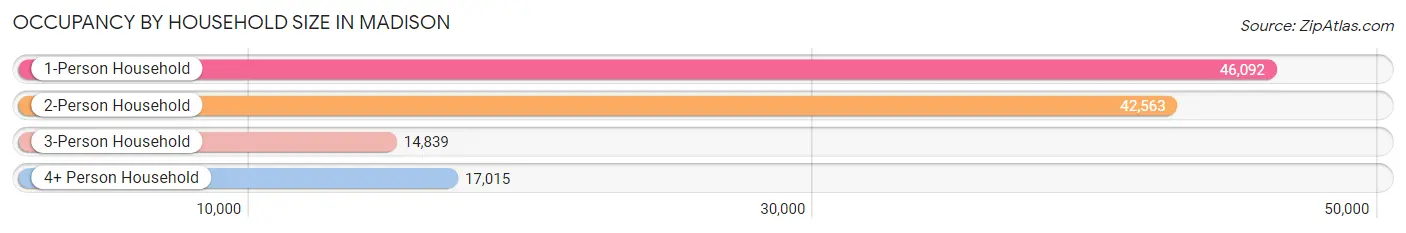
| Household Size | # Housing Units | % Housing Units |
| 1-Person Household | 46,092 | 38.3% |
| 2-Person Household | 42,563 | 35.3% |
| 3-Person Household | 14,839 | 12.3% |
| 4+ Person Household | 17,015 | 14.1% |
| Total Housing Units | 120,509 | 100.0% |
Occupancy by Ownership by Household Size in Madison
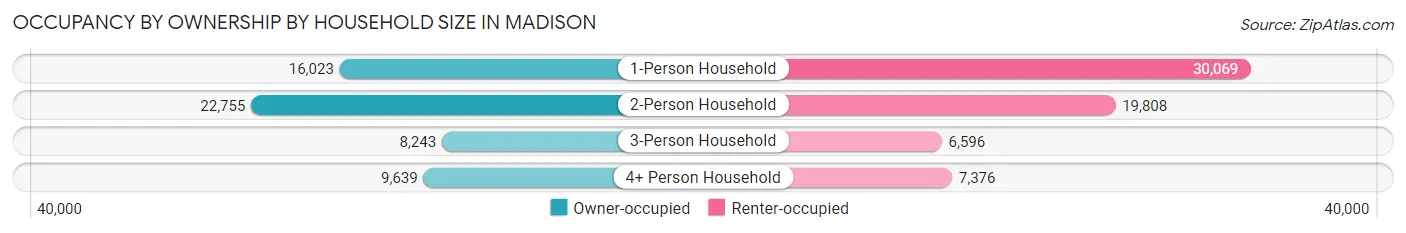
| Household Size | Owner-occupied | Renter-occupied |
| 1-Person Household | 16,023 (34.8%) | 30,069 (65.2%) |
| 2-Person Household | 22,755 (53.5%) | 19,808 (46.5%) |
| 3-Person Household | 8,243 (55.5%) | 6,596 (44.5%) |
| 4+ Person Household | 9,639 (56.7%) | 7,376 (43.3%) |
| Total Housing Units | 56,660 (47.0%) | 63,849 (53.0%) |
Occupancy by Educational Attainment in Madison
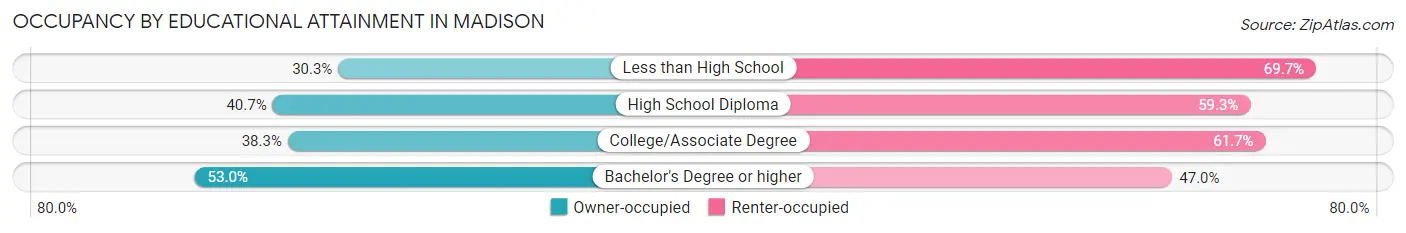
| Household Size | Owner-occupied | Renter-occupied |
| Less than High School | 1,065 (30.3%) | 2,454 (69.7%) |
| High School Diploma | 6,154 (40.7%) | 8,974 (59.3%) |
| College/Associate Degree | 11,836 (38.3%) | 19,103 (61.7%) |
| Bachelor's Degree or higher | 37,605 (53.0%) | 33,318 (47.0%) |
Occupancy by Age of Householder in Madison
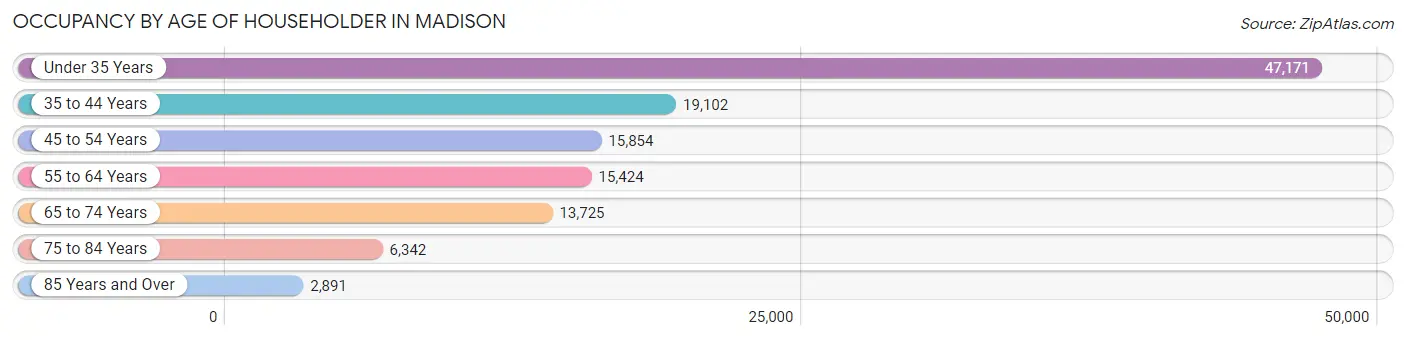
| Age Bracket | # Households | % Households |
| Under 35 Years | 47,171 | 39.1% |
| 35 to 44 Years | 19,102 | 15.9% |
| 45 to 54 Years | 15,854 | 13.2% |
| 55 to 64 Years | 15,424 | 12.8% |
| 65 to 74 Years | 13,725 | 11.4% |
| 75 to 84 Years | 6,342 | 5.3% |
| 85 Years and Over | 2,891 | 2.4% |
| Total | 120,509 | 100.0% |
Housing Finances in Madison
Median Income by Occupancy in Madison
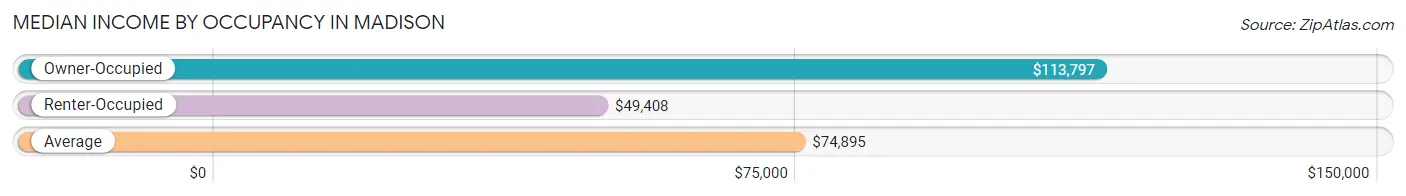
| Occupancy Type | # Households | Median Income |
| Owner-Occupied | 56,660 (47.0%) | $113,797 |
| Renter-Occupied | 63,849 (53.0%) | $49,408 |
| Average | 120,509 (100.0%) | $74,895 |
Occupancy by Householder Income Bracket in Madison
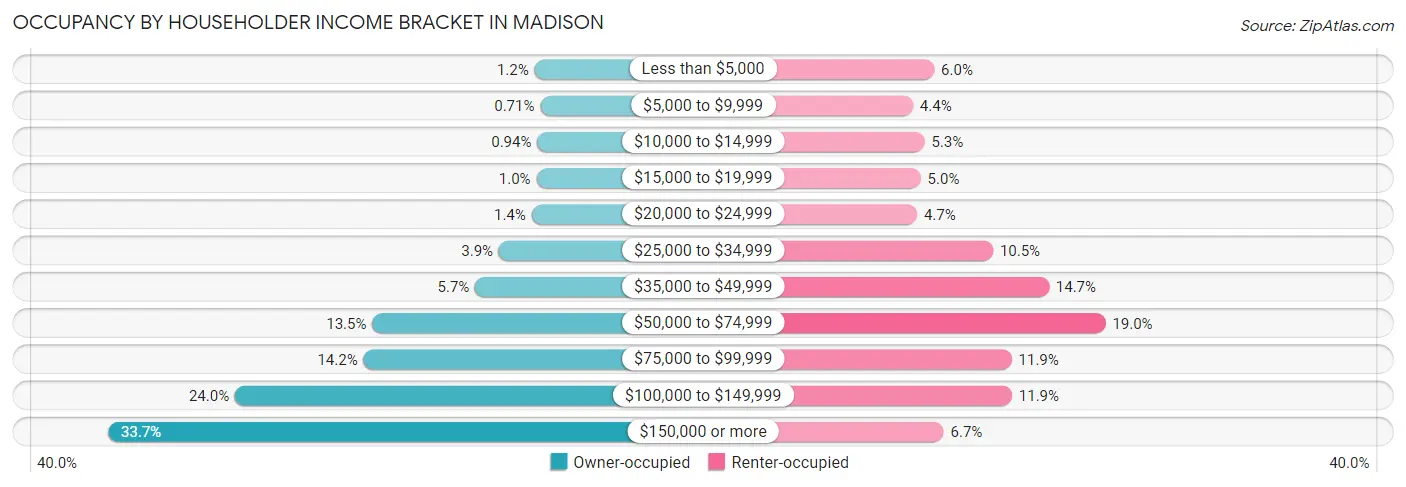
| Income Bracket | Owner-occupied | Renter-occupied |
| Less than $5,000 | 651 (1.1%) | 3,822 (6.0%) |
| $5,000 to $9,999 | 401 (0.7%) | 2,792 (4.4%) |
| $10,000 to $14,999 | 530 (0.9%) | 3,355 (5.2%) |
| $15,000 to $19,999 | 566 (1.0%) | 3,164 (5.0%) |
| $20,000 to $24,999 | 775 (1.4%) | 2,989 (4.7%) |
| $25,000 to $34,999 | 2,187 (3.9%) | 6,683 (10.5%) |
| $35,000 to $49,999 | 3,211 (5.7%) | 9,402 (14.7%) |
| $50,000 to $74,999 | 7,652 (13.5%) | 12,159 (19.0%) |
| $75,000 to $99,999 | 8,037 (14.2%) | 7,594 (11.9%) |
| $100,000 to $149,999 | 13,583 (24.0%) | 7,603 (11.9%) |
| $150,000 or more | 19,067 (33.7%) | 4,286 (6.7%) |
| Total | 56,660 (100.0%) | 63,849 (100.0%) |
Monthly Housing Cost Tiers in Madison
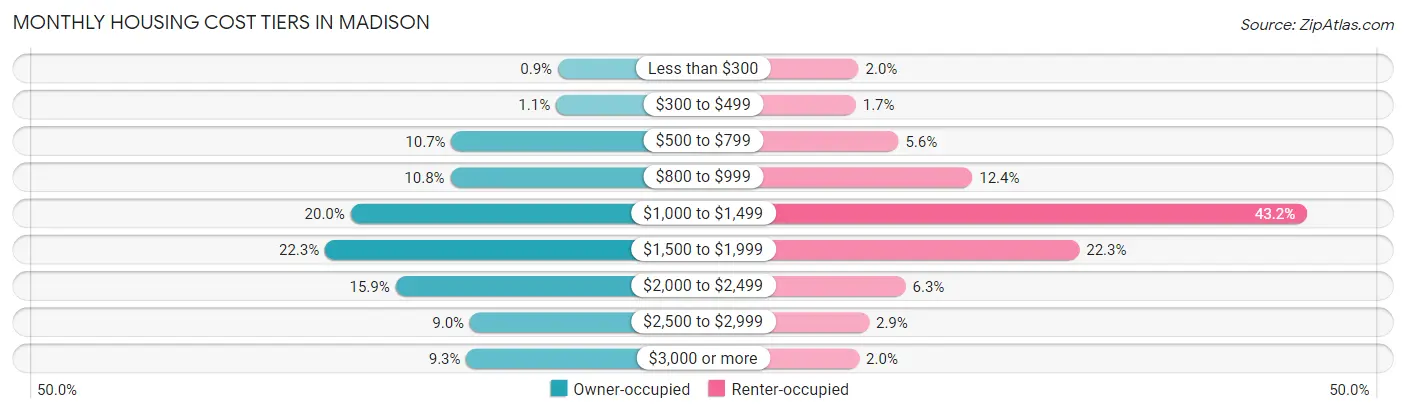
| Monthly Cost | Owner-occupied | Renter-occupied |
| Less than $300 | 512 (0.9%) | 1,244 (1.9%) |
| $300 to $499 | 613 (1.1%) | 1,079 (1.7%) |
| $500 to $799 | 6,067 (10.7%) | 3,588 (5.6%) |
| $800 to $999 | 6,119 (10.8%) | 7,927 (12.4%) |
| $1,000 to $1,499 | 11,329 (20.0%) | 27,603 (43.2%) |
| $1,500 to $1,999 | 12,656 (22.3%) | 14,222 (22.3%) |
| $2,000 to $2,499 | 8,980 (15.9%) | 4,008 (6.3%) |
| $2,500 to $2,999 | 5,098 (9.0%) | 1,857 (2.9%) |
| $3,000 or more | 5,286 (9.3%) | 1,277 (2.0%) |
| Total | 56,660 (100.0%) | 63,849 (100.0%) |
Physical Housing Characteristics in Madison
Housing Structures in Madison
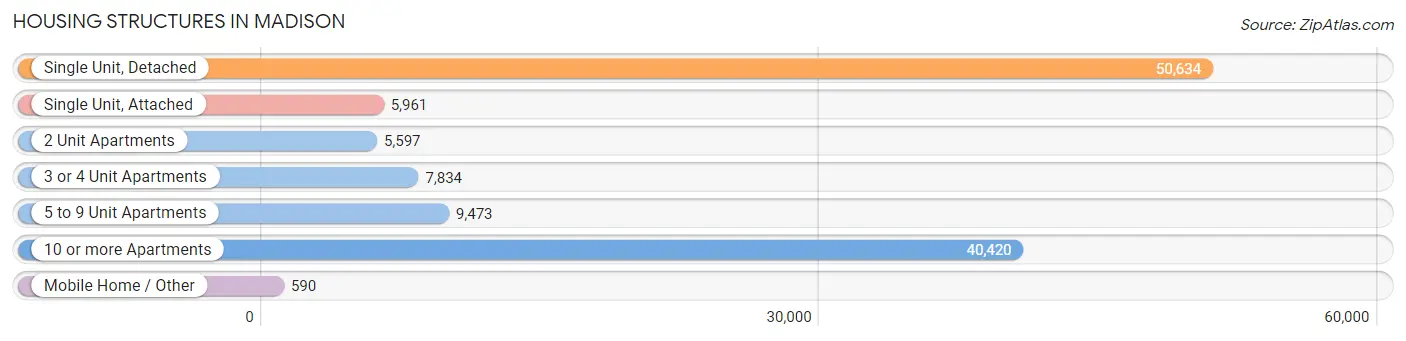
| Structure Type | # Housing Units | % Housing Units |
| Single Unit, Detached | 50,634 | 42.0% |
| Single Unit, Attached | 5,961 | 5.0% |
| 2 Unit Apartments | 5,597 | 4.6% |
| 3 or 4 Unit Apartments | 7,834 | 6.5% |
| 5 to 9 Unit Apartments | 9,473 | 7.9% |
| 10 or more Apartments | 40,420 | 33.5% |
| Mobile Home / Other | 590 | 0.5% |
| Total | 120,509 | 100.0% |
Housing Structures by Occupancy in Madison
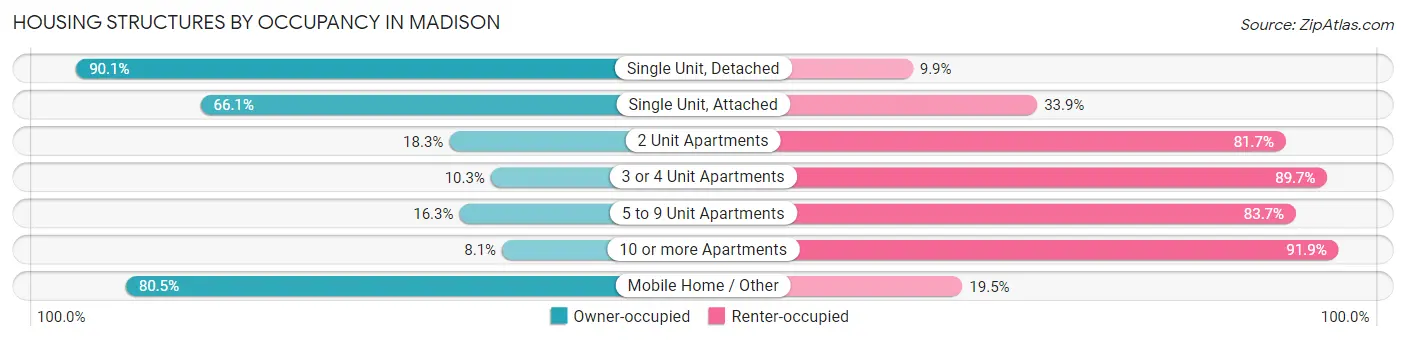
| Structure Type | Owner-occupied | Renter-occupied |
| Single Unit, Detached | 45,602 (90.1%) | 5,032 (9.9%) |
| Single Unit, Attached | 3,941 (66.1%) | 2,020 (33.9%) |
| 2 Unit Apartments | 1,022 (18.3%) | 4,575 (81.7%) |
| 3 or 4 Unit Apartments | 804 (10.3%) | 7,030 (89.7%) |
| 5 to 9 Unit Apartments | 1,545 (16.3%) | 7,928 (83.7%) |
| 10 or more Apartments | 3,271 (8.1%) | 37,149 (91.9%) |
| Mobile Home / Other | 475 (80.5%) | 115 (19.5%) |
| Total | 56,660 (47.0%) | 63,849 (53.0%) |
Housing Structures by Number of Rooms in Madison
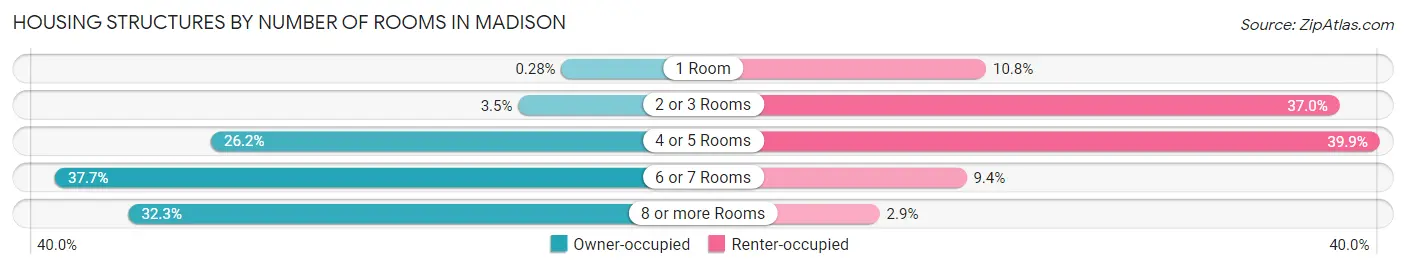
| Number of Rooms | Owner-occupied | Renter-occupied |
| 1 Room | 157 (0.3%) | 6,901 (10.8%) |
| 2 or 3 Rooms | 1,965 (3.5%) | 23,599 (37.0%) |
| 4 or 5 Rooms | 14,846 (26.2%) | 25,494 (39.9%) |
| 6 or 7 Rooms | 21,386 (37.7%) | 5,976 (9.4%) |
| 8 or more Rooms | 18,306 (32.3%) | 1,879 (2.9%) |
| Total | 56,660 (100.0%) | 63,849 (100.0%) |
Housing Structure by Heating Type in Madison
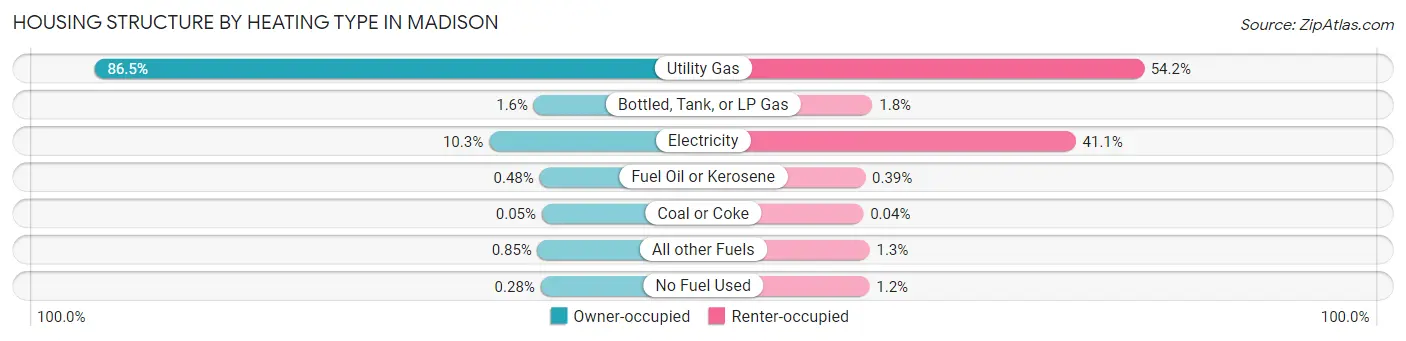
| Heating Type | Owner-occupied | Renter-occupied |
| Utility Gas | 49,006 (86.5%) | 34,631 (54.2%) |
| Bottled, Tank, or LP Gas | 903 (1.6%) | 1,142 (1.8%) |
| Electricity | 5,816 (10.3%) | 26,229 (41.1%) |
| Fuel Oil or Kerosene | 271 (0.5%) | 249 (0.4%) |
| Coal or Coke | 26 (0.1%) | 25 (0.0%) |
| All other Fuels | 479 (0.9%) | 796 (1.3%) |
| No Fuel Used | 159 (0.3%) | 777 (1.2%) |
| Total | 56,660 (100.0%) | 63,849 (100.0%) |
Household Vehicle Usage in Madison
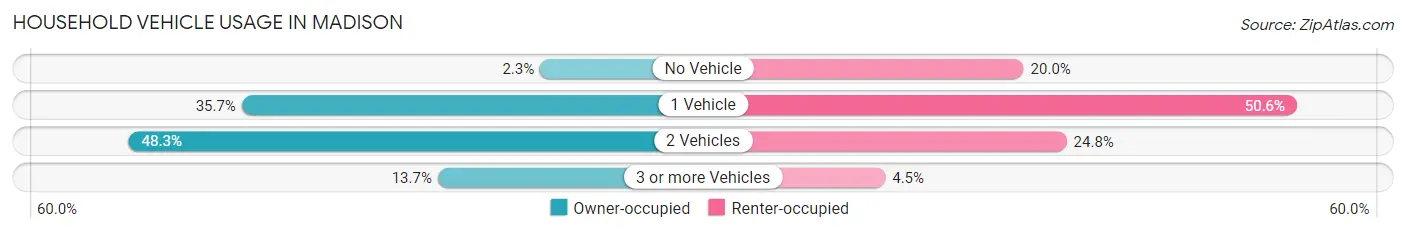
| Vehicles per Household | Owner-occupied | Renter-occupied |
| No Vehicle | 1,278 (2.3%) | 12,780 (20.0%) |
| 1 Vehicle | 20,217 (35.7%) | 32,318 (50.6%) |
| 2 Vehicles | 27,392 (48.3%) | 15,863 (24.8%) |
| 3 or more Vehicles | 7,773 (13.7%) | 2,888 (4.5%) |
| Total | 56,660 (100.0%) | 63,849 (100.0%) |
Real Estate & Mortgages in Madison
Real Estate and Mortgage Overview in Madison
| Characteristic | Without Mortgage | With Mortgage |
| Housing Units | 18,013 | 38,647 |
| Median Property Value | $326,600 | $326,600 |
| Median Household Income | $95,098 | $14,050 |
| Monthly Housing Costs | $887 | $5,070 |
| Real Estate Taxes | $6,345 | $418 |
Property Value by Mortgage Status in Madison
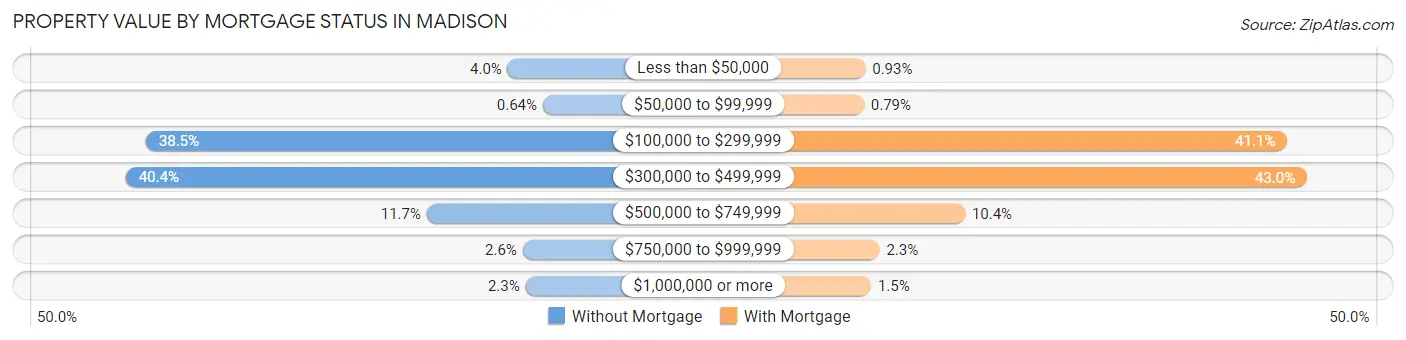
| Property Value | Without Mortgage | With Mortgage |
| Less than $50,000 | 718 (4.0%) | 359 (0.9%) |
| $50,000 to $99,999 | 116 (0.6%) | 305 (0.8%) |
| $100,000 to $299,999 | 6,926 (38.5%) | 15,890 (41.1%) |
| $300,000 to $499,999 | 7,271 (40.4%) | 16,617 (43.0%) |
| $500,000 to $749,999 | 2,107 (11.7%) | 4,027 (10.4%) |
| $750,000 to $999,999 | 462 (2.6%) | 882 (2.3%) |
| $1,000,000 or more | 413 (2.3%) | 567 (1.5%) |
| Total | 18,013 (100.0%) | 38,647 (100.0%) |
Household Income by Mortgage Status in Madison
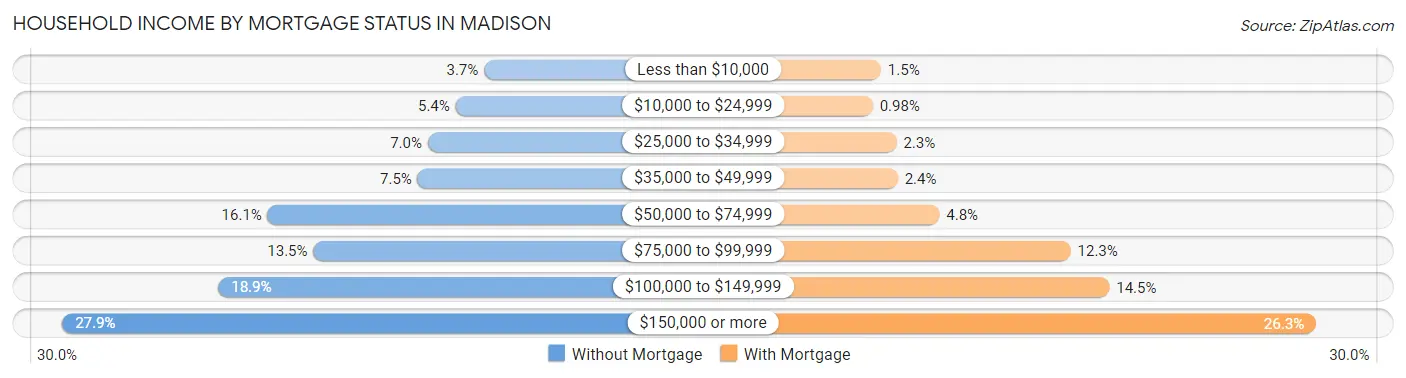
| Household Income | Without Mortgage | With Mortgage |
| Less than $10,000 | 673 (3.7%) | 562 (1.5%) |
| $10,000 to $24,999 | 968 (5.4%) | 379 (1.0%) |
| $25,000 to $34,999 | 1,254 (7.0%) | 903 (2.3%) |
| $35,000 to $49,999 | 1,358 (7.5%) | 933 (2.4%) |
| $50,000 to $74,999 | 2,901 (16.1%) | 1,853 (4.8%) |
| $75,000 to $99,999 | 2,432 (13.5%) | 4,751 (12.3%) |
| $100,000 to $149,999 | 3,410 (18.9%) | 5,605 (14.5%) |
| $150,000 or more | 5,017 (27.9%) | 10,173 (26.3%) |
| Total | 18,013 (100.0%) | 38,647 (100.0%) |
Property Value to Household Income Ratio in Madison
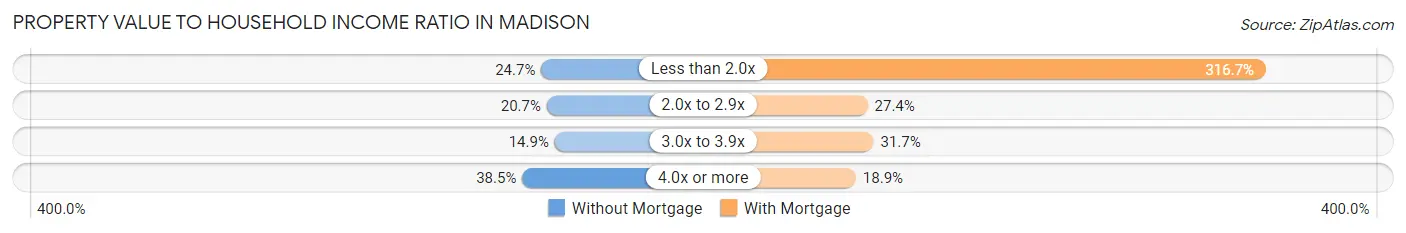
| Value-to-Income Ratio | Without Mortgage | With Mortgage |
| Less than 2.0x | 4,446 (24.7%) | 122,398 (316.7%) |
| 2.0x to 2.9x | 3,720 (20.6%) | 10,577 (27.4%) |
| 3.0x to 3.9x | 2,679 (14.9%) | 12,239 (31.7%) |
| 4.0x or more | 6,934 (38.5%) | 7,293 (18.9%) |
| Total | 18,013 (100.0%) | 38,647 (100.0%) |
Real Estate Taxes by Mortgage Status in Madison
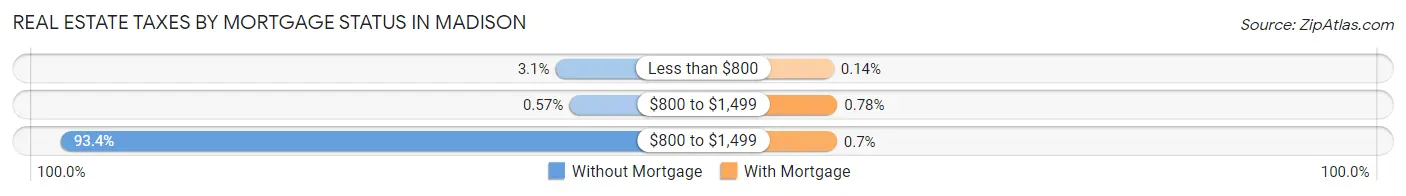
| Property Taxes | Without Mortgage | With Mortgage |
| Less than $800 | 553 (3.1%) | 54 (0.1%) |
| $800 to $1,499 | 103 (0.6%) | 300 (0.8%) |
| $800 to $1,499 | 16,817 (93.4%) | 270 (0.7%) |
| Total | 18,013 (100.0%) | 38,647 (100.0%) |
Health & Disability in Madison
Health Insurance Coverage by Age in Madison
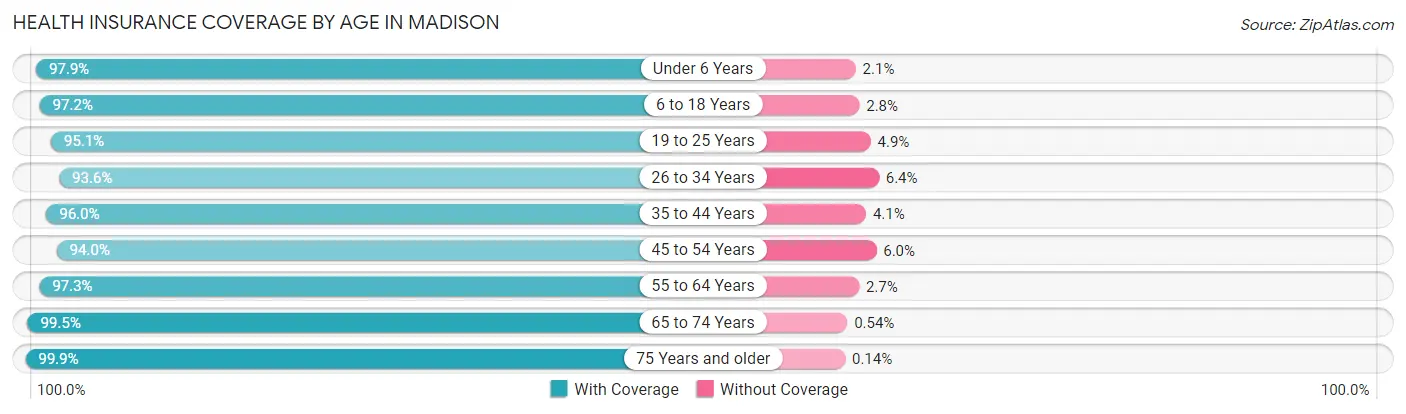
| Age Bracket | With Coverage | Without Coverage |
| Under 6 Years | 15,269 (97.9%) | 330 (2.1%) |
| 6 to 18 Years | 34,134 (97.2%) | 981 (2.8%) |
| 19 to 25 Years | 51,329 (95.1%) | 2,653 (4.9%) |
| 26 to 34 Years | 41,542 (93.6%) | 2,856 (6.4%) |
| 35 to 44 Years | 31,824 (96.0%) | 1,345 (4.1%) |
| 45 to 54 Years | 24,067 (94.0%) | 1,526 (6.0%) |
| 55 to 64 Years | 24,576 (97.3%) | 689 (2.7%) |
| 65 to 74 Years | 20,349 (99.5%) | 111 (0.5%) |
| 75 Years and older | 13,188 (99.9%) | 18 (0.1%) |
| Total | 256,278 (96.1%) | 10,509 (3.9%) |
Health Insurance Coverage by Citizenship Status in Madison
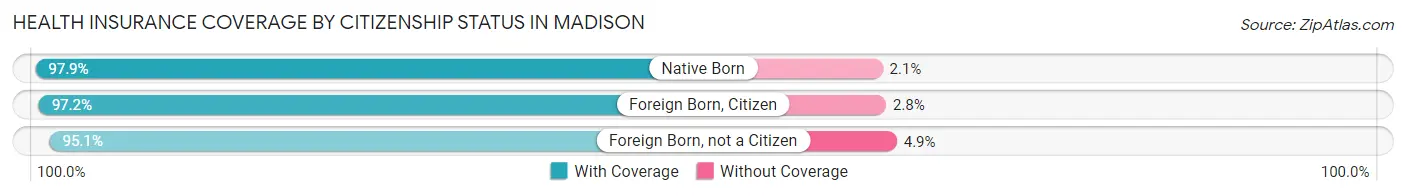
| Citizenship Status | With Coverage | Without Coverage |
| Native Born | 15,269 (97.9%) | 330 (2.1%) |
| Foreign Born, Citizen | 34,134 (97.2%) | 981 (2.8%) |
| Foreign Born, not a Citizen | 51,329 (95.1%) | 2,653 (4.9%) |
Health Insurance Coverage by Household Income in Madison
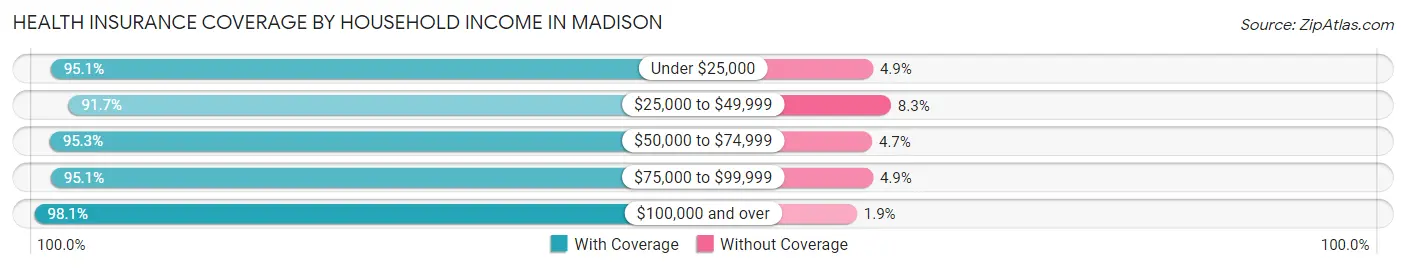
| Household Income | With Coverage | Without Coverage |
| Under $25,000 | 31,335 (95.1%) | 1,613 (4.9%) |
| $25,000 to $49,999 | 34,488 (91.7%) | 3,105 (8.3%) |
| $50,000 to $74,999 | 35,590 (95.3%) | 1,768 (4.7%) |
| $75,000 to $99,999 | 31,953 (95.1%) | 1,654 (4.9%) |
| $100,000 and over | 111,998 (98.1%) | 2,150 (1.9%) |
Public vs Private Health Insurance Coverage by Age in Madison
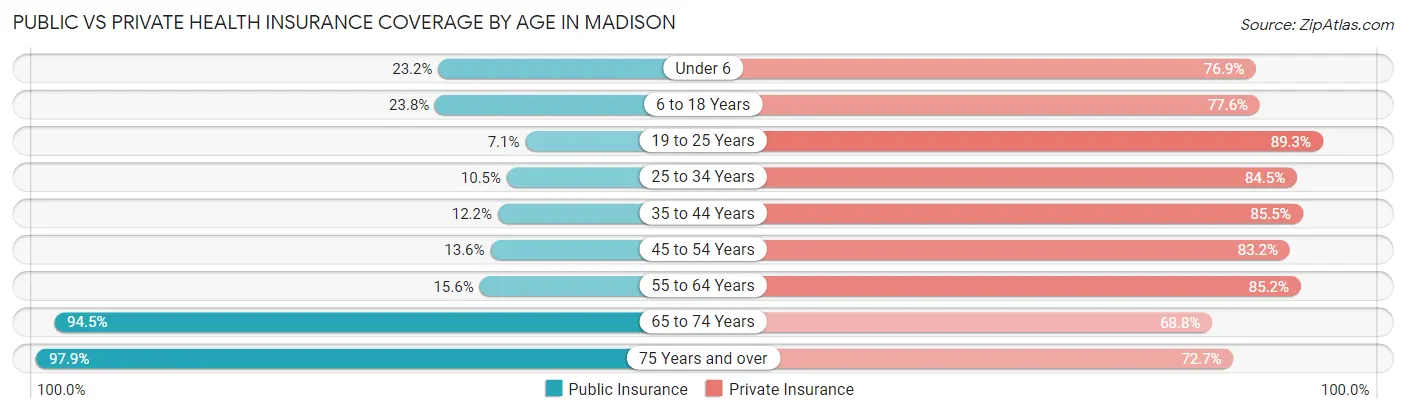
| Age Bracket | Public Insurance | Private Insurance |
| Under 6 | 3,621 (23.2%) | 11,995 (76.9%) |
| 6 to 18 Years | 8,359 (23.8%) | 27,252 (77.6%) |
| 19 to 25 Years | 3,810 (7.1%) | 48,192 (89.3%) |
| 25 to 34 Years | 4,658 (10.5%) | 37,517 (84.5%) |
| 35 to 44 Years | 4,032 (12.2%) | 28,370 (85.5%) |
| 45 to 54 Years | 3,468 (13.6%) | 21,280 (83.2%) |
| 55 to 64 Years | 3,935 (15.6%) | 21,525 (85.2%) |
| 65 to 74 Years | 19,336 (94.5%) | 14,066 (68.8%) |
| 75 Years and over | 12,926 (97.9%) | 9,599 (72.7%) |
| Total | 64,145 (24.0%) | 219,796 (82.4%) |
Disability Status by Sex by Age in Madison
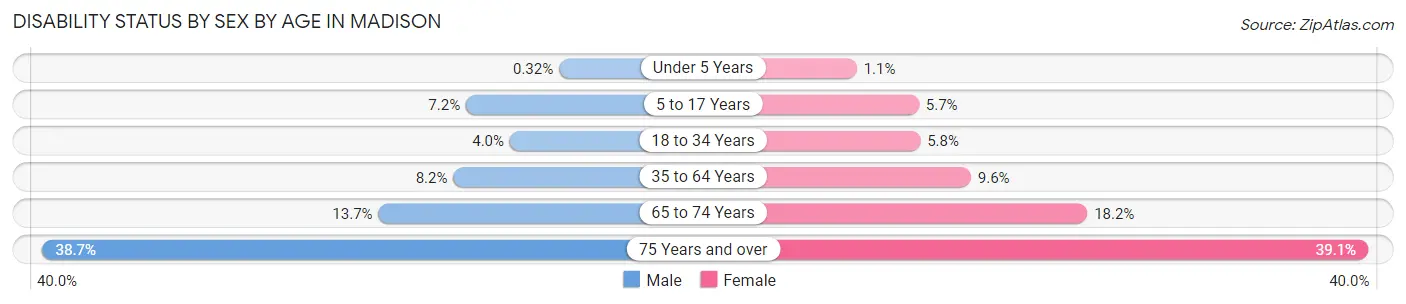
| Age Bracket | Male | Female |
| Under 5 Years | 22 (0.3%) | 71 (1.1%) |
| 5 to 17 Years | 1,079 (7.2%) | 874 (5.7%) |
| 18 to 34 Years | 2,159 (4.0%) | 2,980 (5.8%) |
| 35 to 64 Years | 3,452 (8.2%) | 4,002 (9.6%) |
| 65 to 74 Years | 1,310 (13.7%) | 1,990 (18.2%) |
| 75 Years and over | 2,174 (38.7%) | 2,962 (39.1%) |
Disability Class by Sex by Age in Madison
Disability Class: Hearing Difficulty
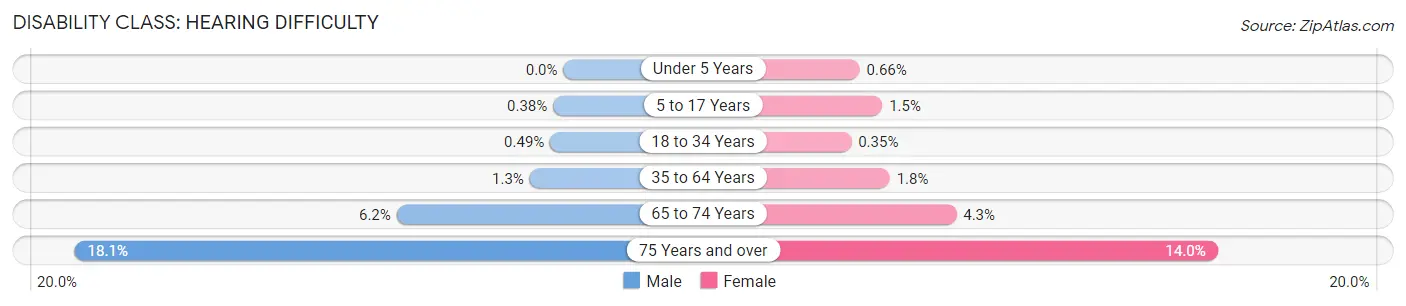
| Age Bracket | Male | Female |
| Under 5 Years | 0 (0.0%) | 42 (0.7%) |
| 5 to 17 Years | 57 (0.4%) | 230 (1.5%) |
| 18 to 34 Years | 268 (0.5%) | 177 (0.4%) |
| 35 to 64 Years | 526 (1.3%) | 743 (1.8%) |
| 65 to 74 Years | 590 (6.2%) | 464 (4.3%) |
| 75 Years and over | 1,020 (18.1%) | 1,058 (14.0%) |
Disability Class: Vision Difficulty
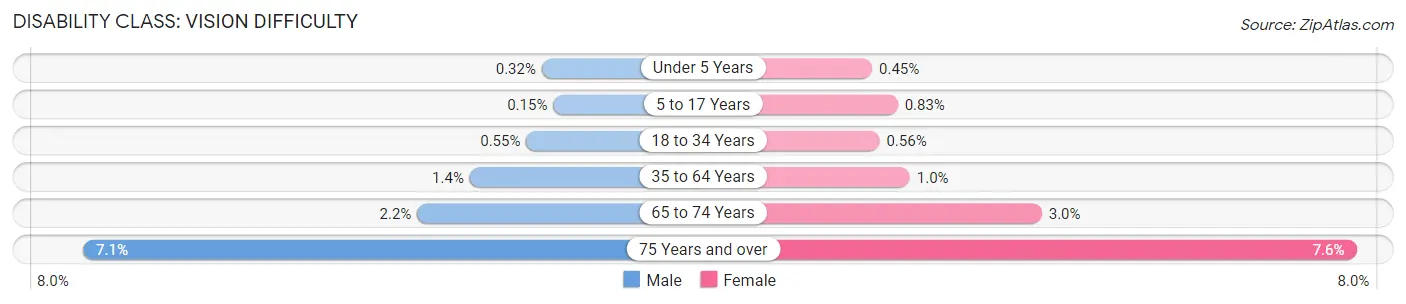
| Age Bracket | Male | Female |
| Under 5 Years | 22 (0.3%) | 29 (0.4%) |
| 5 to 17 Years | 23 (0.2%) | 127 (0.8%) |
| 18 to 34 Years | 299 (0.5%) | 287 (0.6%) |
| 35 to 64 Years | 588 (1.4%) | 424 (1.0%) |
| 65 to 74 Years | 207 (2.2%) | 324 (3.0%) |
| 75 Years and over | 401 (7.1%) | 579 (7.6%) |
Disability Class: Cognitive Difficulty
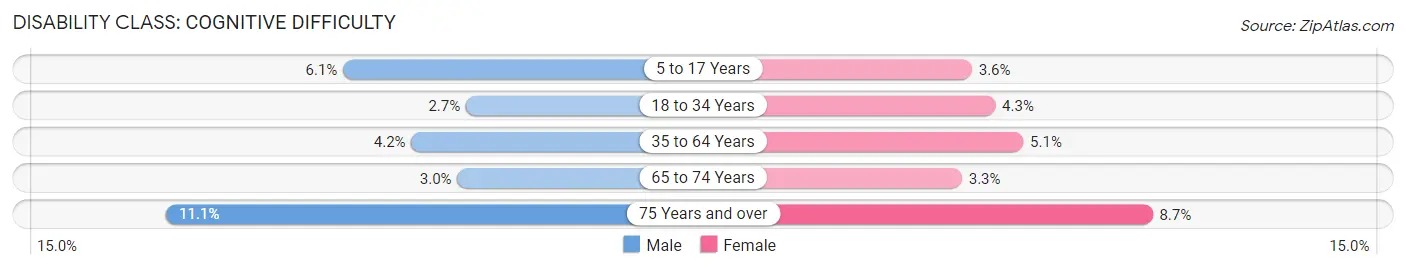
| Age Bracket | Male | Female |
| 5 to 17 Years | 916 (6.1%) | 553 (3.6%) |
| 18 to 34 Years | 1,475 (2.7%) | 2,186 (4.3%) |
| 35 to 64 Years | 1,788 (4.2%) | 2,110 (5.1%) |
| 65 to 74 Years | 281 (2.9%) | 365 (3.3%) |
| 75 Years and over | 622 (11.1%) | 656 (8.6%) |
Disability Class: Ambulatory Difficulty
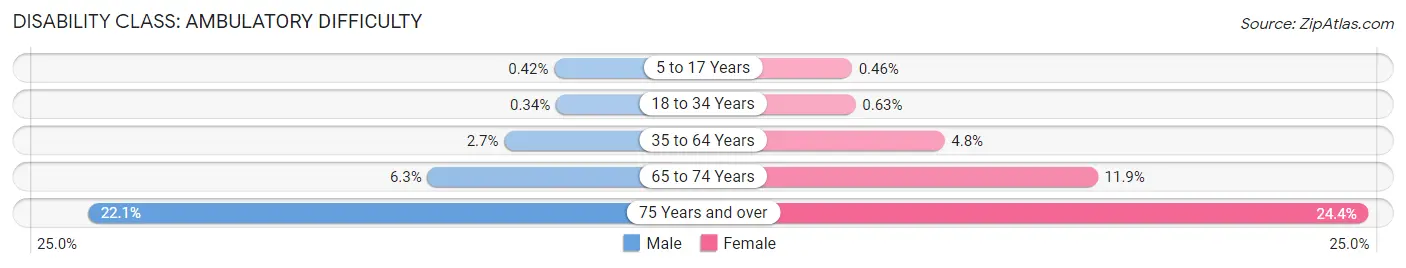
| Age Bracket | Male | Female |
| 5 to 17 Years | 62 (0.4%) | 71 (0.5%) |
| 18 to 34 Years | 185 (0.3%) | 325 (0.6%) |
| 35 to 64 Years | 1,156 (2.7%) | 1,991 (4.8%) |
| 65 to 74 Years | 601 (6.3%) | 1,296 (11.9%) |
| 75 Years and over | 1,241 (22.1%) | 1,853 (24.4%) |
Disability Class: Self-Care Difficulty
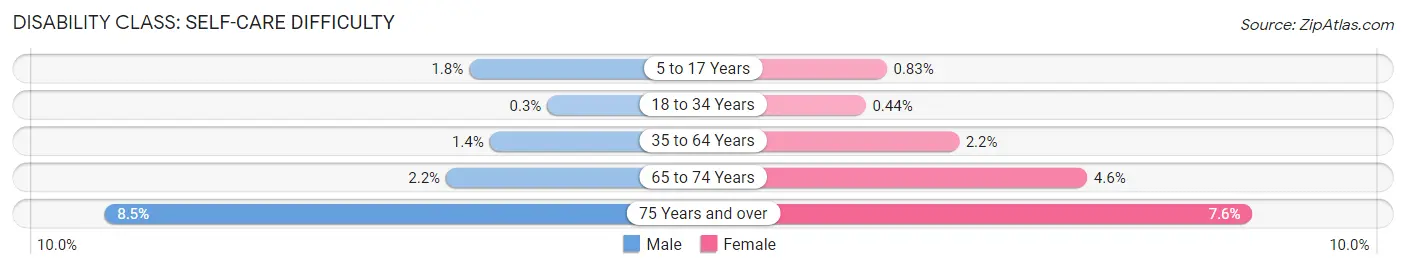
| Age Bracket | Male | Female |
| 5 to 17 Years | 262 (1.8%) | 127 (0.8%) |
| 18 to 34 Years | 162 (0.3%) | 225 (0.4%) |
| 35 to 64 Years | 580 (1.4%) | 905 (2.2%) |
| 65 to 74 Years | 208 (2.2%) | 497 (4.5%) |
| 75 Years and over | 479 (8.5%) | 578 (7.6%) |
Technology Access in Madison
Computing Device Access in Madison
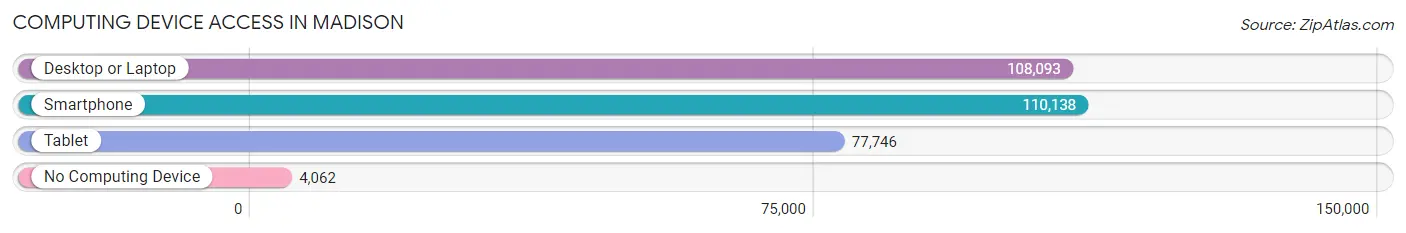
| Device Type | # Households | % Households |
| Desktop or Laptop | 108,093 | 89.7% |
| Smartphone | 110,138 | 91.4% |
| Tablet | 77,746 | 64.5% |
| No Computing Device | 4,062 | 3.4% |
| Total | 120,509 | 100.0% |
Internet Access in Madison
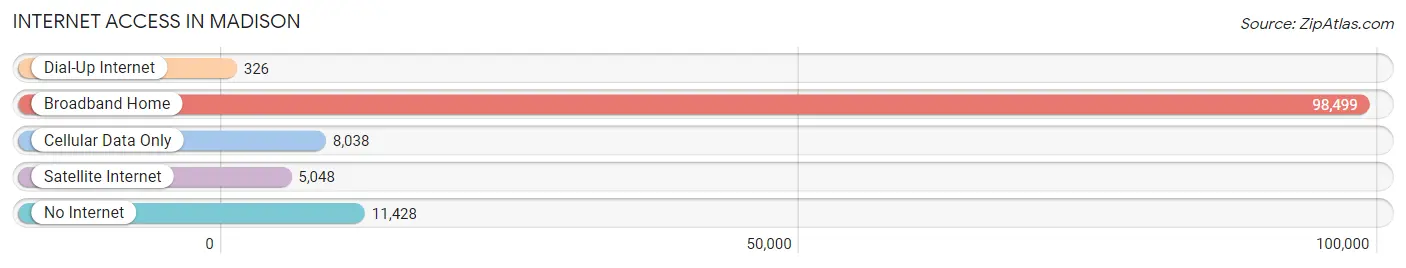
| Internet Type | # Households | % Households |
| Dial-Up Internet | 326 | 0.3% |
| Broadband Home | 98,499 | 81.7% |
| Cellular Data Only | 8,038 | 6.7% |
| Satellite Internet | 5,048 | 4.2% |
| No Internet | 11,428 | 9.5% |
| Total | 120,509 | 100.0% |
Madison Summary
Madison, Wisconsin is the capital of the state and the second largest city in Wisconsin. It is located in the south-central part of the state, on an isthmus between Lakes Mendota and Monona. The city is home to the University of Wisconsin–Madison, the state’s flagship university, and is the county seat of Dane County.
History
The area that is now Madison was originally inhabited by the Ho-Chunk Native American tribe. The first permanent settlers arrived in the area in 1829, and the city was officially founded in 1836. The city was named after James Madison, the fourth President of the United States.
In the mid-19th century, Madison became a center for the abolitionist movement, and the city was a major stop on the Underground Railroad. During the Civil War, Madison was a major supplier of food and other supplies to the Union Army.
In the late 19th century, Madison became a major center for the dairy industry, and the city is still known as “America’s Dairyland.” The University of Wisconsin–Madison was founded in 1848, and the city has been a major center for education and research ever since.
Geography
Madison is located in south-central Wisconsin, on an isthmus between Lakes Mendota and Monona. The city is surrounded by several smaller lakes, including Lake Wingra, Lake Waubesa, and Lake Kegonsa. The city is located at the confluence of the Yahara and Rock Rivers.
The city has a total area of 94.03 square miles, of which 88.45 square miles is land and 5.58 square miles is water. The city is located at an elevation of 830 feet above sea level.
Economy
Madison’s economy is largely driven by the University of Wisconsin–Madison, which is the city’s largest employer. Other major employers in the city include the state government, Epic Systems, American Family Insurance, and the University of Wisconsin Hospital and Clinics.
The city is also home to a number of technology companies, including Google, Microsoft, and Oracle. Madison is also home to a number of biotechnology companies, including Promega and Exact Sciences.
Demographics
As of the 2010 census, Madison had a population of 233,209. The city’s population is racially and ethnically diverse, with the largest racial/ethnic groups being White (68.2%), African American (7.2%), Asian (5.7%), and Hispanic or Latino (5.3%).
The median household income in Madison is $54,811, and the median family income is $68,902. The city’s poverty rate is 11.7%. The city’s population is well-educated, with over 50% of the population having a bachelor’s degree or higher.
Conclusion
Madison, Wisconsin is the capital of the state and the second largest city in Wisconsin. It is located in the south-central part of the state, on an isthmus between Lakes Mendota and Monona. The city has a long and rich history, and is home to the University of Wisconsin–Madison, the state’s flagship university. The city’s economy is largely driven by the university, as well as the state government and a number of technology and biotechnology companies. The city’s population is racially and ethnically diverse, and is well-educated, with over 50% of the population having a bachelor’s degree or higher.
Common Questions
What is Per Capita Income in Madison?
Per Capita income in Madison is $46,652.
What is the Median Family Income in Madison?
Median Family Income in Madison is $111,576.
What is the Median Household income in Madison?
Median Household Income in Madison is $74,895.
What is Income or Wage Gap in Madison?
Income or Wage Gap in Madison is 20.6%.
Women in Madison earn 79.4 cents for every dollar earned by a man.
What is Family Income Deficit in Madison?
Family Income Deficit in Madison is $9,994.
Families that are below poverty line in Madison earn $9,994 less on average than the poverty threshold level.
What is Inequality or Gini Index in Madison?
Inequality or Gini Index in Madison is 0.47.
What is the Total Population of Madison?
Total Population of Madison is 268,516.
What is the Total Male Population of Madison?
Total Male Population of Madison is 134,672.
What is the Total Female Population of Madison?
Total Female Population of Madison is 133,844.
What is the Ratio of Males per 100 Females in Madison?
There are 100.62 Males per 100 Females in Madison.
What is the Ratio of Females per 100 Males in Madison?
There are 99.39 Females per 100 Males in Madison.
What is the Median Population Age in Madison?
Median Population Age in Madison is 31.6 Years.
What is the Average Family Size in Madison
Average Family Size in Madison is 2.9 People.
What is the Average Household Size in Madison
Average Household Size in Madison is 2.1 People.
How Large is the Labor Force in Madison?
There are 161,229 People in the Labor Forcein in Madison.
What is the Percentage of People in the Labor Force in Madison?
70.4% of People are in the Labor Force in Madison.
What is the Unemployment Rate in Madison?
Unemployment Rate in Madison is 2.6%.