Enterprise, NV Map & Demographics
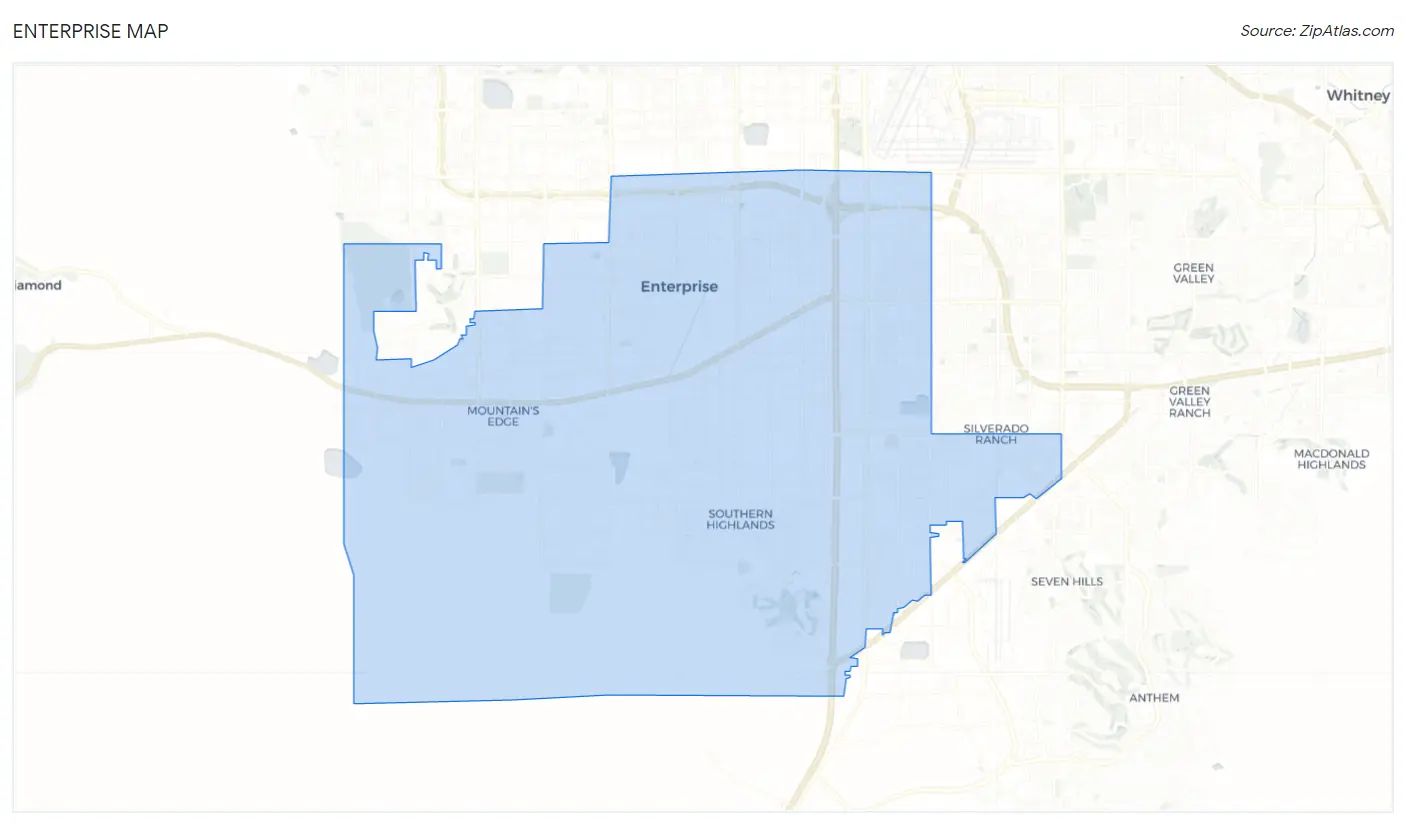
Enterprise Map
Enterprise Overview
$41,717
PER CAPITA INCOME
$98,462
AVG FAMILY INCOME
$91,165
AVG HOUSEHOLD INCOME
16.2%
WAGE / INCOME GAP [ % ]
83.8¢/ $1
WAGE / INCOME GAP [ $ ]
$10,910
FAMILY INCOME DEFICIT
0.42
INEQUALITY / GINI INDEX
225,461
TOTAL POPULATION
112,754
MALE POPULATION
112,707
FEMALE POPULATION
100.04
MALES / 100 FEMALES
99.96
FEMALES / 100 MALES
35.6
MEDIAN AGE
3.4
AVG FAMILY SIZE
2.9
AVG HOUSEHOLD SIZE
129,633
LABOR FORCE [ PEOPLE ]
73.3%
PERCENT IN LABOR FORCE
6.6%
UNEMPLOYMENT RATE
Income in Enterprise
Income Overview in Enterprise
Per Capita Income in Enterprise is $41,717, while median incomes of families and households are $98,462 and $91,165 respectively.
| Characteristic | Number | Measure |
| Per Capita Income | 225,461 | $41,717 |
| Median Family Income | 53,221 | $98,462 |
| Mean Family Income | 53,221 | $123,858 |
| Median Household Income | 79,015 | $91,165 |
| Mean Household Income | 79,015 | $115,434 |
| Income Deficit | 53,221 | $10,910 |
| Wage / Income Gap (%) | 225,461 | 16.17% |
| Wage / Income Gap ($) | 225,461 | 83.83¢ per $1 |
| Gini / Inequality Index | 225,461 | 0.42 |
Earnings by Sex in Enterprise
Average Earnings in Enterprise are $46,076, $50,291 for men and $42,161 for women, a difference of 16.2%.
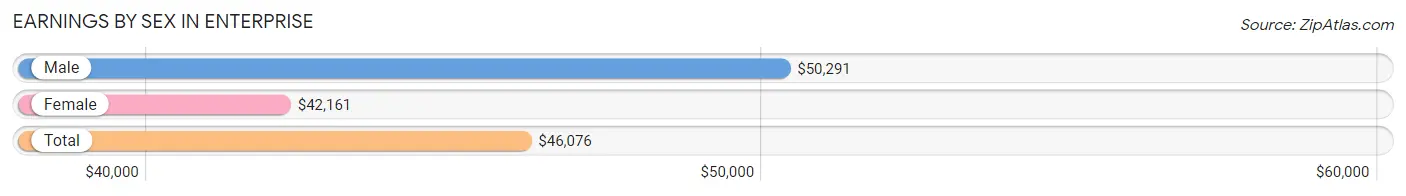
| Sex | Number | Average Earnings |
| Male | 69,231 (52.7%) | $50,291 |
| Female | 62,142 (47.3%) | $42,161 |
| Total | 131,373 (100.0%) | $46,076 |
Earnings by Sex by Income Bracket in Enterprise
The most common earnings brackets in Enterprise are $100,000+ for men (11,704 | 16.9%) and $100,000+ for women (6,955 | 11.2%).
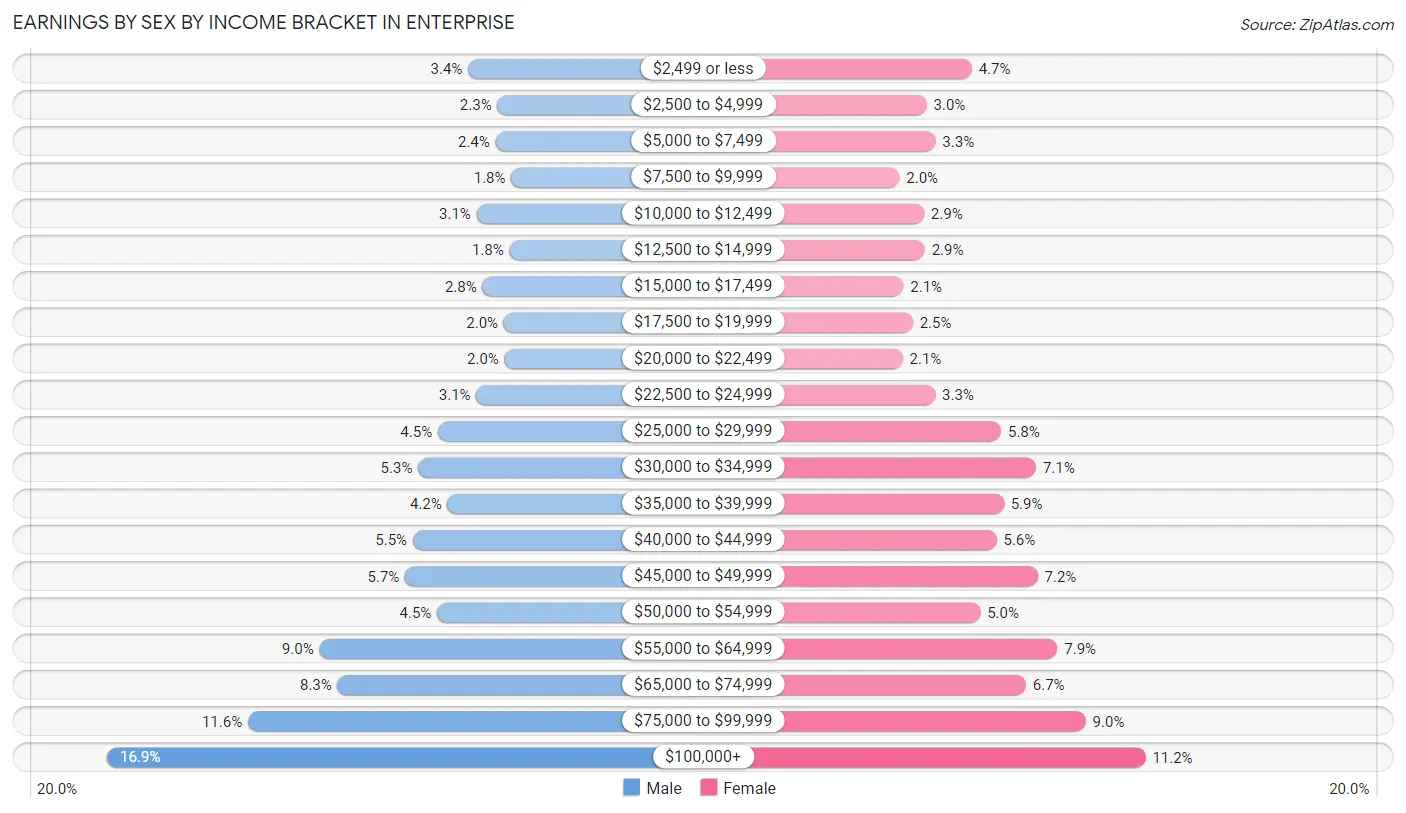
| Income | Male | Female |
| $2,499 or less | 2,337 (3.4%) | 2,907 (4.7%) |
| $2,500 to $4,999 | 1,576 (2.3%) | 1,856 (3.0%) |
| $5,000 to $7,499 | 1,626 (2.4%) | 2,062 (3.3%) |
| $7,500 to $9,999 | 1,217 (1.8%) | 1,225 (2.0%) |
| $10,000 to $12,499 | 2,117 (3.1%) | 1,793 (2.9%) |
| $12,500 to $14,999 | 1,264 (1.8%) | 1,817 (2.9%) |
| $15,000 to $17,499 | 1,965 (2.8%) | 1,319 (2.1%) |
| $17,500 to $19,999 | 1,415 (2.0%) | 1,534 (2.5%) |
| $20,000 to $22,499 | 1,390 (2.0%) | 1,297 (2.1%) |
| $22,500 to $24,999 | 2,125 (3.1%) | 2,059 (3.3%) |
| $25,000 to $29,999 | 3,123 (4.5%) | 3,590 (5.8%) |
| $30,000 to $34,999 | 3,635 (5.2%) | 4,403 (7.1%) |
| $35,000 to $39,999 | 2,872 (4.2%) | 3,654 (5.9%) |
| $40,000 to $44,999 | 3,774 (5.4%) | 3,488 (5.6%) |
| $45,000 to $49,999 | 3,973 (5.7%) | 4,444 (7.1%) |
| $50,000 to $54,999 | 3,145 (4.5%) | 3,107 (5.0%) |
| $55,000 to $64,999 | 6,196 (8.9%) | 4,901 (7.9%) |
| $65,000 to $74,999 | 5,722 (8.3%) | 4,170 (6.7%) |
| $75,000 to $99,999 | 8,055 (11.6%) | 5,561 (8.9%) |
| $100,000+ | 11,704 (16.9%) | 6,955 (11.2%) |
| Total | 69,231 (100.0%) | 62,142 (100.0%) |
Earnings by Sex by Educational Attainment in Enterprise
Average earnings in Enterprise are $55,146 for men and $46,003 for women, a difference of 16.6%. Men with an educational attainment of graduate degree enjoy the highest average annual earnings of $88,285, while those with less than high school education earn the least with $39,022. Women with an educational attainment of graduate degree earn the most with the average annual earnings of $69,594, while those with less than high school education have the smallest earnings of $33,266.
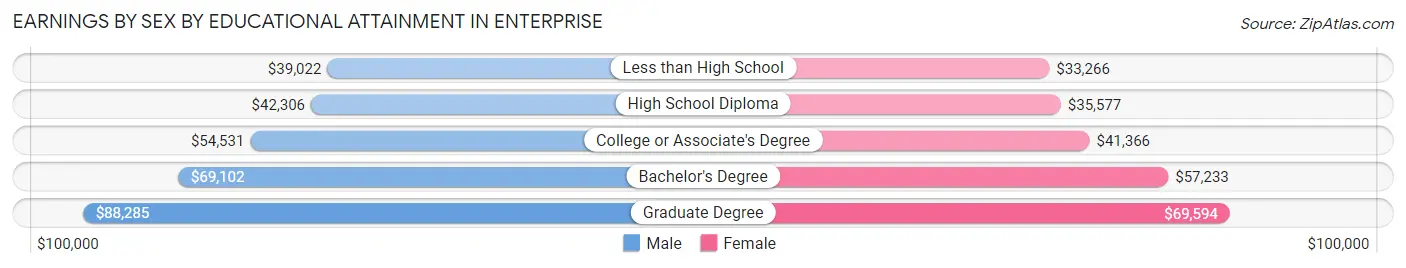
| Educational Attainment | Male Income | Female Income |
| Less than High School | $39,022 | $33,266 |
| High School Diploma | $42,306 | $35,577 |
| College or Associate's Degree | $54,531 | $41,366 |
| Bachelor's Degree | $69,102 | $57,233 |
| Graduate Degree | $88,285 | $69,594 |
| Total | $55,146 | $46,003 |
Family Income in Enterprise
Family Income Brackets in Enterprise
According to the Enterprise family income data, there are 12,188 families falling into the $100,000 to $149,999 income range, which is the most common income bracket and makes up 22.9% of all families. Conversely, the $10,000 to $14,999 income bracket is the least frequent group with only 532 families (1.0%) belonging to this category.
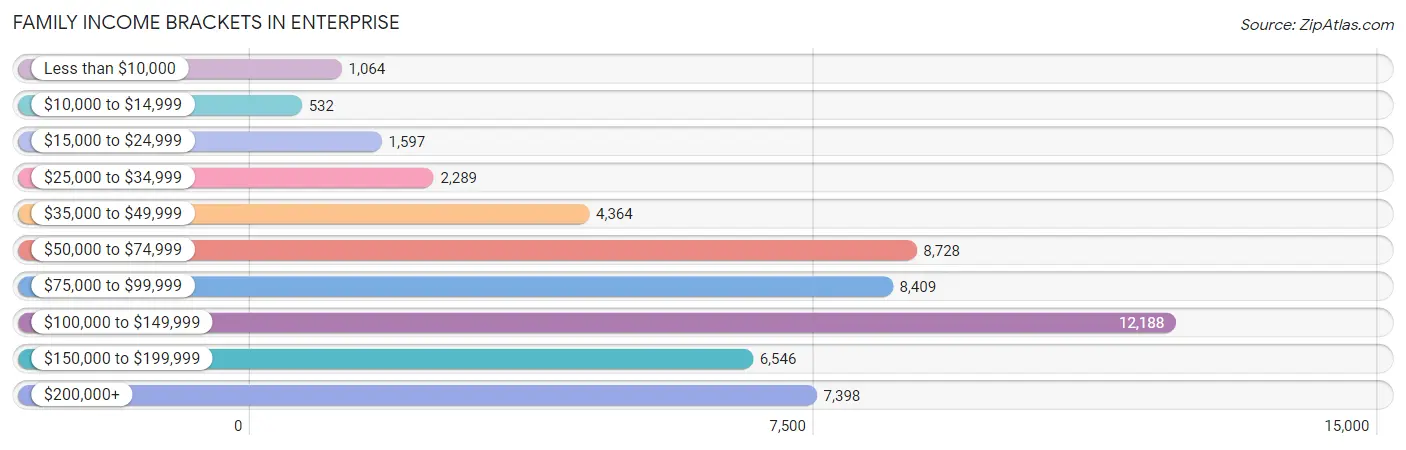
| Income Bracket | # Families | % Families |
| Less than $10,000 | 1,064 | 2.0% |
| $10,000 to $14,999 | 532 | 1.0% |
| $15,000 to $24,999 | 1,597 | 3.0% |
| $25,000 to $34,999 | 2,289 | 4.3% |
| $35,000 to $49,999 | 4,364 | 8.2% |
| $50,000 to $74,999 | 8,728 | 16.4% |
| $75,000 to $99,999 | 8,409 | 15.8% |
| $100,000 to $149,999 | 12,188 | 22.9% |
| $150,000 to $199,999 | 6,546 | 12.3% |
| $200,000+ | 7,398 | 13.9% |
Family Income by Famaliy Size in Enterprise
6-person families (1,921 | 3.6%) account for the highest median family income in Enterprise with $122,781 per family, while 2-person families (21,424 | 40.3%) have the highest median income of $46,344 per family member.
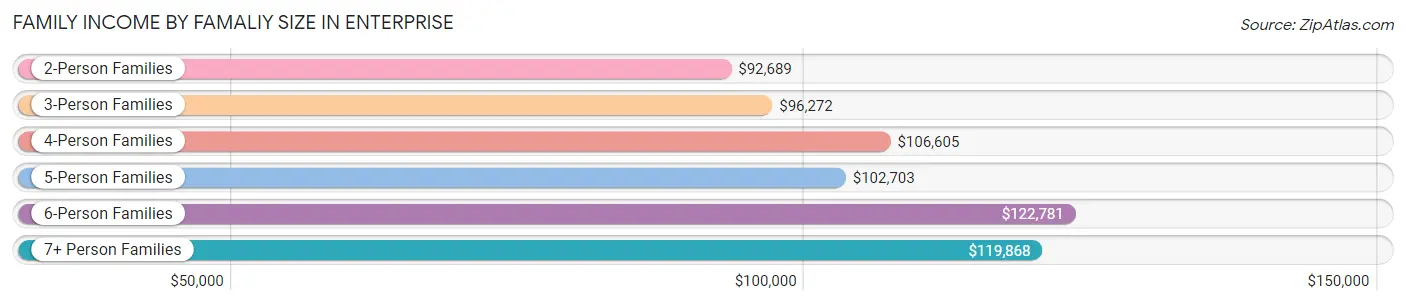
| Income Bracket | # Families | Median Income |
| 2-Person Families | 21,424 (40.3%) | $92,689 |
| 3-Person Families | 12,015 (22.6%) | $96,272 |
| 4-Person Families | 11,555 (21.7%) | $106,605 |
| 5-Person Families | 5,388 (10.1%) | $102,703 |
| 6-Person Families | 1,921 (3.6%) | $122,781 |
| 7+ Person Families | 918 (1.7%) | $119,868 |
| Total | 53,221 (100.0%) | $98,462 |
Family Income by Number of Earners in Enterprise
The median family income in Enterprise is $98,462, with families comprising 3+ earners (8,052) having the highest median family income of $136,457, while families with no earners (4,462) have the lowest median family income of $60,394, accounting for 15.1% and 8.4% of families, respectively.
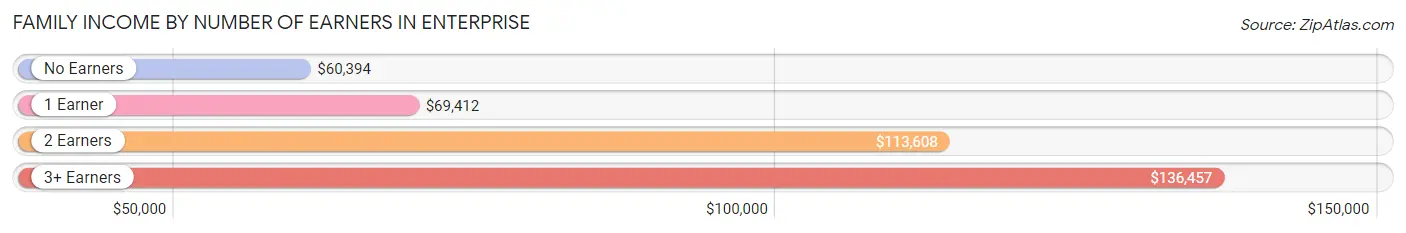
| Number of Earners | # Families | Median Income |
| No Earners | 4,462 (8.4%) | $60,394 |
| 1 Earner | 16,274 (30.6%) | $69,412 |
| 2 Earners | 24,433 (45.9%) | $113,608 |
| 3+ Earners | 8,052 (15.1%) | $136,457 |
| Total | 53,221 (100.0%) | $98,462 |
Household Income in Enterprise
Household Income Brackets in Enterprise
With 17,146 households falling in the category, the $100,000 to $149,999 income range is the most frequent in Enterprise, accounting for 21.7% of all households. In contrast, only 1,501 households (1.9%) fall into the $10,000 to $14,999 income bracket, making it the least populous group.
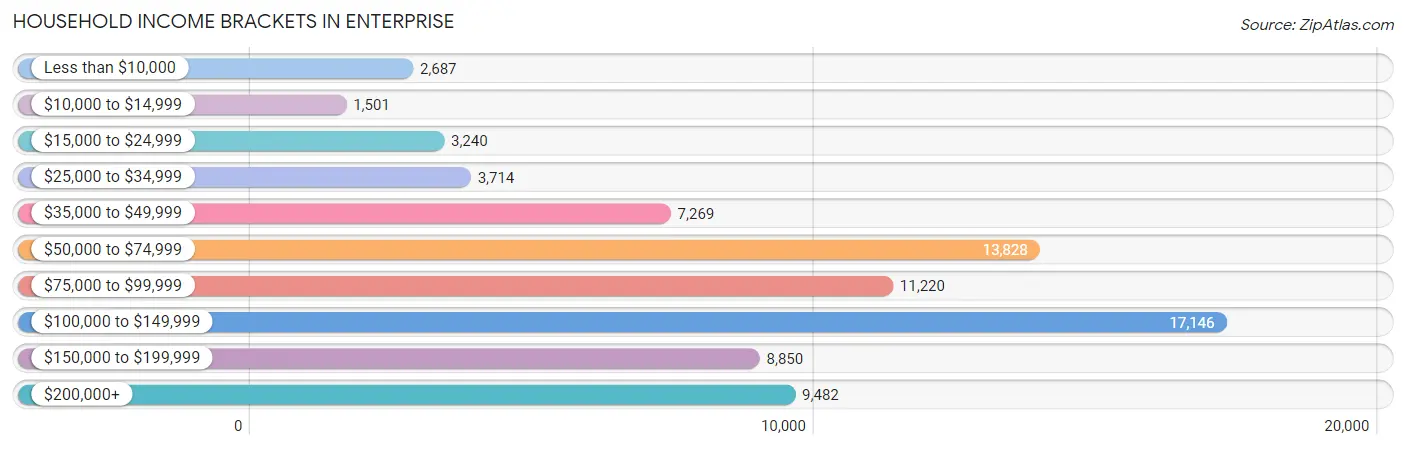
| Income Bracket | # Households | % Households |
| Less than $10,000 | 2,687 | 3.4% |
| $10,000 to $14,999 | 1,501 | 1.9% |
| $15,000 to $24,999 | 3,240 | 4.1% |
| $25,000 to $34,999 | 3,714 | 4.7% |
| $35,000 to $49,999 | 7,269 | 9.2% |
| $50,000 to $74,999 | 13,828 | 17.5% |
| $75,000 to $99,999 | 11,220 | 14.2% |
| $100,000 to $149,999 | 17,146 | 21.7% |
| $150,000 to $199,999 | 8,850 | 11.2% |
| $200,000+ | 9,482 | 12.0% |
Household Income by Householder Age in Enterprise
The median household income in Enterprise is $91,165, with the highest median household income of $100,448 found in the 45 to 64 years age bracket for the primary householder. A total of 28,730 households (36.4%) fall into this category. Meanwhile, the 65+ years age bracket for the primary householder has the lowest median household income of $65,764, with 11,875 households (15.0%) in this group.
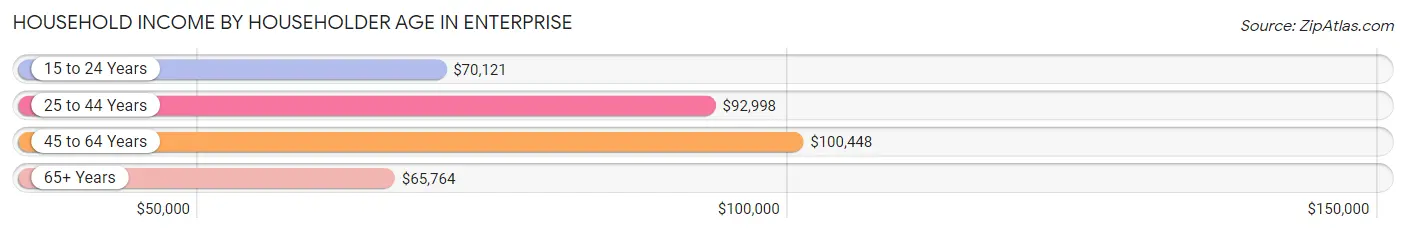
| Income Bracket | # Households | Median Income |
| 15 to 24 Years | 1,630 (2.1%) | $70,121 |
| 25 to 44 Years | 36,780 (46.6%) | $92,998 |
| 45 to 64 Years | 28,730 (36.4%) | $100,448 |
| 65+ Years | 11,875 (15.0%) | $65,764 |
| Total | 79,015 (100.0%) | $91,165 |
Poverty in Enterprise
Income Below Poverty by Sex and Age in Enterprise
With 7.9% poverty level for males and 9.8% for females among the residents of Enterprise, 16 and 17 year old males and 5 year old females are the most vulnerable to poverty, with 345 males (14.0%) and 267 females (17.6%) in their respective age groups living below the poverty level.
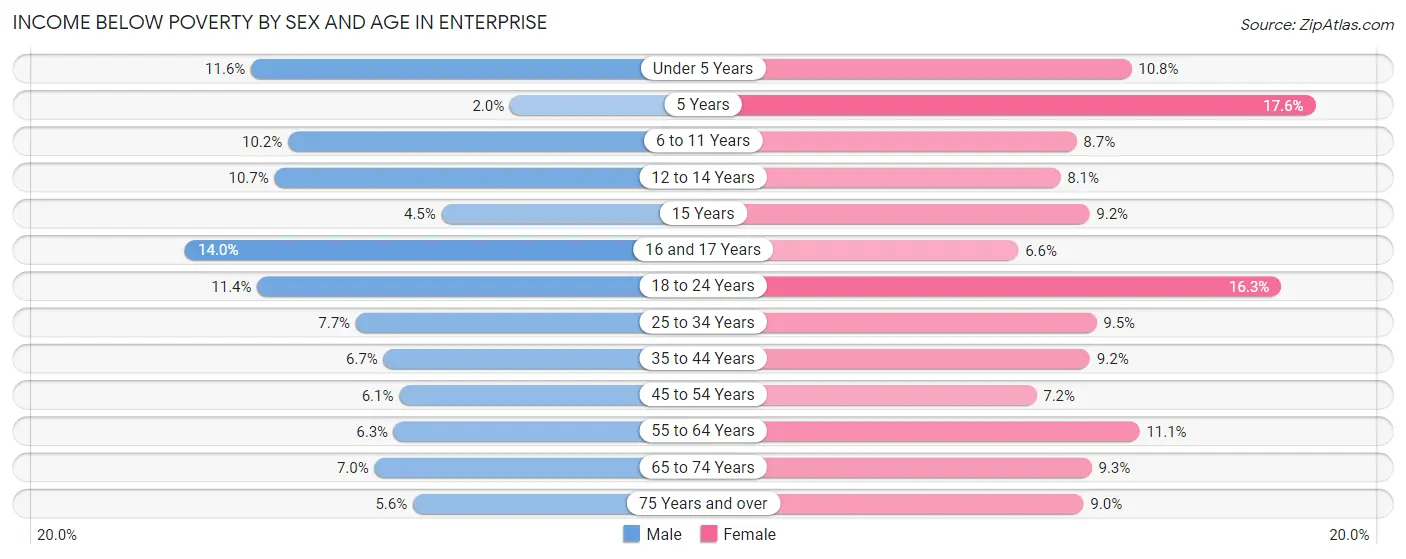
| Age Bracket | Male | Female |
| Under 5 Years | 1,092 (11.6%) | 746 (10.7%) |
| 5 Years | 33 (2.0%) | 267 (17.6%) |
| 6 to 11 Years | 852 (10.2%) | 773 (8.7%) |
| 12 to 14 Years | 409 (10.7%) | 357 (8.1%) |
| 15 Years | 51 (4.5%) | 155 (9.2%) |
| 16 and 17 Years | 345 (14.0%) | 146 (6.6%) |
| 18 to 24 Years | 923 (11.4%) | 1,447 (16.3%) |
| 25 to 34 Years | 1,494 (7.7%) | 1,876 (9.5%) |
| 35 to 44 Years | 1,351 (6.7%) | 1,703 (9.2%) |
| 45 to 54 Years | 984 (6.1%) | 1,082 (7.2%) |
| 55 to 64 Years | 668 (6.3%) | 1,292 (11.1%) |
| 65 to 74 Years | 533 (7.0%) | 788 (9.3%) |
| 75 Years and over | 183 (5.6%) | 386 (9.0%) |
| Total | 8,918 (7.9%) | 11,018 (9.8%) |
Income Above Poverty by Sex and Age in Enterprise
According to the poverty statistics in Enterprise, males aged 5 years and females aged 16 and 17 years are the age groups that are most secure financially, with 98.0% of males and 93.4% of females in these age groups living above the poverty line.
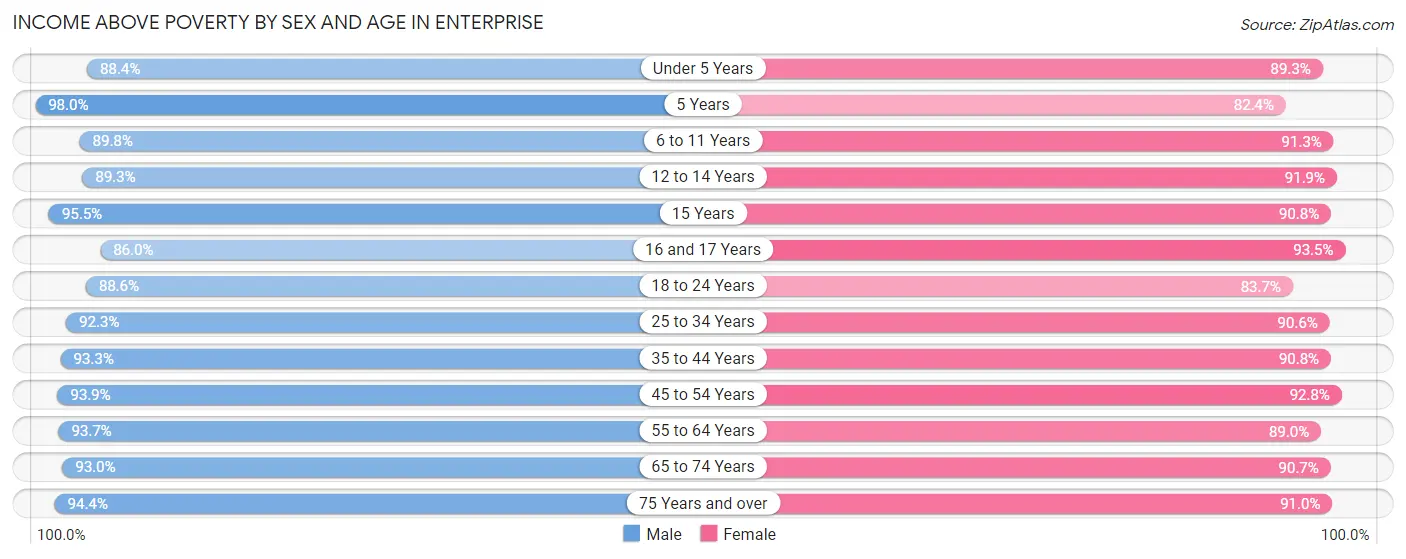
| Age Bracket | Male | Female |
| Under 5 Years | 8,328 (88.4%) | 6,195 (89.2%) |
| 5 Years | 1,634 (98.0%) | 1,252 (82.4%) |
| 6 to 11 Years | 7,481 (89.8%) | 8,105 (91.3%) |
| 12 to 14 Years | 3,405 (89.3%) | 4,044 (91.9%) |
| 15 Years | 1,077 (95.5%) | 1,531 (90.8%) |
| 16 and 17 Years | 2,112 (86.0%) | 2,082 (93.4%) |
| 18 to 24 Years | 7,203 (88.6%) | 7,427 (83.7%) |
| 25 to 34 Years | 17,914 (92.3%) | 17,981 (90.5%) |
| 35 to 44 Years | 18,917 (93.3%) | 16,789 (90.8%) |
| 45 to 54 Years | 15,168 (93.9%) | 13,909 (92.8%) |
| 55 to 64 Years | 9,944 (93.7%) | 10,404 (88.9%) |
| 65 to 74 Years | 7,075 (93.0%) | 7,711 (90.7%) |
| 75 Years and over | 3,095 (94.4%) | 3,919 (91.0%) |
| Total | 103,353 (92.1%) | 101,349 (90.2%) |
Income Below Poverty Among Married-Couple Families in Enterprise
The poverty statistics for married-couple families in Enterprise show that 4.0% or 1,522 of the total 38,254 families live below the poverty line. Families with 3 or 4 children have the highest poverty rate of 13.0%, comprising of 494 families. On the other hand, families with 5 or more children have the lowest poverty rate of 0.0%, which includes 0 families.
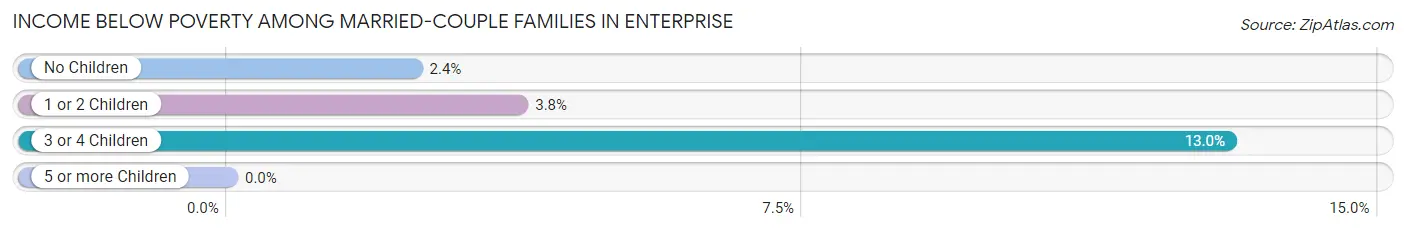
| Children | Above Poverty | Below Poverty |
| No Children | 19,351 (97.6%) | 478 (2.4%) |
| 1 or 2 Children | 13,950 (96.2%) | 550 (3.8%) |
| 3 or 4 Children | 3,294 (87.0%) | 494 (13.0%) |
| 5 or more Children | 137 (100.0%) | 0 (0.0%) |
| Total | 36,732 (96.0%) | 1,522 (4.0%) |
Income Below Poverty Among Single-Parent Households in Enterprise
According to the poverty data in Enterprise, 7.6% or 424 single-father households and 14.5% or 1,368 single-mother households are living below the poverty line. Among single-father households, those with 3 or 4 children have the highest poverty rate, with 38 households (13.3%) experiencing poverty. Likewise, among single-mother households, those with 5 or more children have the highest poverty rate, with 12 households (20.3%) falling below the poverty line.
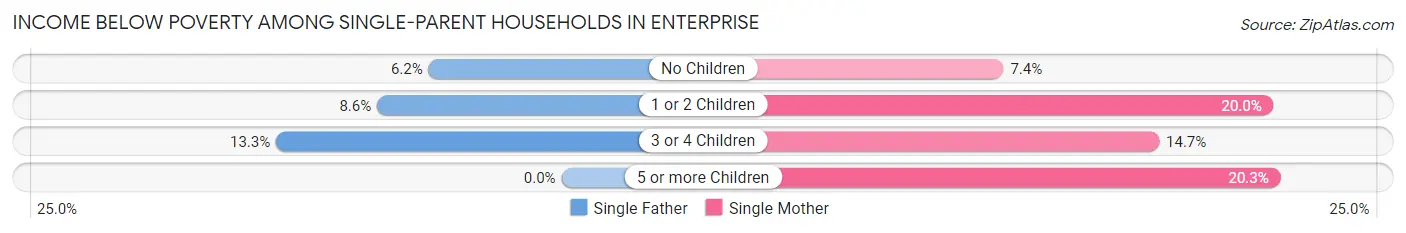
| Children | Single Father | Single Mother |
| No Children | 164 (6.2%) | 282 (7.4%) |
| 1 or 2 Children | 222 (8.6%) | 966 (20.0%) |
| 3 or 4 Children | 38 (13.3%) | 108 (14.7%) |
| 5 or more Children | 0 (0.0%) | 12 (20.3%) |
| Total | 424 (7.6%) | 1,368 (14.5%) |
Income Below Poverty Among Married-Couple vs Single-Parent Households in Enterprise
The poverty data for Enterprise shows that 1,522 of the married-couple family households (4.0%) and 1,792 of the single-parent households (12.0%) are living below the poverty level. Within the married-couple family households, those with 3 or 4 children have the highest poverty rate, with 494 households (13.0%) falling below the poverty line. Among the single-parent households, those with 1 or 2 children have the highest poverty rate, with 1,188 household (16.0%) living below poverty.
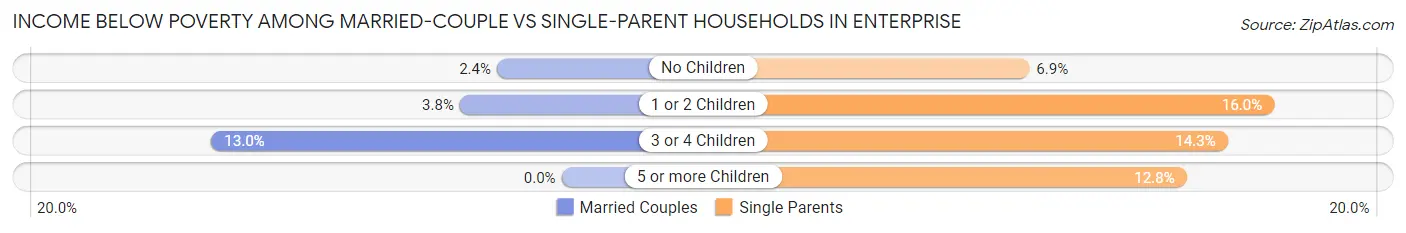
| Children | Married-Couple Families | Single-Parent Households |
| No Children | 478 (2.4%) | 446 (6.9%) |
| 1 or 2 Children | 550 (3.8%) | 1,188 (16.0%) |
| 3 or 4 Children | 494 (13.0%) | 146 (14.3%) |
| 5 or more Children | 0 (0.0%) | 12 (12.8%) |
| Total | 1,522 (4.0%) | 1,792 (12.0%) |
Race in Enterprise
The most populous races in Enterprise are White / Caucasian (102,545 | 45.5%), Asian (50,370 | 22.3%), and Hispanic or Latino (44,128 | 19.6%).
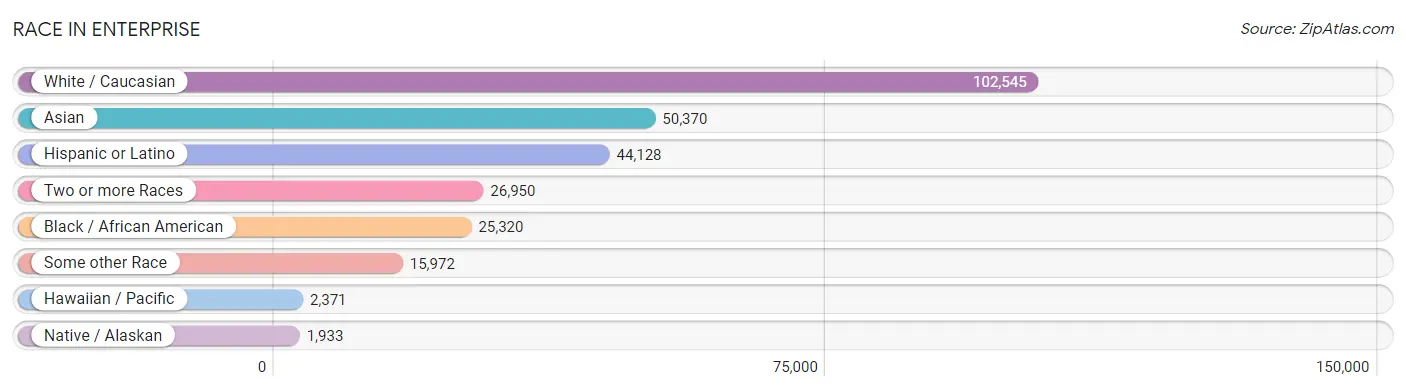
| Race | # Population | % Population |
| Asian | 50,370 | 22.3% |
| Black / African American | 25,320 | 11.2% |
| Hawaiian / Pacific | 2,371 | 1.1% |
| Hispanic or Latino | 44,128 | 19.6% |
| Native / Alaskan | 1,933 | 0.9% |
| White / Caucasian | 102,545 | 45.5% |
| Two or more Races | 26,950 | 11.9% |
| Some other Race | 15,972 | 7.1% |
| Total | 225,461 | 100.0% |
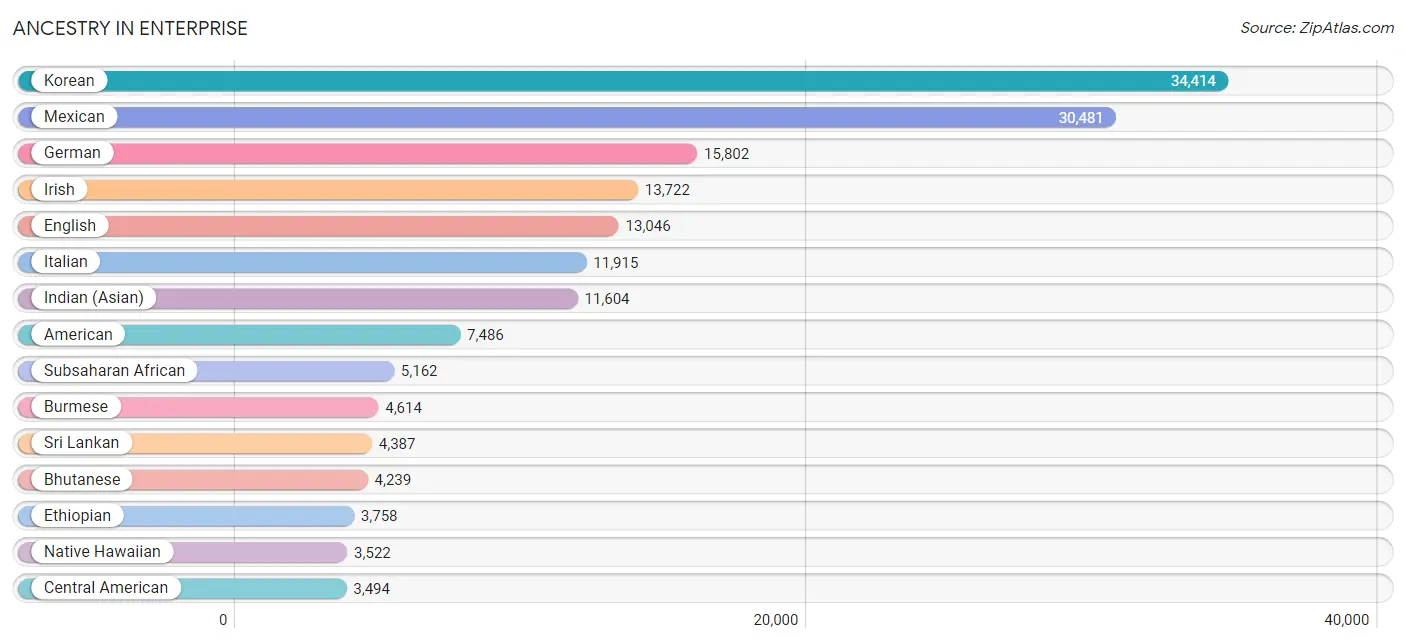
Ancestry in Enterprise
The most populous ancestries reported in Enterprise are Korean (34,414 | 15.3%), Mexican (30,481 | 13.5%), German (15,802 | 7.0%), Irish (13,722 | 6.1%), and English (13,046 | 5.8%), together accounting for 47.7% of all Enterprise residents.
| Ancestry | # Population | % Population |
| Afghan | 36 | 0.0% |
| African | 800 | 0.4% |
| Albanian | 7 | 0.0% |
| American | 7,486 | 3.3% |
| Apache | 97 | 0.0% |
| Arab | 2,115 | 0.9% |
| Argentinean | 172 | 0.1% |
| Armenian | 913 | 0.4% |
| Assyrian / Chaldean / Syriac | 14 | 0.0% |
| Australian | 105 | 0.1% |
| Austrian | 296 | 0.1% |
| Bangladeshi | 145 | 0.1% |
| Barbadian | 26 | 0.0% |
| Basque | 54 | 0.0% |
| Belgian | 186 | 0.1% |
| Belizean | 57 | 0.0% |
| Bhutanese | 4,239 | 1.9% |
| Blackfeet | 36 | 0.0% |
| Brazilian | 395 | 0.2% |
| British | 607 | 0.3% |
| Bulgarian | 138 | 0.1% |
| Burmese | 4,614 | 2.1% |
| Cambodian | 81 | 0.0% |
| Canadian | 314 | 0.1% |
| Cape Verdean | 37 | 0.0% |
| Celtic | 20 | 0.0% |
| Central American | 3,494 | 1.5% |
| Central American Indian | 435 | 0.2% |
| Cherokee | 384 | 0.2% |
| Chickasaw | 25 | 0.0% |
| Chilean | 139 | 0.1% |
| Chinese | 88 | 0.0% |
| Chippewa | 22 | 0.0% |
| Choctaw | 101 | 0.0% |
| Colombian | 911 | 0.4% |
| Costa Rican | 230 | 0.1% |
| Creek | 35 | 0.0% |
| Croatian | 200 | 0.1% |
| Cuban | 1,971 | 0.9% |
| Czech | 492 | 0.2% |
| Czechoslovakian | 135 | 0.1% |
| Danish | 618 | 0.3% |
| Dominican | 674 | 0.3% |
| Dutch | 936 | 0.4% |
| Dutch West Indian | 10 | 0.0% |
| Eastern European | 566 | 0.3% |
| Ecuadorian | 266 | 0.1% |
| Egyptian | 105 | 0.1% |
| English | 13,046 | 5.8% |
| Ethiopian | 3,758 | 1.7% |
| European | 2,950 | 1.3% |
| Filipino | 281 | 0.1% |
| Finnish | 278 | 0.1% |
| French | 2,877 | 1.3% |
| French Canadian | 892 | 0.4% |
| German | 15,802 | 7.0% |
| German Russian | 19 | 0.0% |
| Ghanaian | 31 | 0.0% |
| Greek | 1,157 | 0.5% |
| Guamanian / Chamorro | 387 | 0.2% |
| Guatemalan | 1,076 | 0.5% |
| Guyanese | 51 | 0.0% |
| Haitian | 194 | 0.1% |
| Honduran | 253 | 0.1% |
| Hungarian | 1,102 | 0.5% |
| Icelander | 43 | 0.0% |
| Indian (Asian) | 11,604 | 5.1% |
| Indonesian | 67 | 0.0% |
| Iranian | 603 | 0.3% |
| Iraqi | 32 | 0.0% |
| Irish | 13,722 | 6.1% |
| Israeli | 66 | 0.0% |
| Italian | 11,915 | 5.3% |
| Jamaican | 461 | 0.2% |
| Japanese | 466 | 0.2% |
| Kenyan | 14 | 0.0% |
| Korean | 34,414 | 15.3% |
| Laotian | 61 | 0.0% |
| Latvian | 102 | 0.1% |
| Lebanese | 467 | 0.2% |
| Lithuanian | 215 | 0.1% |
| Malaysian | 503 | 0.2% |
| Maltese | 8 | 0.0% |
| Menominee | 105 | 0.1% |
| Mexican | 30,481 | 13.5% |
| Mexican American Indian | 523 | 0.2% |
| Mongolian | 7 | 0.0% |
| Moroccan | 451 | 0.2% |
| Native Hawaiian | 3,522 | 1.6% |
| Navajo | 441 | 0.2% |
| New Zealander | 24 | 0.0% |
| Nicaraguan | 472 | 0.2% |
| Nigerian | 375 | 0.2% |
| Northern European | 171 | 0.1% |
| Norwegian | 2,073 | 0.9% |
| Okinawan | 19 | 0.0% |
| Paiute | 198 | 0.1% |
| Pakistani | 1,366 | 0.6% |
| Palestinian | 311 | 0.1% |
| Panamanian | 260 | 0.1% |
| Peruvian | 598 | 0.3% |
| Pima | 21 | 0.0% |
| Polish | 3,391 | 1.5% |
| Portuguese | 990 | 0.4% |
| Potawatomi | 23 | 0.0% |
| Pueblo | 64 | 0.0% |
| Puerto Rican | 2,541 | 1.1% |
| Romanian | 490 | 0.2% |
| Russian | 1,996 | 0.9% |
| Salvadoran | 1,091 | 0.5% |
| Samoan | 939 | 0.4% |
| Scandinavian | 678 | 0.3% |
| Scotch-Irish | 786 | 0.4% |
| Scottish | 2,270 | 1.0% |
| Serbian | 593 | 0.3% |
| Shoshone | 22 | 0.0% |
| Sierra Leonean | 10 | 0.0% |
| Sioux | 44 | 0.0% |
| Slavic | 50 | 0.0% |
| Slovak | 180 | 0.1% |
| Slovene | 68 | 0.0% |
| South African | 46 | 0.0% |
| South American | 2,540 | 1.1% |
| South American Indian | 151 | 0.1% |
| Spaniard | 958 | 0.4% |
| Spanish | 744 | 0.3% |
| Spanish American | 29 | 0.0% |
| Sri Lankan | 4,387 | 1.9% |
| Subsaharan African | 5,162 | 2.3% |
| Swedish | 1,858 | 0.8% |
| Swiss | 582 | 0.3% |
| Syrian | 381 | 0.2% |
| Thai | 2,873 | 1.3% |
| Tlingit-Haida | 30 | 0.0% |
| Tohono O'Odham | 11 | 0.0% |
| Tongan | 8 | 0.0% |
| Trinidadian and Tobagonian | 84 | 0.0% |
| Turkish | 397 | 0.2% |
| Ukrainian | 555 | 0.3% |
| Uruguayan | 111 | 0.1% |
| Venezuelan | 343 | 0.2% |
| Vietnamese | 130 | 0.1% |
| Welsh | 410 | 0.2% |
| West Indian | 271 | 0.1% |
| Yugoslavian | 505 | 0.2% |
| Zimbabwean | 1 | 0.0% | View All 146 Rows |
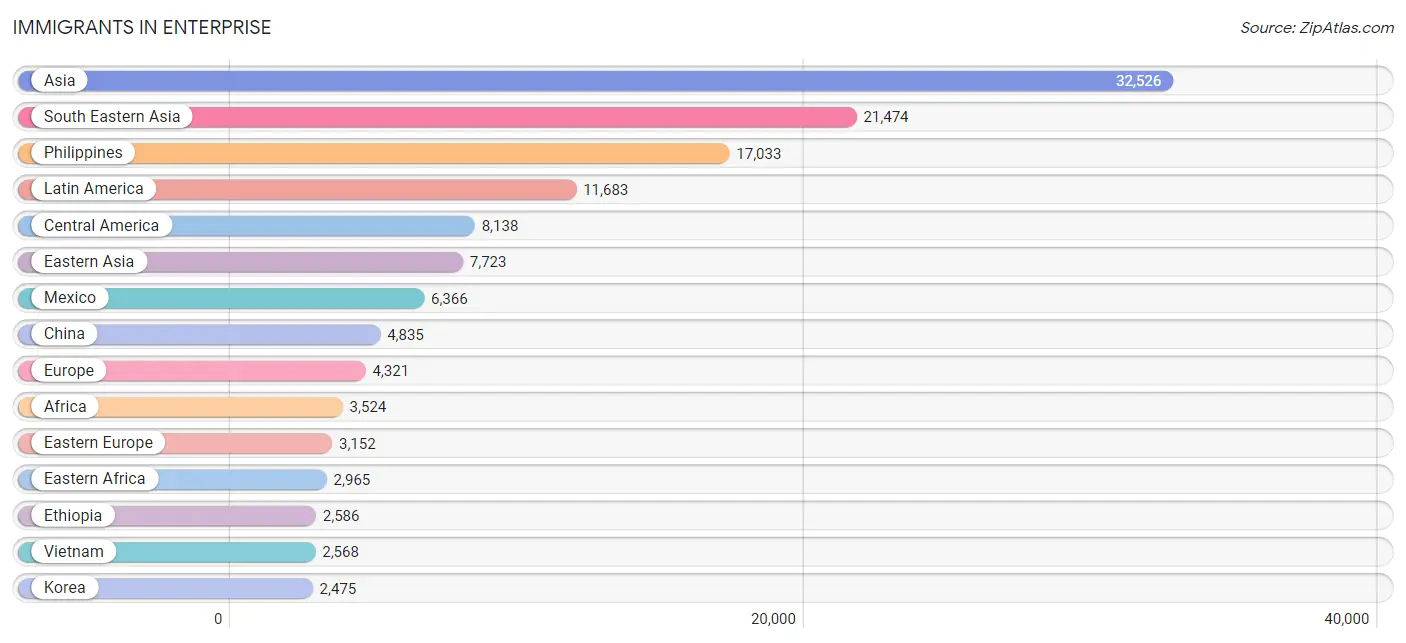
Immigrants in Enterprise
The most numerous immigrant groups reported in Enterprise came from Asia (32,526 | 14.4%), South Eastern Asia (21,474 | 9.5%), Philippines (17,033 | 7.5%), Latin America (11,683 | 5.2%), and Central America (8,138 | 3.6%), together accounting for 40.3% of all Enterprise residents.
| Immigration Origin | # Population | % Population |
| Afghanistan | 25 | 0.0% |
| Africa | 3,524 | 1.6% |
| Albania | 7 | 0.0% |
| Argentina | 25 | 0.0% |
| Armenia | 474 | 0.2% |
| Asia | 32,526 | 14.4% |
| Australia | 292 | 0.1% |
| Austria | 44 | 0.0% |
| Bahamas | 45 | 0.0% |
| Bangladesh | 46 | 0.0% |
| Barbados | 8 | 0.0% |
| Belarus | 5 | 0.0% |
| Belize | 11 | 0.0% |
| Bosnia and Herzegovina | 570 | 0.3% |
| Brazil | 375 | 0.2% |
| Bulgaria | 121 | 0.1% |
| Cambodia | 151 | 0.1% |
| Canada | 957 | 0.4% |
| Caribbean | 1,731 | 0.8% |
| Central America | 8,138 | 3.6% |
| Chile | 124 | 0.1% |
| China | 4,835 | 2.1% |
| Colombia | 417 | 0.2% |
| Congo | 16 | 0.0% |
| Costa Rica | 218 | 0.1% |
| Croatia | 87 | 0.0% |
| Cuba | 972 | 0.4% |
| Czechoslovakia | 10 | 0.0% |
| Denmark | 65 | 0.0% |
| Dominican Republic | 248 | 0.1% |
| Eastern Africa | 2,965 | 1.3% |
| Eastern Asia | 7,723 | 3.4% |
| Eastern Europe | 3,152 | 1.4% |
| Ecuador | 156 | 0.1% |
| Egypt | 66 | 0.0% |
| El Salvador | 539 | 0.2% |
| England | 151 | 0.1% |
| Eritrea | 281 | 0.1% |
| Ethiopia | 2,586 | 1.1% |
| Europe | 4,321 | 1.9% |
| Fiji | 15 | 0.0% |
| France | 100 | 0.0% |
| Germany | 221 | 0.1% |
| Ghana | 65 | 0.0% |
| Guatemala | 673 | 0.3% |
| Guyana | 21 | 0.0% |
| Haiti | 107 | 0.1% |
| Honduras | 71 | 0.0% |
| Hong Kong | 580 | 0.3% |
| Hungary | 482 | 0.2% |
| India | 1,108 | 0.5% |
| Indonesia | 172 | 0.1% |
| Iran | 364 | 0.2% |
| Iraq | 28 | 0.0% |
| Israel | 137 | 0.1% |
| Italy | 153 | 0.1% |
| Jamaica | 141 | 0.1% |
| Japan | 413 | 0.2% |
| Kazakhstan | 39 | 0.0% |
| Kenya | 41 | 0.0% |
| Korea | 2,475 | 1.1% |
| Laos | 255 | 0.1% |
| Latin America | 11,683 | 5.2% |
| Latvia | 69 | 0.0% |
| Lebanon | 214 | 0.1% |
| Lithuania | 100 | 0.0% |
| Malaysia | 60 | 0.0% |
| Mexico | 6,366 | 2.8% |
| Micronesia | 42 | 0.0% |
| Middle Africa | 34 | 0.0% |
| Moldova | 23 | 0.0% |
| Morocco | 197 | 0.1% |
| Netherlands | 19 | 0.0% |
| Nicaragua | 150 | 0.1% |
| Nigeria | 122 | 0.1% |
| Northern Africa | 263 | 0.1% |
| Northern Europe | 500 | 0.2% |
| Norway | 33 | 0.0% |
| Oceania | 434 | 0.2% |
| Pakistan | 205 | 0.1% |
| Panama | 110 | 0.1% |
| Peru | 373 | 0.2% |
| Philippines | 17,033 | 7.5% |
| Poland | 331 | 0.2% |
| Portugal | 52 | 0.0% |
| Romania | 171 | 0.1% |
| Russia | 756 | 0.3% |
| Saudi Arabia | 157 | 0.1% |
| Scotland | 42 | 0.0% |
| Serbia | 54 | 0.0% |
| Sierra Leone | 10 | 0.0% |
| Singapore | 58 | 0.0% |
| South Africa | 47 | 0.0% |
| South America | 1,814 | 0.8% |
| South Central Asia | 1,831 | 0.8% |
| South Eastern Asia | 21,474 | 9.5% |
| Southern Europe | 237 | 0.1% |
| Spain | 24 | 0.0% |
| Sri Lanka | 10 | 0.0% |
| Sweden | 24 | 0.0% |
| Switzerland | 48 | 0.0% |
| Syria | 230 | 0.1% |
| Taiwan | 932 | 0.4% |
| Thailand | 1,101 | 0.5% |
| Trinidad and Tobago | 176 | 0.1% |
| Turkey | 130 | 0.1% |
| Uganda | 12 | 0.0% |
| Ukraine | 236 | 0.1% |
| Uruguay | 45 | 0.0% |
| Uzbekistan | 19 | 0.0% |
| Venezuela | 278 | 0.1% |
| Vietnam | 2,568 | 1.1% |
| West Indies | 23 | 0.0% |
| Western Africa | 197 | 0.1% |
| Western Asia | 1,471 | 0.6% |
| Western Europe | 432 | 0.2% |
| Zaire | 18 | 0.0% | View All 117 Rows |
Sex and Age in Enterprise
Sex and Age in Enterprise
The most populous age groups in Enterprise are 35 to 39 Years (10,949 | 9.7%) for men and 30 to 34 Years (10,261 | 9.1%) for women.
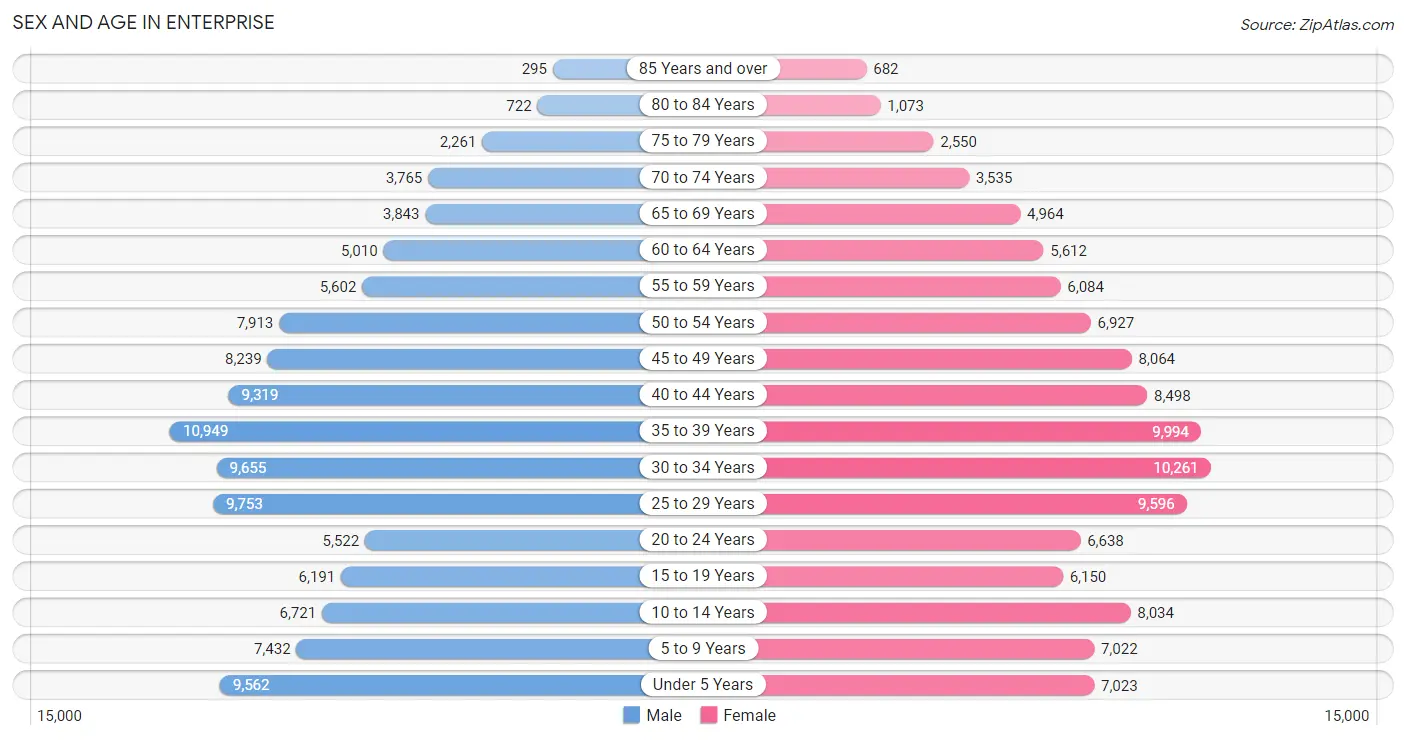
| Age Bracket | Male | Female |
| Under 5 Years | 9,562 (8.5%) | 7,023 (6.2%) |
| 5 to 9 Years | 7,432 (6.6%) | 7,022 (6.2%) |
| 10 to 14 Years | 6,721 (6.0%) | 8,034 (7.1%) |
| 15 to 19 Years | 6,191 (5.5%) | 6,150 (5.5%) |
| 20 to 24 Years | 5,522 (4.9%) | 6,638 (5.9%) |
| 25 to 29 Years | 9,753 (8.6%) | 9,596 (8.5%) |
| 30 to 34 Years | 9,655 (8.6%) | 10,261 (9.1%) |
| 35 to 39 Years | 10,949 (9.7%) | 9,994 (8.9%) |
| 40 to 44 Years | 9,319 (8.3%) | 8,498 (7.5%) |
| 45 to 49 Years | 8,239 (7.3%) | 8,064 (7.1%) |
| 50 to 54 Years | 7,913 (7.0%) | 6,927 (6.1%) |
| 55 to 59 Years | 5,602 (5.0%) | 6,084 (5.4%) |
| 60 to 64 Years | 5,010 (4.4%) | 5,612 (5.0%) |
| 65 to 69 Years | 3,843 (3.4%) | 4,964 (4.4%) |
| 70 to 74 Years | 3,765 (3.3%) | 3,535 (3.1%) |
| 75 to 79 Years | 2,261 (2.0%) | 2,550 (2.3%) |
| 80 to 84 Years | 722 (0.6%) | 1,073 (0.9%) |
| 85 Years and over | 295 (0.3%) | 682 (0.6%) |
| Total | 112,754 (100.0%) | 112,707 (100.0%) |
Families and Households in Enterprise
Median Family Size in Enterprise
The median family size in Enterprise is 3.41 persons per family, with married-couple families (38,254 | 71.9%) accounting for the largest median family size of 3.5 persons per family. On the other hand, single male/father families (5,557 | 10.4%) represent the smallest median family size with 2.98 persons per family.
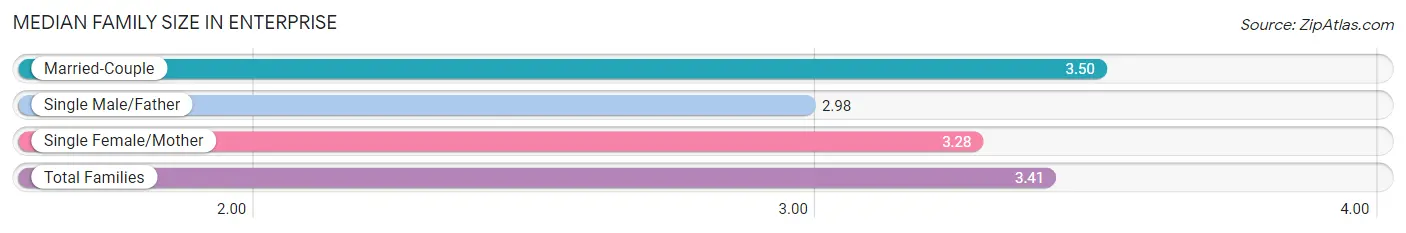
| Family Type | # Families | Family Size |
| Married-Couple | 38,254 (71.9%) | 3.50 |
| Single Male/Father | 5,557 (10.4%) | 2.98 |
| Single Female/Mother | 9,410 (17.7%) | 3.28 |
| Total Families | 53,221 (100.0%) | 3.41 |
Median Household Size in Enterprise
The median household size in Enterprise is 2.85 persons per household, with single female/mother households (9,410 | 11.9%) accounting for the largest median household size of 3.65 persons per household. non-family households (25,794 | 32.6%) represent the smallest median household size with 1.39 persons per household.
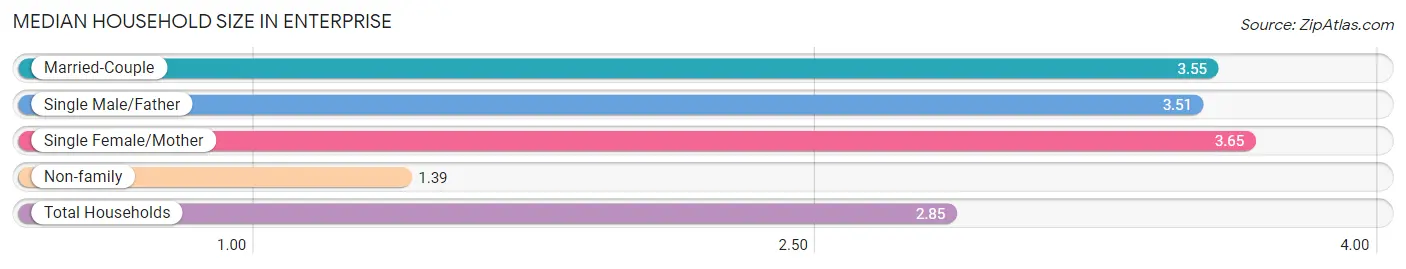
| Household Type | # Households | Household Size |
| Married-Couple | 38,254 (48.4%) | 3.55 |
| Single Male/Father | 5,557 (7.0%) | 3.51 |
| Single Female/Mother | 9,410 (11.9%) | 3.65 |
| Non-family | 25,794 (32.6%) | 1.39 |
| Total Households | 79,015 (100.0%) | 2.85 |
Household Size by Marriage Status in Enterprise
Out of a total of 79,015 households in Enterprise, 53,221 (67.4%) are family households, while 25,794 (32.6%) are nonfamily households. The most numerous type of family households are 2-person households, comprising 18,776, and the most common type of nonfamily households are 1-person households, comprising 18,508.
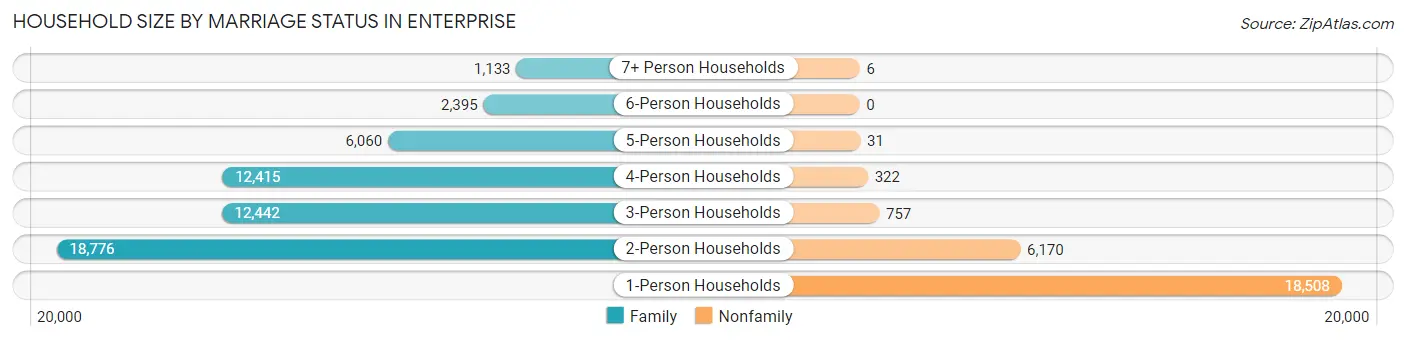
| Household Size | Family Households | Nonfamily Households |
| 1-Person Households | - | 18,508 (23.4%) |
| 2-Person Households | 18,776 (23.8%) | 6,170 (7.8%) |
| 3-Person Households | 12,442 (15.8%) | 757 (1.0%) |
| 4-Person Households | 12,415 (15.7%) | 322 (0.4%) |
| 5-Person Households | 6,060 (7.7%) | 31 (0.0%) |
| 6-Person Households | 2,395 (3.0%) | 0 (0.0%) |
| 7+ Person Households | 1,133 (1.4%) | 6 (0.0%) |
| Total | 53,221 (67.4%) | 25,794 (32.6%) |
Female Fertility in Enterprise
Fertility by Age in Enterprise
Average fertility rate in Enterprise is 52.0 births per 1,000 women. Women in the age bracket of 20 to 34 years have the highest fertility rate with 75.0 births per 1,000 women. Women in the age bracket of 20 to 34 years acount for 63.6% of all women with births.
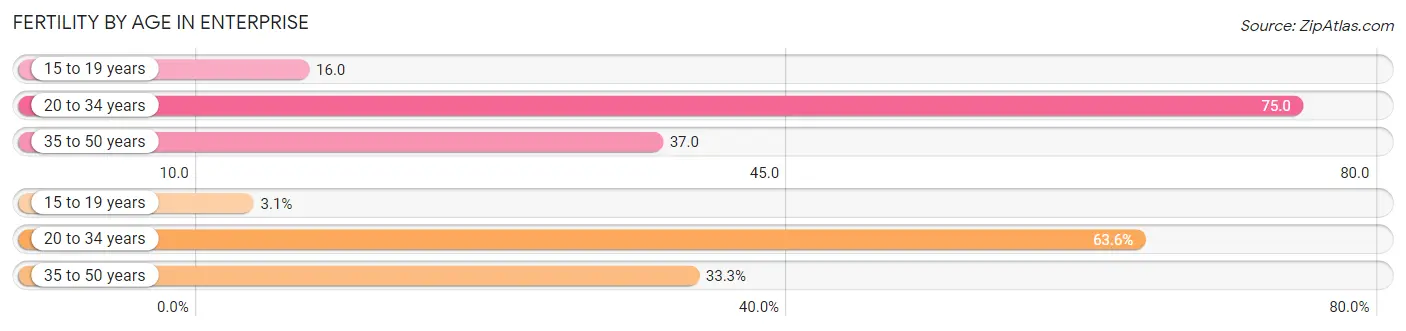
| Age Bracket | Women with Births | Births / 1,000 Women |
| 15 to 19 years | 97 (3.1%) | 16.0 |
| 20 to 34 years | 1,997 (63.6%) | 75.0 |
| 35 to 50 years | 1,046 (33.3%) | 37.0 |
| Total | 3,140 (100.0%) | 52.0 |
Fertility by Age by Marriage Status in Enterprise
69.9% of women with births (3,140) in Enterprise are married. The highest percentage of unmarried women with births falls into 15 to 19 years age bracket with 71.1% of them unmarried at the time of birth, while the lowest percentage of unmarried women with births belong to 20 to 34 years age bracket with 27.6% of them unmarried.
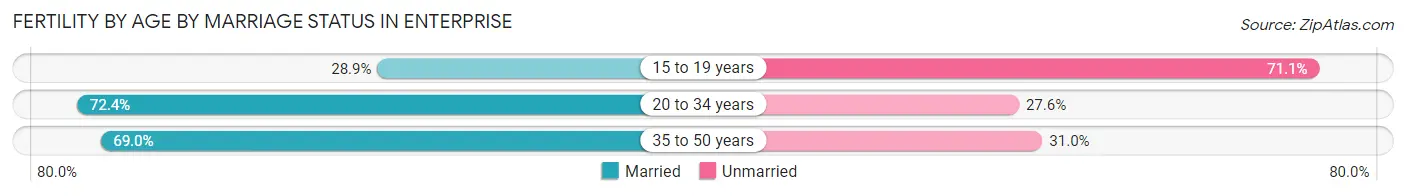
| Age Bracket | Married | Unmarried |
| 15 to 19 years | 28 (28.9%) | 69 (71.1%) |
| 20 to 34 years | 1,446 (72.4%) | 551 (27.6%) |
| 35 to 50 years | 722 (69.0%) | 324 (31.0%) |
| Total | 2,195 (69.9%) | 945 (30.1%) |
Fertility by Education in Enterprise
Average fertility rate in Enterprise is 52.0 births per 1,000 women. Women with the education attainment of college or associate's degree have the highest fertility rate of 69.0 births per 1,000 women, while women with the education attainment of less than high school have the lowest fertility at 12.0 births per 1,000 women. Women with the education attainment of college or associate's degree represent 47.2% of all women with births.
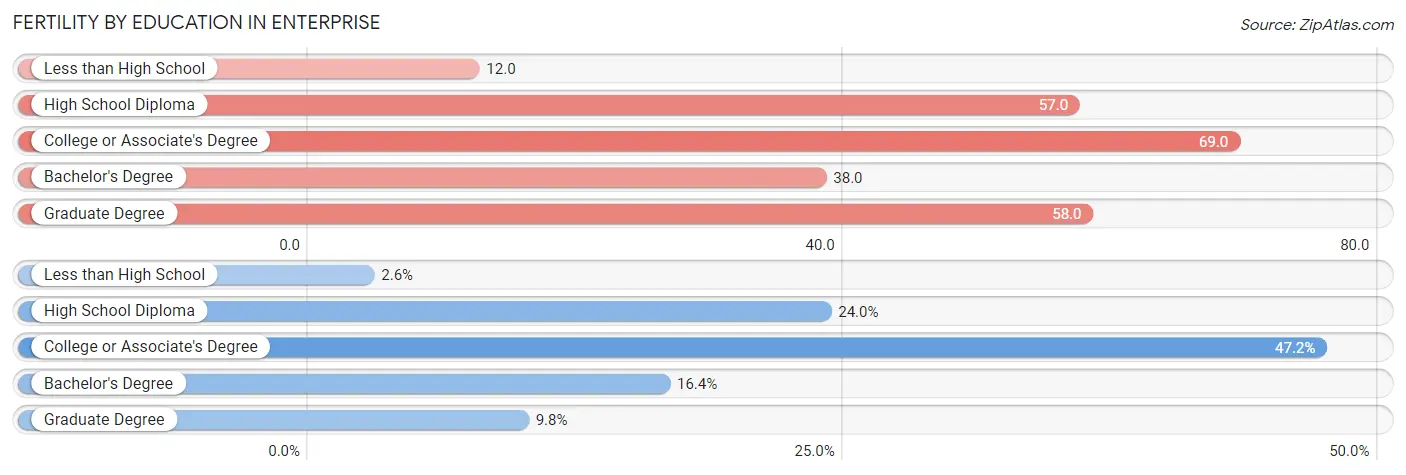
| Educational Attainment | Women with Births | Births / 1,000 Women |
| Less than High School | 81 (2.6%) | 12.0 |
| High School Diploma | 753 (24.0%) | 57.0 |
| College or Associate's Degree | 1,482 (47.2%) | 69.0 |
| Bachelor's Degree | 516 (16.4%) | 38.0 |
| Graduate Degree | 308 (9.8%) | 58.0 |
| Total | 3,140 (100.0%) | 52.0 |
Fertility by Education by Marriage Status in Enterprise
30.1% of women with births in Enterprise are unmarried. Women with the educational attainment of graduate degree are most likely to be married with 100.0% of them married at childbirth, while women with the educational attainment of high school diploma are least likely to be married with 46.9% of them unmarried at childbirth.
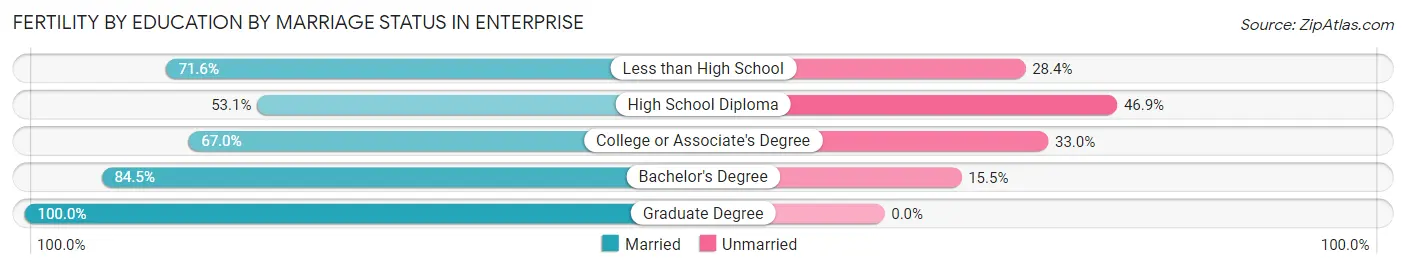
| Educational Attainment | Married | Unmarried |
| Less than High School | 58 (71.6%) | 23 (28.4%) |
| High School Diploma | 400 (53.1%) | 353 (46.9%) |
| College or Associate's Degree | 993 (67.0%) | 489 (33.0%) |
| Bachelor's Degree | 436 (84.5%) | 80 (15.5%) |
| Graduate Degree | 308 (100.0%) | 0 (0.0%) |
| Total | 2,195 (69.9%) | 945 (30.1%) |
Employment Characteristics in Enterprise
Employment by Class of Employer in Enterprise
Among the 118,473 employed individuals in Enterprise, private company employees (90,441 | 76.3%), local government employees (7,573 | 6.4%), and self-employed (not incorporated) (6,079 | 5.1%) make up the most common classes of employment.
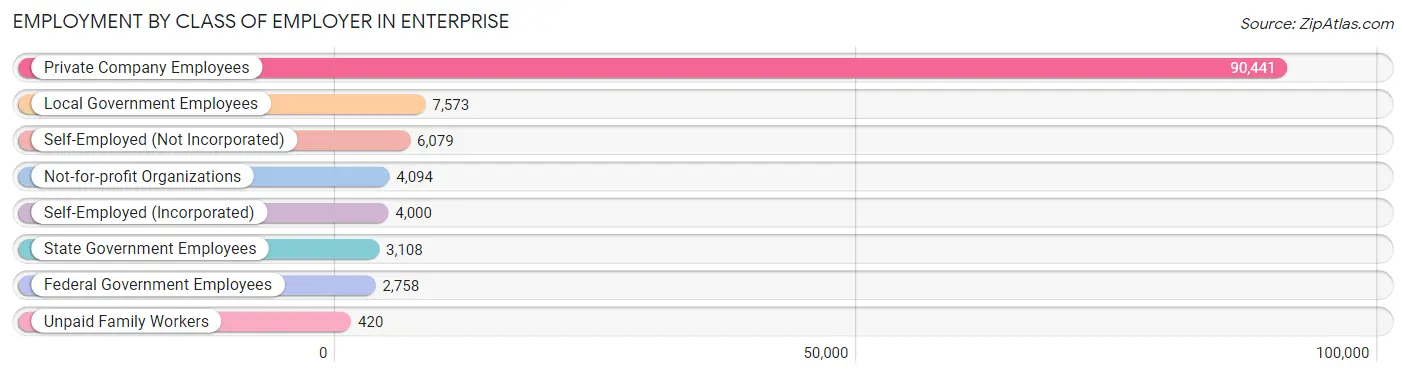
| Employer Class | # Employees | % Employees |
| Private Company Employees | 90,441 | 76.3% |
| Self-Employed (Incorporated) | 4,000 | 3.4% |
| Self-Employed (Not Incorporated) | 6,079 | 5.1% |
| Not-for-profit Organizations | 4,094 | 3.5% |
| Local Government Employees | 7,573 | 6.4% |
| State Government Employees | 3,108 | 2.6% |
| Federal Government Employees | 2,758 | 2.3% |
| Unpaid Family Workers | 420 | 0.4% |
| Total | 118,473 | 100.0% |
Employment Status by Age in Enterprise
According to the labor force statistics for Enterprise, out of the total population over 16 years of age (176,852), 73.3% or 129,633 individuals are in the labor force, with 6.6% or 8,556 of them unemployed. The age group with the highest labor force participation rate is 30 to 34 years, with 88.5% or 17,626 individuals in the labor force. Within the labor force, the 16 to 19 years age range has the highest percentage of unemployed individuals, with 20.8% or 808 of them being unemployed.
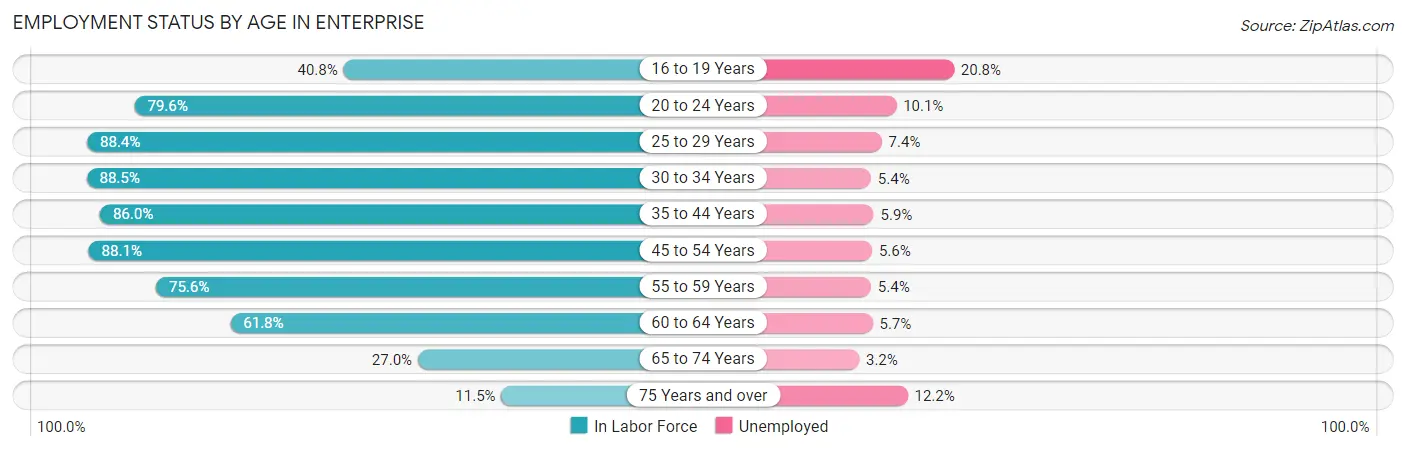
| Age Bracket | In Labor Force | Unemployed |
| 16 to 19 Years | 3,887 (40.8%) | 808 (20.8%) |
| 20 to 24 Years | 9,679 (79.6%) | 978 (10.1%) |
| 25 to 29 Years | 17,105 (88.4%) | 1,266 (7.4%) |
| 30 to 34 Years | 17,626 (88.5%) | 952 (5.4%) |
| 35 to 44 Years | 33,334 (86.0%) | 1,967 (5.9%) |
| 45 to 54 Years | 27,437 (88.1%) | 1,536 (5.6%) |
| 55 to 59 Years | 8,835 (75.6%) | 477 (5.4%) |
| 60 to 64 Years | 6,564 (61.8%) | 374 (5.7%) |
| 65 to 74 Years | 4,349 (27.0%) | 139 (3.2%) |
| 75 Years and over | 872 (11.5%) | 106 (12.2%) |
| Total | 129,633 (73.3%) | 8,556 (6.6%) |
Employment Status by Educational Attainment in Enterprise
According to labor force statistics for Enterprise, 84.3% of individuals (110,834) out of the total population between 25 and 64 years of age (131,476) are in the labor force, with 5.9% or 6,539 of them being unemployed. The group with the highest labor force participation rate are those with the educational attainment of bachelor's degree or higher, with 88.6% or 39,330 individuals in the labor force. Within the labor force, individuals with high school diploma education have the highest percentage of unemployment, with 8.5% or 2,161 of them being unemployed.
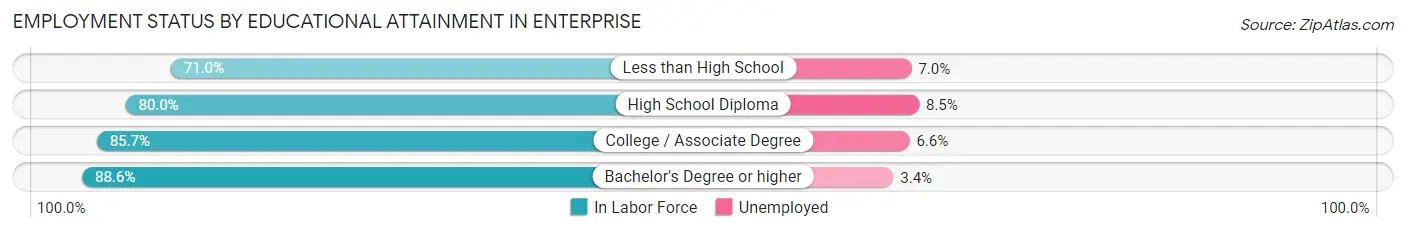
| Educational Attainment | In Labor Force | Unemployed |
| Less than High School | 6,198 (71.0%) | 611 (7.0%) |
| High School Diploma | 25,426 (80.0%) | 2,701 (8.5%) |
| College / Associate Degree | 39,914 (85.7%) | 3,074 (6.6%) |
| Bachelor's Degree or higher | 39,330 (88.6%) | 1,509 (3.4%) |
| Total | 110,834 (84.3%) | 7,757 (5.9%) |
Employment Occupations by Sex in Enterprise
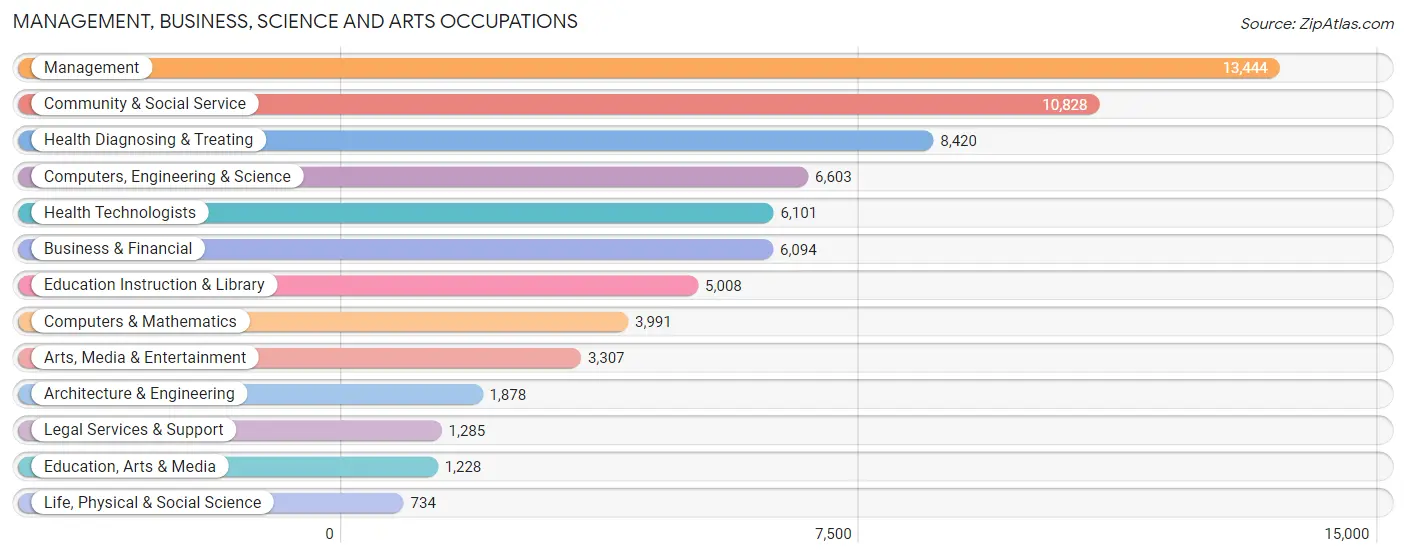
Management, Business, Science and Arts Occupations
The most common Management, Business, Science and Arts occupations in Enterprise are Management (13,444 | 11.1%), Community & Social Service (10,828 | 9.0%), Health Diagnosing & Treating (8,420 | 7.0%), Computers, Engineering & Science (6,603 | 5.5%), and Health Technologists (6,101 | 5.1%).
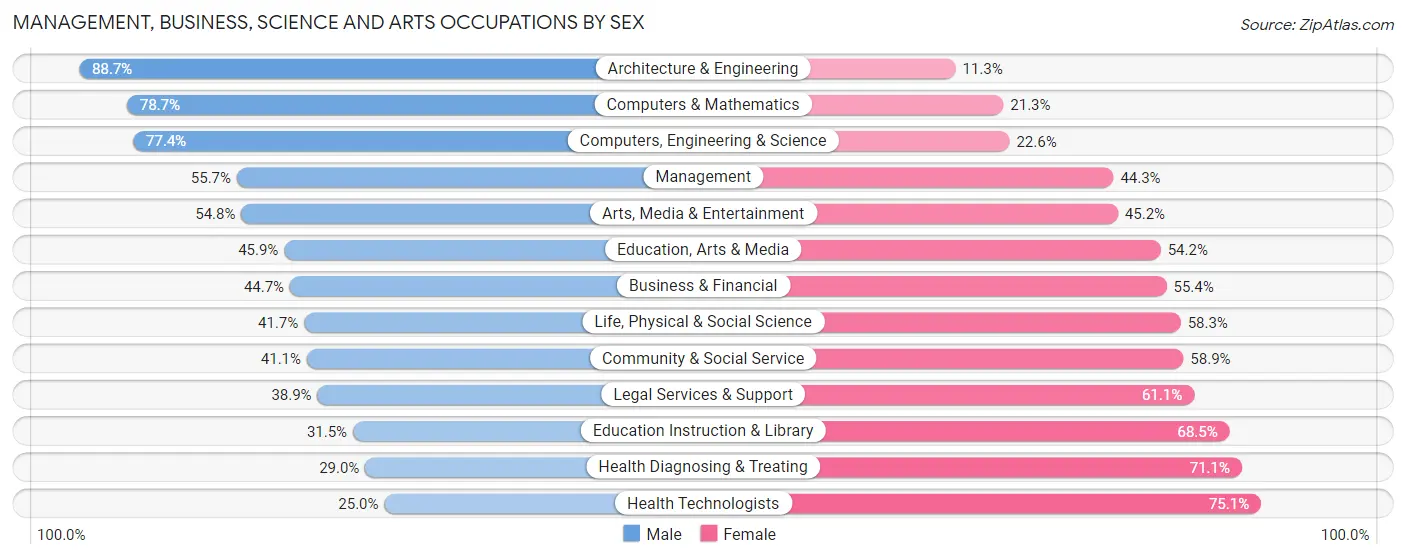
Management, Business, Science and Arts Occupations by Sex
Within the Management, Business, Science and Arts occupations in Enterprise, the most male-oriented occupations are Architecture & Engineering (88.7%), Computers & Mathematics (78.7%), and Computers, Engineering & Science (77.4%), while the most female-oriented occupations are Health Technologists (75.0%), Health Diagnosing & Treating (71.1%), and Education Instruction & Library (68.5%).
| Occupation | Male | Female |
| Management | 7,491 (55.7%) | 5,953 (44.3%) |
| Business & Financial | 2,721 (44.7%) | 3,373 (55.3%) |
| Computers, Engineering & Science | 5,111 (77.4%) | 1,492 (22.6%) |
| Computers & Mathematics | 3,140 (78.7%) | 851 (21.3%) |
| Architecture & Engineering | 1,665 (88.7%) | 213 (11.3%) |
| Life, Physical & Social Science | 306 (41.7%) | 428 (58.3%) |
| Community & Social Service | 4,453 (41.1%) | 6,375 (58.9%) |
| Education, Arts & Media | 563 (45.9%) | 665 (54.1%) |
| Legal Services & Support | 500 (38.9%) | 785 (61.1%) |
| Education Instruction & Library | 1,578 (31.5%) | 3,430 (68.5%) |
| Arts, Media & Entertainment | 1,812 (54.8%) | 1,495 (45.2%) |
| Health Diagnosing & Treating | 2,438 (28.9%) | 5,982 (71.1%) |
| Health Technologists | 1,522 (24.9%) | 4,579 (75.0%) |
| Total (Category) | 22,214 (48.9%) | 23,175 (51.1%) |
| Total (Overall) | 64,040 (53.0%) | 56,721 (47.0%) |
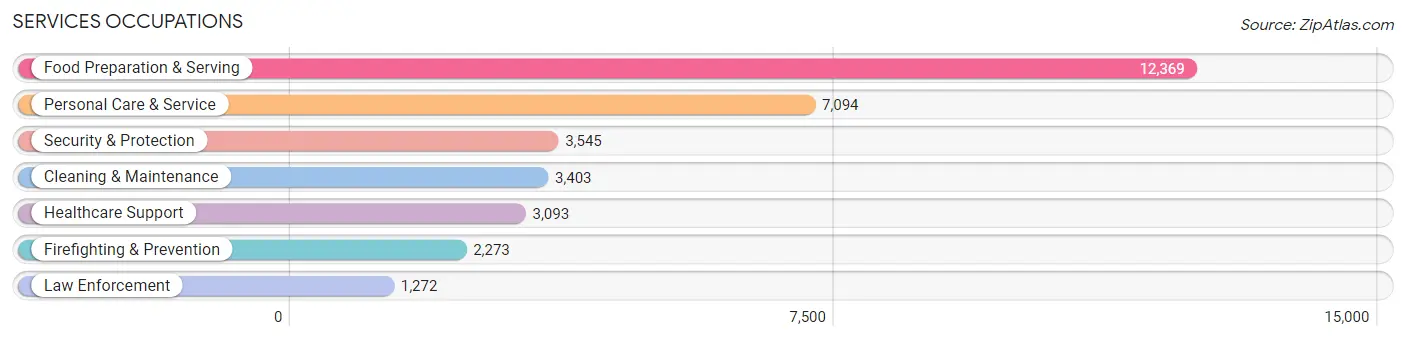
Services Occupations
The most common Services occupations in Enterprise are Food Preparation & Serving (12,369 | 10.2%), Personal Care & Service (7,094 | 5.9%), Security & Protection (3,545 | 2.9%), Cleaning & Maintenance (3,403 | 2.8%), and Healthcare Support (3,093 | 2.6%).
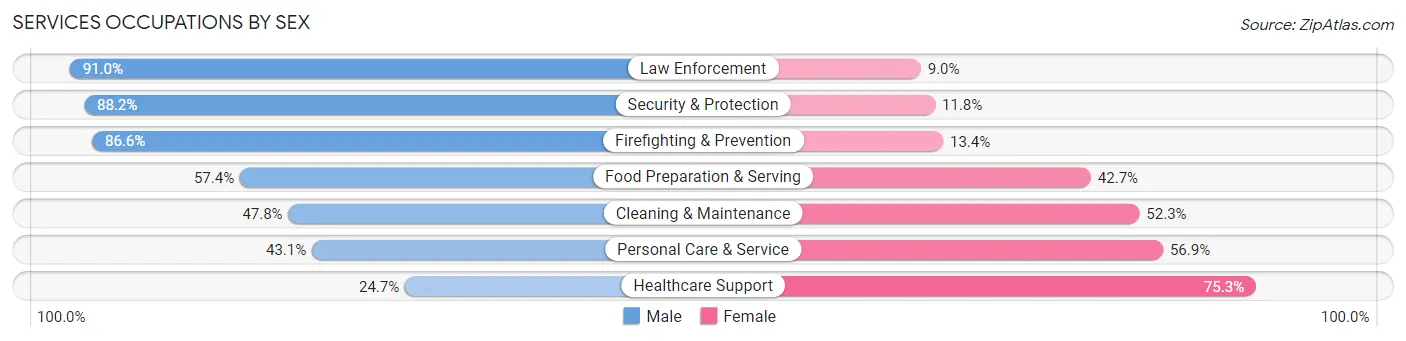
Services Occupations by Sex
Within the Services occupations in Enterprise, the most male-oriented occupations are Law Enforcement (91.0%), Security & Protection (88.2%), and Firefighting & Prevention (86.6%), while the most female-oriented occupations are Healthcare Support (75.3%), Personal Care & Service (56.9%), and Cleaning & Maintenance (52.2%).
| Occupation | Male | Female |
| Healthcare Support | 763 (24.7%) | 2,330 (75.3%) |
| Security & Protection | 3,127 (88.2%) | 418 (11.8%) |
| Firefighting & Prevention | 1,969 (86.6%) | 304 (13.4%) |
| Law Enforcement | 1,158 (91.0%) | 114 (9.0%) |
| Food Preparation & Serving | 7,094 (57.4%) | 5,275 (42.6%) |
| Cleaning & Maintenance | 1,625 (47.7%) | 1,778 (52.2%) |
| Personal Care & Service | 3,056 (43.1%) | 4,038 (56.9%) |
| Total (Category) | 15,665 (53.1%) | 13,839 (46.9%) |
| Total (Overall) | 64,040 (53.0%) | 56,721 (47.0%) |
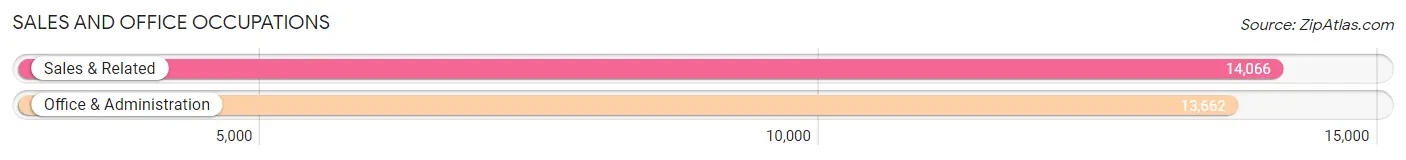
Sales and Office Occupations
The most common Sales and Office occupations in Enterprise are Sales & Related (14,066 | 11.7%), and Office & Administration (13,662 | 11.3%).
Sales and Office Occupations by Sex
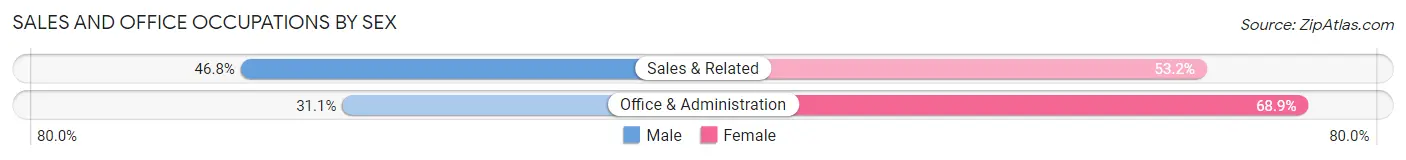
| Occupation | Male | Female |
| Sales & Related | 6,577 (46.8%) | 7,489 (53.2%) |
| Office & Administration | 4,253 (31.1%) | 9,409 (68.9%) |
| Total (Category) | 10,830 (39.1%) | 16,898 (60.9%) |
| Total (Overall) | 64,040 (53.0%) | 56,721 (47.0%) |
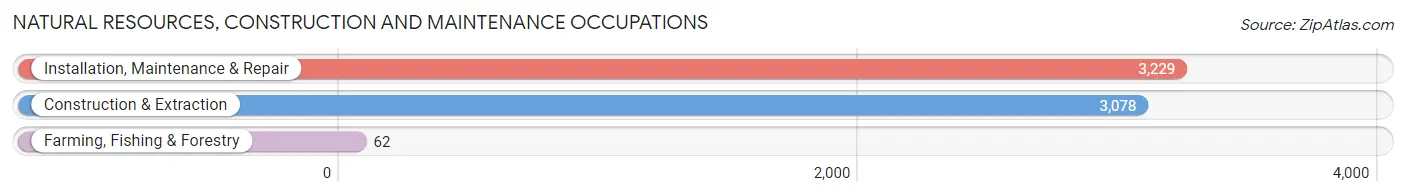
Natural Resources, Construction and Maintenance Occupations
The most common Natural Resources, Construction and Maintenance occupations in Enterprise are Installation, Maintenance & Repair (3,229 | 2.7%), Construction & Extraction (3,078 | 2.5%), and Farming, Fishing & Forestry (62 | 0.1%).
Natural Resources, Construction and Maintenance Occupations by Sex
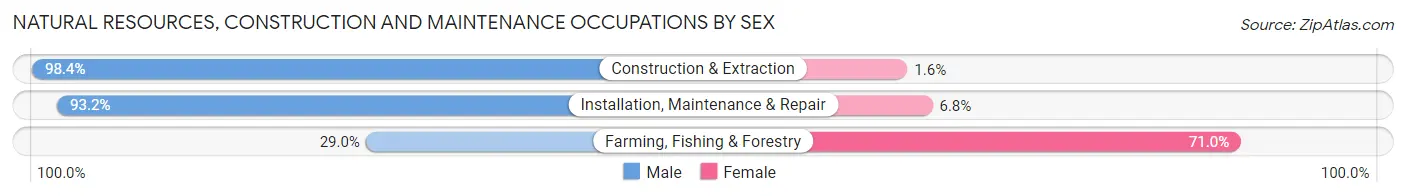
| Occupation | Male | Female |
| Farming, Fishing & Forestry | 18 (29.0%) | 44 (71.0%) |
| Construction & Extraction | 3,030 (98.4%) | 48 (1.6%) |
| Installation, Maintenance & Repair | 3,010 (93.2%) | 219 (6.8%) |
| Total (Category) | 6,058 (95.1%) | 311 (4.9%) |
| Total (Overall) | 64,040 (53.0%) | 56,721 (47.0%) |
Production, Transportation and Moving Occupations
The most common Production, Transportation and Moving occupations in Enterprise are Transportation (5,722 | 4.7%), Production (3,113 | 2.6%), and Material Moving (2,936 | 2.4%).
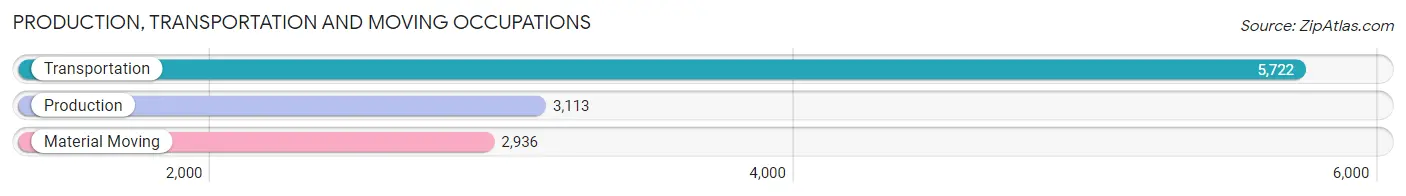
Production, Transportation and Moving Occupations by Sex
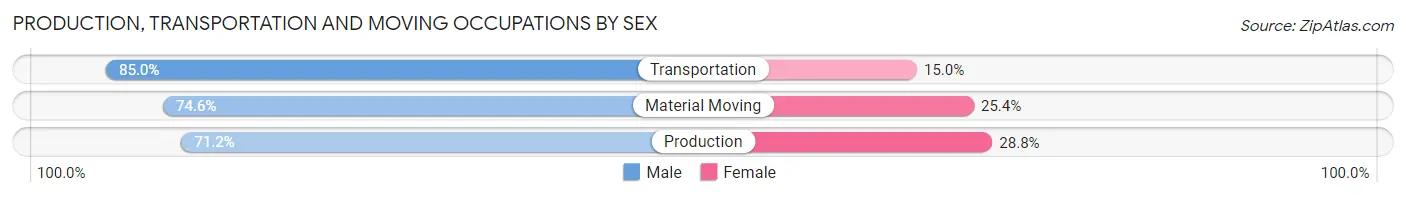
| Occupation | Male | Female |
| Production | 2,217 (71.2%) | 896 (28.8%) |
| Transportation | 4,866 (85.0%) | 856 (15.0%) |
| Material Moving | 2,190 (74.6%) | 746 (25.4%) |
| Total (Category) | 9,273 (78.8%) | 2,498 (21.2%) |
| Total (Overall) | 64,040 (53.0%) | 56,721 (47.0%) |
Employment Industries by Sex in Enterprise
Employment Industries in Enterprise
The major employment industries in Enterprise include Accommodation & Food Services (20,810 | 17.2%), Health Care & Social Assistance (14,497 | 12.0%), Retail Trade (12,436 | 10.3%), Arts, Entertainment & Recreation (10,601 | 8.8%), and Professional & Scientific (8,557 | 7.1%).
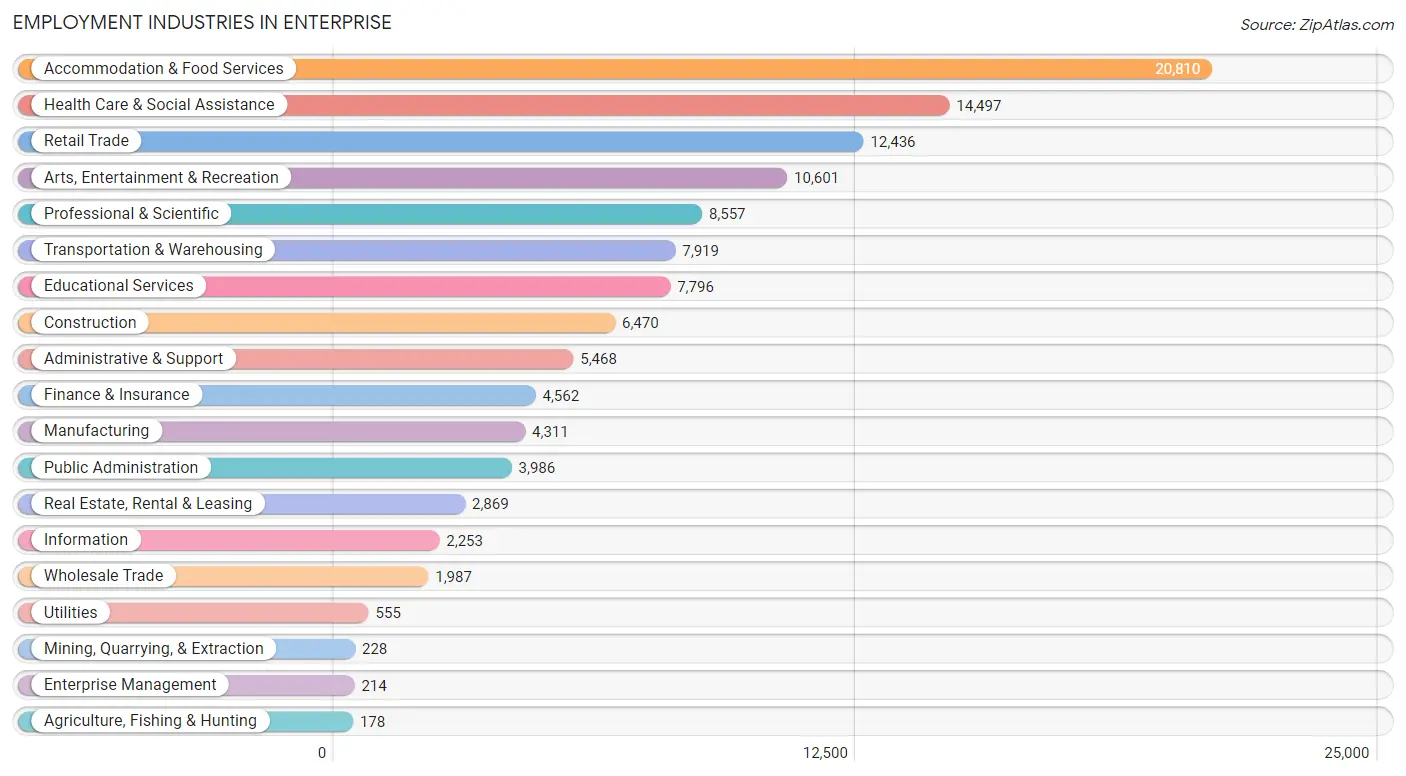
Employment Industries by Sex in Enterprise
The Enterprise industries that see more men than women are Mining, Quarrying, & Extraction (84.2%), Construction (83.8%), and Utilities (82.9%), whereas the industries that tend to have a higher number of women are Health Care & Social Assistance (72.3%), Educational Services (64.0%), and Finance & Insurance (61.5%).
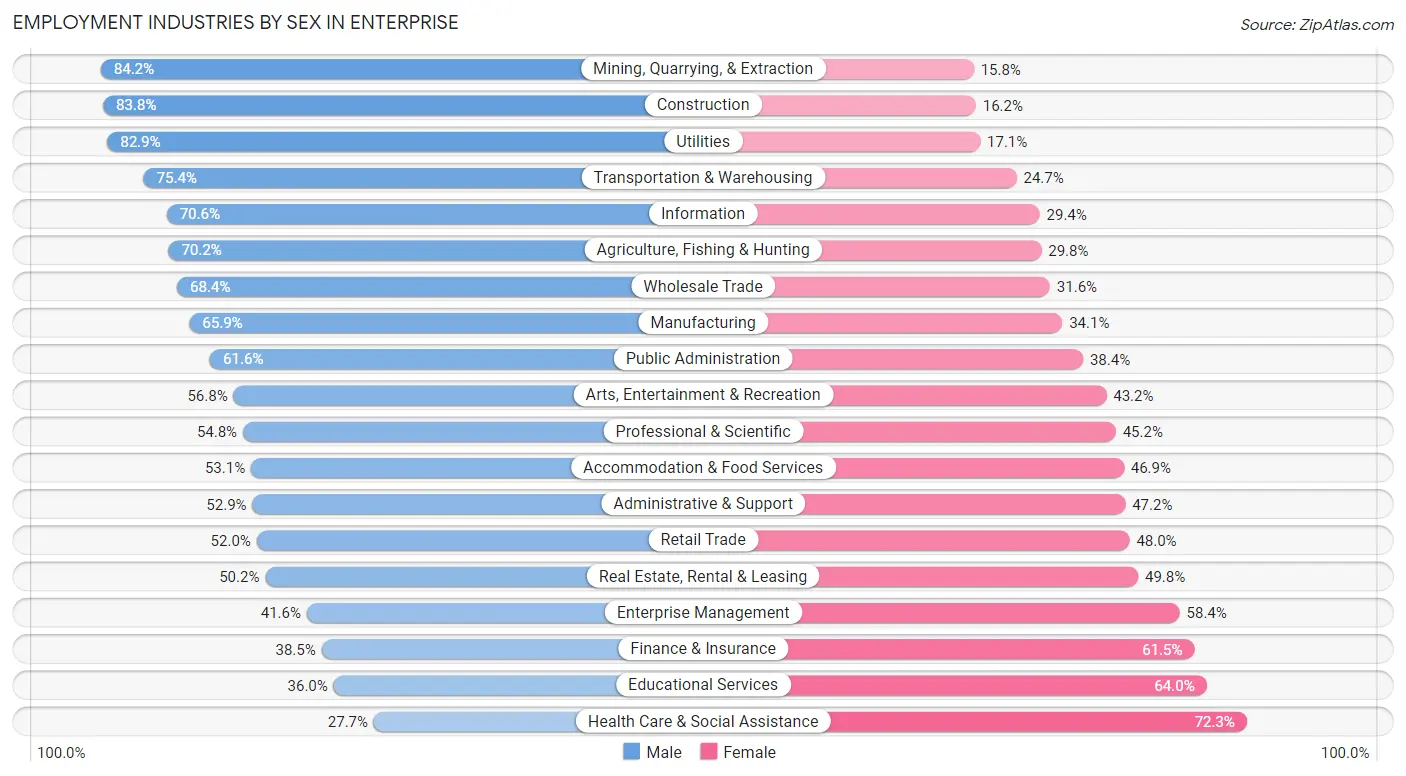
| Industry | Male | Female |
| Agriculture, Fishing & Hunting | 125 (70.2%) | 53 (29.8%) |
| Mining, Quarrying, & Extraction | 192 (84.2%) | 36 (15.8%) |
| Construction | 5,420 (83.8%) | 1,050 (16.2%) |
| Manufacturing | 2,840 (65.9%) | 1,471 (34.1%) |
| Wholesale Trade | 1,360 (68.4%) | 627 (31.6%) |
| Retail Trade | 6,463 (52.0%) | 5,973 (48.0%) |
| Transportation & Warehousing | 5,967 (75.3%) | 1,952 (24.6%) |
| Utilities | 460 (82.9%) | 95 (17.1%) |
| Information | 1,590 (70.6%) | 663 (29.4%) |
| Finance & Insurance | 1,758 (38.5%) | 2,804 (61.5%) |
| Real Estate, Rental & Leasing | 1,440 (50.2%) | 1,429 (49.8%) |
| Professional & Scientific | 4,690 (54.8%) | 3,867 (45.2%) |
| Enterprise Management | 89 (41.6%) | 125 (58.4%) |
| Administrative & Support | 2,890 (52.8%) | 2,578 (47.1%) |
| Educational Services | 2,810 (36.0%) | 4,986 (64.0%) |
| Health Care & Social Assistance | 4,017 (27.7%) | 10,480 (72.3%) |
| Arts, Entertainment & Recreation | 6,017 (56.8%) | 4,584 (43.2%) |
| Accommodation & Food Services | 11,059 (53.1%) | 9,751 (46.9%) |
| Public Administration | 2,455 (61.6%) | 1,531 (38.4%) |
| Total | 64,040 (53.0%) | 56,721 (47.0%) |
Education in Enterprise
School Enrollment in Enterprise
The most common levels of schooling among the 53,401 students in Enterprise are middle school (11,394 | 21.3%), college / undergraduate (11,050 | 20.7%), and elementary school (10,913 | 20.4%).
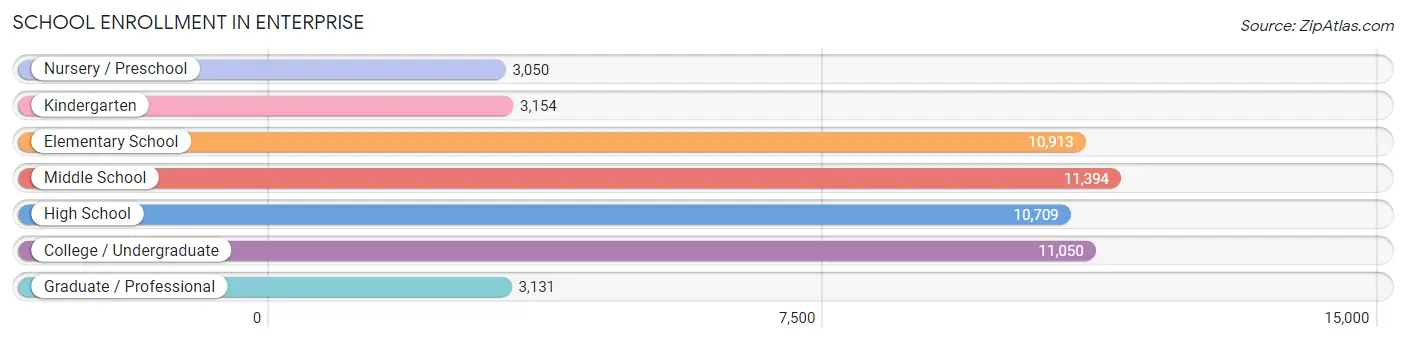
| School Level | # Students | % Students |
| Nursery / Preschool | 3,050 | 5.7% |
| Kindergarten | 3,154 | 5.9% |
| Elementary School | 10,913 | 20.4% |
| Middle School | 11,394 | 21.3% |
| High School | 10,709 | 20.1% |
| College / Undergraduate | 11,050 | 20.7% |
| Graduate / Professional | 3,131 | 5.9% |
| Total | 53,401 | 100.0% |
School Enrollment by Age by Funding Source in Enterprise
Out of a total of 53,401 students who are enrolled in schools in Enterprise, 7,797 (14.6%) attend a private institution, while the remaining 45,604 (85.4%) are enrolled in public schools. The age group of 3 to 4 year olds has the highest likelihood of being enrolled in private schools, with 1,273 (50.9% in the age bracket) enrolled. Conversely, the age group of 18 to 19 year olds has the lowest likelihood of being enrolled in a private school, with 2,898 (94.7% in the age bracket) attending a public institution.
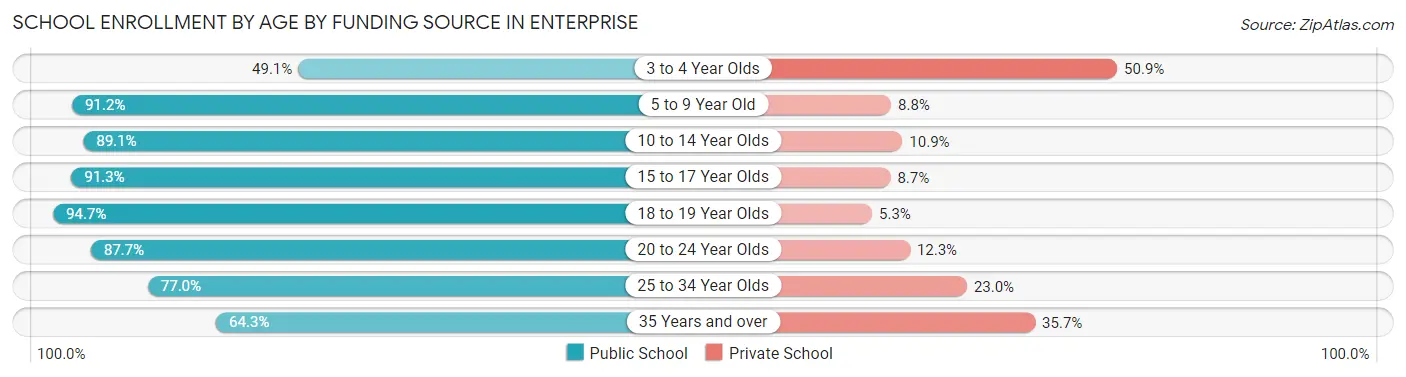
| Age Bracket | Public School | Private School |
| 3 to 4 Year Olds | 1,226 (49.1%) | 1,273 (50.9%) |
| 5 to 9 Year Old | 12,306 (91.2%) | 1,192 (8.8%) |
| 10 to 14 Year Olds | 12,521 (89.1%) | 1,538 (10.9%) |
| 15 to 17 Year Olds | 6,731 (91.3%) | 642 (8.7%) |
| 18 to 19 Year Olds | 2,898 (94.7%) | 162 (5.3%) |
| 20 to 24 Year Olds | 3,894 (87.7%) | 548 (12.3%) |
| 25 to 34 Year Olds | 3,618 (77.0%) | 1,078 (23.0%) |
| 35 Years and over | 2,428 (64.3%) | 1,346 (35.7%) |
| Total | 45,604 (85.4%) | 7,797 (14.6%) |
Educational Attainment by Field of Study in Enterprise
Business (13,604 | 24.6%), science & technology (7,251 | 13.1%), education (5,303 | 9.6%), engineering (3,855 | 7.0%), and arts & humanities (3,804 | 6.9%) are the most common fields of study among 55,399 individuals in Enterprise who have obtained a bachelor's degree or higher.
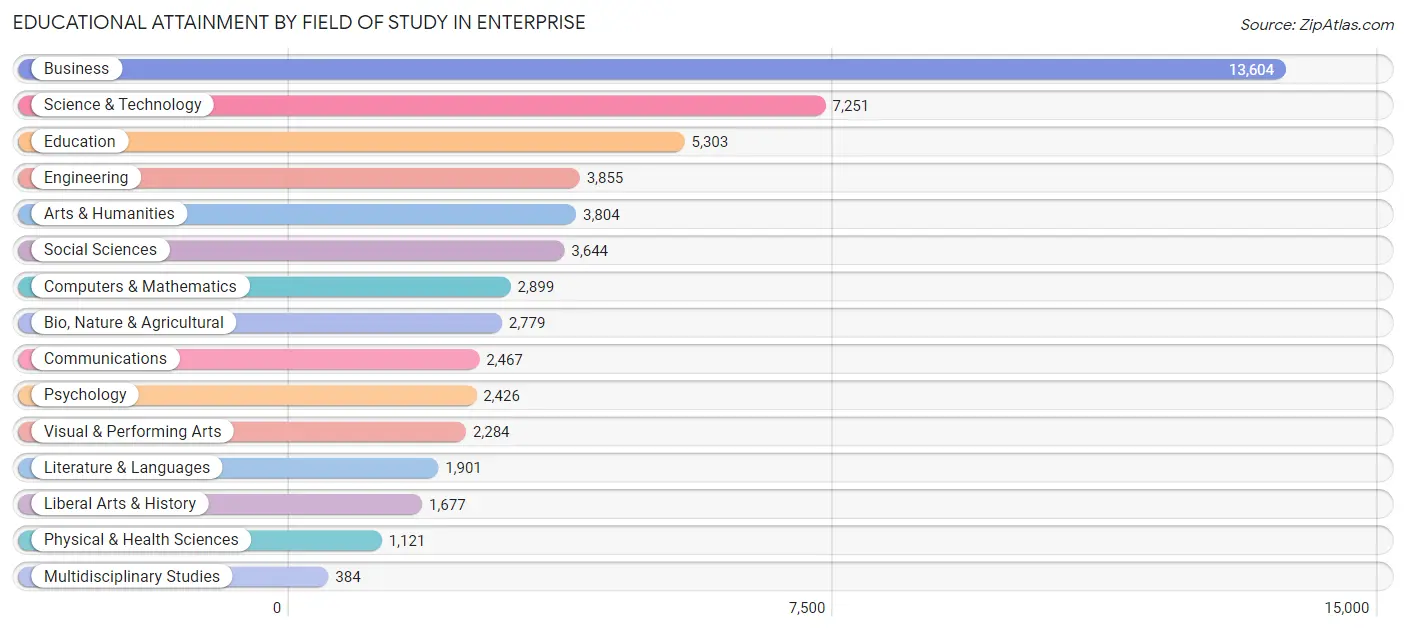
| Field of Study | # Graduates | % Graduates |
| Computers & Mathematics | 2,899 | 5.2% |
| Bio, Nature & Agricultural | 2,779 | 5.0% |
| Physical & Health Sciences | 1,121 | 2.0% |
| Psychology | 2,426 | 4.4% |
| Social Sciences | 3,644 | 6.6% |
| Engineering | 3,855 | 7.0% |
| Multidisciplinary Studies | 384 | 0.7% |
| Science & Technology | 7,251 | 13.1% |
| Business | 13,604 | 24.6% |
| Education | 5,303 | 9.6% |
| Literature & Languages | 1,901 | 3.4% |
| Liberal Arts & History | 1,677 | 3.0% |
| Visual & Performing Arts | 2,284 | 4.1% |
| Communications | 2,467 | 4.4% |
| Arts & Humanities | 3,804 | 6.9% |
| Total | 55,399 | 100.0% |
Transportation & Commute in Enterprise
Vehicle Availability by Sex in Enterprise
The most prevalent vehicle ownership categories in Enterprise are males with 2 vehicles (27,204, accounting for 43.1%) and females with 2 vehicles (24,168, making up 49.2%).
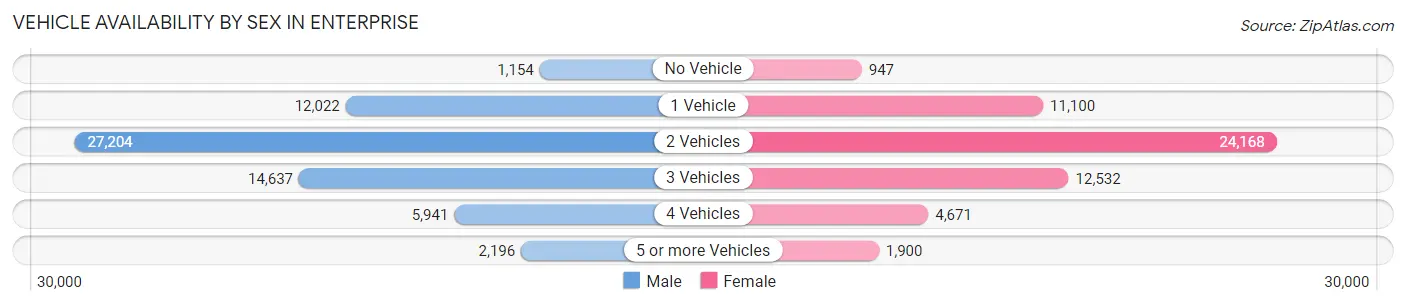
| Vehicles Available | Male | Female |
| No Vehicle | 1,154 (1.8%) | 947 (1.7%) |
| 1 Vehicle | 12,022 (19.0%) | 11,100 (20.1%) |
| 2 Vehicles | 27,204 (43.1%) | 24,168 (43.7%) |
| 3 Vehicles | 14,637 (23.2%) | 12,532 (22.7%) |
| 4 Vehicles | 5,941 (9.4%) | 4,671 (8.4%) |
| 5 or more Vehicles | 2,196 (3.5%) | 1,900 (3.4%) |
| Total | 63,154 (100.0%) | 55,318 (100.0%) |
Commute Time in Enterprise
The most frequently occuring commute durations in Enterprise are 20 to 24 minutes (24,730 commuters, 23.3%), 15 to 19 minutes (21,675 commuters, 20.4%), and 30 to 34 minutes (16,753 commuters, 15.8%).
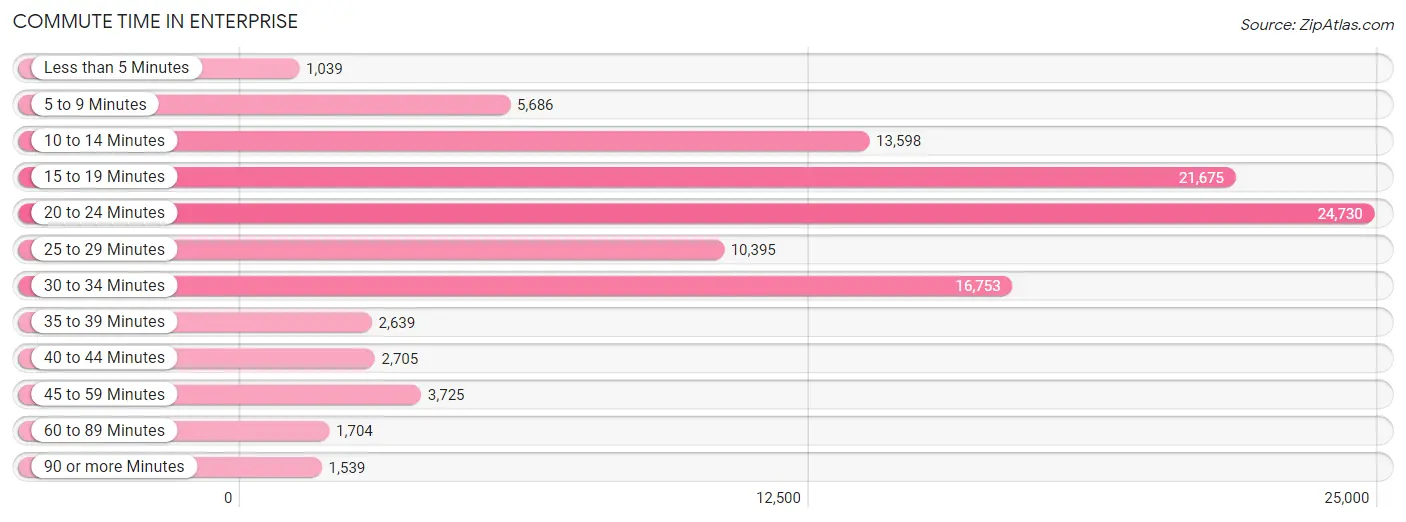
| Commute Time | # Commuters | % Commuters |
| Less than 5 Minutes | 1,039 | 1.0% |
| 5 to 9 Minutes | 5,686 | 5.3% |
| 10 to 14 Minutes | 13,598 | 12.8% |
| 15 to 19 Minutes | 21,675 | 20.4% |
| 20 to 24 Minutes | 24,730 | 23.3% |
| 25 to 29 Minutes | 10,395 | 9.8% |
| 30 to 34 Minutes | 16,753 | 15.8% |
| 35 to 39 Minutes | 2,639 | 2.5% |
| 40 to 44 Minutes | 2,705 | 2.5% |
| 45 to 59 Minutes | 3,725 | 3.5% |
| 60 to 89 Minutes | 1,704 | 1.6% |
| 90 or more Minutes | 1,539 | 1.5% |
Commute Time by Sex in Enterprise
The most common commute times in Enterprise are 20 to 24 minutes (12,814 commuters, 22.7%) for males and 20 to 24 minutes (11,916 commuters, 23.9%) for females.
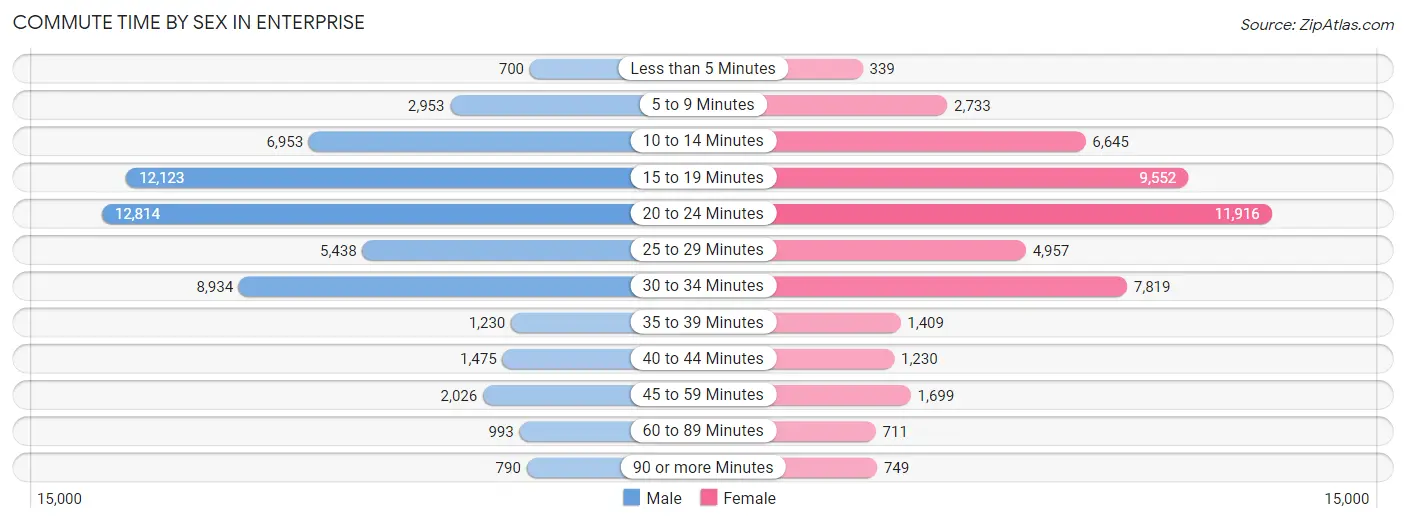
| Commute Time | Male | Female |
| Less than 5 Minutes | 700 (1.2%) | 339 (0.7%) |
| 5 to 9 Minutes | 2,953 (5.2%) | 2,733 (5.5%) |
| 10 to 14 Minutes | 6,953 (12.3%) | 6,645 (13.4%) |
| 15 to 19 Minutes | 12,123 (21.5%) | 9,552 (19.2%) |
| 20 to 24 Minutes | 12,814 (22.7%) | 11,916 (23.9%) |
| 25 to 29 Minutes | 5,438 (9.6%) | 4,957 (10.0%) |
| 30 to 34 Minutes | 8,934 (15.8%) | 7,819 (15.7%) |
| 35 to 39 Minutes | 1,230 (2.2%) | 1,409 (2.8%) |
| 40 to 44 Minutes | 1,475 (2.6%) | 1,230 (2.5%) |
| 45 to 59 Minutes | 2,026 (3.6%) | 1,699 (3.4%) |
| 60 to 89 Minutes | 993 (1.8%) | 711 (1.4%) |
| 90 or more Minutes | 790 (1.4%) | 749 (1.5%) |
Time of Departure to Work by Sex in Enterprise
The most frequent times of departure to work in Enterprise are 4:00 PM to 11:59 PM (6,429, 11.4%) for males and 4:00 PM to 11:59 PM (6,613, 13.3%) for females.
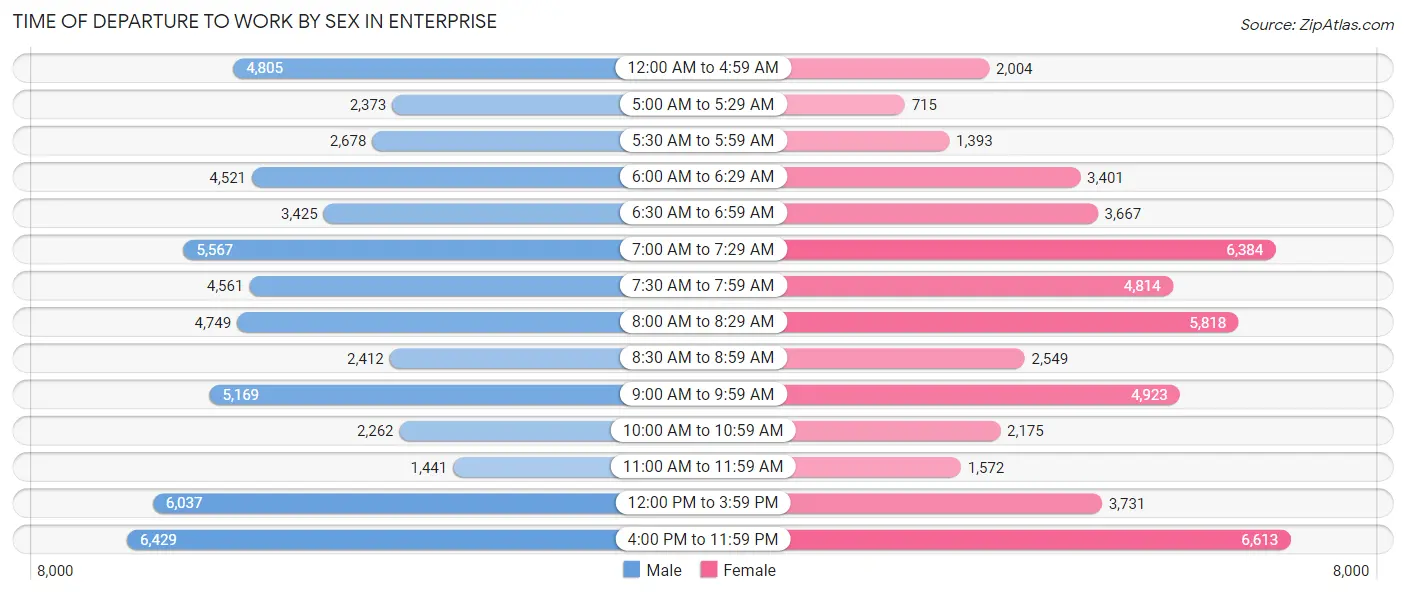
| Time of Departure | Male | Female |
| 12:00 AM to 4:59 AM | 4,805 (8.5%) | 2,004 (4.0%) |
| 5:00 AM to 5:29 AM | 2,373 (4.2%) | 715 (1.4%) |
| 5:30 AM to 5:59 AM | 2,678 (4.8%) | 1,393 (2.8%) |
| 6:00 AM to 6:29 AM | 4,521 (8.0%) | 3,401 (6.8%) |
| 6:30 AM to 6:59 AM | 3,425 (6.1%) | 3,667 (7.4%) |
| 7:00 AM to 7:29 AM | 5,567 (9.9%) | 6,384 (12.8%) |
| 7:30 AM to 7:59 AM | 4,561 (8.1%) | 4,814 (9.7%) |
| 8:00 AM to 8:29 AM | 4,749 (8.4%) | 5,818 (11.7%) |
| 8:30 AM to 8:59 AM | 2,412 (4.3%) | 2,549 (5.1%) |
| 9:00 AM to 9:59 AM | 5,169 (9.2%) | 4,923 (9.9%) |
| 10:00 AM to 10:59 AM | 2,262 (4.0%) | 2,175 (4.4%) |
| 11:00 AM to 11:59 AM | 1,441 (2.5%) | 1,572 (3.2%) |
| 12:00 PM to 3:59 PM | 6,037 (10.7%) | 3,731 (7.5%) |
| 4:00 PM to 11:59 PM | 6,429 (11.4%) | 6,613 (13.3%) |
| Total | 56,429 (100.0%) | 49,759 (100.0%) |
Housing Occupancy in Enterprise
Occupancy by Ownership in Enterprise
Of the total 79,015 dwellings in Enterprise, owner-occupied units account for 49,271 (62.4%), while renter-occupied units make up 29,744 (37.6%).
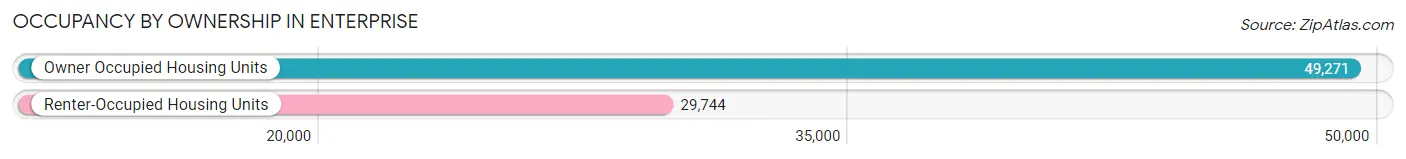
| Occupancy | # Housing Units | % Housing Units |
| Owner Occupied Housing Units | 49,271 | 62.4% |
| Renter-Occupied Housing Units | 29,744 | 37.6% |
| Total Occupied Housing Units | 79,015 | 100.0% |
Occupancy by Household Size in Enterprise
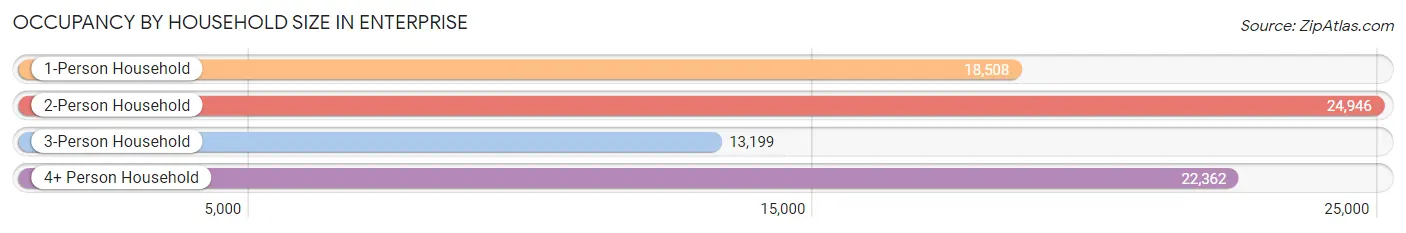
| Household Size | # Housing Units | % Housing Units |
| 1-Person Household | 18,508 | 23.4% |
| 2-Person Household | 24,946 | 31.6% |
| 3-Person Household | 13,199 | 16.7% |
| 4+ Person Household | 22,362 | 28.3% |
| Total Housing Units | 79,015 | 100.0% |
Occupancy by Ownership by Household Size in Enterprise
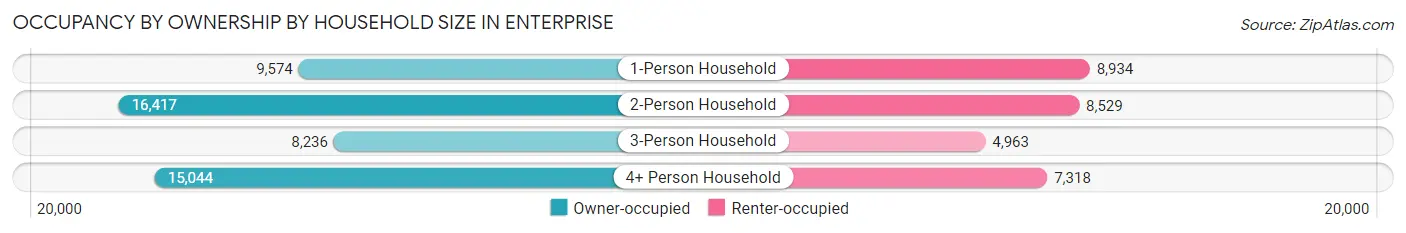
| Household Size | Owner-occupied | Renter-occupied |
| 1-Person Household | 9,574 (51.7%) | 8,934 (48.3%) |
| 2-Person Household | 16,417 (65.8%) | 8,529 (34.2%) |
| 3-Person Household | 8,236 (62.4%) | 4,963 (37.6%) |
| 4+ Person Household | 15,044 (67.3%) | 7,318 (32.7%) |
| Total Housing Units | 49,271 (62.4%) | 29,744 (37.6%) |
Occupancy by Educational Attainment in Enterprise
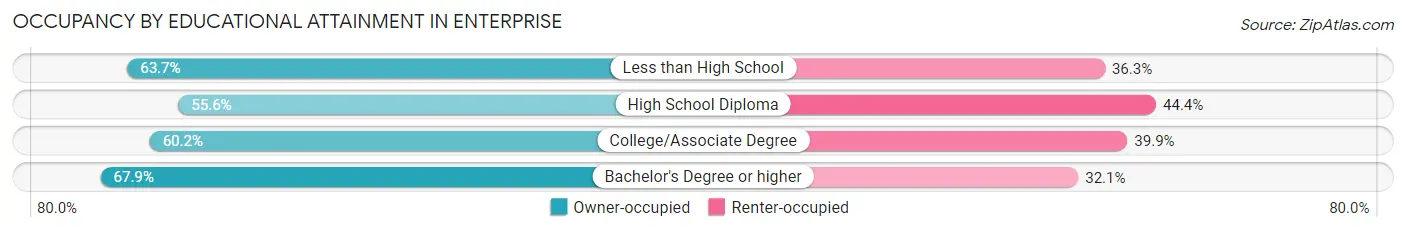
| Household Size | Owner-occupied | Renter-occupied |
| Less than High School | 2,900 (63.7%) | 1,652 (36.3%) |
| High School Diploma | 8,734 (55.6%) | 6,975 (44.4%) |
| College/Associate Degree | 17,612 (60.2%) | 11,669 (39.9%) |
| Bachelor's Degree or higher | 20,025 (67.9%) | 9,448 (32.1%) |
Occupancy by Age of Householder in Enterprise
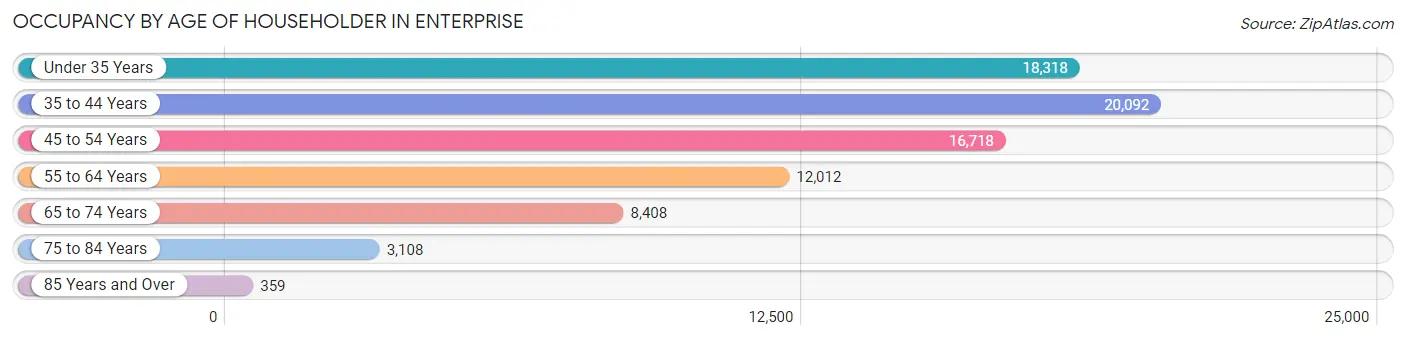
| Age Bracket | # Households | % Households |
| Under 35 Years | 18,318 | 23.2% |
| 35 to 44 Years | 20,092 | 25.4% |
| 45 to 54 Years | 16,718 | 21.2% |
| 55 to 64 Years | 12,012 | 15.2% |
| 65 to 74 Years | 8,408 | 10.6% |
| 75 to 84 Years | 3,108 | 3.9% |
| 85 Years and Over | 359 | 0.4% |
| Total | 79,015 | 100.0% |
Housing Finances in Enterprise
Median Income by Occupancy in Enterprise
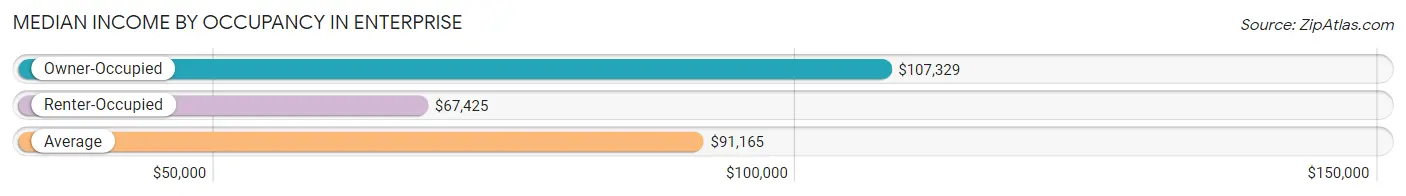
| Occupancy Type | # Households | Median Income |
| Owner-Occupied | 49,271 (62.4%) | $107,329 |
| Renter-Occupied | 29,744 (37.6%) | $67,425 |
| Average | 79,015 (100.0%) | $91,165 |
Occupancy by Householder Income Bracket in Enterprise
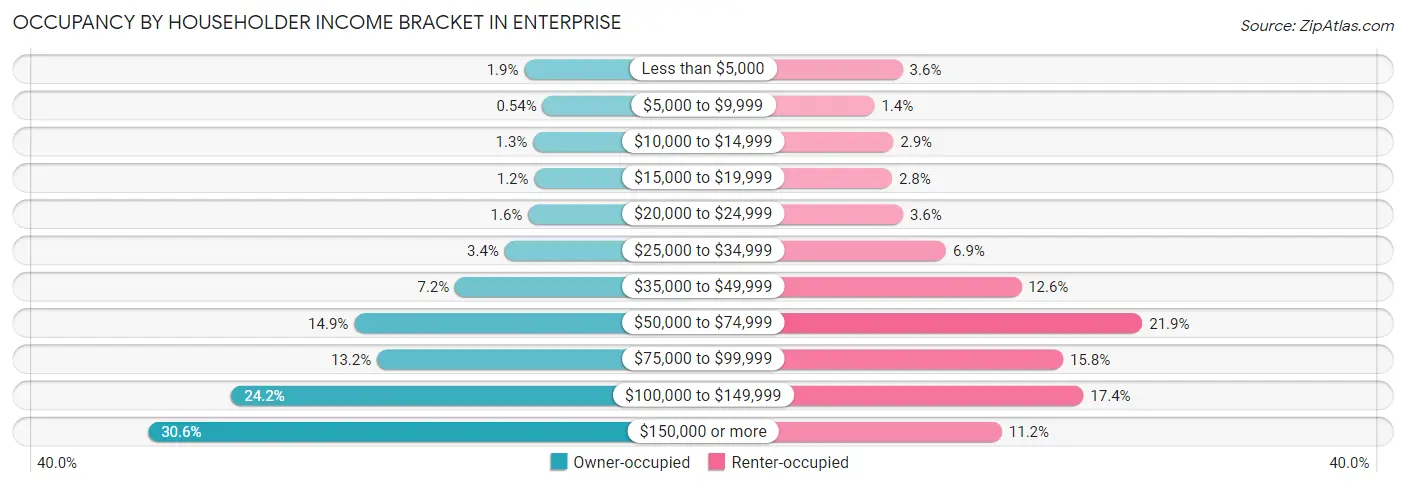
| Income Bracket | Owner-occupied | Renter-occupied |
| Less than $5,000 | 952 (1.9%) | 1,069 (3.6%) |
| $5,000 to $9,999 | 267 (0.5%) | 428 (1.4%) |
| $10,000 to $14,999 | 618 (1.3%) | 856 (2.9%) |
| $15,000 to $19,999 | 573 (1.2%) | 828 (2.8%) |
| $20,000 to $24,999 | 801 (1.6%) | 1,077 (3.6%) |
| $25,000 to $34,999 | 1,687 (3.4%) | 2,052 (6.9%) |
| $35,000 to $49,999 | 3,548 (7.2%) | 3,753 (12.6%) |
| $50,000 to $74,999 | 7,335 (14.9%) | 6,499 (21.8%) |
| $75,000 to $99,999 | 6,479 (13.2%) | 4,704 (15.8%) |
| $100,000 to $149,999 | 11,945 (24.2%) | 5,163 (17.4%) |
| $150,000 or more | 15,066 (30.6%) | 3,315 (11.2%) |
| Total | 49,271 (100.0%) | 29,744 (100.0%) |
Monthly Housing Cost Tiers in Enterprise
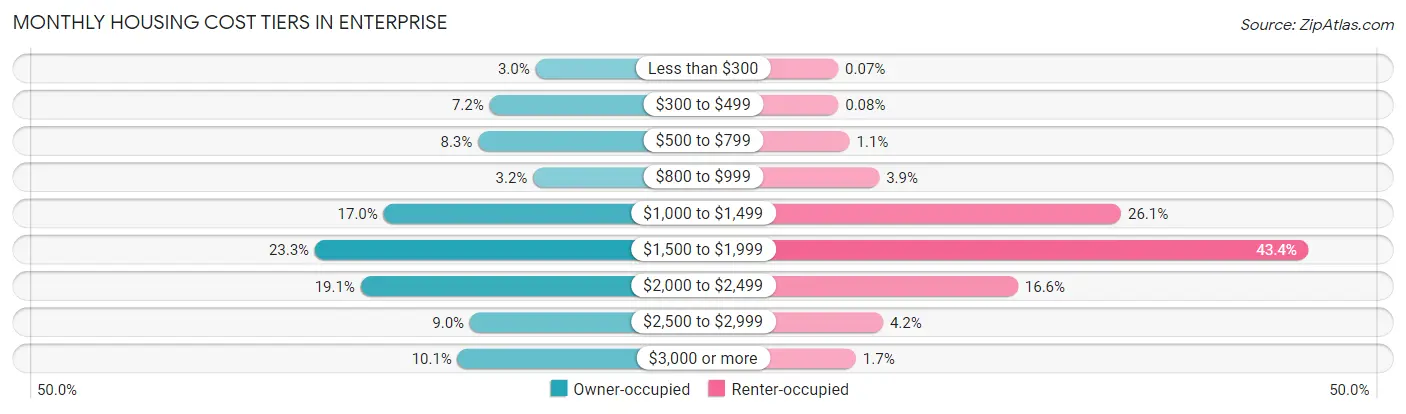
| Monthly Cost | Owner-occupied | Renter-occupied |
| Less than $300 | 1,458 (3.0%) | 20 (0.1%) |
| $300 to $499 | 3,548 (7.2%) | 25 (0.1%) |
| $500 to $799 | 4,063 (8.3%) | 333 (1.1%) |
| $800 to $999 | 1,568 (3.2%) | 1,145 (3.8%) |
| $1,000 to $1,499 | 8,351 (17.0%) | 7,767 (26.1%) |
| $1,500 to $1,999 | 11,466 (23.3%) | 12,904 (43.4%) |
| $2,000 to $2,499 | 9,389 (19.1%) | 4,941 (16.6%) |
| $2,500 to $2,999 | 4,435 (9.0%) | 1,245 (4.2%) |
| $3,000 or more | 4,993 (10.1%) | 507 (1.7%) |
| Total | 49,271 (100.0%) | 29,744 (100.0%) |
Physical Housing Characteristics in Enterprise
Housing Structures in Enterprise
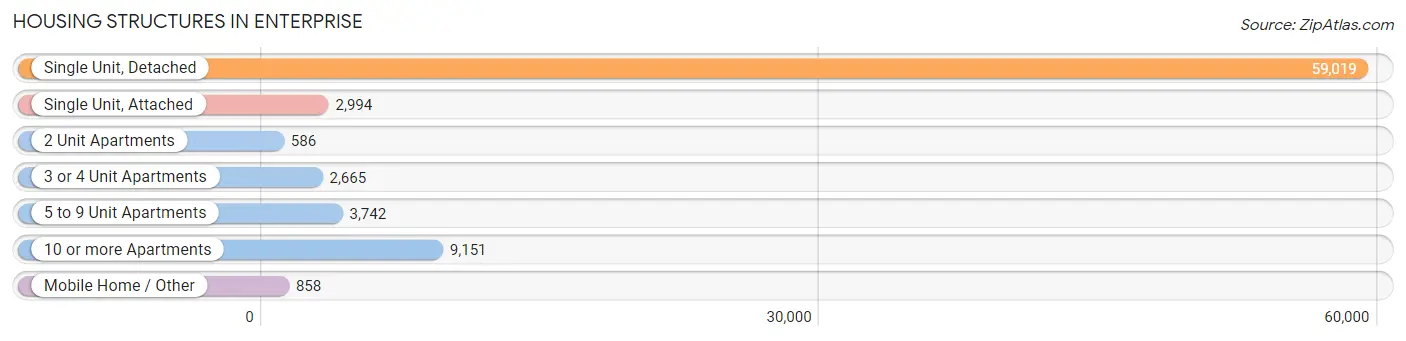
| Structure Type | # Housing Units | % Housing Units |
| Single Unit, Detached | 59,019 | 74.7% |
| Single Unit, Attached | 2,994 | 3.8% |
| 2 Unit Apartments | 586 | 0.7% |
| 3 or 4 Unit Apartments | 2,665 | 3.4% |
| 5 to 9 Unit Apartments | 3,742 | 4.7% |
| 10 or more Apartments | 9,151 | 11.6% |
| Mobile Home / Other | 858 | 1.1% |
| Total | 79,015 | 100.0% |
Housing Structures by Occupancy in Enterprise
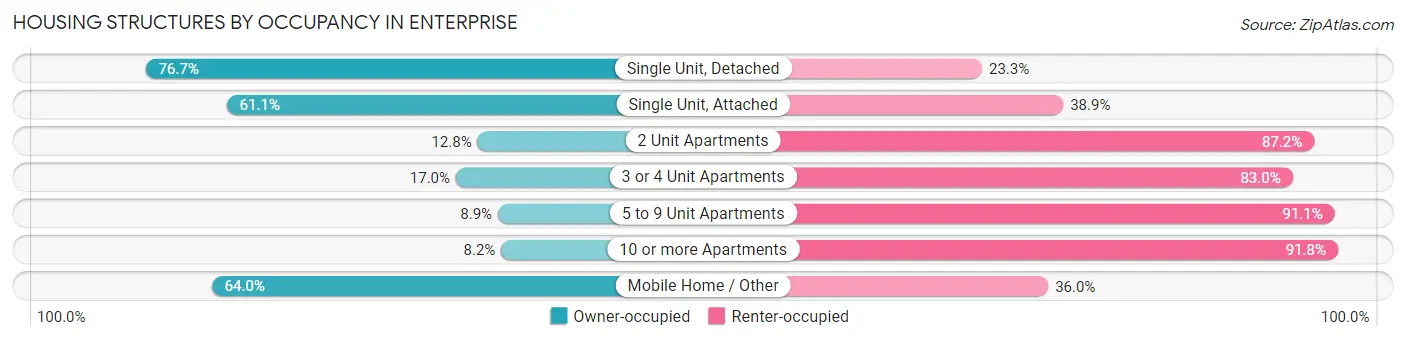
| Structure Type | Owner-occupied | Renter-occupied |
| Single Unit, Detached | 45,280 (76.7%) | 13,739 (23.3%) |
| Single Unit, Attached | 1,829 (61.1%) | 1,165 (38.9%) |
| 2 Unit Apartments | 75 (12.8%) | 511 (87.2%) |
| 3 or 4 Unit Apartments | 452 (17.0%) | 2,213 (83.0%) |
| 5 to 9 Unit Apartments | 332 (8.9%) | 3,410 (91.1%) |
| 10 or more Apartments | 754 (8.2%) | 8,397 (91.8%) |
| Mobile Home / Other | 549 (64.0%) | 309 (36.0%) |
| Total | 49,271 (62.4%) | 29,744 (37.6%) |
Housing Structures by Number of Rooms in Enterprise
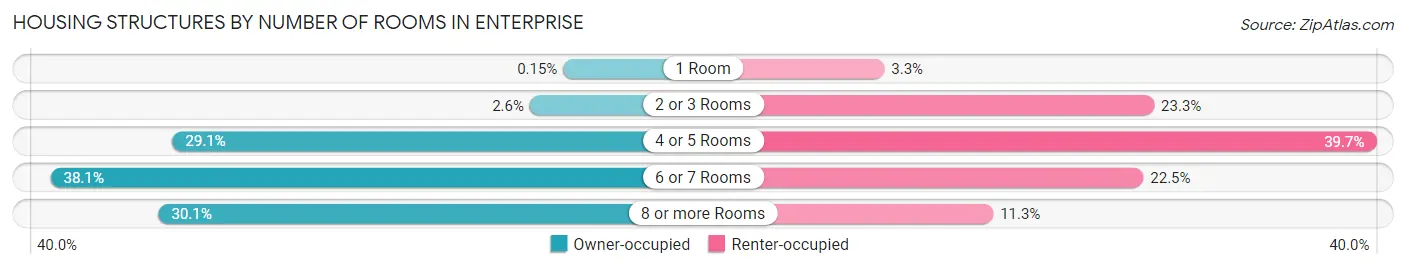
| Number of Rooms | Owner-occupied | Renter-occupied |
| 1 Room | 76 (0.2%) | 978 (3.3%) |
| 2 or 3 Rooms | 1,291 (2.6%) | 6,915 (23.3%) |
| 4 or 5 Rooms | 14,317 (29.1%) | 11,801 (39.7%) |
| 6 or 7 Rooms | 18,761 (38.1%) | 6,677 (22.5%) |
| 8 or more Rooms | 14,826 (30.1%) | 3,373 (11.3%) |
| Total | 49,271 (100.0%) | 29,744 (100.0%) |
Housing Structure by Heating Type in Enterprise
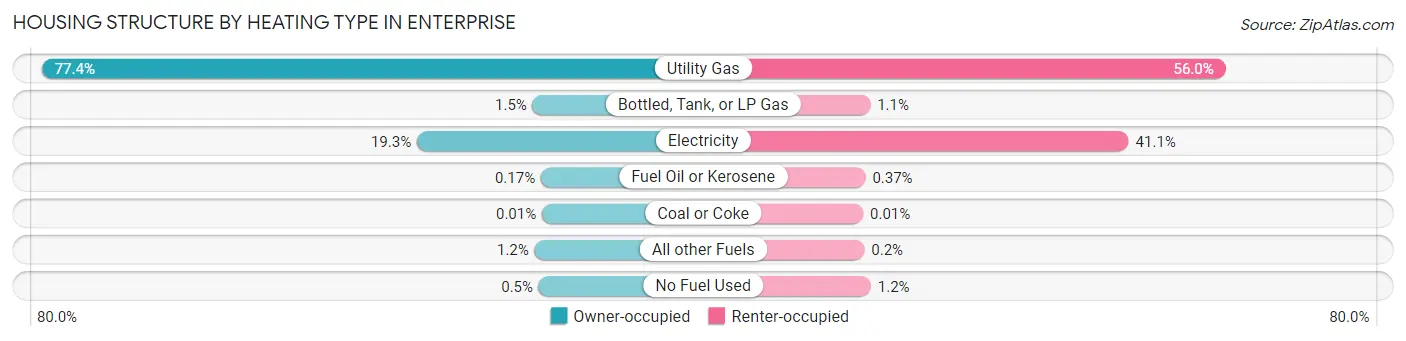
| Heating Type | Owner-occupied | Renter-occupied |
| Utility Gas | 38,114 (77.4%) | 16,669 (56.0%) |
| Bottled, Tank, or LP Gas | 717 (1.5%) | 330 (1.1%) |
| Electricity | 9,530 (19.3%) | 12,214 (41.1%) |
| Fuel Oil or Kerosene | 84 (0.2%) | 110 (0.4%) |
| Coal or Coke | 5 (0.0%) | 3 (0.0%) |
| All other Fuels | 573 (1.2%) | 59 (0.2%) |
| No Fuel Used | 248 (0.5%) | 359 (1.2%) |
| Total | 49,271 (100.0%) | 29,744 (100.0%) |
Household Vehicle Usage in Enterprise
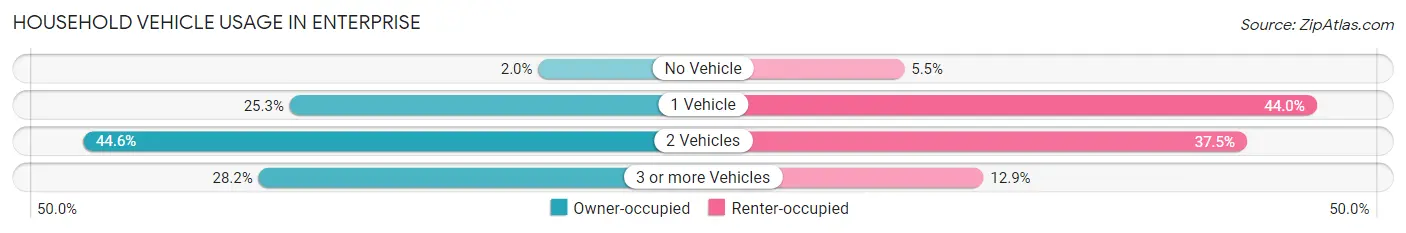
| Vehicles per Household | Owner-occupied | Renter-occupied |
| No Vehicle | 1,006 (2.0%) | 1,647 (5.5%) |
| 1 Vehicle | 12,442 (25.3%) | 13,095 (44.0%) |
| 2 Vehicles | 21,948 (44.6%) | 11,157 (37.5%) |
| 3 or more Vehicles | 13,875 (28.2%) | 3,845 (12.9%) |
| Total | 49,271 (100.0%) | 29,744 (100.0%) |
Real Estate & Mortgages in Enterprise
Real Estate and Mortgage Overview in Enterprise
| Characteristic | Without Mortgage | With Mortgage |
| Housing Units | 9,894 | 39,377 |
| Median Property Value | $419,900 | $412,200 |
| Median Household Income | $92,483 | $12,380 |
| Monthly Housing Costs | $507 | $4,935 |
| Real Estate Taxes | $2,292 | $1,694 |
Property Value by Mortgage Status in Enterprise
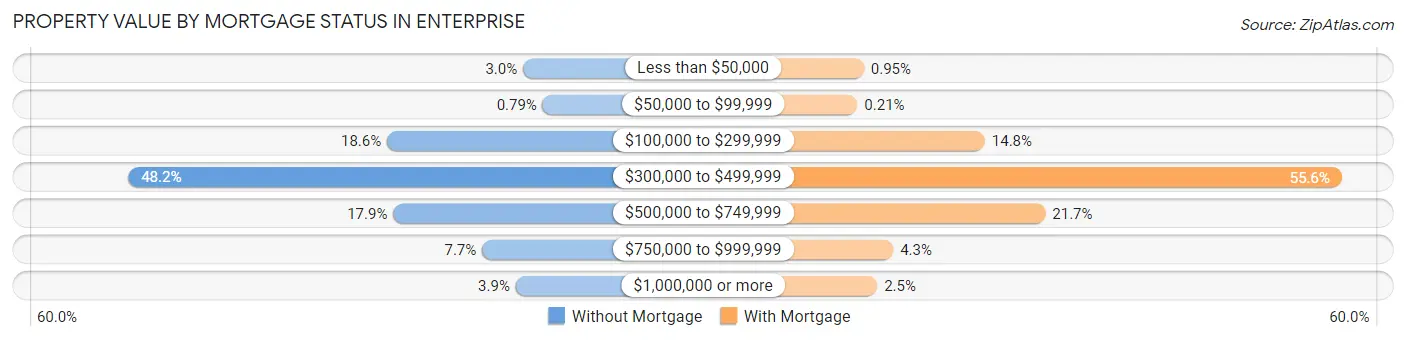
| Property Value | Without Mortgage | With Mortgage |
| Less than $50,000 | 300 (3.0%) | 373 (0.9%) |
| $50,000 to $99,999 | 78 (0.8%) | 83 (0.2%) |
| $100,000 to $299,999 | 1,838 (18.6%) | 5,821 (14.8%) |
| $300,000 to $499,999 | 4,764 (48.1%) | 21,883 (55.6%) |
| $500,000 to $749,999 | 1,768 (17.9%) | 8,542 (21.7%) |
| $750,000 to $999,999 | 763 (7.7%) | 1,699 (4.3%) |
| $1,000,000 or more | 383 (3.9%) | 976 (2.5%) |
| Total | 9,894 (100.0%) | 39,377 (100.0%) |
Household Income by Mortgage Status in Enterprise
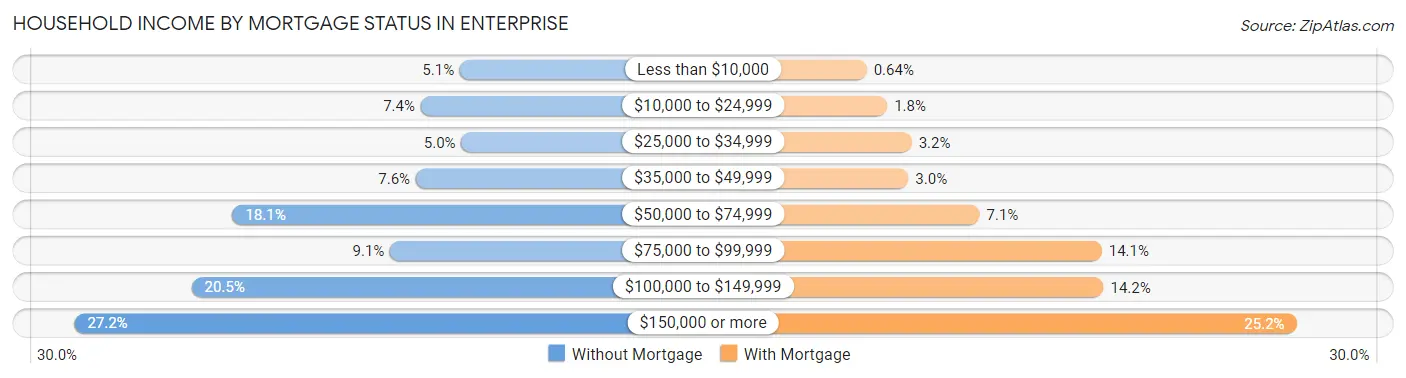
| Household Income | Without Mortgage | With Mortgage |
| Less than $10,000 | 507 (5.1%) | 252 (0.6%) |
| $10,000 to $24,999 | 728 (7.4%) | 712 (1.8%) |
| $25,000 to $34,999 | 499 (5.0%) | 1,264 (3.2%) |
| $35,000 to $49,999 | 756 (7.6%) | 1,188 (3.0%) |
| $50,000 to $74,999 | 1,793 (18.1%) | 2,792 (7.1%) |
| $75,000 to $99,999 | 901 (9.1%) | 5,542 (14.1%) |
| $100,000 to $149,999 | 2,024 (20.5%) | 5,578 (14.2%) |
| $150,000 or more | 2,686 (27.2%) | 9,921 (25.2%) |
| Total | 9,894 (100.0%) | 39,377 (100.0%) |
Property Value to Household Income Ratio in Enterprise
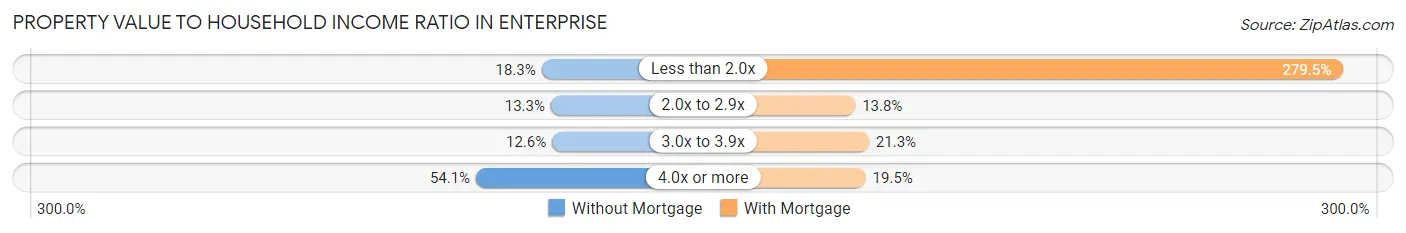
| Value-to-Income Ratio | Without Mortgage | With Mortgage |
| Less than 2.0x | 1,814 (18.3%) | 110,070 (279.5%) |
| 2.0x to 2.9x | 1,318 (13.3%) | 5,423 (13.8%) |
| 3.0x to 3.9x | 1,251 (12.6%) | 8,369 (21.2%) |
| 4.0x or more | 5,351 (54.1%) | 7,672 (19.5%) |
| Total | 9,894 (100.0%) | 39,377 (100.0%) |
Real Estate Taxes by Mortgage Status in Enterprise
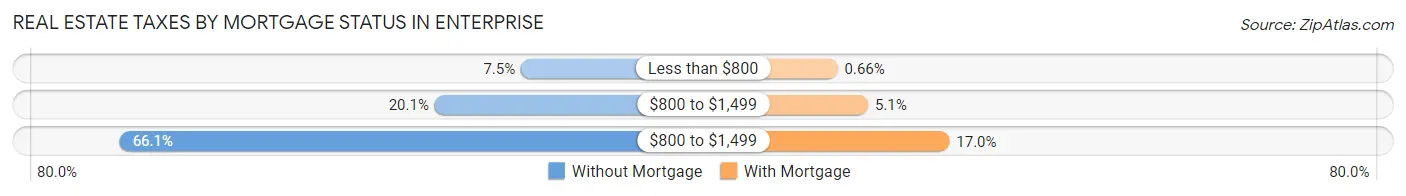
| Property Taxes | Without Mortgage | With Mortgage |
| Less than $800 | 738 (7.5%) | 258 (0.7%) |
| $800 to $1,499 | 1,986 (20.1%) | 2,009 (5.1%) |
| $800 to $1,499 | 6,540 (66.1%) | 6,696 (17.0%) |
| Total | 9,894 (100.0%) | 39,377 (100.0%) |
Health & Disability in Enterprise
Health Insurance Coverage by Age in Enterprise
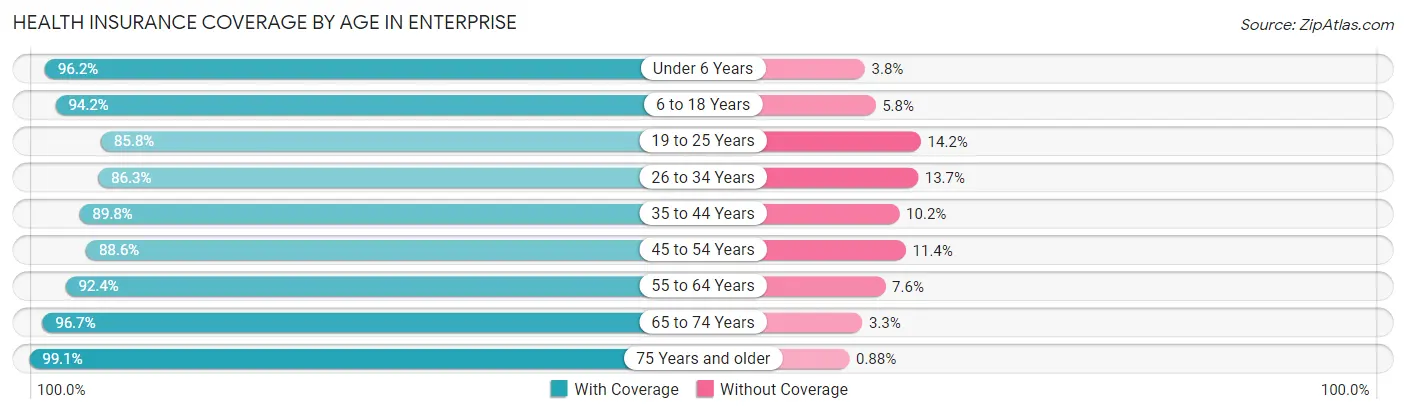
| Age Bracket | With Coverage | Without Coverage |
| Under 6 Years | 19,172 (96.2%) | 755 (3.8%) |
| 6 to 18 Years | 33,818 (94.2%) | 2,066 (5.8%) |
| 19 to 25 Years | 15,309 (85.8%) | 2,543 (14.2%) |
| 26 to 34 Years | 30,772 (86.3%) | 4,885 (13.7%) |
| 35 to 44 Years | 34,715 (89.8%) | 3,958 (10.2%) |
| 45 to 54 Years | 27,560 (88.6%) | 3,559 (11.4%) |
| 55 to 64 Years | 20,609 (92.4%) | 1,699 (7.6%) |
| 65 to 74 Years | 15,575 (96.7%) | 532 (3.3%) |
| 75 Years and older | 7,516 (99.1%) | 67 (0.9%) |
| Total | 205,046 (91.1%) | 20,064 (8.9%) |
Health Insurance Coverage by Citizenship Status in Enterprise
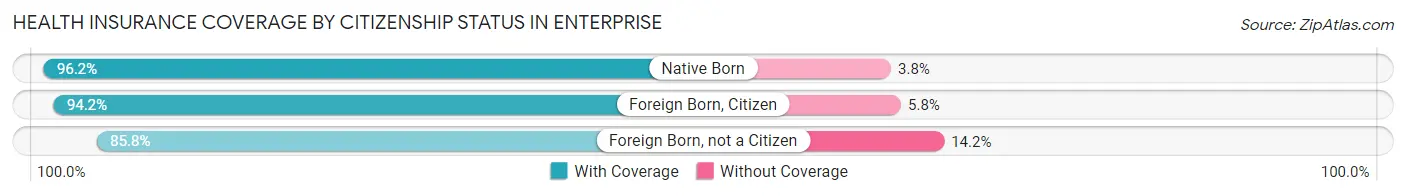
| Citizenship Status | With Coverage | Without Coverage |
| Native Born | 19,172 (96.2%) | 755 (3.8%) |
| Foreign Born, Citizen | 33,818 (94.2%) | 2,066 (5.8%) |
| Foreign Born, not a Citizen | 15,309 (85.8%) | 2,543 (14.2%) |
Health Insurance Coverage by Household Income in Enterprise
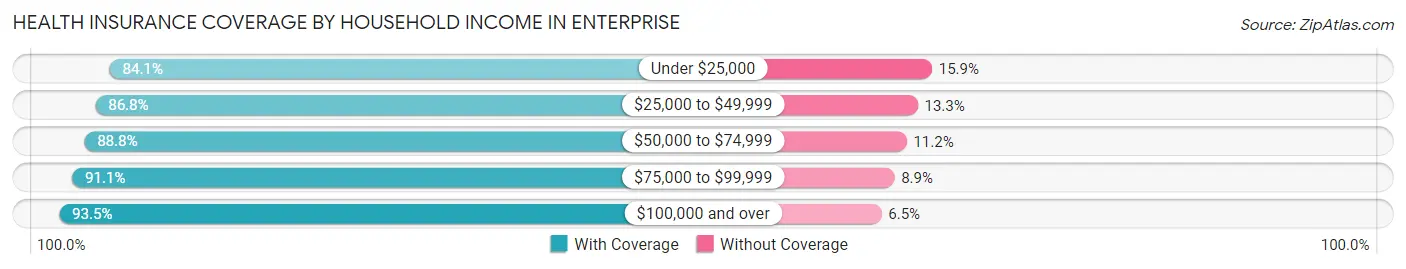
| Household Income | With Coverage | Without Coverage |
| Under $25,000 | 11,390 (84.1%) | 2,158 (15.9%) |
| $25,000 to $49,999 | 22,893 (86.8%) | 3,496 (13.3%) |
| $50,000 to $74,999 | 30,335 (88.8%) | 3,820 (11.2%) |
| $75,000 to $99,999 | 30,468 (91.1%) | 2,973 (8.9%) |
| $100,000 and over | 109,905 (93.5%) | 7,617 (6.5%) |
Public vs Private Health Insurance Coverage by Age in Enterprise
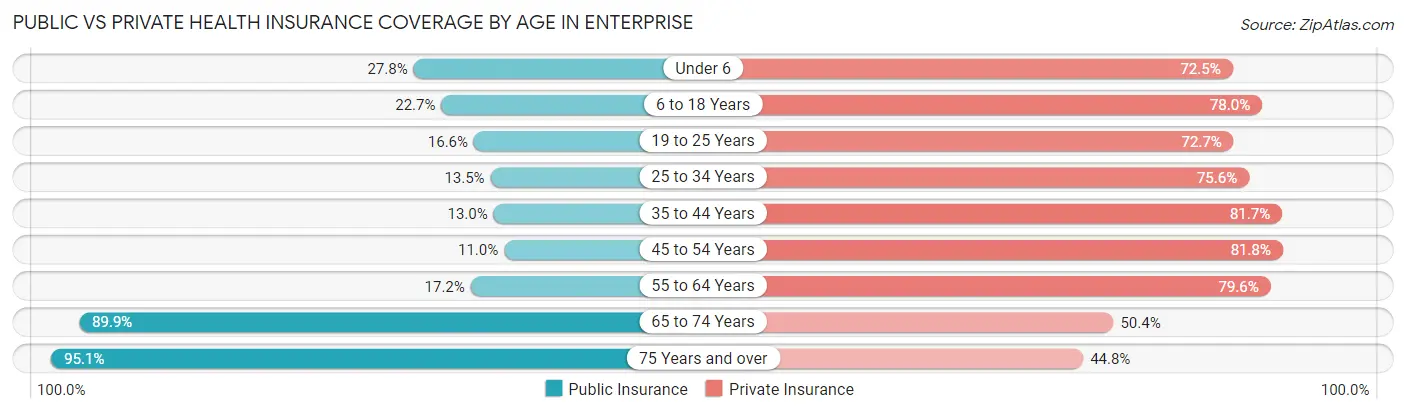
| Age Bracket | Public Insurance | Private Insurance |
| Under 6 | 5,543 (27.8%) | 14,450 (72.5%) |
| 6 to 18 Years | 8,131 (22.7%) | 27,986 (78.0%) |
| 19 to 25 Years | 2,965 (16.6%) | 12,983 (72.7%) |
| 25 to 34 Years | 4,825 (13.5%) | 26,945 (75.6%) |
| 35 to 44 Years | 5,007 (13.0%) | 31,596 (81.7%) |
| 45 to 54 Years | 3,423 (11.0%) | 25,467 (81.8%) |
| 55 to 64 Years | 3,839 (17.2%) | 17,754 (79.6%) |
| 65 to 74 Years | 14,482 (89.9%) | 8,123 (50.4%) |
| 75 Years and over | 7,210 (95.1%) | 3,398 (44.8%) |
| Total | 55,425 (24.6%) | 168,702 (74.9%) |
Disability Status by Sex by Age in Enterprise
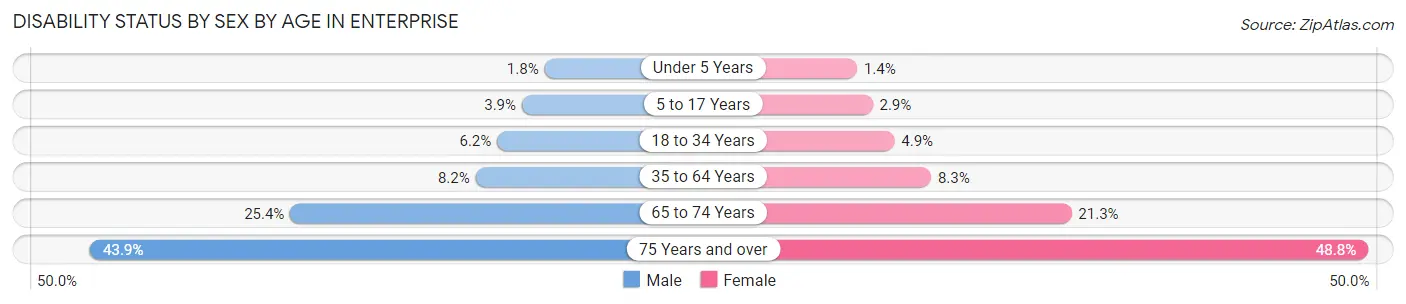
| Age Bracket | Male | Female |
| Under 5 Years | 167 (1.8%) | 99 (1.4%) |
| 5 to 17 Years | 682 (3.8%) | 541 (2.9%) |
| 18 to 34 Years | 1,679 (6.1%) | 1,401 (4.9%) |
| 35 to 64 Years | 3,825 (8.2%) | 3,741 (8.3%) |
| 65 to 74 Years | 1,929 (25.4%) | 1,811 (21.3%) |
| 75 Years and over | 1,440 (43.9%) | 2,102 (48.8%) |
Disability Class by Sex by Age in Enterprise
Disability Class: Hearing Difficulty
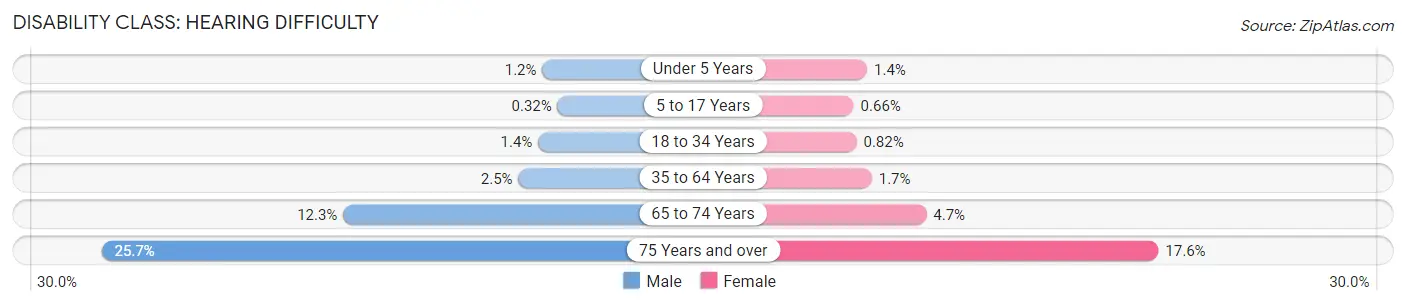
| Age Bracket | Male | Female |
| Under 5 Years | 112 (1.2%) | 99 (1.4%) |
| 5 to 17 Years | 56 (0.3%) | 126 (0.7%) |
| 18 to 34 Years | 381 (1.4%) | 237 (0.8%) |
| 35 to 64 Years | 1,175 (2.5%) | 756 (1.7%) |
| 65 to 74 Years | 933 (12.3%) | 400 (4.7%) |
| 75 Years and over | 843 (25.7%) | 759 (17.6%) |
Disability Class: Vision Difficulty
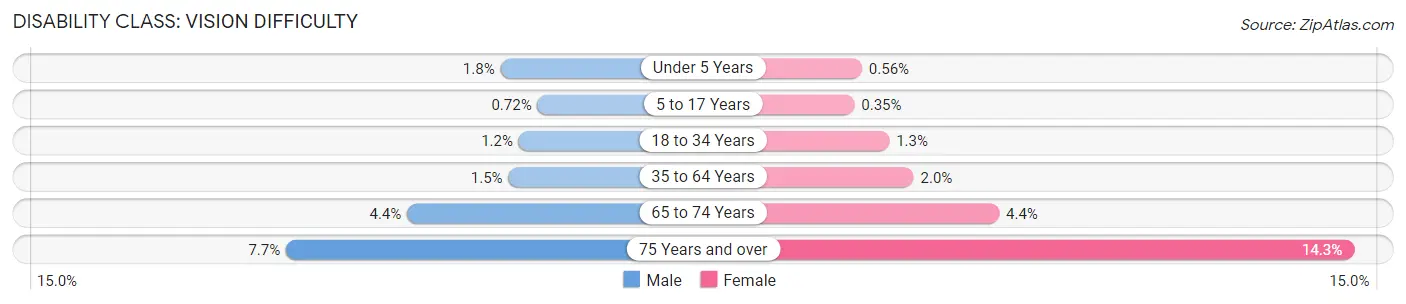
| Age Bracket | Male | Female |
| Under 5 Years | 167 (1.8%) | 39 (0.6%) |
| 5 to 17 Years | 128 (0.7%) | 66 (0.4%) |
| 18 to 34 Years | 339 (1.2%) | 378 (1.3%) |
| 35 to 64 Years | 719 (1.5%) | 902 (2.0%) |
| 65 to 74 Years | 331 (4.3%) | 372 (4.4%) |
| 75 Years and over | 253 (7.7%) | 614 (14.3%) |
Disability Class: Cognitive Difficulty
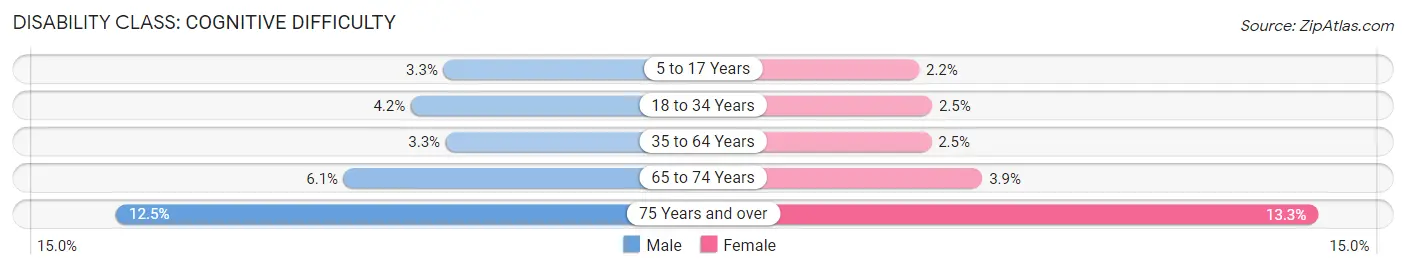
| Age Bracket | Male | Female |
| 5 to 17 Years | 591 (3.3%) | 408 (2.1%) |
| 18 to 34 Years | 1,157 (4.2%) | 722 (2.5%) |
| 35 to 64 Years | 1,535 (3.3%) | 1,125 (2.5%) |
| 65 to 74 Years | 465 (6.1%) | 332 (3.9%) |
| 75 Years and over | 408 (12.4%) | 571 (13.3%) |
Disability Class: Ambulatory Difficulty
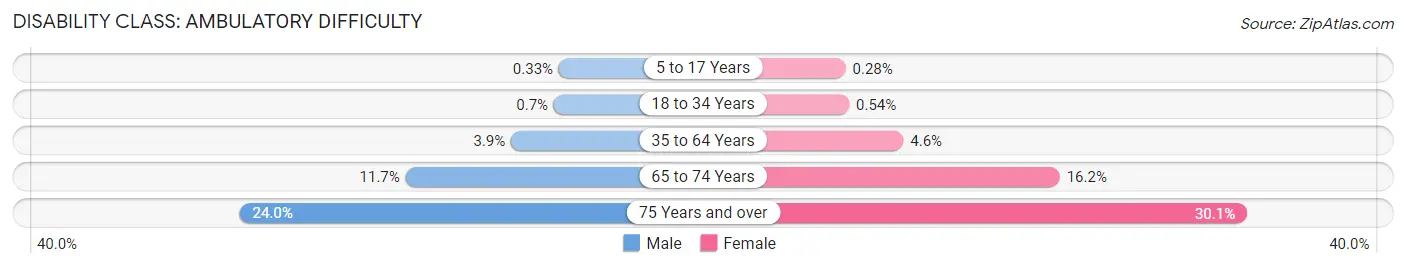
| Age Bracket | Male | Female |
| 5 to 17 Years | 59 (0.3%) | 53 (0.3%) |
| 18 to 34 Years | 190 (0.7%) | 155 (0.5%) |
| 35 to 64 Years | 1,819 (3.9%) | 2,066 (4.6%) |
| 65 to 74 Years | 891 (11.7%) | 1,375 (16.2%) |
| 75 Years and over | 788 (24.0%) | 1,295 (30.1%) |
Disability Class: Self-Care Difficulty

| Age Bracket | Male | Female |
| 5 to 17 Years | 200 (1.1%) | 92 (0.5%) |
| 18 to 34 Years | 142 (0.5%) | 87 (0.3%) |
| 35 to 64 Years | 855 (1.8%) | 545 (1.2%) |
| 65 to 74 Years | 432 (5.7%) | 359 (4.2%) |
| 75 Years and over | 308 (9.4%) | 488 (11.3%) |
Technology Access in Enterprise
Computing Device Access in Enterprise
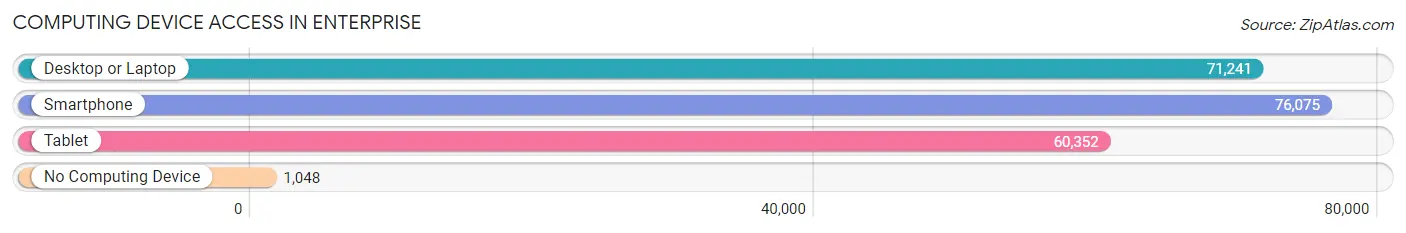
| Device Type | # Households | % Households |
| Desktop or Laptop | 71,241 | 90.2% |
| Smartphone | 76,075 | 96.3% |
| Tablet | 60,352 | 76.4% |
| No Computing Device | 1,048 | 1.3% |
| Total | 79,015 | 100.0% |
Internet Access in Enterprise
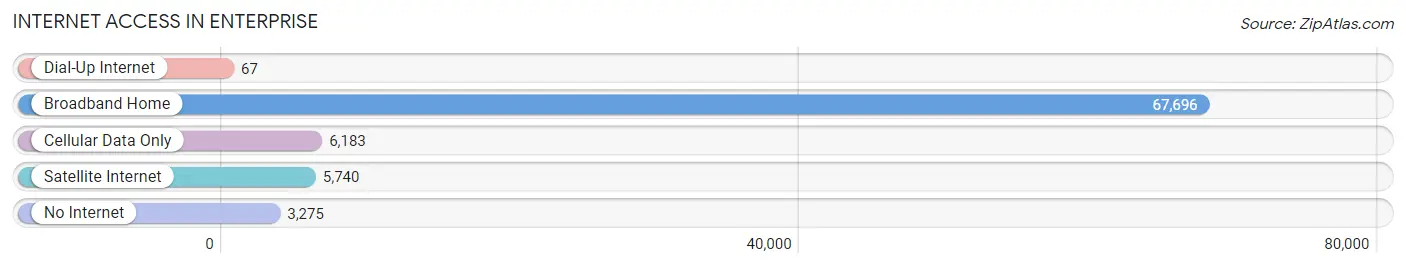
| Internet Type | # Households | % Households |
| Dial-Up Internet | 67 | 0.1% |
| Broadband Home | 67,696 | 85.7% |
| Cellular Data Only | 6,183 | 7.8% |
| Satellite Internet | 5,740 | 7.3% |
| No Internet | 3,275 | 4.1% |
| Total | 79,015 | 100.0% |
Enterprise Summary
Enterprise is an unincorporated town located in Clark County, Nevada. It is located in the Las Vegas Valley, about 15 miles south of the Las Vegas Strip. The population of Enterprise was estimated to be 28,531 in 2019.
History
The area that is now Enterprise was first settled in the late 19th century by Mormon settlers. The town was originally known as Eldorado, but was later renamed Enterprise in honor of the Enterprise Mining Company, which operated in the area. The town was officially incorporated in 1950.
Geography
Enterprise is located in the Las Vegas Valley, about 15 miles south of the Las Vegas Strip. The town is situated in a desert climate, with hot summers and mild winters. The terrain is mostly flat, with some hills in the surrounding area.
Economy
Enterprise is primarily a residential community, with most of its residents commuting to nearby Las Vegas for work. The town is home to several businesses, including a Walmart Supercenter, a Home Depot, and a variety of restaurants and retail stores. The town is also home to several industrial parks, which provide employment opportunities for local residents.
Demographics
As of 2019, the population of Enterprise was estimated to be 28,531. The racial makeup of the town was 73.3% White, 8.2% African American, 0.7% Native American, 4.2% Asian, 0.2% Pacific Islander, and 12.4% from other races. The median household income was $60,945, and the median age was 34.
Conclusion
Enterprise is an unincorporated town located in Clark County, Nevada. It is located in the Las Vegas Valley, about 15 miles south of the Las Vegas Strip. The population of Enterprise was estimated to be 28,531 in 2019. The town is primarily a residential community, with most of its residents commuting to nearby Las Vegas for work. The town is home to several businesses, including a Walmart Supercenter, a Home Depot, and a variety of restaurants and retail stores. The racial makeup of the town was 73.3% White, 8.2% African American, 0.7% Native American, 4.2% Asian, 0.2% Pacific Islander, and 12.4% from other races. The median household income was $60,945, and the median age was 34. Enterprise is a vibrant community that offers its residents a variety of amenities and employment opportunities.
Common Questions
What is Per Capita Income in Enterprise?
Per Capita income in Enterprise is $41,717.
What is the Median Family Income in Enterprise?
Median Family Income in Enterprise is $98,462.
What is the Median Household income in Enterprise?
Median Household Income in Enterprise is $91,165.
What is Income or Wage Gap in Enterprise?
Income or Wage Gap in Enterprise is 16.2%.
Women in Enterprise earn 83.8 cents for every dollar earned by a man.
What is Family Income Deficit in Enterprise?
Family Income Deficit in Enterprise is $10,910.
Families that are below poverty line in Enterprise earn $10,910 less on average than the poverty threshold level.
What is Inequality or Gini Index in Enterprise?
Inequality or Gini Index in Enterprise is 0.42.
What is the Total Population of Enterprise?
Total Population of Enterprise is 225,461.
What is the Total Male Population of Enterprise?
Total Male Population of Enterprise is 112,754.
What is the Total Female Population of Enterprise?
Total Female Population of Enterprise is 112,707.
What is the Ratio of Males per 100 Females in Enterprise?
There are 100.04 Males per 100 Females in Enterprise.
What is the Ratio of Females per 100 Males in Enterprise?
There are 99.96 Females per 100 Males in Enterprise.
What is the Median Population Age in Enterprise?
Median Population Age in Enterprise is 35.6 Years.
What is the Average Family Size in Enterprise
Average Family Size in Enterprise is 3.4 People.
What is the Average Household Size in Enterprise
Average Household Size in Enterprise is 2.9 People.
How Large is the Labor Force in Enterprise?
There are 129,633 People in the Labor Forcein in Enterprise.
What is the Percentage of People in the Labor Force in Enterprise?
73.3% of People are in the Labor Force in Enterprise.
What is the Unemployment Rate in Enterprise?
Unemployment Rate in Enterprise is 6.6%.