Coral Springs, FL Map & Demographics
Coral Springs Map
Coral Springs Overview
$38,483
PER CAPITA INCOME
$97,941
AVG FAMILY INCOME
$87,488
AVG HOUSEHOLD INCOME
22.7%
WAGE / INCOME GAP [ % ]
77.3¢/ $1
WAGE / INCOME GAP [ $ ]
$11,360
FAMILY INCOME DEFICIT
0.42
INEQUALITY / GINI INDEX
133,801
TOTAL POPULATION
63,934
MALE POPULATION
69,867
FEMALE POPULATION
91.51
MALES / 100 FEMALES
109.28
FEMALES / 100 MALES
36.8
MEDIAN AGE
3.4
AVG FAMILY SIZE
3.0
AVG HOUSEHOLD SIZE
73,065
LABOR FORCE [ PEOPLE ]
70.5%
PERCENT IN LABOR FORCE
6.2%
UNEMPLOYMENT RATE
Income in Coral Springs
Income Overview in Coral Springs
Per Capita Income in Coral Springs is $38,483, while median incomes of families and households are $97,941 and $87,488 respectively.
| Characteristic | Number | Measure |
| Per Capita Income | 133,801 | $38,483 |
| Median Family Income | 34,291 | $97,941 |
| Mean Family Income | 34,291 | $123,139 |
| Median Household Income | 44,260 | $87,488 |
| Mean Household Income | 44,260 | $112,047 |
| Income Deficit | 34,291 | $11,360 |
| Wage / Income Gap (%) | 133,801 | 22.73% |
| Wage / Income Gap ($) | 133,801 | 77.27¢ per $1 |
| Gini / Inequality Index | 133,801 | 0.42 |
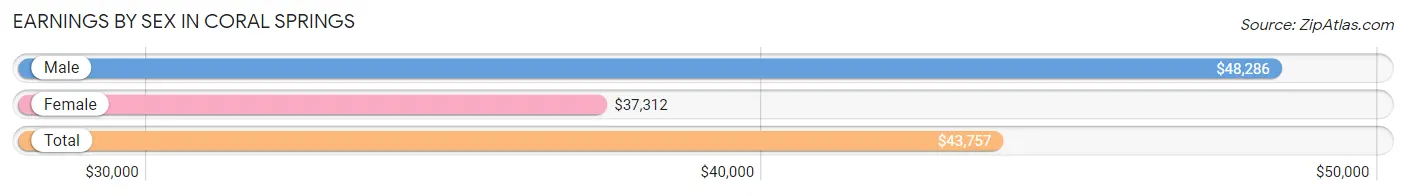
Earnings by Sex in Coral Springs
Average Earnings in Coral Springs are $43,757, $48,286 for men and $37,312 for women, a difference of 22.7%.
| Sex | Number | Average Earnings |
| Male | 38,416 (51.2%) | $48,286 |
| Female | 36,660 (48.8%) | $37,312 |
| Total | 75,076 (100.0%) | $43,757 |
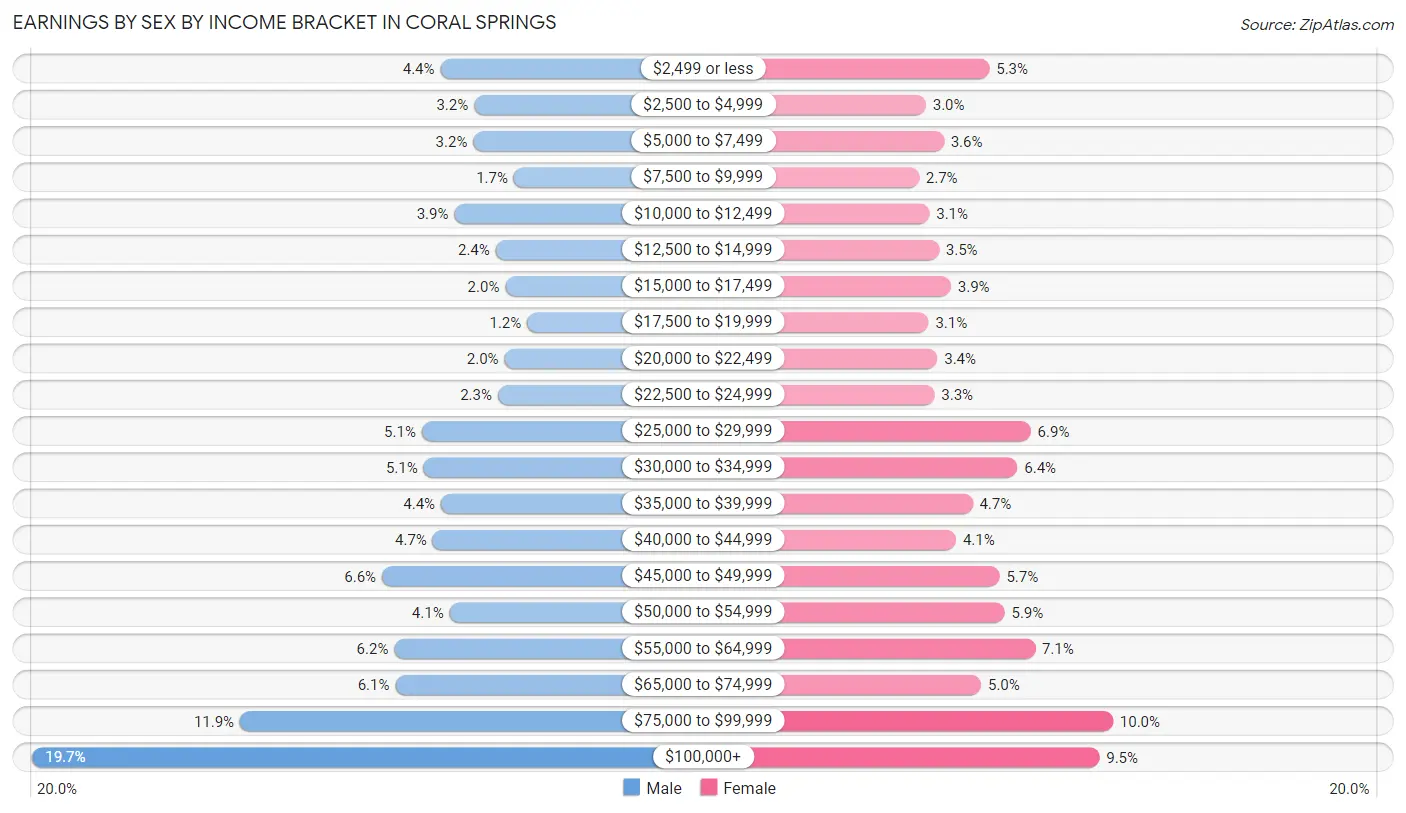
Earnings by Sex by Income Bracket in Coral Springs
The most common earnings brackets in Coral Springs are $100,000+ for men (7,573 | 19.7%) and $75,000 to $99,999 for women (3,655 | 10.0%).
| Income | Male | Female |
| $2,499 or less | 1,697 (4.4%) | 1,956 (5.3%) |
| $2,500 to $4,999 | 1,213 (3.2%) | 1,086 (3.0%) |
| $5,000 to $7,499 | 1,225 (3.2%) | 1,332 (3.6%) |
| $7,500 to $9,999 | 641 (1.7%) | 988 (2.7%) |
| $10,000 to $12,499 | 1,497 (3.9%) | 1,131 (3.1%) |
| $12,500 to $14,999 | 901 (2.4%) | 1,263 (3.5%) |
| $15,000 to $17,499 | 763 (2.0%) | 1,429 (3.9%) |
| $17,500 to $19,999 | 451 (1.2%) | 1,120 (3.1%) |
| $20,000 to $22,499 | 775 (2.0%) | 1,244 (3.4%) |
| $22,500 to $24,999 | 873 (2.3%) | 1,202 (3.3%) |
| $25,000 to $29,999 | 1,968 (5.1%) | 2,525 (6.9%) |
| $30,000 to $34,999 | 1,939 (5.1%) | 2,342 (6.4%) |
| $35,000 to $39,999 | 1,692 (4.4%) | 1,728 (4.7%) |
| $40,000 to $44,999 | 1,811 (4.7%) | 1,499 (4.1%) |
| $45,000 to $49,999 | 2,538 (6.6%) | 2,097 (5.7%) |
| $50,000 to $54,999 | 1,566 (4.1%) | 2,166 (5.9%) |
| $55,000 to $64,999 | 2,364 (6.1%) | 2,585 (7.0%) |
| $65,000 to $74,999 | 2,346 (6.1%) | 1,844 (5.0%) |
| $75,000 to $99,999 | 4,583 (11.9%) | 3,655 (10.0%) |
| $100,000+ | 7,573 (19.7%) | 3,468 (9.5%) |
| Total | 38,416 (100.0%) | 36,660 (100.0%) |
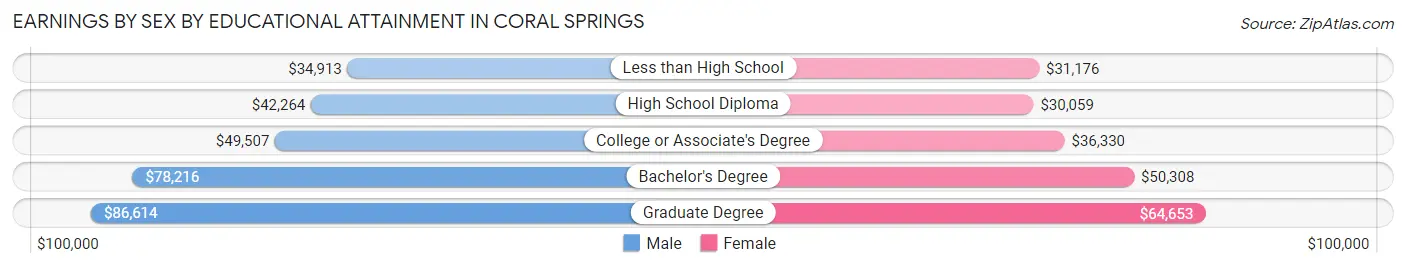
Earnings by Sex by Educational Attainment in Coral Springs
Average earnings in Coral Springs are $55,062 for men and $43,547 for women, a difference of 20.9%. Men with an educational attainment of graduate degree enjoy the highest average annual earnings of $86,614, while those with less than high school education earn the least with $34,913. Women with an educational attainment of graduate degree earn the most with the average annual earnings of $64,653, while those with high school diploma education have the smallest earnings of $30,059.
| Educational Attainment | Male Income | Female Income |
| Less than High School | $34,913 | $31,176 |
| High School Diploma | $42,264 | $30,059 |
| College or Associate's Degree | $49,507 | $36,330 |
| Bachelor's Degree | $78,216 | $50,308 |
| Graduate Degree | $86,614 | $64,653 |
| Total | $55,062 | $43,547 |
Family Income in Coral Springs
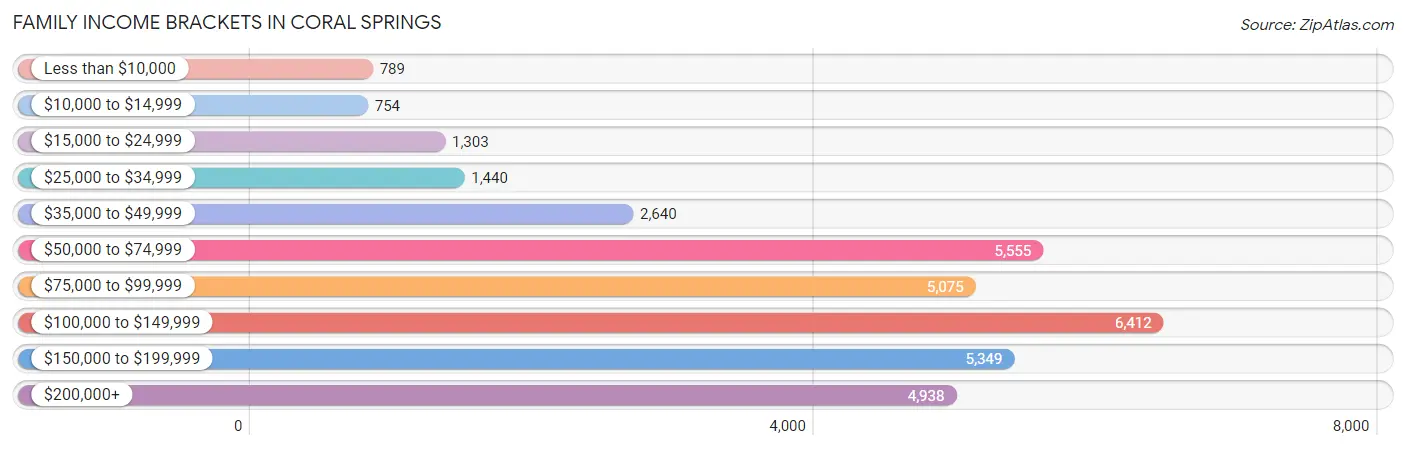
Family Income Brackets in Coral Springs
According to the Coral Springs family income data, there are 6,412 families falling into the $100,000 to $149,999 income range, which is the most common income bracket and makes up 18.7% of all families. Conversely, the $10,000 to $14,999 income bracket is the least frequent group with only 754 families (2.2%) belonging to this category.
| Income Bracket | # Families | % Families |
| Less than $10,000 | 789 | 2.3% |
| $10,000 to $14,999 | 754 | 2.2% |
| $15,000 to $24,999 | 1,303 | 3.8% |
| $25,000 to $34,999 | 1,440 | 4.2% |
| $35,000 to $49,999 | 2,640 | 7.7% |
| $50,000 to $74,999 | 5,555 | 16.2% |
| $75,000 to $99,999 | 5,075 | 14.8% |
| $100,000 to $149,999 | 6,412 | 18.7% |
| $150,000 to $199,999 | 5,349 | 15.6% |
| $200,000+ | 4,938 | 14.4% |
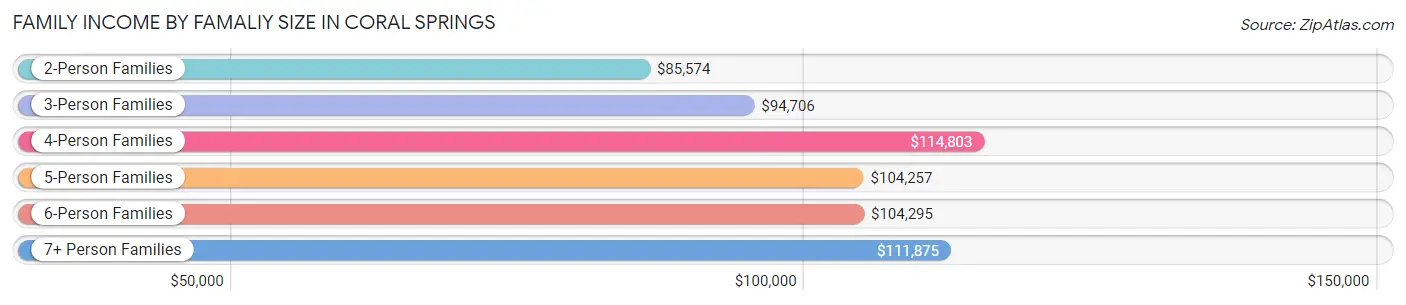
Family Income by Famaliy Size in Coral Springs
4-person families (7,664 | 22.4%) account for the highest median family income in Coral Springs with $114,803 per family, while 2-person families (13,192 | 38.5%) have the highest median income of $42,787 per family member.
| Income Bracket | # Families | Median Income |
| 2-Person Families | 13,192 (38.5%) | $85,574 |
| 3-Person Families | 8,726 (25.5%) | $94,706 |
| 4-Person Families | 7,664 (22.4%) | $114,803 |
| 5-Person Families | 3,020 (8.8%) | $104,257 |
| 6-Person Families | 1,209 (3.5%) | $104,295 |
| 7+ Person Families | 480 (1.4%) | $111,875 |
| Total | 34,291 (100.0%) | $97,941 |
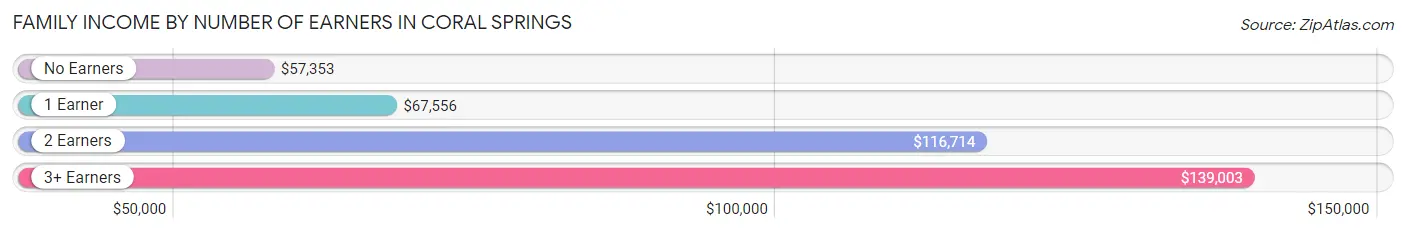
Family Income by Number of Earners in Coral Springs
The median family income in Coral Springs is $97,941, with families comprising 3+ earners (5,412) having the highest median family income of $139,003, while families with no earners (2,856) have the lowest median family income of $57,353, accounting for 15.8% and 8.3% of families, respectively.
| Number of Earners | # Families | Median Income |
| No Earners | 2,856 (8.3%) | $57,353 |
| 1 Earner | 10,134 (29.5%) | $67,556 |
| 2 Earners | 15,889 (46.3%) | $116,714 |
| 3+ Earners | 5,412 (15.8%) | $139,003 |
| Total | 34,291 (100.0%) | $97,941 |
Household Income in Coral Springs
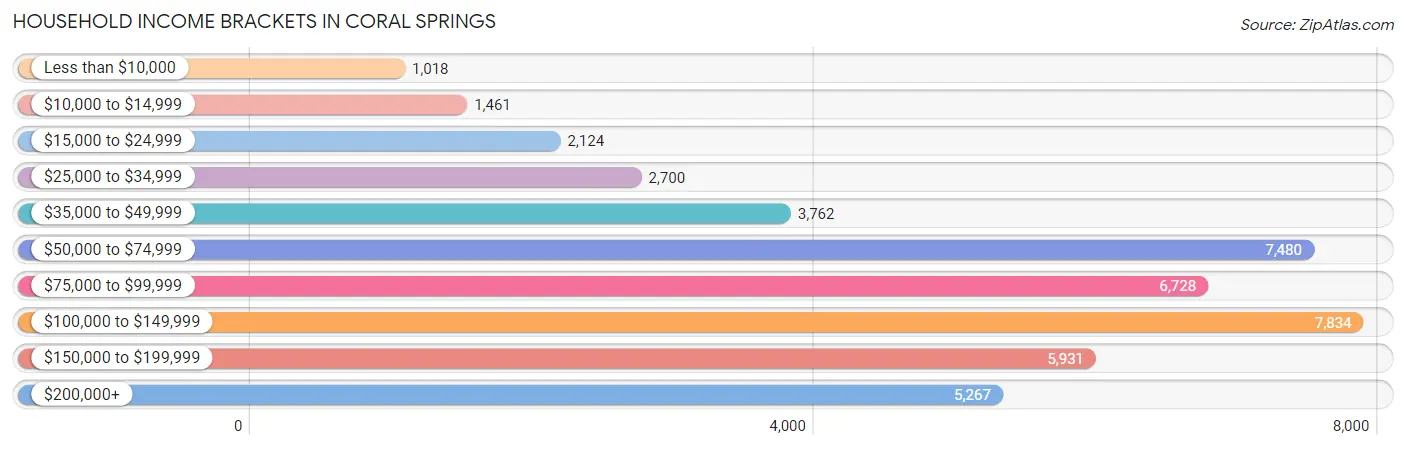
Household Income Brackets in Coral Springs
With 7,834 households falling in the category, the $100,000 to $149,999 income range is the most frequent in Coral Springs, accounting for 17.7% of all households. In contrast, only 1,018 households (2.3%) fall into the less than $10,000 income bracket, making it the least populous group.
| Income Bracket | # Households | % Households |
| Less than $10,000 | 1,018 | 2.3% |
| $10,000 to $14,999 | 1,461 | 3.3% |
| $15,000 to $24,999 | 2,124 | 4.8% |
| $25,000 to $34,999 | 2,700 | 6.1% |
| $35,000 to $49,999 | 3,762 | 8.5% |
| $50,000 to $74,999 | 7,480 | 16.9% |
| $75,000 to $99,999 | 6,728 | 15.2% |
| $100,000 to $149,999 | 7,834 | 17.7% |
| $150,000 to $199,999 | 5,931 | 13.4% |
| $200,000+ | 5,267 | 11.9% |
Household Income by Householder Age in Coral Springs
The median household income in Coral Springs is $87,488, with the highest median household income of $99,218 found in the 45 to 64 years age bracket for the primary householder. A total of 19,049 households (43.0%) fall into this category. Meanwhile, the 15 to 24 years age bracket for the primary householder has the lowest median household income of $50,619, with 1,057 households (2.4%) in this group.
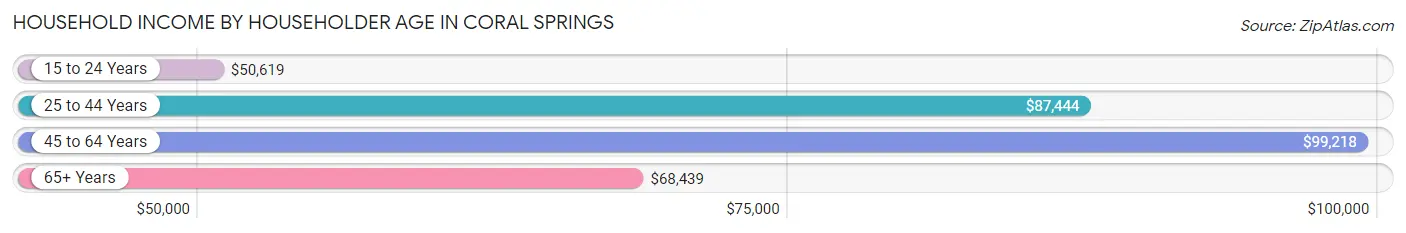
| Income Bracket | # Households | Median Income |
| 15 to 24 Years | 1,057 (2.4%) | $50,619 |
| 25 to 44 Years | 15,622 (35.3%) | $87,444 |
| 45 to 64 Years | 19,049 (43.0%) | $99,218 |
| 65+ Years | 8,532 (19.3%) | $68,439 |
| Total | 44,260 (100.0%) | $87,488 |
Poverty in Coral Springs
Income Below Poverty by Sex and Age in Coral Springs
With 7.2% poverty level for males and 10.1% for females among the residents of Coral Springs, 16 and 17 year old males and under 5 year old females are the most vulnerable to poverty, with 461 males (21.6%) and 720 females (15.5%) in their respective age groups living below the poverty level.
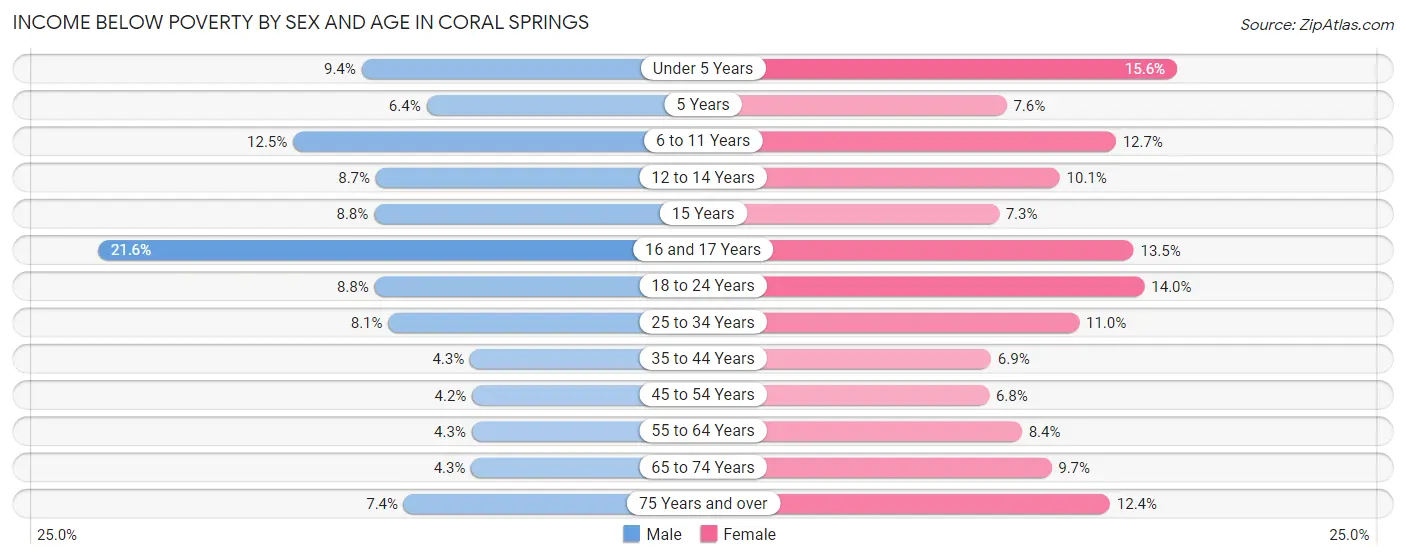
| Age Bracket | Male | Female |
| Under 5 Years | 347 (9.4%) | 720 (15.5%) |
| 5 Years | 52 (6.4%) | 63 (7.6%) |
| 6 to 11 Years | 667 (12.5%) | 644 (12.7%) |
| 12 to 14 Years | 285 (8.7%) | 331 (10.1%) |
| 15 Years | 104 (8.8%) | 106 (7.3%) |
| 16 and 17 Years | 461 (21.6%) | 320 (13.5%) |
| 18 to 24 Years | 563 (8.8%) | 767 (14.0%) |
| 25 to 34 Years | 636 (8.1%) | 968 (11.0%) |
| 35 to 44 Years | 387 (4.3%) | 666 (6.9%) |
| 45 to 54 Years | 370 (4.2%) | 632 (6.8%) |
| 55 to 64 Years | 349 (4.3%) | 804 (8.4%) |
| 65 to 74 Years | 207 (4.3%) | 559 (9.7%) |
| 75 Years and over | 160 (7.4%) | 414 (12.4%) |
| Total | 4,588 (7.2%) | 6,994 (10.1%) |
Income Above Poverty by Sex and Age in Coral Springs
According to the poverty statistics in Coral Springs, males aged 45 to 54 years and females aged 45 to 54 years are the age groups that are most secure financially, with 95.8% of males and 93.2% of females in these age groups living above the poverty line.
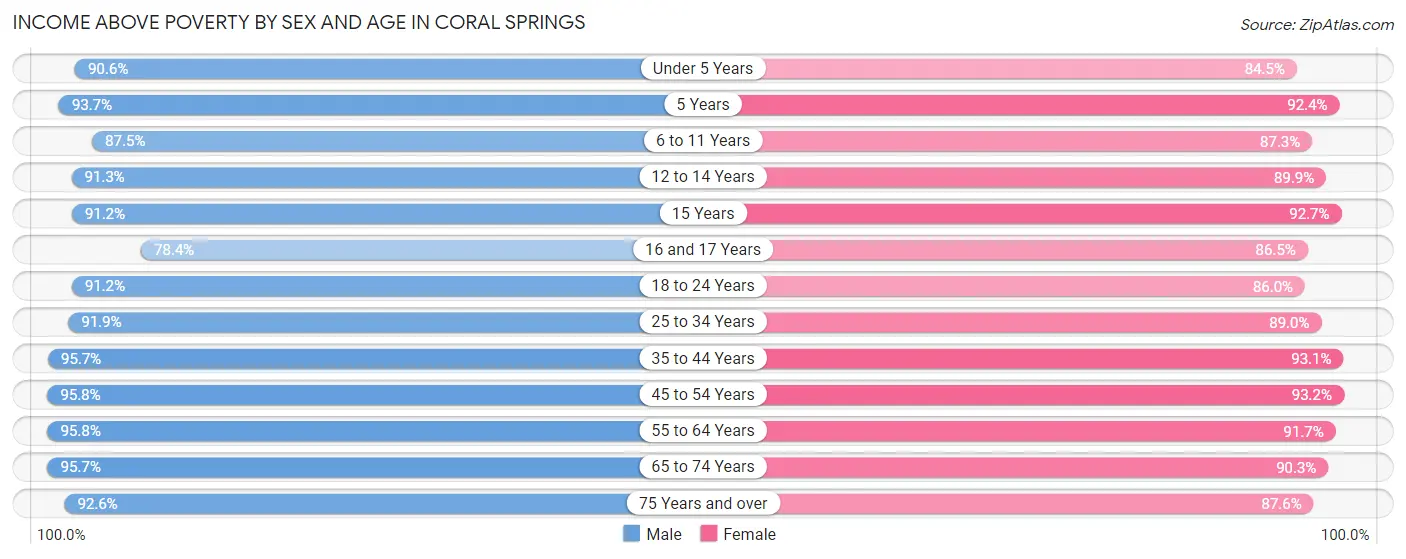
| Age Bracket | Male | Female |
| Under 5 Years | 3,361 (90.6%) | 3,909 (84.5%) |
| 5 Years | 767 (93.6%) | 762 (92.4%) |
| 6 to 11 Years | 4,651 (87.5%) | 4,423 (87.3%) |
| 12 to 14 Years | 2,990 (91.3%) | 2,944 (89.9%) |
| 15 Years | 1,081 (91.2%) | 1,350 (92.7%) |
| 16 and 17 Years | 1,673 (78.4%) | 2,044 (86.5%) |
| 18 to 24 Years | 5,865 (91.2%) | 4,695 (86.0%) |
| 25 to 34 Years | 7,200 (91.9%) | 7,821 (89.0%) |
| 35 to 44 Years | 8,551 (95.7%) | 8,964 (93.1%) |
| 45 to 54 Years | 8,380 (95.8%) | 8,624 (93.2%) |
| 55 to 64 Years | 7,865 (95.8%) | 8,823 (91.6%) |
| 65 to 74 Years | 4,643 (95.7%) | 5,190 (90.3%) |
| 75 Years and over | 2,002 (92.6%) | 2,913 (87.6%) |
| Total | 59,029 (92.8%) | 62,462 (89.9%) |
Income Below Poverty Among Married-Couple Families in Coral Springs
The poverty statistics for married-couple families in Coral Springs show that 2.9% or 710 of the total 24,669 families live below the poverty line. Families with 5 or more children have the highest poverty rate of 16.7%, comprising of 12 families. On the other hand, families with no children have the lowest poverty rate of 1.8%, which includes 236 families.
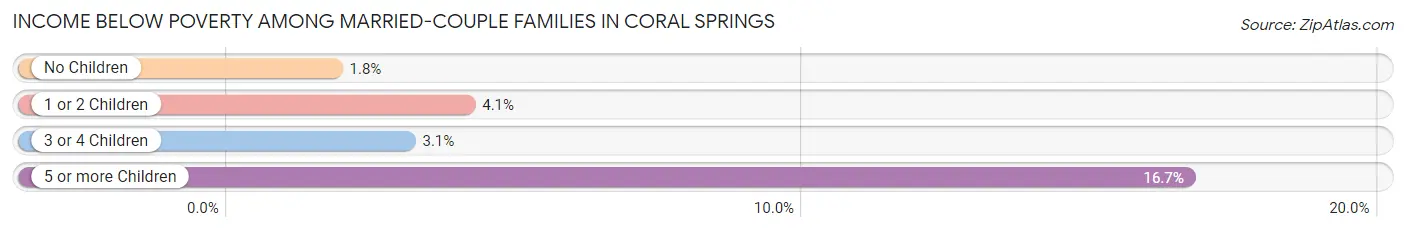
| Children | Above Poverty | Below Poverty |
| No Children | 12,736 (98.2%) | 236 (1.8%) |
| 1 or 2 Children | 9,440 (95.9%) | 407 (4.1%) |
| 3 or 4 Children | 1,723 (96.9%) | 55 (3.1%) |
| 5 or more Children | 60 (83.3%) | 12 (16.7%) |
| Total | 23,959 (97.1%) | 710 (2.9%) |
Income Below Poverty Among Single-Parent Households in Coral Springs
According to the poverty data in Coral Springs, 13.1% or 344 single-father households and 20.7% or 1,452 single-mother households are living below the poverty line. Among single-father households, those with 3 or 4 children have the highest poverty rate, with 37 households (28.2%) experiencing poverty. Likewise, among single-mother households, those with 5 or more children have the highest poverty rate, with 68 households (100.0%) falling below the poverty line.
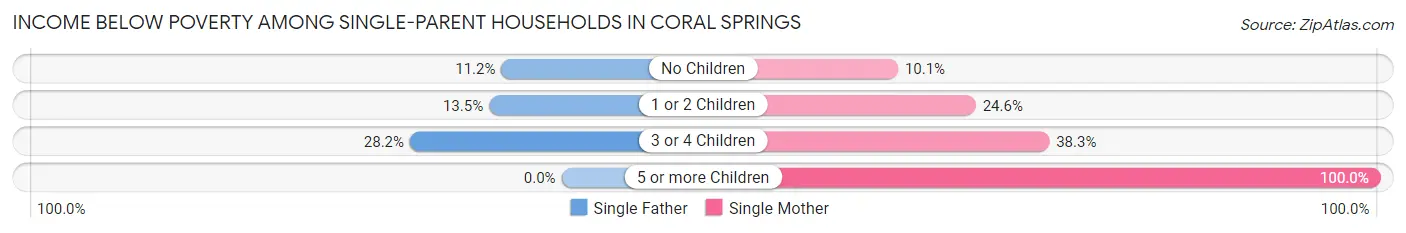
| Children | Single Father | Single Mother |
| No Children | 145 (11.2%) | 276 (10.1%) |
| 1 or 2 Children | 162 (13.5%) | 897 (24.6%) |
| 3 or 4 Children | 37 (28.2%) | 211 (38.3%) |
| 5 or more Children | 0 (0.0%) | 68 (100.0%) |
| Total | 344 (13.1%) | 1,452 (20.7%) |
Income Below Poverty Among Married-Couple vs Single-Parent Households in Coral Springs
The poverty data for Coral Springs shows that 710 of the married-couple family households (2.9%) and 1,796 of the single-parent households (18.7%) are living below the poverty level. Within the married-couple family households, those with 5 or more children have the highest poverty rate, with 12 households (16.7%) falling below the poverty line. Among the single-parent households, those with 5 or more children have the highest poverty rate, with 68 household (100.0%) living below poverty.
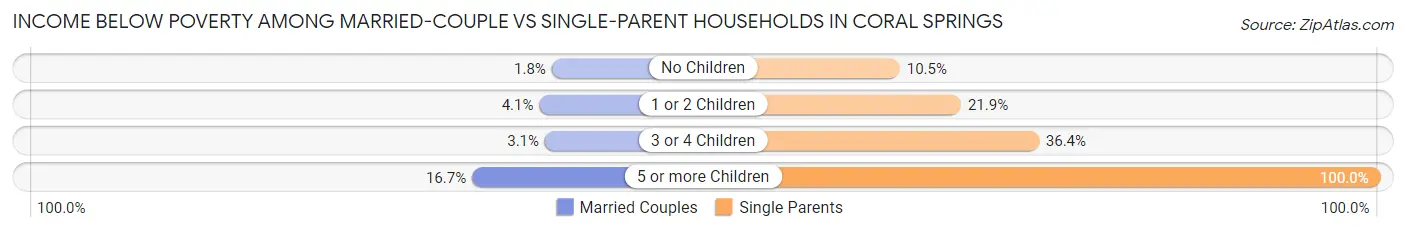
| Children | Married-Couple Families | Single-Parent Households |
| No Children | 236 (1.8%) | 421 (10.5%) |
| 1 or 2 Children | 407 (4.1%) | 1,059 (21.8%) |
| 3 or 4 Children | 55 (3.1%) | 248 (36.4%) |
| 5 or more Children | 12 (16.7%) | 68 (100.0%) |
| Total | 710 (2.9%) | 1,796 (18.7%) |
Race in Coral Springs
The most populous races in Coral Springs are White / Caucasian (66,728 | 49.9%), Hispanic or Latino (39,315 | 29.4%), and Black / African American (32,850 | 24.5%).
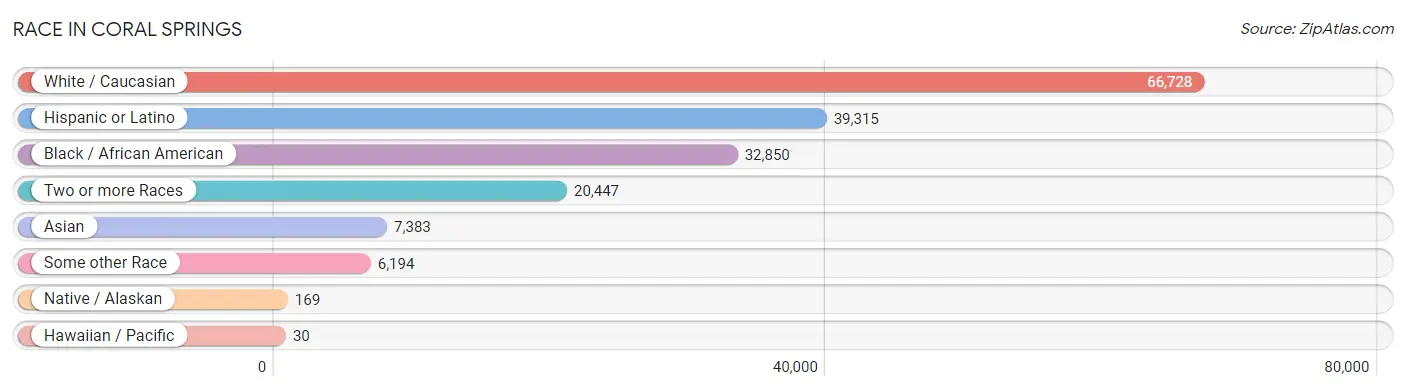
| Race | # Population | % Population |
| Asian | 7,383 | 5.5% |
| Black / African American | 32,850 | 24.5% |
| Hawaiian / Pacific | 30 | 0.0% |
| Hispanic or Latino | 39,315 | 29.4% |
| Native / Alaskan | 169 | 0.1% |
| White / Caucasian | 66,728 | 49.9% |
| Two or more Races | 20,447 | 15.3% |
| Some other Race | 6,194 | 4.6% |
| Total | 133,801 | 100.0% |
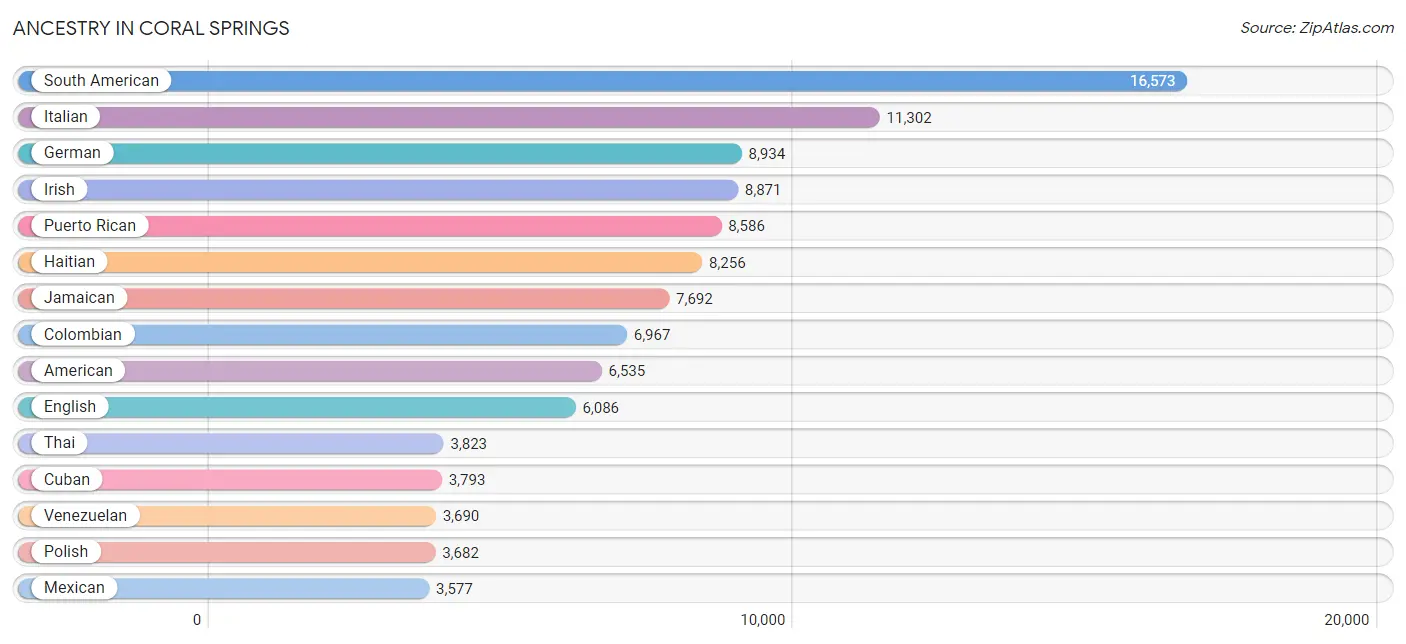
Ancestry in Coral Springs
The most populous ancestries reported in Coral Springs are South American (16,573 | 12.4%), Italian (11,302 | 8.5%), German (8,934 | 6.7%), Irish (8,871 | 6.6%), and Puerto Rican (8,586 | 6.4%), together accounting for 40.6% of all Coral Springs residents.
| Ancestry | # Population | % Population |
| African | 658 | 0.5% |
| American | 6,535 | 4.9% |
| Arab | 974 | 0.7% |
| Argentinean | 861 | 0.6% |
| Armenian | 54 | 0.0% |
| Austrian | 311 | 0.2% |
| Bahamian | 446 | 0.3% |
| Barbadian | 41 | 0.0% |
| Belgian | 54 | 0.0% |
| Belizean | 19 | 0.0% |
| Bhutanese | 213 | 0.2% |
| Blackfeet | 29 | 0.0% |
| Bolivian | 148 | 0.1% |
| Brazilian | 1,446 | 1.1% |
| British | 477 | 0.4% |
| British West Indian | 226 | 0.2% |
| Bulgarian | 126 | 0.1% |
| Burmese | 135 | 0.1% |
| Canadian | 734 | 0.5% |
| Central American | 2,304 | 1.7% |
| Central American Indian | 127 | 0.1% |
| Cherokee | 46 | 0.0% |
| Chilean | 619 | 0.5% |
| Chippewa | 81 | 0.1% |
| Colombian | 6,967 | 5.2% |
| Costa Rican | 3 | 0.0% |
| Creek | 6 | 0.0% |
| Croatian | 13 | 0.0% |
| Cuban | 3,793 | 2.8% |
| Czech | 84 | 0.1% |
| Czechoslovakian | 90 | 0.1% |
| Danish | 172 | 0.1% |
| Dominican | 2,915 | 2.2% |
| Dutch | 518 | 0.4% |
| Eastern European | 1,040 | 0.8% |
| Ecuadorian | 617 | 0.5% |
| Egyptian | 99 | 0.1% |
| English | 6,086 | 4.5% |
| European | 1,436 | 1.1% |
| Filipino | 64 | 0.1% |
| Finnish | 137 | 0.1% |
| French | 1,966 | 1.5% |
| French Canadian | 268 | 0.2% |
| German | 8,934 | 6.7% |
| Ghanaian | 53 | 0.0% |
| Greek | 640 | 0.5% |
| Guatemalan | 648 | 0.5% |
| Guyanese | 617 | 0.5% |
| Haitian | 8,256 | 6.2% |
| Honduran | 937 | 0.7% |
| Hungarian | 717 | 0.5% |
| Indian (Asian) | 2,604 | 1.9% |
| Iranian | 167 | 0.1% |
| Irish | 8,871 | 6.6% |
| Israeli | 183 | 0.1% |
| Italian | 11,302 | 8.5% |
| Jamaican | 7,692 | 5.8% |
| Korean | 1,341 | 1.0% |
| Latvian | 17 | 0.0% |
| Lebanese | 288 | 0.2% |
| Lithuanian | 308 | 0.2% |
| Lumbee | 36 | 0.0% |
| Luxembourger | 98 | 0.1% |
| Malaysian | 9 | 0.0% |
| Mexican | 3,577 | 2.7% |
| Mongolian | 11 | 0.0% |
| Moroccan | 95 | 0.1% |
| Native Hawaiian | 7 | 0.0% |
| Nicaraguan | 434 | 0.3% |
| Nigerian | 185 | 0.1% |
| Northern European | 76 | 0.1% |
| Norwegian | 241 | 0.2% |
| Pakistani | 48 | 0.0% |
| Palestinian | 160 | 0.1% |
| Panamanian | 82 | 0.1% |
| Paraguayan | 14 | 0.0% |
| Pennsylvania German | 28 | 0.0% |
| Peruvian | 3,468 | 2.6% |
| Polish | 3,682 | 2.8% |
| Portuguese | 618 | 0.5% |
| Puerto Rican | 8,586 | 6.4% |
| Romanian | 266 | 0.2% |
| Russian | 1,562 | 1.2% |
| Salvadoran | 200 | 0.2% |
| Samoan | 7 | 0.0% |
| Scandinavian | 273 | 0.2% |
| Scotch-Irish | 469 | 0.4% |
| Scottish | 1,009 | 0.7% |
| Serbian | 66 | 0.1% |
| Sioux | 3 | 0.0% |
| Slavic | 4 | 0.0% |
| Slovak | 29 | 0.0% |
| South African | 38 | 0.0% |
| South American | 16,573 | 12.4% |
| South American Indian | 166 | 0.1% |
| Spaniard | 278 | 0.2% |
| Spanish | 372 | 0.3% |
| Spanish American | 29 | 0.0% |
| Sri Lankan | 724 | 0.5% |
| Subsaharan African | 1,024 | 0.8% |
| Swedish | 447 | 0.3% |
| Swiss | 188 | 0.1% |
| Syrian | 94 | 0.1% |
| Thai | 3,823 | 2.9% |
| Trinidadian and Tobagonian | 939 | 0.7% |
| Turkish | 18 | 0.0% |
| Ukrainian | 409 | 0.3% |
| Uruguayan | 119 | 0.1% |
| Venezuelan | 3,690 | 2.8% |
| Vietnamese | 26 | 0.0% |
| Welsh | 332 | 0.3% |
| West Indian | 317 | 0.2% |
| Yugoslavian | 5 | 0.0% |
| Zimbabwean | 8 | 0.0% | View All 114 Rows |
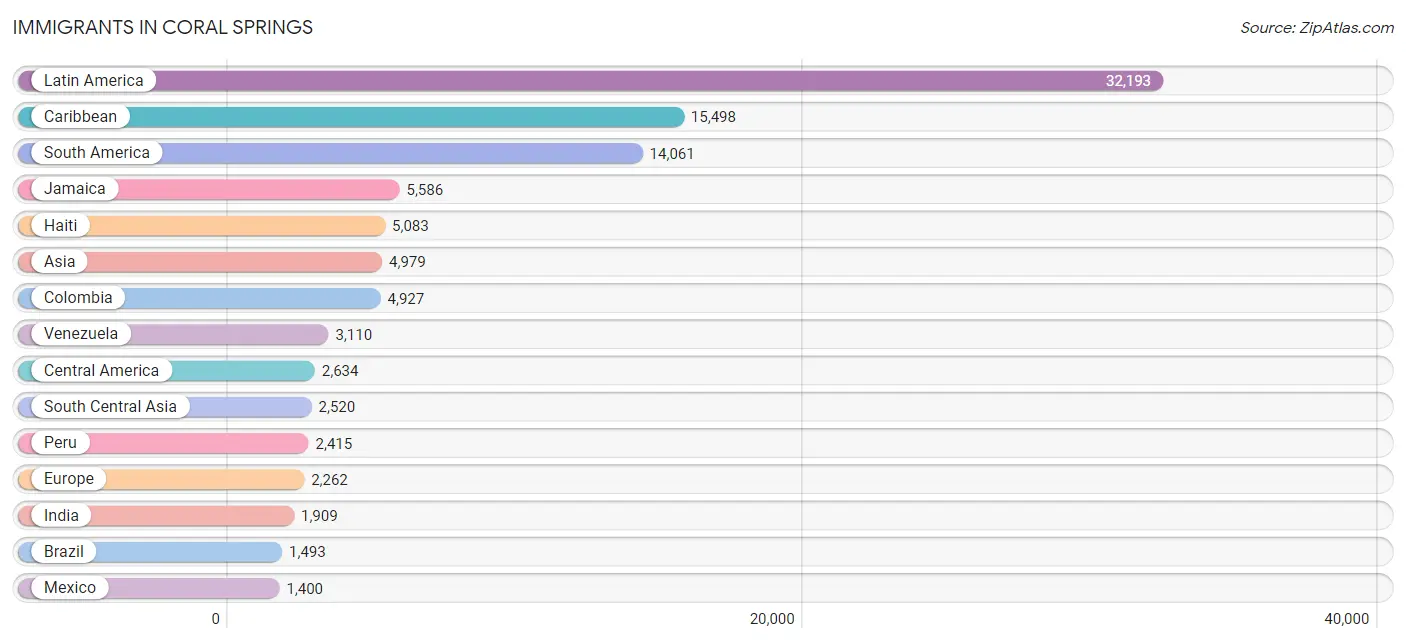
Immigrants in Coral Springs
The most numerous immigrant groups reported in Coral Springs came from Latin America (32,193 | 24.1%), Caribbean (15,498 | 11.6%), South America (14,061 | 10.5%), Jamaica (5,586 | 4.2%), and Haiti (5,083 | 3.8%), together accounting for 54.1% of all Coral Springs residents.
| Immigration Origin | # Population | % Population |
| Africa | 385 | 0.3% |
| Argentina | 559 | 0.4% |
| Armenia | 8 | 0.0% |
| Asia | 4,979 | 3.7% |
| Australia | 4 | 0.0% |
| Bahamas | 189 | 0.1% |
| Bangladesh | 110 | 0.1% |
| Barbados | 15 | 0.0% |
| Belgium | 12 | 0.0% |
| Belize | 28 | 0.0% |
| Bolivia | 56 | 0.0% |
| Brazil | 1,493 | 1.1% |
| Bulgaria | 48 | 0.0% |
| Canada | 912 | 0.7% |
| Caribbean | 15,498 | 11.6% |
| Central America | 2,634 | 2.0% |
| Chile | 392 | 0.3% |
| China | 1,240 | 0.9% |
| Colombia | 4,927 | 3.7% |
| Cuba | 1,280 | 1.0% |
| Dominican Republic | 1,274 | 0.9% |
| Eastern Africa | 27 | 0.0% |
| Eastern Asia | 1,347 | 1.0% |
| Eastern Europe | 644 | 0.5% |
| Ecuador | 611 | 0.5% |
| Egypt | 30 | 0.0% |
| El Salvador | 56 | 0.0% |
| England | 558 | 0.4% |
| Europe | 2,262 | 1.7% |
| France | 15 | 0.0% |
| Germany | 266 | 0.2% |
| Ghana | 53 | 0.0% |
| Greece | 95 | 0.1% |
| Guatemala | 286 | 0.2% |
| Guyana | 339 | 0.3% |
| Haiti | 5,083 | 3.8% |
| Honduras | 657 | 0.5% |
| Hong Kong | 48 | 0.0% |
| Hungary | 106 | 0.1% |
| India | 1,909 | 1.4% |
| Iran | 82 | 0.1% |
| Iraq | 11 | 0.0% |
| Ireland | 19 | 0.0% |
| Israel | 154 | 0.1% |
| Italy | 271 | 0.2% |
| Jamaica | 5,586 | 4.2% |
| Japan | 39 | 0.0% |
| Jordan | 39 | 0.0% |
| Kazakhstan | 92 | 0.1% |
| Korea | 68 | 0.1% |
| Kuwait | 11 | 0.0% |
| Latin America | 32,193 | 24.1% |
| Lebanon | 33 | 0.0% |
| Malaysia | 18 | 0.0% |
| Mexico | 1,400 | 1.1% |
| Middle Africa | 11 | 0.0% |
| Morocco | 76 | 0.1% |
| Netherlands | 24 | 0.0% |
| Nicaragua | 149 | 0.1% |
| Nigeria | 148 | 0.1% |
| Northern Africa | 106 | 0.1% |
| Northern Europe | 828 | 0.6% |
| Oceania | 4 | 0.0% |
| Pakistan | 233 | 0.2% |
| Panama | 58 | 0.0% |
| Peru | 2,415 | 1.8% |
| Philippines | 286 | 0.2% |
| Poland | 238 | 0.2% |
| Portugal | 9 | 0.0% |
| Romania | 104 | 0.1% |
| Russia | 36 | 0.0% |
| Scotland | 57 | 0.0% |
| Singapore | 14 | 0.0% |
| South Africa | 40 | 0.0% |
| South America | 14,061 | 10.5% |
| South Central Asia | 2,520 | 1.9% |
| South Eastern Asia | 763 | 0.6% |
| Southern Europe | 467 | 0.4% |
| Spain | 92 | 0.1% |
| Sri Lanka | 22 | 0.0% |
| St. Vincent and the Grenadines | 253 | 0.2% |
| Sweden | 5 | 0.0% |
| Switzerland | 6 | 0.0% |
| Syria | 22 | 0.0% |
| Taiwan | 120 | 0.1% |
| Thailand | 44 | 0.0% |
| Trinidad and Tobago | 1,337 | 1.0% |
| Turkey | 35 | 0.0% |
| Ukraine | 74 | 0.1% |
| Uruguay | 117 | 0.1% |
| Uzbekistan | 72 | 0.1% |
| Venezuela | 3,110 | 2.3% |
| Vietnam | 401 | 0.3% |
| West Indies | 85 | 0.1% |
| Western Africa | 201 | 0.2% |
| Western Asia | 316 | 0.2% |
| Western Europe | 323 | 0.2% | View All 97 Rows |
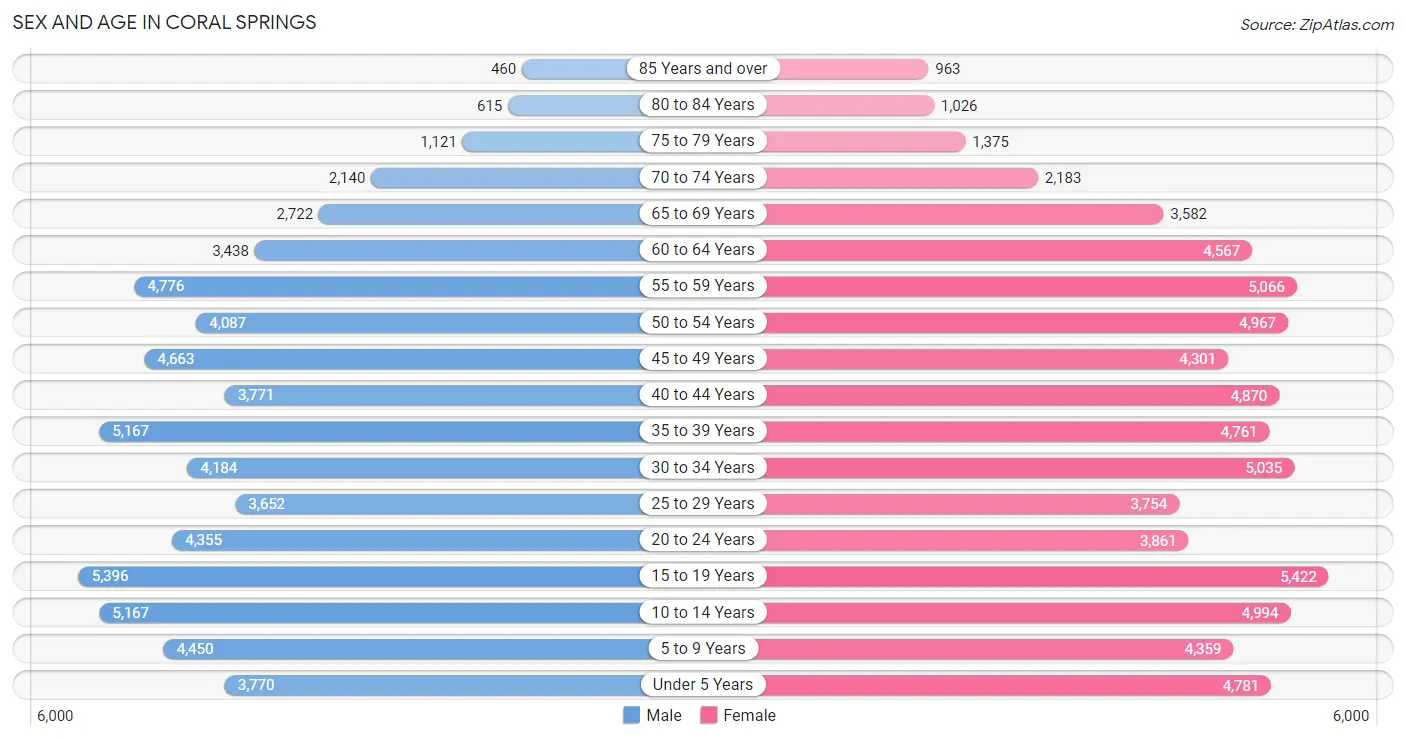
Sex and Age in Coral Springs
Sex and Age in Coral Springs
The most populous age groups in Coral Springs are 15 to 19 Years (5,396 | 8.4%) for men and 15 to 19 Years (5,422 | 7.8%) for women.
| Age Bracket | Male | Female |
| Under 5 Years | 3,770 (5.9%) | 4,781 (6.8%) |
| 5 to 9 Years | 4,450 (7.0%) | 4,359 (6.2%) |
| 10 to 14 Years | 5,167 (8.1%) | 4,994 (7.1%) |
| 15 to 19 Years | 5,396 (8.4%) | 5,422 (7.8%) |
| 20 to 24 Years | 4,355 (6.8%) | 3,861 (5.5%) |
| 25 to 29 Years | 3,652 (5.7%) | 3,754 (5.4%) |
| 30 to 34 Years | 4,184 (6.5%) | 5,035 (7.2%) |
| 35 to 39 Years | 5,167 (8.1%) | 4,761 (6.8%) |
| 40 to 44 Years | 3,771 (5.9%) | 4,870 (7.0%) |
| 45 to 49 Years | 4,663 (7.3%) | 4,301 (6.2%) |
| 50 to 54 Years | 4,087 (6.4%) | 4,967 (7.1%) |
| 55 to 59 Years | 4,776 (7.5%) | 5,066 (7.2%) |
| 60 to 64 Years | 3,438 (5.4%) | 4,567 (6.5%) |
| 65 to 69 Years | 2,722 (4.3%) | 3,582 (5.1%) |
| 70 to 74 Years | 2,140 (3.4%) | 2,183 (3.1%) |
| 75 to 79 Years | 1,121 (1.8%) | 1,375 (2.0%) |
| 80 to 84 Years | 615 (1.0%) | 1,026 (1.5%) |
| 85 Years and over | 460 (0.7%) | 963 (1.4%) |
| Total | 63,934 (100.0%) | 69,867 (100.0%) |
Families and Households in Coral Springs
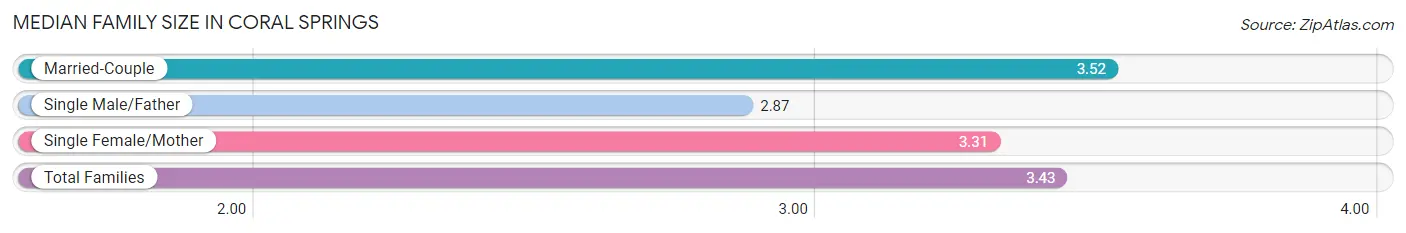
Median Family Size in Coral Springs
The median family size in Coral Springs is 3.43 persons per family, with married-couple families (24,669 | 71.9%) accounting for the largest median family size of 3.52 persons per family. On the other hand, single male/father families (2,625 | 7.7%) represent the smallest median family size with 2.87 persons per family.
| Family Type | # Families | Family Size |
| Married-Couple | 24,669 (71.9%) | 3.52 |
| Single Male/Father | 2,625 (7.7%) | 2.87 |
| Single Female/Mother | 6,997 (20.4%) | 3.31 |
| Total Families | 34,291 (100.0%) | 3.43 |
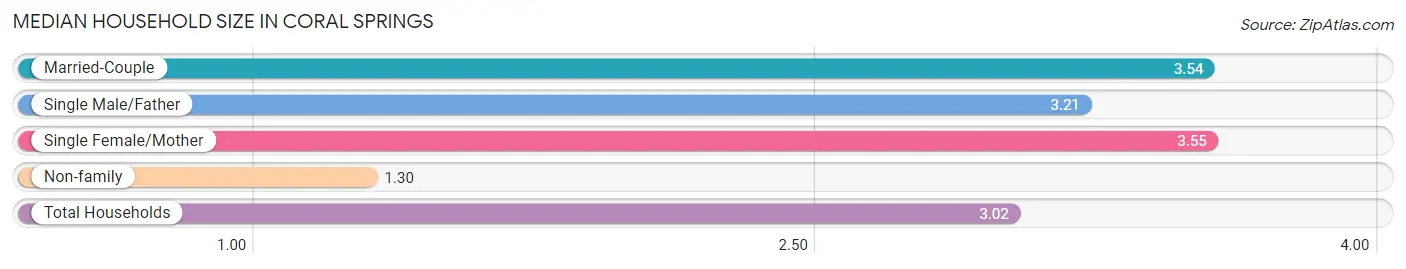
Median Household Size in Coral Springs
The median household size in Coral Springs is 3.02 persons per household, with single female/mother households (6,997 | 15.8%) accounting for the largest median household size of 3.55 persons per household. non-family households (9,969 | 22.5%) represent the smallest median household size with 1.30 persons per household.
| Household Type | # Households | Household Size |
| Married-Couple | 24,669 (55.7%) | 3.54 |
| Single Male/Father | 2,625 (5.9%) | 3.21 |
| Single Female/Mother | 6,997 (15.8%) | 3.55 |
| Non-family | 9,969 (22.5%) | 1.30 |
| Total Households | 44,260 (100.0%) | 3.02 |
Household Size by Marriage Status in Coral Springs
Out of a total of 44,260 households in Coral Springs, 34,291 (77.5%) are family households, while 9,969 (22.5%) are nonfamily households. The most numerous type of family households are 2-person households, comprising 12,338, and the most common type of nonfamily households are 1-person households, comprising 7,663.
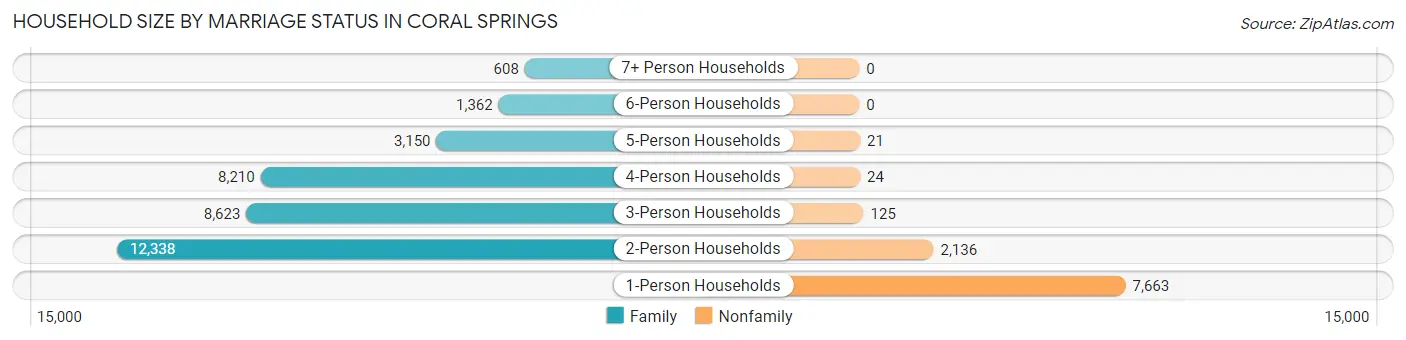
| Household Size | Family Households | Nonfamily Households |
| 1-Person Households | - | 7,663 (17.3%) |
| 2-Person Households | 12,338 (27.9%) | 2,136 (4.8%) |
| 3-Person Households | 8,623 (19.5%) | 125 (0.3%) |
| 4-Person Households | 8,210 (18.5%) | 24 (0.1%) |
| 5-Person Households | 3,150 (7.1%) | 21 (0.1%) |
| 6-Person Households | 1,362 (3.1%) | 0 (0.0%) |
| 7+ Person Households | 608 (1.4%) | 0 (0.0%) |
| Total | 34,291 (77.5%) | 9,969 (22.5%) |
Female Fertility in Coral Springs
Fertility by Age in Coral Springs
Average fertility rate in Coral Springs is 50.0 births per 1,000 women. Women in the age bracket of 20 to 34 years have the highest fertility rate with 88.0 births per 1,000 women. Women in the age bracket of 20 to 34 years acount for 67.2% of all women with births.
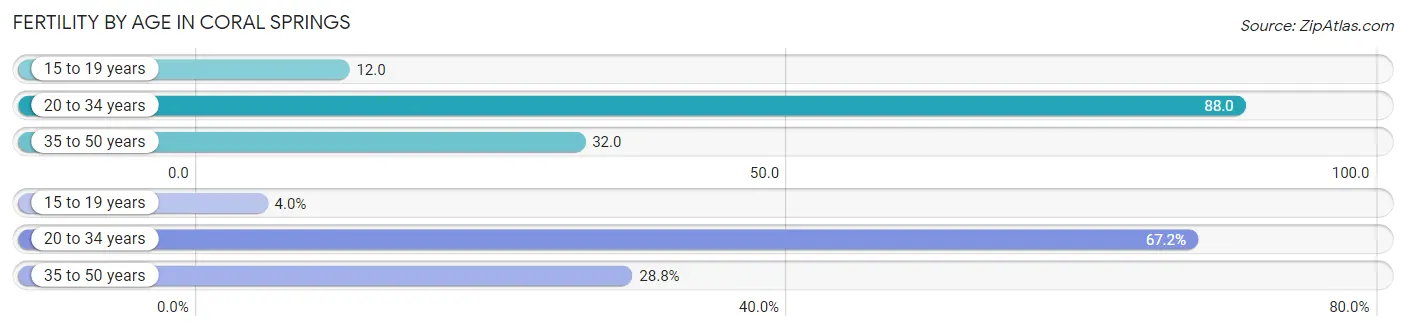
| Age Bracket | Women with Births | Births / 1,000 Women |
| 15 to 19 years | 67 (4.0%) | 12.0 |
| 20 to 34 years | 1,115 (67.2%) | 88.0 |
| 35 to 50 years | 478 (28.8%) | 32.0 |
| Total | 1,660 (100.0%) | 50.0 |
Fertility by Age by Marriage Status in Coral Springs
65.4% of women with births (1,660) in Coral Springs are married. The highest percentage of unmarried women with births falls into 15 to 19 years age bracket with 100.0% of them unmarried at the time of birth, while the lowest percentage of unmarried women with births belong to 35 to 50 years age bracket with 22.2% of them unmarried.
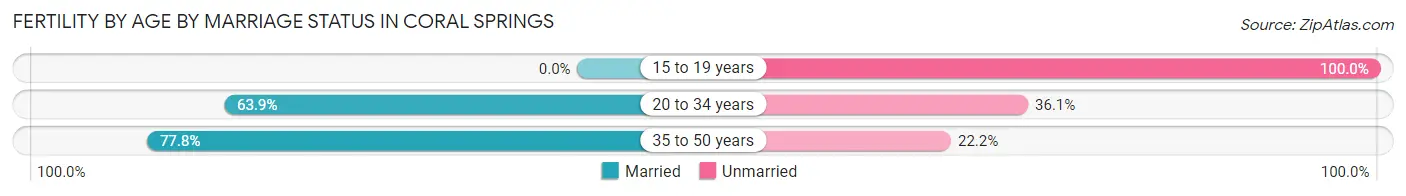
| Age Bracket | Married | Unmarried |
| 15 to 19 years | 0 (0.0%) | 67 (100.0%) |
| 20 to 34 years | 712 (63.9%) | 403 (36.1%) |
| 35 to 50 years | 372 (77.8%) | 106 (22.2%) |
| Total | 1,086 (65.4%) | 574 (34.6%) |
Fertility by Education in Coral Springs
Average fertility rate in Coral Springs is 50.0 births per 1,000 women. Women with the education attainment of bachelor's degree have the highest fertility rate of 76.0 births per 1,000 women, while women with the education attainment of less than high school have the lowest fertility at 10.0 births per 1,000 women. Women with the education attainment of bachelor's degree represent 34.7% of all women with births.
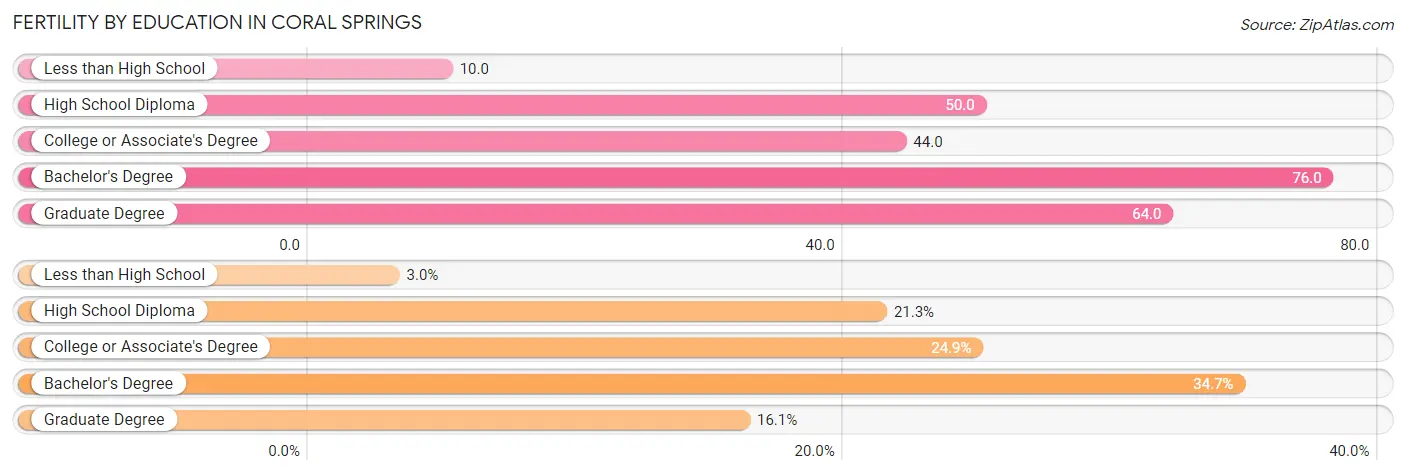
| Educational Attainment | Women with Births | Births / 1,000 Women |
| Less than High School | 50 (3.0%) | 10.0 |
| High School Diploma | 353 (21.3%) | 50.0 |
| College or Associate's Degree | 413 (24.9%) | 44.0 |
| Bachelor's Degree | 576 (34.7%) | 76.0 |
| Graduate Degree | 268 (16.1%) | 64.0 |
| Total | 1,660 (100.0%) | 50.0 |
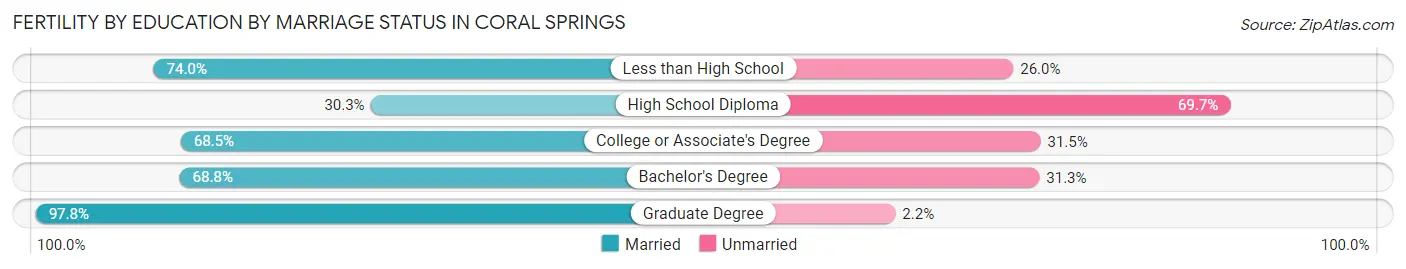
Fertility by Education by Marriage Status in Coral Springs
34.6% of women with births in Coral Springs are unmarried. Women with the educational attainment of graduate degree are most likely to be married with 97.8% of them married at childbirth, while women with the educational attainment of high school diploma are least likely to be married with 69.7% of them unmarried at childbirth.
| Educational Attainment | Married | Unmarried |
| Less than High School | 37 (74.0%) | 13 (26.0%) |
| High School Diploma | 107 (30.3%) | 246 (69.7%) |
| College or Associate's Degree | 283 (68.5%) | 130 (31.5%) |
| Bachelor's Degree | 396 (68.8%) | 180 (31.2%) |
| Graduate Degree | 262 (97.8%) | 6 (2.2%) |
| Total | 1,086 (65.4%) | 574 (34.6%) |
Employment Characteristics in Coral Springs
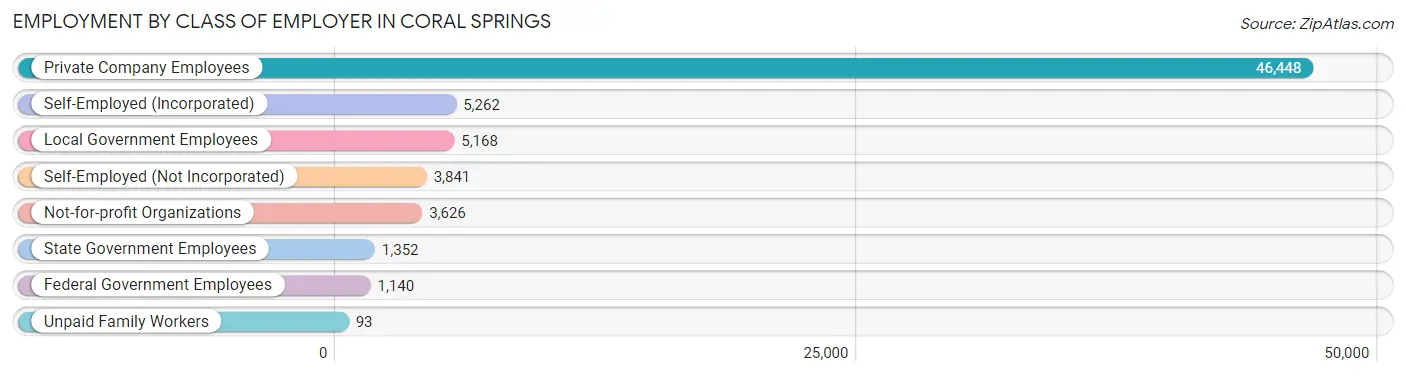
Employment by Class of Employer in Coral Springs
Among the 66,930 employed individuals in Coral Springs, private company employees (46,448 | 69.4%), self-employed (incorporated) (5,262 | 7.9%), and local government employees (5,168 | 7.7%) make up the most common classes of employment.
| Employer Class | # Employees | % Employees |
| Private Company Employees | 46,448 | 69.4% |
| Self-Employed (Incorporated) | 5,262 | 7.9% |
| Self-Employed (Not Incorporated) | 3,841 | 5.7% |
| Not-for-profit Organizations | 3,626 | 5.4% |
| Local Government Employees | 5,168 | 7.7% |
| State Government Employees | 1,352 | 2.0% |
| Federal Government Employees | 1,140 | 1.7% |
| Unpaid Family Workers | 93 | 0.1% |
| Total | 66,930 | 100.0% |
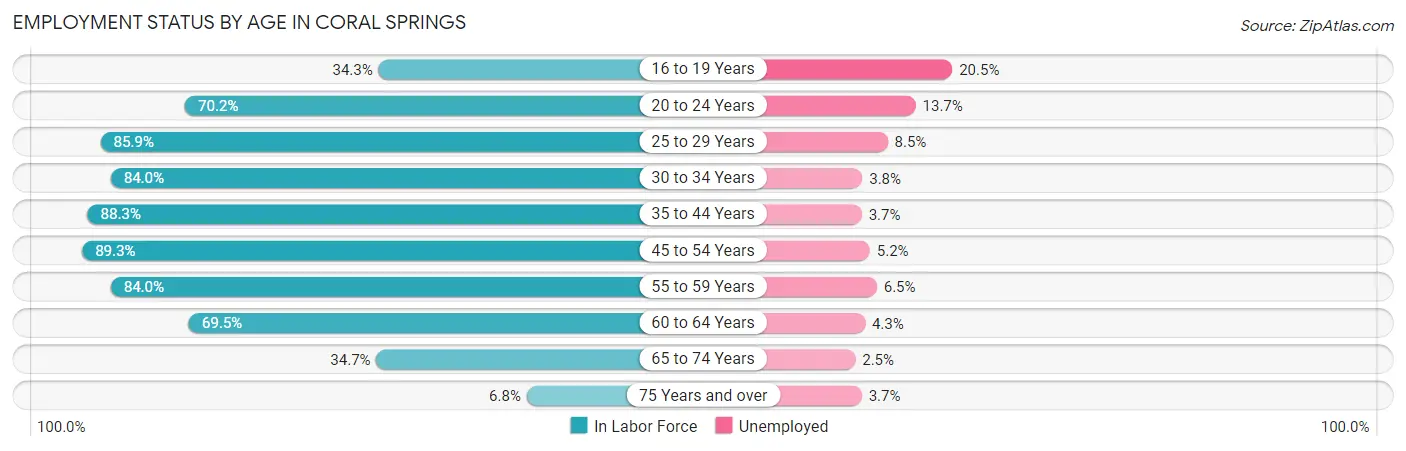
Employment Status by Age in Coral Springs
According to the labor force statistics for Coral Springs, out of the total population over 16 years of age (103,638), 70.5% or 73,065 individuals are in the labor force, with 6.2% or 4,530 of them unemployed. The age group with the highest labor force participation rate is 45 to 54 years, with 89.3% or 16,090 individuals in the labor force. Within the labor force, the 16 to 19 years age range has the highest percentage of unemployed individuals, with 20.5% or 575 of them being unemployed.
| Age Bracket | In Labor Force | Unemployed |
| 16 to 19 Years | 2,804 (34.3%) | 575 (20.5%) |
| 20 to 24 Years | 5,768 (70.2%) | 790 (13.7%) |
| 25 to 29 Years | 6,362 (85.9%) | 541 (8.5%) |
| 30 to 34 Years | 7,744 (84.0%) | 294 (3.8%) |
| 35 to 44 Years | 16,396 (88.3%) | 607 (3.7%) |
| 45 to 54 Years | 16,090 (89.3%) | 837 (5.2%) |
| 55 to 59 Years | 8,267 (84.0%) | 537 (6.5%) |
| 60 to 64 Years | 5,563 (69.5%) | 239 (4.3%) |
| 65 to 74 Years | 3,688 (34.7%) | 92 (2.5%) |
| 75 Years and over | 378 (6.8%) | 14 (3.7%) |
| Total | 73,065 (70.5%) | 4,530 (6.2%) |
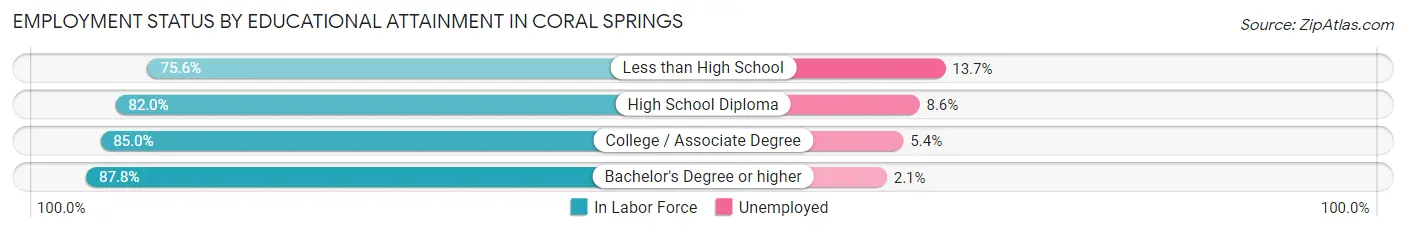
Employment Status by Educational Attainment in Coral Springs
According to labor force statistics for Coral Springs, 85.0% of individuals (60,400) out of the total population between 25 and 64 years of age (71,059) are in the labor force, with 5.1% or 3,080 of them being unemployed. The group with the highest labor force participation rate are those with the educational attainment of bachelor's degree or higher, with 87.8% or 25,106 individuals in the labor force. Within the labor force, individuals with less than high school education have the highest percentage of unemployment, with 13.7% or 316 of them being unemployed.
| Educational Attainment | In Labor Force | Unemployed |
| Less than High School | 2,307 (75.6%) | 418 (13.7%) |
| High School Diploma | 13,446 (82.0%) | 1,410 (8.6%) |
| College / Associate Degree | 19,563 (85.0%) | 1,243 (5.4%) |
| Bachelor's Degree or higher | 25,106 (87.8%) | 600 (2.1%) |
| Total | 60,400 (85.0%) | 3,624 (5.1%) |
Employment Occupations by Sex in Coral Springs
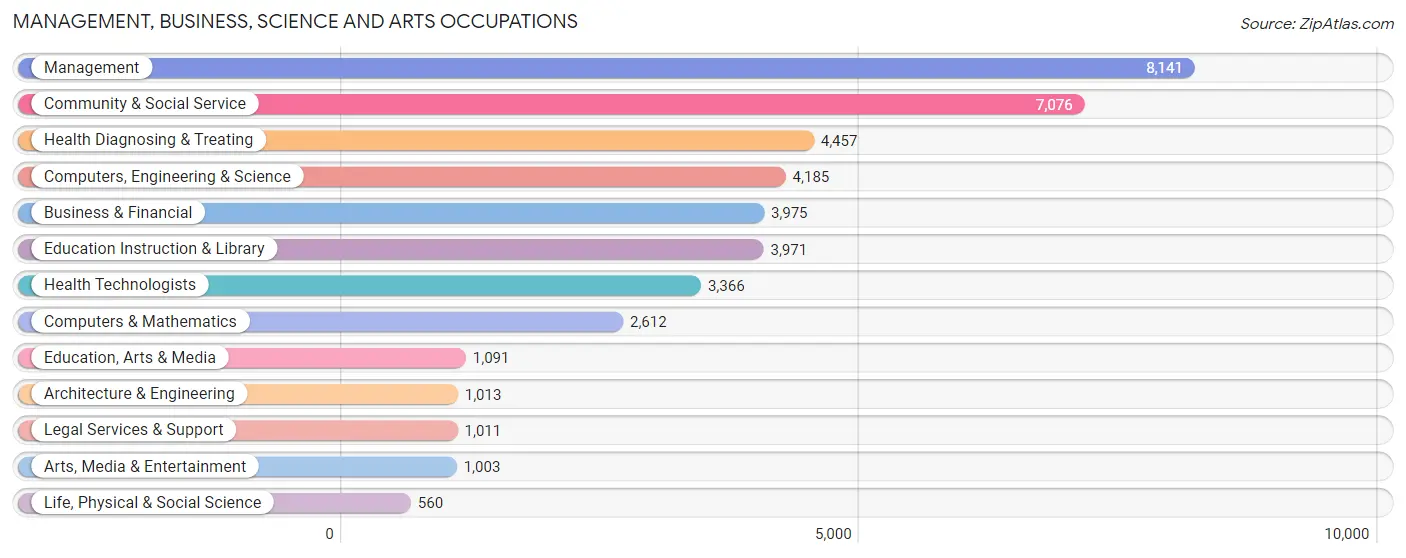
Management, Business, Science and Arts Occupations
The most common Management, Business, Science and Arts occupations in Coral Springs are Management (8,141 | 11.9%), Community & Social Service (7,076 | 10.3%), Health Diagnosing & Treating (4,457 | 6.5%), Computers, Engineering & Science (4,185 | 6.1%), and Business & Financial (3,975 | 5.8%).
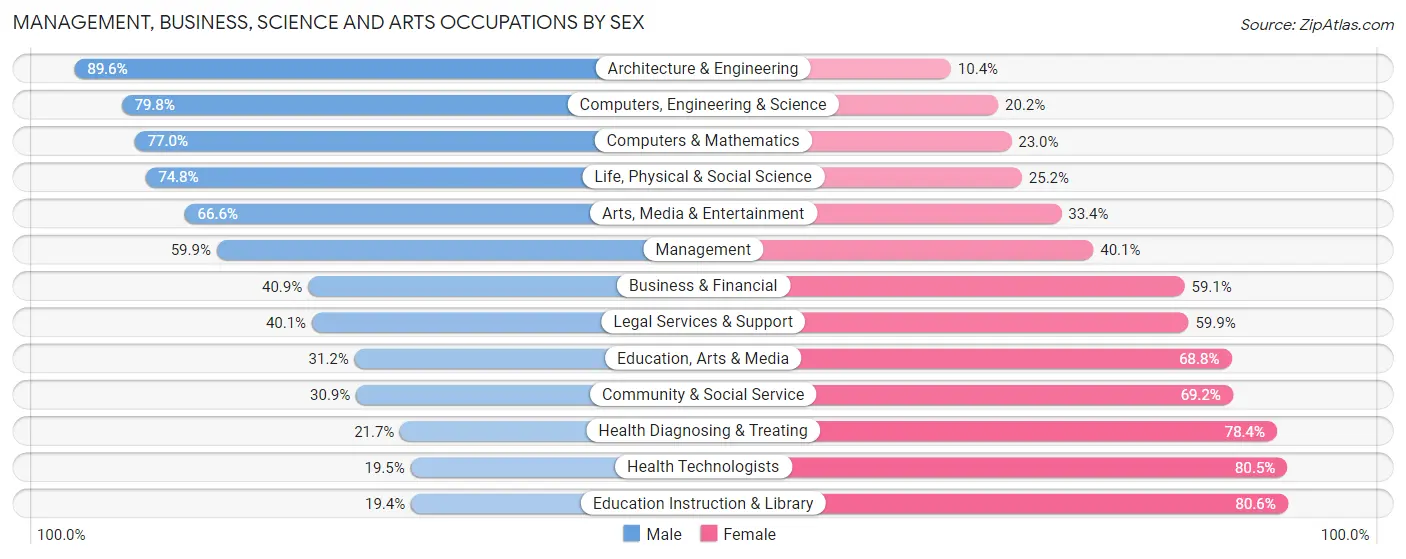
Management, Business, Science and Arts Occupations by Sex
Within the Management, Business, Science and Arts occupations in Coral Springs, the most male-oriented occupations are Architecture & Engineering (89.6%), Computers, Engineering & Science (79.8%), and Computers & Mathematics (77.0%), while the most female-oriented occupations are Education Instruction & Library (80.6%), Health Technologists (80.5%), and Health Diagnosing & Treating (78.3%).
| Occupation | Male | Female |
| Management | 4,878 (59.9%) | 3,263 (40.1%) |
| Business & Financial | 1,625 (40.9%) | 2,350 (59.1%) |
| Computers, Engineering & Science | 3,339 (79.8%) | 846 (20.2%) |
| Computers & Mathematics | 2,012 (77.0%) | 600 (23.0%) |
| Architecture & Engineering | 908 (89.6%) | 105 (10.4%) |
| Life, Physical & Social Science | 419 (74.8%) | 141 (25.2%) |
| Community & Social Service | 2,183 (30.8%) | 4,893 (69.2%) |
| Education, Arts & Media | 340 (31.2%) | 751 (68.8%) |
| Legal Services & Support | 405 (40.1%) | 606 (59.9%) |
| Education Instruction & Library | 770 (19.4%) | 3,201 (80.6%) |
| Arts, Media & Entertainment | 668 (66.6%) | 335 (33.4%) |
| Health Diagnosing & Treating | 965 (21.6%) | 3,492 (78.3%) |
| Health Technologists | 656 (19.5%) | 2,710 (80.5%) |
| Total (Category) | 12,990 (46.7%) | 14,844 (53.3%) |
| Total (Overall) | 34,798 (50.8%) | 33,636 (49.1%) |
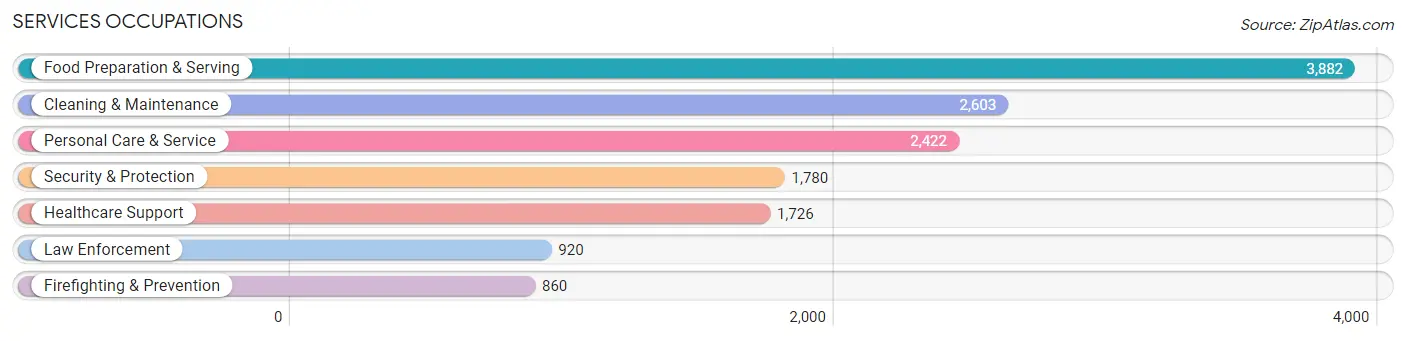
Services Occupations
The most common Services occupations in Coral Springs are Food Preparation & Serving (3,882 | 5.7%), Cleaning & Maintenance (2,603 | 3.8%), Personal Care & Service (2,422 | 3.5%), Security & Protection (1,780 | 2.6%), and Healthcare Support (1,726 | 2.5%).
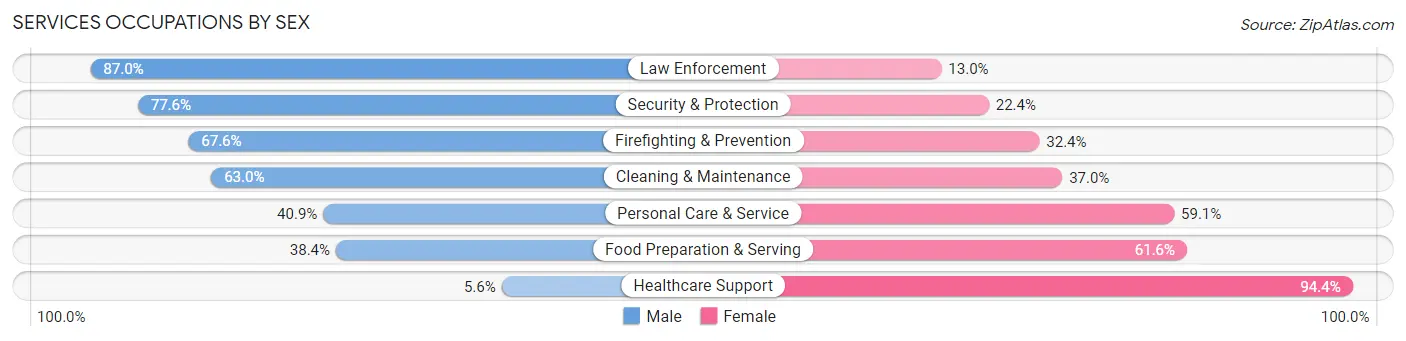
Services Occupations by Sex
Within the Services occupations in Coral Springs, the most male-oriented occupations are Law Enforcement (87.0%), Security & Protection (77.6%), and Firefighting & Prevention (67.6%), while the most female-oriented occupations are Healthcare Support (94.4%), Food Preparation & Serving (61.6%), and Personal Care & Service (59.1%).
| Occupation | Male | Female |
| Healthcare Support | 96 (5.6%) | 1,630 (94.4%) |
| Security & Protection | 1,381 (77.6%) | 399 (22.4%) |
| Firefighting & Prevention | 581 (67.6%) | 279 (32.4%) |
| Law Enforcement | 800 (87.0%) | 120 (13.0%) |
| Food Preparation & Serving | 1,489 (38.4%) | 2,393 (61.6%) |
| Cleaning & Maintenance | 1,641 (63.0%) | 962 (37.0%) |
| Personal Care & Service | 990 (40.9%) | 1,432 (59.1%) |
| Total (Category) | 5,597 (45.1%) | 6,816 (54.9%) |
| Total (Overall) | 34,798 (50.8%) | 33,636 (49.1%) |
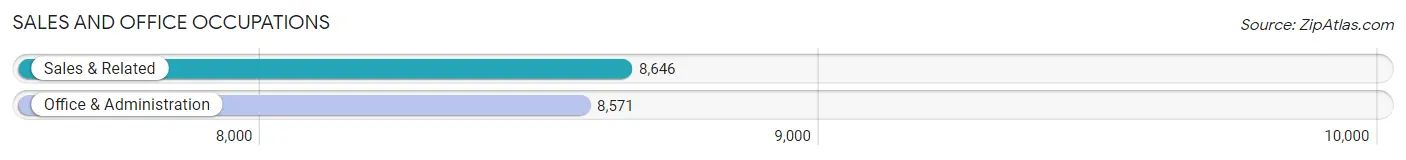
Sales and Office Occupations
The most common Sales and Office occupations in Coral Springs are Sales & Related (8,646 | 12.6%), and Office & Administration (8,571 | 12.5%).
Sales and Office Occupations by Sex
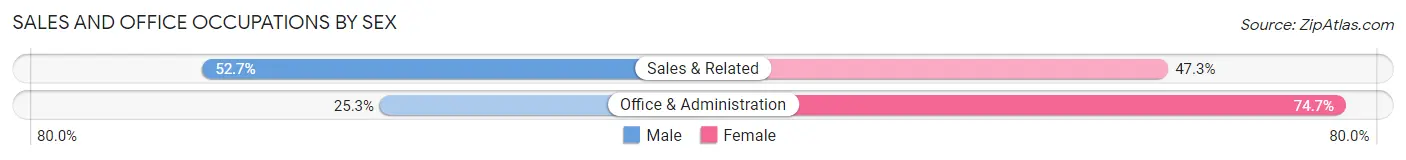
| Occupation | Male | Female |
| Sales & Related | 4,553 (52.7%) | 4,093 (47.3%) |
| Office & Administration | 2,172 (25.3%) | 6,399 (74.7%) |
| Total (Category) | 6,725 (39.1%) | 10,492 (60.9%) |
| Total (Overall) | 34,798 (50.8%) | 33,636 (49.1%) |
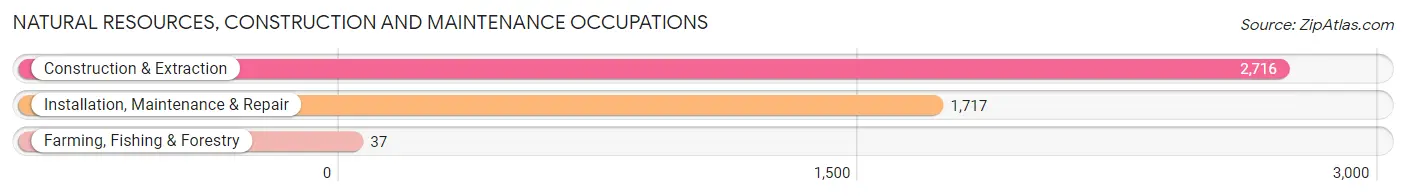
Natural Resources, Construction and Maintenance Occupations
The most common Natural Resources, Construction and Maintenance occupations in Coral Springs are Construction & Extraction (2,716 | 4.0%), Installation, Maintenance & Repair (1,717 | 2.5%), and Farming, Fishing & Forestry (37 | 0.1%).
Natural Resources, Construction and Maintenance Occupations by Sex
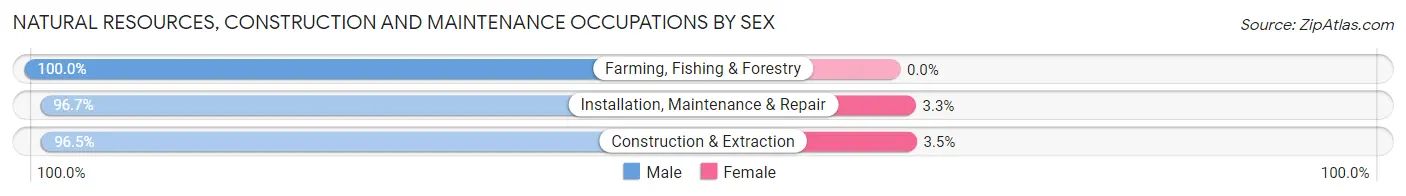
| Occupation | Male | Female |
| Farming, Fishing & Forestry | 37 (100.0%) | 0 (0.0%) |
| Construction & Extraction | 2,622 (96.5%) | 94 (3.5%) |
| Installation, Maintenance & Repair | 1,661 (96.7%) | 56 (3.3%) |
| Total (Category) | 4,320 (96.6%) | 150 (3.4%) |
| Total (Overall) | 34,798 (50.8%) | 33,636 (49.1%) |
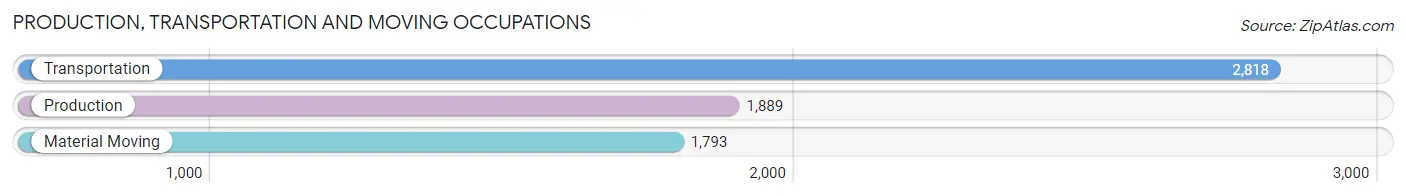
Production, Transportation and Moving Occupations
The most common Production, Transportation and Moving occupations in Coral Springs are Transportation (2,818 | 4.1%), Production (1,889 | 2.8%), and Material Moving (1,793 | 2.6%).
Production, Transportation and Moving Occupations by Sex
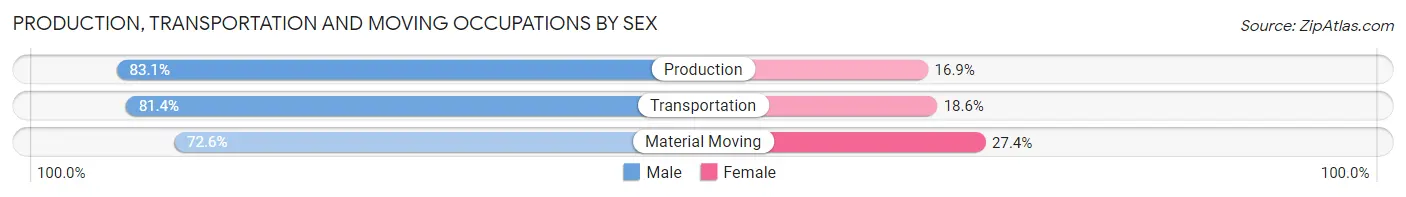
| Occupation | Male | Female |
| Production | 1,570 (83.1%) | 319 (16.9%) |
| Transportation | 2,295 (81.4%) | 523 (18.6%) |
| Material Moving | 1,301 (72.6%) | 492 (27.4%) |
| Total (Category) | 5,166 (79.5%) | 1,334 (20.5%) |
| Total (Overall) | 34,798 (50.8%) | 33,636 (49.1%) |
Employment Industries by Sex in Coral Springs
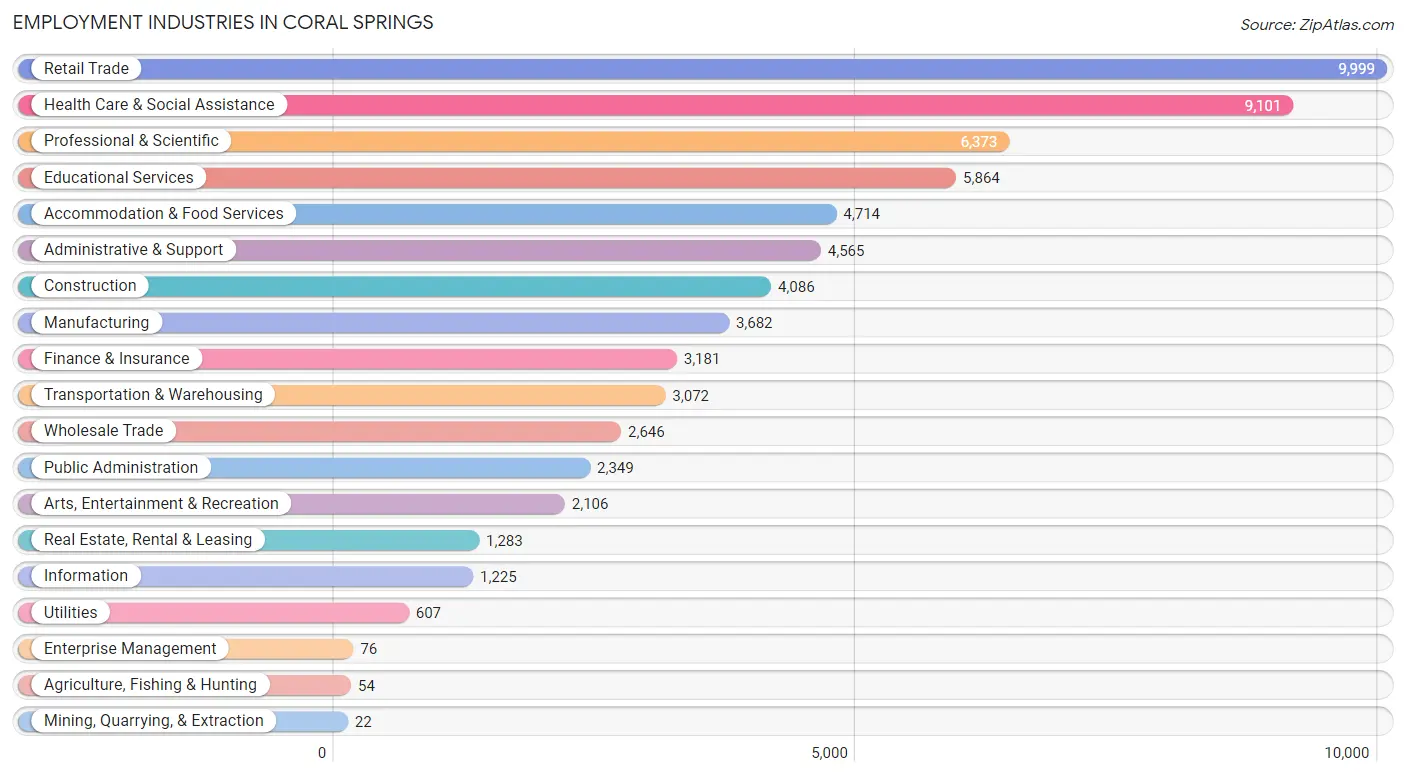
Employment Industries in Coral Springs
The major employment industries in Coral Springs include Retail Trade (9,999 | 14.6%), Health Care & Social Assistance (9,101 | 13.3%), Professional & Scientific (6,373 | 9.3%), Educational Services (5,864 | 8.6%), and Accommodation & Food Services (4,714 | 6.9%).
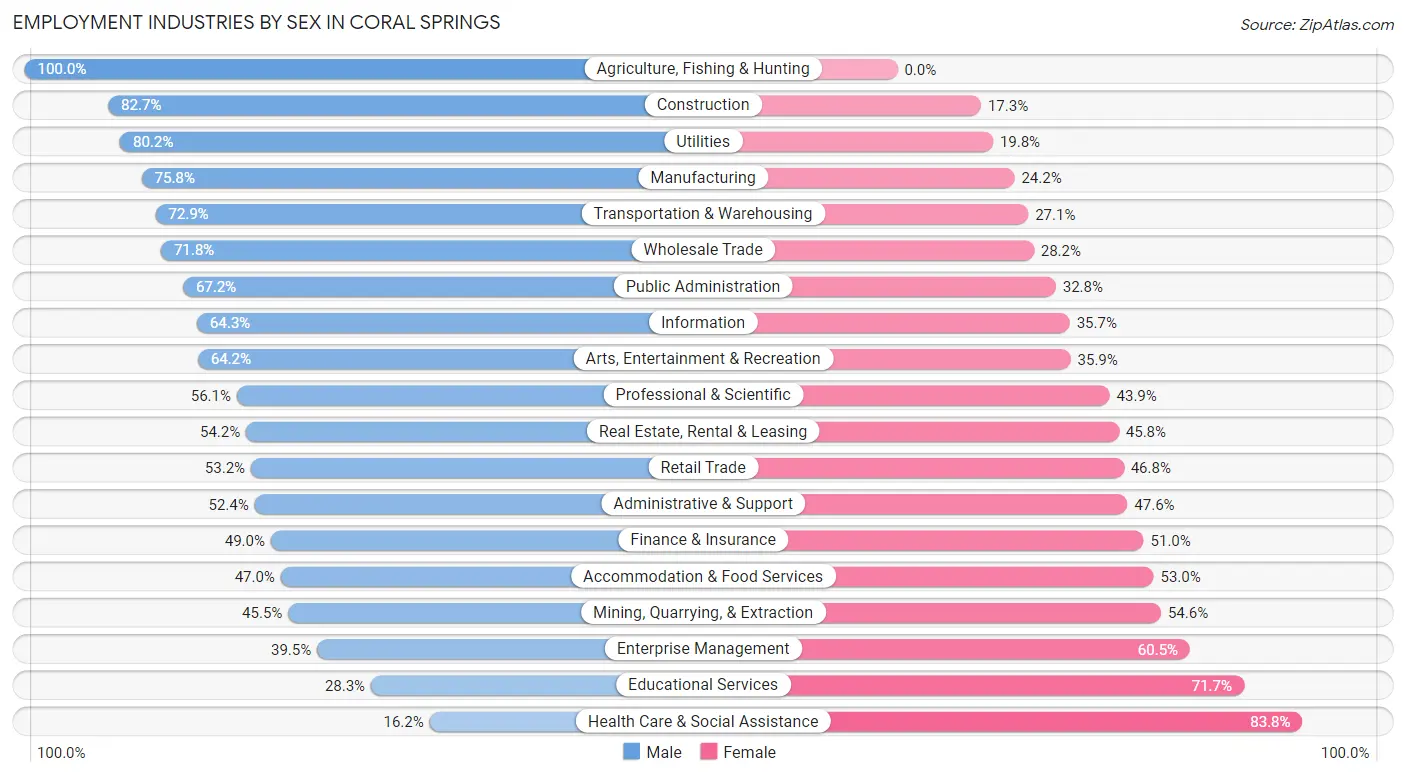
Employment Industries by Sex in Coral Springs
The Coral Springs industries that see more men than women are Agriculture, Fishing & Hunting (100.0%), Construction (82.7%), and Utilities (80.2%), whereas the industries that tend to have a higher number of women are Health Care & Social Assistance (83.8%), Educational Services (71.7%), and Enterprise Management (60.5%).
| Industry | Male | Female |
| Agriculture, Fishing & Hunting | 54 (100.0%) | 0 (0.0%) |
| Mining, Quarrying, & Extraction | 10 (45.5%) | 12 (54.5%) |
| Construction | 3,379 (82.7%) | 707 (17.3%) |
| Manufacturing | 2,790 (75.8%) | 892 (24.2%) |
| Wholesale Trade | 1,899 (71.8%) | 747 (28.2%) |
| Retail Trade | 5,315 (53.2%) | 4,684 (46.8%) |
| Transportation & Warehousing | 2,240 (72.9%) | 832 (27.1%) |
| Utilities | 487 (80.2%) | 120 (19.8%) |
| Information | 788 (64.3%) | 437 (35.7%) |
| Finance & Insurance | 1,560 (49.0%) | 1,621 (51.0%) |
| Real Estate, Rental & Leasing | 695 (54.2%) | 588 (45.8%) |
| Professional & Scientific | 3,574 (56.1%) | 2,799 (43.9%) |
| Enterprise Management | 30 (39.5%) | 46 (60.5%) |
| Administrative & Support | 2,392 (52.4%) | 2,173 (47.6%) |
| Educational Services | 1,660 (28.3%) | 4,204 (71.7%) |
| Health Care & Social Assistance | 1,473 (16.2%) | 7,628 (83.8%) |
| Arts, Entertainment & Recreation | 1,351 (64.1%) | 755 (35.8%) |
| Accommodation & Food Services | 2,215 (47.0%) | 2,499 (53.0%) |
| Public Administration | 1,579 (67.2%) | 770 (32.8%) |
| Total | 34,798 (50.8%) | 33,636 (49.1%) |
Education in Coral Springs
School Enrollment in Coral Springs
The most common levels of schooling among the 38,549 students in Coral Springs are high school (9,408 | 24.4%), middle school (7,798 | 20.2%), and elementary school (7,332 | 19.0%).
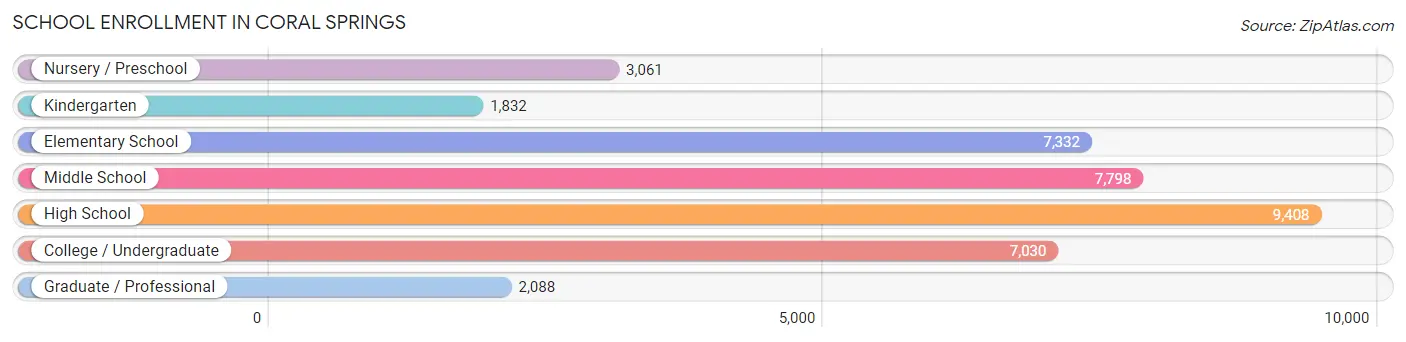
| School Level | # Students | % Students |
| Nursery / Preschool | 3,061 | 7.9% |
| Kindergarten | 1,832 | 4.8% |
| Elementary School | 7,332 | 19.0% |
| Middle School | 7,798 | 20.2% |
| High School | 9,408 | 24.4% |
| College / Undergraduate | 7,030 | 18.2% |
| Graduate / Professional | 2,088 | 5.4% |
| Total | 38,549 | 100.0% |
School Enrollment by Age by Funding Source in Coral Springs
Out of a total of 38,549 students who are enrolled in schools in Coral Springs, 7,517 (19.5%) attend a private institution, while the remaining 31,032 (80.5%) are enrolled in public schools. The age group of 3 to 4 year olds has the highest likelihood of being enrolled in private schools, with 1,466 (52.8% in the age bracket) enrolled. Conversely, the age group of 10 to 14 year olds has the lowest likelihood of being enrolled in a private school, with 9,135 (91.8% in the age bracket) attending a public institution.
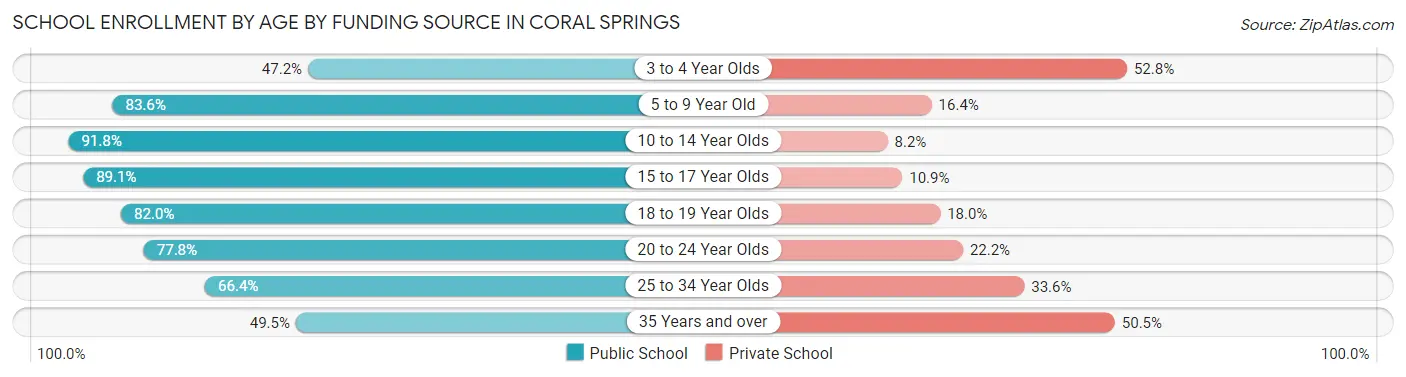
| Age Bracket | Public School | Private School |
| 3 to 4 Year Olds | 1,312 (47.2%) | 1,466 (52.8%) |
| 5 to 9 Year Old | 7,116 (83.6%) | 1,395 (16.4%) |
| 10 to 14 Year Olds | 9,135 (91.8%) | 814 (8.2%) |
| 15 to 17 Year Olds | 6,069 (89.1%) | 744 (10.9%) |
| 18 to 19 Year Olds | 2,230 (82.0%) | 489 (18.0%) |
| 20 to 24 Year Olds | 2,626 (77.8%) | 750 (22.2%) |
| 25 to 34 Year Olds | 1,491 (66.4%) | 756 (33.6%) |
| 35 Years and over | 1,067 (49.5%) | 1,089 (50.5%) |
| Total | 31,032 (80.5%) | 7,517 (19.5%) |
Educational Attainment by Field of Study in Coral Springs
Business (9,158 | 25.3%), science & technology (4,613 | 12.8%), education (3,714 | 10.3%), engineering (3,071 | 8.5%), and arts & humanities (2,670 | 7.4%) are the most common fields of study among 36,156 individuals in Coral Springs who have obtained a bachelor's degree or higher.
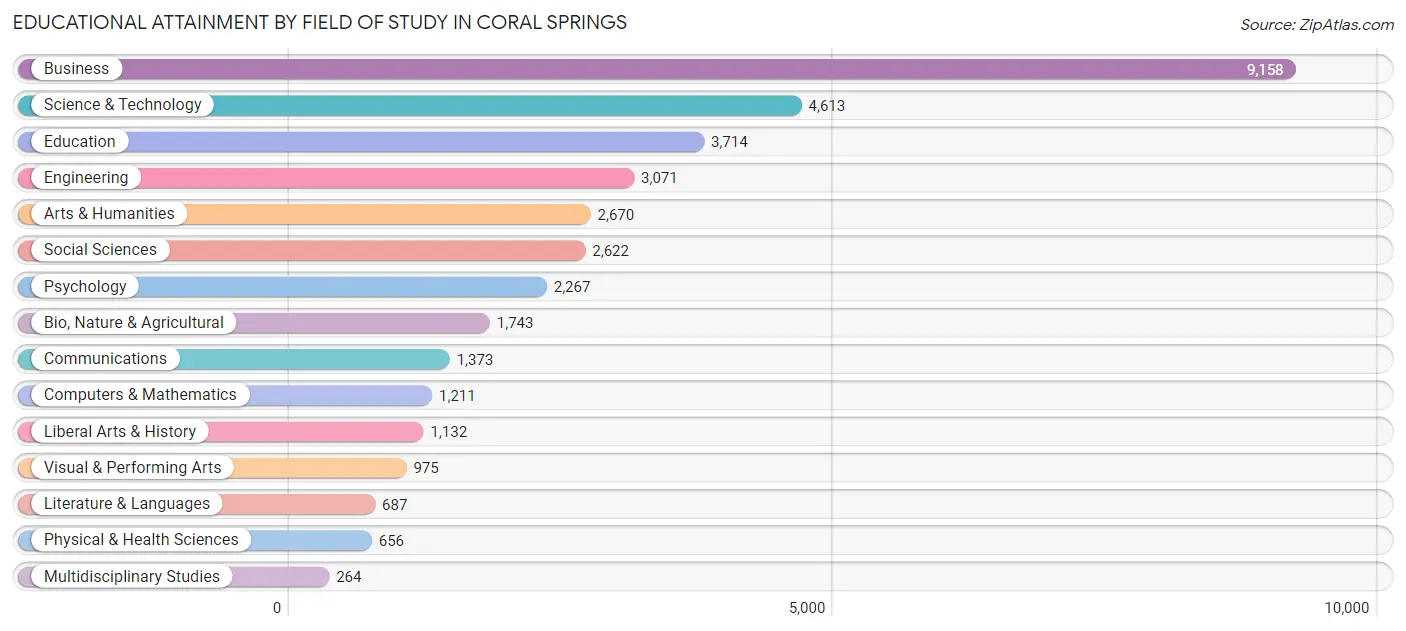
| Field of Study | # Graduates | % Graduates |
| Computers & Mathematics | 1,211 | 3.4% |
| Bio, Nature & Agricultural | 1,743 | 4.8% |
| Physical & Health Sciences | 656 | 1.8% |
| Psychology | 2,267 | 6.3% |
| Social Sciences | 2,622 | 7.2% |
| Engineering | 3,071 | 8.5% |
| Multidisciplinary Studies | 264 | 0.7% |
| Science & Technology | 4,613 | 12.8% |
| Business | 9,158 | 25.3% |
| Education | 3,714 | 10.3% |
| Literature & Languages | 687 | 1.9% |
| Liberal Arts & History | 1,132 | 3.1% |
| Visual & Performing Arts | 975 | 2.7% |
| Communications | 1,373 | 3.8% |
| Arts & Humanities | 2,670 | 7.4% |
| Total | 36,156 | 100.0% |
Transportation & Commute in Coral Springs
Vehicle Availability by Sex in Coral Springs
The most prevalent vehicle ownership categories in Coral Springs are males with 2 vehicles (16,208, accounting for 47.4%) and females with 2 vehicles (14,491, making up 49.5%).
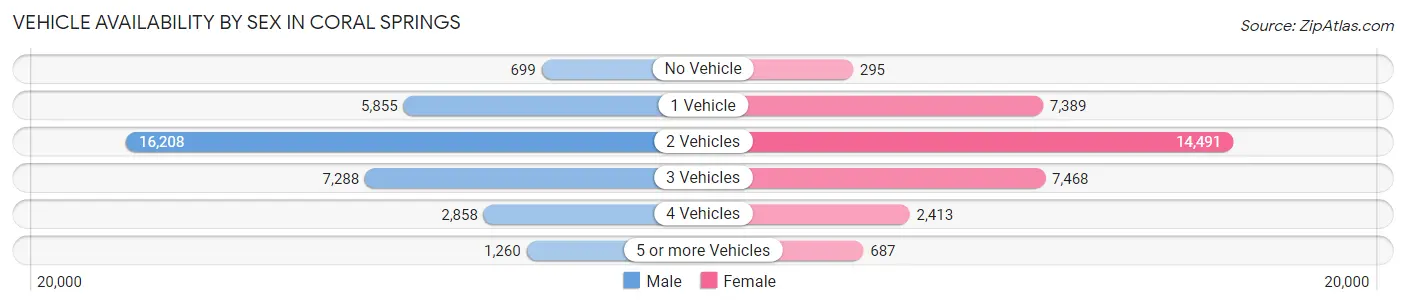
| Vehicles Available | Male | Female |
| No Vehicle | 699 (2.1%) | 295 (0.9%) |
| 1 Vehicle | 5,855 (17.1%) | 7,389 (22.6%) |
| 2 Vehicles | 16,208 (47.4%) | 14,491 (44.3%) |
| 3 Vehicles | 7,288 (21.3%) | 7,468 (22.8%) |
| 4 Vehicles | 2,858 (8.4%) | 2,413 (7.4%) |
| 5 or more Vehicles | 1,260 (3.7%) | 687 (2.1%) |
| Total | 34,168 (100.0%) | 32,743 (100.0%) |
Commute Time in Coral Springs
The most frequently occuring commute durations in Coral Springs are 30 to 34 minutes (11,369 commuters, 19.3%), 20 to 24 minutes (8,161 commuters, 13.9%), and 45 to 59 minutes (6,775 commuters, 11.5%).
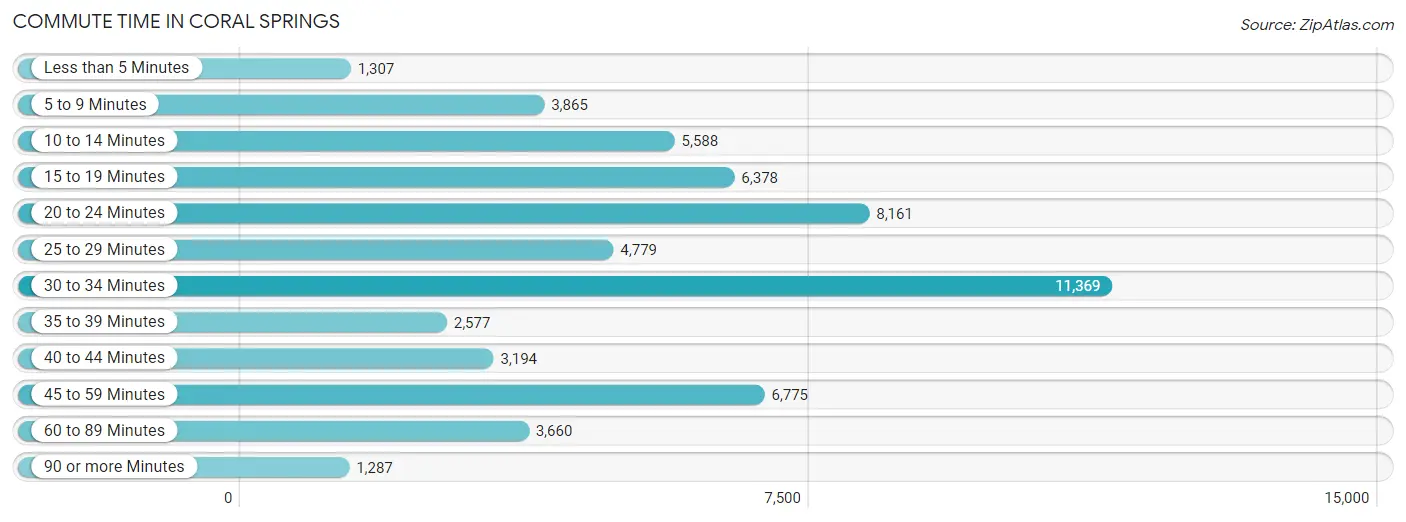
| Commute Time | # Commuters | % Commuters |
| Less than 5 Minutes | 1,307 | 2.2% |
| 5 to 9 Minutes | 3,865 | 6.6% |
| 10 to 14 Minutes | 5,588 | 9.5% |
| 15 to 19 Minutes | 6,378 | 10.8% |
| 20 to 24 Minutes | 8,161 | 13.9% |
| 25 to 29 Minutes | 4,779 | 8.1% |
| 30 to 34 Minutes | 11,369 | 19.3% |
| 35 to 39 Minutes | 2,577 | 4.4% |
| 40 to 44 Minutes | 3,194 | 5.4% |
| 45 to 59 Minutes | 6,775 | 11.5% |
| 60 to 89 Minutes | 3,660 | 6.2% |
| 90 or more Minutes | 1,287 | 2.2% |
Commute Time by Sex in Coral Springs
The most common commute times in Coral Springs are 30 to 34 minutes (5,732 commuters, 18.6%) for males and 30 to 34 minutes (5,637 commuters, 20.1%) for females.
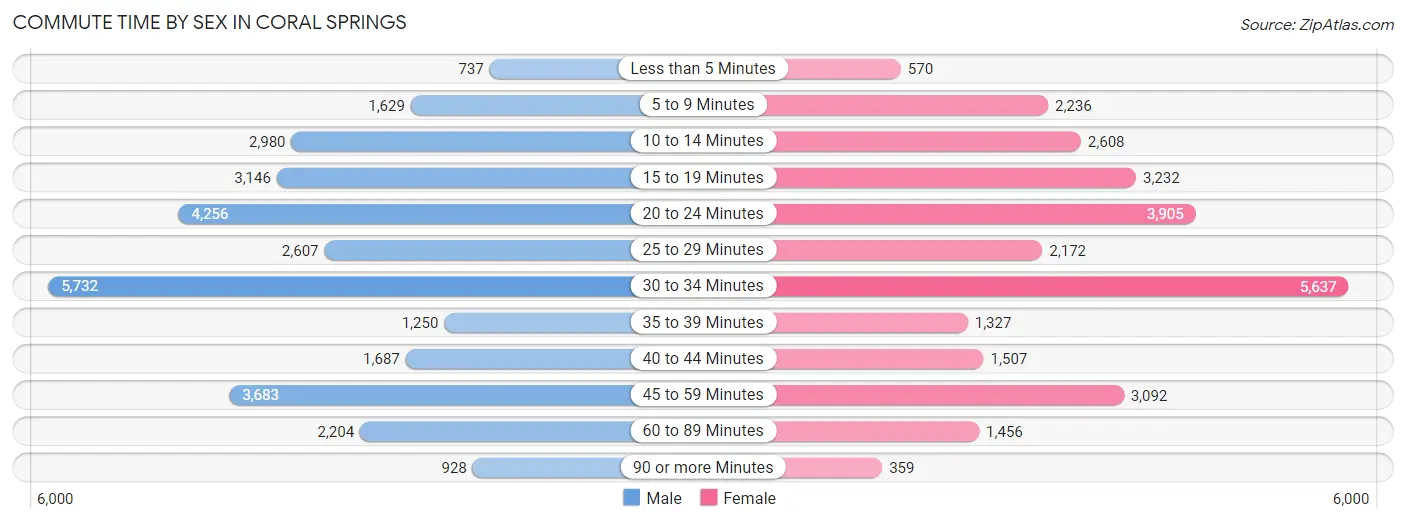
| Commute Time | Male | Female |
| Less than 5 Minutes | 737 (2.4%) | 570 (2.0%) |
| 5 to 9 Minutes | 1,629 (5.3%) | 2,236 (8.0%) |
| 10 to 14 Minutes | 2,980 (9.7%) | 2,608 (9.3%) |
| 15 to 19 Minutes | 3,146 (10.2%) | 3,232 (11.5%) |
| 20 to 24 Minutes | 4,256 (13.8%) | 3,905 (13.9%) |
| 25 to 29 Minutes | 2,607 (8.5%) | 2,172 (7.7%) |
| 30 to 34 Minutes | 5,732 (18.6%) | 5,637 (20.1%) |
| 35 to 39 Minutes | 1,250 (4.1%) | 1,327 (4.7%) |
| 40 to 44 Minutes | 1,687 (5.5%) | 1,507 (5.4%) |
| 45 to 59 Minutes | 3,683 (11.9%) | 3,092 (11.0%) |
| 60 to 89 Minutes | 2,204 (7.1%) | 1,456 (5.2%) |
| 90 or more Minutes | 928 (3.0%) | 359 (1.3%) |
Time of Departure to Work by Sex in Coral Springs
The most frequent times of departure to work in Coral Springs are 7:00 AM to 7:29 AM (4,744, 15.4%) for males and 8:00 AM to 8:29 AM (4,878, 17.4%) for females.
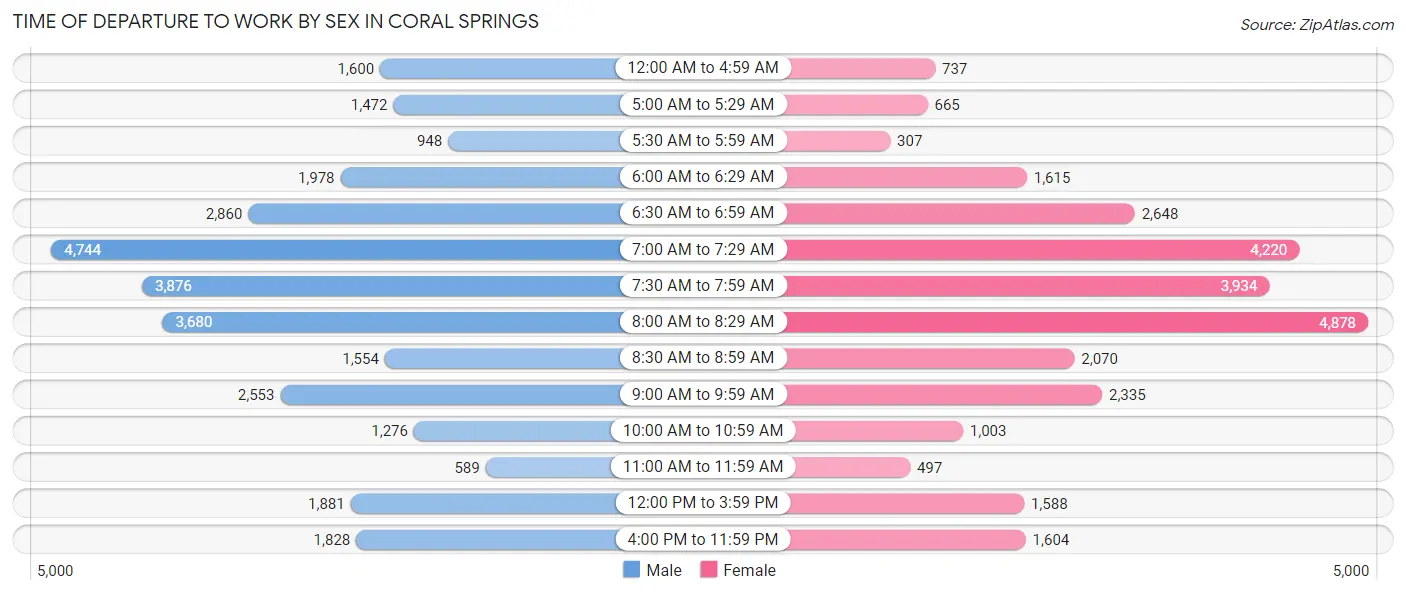
| Time of Departure | Male | Female |
| 12:00 AM to 4:59 AM | 1,600 (5.2%) | 737 (2.6%) |
| 5:00 AM to 5:29 AM | 1,472 (4.8%) | 665 (2.4%) |
| 5:30 AM to 5:59 AM | 948 (3.1%) | 307 (1.1%) |
| 6:00 AM to 6:29 AM | 1,978 (6.4%) | 1,615 (5.8%) |
| 6:30 AM to 6:59 AM | 2,860 (9.3%) | 2,648 (9.4%) |
| 7:00 AM to 7:29 AM | 4,744 (15.4%) | 4,220 (15.0%) |
| 7:30 AM to 7:59 AM | 3,876 (12.6%) | 3,934 (14.0%) |
| 8:00 AM to 8:29 AM | 3,680 (11.9%) | 4,878 (17.4%) |
| 8:30 AM to 8:59 AM | 1,554 (5.0%) | 2,070 (7.4%) |
| 9:00 AM to 9:59 AM | 2,553 (8.3%) | 2,335 (8.3%) |
| 10:00 AM to 10:59 AM | 1,276 (4.1%) | 1,003 (3.6%) |
| 11:00 AM to 11:59 AM | 589 (1.9%) | 497 (1.8%) |
| 12:00 PM to 3:59 PM | 1,881 (6.1%) | 1,588 (5.7%) |
| 4:00 PM to 11:59 PM | 1,828 (5.9%) | 1,604 (5.7%) |
| Total | 30,839 (100.0%) | 28,101 (100.0%) |
Housing Occupancy in Coral Springs
Occupancy by Ownership in Coral Springs
Of the total 44,260 dwellings in Coral Springs, owner-occupied units account for 26,564 (60.0%), while renter-occupied units make up 17,696 (40.0%).
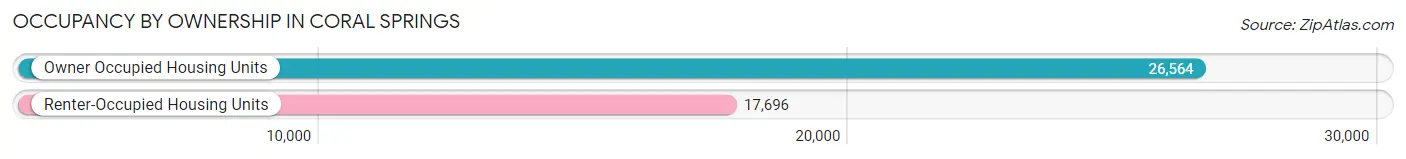
| Occupancy | # Housing Units | % Housing Units |
| Owner Occupied Housing Units | 26,564 | 60.0% |
| Renter-Occupied Housing Units | 17,696 | 40.0% |
| Total Occupied Housing Units | 44,260 | 100.0% |
Occupancy by Household Size in Coral Springs
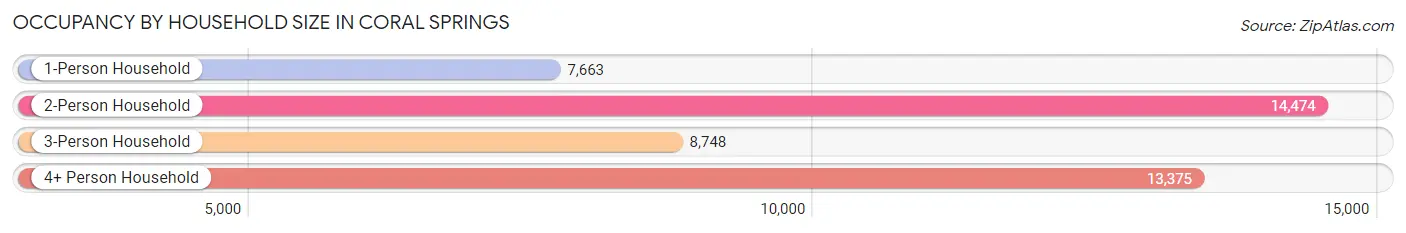
| Household Size | # Housing Units | % Housing Units |
| 1-Person Household | 7,663 | 17.3% |
| 2-Person Household | 14,474 | 32.7% |
| 3-Person Household | 8,748 | 19.8% |
| 4+ Person Household | 13,375 | 30.2% |
| Total Housing Units | 44,260 | 100.0% |
Occupancy by Ownership by Household Size in Coral Springs
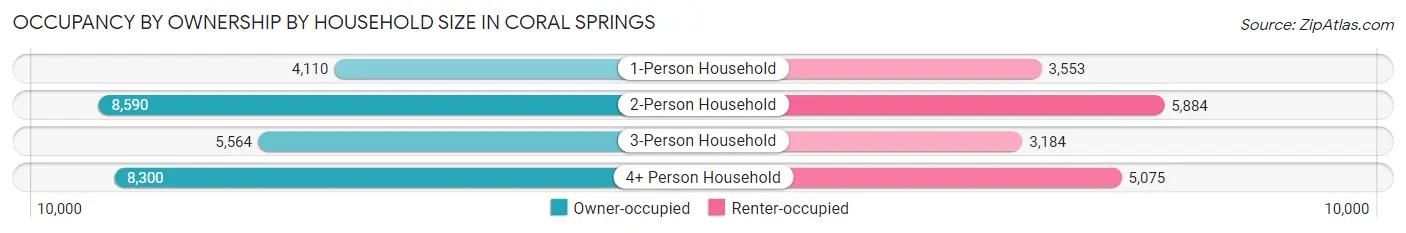
| Household Size | Owner-occupied | Renter-occupied |
| 1-Person Household | 4,110 (53.6%) | 3,553 (46.4%) |
| 2-Person Household | 8,590 (59.4%) | 5,884 (40.6%) |
| 3-Person Household | 5,564 (63.6%) | 3,184 (36.4%) |
| 4+ Person Household | 8,300 (62.1%) | 5,075 (37.9%) |
| Total Housing Units | 26,564 (60.0%) | 17,696 (40.0%) |
Occupancy by Educational Attainment in Coral Springs
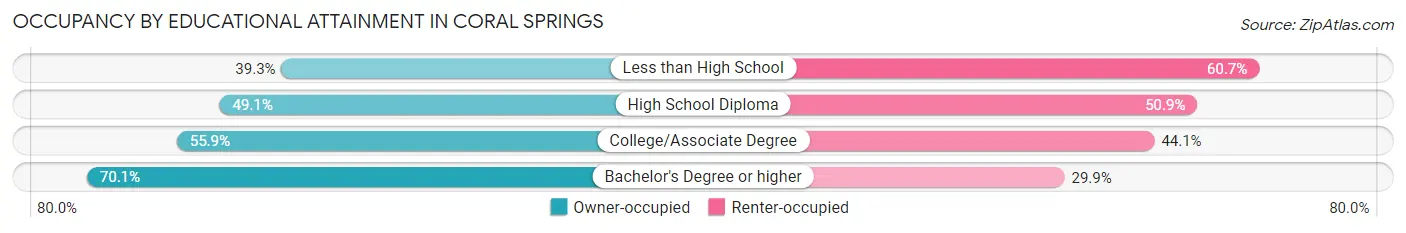
| Household Size | Owner-occupied | Renter-occupied |
| Less than High School | 748 (39.3%) | 1,157 (60.7%) |
| High School Diploma | 4,278 (49.1%) | 4,438 (50.9%) |
| College/Associate Degree | 8,031 (55.9%) | 6,345 (44.1%) |
| Bachelor's Degree or higher | 13,507 (70.1%) | 5,756 (29.9%) |
Occupancy by Age of Householder in Coral Springs
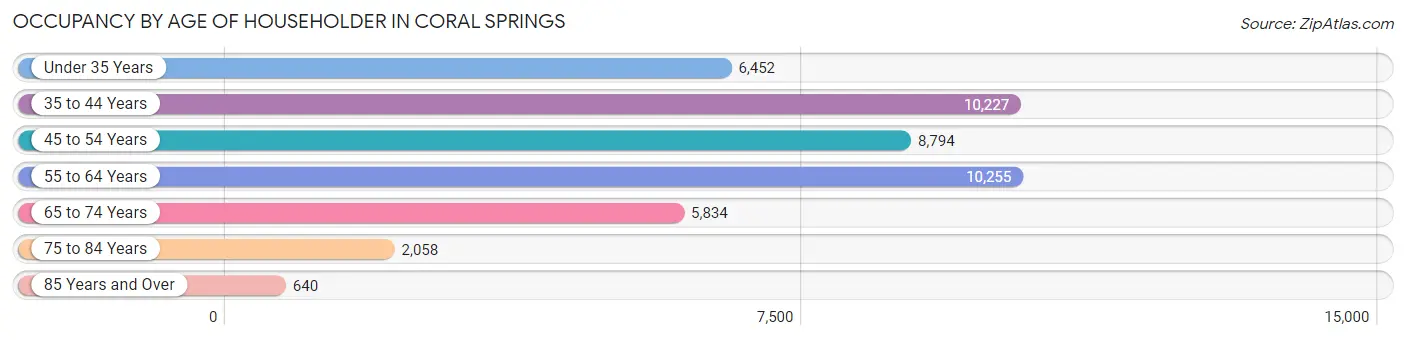
| Age Bracket | # Households | % Households |
| Under 35 Years | 6,452 | 14.6% |
| 35 to 44 Years | 10,227 | 23.1% |
| 45 to 54 Years | 8,794 | 19.9% |
| 55 to 64 Years | 10,255 | 23.2% |
| 65 to 74 Years | 5,834 | 13.2% |
| 75 to 84 Years | 2,058 | 4.6% |
| 85 Years and Over | 640 | 1.5% |
| Total | 44,260 | 100.0% |
Housing Finances in Coral Springs
Median Income by Occupancy in Coral Springs
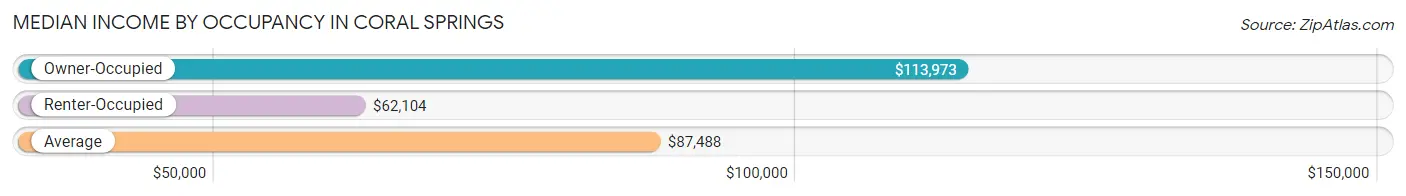
| Occupancy Type | # Households | Median Income |
| Owner-Occupied | 26,564 (60.0%) | $113,973 |
| Renter-Occupied | 17,696 (40.0%) | $62,104 |
| Average | 44,260 (100.0%) | $87,488 |
Occupancy by Householder Income Bracket in Coral Springs
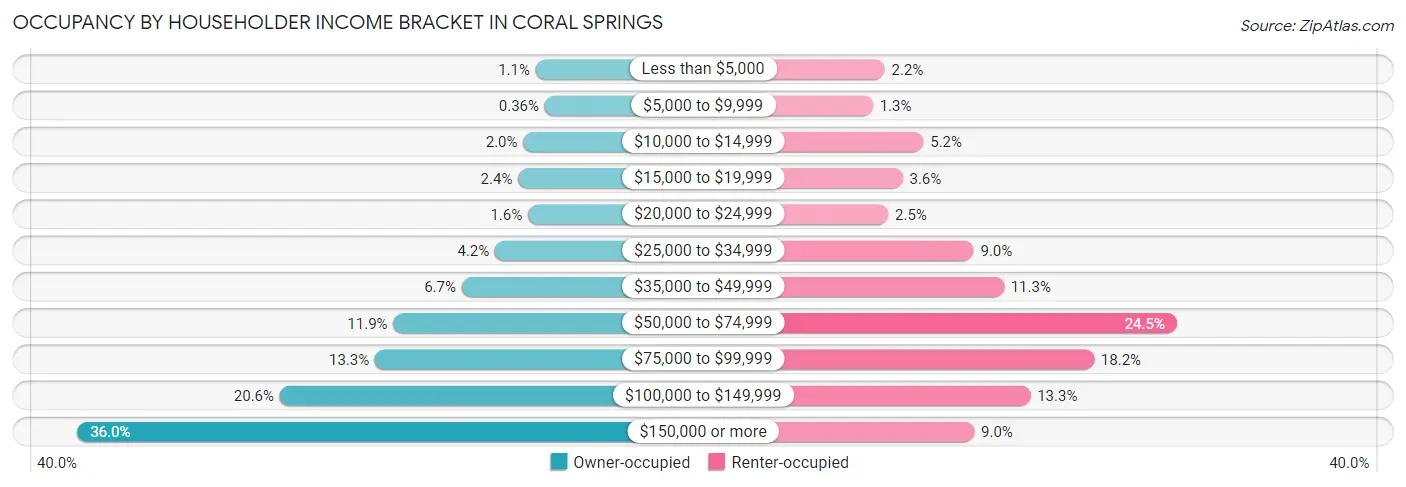
| Income Bracket | Owner-occupied | Renter-occupied |
| Less than $5,000 | 278 (1.1%) | 391 (2.2%) |
| $5,000 to $9,999 | 96 (0.4%) | 232 (1.3%) |
| $10,000 to $14,999 | 530 (2.0%) | 913 (5.2%) |
| $15,000 to $19,999 | 634 (2.4%) | 634 (3.6%) |
| $20,000 to $24,999 | 435 (1.6%) | 438 (2.5%) |
| $25,000 to $34,999 | 1,102 (4.2%) | 1,591 (9.0%) |
| $35,000 to $49,999 | 1,776 (6.7%) | 1,998 (11.3%) |
| $50,000 to $74,999 | 3,160 (11.9%) | 4,331 (24.5%) |
| $75,000 to $99,999 | 3,534 (13.3%) | 3,214 (18.2%) |
| $100,000 to $149,999 | 5,458 (20.5%) | 2,356 (13.3%) |
| $150,000 or more | 9,561 (36.0%) | 1,598 (9.0%) |
| Total | 26,564 (100.0%) | 17,696 (100.0%) |
Monthly Housing Cost Tiers in Coral Springs
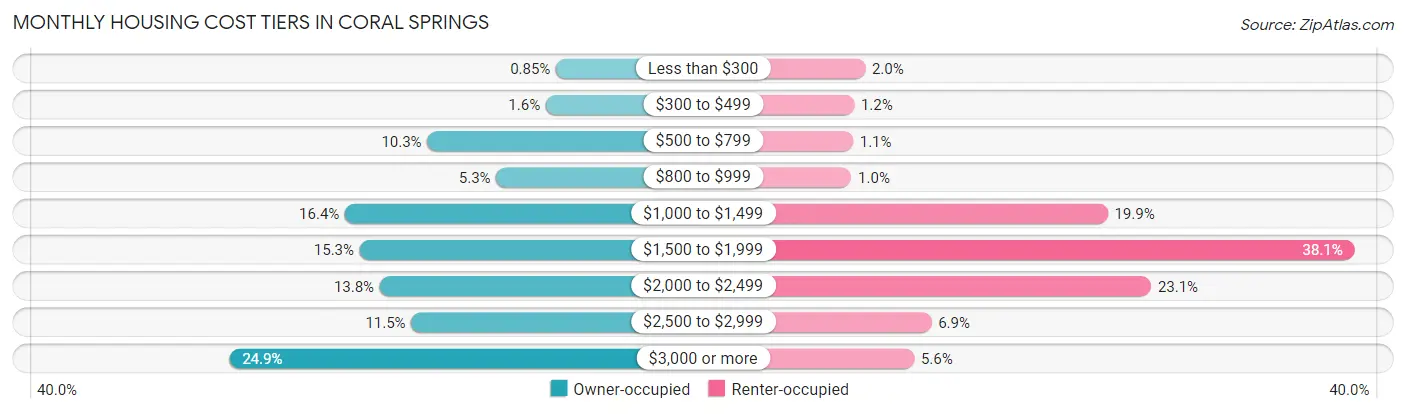
| Monthly Cost | Owner-occupied | Renter-occupied |
| Less than $300 | 225 (0.9%) | 359 (2.0%) |
| $300 to $499 | 426 (1.6%) | 216 (1.2%) |
| $500 to $799 | 2,743 (10.3%) | 200 (1.1%) |
| $800 to $999 | 1,394 (5.2%) | 179 (1.0%) |
| $1,000 to $1,499 | 4,354 (16.4%) | 3,520 (19.9%) |
| $1,500 to $1,999 | 4,067 (15.3%) | 6,740 (38.1%) |
| $2,000 to $2,499 | 3,674 (13.8%) | 4,086 (23.1%) |
| $2,500 to $2,999 | 3,058 (11.5%) | 1,223 (6.9%) |
| $3,000 or more | 6,623 (24.9%) | 998 (5.6%) |
| Total | 26,564 (100.0%) | 17,696 (100.0%) |
Physical Housing Characteristics in Coral Springs
Housing Structures in Coral Springs
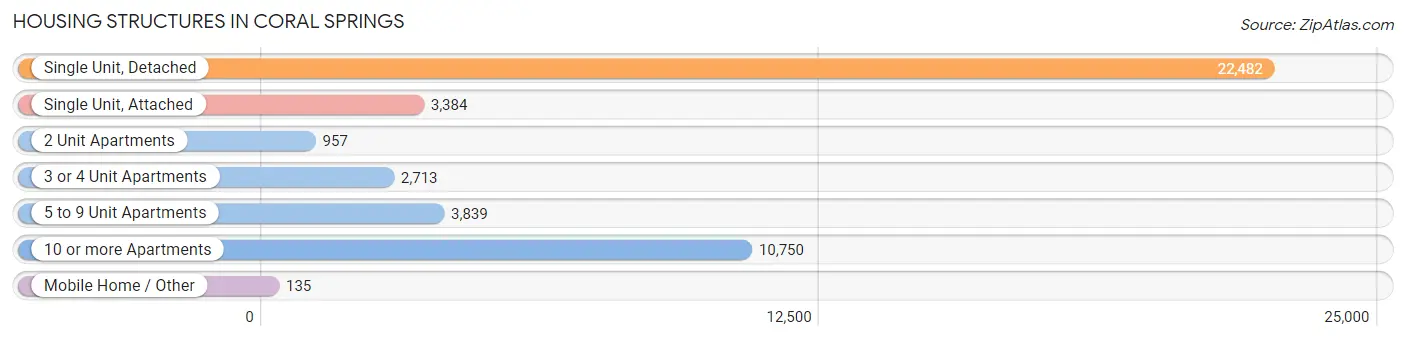
| Structure Type | # Housing Units | % Housing Units |
| Single Unit, Detached | 22,482 | 50.8% |
| Single Unit, Attached | 3,384 | 7.6% |
| 2 Unit Apartments | 957 | 2.2% |
| 3 or 4 Unit Apartments | 2,713 | 6.1% |
| 5 to 9 Unit Apartments | 3,839 | 8.7% |
| 10 or more Apartments | 10,750 | 24.3% |
| Mobile Home / Other | 135 | 0.3% |
| Total | 44,260 | 100.0% |
Housing Structures by Occupancy in Coral Springs
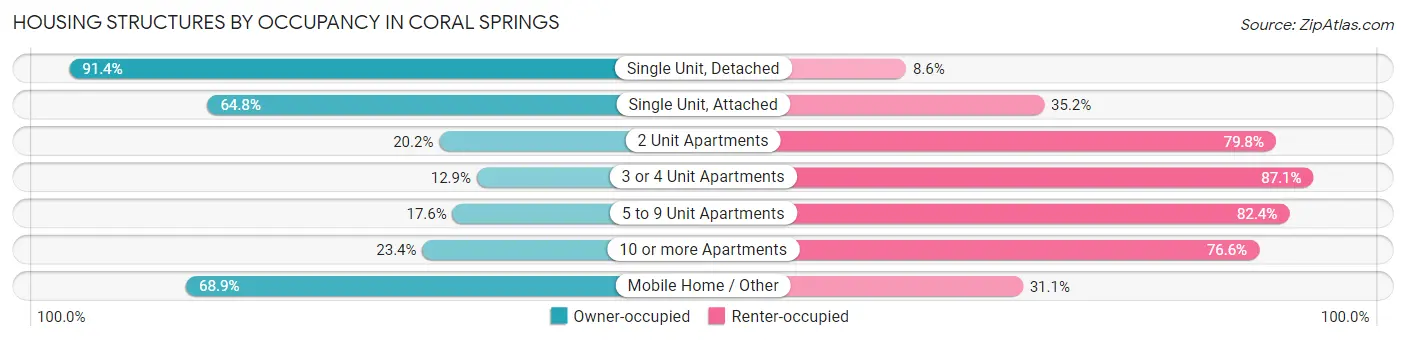
| Structure Type | Owner-occupied | Renter-occupied |
| Single Unit, Detached | 20,541 (91.4%) | 1,941 (8.6%) |
| Single Unit, Attached | 2,192 (64.8%) | 1,192 (35.2%) |
| 2 Unit Apartments | 193 (20.2%) | 764 (79.8%) |
| 3 or 4 Unit Apartments | 351 (12.9%) | 2,362 (87.1%) |
| 5 to 9 Unit Apartments | 676 (17.6%) | 3,163 (82.4%) |
| 10 or more Apartments | 2,518 (23.4%) | 8,232 (76.6%) |
| Mobile Home / Other | 93 (68.9%) | 42 (31.1%) |
| Total | 26,564 (60.0%) | 17,696 (40.0%) |
Housing Structures by Number of Rooms in Coral Springs
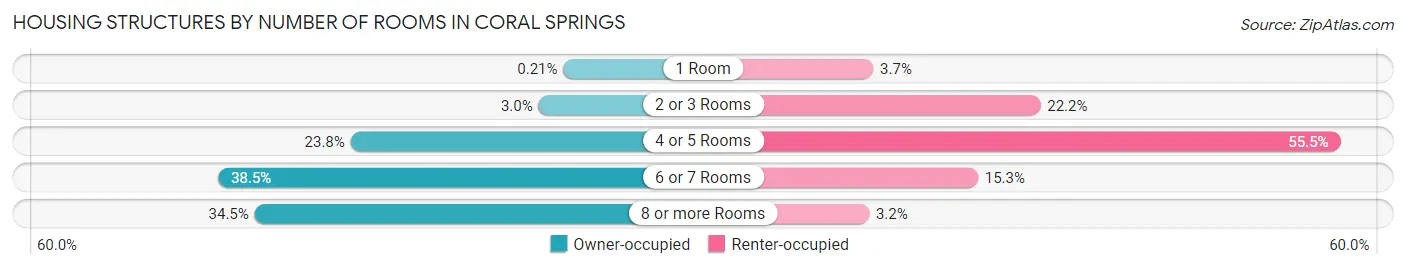
| Number of Rooms | Owner-occupied | Renter-occupied |
| 1 Room | 55 (0.2%) | 653 (3.7%) |
| 2 or 3 Rooms | 787 (3.0%) | 3,936 (22.2%) |
| 4 or 5 Rooms | 6,328 (23.8%) | 9,829 (55.5%) |
| 6 or 7 Rooms | 10,238 (38.5%) | 2,708 (15.3%) |
| 8 or more Rooms | 9,156 (34.5%) | 570 (3.2%) |
| Total | 26,564 (100.0%) | 17,696 (100.0%) |
Housing Structure by Heating Type in Coral Springs
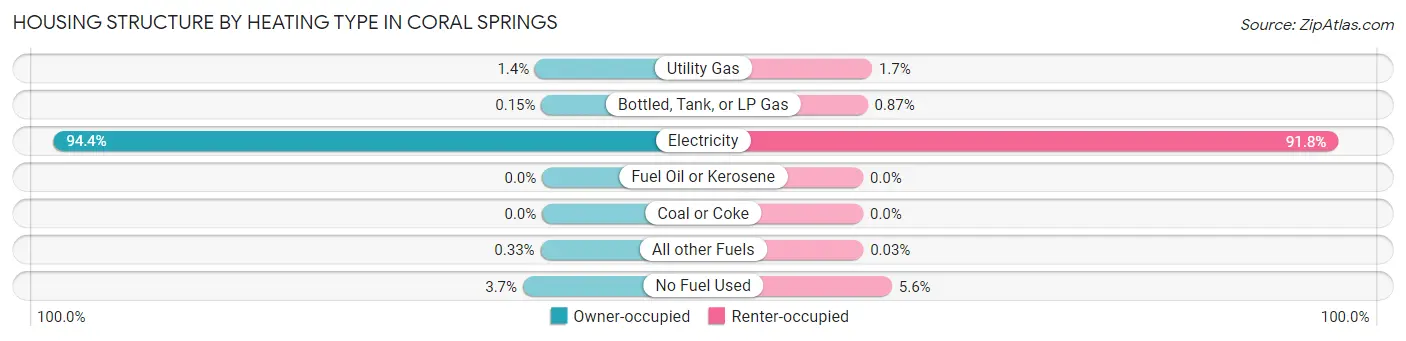
| Heating Type | Owner-occupied | Renter-occupied |
| Utility Gas | 360 (1.4%) | 305 (1.7%) |
| Bottled, Tank, or LP Gas | 40 (0.2%) | 154 (0.9%) |
| Electricity | 25,088 (94.4%) | 16,245 (91.8%) |
| Fuel Oil or Kerosene | 0 (0.0%) | 0 (0.0%) |
| Coal or Coke | 0 (0.0%) | 0 (0.0%) |
| All other Fuels | 87 (0.3%) | 6 (0.0%) |
| No Fuel Used | 989 (3.7%) | 986 (5.6%) |
| Total | 26,564 (100.0%) | 17,696 (100.0%) |
Household Vehicle Usage in Coral Springs
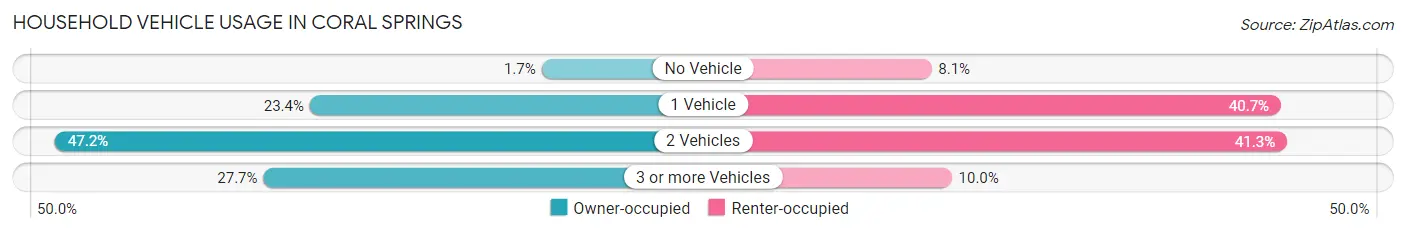
| Vehicles per Household | Owner-occupied | Renter-occupied |
| No Vehicle | 462 (1.7%) | 1,428 (8.1%) |
| 1 Vehicle | 6,211 (23.4%) | 7,202 (40.7%) |
| 2 Vehicles | 12,529 (47.2%) | 7,304 (41.3%) |
| 3 or more Vehicles | 7,362 (27.7%) | 1,762 (10.0%) |
| Total | 26,564 (100.0%) | 17,696 (100.0%) |
Real Estate & Mortgages in Coral Springs
Real Estate and Mortgage Overview in Coral Springs
| Characteristic | Without Mortgage | With Mortgage |
| Housing Units | 7,997 | 18,567 |
| Median Property Value | $448,200 | $455,200 |
| Median Household Income | $87,573 | $7,436 |
| Monthly Housing Costs | $967 | $6,600 |
| Real Estate Taxes | $4,712 | $274 |
Property Value by Mortgage Status in Coral Springs
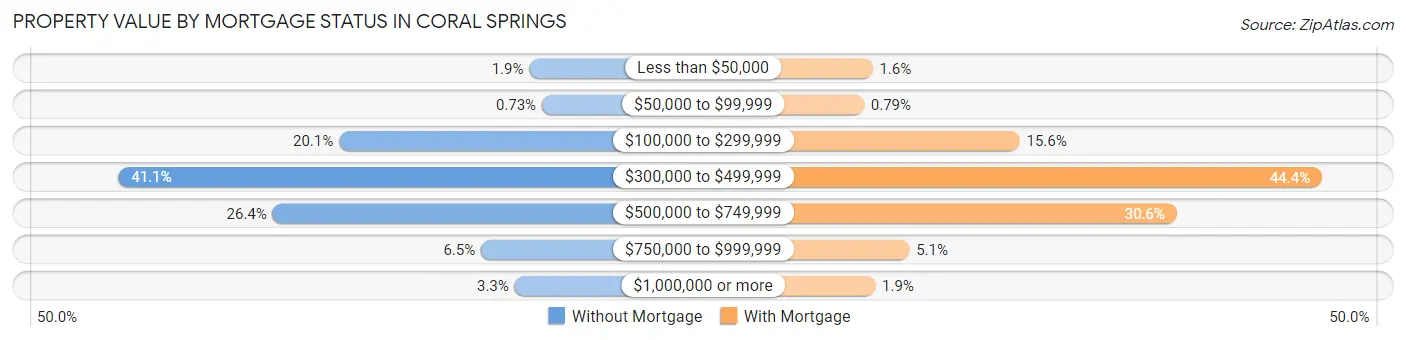
| Property Value | Without Mortgage | With Mortgage |
| Less than $50,000 | 154 (1.9%) | 299 (1.6%) |
| $50,000 to $99,999 | 58 (0.7%) | 147 (0.8%) |
| $100,000 to $299,999 | 1,603 (20.1%) | 2,901 (15.6%) |
| $300,000 to $499,999 | 3,284 (41.1%) | 8,247 (44.4%) |
| $500,000 to $749,999 | 2,110 (26.4%) | 5,680 (30.6%) |
| $750,000 to $999,999 | 522 (6.5%) | 948 (5.1%) |
| $1,000,000 or more | 266 (3.3%) | 345 (1.9%) |
| Total | 7,997 (100.0%) | 18,567 (100.0%) |
Household Income by Mortgage Status in Coral Springs
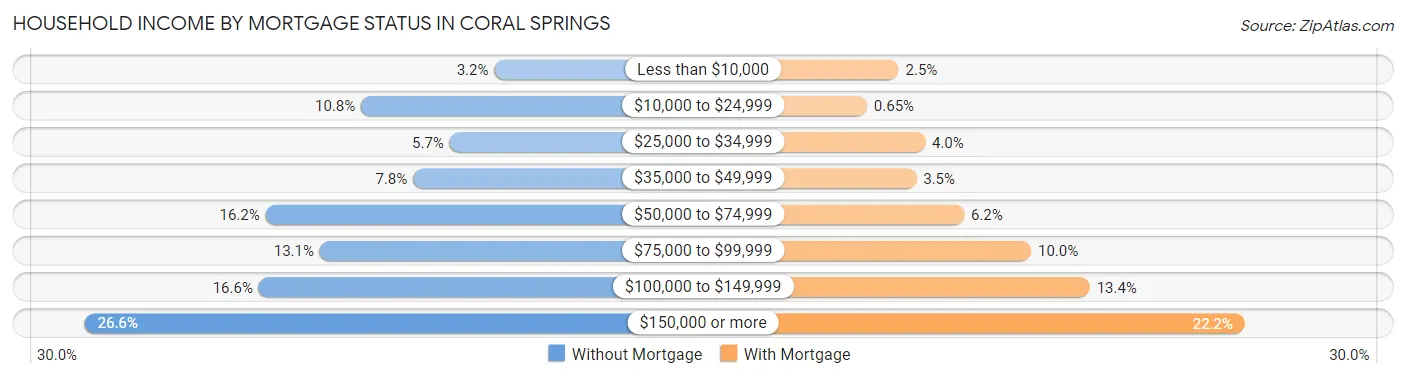
| Household Income | Without Mortgage | With Mortgage |
| Less than $10,000 | 253 (3.2%) | 457 (2.5%) |
| $10,000 to $24,999 | 861 (10.8%) | 121 (0.6%) |
| $25,000 to $34,999 | 457 (5.7%) | 738 (4.0%) |
| $35,000 to $49,999 | 624 (7.8%) | 645 (3.5%) |
| $50,000 to $74,999 | 1,298 (16.2%) | 1,152 (6.2%) |
| $75,000 to $99,999 | 1,050 (13.1%) | 1,862 (10.0%) |
| $100,000 to $149,999 | 1,329 (16.6%) | 2,484 (13.4%) |
| $150,000 or more | 2,125 (26.6%) | 4,129 (22.2%) |
| Total | 7,997 (100.0%) | 18,567 (100.0%) |
Property Value to Household Income Ratio in Coral Springs
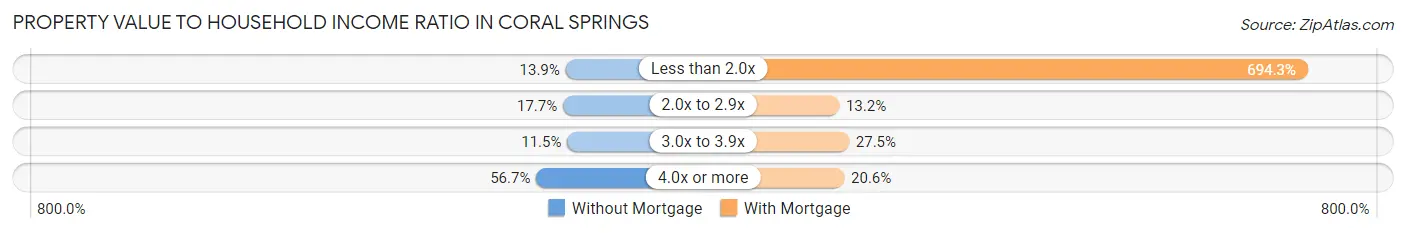
| Value-to-Income Ratio | Without Mortgage | With Mortgage |
| Less than 2.0x | 1,115 (13.9%) | 128,913 (694.3%) |
| 2.0x to 2.9x | 1,416 (17.7%) | 2,444 (13.2%) |
| 3.0x to 3.9x | 918 (11.5%) | 5,106 (27.5%) |
| 4.0x or more | 4,531 (56.7%) | 3,830 (20.6%) |
| Total | 7,997 (100.0%) | 18,567 (100.0%) |
Real Estate Taxes by Mortgage Status in Coral Springs
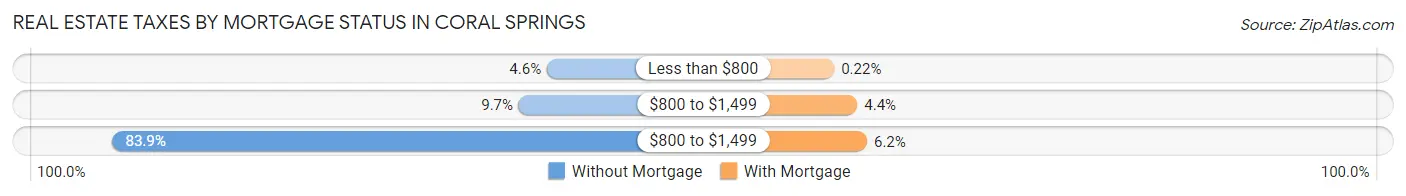
| Property Taxes | Without Mortgage | With Mortgage |
| Less than $800 | 367 (4.6%) | 40 (0.2%) |
| $800 to $1,499 | 777 (9.7%) | 824 (4.4%) |
| $800 to $1,499 | 6,712 (83.9%) | 1,153 (6.2%) |
| Total | 7,997 (100.0%) | 18,567 (100.0%) |
Health & Disability in Coral Springs
Health Insurance Coverage by Age in Coral Springs
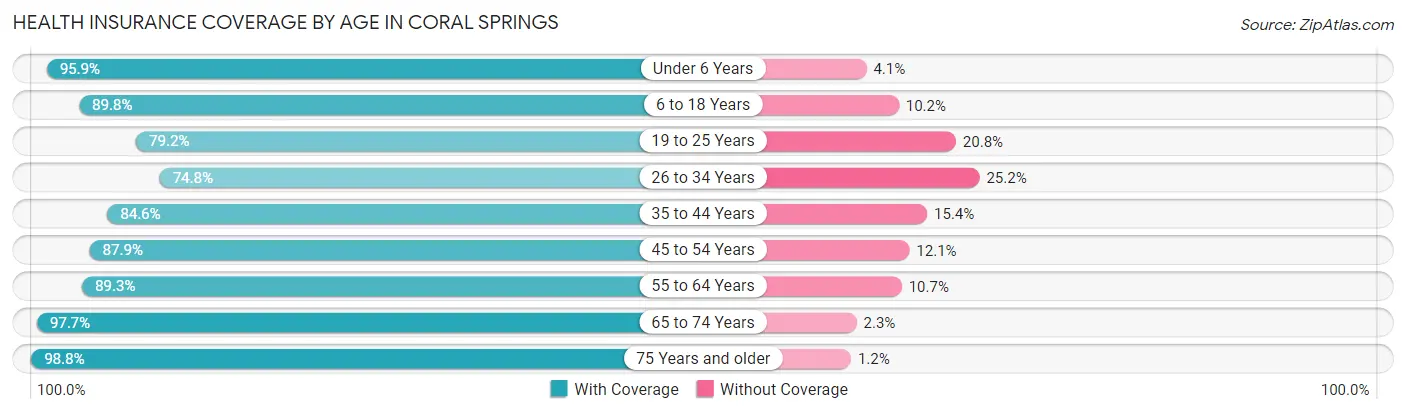
| Age Bracket | With Coverage | Without Coverage |
| Under 6 Years | 9,774 (95.9%) | 421 (4.1%) |
| 6 to 18 Years | 23,696 (89.8%) | 2,680 (10.2%) |
| 19 to 25 Years | 8,904 (79.2%) | 2,340 (20.8%) |
| 26 to 34 Years | 11,423 (74.8%) | 3,851 (25.2%) |
| 35 to 44 Years | 15,699 (84.6%) | 2,866 (15.4%) |
| 45 to 54 Years | 15,820 (87.9%) | 2,186 (12.1%) |
| 55 to 64 Years | 15,930 (89.3%) | 1,911 (10.7%) |
| 65 to 74 Years | 10,356 (97.7%) | 243 (2.3%) |
| 75 Years and older | 5,421 (98.8%) | 68 (1.2%) |
| Total | 117,023 (87.6%) | 16,566 (12.4%) |
Health Insurance Coverage by Citizenship Status in Coral Springs
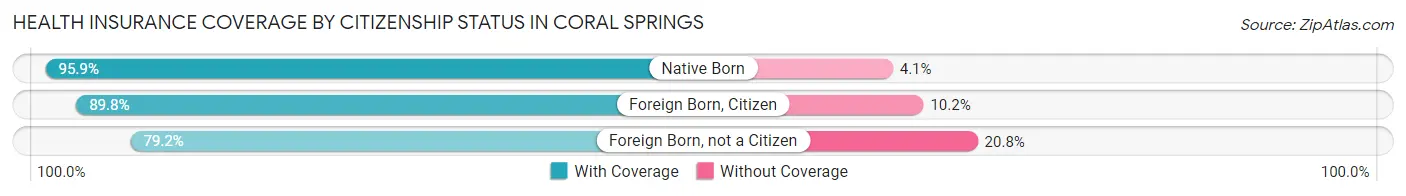
| Citizenship Status | With Coverage | Without Coverage |
| Native Born | 9,774 (95.9%) | 421 (4.1%) |
| Foreign Born, Citizen | 23,696 (89.8%) | 2,680 (10.2%) |
| Foreign Born, not a Citizen | 8,904 (79.2%) | 2,340 (20.8%) |
Health Insurance Coverage by Household Income in Coral Springs
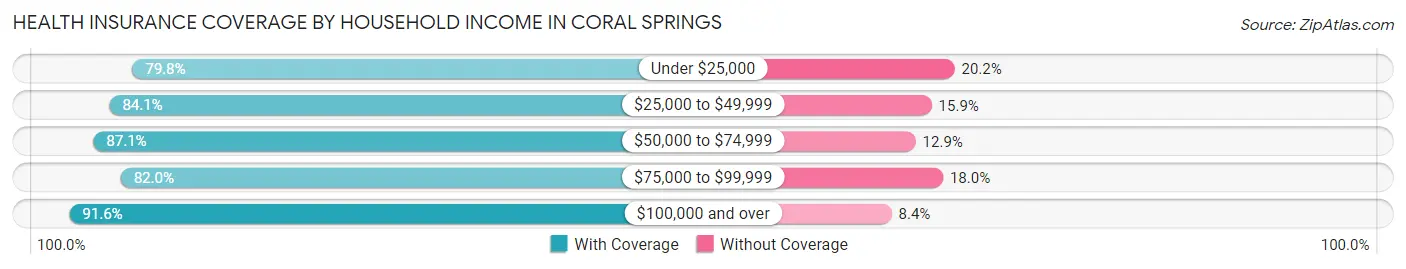
| Household Income | With Coverage | Without Coverage |
| Under $25,000 | 7,617 (79.8%) | 1,927 (20.2%) |
| $25,000 to $49,999 | 13,027 (84.1%) | 2,462 (15.9%) |
| $50,000 to $74,999 | 17,665 (87.1%) | 2,616 (12.9%) |
| $75,000 to $99,999 | 17,951 (82.0%) | 3,945 (18.0%) |
| $100,000 and over | 60,646 (91.6%) | 5,558 (8.4%) |
Public vs Private Health Insurance Coverage by Age in Coral Springs
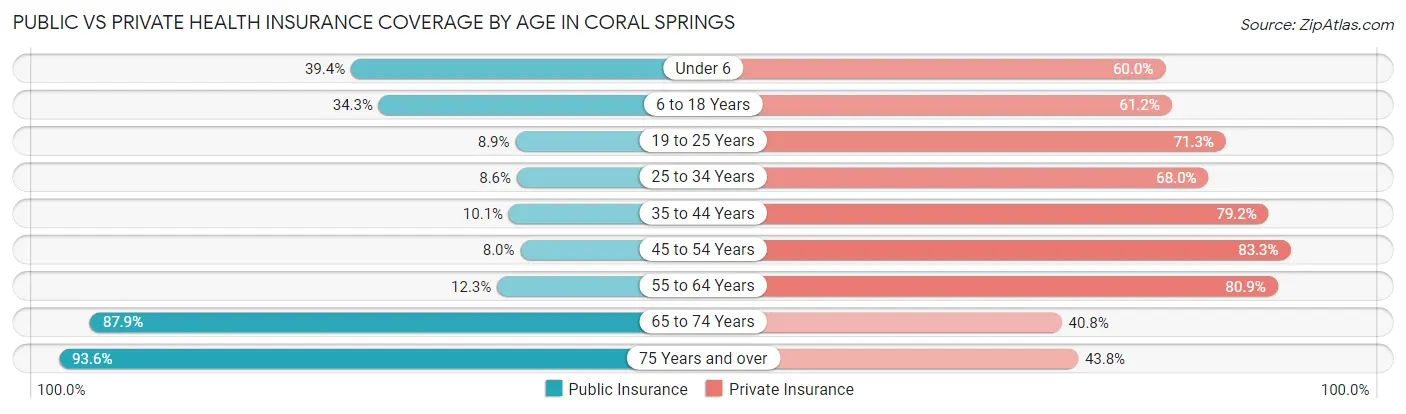
| Age Bracket | Public Insurance | Private Insurance |
| Under 6 | 4,019 (39.4%) | 6,119 (60.0%) |
| 6 to 18 Years | 9,036 (34.3%) | 16,143 (61.2%) |
| 19 to 25 Years | 1,002 (8.9%) | 8,011 (71.3%) |
| 25 to 34 Years | 1,318 (8.6%) | 10,393 (68.0%) |
| 35 to 44 Years | 1,876 (10.1%) | 14,706 (79.2%) |
| 45 to 54 Years | 1,436 (8.0%) | 14,990 (83.3%) |
| 55 to 64 Years | 2,195 (12.3%) | 14,431 (80.9%) |
| 65 to 74 Years | 9,315 (87.9%) | 4,324 (40.8%) |
| 75 Years and over | 5,138 (93.6%) | 2,406 (43.8%) |
| Total | 35,335 (26.5%) | 91,523 (68.5%) |
Disability Status by Sex by Age in Coral Springs
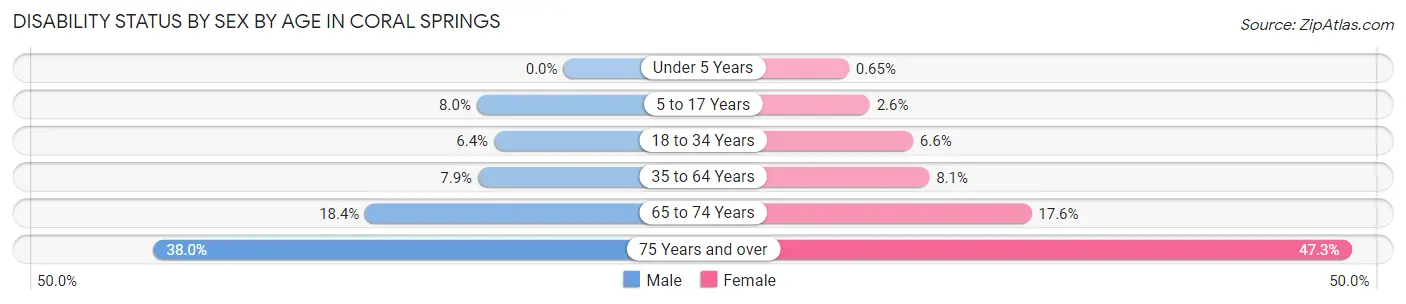
| Age Bracket | Male | Female |
| Under 5 Years | 0 (0.0%) | 31 (0.6%) |
| 5 to 17 Years | 1,040 (8.0%) | 341 (2.6%) |
| 18 to 34 Years | 916 (6.4%) | 938 (6.6%) |
| 35 to 64 Years | 2,055 (7.9%) | 2,313 (8.1%) |
| 65 to 74 Years | 892 (18.4%) | 1,011 (17.6%) |
| 75 Years and over | 822 (38.0%) | 1,573 (47.3%) |
Disability Class by Sex by Age in Coral Springs
Disability Class: Hearing Difficulty
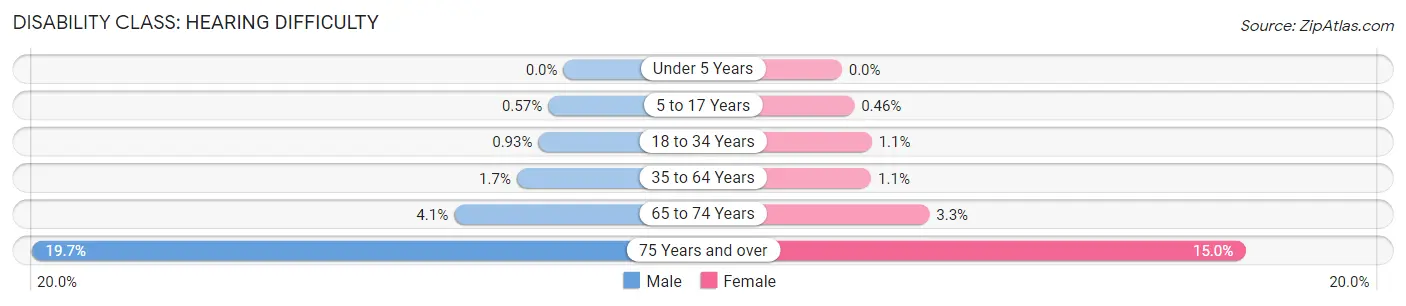
| Age Bracket | Male | Female |
| Under 5 Years | 0 (0.0%) | 0 (0.0%) |
| 5 to 17 Years | 74 (0.6%) | 60 (0.5%) |
| 18 to 34 Years | 132 (0.9%) | 158 (1.1%) |
| 35 to 64 Years | 449 (1.7%) | 311 (1.1%) |
| 65 to 74 Years | 197 (4.1%) | 187 (3.3%) |
| 75 Years and over | 426 (19.7%) | 498 (15.0%) |
Disability Class: Vision Difficulty
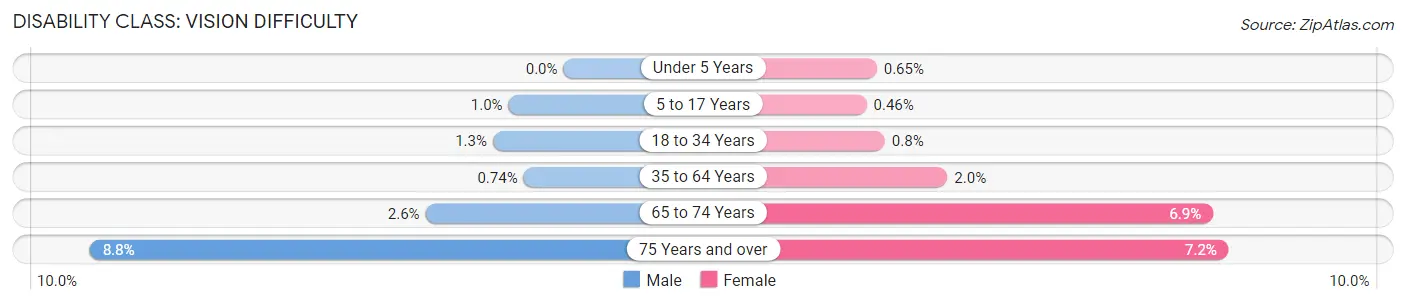
| Age Bracket | Male | Female |
| Under 5 Years | 0 (0.0%) | 31 (0.6%) |
| 5 to 17 Years | 132 (1.0%) | 61 (0.5%) |
| 18 to 34 Years | 186 (1.3%) | 114 (0.8%) |
| 35 to 64 Years | 191 (0.7%) | 559 (2.0%) |
| 65 to 74 Years | 124 (2.6%) | 396 (6.9%) |
| 75 Years and over | 190 (8.8%) | 239 (7.2%) |
Disability Class: Cognitive Difficulty
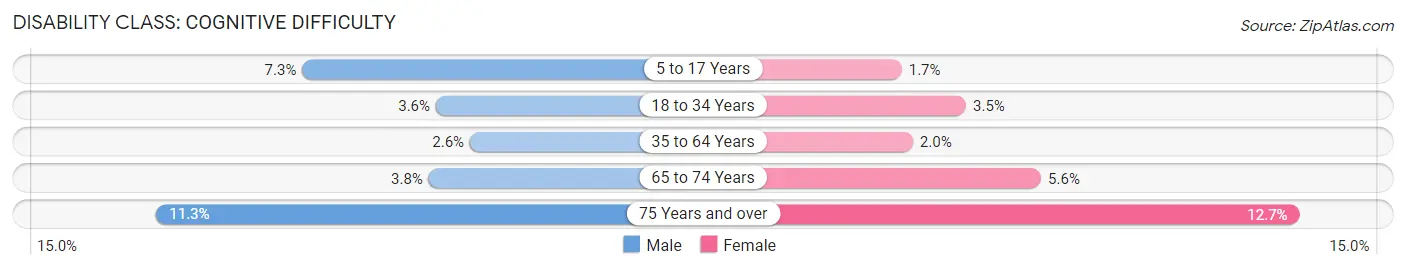
| Age Bracket | Male | Female |
| 5 to 17 Years | 941 (7.3%) | 220 (1.7%) |
| 18 to 34 Years | 505 (3.5%) | 492 (3.5%) |
| 35 to 64 Years | 673 (2.6%) | 564 (2.0%) |
| 65 to 74 Years | 182 (3.7%) | 319 (5.6%) |
| 75 Years and over | 245 (11.3%) | 424 (12.7%) |
Disability Class: Ambulatory Difficulty
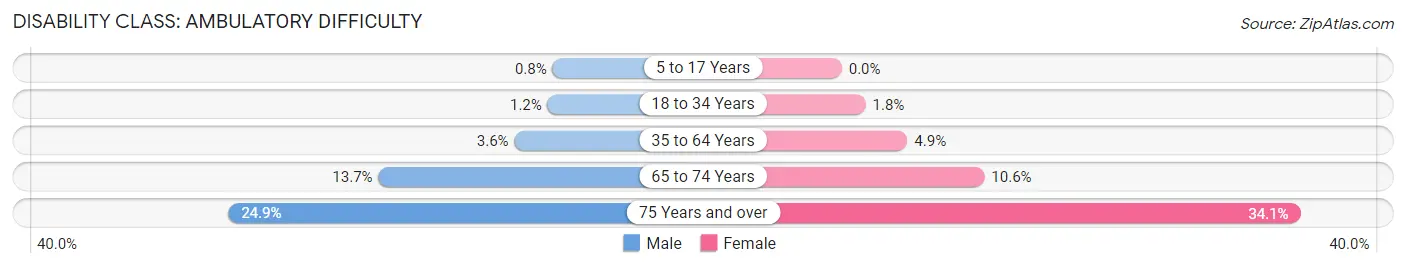
| Age Bracket | Male | Female |
| 5 to 17 Years | 104 (0.8%) | 0 (0.0%) |
| 18 to 34 Years | 166 (1.2%) | 252 (1.8%) |
| 35 to 64 Years | 941 (3.6%) | 1,388 (4.9%) |
| 65 to 74 Years | 666 (13.7%) | 609 (10.6%) |
| 75 Years and over | 538 (24.9%) | 1,133 (34.1%) |
Disability Class: Self-Care Difficulty
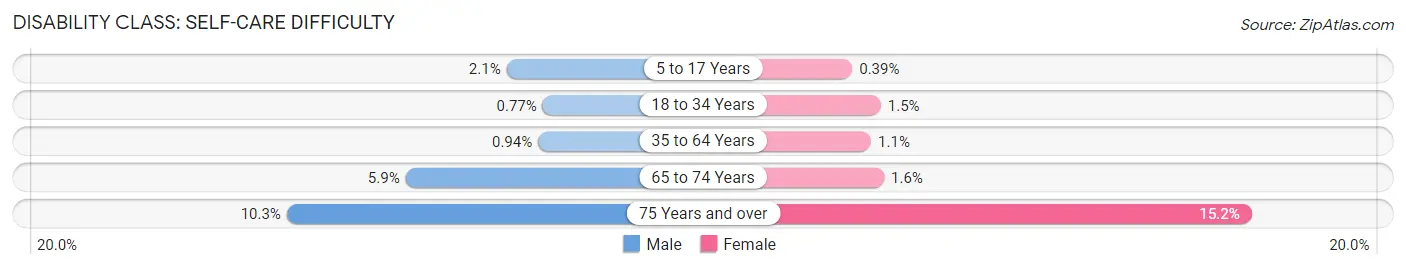
| Age Bracket | Male | Female |
| 5 to 17 Years | 273 (2.1%) | 52 (0.4%) |
| 18 to 34 Years | 110 (0.8%) | 206 (1.5%) |
| 35 to 64 Years | 244 (0.9%) | 310 (1.1%) |
| 65 to 74 Years | 284 (5.9%) | 90 (1.6%) |
| 75 Years and over | 222 (10.3%) | 506 (15.2%) |
Technology Access in Coral Springs
Computing Device Access in Coral Springs
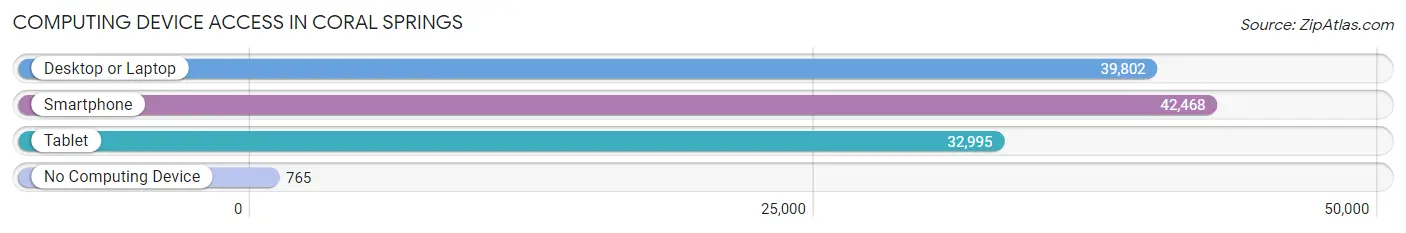
| Device Type | # Households | % Households |
| Desktop or Laptop | 39,802 | 89.9% |
| Smartphone | 42,468 | 96.0% |
| Tablet | 32,995 | 74.6% |
| No Computing Device | 765 | 1.7% |
| Total | 44,260 | 100.0% |
Internet Access in Coral Springs
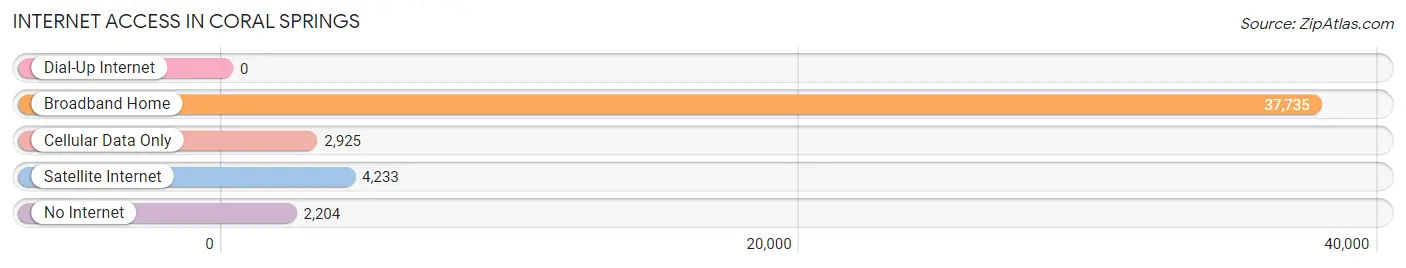
| Internet Type | # Households | % Households |
| Dial-Up Internet | 0 | 0.0% |
| Broadband Home | 37,735 | 85.3% |
| Cellular Data Only | 2,925 | 6.6% |
| Satellite Internet | 4,233 | 9.6% |
| No Internet | 2,204 | 5.0% |
| Total | 44,260 | 100.0% |
Coral Springs Summary
Coral Springs is a city located in the Broward County of Florida, United States. It is a part of the Miami metropolitan area and is located about 20 miles northwest of Fort Lauderdale. The city was incorporated in July 1963 and has since grown to become one of the most populous cities in the state. As of the 2010 census, the population of Coral Springs was 121,096.
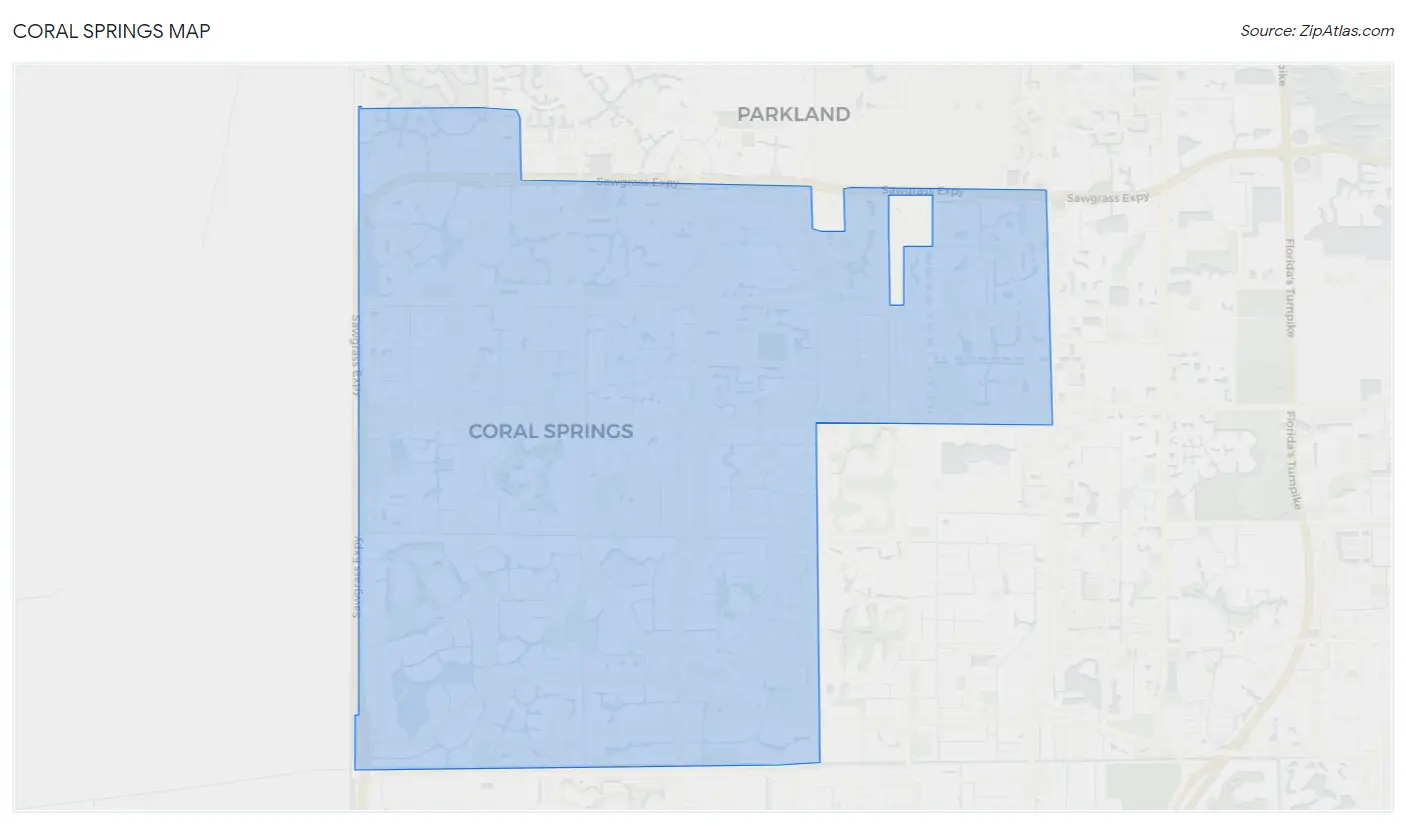
Geography
Coral Springs is located in the southeastern part of Florida, in the Miami metropolitan area. It is situated in the northern part of Broward County, about 20 miles northwest of Fort Lauderdale. The city is bordered by Tamarac to the north, Margate to the east, Parkland to the west, and Coconut Creek to the south. The city covers an area of 24.3 square miles, of which 0.2 square miles is water. The city is located on a flat terrain, with the highest elevation being about 20 feet above sea level.
Climate
Coral Springs has a tropical monsoon climate, with hot and humid summers and mild winters. The average temperature in the city ranges from 64°F in January to 83°F in August. The average annual precipitation is about 60 inches, with the wettest months being June and July.
Economy
Coral Springs is home to a diverse economy, with a variety of industries represented. The city is home to several large companies, including Motorola Solutions, American Express, and Siemens. The city is also home to several smaller businesses, including restaurants, retail stores, and professional services. The city is also home to several educational institutions, including the University of Florida, Florida Atlantic University, and Broward College.
Demographics
As of the 2010 census, the population of Coral Springs was 121,096. The racial makeup of the city was 74.3% White, 11.3% African American, 0.3% Native American, 8.2% Asian, 0.1% Pacific Islander, and 4.8% from other races. The median household income in the city was $67,945, and the median family income was $77,845. The per capita income in the city was $30,945.
Conclusion
Coral Springs is a city located in the Broward County of Florida, United States. It is a part of the Miami metropolitan area and is located about 20 miles northwest of Fort Lauderdale. The city was incorporated in July 1963 and has since grown to become one of the most populous cities in the state. As of the 2010 census, the population of Coral Springs was 121,096. The city has a tropical monsoon climate, with hot and humid summers and mild winters. The economy of the city is diverse, with a variety of industries represented. The racial makeup of the city was 74.3% White, 11.3% African American, 0.3% Native American, 8.2% Asian, 0.1% Pacific Islander, and 4.8% from other races. The median household income in the city was $67,945, and the median family income was $77,845.
Common Questions
What is Per Capita Income in Coral Springs?
Per Capita income in Coral Springs is $38,483.
What is the Median Family Income in Coral Springs?
Median Family Income in Coral Springs is $97,941.
What is the Median Household income in Coral Springs?
Median Household Income in Coral Springs is $87,488.
What is Income or Wage Gap in Coral Springs?
Income or Wage Gap in Coral Springs is 22.7%.
Women in Coral Springs earn 77.3 cents for every dollar earned by a man.
What is Family Income Deficit in Coral Springs?
Family Income Deficit in Coral Springs is $11,360.
Families that are below poverty line in Coral Springs earn $11,360 less on average than the poverty threshold level.
What is Inequality or Gini Index in Coral Springs?
Inequality or Gini Index in Coral Springs is 0.42.
What is the Total Population of Coral Springs?
Total Population of Coral Springs is 133,801.
What is the Total Male Population of Coral Springs?
Total Male Population of Coral Springs is 63,934.
What is the Total Female Population of Coral Springs?
Total Female Population of Coral Springs is 69,867.
What is the Ratio of Males per 100 Females in Coral Springs?
There are 91.51 Males per 100 Females in Coral Springs.
What is the Ratio of Females per 100 Males in Coral Springs?
There are 109.28 Females per 100 Males in Coral Springs.
What is the Median Population Age in Coral Springs?
Median Population Age in Coral Springs is 36.8 Years.
What is the Average Family Size in Coral Springs
Average Family Size in Coral Springs is 3.4 People.
What is the Average Household Size in Coral Springs
Average Household Size in Coral Springs is 3.0 People.
How Large is the Labor Force in Coral Springs?
There are 73,065 People in the Labor Forcein in Coral Springs.
What is the Percentage of People in the Labor Force in Coral Springs?
70.5% of People are in the Labor Force in Coral Springs.
What is the Unemployment Rate in Coral Springs?
Unemployment Rate in Coral Springs is 6.2%.