Henderson, NV Map & Demographics
Henderson Map
Henderson Overview
$46,882
PER CAPITA INCOME
$100,794
AVG FAMILY INCOME
$85,311
AVG HOUSEHOLD INCOME
28.3%
WAGE / INCOME GAP [ % ]
71.7¢/ $1
WAGE / INCOME GAP [ $ ]
$11,619
FAMILY INCOME DEFICIT
0.46
INEQUALITY / GINI INDEX
318,063
TOTAL POPULATION
158,062
MALE POPULATION
160,001
FEMALE POPULATION
98.79
MALES / 100 FEMALES
101.23
FEMALES / 100 MALES
42.3
MEDIAN AGE
3.1
AVG FAMILY SIZE
2.5
AVG HOUSEHOLD SIZE
158,107
LABOR FORCE [ PEOPLE ]
61.1%
PERCENT IN LABOR FORCE
7.0%
UNEMPLOYMENT RATE
Henderson Area Codes
Income in Henderson
Income Overview in Henderson
Per Capita Income in Henderson is $46,882, while median incomes of families and households are $100,794 and $85,311 respectively.
| Characteristic | Number | Measure |
| Per Capita Income | 318,063 | $46,882 |
| Median Family Income | 81,949 | $100,794 |
| Mean Family Income | 81,949 | $132,967 |
| Median Household Income | 124,626 | $85,311 |
| Mean Household Income | 124,626 | $116,750 |
| Income Deficit | 81,949 | $11,619 |
| Wage / Income Gap (%) | 318,063 | 28.33% |
| Wage / Income Gap ($) | 318,063 | 71.67¢ per $1 |
| Gini / Inequality Index | 318,063 | 0.46 |
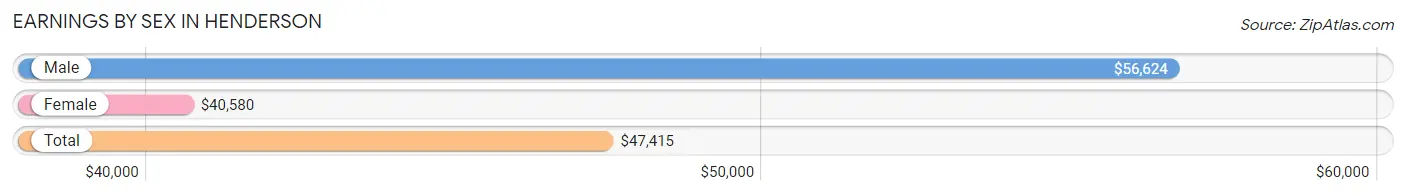
Earnings by Sex in Henderson
Average Earnings in Henderson are $47,415, $56,624 for men and $40,580 for women, a difference of 28.3%.
| Sex | Number | Average Earnings |
| Male | 86,072 (52.9%) | $56,624 |
| Female | 76,472 (47.0%) | $40,580 |
| Total | 162,544 (100.0%) | $47,415 |
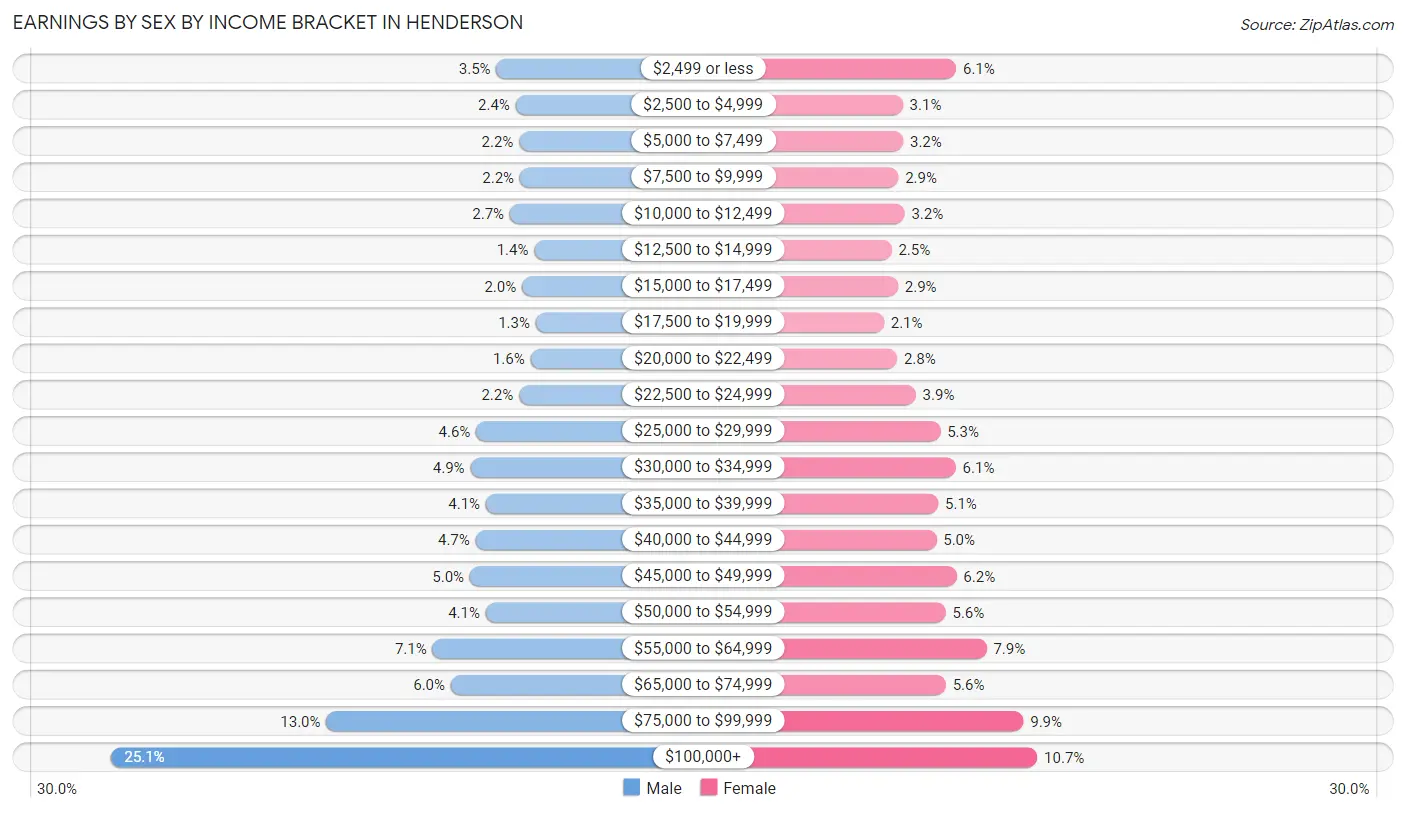
Earnings by Sex by Income Bracket in Henderson
The most common earnings brackets in Henderson are $100,000+ for men (21,617 | 25.1%) and $100,000+ for women (8,181 | 10.7%).
| Income | Male | Female |
| $2,499 or less | 2,997 (3.5%) | 4,699 (6.1%) |
| $2,500 to $4,999 | 2,065 (2.4%) | 2,403 (3.1%) |
| $5,000 to $7,499 | 1,895 (2.2%) | 2,413 (3.2%) |
| $7,500 to $9,999 | 1,858 (2.2%) | 2,212 (2.9%) |
| $10,000 to $12,499 | 2,342 (2.7%) | 2,475 (3.2%) |
| $12,500 to $14,999 | 1,163 (1.3%) | 1,922 (2.5%) |
| $15,000 to $17,499 | 1,757 (2.0%) | 2,196 (2.9%) |
| $17,500 to $19,999 | 1,095 (1.3%) | 1,587 (2.1%) |
| $20,000 to $22,499 | 1,347 (1.6%) | 2,160 (2.8%) |
| $22,500 to $24,999 | 1,903 (2.2%) | 2,963 (3.9%) |
| $25,000 to $29,999 | 3,974 (4.6%) | 4,011 (5.2%) |
| $30,000 to $34,999 | 4,253 (4.9%) | 4,683 (6.1%) |
| $35,000 to $39,999 | 3,502 (4.1%) | 3,925 (5.1%) |
| $40,000 to $44,999 | 4,005 (4.6%) | 3,847 (5.0%) |
| $45,000 to $49,999 | 4,280 (5.0%) | 4,711 (6.2%) |
| $50,000 to $54,999 | 3,511 (4.1%) | 4,245 (5.6%) |
| $55,000 to $64,999 | 6,086 (7.1%) | 6,003 (7.9%) |
| $65,000 to $74,999 | 5,202 (6.0%) | 4,250 (5.6%) |
| $75,000 to $99,999 | 11,220 (13.0%) | 7,586 (9.9%) |
| $100,000+ | 21,617 (25.1%) | 8,181 (10.7%) |
| Total | 86,072 (100.0%) | 76,472 (100.0%) |
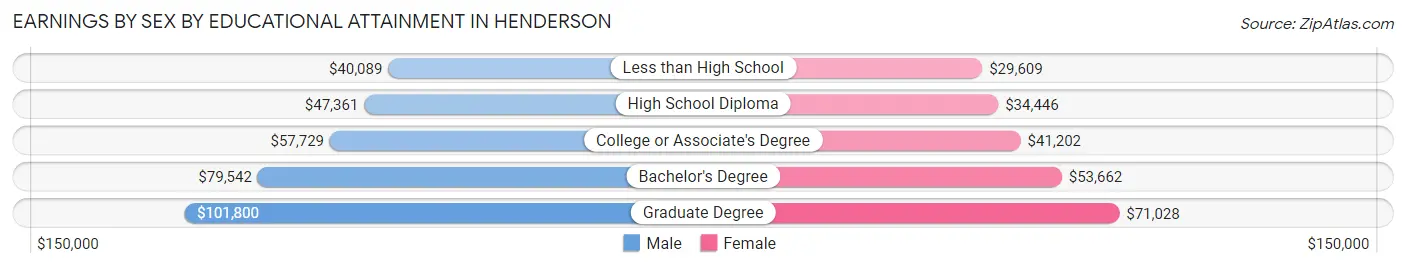
Earnings by Sex by Educational Attainment in Henderson
Average earnings in Henderson are $62,129 for men and $45,608 for women, a difference of 26.6%. Men with an educational attainment of graduate degree enjoy the highest average annual earnings of $101,800, while those with less than high school education earn the least with $40,089. Women with an educational attainment of graduate degree earn the most with the average annual earnings of $71,028, while those with less than high school education have the smallest earnings of $29,609.
| Educational Attainment | Male Income | Female Income |
| Less than High School | $40,089 | $29,609 |
| High School Diploma | $47,361 | $34,446 |
| College or Associate's Degree | $57,729 | $41,202 |
| Bachelor's Degree | $79,542 | $53,662 |
| Graduate Degree | $101,800 | $71,028 |
| Total | $62,129 | $45,608 |
Family Income in Henderson
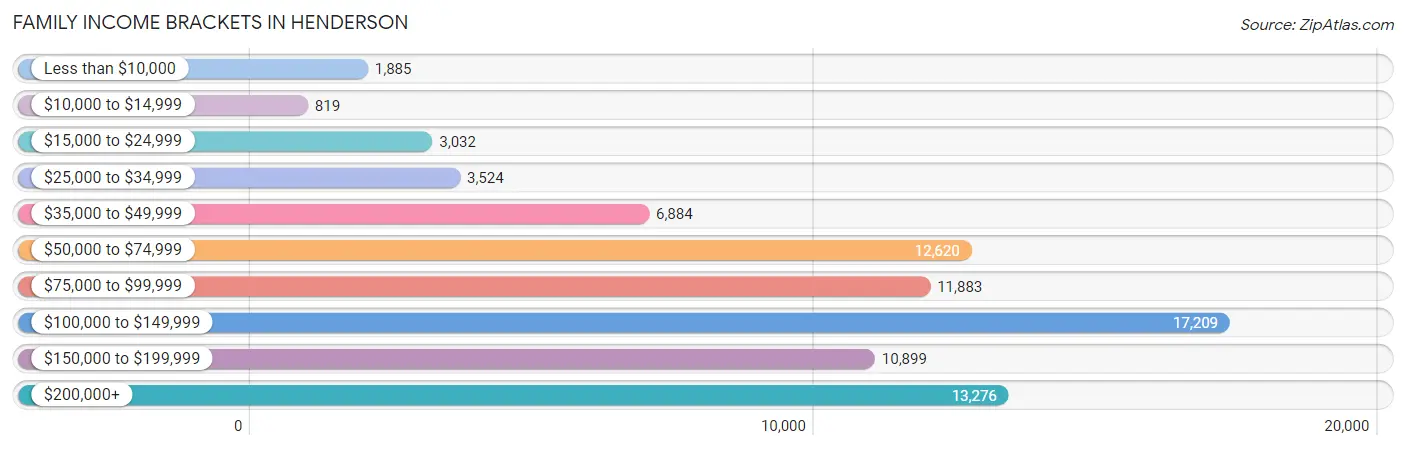
Family Income Brackets in Henderson
According to the Henderson family income data, there are 17,209 families falling into the $100,000 to $149,999 income range, which is the most common income bracket and makes up 21.0% of all families. Conversely, the $10,000 to $14,999 income bracket is the least frequent group with only 819 families (1.0%) belonging to this category.
| Income Bracket | # Families | % Families |
| Less than $10,000 | 1,885 | 2.3% |
| $10,000 to $14,999 | 819 | 1.0% |
| $15,000 to $24,999 | 3,032 | 3.7% |
| $25,000 to $34,999 | 3,524 | 4.3% |
| $35,000 to $49,999 | 6,884 | 8.4% |
| $50,000 to $74,999 | 12,620 | 15.4% |
| $75,000 to $99,999 | 11,883 | 14.5% |
| $100,000 to $149,999 | 17,209 | 21.0% |
| $150,000 to $199,999 | 10,899 | 13.3% |
| $200,000+ | 13,276 | 16.2% |
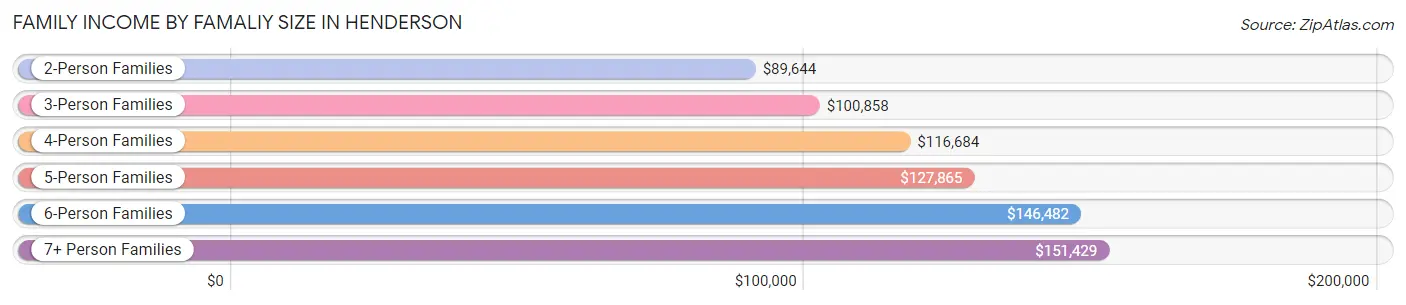
Family Income by Famaliy Size in Henderson
7+ person families (1,242 | 1.5%) account for the highest median family income in Henderson with $151,429 per family, while 2-person families (41,005 | 50.0%) have the highest median income of $44,822 per family member.
| Income Bracket | # Families | Median Income |
| 2-Person Families | 41,005 (50.0%) | $89,644 |
| 3-Person Families | 16,993 (20.7%) | $100,858 |
| 4-Person Families | 13,992 (17.1%) | $116,684 |
| 5-Person Families | 6,480 (7.9%) | $127,865 |
| 6-Person Families | 2,237 (2.7%) | $146,482 |
| 7+ Person Families | 1,242 (1.5%) | $151,429 |
| Total | 81,949 (100.0%) | $100,794 |
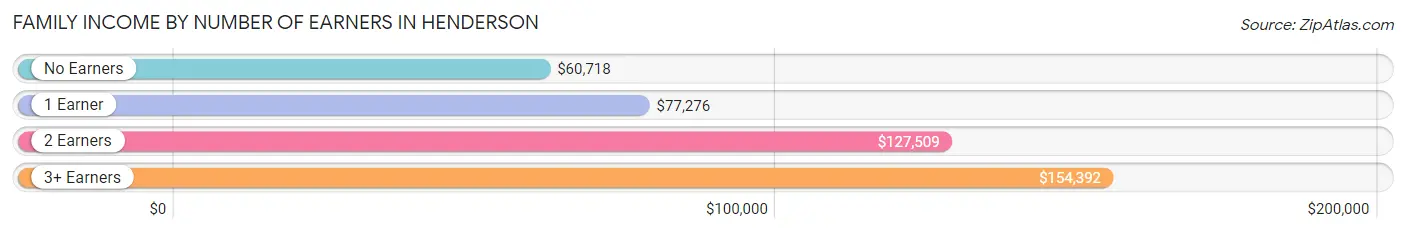
Family Income by Number of Earners in Henderson
The median family income in Henderson is $100,794, with families comprising 3+ earners (8,541) having the highest median family income of $154,392, while families with no earners (14,807) have the lowest median family income of $60,718, accounting for 10.4% and 18.1% of families, respectively.
| Number of Earners | # Families | Median Income |
| No Earners | 14,807 (18.1%) | $60,718 |
| 1 Earner | 27,953 (34.1%) | $77,276 |
| 2 Earners | 30,648 (37.4%) | $127,509 |
| 3+ Earners | 8,541 (10.4%) | $154,392 |
| Total | 81,949 (100.0%) | $100,794 |
Household Income in Henderson
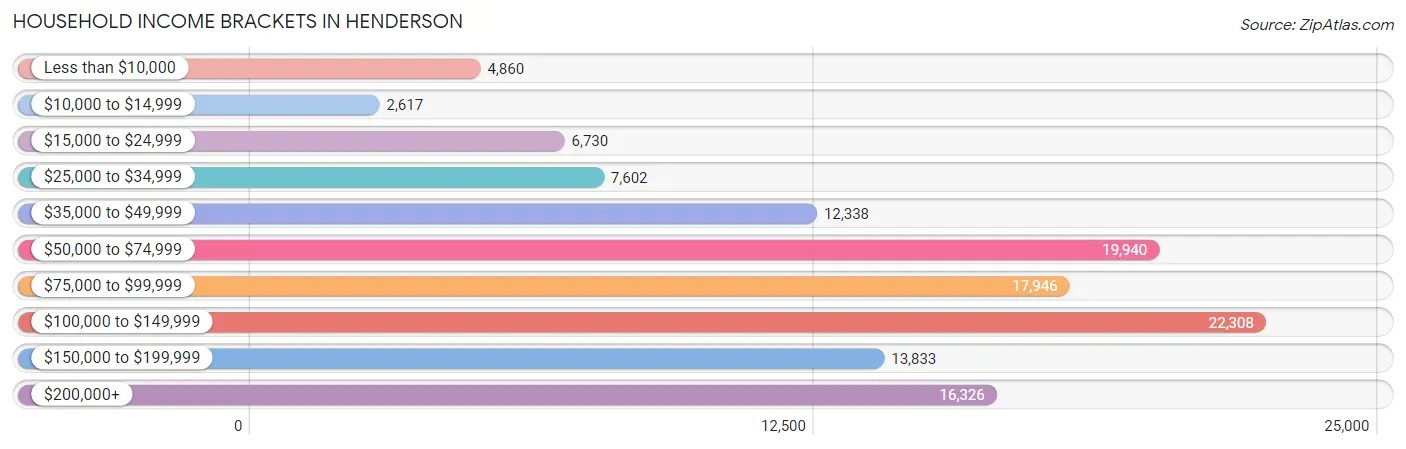
Household Income Brackets in Henderson
With 22,308 households falling in the category, the $100,000 to $149,999 income range is the most frequent in Henderson, accounting for 17.9% of all households. In contrast, only 2,617 households (2.1%) fall into the $10,000 to $14,999 income bracket, making it the least populous group.
| Income Bracket | # Households | % Households |
| Less than $10,000 | 4,860 | 3.9% |
| $10,000 to $14,999 | 2,617 | 2.1% |
| $15,000 to $24,999 | 6,730 | 5.4% |
| $25,000 to $34,999 | 7,602 | 6.1% |
| $35,000 to $49,999 | 12,338 | 9.9% |
| $50,000 to $74,999 | 19,940 | 16.0% |
| $75,000 to $99,999 | 17,946 | 14.4% |
| $100,000 to $149,999 | 22,308 | 17.9% |
| $150,000 to $199,999 | 13,833 | 11.1% |
| $200,000+ | 16,326 | 13.1% |
Household Income by Householder Age in Henderson
The median household income in Henderson is $85,311, with the highest median household income of $106,954 found in the 45 to 64 years age bracket for the primary householder. A total of 47,338 households (38.0%) fall into this category. Meanwhile, the 15 to 24 years age bracket for the primary householder has the lowest median household income of $42,428, with 2,078 households (1.7%) in this group.
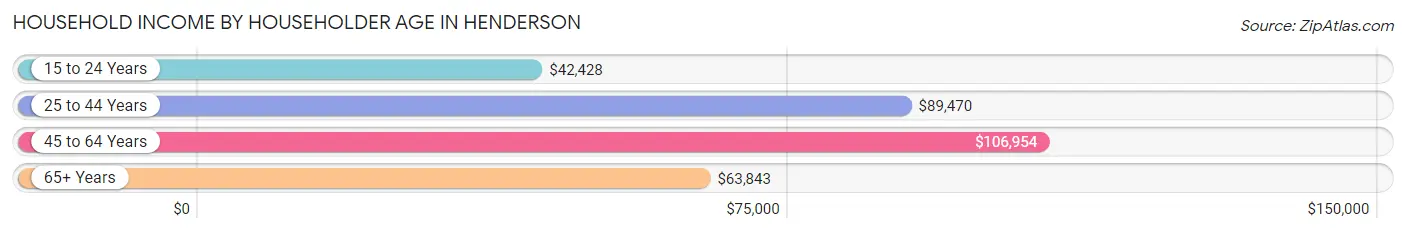
| Income Bracket | # Households | Median Income |
| 15 to 24 Years | 2,078 (1.7%) | $42,428 |
| 25 to 44 Years | 37,199 (29.8%) | $89,470 |
| 45 to 64 Years | 47,338 (38.0%) | $106,954 |
| 65+ Years | 38,011 (30.5%) | $63,843 |
| Total | 124,626 (100.0%) | $85,311 |
Poverty in Henderson
Income Below Poverty by Sex and Age in Henderson
With 7.0% poverty level for males and 9.2% for females among the residents of Henderson, 12 to 14 year old males and 5 year old females are the most vulnerable to poverty, with 865 males (12.4%) and 360 females (20.9%) in their respective age groups living below the poverty level.
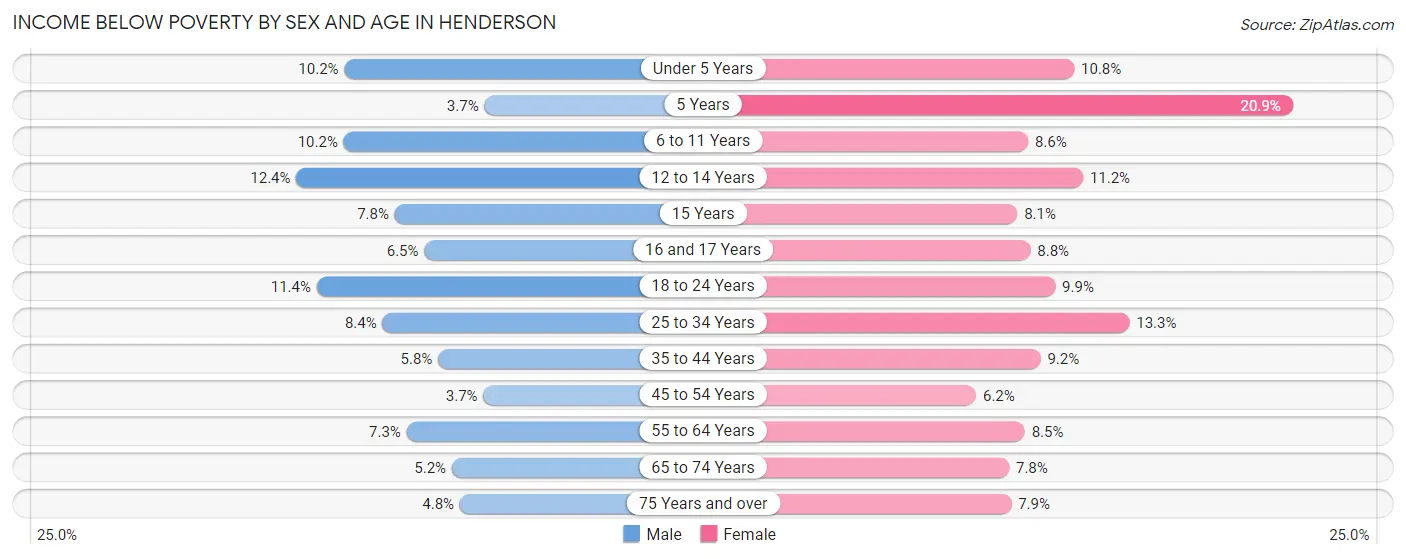
| Age Bracket | Male | Female |
| Under 5 Years | 751 (10.2%) | 841 (10.8%) |
| 5 Years | 64 (3.7%) | 360 (20.9%) |
| 6 to 11 Years | 1,213 (10.2%) | 1,000 (8.6%) |
| 12 to 14 Years | 865 (12.4%) | 622 (11.2%) |
| 15 Years | 163 (7.8%) | 146 (8.1%) |
| 16 and 17 Years | 314 (6.5%) | 350 (8.7%) |
| 18 to 24 Years | 984 (11.4%) | 1,063 (9.9%) |
| 25 to 34 Years | 1,635 (8.4%) | 2,702 (13.3%) |
| 35 to 44 Years | 1,198 (5.8%) | 1,913 (9.2%) |
| 45 to 54 Years | 826 (3.7%) | 1,278 (6.2%) |
| 55 to 64 Years | 1,527 (7.3%) | 1,815 (8.5%) |
| 65 to 74 Years | 905 (5.2%) | 1,512 (7.8%) |
| 75 Years and over | 602 (4.8%) | 1,073 (7.9%) |
| Total | 11,047 (7.0%) | 14,675 (9.2%) |
Income Above Poverty by Sex and Age in Henderson
According to the poverty statistics in Henderson, males aged 5 years and females aged 45 to 54 years are the age groups that are most secure financially, with 96.3% of males and 93.8% of females in these age groups living above the poverty line.
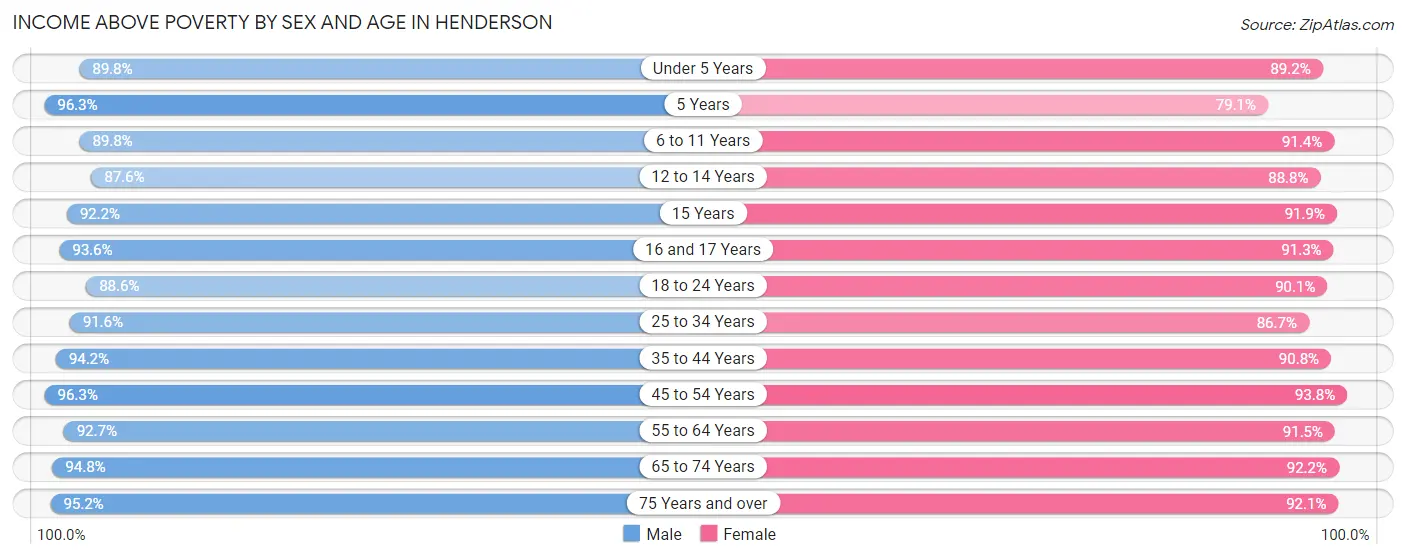
| Age Bracket | Male | Female |
| Under 5 Years | 6,640 (89.8%) | 6,959 (89.2%) |
| 5 Years | 1,684 (96.3%) | 1,361 (79.1%) |
| 6 to 11 Years | 10,690 (89.8%) | 10,571 (91.4%) |
| 12 to 14 Years | 6,119 (87.6%) | 4,936 (88.8%) |
| 15 Years | 1,922 (92.2%) | 1,647 (91.9%) |
| 16 and 17 Years | 4,551 (93.5%) | 3,648 (91.2%) |
| 18 to 24 Years | 7,616 (88.6%) | 9,673 (90.1%) |
| 25 to 34 Years | 17,846 (91.6%) | 17,555 (86.7%) |
| 35 to 44 Years | 19,406 (94.2%) | 18,827 (90.8%) |
| 45 to 54 Years | 21,434 (96.3%) | 19,246 (93.8%) |
| 55 to 64 Years | 19,465 (92.7%) | 19,565 (91.5%) |
| 65 to 74 Years | 16,599 (94.8%) | 17,966 (92.2%) |
| 75 Years and over | 11,942 (95.2%) | 12,579 (92.1%) |
| Total | 145,914 (93.0%) | 144,533 (90.8%) |
Income Below Poverty Among Married-Couple Families in Henderson
The poverty statistics for married-couple families in Henderson show that 3.3% or 2,023 of the total 61,774 families live below the poverty line. Families with 5 or more children have the highest poverty rate of 7.3%, comprising of 24 families. On the other hand, families with no children have the lowest poverty rate of 2.6%, which includes 981 families.
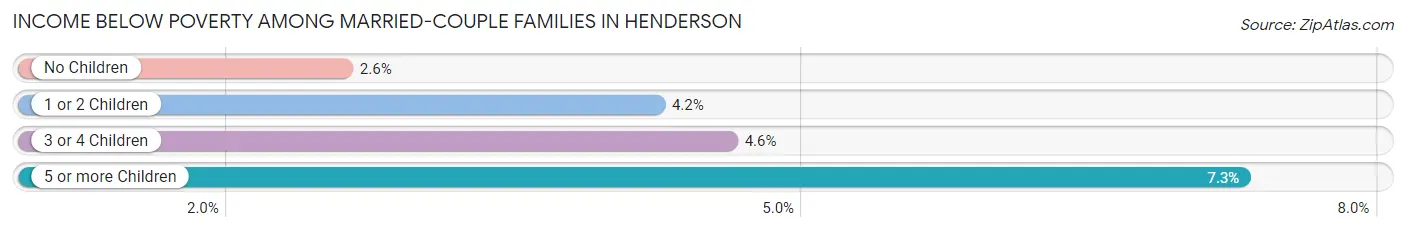
| Children | Above Poverty | Below Poverty |
| No Children | 36,813 (97.4%) | 981 (2.6%) |
| 1 or 2 Children | 18,351 (95.8%) | 811 (4.2%) |
| 3 or 4 Children | 4,282 (95.4%) | 207 (4.6%) |
| 5 or more Children | 305 (92.7%) | 24 (7.3%) |
| Total | 59,751 (96.7%) | 2,023 (3.3%) |
Income Below Poverty Among Single-Parent Households in Henderson
According to the poverty data in Henderson, 7.6% or 530 single-father households and 14.6% or 1,935 single-mother households are living below the poverty line. Among single-father households, those with 1 or 2 children have the highest poverty rate, with 333 households (9.3%) experiencing poverty. Likewise, among single-mother households, those with 5 or more children have the highest poverty rate, with 66 households (58.9%) falling below the poverty line.
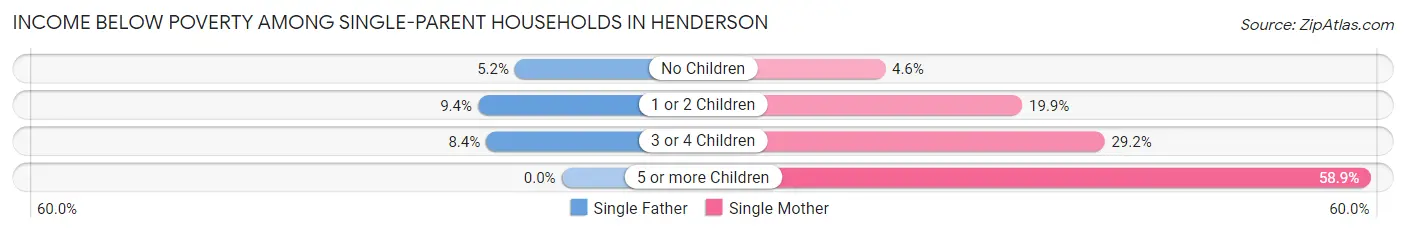
| Children | Single Father | Single Mother |
| No Children | 141 (5.2%) | 261 (4.6%) |
| 1 or 2 Children | 333 (9.3%) | 1,243 (19.9%) |
| 3 or 4 Children | 56 (8.4%) | 365 (29.1%) |
| 5 or more Children | 0 (0.0%) | 66 (58.9%) |
| Total | 530 (7.6%) | 1,935 (14.6%) |
Income Below Poverty Among Married-Couple vs Single-Parent Households in Henderson
The poverty data for Henderson shows that 2,023 of the married-couple family households (3.3%) and 2,465 of the single-parent households (12.2%) are living below the poverty level. Within the married-couple family households, those with 5 or more children have the highest poverty rate, with 24 households (7.3%) falling below the poverty line. Among the single-parent households, those with 5 or more children have the highest poverty rate, with 66 household (58.9%) living below poverty.
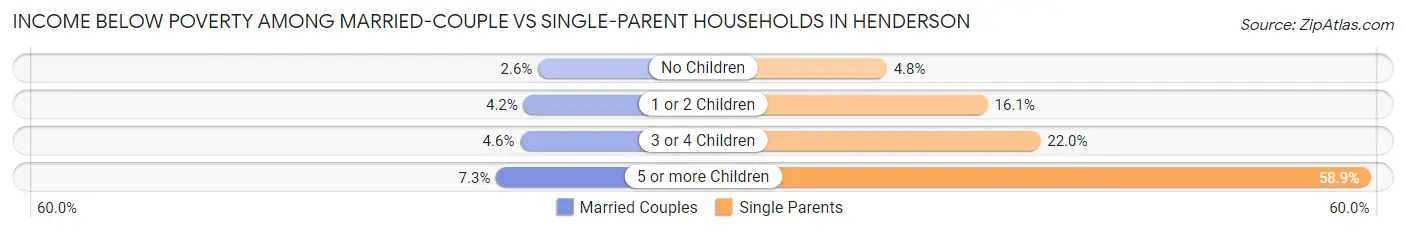
| Children | Married-Couple Families | Single-Parent Households |
| No Children | 981 (2.6%) | 402 (4.8%) |
| 1 or 2 Children | 811 (4.2%) | 1,576 (16.1%) |
| 3 or 4 Children | 207 (4.6%) | 421 (22.0%) |
| 5 or more Children | 24 (7.3%) | 66 (58.9%) |
| Total | 2,023 (3.3%) | 2,465 (12.2%) |
Race in Henderson
The most populous races in Henderson are White / Caucasian (211,056 | 66.4%), Hispanic or Latino (60,808 | 19.1%), and Two or more Races (34,658 | 10.9%).
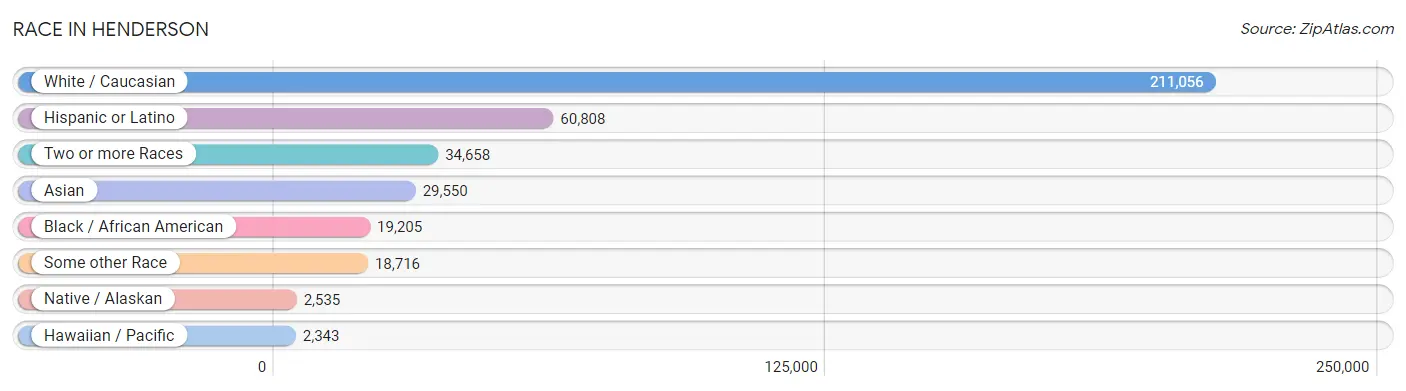
| Race | # Population | % Population |
| Asian | 29,550 | 9.3% |
| Black / African American | 19,205 | 6.0% |
| Hawaiian / Pacific | 2,343 | 0.7% |
| Hispanic or Latino | 60,808 | 19.1% |
| Native / Alaskan | 2,535 | 0.8% |
| White / Caucasian | 211,056 | 66.4% |
| Two or more Races | 34,658 | 10.9% |
| Some other Race | 18,716 | 5.9% |
| Total | 318,063 | 100.0% |
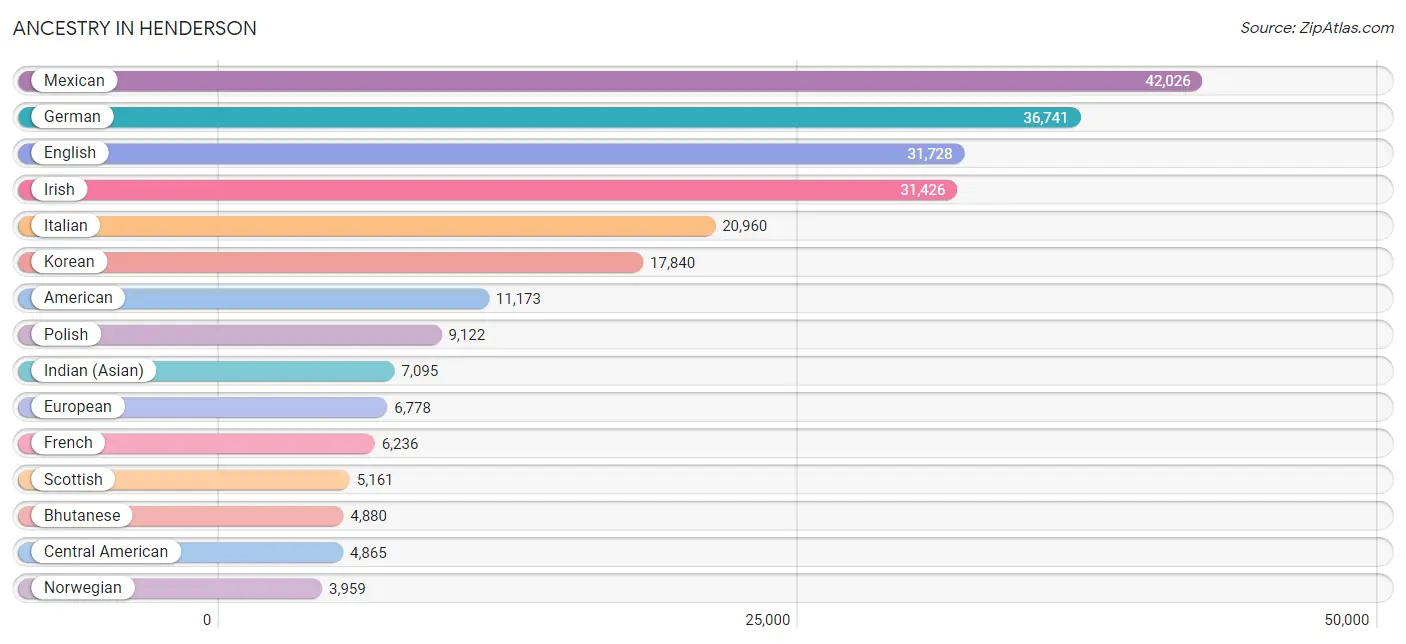
Ancestry in Henderson
The most populous ancestries reported in Henderson are Mexican (42,026 | 13.2%), German (36,741 | 11.6%), English (31,728 | 10.0%), Irish (31,426 | 9.9%), and Italian (20,960 | 6.6%), together accounting for 51.2% of all Henderson residents.
| Ancestry | # Population | % Population |
| Afghan | 15 | 0.0% |
| African | 2,714 | 0.9% |
| Alaska Native | 63 | 0.0% |
| Alaskan Athabascan | 3 | 0.0% |
| Albanian | 61 | 0.0% |
| American | 11,173 | 3.5% |
| Apache | 388 | 0.1% |
| Arab | 1,906 | 0.6% |
| Arapaho | 6 | 0.0% |
| Argentinean | 463 | 0.2% |
| Armenian | 621 | 0.2% |
| Assyrian / Chaldean / Syriac | 42 | 0.0% |
| Australian | 120 | 0.0% |
| Austrian | 552 | 0.2% |
| Bangladeshi | 373 | 0.1% |
| Basque | 83 | 0.0% |
| Belgian | 305 | 0.1% |
| Belizean | 26 | 0.0% |
| Bhutanese | 4,880 | 1.5% |
| Blackfeet | 123 | 0.0% |
| Bolivian | 474 | 0.2% |
| Brazilian | 274 | 0.1% |
| British | 2,293 | 0.7% |
| British West Indian | 110 | 0.0% |
| Bulgarian | 263 | 0.1% |
| Burmese | 3,308 | 1.0% |
| Cajun | 66 | 0.0% |
| Cambodian | 10 | 0.0% |
| Canadian | 995 | 0.3% |
| Cape Verdean | 18 | 0.0% |
| Celtic | 20 | 0.0% |
| Central American | 4,865 | 1.5% |
| Central American Indian | 545 | 0.2% |
| Cherokee | 999 | 0.3% |
| Cheyenne | 4 | 0.0% |
| Chickasaw | 142 | 0.0% |
| Chilean | 153 | 0.1% |
| Chippewa | 80 | 0.0% |
| Choctaw | 179 | 0.1% |
| Colombian | 949 | 0.3% |
| Colville | 15 | 0.0% |
| Costa Rican | 280 | 0.1% |
| Creek | 11 | 0.0% |
| Croatian | 624 | 0.2% |
| Cuban | 2,563 | 0.8% |
| Czech | 1,198 | 0.4% |
| Czechoslovakian | 318 | 0.1% |
| Danish | 2,173 | 0.7% |
| Dominican | 489 | 0.2% |
| Dutch | 3,234 | 1.0% |
| Dutch West Indian | 41 | 0.0% |
| Eastern European | 1,060 | 0.3% |
| Ecuadorian | 410 | 0.1% |
| Egyptian | 417 | 0.1% |
| English | 31,728 | 10.0% |
| Estonian | 23 | 0.0% |
| Ethiopian | 11 | 0.0% |
| European | 6,778 | 2.1% |
| Filipino | 646 | 0.2% |
| Finnish | 483 | 0.2% |
| French | 6,236 | 2.0% |
| French American Indian | 14 | 0.0% |
| French Canadian | 1,636 | 0.5% |
| German | 36,741 | 11.6% |
| German Russian | 19 | 0.0% |
| Ghanaian | 48 | 0.0% |
| Greek | 1,508 | 0.5% |
| Guamanian / Chamorro | 486 | 0.2% |
| Guatemalan | 1,249 | 0.4% |
| Haitian | 200 | 0.1% |
| Honduran | 393 | 0.1% |
| Hopi | 23 | 0.0% |
| Hungarian | 1,129 | 0.4% |
| Icelander | 142 | 0.0% |
| Indian (Asian) | 7,095 | 2.2% |
| Indonesian | 9 | 0.0% |
| Iranian | 269 | 0.1% |
| Iraqi | 184 | 0.1% |
| Irish | 31,426 | 9.9% |
| Iroquois | 67 | 0.0% |
| Israeli | 311 | 0.1% |
| Italian | 20,960 | 6.6% |
| Jamaican | 327 | 0.1% |
| Japanese | 132 | 0.0% |
| Jordanian | 12 | 0.0% |
| Kenyan | 48 | 0.0% |
| Kiowa | 7 | 0.0% |
| Korean | 17,840 | 5.6% |
| Laotian | 356 | 0.1% |
| Latvian | 128 | 0.0% |
| Lebanese | 738 | 0.2% |
| Liberian | 64 | 0.0% |
| Lithuanian | 790 | 0.3% |
| Luxembourger | 116 | 0.0% |
| Macedonian | 34 | 0.0% |
| Malaysian | 319 | 0.1% |
| Maltese | 24 | 0.0% |
| Mexican | 42,026 | 13.2% |
| Mexican American Indian | 732 | 0.2% |
| Mongolian | 117 | 0.0% |
| Moroccan | 141 | 0.0% |
| Native Hawaiian | 3,394 | 1.1% |
| Navajo | 308 | 0.1% |
| Nepalese | 217 | 0.1% |
| New Zealander | 27 | 0.0% |
| Nicaraguan | 314 | 0.1% |
| Nigerian | 307 | 0.1% |
| Northern European | 371 | 0.1% |
| Norwegian | 3,959 | 1.2% |
| Osage | 37 | 0.0% |
| Paiute | 332 | 0.1% |
| Pakistani | 1,487 | 0.5% |
| Palestinian | 94 | 0.0% |
| Panamanian | 406 | 0.1% |
| Paraguayan | 60 | 0.0% |
| Pennsylvania German | 72 | 0.0% |
| Peruvian | 673 | 0.2% |
| Polish | 9,122 | 2.9% |
| Portuguese | 1,963 | 0.6% |
| Pueblo | 88 | 0.0% |
| Puerto Rican | 2,675 | 0.8% |
| Puget Sound Salish | 6 | 0.0% |
| Romanian | 978 | 0.3% |
| Russian | 3,104 | 1.0% |
| Salvadoran | 2,102 | 0.7% |
| Samoan | 576 | 0.2% |
| Scandinavian | 1,561 | 0.5% |
| Scotch-Irish | 2,037 | 0.6% |
| Scottish | 5,161 | 1.6% |
| Senegalese | 10 | 0.0% |
| Serbian | 372 | 0.1% |
| Shoshone | 8 | 0.0% |
| Sioux | 140 | 0.0% |
| Slavic | 69 | 0.0% |
| Slovak | 526 | 0.2% |
| Slovene | 56 | 0.0% |
| Somali | 37 | 0.0% |
| South African | 120 | 0.0% |
| South American | 3,786 | 1.2% |
| South American Indian | 105 | 0.0% |
| Spaniard | 1,645 | 0.5% |
| Spanish | 984 | 0.3% |
| Spanish American | 12 | 0.0% |
| Spanish American Indian | 11 | 0.0% |
| Sri Lankan | 1,766 | 0.6% |
| Subsaharan African | 3,517 | 1.1% |
| Swedish | 3,898 | 1.2% |
| Swiss | 1,490 | 0.5% |
| Syrian | 297 | 0.1% |
| Thai | 3,832 | 1.2% |
| Tlingit-Haida | 29 | 0.0% |
| Tohono O'Odham | 13 | 0.0% |
| Tongan | 113 | 0.0% |
| Trinidadian and Tobagonian | 143 | 0.0% |
| Turkish | 79 | 0.0% |
| U.S. Virgin Islander | 12 | 0.0% |
| Ukrainian | 697 | 0.2% |
| Uruguayan | 20 | 0.0% |
| Ute | 17 | 0.0% |
| Venezuelan | 505 | 0.2% |
| Vietnamese | 25 | 0.0% |
| Welsh | 1,922 | 0.6% |
| West Indian | 22 | 0.0% |
| Yaqui | 10 | 0.0% |
| Yugoslavian | 204 | 0.1% |
| Yuman | 47 | 0.0% |
| Zimbabwean | 57 | 0.0% | View All 167 Rows |
Immigrants in Henderson
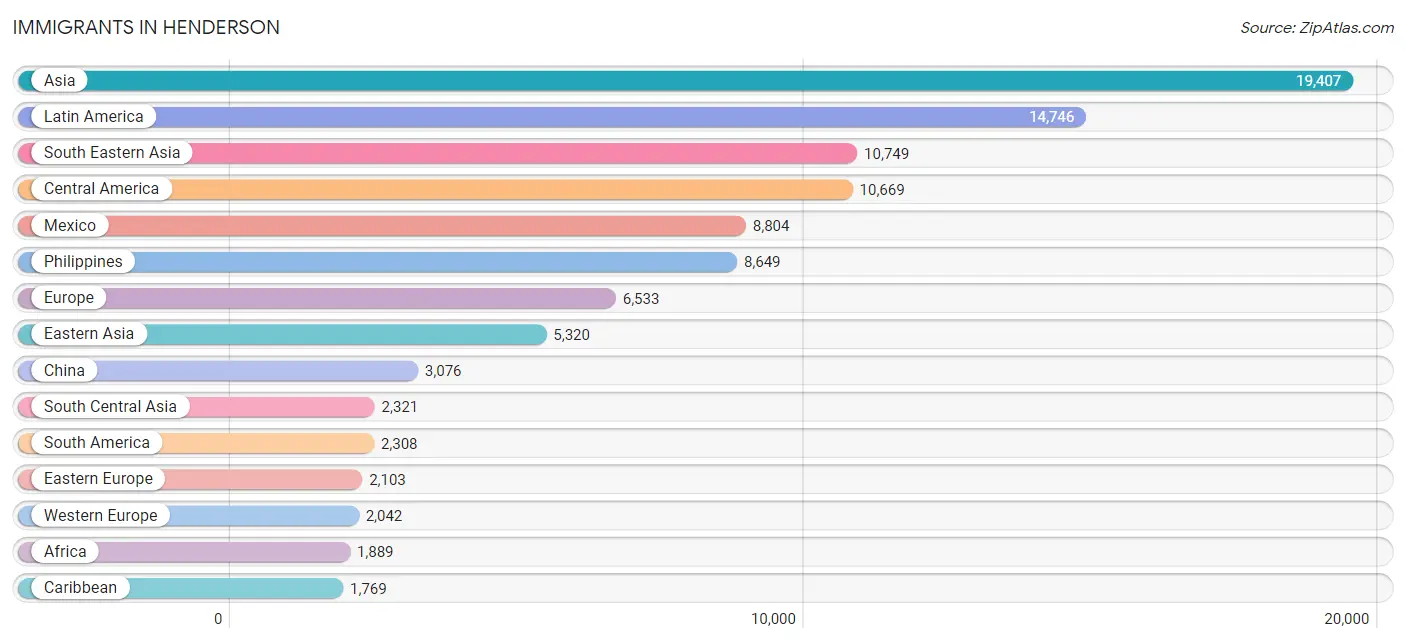
The most numerous immigrant groups reported in Henderson came from Asia (19,407 | 6.1%), Latin America (14,746 | 4.6%), South Eastern Asia (10,749 | 3.4%), Central America (10,669 | 3.4%), and Mexico (8,804 | 2.8%), together accounting for 20.2% of all Henderson residents.
| Immigration Origin | # Population | % Population |
| Africa | 1,889 | 0.6% |
| Albania | 62 | 0.0% |
| Argentina | 385 | 0.1% |
| Armenia | 44 | 0.0% |
| Asia | 19,407 | 6.1% |
| Australia | 114 | 0.0% |
| Austria | 58 | 0.0% |
| Azores | 17 | 0.0% |
| Bahamas | 6 | 0.0% |
| Bangladesh | 50 | 0.0% |
| Belarus | 29 | 0.0% |
| Belgium | 110 | 0.0% |
| Bolivia | 241 | 0.1% |
| Bosnia and Herzegovina | 9 | 0.0% |
| Brazil | 487 | 0.2% |
| Bulgaria | 208 | 0.1% |
| Cambodia | 73 | 0.0% |
| Cameroon | 63 | 0.0% |
| Canada | 1,680 | 0.5% |
| Caribbean | 1,769 | 0.6% |
| Central America | 10,669 | 3.4% |
| Chile | 70 | 0.0% |
| China | 3,076 | 1.0% |
| Colombia | 247 | 0.1% |
| Costa Rica | 108 | 0.0% |
| Croatia | 21 | 0.0% |
| Cuba | 1,198 | 0.4% |
| Czechoslovakia | 166 | 0.1% |
| Denmark | 95 | 0.0% |
| Dominica | 19 | 0.0% |
| Dominican Republic | 48 | 0.0% |
| Eastern Africa | 266 | 0.1% |
| Eastern Asia | 5,320 | 1.7% |
| Eastern Europe | 2,103 | 0.7% |
| Ecuador | 215 | 0.1% |
| Egypt | 271 | 0.1% |
| El Salvador | 858 | 0.3% |
| England | 652 | 0.2% |
| Ethiopia | 68 | 0.0% |
| Europe | 6,533 | 2.1% |
| Fiji | 215 | 0.1% |
| France | 500 | 0.2% |
| Germany | 1,026 | 0.3% |
| Ghana | 36 | 0.0% |
| Greece | 86 | 0.0% |
| Grenada | 18 | 0.0% |
| Guatemala | 346 | 0.1% |
| Guyana | 10 | 0.0% |
| Haiti | 136 | 0.0% |
| Honduras | 302 | 0.1% |
| Hong Kong | 256 | 0.1% |
| Hungary | 60 | 0.0% |
| India | 1,742 | 0.5% |
| Indonesia | 147 | 0.1% |
| Iran | 303 | 0.1% |
| Iraq | 175 | 0.1% |
| Ireland | 40 | 0.0% |
| Israel | 287 | 0.1% |
| Italy | 411 | 0.1% |
| Jamaica | 214 | 0.1% |
| Japan | 842 | 0.3% |
| Jordan | 12 | 0.0% |
| Kenya | 120 | 0.0% |
| Korea | 1,402 | 0.4% |
| Laos | 208 | 0.1% |
| Latin America | 14,746 | 4.6% |
| Latvia | 36 | 0.0% |
| Lebanon | 242 | 0.1% |
| Liberia | 94 | 0.0% |
| Lithuania | 44 | 0.0% |
| Malaysia | 184 | 0.1% |
| Mexico | 8,804 | 2.8% |
| Middle Africa | 80 | 0.0% |
| Moldova | 4 | 0.0% |
| Morocco | 165 | 0.1% |
| Nepal | 16 | 0.0% |
| Netherlands | 224 | 0.1% |
| Nicaragua | 88 | 0.0% |
| Nigeria | 658 | 0.2% |
| North Macedonia | 27 | 0.0% |
| Northern Africa | 436 | 0.1% |
| Northern Europe | 1,654 | 0.5% |
| Norway | 31 | 0.0% |
| Oceania | 503 | 0.2% |
| Pakistan | 119 | 0.0% |
| Panama | 148 | 0.1% |
| Peru | 460 | 0.1% |
| Philippines | 8,649 | 2.7% |
| Poland | 337 | 0.1% |
| Portugal | 122 | 0.0% |
| Romania | 495 | 0.2% |
| Russia | 237 | 0.1% |
| Saudi Arabia | 32 | 0.0% |
| Scotland | 209 | 0.1% |
| Serbia | 50 | 0.0% |
| Singapore | 147 | 0.1% |
| Somalia | 57 | 0.0% |
| South Africa | 167 | 0.1% |
| South America | 2,308 | 0.7% |
| South Central Asia | 2,321 | 0.7% |
| South Eastern Asia | 10,749 | 3.4% |
| Southern Europe | 734 | 0.2% |
| Spain | 115 | 0.0% |
| Sri Lanka | 64 | 0.0% |
| Sweden | 134 | 0.0% |
| Switzerland | 100 | 0.0% |
| Syria | 44 | 0.0% |
| Taiwan | 974 | 0.3% |
| Thailand | 693 | 0.2% |
| Trinidad and Tobago | 106 | 0.0% |
| Turkey | 97 | 0.0% |
| Uganda | 5 | 0.0% |
| Ukraine | 164 | 0.1% |
| Uzbekistan | 7 | 0.0% |
| Venezuela | 152 | 0.1% |
| Vietnam | 639 | 0.2% |
| West Indies | 12 | 0.0% |
| Western Africa | 899 | 0.3% |
| Western Asia | 992 | 0.3% |
| Western Europe | 2,042 | 0.6% |
| Zimbabwe | 16 | 0.0% | View All 121 Rows |
Sex and Age in Henderson
Sex and Age in Henderson
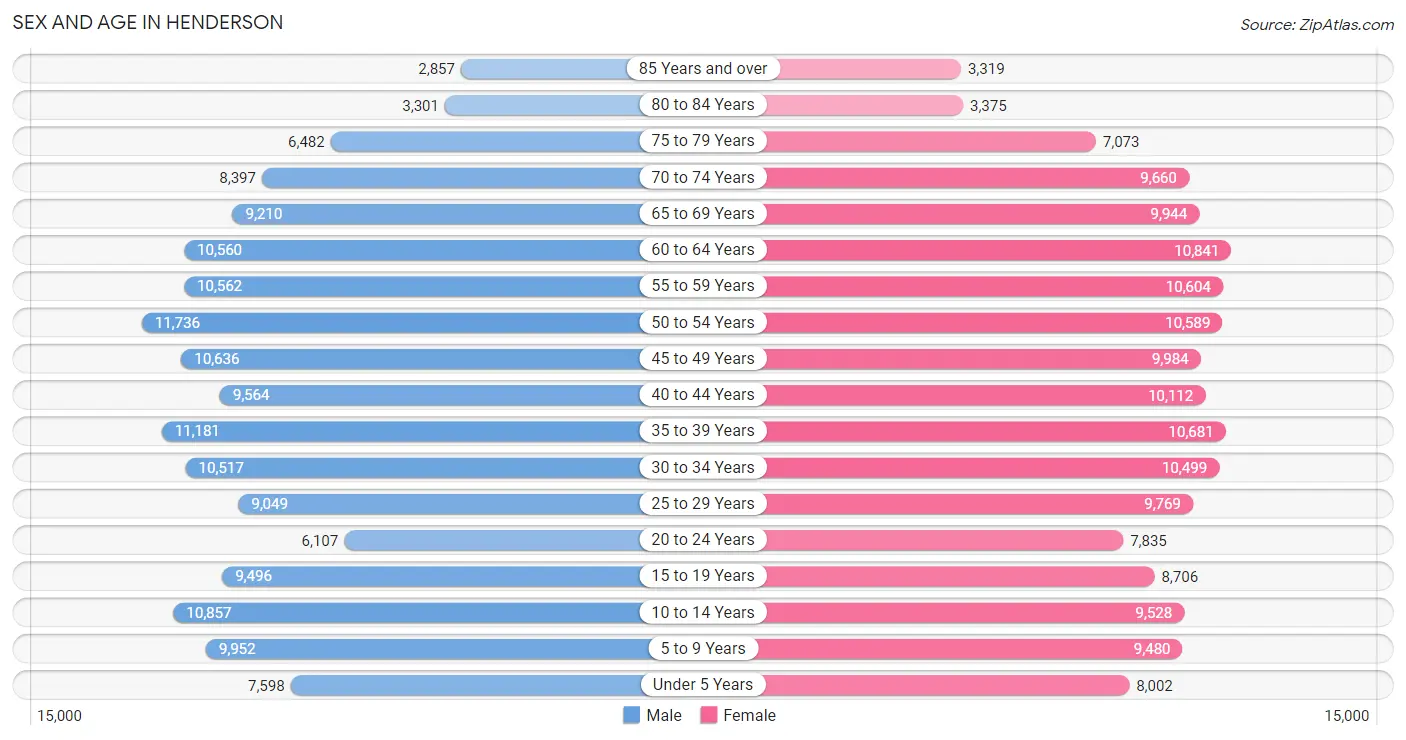
The most populous age groups in Henderson are 50 to 54 Years (11,736 | 7.4%) for men and 60 to 64 Years (10,841 | 6.8%) for women.
| Age Bracket | Male | Female |
| Under 5 Years | 7,598 (4.8%) | 8,002 (5.0%) |
| 5 to 9 Years | 9,952 (6.3%) | 9,480 (5.9%) |
| 10 to 14 Years | 10,857 (6.9%) | 9,528 (5.9%) |
| 15 to 19 Years | 9,496 (6.0%) | 8,706 (5.4%) |
| 20 to 24 Years | 6,107 (3.9%) | 7,835 (4.9%) |
| 25 to 29 Years | 9,049 (5.7%) | 9,769 (6.1%) |
| 30 to 34 Years | 10,517 (6.7%) | 10,499 (6.6%) |
| 35 to 39 Years | 11,181 (7.1%) | 10,681 (6.7%) |
| 40 to 44 Years | 9,564 (6.0%) | 10,112 (6.3%) |
| 45 to 49 Years | 10,636 (6.7%) | 9,984 (6.2%) |
| 50 to 54 Years | 11,736 (7.4%) | 10,589 (6.6%) |
| 55 to 59 Years | 10,562 (6.7%) | 10,604 (6.6%) |
| 60 to 64 Years | 10,560 (6.7%) | 10,841 (6.8%) |
| 65 to 69 Years | 9,210 (5.8%) | 9,944 (6.2%) |
| 70 to 74 Years | 8,397 (5.3%) | 9,660 (6.0%) |
| 75 to 79 Years | 6,482 (4.1%) | 7,073 (4.4%) |
| 80 to 84 Years | 3,301 (2.1%) | 3,375 (2.1%) |
| 85 Years and over | 2,857 (1.8%) | 3,319 (2.1%) |
| Total | 158,062 (100.0%) | 160,001 (100.0%) |
Families and Households in Henderson
Median Family Size in Henderson
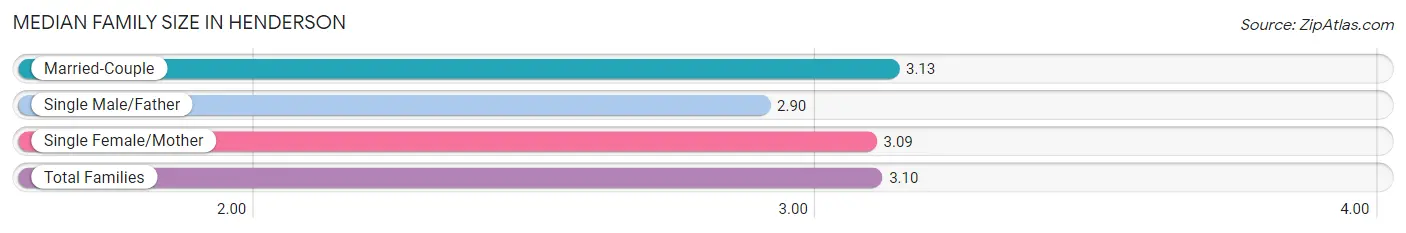
The median family size in Henderson is 3.10 persons per family, with married-couple families (61,774 | 75.4%) accounting for the largest median family size of 3.13 persons per family. On the other hand, single male/father families (6,927 | 8.5%) represent the smallest median family size with 2.90 persons per family.
| Family Type | # Families | Family Size |
| Married-Couple | 61,774 (75.4%) | 3.13 |
| Single Male/Father | 6,927 (8.5%) | 2.90 |
| Single Female/Mother | 13,248 (16.2%) | 3.09 |
| Total Families | 81,949 (100.0%) | 3.10 |
Median Household Size in Henderson
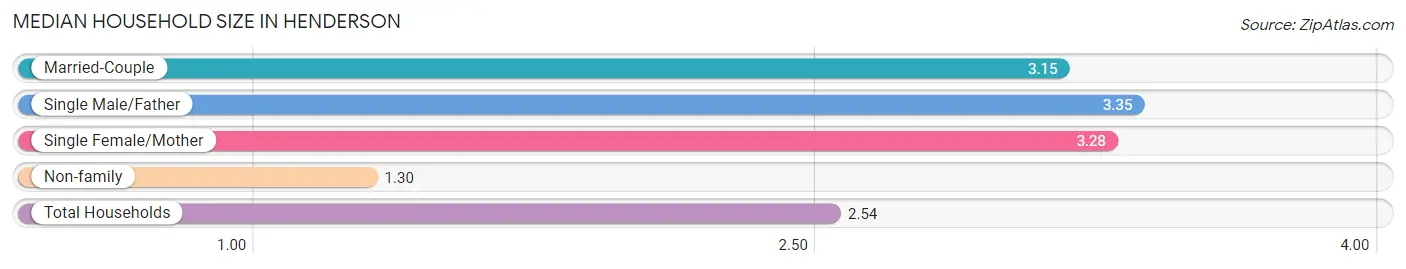
The median household size in Henderson is 2.54 persons per household, with single male/father households (6,927 | 5.6%) accounting for the largest median household size of 3.35 persons per household. non-family households (42,677 | 34.2%) represent the smallest median household size with 1.30 persons per household.
| Household Type | # Households | Household Size |
| Married-Couple | 61,774 (49.6%) | 3.15 |
| Single Male/Father | 6,927 (5.6%) | 3.35 |
| Single Female/Mother | 13,248 (10.6%) | 3.28 |
| Non-family | 42,677 (34.2%) | 1.30 |
| Total Households | 124,626 (100.0%) | 2.54 |
Household Size by Marriage Status in Henderson
Out of a total of 124,626 households in Henderson, 81,949 (65.8%) are family households, while 42,677 (34.2%) are nonfamily households. The most numerous type of family households are 2-person households, comprising 38,182, and the most common type of nonfamily households are 1-person households, comprising 33,341.
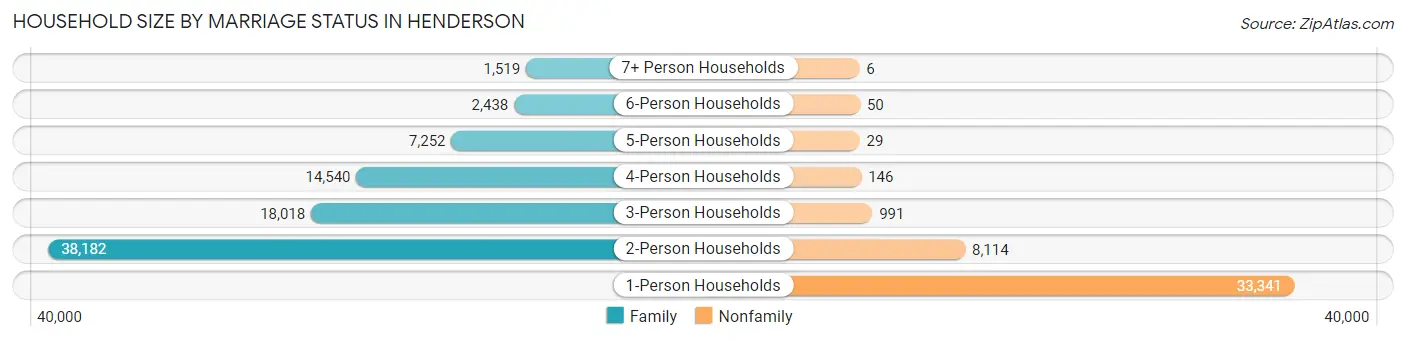
| Household Size | Family Households | Nonfamily Households |
| 1-Person Households | - | 33,341 (26.8%) |
| 2-Person Households | 38,182 (30.6%) | 8,114 (6.5%) |
| 3-Person Households | 18,018 (14.5%) | 991 (0.8%) |
| 4-Person Households | 14,540 (11.7%) | 146 (0.1%) |
| 5-Person Households | 7,252 (5.8%) | 29 (0.0%) |
| 6-Person Households | 2,438 (2.0%) | 50 (0.0%) |
| 7+ Person Households | 1,519 (1.2%) | 6 (0.0%) |
| Total | 81,949 (65.8%) | 42,677 (34.2%) |
Female Fertility in Henderson
Fertility by Age in Henderson
Average fertility rate in Henderson is 48.0 births per 1,000 women. Women in the age bracket of 20 to 34 years have the highest fertility rate with 77.0 births per 1,000 women. Women in the age bracket of 20 to 34 years acount for 64.7% of all women with births.
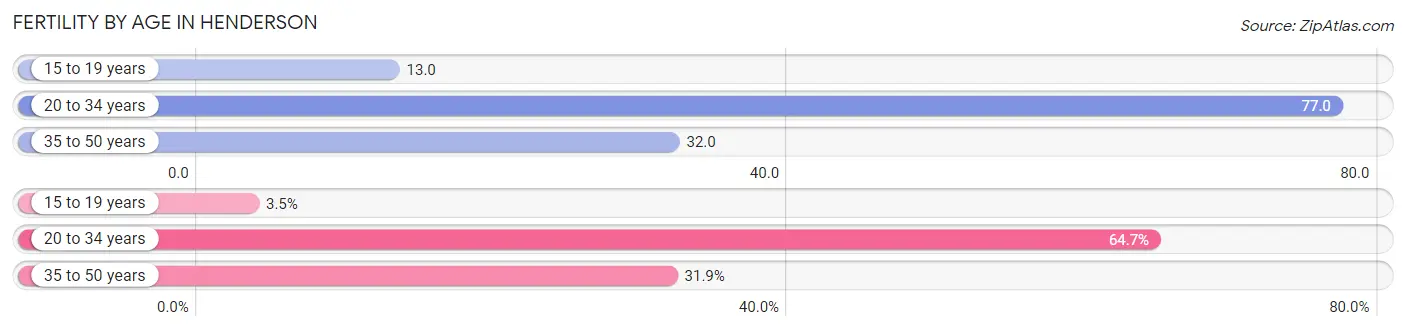
| Age Bracket | Women with Births | Births / 1,000 Women |
| 15 to 19 years | 116 (3.5%) | 13.0 |
| 20 to 34 years | 2,165 (64.7%) | 77.0 |
| 35 to 50 years | 1,067 (31.9%) | 32.0 |
| Total | 3,348 (100.0%) | 48.0 |
Fertility by Age by Marriage Status in Henderson
67.2% of women with births (3,348) in Henderson are married. The highest percentage of unmarried women with births falls into 15 to 19 years age bracket with 100.0% of them unmarried at the time of birth, while the lowest percentage of unmarried women with births belong to 35 to 50 years age bracket with 26.8% of them unmarried.
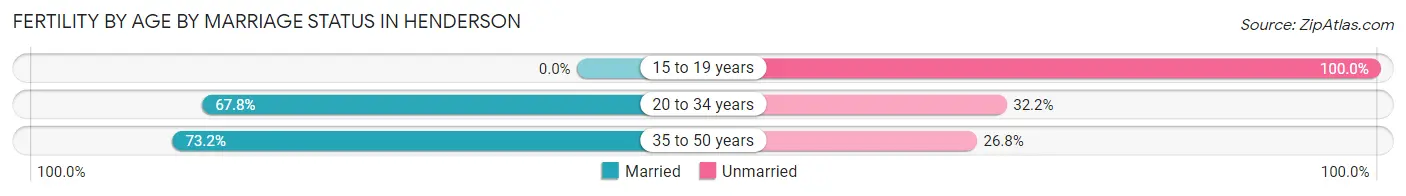
| Age Bracket | Married | Unmarried |
| 15 to 19 years | 0 (0.0%) | 116 (100.0%) |
| 20 to 34 years | 1,468 (67.8%) | 697 (32.2%) |
| 35 to 50 years | 781 (73.2%) | 286 (26.8%) |
| Total | 2,250 (67.2%) | 1,098 (32.8%) |
Fertility by Education in Henderson
Average fertility rate in Henderson is 48.0 births per 1,000 women. Women with the education attainment of bachelor's degree have the highest fertility rate of 66.0 births per 1,000 women, while women with the education attainment of less than high school have the lowest fertility at 29.0 births per 1,000 women. Women with the education attainment of college or associate's degree represent 32.1% of all women with births.
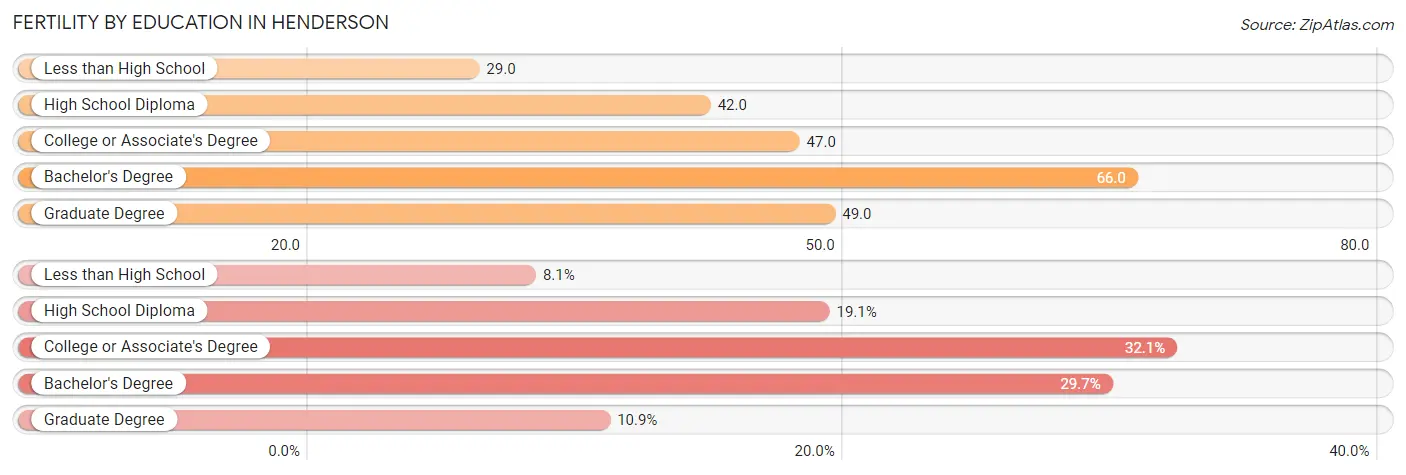
| Educational Attainment | Women with Births | Births / 1,000 Women |
| Less than High School | 272 (8.1%) | 29.0 |
| High School Diploma | 640 (19.1%) | 42.0 |
| College or Associate's Degree | 1,076 (32.1%) | 47.0 |
| Bachelor's Degree | 995 (29.7%) | 66.0 |
| Graduate Degree | 365 (10.9%) | 49.0 |
| Total | 3,348 (100.0%) | 48.0 |
Fertility by Education by Marriage Status in Henderson
32.8% of women with births in Henderson are unmarried. Women with the educational attainment of graduate degree are most likely to be married with 95.3% of them married at childbirth, while women with the educational attainment of high school diploma are least likely to be married with 54.2% of them unmarried at childbirth.
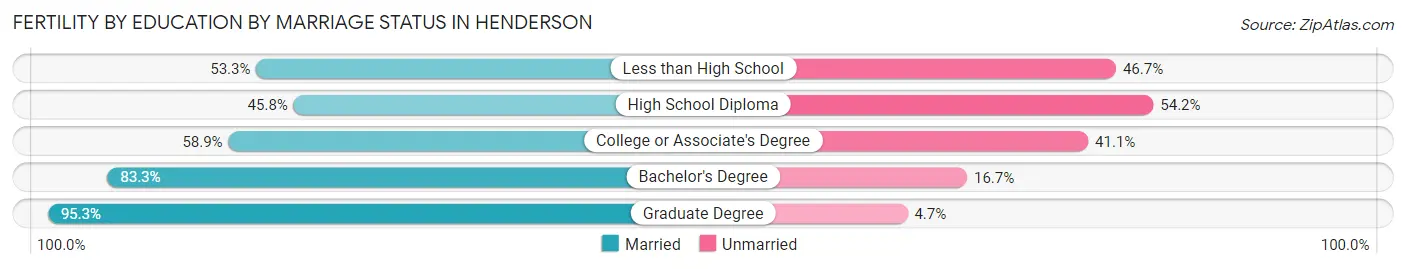
| Educational Attainment | Married | Unmarried |
| Less than High School | 145 (53.3%) | 127 (46.7%) |
| High School Diploma | 293 (45.8%) | 347 (54.2%) |
| College or Associate's Degree | 634 (58.9%) | 442 (41.1%) |
| Bachelor's Degree | 829 (83.3%) | 166 (16.7%) |
| Graduate Degree | 348 (95.3%) | 17 (4.7%) |
| Total | 2,250 (67.2%) | 1,098 (32.8%) |
Employment Characteristics in Henderson
Employment by Class of Employer in Henderson
Among the 144,136 employed individuals in Henderson, private company employees (101,425 | 70.4%), local government employees (12,636 | 8.8%), and self-employed (not incorporated) (8,369 | 5.8%) make up the most common classes of employment.
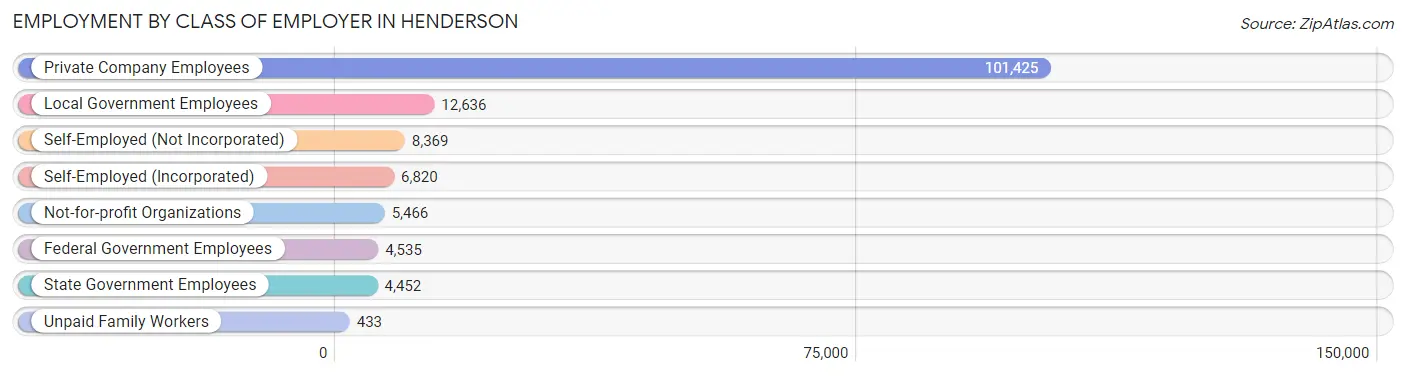
| Employer Class | # Employees | % Employees |
| Private Company Employees | 101,425 | 70.4% |
| Self-Employed (Incorporated) | 6,820 | 4.7% |
| Self-Employed (Not Incorporated) | 8,369 | 5.8% |
| Not-for-profit Organizations | 5,466 | 3.8% |
| Local Government Employees | 12,636 | 8.8% |
| State Government Employees | 4,452 | 3.1% |
| Federal Government Employees | 4,535 | 3.2% |
| Unpaid Family Workers | 433 | 0.3% |
| Total | 144,136 | 100.0% |
Employment Status by Age in Henderson
According to the labor force statistics for Henderson, out of the total population over 16 years of age (258,768), 61.1% or 158,107 individuals are in the labor force, with 7.0% or 11,067 of them unemployed. The age group with the highest labor force participation rate is 30 to 34 years, with 83.6% or 17,569 individuals in the labor force. Within the labor force, the 75 years and over age range has the highest percentage of unemployed individuals, with 25.7% or 407 of them being unemployed.
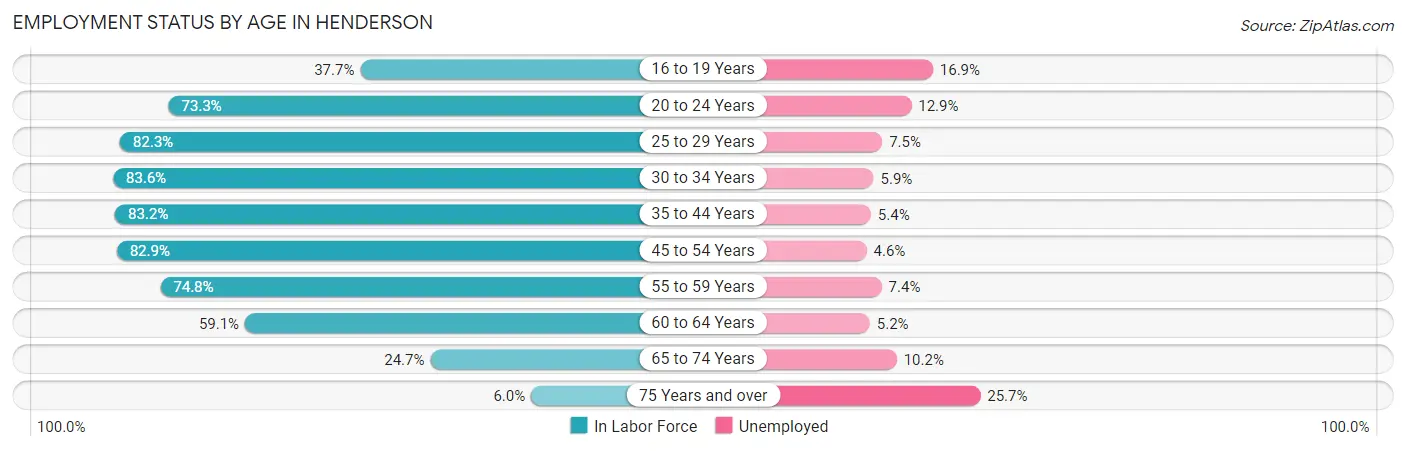
| Age Bracket | In Labor Force | Unemployed |
| 16 to 19 Years | 5,400 (37.7%) | 913 (16.9%) |
| 20 to 24 Years | 10,219 (73.3%) | 1,318 (12.9%) |
| 25 to 29 Years | 15,487 (82.3%) | 1,162 (7.5%) |
| 30 to 34 Years | 17,569 (83.6%) | 1,037 (5.9%) |
| 35 to 44 Years | 34,560 (83.2%) | 1,866 (5.4%) |
| 45 to 54 Years | 35,601 (82.9%) | 1,638 (4.6%) |
| 55 to 59 Years | 15,832 (74.8%) | 1,172 (7.4%) |
| 60 to 64 Years | 12,648 (59.1%) | 658 (5.2%) |
| 65 to 74 Years | 9,191 (24.7%) | 937 (10.2%) |
| 75 Years and over | 1,584 (6.0%) | 407 (25.7%) |
| Total | 158,107 (61.1%) | 11,067 (7.0%) |
Employment Status by Educational Attainment in Henderson
According to labor force statistics for Henderson, 78.9% of individuals (131,671) out of the total population between 25 and 64 years of age (166,884) are in the labor force, with 5.7% or 7,505 of them being unemployed. The group with the highest labor force participation rate are those with the educational attainment of bachelor's degree or higher, with 83.0% or 50,073 individuals in the labor force. Within the labor force, individuals with less than high school education have the highest percentage of unemployment, with 11.2% or 777 of them being unemployed.
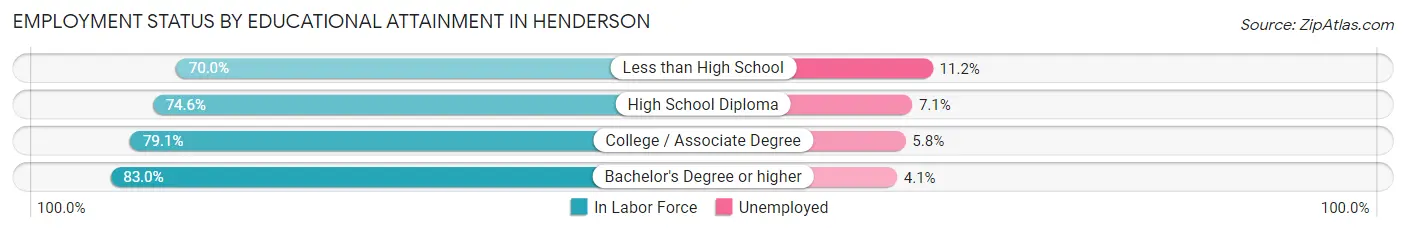
| Educational Attainment | In Labor Force | Unemployed |
| Less than High School | 6,934 (70.0%) | 1,109 (11.2%) |
| High School Diploma | 28,927 (74.6%) | 2,753 (7.1%) |
| College / Associate Degree | 45,778 (79.1%) | 3,357 (5.8%) |
| Bachelor's Degree or higher | 50,073 (83.0%) | 2,473 (4.1%) |
| Total | 131,671 (78.9%) | 9,512 (5.7%) |
Employment Occupations by Sex in Henderson
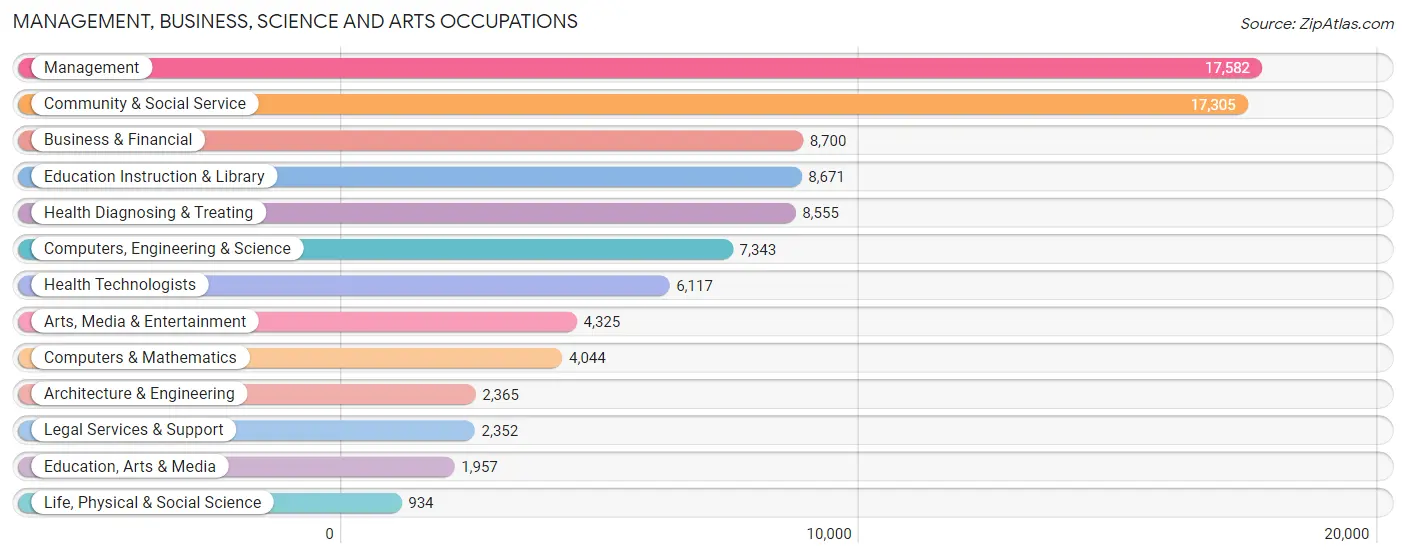
Management, Business, Science and Arts Occupations
The most common Management, Business, Science and Arts occupations in Henderson are Management (17,582 | 12.0%), Community & Social Service (17,305 | 11.8%), Business & Financial (8,700 | 6.0%), Education Instruction & Library (8,671 | 5.9%), and Health Diagnosing & Treating (8,555 | 5.9%).
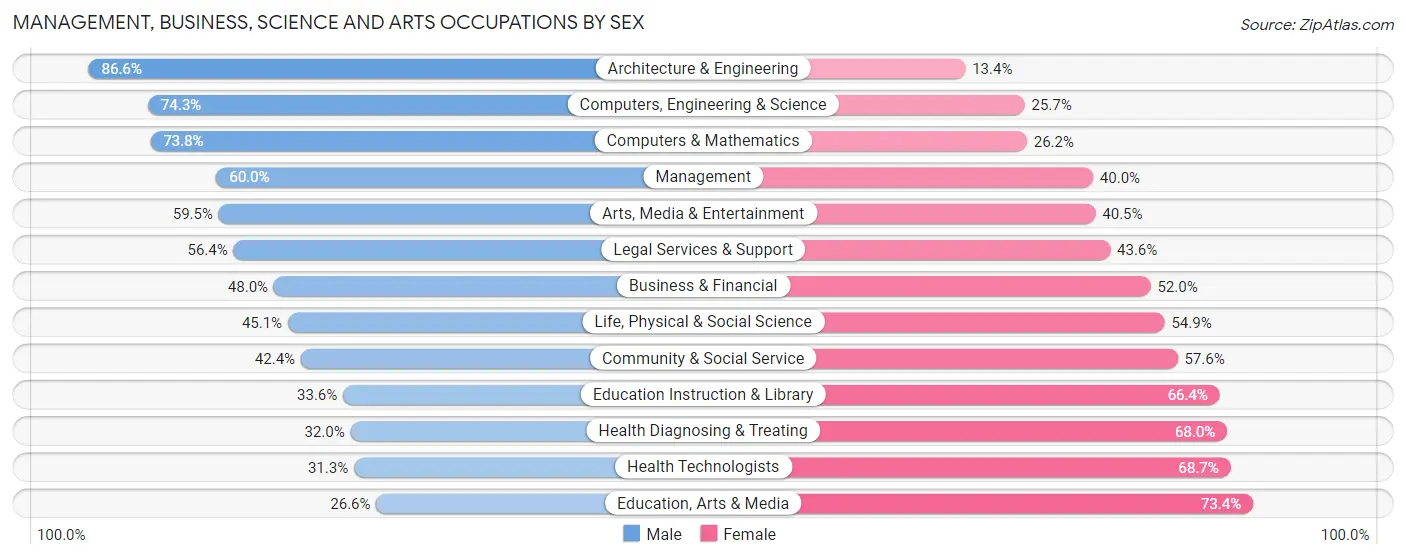
Management, Business, Science and Arts Occupations by Sex
Within the Management, Business, Science and Arts occupations in Henderson, the most male-oriented occupations are Architecture & Engineering (86.6%), Computers, Engineering & Science (74.3%), and Computers & Mathematics (73.8%), while the most female-oriented occupations are Education, Arts & Media (73.4%), Health Technologists (68.7%), and Health Diagnosing & Treating (68.0%).
| Occupation | Male | Female |
| Management | 10,549 (60.0%) | 7,033 (40.0%) |
| Business & Financial | 4,175 (48.0%) | 4,525 (52.0%) |
| Computers, Engineering & Science | 5,454 (74.3%) | 1,889 (25.7%) |
| Computers & Mathematics | 2,984 (73.8%) | 1,060 (26.2%) |
| Architecture & Engineering | 2,049 (86.6%) | 316 (13.4%) |
| Life, Physical & Social Science | 421 (45.1%) | 513 (54.9%) |
| Community & Social Service | 7,331 (42.4%) | 9,974 (57.6%) |
| Education, Arts & Media | 521 (26.6%) | 1,436 (73.4%) |
| Legal Services & Support | 1,327 (56.4%) | 1,025 (43.6%) |
| Education Instruction & Library | 2,910 (33.6%) | 5,761 (66.4%) |
| Arts, Media & Entertainment | 2,573 (59.5%) | 1,752 (40.5%) |
| Health Diagnosing & Treating | 2,738 (32.0%) | 5,817 (68.0%) |
| Health Technologists | 1,914 (31.3%) | 4,203 (68.7%) |
| Total (Category) | 30,247 (50.8%) | 29,238 (49.1%) |
| Total (Overall) | 78,055 (53.4%) | 68,033 (46.6%) |
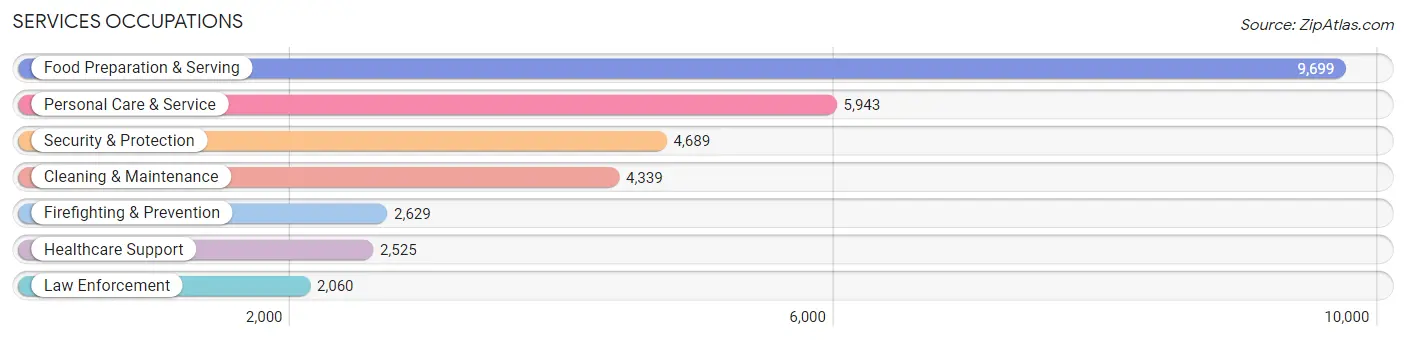
Services Occupations
The most common Services occupations in Henderson are Food Preparation & Serving (9,699 | 6.6%), Personal Care & Service (5,943 | 4.1%), Security & Protection (4,689 | 3.2%), Cleaning & Maintenance (4,339 | 3.0%), and Firefighting & Prevention (2,629 | 1.8%).
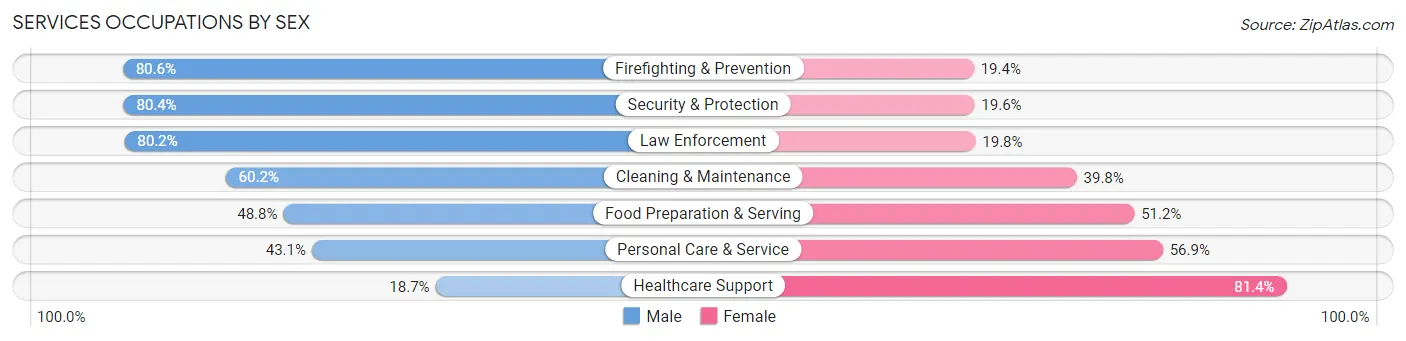
Services Occupations by Sex
Within the Services occupations in Henderson, the most male-oriented occupations are Firefighting & Prevention (80.6%), Security & Protection (80.4%), and Law Enforcement (80.2%), while the most female-oriented occupations are Healthcare Support (81.4%), Personal Care & Service (56.9%), and Food Preparation & Serving (51.2%).
| Occupation | Male | Female |
| Healthcare Support | 471 (18.6%) | 2,054 (81.4%) |
| Security & Protection | 3,771 (80.4%) | 918 (19.6%) |
| Firefighting & Prevention | 2,118 (80.6%) | 511 (19.4%) |
| Law Enforcement | 1,653 (80.2%) | 407 (19.8%) |
| Food Preparation & Serving | 4,731 (48.8%) | 4,968 (51.2%) |
| Cleaning & Maintenance | 2,611 (60.2%) | 1,728 (39.8%) |
| Personal Care & Service | 2,563 (43.1%) | 3,380 (56.9%) |
| Total (Category) | 14,147 (52.0%) | 13,048 (48.0%) |
| Total (Overall) | 78,055 (53.4%) | 68,033 (46.6%) |
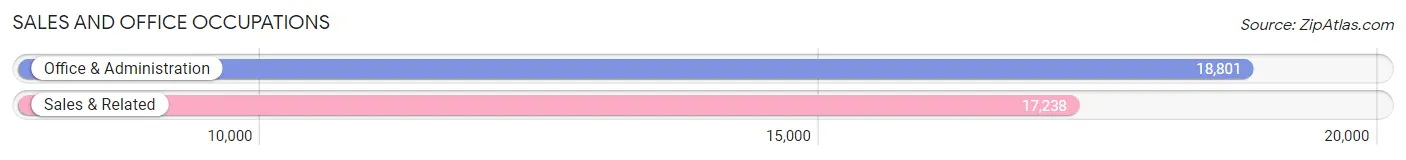
Sales and Office Occupations
The most common Sales and Office occupations in Henderson are Office & Administration (18,801 | 12.9%), and Sales & Related (17,238 | 11.8%).
Sales and Office Occupations by Sex
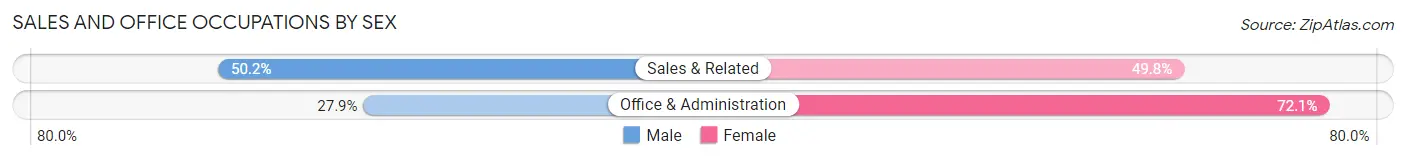
| Occupation | Male | Female |
| Sales & Related | 8,661 (50.2%) | 8,577 (49.8%) |
| Office & Administration | 5,241 (27.9%) | 13,560 (72.1%) |
| Total (Category) | 13,902 (38.6%) | 22,137 (61.4%) |
| Total (Overall) | 78,055 (53.4%) | 68,033 (46.6%) |
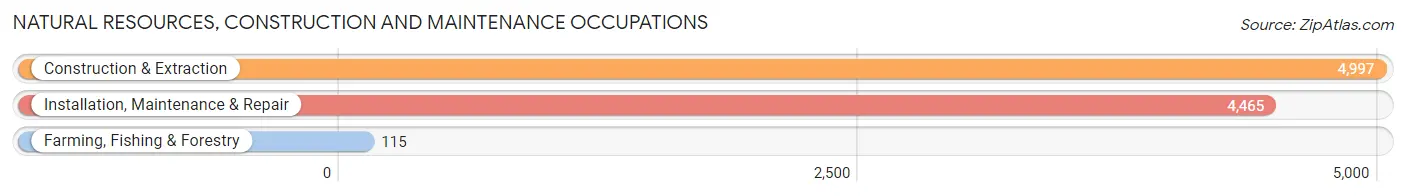
Natural Resources, Construction and Maintenance Occupations
The most common Natural Resources, Construction and Maintenance occupations in Henderson are Construction & Extraction (4,997 | 3.4%), Installation, Maintenance & Repair (4,465 | 3.1%), and Farming, Fishing & Forestry (115 | 0.1%).
Natural Resources, Construction and Maintenance Occupations by Sex
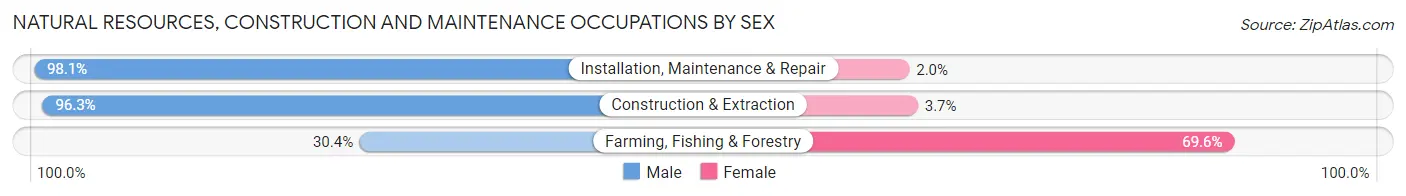
| Occupation | Male | Female |
| Farming, Fishing & Forestry | 35 (30.4%) | 80 (69.6%) |
| Construction & Extraction | 4,811 (96.3%) | 186 (3.7%) |
| Installation, Maintenance & Repair | 4,378 (98.1%) | 87 (1.9%) |
| Total (Category) | 9,224 (96.3%) | 353 (3.7%) |
| Total (Overall) | 78,055 (53.4%) | 68,033 (46.6%) |
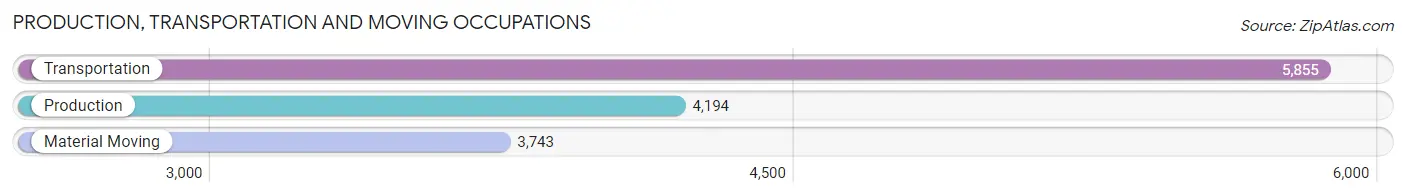
Production, Transportation and Moving Occupations
The most common Production, Transportation and Moving occupations in Henderson are Transportation (5,855 | 4.0%), Production (4,194 | 2.9%), and Material Moving (3,743 | 2.6%).
Production, Transportation and Moving Occupations by Sex
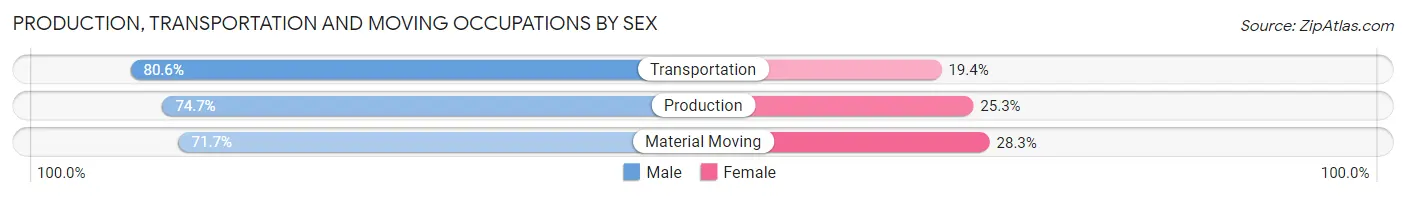
| Occupation | Male | Female |
| Production | 3,133 (74.7%) | 1,061 (25.3%) |
| Transportation | 4,717 (80.6%) | 1,138 (19.4%) |
| Material Moving | 2,685 (71.7%) | 1,058 (28.3%) |
| Total (Category) | 10,535 (76.4%) | 3,257 (23.6%) |
| Total (Overall) | 78,055 (53.4%) | 68,033 (46.6%) |
Employment Industries by Sex in Henderson
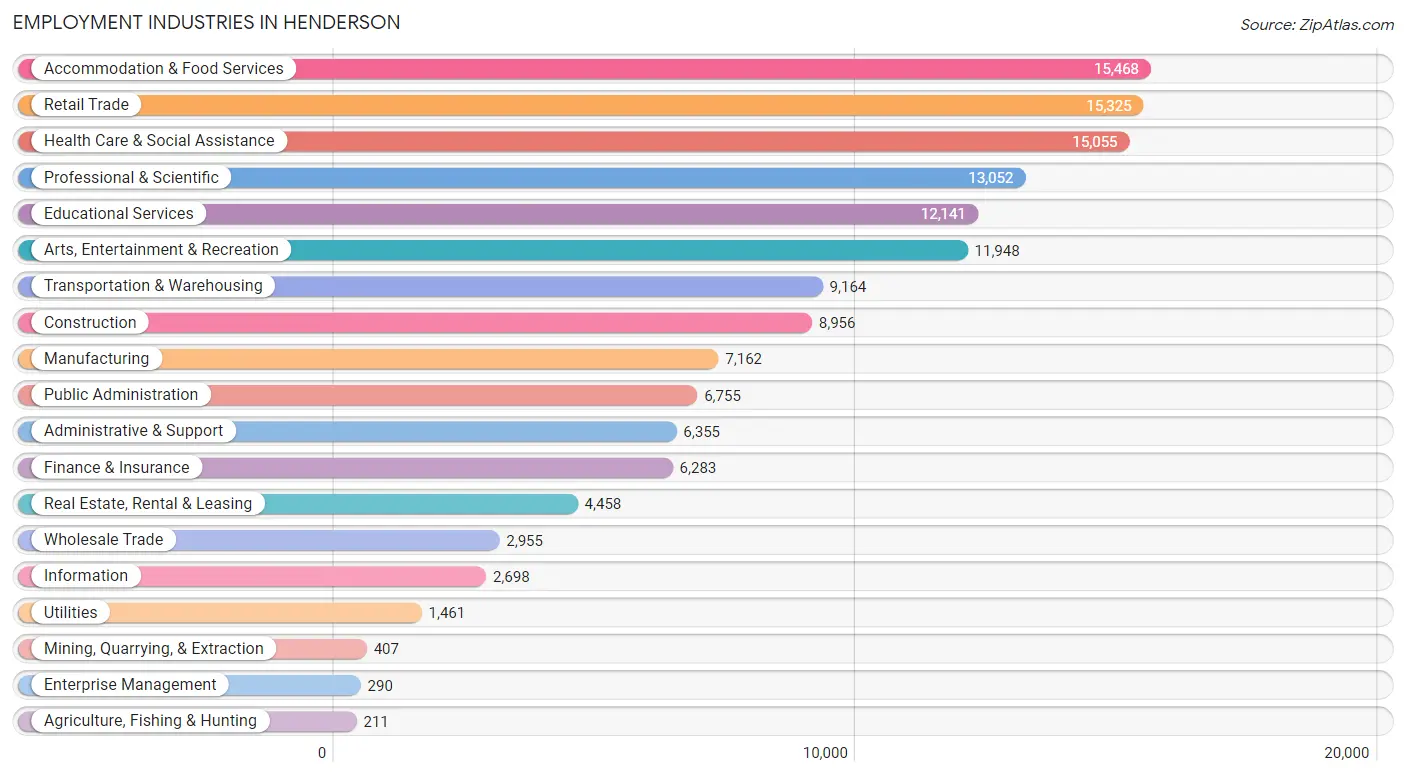
Employment Industries in Henderson
The major employment industries in Henderson include Accommodation & Food Services (15,468 | 10.6%), Retail Trade (15,325 | 10.5%), Health Care & Social Assistance (15,055 | 10.3%), Professional & Scientific (13,052 | 8.9%), and Educational Services (12,141 | 8.3%).
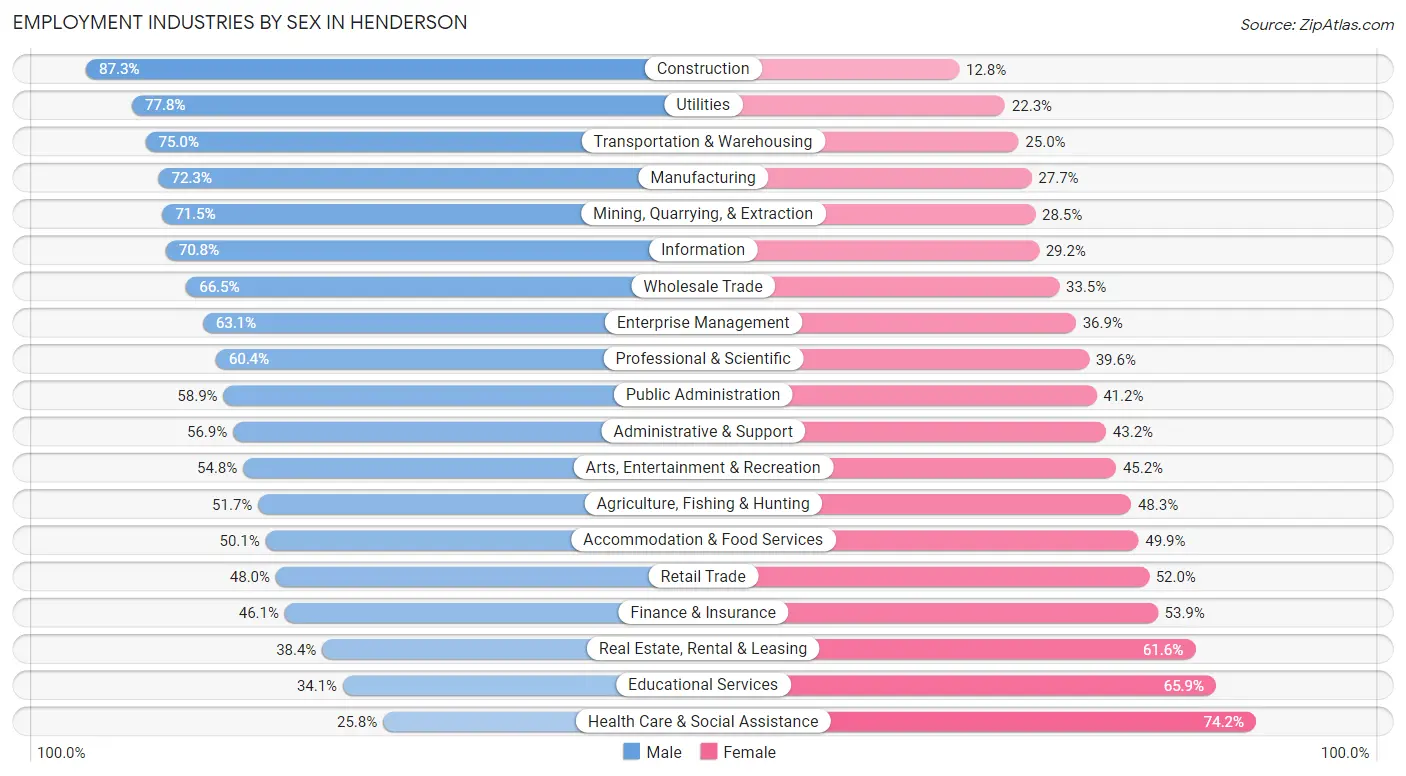
Employment Industries by Sex in Henderson
The Henderson industries that see more men than women are Construction (87.3%), Utilities (77.7%), and Transportation & Warehousing (75.0%), whereas the industries that tend to have a higher number of women are Health Care & Social Assistance (74.2%), Educational Services (65.9%), and Real Estate, Rental & Leasing (61.6%).
| Industry | Male | Female |
| Agriculture, Fishing & Hunting | 109 (51.7%) | 102 (48.3%) |
| Mining, Quarrying, & Extraction | 291 (71.5%) | 116 (28.5%) |
| Construction | 7,814 (87.3%) | 1,142 (12.8%) |
| Manufacturing | 5,176 (72.3%) | 1,986 (27.7%) |
| Wholesale Trade | 1,966 (66.5%) | 989 (33.5%) |
| Retail Trade | 7,355 (48.0%) | 7,970 (52.0%) |
| Transportation & Warehousing | 6,869 (75.0%) | 2,295 (25.0%) |
| Utilities | 1,136 (77.7%) | 325 (22.3%) |
| Information | 1,909 (70.8%) | 789 (29.2%) |
| Finance & Insurance | 2,899 (46.1%) | 3,384 (53.9%) |
| Real Estate, Rental & Leasing | 1,712 (38.4%) | 2,746 (61.6%) |
| Professional & Scientific | 7,884 (60.4%) | 5,168 (39.6%) |
| Enterprise Management | 183 (63.1%) | 107 (36.9%) |
| Administrative & Support | 3,613 (56.9%) | 2,742 (43.1%) |
| Educational Services | 4,141 (34.1%) | 8,000 (65.9%) |
| Health Care & Social Assistance | 3,886 (25.8%) | 11,169 (74.2%) |
| Arts, Entertainment & Recreation | 6,544 (54.8%) | 5,404 (45.2%) |
| Accommodation & Food Services | 7,754 (50.1%) | 7,714 (49.9%) |
| Public Administration | 3,975 (58.9%) | 2,780 (41.1%) |
| Total | 78,055 (53.4%) | 68,033 (46.6%) |
Education in Henderson
School Enrollment in Henderson
The most common levels of schooling among the 72,890 students in Henderson are middle school (16,725 | 23.0%), high school (16,179 | 22.2%), and elementary school (15,339 | 21.0%).
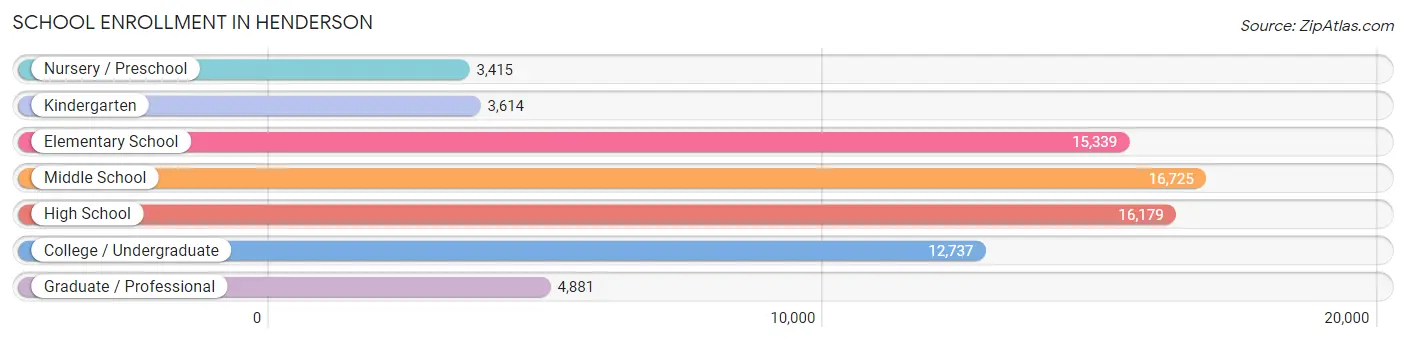
| School Level | # Students | % Students |
| Nursery / Preschool | 3,415 | 4.7% |
| Kindergarten | 3,614 | 5.0% |
| Elementary School | 15,339 | 21.0% |
| Middle School | 16,725 | 23.0% |
| High School | 16,179 | 22.2% |
| College / Undergraduate | 12,737 | 17.5% |
| Graduate / Professional | 4,881 | 6.7% |
| Total | 72,890 | 100.0% |
School Enrollment by Age by Funding Source in Henderson
Out of a total of 72,890 students who are enrolled in schools in Henderson, 10,277 (14.1%) attend a private institution, while the remaining 62,613 (85.9%) are enrolled in public schools. The age group of 3 to 4 year olds has the highest likelihood of being enrolled in private schools, with 1,152 (44.6% in the age bracket) enrolled. Conversely, the age group of 18 to 19 year olds has the lowest likelihood of being enrolled in a private school, with 3,279 (93.2% in the age bracket) attending a public institution.
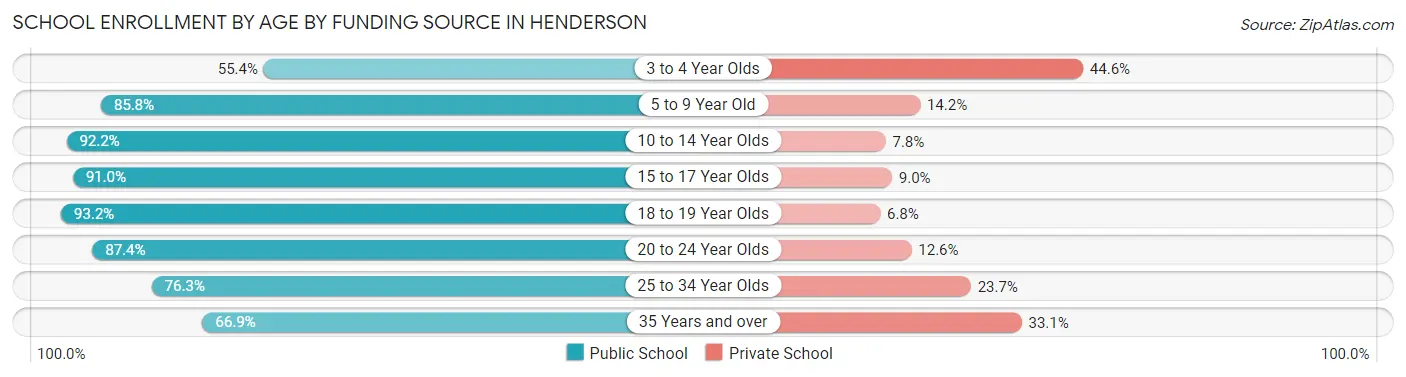
| Age Bracket | Public School | Private School |
| 3 to 4 Year Olds | 1,433 (55.4%) | 1,152 (44.6%) |
| 5 to 9 Year Old | 15,768 (85.8%) | 2,611 (14.2%) |
| 10 to 14 Year Olds | 18,473 (92.2%) | 1,563 (7.8%) |
| 15 to 17 Year Olds | 11,433 (91.0%) | 1,126 (9.0%) |
| 18 to 19 Year Olds | 3,279 (93.2%) | 238 (6.8%) |
| 20 to 24 Year Olds | 4,698 (87.4%) | 678 (12.6%) |
| 25 to 34 Year Olds | 4,171 (76.3%) | 1,293 (23.7%) |
| 35 Years and over | 3,326 (66.9%) | 1,648 (33.1%) |
| Total | 62,613 (85.9%) | 10,277 (14.1%) |
Educational Attainment by Field of Study in Henderson
Business (20,882 | 24.1%), education (9,495 | 11.0%), science & technology (9,013 | 10.4%), social sciences (6,723 | 7.8%), and arts & humanities (6,231 | 7.2%) are the most common fields of study among 86,628 individuals in Henderson who have obtained a bachelor's degree or higher.
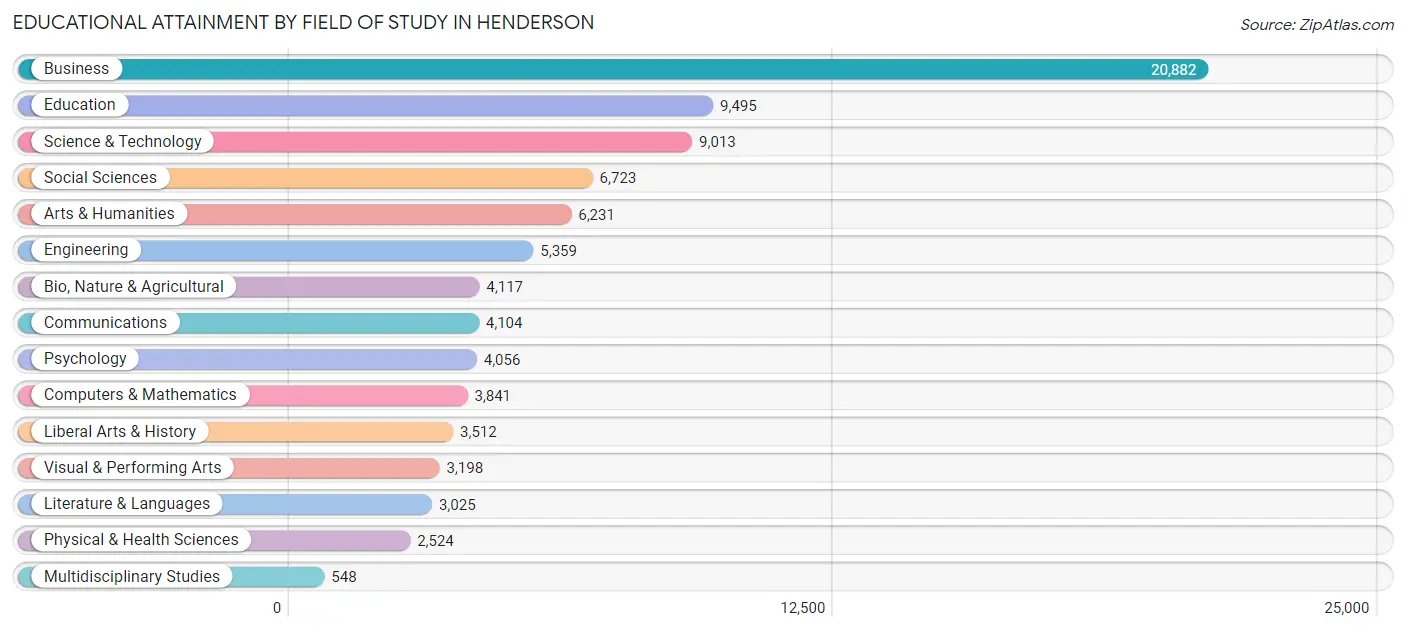
| Field of Study | # Graduates | % Graduates |
| Computers & Mathematics | 3,841 | 4.4% |
| Bio, Nature & Agricultural | 4,117 | 4.8% |
| Physical & Health Sciences | 2,524 | 2.9% |
| Psychology | 4,056 | 4.7% |
| Social Sciences | 6,723 | 7.8% |
| Engineering | 5,359 | 6.2% |
| Multidisciplinary Studies | 548 | 0.6% |
| Science & Technology | 9,013 | 10.4% |
| Business | 20,882 | 24.1% |
| Education | 9,495 | 11.0% |
| Literature & Languages | 3,025 | 3.5% |
| Liberal Arts & History | 3,512 | 4.1% |
| Visual & Performing Arts | 3,198 | 3.7% |
| Communications | 4,104 | 4.7% |
| Arts & Humanities | 6,231 | 7.2% |
| Total | 86,628 | 100.0% |
Transportation & Commute in Henderson
Vehicle Availability by Sex in Henderson
The most prevalent vehicle ownership categories in Henderson are males with 2 vehicles (34,168, accounting for 44.1%) and females with 2 vehicles (28,127, making up 51.3%).
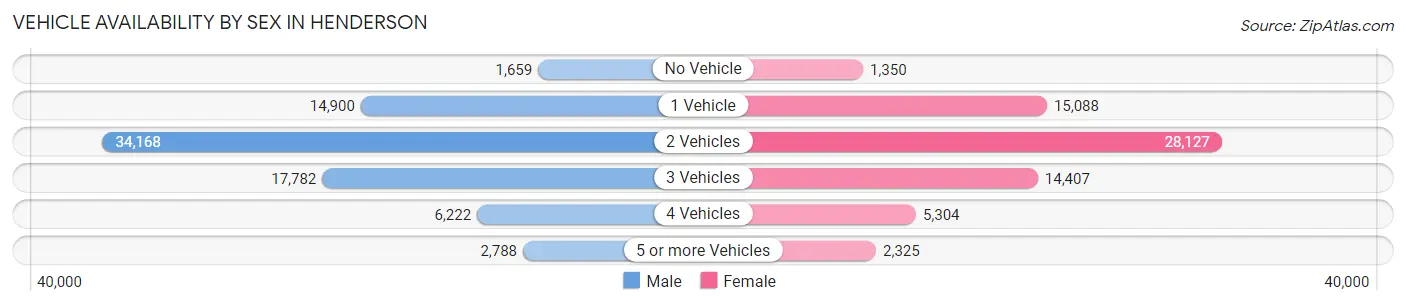
| Vehicles Available | Male | Female |
| No Vehicle | 1,659 (2.1%) | 1,350 (2.0%) |
| 1 Vehicle | 14,900 (19.2%) | 15,088 (22.7%) |
| 2 Vehicles | 34,168 (44.1%) | 28,127 (42.2%) |
| 3 Vehicles | 17,782 (22.9%) | 14,407 (21.6%) |
| 4 Vehicles | 6,222 (8.0%) | 5,304 (8.0%) |
| 5 or more Vehicles | 2,788 (3.6%) | 2,325 (3.5%) |
| Total | 77,519 (100.0%) | 66,601 (100.0%) |
Commute Time in Henderson
The most frequently occuring commute durations in Henderson are 20 to 24 minutes (22,475 commuters, 18.1%), 30 to 34 minutes (21,574 commuters, 17.4%), and 15 to 19 minutes (20,264 commuters, 16.3%).
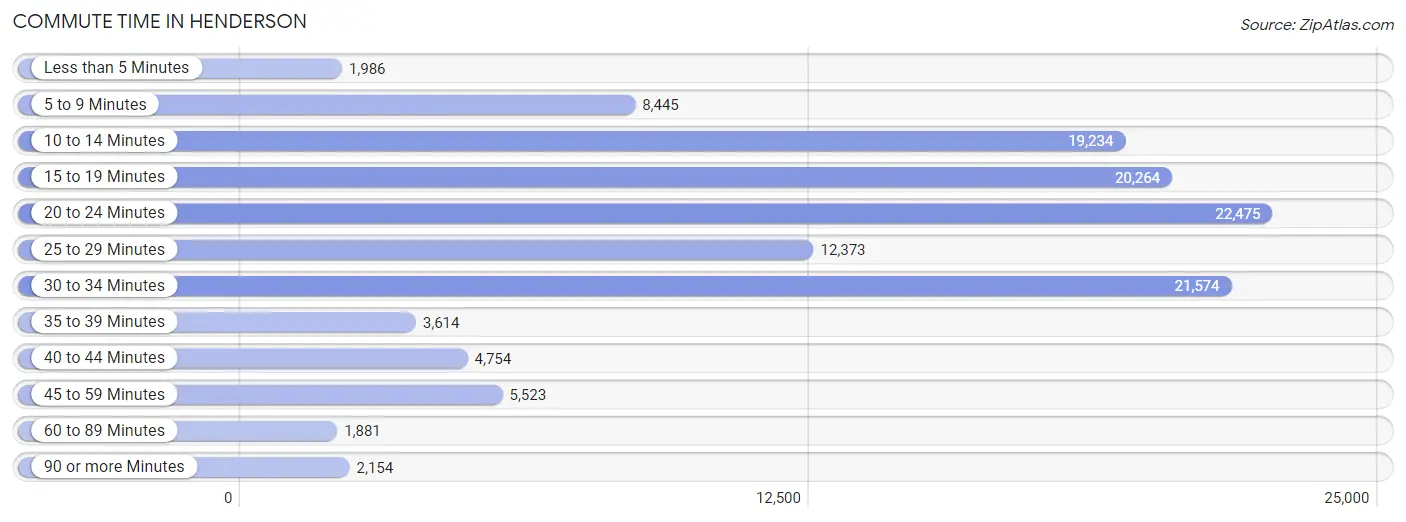
| Commute Time | # Commuters | % Commuters |
| Less than 5 Minutes | 1,986 | 1.6% |
| 5 to 9 Minutes | 8,445 | 6.8% |
| 10 to 14 Minutes | 19,234 | 15.5% |
| 15 to 19 Minutes | 20,264 | 16.3% |
| 20 to 24 Minutes | 22,475 | 18.1% |
| 25 to 29 Minutes | 12,373 | 10.0% |
| 30 to 34 Minutes | 21,574 | 17.4% |
| 35 to 39 Minutes | 3,614 | 2.9% |
| 40 to 44 Minutes | 4,754 | 3.8% |
| 45 to 59 Minutes | 5,523 | 4.4% |
| 60 to 89 Minutes | 1,881 | 1.5% |
| 90 or more Minutes | 2,154 | 1.7% |
Commute Time by Sex in Henderson
The most common commute times in Henderson are 30 to 34 minutes (12,675 commuters, 18.7%) for males and 20 to 24 minutes (10,004 commuters, 17.7%) for females.
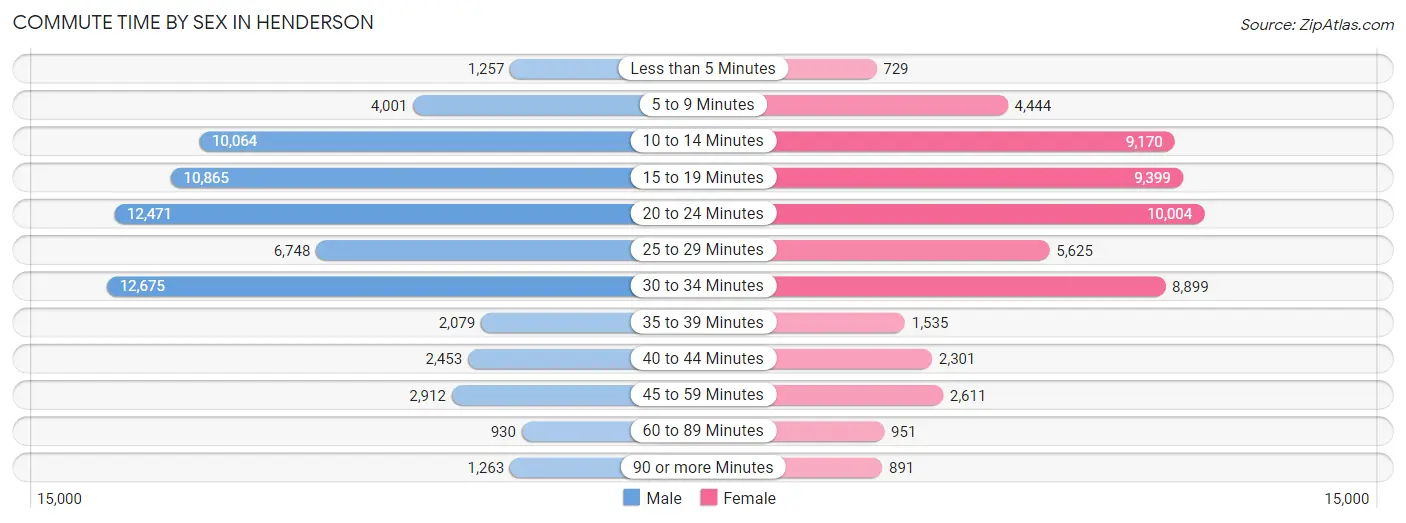
| Commute Time | Male | Female |
| Less than 5 Minutes | 1,257 (1.9%) | 729 (1.3%) |
| 5 to 9 Minutes | 4,001 (5.9%) | 4,444 (7.9%) |
| 10 to 14 Minutes | 10,064 (14.9%) | 9,170 (16.2%) |
| 15 to 19 Minutes | 10,865 (16.0%) | 9,399 (16.6%) |
| 20 to 24 Minutes | 12,471 (18.4%) | 10,004 (17.7%) |
| 25 to 29 Minutes | 6,748 (10.0%) | 5,625 (10.0%) |
| 30 to 34 Minutes | 12,675 (18.7%) | 8,899 (15.7%) |
| 35 to 39 Minutes | 2,079 (3.1%) | 1,535 (2.7%) |
| 40 to 44 Minutes | 2,453 (3.6%) | 2,301 (4.1%) |
| 45 to 59 Minutes | 2,912 (4.3%) | 2,611 (4.6%) |
| 60 to 89 Minutes | 930 (1.4%) | 951 (1.7%) |
| 90 or more Minutes | 1,263 (1.9%) | 891 (1.6%) |
Time of Departure to Work by Sex in Henderson
The most frequent times of departure to work in Henderson are 9:00 AM to 9:59 AM (7,770, 11.5%) for males and 9:00 AM to 9:59 AM (6,831, 12.1%) for females.
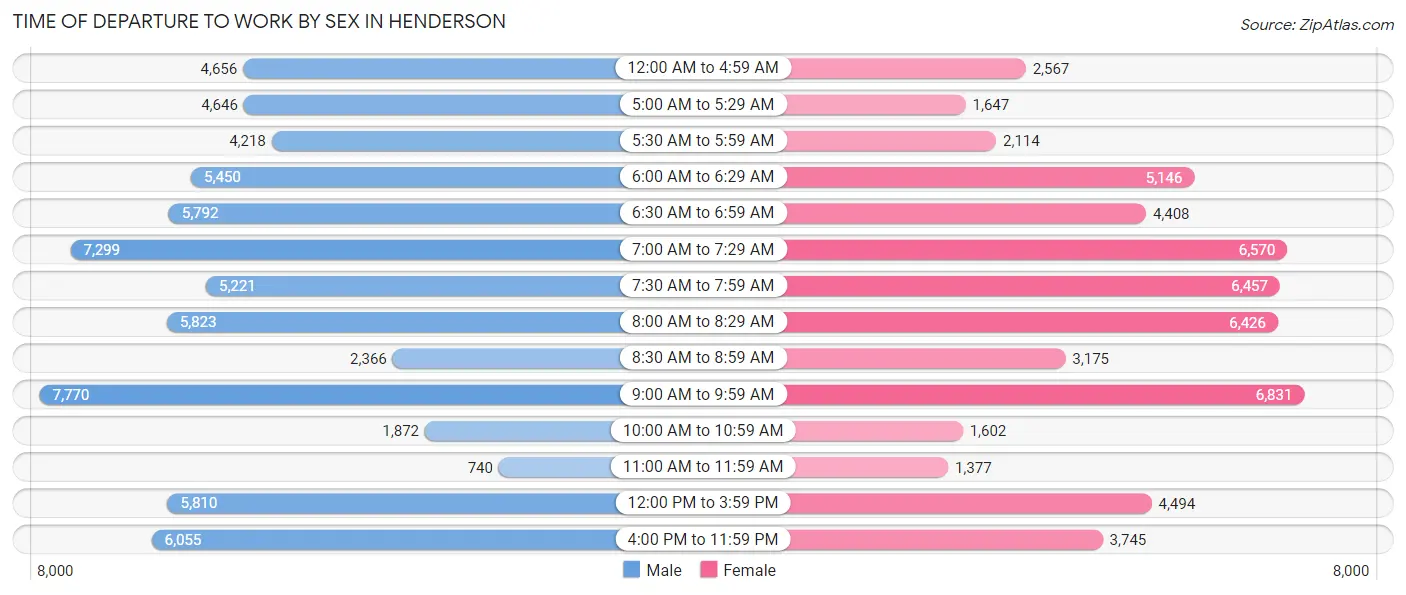
| Time of Departure | Male | Female |
| 12:00 AM to 4:59 AM | 4,656 (6.9%) | 2,567 (4.5%) |
| 5:00 AM to 5:29 AM | 4,646 (6.9%) | 1,647 (2.9%) |
| 5:30 AM to 5:59 AM | 4,218 (6.2%) | 2,114 (3.7%) |
| 6:00 AM to 6:29 AM | 5,450 (8.1%) | 5,146 (9.1%) |
| 6:30 AM to 6:59 AM | 5,792 (8.6%) | 4,408 (7.8%) |
| 7:00 AM to 7:29 AM | 7,299 (10.8%) | 6,570 (11.6%) |
| 7:30 AM to 7:59 AM | 5,221 (7.7%) | 6,457 (11.4%) |
| 8:00 AM to 8:29 AM | 5,823 (8.6%) | 6,426 (11.4%) |
| 8:30 AM to 8:59 AM | 2,366 (3.5%) | 3,175 (5.6%) |
| 9:00 AM to 9:59 AM | 7,770 (11.5%) | 6,831 (12.1%) |
| 10:00 AM to 10:59 AM | 1,872 (2.8%) | 1,602 (2.8%) |
| 11:00 AM to 11:59 AM | 740 (1.1%) | 1,377 (2.4%) |
| 12:00 PM to 3:59 PM | 5,810 (8.6%) | 4,494 (8.0%) |
| 4:00 PM to 11:59 PM | 6,055 (8.9%) | 3,745 (6.6%) |
| Total | 67,718 (100.0%) | 56,559 (100.0%) |
Housing Occupancy in Henderson
Occupancy by Ownership in Henderson
Of the total 124,626 dwellings in Henderson, owner-occupied units account for 81,210 (65.2%), while renter-occupied units make up 43,416 (34.8%).
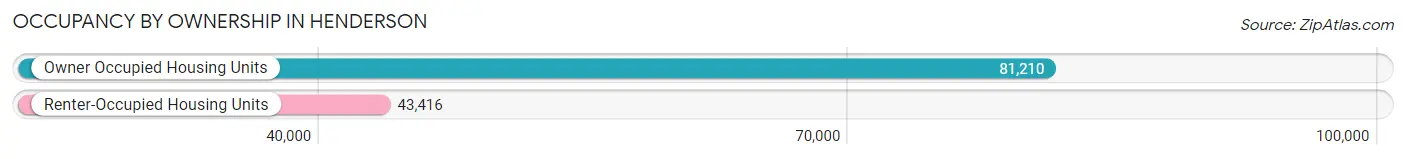
| Occupancy | # Housing Units | % Housing Units |
| Owner Occupied Housing Units | 81,210 | 65.2% |
| Renter-Occupied Housing Units | 43,416 | 34.8% |
| Total Occupied Housing Units | 124,626 | 100.0% |
Occupancy by Household Size in Henderson
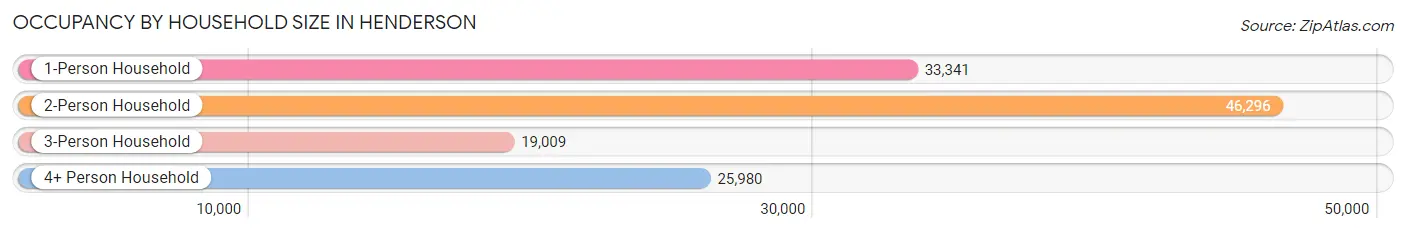
| Household Size | # Housing Units | % Housing Units |
| 1-Person Household | 33,341 | 26.8% |
| 2-Person Household | 46,296 | 37.1% |
| 3-Person Household | 19,009 | 15.2% |
| 4+ Person Household | 25,980 | 20.8% |
| Total Housing Units | 124,626 | 100.0% |
Occupancy by Ownership by Household Size in Henderson
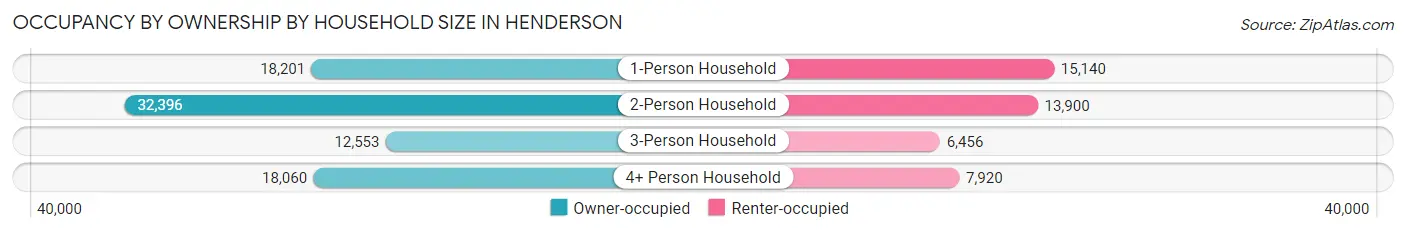
| Household Size | Owner-occupied | Renter-occupied |
| 1-Person Household | 18,201 (54.6%) | 15,140 (45.4%) |
| 2-Person Household | 32,396 (70.0%) | 13,900 (30.0%) |
| 3-Person Household | 12,553 (66.0%) | 6,456 (34.0%) |
| 4+ Person Household | 18,060 (69.5%) | 7,920 (30.5%) |
| Total Housing Units | 81,210 (65.2%) | 43,416 (34.8%) |
Occupancy by Educational Attainment in Henderson
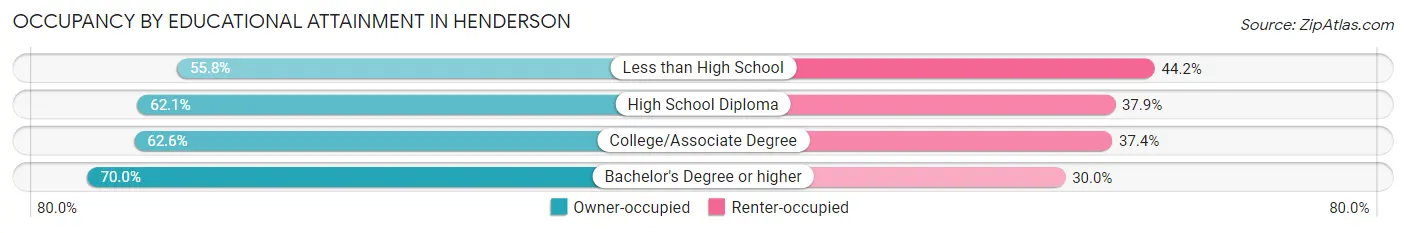
| Household Size | Owner-occupied | Renter-occupied |
| Less than High School | 3,110 (55.8%) | 2,460 (44.2%) |
| High School Diploma | 14,521 (62.1%) | 8,853 (37.9%) |
| College/Associate Degree | 28,793 (62.6%) | 17,209 (37.4%) |
| Bachelor's Degree or higher | 34,786 (70.0%) | 14,894 (30.0%) |
Occupancy by Age of Householder in Henderson
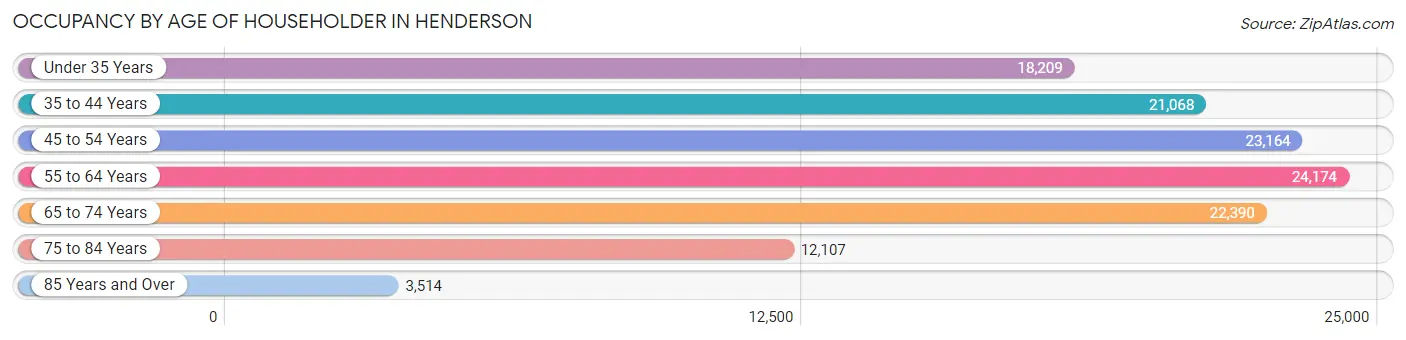
| Age Bracket | # Households | % Households |
| Under 35 Years | 18,209 | 14.6% |
| 35 to 44 Years | 21,068 | 16.9% |
| 45 to 54 Years | 23,164 | 18.6% |
| 55 to 64 Years | 24,174 | 19.4% |
| 65 to 74 Years | 22,390 | 18.0% |
| 75 to 84 Years | 12,107 | 9.7% |
| 85 Years and Over | 3,514 | 2.8% |
| Total | 124,626 | 100.0% |
Housing Finances in Henderson
Median Income by Occupancy in Henderson
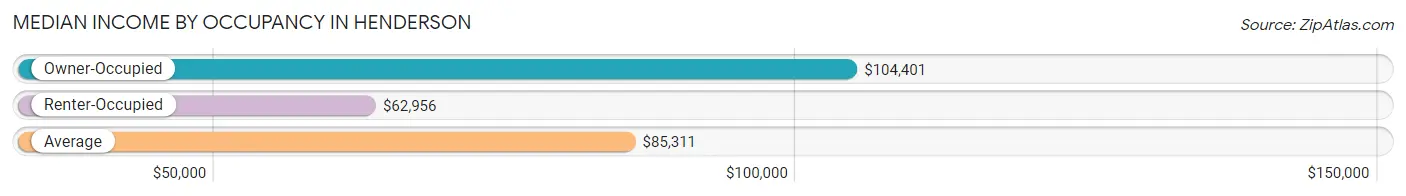
| Occupancy Type | # Households | Median Income |
| Owner-Occupied | 81,210 (65.2%) | $104,401 |
| Renter-Occupied | 43,416 (34.8%) | $62,956 |
| Average | 124,626 (100.0%) | $85,311 |
Occupancy by Householder Income Bracket in Henderson
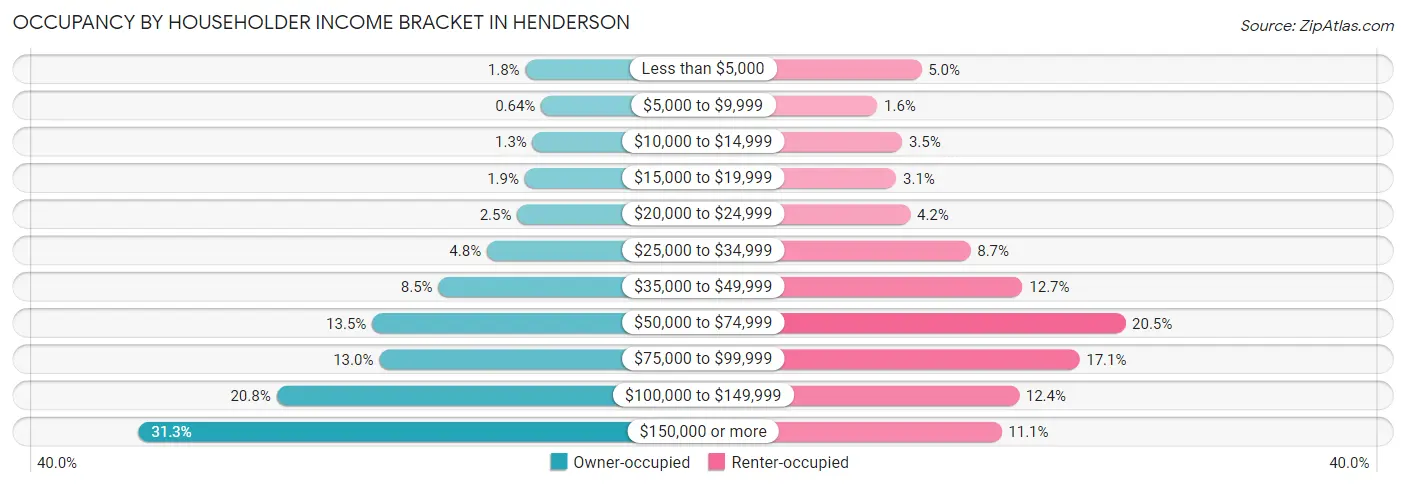
| Income Bracket | Owner-occupied | Renter-occupied |
| Less than $5,000 | 1,497 (1.8%) | 2,171 (5.0%) |
| $5,000 to $9,999 | 519 (0.6%) | 712 (1.6%) |
| $10,000 to $14,999 | 1,049 (1.3%) | 1,535 (3.5%) |
| $15,000 to $19,999 | 1,536 (1.9%) | 1,341 (3.1%) |
| $20,000 to $24,999 | 1,997 (2.5%) | 1,800 (4.2%) |
| $25,000 to $34,999 | 3,870 (4.8%) | 3,794 (8.7%) |
| $35,000 to $49,999 | 6,881 (8.5%) | 5,519 (12.7%) |
| $50,000 to $74,999 | 10,976 (13.5%) | 8,917 (20.5%) |
| $75,000 to $99,999 | 10,544 (13.0%) | 7,403 (17.1%) |
| $100,000 to $149,999 | 16,897 (20.8%) | 5,399 (12.4%) |
| $150,000 or more | 25,444 (31.3%) | 4,825 (11.1%) |
| Total | 81,210 (100.0%) | 43,416 (100.0%) |
Monthly Housing Cost Tiers in Henderson
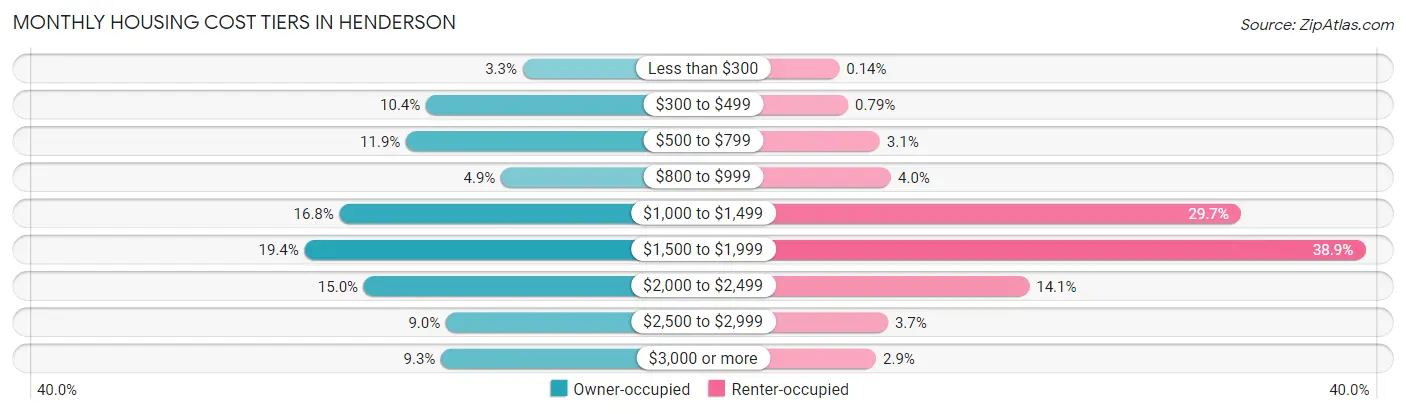
| Monthly Cost | Owner-occupied | Renter-occupied |
| Less than $300 | 2,690 (3.3%) | 59 (0.1%) |
| $300 to $499 | 8,472 (10.4%) | 343 (0.8%) |
| $500 to $799 | 9,662 (11.9%) | 1,357 (3.1%) |
| $800 to $999 | 3,976 (4.9%) | 1,715 (4.0%) |
| $1,000 to $1,499 | 13,647 (16.8%) | 12,892 (29.7%) |
| $1,500 to $1,999 | 15,735 (19.4%) | 16,867 (38.9%) |
| $2,000 to $2,499 | 12,186 (15.0%) | 6,133 (14.1%) |
| $2,500 to $2,999 | 7,274 (9.0%) | 1,614 (3.7%) |
| $3,000 or more | 7,568 (9.3%) | 1,236 (2.9%) |
| Total | 81,210 (100.0%) | 43,416 (100.0%) |
Physical Housing Characteristics in Henderson
Housing Structures in Henderson
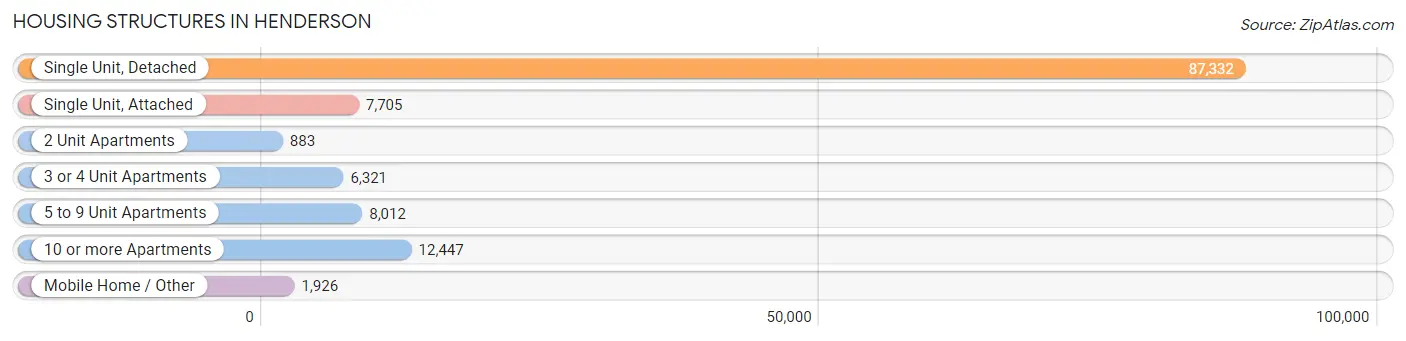
| Structure Type | # Housing Units | % Housing Units |
| Single Unit, Detached | 87,332 | 70.1% |
| Single Unit, Attached | 7,705 | 6.2% |
| 2 Unit Apartments | 883 | 0.7% |
| 3 or 4 Unit Apartments | 6,321 | 5.1% |
| 5 to 9 Unit Apartments | 8,012 | 6.4% |
| 10 or more Apartments | 12,447 | 10.0% |
| Mobile Home / Other | 1,926 | 1.5% |
| Total | 124,626 | 100.0% |
Housing Structures by Occupancy in Henderson
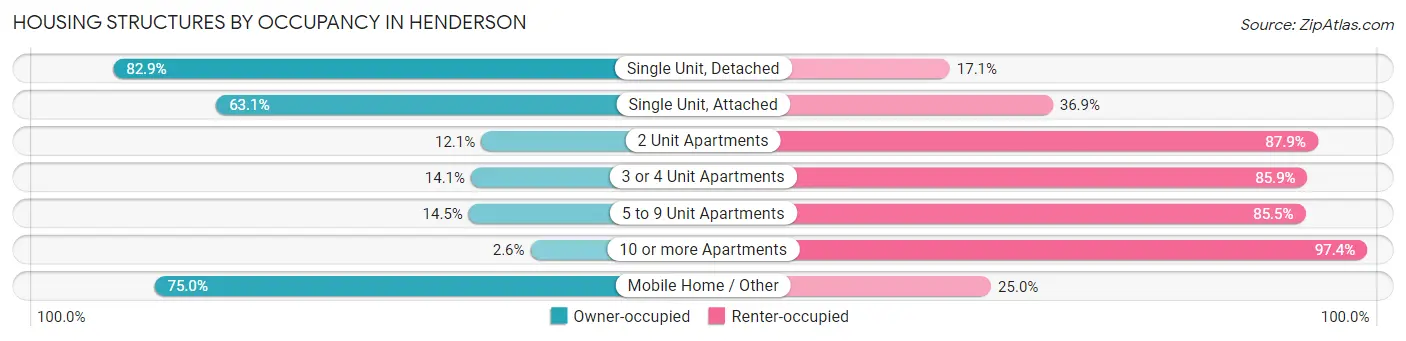
| Structure Type | Owner-occupied | Renter-occupied |
| Single Unit, Detached | 72,419 (82.9%) | 14,913 (17.1%) |
| Single Unit, Attached | 4,862 (63.1%) | 2,843 (36.9%) |
| 2 Unit Apartments | 107 (12.1%) | 776 (87.9%) |
| 3 or 4 Unit Apartments | 890 (14.1%) | 5,431 (85.9%) |
| 5 to 9 Unit Apartments | 1,162 (14.5%) | 6,850 (85.5%) |
| 10 or more Apartments | 326 (2.6%) | 12,121 (97.4%) |
| Mobile Home / Other | 1,444 (75.0%) | 482 (25.0%) |
| Total | 81,210 (65.2%) | 43,416 (34.8%) |
Housing Structures by Number of Rooms in Henderson
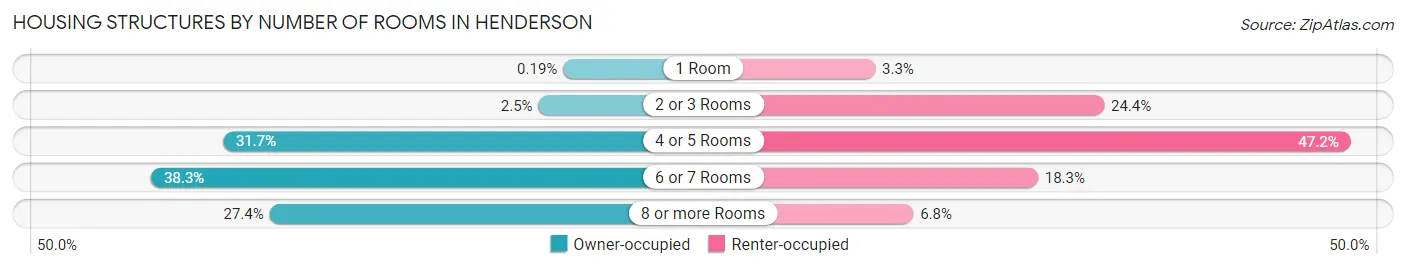
| Number of Rooms | Owner-occupied | Renter-occupied |
| 1 Room | 154 (0.2%) | 1,413 (3.3%) |
| 2 or 3 Rooms | 2,012 (2.5%) | 10,605 (24.4%) |
| 4 or 5 Rooms | 25,723 (31.7%) | 20,506 (47.2%) |
| 6 or 7 Rooms | 31,112 (38.3%) | 7,947 (18.3%) |
| 8 or more Rooms | 22,209 (27.4%) | 2,945 (6.8%) |
| Total | 81,210 (100.0%) | 43,416 (100.0%) |
Housing Structure by Heating Type in Henderson
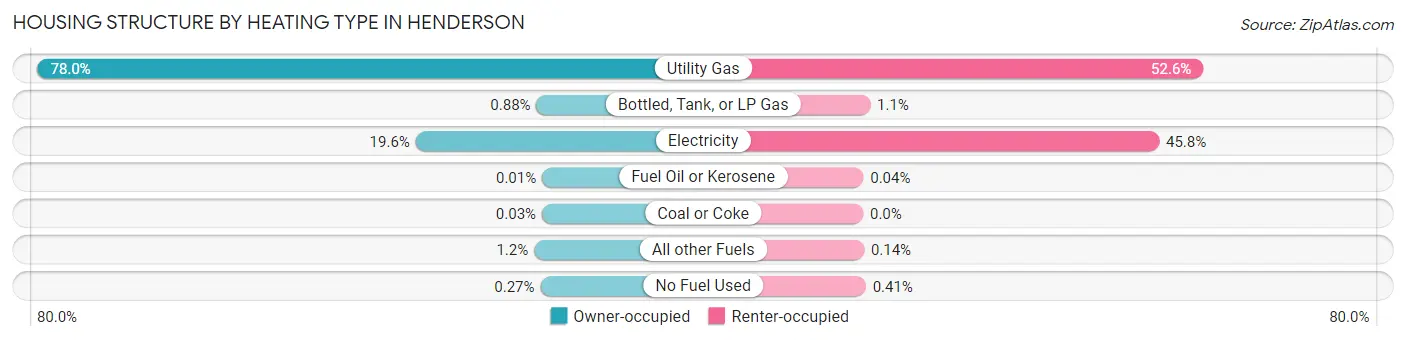
| Heating Type | Owner-occupied | Renter-occupied |
| Utility Gas | 63,352 (78.0%) | 22,825 (52.6%) |
| Bottled, Tank, or LP Gas | 718 (0.9%) | 473 (1.1%) |
| Electricity | 15,877 (19.6%) | 19,865 (45.8%) |
| Fuel Oil or Kerosene | 11 (0.0%) | 18 (0.0%) |
| Coal or Coke | 21 (0.0%) | 0 (0.0%) |
| All other Fuels | 1,009 (1.2%) | 59 (0.1%) |
| No Fuel Used | 222 (0.3%) | 176 (0.4%) |
| Total | 81,210 (100.0%) | 43,416 (100.0%) |
Household Vehicle Usage in Henderson
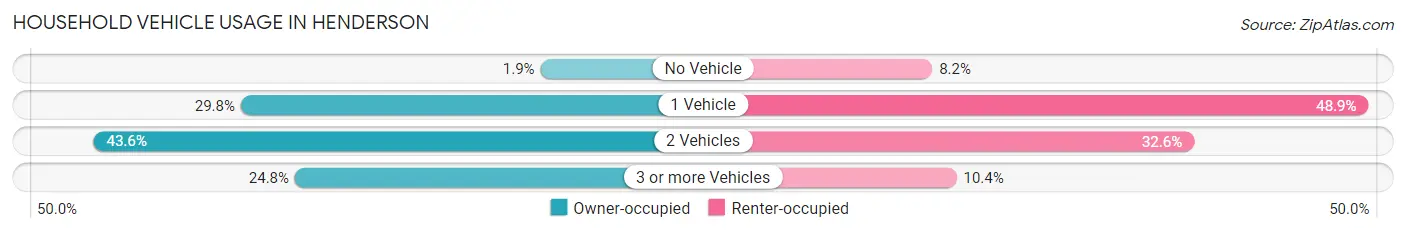
| Vehicles per Household | Owner-occupied | Renter-occupied |
| No Vehicle | 1,502 (1.8%) | 3,537 (8.2%) |
| 1 Vehicle | 24,216 (29.8%) | 21,211 (48.9%) |
| 2 Vehicles | 35,379 (43.6%) | 14,143 (32.6%) |
| 3 or more Vehicles | 20,113 (24.8%) | 4,525 (10.4%) |
| Total | 81,210 (100.0%) | 43,416 (100.0%) |
Real Estate & Mortgages in Henderson
Real Estate and Mortgage Overview in Henderson
| Characteristic | Without Mortgage | With Mortgage |
| Housing Units | 24,767 | 56,443 |
| Median Property Value | $416,200 | $432,100 |
| Median Household Income | $82,099 | $19,771 |
| Monthly Housing Costs | $539 | $7,227 |
| Real Estate Taxes | $2,352 | $1,073 |
Property Value by Mortgage Status in Henderson
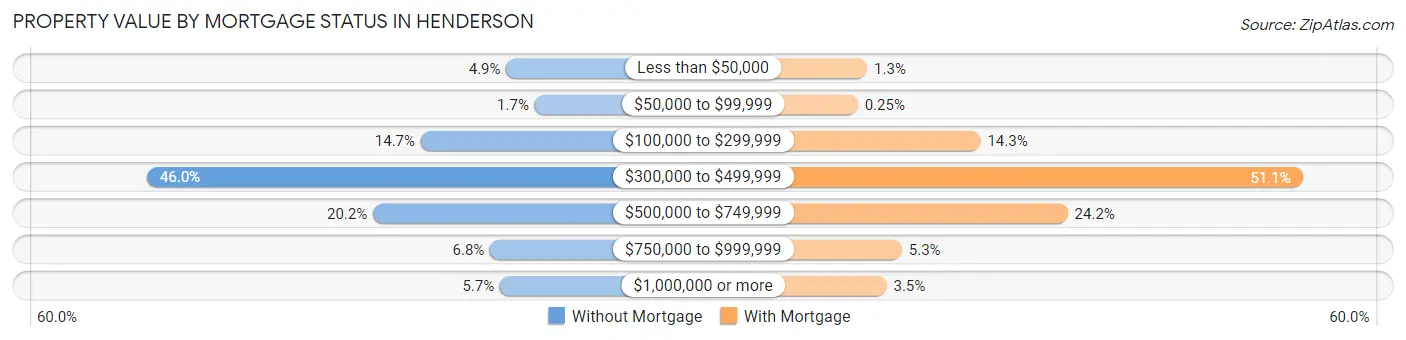
| Property Value | Without Mortgage | With Mortgage |
| Less than $50,000 | 1,223 (4.9%) | 753 (1.3%) |
| $50,000 to $99,999 | 420 (1.7%) | 139 (0.3%) |
| $100,000 to $299,999 | 3,644 (14.7%) | 8,058 (14.3%) |
| $300,000 to $499,999 | 11,399 (46.0%) | 28,830 (51.1%) |
| $500,000 to $749,999 | 4,999 (20.2%) | 13,679 (24.2%) |
| $750,000 to $999,999 | 1,681 (6.8%) | 2,986 (5.3%) |
| $1,000,000 or more | 1,401 (5.7%) | 1,998 (3.5%) |
| Total | 24,767 (100.0%) | 56,443 (100.0%) |
Household Income by Mortgage Status in Henderson
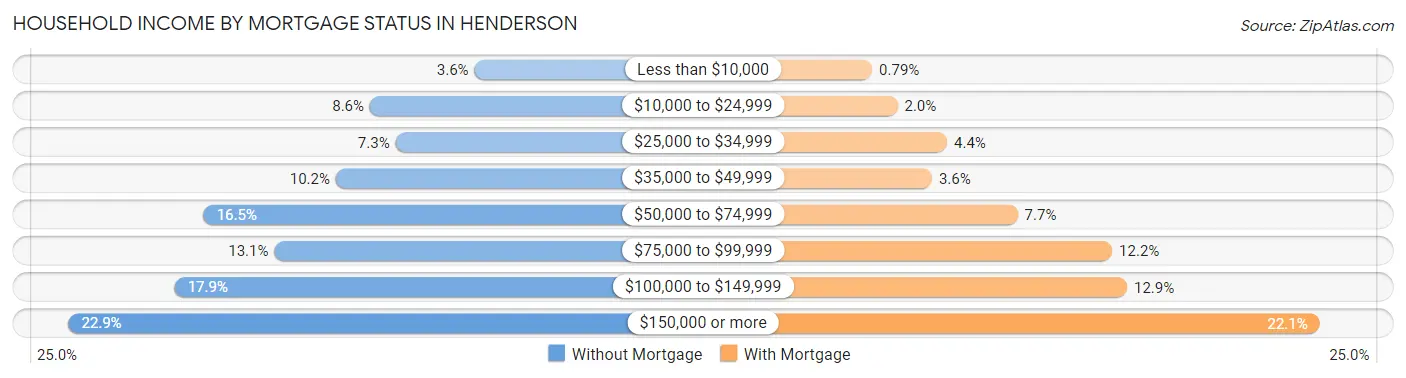
| Household Income | Without Mortgage | With Mortgage |
| Less than $10,000 | 886 (3.6%) | 444 (0.8%) |
| $10,000 to $24,999 | 2,121 (8.6%) | 1,130 (2.0%) |
| $25,000 to $34,999 | 1,818 (7.3%) | 2,461 (4.4%) |
| $35,000 to $49,999 | 2,522 (10.2%) | 2,052 (3.6%) |
| $50,000 to $74,999 | 4,078 (16.5%) | 4,359 (7.7%) |
| $75,000 to $99,999 | 3,248 (13.1%) | 6,898 (12.2%) |
| $100,000 to $149,999 | 4,421 (17.8%) | 7,296 (12.9%) |
| $150,000 or more | 5,673 (22.9%) | 12,476 (22.1%) |
| Total | 24,767 (100.0%) | 56,443 (100.0%) |
Property Value to Household Income Ratio in Henderson
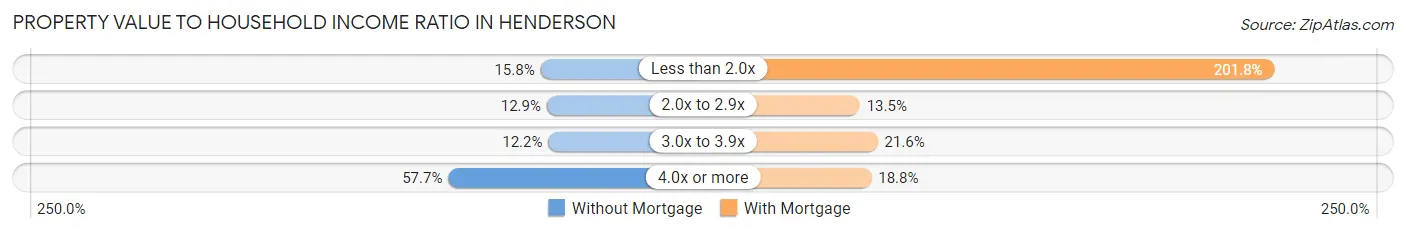
| Value-to-Income Ratio | Without Mortgage | With Mortgage |
| Less than 2.0x | 3,906 (15.8%) | 113,897 (201.8%) |
| 2.0x to 2.9x | 3,199 (12.9%) | 7,639 (13.5%) |
| 3.0x to 3.9x | 3,030 (12.2%) | 12,207 (21.6%) |
| 4.0x or more | 14,279 (57.7%) | 10,602 (18.8%) |
| Total | 24,767 (100.0%) | 56,443 (100.0%) |
Real Estate Taxes by Mortgage Status in Henderson
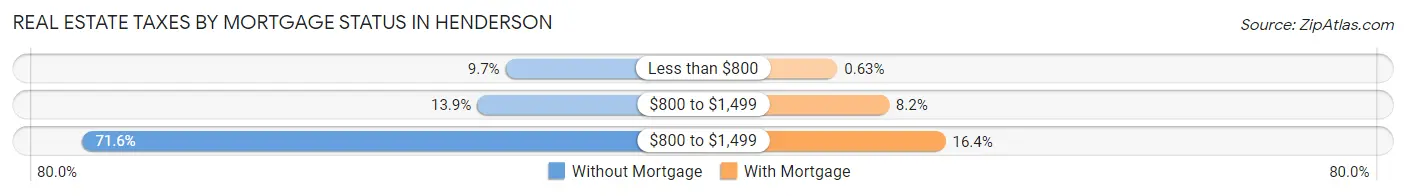
| Property Taxes | Without Mortgage | With Mortgage |
| Less than $800 | 2,413 (9.7%) | 355 (0.6%) |
| $800 to $1,499 | 3,440 (13.9%) | 4,606 (8.2%) |
| $800 to $1,499 | 17,721 (71.6%) | 9,278 (16.4%) |
| Total | 24,767 (100.0%) | 56,443 (100.0%) |
Health & Disability in Henderson
Health Insurance Coverage by Age in Henderson
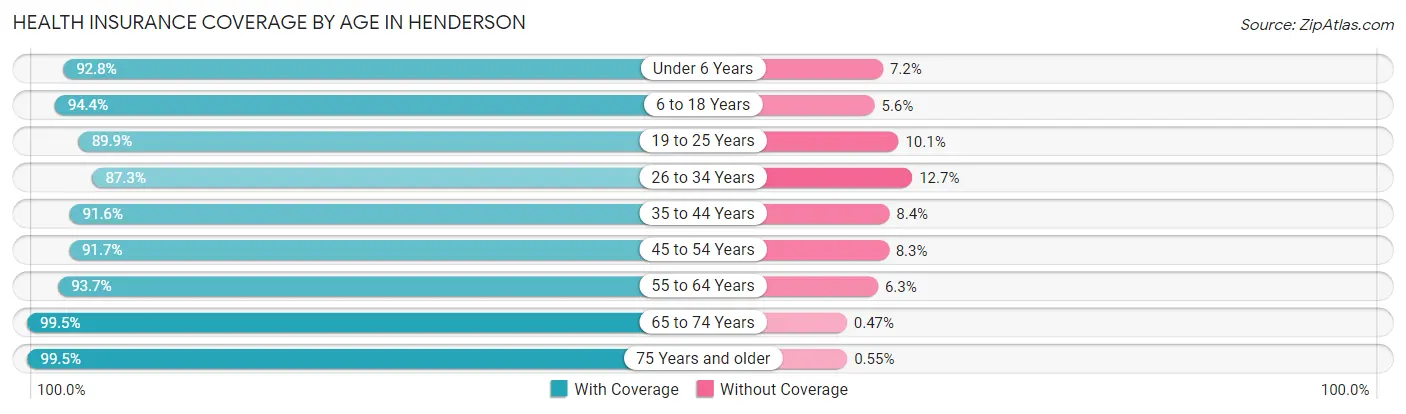
| Age Bracket | With Coverage | Without Coverage |
| Under 6 Years | 17,702 (92.8%) | 1,376 (7.2%) |
| 6 to 18 Years | 49,089 (94.4%) | 2,933 (5.6%) |
| 19 to 25 Years | 17,839 (89.9%) | 2,004 (10.1%) |
| 26 to 34 Years | 31,304 (87.3%) | 4,540 (12.7%) |
| 35 to 44 Years | 37,538 (91.6%) | 3,441 (8.4%) |
| 45 to 54 Years | 39,122 (91.7%) | 3,533 (8.3%) |
| 55 to 64 Years | 39,711 (93.7%) | 2,661 (6.3%) |
| 65 to 74 Years | 36,808 (99.5%) | 174 (0.5%) |
| 75 Years and older | 26,051 (99.5%) | 145 (0.5%) |
| Total | 295,164 (93.4%) | 20,807 (6.6%) |
Health Insurance Coverage by Citizenship Status in Henderson
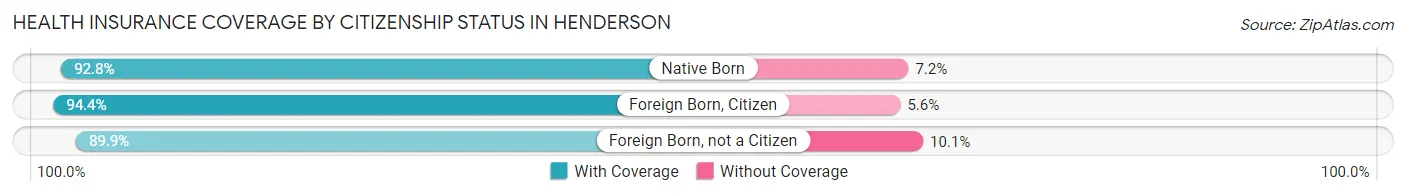
| Citizenship Status | With Coverage | Without Coverage |
| Native Born | 17,702 (92.8%) | 1,376 (7.2%) |
| Foreign Born, Citizen | 49,089 (94.4%) | 2,933 (5.6%) |
| Foreign Born, not a Citizen | 17,839 (89.9%) | 2,004 (10.1%) |
Health Insurance Coverage by Household Income in Henderson
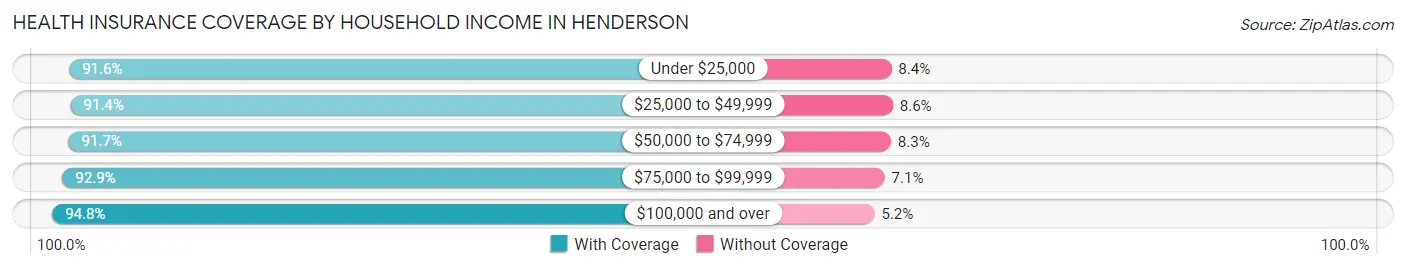
| Household Income | With Coverage | Without Coverage |
| Under $25,000 | 22,459 (91.6%) | 2,049 (8.4%) |
| $25,000 to $49,999 | 36,094 (91.4%) | 3,410 (8.6%) |
| $50,000 to $74,999 | 42,517 (91.7%) | 3,828 (8.3%) |
| $75,000 to $99,999 | 42,013 (92.9%) | 3,206 (7.1%) |
| $100,000 and over | 151,920 (94.8%) | 8,304 (5.2%) |
Public vs Private Health Insurance Coverage by Age in Henderson
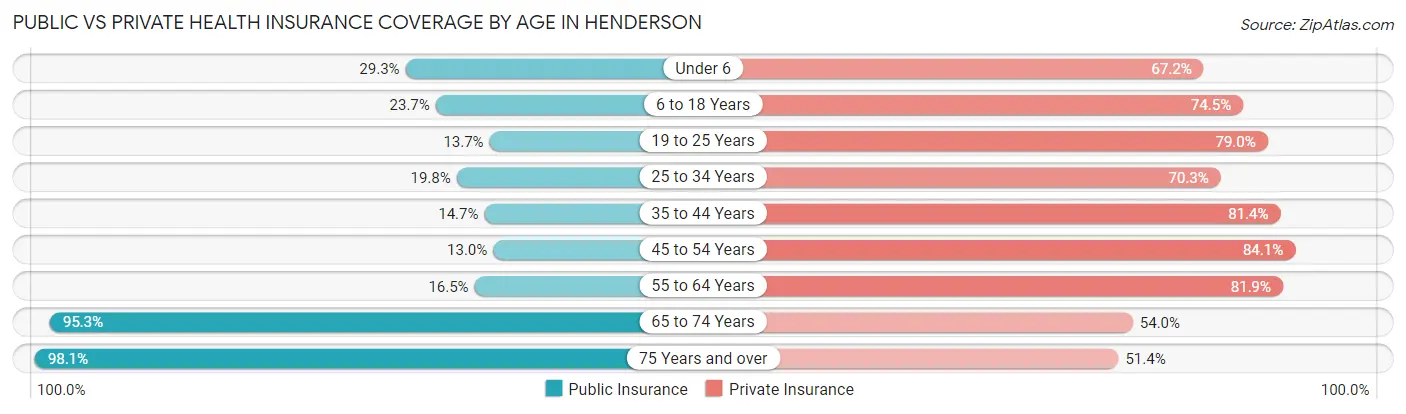
| Age Bracket | Public Insurance | Private Insurance |
| Under 6 | 5,594 (29.3%) | 12,812 (67.2%) |
| 6 to 18 Years | 12,337 (23.7%) | 38,739 (74.5%) |
| 19 to 25 Years | 2,722 (13.7%) | 15,679 (79.0%) |
| 25 to 34 Years | 7,104 (19.8%) | 25,201 (70.3%) |
| 35 to 44 Years | 6,015 (14.7%) | 33,353 (81.4%) |
| 45 to 54 Years | 5,561 (13.0%) | 35,877 (84.1%) |
| 55 to 64 Years | 6,991 (16.5%) | 34,686 (81.9%) |
| 65 to 74 Years | 35,253 (95.3%) | 19,980 (54.0%) |
| 75 Years and over | 25,695 (98.1%) | 13,455 (51.4%) |
| Total | 107,272 (34.0%) | 229,782 (72.7%) |
Disability Status by Sex by Age in Henderson
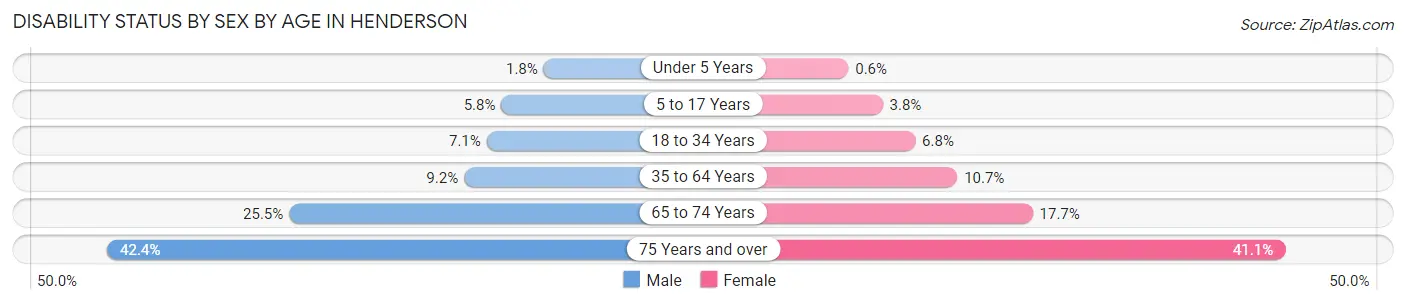
| Age Bracket | Male | Female |
| Under 5 Years | 139 (1.8%) | 48 (0.6%) |
| 5 to 17 Years | 1,600 (5.8%) | 941 (3.8%) |
| 18 to 34 Years | 1,978 (7.1%) | 2,099 (6.8%) |
| 35 to 64 Years | 5,849 (9.2%) | 6,697 (10.7%) |
| 65 to 74 Years | 4,455 (25.5%) | 3,449 (17.7%) |
| 75 Years and over | 5,313 (42.3%) | 5,615 (41.1%) |
Disability Class by Sex by Age in Henderson
Disability Class: Hearing Difficulty
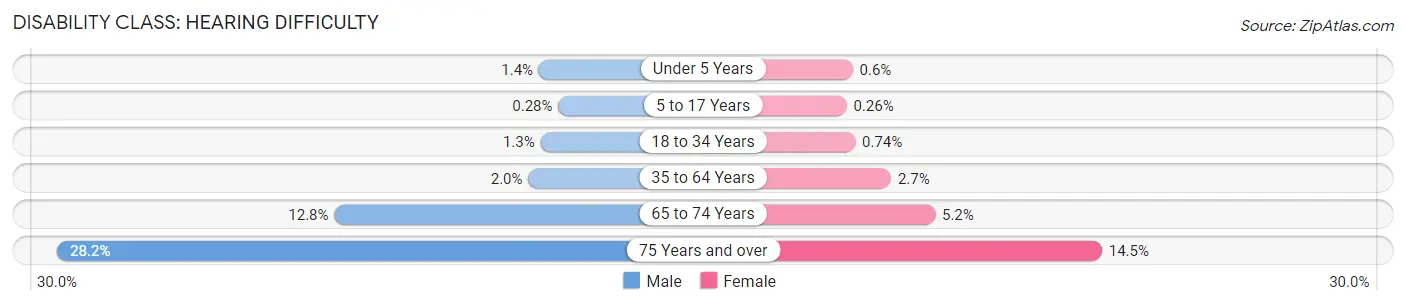
| Age Bracket | Male | Female |
| Under 5 Years | 103 (1.4%) | 48 (0.6%) |
| 5 to 17 Years | 78 (0.3%) | 65 (0.3%) |
| 18 to 34 Years | 353 (1.3%) | 227 (0.7%) |
| 35 to 64 Years | 1,238 (1.9%) | 1,713 (2.7%) |
| 65 to 74 Years | 2,231 (12.8%) | 1,010 (5.2%) |
| 75 Years and over | 3,536 (28.2%) | 1,977 (14.5%) |
Disability Class: Vision Difficulty
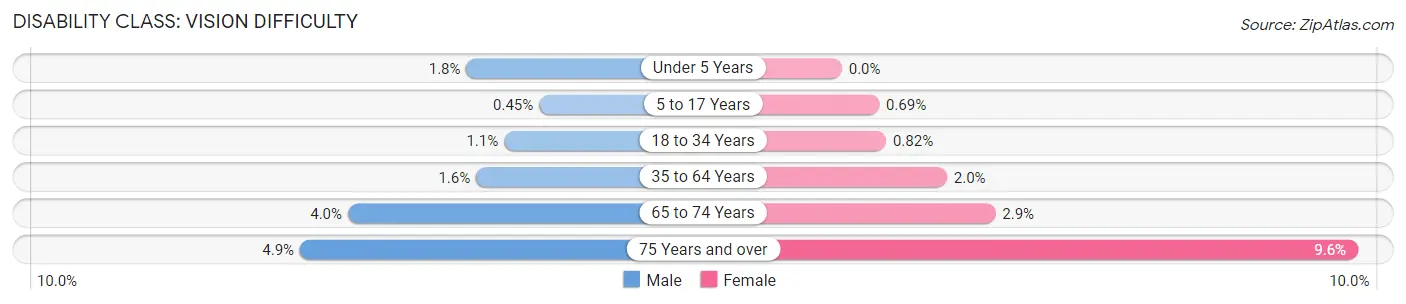
| Age Bracket | Male | Female |
| Under 5 Years | 137 (1.8%) | 0 (0.0%) |
| 5 to 17 Years | 125 (0.4%) | 170 (0.7%) |
| 18 to 34 Years | 307 (1.1%) | 253 (0.8%) |
| 35 to 64 Years | 1,026 (1.6%) | 1,217 (1.9%) |
| 65 to 74 Years | 701 (4.0%) | 556 (2.9%) |
| 75 Years and over | 613 (4.9%) | 1,308 (9.6%) |
Disability Class: Cognitive Difficulty
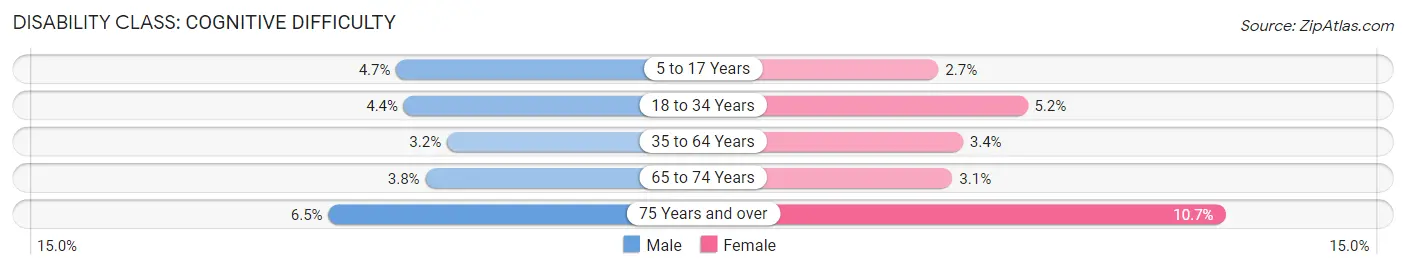
| Age Bracket | Male | Female |
| 5 to 17 Years | 1,292 (4.6%) | 667 (2.7%) |
| 18 to 34 Years | 1,235 (4.4%) | 1,595 (5.2%) |
| 35 to 64 Years | 2,057 (3.2%) | 2,110 (3.4%) |
| 65 to 74 Years | 672 (3.8%) | 600 (3.1%) |
| 75 Years and over | 821 (6.5%) | 1,458 (10.7%) |
Disability Class: Ambulatory Difficulty
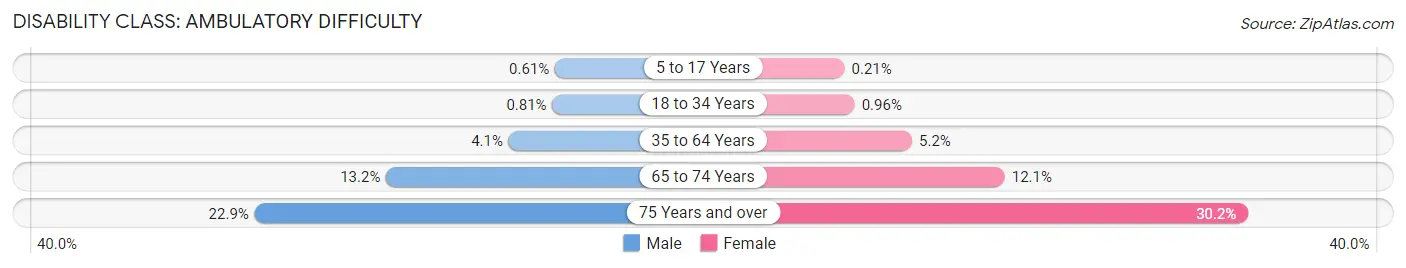
| Age Bracket | Male | Female |
| 5 to 17 Years | 170 (0.6%) | 53 (0.2%) |
| 18 to 34 Years | 224 (0.8%) | 297 (1.0%) |
| 35 to 64 Years | 2,568 (4.1%) | 3,268 (5.2%) |
| 65 to 74 Years | 2,302 (13.2%) | 2,356 (12.1%) |
| 75 Years and over | 2,875 (22.9%) | 4,119 (30.2%) |
Disability Class: Self-Care Difficulty
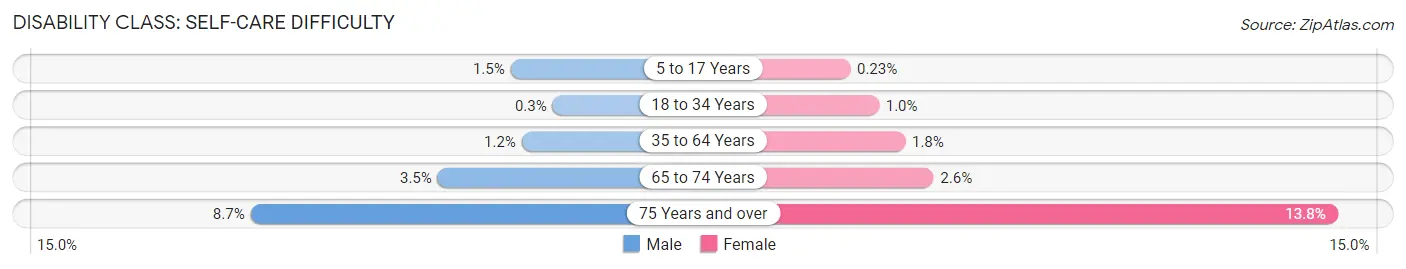
| Age Bracket | Male | Female |
| 5 to 17 Years | 408 (1.5%) | 57 (0.2%) |
| 18 to 34 Years | 83 (0.3%) | 317 (1.0%) |
| 35 to 64 Years | 738 (1.2%) | 1,101 (1.8%) |
| 65 to 74 Years | 612 (3.5%) | 497 (2.5%) |
| 75 Years and over | 1,093 (8.7%) | 1,884 (13.8%) |
Technology Access in Henderson
Computing Device Access in Henderson
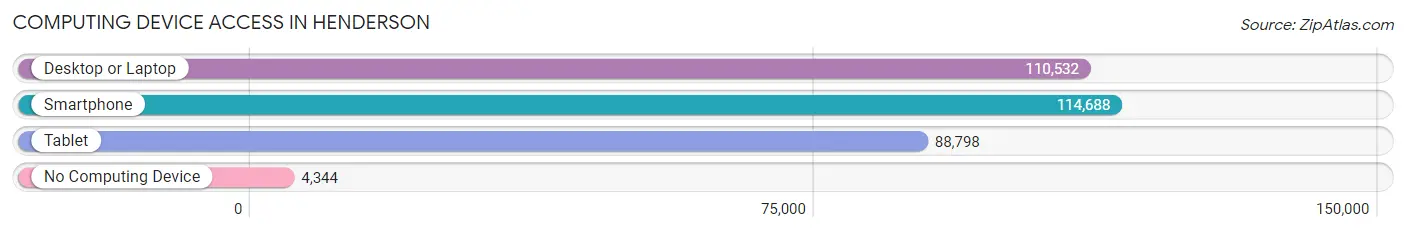
| Device Type | # Households | % Households |
| Desktop or Laptop | 110,532 | 88.7% |
| Smartphone | 114,688 | 92.0% |
| Tablet | 88,798 | 71.3% |
| No Computing Device | 4,344 | 3.5% |
| Total | 124,626 | 100.0% |
Internet Access in Henderson
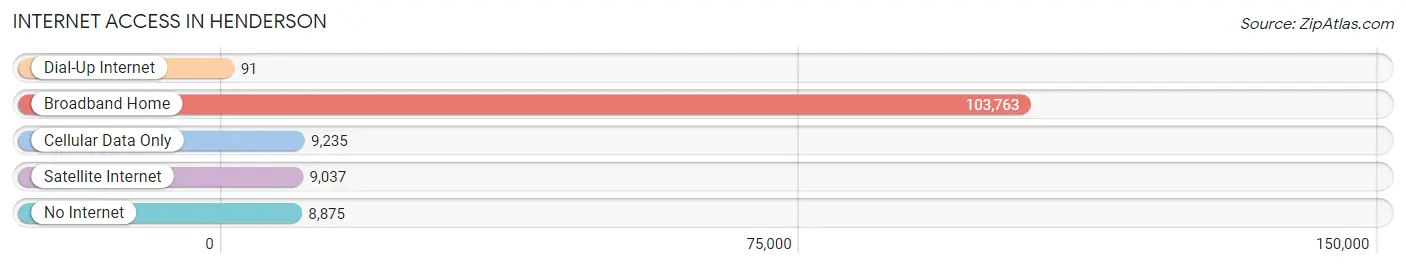
| Internet Type | # Households | % Households |
| Dial-Up Internet | 91 | 0.1% |
| Broadband Home | 103,763 | 83.3% |
| Cellular Data Only | 9,235 | 7.4% |
| Satellite Internet | 9,037 | 7.2% |
| No Internet | 8,875 | 7.1% |
| Total | 124,626 | 100.0% |
Henderson Summary
Henderson, Nevada is a city located in Clark County, Nevada, United States. It is the second-largest city in the state, with a population of over 300,000 people. Henderson is located in the Las Vegas metropolitan area and is considered a suburb of Las Vegas. The city is known for its many parks, trails, and recreational activities, as well as its diverse economy.
History
Henderson was founded in 1941 by the Basic Magnesium Plant, which was built to produce magnesium for the war effort. The city was named after Senator Charles B. Henderson, who was instrumental in the development of the plant. The plant was the largest employer in the area and provided jobs for thousands of people. After the war, the plant was closed and the city began to grow as a residential community.
In the 1950s, Henderson experienced a population boom as people moved to the area to take advantage of the affordable housing and the city's proximity to Las Vegas. The city was incorporated in 1953 and continued to grow throughout the 1960s and 1970s. In the 1980s, Henderson experienced a period of rapid growth as the city became a popular destination for retirees and families.
Geography
Henderson is located in the Mojave Desert in Clark County, Nevada. The city is situated in the southeastern part of the state, just south of Las Vegas. The city covers an area of over 107 square miles and is bordered by the cities of Las Vegas, North Las Vegas, and Boulder City. The city is located at an elevation of 2,000 feet and is surrounded by mountains on all sides.
The climate in Henderson is generally hot and dry, with temperatures ranging from the mid-90s in the summer to the mid-50s in the winter. The city receives an average of 4.5 inches of precipitation per year, with most of it falling in the winter months.
Economy
Henderson is home to a diverse economy that includes manufacturing, tourism, and gaming. The city is home to several major employers, including the Las Vegas Sands Corporation, the MGM Grand, and the Henderson Executive Airport. The city is also home to several major industrial parks, including the Henderson Business Park and the Henderson Industrial Park.
The city's economy is also supported by its tourism industry. Henderson is home to several popular attractions, including the Lake Las Vegas Resort, the Ethel M Chocolate Factory, and the Henderson Bird Viewing Preserve. The city is also home to several casinos, including the M Resort, the Green Valley Ranch, and the Sunset Station.
Demographics
As of the 2020 census, Henderson had a population of over 300,000 people. The city has a population density of 2,845 people per square mile. The median age in Henderson is 37.7 years, and the median household income is $63,845.
The racial makeup of Henderson is 73.2% White, 8.3% Hispanic or Latino, 6.7% African American, 5.2% Asian, and 4.6% other. The city is home to a large number of immigrants, with over 20% of the population being foreign-born.
Henderson is a diverse city with a variety of cultures and religions. The city is home to a large number of churches, synagogues, and mosques. The city is also home to a large number of public and private schools, as well as several universities and colleges.
Common Questions
What is Per Capita Income in Henderson?
Per Capita income in Henderson is $46,882.
What is the Median Family Income in Henderson?
Median Family Income in Henderson is $100,794.
What is the Median Household income in Henderson?
Median Household Income in Henderson is $85,311.
What is Income or Wage Gap in Henderson?
Income or Wage Gap in Henderson is 28.3%.
Women in Henderson earn 71.7 cents for every dollar earned by a man.
What is Family Income Deficit in Henderson?
Family Income Deficit in Henderson is $11,619.
Families that are below poverty line in Henderson earn $11,619 less on average than the poverty threshold level.
What is Inequality or Gini Index in Henderson?
Inequality or Gini Index in Henderson is 0.46.
What is the Total Population of Henderson?
Total Population of Henderson is 318,063.
What is the Total Male Population of Henderson?
Total Male Population of Henderson is 158,062.
What is the Total Female Population of Henderson?
Total Female Population of Henderson is 160,001.
What is the Ratio of Males per 100 Females in Henderson?
There are 98.79 Males per 100 Females in Henderson.
What is the Ratio of Females per 100 Males in Henderson?
There are 101.23 Females per 100 Males in Henderson.
What is the Median Population Age in Henderson?
Median Population Age in Henderson is 42.3 Years.
What is the Average Family Size in Henderson
Average Family Size in Henderson is 3.1 People.
What is the Average Household Size in Henderson
Average Household Size in Henderson is 2.5 People.
How Large is the Labor Force in Henderson?
There are 158,107 People in the Labor Forcein in Henderson.
What is the Percentage of People in the Labor Force in Henderson?
61.1% of People are in the Labor Force in Henderson.
What is the Unemployment Rate in Henderson?
Unemployment Rate in Henderson is 7.0%.