Orlando, FL Map & Demographics
Orlando Map
Orlando Overview
$40,253
PER CAPITA INCOME
$74,980
AVG FAMILY INCOME
$66,292
AVG HOUSEHOLD INCOME
25.3%
WAGE / INCOME GAP [ % ]
74.7¢/ $1
WAGE / INCOME GAP [ $ ]
$11,277
FAMILY INCOME DEFICIT
0.50
INEQUALITY / GINI INDEX
307,738
TOTAL POPULATION
150,314
MALE POPULATION
157,424
FEMALE POPULATION
95.48
MALES / 100 FEMALES
104.73
FEMALES / 100 MALES
34.7
MEDIAN AGE
3.3
AVG FAMILY SIZE
2.5
AVG HOUSEHOLD SIZE
178,952
LABOR FORCE [ PEOPLE ]
71.3%
PERCENT IN LABOR FORCE
5.2%
UNEMPLOYMENT RATE
Orlando Zip Codes
Income in Orlando
Income Overview in Orlando
Per Capita Income in Orlando is $40,253, while median incomes of families and households are $74,980 and $66,292 respectively.
| Characteristic | Number | Measure |
| Per Capita Income | 307,738 | $40,253 |
| Median Family Income | 67,758 | $74,980 |
| Mean Family Income | 67,758 | $111,701 |
| Median Household Income | 122,607 | $66,292 |
| Mean Household Income | 122,607 | $96,619 |
| Income Deficit | 67,758 | $11,277 |
| Wage / Income Gap (%) | 307,738 | 25.31% |
| Wage / Income Gap ($) | 307,738 | 74.69¢ per $1 |
| Gini / Inequality Index | 307,738 | 0.50 |
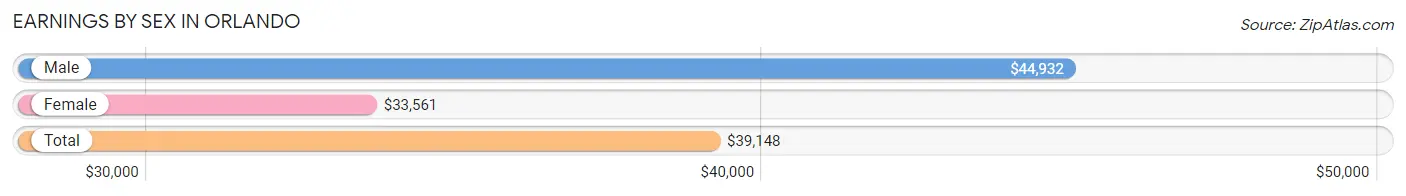
Earnings by Sex in Orlando
Average Earnings in Orlando are $39,148, $44,932 for men and $33,561 for women, a difference of 25.3%.
| Sex | Number | Average Earnings |
| Male | 94,486 (52.0%) | $44,932 |
| Female | 87,151 (48.0%) | $33,561 |
| Total | 181,637 (100.0%) | $39,148 |
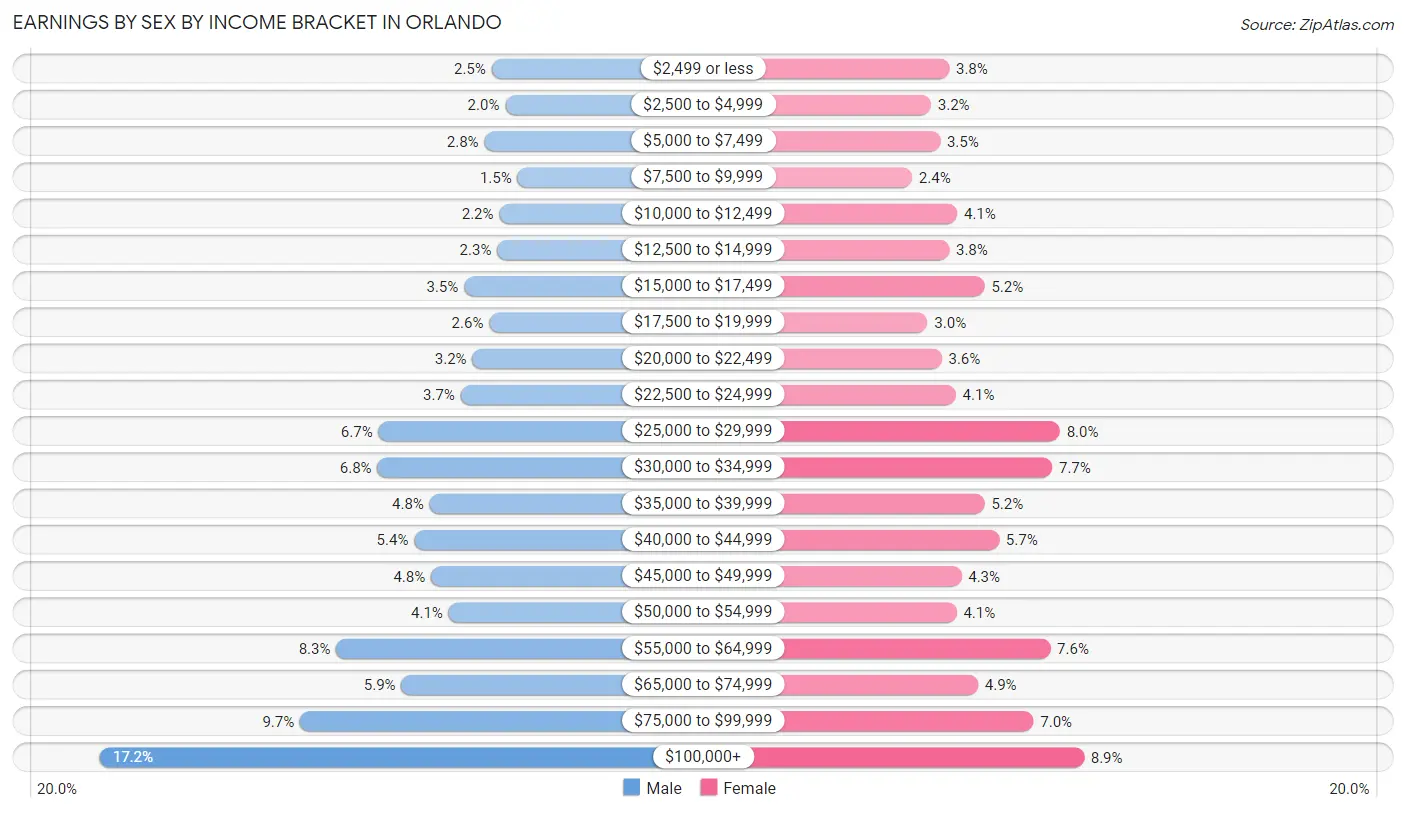
Earnings by Sex by Income Bracket in Orlando
The most common earnings brackets in Orlando are $100,000+ for men (16,233 | 17.2%) and $100,000+ for women (7,742 | 8.9%).
| Income | Male | Female |
| $2,499 or less | 2,365 (2.5%) | 3,334 (3.8%) |
| $2,500 to $4,999 | 1,879 (2.0%) | 2,747 (3.2%) |
| $5,000 to $7,499 | 2,620 (2.8%) | 3,045 (3.5%) |
| $7,500 to $9,999 | 1,444 (1.5%) | 2,125 (2.4%) |
| $10,000 to $12,499 | 2,091 (2.2%) | 3,597 (4.1%) |
| $12,500 to $14,999 | 2,168 (2.3%) | 3,340 (3.8%) |
| $15,000 to $17,499 | 3,335 (3.5%) | 4,499 (5.2%) |
| $17,500 to $19,999 | 2,448 (2.6%) | 2,636 (3.0%) |
| $20,000 to $22,499 | 3,044 (3.2%) | 3,095 (3.5%) |
| $22,500 to $24,999 | 3,461 (3.7%) | 3,552 (4.1%) |
| $25,000 to $29,999 | 6,373 (6.7%) | 6,953 (8.0%) |
| $30,000 to $34,999 | 6,408 (6.8%) | 6,703 (7.7%) |
| $35,000 to $39,999 | 4,551 (4.8%) | 4,496 (5.2%) |
| $40,000 to $44,999 | 5,106 (5.4%) | 4,965 (5.7%) |
| $45,000 to $49,999 | 4,511 (4.8%) | 3,735 (4.3%) |
| $50,000 to $54,999 | 3,884 (4.1%) | 3,580 (4.1%) |
| $55,000 to $64,999 | 7,859 (8.3%) | 6,641 (7.6%) |
| $65,000 to $74,999 | 5,557 (5.9%) | 4,275 (4.9%) |
| $75,000 to $99,999 | 9,149 (9.7%) | 6,091 (7.0%) |
| $100,000+ | 16,233 (17.2%) | 7,742 (8.9%) |
| Total | 94,486 (100.0%) | 87,151 (100.0%) |
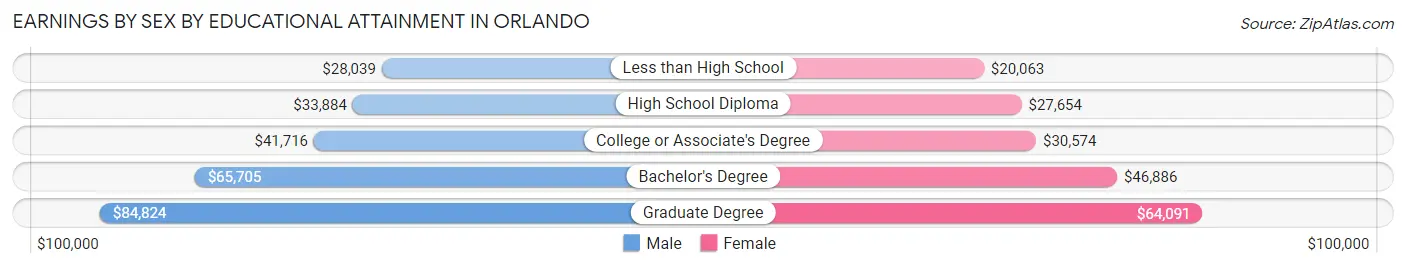
Earnings by Sex by Educational Attainment in Orlando
Average earnings in Orlando are $49,248 for men and $36,488 for women, a difference of 25.9%. Men with an educational attainment of graduate degree enjoy the highest average annual earnings of $84,824, while those with less than high school education earn the least with $28,039. Women with an educational attainment of graduate degree earn the most with the average annual earnings of $64,091, while those with less than high school education have the smallest earnings of $20,063.
| Educational Attainment | Male Income | Female Income |
| Less than High School | $28,039 | $20,063 |
| High School Diploma | $33,884 | $27,654 |
| College or Associate's Degree | $41,716 | $30,574 |
| Bachelor's Degree | $65,705 | $46,886 |
| Graduate Degree | $84,824 | $64,091 |
| Total | $49,248 | $36,488 |
Family Income in Orlando
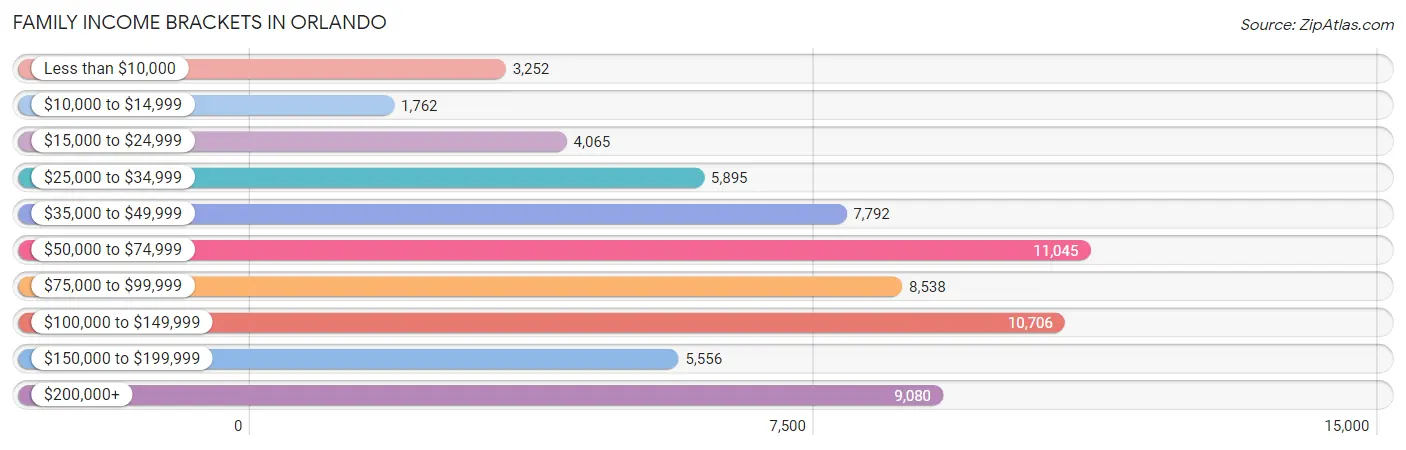
Family Income Brackets in Orlando
According to the Orlando family income data, there are 11,045 families falling into the $50,000 to $74,999 income range, which is the most common income bracket and makes up 16.3% of all families. Conversely, the $10,000 to $14,999 income bracket is the least frequent group with only 1,762 families (2.6%) belonging to this category.
| Income Bracket | # Families | % Families |
| Less than $10,000 | 3,252 | 4.8% |
| $10,000 to $14,999 | 1,762 | 2.6% |
| $15,000 to $24,999 | 4,065 | 6.0% |
| $25,000 to $34,999 | 5,895 | 8.7% |
| $35,000 to $49,999 | 7,792 | 11.5% |
| $50,000 to $74,999 | 11,045 | 16.3% |
| $75,000 to $99,999 | 8,538 | 12.6% |
| $100,000 to $149,999 | 10,706 | 15.8% |
| $150,000 to $199,999 | 5,556 | 8.2% |
| $200,000+ | 9,080 | 13.4% |
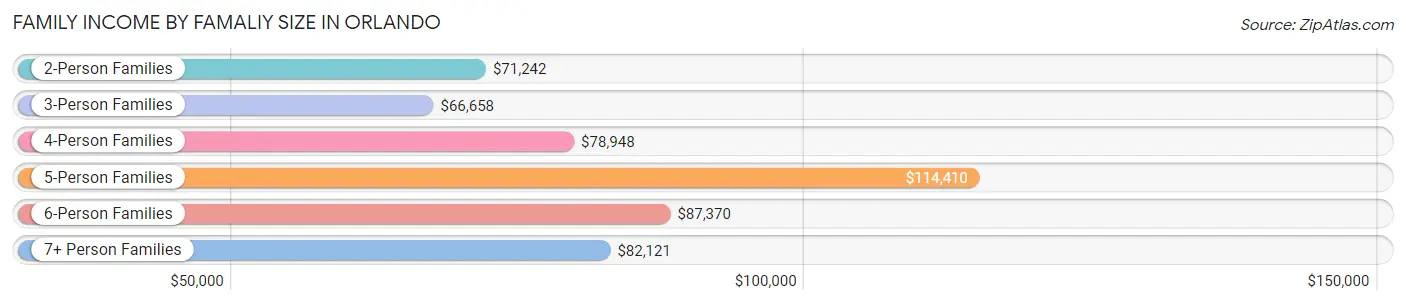
Family Income by Famaliy Size in Orlando
5-person families (4,636 | 6.8%) account for the highest median family income in Orlando with $114,410 per family, while 2-person families (31,594 | 46.6%) have the highest median income of $35,621 per family member.
| Income Bracket | # Families | Median Income |
| 2-Person Families | 31,594 (46.6%) | $71,242 |
| 3-Person Families | 16,951 (25.0%) | $66,658 |
| 4-Person Families | 11,895 (17.6%) | $78,948 |
| 5-Person Families | 4,636 (6.8%) | $114,410 |
| 6-Person Families | 1,584 (2.3%) | $87,370 |
| 7+ Person Families | 1,098 (1.6%) | $82,121 |
| Total | 67,758 (100.0%) | $74,980 |
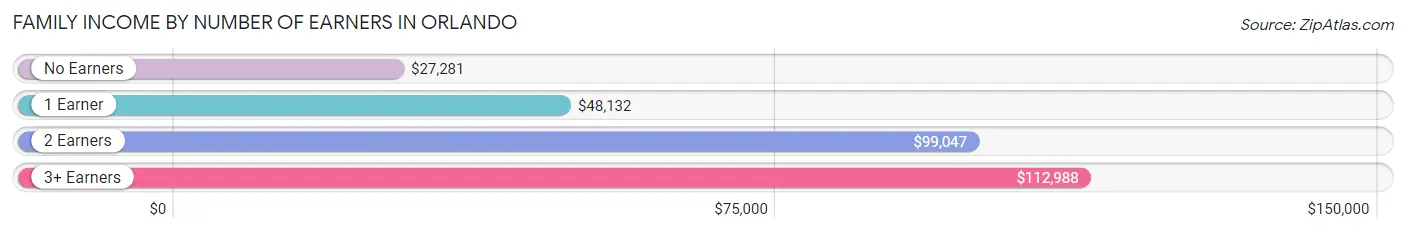
Family Income by Number of Earners in Orlando
The median family income in Orlando is $74,980, with families comprising 3+ earners (7,099) having the highest median family income of $112,988, while families with no earners (7,410) have the lowest median family income of $27,281, accounting for 10.5% and 10.9% of families, respectively.
| Number of Earners | # Families | Median Income |
| No Earners | 7,410 (10.9%) | $27,281 |
| 1 Earner | 23,628 (34.9%) | $48,132 |
| 2 Earners | 29,621 (43.7%) | $99,047 |
| 3+ Earners | 7,099 (10.5%) | $112,988 |
| Total | 67,758 (100.0%) | $74,980 |
Household Income in Orlando
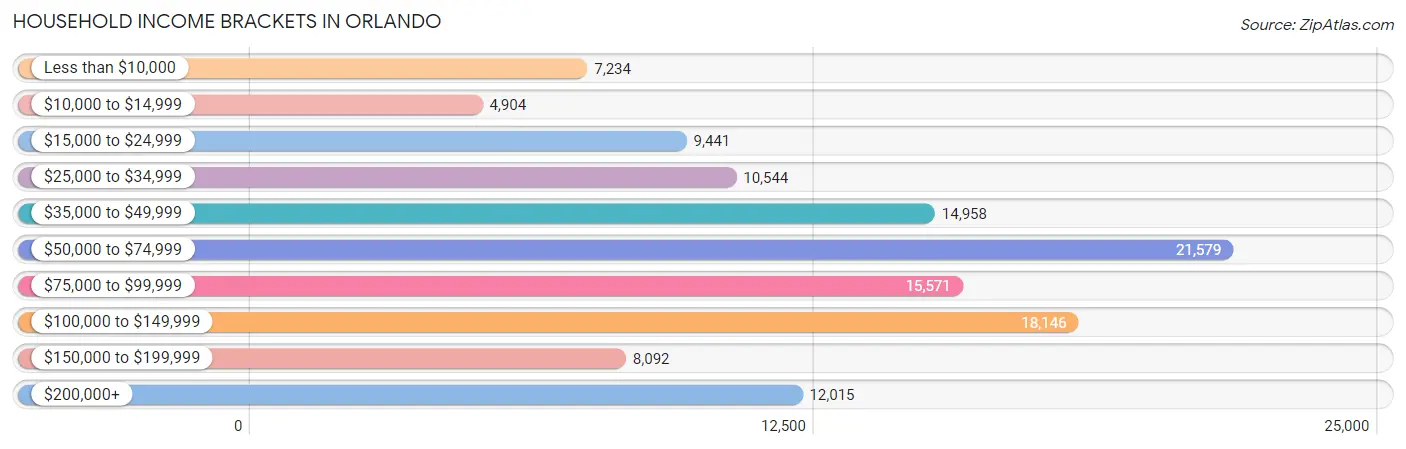
Household Income Brackets in Orlando
With 21,579 households falling in the category, the $50,000 to $74,999 income range is the most frequent in Orlando, accounting for 17.6% of all households. In contrast, only 4,904 households (4.0%) fall into the $10,000 to $14,999 income bracket, making it the least populous group.
| Income Bracket | # Households | % Households |
| Less than $10,000 | 7,234 | 5.9% |
| $10,000 to $14,999 | 4,904 | 4.0% |
| $15,000 to $24,999 | 9,441 | 7.7% |
| $25,000 to $34,999 | 10,544 | 8.6% |
| $35,000 to $49,999 | 14,958 | 12.2% |
| $50,000 to $74,999 | 21,579 | 17.6% |
| $75,000 to $99,999 | 15,571 | 12.7% |
| $100,000 to $149,999 | 18,146 | 14.8% |
| $150,000 to $199,999 | 8,092 | 6.6% |
| $200,000+ | 12,015 | 9.8% |
Household Income by Householder Age in Orlando
The median household income in Orlando is $66,292, with the highest median household income of $71,854 found in the 25 to 44 years age bracket for the primary householder. A total of 58,799 households (48.0%) fall into this category. Meanwhile, the 65+ years age bracket for the primary householder has the lowest median household income of $42,887, with 20,084 households (16.4%) in this group.
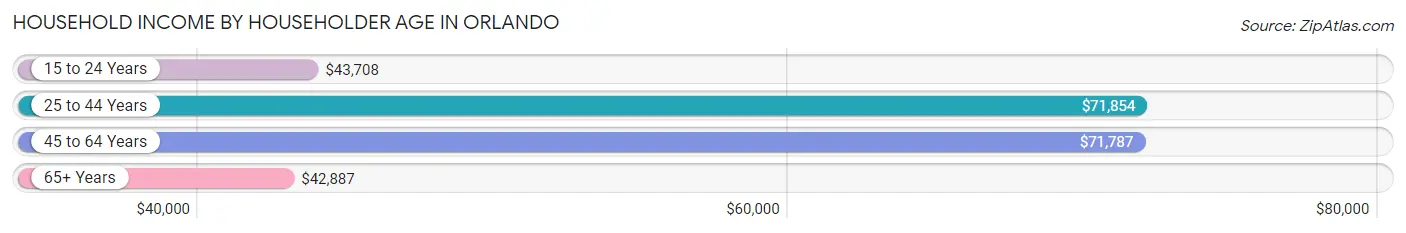
| Income Bracket | # Households | Median Income |
| 15 to 24 Years | 4,700 (3.8%) | $43,708 |
| 25 to 44 Years | 58,799 (48.0%) | $71,854 |
| 45 to 64 Years | 39,024 (31.8%) | $71,787 |
| 65+ Years | 20,084 (16.4%) | $42,887 |
| Total | 122,607 (100.0%) | $66,292 |
Poverty in Orlando
Income Below Poverty by Sex and Age in Orlando
With 13.5% poverty level for males and 16.7% for females among the residents of Orlando, 5 year old males and under 5 year old females are the most vulnerable to poverty, with 664 males (34.3%) and 2,199 females (23.4%) in their respective age groups living below the poverty level.
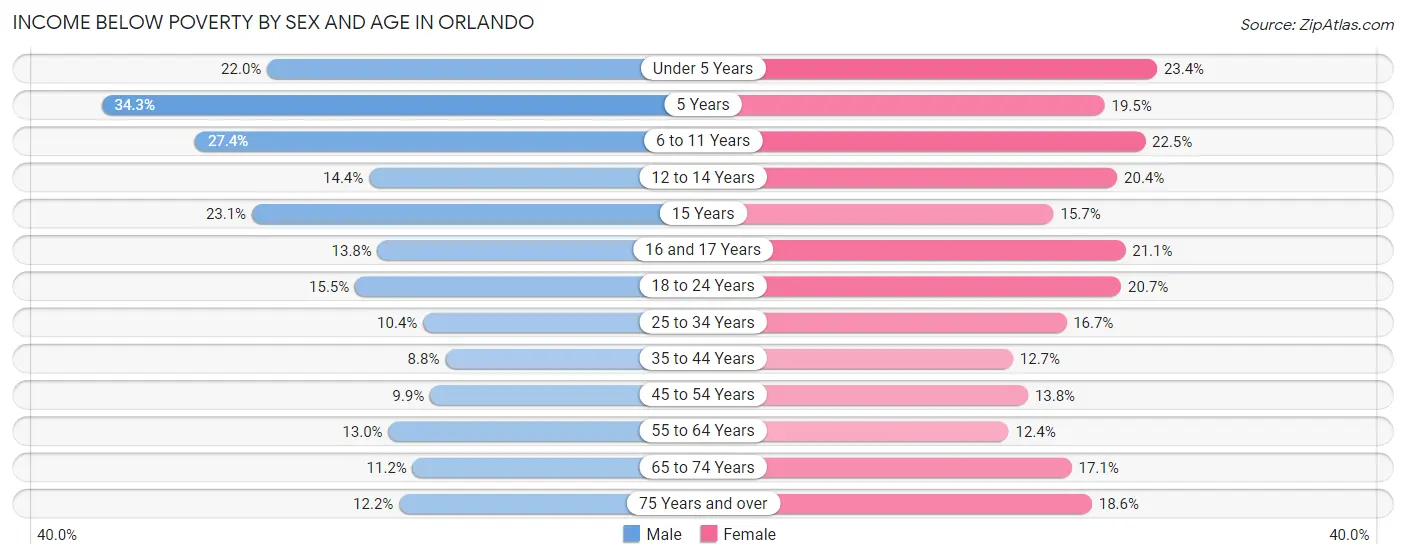
| Age Bracket | Male | Female |
| Under 5 Years | 2,157 (22.0%) | 2,199 (23.4%) |
| 5 Years | 664 (34.3%) | 325 (19.5%) |
| 6 to 11 Years | 3,029 (27.4%) | 2,100 (22.5%) |
| 12 to 14 Years | 694 (14.4%) | 985 (20.4%) |
| 15 Years | 417 (23.1%) | 211 (15.7%) |
| 16 and 17 Years | 430 (13.8%) | 887 (21.0%) |
| 18 to 24 Years | 1,789 (15.5%) | 2,684 (20.7%) |
| 25 to 34 Years | 3,372 (10.4%) | 5,605 (16.7%) |
| 35 to 44 Years | 2,230 (8.8%) | 3,082 (12.7%) |
| 45 to 54 Years | 1,910 (9.9%) | 2,537 (13.8%) |
| 55 to 64 Years | 1,932 (13.0%) | 2,045 (12.4%) |
| 65 to 74 Years | 910 (11.2%) | 1,862 (17.1%) |
| 75 Years and over | 589 (12.2%) | 1,524 (18.6%) |
| Total | 20,123 (13.5%) | 26,046 (16.7%) |
Income Above Poverty by Sex and Age in Orlando
According to the poverty statistics in Orlando, males aged 35 to 44 years and females aged 55 to 64 years are the age groups that are most secure financially, with 91.2% of males and 87.6% of females in these age groups living above the poverty line.
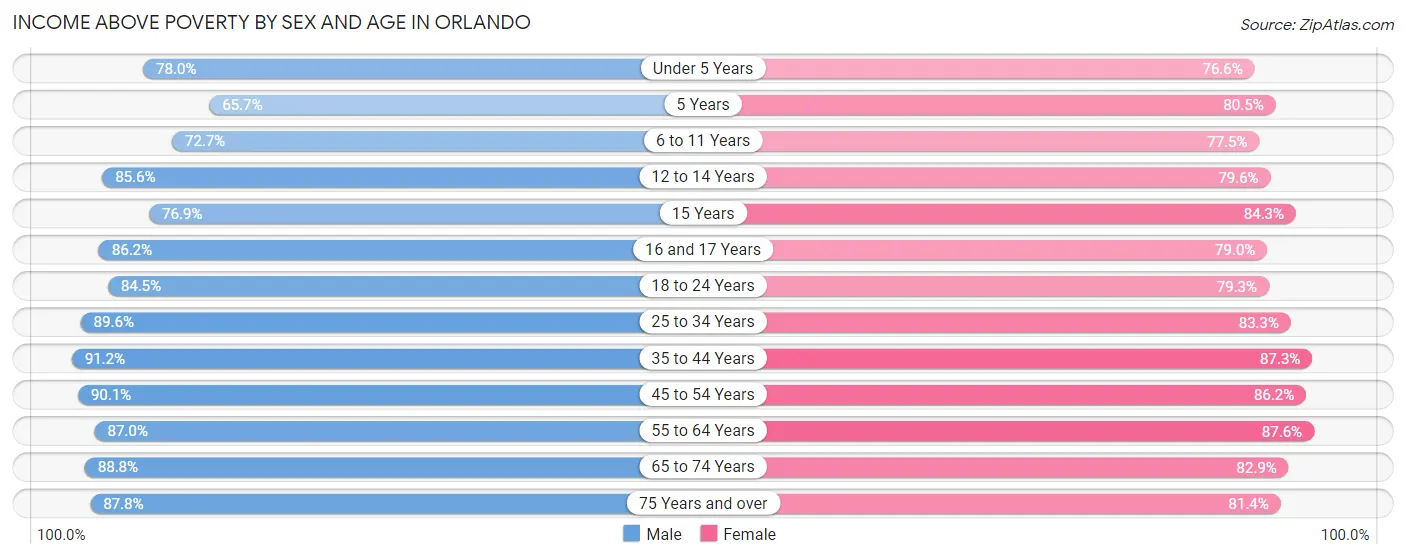
| Age Bracket | Male | Female |
| Under 5 Years | 7,654 (78.0%) | 7,199 (76.6%) |
| 5 Years | 1,273 (65.7%) | 1,341 (80.5%) |
| 6 to 11 Years | 8,047 (72.7%) | 7,223 (77.5%) |
| 12 to 14 Years | 4,119 (85.6%) | 3,833 (79.6%) |
| 15 Years | 1,387 (76.9%) | 1,131 (84.3%) |
| 16 and 17 Years | 2,688 (86.2%) | 3,327 (78.9%) |
| 18 to 24 Years | 9,784 (84.5%) | 10,257 (79.3%) |
| 25 to 34 Years | 29,019 (89.6%) | 28,043 (83.3%) |
| 35 to 44 Years | 23,204 (91.2%) | 21,179 (87.3%) |
| 45 to 54 Years | 17,375 (90.1%) | 15,826 (86.2%) |
| 55 to 64 Years | 12,942 (87.0%) | 14,469 (87.6%) |
| 65 to 74 Years | 7,224 (88.8%) | 9,055 (82.9%) |
| 75 Years and over | 4,243 (87.8%) | 6,689 (81.4%) |
| Total | 128,959 (86.5%) | 129,572 (83.3%) |
Income Below Poverty Among Married-Couple Families in Orlando
The poverty statistics for married-couple families in Orlando show that 7.6% or 3,270 of the total 42,775 families live below the poverty line. Families with 3 or 4 children have the highest poverty rate of 11.7%, comprising of 314 families. On the other hand, families with 5 or more children have the lowest poverty rate of 0.0%, which includes 0 families.
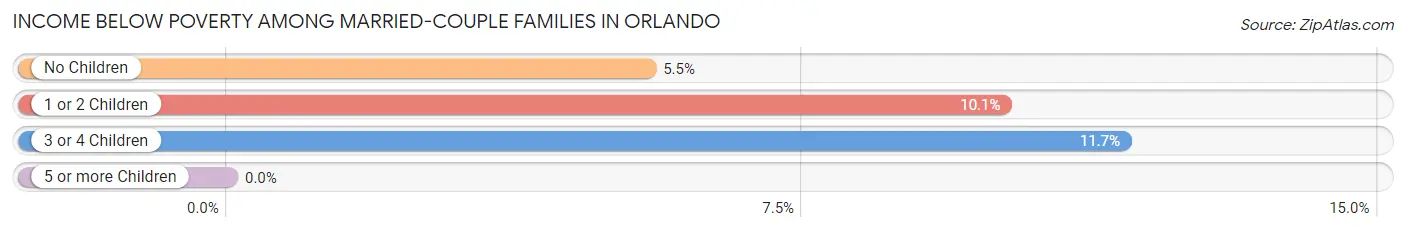
| Children | Above Poverty | Below Poverty |
| No Children | 22,131 (94.5%) | 1,278 (5.5%) |
| 1 or 2 Children | 14,925 (89.9%) | 1,678 (10.1%) |
| 3 or 4 Children | 2,377 (88.3%) | 314 (11.7%) |
| 5 or more Children | 72 (100.0%) | 0 (0.0%) |
| Total | 39,505 (92.4%) | 3,270 (7.6%) |
Income Below Poverty Among Single-Parent Households in Orlando
According to the poverty data in Orlando, 14.1% or 891 single-father households and 22.8% or 4,264 single-mother households are living below the poverty line. Among single-father households, those with 3 or 4 children have the highest poverty rate, with 115 households (42.7%) experiencing poverty. Likewise, among single-mother households, those with 5 or more children have the highest poverty rate, with 215 households (61.8%) falling below the poverty line.
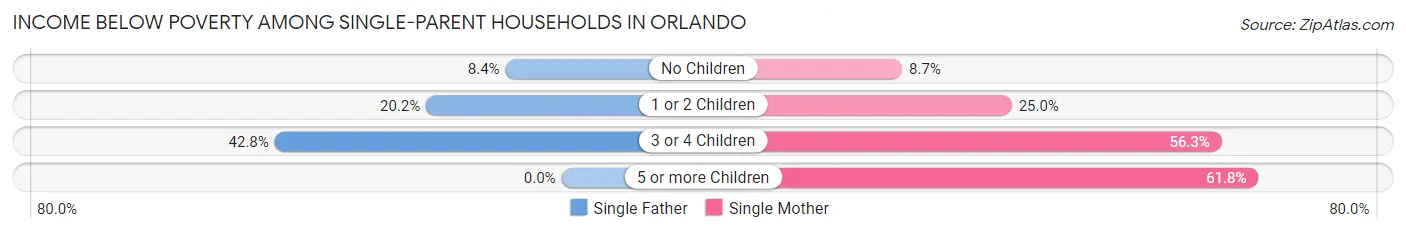
| Children | Single Father | Single Mother |
| No Children | 313 (8.4%) | 604 (8.7%) |
| 1 or 2 Children | 463 (20.2%) | 2,375 (25.0%) |
| 3 or 4 Children | 115 (42.7%) | 1,070 (56.3%) |
| 5 or more Children | 0 (0.0%) | 215 (61.8%) |
| Total | 891 (14.1%) | 4,264 (22.8%) |
Income Below Poverty Among Married-Couple vs Single-Parent Households in Orlando
The poverty data for Orlando shows that 3,270 of the married-couple family households (7.6%) and 5,155 of the single-parent households (20.6%) are living below the poverty level. Within the married-couple family households, those with 3 or 4 children have the highest poverty rate, with 314 households (11.7%) falling below the poverty line. Among the single-parent households, those with 5 or more children have the highest poverty rate, with 215 household (61.8%) living below poverty.
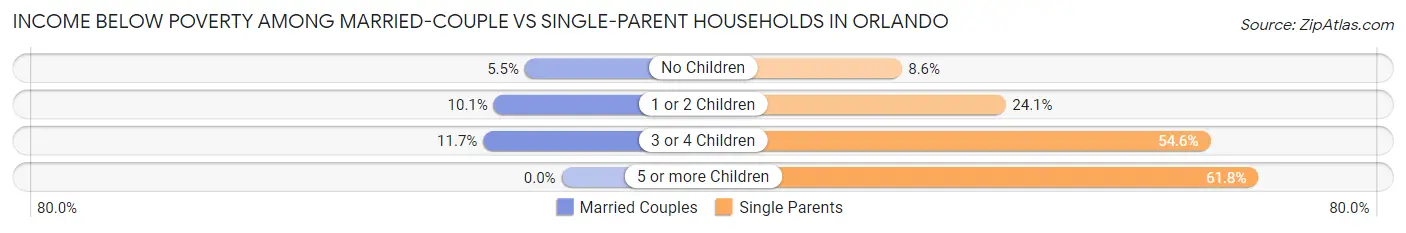
| Children | Married-Couple Families | Single-Parent Households |
| No Children | 1,278 (5.5%) | 917 (8.6%) |
| 1 or 2 Children | 1,678 (10.1%) | 2,838 (24.1%) |
| 3 or 4 Children | 314 (11.7%) | 1,185 (54.6%) |
| 5 or more Children | 0 (0.0%) | 215 (61.8%) |
| Total | 3,270 (7.6%) | 5,155 (20.6%) |
Race in Orlando
The most populous races in Orlando are White / Caucasian (149,183 | 48.5%), Hispanic or Latino (107,128 | 34.8%), and Black / African American (71,661 | 23.3%).
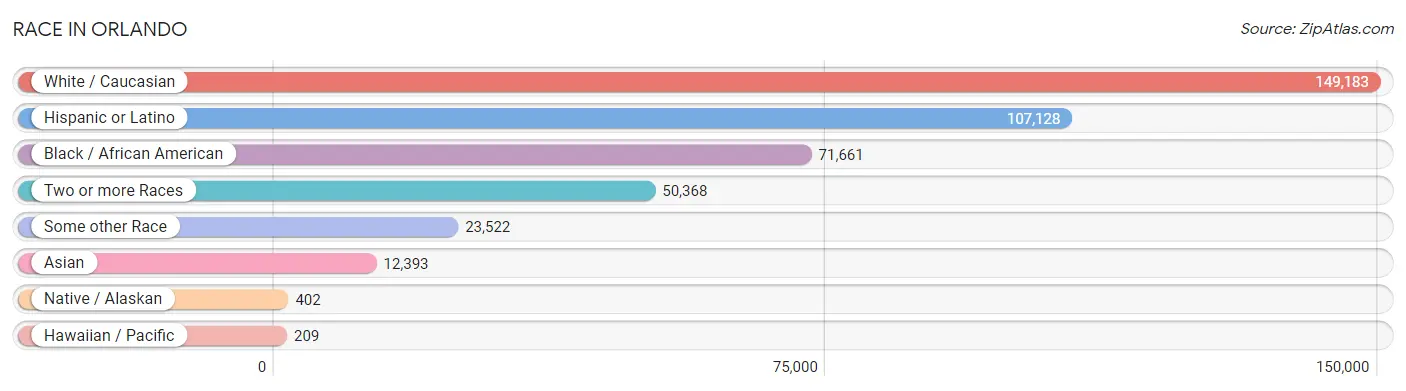
| Race | # Population | % Population |
| Asian | 12,393 | 4.0% |
| Black / African American | 71,661 | 23.3% |
| Hawaiian / Pacific | 209 | 0.1% |
| Hispanic or Latino | 107,128 | 34.8% |
| Native / Alaskan | 402 | 0.1% |
| White / Caucasian | 149,183 | 48.5% |
| Two or more Races | 50,368 | 16.4% |
| Some other Race | 23,522 | 7.6% |
| Total | 307,738 | 100.0% |
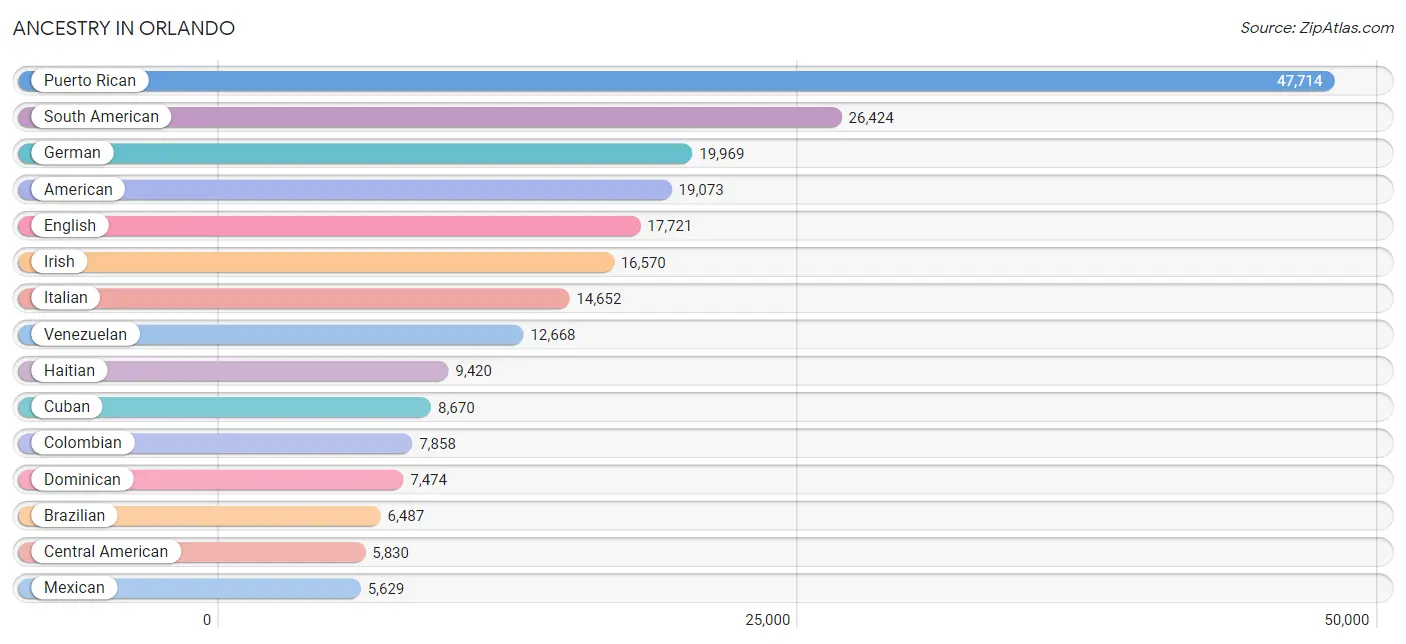
Ancestry in Orlando
The most populous ancestries reported in Orlando are Puerto Rican (47,714 | 15.5%), South American (26,424 | 8.6%), German (19,969 | 6.5%), American (19,073 | 6.2%), and English (17,721 | 5.8%), together accounting for 42.5% of all Orlando residents.
| Ancestry | # Population | % Population |
| African | 1,457 | 0.5% |
| Albanian | 20 | 0.0% |
| Aleut | 13 | 0.0% |
| American | 19,073 | 6.2% |
| Apache | 9 | 0.0% |
| Arab | 3,642 | 1.2% |
| Argentinean | 939 | 0.3% |
| Armenian | 71 | 0.0% |
| Australian | 25 | 0.0% |
| Austrian | 297 | 0.1% |
| Bahamian | 502 | 0.2% |
| Barbadian | 28 | 0.0% |
| Basque | 10 | 0.0% |
| Belgian | 50 | 0.0% |
| Belizean | 48 | 0.0% |
| Bhutanese | 886 | 0.3% |
| Blackfeet | 114 | 0.0% |
| Bolivian | 110 | 0.0% |
| Brazilian | 6,487 | 2.1% |
| British | 1,479 | 0.5% |
| British West Indian | 208 | 0.1% |
| Bulgarian | 586 | 0.2% |
| Burmese | 776 | 0.3% |
| Cajun | 20 | 0.0% |
| Cambodian | 11 | 0.0% |
| Canadian | 519 | 0.2% |
| Cape Verdean | 49 | 0.0% |
| Central American | 5,830 | 1.9% |
| Central American Indian | 185 | 0.1% |
| Cherokee | 519 | 0.2% |
| Chickasaw | 19 | 0.0% |
| Chilean | 414 | 0.1% |
| Chinese | 15 | 0.0% |
| Chippewa | 20 | 0.0% |
| Choctaw | 69 | 0.0% |
| Colombian | 7,858 | 2.5% |
| Comanche | 19 | 0.0% |
| Costa Rican | 978 | 0.3% |
| Creek | 27 | 0.0% |
| Croatian | 136 | 0.0% |
| Cuban | 8,670 | 2.8% |
| Czech | 540 | 0.2% |
| Czechoslovakian | 172 | 0.1% |
| Danish | 504 | 0.2% |
| Delaware | 31 | 0.0% |
| Dominican | 7,474 | 2.4% |
| Dutch | 1,850 | 0.6% |
| Eastern European | 455 | 0.2% |
| Ecuadorian | 2,118 | 0.7% |
| Egyptian | 92 | 0.0% |
| English | 17,721 | 5.8% |
| Ethiopian | 14 | 0.0% |
| European | 3,078 | 1.0% |
| Fijian | 20 | 0.0% |
| Filipino | 78 | 0.0% |
| Finnish | 338 | 0.1% |
| French | 4,604 | 1.5% |
| French American Indian | 11 | 0.0% |
| French Canadian | 660 | 0.2% |
| German | 19,969 | 6.5% |
| Ghanaian | 208 | 0.1% |
| Greek | 907 | 0.3% |
| Guamanian / Chamorro | 53 | 0.0% |
| Guatemalan | 1,401 | 0.5% |
| Guyanese | 410 | 0.1% |
| Haitian | 9,420 | 3.1% |
| Honduran | 1,073 | 0.4% |
| Hungarian | 483 | 0.2% |
| Icelander | 357 | 0.1% |
| Indian (Asian) | 3,872 | 1.3% |
| Indonesian | 119 | 0.0% |
| Iranian | 209 | 0.1% |
| Iraqi | 18 | 0.0% |
| Irish | 16,570 | 5.4% |
| Iroquois | 15 | 0.0% |
| Israeli | 510 | 0.2% |
| Italian | 14,652 | 4.8% |
| Jamaican | 4,303 | 1.4% |
| Japanese | 65 | 0.0% |
| Jordanian | 160 | 0.1% |
| Kenyan | 15 | 0.0% |
| Korean | 3,038 | 1.0% |
| Laotian | 90 | 0.0% |
| Latvian | 9 | 0.0% |
| Lebanese | 1,213 | 0.4% |
| Lithuanian | 366 | 0.1% |
| Luxembourger | 21 | 0.0% |
| Macedonian | 28 | 0.0% |
| Malaysian | 95 | 0.0% |
| Maltese | 8 | 0.0% |
| Mexican | 5,629 | 1.8% |
| Mexican American Indian | 38 | 0.0% |
| Moroccan | 491 | 0.2% |
| Native Hawaiian | 391 | 0.1% |
| Navajo | 25 | 0.0% |
| New Zealander | 15 | 0.0% |
| Nicaraguan | 885 | 0.3% |
| Nigerian | 287 | 0.1% |
| Northern European | 430 | 0.1% |
| Norwegian | 926 | 0.3% |
| Okinawan | 16 | 0.0% |
| Osage | 38 | 0.0% |
| Pakistani | 262 | 0.1% |
| Palestinian | 232 | 0.1% |
| Panamanian | 762 | 0.3% |
| Paraguayan | 143 | 0.1% |
| Pennsylvania German | 100 | 0.0% |
| Peruvian | 2,012 | 0.6% |
| Pima | 19 | 0.0% |
| Polish | 4,943 | 1.6% |
| Portuguese | 2,584 | 0.8% |
| Puerto Rican | 47,714 | 15.5% |
| Romanian | 218 | 0.1% |
| Russian | 1,631 | 0.5% |
| Salvadoran | 690 | 0.2% |
| Samoan | 101 | 0.0% |
| Scandinavian | 636 | 0.2% |
| Scotch-Irish | 1,841 | 0.6% |
| Scottish | 2,617 | 0.9% |
| Seminole | 46 | 0.0% |
| Serbian | 33 | 0.0% |
| Sioux | 62 | 0.0% |
| Slavic | 159 | 0.1% |
| Slovak | 593 | 0.2% |
| Slovene | 192 | 0.1% |
| South African | 64 | 0.0% |
| South American | 26,424 | 8.6% |
| South American Indian | 101 | 0.0% |
| Spaniard | 1,388 | 0.4% |
| Spanish | 408 | 0.1% |
| Spanish American | 44 | 0.0% |
| Sri Lankan | 1,814 | 0.6% |
| Subsaharan African | 2,358 | 0.8% |
| Swedish | 1,331 | 0.4% |
| Swiss | 245 | 0.1% |
| Syrian | 379 | 0.1% |
| Thai | 4,418 | 1.4% |
| Tlingit-Haida | 6 | 0.0% |
| Trinidadian and Tobagonian | 933 | 0.3% |
| Turkish | 106 | 0.0% |
| U.S. Virgin Islander | 1,043 | 0.3% |
| Ukrainian | 1,095 | 0.4% |
| Uruguayan | 113 | 0.0% |
| Venezuelan | 12,668 | 4.1% |
| Vietnamese | 8 | 0.0% |
| Welsh | 1,106 | 0.4% |
| West Indian | 546 | 0.2% |
| Yugoslavian | 45 | 0.0% |
| Zimbabwean | 51 | 0.0% | View All 149 Rows |
Immigrants in Orlando
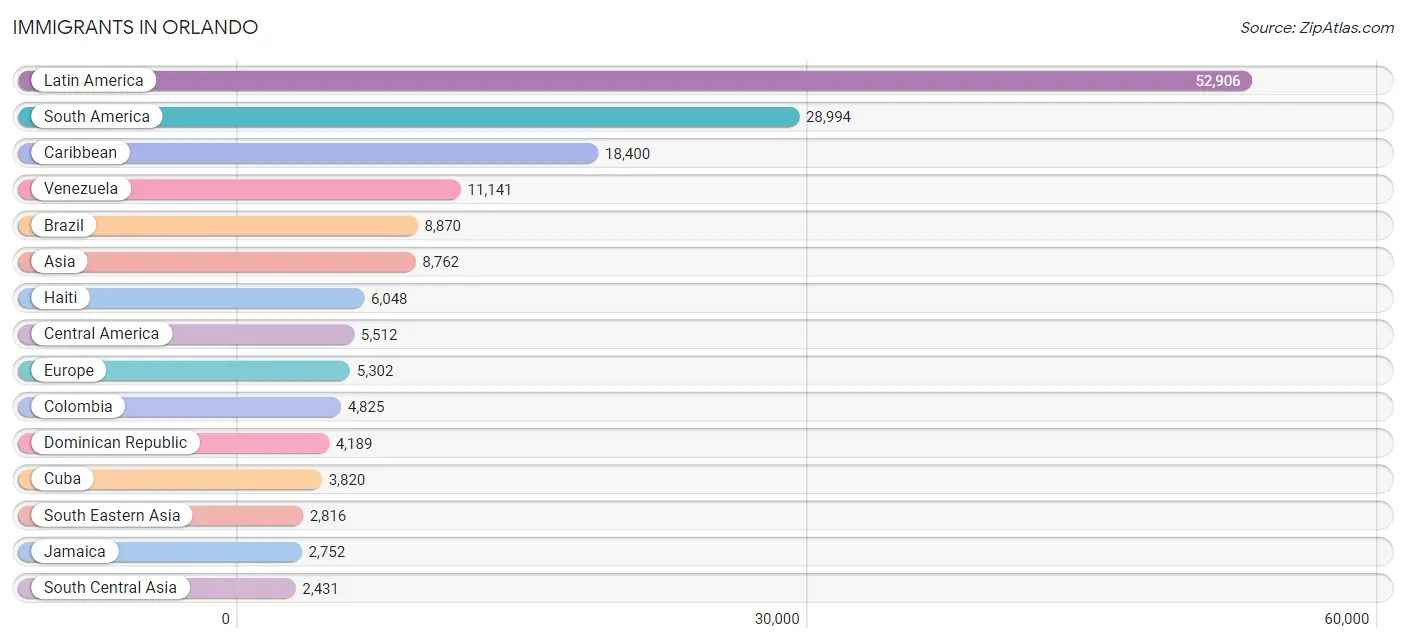
The most numerous immigrant groups reported in Orlando came from Latin America (52,906 | 17.2%), South America (28,994 | 9.4%), Caribbean (18,400 | 6.0%), Venezuela (11,141 | 3.6%), and Brazil (8,870 | 2.9%), together accounting for 39.1% of all Orlando residents.
| Immigration Origin | # Population | % Population |
| Africa | 1,608 | 0.5% |
| Albania | 20 | 0.0% |
| Argentina | 614 | 0.2% |
| Asia | 8,762 | 2.9% |
| Australia | 40 | 0.0% |
| Austria | 48 | 0.0% |
| Bahamas | 207 | 0.1% |
| Bangladesh | 39 | 0.0% |
| Barbados | 31 | 0.0% |
| Belarus | 75 | 0.0% |
| Belgium | 72 | 0.0% |
| Belize | 53 | 0.0% |
| Bolivia | 81 | 0.0% |
| Brazil | 8,870 | 2.9% |
| Bulgaria | 511 | 0.2% |
| Cabo Verde | 31 | 0.0% |
| Cambodia | 47 | 0.0% |
| Canada | 692 | 0.2% |
| Caribbean | 18,400 | 6.0% |
| Central America | 5,512 | 1.8% |
| Chile | 328 | 0.1% |
| China | 1,335 | 0.4% |
| Colombia | 4,825 | 1.6% |
| Congo | 82 | 0.0% |
| Costa Rica | 484 | 0.2% |
| Croatia | 11 | 0.0% |
| Cuba | 3,820 | 1.2% |
| Czechoslovakia | 114 | 0.0% |
| Dominica | 105 | 0.0% |
| Dominican Republic | 4,189 | 1.4% |
| Eastern Africa | 240 | 0.1% |
| Eastern Asia | 2,030 | 0.7% |
| Eastern Europe | 1,943 | 0.6% |
| Ecuador | 940 | 0.3% |
| Egypt | 94 | 0.0% |
| El Salvador | 287 | 0.1% |
| England | 438 | 0.1% |
| Ethiopia | 11 | 0.0% |
| Europe | 5,302 | 1.7% |
| France | 326 | 0.1% |
| Germany | 634 | 0.2% |
| Ghana | 170 | 0.1% |
| Greece | 53 | 0.0% |
| Grenada | 67 | 0.0% |
| Guatemala | 777 | 0.3% |
| Guyana | 441 | 0.1% |
| Haiti | 6,048 | 2.0% |
| Honduras | 761 | 0.3% |
| Hong Kong | 36 | 0.0% |
| Hungary | 42 | 0.0% |
| India | 1,946 | 0.6% |
| Indonesia | 30 | 0.0% |
| Iran | 86 | 0.0% |
| Ireland | 58 | 0.0% |
| Israel | 304 | 0.1% |
| Italy | 101 | 0.0% |
| Jamaica | 2,752 | 0.9% |
| Japan | 220 | 0.1% |
| Jordan | 82 | 0.0% |
| Kazakhstan | 186 | 0.1% |
| Kenya | 25 | 0.0% |
| Korea | 475 | 0.2% |
| Kuwait | 19 | 0.0% |
| Laos | 64 | 0.0% |
| Latin America | 52,906 | 17.2% |
| Lebanon | 391 | 0.1% |
| Lithuania | 25 | 0.0% |
| Malaysia | 60 | 0.0% |
| Mexico | 2,225 | 0.7% |
| Middle Africa | 109 | 0.0% |
| Moldova | 35 | 0.0% |
| Morocco | 424 | 0.1% |
| Netherlands | 29 | 0.0% |
| Nicaragua | 643 | 0.2% |
| Nigeria | 122 | 0.0% |
| Northern Africa | 773 | 0.3% |
| Northern Europe | 1,271 | 0.4% |
| Norway | 14 | 0.0% |
| Oceania | 55 | 0.0% |
| Pakistan | 163 | 0.1% |
| Panama | 282 | 0.1% |
| Peru | 1,576 | 0.5% |
| Philippines | 1,357 | 0.4% |
| Poland | 40 | 0.0% |
| Portugal | 111 | 0.0% |
| Romania | 56 | 0.0% |
| Russia | 409 | 0.1% |
| Saudi Arabia | 156 | 0.1% |
| Scotland | 10 | 0.0% |
| Serbia | 12 | 0.0% |
| Singapore | 350 | 0.1% |
| South Africa | 129 | 0.0% |
| South America | 28,994 | 9.4% |
| South Central Asia | 2,431 | 0.8% |
| South Eastern Asia | 2,816 | 0.9% |
| Southern Europe | 871 | 0.3% |
| Spain | 606 | 0.2% |
| Sri Lanka | 11 | 0.0% |
| St. Vincent and the Grenadines | 24 | 0.0% |
| Sweden | 64 | 0.0% |
| Switzerland | 79 | 0.0% |
| Syria | 313 | 0.1% |
| Taiwan | 173 | 0.1% |
| Thailand | 38 | 0.0% |
| Trinidad and Tobago | 555 | 0.2% |
| Turkey | 50 | 0.0% |
| Ukraine | 513 | 0.2% |
| Uruguay | 42 | 0.0% |
| Venezuela | 11,141 | 3.6% |
| Vietnam | 775 | 0.3% |
| West Indies | 57 | 0.0% |
| Western Africa | 323 | 0.1% |
| Western Asia | 1,449 | 0.5% |
| Western Europe | 1,188 | 0.4% |
| Zimbabwe | 91 | 0.0% | View All 115 Rows |
Sex and Age in Orlando
Sex and Age in Orlando
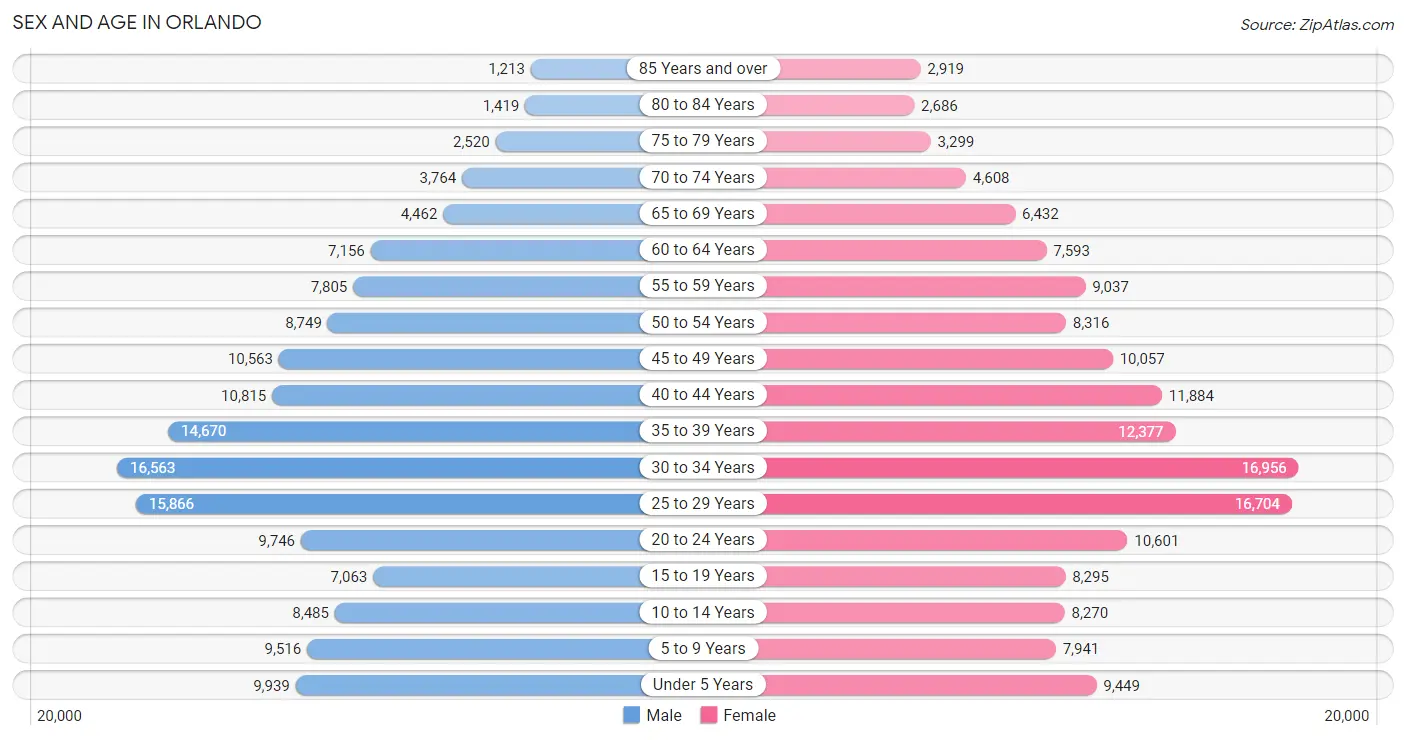
The most populous age groups in Orlando are 30 to 34 Years (16,563 | 11.0%) for men and 30 to 34 Years (16,956 | 10.8%) for women.
| Age Bracket | Male | Female |
| Under 5 Years | 9,939 (6.6%) | 9,449 (6.0%) |
| 5 to 9 Years | 9,516 (6.3%) | 7,941 (5.0%) |
| 10 to 14 Years | 8,485 (5.6%) | 8,270 (5.2%) |
| 15 to 19 Years | 7,063 (4.7%) | 8,295 (5.3%) |
| 20 to 24 Years | 9,746 (6.5%) | 10,601 (6.7%) |
| 25 to 29 Years | 15,866 (10.6%) | 16,704 (10.6%) |
| 30 to 34 Years | 16,563 (11.0%) | 16,956 (10.8%) |
| 35 to 39 Years | 14,670 (9.8%) | 12,377 (7.9%) |
| 40 to 44 Years | 10,815 (7.2%) | 11,884 (7.5%) |
| 45 to 49 Years | 10,563 (7.0%) | 10,057 (6.4%) |
| 50 to 54 Years | 8,749 (5.8%) | 8,316 (5.3%) |
| 55 to 59 Years | 7,805 (5.2%) | 9,037 (5.7%) |
| 60 to 64 Years | 7,156 (4.8%) | 7,593 (4.8%) |
| 65 to 69 Years | 4,462 (3.0%) | 6,432 (4.1%) |
| 70 to 74 Years | 3,764 (2.5%) | 4,608 (2.9%) |
| 75 to 79 Years | 2,520 (1.7%) | 3,299 (2.1%) |
| 80 to 84 Years | 1,419 (0.9%) | 2,686 (1.7%) |
| 85 Years and over | 1,213 (0.8%) | 2,919 (1.8%) |
| Total | 150,314 (100.0%) | 157,424 (100.0%) |
Families and Households in Orlando
Median Family Size in Orlando
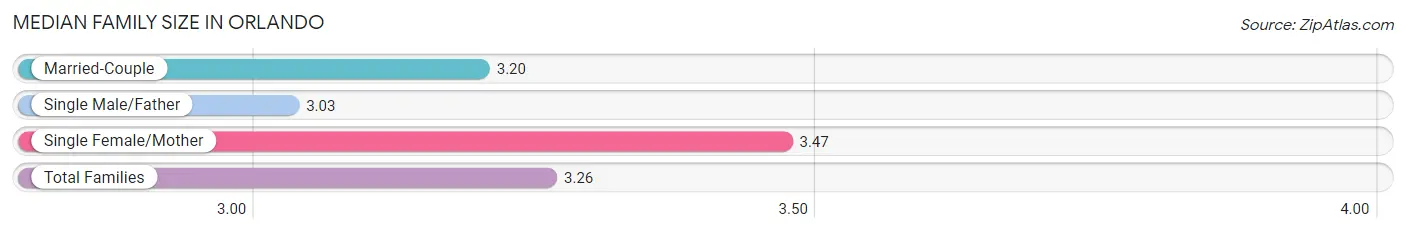
The median family size in Orlando is 3.26 persons per family, with single female/mother families (18,669 | 27.6%) accounting for the largest median family size of 3.47 persons per family. On the other hand, single male/father families (6,314 | 9.3%) represent the smallest median family size with 3.03 persons per family.
| Family Type | # Families | Family Size |
| Married-Couple | 42,775 (63.1%) | 3.20 |
| Single Male/Father | 6,314 (9.3%) | 3.03 |
| Single Female/Mother | 18,669 (27.6%) | 3.47 |
| Total Families | 67,758 (100.0%) | 3.26 |
Median Household Size in Orlando
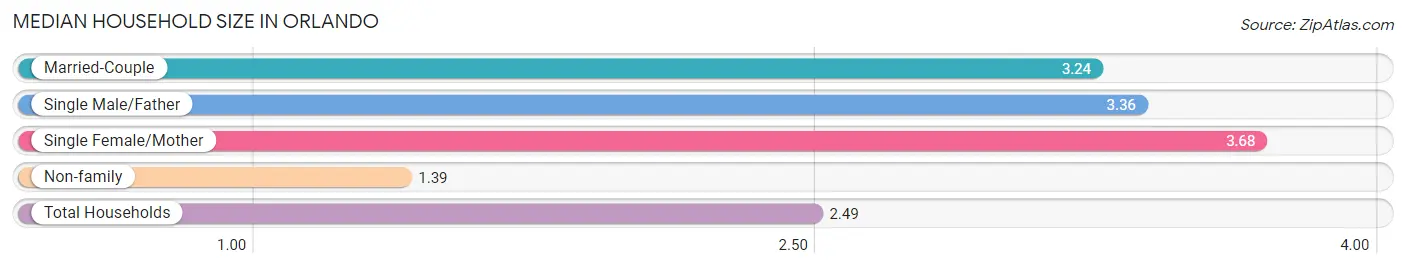
The median household size in Orlando is 2.49 persons per household, with single female/mother households (18,669 | 15.2%) accounting for the largest median household size of 3.68 persons per household. non-family households (54,849 | 44.7%) represent the smallest median household size with 1.39 persons per household.
| Household Type | # Households | Household Size |
| Married-Couple | 42,775 (34.9%) | 3.24 |
| Single Male/Father | 6,314 (5.1%) | 3.36 |
| Single Female/Mother | 18,669 (15.2%) | 3.68 |
| Non-family | 54,849 (44.7%) | 1.39 |
| Total Households | 122,607 (100.0%) | 2.49 |
Household Size by Marriage Status in Orlando
Out of a total of 122,607 households in Orlando, 67,758 (55.3%) are family households, while 54,849 (44.7%) are nonfamily households. The most numerous type of family households are 2-person households, comprising 28,873, and the most common type of nonfamily households are 1-person households, comprising 40,231.
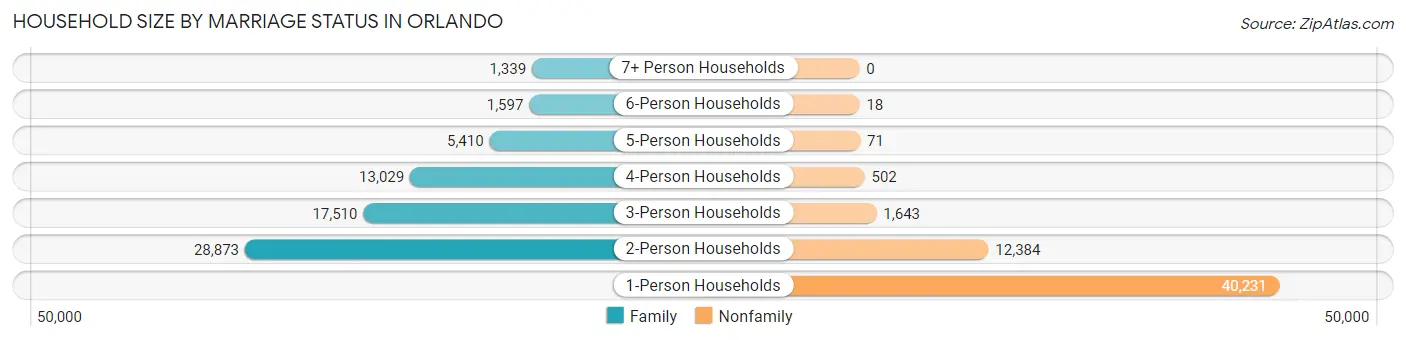
| Household Size | Family Households | Nonfamily Households |
| 1-Person Households | - | 40,231 (32.8%) |
| 2-Person Households | 28,873 (23.5%) | 12,384 (10.1%) |
| 3-Person Households | 17,510 (14.3%) | 1,643 (1.3%) |
| 4-Person Households | 13,029 (10.6%) | 502 (0.4%) |
| 5-Person Households | 5,410 (4.4%) | 71 (0.1%) |
| 6-Person Households | 1,597 (1.3%) | 18 (0.0%) |
| 7+ Person Households | 1,339 (1.1%) | 0 (0.0%) |
| Total | 67,758 (55.3%) | 54,849 (44.7%) |
Female Fertility in Orlando
Fertility by Age in Orlando
Average fertility rate in Orlando is 46.0 births per 1,000 women. Women in the age bracket of 20 to 34 years have the highest fertility rate with 74.0 births per 1,000 women. Women in the age bracket of 20 to 34 years acount for 79.0% of all women with births.
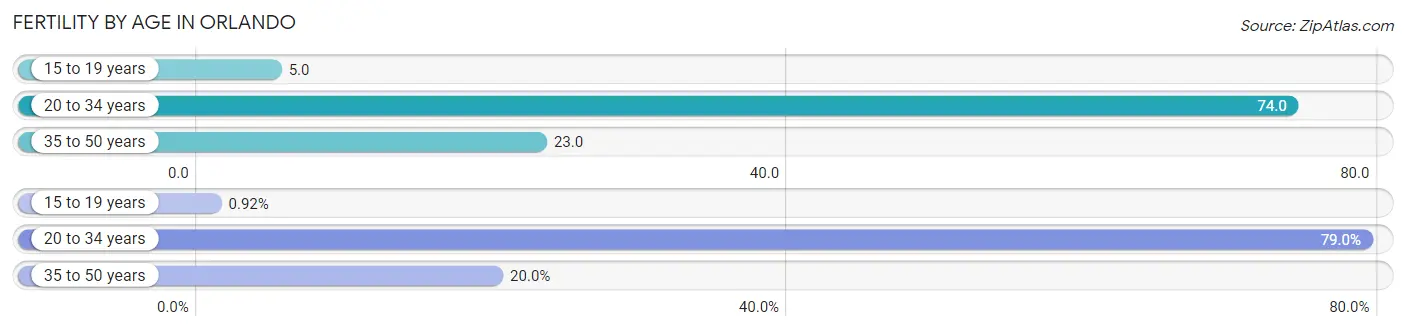
| Age Bracket | Women with Births | Births / 1,000 Women |
| 15 to 19 years | 38 (0.9%) | 5.0 |
| 20 to 34 years | 3,255 (79.0%) | 74.0 |
| 35 to 50 years | 825 (20.0%) | 23.0 |
| Total | 4,118 (100.0%) | 46.0 |
Fertility by Age by Marriage Status in Orlando
66.2% of women with births (4,118) in Orlando are married. The highest percentage of unmarried women with births falls into 15 to 19 years age bracket with 100.0% of them unmarried at the time of birth, while the lowest percentage of unmarried women with births belong to 35 to 50 years age bracket with 29.3% of them unmarried.
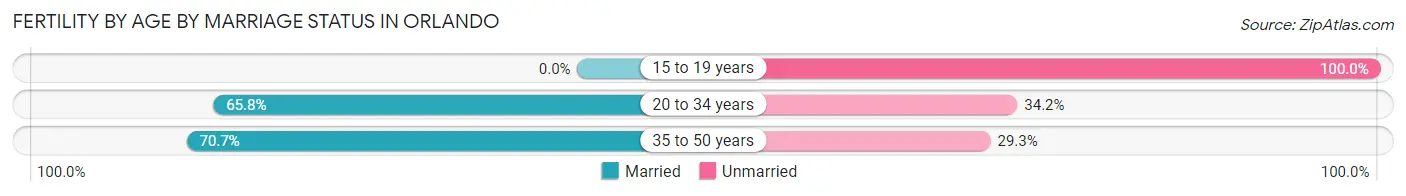
| Age Bracket | Married | Unmarried |
| 15 to 19 years | 0 (0.0%) | 38 (100.0%) |
| 20 to 34 years | 2,142 (65.8%) | 1,113 (34.2%) |
| 35 to 50 years | 583 (70.7%) | 242 (29.3%) |
| Total | 2,726 (66.2%) | 1,392 (33.8%) |
Fertility by Education in Orlando
Average fertility rate in Orlando is 46.0 births per 1,000 women. Women with the education attainment of high school diploma have the highest fertility rate of 68.0 births per 1,000 women, while women with the education attainment of less than high school have the lowest fertility at 39.0 births per 1,000 women. Women with the education attainment of high school diploma represent 27.7% of all women with births.
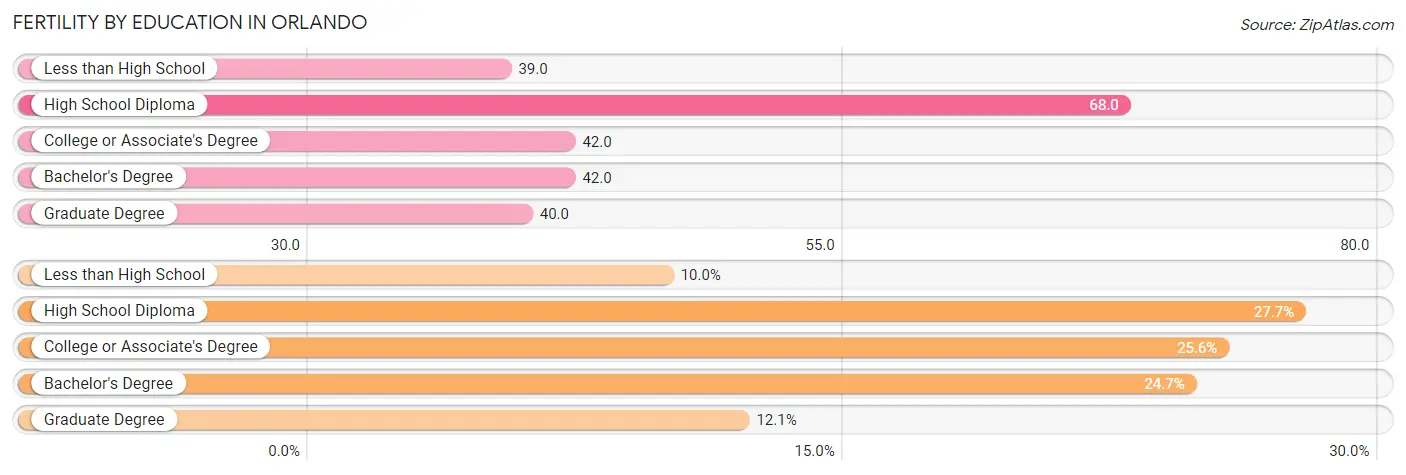
| Educational Attainment | Women with Births | Births / 1,000 Women |
| Less than High School | 410 (10.0%) | 39.0 |
| High School Diploma | 1,142 (27.7%) | 68.0 |
| College or Associate's Degree | 1,053 (25.6%) | 42.0 |
| Bachelor's Degree | 1,015 (24.6%) | 42.0 |
| Graduate Degree | 498 (12.1%) | 40.0 |
| Total | 4,118 (100.0%) | 46.0 |
Fertility by Education by Marriage Status in Orlando
33.8% of women with births in Orlando are unmarried. Women with the educational attainment of graduate degree are most likely to be married with 98.6% of them married at childbirth, while women with the educational attainment of college or associate's degree are least likely to be married with 53.2% of them unmarried at childbirth.
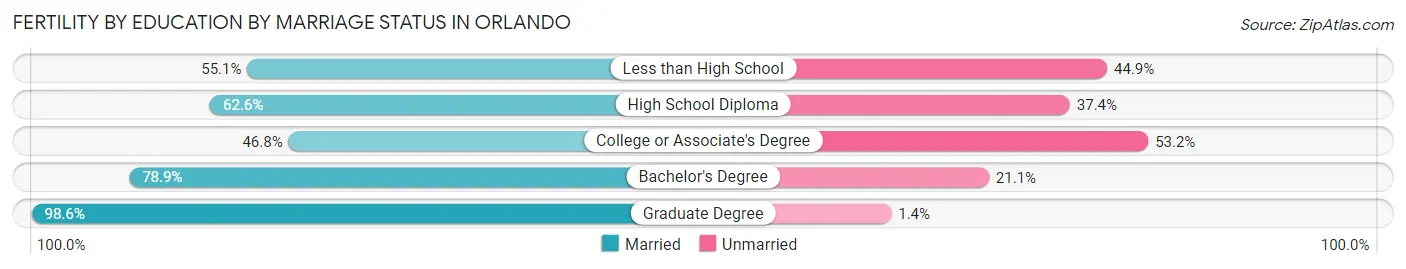
| Educational Attainment | Married | Unmarried |
| Less than High School | 226 (55.1%) | 184 (44.9%) |
| High School Diploma | 715 (62.6%) | 427 (37.4%) |
| College or Associate's Degree | 493 (46.8%) | 560 (53.2%) |
| Bachelor's Degree | 801 (78.9%) | 214 (21.1%) |
| Graduate Degree | 491 (98.6%) | 7 (1.4%) |
| Total | 2,726 (66.2%) | 1,392 (33.8%) |
Employment Characteristics in Orlando
Employment by Class of Employer in Orlando
Among the 166,730 employed individuals in Orlando, private company employees (122,748 | 73.6%), not-for-profit organizations (11,601 | 7.0%), and self-employed (not incorporated) (8,975 | 5.4%) make up the most common classes of employment.
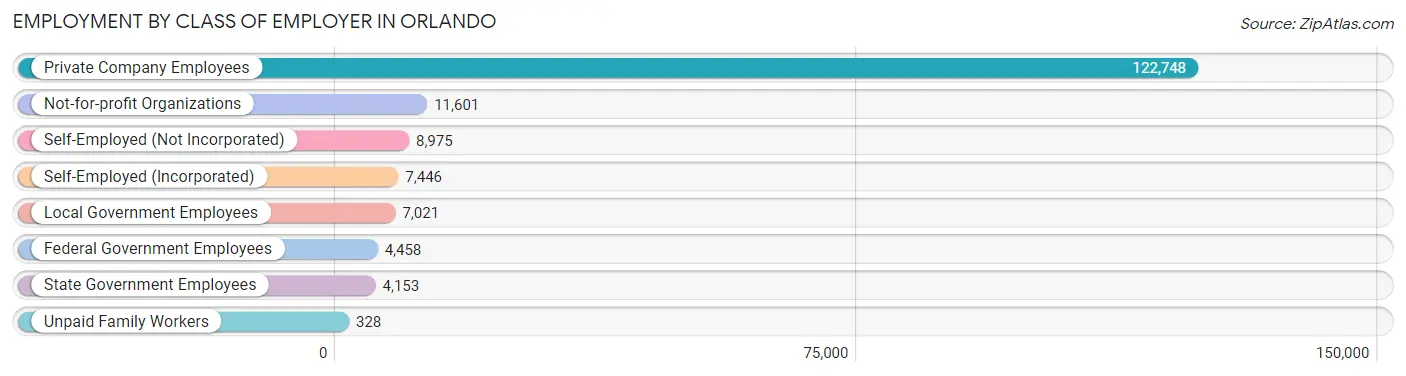
| Employer Class | # Employees | % Employees |
| Private Company Employees | 122,748 | 73.6% |
| Self-Employed (Incorporated) | 7,446 | 4.5% |
| Self-Employed (Not Incorporated) | 8,975 | 5.4% |
| Not-for-profit Organizations | 11,601 | 7.0% |
| Local Government Employees | 7,021 | 4.2% |
| State Government Employees | 4,153 | 2.5% |
| Federal Government Employees | 4,458 | 2.7% |
| Unpaid Family Workers | 328 | 0.2% |
| Total | 166,730 | 100.0% |
Employment Status by Age in Orlando
According to the labor force statistics for Orlando, out of the total population over 16 years of age (250,984), 71.3% or 178,952 individuals are in the labor force, with 5.2% or 9,306 of them unemployed. The age group with the highest labor force participation rate is 25 to 29 years, with 86.7% or 28,238 individuals in the labor force. Within the labor force, the 16 to 19 years age range has the highest percentage of unemployed individuals, with 14.5% or 600 of them being unemployed.
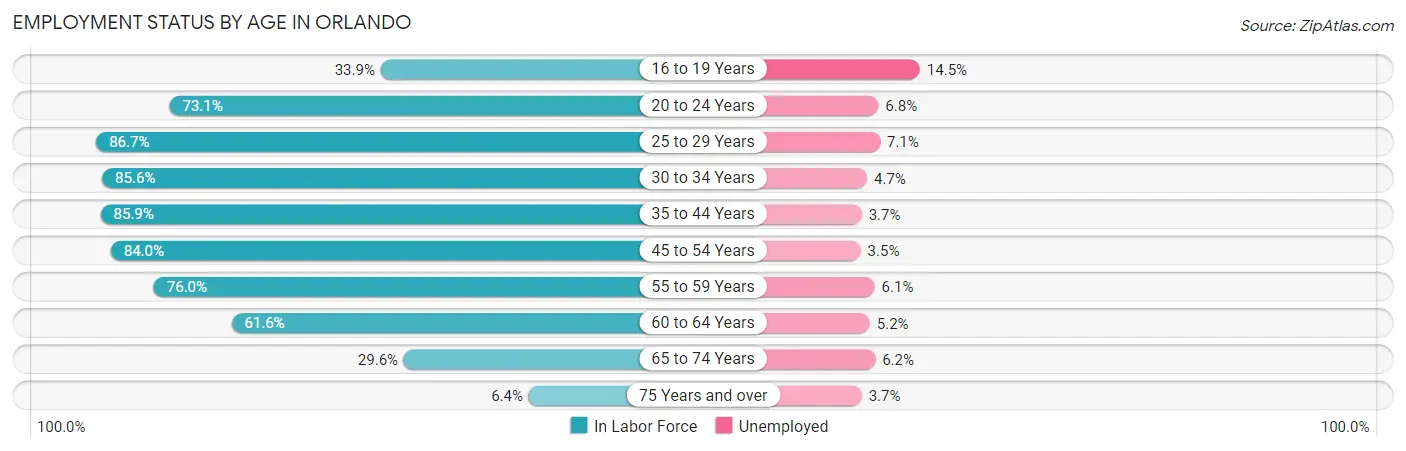
| Age Bracket | In Labor Force | Unemployed |
| 16 to 19 Years | 4,137 (33.9%) | 600 (14.5%) |
| 20 to 24 Years | 14,874 (73.1%) | 1,011 (6.8%) |
| 25 to 29 Years | 28,238 (86.7%) | 2,005 (7.1%) |
| 30 to 34 Years | 28,692 (85.6%) | 1,349 (4.7%) |
| 35 to 44 Years | 42,732 (85.9%) | 1,581 (3.7%) |
| 45 to 54 Years | 31,655 (84.0%) | 1,108 (3.5%) |
| 55 to 59 Years | 12,800 (76.0%) | 781 (6.1%) |
| 60 to 64 Years | 9,085 (61.6%) | 472 (5.2%) |
| 65 to 74 Years | 5,703 (29.6%) | 354 (6.2%) |
| 75 Years and over | 900 (6.4%) | 33 (3.7%) |
| Total | 178,952 (71.3%) | 9,306 (5.2%) |
Employment Status by Educational Attainment in Orlando
According to labor force statistics for Orlando, 82.8% of individuals (153,272) out of the total population between 25 and 64 years of age (185,111) are in the labor force, with 4.8% or 7,357 of them being unemployed. The group with the highest labor force participation rate are those with the educational attainment of bachelor's degree or higher, with 87.3% or 70,098 individuals in the labor force. Within the labor force, individuals with less than high school education have the highest percentage of unemployment, with 11.5% or 978 of them being unemployed.
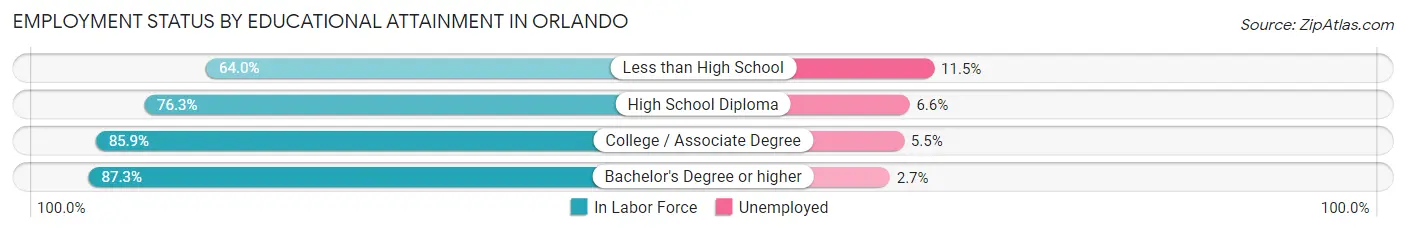
| Educational Attainment | In Labor Force | Unemployed |
| Less than High School | 8,500 (64.0%) | 1,527 (11.5%) |
| High School Diploma | 31,636 (76.3%) | 2,736 (6.6%) |
| College / Associate Degree | 43,013 (85.9%) | 2,754 (5.5%) |
| Bachelor's Degree or higher | 70,098 (87.3%) | 2,168 (2.7%) |
| Total | 153,272 (82.8%) | 8,885 (4.8%) |
Employment Occupations by Sex in Orlando
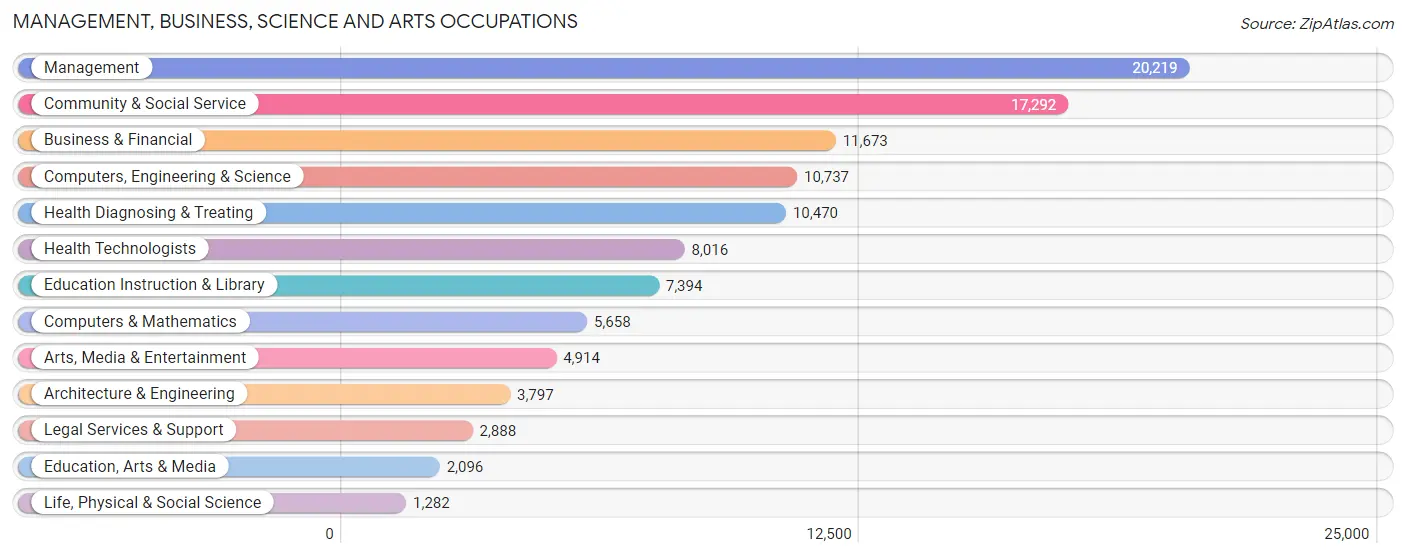
Management, Business, Science and Arts Occupations
The most common Management, Business, Science and Arts occupations in Orlando are Management (20,219 | 12.0%), Community & Social Service (17,292 | 10.2%), Business & Financial (11,673 | 6.9%), Computers, Engineering & Science (10,737 | 6.4%), and Health Diagnosing & Treating (10,470 | 6.2%).
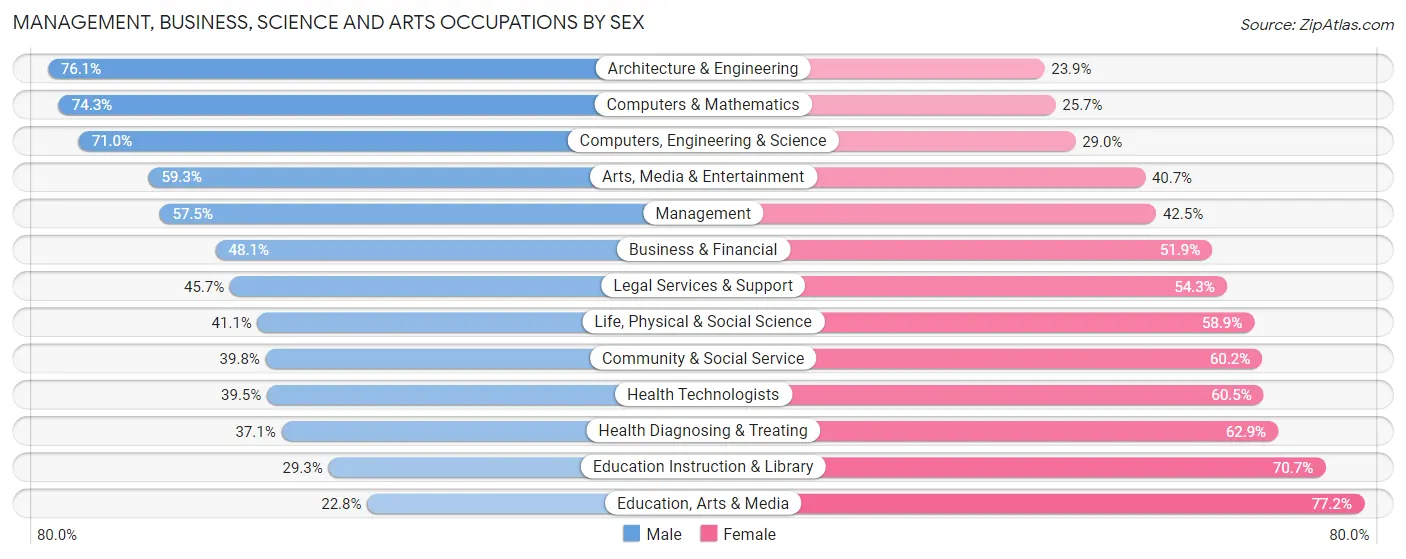
Management, Business, Science and Arts Occupations by Sex
Within the Management, Business, Science and Arts occupations in Orlando, the most male-oriented occupations are Architecture & Engineering (76.1%), Computers & Mathematics (74.3%), and Computers, Engineering & Science (71.0%), while the most female-oriented occupations are Education, Arts & Media (77.2%), Education Instruction & Library (70.7%), and Health Diagnosing & Treating (62.9%).
| Occupation | Male | Female |
| Management | 11,622 (57.5%) | 8,597 (42.5%) |
| Business & Financial | 5,616 (48.1%) | 6,057 (51.9%) |
| Computers, Engineering & Science | 7,619 (71.0%) | 3,118 (29.0%) |
| Computers & Mathematics | 4,202 (74.3%) | 1,456 (25.7%) |
| Architecture & Engineering | 2,890 (76.1%) | 907 (23.9%) |
| Life, Physical & Social Science | 527 (41.1%) | 755 (58.9%) |
| Community & Social Service | 6,877 (39.8%) | 10,415 (60.2%) |
| Education, Arts & Media | 478 (22.8%) | 1,618 (77.2%) |
| Legal Services & Support | 1,320 (45.7%) | 1,568 (54.3%) |
| Education Instruction & Library | 2,164 (29.3%) | 5,230 (70.7%) |
| Arts, Media & Entertainment | 2,915 (59.3%) | 1,999 (40.7%) |
| Health Diagnosing & Treating | 3,888 (37.1%) | 6,582 (62.9%) |
| Health Technologists | 3,169 (39.5%) | 4,847 (60.5%) |
| Total (Category) | 35,622 (50.6%) | 34,769 (49.4%) |
| Total (Overall) | 88,670 (52.5%) | 80,146 (47.5%) |
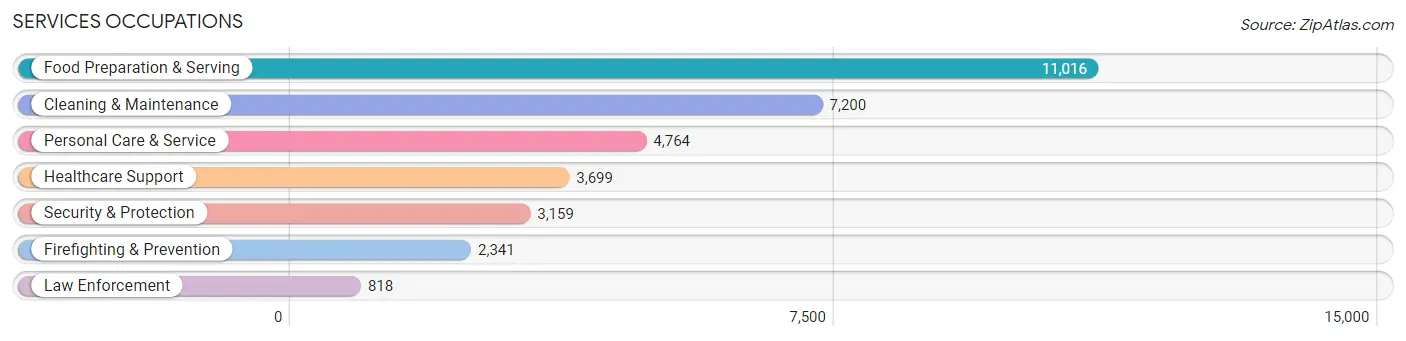
Services Occupations
The most common Services occupations in Orlando are Food Preparation & Serving (11,016 | 6.5%), Cleaning & Maintenance (7,200 | 4.3%), Personal Care & Service (4,764 | 2.8%), Healthcare Support (3,699 | 2.2%), and Security & Protection (3,159 | 1.9%).
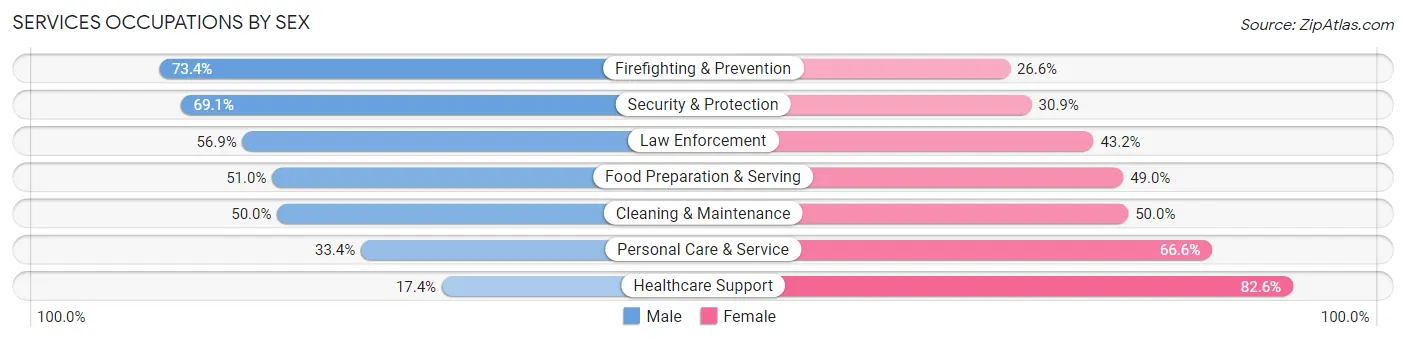
Services Occupations by Sex
Within the Services occupations in Orlando, the most male-oriented occupations are Firefighting & Prevention (73.4%), Security & Protection (69.1%), and Law Enforcement (56.9%), while the most female-oriented occupations are Healthcare Support (82.6%), Personal Care & Service (66.6%), and Cleaning & Maintenance (50.0%).
| Occupation | Male | Female |
| Healthcare Support | 642 (17.4%) | 3,057 (82.6%) |
| Security & Protection | 2,183 (69.1%) | 976 (30.9%) |
| Firefighting & Prevention | 1,718 (73.4%) | 623 (26.6%) |
| Law Enforcement | 465 (56.9%) | 353 (43.1%) |
| Food Preparation & Serving | 5,614 (51.0%) | 5,402 (49.0%) |
| Cleaning & Maintenance | 3,597 (50.0%) | 3,603 (50.0%) |
| Personal Care & Service | 1,590 (33.4%) | 3,174 (66.6%) |
| Total (Category) | 13,626 (45.7%) | 16,212 (54.3%) |
| Total (Overall) | 88,670 (52.5%) | 80,146 (47.5%) |
Sales and Office Occupations
The most common Sales and Office occupations in Orlando are Sales & Related (21,287 | 12.6%), and Office & Administration (17,964 | 10.6%).

Sales and Office Occupations by Sex
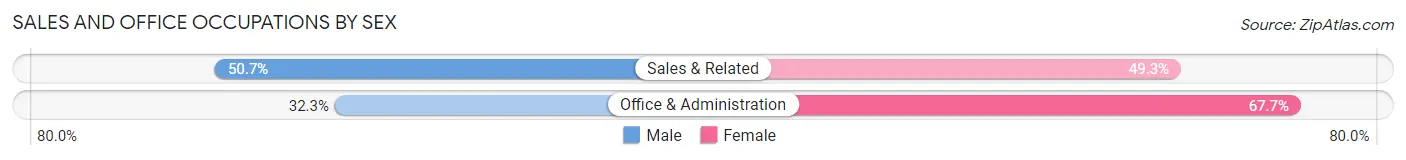
| Occupation | Male | Female |
| Sales & Related | 10,794 (50.7%) | 10,493 (49.3%) |
| Office & Administration | 5,799 (32.3%) | 12,165 (67.7%) |
| Total (Category) | 16,593 (42.3%) | 22,658 (57.7%) |
| Total (Overall) | 88,670 (52.5%) | 80,146 (47.5%) |
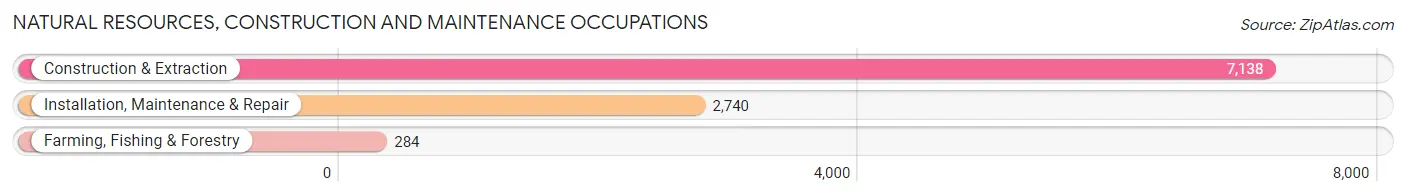
Natural Resources, Construction and Maintenance Occupations
The most common Natural Resources, Construction and Maintenance occupations in Orlando are Construction & Extraction (7,138 | 4.2%), Installation, Maintenance & Repair (2,740 | 1.6%), and Farming, Fishing & Forestry (284 | 0.2%).
Natural Resources, Construction and Maintenance Occupations by Sex
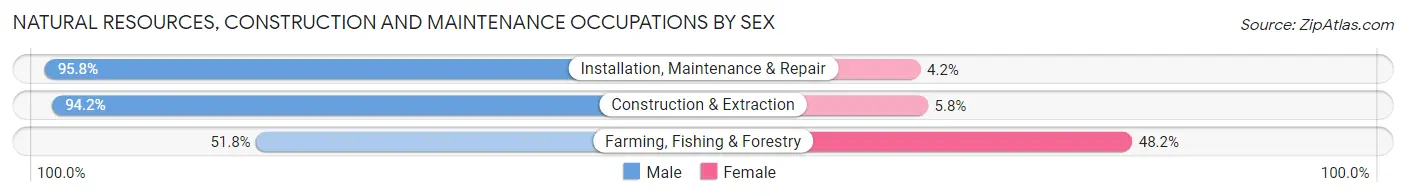
| Occupation | Male | Female |
| Farming, Fishing & Forestry | 147 (51.8%) | 137 (48.2%) |
| Construction & Extraction | 6,727 (94.2%) | 411 (5.8%) |
| Installation, Maintenance & Repair | 2,625 (95.8%) | 115 (4.2%) |
| Total (Category) | 9,499 (93.5%) | 663 (6.5%) |
| Total (Overall) | 88,670 (52.5%) | 80,146 (47.5%) |
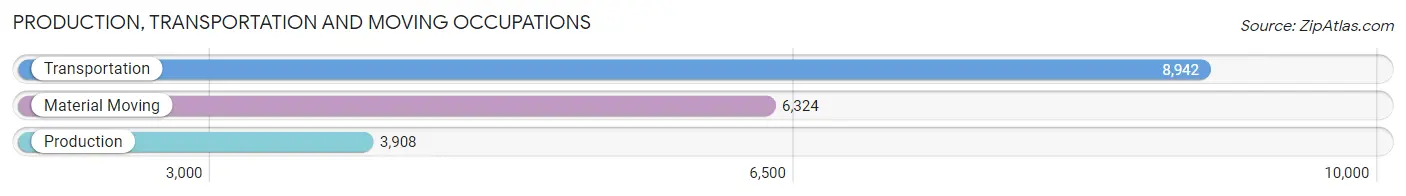
Production, Transportation and Moving Occupations
The most common Production, Transportation and Moving occupations in Orlando are Transportation (8,942 | 5.3%), Material Moving (6,324 | 3.7%), and Production (3,908 | 2.3%).
Production, Transportation and Moving Occupations by Sex
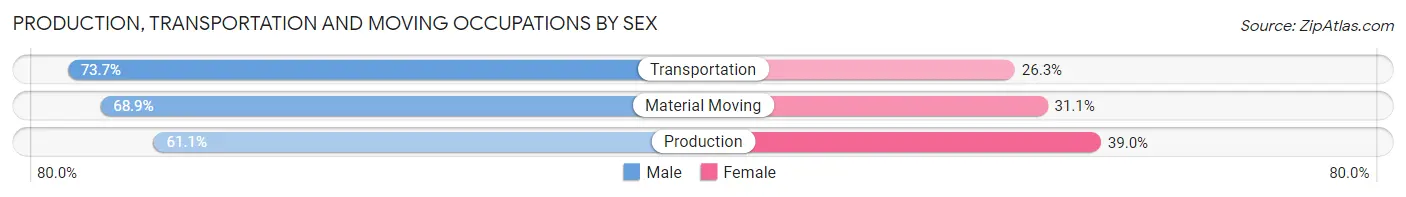
| Occupation | Male | Female |
| Production | 2,386 (61.1%) | 1,522 (39.0%) |
| Transportation | 6,588 (73.7%) | 2,354 (26.3%) |
| Material Moving | 4,356 (68.9%) | 1,968 (31.1%) |
| Total (Category) | 13,330 (69.5%) | 5,844 (30.5%) |
| Total (Overall) | 88,670 (52.5%) | 80,146 (47.5%) |
Employment Industries by Sex in Orlando
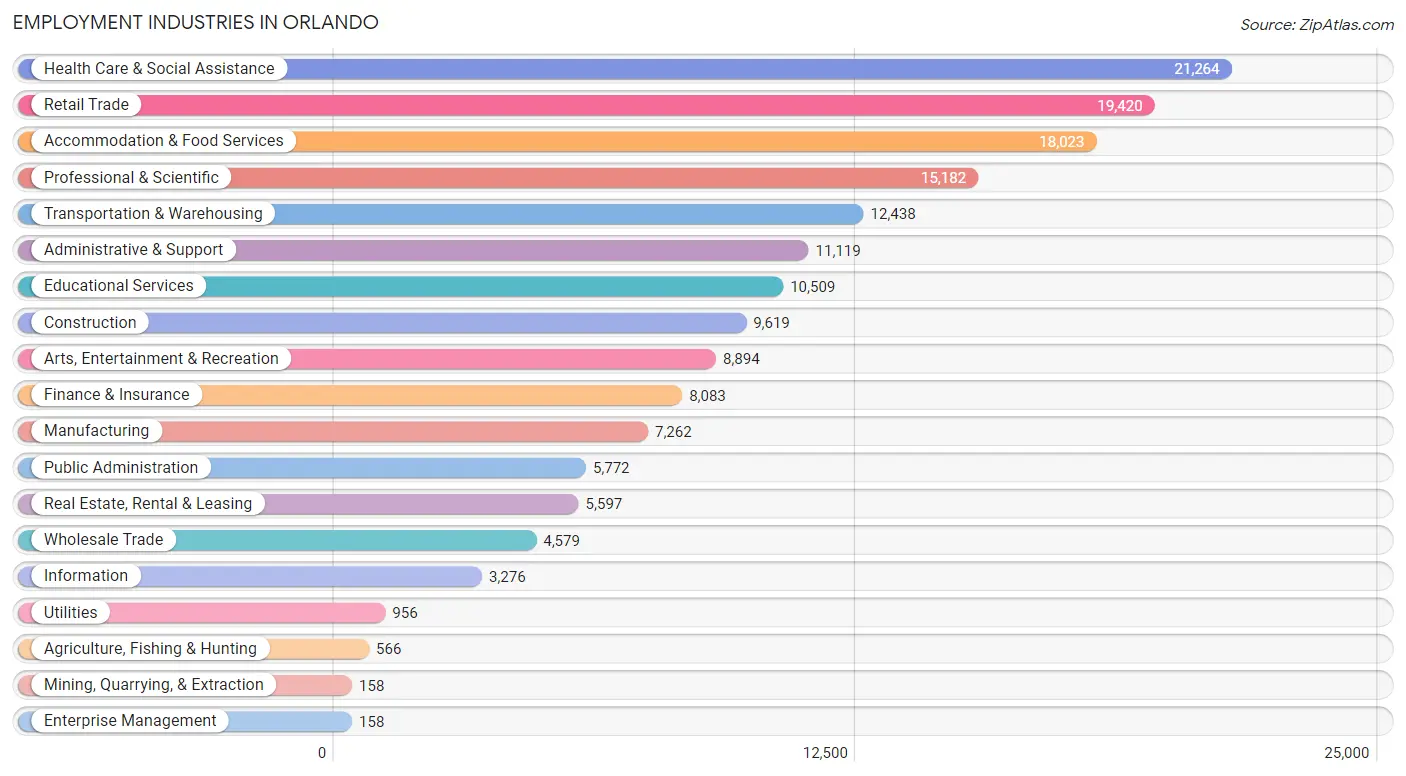
Employment Industries in Orlando
The major employment industries in Orlando include Health Care & Social Assistance (21,264 | 12.6%), Retail Trade (19,420 | 11.5%), Accommodation & Food Services (18,023 | 10.7%), Professional & Scientific (15,182 | 9.0%), and Transportation & Warehousing (12,438 | 7.4%).
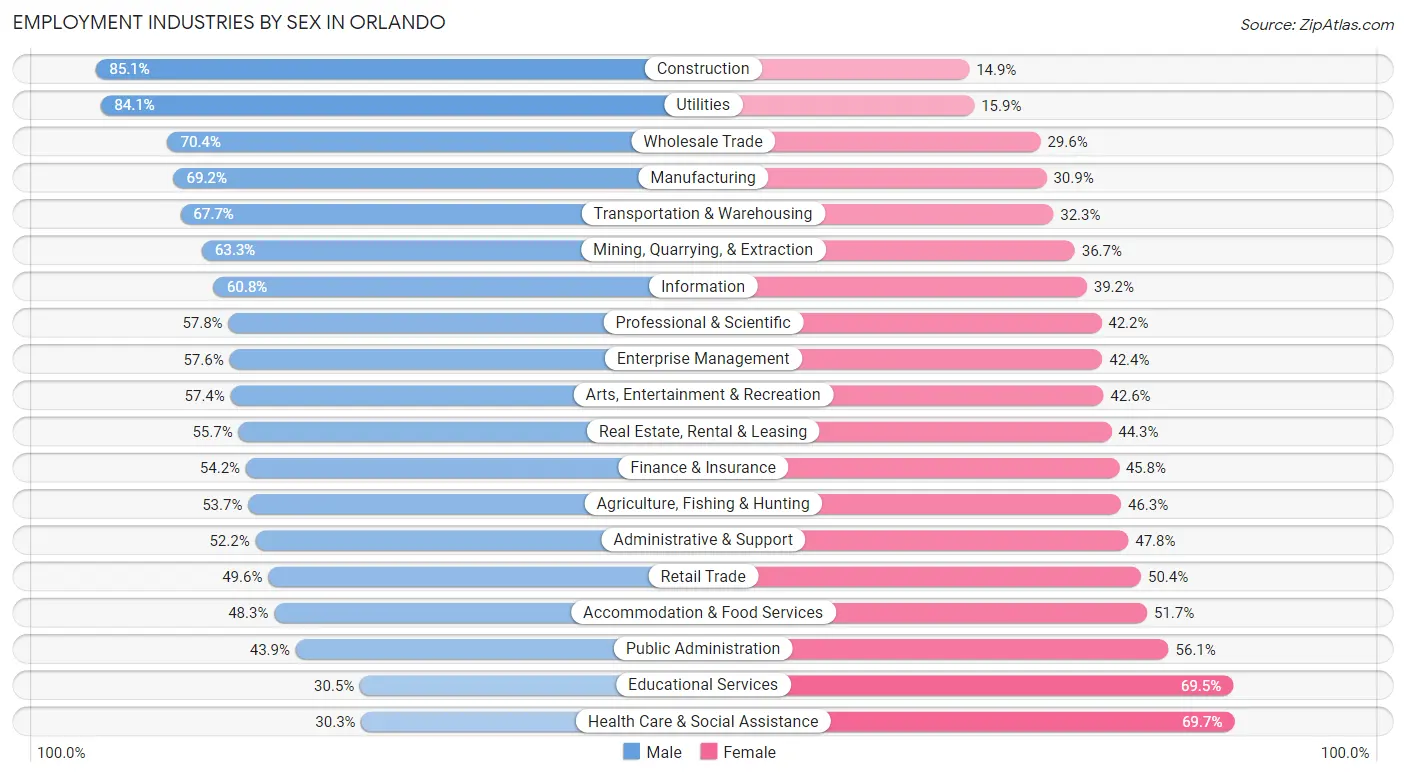
Employment Industries by Sex in Orlando
The Orlando industries that see more men than women are Construction (85.1%), Utilities (84.1%), and Wholesale Trade (70.4%), whereas the industries that tend to have a higher number of women are Health Care & Social Assistance (69.7%), Educational Services (69.5%), and Public Administration (56.1%).
| Industry | Male | Female |
| Agriculture, Fishing & Hunting | 304 (53.7%) | 262 (46.3%) |
| Mining, Quarrying, & Extraction | 100 (63.3%) | 58 (36.7%) |
| Construction | 8,190 (85.1%) | 1,429 (14.9%) |
| Manufacturing | 5,022 (69.2%) | 2,240 (30.8%) |
| Wholesale Trade | 3,223 (70.4%) | 1,356 (29.6%) |
| Retail Trade | 9,626 (49.6%) | 9,794 (50.4%) |
| Transportation & Warehousing | 8,426 (67.7%) | 4,012 (32.3%) |
| Utilities | 804 (84.1%) | 152 (15.9%) |
| Information | 1,992 (60.8%) | 1,284 (39.2%) |
| Finance & Insurance | 4,380 (54.2%) | 3,703 (45.8%) |
| Real Estate, Rental & Leasing | 3,119 (55.7%) | 2,478 (44.3%) |
| Professional & Scientific | 8,777 (57.8%) | 6,405 (42.2%) |
| Enterprise Management | 91 (57.6%) | 67 (42.4%) |
| Administrative & Support | 5,805 (52.2%) | 5,314 (47.8%) |
| Educational Services | 3,209 (30.5%) | 7,300 (69.5%) |
| Health Care & Social Assistance | 6,441 (30.3%) | 14,823 (69.7%) |
| Arts, Entertainment & Recreation | 5,102 (57.4%) | 3,792 (42.6%) |
| Accommodation & Food Services | 8,711 (48.3%) | 9,312 (51.7%) |
| Public Administration | 2,532 (43.9%) | 3,240 (56.1%) |
| Total | 88,670 (52.5%) | 80,146 (47.5%) |
Education in Orlando
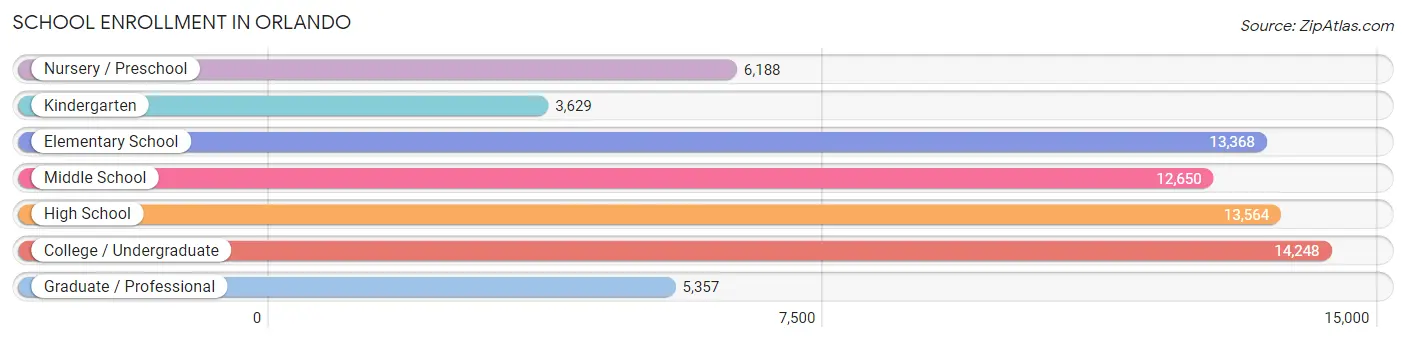
School Enrollment in Orlando
The most common levels of schooling among the 69,004 students in Orlando are college / undergraduate (14,248 | 20.6%), high school (13,564 | 19.7%), and elementary school (13,368 | 19.4%).
| School Level | # Students | % Students |
| Nursery / Preschool | 6,188 | 9.0% |
| Kindergarten | 3,629 | 5.3% |
| Elementary School | 13,368 | 19.4% |
| Middle School | 12,650 | 18.3% |
| High School | 13,564 | 19.7% |
| College / Undergraduate | 14,248 | 20.6% |
| Graduate / Professional | 5,357 | 7.8% |
| Total | 69,004 | 100.0% |
School Enrollment by Age by Funding Source in Orlando
Out of a total of 69,004 students who are enrolled in schools in Orlando, 12,628 (18.3%) attend a private institution, while the remaining 56,376 (81.7%) are enrolled in public schools. The age group of 3 to 4 year olds has the highest likelihood of being enrolled in private schools, with 1,820 (38.3% in the age bracket) enrolled. Conversely, the age group of 15 to 17 year olds has the lowest likelihood of being enrolled in a private school, with 8,913 (87.0% in the age bracket) attending a public institution.
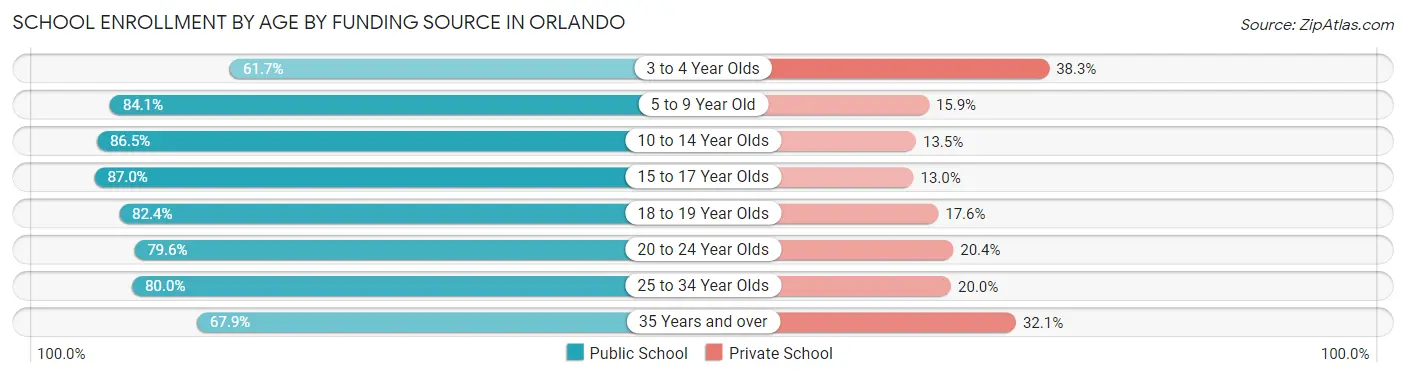
| Age Bracket | Public School | Private School |
| 3 to 4 Year Olds | 2,934 (61.7%) | 1,820 (38.3%) |
| 5 to 9 Year Old | 13,894 (84.1%) | 2,623 (15.9%) |
| 10 to 14 Year Olds | 14,202 (86.5%) | 2,213 (13.5%) |
| 15 to 17 Year Olds | 8,913 (87.0%) | 1,334 (13.0%) |
| 18 to 19 Year Olds | 2,594 (82.4%) | 555 (17.6%) |
| 20 to 24 Year Olds | 5,507 (79.6%) | 1,413 (20.4%) |
| 25 to 34 Year Olds | 5,835 (80.0%) | 1,460 (20.0%) |
| 35 Years and over | 2,517 (67.9%) | 1,190 (32.1%) |
| Total | 56,376 (81.7%) | 12,628 (18.3%) |
Educational Attainment by Field of Study in Orlando
Business (23,679 | 24.6%), science & technology (10,689 | 11.1%), engineering (8,583 | 8.9%), education (7,693 | 8.0%), and social sciences (6,459 | 6.7%) are the most common fields of study among 96,312 individuals in Orlando who have obtained a bachelor's degree or higher.
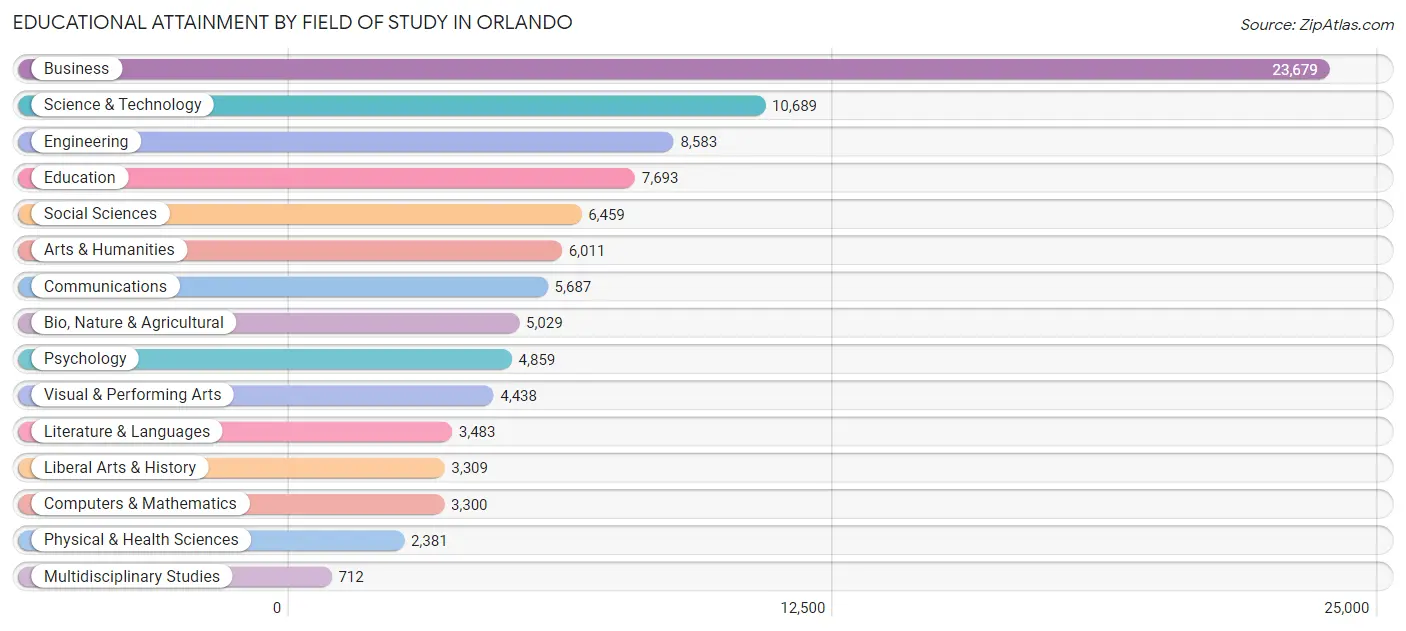
| Field of Study | # Graduates | % Graduates |
| Computers & Mathematics | 3,300 | 3.4% |
| Bio, Nature & Agricultural | 5,029 | 5.2% |
| Physical & Health Sciences | 2,381 | 2.5% |
| Psychology | 4,859 | 5.1% |
| Social Sciences | 6,459 | 6.7% |
| Engineering | 8,583 | 8.9% |
| Multidisciplinary Studies | 712 | 0.7% |
| Science & Technology | 10,689 | 11.1% |
| Business | 23,679 | 24.6% |
| Education | 7,693 | 8.0% |
| Literature & Languages | 3,483 | 3.6% |
| Liberal Arts & History | 3,309 | 3.4% |
| Visual & Performing Arts | 4,438 | 4.6% |
| Communications | 5,687 | 5.9% |
| Arts & Humanities | 6,011 | 6.2% |
| Total | 96,312 | 100.0% |
Transportation & Commute in Orlando
Vehicle Availability by Sex in Orlando
The most prevalent vehicle ownership categories in Orlando are males with 2 vehicles (42,938, accounting for 48.9%) and females with 2 vehicles (33,587, making up 54.5%).
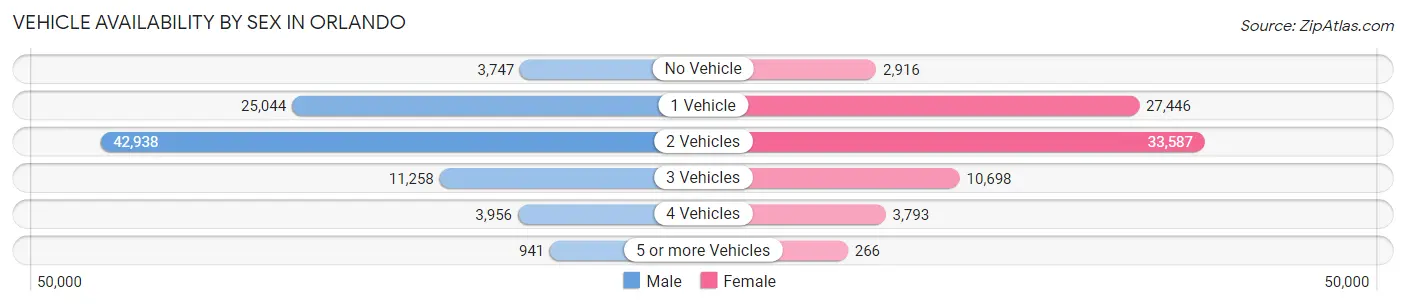
| Vehicles Available | Male | Female |
| No Vehicle | 3,747 (4.3%) | 2,916 (3.7%) |
| 1 Vehicle | 25,044 (28.5%) | 27,446 (34.9%) |
| 2 Vehicles | 42,938 (48.9%) | 33,587 (42.7%) |
| 3 Vehicles | 11,258 (12.8%) | 10,698 (13.6%) |
| 4 Vehicles | 3,956 (4.5%) | 3,793 (4.8%) |
| 5 or more Vehicles | 941 (1.1%) | 266 (0.3%) |
| Total | 87,884 (100.0%) | 78,706 (100.0%) |
Commute Time in Orlando
The most frequently occuring commute durations in Orlando are 30 to 34 minutes (27,296 commuters, 18.6%), 20 to 24 minutes (25,200 commuters, 17.2%), and 15 to 19 minutes (22,131 commuters, 15.1%).
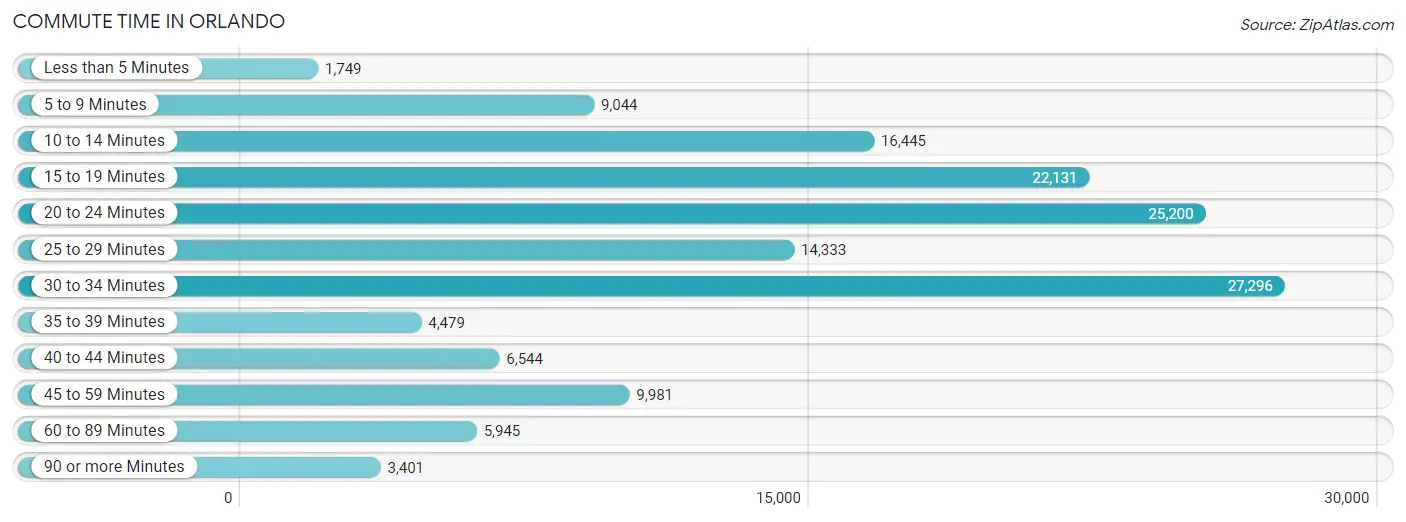
| Commute Time | # Commuters | % Commuters |
| Less than 5 Minutes | 1,749 | 1.2% |
| 5 to 9 Minutes | 9,044 | 6.2% |
| 10 to 14 Minutes | 16,445 | 11.2% |
| 15 to 19 Minutes | 22,131 | 15.1% |
| 20 to 24 Minutes | 25,200 | 17.2% |
| 25 to 29 Minutes | 14,333 | 9.8% |
| 30 to 34 Minutes | 27,296 | 18.6% |
| 35 to 39 Minutes | 4,479 | 3.1% |
| 40 to 44 Minutes | 6,544 | 4.5% |
| 45 to 59 Minutes | 9,981 | 6.8% |
| 60 to 89 Minutes | 5,945 | 4.1% |
| 90 or more Minutes | 3,401 | 2.3% |
Commute Time by Sex in Orlando
The most common commute times in Orlando are 30 to 34 minutes (14,269 commuters, 18.4%) for males and 30 to 34 minutes (13,027 commuters, 18.8%) for females.
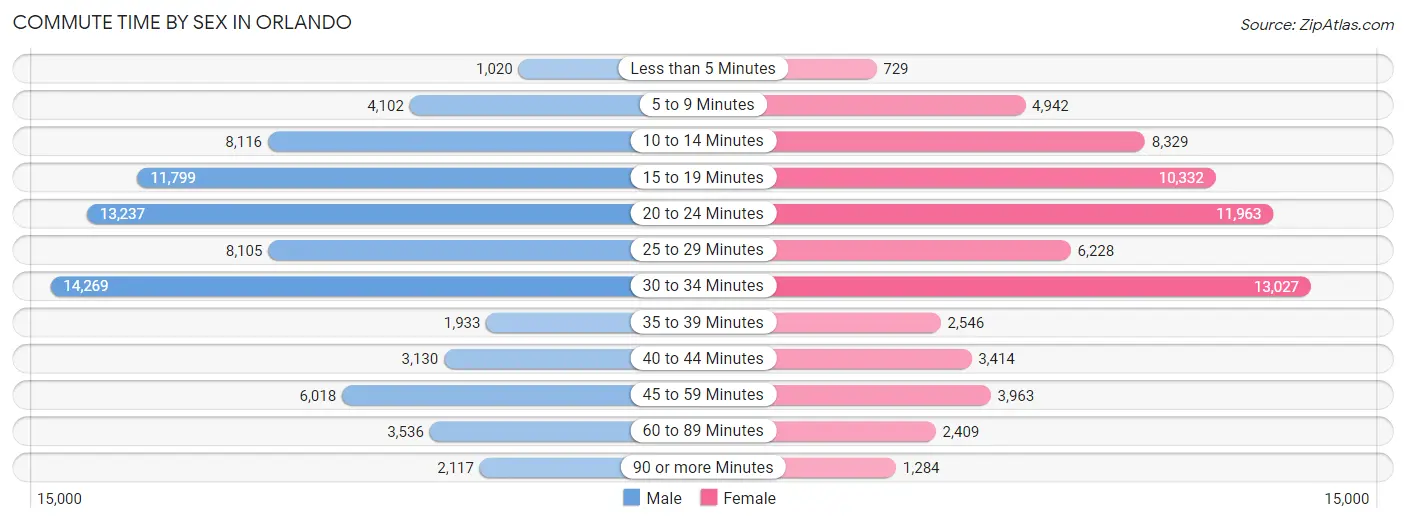
| Commute Time | Male | Female |
| Less than 5 Minutes | 1,020 (1.3%) | 729 (1.1%) |
| 5 to 9 Minutes | 4,102 (5.3%) | 4,942 (7.1%) |
| 10 to 14 Minutes | 8,116 (10.5%) | 8,329 (12.0%) |
| 15 to 19 Minutes | 11,799 (15.2%) | 10,332 (14.9%) |
| 20 to 24 Minutes | 13,237 (17.1%) | 11,963 (17.3%) |
| 25 to 29 Minutes | 8,105 (10.5%) | 6,228 (9.0%) |
| 30 to 34 Minutes | 14,269 (18.4%) | 13,027 (18.8%) |
| 35 to 39 Minutes | 1,933 (2.5%) | 2,546 (3.7%) |
| 40 to 44 Minutes | 3,130 (4.0%) | 3,414 (4.9%) |
| 45 to 59 Minutes | 6,018 (7.8%) | 3,963 (5.7%) |
| 60 to 89 Minutes | 3,536 (4.6%) | 2,409 (3.5%) |
| 90 or more Minutes | 2,117 (2.7%) | 1,284 (1.9%) |
Time of Departure to Work by Sex in Orlando
The most frequent times of departure to work in Orlando are 7:00 AM to 7:29 AM (10,499, 13.6%) for males and 8:00 AM to 8:29 AM (11,274, 16.3%) for females.
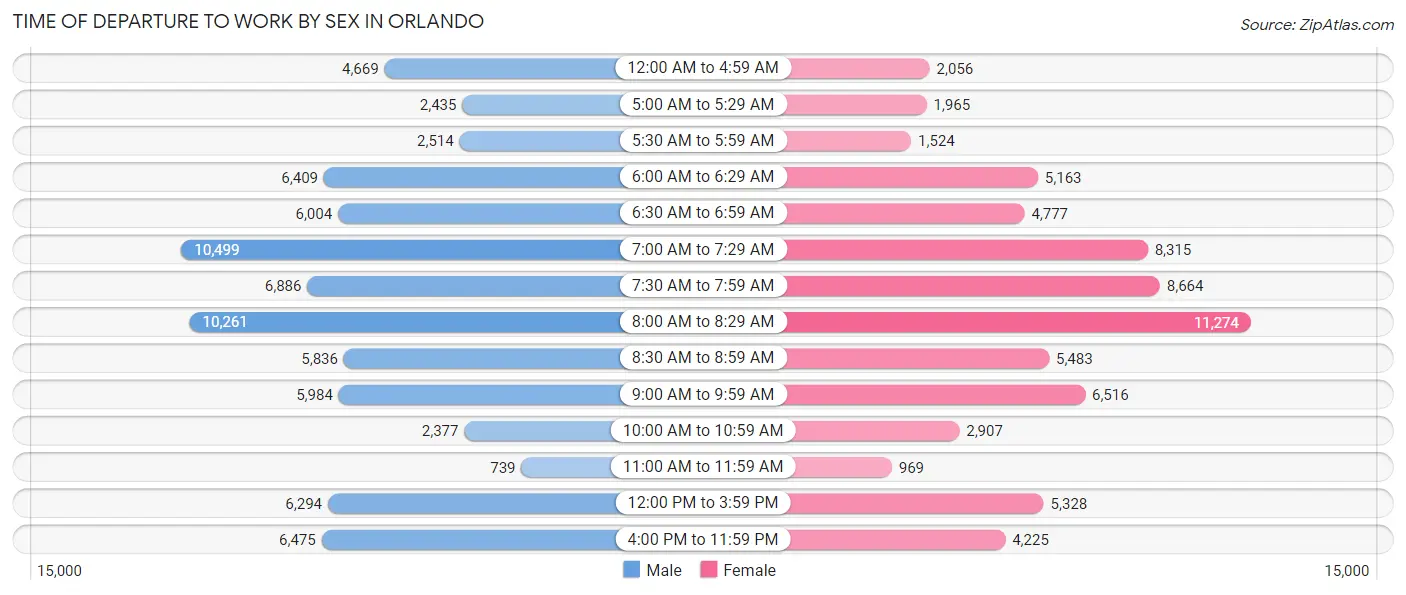
| Time of Departure | Male | Female |
| 12:00 AM to 4:59 AM | 4,669 (6.0%) | 2,056 (3.0%) |
| 5:00 AM to 5:29 AM | 2,435 (3.2%) | 1,965 (2.8%) |
| 5:30 AM to 5:59 AM | 2,514 (3.3%) | 1,524 (2.2%) |
| 6:00 AM to 6:29 AM | 6,409 (8.3%) | 5,163 (7.5%) |
| 6:30 AM to 6:59 AM | 6,004 (7.8%) | 4,777 (6.9%) |
| 7:00 AM to 7:29 AM | 10,499 (13.6%) | 8,315 (12.0%) |
| 7:30 AM to 7:59 AM | 6,886 (8.9%) | 8,664 (12.5%) |
| 8:00 AM to 8:29 AM | 10,261 (13.3%) | 11,274 (16.3%) |
| 8:30 AM to 8:59 AM | 5,836 (7.5%) | 5,483 (7.9%) |
| 9:00 AM to 9:59 AM | 5,984 (7.7%) | 6,516 (9.4%) |
| 10:00 AM to 10:59 AM | 2,377 (3.1%) | 2,907 (4.2%) |
| 11:00 AM to 11:59 AM | 739 (1.0%) | 969 (1.4%) |
| 12:00 PM to 3:59 PM | 6,294 (8.1%) | 5,328 (7.7%) |
| 4:00 PM to 11:59 PM | 6,475 (8.4%) | 4,225 (6.1%) |
| Total | 77,382 (100.0%) | 69,166 (100.0%) |
Housing Occupancy in Orlando
Occupancy by Ownership in Orlando
Of the total 122,607 dwellings in Orlando, owner-occupied units account for 48,099 (39.2%), while renter-occupied units make up 74,508 (60.8%).
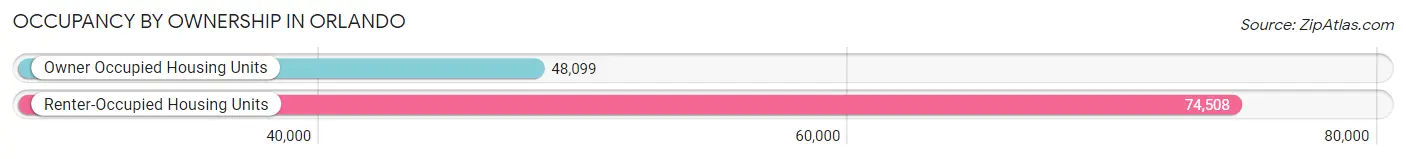
| Occupancy | # Housing Units | % Housing Units |
| Owner Occupied Housing Units | 48,099 | 39.2% |
| Renter-Occupied Housing Units | 74,508 | 60.8% |
| Total Occupied Housing Units | 122,607 | 100.0% |
Occupancy by Household Size in Orlando
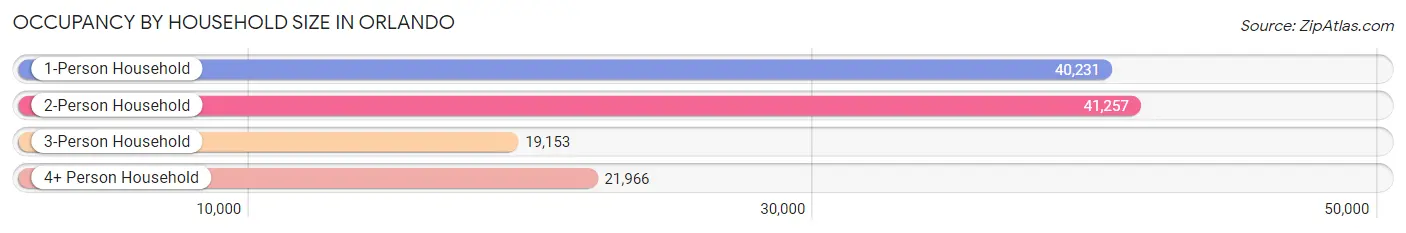
| Household Size | # Housing Units | % Housing Units |
| 1-Person Household | 40,231 | 32.8% |
| 2-Person Household | 41,257 | 33.7% |
| 3-Person Household | 19,153 | 15.6% |
| 4+ Person Household | 21,966 | 17.9% |
| Total Housing Units | 122,607 | 100.0% |
Occupancy by Ownership by Household Size in Orlando
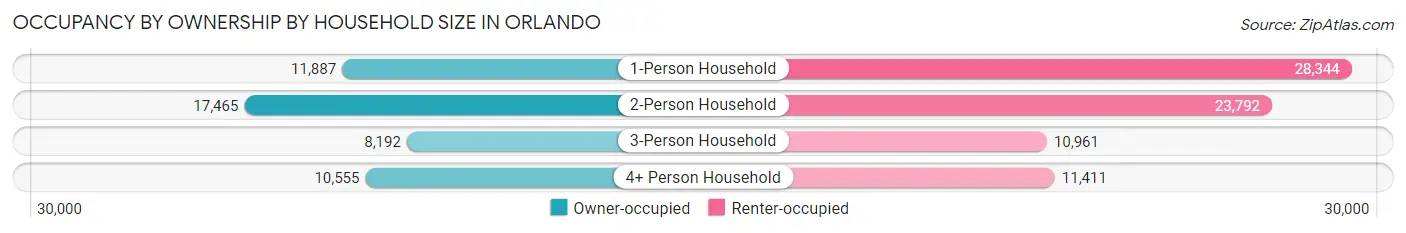
| Household Size | Owner-occupied | Renter-occupied |
| 1-Person Household | 11,887 (29.5%) | 28,344 (70.5%) |
| 2-Person Household | 17,465 (42.3%) | 23,792 (57.7%) |
| 3-Person Household | 8,192 (42.8%) | 10,961 (57.2%) |
| 4+ Person Household | 10,555 (48.0%) | 11,411 (51.9%) |
| Total Housing Units | 48,099 (39.2%) | 74,508 (60.8%) |
Occupancy by Educational Attainment in Orlando
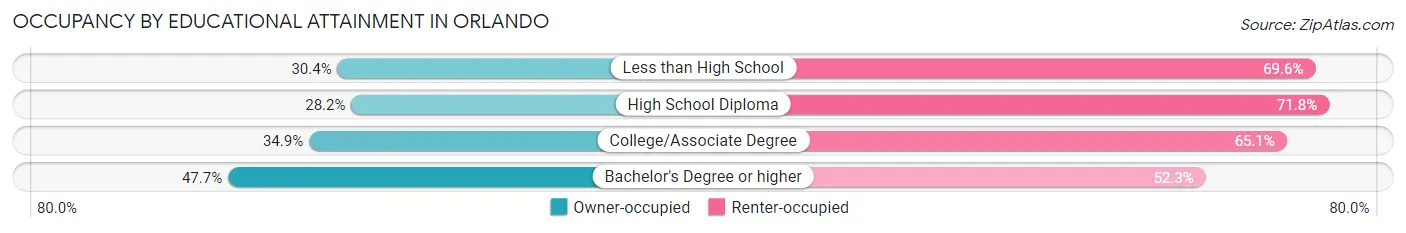
| Household Size | Owner-occupied | Renter-occupied |
| Less than High School | 2,563 (30.4%) | 5,877 (69.6%) |
| High School Diploma | 6,713 (28.2%) | 17,108 (71.8%) |
| College/Associate Degree | 11,706 (34.9%) | 21,843 (65.1%) |
| Bachelor's Degree or higher | 27,117 (47.7%) | 29,680 (52.3%) |
Occupancy by Age of Householder in Orlando
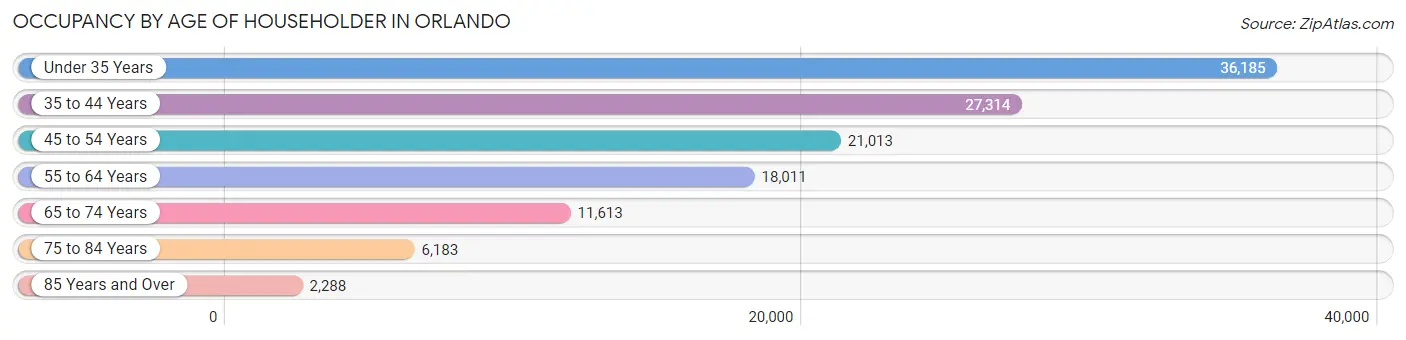
| Age Bracket | # Households | % Households |
| Under 35 Years | 36,185 | 29.5% |
| 35 to 44 Years | 27,314 | 22.3% |
| 45 to 54 Years | 21,013 | 17.1% |
| 55 to 64 Years | 18,011 | 14.7% |
| 65 to 74 Years | 11,613 | 9.5% |
| 75 to 84 Years | 6,183 | 5.0% |
| 85 Years and Over | 2,288 | 1.9% |
| Total | 122,607 | 100.0% |
Housing Finances in Orlando
Median Income by Occupancy in Orlando
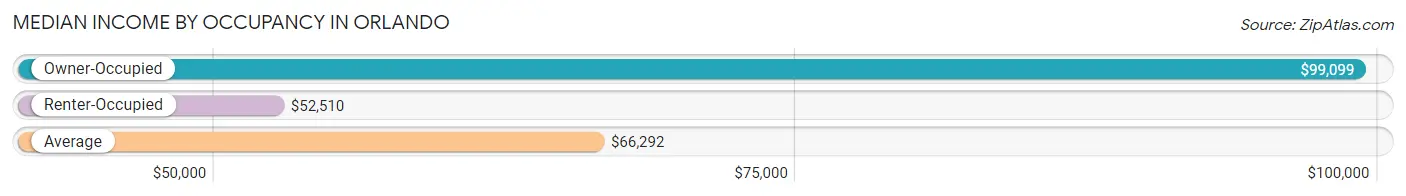
| Occupancy Type | # Households | Median Income |
| Owner-Occupied | 48,099 (39.2%) | $99,099 |
| Renter-Occupied | 74,508 (60.8%) | $52,510 |
| Average | 122,607 (100.0%) | $66,292 |
Occupancy by Householder Income Bracket in Orlando
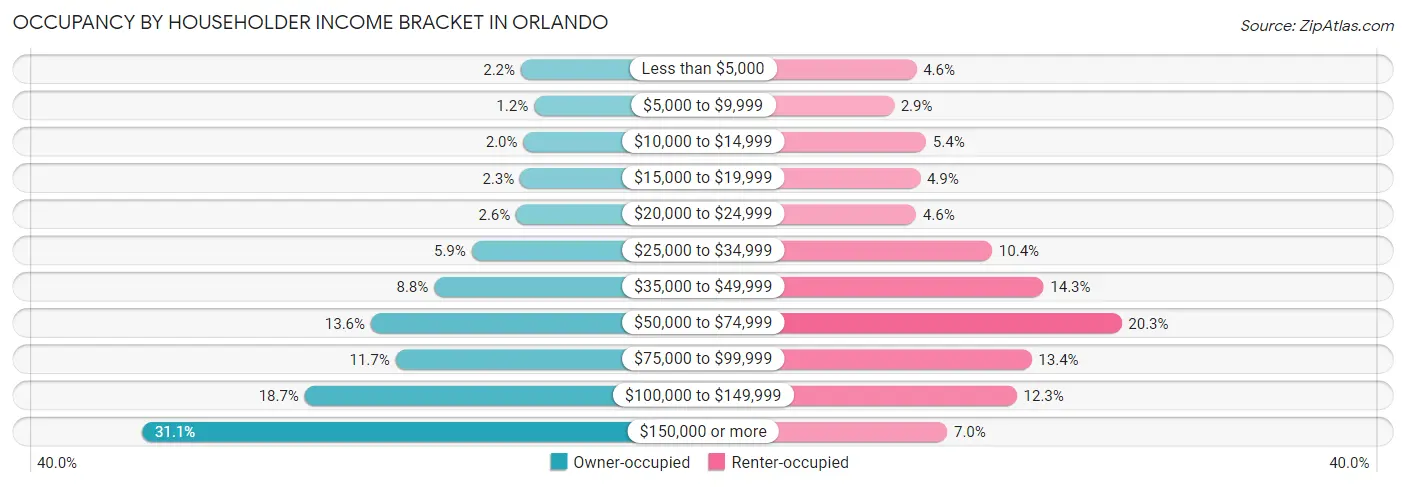
| Income Bracket | Owner-occupied | Renter-occupied |
| Less than $5,000 | 1,055 (2.2%) | 3,443 (4.6%) |
| $5,000 to $9,999 | 571 (1.2%) | 2,165 (2.9%) |
| $10,000 to $14,999 | 960 (2.0%) | 3,995 (5.4%) |
| $15,000 to $19,999 | 1,083 (2.2%) | 3,662 (4.9%) |
| $20,000 to $24,999 | 1,227 (2.5%) | 3,431 (4.6%) |
| $25,000 to $34,999 | 2,859 (5.9%) | 7,744 (10.4%) |
| $35,000 to $49,999 | 4,233 (8.8%) | 10,665 (14.3%) |
| $50,000 to $74,999 | 6,551 (13.6%) | 15,085 (20.3%) |
| $75,000 to $99,999 | 5,645 (11.7%) | 9,983 (13.4%) |
| $100,000 to $149,999 | 8,975 (18.7%) | 9,142 (12.3%) |
| $150,000 or more | 14,940 (31.1%) | 5,193 (7.0%) |
| Total | 48,099 (100.0%) | 74,508 (100.0%) |
Monthly Housing Cost Tiers in Orlando
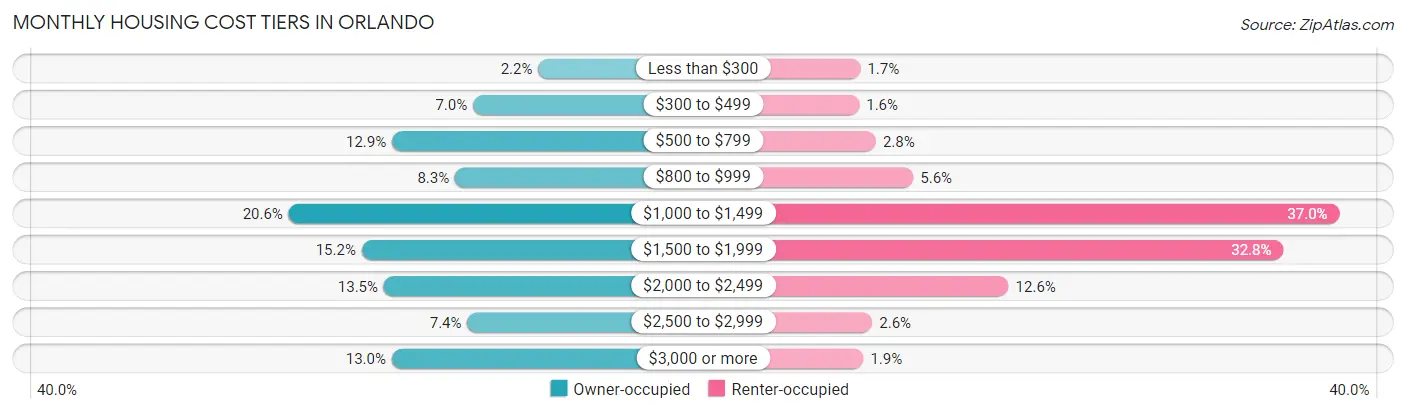
| Monthly Cost | Owner-occupied | Renter-occupied |
| Less than $300 | 1,043 (2.2%) | 1,264 (1.7%) |
| $300 to $499 | 3,353 (7.0%) | 1,196 (1.6%) |
| $500 to $799 | 6,225 (12.9%) | 2,119 (2.8%) |
| $800 to $999 | 3,993 (8.3%) | 4,167 (5.6%) |
| $1,000 to $1,499 | 9,884 (20.5%) | 27,547 (37.0%) |
| $1,500 to $1,999 | 7,297 (15.2%) | 24,465 (32.8%) |
| $2,000 to $2,499 | 6,515 (13.5%) | 9,395 (12.6%) |
| $2,500 to $2,999 | 3,553 (7.4%) | 1,915 (2.6%) |
| $3,000 or more | 6,236 (13.0%) | 1,428 (1.9%) |
| Total | 48,099 (100.0%) | 74,508 (100.0%) |
Physical Housing Characteristics in Orlando
Housing Structures in Orlando
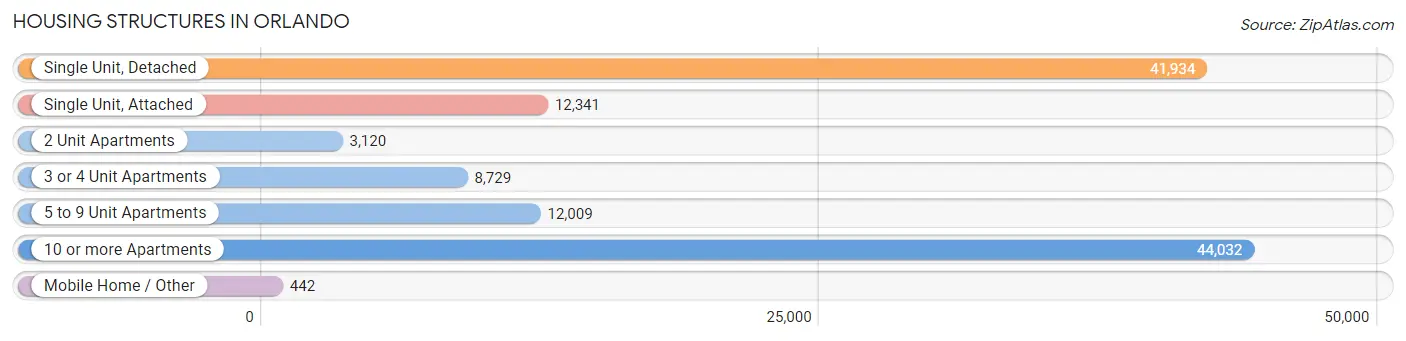
| Structure Type | # Housing Units | % Housing Units |
| Single Unit, Detached | 41,934 | 34.2% |
| Single Unit, Attached | 12,341 | 10.1% |
| 2 Unit Apartments | 3,120 | 2.5% |
| 3 or 4 Unit Apartments | 8,729 | 7.1% |
| 5 to 9 Unit Apartments | 12,009 | 9.8% |
| 10 or more Apartments | 44,032 | 35.9% |
| Mobile Home / Other | 442 | 0.4% |
| Total | 122,607 | 100.0% |
Housing Structures by Occupancy in Orlando
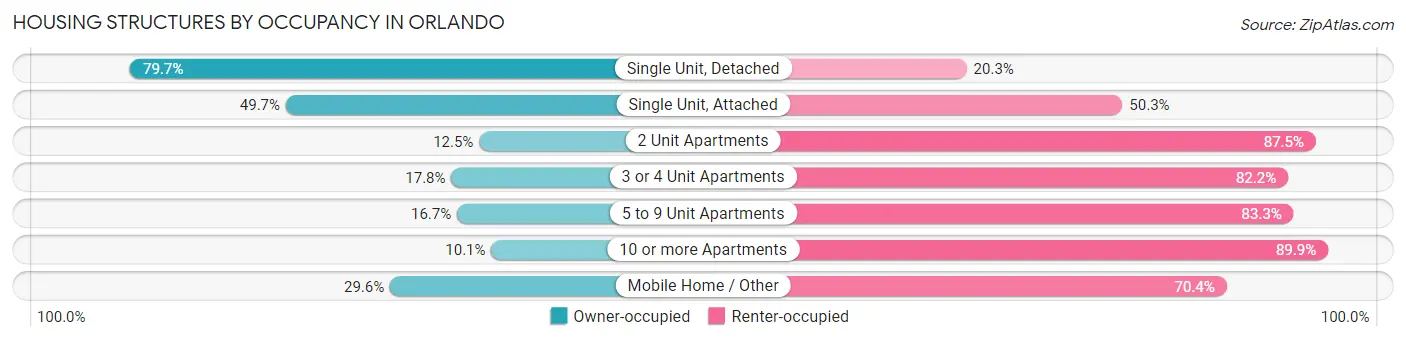
| Structure Type | Owner-occupied | Renter-occupied |
| Single Unit, Detached | 33,419 (79.7%) | 8,515 (20.3%) |
| Single Unit, Attached | 6,133 (49.7%) | 6,208 (50.3%) |
| 2 Unit Apartments | 389 (12.5%) | 2,731 (87.5%) |
| 3 or 4 Unit Apartments | 1,556 (17.8%) | 7,173 (82.2%) |
| 5 to 9 Unit Apartments | 2,010 (16.7%) | 9,999 (83.3%) |
| 10 or more Apartments | 4,461 (10.1%) | 39,571 (89.9%) |
| Mobile Home / Other | 131 (29.6%) | 311 (70.4%) |
| Total | 48,099 (39.2%) | 74,508 (60.8%) |
Housing Structures by Number of Rooms in Orlando
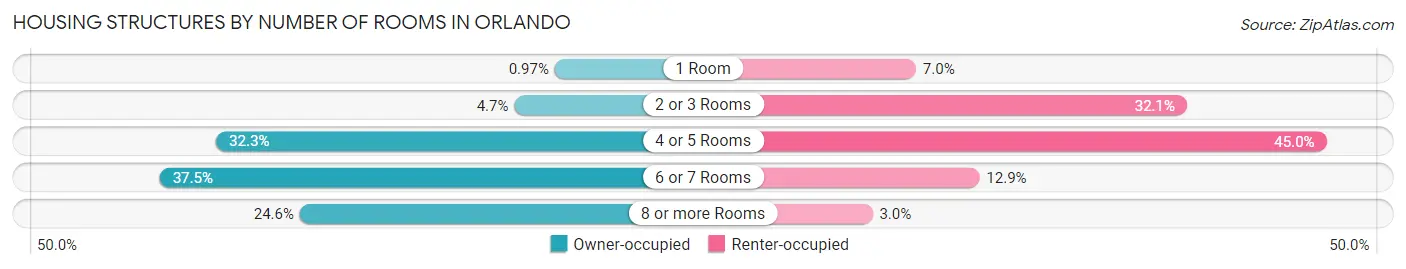
| Number of Rooms | Owner-occupied | Renter-occupied |
| 1 Room | 465 (1.0%) | 5,238 (7.0%) |
| 2 or 3 Rooms | 2,264 (4.7%) | 23,905 (32.1%) |
| 4 or 5 Rooms | 15,525 (32.3%) | 33,518 (45.0%) |
| 6 or 7 Rooms | 18,036 (37.5%) | 9,608 (12.9%) |
| 8 or more Rooms | 11,809 (24.5%) | 2,239 (3.0%) |
| Total | 48,099 (100.0%) | 74,508 (100.0%) |
Housing Structure by Heating Type in Orlando
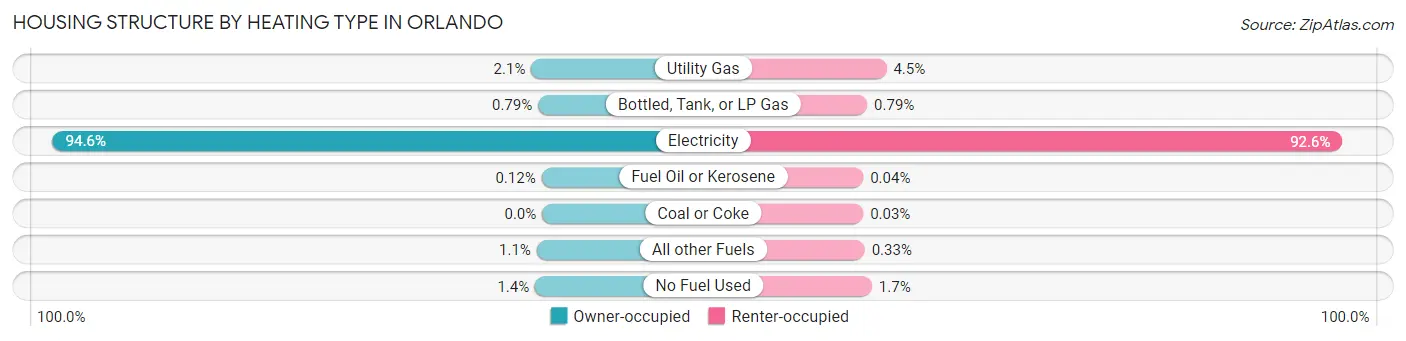
| Heating Type | Owner-occupied | Renter-occupied |
| Utility Gas | 1,009 (2.1%) | 3,371 (4.5%) |
| Bottled, Tank, or LP Gas | 379 (0.8%) | 585 (0.8%) |
| Electricity | 45,493 (94.6%) | 68,985 (92.6%) |
| Fuel Oil or Kerosene | 58 (0.1%) | 27 (0.0%) |
| Coal or Coke | 0 (0.0%) | 19 (0.0%) |
| All other Fuels | 507 (1.1%) | 248 (0.3%) |
| No Fuel Used | 653 (1.4%) | 1,273 (1.7%) |
| Total | 48,099 (100.0%) | 74,508 (100.0%) |
Household Vehicle Usage in Orlando
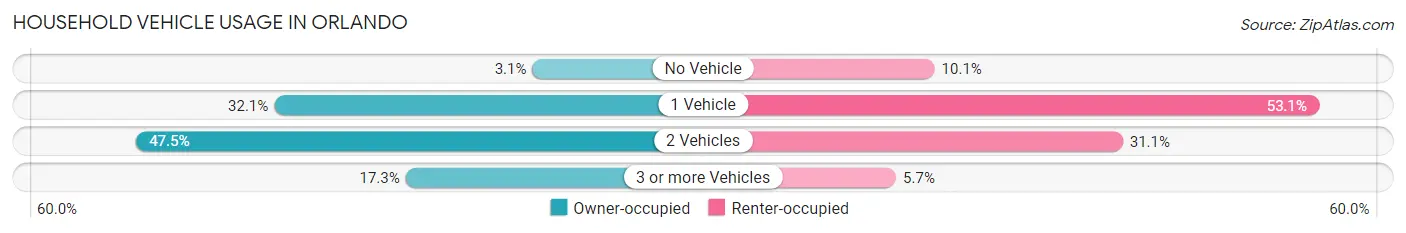
| Vehicles per Household | Owner-occupied | Renter-occupied |
| No Vehicle | 1,507 (3.1%) | 7,490 (10.1%) |
| 1 Vehicle | 15,415 (32.1%) | 39,546 (53.1%) |
| 2 Vehicles | 22,843 (47.5%) | 23,196 (31.1%) |
| 3 or more Vehicles | 8,334 (17.3%) | 4,276 (5.7%) |
| Total | 48,099 (100.0%) | 74,508 (100.0%) |
Real Estate & Mortgages in Orlando
Real Estate and Mortgage Overview in Orlando
| Characteristic | Without Mortgage | With Mortgage |
| Housing Units | 15,139 | 32,960 |
| Median Property Value | $280,000 | $351,800 |
| Median Household Income | $69,672 | $11,857 |
| Monthly Housing Costs | $691 | $6,145 |
| Real Estate Taxes | $2,176 | $902 |
Property Value by Mortgage Status in Orlando
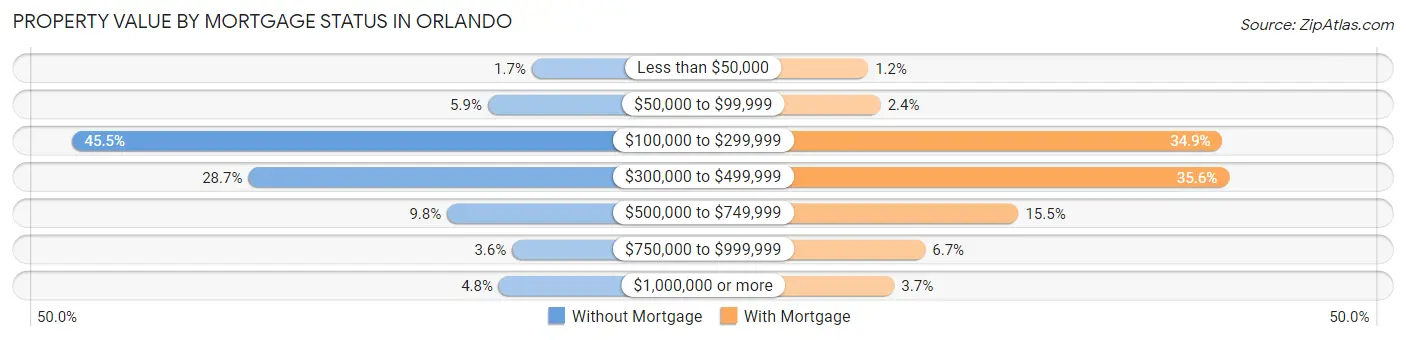
| Property Value | Without Mortgage | With Mortgage |
| Less than $50,000 | 257 (1.7%) | 398 (1.2%) |
| $50,000 to $99,999 | 892 (5.9%) | 790 (2.4%) |
| $100,000 to $299,999 | 6,892 (45.5%) | 11,517 (34.9%) |
| $300,000 to $499,999 | 4,345 (28.7%) | 11,726 (35.6%) |
| $500,000 to $749,999 | 1,479 (9.8%) | 5,116 (15.5%) |
| $750,000 to $999,999 | 542 (3.6%) | 2,192 (6.7%) |
| $1,000,000 or more | 732 (4.8%) | 1,221 (3.7%) |
| Total | 15,139 (100.0%) | 32,960 (100.0%) |
Household Income by Mortgage Status in Orlando
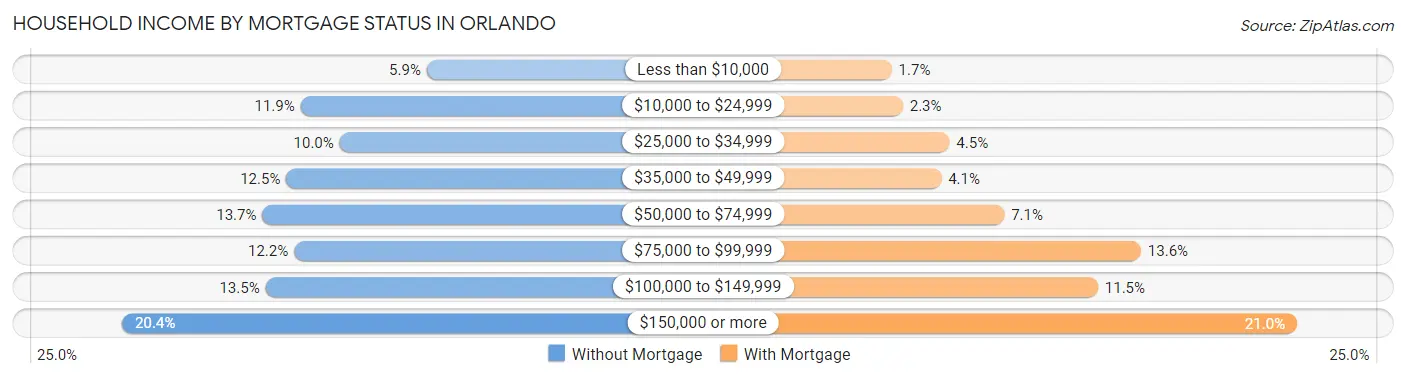
| Household Income | Without Mortgage | With Mortgage |
| Less than $10,000 | 885 (5.9%) | 568 (1.7%) |
| $10,000 to $24,999 | 1,796 (11.9%) | 741 (2.2%) |
| $25,000 to $34,999 | 1,514 (10.0%) | 1,474 (4.5%) |
| $35,000 to $49,999 | 1,899 (12.5%) | 1,345 (4.1%) |
| $50,000 to $74,999 | 2,071 (13.7%) | 2,334 (7.1%) |
| $75,000 to $99,999 | 1,843 (12.2%) | 4,480 (13.6%) |
| $100,000 to $149,999 | 2,048 (13.5%) | 3,802 (11.5%) |
| $150,000 or more | 3,083 (20.4%) | 6,927 (21.0%) |
| Total | 15,139 (100.0%) | 32,960 (100.0%) |
Property Value to Household Income Ratio in Orlando
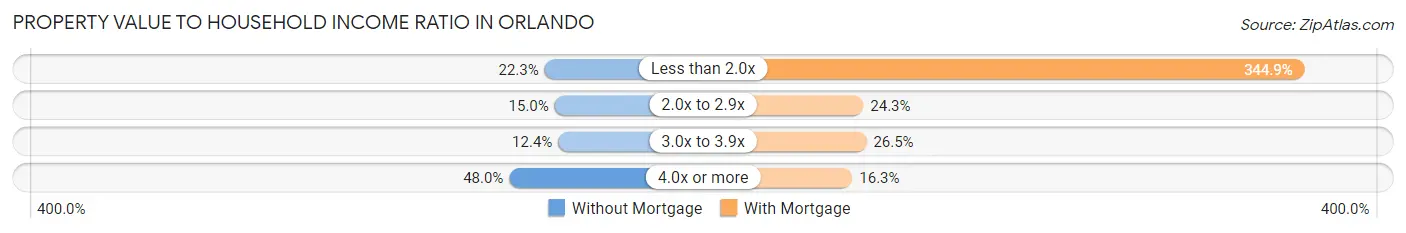
| Value-to-Income Ratio | Without Mortgage | With Mortgage |
| Less than 2.0x | 3,378 (22.3%) | 113,662 (344.9%) |
| 2.0x to 2.9x | 2,269 (15.0%) | 8,002 (24.3%) |
| 3.0x to 3.9x | 1,878 (12.4%) | 8,743 (26.5%) |
| 4.0x or more | 7,260 (48.0%) | 5,370 (16.3%) |
| Total | 15,139 (100.0%) | 32,960 (100.0%) |
Real Estate Taxes by Mortgage Status in Orlando
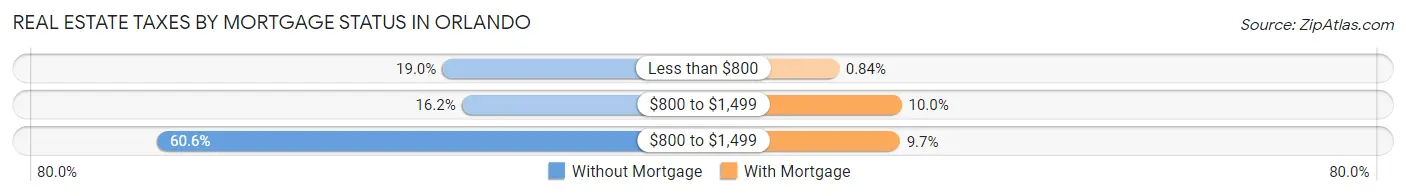
| Property Taxes | Without Mortgage | With Mortgage |
| Less than $800 | 2,875 (19.0%) | 278 (0.8%) |
| $800 to $1,499 | 2,446 (16.2%) | 3,300 (10.0%) |
| $800 to $1,499 | 9,179 (60.6%) | 3,210 (9.7%) |
| Total | 15,139 (100.0%) | 32,960 (100.0%) |
Health & Disability in Orlando
Health Insurance Coverage by Age in Orlando
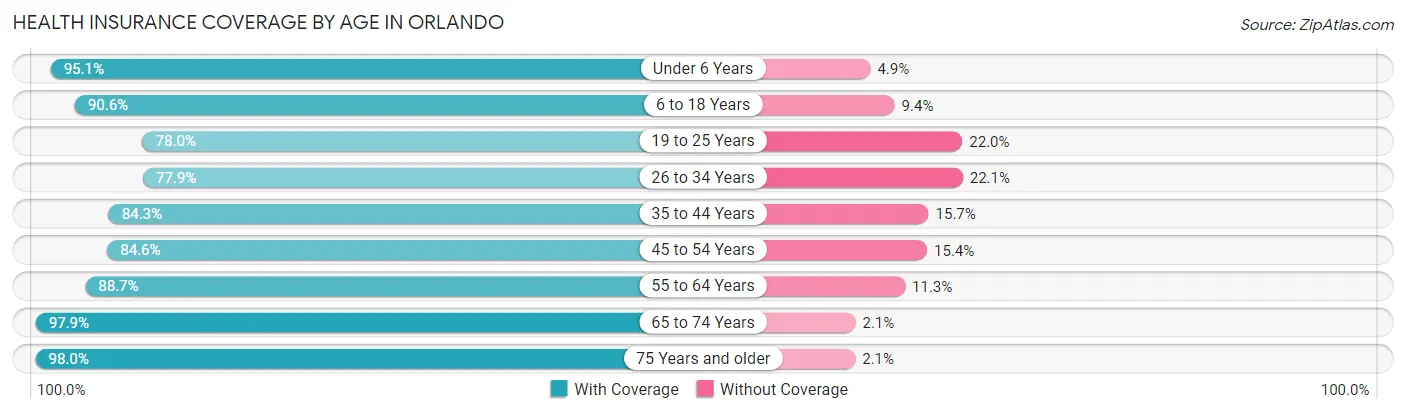
| Age Bracket | With Coverage | Without Coverage |
| Under 6 Years | 21,951 (95.1%) | 1,126 (4.9%) |
| 6 to 18 Years | 39,491 (90.6%) | 4,094 (9.4%) |
| 19 to 25 Years | 22,395 (78.0%) | 6,324 (22.0%) |
| 26 to 34 Years | 46,320 (77.9%) | 13,131 (22.1%) |
| 35 to 44 Years | 41,679 (84.3%) | 7,776 (15.7%) |
| 45 to 54 Years | 31,828 (84.6%) | 5,811 (15.4%) |
| 55 to 64 Years | 27,775 (88.7%) | 3,553 (11.3%) |
| 65 to 74 Years | 18,650 (97.9%) | 401 (2.1%) |
| 75 Years and older | 12,778 (98.0%) | 267 (2.1%) |
| Total | 262,867 (86.1%) | 42,483 (13.9%) |
Health Insurance Coverage by Citizenship Status in Orlando
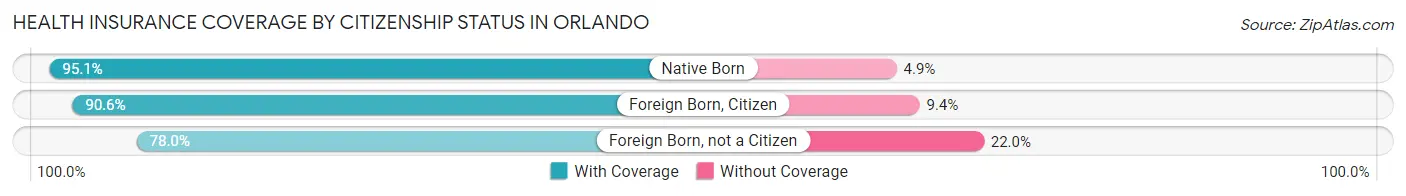
| Citizenship Status | With Coverage | Without Coverage |
| Native Born | 21,951 (95.1%) | 1,126 (4.9%) |
| Foreign Born, Citizen | 39,491 (90.6%) | 4,094 (9.4%) |
| Foreign Born, not a Citizen | 22,395 (78.0%) | 6,324 (22.0%) |
Health Insurance Coverage by Household Income in Orlando
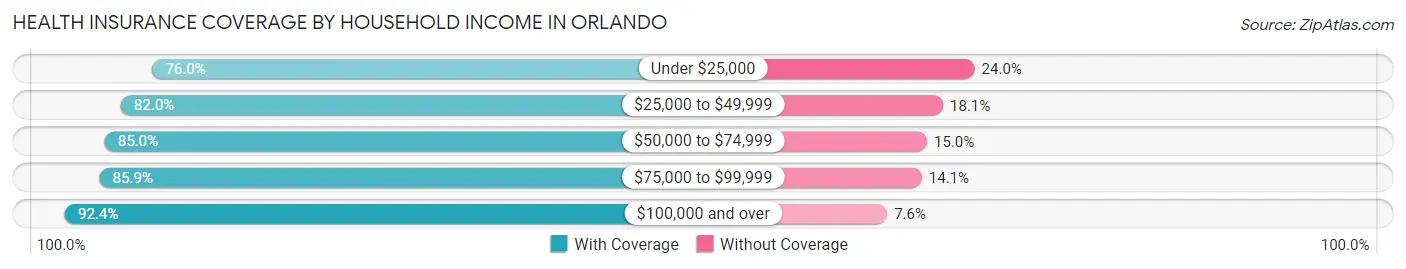
| Household Income | With Coverage | Without Coverage |
| Under $25,000 | 30,873 (76.0%) | 9,726 (24.0%) |
| $25,000 to $49,999 | 47,508 (82.0%) | 10,463 (18.0%) |
| $50,000 to $74,999 | 44,627 (85.0%) | 7,893 (15.0%) |
| $75,000 to $99,999 | 36,313 (85.9%) | 5,944 (14.1%) |
| $100,000 and over | 102,426 (92.4%) | 8,395 (7.6%) |
Public vs Private Health Insurance Coverage by Age in Orlando
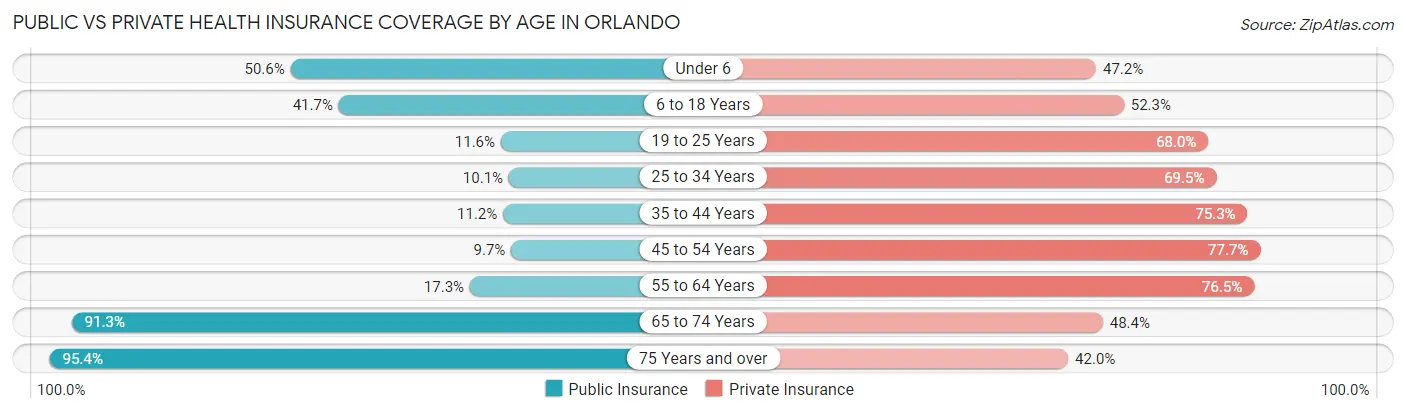
| Age Bracket | Public Insurance | Private Insurance |
| Under 6 | 11,686 (50.6%) | 10,892 (47.2%) |
| 6 to 18 Years | 18,170 (41.7%) | 22,811 (52.3%) |
| 19 to 25 Years | 3,331 (11.6%) | 19,529 (68.0%) |
| 25 to 34 Years | 6,008 (10.1%) | 41,319 (69.5%) |
| 35 to 44 Years | 5,530 (11.2%) | 37,237 (75.3%) |
| 45 to 54 Years | 3,644 (9.7%) | 29,226 (77.6%) |
| 55 to 64 Years | 5,433 (17.3%) | 23,975 (76.5%) |
| 65 to 74 Years | 17,387 (91.3%) | 9,228 (48.4%) |
| 75 Years and over | 12,441 (95.4%) | 5,482 (42.0%) |
| Total | 83,630 (27.4%) | 199,699 (65.4%) |
Disability Status by Sex by Age in Orlando
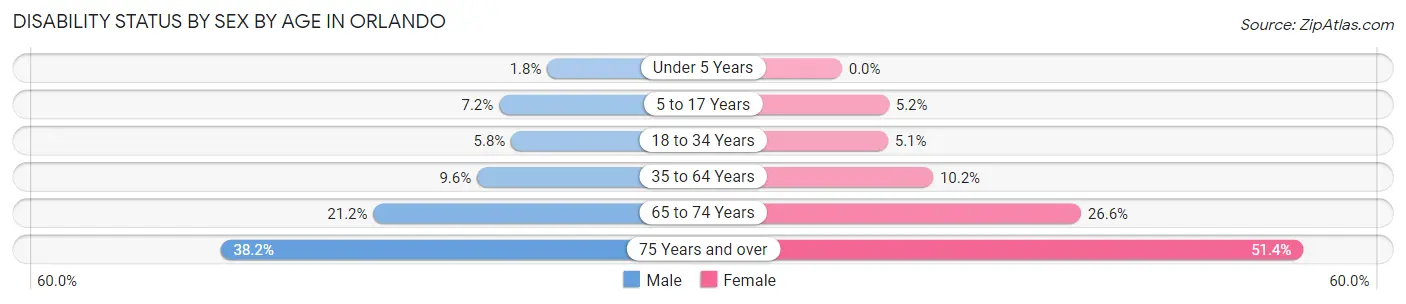
| Age Bracket | Male | Female |
| Under 5 Years | 178 (1.8%) | 0 (0.0%) |
| 5 to 17 Years | 1,640 (7.1%) | 1,138 (5.2%) |
| 18 to 34 Years | 2,545 (5.8%) | 2,406 (5.1%) |
| 35 to 64 Years | 5,711 (9.6%) | 5,989 (10.2%) |
| 65 to 74 Years | 1,721 (21.2%) | 2,907 (26.6%) |
| 75 Years and over | 1,845 (38.2%) | 4,220 (51.4%) |
Disability Class by Sex by Age in Orlando
Disability Class: Hearing Difficulty
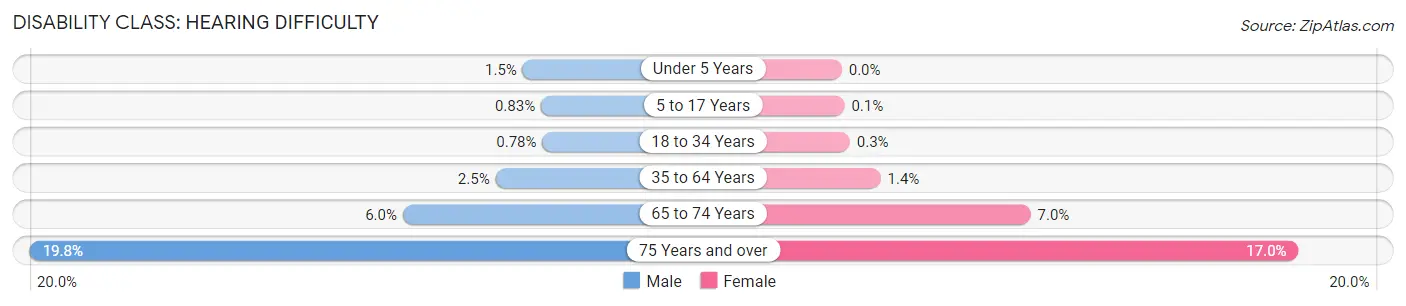
| Age Bracket | Male | Female |
| Under 5 Years | 150 (1.5%) | 0 (0.0%) |
| 5 to 17 Years | 191 (0.8%) | 21 (0.1%) |
| 18 to 34 Years | 342 (0.8%) | 141 (0.3%) |
| 35 to 64 Years | 1,497 (2.5%) | 848 (1.4%) |
| 65 to 74 Years | 485 (6.0%) | 765 (7.0%) |
| 75 Years and over | 957 (19.8%) | 1,392 (17.0%) |
Disability Class: Vision Difficulty
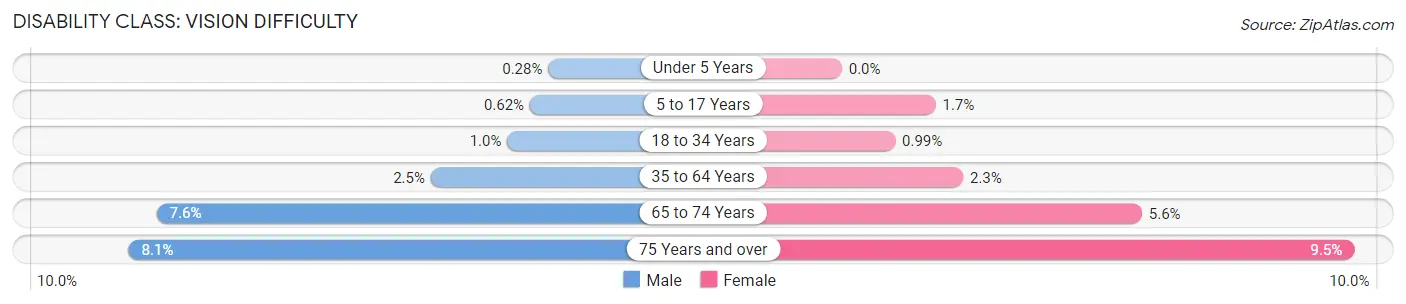
| Age Bracket | Male | Female |
| Under 5 Years | 28 (0.3%) | 0 (0.0%) |
| 5 to 17 Years | 143 (0.6%) | 378 (1.7%) |
| 18 to 34 Years | 454 (1.0%) | 463 (1.0%) |
| 35 to 64 Years | 1,459 (2.5%) | 1,325 (2.2%) |
| 65 to 74 Years | 614 (7.5%) | 608 (5.6%) |
| 75 Years and over | 390 (8.1%) | 781 (9.5%) |
Disability Class: Cognitive Difficulty
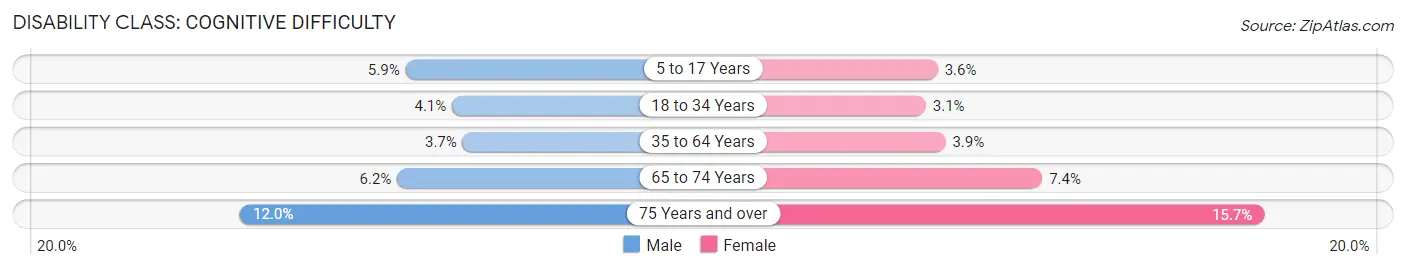
| Age Bracket | Male | Female |
| 5 to 17 Years | 1,344 (5.9%) | 776 (3.6%) |
| 18 to 34 Years | 1,808 (4.1%) | 1,467 (3.1%) |
| 35 to 64 Years | 2,222 (3.7%) | 2,271 (3.8%) |
| 65 to 74 Years | 502 (6.2%) | 812 (7.4%) |
| 75 Years and over | 580 (12.0%) | 1,288 (15.7%) |
Disability Class: Ambulatory Difficulty
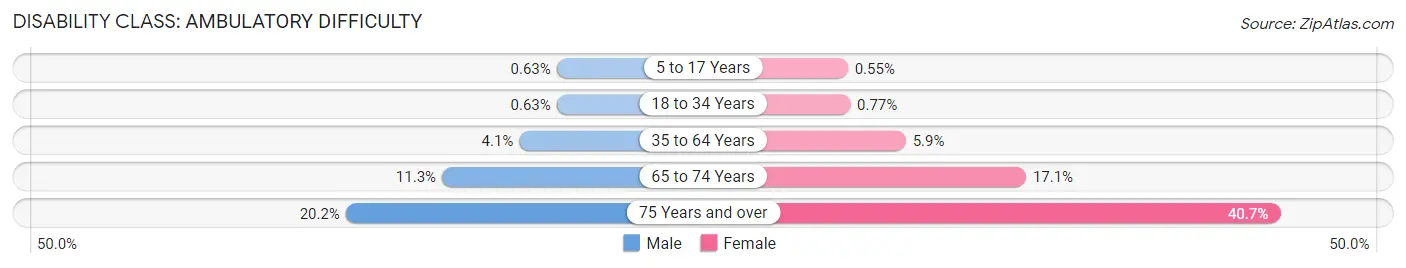
| Age Bracket | Male | Female |
| 5 to 17 Years | 144 (0.6%) | 119 (0.5%) |
| 18 to 34 Years | 276 (0.6%) | 360 (0.8%) |
| 35 to 64 Years | 2,438 (4.1%) | 3,498 (5.9%) |
| 65 to 74 Years | 917 (11.3%) | 1,866 (17.1%) |
| 75 Years and over | 976 (20.2%) | 3,340 (40.7%) |
Disability Class: Self-Care Difficulty
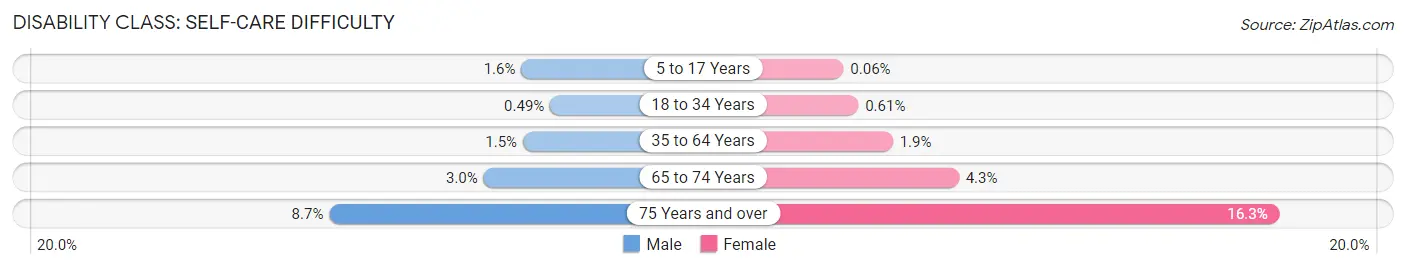
| Age Bracket | Male | Female |
| 5 to 17 Years | 358 (1.6%) | 14 (0.1%) |
| 18 to 34 Years | 215 (0.5%) | 285 (0.6%) |
| 35 to 64 Years | 892 (1.5%) | 1,116 (1.9%) |
| 65 to 74 Years | 241 (3.0%) | 474 (4.3%) |
| 75 Years and over | 420 (8.7%) | 1,335 (16.3%) |
Technology Access in Orlando
Computing Device Access in Orlando
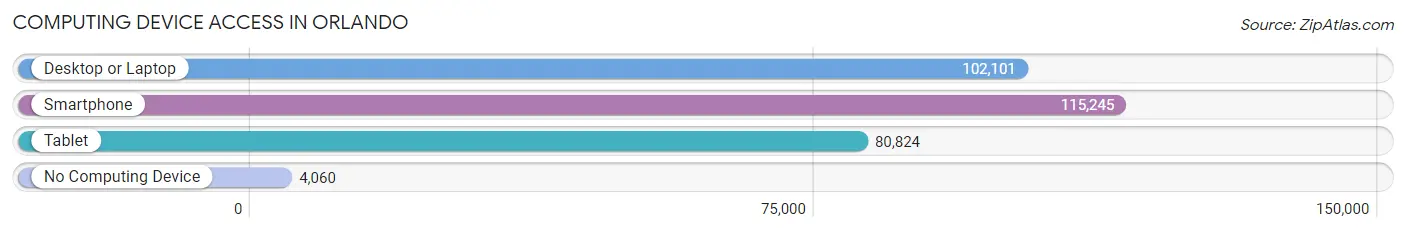
| Device Type | # Households | % Households |
| Desktop or Laptop | 102,101 | 83.3% |
| Smartphone | 115,245 | 94.0% |
| Tablet | 80,824 | 65.9% |
| No Computing Device | 4,060 | 3.3% |
| Total | 122,607 | 100.0% |
Internet Access in Orlando
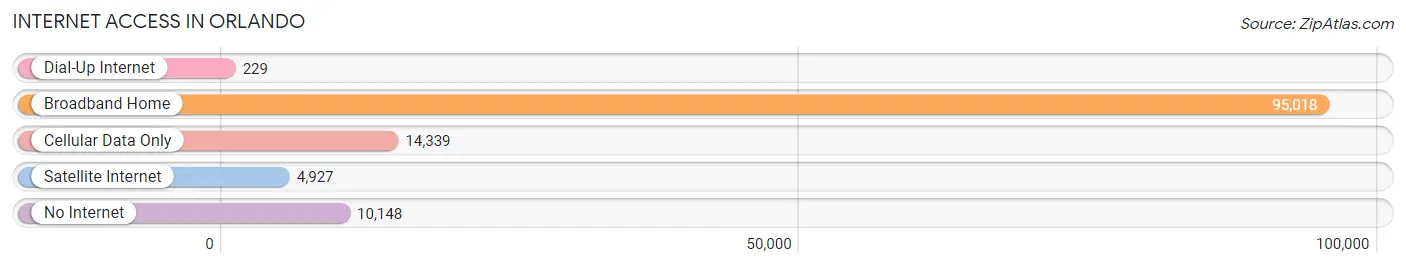
| Internet Type | # Households | % Households |
| Dial-Up Internet | 229 | 0.2% |
| Broadband Home | 95,018 | 77.5% |
| Cellular Data Only | 14,339 | 11.7% |
| Satellite Internet | 4,927 | 4.0% |
| No Internet | 10,148 | 8.3% |
| Total | 122,607 | 100.0% |
Orlando Summary
Orlando, Florida is a major city located in the central region of the state. It is the county seat of Orange County and the sixth-largest city in Florida. The city is known for its many attractions, including Walt Disney World, Universal Orlando Resort, SeaWorld Orlando, and the Orange County Convention Center. Orlando is also home to a number of professional sports teams, including the Orlando Magic of the NBA, the Orlando City Soccer Club of Major League Soccer, and the Orlando Solar Bears of the ECHL.
History
The area that is now Orlando was originally inhabited by the Timucua people, who were later displaced by the Seminole tribe. The first permanent European settlers arrived in the area in 1843, when a group of settlers from Tennessee established a settlement called Jernigan. The settlement was named after Aaron Jernigan, a cattleman who had moved to the area from Georgia. In 1857, the settlement was renamed Orlando after a soldier who had died in the Second Seminole War.
In the late 19th century, Orlando began to grow rapidly as a result of the arrival of the railroad. The city was incorporated in 1875 and was designated as the county seat of Orange County in 1885. In the early 20th century, Orlando experienced a period of rapid growth, becoming a major tourist destination due to its proximity to the many attractions in the area.
Geography
Orlando is located in central Florida, approximately 25 miles (40 km) northeast of Tampa and approximately 60 miles (97 km) southwest of Daytona Beach. The city is situated on the northern shore of Lake Eola, a large freshwater lake located in the center of the city. The city is also located near the headwaters of the St. Johns River, which flows southward to the Atlantic Ocean.
The city has a total area of 110.8 square miles (286.6 km2), of which 107.3 square miles (277.9 km2) is land and 3.5 square miles (9.1 km2) is water. The city is located in a humid subtropical climate zone, with hot, humid summers and mild, dry winters.
Economy
Orlando is a major economic center in Florida, with a diverse economy that includes tourism, manufacturing, finance, healthcare, and technology. The city is home to a number of major corporations, including Lockheed Martin, Darden Restaurants, and Tupperware Brands.
Tourism is a major part of the city's economy, with the city being home to a number of major attractions, including Walt Disney World, Universal Orlando Resort, SeaWorld Orlando, and the Orange County Convention Center. The city is also home to a number of professional sports teams, including the Orlando Magic of the NBA, the Orlando City Soccer Club of Major League Soccer, and the Orlando Solar Bears of the ECHL.
Demographics
As of the 2020 census, the population of Orlando was 285,713, making it the sixth-largest city in Florida. The city has a population density of 2,619 people per square mile (1,009/km2). The racial makeup of the city was 54.2% White, 28.2% African American, 0.5% Native American, 4.2% Asian, 0.1% Pacific Islander, 10.2% from other races, and 2.7% from two or more races. Hispanic or Latino of any race were 24.3% of the population.
The median income for a household in the city was $45,890, and the median income for a family was $54,890. The per capita income for the city was $25,890. About 17.2% of the population was below the poverty line.
Common Questions
What is Per Capita Income in Orlando?
Per Capita income in Orlando is $40,253.
What is the Median Family Income in Orlando?
Median Family Income in Orlando is $74,980.
What is the Median Household income in Orlando?
Median Household Income in Orlando is $66,292.
What is Income or Wage Gap in Orlando?
Income or Wage Gap in Orlando is 25.3%.
Women in Orlando earn 74.7 cents for every dollar earned by a man.
What is Family Income Deficit in Orlando?
Family Income Deficit in Orlando is $11,277.
Families that are below poverty line in Orlando earn $11,277 less on average than the poverty threshold level.
What is Inequality or Gini Index in Orlando?
Inequality or Gini Index in Orlando is 0.50.
What is the Total Population of Orlando?
Total Population of Orlando is 307,738.
What is the Total Male Population of Orlando?
Total Male Population of Orlando is 150,314.
What is the Total Female Population of Orlando?
Total Female Population of Orlando is 157,424.
What is the Ratio of Males per 100 Females in Orlando?
There are 95.48 Males per 100 Females in Orlando.
What is the Ratio of Females per 100 Males in Orlando?
There are 104.73 Females per 100 Males in Orlando.
What is the Median Population Age in Orlando?
Median Population Age in Orlando is 34.7 Years.
What is the Average Family Size in Orlando
Average Family Size in Orlando is 3.3 People.
What is the Average Household Size in Orlando
Average Household Size in Orlando is 2.5 People.
How Large is the Labor Force in Orlando?
There are 178,952 People in the Labor Forcein in Orlando.
What is the Percentage of People in the Labor Force in Orlando?
71.3% of People are in the Labor Force in Orlando.
What is the Unemployment Rate in Orlando?
Unemployment Rate in Orlando is 5.2%.