Miramar, FL Map & Demographics
Miramar Map
Miramar Overview
$35,321
PER CAPITA INCOME
$90,967
AVG FAMILY INCOME
$81,812
AVG HOUSEHOLD INCOME
9.9%
WAGE / INCOME GAP [ % ]
90.1¢/ $1
WAGE / INCOME GAP [ $ ]
$10,684
FAMILY INCOME DEFICIT
0.41
INEQUALITY / GINI INDEX
135,158
TOTAL POPULATION
65,877
MALE POPULATION
69,281
FEMALE POPULATION
95.09
MALES / 100 FEMALES
105.17
FEMALES / 100 MALES
38.8
MEDIAN AGE
3.5
AVG FAMILY SIZE
3.1
AVG HOUSEHOLD SIZE
77,836
LABOR FORCE [ PEOPLE ]
72.0%
PERCENT IN LABOR FORCE
4.2%
UNEMPLOYMENT RATE
Income in Miramar
Income Overview in Miramar
Per Capita Income in Miramar is $35,321, while median incomes of families and households are $90,967 and $81,812 respectively.
| Characteristic | Number | Measure |
| Per Capita Income | 135,158 | $35,321 |
| Median Family Income | 32,863 | $90,967 |
| Mean Family Income | 32,863 | $113,964 |
| Median Household Income | 43,038 | $81,812 |
| Mean Household Income | 43,038 | $105,465 |
| Income Deficit | 32,863 | $10,684 |
| Wage / Income Gap (%) | 135,158 | 9.85% |
| Wage / Income Gap ($) | 135,158 | 90.15¢ per $1 |
| Gini / Inequality Index | 135,158 | 0.41 |
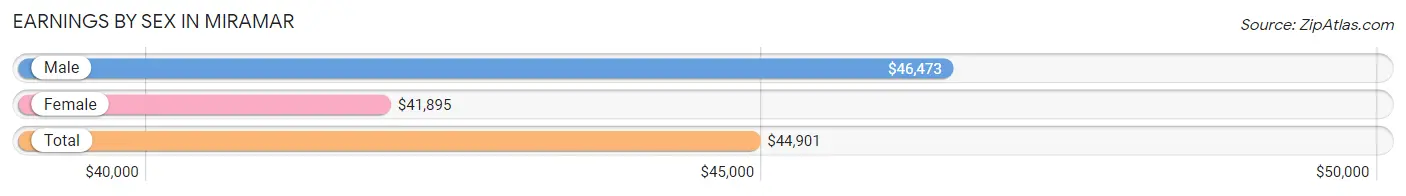
Earnings by Sex in Miramar
Average Earnings in Miramar are $44,901, $46,473 for men and $41,895 for women, a difference of 9.9%.
| Sex | Number | Average Earnings |
| Male | 39,939 (51.0%) | $46,473 |
| Female | 38,436 (49.0%) | $41,895 |
| Total | 78,375 (100.0%) | $44,901 |
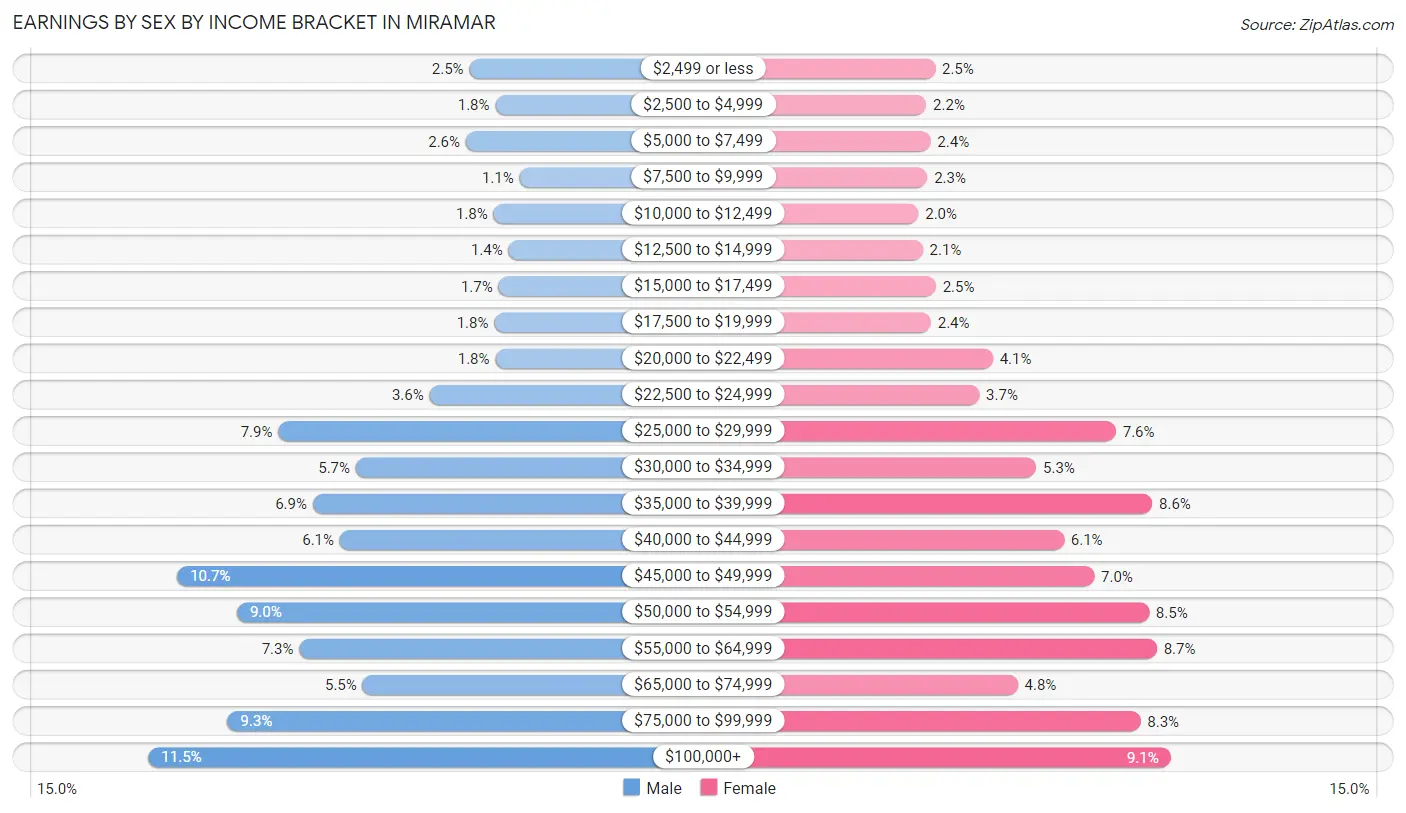
Earnings by Sex by Income Bracket in Miramar
The most common earnings brackets in Miramar are $100,000+ for men (4,601 | 11.5%) and $100,000+ for women (3,497 | 9.1%).
| Income | Male | Female |
| $2,499 or less | 999 (2.5%) | 955 (2.5%) |
| $2,500 to $4,999 | 706 (1.8%) | 857 (2.2%) |
| $5,000 to $7,499 | 1,038 (2.6%) | 904 (2.4%) |
| $7,500 to $9,999 | 437 (1.1%) | 867 (2.3%) |
| $10,000 to $12,499 | 728 (1.8%) | 773 (2.0%) |
| $12,500 to $14,999 | 561 (1.4%) | 820 (2.1%) |
| $15,000 to $17,499 | 671 (1.7%) | 962 (2.5%) |
| $17,500 to $19,999 | 720 (1.8%) | 908 (2.4%) |
| $20,000 to $22,499 | 708 (1.8%) | 1,576 (4.1%) |
| $22,500 to $24,999 | 1,445 (3.6%) | 1,430 (3.7%) |
| $25,000 to $29,999 | 3,142 (7.9%) | 2,904 (7.6%) |
| $30,000 to $34,999 | 2,274 (5.7%) | 2,046 (5.3%) |
| $35,000 to $39,999 | 2,754 (6.9%) | 3,296 (8.6%) |
| $40,000 to $44,999 | 2,453 (6.1%) | 2,346 (6.1%) |
| $45,000 to $49,999 | 4,276 (10.7%) | 2,670 (7.0%) |
| $50,000 to $54,999 | 3,605 (9.0%) | 3,264 (8.5%) |
| $55,000 to $64,999 | 2,909 (7.3%) | 3,346 (8.7%) |
| $65,000 to $74,999 | 2,197 (5.5%) | 1,844 (4.8%) |
| $75,000 to $99,999 | 3,715 (9.3%) | 3,171 (8.3%) |
| $100,000+ | 4,601 (11.5%) | 3,497 (9.1%) |
| Total | 39,939 (100.0%) | 38,436 (100.0%) |
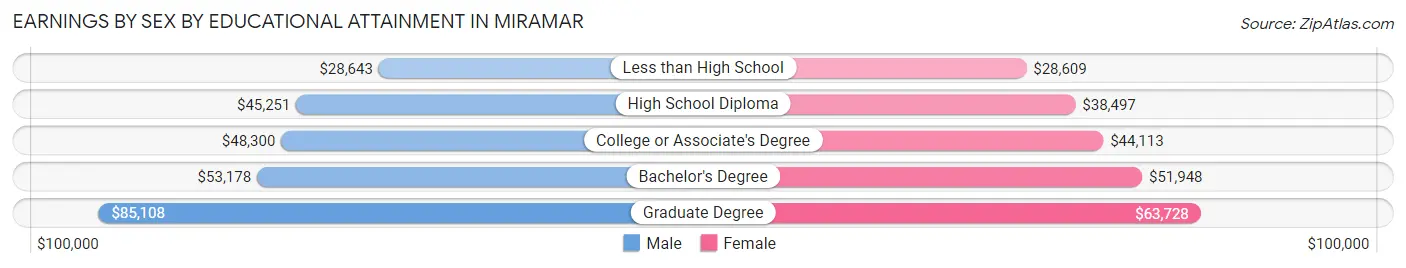
Earnings by Sex by Educational Attainment in Miramar
Average earnings in Miramar are $48,428 for men and $45,653 for women, a difference of 5.7%. Men with an educational attainment of graduate degree enjoy the highest average annual earnings of $85,108, while those with less than high school education earn the least with $28,643. Women with an educational attainment of graduate degree earn the most with the average annual earnings of $63,728, while those with less than high school education have the smallest earnings of $28,609.
| Educational Attainment | Male Income | Female Income |
| Less than High School | $28,643 | $28,609 |
| High School Diploma | $45,251 | $38,497 |
| College or Associate's Degree | $48,300 | $44,113 |
| Bachelor's Degree | $53,178 | $51,948 |
| Graduate Degree | $85,108 | $63,728 |
| Total | $48,428 | $45,653 |
Family Income in Miramar
Family Income Brackets in Miramar
According to the Miramar family income data, there are 7,000 families falling into the $100,000 to $149,999 income range, which is the most common income bracket and makes up 21.3% of all families. Conversely, the $10,000 to $14,999 income bracket is the least frequent group with only 657 families (2.0%) belonging to this category.
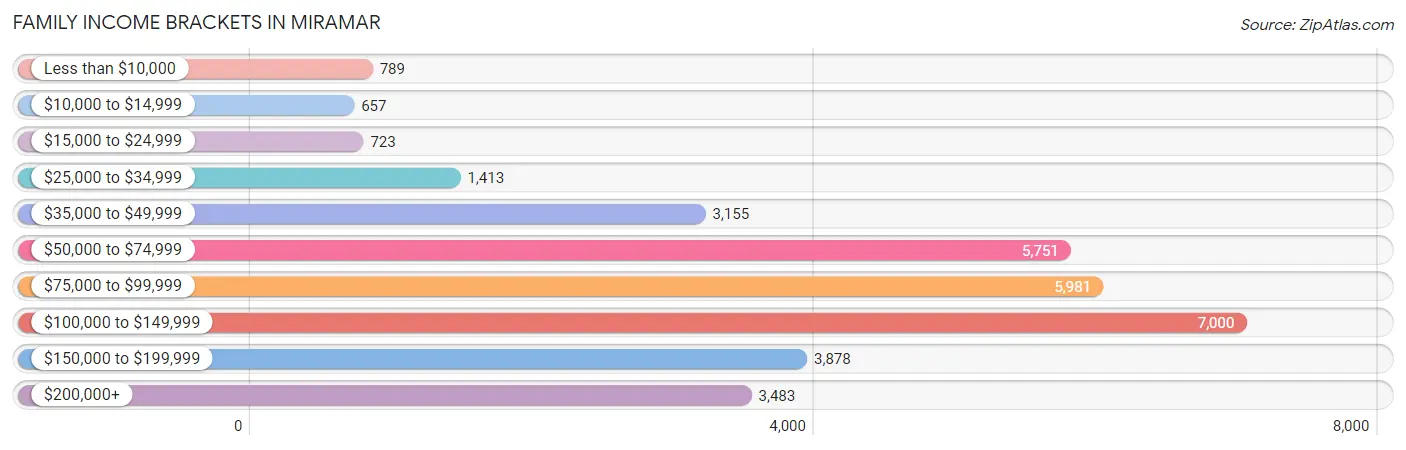
| Income Bracket | # Families | % Families |
| Less than $10,000 | 789 | 2.4% |
| $10,000 to $14,999 | 657 | 2.0% |
| $15,000 to $24,999 | 723 | 2.2% |
| $25,000 to $34,999 | 1,413 | 4.3% |
| $35,000 to $49,999 | 3,155 | 9.6% |
| $50,000 to $74,999 | 5,751 | 17.5% |
| $75,000 to $99,999 | 5,981 | 18.2% |
| $100,000 to $149,999 | 7,000 | 21.3% |
| $150,000 to $199,999 | 3,878 | 11.8% |
| $200,000+ | 3,483 | 10.6% |
Family Income by Famaliy Size in Miramar
7+ person families (809 | 2.5%) account for the highest median family income in Miramar with $169,160 per family, while 2-person families (11,434 | 34.8%) have the highest median income of $35,578 per family member.
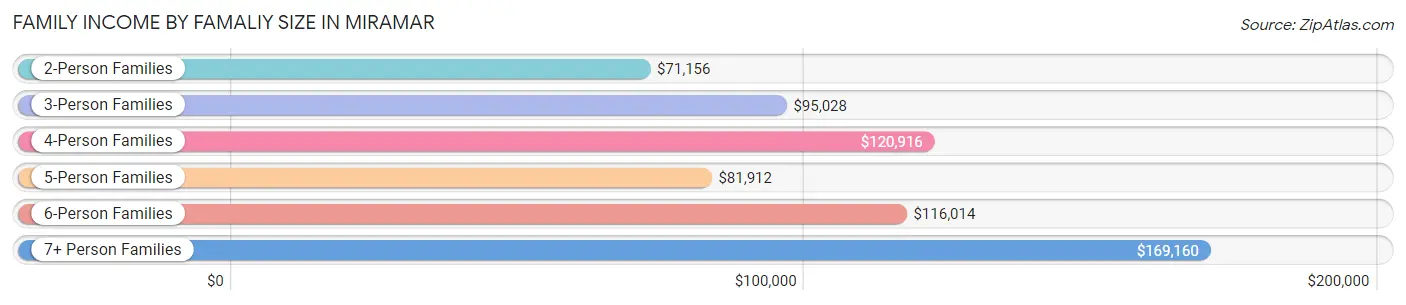
| Income Bracket | # Families | Median Income |
| 2-Person Families | 11,434 (34.8%) | $71,156 |
| 3-Person Families | 9,648 (29.4%) | $95,028 |
| 4-Person Families | 6,911 (21.0%) | $120,916 |
| 5-Person Families | 2,934 (8.9%) | $81,912 |
| 6-Person Families | 1,127 (3.4%) | $116,014 |
| 7+ Person Families | 809 (2.5%) | $169,160 |
| Total | 32,863 (100.0%) | $90,967 |
Family Income by Number of Earners in Miramar
The median family income in Miramar is $90,967, with families comprising 3+ earners (6,473) having the highest median family income of $141,069, while families with no earners (2,759) have the lowest median family income of $24,943, accounting for 19.7% and 8.4% of families, respectively.
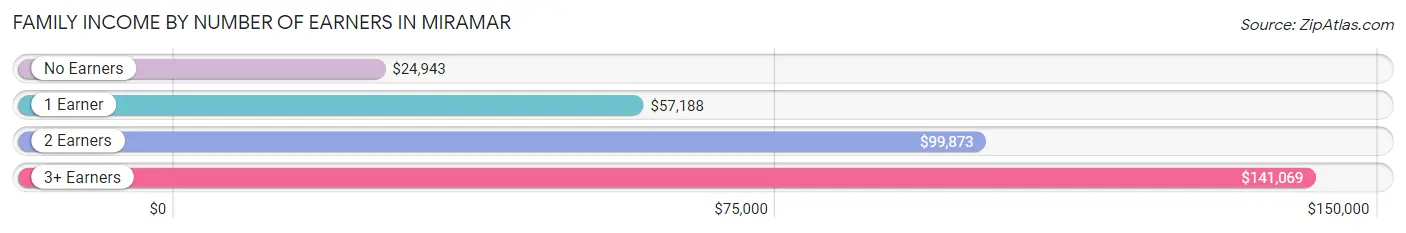
| Number of Earners | # Families | Median Income |
| No Earners | 2,759 (8.4%) | $24,943 |
| 1 Earner | 8,750 (26.6%) | $57,188 |
| 2 Earners | 14,881 (45.3%) | $99,873 |
| 3+ Earners | 6,473 (19.7%) | $141,069 |
| Total | 32,863 (100.0%) | $90,967 |
Household Income in Miramar
Household Income Brackets in Miramar
With 8,349 households falling in the category, the $100,000 to $149,999 income range is the most frequent in Miramar, accounting for 19.4% of all households. In contrast, only 904 households (2.1%) fall into the $10,000 to $14,999 income bracket, making it the least populous group.
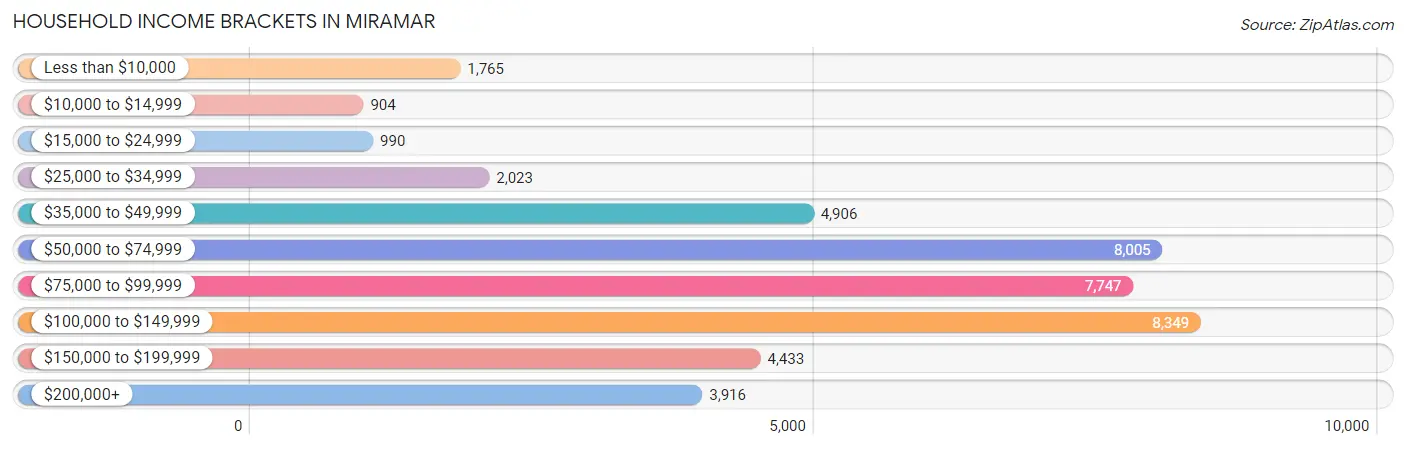
| Income Bracket | # Households | % Households |
| Less than $10,000 | 1,765 | 4.1% |
| $10,000 to $14,999 | 904 | 2.1% |
| $15,000 to $24,999 | 990 | 2.3% |
| $25,000 to $34,999 | 2,023 | 4.7% |
| $35,000 to $49,999 | 4,906 | 11.4% |
| $50,000 to $74,999 | 8,005 | 18.6% |
| $75,000 to $99,999 | 7,747 | 18.0% |
| $100,000 to $149,999 | 8,349 | 19.4% |
| $150,000 to $199,999 | 4,433 | 10.3% |
| $200,000+ | 3,916 | 9.1% |
Household Income by Householder Age in Miramar
The median household income in Miramar is $81,812, with the highest median household income of $95,308 found in the 45 to 64 years age bracket for the primary householder. A total of 19,394 households (45.1%) fall into this category. Meanwhile, the 15 to 24 years age bracket for the primary householder has the lowest median household income of $58,947, with 932 households (2.2%) in this group.
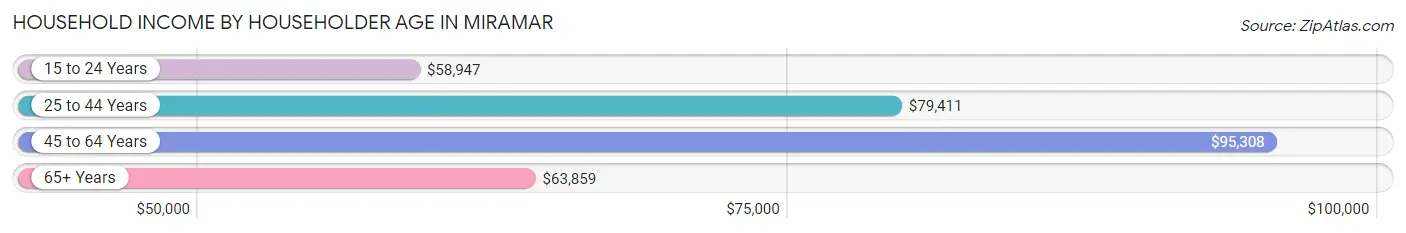
| Income Bracket | # Households | Median Income |
| 15 to 24 Years | 932 (2.2%) | $58,947 |
| 25 to 44 Years | 15,142 (35.2%) | $79,411 |
| 45 to 64 Years | 19,394 (45.1%) | $95,308 |
| 65+ Years | 7,570 (17.6%) | $63,859 |
| Total | 43,038 (100.0%) | $81,812 |
Poverty in Miramar
Income Below Poverty by Sex and Age in Miramar
With 6.9% poverty level for males and 9.5% for females among the residents of Miramar, 75 year old and over males and 15 year old females are the most vulnerable to poverty, with 528 males (23.6%) and 252 females (31.2%) in their respective age groups living below the poverty level.
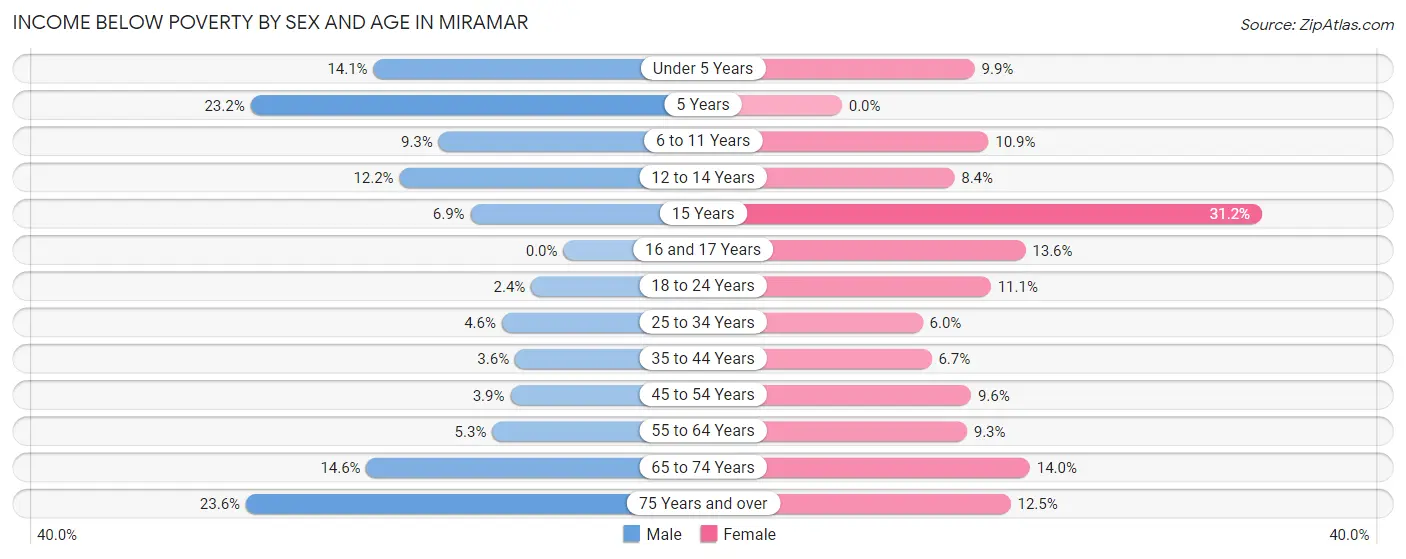
| Age Bracket | Male | Female |
| Under 5 Years | 499 (14.1%) | 410 (9.9%) |
| 5 Years | 118 (23.2%) | 0 (0.0%) |
| 6 to 11 Years | 451 (9.3%) | 570 (10.9%) |
| 12 to 14 Years | 391 (12.2%) | 198 (8.4%) |
| 15 Years | 45 (6.9%) | 252 (31.2%) |
| 16 and 17 Years | 0 (0.0%) | 185 (13.6%) |
| 18 to 24 Years | 139 (2.4%) | 663 (11.1%) |
| 25 to 34 Years | 465 (4.6%) | 561 (6.0%) |
| 35 to 44 Years | 367 (3.6%) | 689 (6.7%) |
| 45 to 54 Years | 405 (3.9%) | 1,025 (9.6%) |
| 55 to 64 Years | 414 (5.3%) | 806 (9.3%) |
| 65 to 74 Years | 694 (14.6%) | 709 (14.0%) |
| 75 Years and over | 528 (23.6%) | 479 (12.5%) |
| Total | 4,516 (6.9%) | 6,547 (9.5%) |
Income Above Poverty by Sex and Age in Miramar
According to the poverty statistics in Miramar, males aged 16 and 17 years and females aged 5 years are the age groups that are most secure financially, with 100.0% of males and 100.0% of females in these age groups living above the poverty line.
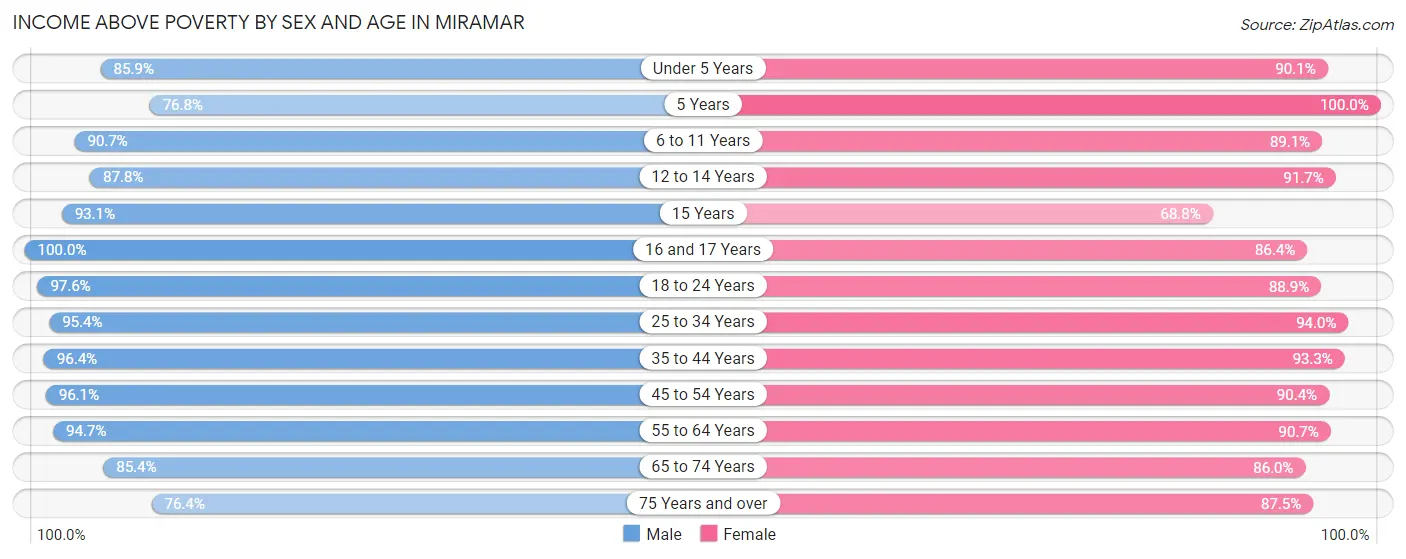
| Age Bracket | Male | Female |
| Under 5 Years | 3,039 (85.9%) | 3,749 (90.1%) |
| 5 Years | 390 (76.8%) | 1,098 (100.0%) |
| 6 to 11 Years | 4,417 (90.7%) | 4,667 (89.1%) |
| 12 to 14 Years | 2,823 (87.8%) | 2,174 (91.6%) |
| 15 Years | 607 (93.1%) | 556 (68.8%) |
| 16 and 17 Years | 1,445 (100.0%) | 1,172 (86.4%) |
| 18 to 24 Years | 5,667 (97.6%) | 5,333 (88.9%) |
| 25 to 34 Years | 9,705 (95.4%) | 8,785 (94.0%) |
| 35 to 44 Years | 9,845 (96.4%) | 9,651 (93.3%) |
| 45 to 54 Years | 9,862 (96.1%) | 9,659 (90.4%) |
| 55 to 64 Years | 7,431 (94.7%) | 7,882 (90.7%) |
| 65 to 74 Years | 4,053 (85.4%) | 4,369 (86.0%) |
| 75 Years and over | 1,712 (76.4%) | 3,344 (87.5%) |
| Total | 60,996 (93.1%) | 62,439 (90.5%) |
Income Below Poverty Among Married-Couple Families in Miramar
The poverty statistics for married-couple families in Miramar show that 4.4% or 928 of the total 21,013 families live below the poverty line. Families with 5 or more children have the highest poverty rate of 7.9%, comprising of 5 families. On the other hand, families with 1 or 2 children have the lowest poverty rate of 2.4%, which includes 182 families.
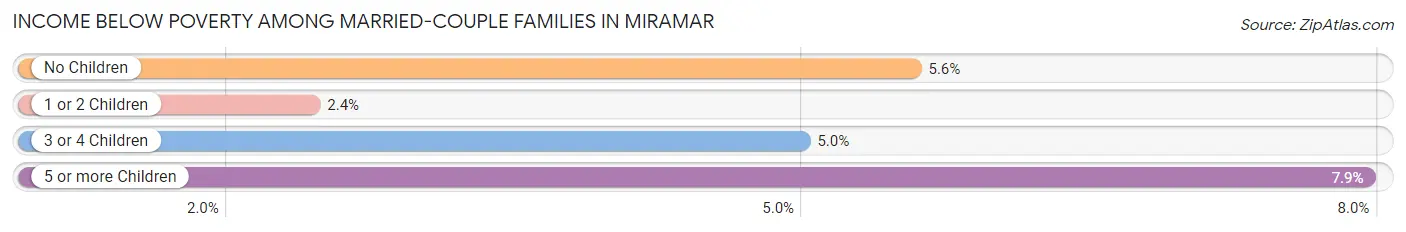
| Children | Above Poverty | Below Poverty |
| No Children | 11,247 (94.4%) | 664 (5.6%) |
| 1 or 2 Children | 7,313 (97.6%) | 182 (2.4%) |
| 3 or 4 Children | 1,467 (95.0%) | 77 (5.0%) |
| 5 or more Children | 58 (92.1%) | 5 (7.9%) |
| Total | 20,085 (95.6%) | 928 (4.4%) |
Income Below Poverty Among Single-Parent Households in Miramar
According to the poverty data in Miramar, 2.1% or 72 single-father households and 13.7% or 1,156 single-mother households are living below the poverty line. Among single-father households, those with 1 or 2 children have the highest poverty rate, with 66 households (5.3%) experiencing poverty. Likewise, among single-mother households, those with 5 or more children have the highest poverty rate, with 42 households (100.0%) falling below the poverty line.
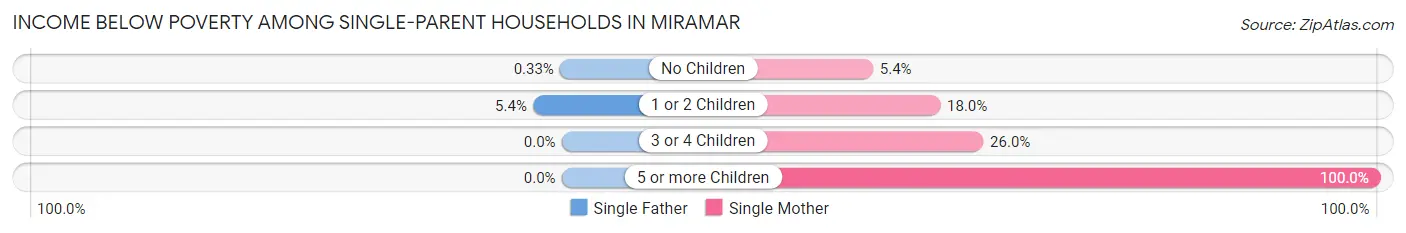
| Children | Single Father | Single Mother |
| No Children | 6 (0.3%) | 187 (5.4%) |
| 1 or 2 Children | 66 (5.3%) | 795 (18.0%) |
| 3 or 4 Children | 0 (0.0%) | 132 (26.0%) |
| 5 or more Children | 0 (0.0%) | 42 (100.0%) |
| Total | 72 (2.1%) | 1,156 (13.7%) |
Income Below Poverty Among Married-Couple vs Single-Parent Households in Miramar
The poverty data for Miramar shows that 928 of the married-couple family households (4.4%) and 1,228 of the single-parent households (10.4%) are living below the poverty level. Within the married-couple family households, those with 5 or more children have the highest poverty rate, with 5 households (7.9%) falling below the poverty line. Among the single-parent households, those with 5 or more children have the highest poverty rate, with 42 household (100.0%) living below poverty.
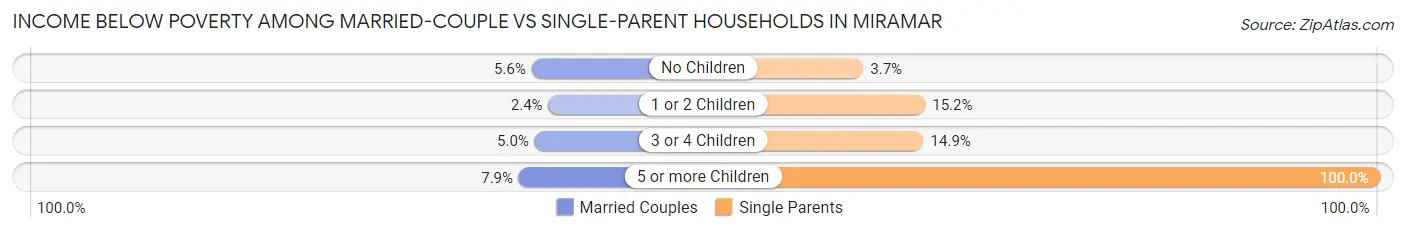
| Children | Married-Couple Families | Single-Parent Households |
| No Children | 664 (5.6%) | 193 (3.7%) |
| 1 or 2 Children | 182 (2.4%) | 861 (15.2%) |
| 3 or 4 Children | 77 (5.0%) | 132 (14.9%) |
| 5 or more Children | 5 (7.9%) | 42 (100.0%) |
| Total | 928 (4.4%) | 1,228 (10.4%) |
Race in Miramar
The most populous races in Miramar are Black / African American (62,590 | 46.3%), Hispanic or Latino (48,895 | 36.2%), and White / Caucasian (40,115 | 29.7%).
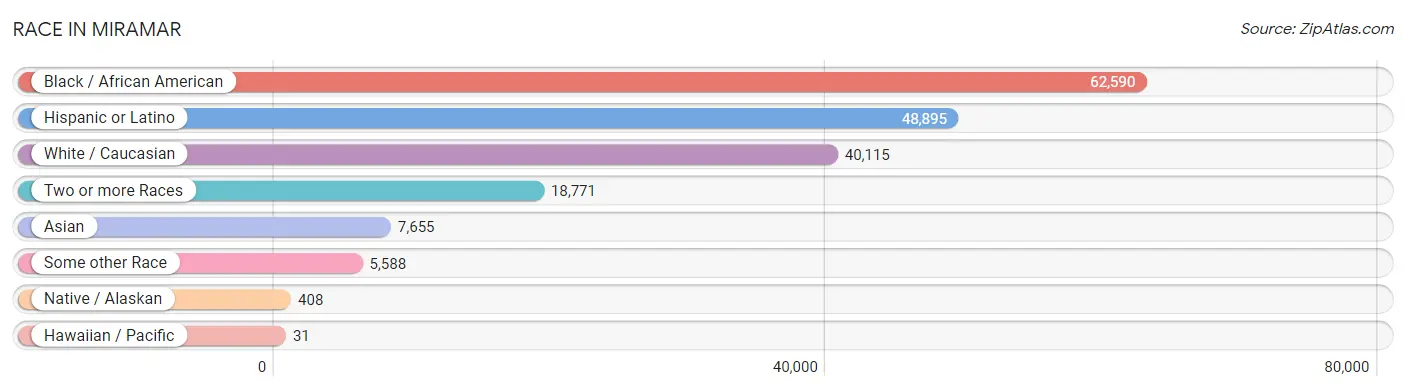
| Race | # Population | % Population |
| Asian | 7,655 | 5.7% |
| Black / African American | 62,590 | 46.3% |
| Hawaiian / Pacific | 31 | 0.0% |
| Hispanic or Latino | 48,895 | 36.2% |
| Native / Alaskan | 408 | 0.3% |
| White / Caucasian | 40,115 | 29.7% |
| Two or more Races | 18,771 | 13.9% |
| Some other Race | 5,588 | 4.1% |
| Total | 135,158 | 100.0% |
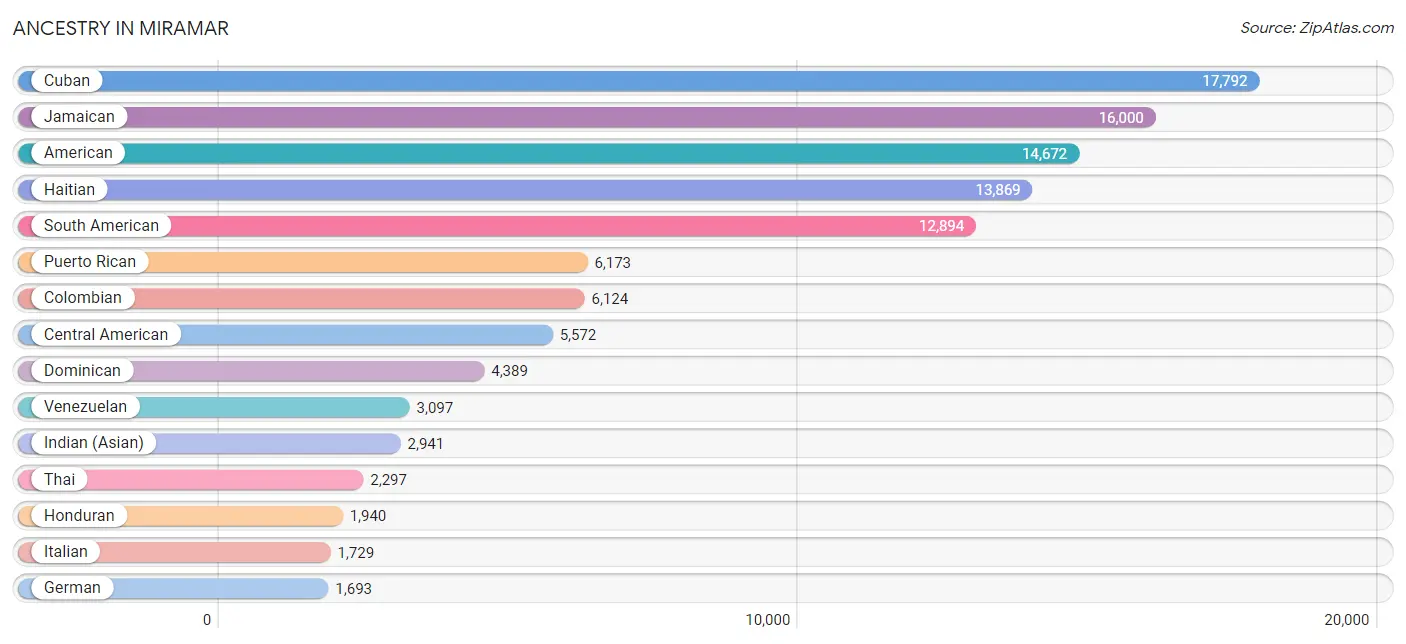
Ancestry in Miramar
The most populous ancestries reported in Miramar are Cuban (17,792 | 13.2%), Jamaican (16,000 | 11.8%), American (14,672 | 10.9%), Haitian (13,869 | 10.3%), and South American (12,894 | 9.5%), together accounting for 55.7% of all Miramar residents.
| Ancestry | # Population | % Population |
| African | 687 | 0.5% |
| American | 14,672 | 10.9% |
| Arab | 299 | 0.2% |
| Argentinean | 875 | 0.6% |
| Armenian | 2 | 0.0% |
| Bahamian | 662 | 0.5% |
| Barbadian | 75 | 0.1% |
| Belgian | 78 | 0.1% |
| Belizean | 216 | 0.2% |
| Bhutanese | 599 | 0.4% |
| Blackfeet | 22 | 0.0% |
| Bolivian | 423 | 0.3% |
| Brazilian | 410 | 0.3% |
| British | 110 | 0.1% |
| British West Indian | 417 | 0.3% |
| Burmese | 369 | 0.3% |
| Canadian | 183 | 0.1% |
| Central American | 5,572 | 4.1% |
| Central American Indian | 380 | 0.3% |
| Cherokee | 193 | 0.1% |
| Chilean | 138 | 0.1% |
| Colombian | 6,124 | 4.5% |
| Costa Rican | 168 | 0.1% |
| Creek | 42 | 0.0% |
| Croatian | 265 | 0.2% |
| Crow | 13 | 0.0% |
| Cuban | 17,792 | 13.2% |
| Czech | 135 | 0.1% |
| Danish | 11 | 0.0% |
| Dominican | 4,389 | 3.3% |
| Dutch | 205 | 0.2% |
| Eastern European | 120 | 0.1% |
| Ecuadorian | 777 | 0.6% |
| English | 1,392 | 1.0% |
| Ethiopian | 130 | 0.1% |
| European | 275 | 0.2% |
| Filipino | 34 | 0.0% |
| French | 179 | 0.1% |
| French Canadian | 61 | 0.1% |
| German | 1,693 | 1.3% |
| Greek | 133 | 0.1% |
| Guatemalan | 807 | 0.6% |
| Guyanese | 351 | 0.3% |
| Haitian | 13,869 | 10.3% |
| Honduran | 1,940 | 1.4% |
| Hungarian | 64 | 0.1% |
| Indian (Asian) | 2,941 | 2.2% |
| Iranian | 101 | 0.1% |
| Irish | 1,382 | 1.0% |
| Israeli | 281 | 0.2% |
| Italian | 1,729 | 1.3% |
| Jamaican | 16,000 | 11.8% |
| Japanese | 41 | 0.0% |
| Jordanian | 56 | 0.0% |
| Korean | 1,266 | 0.9% |
| Lebanese | 147 | 0.1% |
| Lumbee | 174 | 0.1% |
| Mexican | 811 | 0.6% |
| Native Hawaiian | 16 | 0.0% |
| Nicaraguan | 1,506 | 1.1% |
| Nigerian | 454 | 0.3% |
| Northern European | 60 | 0.0% |
| Norwegian | 39 | 0.0% |
| Palestinian | 30 | 0.0% |
| Panamanian | 520 | 0.4% |
| Peruvian | 1,442 | 1.1% |
| Polish | 420 | 0.3% |
| Portuguese | 326 | 0.2% |
| Puerto Rican | 6,173 | 4.6% |
| Romanian | 144 | 0.1% |
| Russian | 400 | 0.3% |
| Salvadoran | 620 | 0.5% |
| Scotch-Irish | 68 | 0.1% |
| Scottish | 166 | 0.1% |
| Seminole | 5 | 0.0% |
| Sierra Leonean | 90 | 0.1% |
| Sioux | 24 | 0.0% |
| South American | 12,894 | 9.5% |
| South American Indian | 17 | 0.0% |
| Spaniard | 257 | 0.2% |
| Spanish | 71 | 0.1% |
| Spanish American | 58 | 0.0% |
| Spanish American Indian | 14 | 0.0% |
| Sri Lankan | 1,032 | 0.8% |
| Subsaharan African | 1,346 | 1.0% |
| Swedish | 136 | 0.1% |
| Swiss | 27 | 0.0% |
| Syrian | 28 | 0.0% |
| Thai | 2,297 | 1.7% |
| Trinidadian and Tobagonian | 1,507 | 1.1% |
| Turkish | 107 | 0.1% |
| U.S. Virgin Islander | 125 | 0.1% |
| Ukrainian | 29 | 0.0% |
| Uruguayan | 18 | 0.0% |
| Venezuelan | 3,097 | 2.3% |
| Welsh | 9 | 0.0% |
| West Indian | 777 | 0.6% |
| Yuman | 16 | 0.0% | View All 98 Rows |
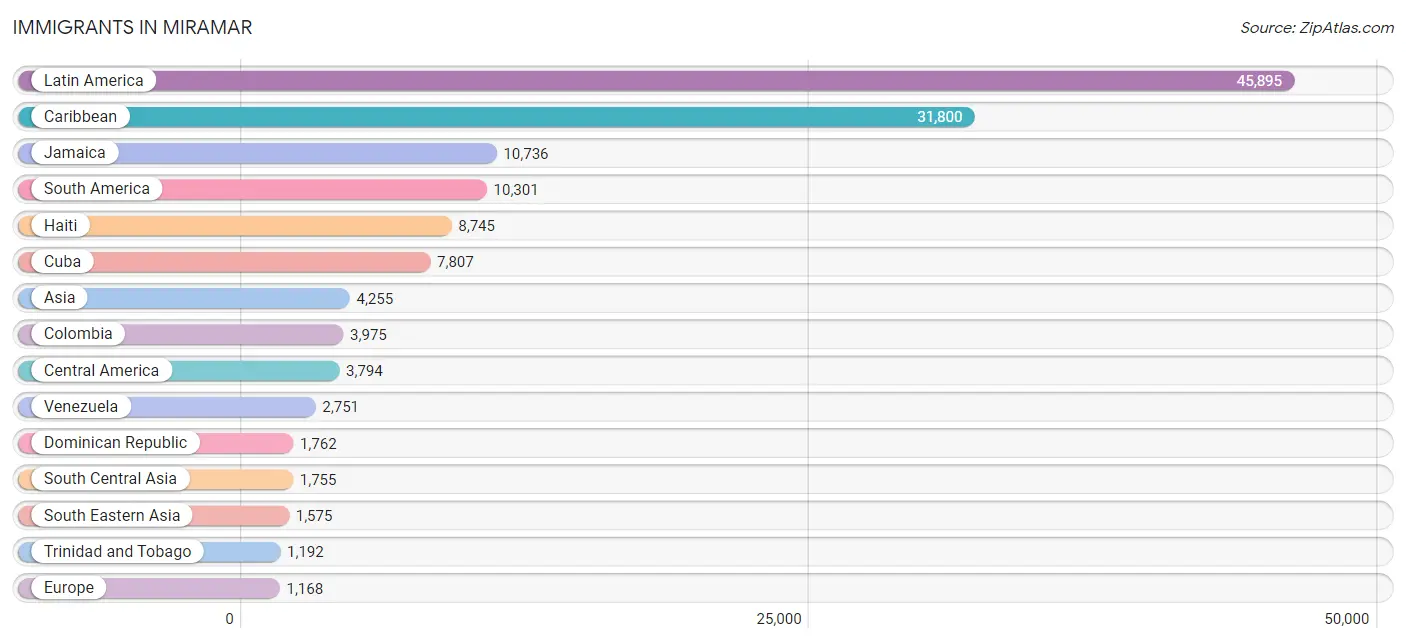
Immigrants in Miramar
The most numerous immigrant groups reported in Miramar came from Latin America (45,895 | 34.0%), Caribbean (31,800 | 23.5%), Jamaica (10,736 | 7.9%), South America (10,301 | 7.6%), and Haiti (8,745 | 6.5%), together accounting for 79.5% of all Miramar residents.
| Immigration Origin | # Population | % Population |
| Africa | 729 | 0.5% |
| Argentina | 529 | 0.4% |
| Asia | 4,255 | 3.2% |
| Bahamas | 368 | 0.3% |
| Bangladesh | 152 | 0.1% |
| Barbados | 388 | 0.3% |
| Belgium | 61 | 0.1% |
| Belize | 78 | 0.1% |
| Bolivia | 333 | 0.3% |
| Brazil | 571 | 0.4% |
| Canada | 214 | 0.2% |
| Caribbean | 31,800 | 23.5% |
| Central America | 3,794 | 2.8% |
| Chile | 86 | 0.1% |
| China | 417 | 0.3% |
| Colombia | 3,975 | 2.9% |
| Costa Rica | 172 | 0.1% |
| Cuba | 7,807 | 5.8% |
| Dominica | 124 | 0.1% |
| Dominican Republic | 1,762 | 1.3% |
| Eastern Africa | 225 | 0.2% |
| Eastern Asia | 556 | 0.4% |
| Eastern Europe | 332 | 0.3% |
| Ecuador | 678 | 0.5% |
| El Salvador | 194 | 0.1% |
| England | 124 | 0.1% |
| Ethiopia | 130 | 0.1% |
| Europe | 1,168 | 0.9% |
| France | 68 | 0.1% |
| Germany | 151 | 0.1% |
| Greece | 22 | 0.0% |
| Grenada | 69 | 0.1% |
| Guatemala | 330 | 0.2% |
| Guyana | 480 | 0.4% |
| Haiti | 8,745 | 6.5% |
| Honduras | 1,035 | 0.8% |
| Hong Kong | 80 | 0.1% |
| Hungary | 52 | 0.0% |
| India | 931 | 0.7% |
| Iran | 135 | 0.1% |
| Israel | 161 | 0.1% |
| Italy | 62 | 0.1% |
| Jamaica | 10,736 | 7.9% |
| Japan | 139 | 0.1% |
| Kazakhstan | 19 | 0.0% |
| Kenya | 4 | 0.0% |
| Kuwait | 66 | 0.1% |
| Latin America | 45,895 | 34.0% |
| Mexico | 676 | 0.5% |
| Moldova | 10 | 0.0% |
| Nicaragua | 1,054 | 0.8% |
| Nigeria | 428 | 0.3% |
| Northern Europe | 268 | 0.2% |
| Norway | 7 | 0.0% |
| Pakistan | 507 | 0.4% |
| Panama | 255 | 0.2% |
| Peru | 815 | 0.6% |
| Philippines | 983 | 0.7% |
| Poland | 75 | 0.1% |
| Portugal | 29 | 0.0% |
| Romania | 27 | 0.0% |
| Russia | 119 | 0.1% |
| Serbia | 49 | 0.0% |
| Sierra Leone | 59 | 0.0% |
| South Africa | 17 | 0.0% |
| South America | 10,301 | 7.6% |
| South Central Asia | 1,755 | 1.3% |
| South Eastern Asia | 1,575 | 1.2% |
| Southern Europe | 272 | 0.2% |
| Spain | 159 | 0.1% |
| St. Vincent and the Grenadines | 83 | 0.1% |
| Switzerland | 16 | 0.0% |
| Taiwan | 34 | 0.0% |
| Thailand | 18 | 0.0% |
| Trinidad and Tobago | 1,192 | 0.9% |
| Turkey | 49 | 0.0% |
| Uruguay | 18 | 0.0% |
| Uzbekistan | 11 | 0.0% |
| Venezuela | 2,751 | 2.0% |
| Vietnam | 574 | 0.4% |
| Western Africa | 487 | 0.4% |
| Western Asia | 357 | 0.3% |
| Western Europe | 296 | 0.2% |
| Yemen | 30 | 0.0% | View All 84 Rows |
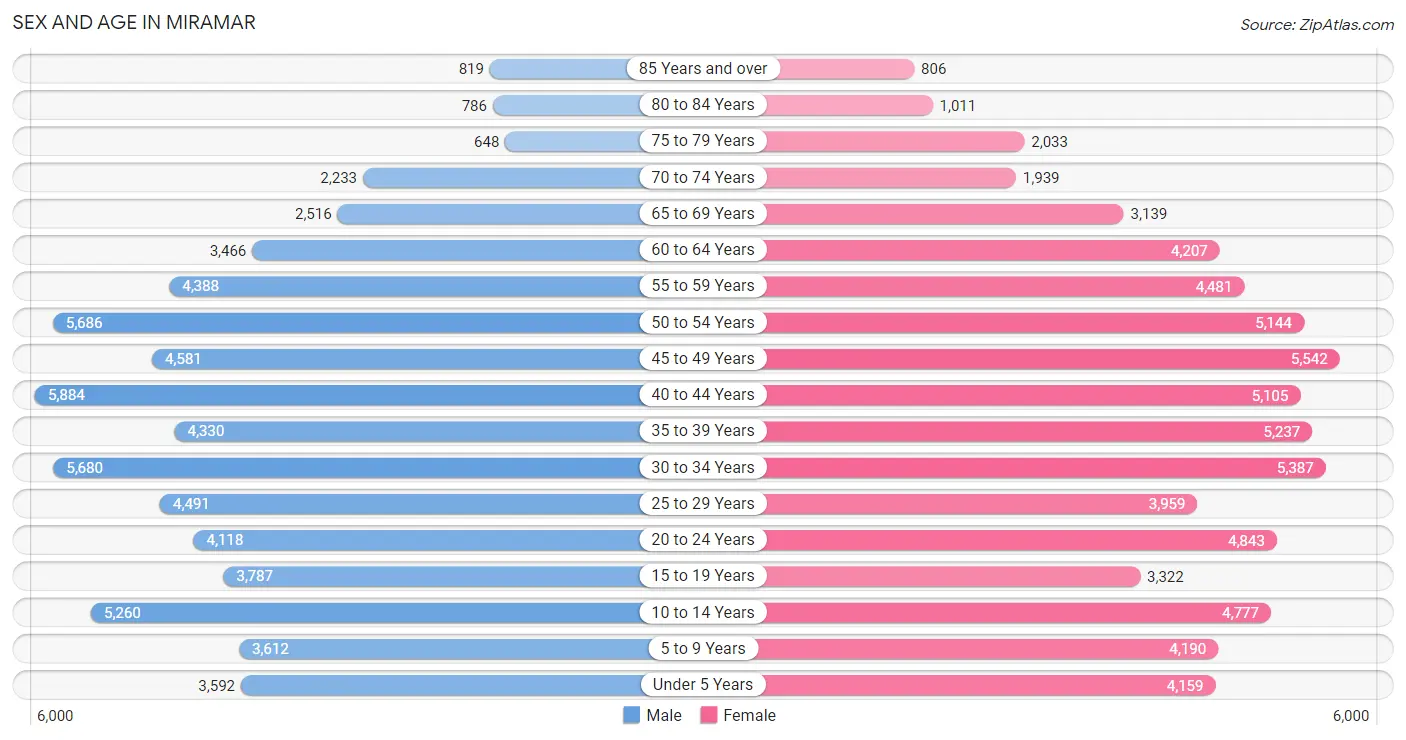
Sex and Age in Miramar
Sex and Age in Miramar
The most populous age groups in Miramar are 40 to 44 Years (5,884 | 8.9%) for men and 45 to 49 Years (5,542 | 8.0%) for women.
| Age Bracket | Male | Female |
| Under 5 Years | 3,592 (5.4%) | 4,159 (6.0%) |
| 5 to 9 Years | 3,612 (5.5%) | 4,190 (6.0%) |
| 10 to 14 Years | 5,260 (8.0%) | 4,777 (6.9%) |
| 15 to 19 Years | 3,787 (5.8%) | 3,322 (4.8%) |
| 20 to 24 Years | 4,118 (6.2%) | 4,843 (7.0%) |
| 25 to 29 Years | 4,491 (6.8%) | 3,959 (5.7%) |
| 30 to 34 Years | 5,680 (8.6%) | 5,387 (7.8%) |
| 35 to 39 Years | 4,330 (6.6%) | 5,237 (7.6%) |
| 40 to 44 Years | 5,884 (8.9%) | 5,105 (7.4%) |
| 45 to 49 Years | 4,581 (7.0%) | 5,542 (8.0%) |
| 50 to 54 Years | 5,686 (8.6%) | 5,144 (7.4%) |
| 55 to 59 Years | 4,388 (6.7%) | 4,481 (6.5%) |
| 60 to 64 Years | 3,466 (5.3%) | 4,207 (6.1%) |
| 65 to 69 Years | 2,516 (3.8%) | 3,139 (4.5%) |
| 70 to 74 Years | 2,233 (3.4%) | 1,939 (2.8%) |
| 75 to 79 Years | 648 (1.0%) | 2,033 (2.9%) |
| 80 to 84 Years | 786 (1.2%) | 1,011 (1.5%) |
| 85 Years and over | 819 (1.2%) | 806 (1.2%) |
| Total | 65,877 (100.0%) | 69,281 (100.0%) |
Families and Households in Miramar
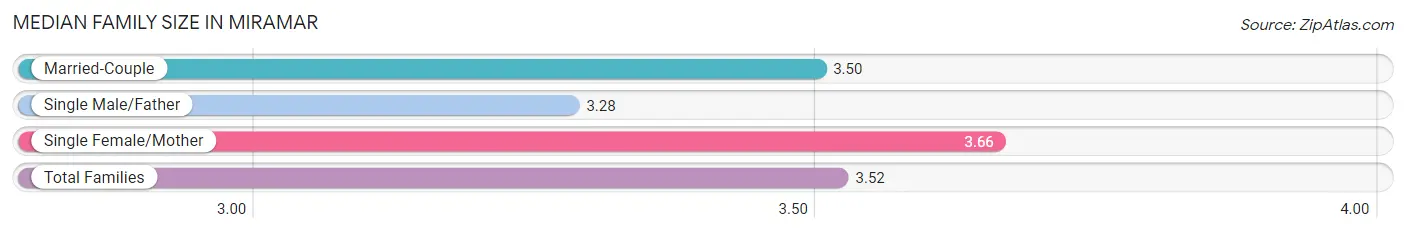
Median Family Size in Miramar
The median family size in Miramar is 3.52 persons per family, with single female/mother families (8,416 | 25.6%) accounting for the largest median family size of 3.66 persons per family. On the other hand, single male/father families (3,434 | 10.4%) represent the smallest median family size with 3.28 persons per family.
| Family Type | # Families | Family Size |
| Married-Couple | 21,013 (63.9%) | 3.50 |
| Single Male/Father | 3,434 (10.4%) | 3.28 |
| Single Female/Mother | 8,416 (25.6%) | 3.66 |
| Total Families | 32,863 (100.0%) | 3.52 |
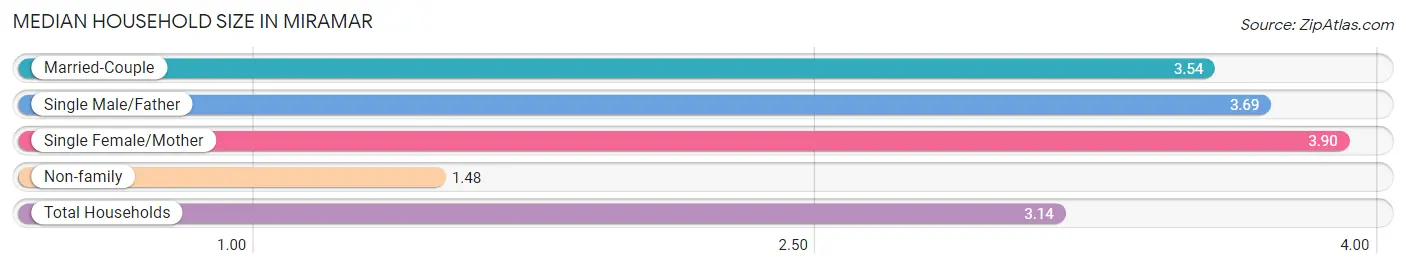
Median Household Size in Miramar
The median household size in Miramar is 3.14 persons per household, with single female/mother households (8,416 | 19.6%) accounting for the largest median household size of 3.9 persons per household. non-family households (10,175 | 23.6%) represent the smallest median household size with 1.48 persons per household.
| Household Type | # Households | Household Size |
| Married-Couple | 21,013 (48.8%) | 3.54 |
| Single Male/Father | 3,434 (8.0%) | 3.69 |
| Single Female/Mother | 8,416 (19.6%) | 3.90 |
| Non-family | 10,175 (23.6%) | 1.48 |
| Total Households | 43,038 (100.0%) | 3.14 |
Household Size by Marriage Status in Miramar
Out of a total of 43,038 households in Miramar, 32,863 (76.4%) are family households, while 10,175 (23.6%) are nonfamily households. The most numerous type of family households are 2-person households, comprising 10,132, and the most common type of nonfamily households are 1-person households, comprising 6,925.
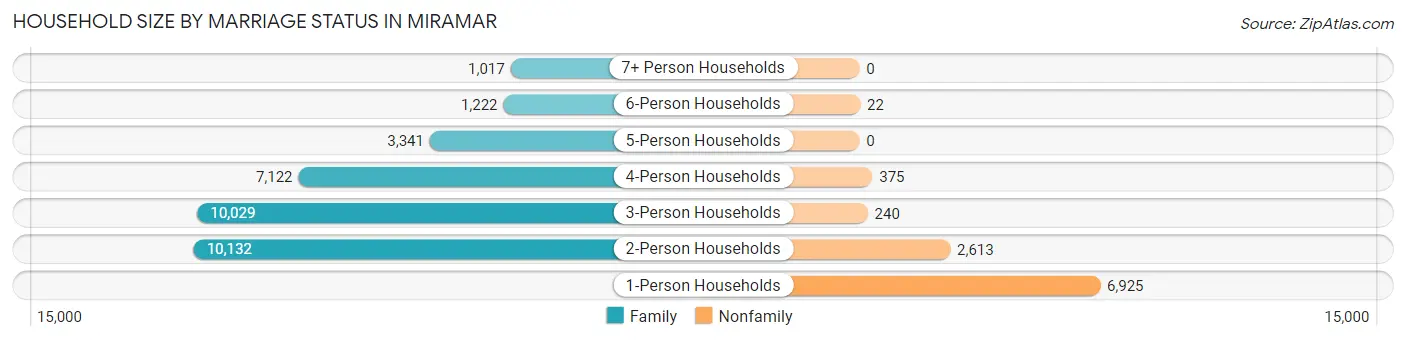
| Household Size | Family Households | Nonfamily Households |
| 1-Person Households | - | 6,925 (16.1%) |
| 2-Person Households | 10,132 (23.5%) | 2,613 (6.1%) |
| 3-Person Households | 10,029 (23.3%) | 240 (0.6%) |
| 4-Person Households | 7,122 (16.6%) | 375 (0.9%) |
| 5-Person Households | 3,341 (7.8%) | 0 (0.0%) |
| 6-Person Households | 1,222 (2.8%) | 22 (0.1%) |
| 7+ Person Households | 1,017 (2.4%) | 0 (0.0%) |
| Total | 32,863 (76.4%) | 10,175 (23.6%) |
Female Fertility in Miramar
Fertility by Age in Miramar
Average fertility rate in Miramar is 34.0 births per 1,000 women. Women in the age bracket of 20 to 34 years have the highest fertility rate with 60.0 births per 1,000 women. Women in the age bracket of 20 to 34 years acount for 72.2% of all women with births.
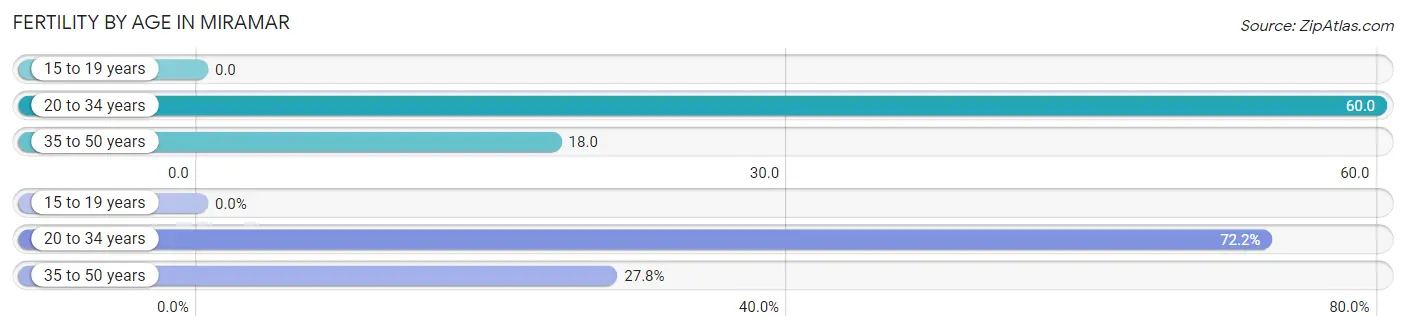
| Age Bracket | Women with Births | Births / 1,000 Women |
| 15 to 19 years | 0 (0.0%) | 0.0 |
| 20 to 34 years | 858 (72.2%) | 60.0 |
| 35 to 50 years | 330 (27.8%) | 18.0 |
| Total | 1,188 (100.0%) | 34.0 |
Fertility by Age by Marriage Status in Miramar
71.7% of women with births (1,188) in Miramar are married. The highest percentage of unmarried women with births falls into 20 to 34 years age bracket with 33.3% of them unmarried at the time of birth, while the lowest percentage of unmarried women with births belong to 35 to 50 years age bracket with 15.1% of them unmarried.
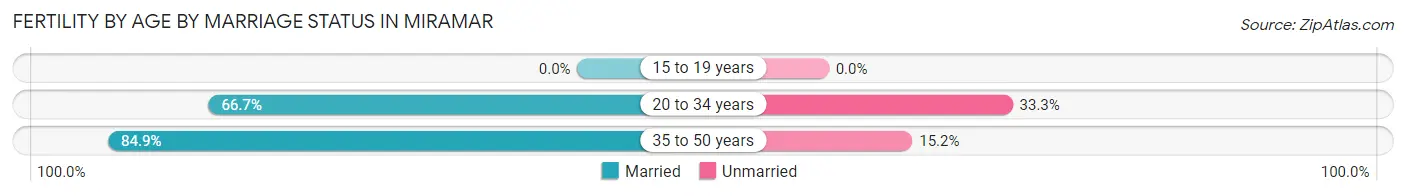
| Age Bracket | Married | Unmarried |
| 15 to 19 years | 0 (0.0%) | 0 (0.0%) |
| 20 to 34 years | 572 (66.7%) | 286 (33.3%) |
| 35 to 50 years | 280 (84.9%) | 50 (15.1%) |
| Total | 852 (71.7%) | 336 (28.3%) |
Fertility by Education in Miramar
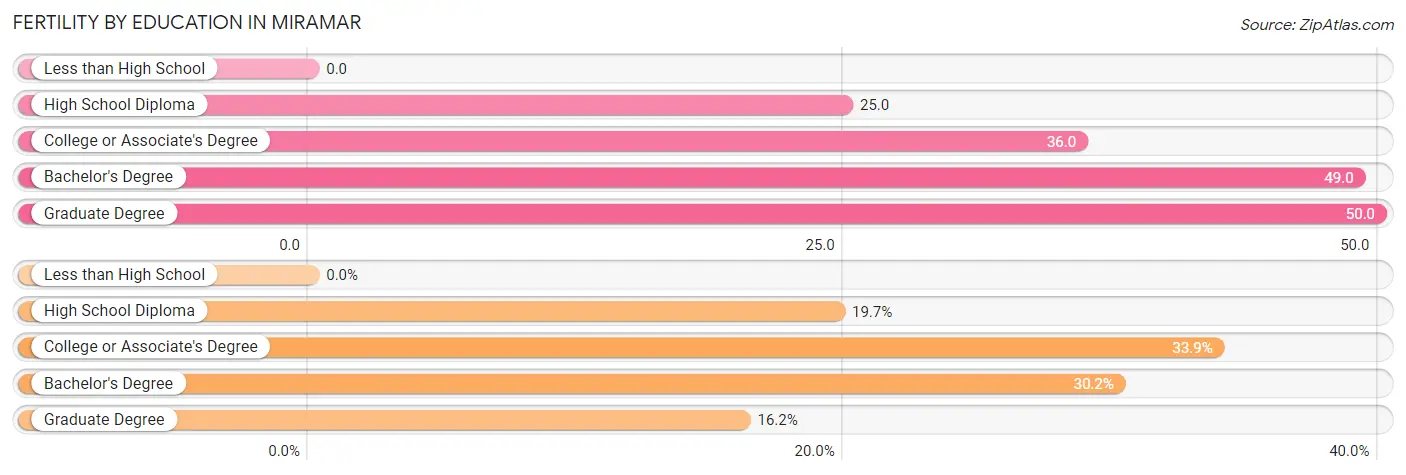
| Educational Attainment | Women with Births | Births / 1,000 Women |
| Less than High School | 0 (0.0%) | 0.0 |
| High School Diploma | 234 (19.7%) | 25.0 |
| College or Associate's Degree | 403 (33.9%) | 36.0 |
| Bachelor's Degree | 359 (30.2%) | 49.0 |
| Graduate Degree | 192 (16.2%) | 50.0 |
| Total | 1,188 (100.0%) | 34.0 |
Fertility by Education by Marriage Status in Miramar
28.3% of women with births in Miramar are unmarried. Women with the educational attainment of graduate degree are most likely to be married with 100.0% of them married at childbirth, while women with the educational attainment of high school diploma are least likely to be married with 57.3% of them unmarried at childbirth.
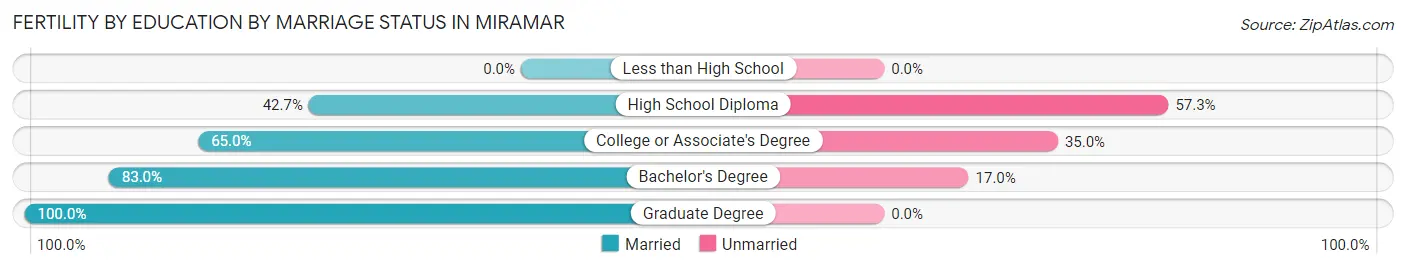
| Educational Attainment | Married | Unmarried |
| Less than High School | 0 (0.0%) | 0 (0.0%) |
| High School Diploma | 100 (42.7%) | 134 (57.3%) |
| College or Associate's Degree | 262 (65.0%) | 141 (35.0%) |
| Bachelor's Degree | 298 (83.0%) | 61 (17.0%) |
| Graduate Degree | 192 (100.0%) | 0 (0.0%) |
| Total | 852 (71.7%) | 336 (28.3%) |
Employment Characteristics in Miramar
Employment by Class of Employer in Miramar
Among the 72,377 employed individuals in Miramar, private company employees (53,226 | 73.5%), local government employees (6,295 | 8.7%), and not-for-profit organizations (3,476 | 4.8%) make up the most common classes of employment.
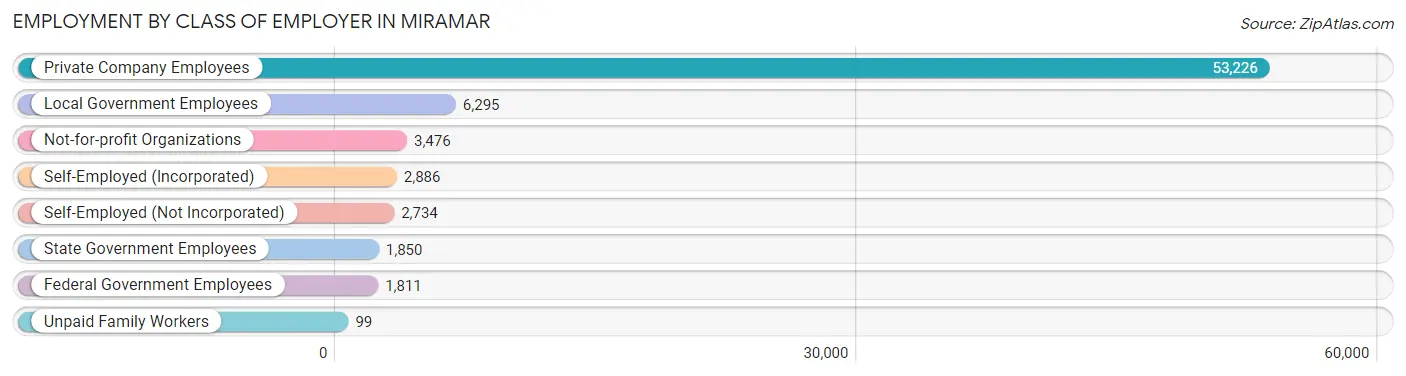
| Employer Class | # Employees | % Employees |
| Private Company Employees | 53,226 | 73.5% |
| Self-Employed (Incorporated) | 2,886 | 4.0% |
| Self-Employed (Not Incorporated) | 2,734 | 3.8% |
| Not-for-profit Organizations | 3,476 | 4.8% |
| Local Government Employees | 6,295 | 8.7% |
| State Government Employees | 1,850 | 2.6% |
| Federal Government Employees | 1,811 | 2.5% |
| Unpaid Family Workers | 99 | 0.1% |
| Total | 72,377 | 100.0% |
Employment Status by Age in Miramar
According to the labor force statistics for Miramar, out of the total population over 16 years of age (108,106), 72.0% or 77,836 individuals are in the labor force, with 4.2% or 3,269 of them unemployed. The age group with the highest labor force participation rate is 35 to 44 years, with 89.4% or 18,377 individuals in the labor force. Within the labor force, the 16 to 19 years age range has the highest percentage of unemployed individuals, with 19.7% or 317 of them being unemployed.
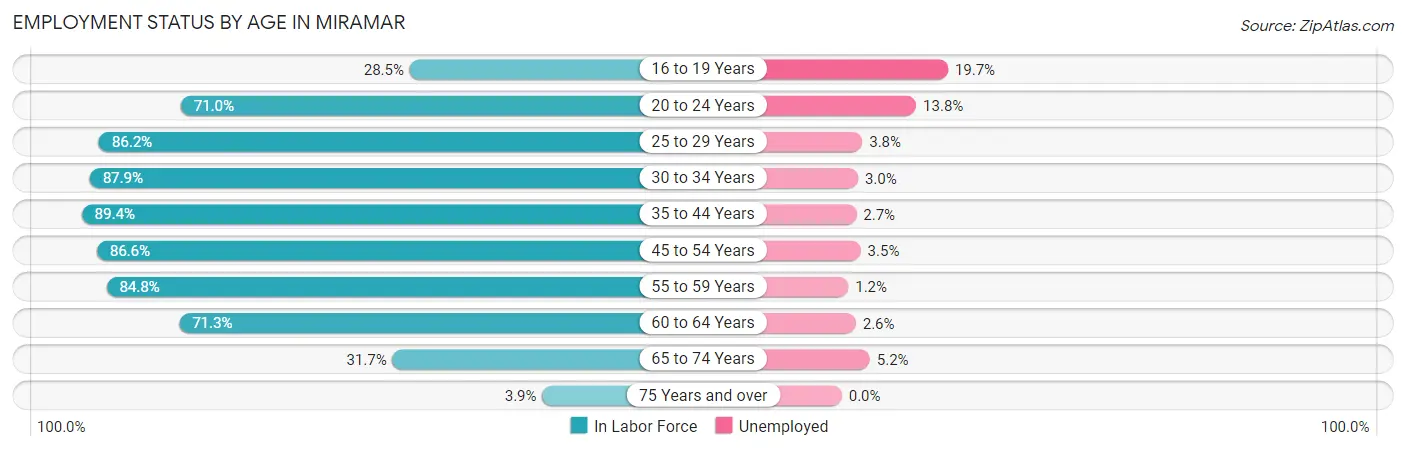
| Age Bracket | In Labor Force | Unemployed |
| 16 to 19 Years | 1,609 (28.5%) | 317 (19.7%) |
| 20 to 24 Years | 6,362 (71.0%) | 878 (13.8%) |
| 25 to 29 Years | 7,284 (86.2%) | 277 (3.8%) |
| 30 to 34 Years | 9,728 (87.9%) | 292 (3.0%) |
| 35 to 44 Years | 18,377 (89.4%) | 496 (2.7%) |
| 45 to 54 Years | 18,145 (86.6%) | 635 (3.5%) |
| 55 to 59 Years | 7,521 (84.8%) | 90 (1.2%) |
| 60 to 64 Years | 5,471 (71.3%) | 142 (2.6%) |
| 65 to 74 Years | 3,115 (31.7%) | 162 (5.2%) |
| 75 Years and over | 238 (3.9%) | 0 (0.0%) |
| Total | 77,836 (72.0%) | 3,269 (4.2%) |
Employment Status by Educational Attainment in Miramar
According to labor force statistics for Miramar, 85.8% of individuals (66,553) out of the total population between 25 and 64 years of age (77,568) are in the labor force, with 2.9% or 1,930 of them being unemployed. The group with the highest labor force participation rate are those with the educational attainment of bachelor's degree or higher, with 91.3% or 22,892 individuals in the labor force. Within the labor force, individuals with less than high school education have the highest percentage of unemployment, with 3.9% or 135 of them being unemployed.
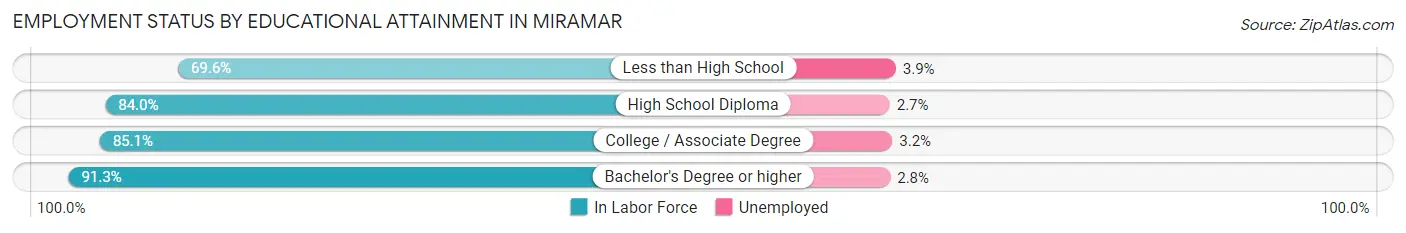
| Educational Attainment | In Labor Force | Unemployed |
| Less than High School | 3,473 (69.6%) | 195 (3.9%) |
| High School Diploma | 21,843 (84.0%) | 702 (2.7%) |
| College / Associate Degree | 18,298 (85.1%) | 688 (3.2%) |
| Bachelor's Degree or higher | 22,892 (91.3%) | 702 (2.8%) |
| Total | 66,553 (85.8%) | 2,249 (2.9%) |
Employment Occupations by Sex in Miramar
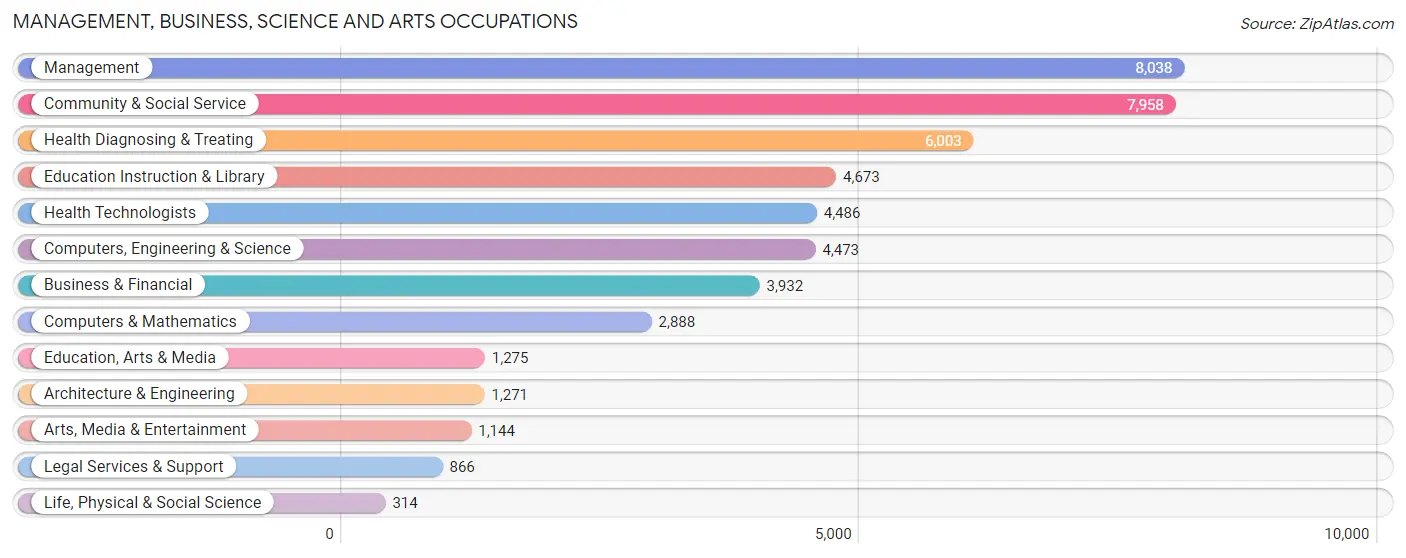
Management, Business, Science and Arts Occupations
The most common Management, Business, Science and Arts occupations in Miramar are Management (8,038 | 10.8%), Community & Social Service (7,958 | 10.7%), Health Diagnosing & Treating (6,003 | 8.1%), Education Instruction & Library (4,673 | 6.3%), and Health Technologists (4,486 | 6.0%).
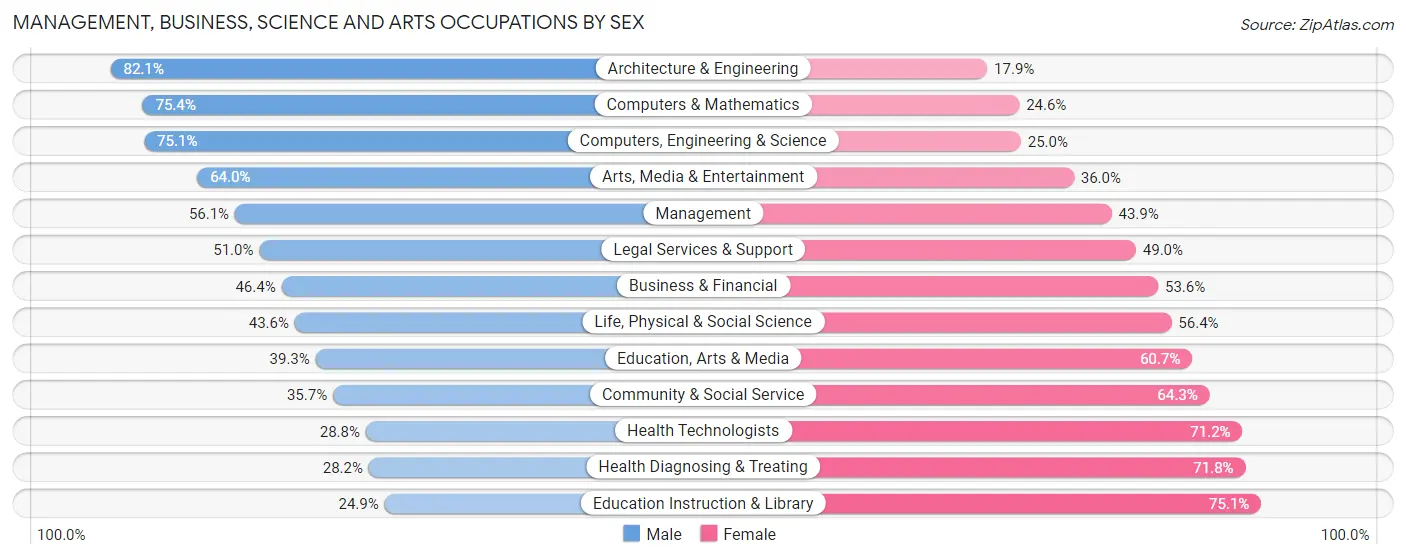
Management, Business, Science and Arts Occupations by Sex
Within the Management, Business, Science and Arts occupations in Miramar, the most male-oriented occupations are Architecture & Engineering (82.1%), Computers & Mathematics (75.4%), and Computers, Engineering & Science (75.0%), while the most female-oriented occupations are Education Instruction & Library (75.1%), Health Diagnosing & Treating (71.8%), and Health Technologists (71.2%).
| Occupation | Male | Female |
| Management | 4,511 (56.1%) | 3,527 (43.9%) |
| Business & Financial | 1,825 (46.4%) | 2,107 (53.6%) |
| Computers, Engineering & Science | 3,357 (75.0%) | 1,116 (24.9%) |
| Computers & Mathematics | 2,177 (75.4%) | 711 (24.6%) |
| Architecture & Engineering | 1,043 (82.1%) | 228 (17.9%) |
| Life, Physical & Social Science | 137 (43.6%) | 177 (56.4%) |
| Community & Social Service | 2,839 (35.7%) | 5,119 (64.3%) |
| Education, Arts & Media | 501 (39.3%) | 774 (60.7%) |
| Legal Services & Support | 442 (51.0%) | 424 (49.0%) |
| Education Instruction & Library | 1,164 (24.9%) | 3,509 (75.1%) |
| Arts, Media & Entertainment | 732 (64.0%) | 412 (36.0%) |
| Health Diagnosing & Treating | 1,693 (28.2%) | 4,310 (71.8%) |
| Health Technologists | 1,293 (28.8%) | 3,193 (71.2%) |
| Total (Category) | 14,225 (46.8%) | 16,179 (53.2%) |
| Total (Overall) | 37,785 (50.7%) | 36,677 (49.3%) |
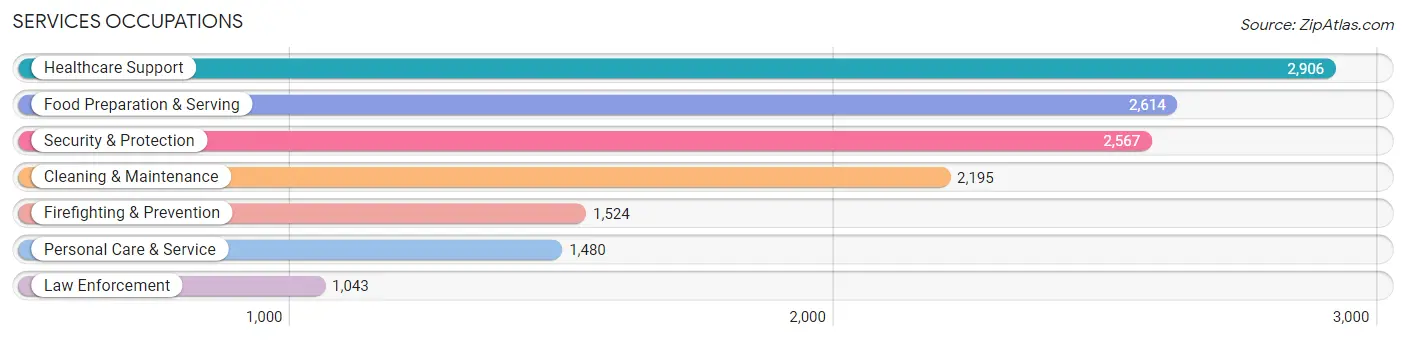
Services Occupations
The most common Services occupations in Miramar are Healthcare Support (2,906 | 3.9%), Food Preparation & Serving (2,614 | 3.5%), Security & Protection (2,567 | 3.5%), Cleaning & Maintenance (2,195 | 2.9%), and Firefighting & Prevention (1,524 | 2.1%).
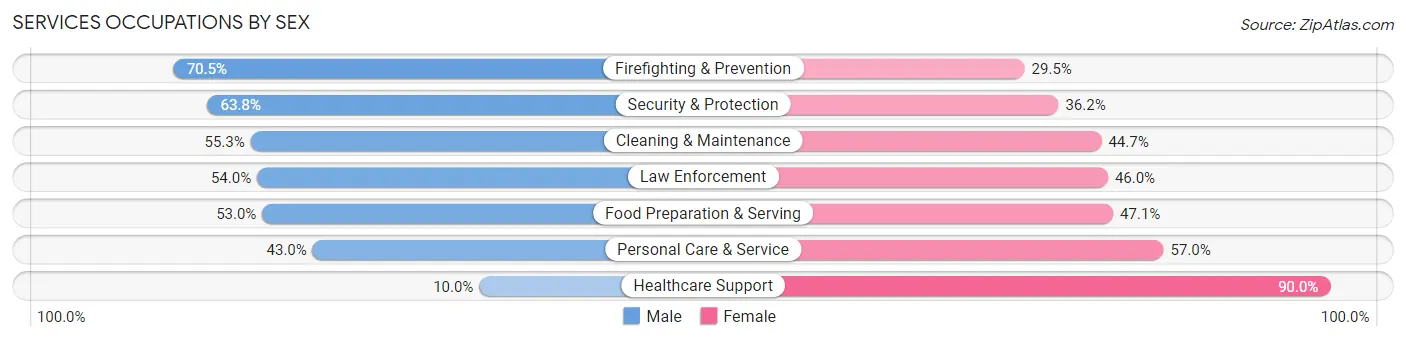
Services Occupations by Sex
Within the Services occupations in Miramar, the most male-oriented occupations are Firefighting & Prevention (70.5%), Security & Protection (63.8%), and Cleaning & Maintenance (55.3%), while the most female-oriented occupations are Healthcare Support (90.0%), Personal Care & Service (57.0%), and Food Preparation & Serving (47.0%).
| Occupation | Male | Female |
| Healthcare Support | 290 (10.0%) | 2,616 (90.0%) |
| Security & Protection | 1,637 (63.8%) | 930 (36.2%) |
| Firefighting & Prevention | 1,074 (70.5%) | 450 (29.5%) |
| Law Enforcement | 563 (54.0%) | 480 (46.0%) |
| Food Preparation & Serving | 1,384 (52.9%) | 1,230 (47.0%) |
| Cleaning & Maintenance | 1,213 (55.3%) | 982 (44.7%) |
| Personal Care & Service | 636 (43.0%) | 844 (57.0%) |
| Total (Category) | 5,160 (43.9%) | 6,602 (56.1%) |
| Total (Overall) | 37,785 (50.7%) | 36,677 (49.3%) |
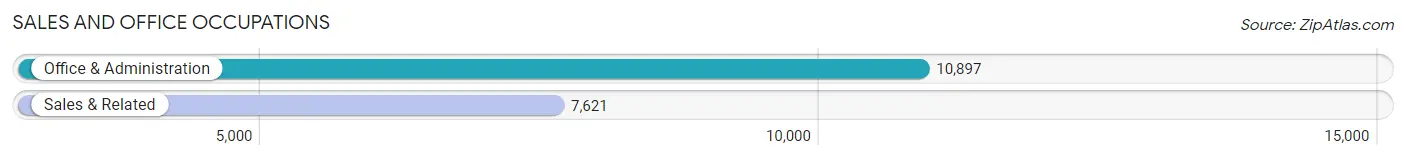
Sales and Office Occupations
The most common Sales and Office occupations in Miramar are Office & Administration (10,897 | 14.6%), and Sales & Related (7,621 | 10.2%).
Sales and Office Occupations by Sex
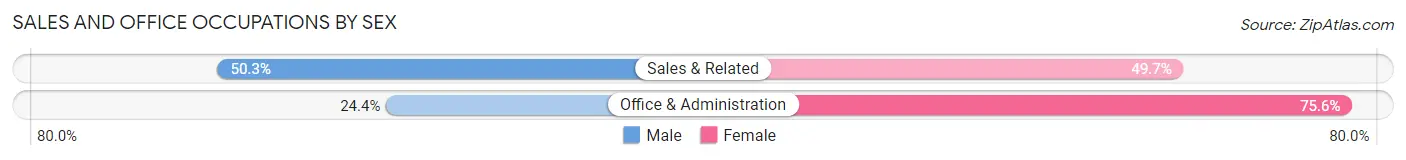
| Occupation | Male | Female |
| Sales & Related | 3,834 (50.3%) | 3,787 (49.7%) |
| Office & Administration | 2,654 (24.4%) | 8,243 (75.6%) |
| Total (Category) | 6,488 (35.0%) | 12,030 (65.0%) |
| Total (Overall) | 37,785 (50.7%) | 36,677 (49.3%) |
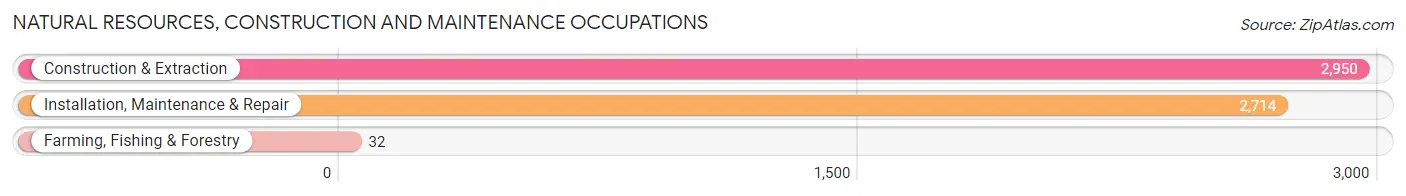
Natural Resources, Construction and Maintenance Occupations
The most common Natural Resources, Construction and Maintenance occupations in Miramar are Construction & Extraction (2,950 | 4.0%), Installation, Maintenance & Repair (2,714 | 3.6%), and Farming, Fishing & Forestry (32 | 0.0%).
Natural Resources, Construction and Maintenance Occupations by Sex
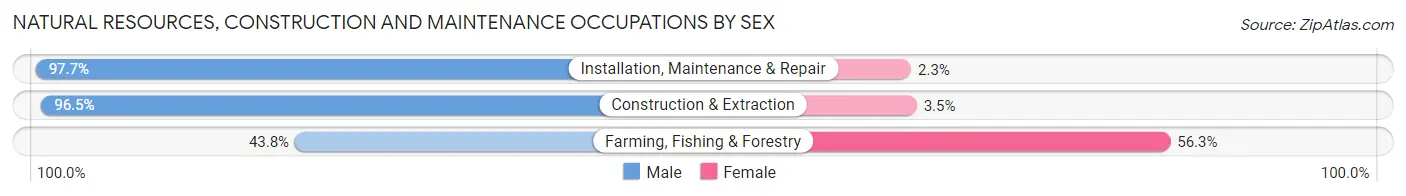
| Occupation | Male | Female |
| Farming, Fishing & Forestry | 14 (43.8%) | 18 (56.2%) |
| Construction & Extraction | 2,847 (96.5%) | 103 (3.5%) |
| Installation, Maintenance & Repair | 2,651 (97.7%) | 63 (2.3%) |
| Total (Category) | 5,512 (96.8%) | 184 (3.2%) |
| Total (Overall) | 37,785 (50.7%) | 36,677 (49.3%) |
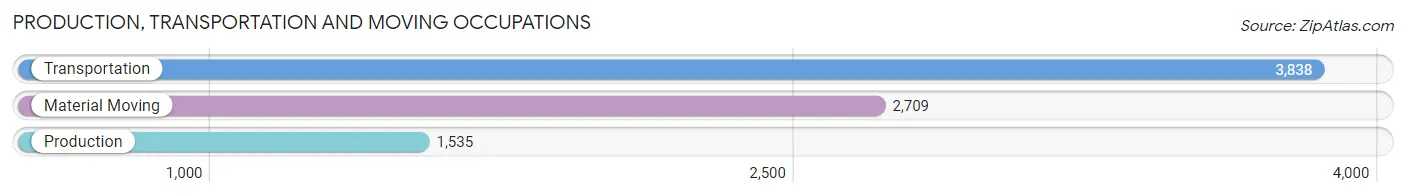
Production, Transportation and Moving Occupations
The most common Production, Transportation and Moving occupations in Miramar are Transportation (3,838 | 5.1%), Material Moving (2,709 | 3.6%), and Production (1,535 | 2.1%).
Production, Transportation and Moving Occupations by Sex
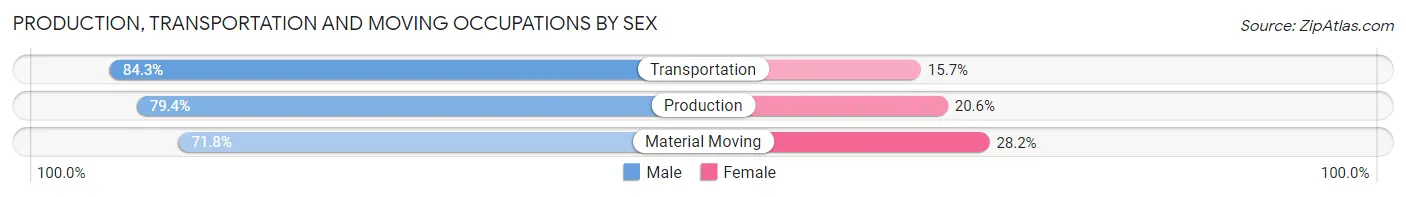
| Occupation | Male | Female |
| Production | 1,219 (79.4%) | 316 (20.6%) |
| Transportation | 3,237 (84.3%) | 601 (15.7%) |
| Material Moving | 1,944 (71.8%) | 765 (28.2%) |
| Total (Category) | 6,400 (79.2%) | 1,682 (20.8%) |
| Total (Overall) | 37,785 (50.7%) | 36,677 (49.3%) |
Employment Industries by Sex in Miramar
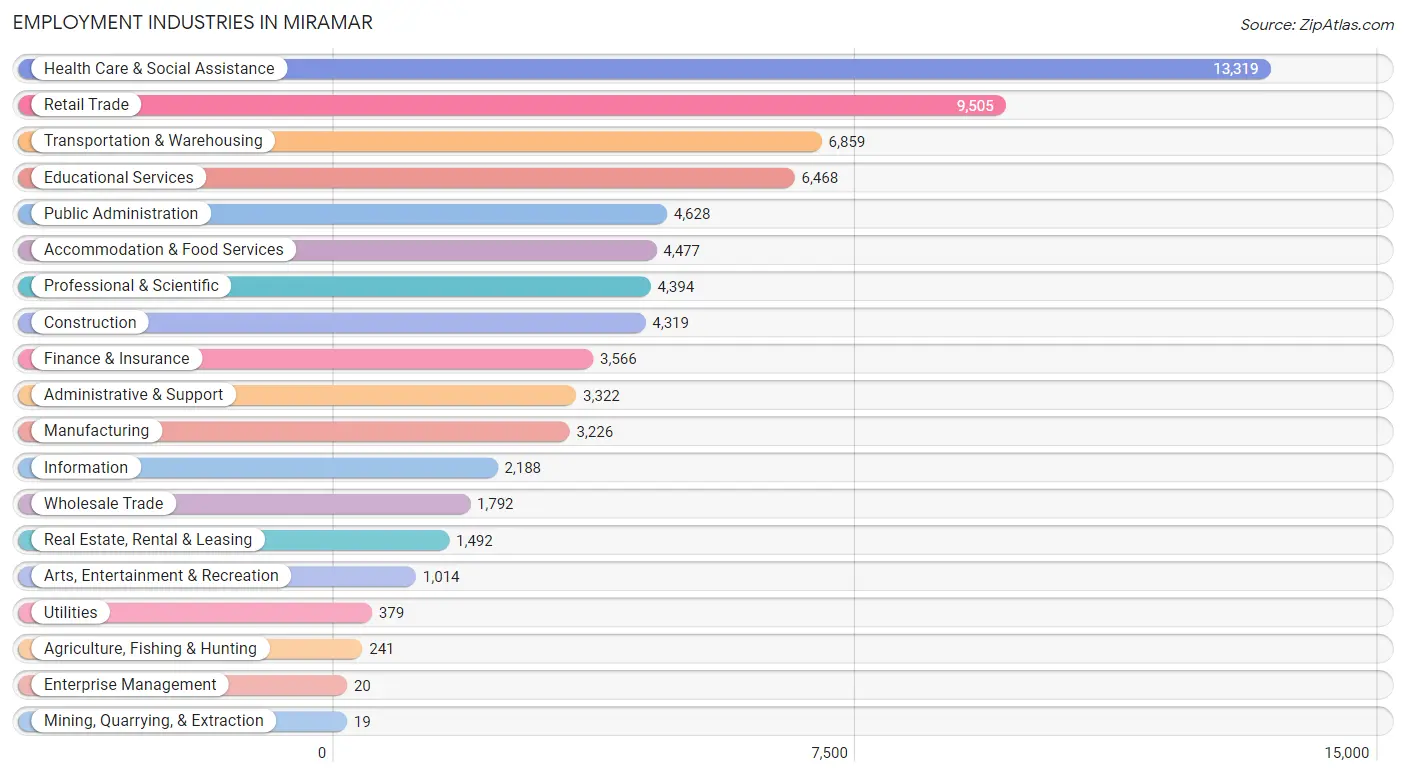
Employment Industries in Miramar
The major employment industries in Miramar include Health Care & Social Assistance (13,319 | 17.9%), Retail Trade (9,505 | 12.8%), Transportation & Warehousing (6,859 | 9.2%), Educational Services (6,468 | 8.7%), and Public Administration (4,628 | 6.2%).
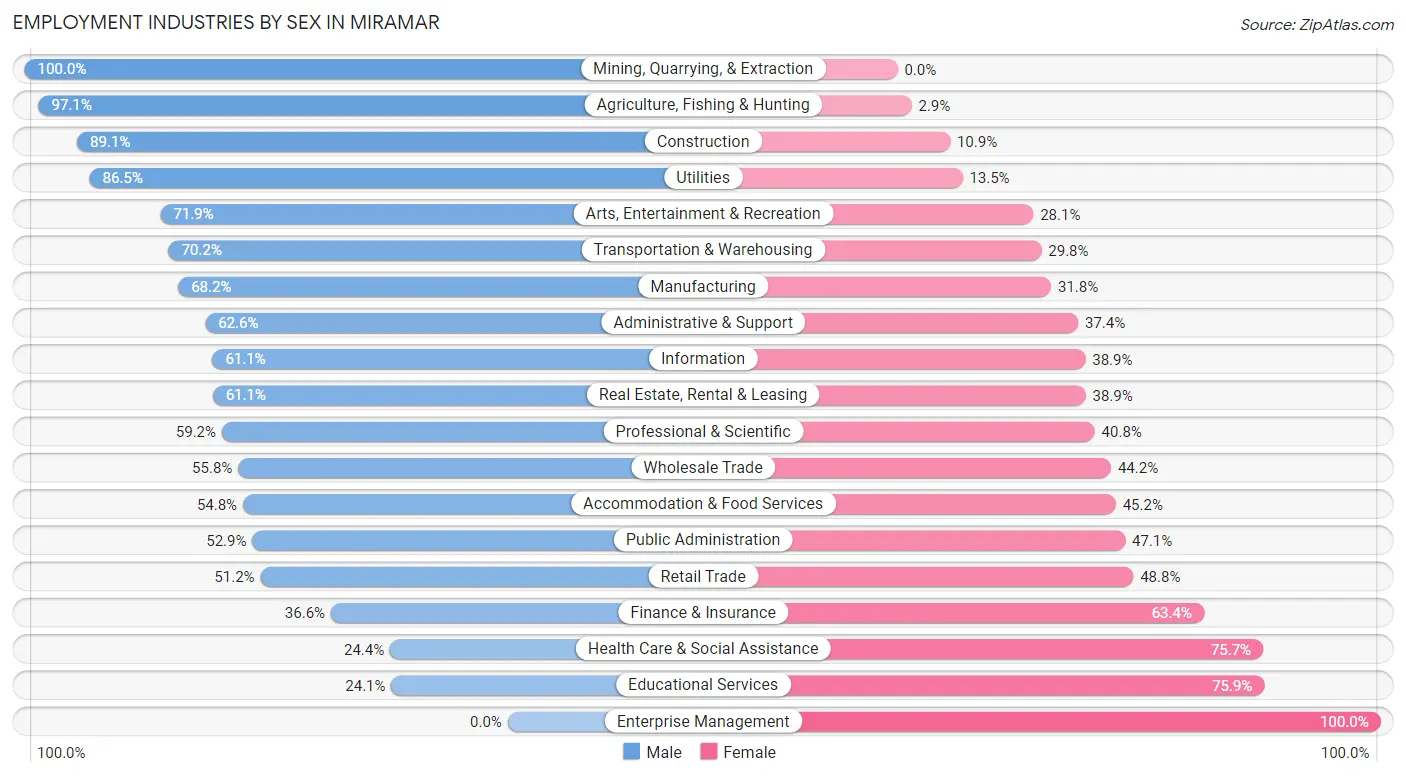
Employment Industries by Sex in Miramar
The Miramar industries that see more men than women are Mining, Quarrying, & Extraction (100.0%), Agriculture, Fishing & Hunting (97.1%), and Construction (89.1%), whereas the industries that tend to have a higher number of women are Enterprise Management (100.0%), Educational Services (75.9%), and Health Care & Social Assistance (75.6%).
| Industry | Male | Female |
| Agriculture, Fishing & Hunting | 234 (97.1%) | 7 (2.9%) |
| Mining, Quarrying, & Extraction | 19 (100.0%) | 0 (0.0%) |
| Construction | 3,849 (89.1%) | 470 (10.9%) |
| Manufacturing | 2,200 (68.2%) | 1,026 (31.8%) |
| Wholesale Trade | 1,000 (55.8%) | 792 (44.2%) |
| Retail Trade | 4,866 (51.2%) | 4,639 (48.8%) |
| Transportation & Warehousing | 4,816 (70.2%) | 2,043 (29.8%) |
| Utilities | 328 (86.5%) | 51 (13.5%) |
| Information | 1,337 (61.1%) | 851 (38.9%) |
| Finance & Insurance | 1,305 (36.6%) | 2,261 (63.4%) |
| Real Estate, Rental & Leasing | 911 (61.1%) | 581 (38.9%) |
| Professional & Scientific | 2,600 (59.2%) | 1,794 (40.8%) |
| Enterprise Management | 0 (0.0%) | 20 (100.0%) |
| Administrative & Support | 2,080 (62.6%) | 1,242 (37.4%) |
| Educational Services | 1,558 (24.1%) | 4,910 (75.9%) |
| Health Care & Social Assistance | 3,243 (24.3%) | 10,076 (75.6%) |
| Arts, Entertainment & Recreation | 729 (71.9%) | 285 (28.1%) |
| Accommodation & Food Services | 2,454 (54.8%) | 2,023 (45.2%) |
| Public Administration | 2,447 (52.9%) | 2,181 (47.1%) |
| Total | 37,785 (50.7%) | 36,677 (49.3%) |
Education in Miramar
School Enrollment in Miramar
The most common levels of schooling among the 34,335 students in Miramar are middle school (7,585 | 22.1%), college / undergraduate (7,419 | 21.6%), and high school (6,933 | 20.2%).
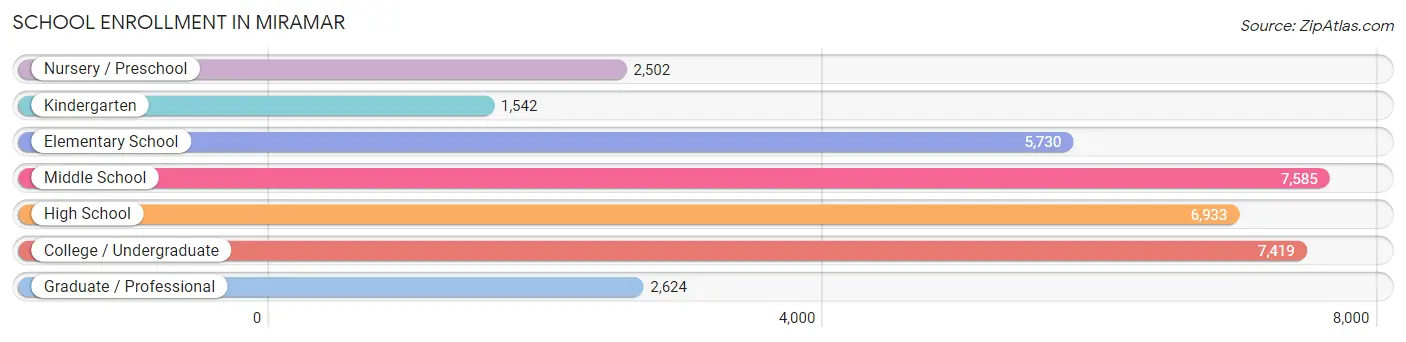
| School Level | # Students | % Students |
| Nursery / Preschool | 2,502 | 7.3% |
| Kindergarten | 1,542 | 4.5% |
| Elementary School | 5,730 | 16.7% |
| Middle School | 7,585 | 22.1% |
| High School | 6,933 | 20.2% |
| College / Undergraduate | 7,419 | 21.6% |
| Graduate / Professional | 2,624 | 7.6% |
| Total | 34,335 | 100.0% |
School Enrollment by Age by Funding Source in Miramar
Out of a total of 34,335 students who are enrolled in schools in Miramar, 5,562 (16.2%) attend a private institution, while the remaining 28,773 (83.8%) are enrolled in public schools. The age group of 3 to 4 year olds has the highest likelihood of being enrolled in private schools, with 1,195 (58.8% in the age bracket) enrolled. Conversely, the age group of 15 to 17 year olds has the lowest likelihood of being enrolled in a private school, with 3,889 (93.2% in the age bracket) attending a public institution.
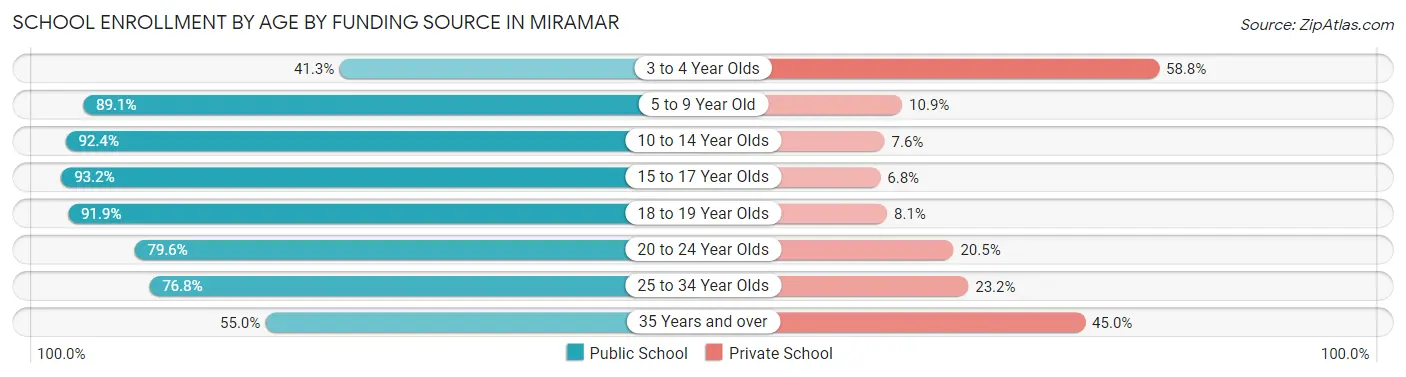
| Age Bracket | Public School | Private School |
| 3 to 4 Year Olds | 839 (41.2%) | 1,195 (58.8%) |
| 5 to 9 Year Old | 6,529 (89.1%) | 798 (10.9%) |
| 10 to 14 Year Olds | 8,838 (92.4%) | 729 (7.6%) |
| 15 to 17 Year Olds | 3,889 (93.2%) | 285 (6.8%) |
| 18 to 19 Year Olds | 2,101 (91.9%) | 185 (8.1%) |
| 20 to 24 Year Olds | 3,668 (79.5%) | 943 (20.4%) |
| 25 to 34 Year Olds | 1,875 (76.8%) | 567 (23.2%) |
| 35 Years and over | 1,042 (55.0%) | 852 (45.0%) |
| Total | 28,773 (83.8%) | 5,562 (16.2%) |
Educational Attainment by Field of Study in Miramar
Business (7,423 | 24.3%), science & technology (5,545 | 18.1%), arts & humanities (2,523 | 8.3%), engineering (2,245 | 7.3%), and education (2,231 | 7.3%) are the most common fields of study among 30,562 individuals in Miramar who have obtained a bachelor's degree or higher.
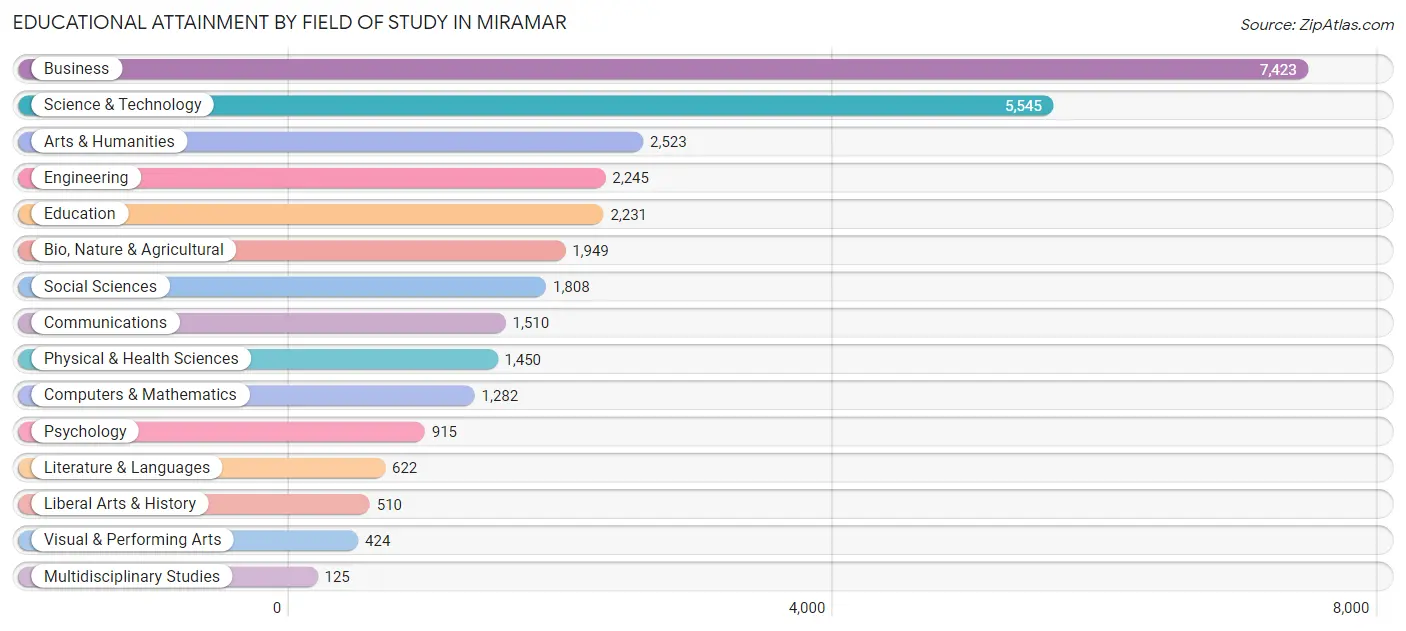
| Field of Study | # Graduates | % Graduates |
| Computers & Mathematics | 1,282 | 4.2% |
| Bio, Nature & Agricultural | 1,949 | 6.4% |
| Physical & Health Sciences | 1,450 | 4.7% |
| Psychology | 915 | 3.0% |
| Social Sciences | 1,808 | 5.9% |
| Engineering | 2,245 | 7.3% |
| Multidisciplinary Studies | 125 | 0.4% |
| Science & Technology | 5,545 | 18.1% |
| Business | 7,423 | 24.3% |
| Education | 2,231 | 7.3% |
| Literature & Languages | 622 | 2.0% |
| Liberal Arts & History | 510 | 1.7% |
| Visual & Performing Arts | 424 | 1.4% |
| Communications | 1,510 | 4.9% |
| Arts & Humanities | 2,523 | 8.3% |
| Total | 30,562 | 100.0% |
Transportation & Commute in Miramar
Vehicle Availability by Sex in Miramar
The most prevalent vehicle ownership categories in Miramar are males with 2 vehicles (16,575, accounting for 45.0%) and females with 2 vehicles (15,316, making up 46.7%).
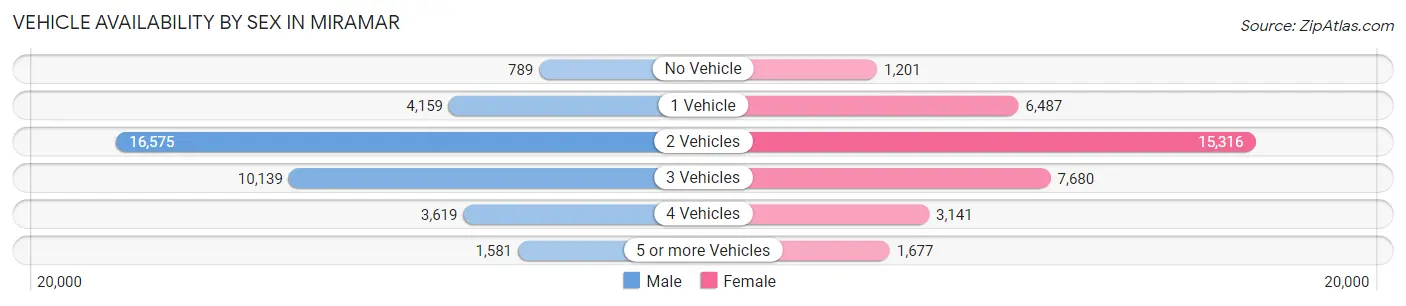
| Vehicles Available | Male | Female |
| No Vehicle | 789 (2.1%) | 1,201 (3.4%) |
| 1 Vehicle | 4,159 (11.3%) | 6,487 (18.3%) |
| 2 Vehicles | 16,575 (45.0%) | 15,316 (43.1%) |
| 3 Vehicles | 10,139 (27.5%) | 7,680 (21.6%) |
| 4 Vehicles | 3,619 (9.8%) | 3,141 (8.8%) |
| 5 or more Vehicles | 1,581 (4.3%) | 1,677 (4.7%) |
| Total | 36,862 (100.0%) | 35,502 (100.0%) |
Commute Time in Miramar
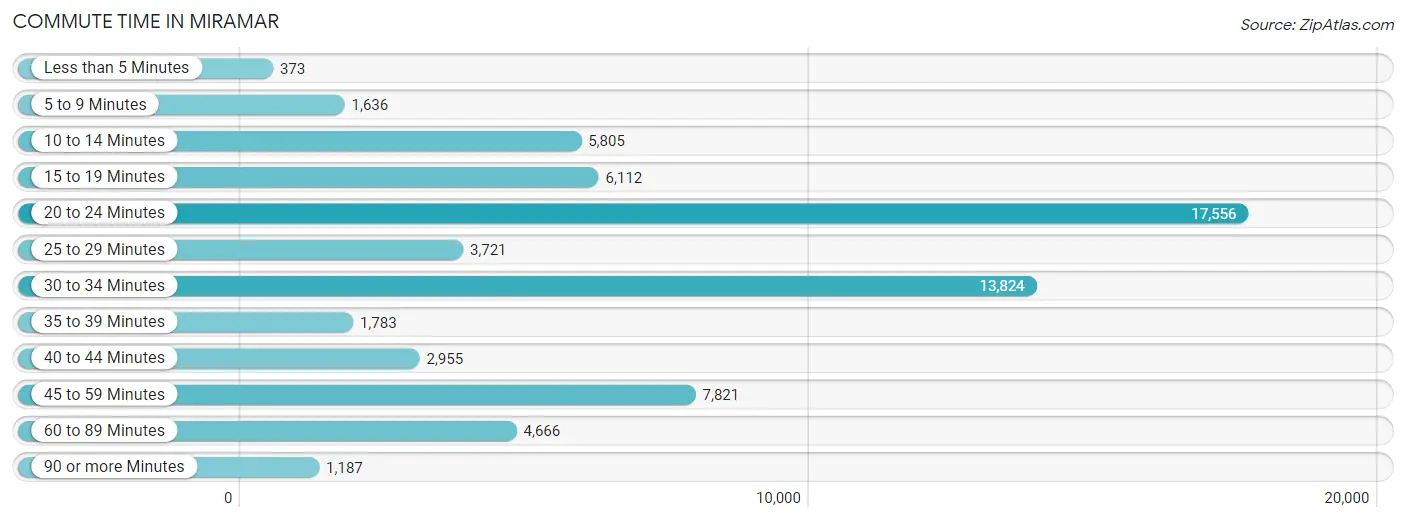
The most frequently occuring commute durations in Miramar are 20 to 24 minutes (17,556 commuters, 26.0%), 30 to 34 minutes (13,824 commuters, 20.5%), and 45 to 59 minutes (7,821 commuters, 11.6%).
| Commute Time | # Commuters | % Commuters |
| Less than 5 Minutes | 373 | 0.5% |
| 5 to 9 Minutes | 1,636 | 2.4% |
| 10 to 14 Minutes | 5,805 | 8.6% |
| 15 to 19 Minutes | 6,112 | 9.1% |
| 20 to 24 Minutes | 17,556 | 26.0% |
| 25 to 29 Minutes | 3,721 | 5.5% |
| 30 to 34 Minutes | 13,824 | 20.5% |
| 35 to 39 Minutes | 1,783 | 2.6% |
| 40 to 44 Minutes | 2,955 | 4.4% |
| 45 to 59 Minutes | 7,821 | 11.6% |
| 60 to 89 Minutes | 4,666 | 6.9% |
| 90 or more Minutes | 1,187 | 1.8% |
Commute Time by Sex in Miramar
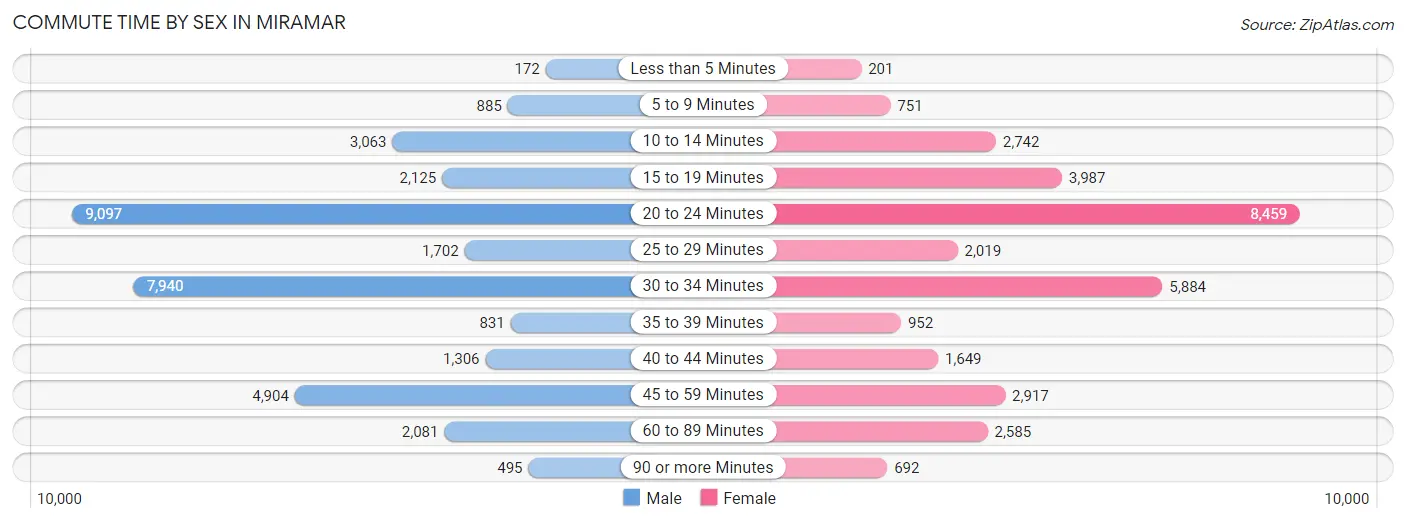
The most common commute times in Miramar are 20 to 24 minutes (9,097 commuters, 26.3%) for males and 20 to 24 minutes (8,459 commuters, 25.8%) for females.
| Commute Time | Male | Female |
| Less than 5 Minutes | 172 (0.5%) | 201 (0.6%) |
| 5 to 9 Minutes | 885 (2.6%) | 751 (2.3%) |
| 10 to 14 Minutes | 3,063 (8.8%) | 2,742 (8.4%) |
| 15 to 19 Minutes | 2,125 (6.1%) | 3,987 (12.1%) |
| 20 to 24 Minutes | 9,097 (26.3%) | 8,459 (25.8%) |
| 25 to 29 Minutes | 1,702 (4.9%) | 2,019 (6.1%) |
| 30 to 34 Minutes | 7,940 (23.0%) | 5,884 (17.9%) |
| 35 to 39 Minutes | 831 (2.4%) | 952 (2.9%) |
| 40 to 44 Minutes | 1,306 (3.8%) | 1,649 (5.0%) |
| 45 to 59 Minutes | 4,904 (14.2%) | 2,917 (8.9%) |
| 60 to 89 Minutes | 2,081 (6.0%) | 2,585 (7.9%) |
| 90 or more Minutes | 495 (1.4%) | 692 (2.1%) |
Time of Departure to Work by Sex in Miramar
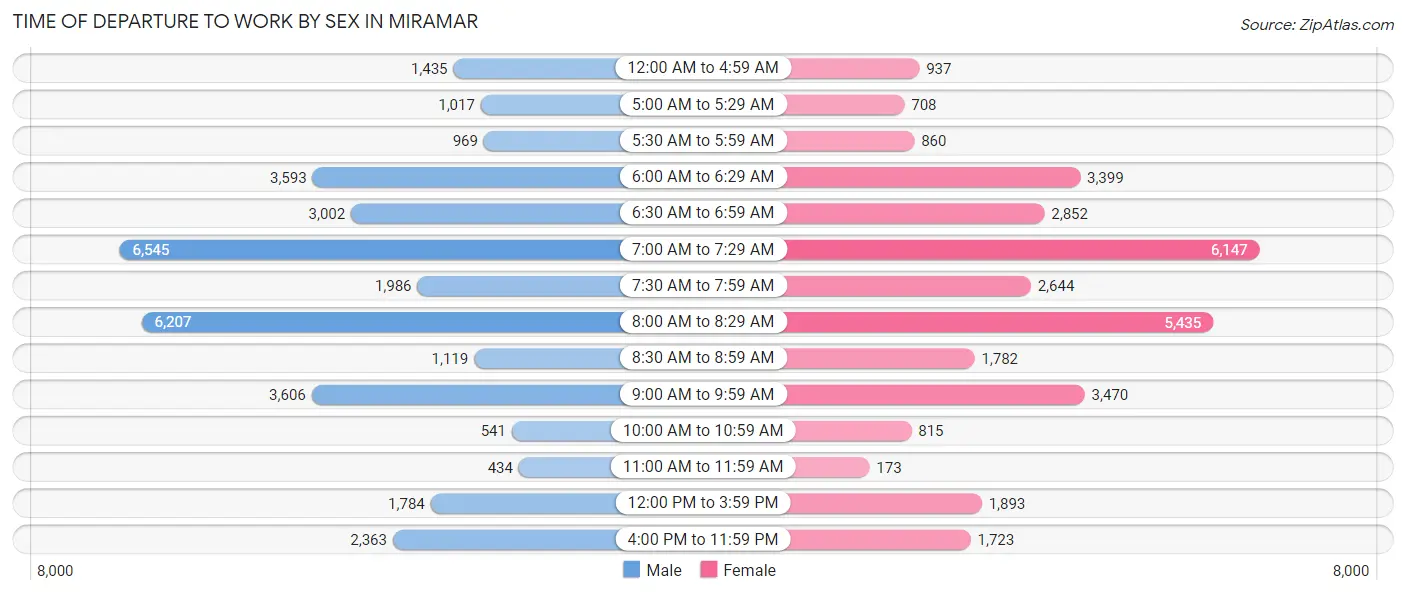
The most frequent times of departure to work in Miramar are 7:00 AM to 7:29 AM (6,545, 18.9%) for males and 7:00 AM to 7:29 AM (6,147, 18.7%) for females.
| Time of Departure | Male | Female |
| 12:00 AM to 4:59 AM | 1,435 (4.2%) | 937 (2.9%) |
| 5:00 AM to 5:29 AM | 1,017 (2.9%) | 708 (2.2%) |
| 5:30 AM to 5:59 AM | 969 (2.8%) | 860 (2.6%) |
| 6:00 AM to 6:29 AM | 3,593 (10.4%) | 3,399 (10.3%) |
| 6:30 AM to 6:59 AM | 3,002 (8.7%) | 2,852 (8.7%) |
| 7:00 AM to 7:29 AM | 6,545 (18.9%) | 6,147 (18.7%) |
| 7:30 AM to 7:59 AM | 1,986 (5.7%) | 2,644 (8.1%) |
| 8:00 AM to 8:29 AM | 6,207 (17.9%) | 5,435 (16.6%) |
| 8:30 AM to 8:59 AM | 1,119 (3.2%) | 1,782 (5.4%) |
| 9:00 AM to 9:59 AM | 3,606 (10.4%) | 3,470 (10.6%) |
| 10:00 AM to 10:59 AM | 541 (1.6%) | 815 (2.5%) |
| 11:00 AM to 11:59 AM | 434 (1.3%) | 173 (0.5%) |
| 12:00 PM to 3:59 PM | 1,784 (5.2%) | 1,893 (5.8%) |
| 4:00 PM to 11:59 PM | 2,363 (6.8%) | 1,723 (5.2%) |
| Total | 34,601 (100.0%) | 32,838 (100.0%) |
Housing Occupancy in Miramar
Occupancy by Ownership in Miramar
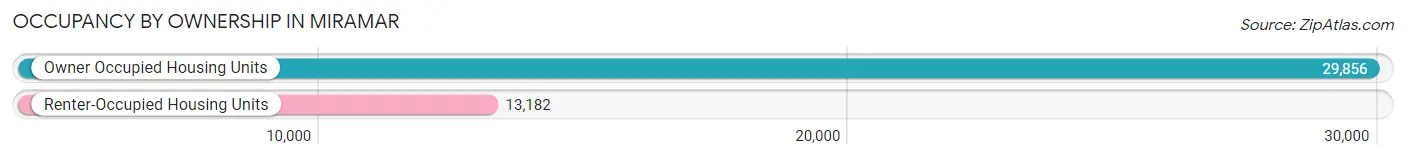
Of the total 43,038 dwellings in Miramar, owner-occupied units account for 29,856 (69.4%), while renter-occupied units make up 13,182 (30.6%).
| Occupancy | # Housing Units | % Housing Units |
| Owner Occupied Housing Units | 29,856 | 69.4% |
| Renter-Occupied Housing Units | 13,182 | 30.6% |
| Total Occupied Housing Units | 43,038 | 100.0% |
Occupancy by Household Size in Miramar
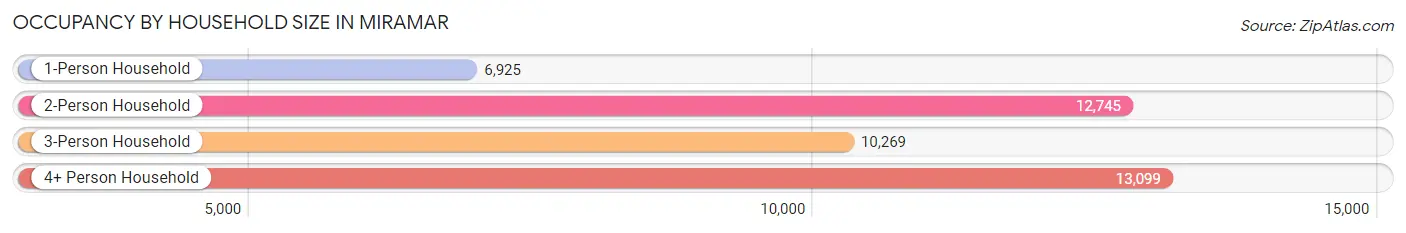
| Household Size | # Housing Units | % Housing Units |
| 1-Person Household | 6,925 | 16.1% |
| 2-Person Household | 12,745 | 29.6% |
| 3-Person Household | 10,269 | 23.9% |
| 4+ Person Household | 13,099 | 30.4% |
| Total Housing Units | 43,038 | 100.0% |
Occupancy by Ownership by Household Size in Miramar
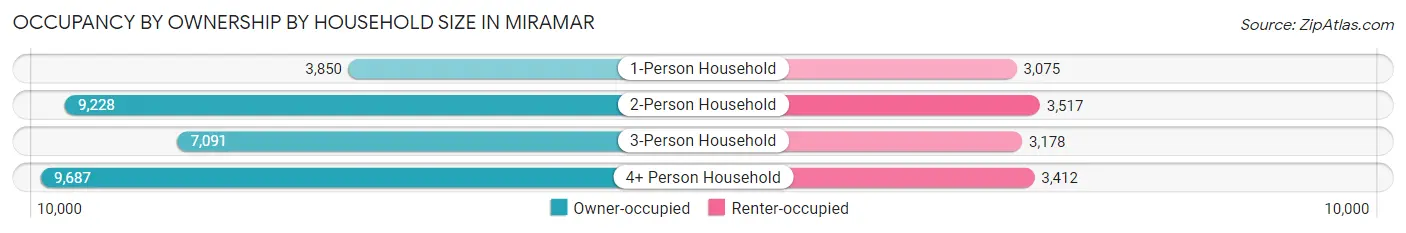
| Household Size | Owner-occupied | Renter-occupied |
| 1-Person Household | 3,850 (55.6%) | 3,075 (44.4%) |
| 2-Person Household | 9,228 (72.4%) | 3,517 (27.6%) |
| 3-Person Household | 7,091 (69.1%) | 3,178 (30.9%) |
| 4+ Person Household | 9,687 (74.0%) | 3,412 (26.1%) |
| Total Housing Units | 29,856 (69.4%) | 13,182 (30.6%) |
Occupancy by Educational Attainment in Miramar
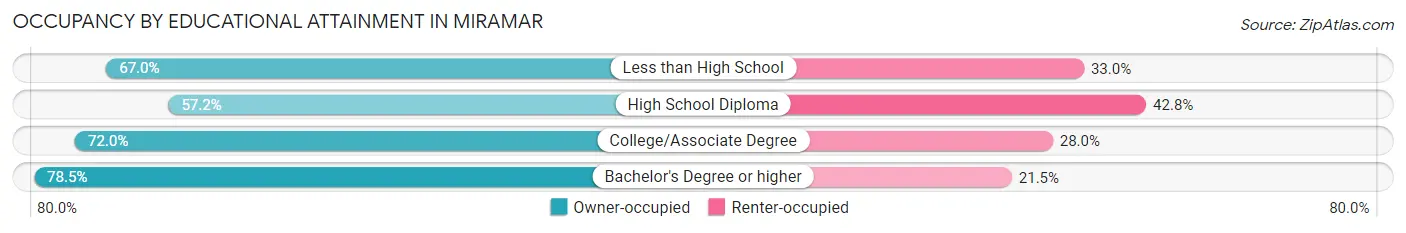
| Household Size | Owner-occupied | Renter-occupied |
| Less than High School | 1,780 (67.0%) | 875 (33.0%) |
| High School Diploma | 7,621 (57.2%) | 5,708 (42.8%) |
| College/Associate Degree | 8,617 (72.0%) | 3,353 (28.0%) |
| Bachelor's Degree or higher | 11,838 (78.5%) | 3,246 (21.5%) |
Occupancy by Age of Householder in Miramar
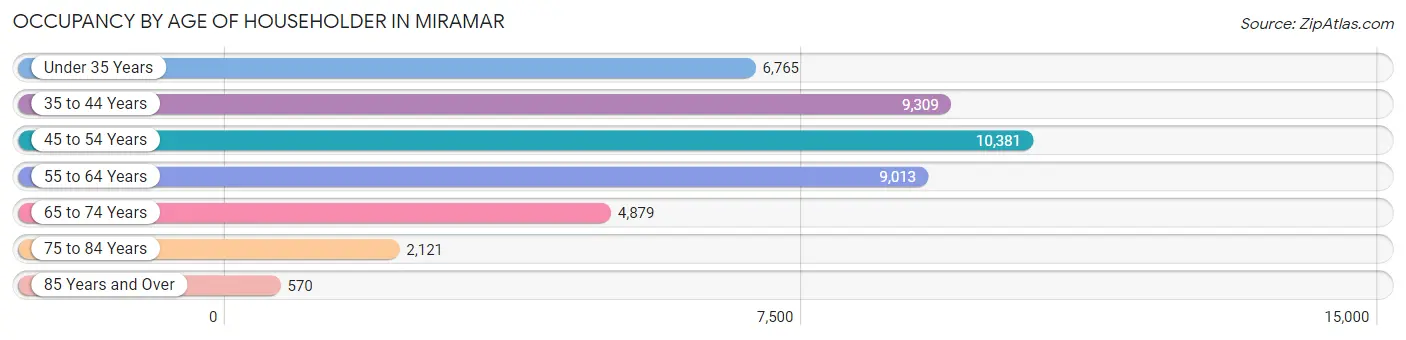
| Age Bracket | # Households | % Households |
| Under 35 Years | 6,765 | 15.7% |
| 35 to 44 Years | 9,309 | 21.6% |
| 45 to 54 Years | 10,381 | 24.1% |
| 55 to 64 Years | 9,013 | 20.9% |
| 65 to 74 Years | 4,879 | 11.3% |
| 75 to 84 Years | 2,121 | 4.9% |
| 85 Years and Over | 570 | 1.3% |
| Total | 43,038 | 100.0% |
Housing Finances in Miramar
Median Income by Occupancy in Miramar
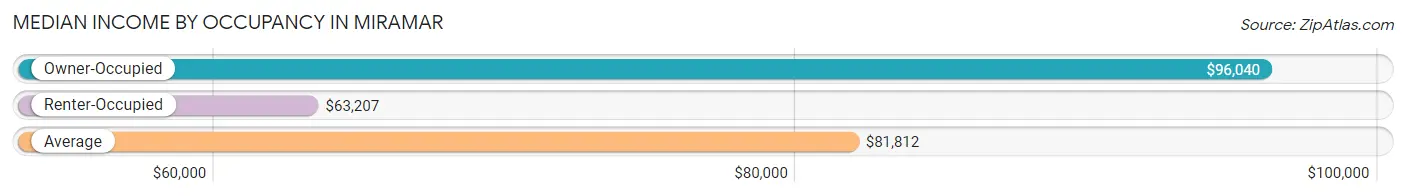
| Occupancy Type | # Households | Median Income |
| Owner-Occupied | 29,856 (69.4%) | $96,040 |
| Renter-Occupied | 13,182 (30.6%) | $63,207 |
| Average | 43,038 (100.0%) | $81,812 |
Occupancy by Householder Income Bracket in Miramar
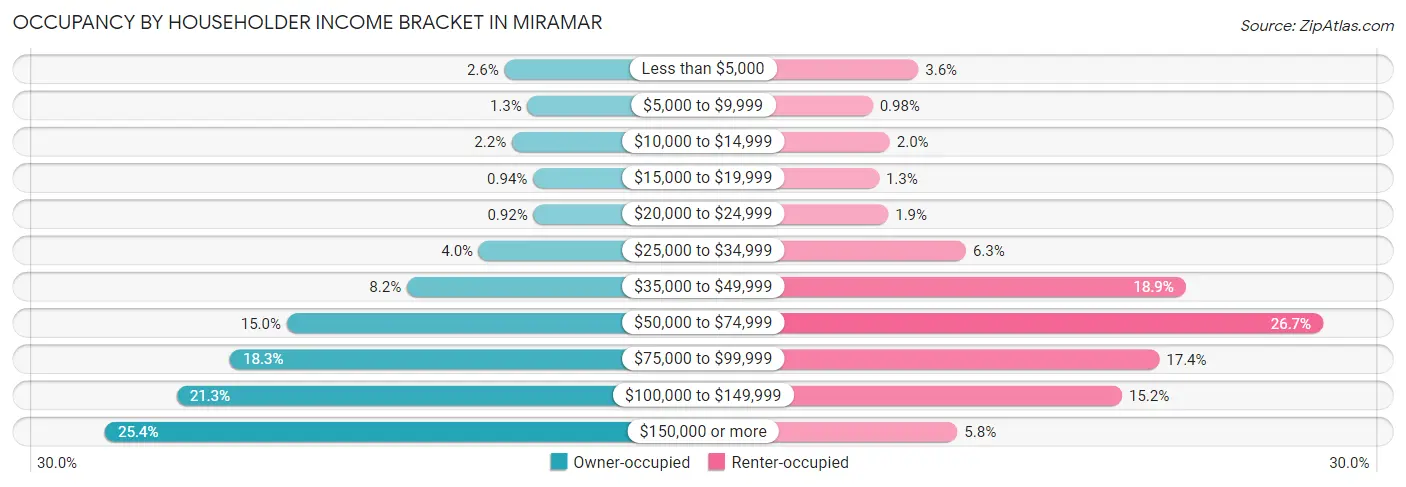
| Income Bracket | Owner-occupied | Renter-occupied |
| Less than $5,000 | 767 (2.6%) | 473 (3.6%) |
| $5,000 to $9,999 | 376 (1.3%) | 129 (1.0%) |
| $10,000 to $14,999 | 641 (2.1%) | 258 (2.0%) |
| $15,000 to $19,999 | 281 (0.9%) | 177 (1.3%) |
| $20,000 to $24,999 | 275 (0.9%) | 246 (1.9%) |
| $25,000 to $34,999 | 1,205 (4.0%) | 832 (6.3%) |
| $35,000 to $49,999 | 2,432 (8.2%) | 2,486 (18.9%) |
| $50,000 to $74,999 | 4,485 (15.0%) | 3,519 (26.7%) |
| $75,000 to $99,999 | 5,451 (18.3%) | 2,288 (17.4%) |
| $100,000 to $149,999 | 6,360 (21.3%) | 2,007 (15.2%) |
| $150,000 or more | 7,583 (25.4%) | 767 (5.8%) |
| Total | 29,856 (100.0%) | 13,182 (100.0%) |
Monthly Housing Cost Tiers in Miramar
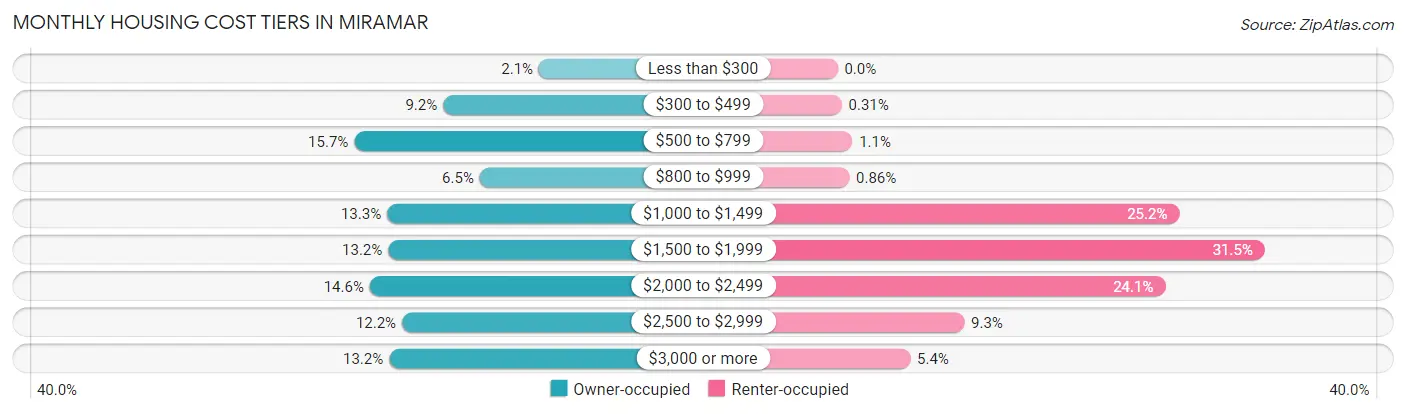
| Monthly Cost | Owner-occupied | Renter-occupied |
| Less than $300 | 632 (2.1%) | 0 (0.0%) |
| $300 to $499 | 2,742 (9.2%) | 41 (0.3%) |
| $500 to $799 | 4,696 (15.7%) | 144 (1.1%) |
| $800 to $999 | 1,936 (6.5%) | 114 (0.9%) |
| $1,000 to $1,499 | 3,975 (13.3%) | 3,318 (25.2%) |
| $1,500 to $1,999 | 3,949 (13.2%) | 4,148 (31.5%) |
| $2,000 to $2,499 | 4,354 (14.6%) | 3,182 (24.1%) |
| $2,500 to $2,999 | 3,644 (12.2%) | 1,230 (9.3%) |
| $3,000 or more | 3,928 (13.2%) | 705 (5.3%) |
| Total | 29,856 (100.0%) | 13,182 (100.0%) |
Physical Housing Characteristics in Miramar
Housing Structures in Miramar
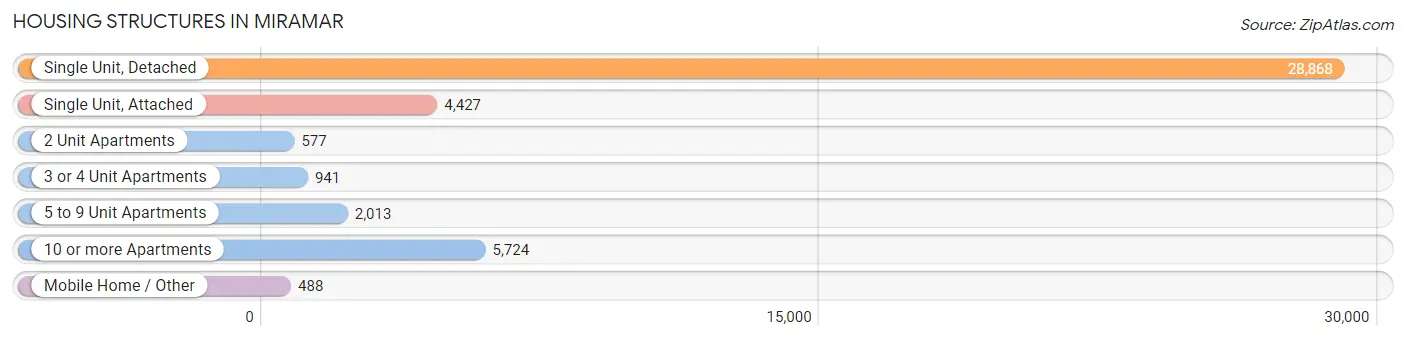
| Structure Type | # Housing Units | % Housing Units |
| Single Unit, Detached | 28,868 | 67.1% |
| Single Unit, Attached | 4,427 | 10.3% |
| 2 Unit Apartments | 577 | 1.3% |
| 3 or 4 Unit Apartments | 941 | 2.2% |
| 5 to 9 Unit Apartments | 2,013 | 4.7% |
| 10 or more Apartments | 5,724 | 13.3% |
| Mobile Home / Other | 488 | 1.1% |
| Total | 43,038 | 100.0% |
Housing Structures by Occupancy in Miramar
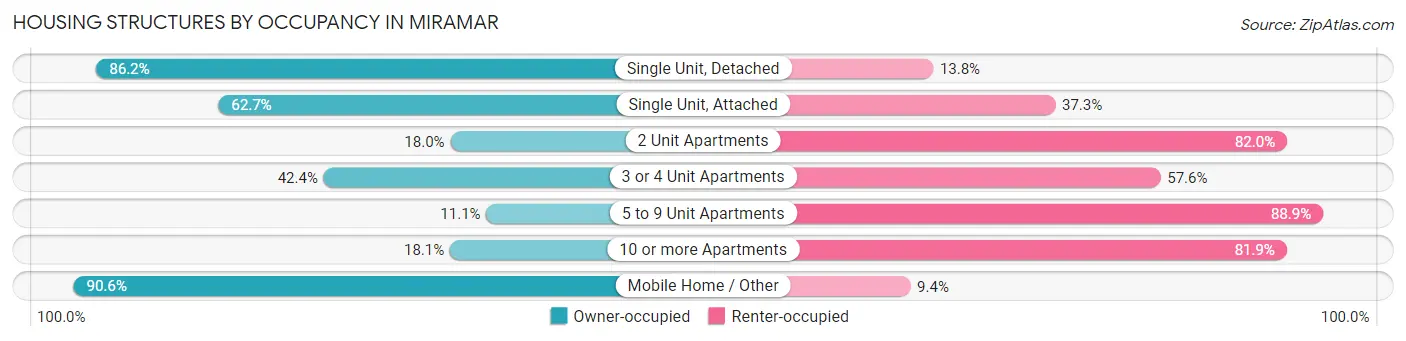
| Structure Type | Owner-occupied | Renter-occupied |
| Single Unit, Detached | 24,878 (86.2%) | 3,990 (13.8%) |
| Single Unit, Attached | 2,775 (62.7%) | 1,652 (37.3%) |
| 2 Unit Apartments | 104 (18.0%) | 473 (82.0%) |
| 3 or 4 Unit Apartments | 399 (42.4%) | 542 (57.6%) |
| 5 to 9 Unit Apartments | 223 (11.1%) | 1,790 (88.9%) |
| 10 or more Apartments | 1,035 (18.1%) | 4,689 (81.9%) |
| Mobile Home / Other | 442 (90.6%) | 46 (9.4%) |
| Total | 29,856 (69.4%) | 13,182 (30.6%) |
Housing Structures by Number of Rooms in Miramar
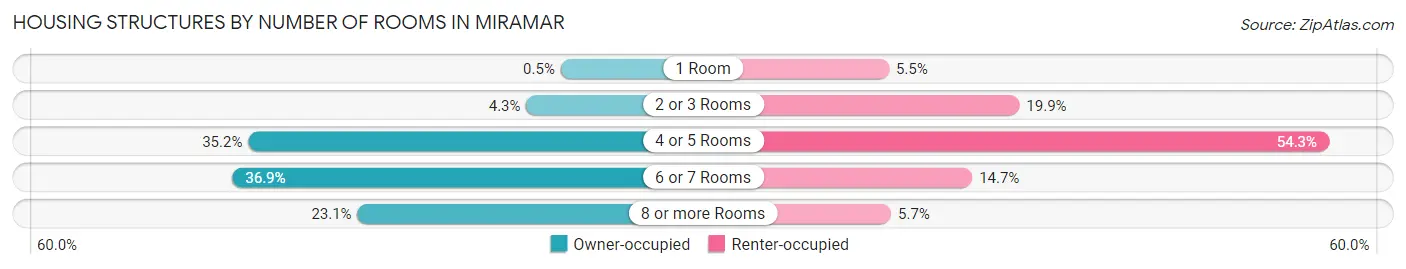
| Number of Rooms | Owner-occupied | Renter-occupied |
| 1 Room | 150 (0.5%) | 719 (5.4%) |
| 2 or 3 Rooms | 1,288 (4.3%) | 2,626 (19.9%) |
| 4 or 5 Rooms | 10,504 (35.2%) | 7,153 (54.3%) |
| 6 or 7 Rooms | 11,028 (36.9%) | 1,935 (14.7%) |
| 8 or more Rooms | 6,886 (23.1%) | 749 (5.7%) |
| Total | 29,856 (100.0%) | 13,182 (100.0%) |
Housing Structure by Heating Type in Miramar
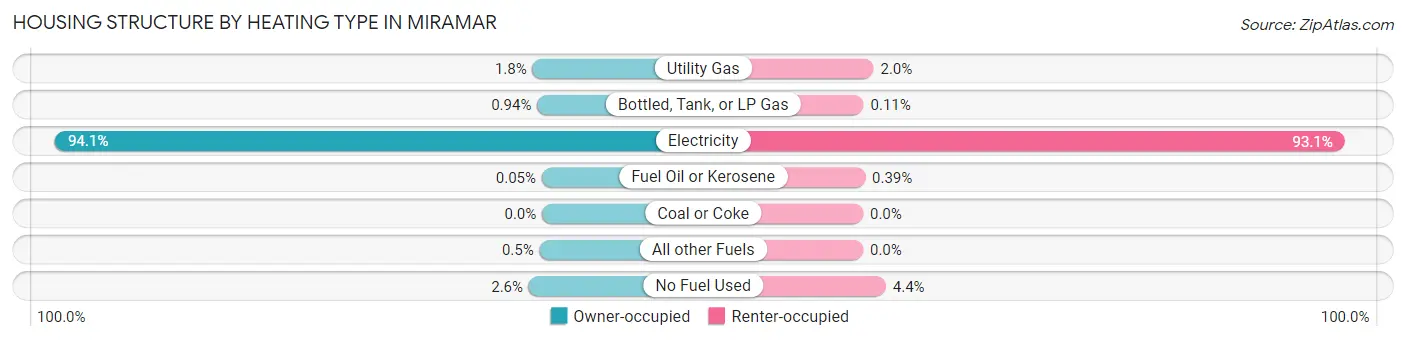
| Heating Type | Owner-occupied | Renter-occupied |
| Utility Gas | 549 (1.8%) | 268 (2.0%) |
| Bottled, Tank, or LP Gas | 281 (0.9%) | 15 (0.1%) |
| Electricity | 28,099 (94.1%) | 12,267 (93.1%) |
| Fuel Oil or Kerosene | 15 (0.1%) | 51 (0.4%) |
| Coal or Coke | 0 (0.0%) | 0 (0.0%) |
| All other Fuels | 149 (0.5%) | 0 (0.0%) |
| No Fuel Used | 763 (2.6%) | 581 (4.4%) |
| Total | 29,856 (100.0%) | 13,182 (100.0%) |
Household Vehicle Usage in Miramar
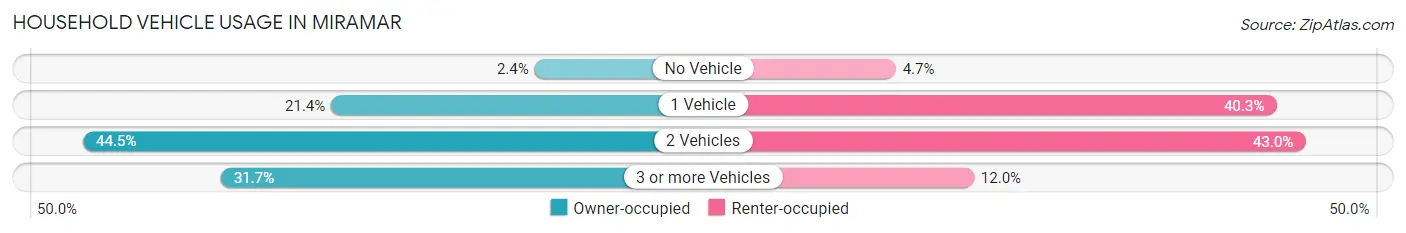
| Vehicles per Household | Owner-occupied | Renter-occupied |
| No Vehicle | 716 (2.4%) | 625 (4.7%) |
| 1 Vehicle | 6,385 (21.4%) | 5,307 (40.3%) |
| 2 Vehicles | 13,298 (44.5%) | 5,663 (43.0%) |
| 3 or more Vehicles | 9,457 (31.7%) | 1,587 (12.0%) |
| Total | 29,856 (100.0%) | 13,182 (100.0%) |
Real Estate & Mortgages in Miramar
Real Estate and Mortgage Overview in Miramar
| Characteristic | Without Mortgage | With Mortgage |
| Housing Units | 11,172 | 18,684 |
| Median Property Value | $354,100 | $393,900 |
| Median Household Income | $77,321 | $6,024 |
| Monthly Housing Costs | $655 | $3,912 |
| Real Estate Taxes | $3,184 | $239 |
Property Value by Mortgage Status in Miramar
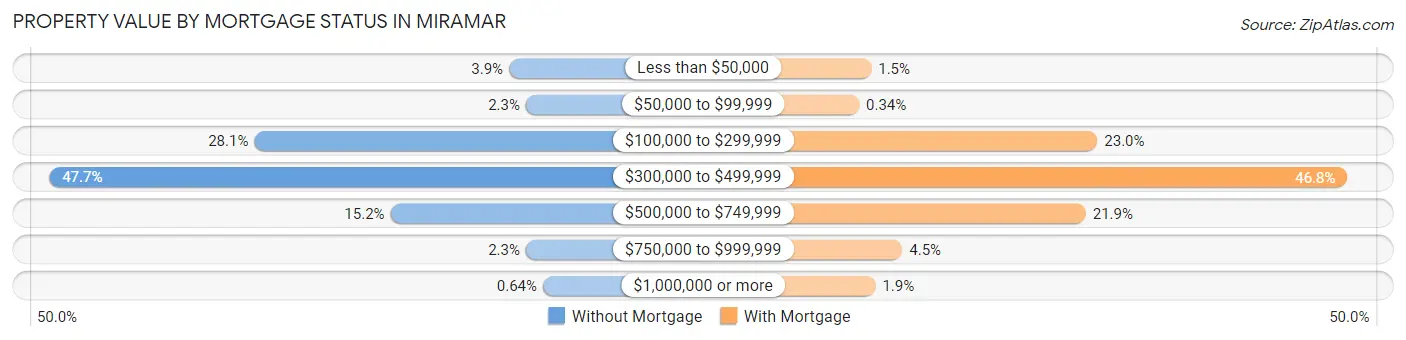
| Property Value | Without Mortgage | With Mortgage |
| Less than $50,000 | 432 (3.9%) | 281 (1.5%) |
| $50,000 to $99,999 | 254 (2.3%) | 64 (0.3%) |
| $100,000 to $299,999 | 3,143 (28.1%) | 4,302 (23.0%) |
| $300,000 to $499,999 | 5,323 (47.6%) | 8,750 (46.8%) |
| $500,000 to $749,999 | 1,694 (15.2%) | 4,098 (21.9%) |
| $750,000 to $999,999 | 254 (2.3%) | 834 (4.5%) |
| $1,000,000 or more | 72 (0.6%) | 355 (1.9%) |
| Total | 11,172 (100.0%) | 18,684 (100.0%) |
Household Income by Mortgage Status in Miramar
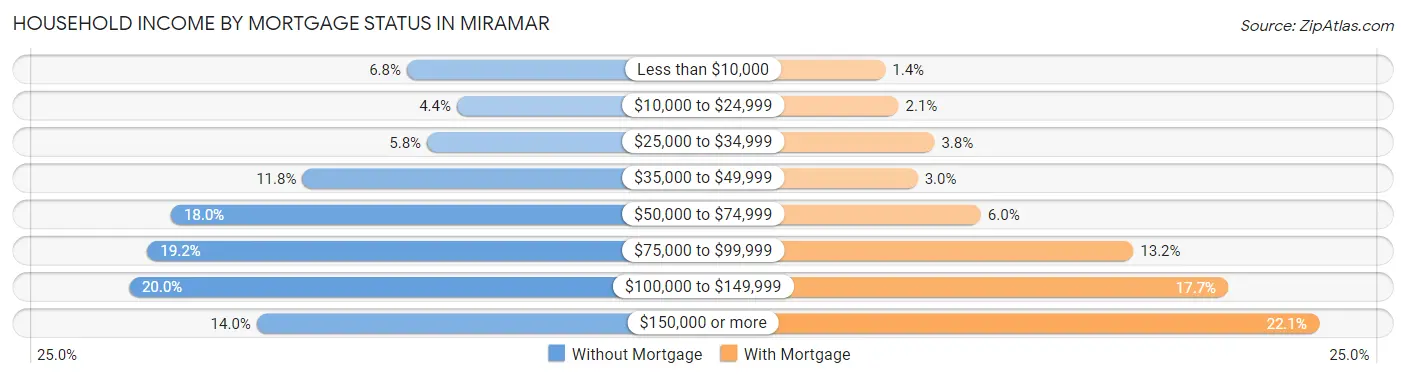
| Household Income | Without Mortgage | With Mortgage |
| Less than $10,000 | 760 (6.8%) | 265 (1.4%) |
| $10,000 to $24,999 | 494 (4.4%) | 383 (2.1%) |
| $25,000 to $34,999 | 652 (5.8%) | 703 (3.8%) |
| $35,000 to $49,999 | 1,316 (11.8%) | 553 (3.0%) |
| $50,000 to $74,999 | 2,014 (18.0%) | 1,116 (6.0%) |
| $75,000 to $99,999 | 2,139 (19.2%) | 2,471 (13.2%) |
| $100,000 to $149,999 | 2,238 (20.0%) | 3,312 (17.7%) |
| $150,000 or more | 1,559 (14.0%) | 4,122 (22.1%) |
| Total | 11,172 (100.0%) | 18,684 (100.0%) |
Property Value to Household Income Ratio in Miramar
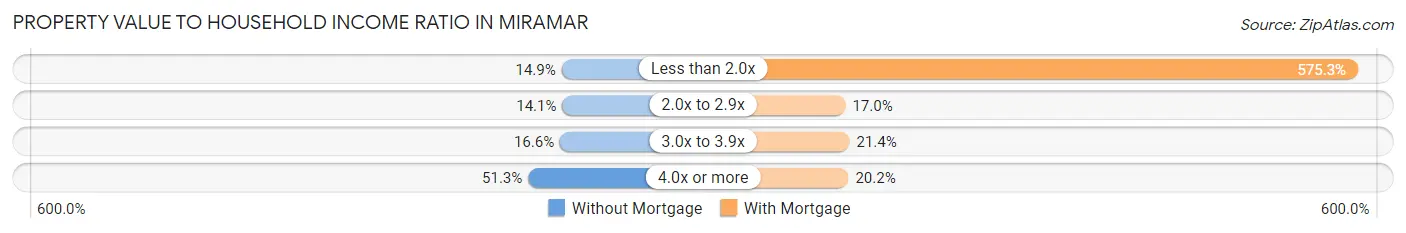
| Value-to-Income Ratio | Without Mortgage | With Mortgage |
| Less than 2.0x | 1,665 (14.9%) | 107,492 (575.3%) |
| 2.0x to 2.9x | 1,571 (14.1%) | 3,170 (17.0%) |
| 3.0x to 3.9x | 1,854 (16.6%) | 3,999 (21.4%) |
| 4.0x or more | 5,736 (51.3%) | 3,778 (20.2%) |
| Total | 11,172 (100.0%) | 18,684 (100.0%) |
Real Estate Taxes by Mortgage Status in Miramar
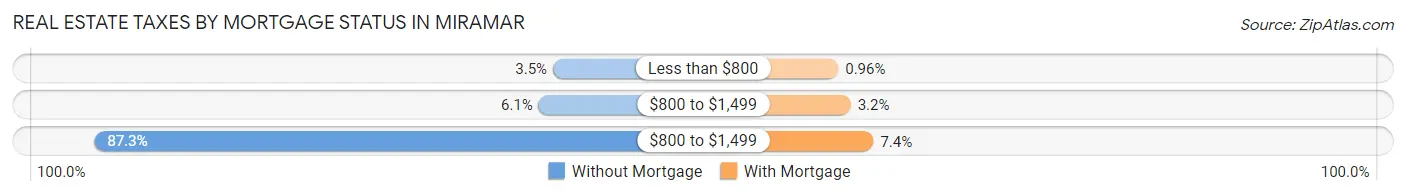
| Property Taxes | Without Mortgage | With Mortgage |
| Less than $800 | 391 (3.5%) | 179 (1.0%) |
| $800 to $1,499 | 682 (6.1%) | 603 (3.2%) |
| $800 to $1,499 | 9,749 (87.3%) | 1,381 (7.4%) |
| Total | 11,172 (100.0%) | 18,684 (100.0%) |
Health & Disability in Miramar
Health Insurance Coverage by Age in Miramar
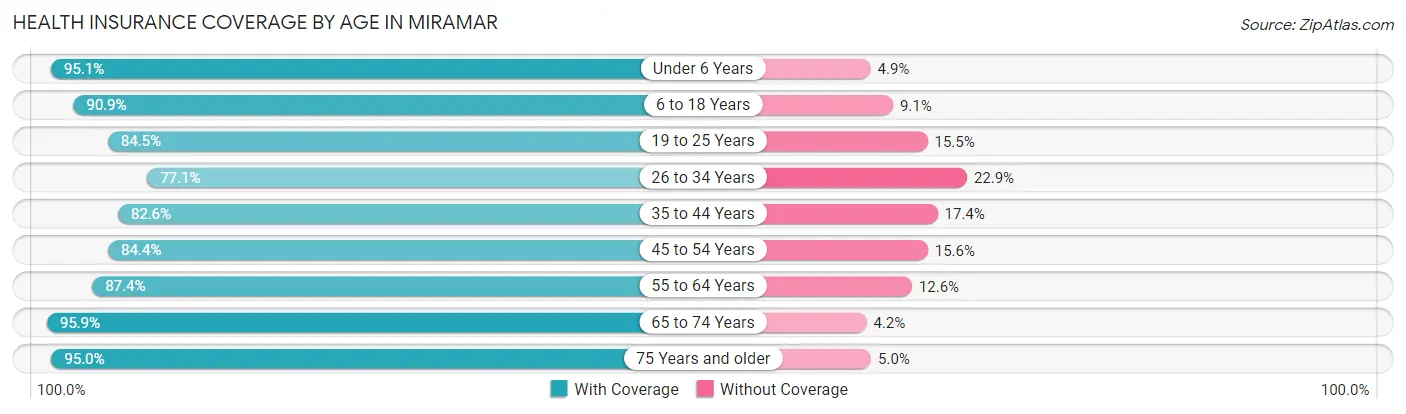
| Age Bracket | With Coverage | Without Coverage |
| Under 6 Years | 8,898 (95.1%) | 459 (4.9%) |
| 6 to 18 Years | 20,349 (90.9%) | 2,031 (9.1%) |
| 19 to 25 Years | 9,629 (84.5%) | 1,769 (15.5%) |
| 26 to 34 Years | 13,871 (77.1%) | 4,113 (22.9%) |
| 35 to 44 Years | 16,954 (82.6%) | 3,571 (17.4%) |
| 45 to 54 Years | 17,689 (84.4%) | 3,262 (15.6%) |
| 55 to 64 Years | 14,446 (87.4%) | 2,087 (12.6%) |
| 65 to 74 Years | 9,417 (95.9%) | 408 (4.2%) |
| 75 Years and older | 5,760 (95.0%) | 303 (5.0%) |
| Total | 117,013 (86.7%) | 18,003 (13.3%) |
Health Insurance Coverage by Citizenship Status in Miramar
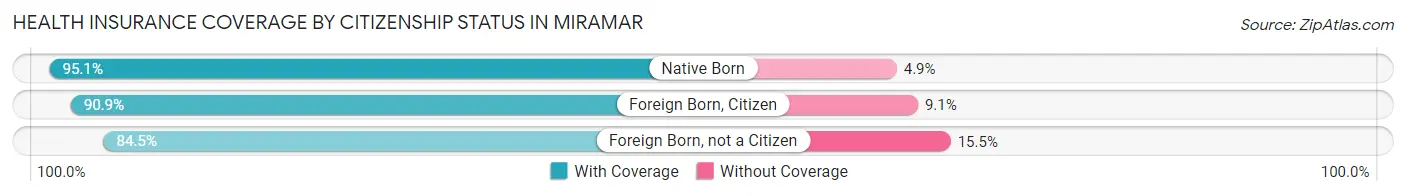
| Citizenship Status | With Coverage | Without Coverage |
| Native Born | 8,898 (95.1%) | 459 (4.9%) |
| Foreign Born, Citizen | 20,349 (90.9%) | 2,031 (9.1%) |
| Foreign Born, not a Citizen | 9,629 (84.5%) | 1,769 (15.5%) |
Health Insurance Coverage by Household Income in Miramar
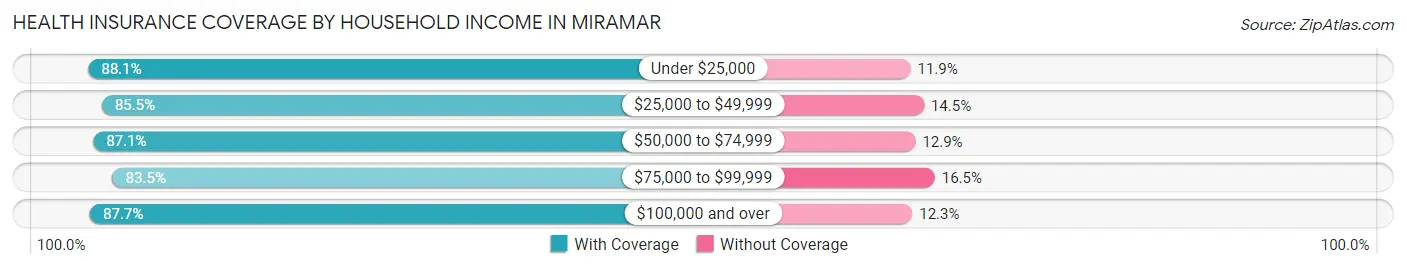
| Household Income | With Coverage | Without Coverage |
| Under $25,000 | 6,725 (88.1%) | 912 (11.9%) |
| $25,000 to $49,999 | 14,794 (85.5%) | 2,500 (14.5%) |
| $50,000 to $74,999 | 19,408 (87.1%) | 2,864 (12.9%) |
| $75,000 to $99,999 | 18,717 (83.5%) | 3,697 (16.5%) |
| $100,000 and over | 57,246 (87.7%) | 8,016 (12.3%) |
Public vs Private Health Insurance Coverage by Age in Miramar
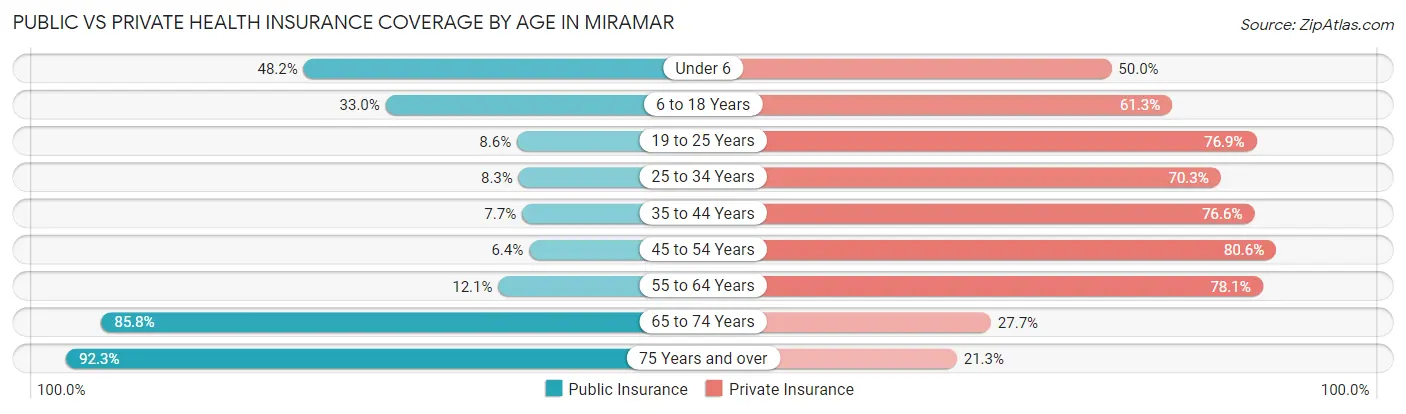
| Age Bracket | Public Insurance | Private Insurance |
| Under 6 | 4,512 (48.2%) | 4,682 (50.0%) |
| 6 to 18 Years | 7,383 (33.0%) | 13,719 (61.3%) |
| 19 to 25 Years | 981 (8.6%) | 8,769 (76.9%) |
| 25 to 34 Years | 1,492 (8.3%) | 12,642 (70.3%) |
| 35 to 44 Years | 1,576 (7.7%) | 15,711 (76.5%) |
| 45 to 54 Years | 1,332 (6.4%) | 16,887 (80.6%) |
| 55 to 64 Years | 1,995 (12.1%) | 12,909 (78.1%) |
| 65 to 74 Years | 8,425 (85.8%) | 2,720 (27.7%) |
| 75 Years and over | 5,596 (92.3%) | 1,294 (21.3%) |
| Total | 33,292 (24.7%) | 89,333 (66.2%) |
Disability Status by Sex by Age in Miramar
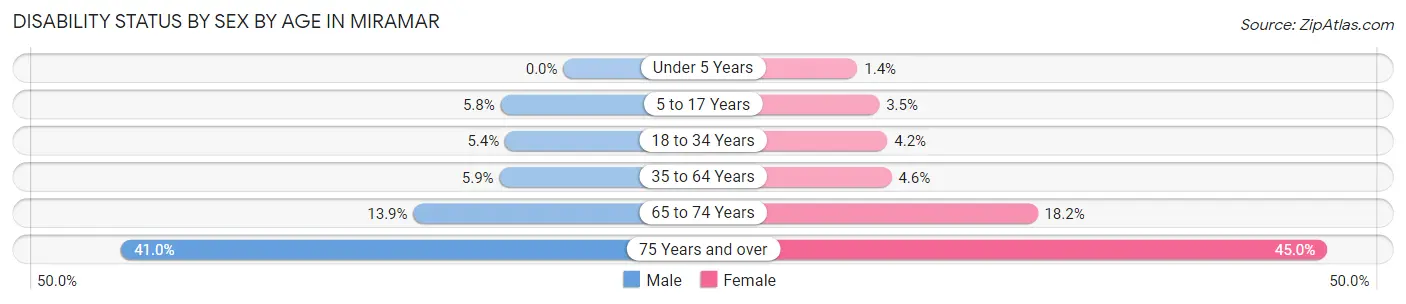
| Age Bracket | Male | Female |
| Under 5 Years | 0 (0.0%) | 60 (1.4%) |
| 5 to 17 Years | 639 (5.8%) | 386 (3.5%) |
| 18 to 34 Years | 864 (5.4%) | 647 (4.2%) |
| 35 to 64 Years | 1,677 (5.9%) | 1,370 (4.6%) |
| 65 to 74 Years | 661 (13.9%) | 922 (18.2%) |
| 75 Years and over | 919 (41.0%) | 1,722 (45.0%) |
Disability Class by Sex by Age in Miramar
Disability Class: Hearing Difficulty
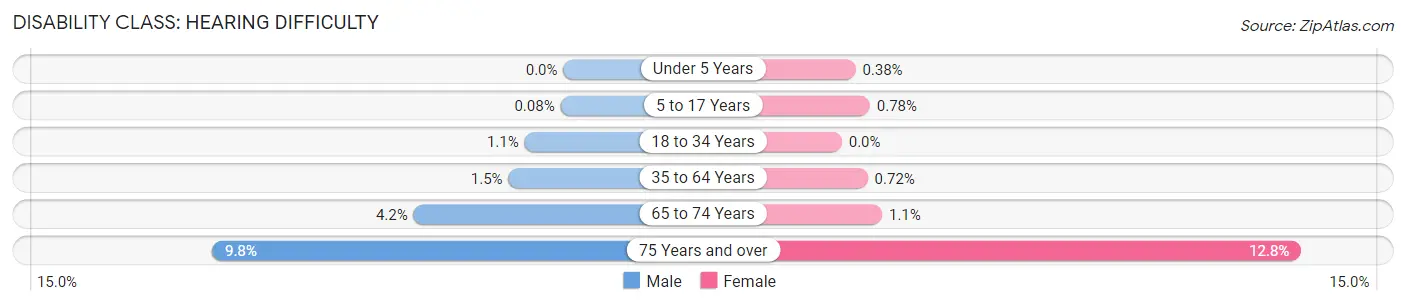
| Age Bracket | Male | Female |
| Under 5 Years | 0 (0.0%) | 16 (0.4%) |
| 5 to 17 Years | 9 (0.1%) | 87 (0.8%) |
| 18 to 34 Years | 173 (1.1%) | 0 (0.0%) |
| 35 to 64 Years | 432 (1.5%) | 213 (0.7%) |
| 65 to 74 Years | 198 (4.2%) | 57 (1.1%) |
| 75 Years and over | 219 (9.8%) | 489 (12.8%) |
Disability Class: Vision Difficulty
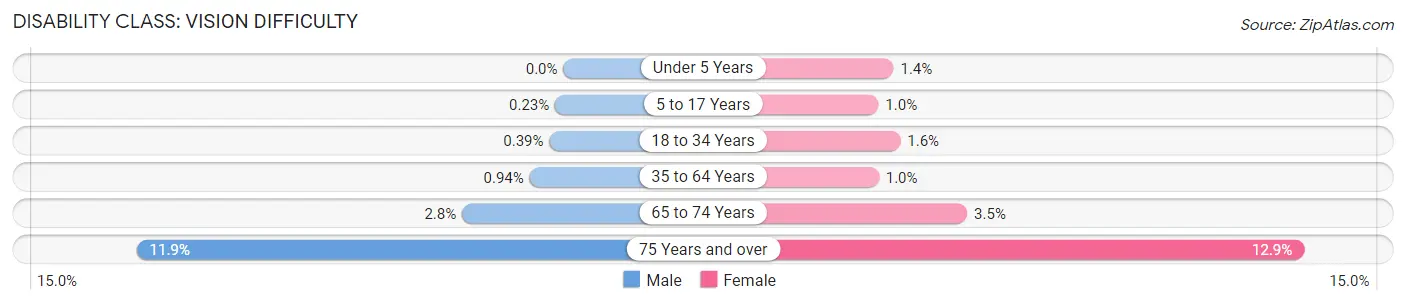
| Age Bracket | Male | Female |
| Under 5 Years | 0 (0.0%) | 60 (1.4%) |
| 5 to 17 Years | 25 (0.2%) | 114 (1.0%) |
| 18 to 34 Years | 62 (0.4%) | 250 (1.6%) |
| 35 to 64 Years | 266 (0.9%) | 306 (1.0%) |
| 65 to 74 Years | 134 (2.8%) | 177 (3.5%) |
| 75 Years and over | 266 (11.9%) | 492 (12.9%) |
Disability Class: Cognitive Difficulty
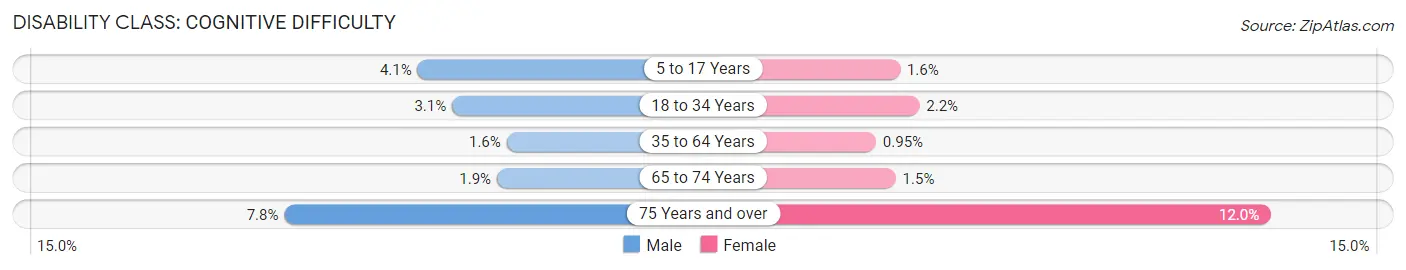
| Age Bracket | Male | Female |
| 5 to 17 Years | 445 (4.1%) | 180 (1.6%) |
| 18 to 34 Years | 494 (3.1%) | 330 (2.2%) |
| 35 to 64 Years | 448 (1.6%) | 281 (0.9%) |
| 65 to 74 Years | 88 (1.8%) | 76 (1.5%) |
| 75 Years and over | 174 (7.8%) | 457 (11.9%) |
Disability Class: Ambulatory Difficulty
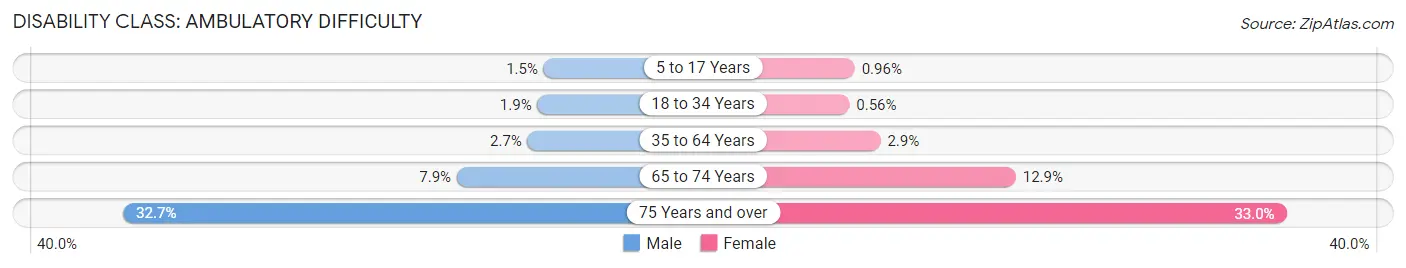
| Age Bracket | Male | Female |
| 5 to 17 Years | 159 (1.5%) | 107 (1.0%) |
| 18 to 34 Years | 306 (1.9%) | 85 (0.6%) |
| 35 to 64 Years | 750 (2.6%) | 852 (2.9%) |
| 65 to 74 Years | 375 (7.9%) | 656 (12.9%) |
| 75 Years and over | 732 (32.7%) | 1,262 (33.0%) |
Disability Class: Self-Care Difficulty
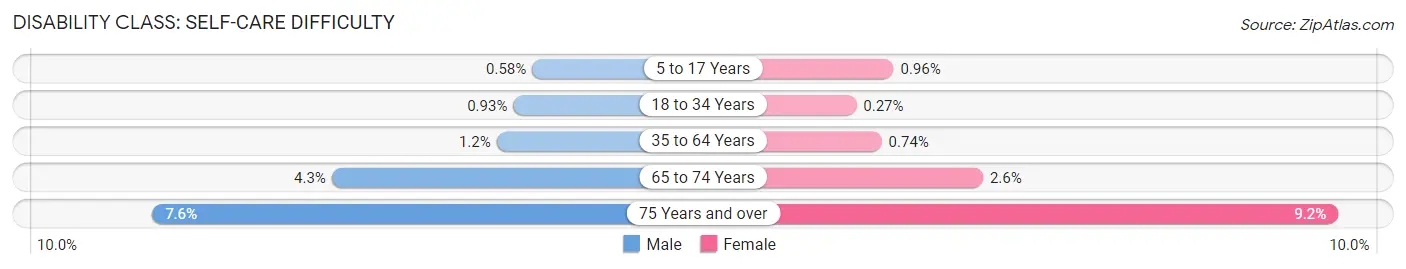
| Age Bracket | Male | Female |
| 5 to 17 Years | 64 (0.6%) | 107 (1.0%) |
| 18 to 34 Years | 149 (0.9%) | 42 (0.3%) |
| 35 to 64 Years | 351 (1.2%) | 221 (0.7%) |
| 65 to 74 Years | 204 (4.3%) | 133 (2.6%) |
| 75 Years and over | 171 (7.6%) | 352 (9.2%) |
Technology Access in Miramar
Computing Device Access in Miramar
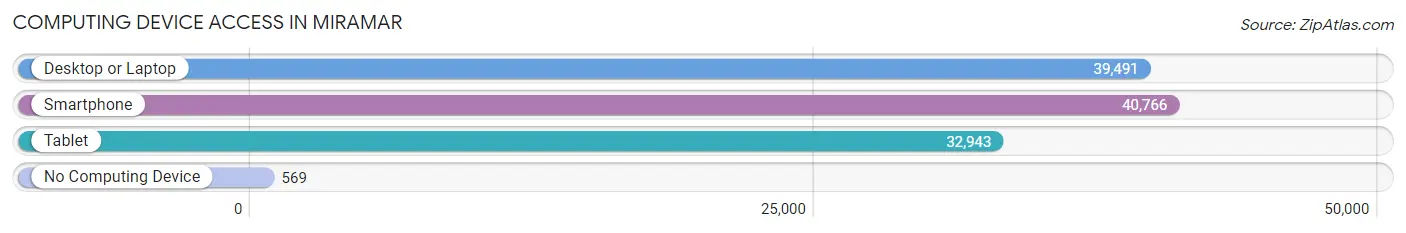
| Device Type | # Households | % Households |
| Desktop or Laptop | 39,491 | 91.8% |
| Smartphone | 40,766 | 94.7% |
| Tablet | 32,943 | 76.5% |
| No Computing Device | 569 | 1.3% |
| Total | 43,038 | 100.0% |
Internet Access in Miramar
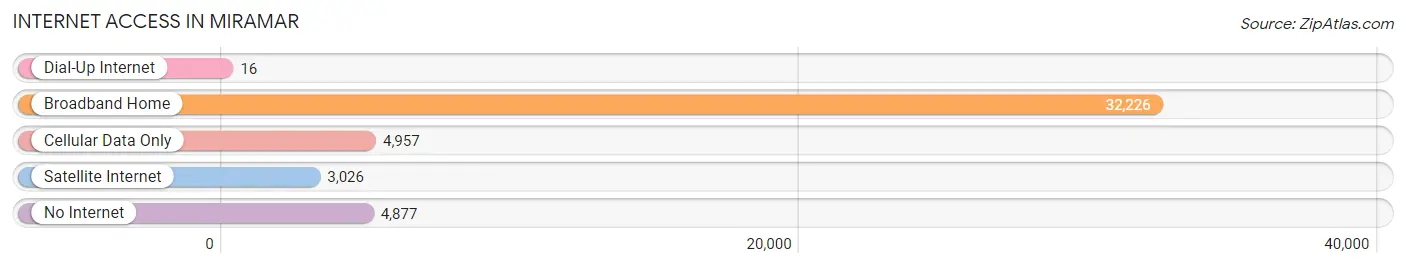
| Internet Type | # Households | % Households |
| Dial-Up Internet | 16 | 0.0% |
| Broadband Home | 32,226 | 74.9% |
| Cellular Data Only | 4,957 | 11.5% |
| Satellite Internet | 3,026 | 7.0% |
| No Internet | 4,877 | 11.3% |
| Total | 43,038 | 100.0% |
Miramar Summary
Miramar, Florida is a city located in Broward County, Florida, United States. It is part of the Miami metropolitan area, which is the most populous metropolitan area in the state of Florida and the eighth-most populous metropolitan area in the United States. As of the 2010 census, the population of Miramar was 122,041, making it the most populous city in Broward County.
Geography
Miramar is located at 26°18'25" North, 80°20'30" West (26.306944, -80.341667). It is bordered by Pembroke Pines to the north, Miami Gardens to the east, Hollywood to the south, and the Everglades to the west. The city covers an area of 31.3 square miles (81 km2).
The city is located in the southeastern portion of the Florida peninsula, and is part of the Miami metropolitan area. The city is located on the Atlantic Coastal Ridge, which is a narrow strip of land that runs along the eastern coast of Florida. The city is located in a region of limestone and sandstone, and is characterized by flat terrain and sandy soils.
Climate
Miramar has a tropical monsoon climate, with hot and humid summers and mild winters. The average annual temperature is 78°F (26°C), and the average annual precipitation is 61.3 inches (155 cm).
Demographics
As of the 2010 census, there were 122,041 people, 40,845 households, and 28,845 families residing in the city. The population density was 3,902.3 people per square mile (1,505.2/km2). There were 44,945 housing units at an average density of 1,433.3 per square mile (553.3/km2). The racial makeup of the city was 44.2% White, 33.3% African American, 0.4% Native American, 8.3% Asian, 0.1% Pacific Islander, 10.2% from other races, and 3.5% from two or more races. Hispanic or Latino of any race were 33.2% of the population.
Economy
Miramar is home to a variety of businesses, including manufacturing, retail, and service industries. The city is home to several major employers, including Memorial Healthcare System, American Express, and the Miami-Dade County Public Schools. The city also has a large number of small businesses, including restaurants, shops, and professional services.
The city's economy is largely driven by tourism, with visitors coming to the city to enjoy its beaches, parks, and other attractions. The city is also home to several major shopping centers, including the Miramar Town Center and the Pembroke Lakes Mall.
Conclusion
Miramar, Florida is a city located in Broward County, Florida, United States. It is part of the Miami metropolitan area, which is the most populous metropolitan area in the state of Florida and the eighth-most populous metropolitan area in the United States. As of the 2010 census, the population of Miramar was 122,041, making it the most populous city in Broward County. The city is located in the southeastern portion of the Florida peninsula, and is part of the Miami metropolitan area. The city has a tropical monsoon climate, with hot and humid summers and mild winters. As of the 2010 census, there were 122,041 people, 40,845 households, and 28,845 families residing in the city. The city's economy is largely driven by tourism, with visitors coming to the city to enjoy its beaches, parks, and other attractions. The city is also home to several major employers, including Memorial Healthcare System, American Express, and the Miami-Dade County Public Schools.
Common Questions
What is Per Capita Income in Miramar?
Per Capita income in Miramar is $35,321.
What is the Median Family Income in Miramar?
Median Family Income in Miramar is $90,967.
What is the Median Household income in Miramar?
Median Household Income in Miramar is $81,812.
What is Income or Wage Gap in Miramar?
Income or Wage Gap in Miramar is 9.9%.
Women in Miramar earn 90.1 cents for every dollar earned by a man.
What is Family Income Deficit in Miramar?
Family Income Deficit in Miramar is $10,684.
Families that are below poverty line in Miramar earn $10,684 less on average than the poverty threshold level.
What is Inequality or Gini Index in Miramar?
Inequality or Gini Index in Miramar is 0.41.
What is the Total Population of Miramar?
Total Population of Miramar is 135,158.
What is the Total Male Population of Miramar?
Total Male Population of Miramar is 65,877.
What is the Total Female Population of Miramar?
Total Female Population of Miramar is 69,281.
What is the Ratio of Males per 100 Females in Miramar?
There are 95.09 Males per 100 Females in Miramar.
What is the Ratio of Females per 100 Males in Miramar?
There are 105.17 Females per 100 Males in Miramar.
What is the Median Population Age in Miramar?
Median Population Age in Miramar is 38.8 Years.
What is the Average Family Size in Miramar
Average Family Size in Miramar is 3.5 People.
What is the Average Household Size in Miramar
Average Household Size in Miramar is 3.1 People.
How Large is the Labor Force in Miramar?
There are 77,836 People in the Labor Forcein in Miramar.
What is the Percentage of People in the Labor Force in Miramar?
72.0% of People are in the Labor Force in Miramar.
What is the Unemployment Rate in Miramar?
Unemployment Rate in Miramar is 4.2%.