Doral, FL Map & Demographics
Doral Map
Doral Overview
$35,751
PER CAPITA INCOME
$84,476
AVG FAMILY INCOME
$83,823
AVG HOUSEHOLD INCOME
33.6%
WAGE / INCOME GAP [ % ]
66.4¢/ $1
WAGE / INCOME GAP [ $ ]
$11,504
FAMILY INCOME DEFICIT
0.44
INEQUALITY / GINI INDEX
74,891
TOTAL POPULATION
37,174
MALE POPULATION
37,717
FEMALE POPULATION
98.56
MALES / 100 FEMALES
101.46
FEMALES / 100 MALES
36.8
MEDIAN AGE
3.4
AVG FAMILY SIZE
3.1
AVG HOUSEHOLD SIZE
40,290
LABOR FORCE [ PEOPLE ]
69.0%
PERCENT IN LABOR FORCE
3.1%
UNEMPLOYMENT RATE
Income in Doral
Income Overview in Doral
Per Capita Income in Doral is $35,751, while median incomes of families and households are $84,476 and $83,823 respectively.
| Characteristic | Number | Measure |
| Per Capita Income | 74,891 | $35,751 |
| Median Family Income | 19,640 | $84,476 |
| Mean Family Income | 19,640 | $111,295 |
| Median Household Income | 24,247 | $83,823 |
| Mean Household Income | 24,247 | $108,122 |
| Income Deficit | 19,640 | $11,504 |
| Wage / Income Gap (%) | 74,891 | 33.59% |
| Wage / Income Gap ($) | 74,891 | 66.41¢ per $1 |
| Gini / Inequality Index | 74,891 | 0.44 |
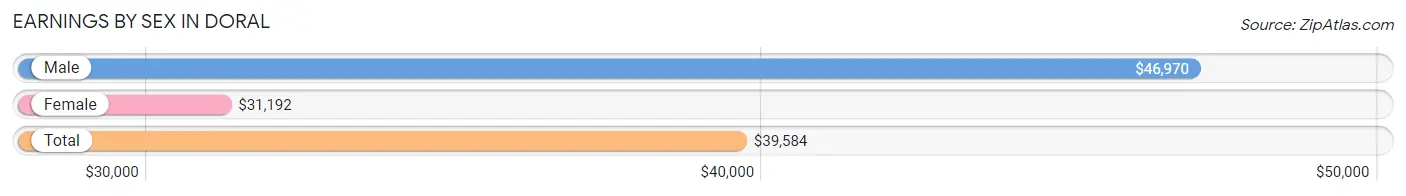
Earnings by Sex in Doral
Average Earnings in Doral are $39,584, $46,970 for men and $31,192 for women, a difference of 33.6%.
| Sex | Number | Average Earnings |
| Male | 22,903 (55.9%) | $46,970 |
| Female | 18,091 (44.1%) | $31,192 |
| Total | 40,994 (100.0%) | $39,584 |
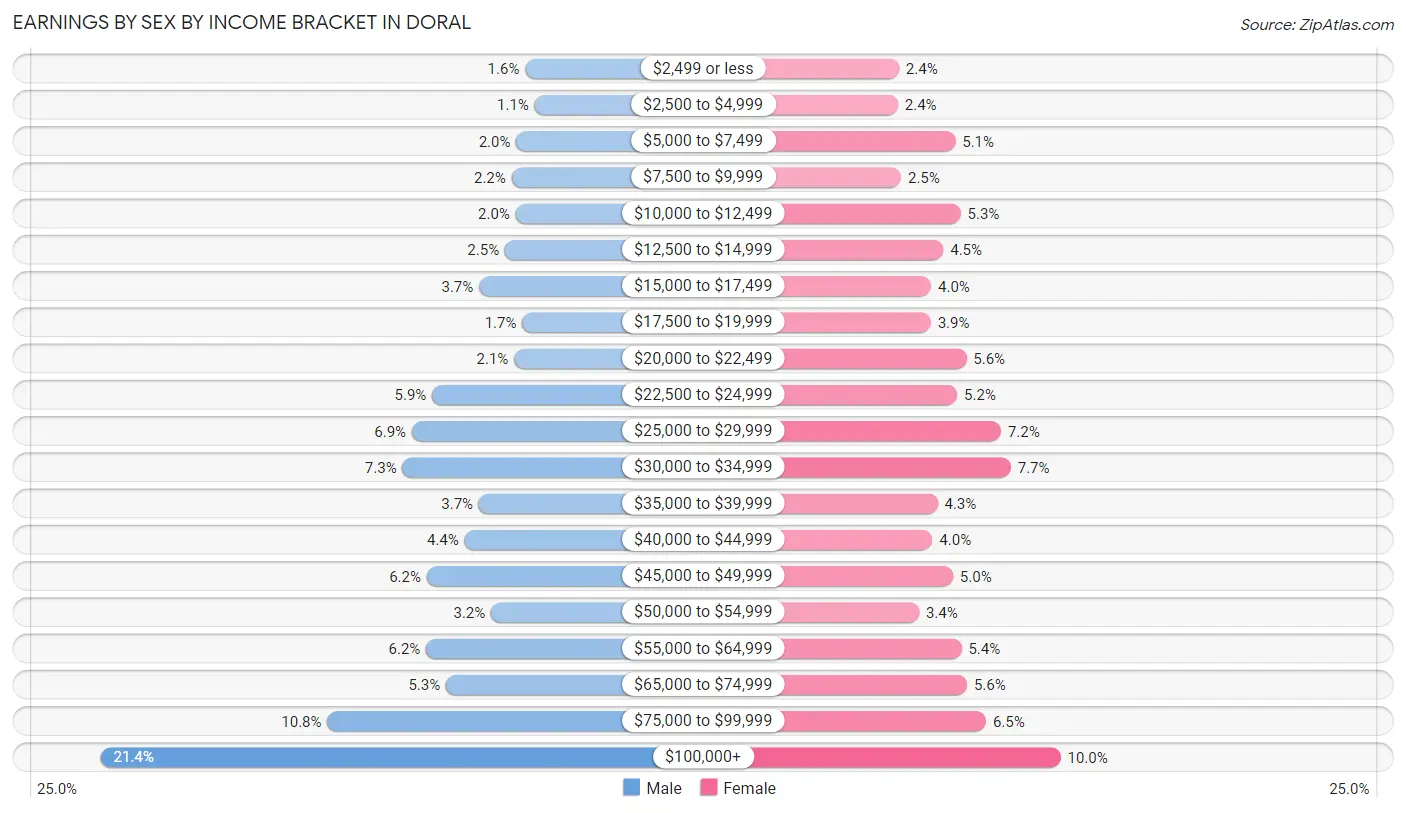
Earnings by Sex by Income Bracket in Doral
The most common earnings brackets in Doral are $100,000+ for men (4,910 | 21.4%) and $100,000+ for women (1,811 | 10.0%).
| Income | Male | Female |
| $2,499 or less | 355 (1.5%) | 442 (2.4%) |
| $2,500 to $4,999 | 255 (1.1%) | 432 (2.4%) |
| $5,000 to $7,499 | 452 (2.0%) | 919 (5.1%) |
| $7,500 to $9,999 | 502 (2.2%) | 460 (2.5%) |
| $10,000 to $12,499 | 457 (2.0%) | 965 (5.3%) |
| $12,500 to $14,999 | 573 (2.5%) | 817 (4.5%) |
| $15,000 to $17,499 | 849 (3.7%) | 715 (4.0%) |
| $17,500 to $19,999 | 388 (1.7%) | 711 (3.9%) |
| $20,000 to $22,499 | 474 (2.1%) | 1,014 (5.6%) |
| $22,500 to $24,999 | 1,353 (5.9%) | 935 (5.2%) |
| $25,000 to $29,999 | 1,571 (6.9%) | 1,306 (7.2%) |
| $30,000 to $34,999 | 1,673 (7.3%) | 1,389 (7.7%) |
| $35,000 to $39,999 | 851 (3.7%) | 769 (4.3%) |
| $40,000 to $44,999 | 1,006 (4.4%) | 725 (4.0%) |
| $45,000 to $49,999 | 1,411 (6.2%) | 899 (5.0%) |
| $50,000 to $54,999 | 722 (3.2%) | 612 (3.4%) |
| $55,000 to $64,999 | 1,418 (6.2%) | 972 (5.4%) |
| $65,000 to $74,999 | 1,204 (5.3%) | 1,019 (5.6%) |
| $75,000 to $99,999 | 2,479 (10.8%) | 1,179 (6.5%) |
| $100,000+ | 4,910 (21.4%) | 1,811 (10.0%) |
| Total | 22,903 (100.0%) | 18,091 (100.0%) |
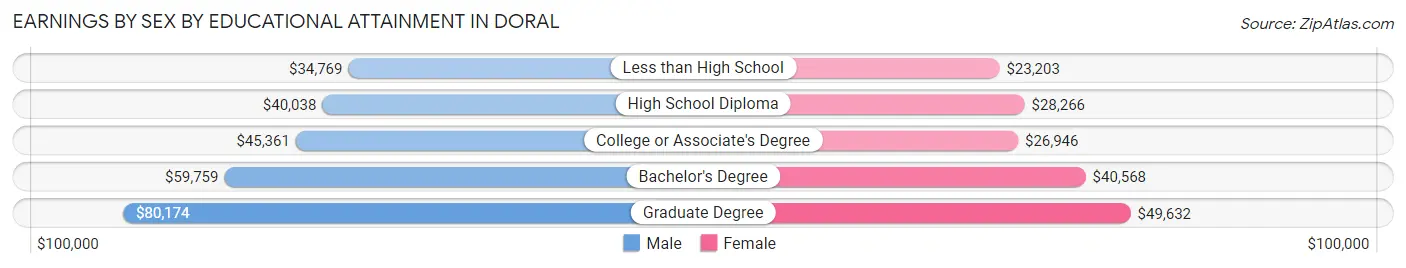
Earnings by Sex by Educational Attainment in Doral
Average earnings in Doral are $52,207 for men and $33,581 for women, a difference of 35.7%. Men with an educational attainment of graduate degree enjoy the highest average annual earnings of $80,174, while those with less than high school education earn the least with $34,769. Women with an educational attainment of graduate degree earn the most with the average annual earnings of $49,632, while those with less than high school education have the smallest earnings of $23,203.
| Educational Attainment | Male Income | Female Income |
| Less than High School | $34,769 | $23,203 |
| High School Diploma | $40,038 | $28,266 |
| College or Associate's Degree | $45,361 | $26,946 |
| Bachelor's Degree | $59,759 | $40,568 |
| Graduate Degree | $80,174 | $49,632 |
| Total | $52,207 | $33,581 |
Family Income in Doral
Family Income Brackets in Doral
According to the Doral family income data, there are 3,751 families falling into the $50,000 to $74,999 income range, which is the most common income bracket and makes up 19.1% of all families. Conversely, the $10,000 to $14,999 income bracket is the least frequent group with only 373 families (1.9%) belonging to this category.
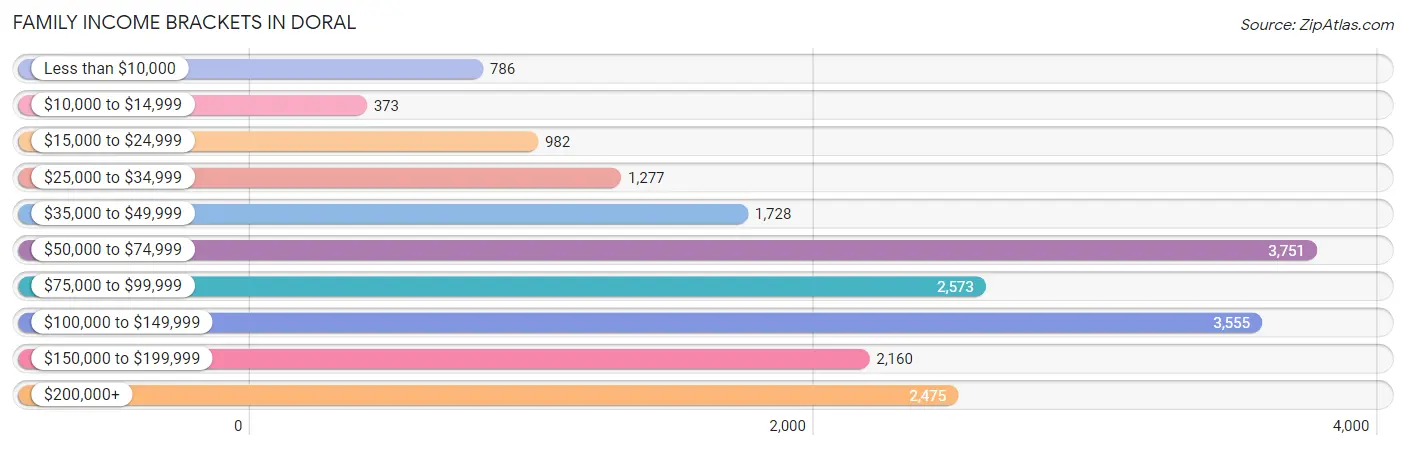
| Income Bracket | # Families | % Families |
| Less than $10,000 | 786 | 4.0% |
| $10,000 to $14,999 | 373 | 1.9% |
| $15,000 to $24,999 | 982 | 5.0% |
| $25,000 to $34,999 | 1,277 | 6.5% |
| $35,000 to $49,999 | 1,728 | 8.8% |
| $50,000 to $74,999 | 3,751 | 19.1% |
| $75,000 to $99,999 | 2,573 | 13.1% |
| $100,000 to $149,999 | 3,555 | 18.1% |
| $150,000 to $199,999 | 2,160 | 11.0% |
| $200,000+ | 2,475 | 12.6% |
Family Income by Famaliy Size in Doral
7+ person families (139 | 0.7%) account for the highest median family income in Doral with $140,733 per family, while 2-person families (6,096 | 31.0%) have the highest median income of $33,148 per family member.
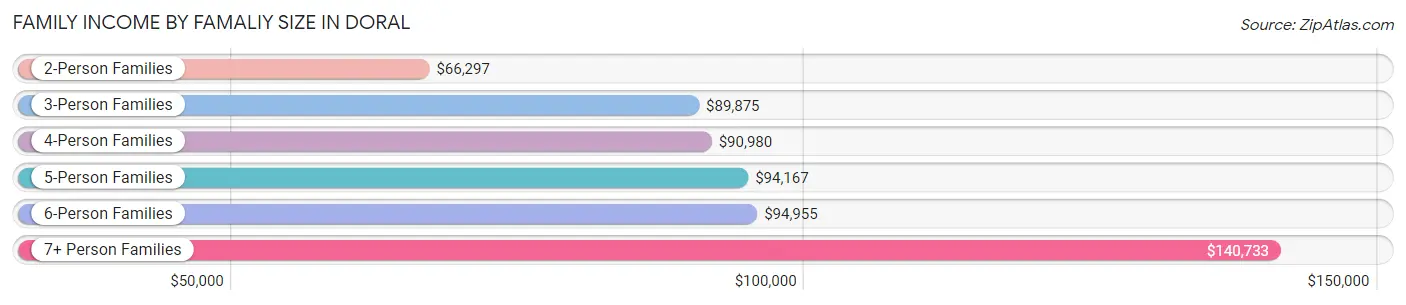
| Income Bracket | # Families | Median Income |
| 2-Person Families | 6,096 (31.0%) | $66,297 |
| 3-Person Families | 5,116 (26.1%) | $89,875 |
| 4-Person Families | 5,778 (29.4%) | $90,980 |
| 5-Person Families | 2,024 (10.3%) | $94,167 |
| 6-Person Families | 487 (2.5%) | $94,955 |
| 7+ Person Families | 139 (0.7%) | $140,733 |
| Total | 19,640 (100.0%) | $84,476 |
Family Income by Number of Earners in Doral
The median family income in Doral is $84,476, with families comprising 2 earners (9,495) having the highest median family income of $102,185, while families with no earners (1,667) have the lowest median family income of $21,646, accounting for 48.3% and 8.5% of families, respectively.
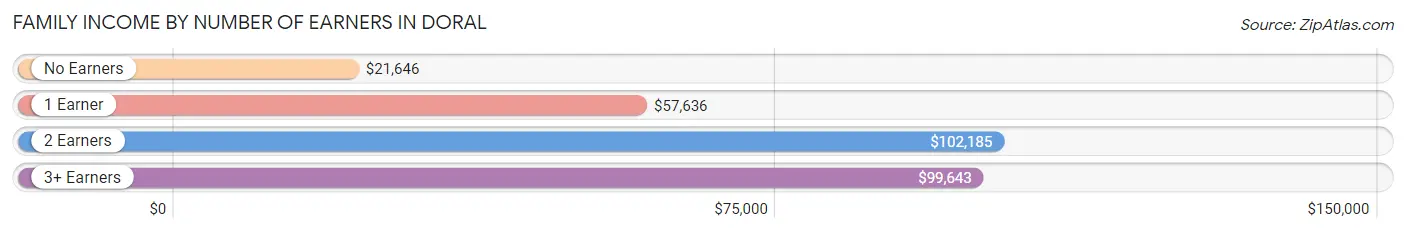
| Number of Earners | # Families | Median Income |
| No Earners | 1,667 (8.5%) | $21,646 |
| 1 Earner | 5,692 (29.0%) | $57,636 |
| 2 Earners | 9,495 (48.3%) | $102,185 |
| 3+ Earners | 2,786 (14.2%) | $99,643 |
| Total | 19,640 (100.0%) | $84,476 |
Household Income in Doral
Household Income Brackets in Doral
With 4,486 households falling in the category, the $100,000 to $149,999 income range is the most frequent in Doral, accounting for 18.5% of all households. In contrast, only 509 households (2.1%) fall into the $10,000 to $14,999 income bracket, making it the least populous group.
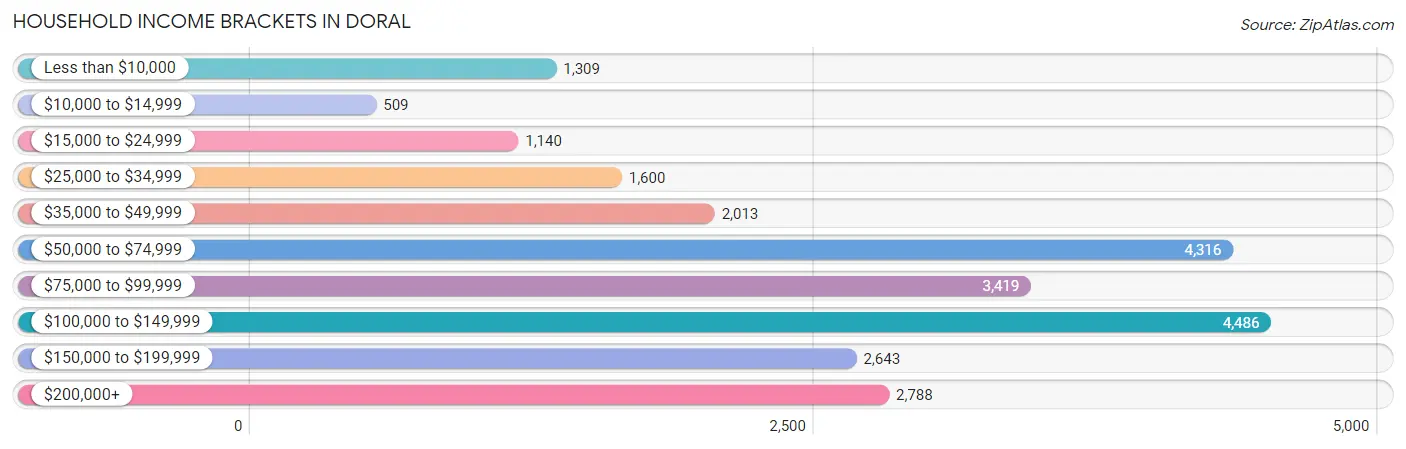
| Income Bracket | # Households | % Households |
| Less than $10,000 | 1,309 | 5.4% |
| $10,000 to $14,999 | 509 | 2.1% |
| $15,000 to $24,999 | 1,140 | 4.7% |
| $25,000 to $34,999 | 1,600 | 6.6% |
| $35,000 to $49,999 | 2,013 | 8.3% |
| $50,000 to $74,999 | 4,316 | 17.8% |
| $75,000 to $99,999 | 3,419 | 14.1% |
| $100,000 to $149,999 | 4,486 | 18.5% |
| $150,000 to $199,999 | 2,643 | 10.9% |
| $200,000+ | 2,788 | 11.5% |
Household Income by Householder Age in Doral
The median household income in Doral is $83,823, with the highest median household income of $99,616 found in the 45 to 64 years age bracket for the primary householder. A total of 10,456 households (43.1%) fall into this category. Meanwhile, the 15 to 24 years age bracket for the primary householder has the lowest median household income of $48,750, with 780 households (3.2%) in this group.
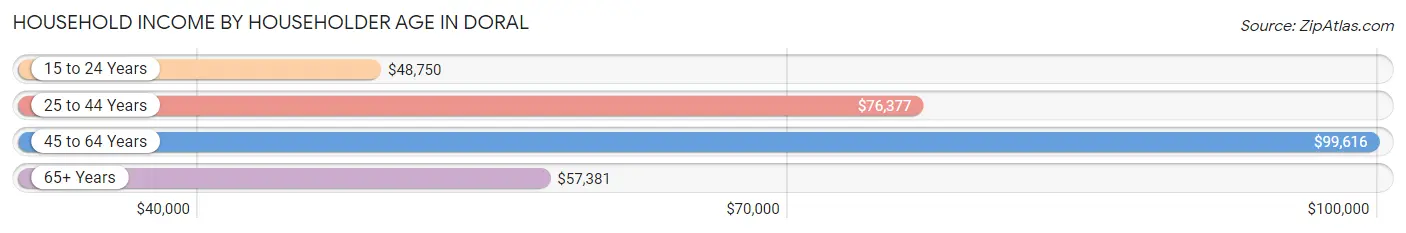
| Income Bracket | # Households | Median Income |
| 15 to 24 Years | 780 (3.2%) | $48,750 |
| 25 to 44 Years | 10,407 (42.9%) | $76,377 |
| 45 to 64 Years | 10,456 (43.1%) | $99,616 |
| 65+ Years | 2,604 (10.7%) | $57,381 |
| Total | 24,247 (100.0%) | $83,823 |
Poverty in Doral
Income Below Poverty by Sex and Age in Doral
With 8.3% poverty level for males and 13.2% for females among the residents of Doral, under 5 year old males and 16 and 17 year old females are the most vulnerable to poverty, with 253 males (14.4%) and 271 females (20.0%) in their respective age groups living below the poverty level.
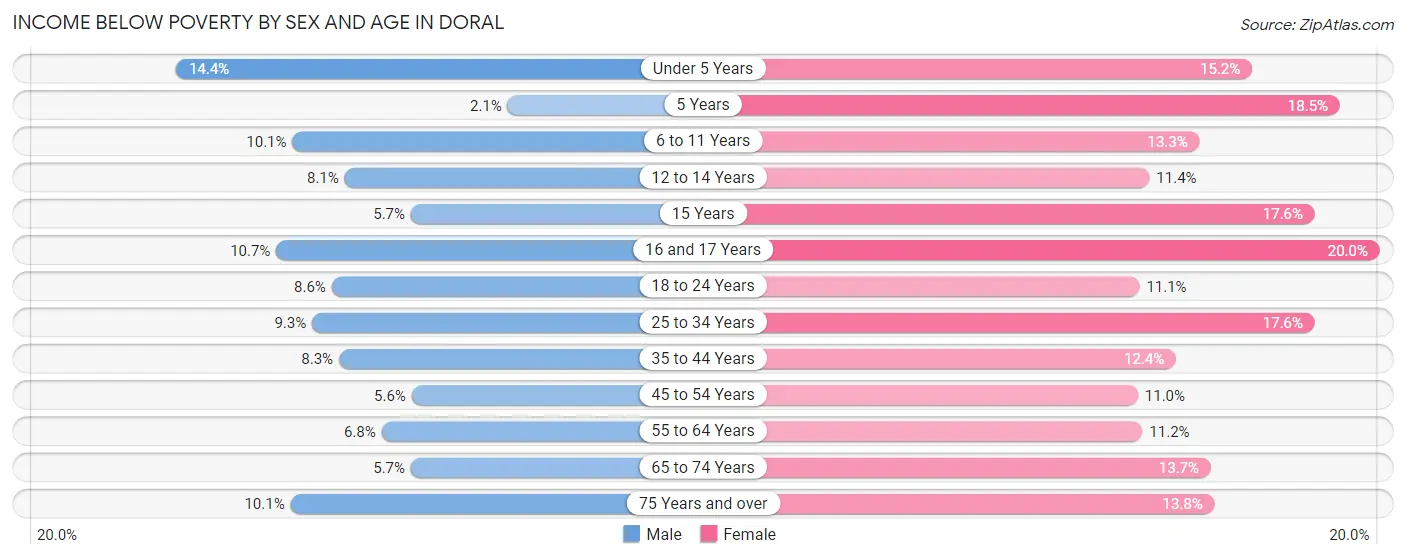
| Age Bracket | Male | Female |
| Under 5 Years | 253 (14.4%) | 337 (15.2%) |
| 5 Years | 7 (2.1%) | 54 (18.5%) |
| 6 to 11 Years | 393 (10.1%) | 466 (13.3%) |
| 12 to 14 Years | 114 (8.1%) | 230 (11.4%) |
| 15 Years | 27 (5.7%) | 62 (17.6%) |
| 16 and 17 Years | 123 (10.7%) | 271 (20.0%) |
| 18 to 24 Years | 336 (8.6%) | 337 (11.1%) |
| 25 to 34 Years | 490 (9.3%) | 760 (17.6%) |
| 35 to 44 Years | 496 (8.3%) | 892 (12.4%) |
| 45 to 54 Years | 380 (5.6%) | 692 (11.0%) |
| 55 to 64 Years | 250 (6.8%) | 381 (11.2%) |
| 65 to 74 Years | 73 (5.7%) | 317 (13.7%) |
| 75 Years and over | 111 (10.1%) | 184 (13.8%) |
| Total | 3,053 (8.3%) | 4,983 (13.2%) |
Income Above Poverty by Sex and Age in Doral
According to the poverty statistics in Doral, males aged 5 years and females aged 45 to 54 years are the age groups that are most secure financially, with 97.9% of males and 89.0% of females in these age groups living above the poverty line.
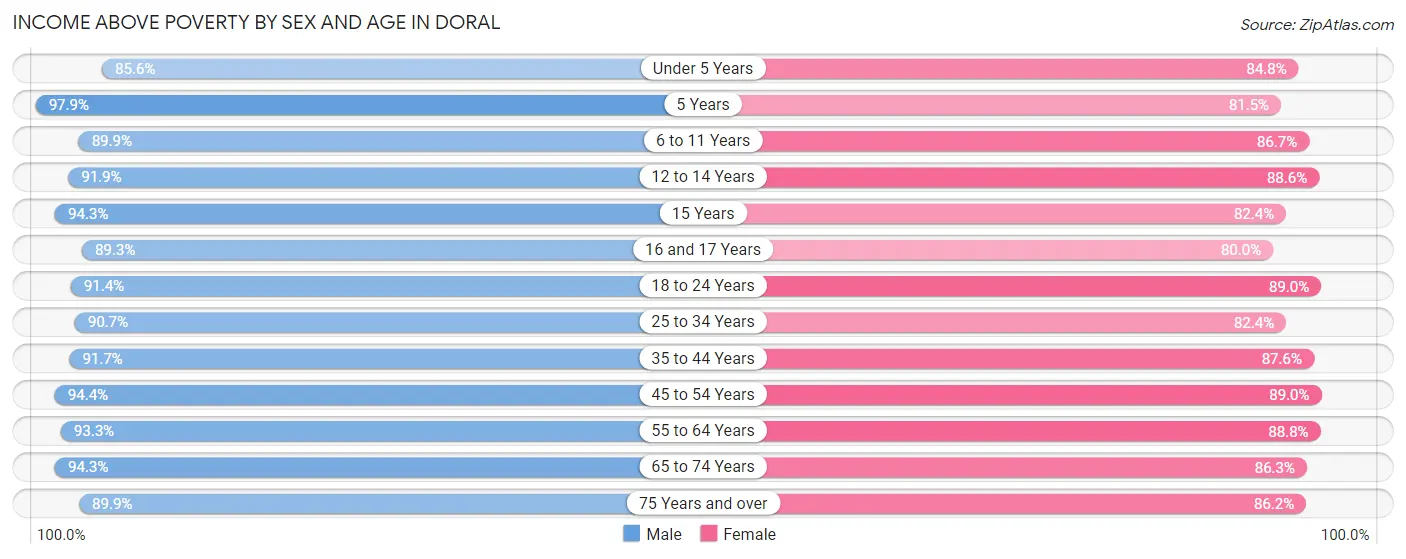
| Age Bracket | Male | Female |
| Under 5 Years | 1,507 (85.6%) | 1,876 (84.8%) |
| 5 Years | 331 (97.9%) | 238 (81.5%) |
| 6 to 11 Years | 3,512 (89.9%) | 3,042 (86.7%) |
| 12 to 14 Years | 1,290 (91.9%) | 1,784 (88.6%) |
| 15 Years | 450 (94.3%) | 291 (82.4%) |
| 16 and 17 Years | 1,031 (89.3%) | 1,086 (80.0%) |
| 18 to 24 Years | 3,571 (91.4%) | 2,712 (88.9%) |
| 25 to 34 Years | 4,764 (90.7%) | 3,569 (82.4%) |
| 35 to 44 Years | 5,461 (91.7%) | 6,296 (87.6%) |
| 45 to 54 Years | 6,370 (94.4%) | 5,605 (89.0%) |
| 55 to 64 Years | 3,456 (93.2%) | 3,033 (88.8%) |
| 65 to 74 Years | 1,217 (94.3%) | 1,997 (86.3%) |
| 75 Years and over | 985 (89.9%) | 1,145 (86.2%) |
| Total | 33,945 (91.7%) | 32,674 (86.8%) |
Income Below Poverty Among Married-Couple Families in Doral
The poverty statistics for married-couple families in Doral show that 6.8% or 998 of the total 14,585 families live below the poverty line. Families with 3 or 4 children have the highest poverty rate of 17.2%, comprising of 151 families. On the other hand, families with 5 or more children have the lowest poverty rate of 0.0%, which includes 0 families.
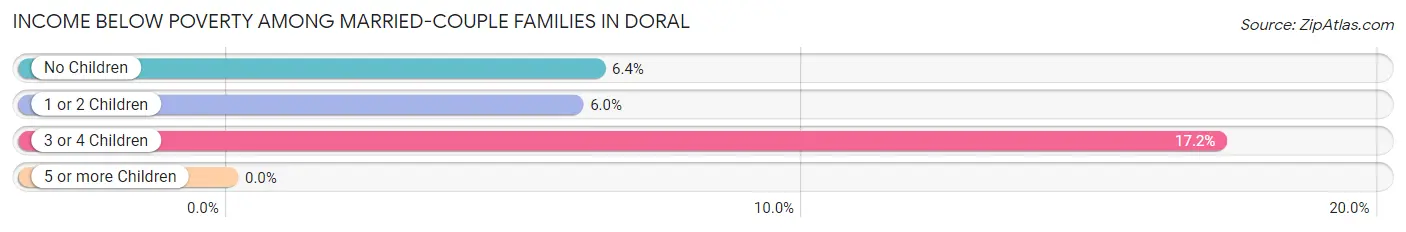
| Children | Above Poverty | Below Poverty |
| No Children | 5,805 (93.6%) | 396 (6.4%) |
| 1 or 2 Children | 7,052 (94.0%) | 451 (6.0%) |
| 3 or 4 Children | 726 (82.8%) | 151 (17.2%) |
| 5 or more Children | 4 (100.0%) | 0 (0.0%) |
| Total | 13,587 (93.2%) | 998 (6.8%) |
Income Below Poverty Among Single-Parent Households in Doral
According to the poverty data in Doral, 13.2% or 236 single-father households and 20.6% or 673 single-mother households are living below the poverty line. Among single-father households, those with 1 or 2 children have the highest poverty rate, with 150 households (24.4%) experiencing poverty. Likewise, among single-mother households, those with 3 or 4 children have the highest poverty rate, with 63 households (40.9%) falling below the poverty line.
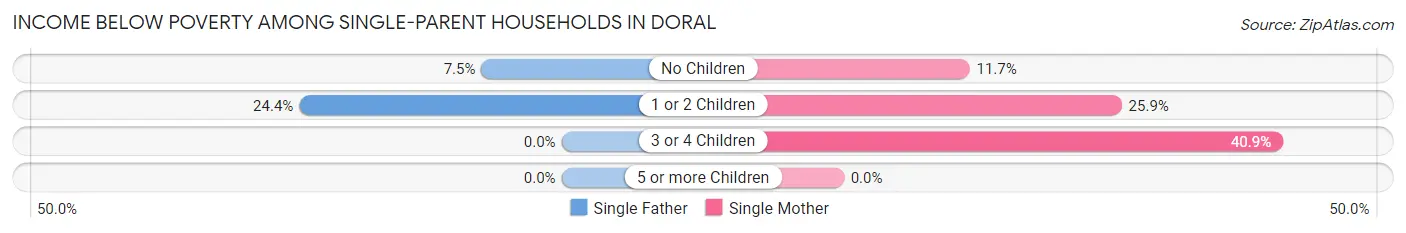
| Children | Single Father | Single Mother |
| No Children | 86 (7.5%) | 161 (11.7%) |
| 1 or 2 Children | 150 (24.4%) | 449 (25.9%) |
| 3 or 4 Children | 0 (0.0%) | 63 (40.9%) |
| 5 or more Children | 0 (0.0%) | 0 (0.0%) |
| Total | 236 (13.2%) | 673 (20.6%) |
Income Below Poverty Among Married-Couple vs Single-Parent Households in Doral
The poverty data for Doral shows that 998 of the married-couple family households (6.8%) and 909 of the single-parent households (18.0%) are living below the poverty level. Within the married-couple family households, those with 3 or 4 children have the highest poverty rate, with 151 households (17.2%) falling below the poverty line. Among the single-parent households, those with 3 or 4 children have the highest poverty rate, with 63 household (34.6%) living below poverty.
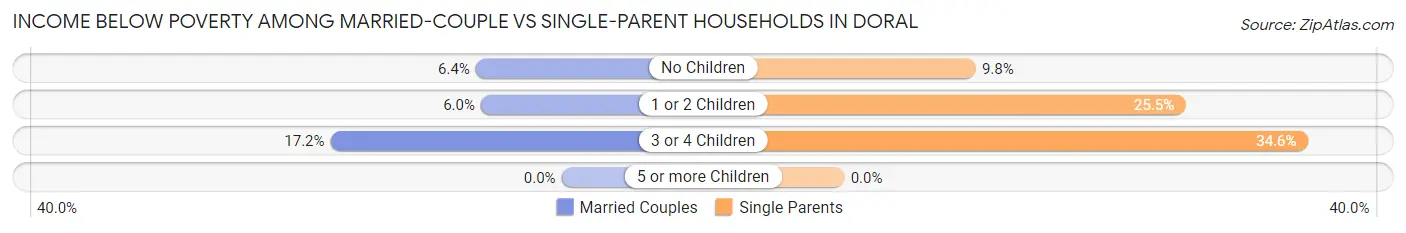
| Children | Married-Couple Families | Single-Parent Households |
| No Children | 396 (6.4%) | 247 (9.8%) |
| 1 or 2 Children | 451 (6.0%) | 599 (25.5%) |
| 3 or 4 Children | 151 (17.2%) | 63 (34.6%) |
| 5 or more Children | 0 (0.0%) | 0 (0.0%) |
| Total | 998 (6.8%) | 909 (18.0%) |
Race in Doral
The most populous races in Doral are Hispanic or Latino (63,018 | 84.2%), White / Caucasian (48,450 | 64.7%), and Two or more Races (18,316 | 24.5%).
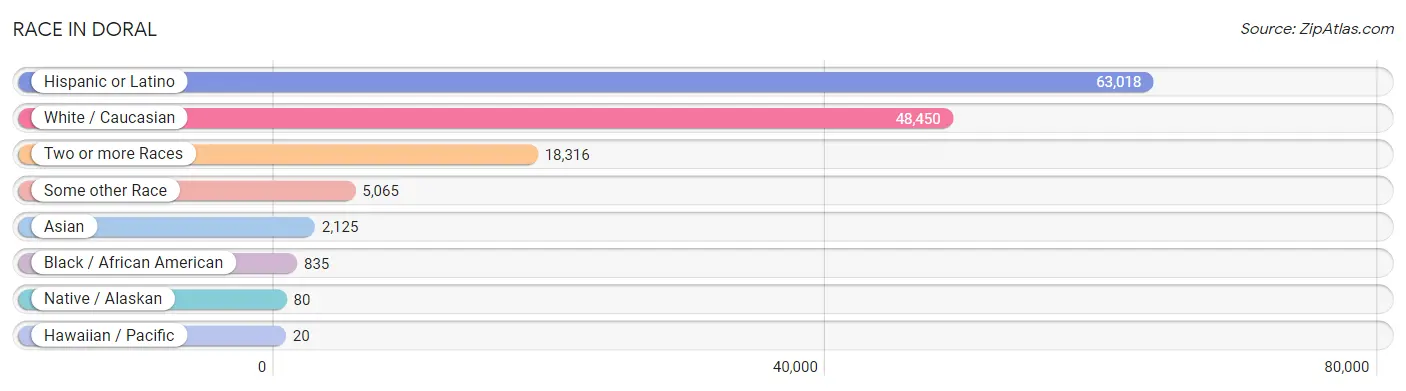
| Race | # Population | % Population |
| Asian | 2,125 | 2.8% |
| Black / African American | 835 | 1.1% |
| Hawaiian / Pacific | 20 | 0.0% |
| Hispanic or Latino | 63,018 | 84.2% |
| Native / Alaskan | 80 | 0.1% |
| White / Caucasian | 48,450 | 64.7% |
| Two or more Races | 18,316 | 24.5% |
| Some other Race | 5,065 | 6.8% |
| Total | 74,891 | 100.0% |
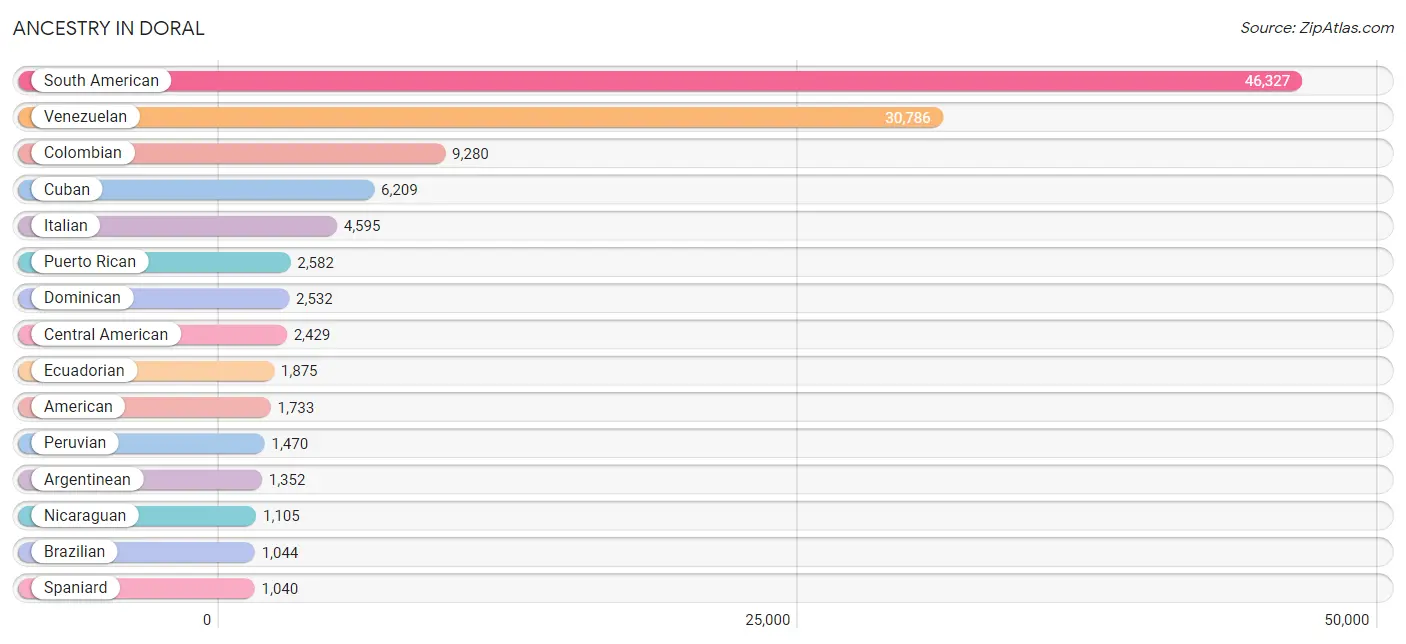
Ancestry in Doral
The most populous ancestries reported in Doral are South American (46,327 | 61.9%), Venezuelan (30,786 | 41.1%), Colombian (9,280 | 12.4%), Cuban (6,209 | 8.3%), and Italian (4,595 | 6.1%), together accounting for 129.8% of all Doral residents.
| Ancestry | # Population | % Population |
| African | 194 | 0.3% |
| American | 1,733 | 2.3% |
| Arab | 797 | 1.1% |
| Argentinean | 1,352 | 1.8% |
| Armenian | 148 | 0.2% |
| Austrian | 157 | 0.2% |
| Barbadian | 19 | 0.0% |
| Basque | 25 | 0.0% |
| Bhutanese | 386 | 0.5% |
| Bolivian | 523 | 0.7% |
| Brazilian | 1,044 | 1.4% |
| British | 138 | 0.2% |
| Bulgarian | 47 | 0.1% |
| Burmese | 225 | 0.3% |
| Canadian | 68 | 0.1% |
| Central American | 2,429 | 3.2% |
| Central American Indian | 21 | 0.0% |
| Cherokee | 7 | 0.0% |
| Chilean | 641 | 0.9% |
| Colombian | 9,280 | 12.4% |
| Costa Rican | 149 | 0.2% |
| Croatian | 34 | 0.1% |
| Cuban | 6,209 | 8.3% |
| Czech | 48 | 0.1% |
| Danish | 25 | 0.0% |
| Dominican | 2,532 | 3.4% |
| Dutch | 194 | 0.3% |
| Dutch West Indian | 11 | 0.0% |
| Eastern European | 82 | 0.1% |
| Ecuadorian | 1,875 | 2.5% |
| Egyptian | 28 | 0.0% |
| English | 270 | 0.4% |
| European | 493 | 0.7% |
| Filipino | 49 | 0.1% |
| Finnish | 17 | 0.0% |
| French | 453 | 0.6% |
| German | 928 | 1.2% |
| Ghanaian | 105 | 0.1% |
| Greek | 238 | 0.3% |
| Guatemalan | 128 | 0.2% |
| Guyanese | 21 | 0.0% |
| Haitian | 88 | 0.1% |
| Honduran | 415 | 0.5% |
| Hungarian | 94 | 0.1% |
| Indian (Asian) | 487 | 0.6% |
| Inupiat | 6 | 0.0% |
| Iranian | 156 | 0.2% |
| Irish | 397 | 0.5% |
| Israeli | 73 | 0.1% |
| Italian | 4,595 | 6.1% |
| Jamaican | 89 | 0.1% |
| Korean | 194 | 0.3% |
| Laotian | 23 | 0.0% |
| Lebanese | 400 | 0.5% |
| Macedonian | 8 | 0.0% |
| Mexican | 1,019 | 1.4% |
| Native Hawaiian | 41 | 0.1% |
| Nicaraguan | 1,105 | 1.5% |
| Norwegian | 38 | 0.1% |
| Pakistani | 118 | 0.2% |
| Palestinian | 32 | 0.0% |
| Panamanian | 379 | 0.5% |
| Paraguayan | 156 | 0.2% |
| Peruvian | 1,470 | 2.0% |
| Polish | 231 | 0.3% |
| Portuguese | 684 | 0.9% |
| Puerto Rican | 2,582 | 3.5% |
| Romanian | 59 | 0.1% |
| Russian | 222 | 0.3% |
| Salvadoran | 253 | 0.3% |
| Scotch-Irish | 35 | 0.1% |
| Scottish | 45 | 0.1% |
| Slovak | 10 | 0.0% |
| South American | 46,327 | 61.9% |
| South American Indian | 173 | 0.2% |
| Spaniard | 1,040 | 1.4% |
| Spanish | 167 | 0.2% |
| Sri Lankan | 27 | 0.0% |
| Subsaharan African | 299 | 0.4% |
| Swedish | 65 | 0.1% |
| Swiss | 33 | 0.0% |
| Syrian | 145 | 0.2% |
| Thai | 941 | 1.3% |
| Turkish | 93 | 0.1% |
| Ukrainian | 33 | 0.0% |
| Uruguayan | 244 | 0.3% |
| Venezuelan | 30,786 | 41.1% |
| Vietnamese | 13 | 0.0% |
| Welsh | 15 | 0.0% | View All 89 Rows |
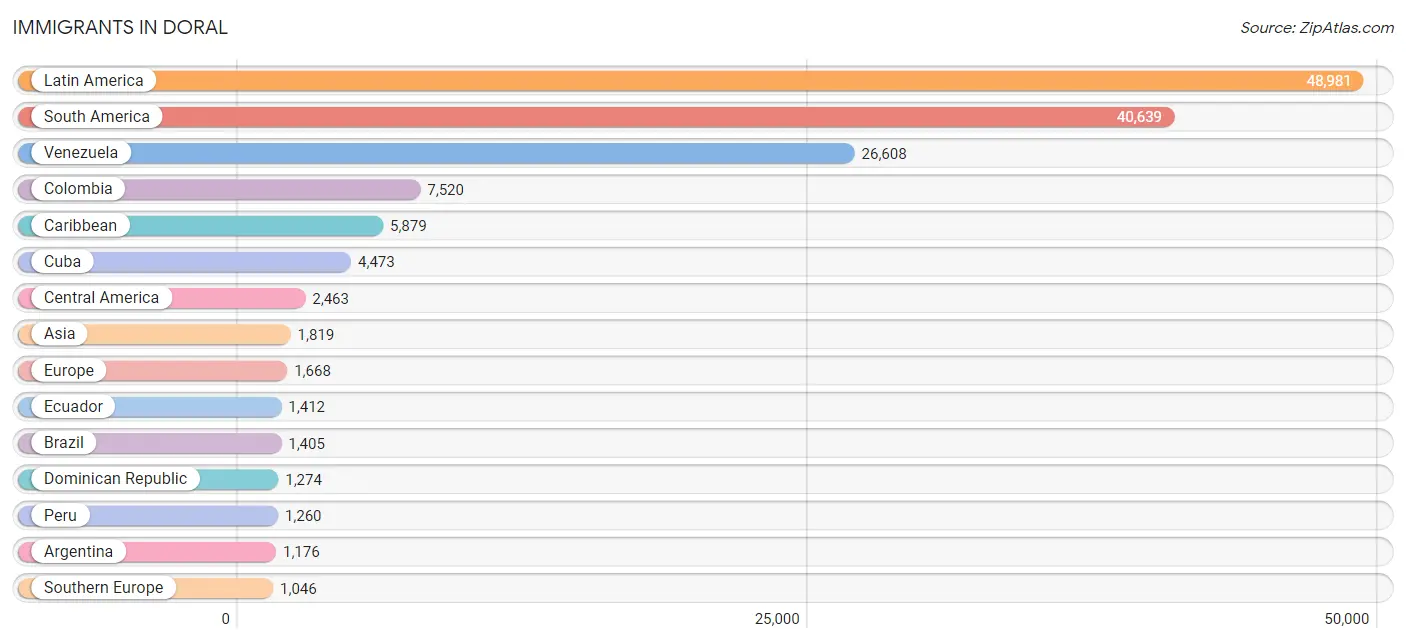
Immigrants in Doral
The most numerous immigrant groups reported in Doral came from Latin America (48,981 | 65.4%), South America (40,639 | 54.3%), Venezuela (26,608 | 35.5%), Colombia (7,520 | 10.0%), and Caribbean (5,879 | 7.9%), together accounting for 173.1% of all Doral residents.
| Immigration Origin | # Population | % Population |
| Africa | 148 | 0.2% |
| Argentina | 1,176 | 1.6% |
| Asia | 1,819 | 2.4% |
| Austria | 11 | 0.0% |
| Bangladesh | 13 | 0.0% |
| Barbados | 19 | 0.0% |
| Belize | 8 | 0.0% |
| Bolivia | 321 | 0.4% |
| Brazil | 1,405 | 1.9% |
| Bulgaria | 14 | 0.0% |
| Canada | 126 | 0.2% |
| Caribbean | 5,879 | 7.9% |
| Central America | 2,463 | 3.3% |
| Chile | 587 | 0.8% |
| China | 239 | 0.3% |
| Colombia | 7,520 | 10.0% |
| Costa Rica | 149 | 0.2% |
| Croatia | 19 | 0.0% |
| Cuba | 4,473 | 6.0% |
| Czechoslovakia | 15 | 0.0% |
| Denmark | 8 | 0.0% |
| Dominican Republic | 1,274 | 1.7% |
| Eastern Africa | 26 | 0.0% |
| Eastern Asia | 626 | 0.8% |
| Eastern Europe | 204 | 0.3% |
| Ecuador | 1,412 | 1.9% |
| Egypt | 41 | 0.1% |
| El Salvador | 237 | 0.3% |
| England | 12 | 0.0% |
| Europe | 1,668 | 2.2% |
| France | 243 | 0.3% |
| Germany | 33 | 0.0% |
| Greece | 15 | 0.0% |
| Guatemala | 111 | 0.2% |
| Haiti | 50 | 0.1% |
| Honduras | 315 | 0.4% |
| Hong Kong | 46 | 0.1% |
| India | 586 | 0.8% |
| Ireland | 22 | 0.0% |
| Israel | 42 | 0.1% |
| Italy | 317 | 0.4% |
| Jamaica | 38 | 0.1% |
| Japan | 246 | 0.3% |
| Jordan | 4 | 0.0% |
| Korea | 141 | 0.2% |
| Kuwait | 47 | 0.1% |
| Latin America | 48,981 | 65.4% |
| Lebanon | 98 | 0.1% |
| Mexico | 698 | 0.9% |
| Middle Africa | 9 | 0.0% |
| Morocco | 68 | 0.1% |
| Netherlands | 65 | 0.1% |
| Nicaragua | 568 | 0.8% |
| Northern Africa | 113 | 0.2% |
| Northern Europe | 66 | 0.1% |
| Pakistan | 42 | 0.1% |
| Panama | 377 | 0.5% |
| Peru | 1,260 | 1.7% |
| Philippines | 97 | 0.1% |
| Poland | 63 | 0.1% |
| Portugal | 111 | 0.2% |
| Romania | 51 | 0.1% |
| Russia | 36 | 0.1% |
| South America | 40,639 | 54.3% |
| South Central Asia | 641 | 0.9% |
| South Eastern Asia | 279 | 0.4% |
| Southern Europe | 1,046 | 1.4% |
| Spain | 603 | 0.8% |
| Sweden | 14 | 0.0% |
| Syria | 25 | 0.0% |
| Taiwan | 104 | 0.1% |
| Thailand | 127 | 0.2% |
| Trinidad and Tobago | 25 | 0.0% |
| Turkey | 53 | 0.1% |
| Uruguay | 223 | 0.3% |
| Venezuela | 26,608 | 35.5% |
| Vietnam | 27 | 0.0% |
| Western Asia | 269 | 0.4% |
| Western Europe | 352 | 0.5% | View All 79 Rows |
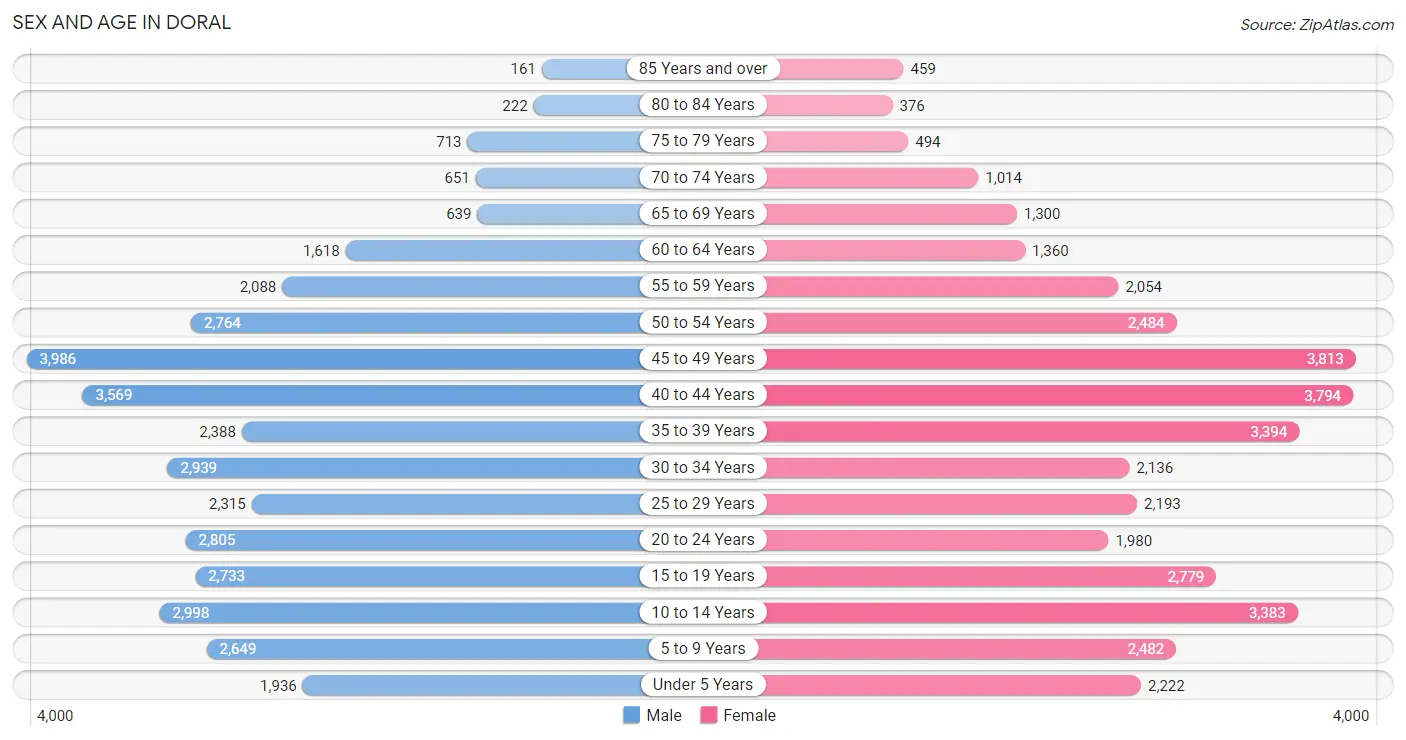
Sex and Age in Doral
Sex and Age in Doral
The most populous age groups in Doral are 45 to 49 Years (3,986 | 10.7%) for men and 45 to 49 Years (3,813 | 10.1%) for women.
| Age Bracket | Male | Female |
| Under 5 Years | 1,936 (5.2%) | 2,222 (5.9%) |
| 5 to 9 Years | 2,649 (7.1%) | 2,482 (6.6%) |
| 10 to 14 Years | 2,998 (8.1%) | 3,383 (9.0%) |
| 15 to 19 Years | 2,733 (7.3%) | 2,779 (7.4%) |
| 20 to 24 Years | 2,805 (7.5%) | 1,980 (5.2%) |
| 25 to 29 Years | 2,315 (6.2%) | 2,193 (5.8%) |
| 30 to 34 Years | 2,939 (7.9%) | 2,136 (5.7%) |
| 35 to 39 Years | 2,388 (6.4%) | 3,394 (9.0%) |
| 40 to 44 Years | 3,569 (9.6%) | 3,794 (10.1%) |
| 45 to 49 Years | 3,986 (10.7%) | 3,813 (10.1%) |
| 50 to 54 Years | 2,764 (7.4%) | 2,484 (6.6%) |
| 55 to 59 Years | 2,088 (5.6%) | 2,054 (5.4%) |
| 60 to 64 Years | 1,618 (4.3%) | 1,360 (3.6%) |
| 65 to 69 Years | 639 (1.7%) | 1,300 (3.5%) |
| 70 to 74 Years | 651 (1.8%) | 1,014 (2.7%) |
| 75 to 79 Years | 713 (1.9%) | 494 (1.3%) |
| 80 to 84 Years | 222 (0.6%) | 376 (1.0%) |
| 85 Years and over | 161 (0.4%) | 459 (1.2%) |
| Total | 37,174 (100.0%) | 37,717 (100.0%) |
Families and Households in Doral
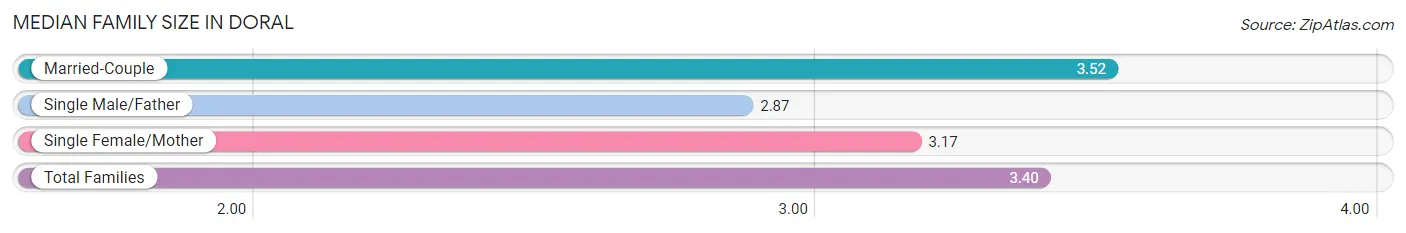
Median Family Size in Doral
The median family size in Doral is 3.40 persons per family, with married-couple families (14,585 | 74.3%) accounting for the largest median family size of 3.52 persons per family. On the other hand, single male/father families (1,793 | 9.1%) represent the smallest median family size with 2.87 persons per family.
| Family Type | # Families | Family Size |
| Married-Couple | 14,585 (74.3%) | 3.52 |
| Single Male/Father | 1,793 (9.1%) | 2.87 |
| Single Female/Mother | 3,262 (16.6%) | 3.17 |
| Total Families | 19,640 (100.0%) | 3.40 |
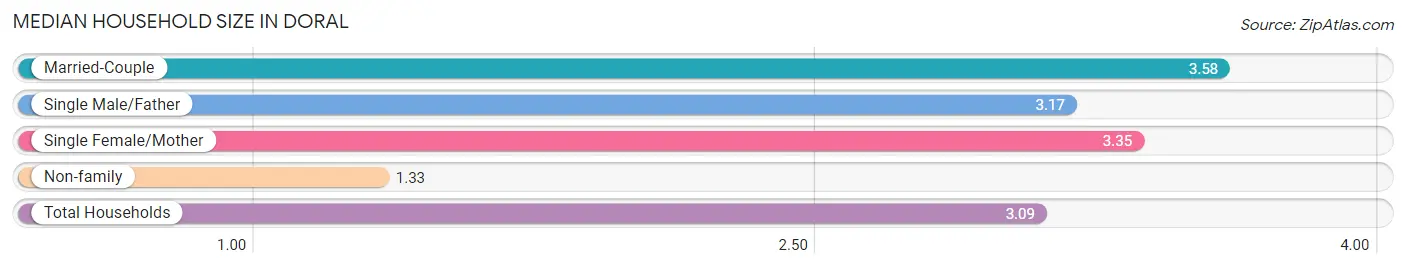
Median Household Size in Doral
The median household size in Doral is 3.09 persons per household, with married-couple households (14,585 | 60.2%) accounting for the largest median household size of 3.58 persons per household. non-family households (4,607 | 19.0%) represent the smallest median household size with 1.33 persons per household.
| Household Type | # Households | Household Size |
| Married-Couple | 14,585 (60.2%) | 3.58 |
| Single Male/Father | 1,793 (7.4%) | 3.17 |
| Single Female/Mother | 3,262 (13.5%) | 3.35 |
| Non-family | 4,607 (19.0%) | 1.33 |
| Total Households | 24,247 (100.0%) | 3.09 |
Household Size by Marriage Status in Doral
Out of a total of 24,247 households in Doral, 19,640 (81.0%) are family households, while 4,607 (19.0%) are nonfamily households. The most numerous type of family households are 4-person households, comprising 5,700, and the most common type of nonfamily households are 1-person households, comprising 3,532.
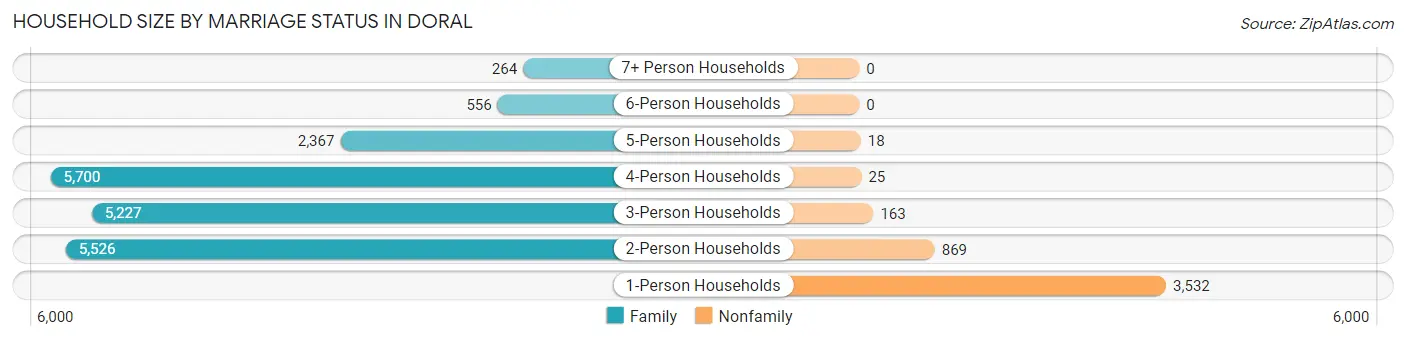
| Household Size | Family Households | Nonfamily Households |
| 1-Person Households | - | 3,532 (14.6%) |
| 2-Person Households | 5,526 (22.8%) | 869 (3.6%) |
| 3-Person Households | 5,227 (21.6%) | 163 (0.7%) |
| 4-Person Households | 5,700 (23.5%) | 25 (0.1%) |
| 5-Person Households | 2,367 (9.8%) | 18 (0.1%) |
| 6-Person Households | 556 (2.3%) | 0 (0.0%) |
| 7+ Person Households | 264 (1.1%) | 0 (0.0%) |
| Total | 19,640 (81.0%) | 4,607 (19.0%) |
Female Fertility in Doral
Fertility by Age in Doral
Average fertility rate in Doral is 39.0 births per 1,000 women. Women in the age bracket of 20 to 34 years have the highest fertility rate with 65.0 births per 1,000 women. Women in the age bracket of 20 to 34 years acount for 51.2% of all women with births.
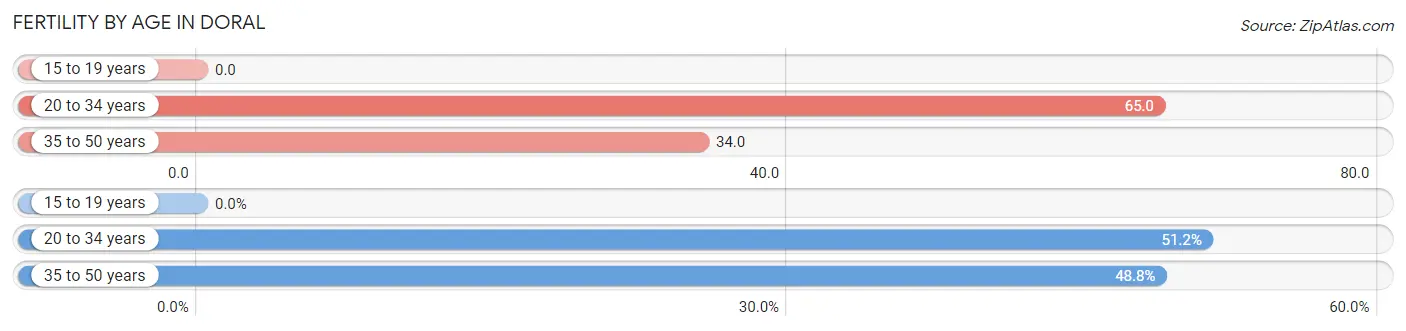
| Age Bracket | Women with Births | Births / 1,000 Women |
| 15 to 19 years | 0 (0.0%) | 0.0 |
| 20 to 34 years | 413 (51.2%) | 65.0 |
| 35 to 50 years | 394 (48.8%) | 34.0 |
| Total | 807 (100.0%) | 39.0 |
Fertility by Age by Marriage Status in Doral
80.4% of women with births (807) in Doral are married. The highest percentage of unmarried women with births falls into 20 to 34 years age bracket with 24.2% of them unmarried at the time of birth, while the lowest percentage of unmarried women with births belong to 35 to 50 years age bracket with 14.7% of them unmarried.
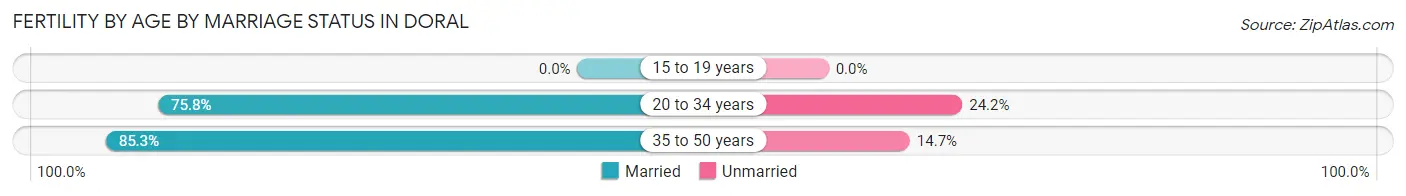
| Age Bracket | Married | Unmarried |
| 15 to 19 years | 0 (0.0%) | 0 (0.0%) |
| 20 to 34 years | 313 (75.8%) | 100 (24.2%) |
| 35 to 50 years | 336 (85.3%) | 58 (14.7%) |
| Total | 649 (80.4%) | 158 (19.6%) |
Fertility by Education in Doral
Average fertility rate in Doral is 39.0 births per 1,000 women. Women with the education attainment of bachelor's degree have the highest fertility rate of 63.0 births per 1,000 women, while women with the education attainment of high school diploma have the lowest fertility at 8.0 births per 1,000 women. Women with the education attainment of bachelor's degree represent 46.6% of all women with births.
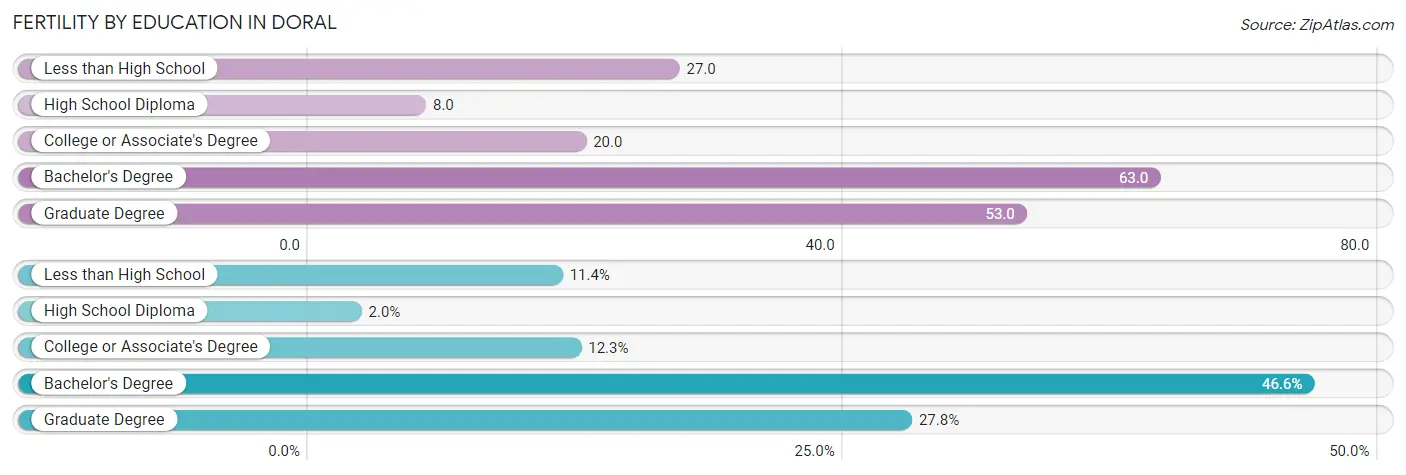
| Educational Attainment | Women with Births | Births / 1,000 Women |
| Less than High School | 92 (11.4%) | 27.0 |
| High School Diploma | 16 (2.0%) | 8.0 |
| College or Associate's Degree | 99 (12.3%) | 20.0 |
| Bachelor's Degree | 376 (46.6%) | 63.0 |
| Graduate Degree | 224 (27.8%) | 53.0 |
| Total | 807 (100.0%) | 39.0 |
Fertility by Education by Marriage Status in Doral
19.6% of women with births in Doral are unmarried. Women with the educational attainment of graduate degree are most likely to be married with 100.0% of them married at childbirth, while women with the educational attainment of college or associate's degree are least likely to be married with 76.8% of them unmarried at childbirth.
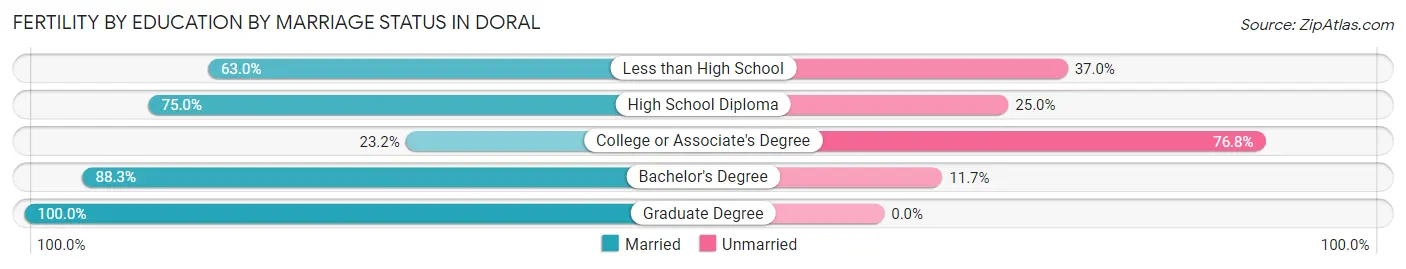
| Educational Attainment | Married | Unmarried |
| Less than High School | 58 (63.0%) | 34 (37.0%) |
| High School Diploma | 12 (75.0%) | 4 (25.0%) |
| College or Associate's Degree | 23 (23.2%) | 76 (76.8%) |
| Bachelor's Degree | 332 (88.3%) | 44 (11.7%) |
| Graduate Degree | 224 (100.0%) | 0 (0.0%) |
| Total | 649 (80.4%) | 158 (19.6%) |
Employment Characteristics in Doral
Employment by Class of Employer in Doral
Among the 38,508 employed individuals in Doral, private company employees (27,311 | 70.9%), self-employed (not incorporated) (4,515 | 11.7%), and self-employed (incorporated) (3,884 | 10.1%) make up the most common classes of employment.
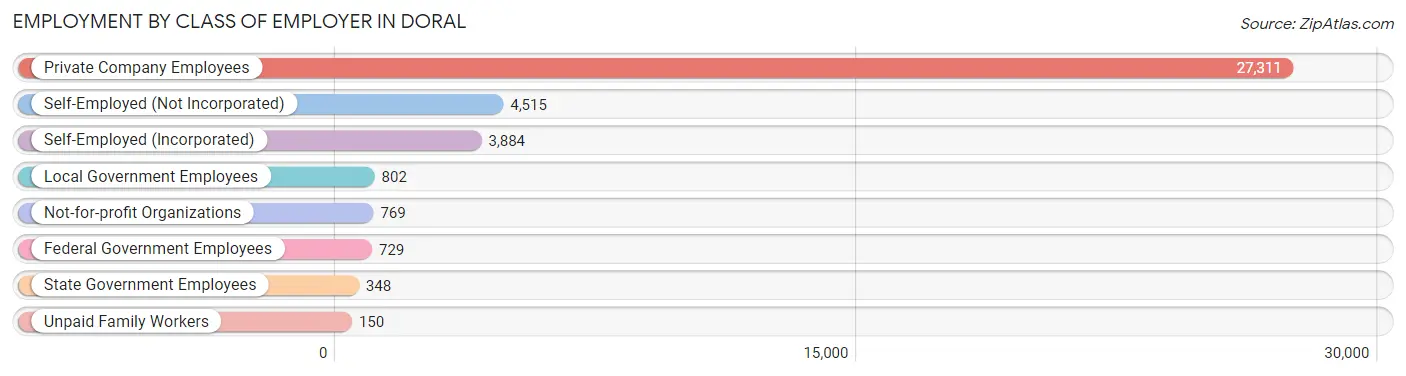
| Employer Class | # Employees | % Employees |
| Private Company Employees | 27,311 | 70.9% |
| Self-Employed (Incorporated) | 3,884 | 10.1% |
| Self-Employed (Not Incorporated) | 4,515 | 11.7% |
| Not-for-profit Organizations | 769 | 2.0% |
| Local Government Employees | 802 | 2.1% |
| State Government Employees | 348 | 0.9% |
| Federal Government Employees | 729 | 1.9% |
| Unpaid Family Workers | 150 | 0.4% |
| Total | 38,508 | 100.0% |
Employment Status by Age in Doral
According to the labor force statistics for Doral, out of the total population over 16 years of age (58,391), 69.0% or 40,290 individuals are in the labor force, with 3.1% or 1,249 of them unemployed. The age group with the highest labor force participation rate is 45 to 54 years, with 84.9% or 11,077 individuals in the labor force. Within the labor force, the 16 to 19 years age range has the highest percentage of unemployed individuals, with 14.7% or 153 of them being unemployed.
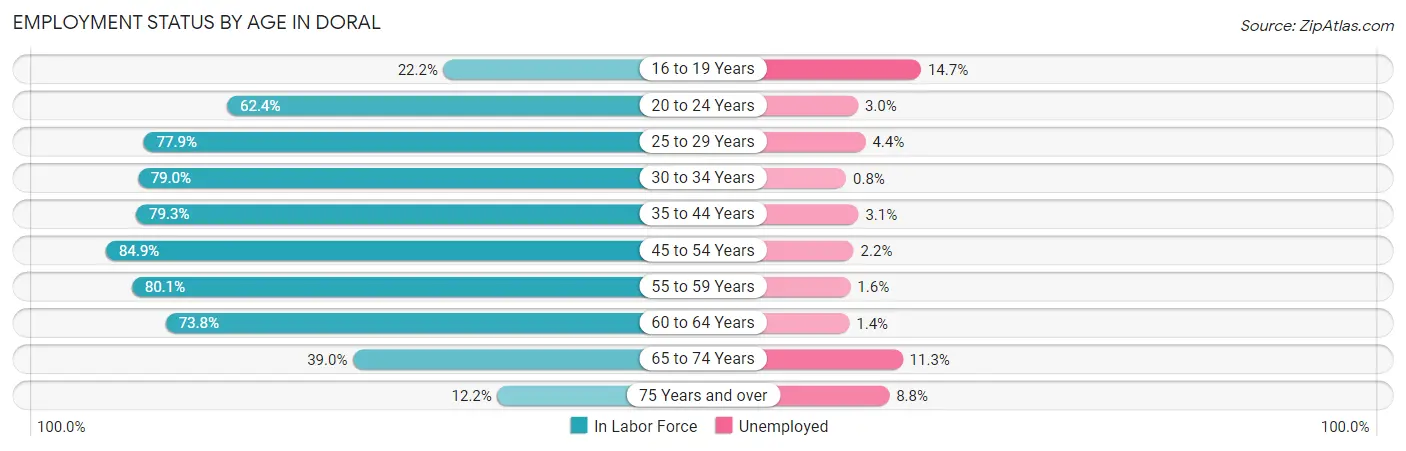
| Age Bracket | In Labor Force | Unemployed |
| 16 to 19 Years | 1,039 (22.2%) | 153 (14.7%) |
| 20 to 24 Years | 2,986 (62.4%) | 90 (3.0%) |
| 25 to 29 Years | 3,512 (77.9%) | 155 (4.4%) |
| 30 to 34 Years | 4,009 (79.0%) | 32 (0.8%) |
| 35 to 44 Years | 10,424 (79.3%) | 323 (3.1%) |
| 45 to 54 Years | 11,077 (84.9%) | 244 (2.2%) |
| 55 to 59 Years | 3,318 (80.1%) | 53 (1.6%) |
| 60 to 64 Years | 2,198 (73.8%) | 31 (1.4%) |
| 65 to 74 Years | 1,406 (39.0%) | 159 (11.3%) |
| 75 Years and over | 296 (12.2%) | 26 (8.8%) |
| Total | 40,290 (69.0%) | 1,249 (3.1%) |
Employment Status by Educational Attainment in Doral
According to labor force statistics for Doral, 80.5% of individuals (34,530) out of the total population between 25 and 64 years of age (42,895) are in the labor force, with 2.4% or 829 of them being unemployed. The group with the highest labor force participation rate are those with the educational attainment of bachelor's degree or higher, with 83.2% or 21,306 individuals in the labor force. Within the labor force, individuals with bachelor's degree or higher education have the highest percentage of unemployment, with 2.8% or 597 of them being unemployed.
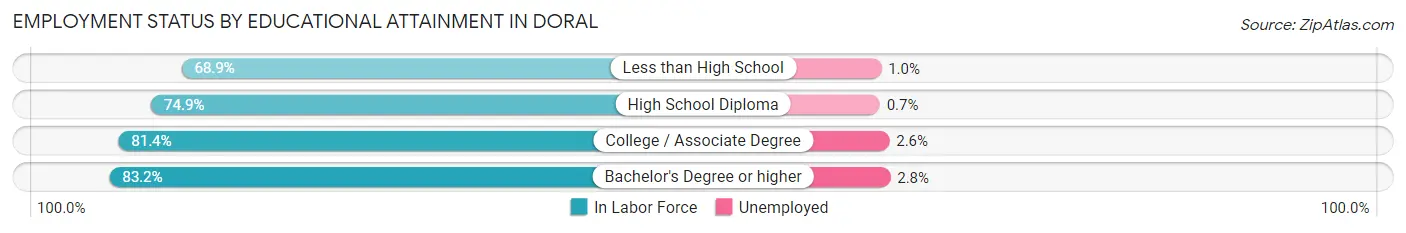
| Educational Attainment | In Labor Force | Unemployed |
| Less than High School | 3,053 (68.9%) | 44 (1.0%) |
| High School Diploma | 3,255 (74.9%) | 30 (0.7%) |
| College / Associate Degree | 6,927 (81.4%) | 221 (2.6%) |
| Bachelor's Degree or higher | 21,306 (83.2%) | 717 (2.8%) |
| Total | 34,530 (80.5%) | 1,029 (2.4%) |
Employment Occupations by Sex in Doral
Management, Business, Science and Arts Occupations
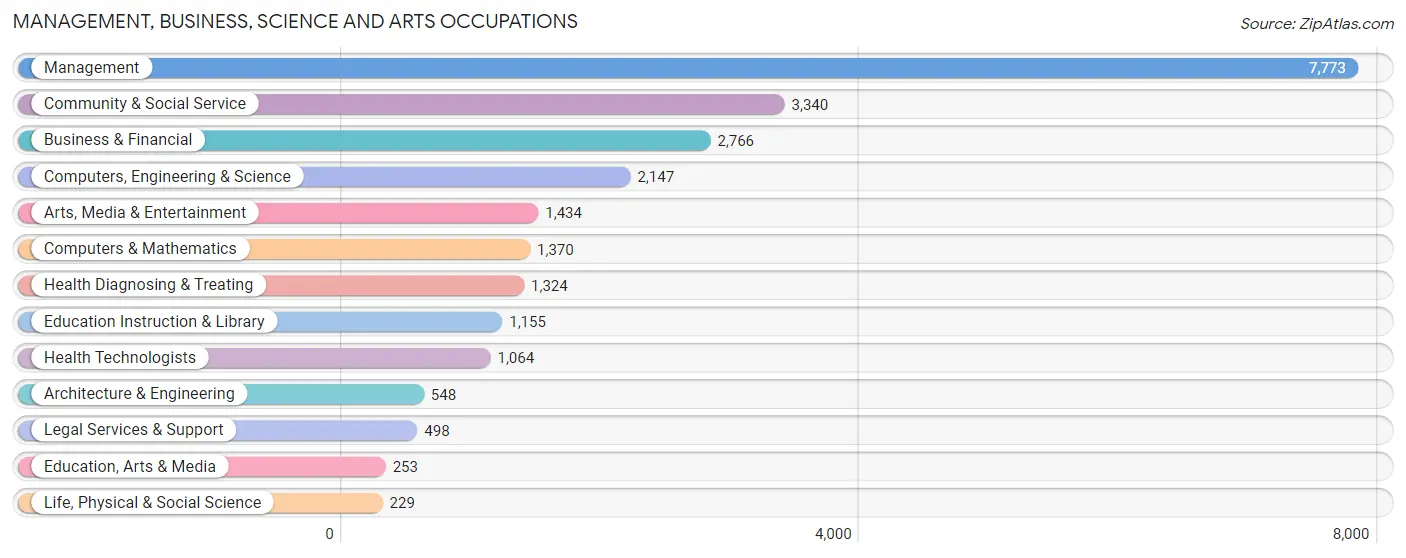
The most common Management, Business, Science and Arts occupations in Doral are Management (7,773 | 20.1%), Community & Social Service (3,340 | 8.6%), Business & Financial (2,766 | 7.2%), Computers, Engineering & Science (2,147 | 5.6%), and Arts, Media & Entertainment (1,434 | 3.7%).
Management, Business, Science and Arts Occupations by Sex
Within the Management, Business, Science and Arts occupations in Doral, the most male-oriented occupations are Computers & Mathematics (74.5%), Computers, Engineering & Science (70.8%), and Architecture & Engineering (69.2%), while the most female-oriented occupations are Education Instruction & Library (74.0%), Health Diagnosing & Treating (63.7%), and Health Technologists (61.2%).
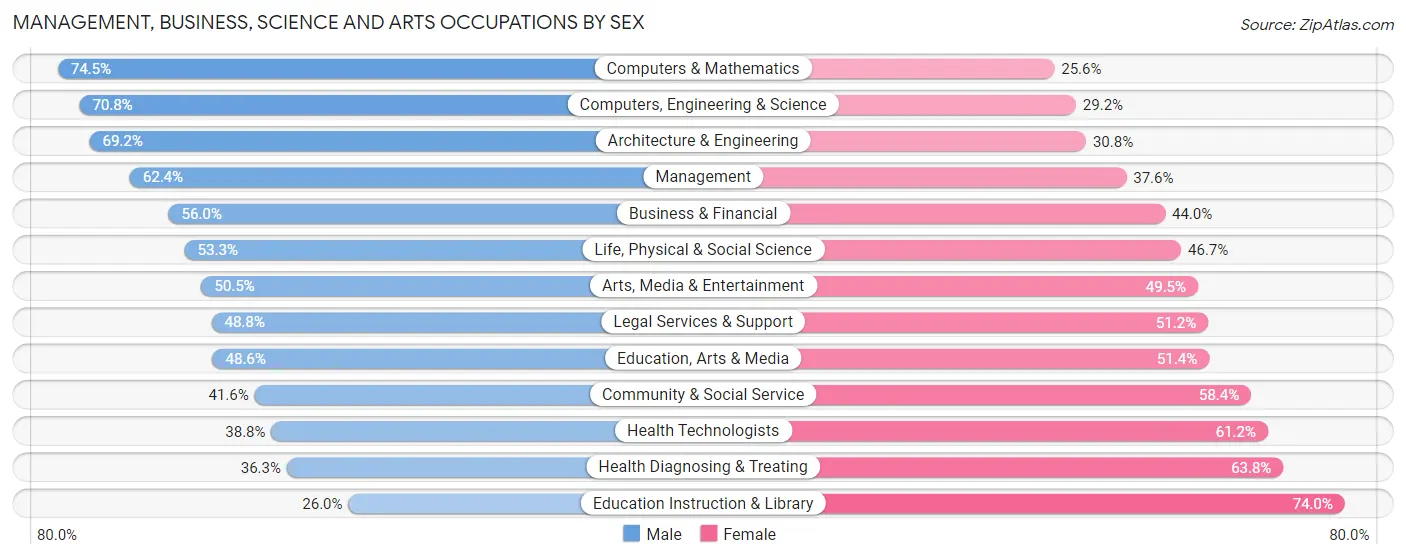
| Occupation | Male | Female |
| Management | 4,853 (62.4%) | 2,920 (37.6%) |
| Business & Financial | 1,548 (56.0%) | 1,218 (44.0%) |
| Computers, Engineering & Science | 1,521 (70.8%) | 626 (29.2%) |
| Computers & Mathematics | 1,020 (74.5%) | 350 (25.6%) |
| Architecture & Engineering | 379 (69.2%) | 169 (30.8%) |
| Life, Physical & Social Science | 122 (53.3%) | 107 (46.7%) |
| Community & Social Service | 1,390 (41.6%) | 1,950 (58.4%) |
| Education, Arts & Media | 123 (48.6%) | 130 (51.4%) |
| Legal Services & Support | 243 (48.8%) | 255 (51.2%) |
| Education Instruction & Library | 300 (26.0%) | 855 (74.0%) |
| Arts, Media & Entertainment | 724 (50.5%) | 710 (49.5%) |
| Health Diagnosing & Treating | 480 (36.2%) | 844 (63.7%) |
| Health Technologists | 413 (38.8%) | 651 (61.2%) |
| Total (Category) | 9,792 (56.4%) | 7,558 (43.6%) |
| Total (Overall) | 21,736 (56.2%) | 16,921 (43.8%) |
Services Occupations
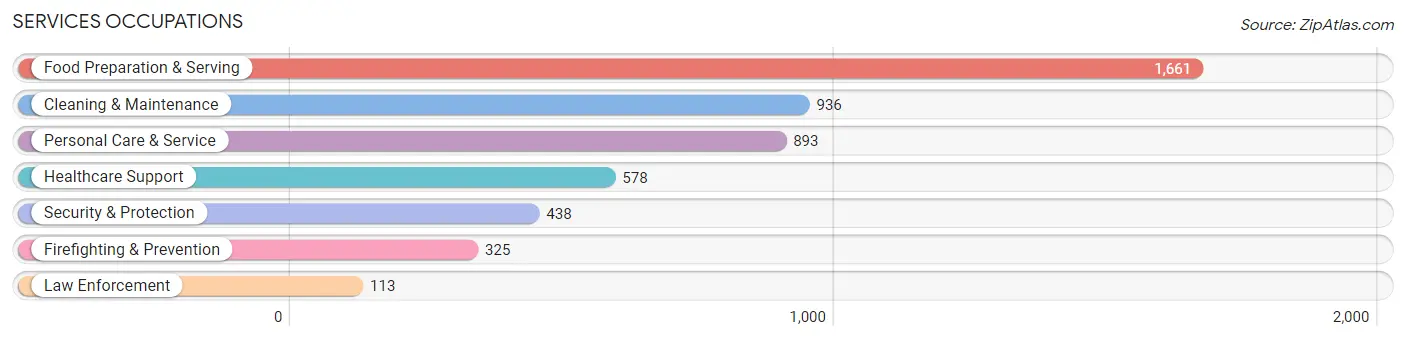
The most common Services occupations in Doral are Food Preparation & Serving (1,661 | 4.3%), Cleaning & Maintenance (936 | 2.4%), Personal Care & Service (893 | 2.3%), Healthcare Support (578 | 1.5%), and Security & Protection (438 | 1.1%).
Services Occupations by Sex
Within the Services occupations in Doral, the most male-oriented occupations are Law Enforcement (76.1%), Cleaning & Maintenance (70.7%), and Food Preparation & Serving (61.5%), while the most female-oriented occupations are Healthcare Support (82.5%), Personal Care & Service (78.3%), and Firefighting & Prevention (56.6%).
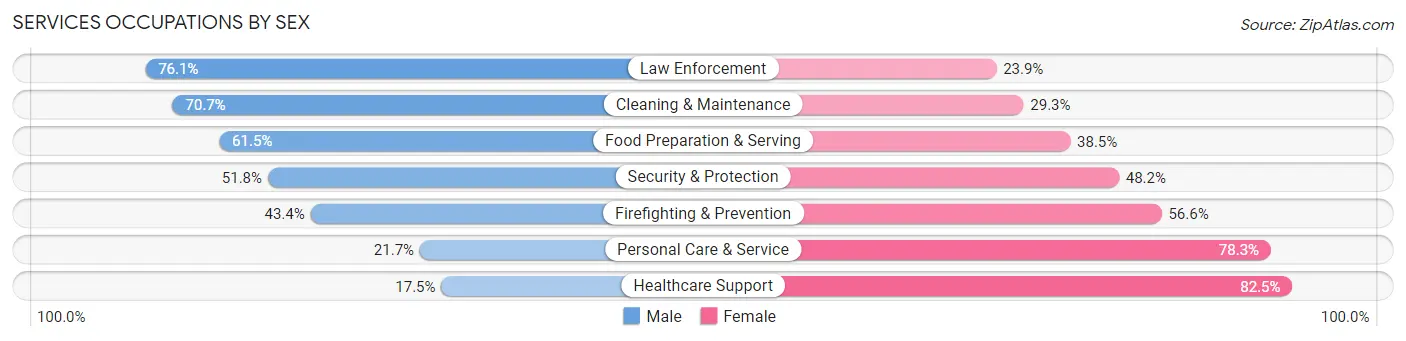
| Occupation | Male | Female |
| Healthcare Support | 101 (17.5%) | 477 (82.5%) |
| Security & Protection | 227 (51.8%) | 211 (48.2%) |
| Firefighting & Prevention | 141 (43.4%) | 184 (56.6%) |
| Law Enforcement | 86 (76.1%) | 27 (23.9%) |
| Food Preparation & Serving | 1,021 (61.5%) | 640 (38.5%) |
| Cleaning & Maintenance | 662 (70.7%) | 274 (29.3%) |
| Personal Care & Service | 194 (21.7%) | 699 (78.3%) |
| Total (Category) | 2,205 (48.9%) | 2,301 (51.1%) |
| Total (Overall) | 21,736 (56.2%) | 16,921 (43.8%) |
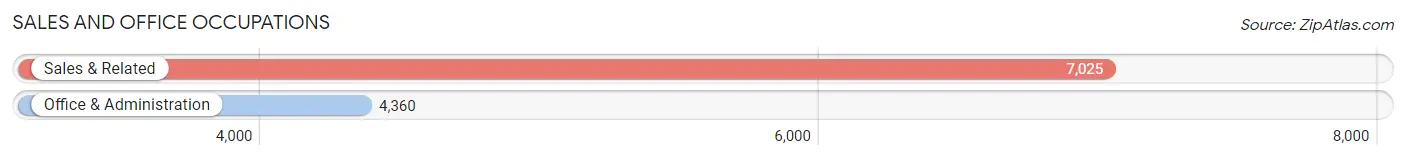
Sales and Office Occupations
The most common Sales and Office occupations in Doral are Sales & Related (7,025 | 18.2%), and Office & Administration (4,360 | 11.3%).
Sales and Office Occupations by Sex
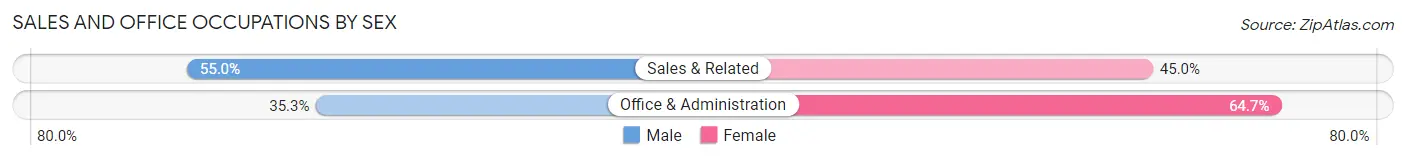
| Occupation | Male | Female |
| Sales & Related | 3,866 (55.0%) | 3,159 (45.0%) |
| Office & Administration | 1,538 (35.3%) | 2,822 (64.7%) |
| Total (Category) | 5,404 (47.5%) | 5,981 (52.5%) |
| Total (Overall) | 21,736 (56.2%) | 16,921 (43.8%) |
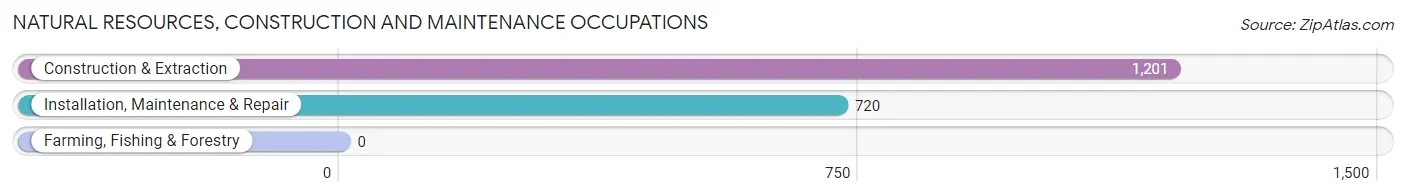
Natural Resources, Construction and Maintenance Occupations
The most common Natural Resources, Construction and Maintenance occupations in Doral are Construction & Extraction (1,201 | 3.1%), and Installation, Maintenance & Repair (720 | 1.9%).
Natural Resources, Construction and Maintenance Occupations by Sex
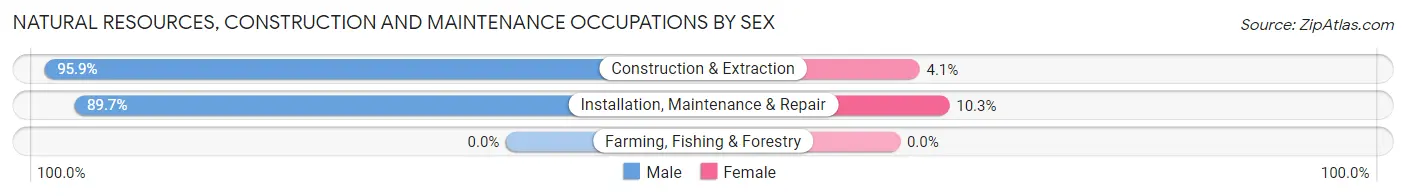
| Occupation | Male | Female |
| Farming, Fishing & Forestry | 0 (0.0%) | 0 (0.0%) |
| Construction & Extraction | 1,152 (95.9%) | 49 (4.1%) |
| Installation, Maintenance & Repair | 646 (89.7%) | 74 (10.3%) |
| Total (Category) | 1,798 (93.6%) | 123 (6.4%) |
| Total (Overall) | 21,736 (56.2%) | 16,921 (43.8%) |
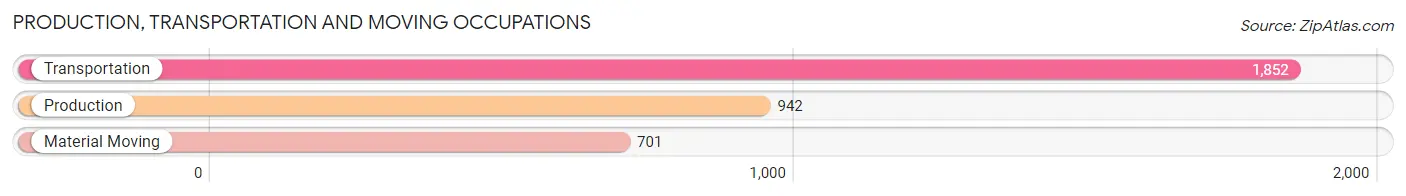
Production, Transportation and Moving Occupations
The most common Production, Transportation and Moving occupations in Doral are Transportation (1,852 | 4.8%), Production (942 | 2.4%), and Material Moving (701 | 1.8%).
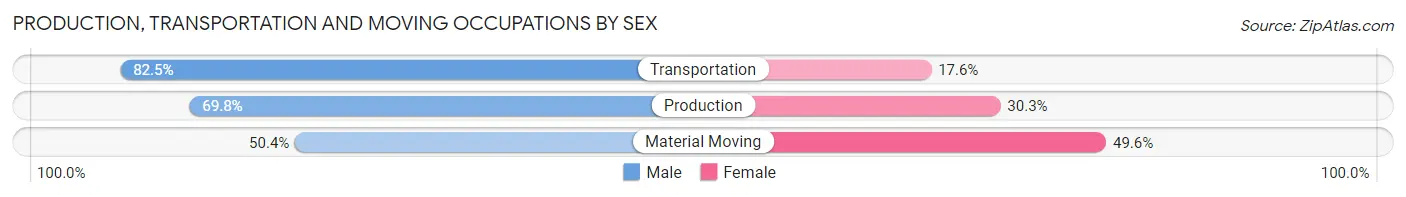
Production, Transportation and Moving Occupations by Sex
| Occupation | Male | Female |
| Production | 657 (69.8%) | 285 (30.2%) |
| Transportation | 1,527 (82.5%) | 325 (17.5%) |
| Material Moving | 353 (50.4%) | 348 (49.6%) |
| Total (Category) | 2,537 (72.6%) | 958 (27.4%) |
| Total (Overall) | 21,736 (56.2%) | 16,921 (43.8%) |
Employment Industries by Sex in Doral
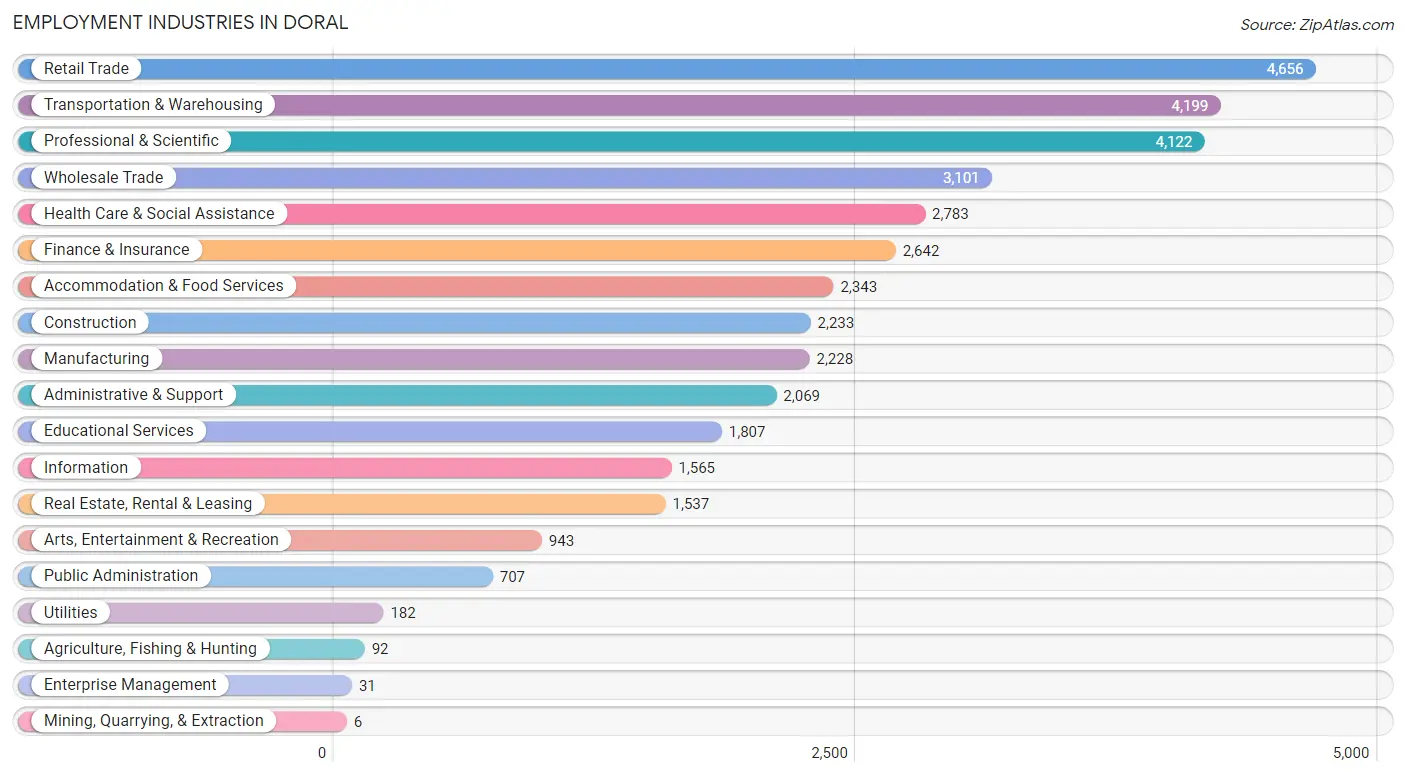
Employment Industries in Doral
The major employment industries in Doral include Retail Trade (4,656 | 12.0%), Transportation & Warehousing (4,199 | 10.9%), Professional & Scientific (4,122 | 10.7%), Wholesale Trade (3,101 | 8.0%), and Health Care & Social Assistance (2,783 | 7.2%).
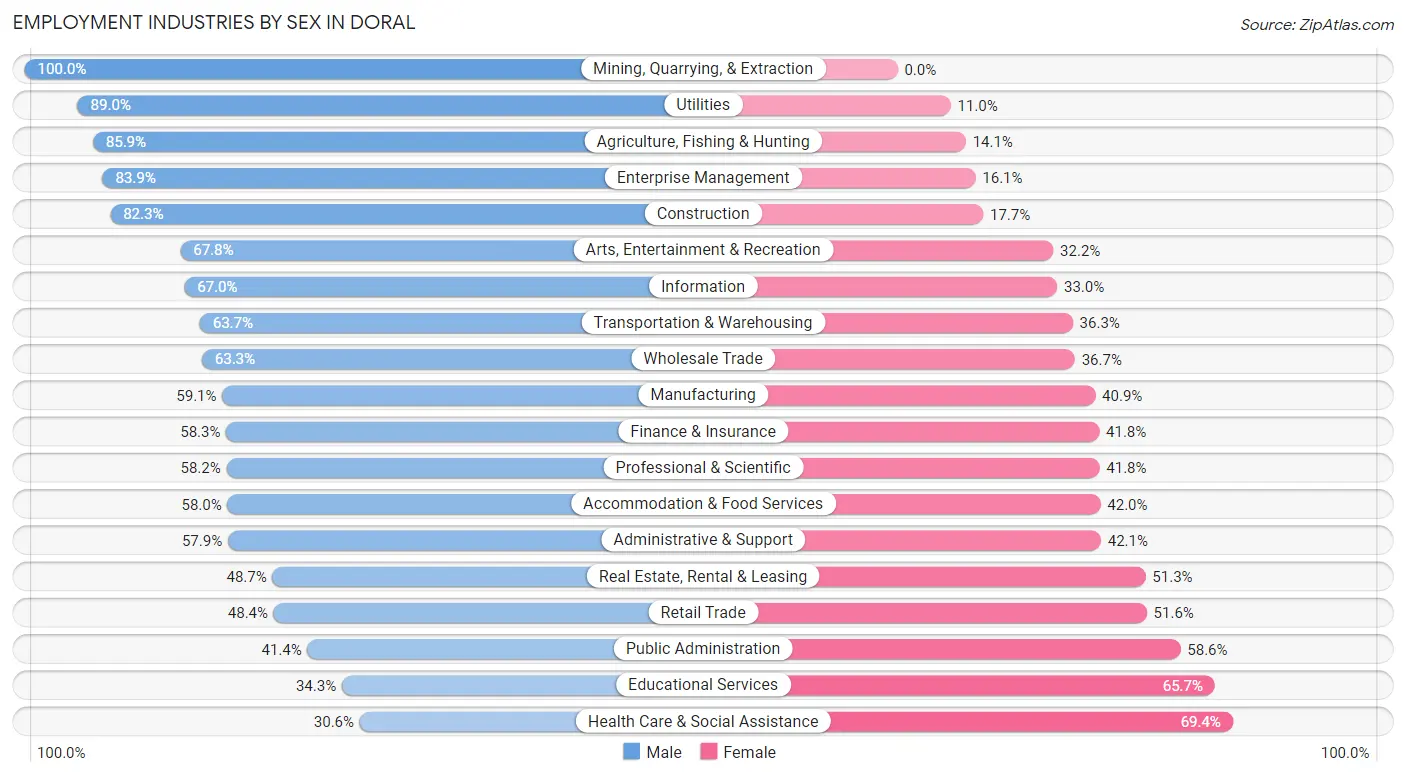
Employment Industries by Sex in Doral
The Doral industries that see more men than women are Mining, Quarrying, & Extraction (100.0%), Utilities (89.0%), and Agriculture, Fishing & Hunting (85.9%), whereas the industries that tend to have a higher number of women are Health Care & Social Assistance (69.4%), Educational Services (65.7%), and Public Administration (58.6%).
| Industry | Male | Female |
| Agriculture, Fishing & Hunting | 79 (85.9%) | 13 (14.1%) |
| Mining, Quarrying, & Extraction | 6 (100.0%) | 0 (0.0%) |
| Construction | 1,837 (82.3%) | 396 (17.7%) |
| Manufacturing | 1,316 (59.1%) | 912 (40.9%) |
| Wholesale Trade | 1,963 (63.3%) | 1,138 (36.7%) |
| Retail Trade | 2,254 (48.4%) | 2,402 (51.6%) |
| Transportation & Warehousing | 2,676 (63.7%) | 1,523 (36.3%) |
| Utilities | 162 (89.0%) | 20 (11.0%) |
| Information | 1,048 (67.0%) | 517 (33.0%) |
| Finance & Insurance | 1,539 (58.3%) | 1,103 (41.7%) |
| Real Estate, Rental & Leasing | 748 (48.7%) | 789 (51.3%) |
| Professional & Scientific | 2,399 (58.2%) | 1,723 (41.8%) |
| Enterprise Management | 26 (83.9%) | 5 (16.1%) |
| Administrative & Support | 1,198 (57.9%) | 871 (42.1%) |
| Educational Services | 620 (34.3%) | 1,187 (65.7%) |
| Health Care & Social Assistance | 852 (30.6%) | 1,931 (69.4%) |
| Arts, Entertainment & Recreation | 639 (67.8%) | 304 (32.2%) |
| Accommodation & Food Services | 1,359 (58.0%) | 984 (42.0%) |
| Public Administration | 293 (41.4%) | 414 (58.6%) |
| Total | 21,736 (56.2%) | 16,921 (43.8%) |
Education in Doral
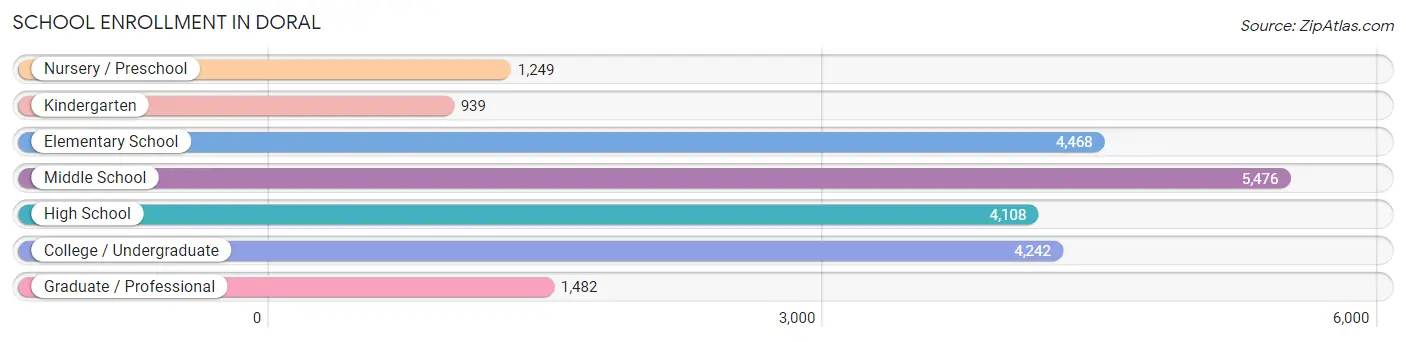
School Enrollment in Doral
The most common levels of schooling among the 21,964 students in Doral are middle school (5,476 | 24.9%), elementary school (4,468 | 20.3%), and college / undergraduate (4,242 | 19.3%).
| School Level | # Students | % Students |
| Nursery / Preschool | 1,249 | 5.7% |
| Kindergarten | 939 | 4.3% |
| Elementary School | 4,468 | 20.3% |
| Middle School | 5,476 | 24.9% |
| High School | 4,108 | 18.7% |
| College / Undergraduate | 4,242 | 19.3% |
| Graduate / Professional | 1,482 | 6.8% |
| Total | 21,964 | 100.0% |
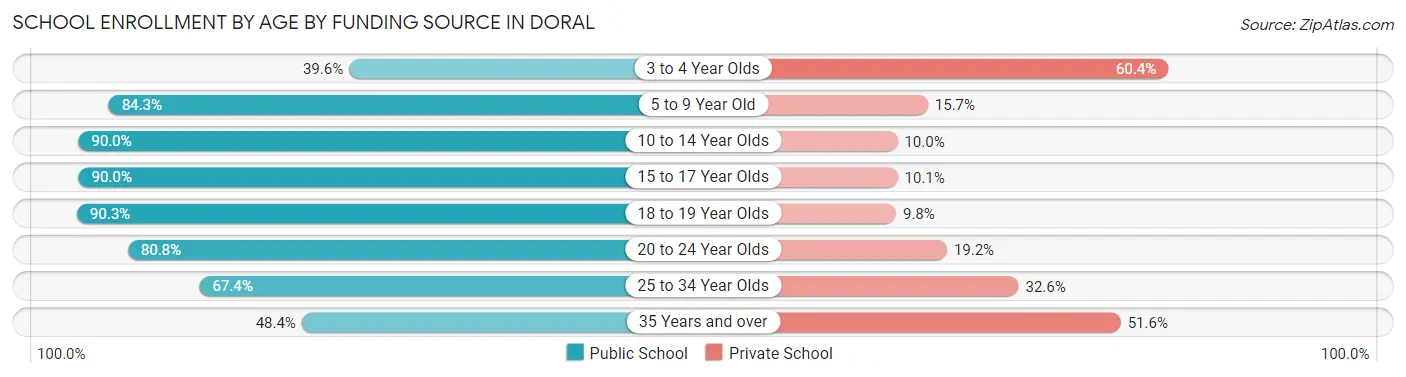
School Enrollment by Age by Funding Source in Doral
Out of a total of 21,964 students who are enrolled in schools in Doral, 3,975 (18.1%) attend a private institution, while the remaining 17,989 (81.9%) are enrolled in public schools. The age group of 3 to 4 year olds has the highest likelihood of being enrolled in private schools, with 716 (60.4% in the age bracket) enrolled. Conversely, the age group of 18 to 19 year olds has the lowest likelihood of being enrolled in a private school, with 1,546 (90.2% in the age bracket) attending a public institution.
| Age Bracket | Public School | Private School |
| 3 to 4 Year Olds | 469 (39.6%) | 716 (60.4%) |
| 5 to 9 Year Old | 4,161 (84.3%) | 774 (15.7%) |
| 10 to 14 Year Olds | 5,696 (90.0%) | 634 (10.0%) |
| 15 to 17 Year Olds | 2,802 (89.9%) | 313 (10.1%) |
| 18 to 19 Year Olds | 1,546 (90.2%) | 167 (9.8%) |
| 20 to 24 Year Olds | 2,010 (80.8%) | 479 (19.2%) |
| 25 to 34 Year Olds | 832 (67.4%) | 402 (32.6%) |
| 35 Years and over | 466 (48.4%) | 497 (51.6%) |
| Total | 17,989 (81.9%) | 3,975 (18.1%) |
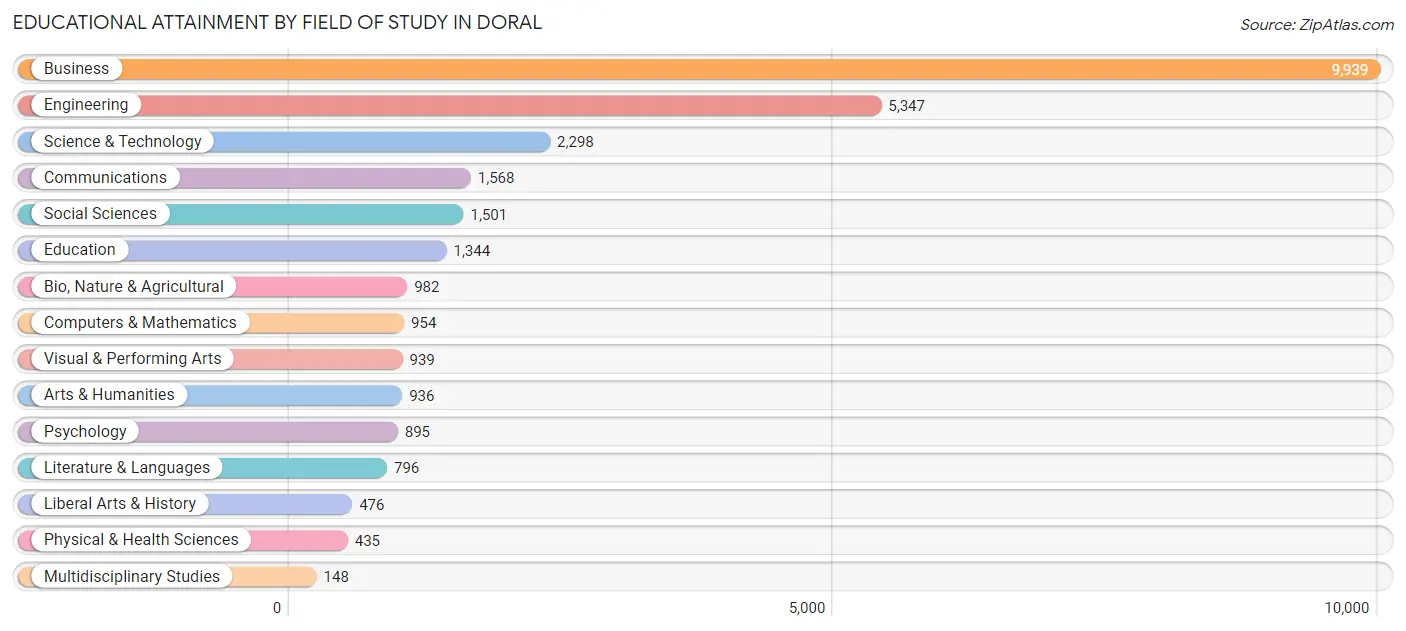
Educational Attainment by Field of Study in Doral
Business (9,939 | 34.8%), engineering (5,347 | 18.7%), science & technology (2,298 | 8.1%), communications (1,568 | 5.5%), and social sciences (1,501 | 5.3%) are the most common fields of study among 28,558 individuals in Doral who have obtained a bachelor's degree or higher.
| Field of Study | # Graduates | % Graduates |
| Computers & Mathematics | 954 | 3.3% |
| Bio, Nature & Agricultural | 982 | 3.4% |
| Physical & Health Sciences | 435 | 1.5% |
| Psychology | 895 | 3.1% |
| Social Sciences | 1,501 | 5.3% |
| Engineering | 5,347 | 18.7% |
| Multidisciplinary Studies | 148 | 0.5% |
| Science & Technology | 2,298 | 8.1% |
| Business | 9,939 | 34.8% |
| Education | 1,344 | 4.7% |
| Literature & Languages | 796 | 2.8% |
| Liberal Arts & History | 476 | 1.7% |
| Visual & Performing Arts | 939 | 3.3% |
| Communications | 1,568 | 5.5% |
| Arts & Humanities | 936 | 3.3% |
| Total | 28,558 | 100.0% |
Transportation & Commute in Doral
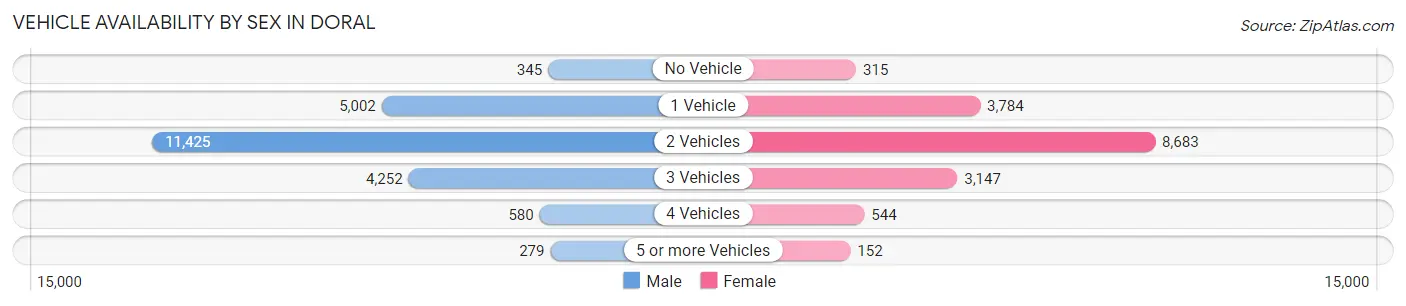
Vehicle Availability by Sex in Doral
The most prevalent vehicle ownership categories in Doral are males with 2 vehicles (11,425, accounting for 52.2%) and females with 2 vehicles (8,683, making up 68.7%).
| Vehicles Available | Male | Female |
| No Vehicle | 345 (1.6%) | 315 (1.9%) |
| 1 Vehicle | 5,002 (22.9%) | 3,784 (22.8%) |
| 2 Vehicles | 11,425 (52.2%) | 8,683 (52.2%) |
| 3 Vehicles | 4,252 (19.4%) | 3,147 (18.9%) |
| 4 Vehicles | 580 (2.6%) | 544 (3.3%) |
| 5 or more Vehicles | 279 (1.3%) | 152 (0.9%) |
| Total | 21,883 (100.0%) | 16,625 (100.0%) |
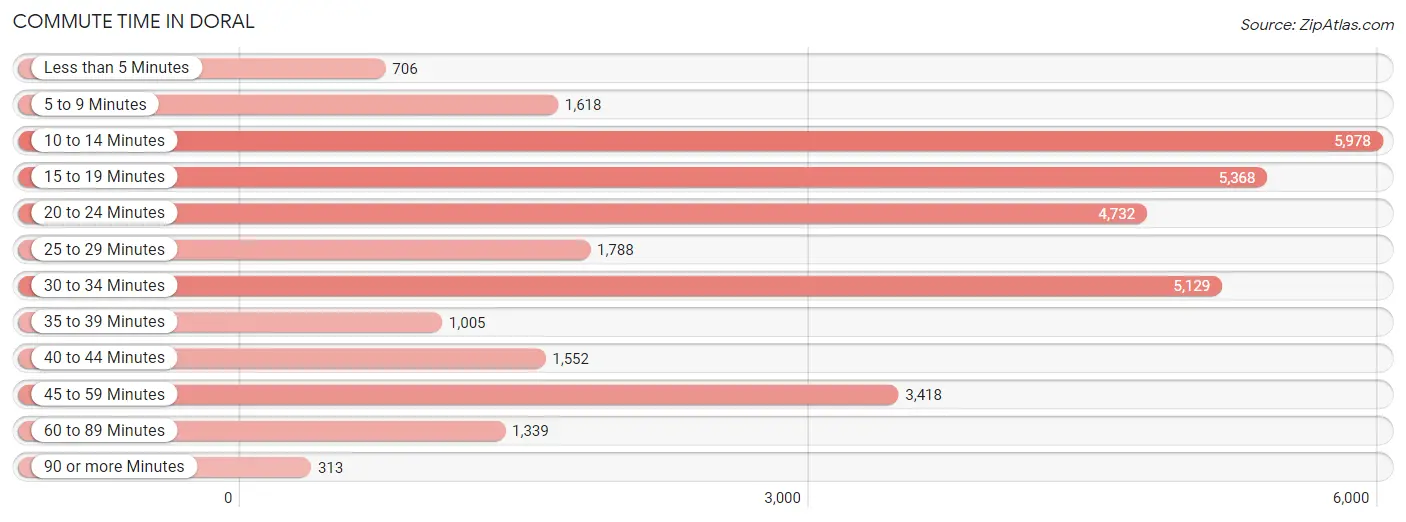
Commute Time in Doral
The most frequently occuring commute durations in Doral are 10 to 14 minutes (5,978 commuters, 18.1%), 15 to 19 minutes (5,368 commuters, 16.3%), and 30 to 34 minutes (5,129 commuters, 15.6%).
| Commute Time | # Commuters | % Commuters |
| Less than 5 Minutes | 706 | 2.1% |
| 5 to 9 Minutes | 1,618 | 4.9% |
| 10 to 14 Minutes | 5,978 | 18.1% |
| 15 to 19 Minutes | 5,368 | 16.3% |
| 20 to 24 Minutes | 4,732 | 14.4% |
| 25 to 29 Minutes | 1,788 | 5.4% |
| 30 to 34 Minutes | 5,129 | 15.6% |
| 35 to 39 Minutes | 1,005 | 3.0% |
| 40 to 44 Minutes | 1,552 | 4.7% |
| 45 to 59 Minutes | 3,418 | 10.4% |
| 60 to 89 Minutes | 1,339 | 4.1% |
| 90 or more Minutes | 313 | 0.9% |
Commute Time by Sex in Doral
The most common commute times in Doral are 10 to 14 minutes (3,231 commuters, 17.1%) for males and 10 to 14 minutes (2,747 commuters, 19.5%) for females.
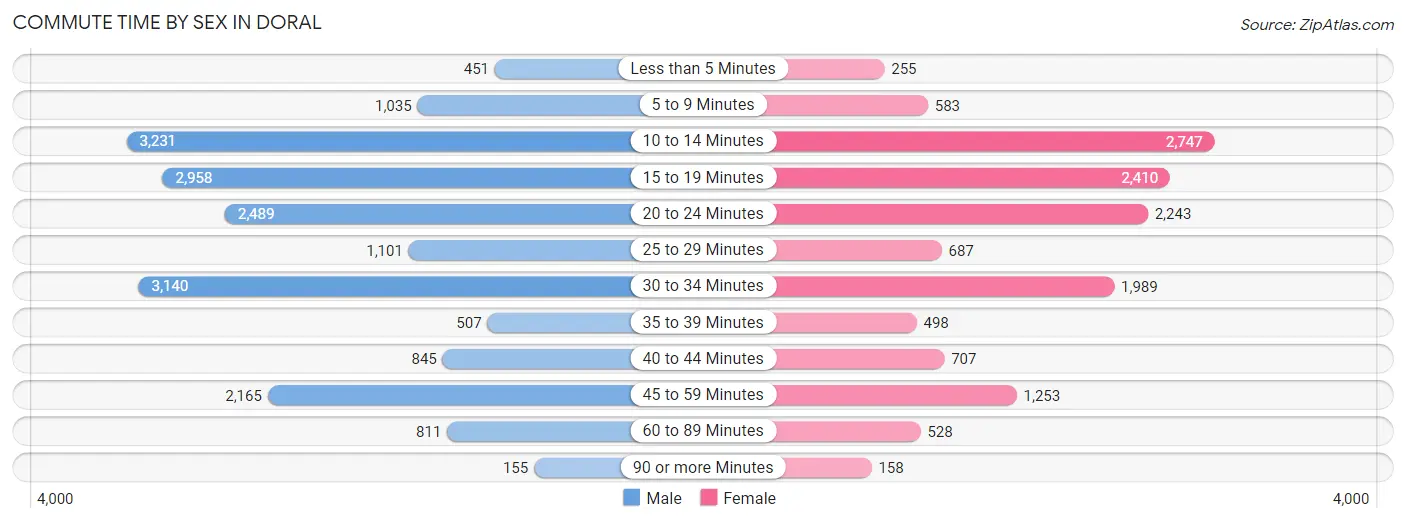
| Commute Time | Male | Female |
| Less than 5 Minutes | 451 (2.4%) | 255 (1.8%) |
| 5 to 9 Minutes | 1,035 (5.5%) | 583 (4.2%) |
| 10 to 14 Minutes | 3,231 (17.1%) | 2,747 (19.5%) |
| 15 to 19 Minutes | 2,958 (15.7%) | 2,410 (17.1%) |
| 20 to 24 Minutes | 2,489 (13.2%) | 2,243 (16.0%) |
| 25 to 29 Minutes | 1,101 (5.8%) | 687 (4.9%) |
| 30 to 34 Minutes | 3,140 (16.6%) | 1,989 (14.1%) |
| 35 to 39 Minutes | 507 (2.7%) | 498 (3.5%) |
| 40 to 44 Minutes | 845 (4.5%) | 707 (5.0%) |
| 45 to 59 Minutes | 2,165 (11.5%) | 1,253 (8.9%) |
| 60 to 89 Minutes | 811 (4.3%) | 528 (3.8%) |
| 90 or more Minutes | 155 (0.8%) | 158 (1.1%) |
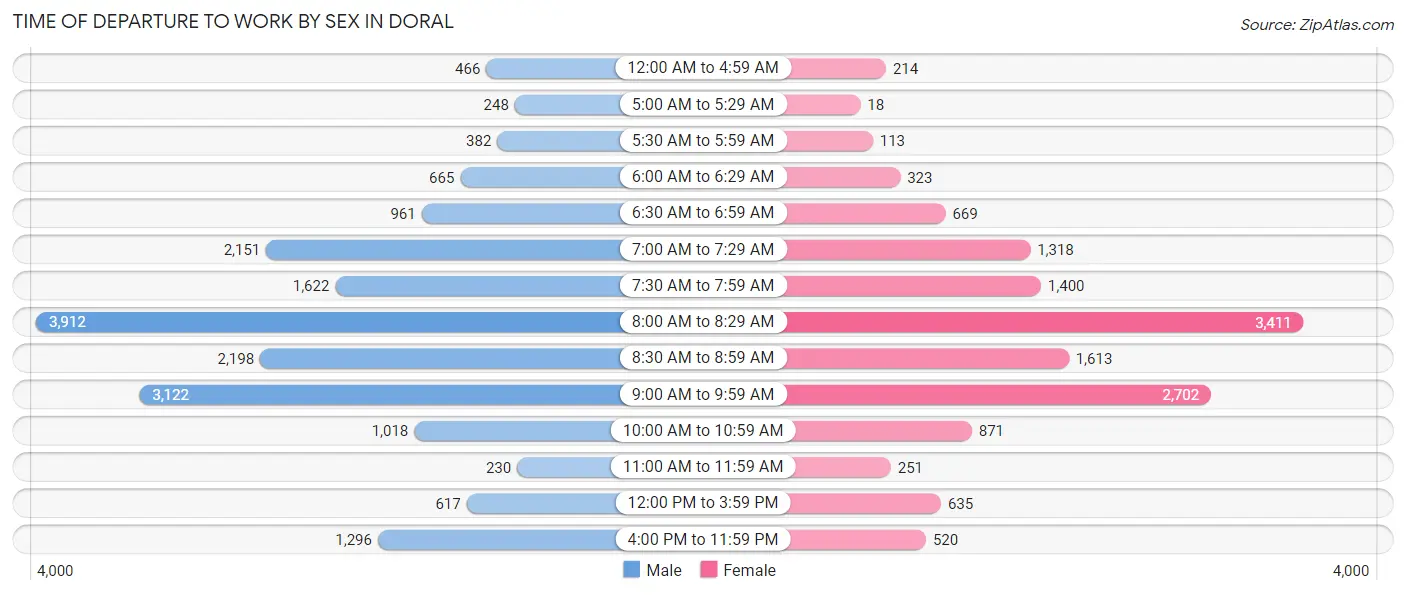
Time of Departure to Work by Sex in Doral
The most frequent times of departure to work in Doral are 8:00 AM to 8:29 AM (3,912, 20.7%) for males and 8:00 AM to 8:29 AM (3,411, 24.3%) for females.
| Time of Departure | Male | Female |
| 12:00 AM to 4:59 AM | 466 (2.5%) | 214 (1.5%) |
| 5:00 AM to 5:29 AM | 248 (1.3%) | 18 (0.1%) |
| 5:30 AM to 5:59 AM | 382 (2.0%) | 113 (0.8%) |
| 6:00 AM to 6:29 AM | 665 (3.5%) | 323 (2.3%) |
| 6:30 AM to 6:59 AM | 961 (5.1%) | 669 (4.8%) |
| 7:00 AM to 7:29 AM | 2,151 (11.4%) | 1,318 (9.4%) |
| 7:30 AM to 7:59 AM | 1,622 (8.6%) | 1,400 (10.0%) |
| 8:00 AM to 8:29 AM | 3,912 (20.7%) | 3,411 (24.3%) |
| 8:30 AM to 8:59 AM | 2,198 (11.6%) | 1,613 (11.5%) |
| 9:00 AM to 9:59 AM | 3,122 (16.5%) | 2,702 (19.2%) |
| 10:00 AM to 10:59 AM | 1,018 (5.4%) | 871 (6.2%) |
| 11:00 AM to 11:59 AM | 230 (1.2%) | 251 (1.8%) |
| 12:00 PM to 3:59 PM | 617 (3.3%) | 635 (4.5%) |
| 4:00 PM to 11:59 PM | 1,296 (6.9%) | 520 (3.7%) |
| Total | 18,888 (100.0%) | 14,058 (100.0%) |
Housing Occupancy in Doral
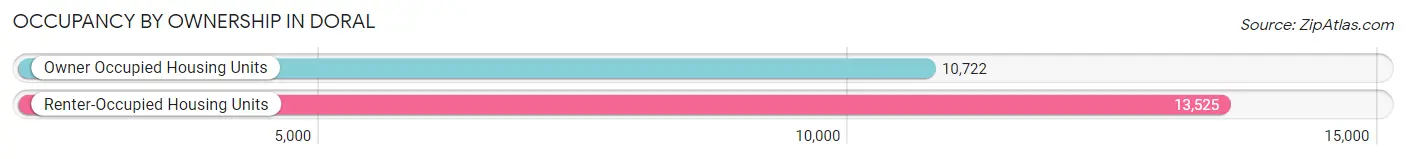
Occupancy by Ownership in Doral
Of the total 24,247 dwellings in Doral, owner-occupied units account for 10,722 (44.2%), while renter-occupied units make up 13,525 (55.8%).
| Occupancy | # Housing Units | % Housing Units |
| Owner Occupied Housing Units | 10,722 | 44.2% |
| Renter-Occupied Housing Units | 13,525 | 55.8% |
| Total Occupied Housing Units | 24,247 | 100.0% |
Occupancy by Household Size in Doral
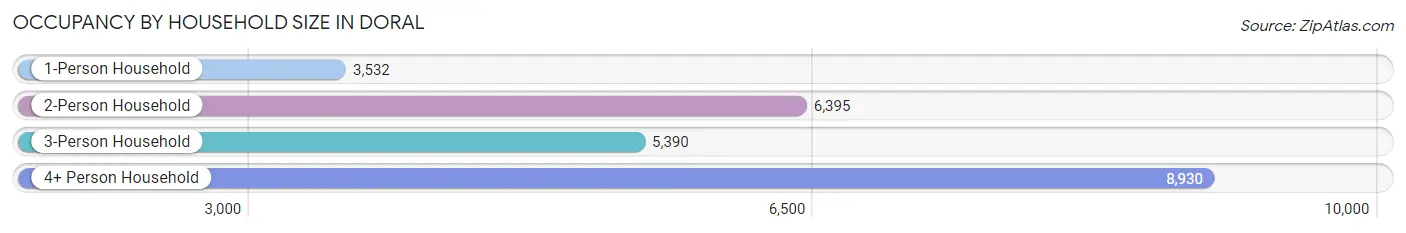
| Household Size | # Housing Units | % Housing Units |
| 1-Person Household | 3,532 | 14.6% |
| 2-Person Household | 6,395 | 26.4% |
| 3-Person Household | 5,390 | 22.2% |
| 4+ Person Household | 8,930 | 36.8% |
| Total Housing Units | 24,247 | 100.0% |
Occupancy by Ownership by Household Size in Doral
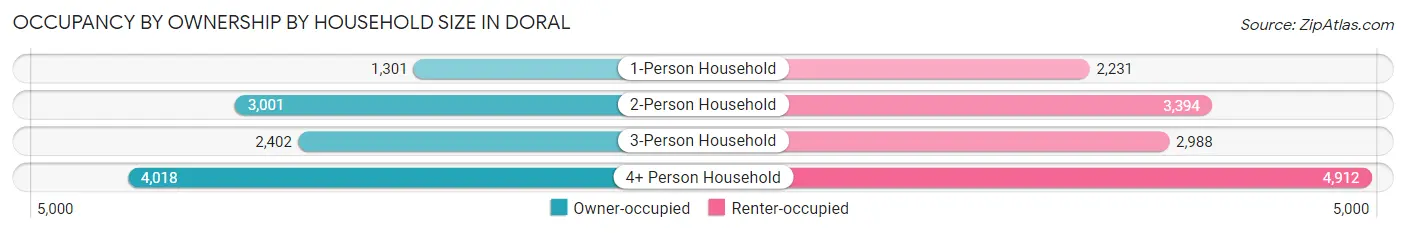
| Household Size | Owner-occupied | Renter-occupied |
| 1-Person Household | 1,301 (36.8%) | 2,231 (63.2%) |
| 2-Person Household | 3,001 (46.9%) | 3,394 (53.1%) |
| 3-Person Household | 2,402 (44.6%) | 2,988 (55.4%) |
| 4+ Person Household | 4,018 (45.0%) | 4,912 (55.0%) |
| Total Housing Units | 10,722 (44.2%) | 13,525 (55.8%) |
Occupancy by Educational Attainment in Doral
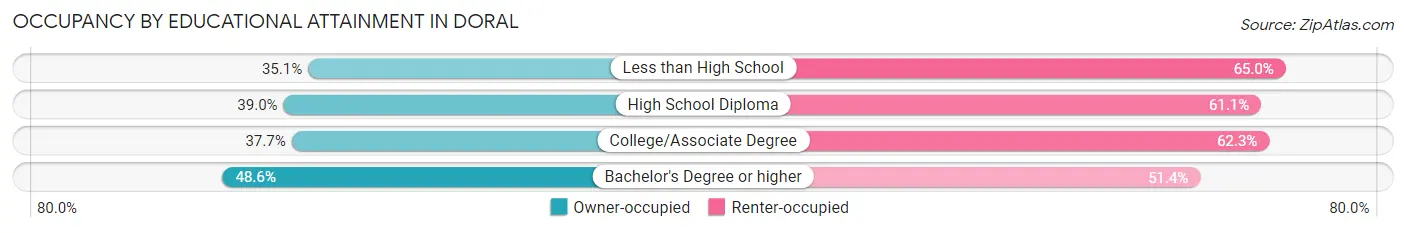
| Household Size | Owner-occupied | Renter-occupied |
| Less than High School | 798 (35.0%) | 1,479 (64.9%) |
| High School Diploma | 894 (39.0%) | 1,401 (61.1%) |
| College/Associate Degree | 1,839 (37.7%) | 3,043 (62.3%) |
| Bachelor's Degree or higher | 7,191 (48.6%) | 7,602 (51.4%) |
Occupancy by Age of Householder in Doral
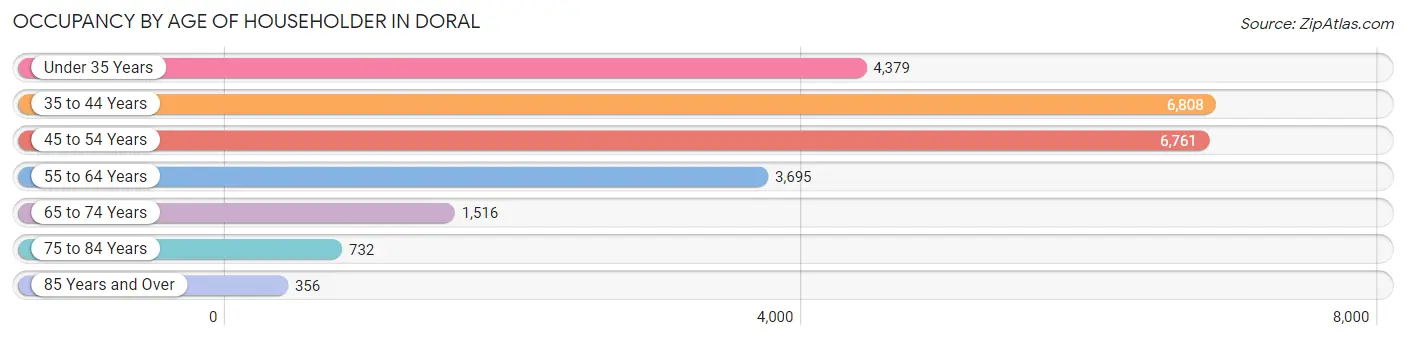
| Age Bracket | # Households | % Households |
| Under 35 Years | 4,379 | 18.1% |
| 35 to 44 Years | 6,808 | 28.1% |
| 45 to 54 Years | 6,761 | 27.9% |
| 55 to 64 Years | 3,695 | 15.2% |
| 65 to 74 Years | 1,516 | 6.2% |
| 75 to 84 Years | 732 | 3.0% |
| 85 Years and Over | 356 | 1.5% |
| Total | 24,247 | 100.0% |
Housing Finances in Doral
Median Income by Occupancy in Doral
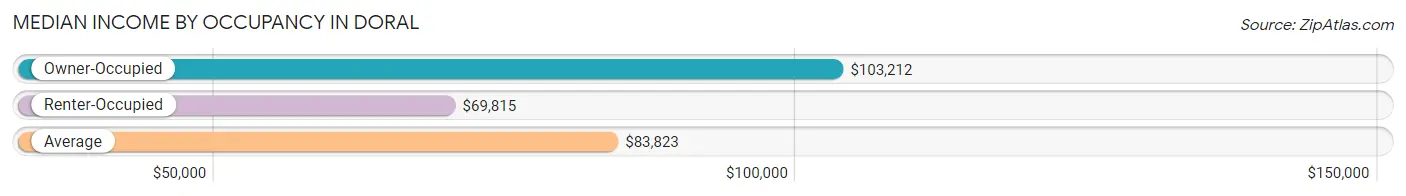
| Occupancy Type | # Households | Median Income |
| Owner-Occupied | 10,722 (44.2%) | $103,212 |
| Renter-Occupied | 13,525 (55.8%) | $69,815 |
| Average | 24,247 (100.0%) | $83,823 |
Occupancy by Householder Income Bracket in Doral
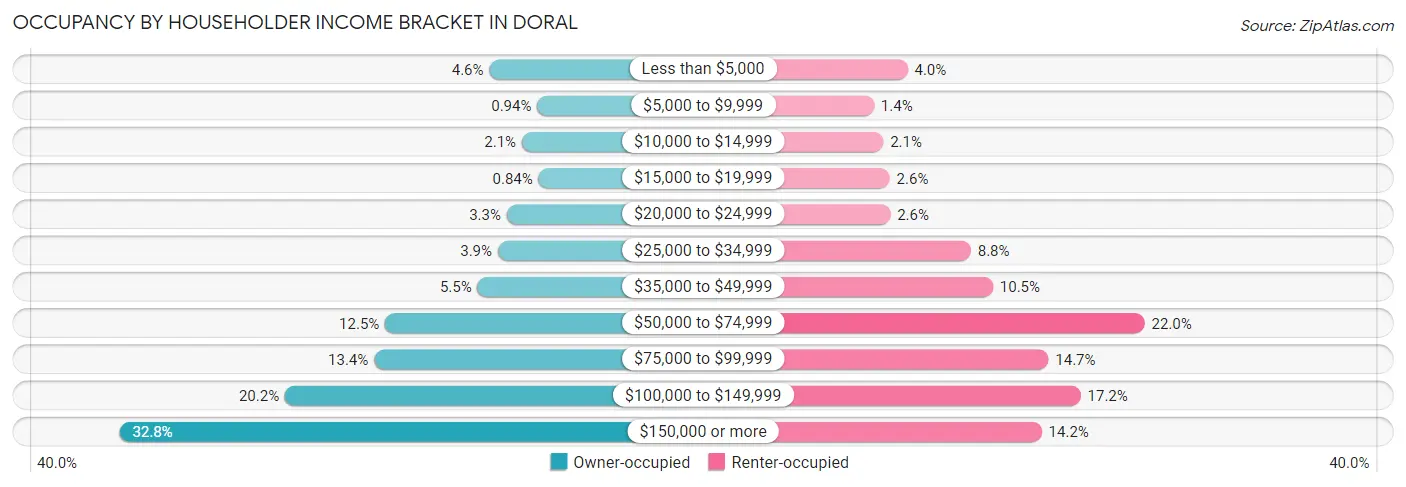
| Income Bracket | Owner-occupied | Renter-occupied |
| Less than $5,000 | 492 (4.6%) | 535 (4.0%) |
| $5,000 to $9,999 | 101 (0.9%) | 189 (1.4%) |
| $10,000 to $14,999 | 226 (2.1%) | 286 (2.1%) |
| $15,000 to $19,999 | 90 (0.8%) | 352 (2.6%) |
| $20,000 to $24,999 | 350 (3.3%) | 357 (2.6%) |
| $25,000 to $34,999 | 422 (3.9%) | 1,188 (8.8%) |
| $35,000 to $49,999 | 589 (5.5%) | 1,415 (10.5%) |
| $50,000 to $74,999 | 1,343 (12.5%) | 2,978 (22.0%) |
| $75,000 to $99,999 | 1,433 (13.4%) | 1,987 (14.7%) |
| $100,000 to $149,999 | 2,162 (20.2%) | 2,320 (17.2%) |
| $150,000 or more | 3,514 (32.8%) | 1,918 (14.2%) |
| Total | 10,722 (100.0%) | 13,525 (100.0%) |
Monthly Housing Cost Tiers in Doral
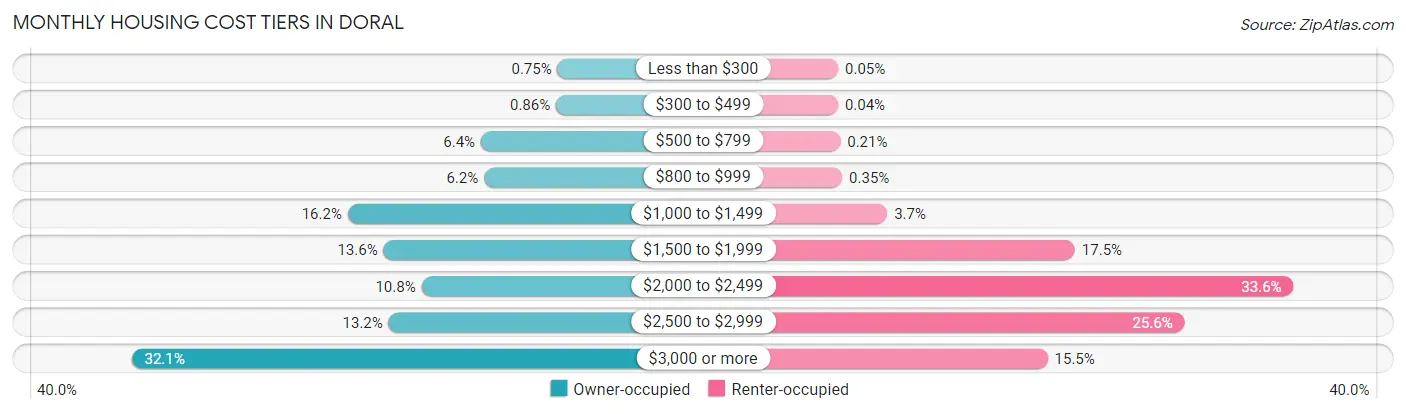
| Monthly Cost | Owner-occupied | Renter-occupied |
| Less than $300 | 80 (0.7%) | 7 (0.1%) |
| $300 to $499 | 92 (0.9%) | 5 (0.0%) |
| $500 to $799 | 685 (6.4%) | 28 (0.2%) |
| $800 to $999 | 660 (6.2%) | 48 (0.4%) |
| $1,000 to $1,499 | 1,737 (16.2%) | 497 (3.7%) |
| $1,500 to $1,999 | 1,455 (13.6%) | 2,365 (17.5%) |
| $2,000 to $2,499 | 1,155 (10.8%) | 4,542 (33.6%) |
| $2,500 to $2,999 | 1,414 (13.2%) | 3,458 (25.6%) |
| $3,000 or more | 3,444 (32.1%) | 2,094 (15.5%) |
| Total | 10,722 (100.0%) | 13,525 (100.0%) |
Physical Housing Characteristics in Doral
Housing Structures in Doral
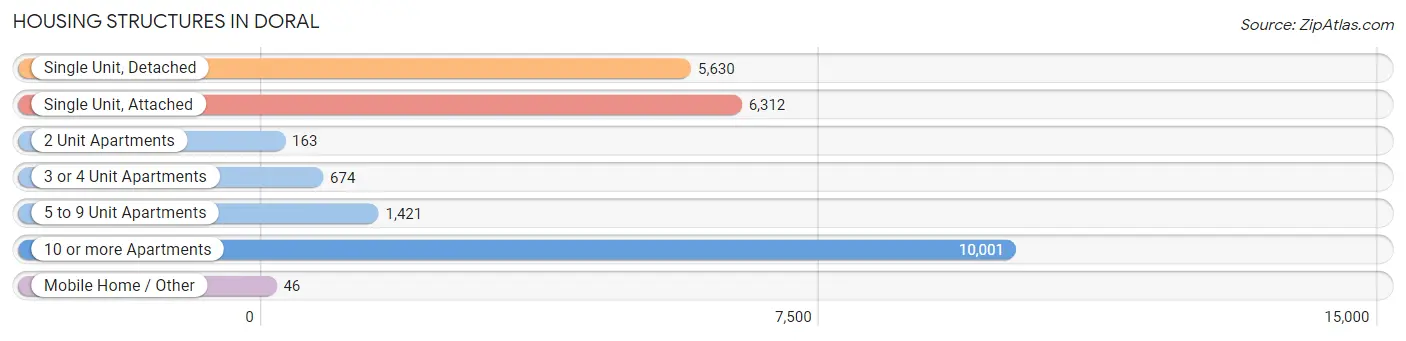
| Structure Type | # Housing Units | % Housing Units |
| Single Unit, Detached | 5,630 | 23.2% |
| Single Unit, Attached | 6,312 | 26.0% |
| 2 Unit Apartments | 163 | 0.7% |
| 3 or 4 Unit Apartments | 674 | 2.8% |
| 5 to 9 Unit Apartments | 1,421 | 5.9% |
| 10 or more Apartments | 10,001 | 41.2% |
| Mobile Home / Other | 46 | 0.2% |
| Total | 24,247 | 100.0% |
Housing Structures by Occupancy in Doral
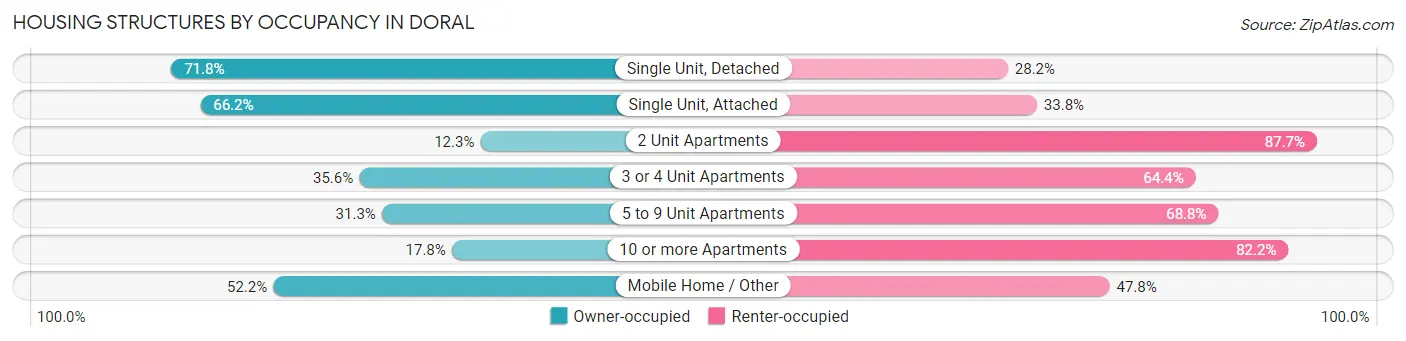
| Structure Type | Owner-occupied | Renter-occupied |
| Single Unit, Detached | 4,040 (71.8%) | 1,590 (28.2%) |
| Single Unit, Attached | 4,176 (66.2%) | 2,136 (33.8%) |
| 2 Unit Apartments | 20 (12.3%) | 143 (87.7%) |
| 3 or 4 Unit Apartments | 240 (35.6%) | 434 (64.4%) |
| 5 to 9 Unit Apartments | 444 (31.2%) | 977 (68.8%) |
| 10 or more Apartments | 1,778 (17.8%) | 8,223 (82.2%) |
| Mobile Home / Other | 24 (52.2%) | 22 (47.8%) |
| Total | 10,722 (44.2%) | 13,525 (55.8%) |
Housing Structures by Number of Rooms in Doral
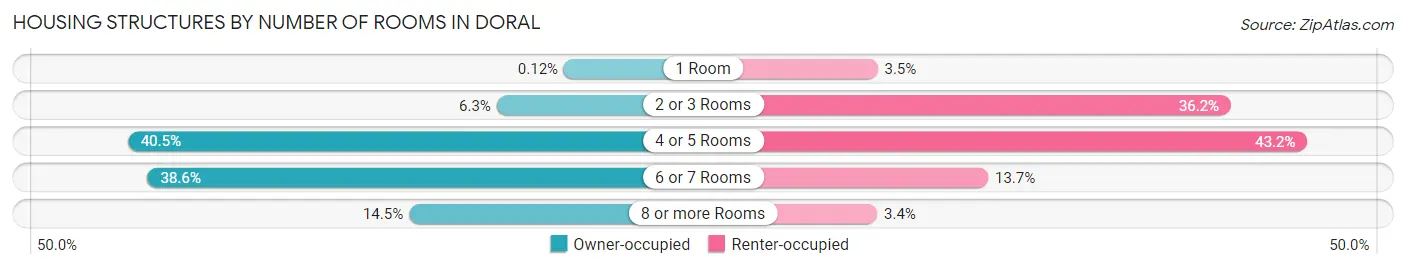
| Number of Rooms | Owner-occupied | Renter-occupied |
| 1 Room | 13 (0.1%) | 470 (3.5%) |
| 2 or 3 Rooms | 680 (6.3%) | 4,891 (36.2%) |
| 4 or 5 Rooms | 4,338 (40.5%) | 5,846 (43.2%) |
| 6 or 7 Rooms | 4,142 (38.6%) | 1,853 (13.7%) |
| 8 or more Rooms | 1,549 (14.4%) | 465 (3.4%) |
| Total | 10,722 (100.0%) | 13,525 (100.0%) |
Housing Structure by Heating Type in Doral
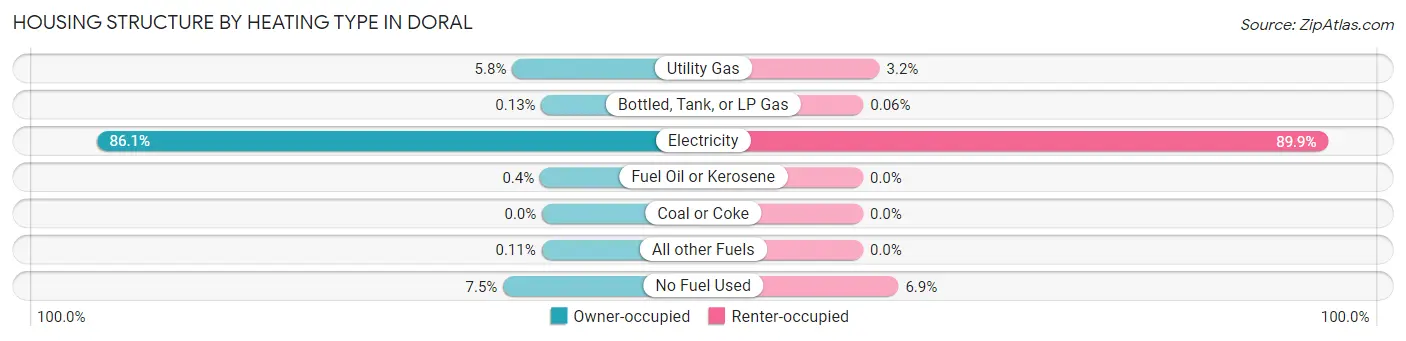
| Heating Type | Owner-occupied | Renter-occupied |
| Utility Gas | 619 (5.8%) | 433 (3.2%) |
| Bottled, Tank, or LP Gas | 14 (0.1%) | 8 (0.1%) |
| Electricity | 9,228 (86.1%) | 12,157 (89.9%) |
| Fuel Oil or Kerosene | 43 (0.4%) | 0 (0.0%) |
| Coal or Coke | 0 (0.0%) | 0 (0.0%) |
| All other Fuels | 12 (0.1%) | 0 (0.0%) |
| No Fuel Used | 806 (7.5%) | 927 (6.9%) |
| Total | 10,722 (100.0%) | 13,525 (100.0%) |
Household Vehicle Usage in Doral
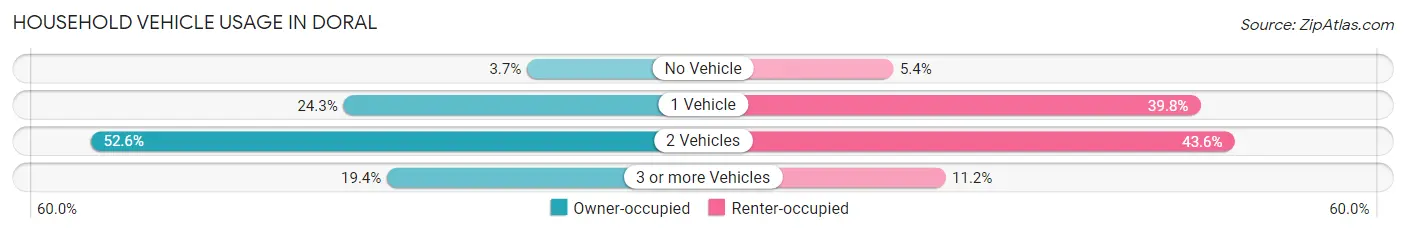
| Vehicles per Household | Owner-occupied | Renter-occupied |
| No Vehicle | 399 (3.7%) | 728 (5.4%) |
| 1 Vehicle | 2,603 (24.3%) | 5,381 (39.8%) |
| 2 Vehicles | 5,641 (52.6%) | 5,898 (43.6%) |
| 3 or more Vehicles | 2,079 (19.4%) | 1,518 (11.2%) |
| Total | 10,722 (100.0%) | 13,525 (100.0%) |
Real Estate & Mortgages in Doral
Real Estate and Mortgage Overview in Doral
| Characteristic | Without Mortgage | With Mortgage |
| Housing Units | 3,605 | 7,117 |
| Median Property Value | $461,100 | $472,800 |
| Median Household Income | $88,446 | $2,555 |
| Monthly Housing Costs | $1,076 | $3,435 |
| Real Estate Taxes | $5,249 | $398 |
Property Value by Mortgage Status in Doral
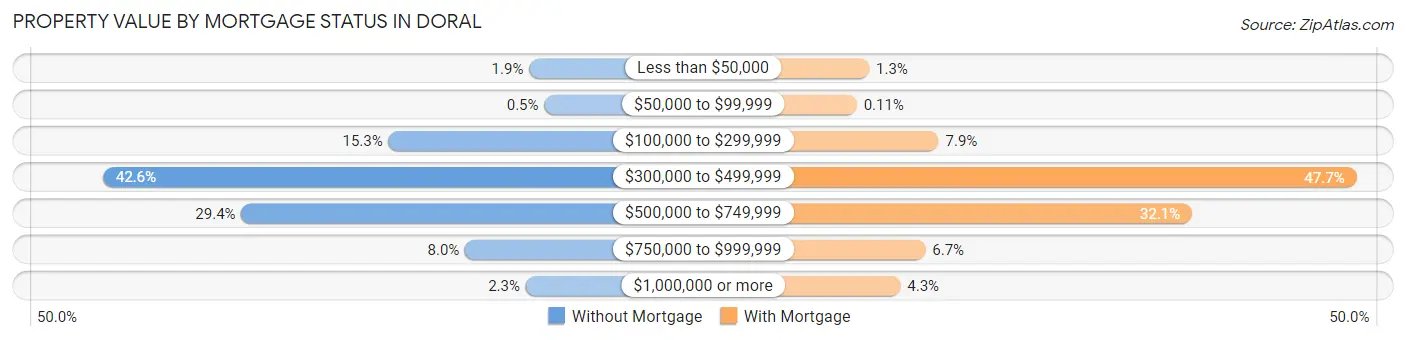
| Property Value | Without Mortgage | With Mortgage |
| Less than $50,000 | 70 (1.9%) | 92 (1.3%) |
| $50,000 to $99,999 | 18 (0.5%) | 8 (0.1%) |
| $100,000 to $299,999 | 553 (15.3%) | 563 (7.9%) |
| $300,000 to $499,999 | 1,534 (42.5%) | 3,396 (47.7%) |
| $500,000 to $749,999 | 1,058 (29.3%) | 2,281 (32.1%) |
| $750,000 to $999,999 | 290 (8.0%) | 473 (6.7%) |
| $1,000,000 or more | 82 (2.3%) | 304 (4.3%) |
| Total | 3,605 (100.0%) | 7,117 (100.0%) |
Household Income by Mortgage Status in Doral
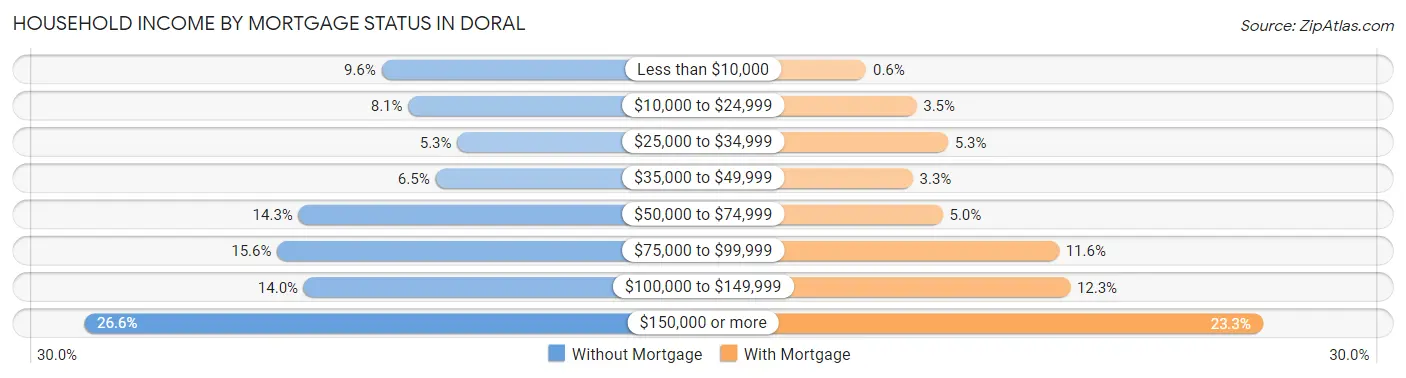
| Household Income | Without Mortgage | With Mortgage |
| Less than $10,000 | 346 (9.6%) | 43 (0.6%) |
| $10,000 to $24,999 | 291 (8.1%) | 247 (3.5%) |
| $25,000 to $34,999 | 190 (5.3%) | 375 (5.3%) |
| $35,000 to $49,999 | 235 (6.5%) | 232 (3.3%) |
| $50,000 to $74,999 | 517 (14.3%) | 354 (5.0%) |
| $75,000 to $99,999 | 561 (15.6%) | 826 (11.6%) |
| $100,000 to $149,999 | 506 (14.0%) | 872 (12.2%) |
| $150,000 or more | 959 (26.6%) | 1,656 (23.3%) |
| Total | 3,605 (100.0%) | 7,117 (100.0%) |
Property Value to Household Income Ratio in Doral
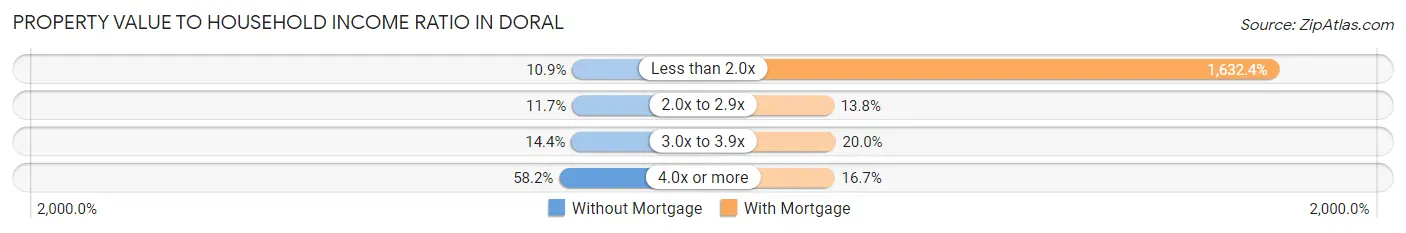
| Value-to-Income Ratio | Without Mortgage | With Mortgage |
| Less than 2.0x | 391 (10.8%) | 116,181 (1,632.4%) |
| 2.0x to 2.9x | 420 (11.7%) | 981 (13.8%) |
| 3.0x to 3.9x | 519 (14.4%) | 1,424 (20.0%) |
| 4.0x or more | 2,099 (58.2%) | 1,189 (16.7%) |
| Total | 3,605 (100.0%) | 7,117 (100.0%) |
Real Estate Taxes by Mortgage Status in Doral
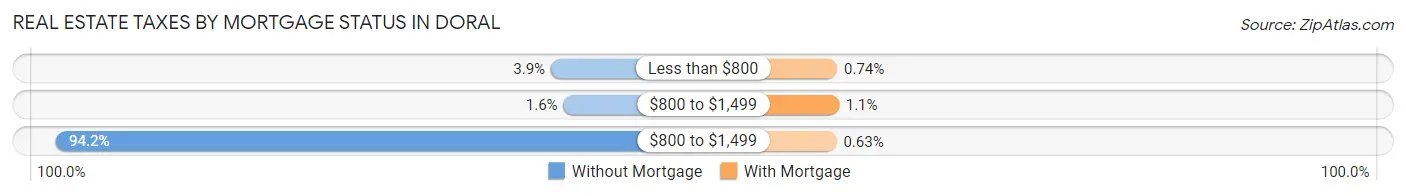
| Property Taxes | Without Mortgage | With Mortgage |
| Less than $800 | 139 (3.9%) | 53 (0.7%) |
| $800 to $1,499 | 57 (1.6%) | 75 (1.1%) |
| $800 to $1,499 | 3,397 (94.2%) | 45 (0.6%) |
| Total | 3,605 (100.0%) | 7,117 (100.0%) |
Health & Disability in Doral
Health Insurance Coverage by Age in Doral
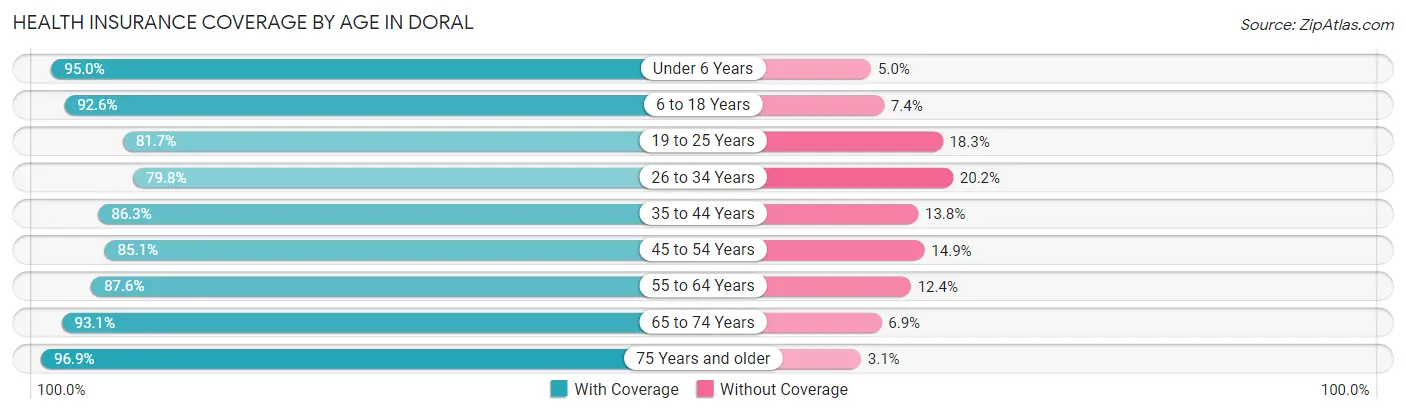
| Age Bracket | With Coverage | Without Coverage |
| Under 6 Years | 4,563 (95.0%) | 240 (5.0%) |
| 6 to 18 Years | 14,101 (92.6%) | 1,125 (7.4%) |
| 19 to 25 Years | 5,397 (81.7%) | 1,210 (18.3%) |
| 26 to 34 Years | 6,874 (79.8%) | 1,744 (20.2%) |
| 35 to 44 Years | 11,326 (86.3%) | 1,806 (13.8%) |
| 45 to 54 Years | 11,078 (85.1%) | 1,945 (14.9%) |
| 55 to 64 Years | 6,224 (87.6%) | 880 (12.4%) |
| 65 to 74 Years | 3,355 (93.1%) | 249 (6.9%) |
| 75 Years and older | 2,350 (96.9%) | 75 (3.1%) |
| Total | 65,268 (87.6%) | 9,274 (12.4%) |
Health Insurance Coverage by Citizenship Status in Doral
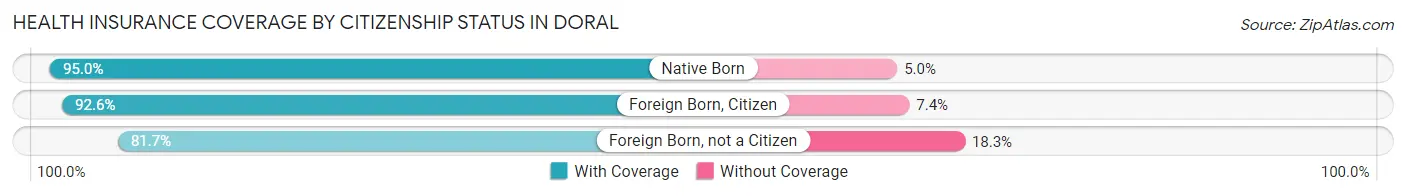
| Citizenship Status | With Coverage | Without Coverage |
| Native Born | 4,563 (95.0%) | 240 (5.0%) |
| Foreign Born, Citizen | 14,101 (92.6%) | 1,125 (7.4%) |
| Foreign Born, not a Citizen | 5,397 (81.7%) | 1,210 (18.3%) |
Health Insurance Coverage by Household Income in Doral
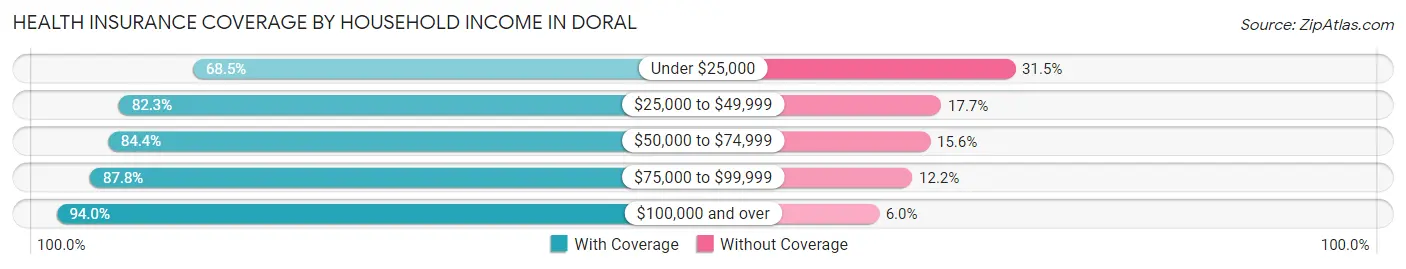
| Household Income | With Coverage | Without Coverage |
| Under $25,000 | 4,374 (68.5%) | 2,015 (31.5%) |
| $25,000 to $49,999 | 8,792 (82.3%) | 1,887 (17.7%) |
| $50,000 to $74,999 | 10,996 (84.4%) | 2,032 (15.6%) |
| $75,000 to $99,999 | 9,590 (87.8%) | 1,337 (12.2%) |
| $100,000 and over | 31,516 (94.0%) | 2,003 (6.0%) |
Public vs Private Health Insurance Coverage by Age in Doral
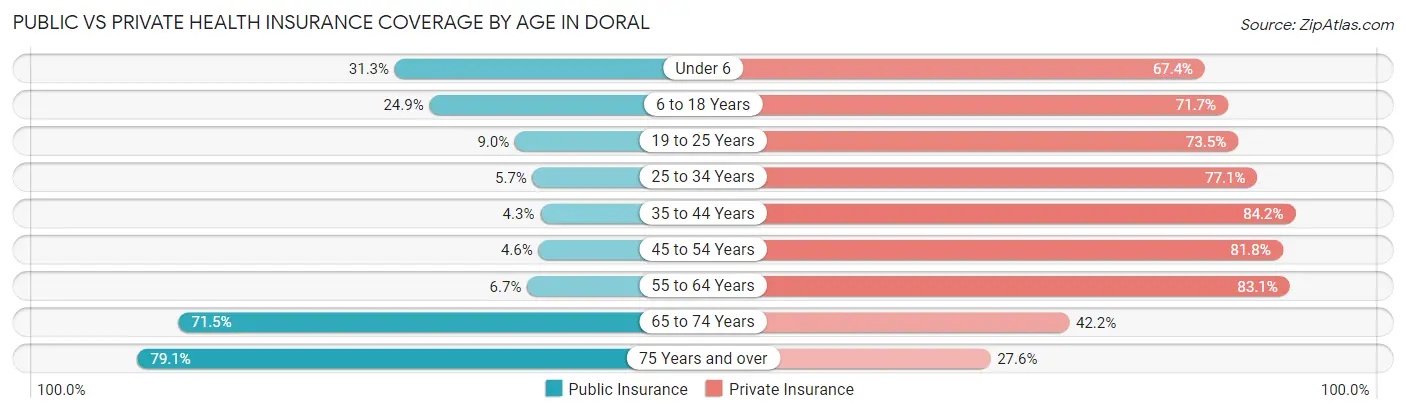
| Age Bracket | Public Insurance | Private Insurance |
| Under 6 | 1,502 (31.3%) | 3,237 (67.4%) |
| 6 to 18 Years | 3,783 (24.8%) | 10,909 (71.7%) |
| 19 to 25 Years | 592 (9.0%) | 4,859 (73.5%) |
| 25 to 34 Years | 490 (5.7%) | 6,646 (77.1%) |
| 35 to 44 Years | 564 (4.3%) | 11,053 (84.2%) |
| 45 to 54 Years | 600 (4.6%) | 10,653 (81.8%) |
| 55 to 64 Years | 476 (6.7%) | 5,905 (83.1%) |
| 65 to 74 Years | 2,575 (71.5%) | 1,520 (42.2%) |
| 75 Years and over | 1,917 (79.0%) | 668 (27.6%) |
| Total | 12,499 (16.8%) | 55,450 (74.4%) |
Disability Status by Sex by Age in Doral
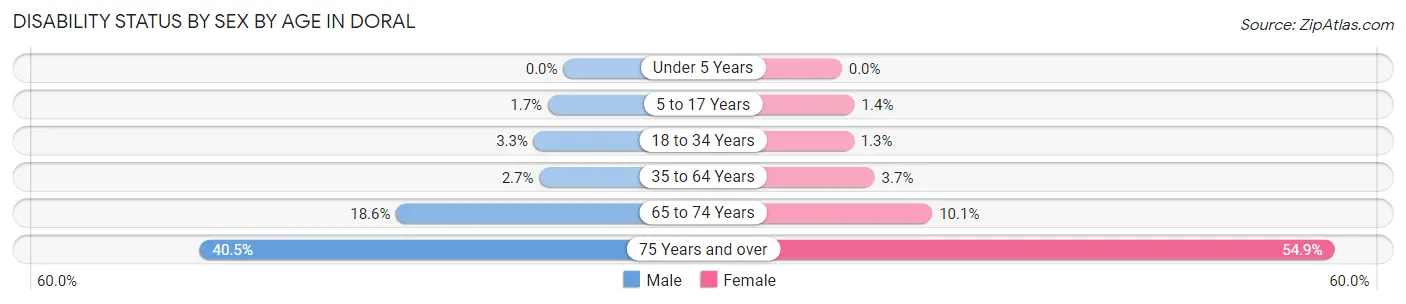
| Age Bracket | Male | Female |
| Under 5 Years | 0 (0.0%) | 0 (0.0%) |
| 5 to 17 Years | 125 (1.7%) | 108 (1.4%) |
| 18 to 34 Years | 292 (3.3%) | 98 (1.3%) |
| 35 to 64 Years | 438 (2.7%) | 619 (3.7%) |
| 65 to 74 Years | 240 (18.6%) | 233 (10.1%) |
| 75 Years and over | 444 (40.5%) | 729 (54.8%) |
Disability Class by Sex by Age in Doral
Disability Class: Hearing Difficulty
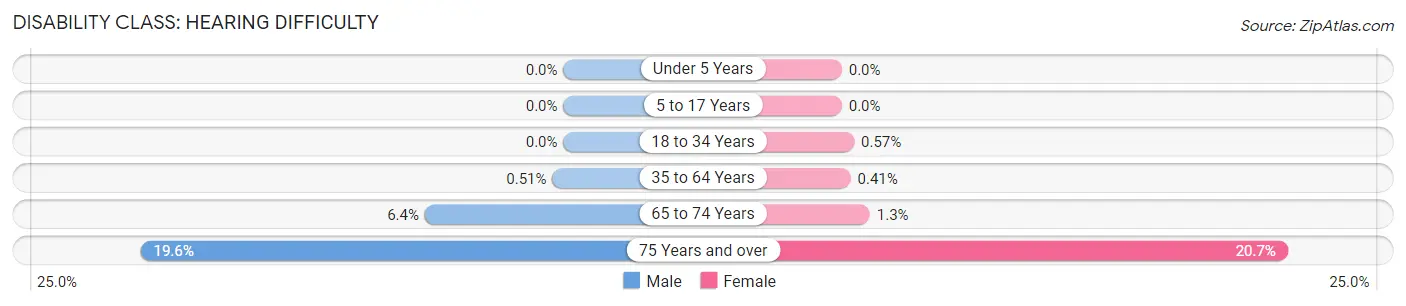
| Age Bracket | Male | Female |
| Under 5 Years | 0 (0.0%) | 0 (0.0%) |
| 5 to 17 Years | 0 (0.0%) | 0 (0.0%) |
| 18 to 34 Years | 0 (0.0%) | 42 (0.6%) |
| 35 to 64 Years | 84 (0.5%) | 69 (0.4%) |
| 65 to 74 Years | 83 (6.4%) | 30 (1.3%) |
| 75 Years and over | 215 (19.6%) | 275 (20.7%) |
Disability Class: Vision Difficulty
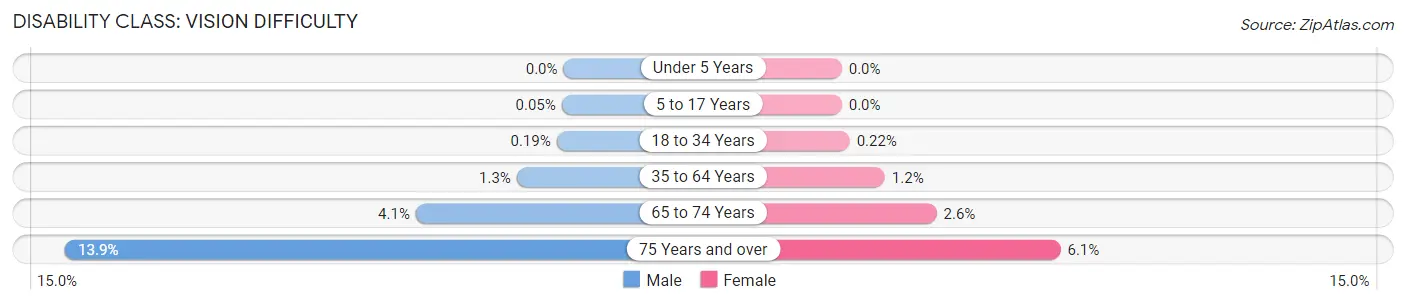
| Age Bracket | Male | Female |
| Under 5 Years | 0 (0.0%) | 0 (0.0%) |
| 5 to 17 Years | 4 (0.1%) | 0 (0.0%) |
| 18 to 34 Years | 17 (0.2%) | 16 (0.2%) |
| 35 to 64 Years | 212 (1.3%) | 203 (1.2%) |
| 65 to 74 Years | 53 (4.1%) | 61 (2.6%) |
| 75 Years and over | 152 (13.9%) | 81 (6.1%) |
Disability Class: Cognitive Difficulty
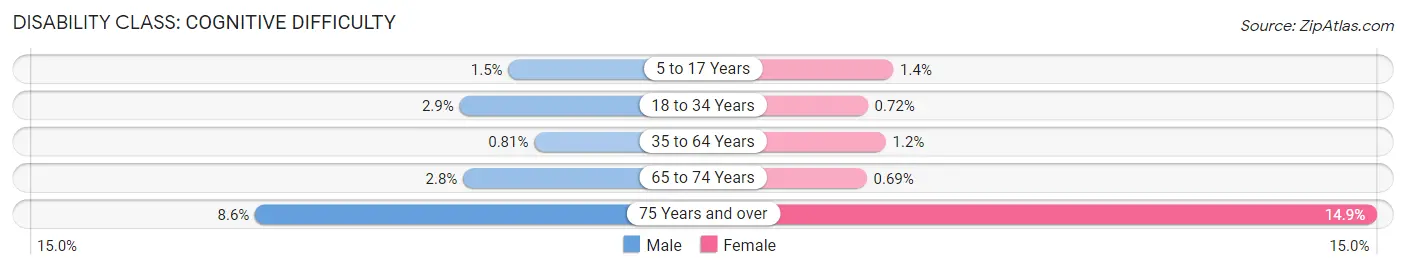
| Age Bracket | Male | Female |
| 5 to 17 Years | 111 (1.5%) | 108 (1.4%) |
| 18 to 34 Years | 256 (2.9%) | 53 (0.7%) |
| 35 to 64 Years | 132 (0.8%) | 207 (1.2%) |
| 65 to 74 Years | 36 (2.8%) | 16 (0.7%) |
| 75 Years and over | 94 (8.6%) | 198 (14.9%) |
Disability Class: Ambulatory Difficulty
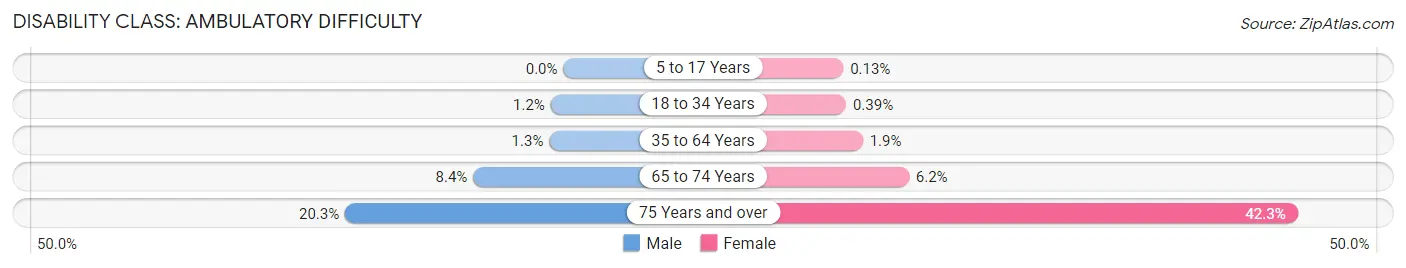
| Age Bracket | Male | Female |
| 5 to 17 Years | 0 (0.0%) | 10 (0.1%) |
| 18 to 34 Years | 105 (1.2%) | 29 (0.4%) |
| 35 to 64 Years | 214 (1.3%) | 328 (1.9%) |
| 65 to 74 Years | 108 (8.4%) | 144 (6.2%) |
| 75 Years and over | 222 (20.3%) | 562 (42.3%) |
Disability Class: Self-Care Difficulty
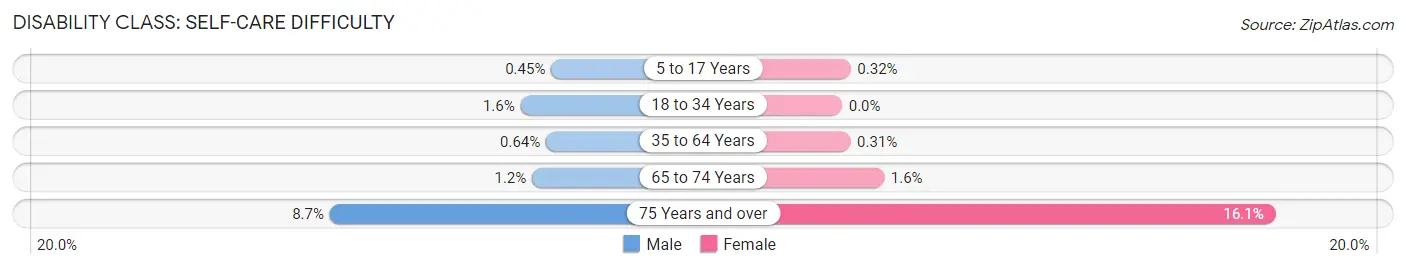
| Age Bracket | Male | Female |
| 5 to 17 Years | 33 (0.4%) | 24 (0.3%) |
| 18 to 34 Years | 141 (1.6%) | 0 (0.0%) |
| 35 to 64 Years | 105 (0.6%) | 53 (0.3%) |
| 65 to 74 Years | 15 (1.2%) | 36 (1.6%) |
| 75 Years and over | 95 (8.7%) | 214 (16.1%) |
Technology Access in Doral
Computing Device Access in Doral
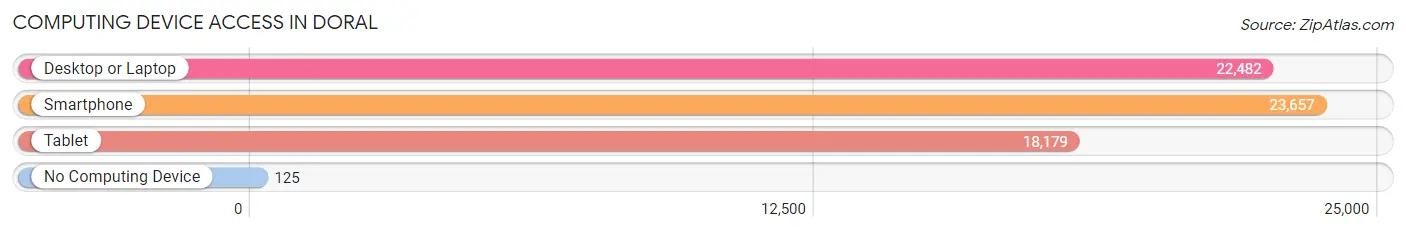
| Device Type | # Households | % Households |
| Desktop or Laptop | 22,482 | 92.7% |
| Smartphone | 23,657 | 97.6% |
| Tablet | 18,179 | 75.0% |
| No Computing Device | 125 | 0.5% |
| Total | 24,247 | 100.0% |
Internet Access in Doral
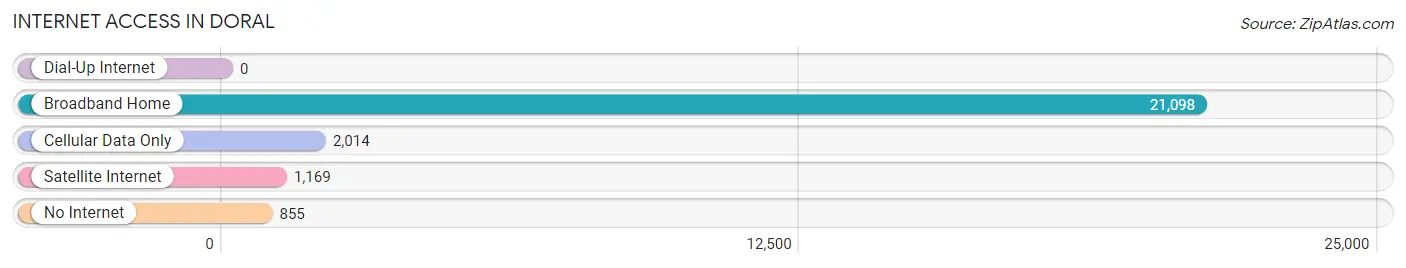
| Internet Type | # Households | % Households |
| Dial-Up Internet | 0 | 0.0% |
| Broadband Home | 21,098 | 87.0% |
| Cellular Data Only | 2,014 | 8.3% |
| Satellite Internet | 1,169 | 4.8% |
| No Internet | 855 | 3.5% |
| Total | 24,247 | 100.0% |
Doral Summary
Doral is a city located in Miami-Dade County, Florida, United States. It is located just west of Miami International Airport and is part of the Miami metropolitan area. The city was incorporated in 2003 and has a population of approximately 60,000 people.
Geography
Doral is located in the western part of Miami-Dade County, Florida. It is bordered by the cities of Miami Springs to the east, Hialeah to the west, and Sweetwater to the south. The city is situated on the Miami River and is approximately 10 miles west of Miami International Airport. The city covers an area of approximately 10 square miles and has a total land area of 8.3 square miles.
Climate
Doral has a tropical monsoon climate, with hot and humid summers and mild winters. The average temperature in the summer is around 90°F, while in the winter it is around 70°F. The city receives an average of 60 inches of rain per year, with the majority of it falling in the summer months.
Demographics
As of the 2010 census, the population of Doral was 53,441. The racial makeup of the city was 57.2% White, 22.3% Hispanic or Latino, 15.3% African American, and 5.2% other races. The median household income was $50,819, and the median family income was $54,819.
Economy
Doral is home to many businesses and industries, including manufacturing, retail, and tourism. The city is home to several large companies, such as Carnival Cruise Lines, Ryder Systems, and Microsoft. The city also has a large number of small businesses, such as restaurants, shops, and other services.
The city is also home to several golf courses, including the Trump National Doral Miami, which is one of the most prestigious golf courses in the world. The city also has a large number of hotels, including the Trump International Hotel and Tower, which is one of the most luxurious hotels in the world.
History
Doral was originally part of a large tract of land owned by the Dade County School Board. In the 1950s, the land was sold to developers, who began to build homes and businesses in the area. The city was officially incorporated in 2003 and has since grown to become one of the most desirable cities in Miami-Dade County.
Conclusion
Doral is a vibrant city located in Miami-Dade County, Florida. It is home to many businesses and industries, including manufacturing, retail, and tourism. The city has a diverse population and a strong economy. It is also home to several golf courses and luxurious hotels. Doral has a rich history and is an important part of the Miami metropolitan area.
Common Questions
What is Per Capita Income in Doral?
Per Capita income in Doral is $35,751.
What is the Median Family Income in Doral?
Median Family Income in Doral is $84,476.
What is the Median Household income in Doral?
Median Household Income in Doral is $83,823.
What is Income or Wage Gap in Doral?
Income or Wage Gap in Doral is 33.6%.
Women in Doral earn 66.4 cents for every dollar earned by a man.
What is Family Income Deficit in Doral?
Family Income Deficit in Doral is $11,504.
Families that are below poverty line in Doral earn $11,504 less on average than the poverty threshold level.
What is Inequality or Gini Index in Doral?
Inequality or Gini Index in Doral is 0.44.
What is the Total Population of Doral?
Total Population of Doral is 74,891.
What is the Total Male Population of Doral?
Total Male Population of Doral is 37,174.
What is the Total Female Population of Doral?
Total Female Population of Doral is 37,717.
What is the Ratio of Males per 100 Females in Doral?
There are 98.56 Males per 100 Females in Doral.
What is the Ratio of Females per 100 Males in Doral?
There are 101.46 Females per 100 Males in Doral.
What is the Median Population Age in Doral?
Median Population Age in Doral is 36.8 Years.
What is the Average Family Size in Doral
Average Family Size in Doral is 3.4 People.
What is the Average Household Size in Doral
Average Household Size in Doral is 3.1 People.
How Large is the Labor Force in Doral?
There are 40,290 People in the Labor Forcein in Doral.
What is the Percentage of People in the Labor Force in Doral?
69.0% of People are in the Labor Force in Doral.
What is the Unemployment Rate in Doral?
Unemployment Rate in Doral is 3.1%.