Greenacres, FL Map & Demographics
Greenacres Map
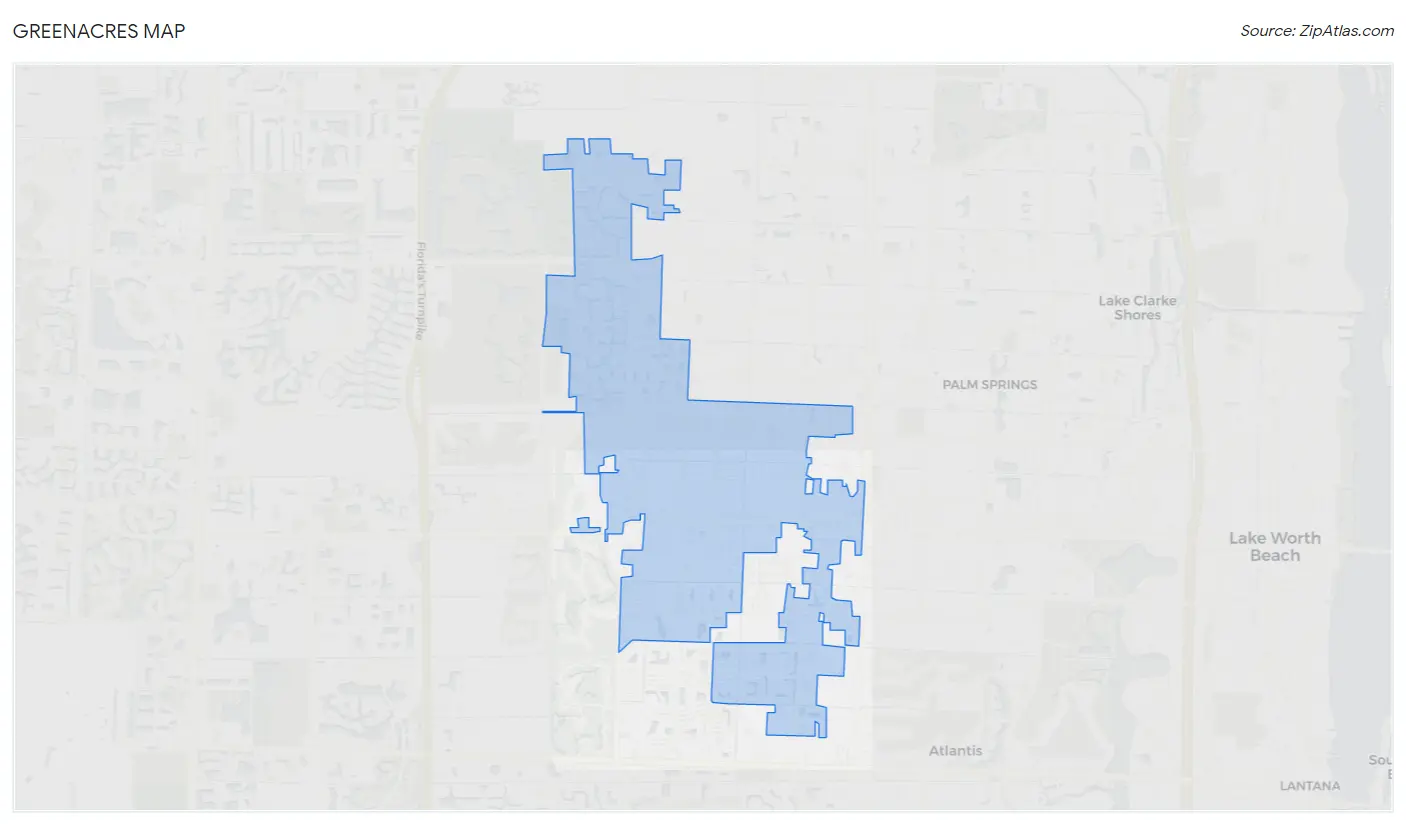
Greenacres Overview
$34,117
PER CAPITA INCOME
$65,993
AVG FAMILY INCOME
$58,981
AVG HOUSEHOLD INCOME
6.7%
WAGE / INCOME GAP [ % ]
93.3¢/ $1
WAGE / INCOME GAP [ $ ]
0.52
INEQUALITY / GINI INDEX
43,651
TOTAL POPULATION
21,050
MALE POPULATION
22,601
FEMALE POPULATION
93.14
MALES / 100 FEMALES
107.37
FEMALES / 100 MALES
38.7
MEDIAN AGE
3.3
AVG FAMILY SIZE
2.8
AVG HOUSEHOLD SIZE
22,977
LABOR FORCE [ PEOPLE ]
65.4%
PERCENT IN LABOR FORCE
5.4%
UNEMPLOYMENT RATE
Greenacres Area Codes
Income in Greenacres
Income Overview in Greenacres
Per Capita Income in Greenacres is $34,117, while median incomes of families and households are $65,993 and $58,981 respectively.
| Characteristic | Number | Measure |
| Per Capita Income | 43,651 | $34,117 |
| Median Family Income | 10,761 | $65,993 |
| Mean Family Income | 10,761 | $88,677 |
| Median Household Income | 15,535 | $58,981 |
| Mean Household Income | 15,535 | $92,024 |
| Income Deficit | 10,761 | $0 |
| Wage / Income Gap (%) | 43,651 | 6.68% |
| Wage / Income Gap ($) | 43,651 | 93.32¢ per $1 |
| Gini / Inequality Index | 43,651 | 0.52 |
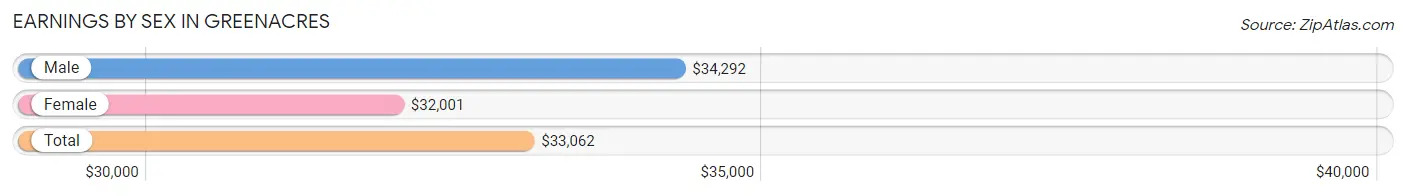
Earnings by Sex in Greenacres
Average Earnings in Greenacres are $33,062, $34,292 for men and $32,001 for women, a difference of 6.7%.
| Sex | Number | Average Earnings |
| Male | 11,853 (50.2%) | $34,292 |
| Female | 11,736 (49.7%) | $32,001 |
| Total | 23,589 (100.0%) | $33,062 |
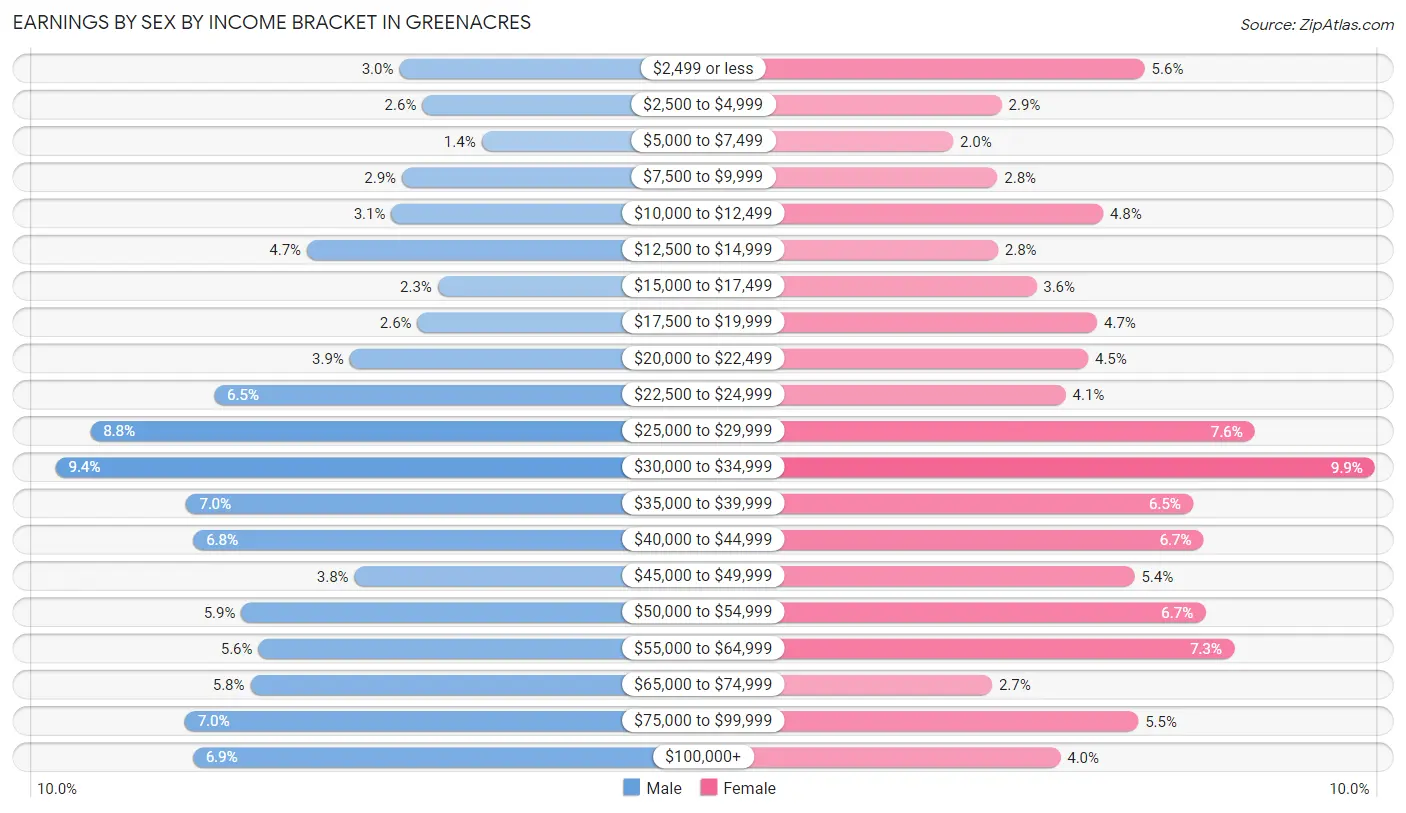
Earnings by Sex by Income Bracket in Greenacres
The most common earnings brackets in Greenacres are $30,000 to $34,999 for men (1,116 | 9.4%) and $30,000 to $34,999 for women (1,161 | 9.9%).
| Income | Male | Female |
| $2,499 or less | 353 (3.0%) | 655 (5.6%) |
| $2,500 to $4,999 | 302 (2.5%) | 340 (2.9%) |
| $5,000 to $7,499 | 171 (1.4%) | 234 (2.0%) |
| $7,500 to $9,999 | 347 (2.9%) | 331 (2.8%) |
| $10,000 to $12,499 | 371 (3.1%) | 563 (4.8%) |
| $12,500 to $14,999 | 558 (4.7%) | 332 (2.8%) |
| $15,000 to $17,499 | 268 (2.3%) | 417 (3.5%) |
| $17,500 to $19,999 | 313 (2.6%) | 551 (4.7%) |
| $20,000 to $22,499 | 464 (3.9%) | 530 (4.5%) |
| $22,500 to $24,999 | 764 (6.5%) | 481 (4.1%) |
| $25,000 to $29,999 | 1,040 (8.8%) | 897 (7.6%) |
| $30,000 to $34,999 | 1,116 (9.4%) | 1,161 (9.9%) |
| $35,000 to $39,999 | 826 (7.0%) | 760 (6.5%) |
| $40,000 to $44,999 | 811 (6.8%) | 784 (6.7%) |
| $45,000 to $49,999 | 453 (3.8%) | 632 (5.4%) |
| $50,000 to $54,999 | 704 (5.9%) | 787 (6.7%) |
| $55,000 to $64,999 | 666 (5.6%) | 851 (7.2%) |
| $65,000 to $74,999 | 684 (5.8%) | 319 (2.7%) |
| $75,000 to $99,999 | 830 (7.0%) | 641 (5.5%) |
| $100,000+ | 812 (6.9%) | 470 (4.0%) |
| Total | 11,853 (100.0%) | 11,736 (100.0%) |
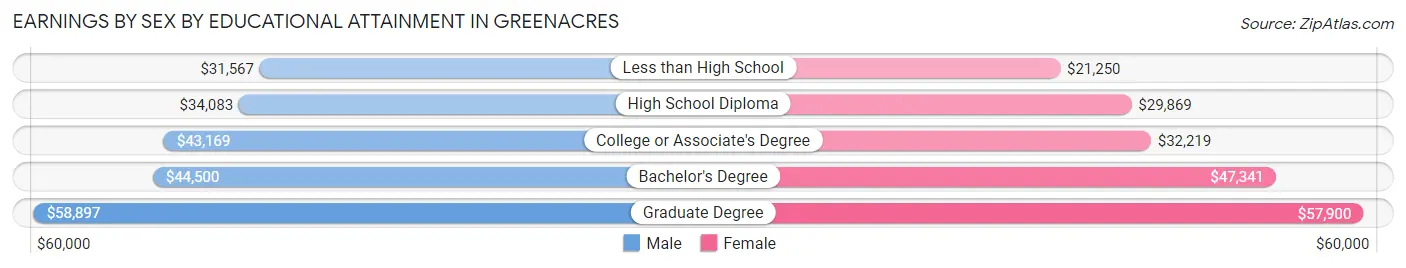
Earnings by Sex by Educational Attainment in Greenacres
Average earnings in Greenacres are $38,449 for men and $33,272 for women, a difference of 13.5%. Men with an educational attainment of graduate degree enjoy the highest average annual earnings of $58,897, while those with less than high school education earn the least with $31,567. Women with an educational attainment of graduate degree earn the most with the average annual earnings of $57,900, while those with less than high school education have the smallest earnings of $21,250.
| Educational Attainment | Male Income | Female Income |
| Less than High School | $31,567 | $21,250 |
| High School Diploma | $34,083 | $29,869 |
| College or Associate's Degree | $43,169 | $32,219 |
| Bachelor's Degree | $44,500 | $47,341 |
| Graduate Degree | $58,897 | $57,900 |
| Total | $38,449 | $33,272 |
Family Income in Greenacres
Family Income Brackets in Greenacres
According to the Greenacres family income data, there are 2,690 families falling into the $50,000 to $74,999 income range, which is the most common income bracket and makes up 25.0% of all families. Conversely, the less than $10,000 income bracket is the least frequent group with only 291 families (2.7%) belonging to this category.
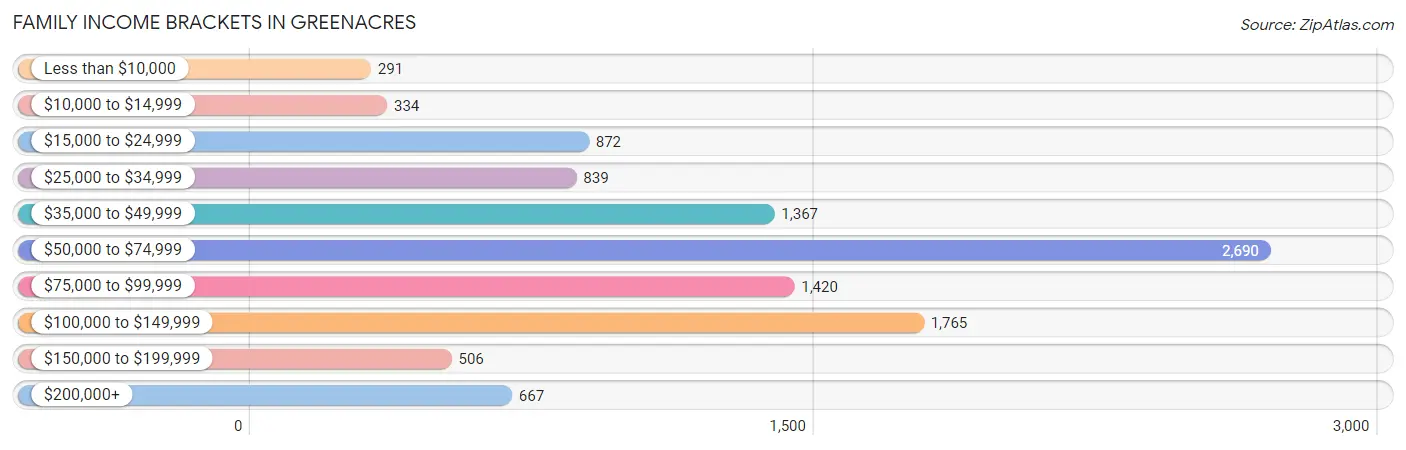
| Income Bracket | # Families | % Families |
| Less than $10,000 | 291 | 2.7% |
| $10,000 to $14,999 | 334 | 3.1% |
| $15,000 to $24,999 | 872 | 8.1% |
| $25,000 to $34,999 | 839 | 7.8% |
| $35,000 to $49,999 | 1,367 | 12.7% |
| $50,000 to $74,999 | 2,690 | 25.0% |
| $75,000 to $99,999 | 1,420 | 13.2% |
| $100,000 to $149,999 | 1,765 | 16.4% |
| $150,000 to $199,999 | 506 | 4.7% |
| $200,000+ | 667 | 6.2% |
Family Income by Famaliy Size in Greenacres
6-person families (142 | 1.3%) account for the highest median family income in Greenacres with $235,436 per family, while 6-person families (142 | 1.3%) have the highest median income of $39,239 per family member.
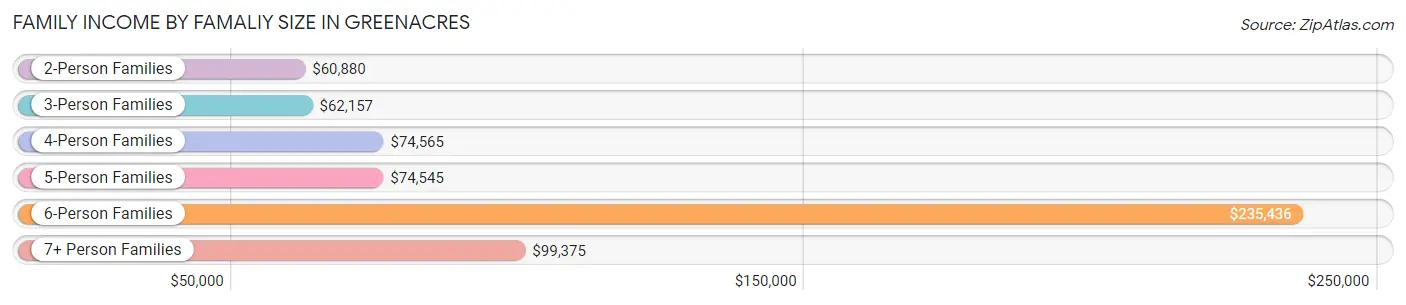
| Income Bracket | # Families | Median Income |
| 2-Person Families | 4,845 (45.0%) | $60,880 |
| 3-Person Families | 3,001 (27.9%) | $62,157 |
| 4-Person Families | 1,604 (14.9%) | $74,565 |
| 5-Person Families | 970 (9.0%) | $74,545 |
| 6-Person Families | 142 (1.3%) | $235,436 |
| 7+ Person Families | 199 (1.8%) | $99,375 |
| Total | 10,761 (100.0%) | $65,993 |
Family Income by Number of Earners in Greenacres
The median family income in Greenacres is $65,993, with families comprising 3+ earners (1,254) having the highest median family income of $116,127, while families with no earners (1,533) have the lowest median family income of $31,542, accounting for 11.7% and 14.2% of families, respectively.
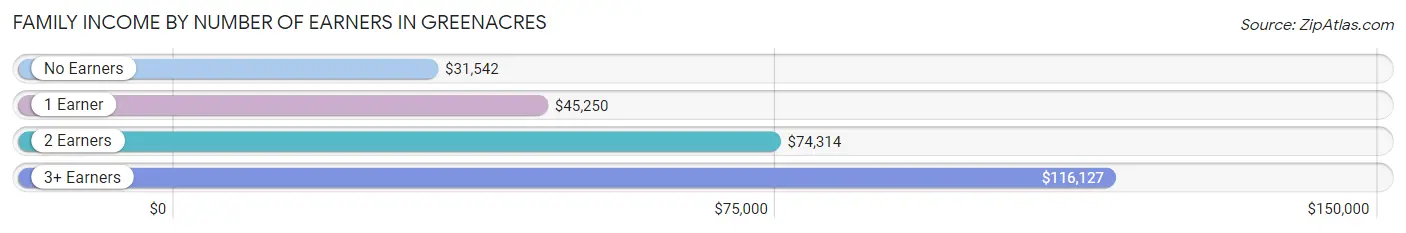
| Number of Earners | # Families | Median Income |
| No Earners | 1,533 (14.2%) | $31,542 |
| 1 Earner | 3,197 (29.7%) | $45,250 |
| 2 Earners | 4,777 (44.4%) | $74,314 |
| 3+ Earners | 1,254 (11.7%) | $116,127 |
| Total | 10,761 (100.0%) | $65,993 |
Household Income in Greenacres
Household Income Brackets in Greenacres
With 3,464 households falling in the category, the $50,000 to $74,999 income range is the most frequent in Greenacres, accounting for 22.3% of all households. In contrast, only 482 households (3.1%) fall into the $10,000 to $14,999 income bracket, making it the least populous group.
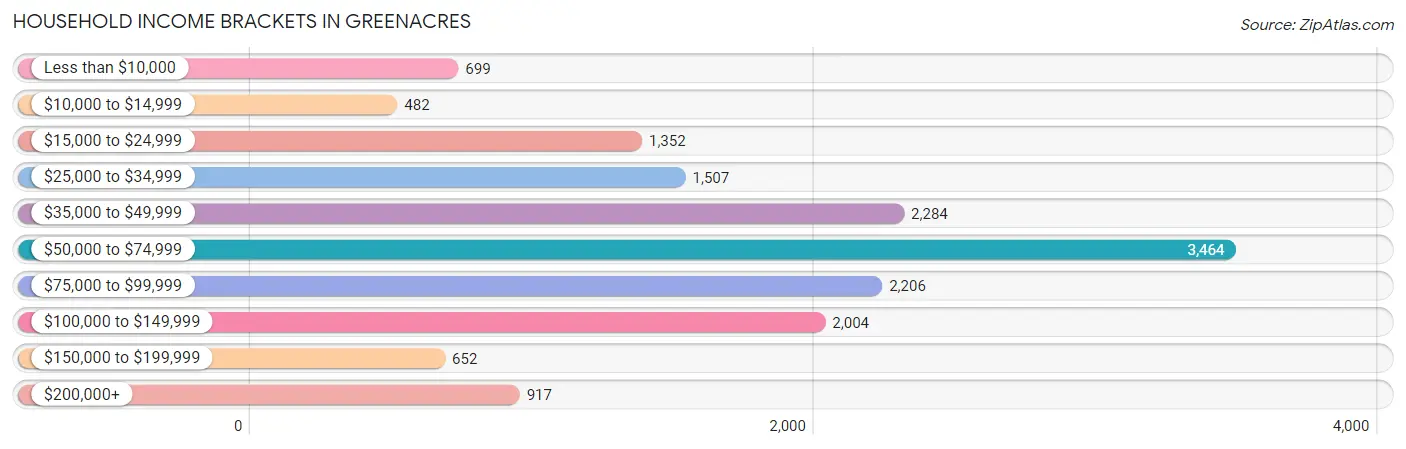
| Income Bracket | # Households | % Households |
| Less than $10,000 | 699 | 4.5% |
| $10,000 to $14,999 | 482 | 3.1% |
| $15,000 to $24,999 | 1,352 | 8.7% |
| $25,000 to $34,999 | 1,507 | 9.7% |
| $35,000 to $49,999 | 2,284 | 14.7% |
| $50,000 to $74,999 | 3,464 | 22.3% |
| $75,000 to $99,999 | 2,206 | 14.2% |
| $100,000 to $149,999 | 2,004 | 12.9% |
| $150,000 to $199,999 | 652 | 4.2% |
| $200,000+ | 917 | 5.9% |
Household Income by Householder Age in Greenacres
The median household income in Greenacres is $58,981, with the highest median household income of $65,809 found in the 45 to 64 years age bracket for the primary householder. A total of 6,045 households (38.9%) fall into this category. Meanwhile, the 65+ years age bracket for the primary householder has the lowest median household income of $41,578, with 4,396 households (28.3%) in this group.
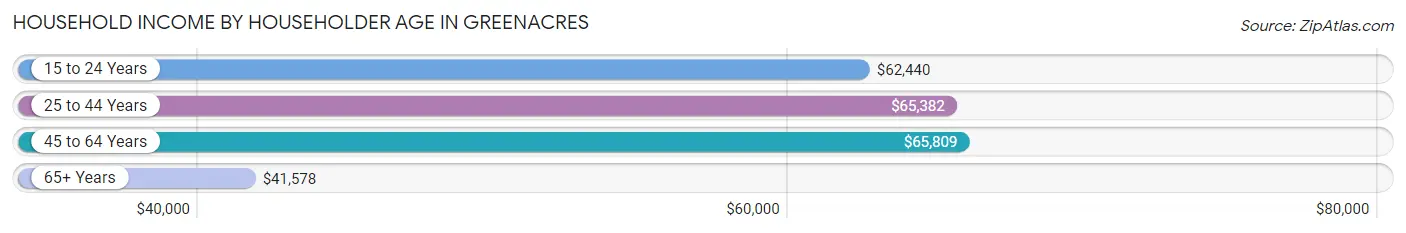
| Income Bracket | # Households | Median Income |
| 15 to 24 Years | 338 (2.2%) | $62,440 |
| 25 to 44 Years | 4,756 (30.6%) | $65,382 |
| 45 to 64 Years | 6,045 (38.9%) | $65,809 |
| 65+ Years | 4,396 (28.3%) | $41,578 |
| Total | 15,535 (100.0%) | $58,981 |
Poverty in Greenacres
Income Below Poverty by Sex and Age in Greenacres
With 13.0% poverty level for males and 16.4% for females among the residents of Greenacres, 6 to 11 year old males and under 5 year old females are the most vulnerable to poverty, with 407 males (27.3%) and 385 females (29.4%) in their respective age groups living below the poverty level.
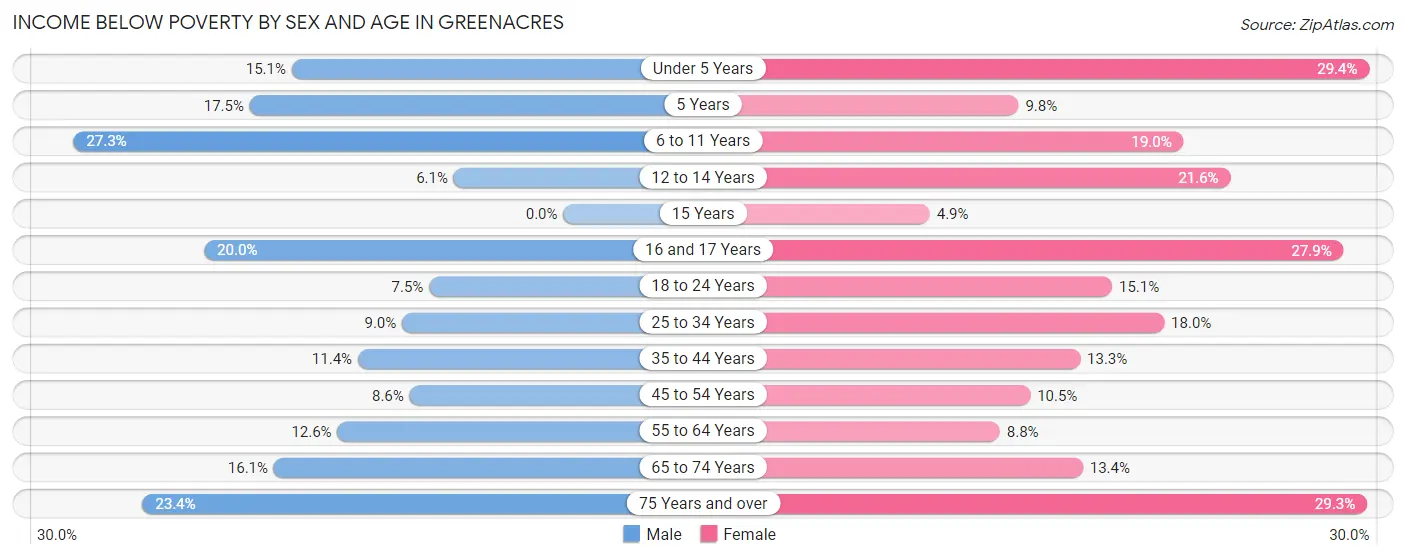
| Age Bracket | Male | Female |
| Under 5 Years | 226 (15.1%) | 385 (29.4%) |
| 5 Years | 22 (17.5%) | 12 (9.8%) |
| 6 to 11 Years | 407 (27.3%) | 321 (19.0%) |
| 12 to 14 Years | 42 (6.1%) | 132 (21.6%) |
| 15 Years | 0 (0.0%) | 15 (4.9%) |
| 16 and 17 Years | 96 (20.0%) | 114 (27.9%) |
| 18 to 24 Years | 165 (7.5%) | 228 (15.0%) |
| 25 to 34 Years | 280 (9.0%) | 580 (17.9%) |
| 35 to 44 Years | 311 (11.4%) | 424 (13.3%) |
| 45 to 54 Years | 245 (8.6%) | 282 (10.5%) |
| 55 to 64 Years | 297 (12.6%) | 267 (8.8%) |
| 65 to 74 Years | 281 (16.1%) | 276 (13.4%) |
| 75 Years and over | 331 (23.4%) | 600 (29.2%) |
| Total | 2,703 (13.0%) | 3,636 (16.4%) |
Income Above Poverty by Sex and Age in Greenacres
According to the poverty statistics in Greenacres, males aged 15 years and females aged 15 years are the age groups that are most secure financially, with 100.0% of males and 95.1% of females in these age groups living above the poverty line.
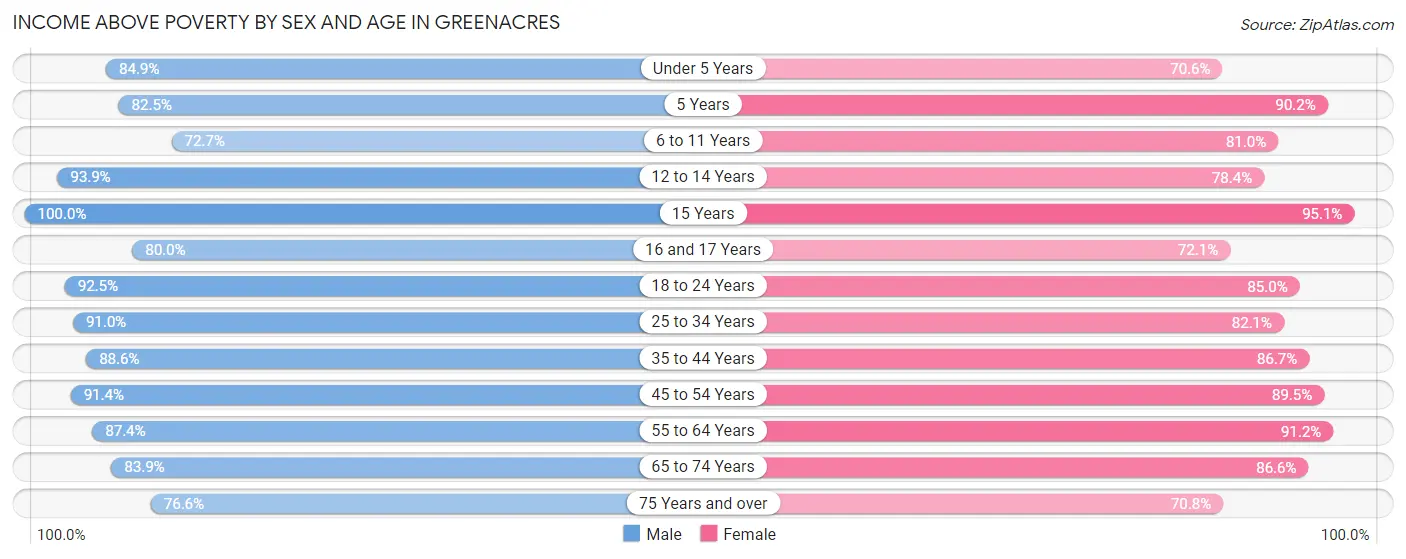
| Age Bracket | Male | Female |
| Under 5 Years | 1,269 (84.9%) | 926 (70.6%) |
| 5 Years | 104 (82.5%) | 110 (90.2%) |
| 6 to 11 Years | 1,085 (72.7%) | 1,366 (81.0%) |
| 12 to 14 Years | 646 (93.9%) | 478 (78.4%) |
| 15 Years | 162 (100.0%) | 291 (95.1%) |
| 16 and 17 Years | 384 (80.0%) | 294 (72.1%) |
| 18 to 24 Years | 2,045 (92.5%) | 1,287 (85.0%) |
| 25 to 34 Years | 2,838 (91.0%) | 2,652 (82.1%) |
| 35 to 44 Years | 2,407 (88.6%) | 2,772 (86.7%) |
| 45 to 54 Years | 2,618 (91.4%) | 2,407 (89.5%) |
| 55 to 64 Years | 2,064 (87.4%) | 2,766 (91.2%) |
| 65 to 74 Years | 1,462 (83.9%) | 1,781 (86.6%) |
| 75 Years and over | 1,081 (76.6%) | 1,451 (70.8%) |
| Total | 18,165 (87.1%) | 18,581 (83.6%) |
Income Below Poverty Among Married-Couple Families in Greenacres
The poverty statistics for married-couple families in Greenacres show that 11.7% or 749 of the total 6,377 families live below the poverty line. Families with 3 or 4 children have the highest poverty rate of 13.1%, comprising of 38 families. On the other hand, families with 5 or more children have the lowest poverty rate of 0.0%, which includes 0 families.
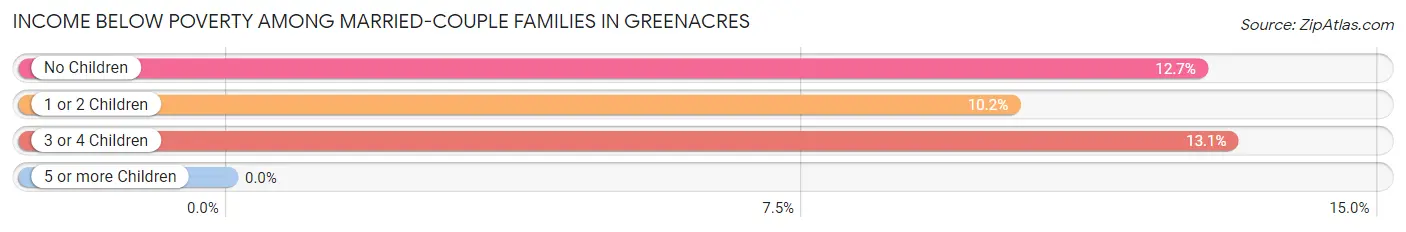
| Children | Above Poverty | Below Poverty |
| No Children | 3,416 (87.3%) | 495 (12.7%) |
| 1 or 2 Children | 1,899 (89.8%) | 216 (10.2%) |
| 3 or 4 Children | 253 (86.9%) | 38 (13.1%) |
| 5 or more Children | 60 (100.0%) | 0 (0.0%) |
| Total | 5,628 (88.2%) | 749 (11.7%) |
Income Below Poverty Among Single-Parent Households in Greenacres
According to the poverty data in Greenacres, 3.5% or 35 single-father households and 16.2% or 550 single-mother households are living below the poverty line. Among single-father households, those with 3 or 4 children have the highest poverty rate, with 35 households (45.5%) experiencing poverty. Likewise, among single-mother households, those with 5 or more children have the highest poverty rate, with 25 households (78.1%) falling below the poverty line.
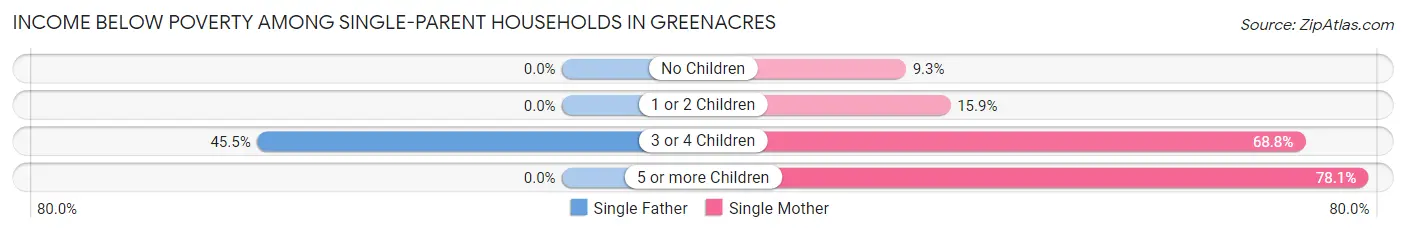
| Children | Single Father | Single Mother |
| No Children | 0 (0.0%) | 154 (9.2%) |
| 1 or 2 Children | 0 (0.0%) | 239 (15.9%) |
| 3 or 4 Children | 35 (45.5%) | 132 (68.8%) |
| 5 or more Children | 0 (0.0%) | 25 (78.1%) |
| Total | 35 (3.5%) | 550 (16.2%) |
Income Below Poverty Among Married-Couple vs Single-Parent Households in Greenacres
The poverty data for Greenacres shows that 749 of the married-couple family households (11.7%) and 585 of the single-parent households (13.3%) are living below the poverty level. Within the married-couple family households, those with 3 or 4 children have the highest poverty rate, with 38 households (13.1%) falling below the poverty line. Among the single-parent households, those with 5 or more children have the highest poverty rate, with 25 household (78.1%) living below poverty.
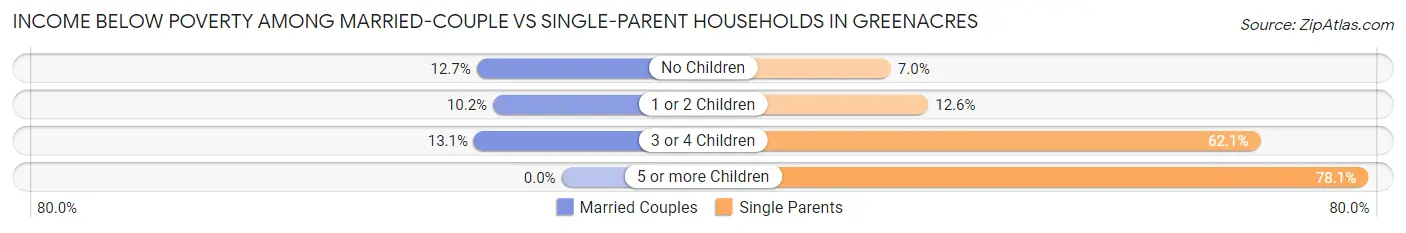
| Children | Married-Couple Families | Single-Parent Households |
| No Children | 495 (12.7%) | 154 (7.0%) |
| 1 or 2 Children | 216 (10.2%) | 239 (12.6%) |
| 3 or 4 Children | 38 (13.1%) | 167 (62.1%) |
| 5 or more Children | 0 (0.0%) | 25 (78.1%) |
| Total | 749 (11.7%) | 585 (13.3%) |
Race in Greenacres
The most populous races in Greenacres are Hispanic or Latino (18,553 | 42.5%), White / Caucasian (18,171 | 41.6%), and Black / African American (12,007 | 27.5%).
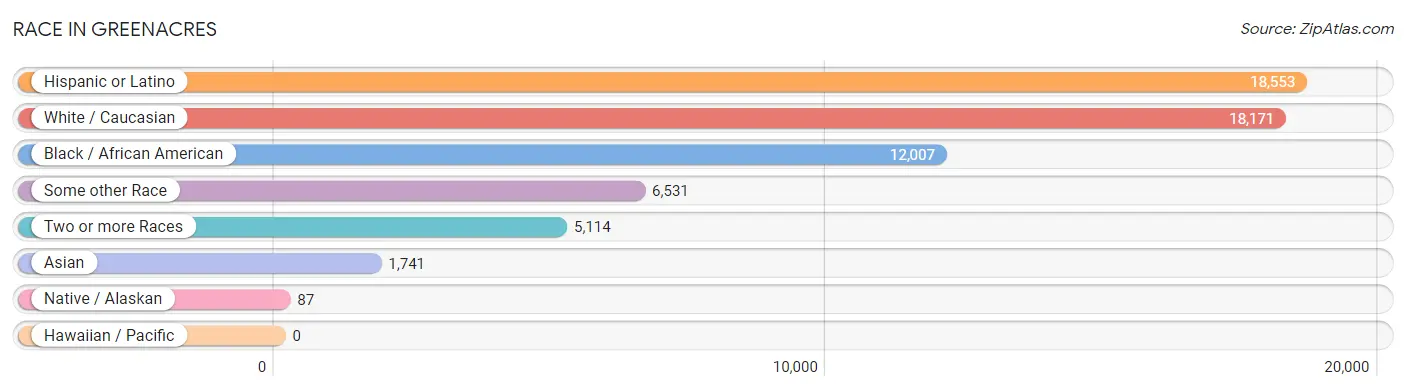
| Race | # Population | % Population |
| Asian | 1,741 | 4.0% |
| Black / African American | 12,007 | 27.5% |
| Hawaiian / Pacific | 0 | 0.0% |
| Hispanic or Latino | 18,553 | 42.5% |
| Native / Alaskan | 87 | 0.2% |
| White / Caucasian | 18,171 | 41.6% |
| Two or more Races | 5,114 | 11.7% |
| Some other Race | 6,531 | 15.0% |
| Total | 43,651 | 100.0% |
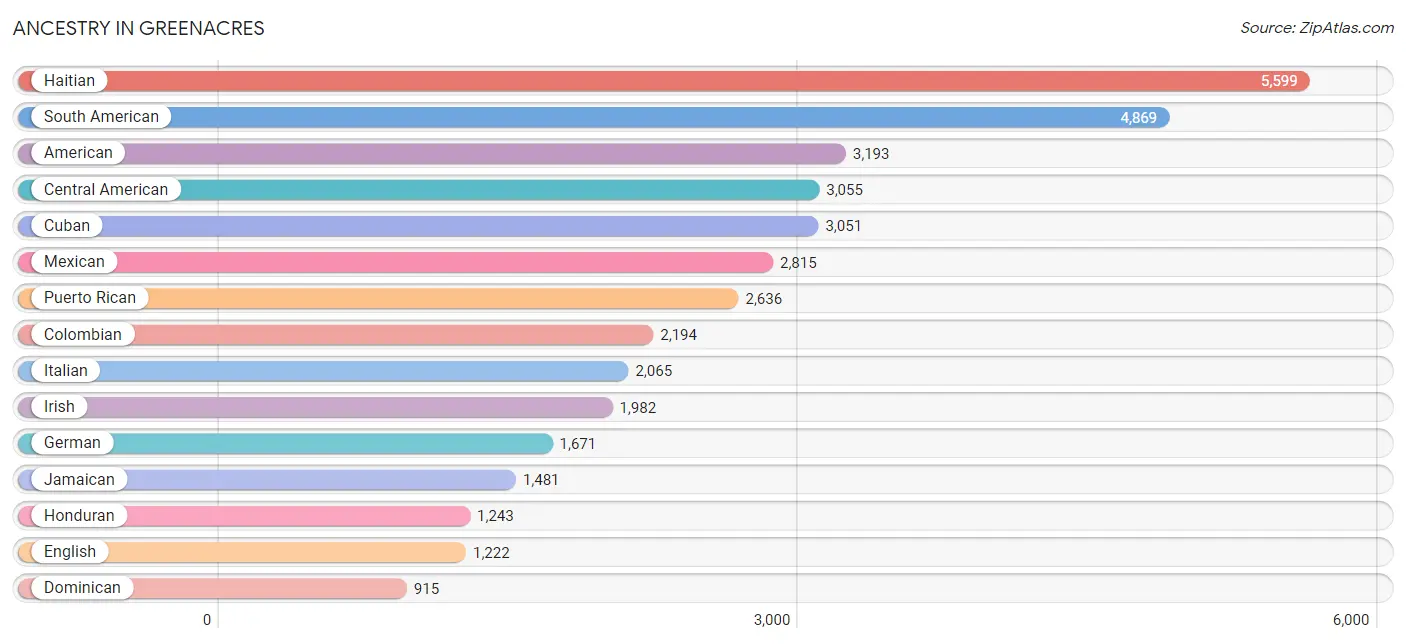
Ancestry in Greenacres
The most populous ancestries reported in Greenacres are Haitian (5,599 | 12.8%), South American (4,869 | 11.2%), American (3,193 | 7.3%), Central American (3,055 | 7.0%), and Cuban (3,051 | 7.0%), together accounting for 45.3% of all Greenacres residents.
| Ancestry | # Population | % Population |
| African | 392 | 0.9% |
| American | 3,193 | 7.3% |
| Arab | 62 | 0.1% |
| Argentinean | 157 | 0.4% |
| Armenian | 71 | 0.2% |
| Austrian | 39 | 0.1% |
| Bahamian | 5 | 0.0% |
| Barbadian | 15 | 0.0% |
| Belgian | 24 | 0.1% |
| Belizean | 139 | 0.3% |
| Bolivian | 301 | 0.7% |
| Brazilian | 83 | 0.2% |
| British | 77 | 0.2% |
| Burmese | 30 | 0.1% |
| Canadian | 121 | 0.3% |
| Celtic | 15 | 0.0% |
| Central American | 3,055 | 7.0% |
| Central American Indian | 43 | 0.1% |
| Cherokee | 115 | 0.3% |
| Chilean | 75 | 0.2% |
| Colombian | 2,194 | 5.0% |
| Costa Rican | 64 | 0.2% |
| Croatian | 7 | 0.0% |
| Cuban | 3,051 | 7.0% |
| Czech | 22 | 0.1% |
| Danish | 29 | 0.1% |
| Dominican | 915 | 2.1% |
| Dutch | 133 | 0.3% |
| Eastern European | 244 | 0.6% |
| Ecuadorian | 377 | 0.9% |
| English | 1,222 | 2.8% |
| Estonian | 38 | 0.1% |
| European | 229 | 0.5% |
| Finnish | 22 | 0.1% |
| French | 206 | 0.5% |
| French Canadian | 236 | 0.5% |
| German | 1,671 | 3.8% |
| Ghanaian | 47 | 0.1% |
| Greek | 72 | 0.2% |
| Guatemalan | 816 | 1.9% |
| Haitian | 5,599 | 12.8% |
| Hmong | 21 | 0.1% |
| Honduran | 1,243 | 2.9% |
| Hungarian | 96 | 0.2% |
| Indian (Asian) | 125 | 0.3% |
| Indonesian | 24 | 0.1% |
| Iranian | 35 | 0.1% |
| Irish | 1,982 | 4.5% |
| Israeli | 31 | 0.1% |
| Italian | 2,065 | 4.7% |
| Jamaican | 1,481 | 3.4% |
| Korean | 270 | 0.6% |
| Lebanese | 31 | 0.1% |
| Lithuanian | 6 | 0.0% |
| Macedonian | 35 | 0.1% |
| Mexican | 2,815 | 6.5% |
| Mexican American Indian | 69 | 0.2% |
| Native Hawaiian | 138 | 0.3% |
| Nicaraguan | 326 | 0.7% |
| Nigerian | 15 | 0.0% |
| Norwegian | 81 | 0.2% |
| Pakistani | 71 | 0.2% |
| Paraguayan | 24 | 0.1% |
| Pennsylvania German | 41 | 0.1% |
| Peruvian | 847 | 1.9% |
| Polish | 684 | 1.6% |
| Portuguese | 178 | 0.4% |
| Puerto Rican | 2,636 | 6.0% |
| Romanian | 85 | 0.2% |
| Russian | 175 | 0.4% |
| Salvadoran | 606 | 1.4% |
| Scandinavian | 17 | 0.0% |
| Scotch-Irish | 90 | 0.2% |
| Scottish | 240 | 0.5% |
| Slovak | 20 | 0.1% |
| South American | 4,869 | 11.2% |
| South American Indian | 8 | 0.0% |
| Spaniard | 147 | 0.3% |
| Spanish | 113 | 0.3% |
| Sri Lankan | 141 | 0.3% |
| Subsaharan African | 454 | 1.0% |
| Swedish | 104 | 0.2% |
| Swiss | 8 | 0.0% |
| Syrian | 23 | 0.1% |
| Thai | 866 | 2.0% |
| Tlingit-Haida | 32 | 0.1% |
| Trinidadian and Tobagonian | 226 | 0.5% |
| Turkish | 14 | 0.0% |
| Ukrainian | 29 | 0.1% |
| Uruguayan | 224 | 0.5% |
| Venezuelan | 670 | 1.5% |
| Vietnamese | 152 | 0.4% |
| Welsh | 97 | 0.2% |
| West Indian | 208 | 0.5% |
| Yugoslavian | 34 | 0.1% | View All 95 Rows |
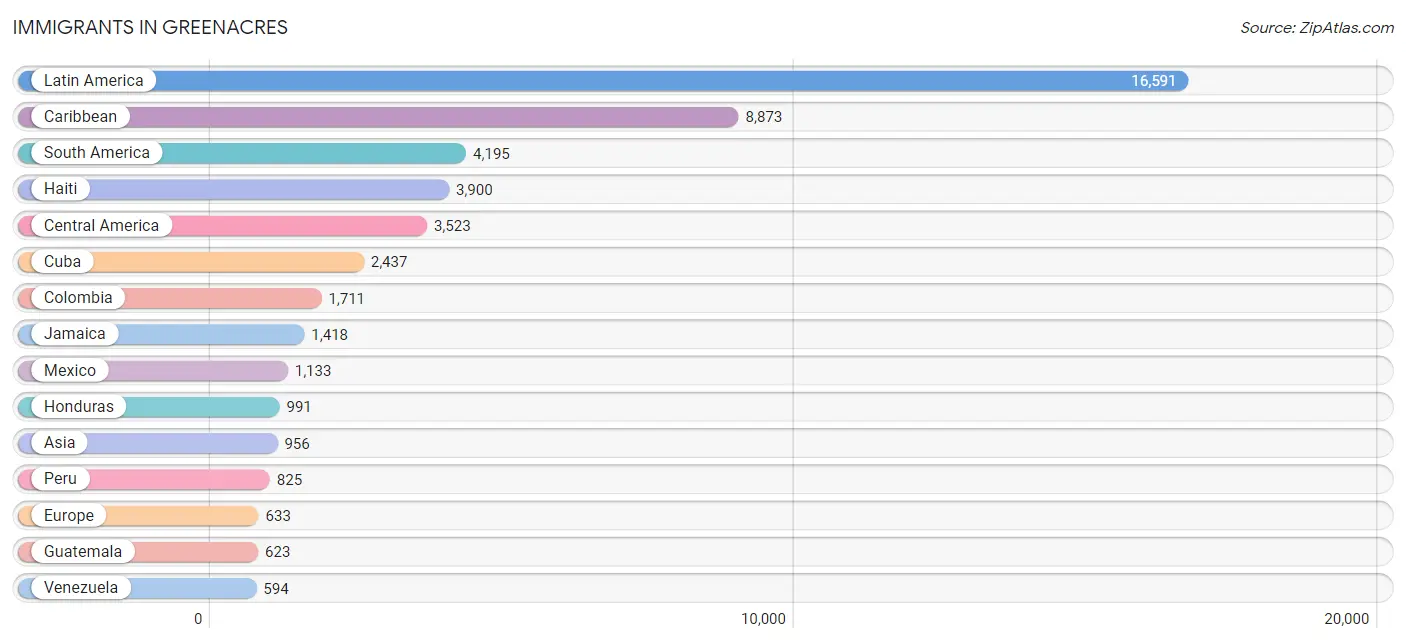
Immigrants in Greenacres
The most numerous immigrant groups reported in Greenacres came from Latin America (16,591 | 38.0%), Caribbean (8,873 | 20.3%), South America (4,195 | 9.6%), Haiti (3,900 | 8.9%), and Central America (3,523 | 8.1%), together accounting for 85.0% of all Greenacres residents.
| Immigration Origin | # Population | % Population |
| Africa | 39 | 0.1% |
| Argentina | 183 | 0.4% |
| Asia | 956 | 2.2% |
| Austria | 8 | 0.0% |
| Bahamas | 10 | 0.0% |
| Bangladesh | 208 | 0.5% |
| Barbados | 85 | 0.2% |
| Belgium | 20 | 0.1% |
| Belize | 102 | 0.2% |
| Bolivia | 246 | 0.6% |
| Brazil | 63 | 0.1% |
| Canada | 294 | 0.7% |
| Caribbean | 8,873 | 20.3% |
| Central America | 3,523 | 8.1% |
| Chile | 106 | 0.2% |
| China | 62 | 0.1% |
| Colombia | 1,711 | 3.9% |
| Costa Rica | 64 | 0.2% |
| Cuba | 2,437 | 5.6% |
| Dominica | 50 | 0.1% |
| Dominican Republic | 400 | 0.9% |
| Eastern Africa | 8 | 0.0% |
| Eastern Asia | 92 | 0.2% |
| Eastern Europe | 242 | 0.5% |
| Ecuador | 151 | 0.4% |
| El Salvador | 388 | 0.9% |
| England | 19 | 0.0% |
| Europe | 633 | 1.5% |
| France | 1 | 0.0% |
| Germany | 82 | 0.2% |
| Ghana | 31 | 0.1% |
| Greece | 15 | 0.0% |
| Guatemala | 623 | 1.4% |
| Guyana | 90 | 0.2% |
| Haiti | 3,900 | 8.9% |
| Honduras | 991 | 2.3% |
| Hungary | 6 | 0.0% |
| India | 174 | 0.4% |
| Iraq | 8 | 0.0% |
| Italy | 75 | 0.2% |
| Jamaica | 1,418 | 3.3% |
| Korea | 30 | 0.1% |
| Latin America | 16,591 | 38.0% |
| Latvia | 39 | 0.1% |
| Lebanon | 31 | 0.1% |
| Mexico | 1,133 | 2.6% |
| Nepal | 24 | 0.1% |
| Netherlands | 40 | 0.1% |
| Nicaragua | 222 | 0.5% |
| Northern Europe | 62 | 0.1% |
| Peru | 825 | 1.9% |
| Philippines | 217 | 0.5% |
| Poland | 89 | 0.2% |
| Portugal | 36 | 0.1% |
| Romania | 51 | 0.1% |
| Russia | 1 | 0.0% |
| South America | 4,195 | 9.6% |
| South Central Asia | 406 | 0.9% |
| South Eastern Asia | 405 | 0.9% |
| Southern Europe | 178 | 0.4% |
| Spain | 52 | 0.1% |
| St. Vincent and the Grenadines | 22 | 0.1% |
| Taiwan | 2 | 0.0% |
| Thailand | 81 | 0.2% |
| Trinidad and Tobago | 447 | 1.0% |
| Turkey | 14 | 0.0% |
| Ukraine | 18 | 0.0% |
| Uruguay | 202 | 0.5% |
| Venezuela | 594 | 1.4% |
| Vietnam | 83 | 0.2% |
| West Indies | 38 | 0.1% |
| Western Africa | 31 | 0.1% |
| Western Asia | 53 | 0.1% |
| Western Europe | 151 | 0.4% | View All 74 Rows |
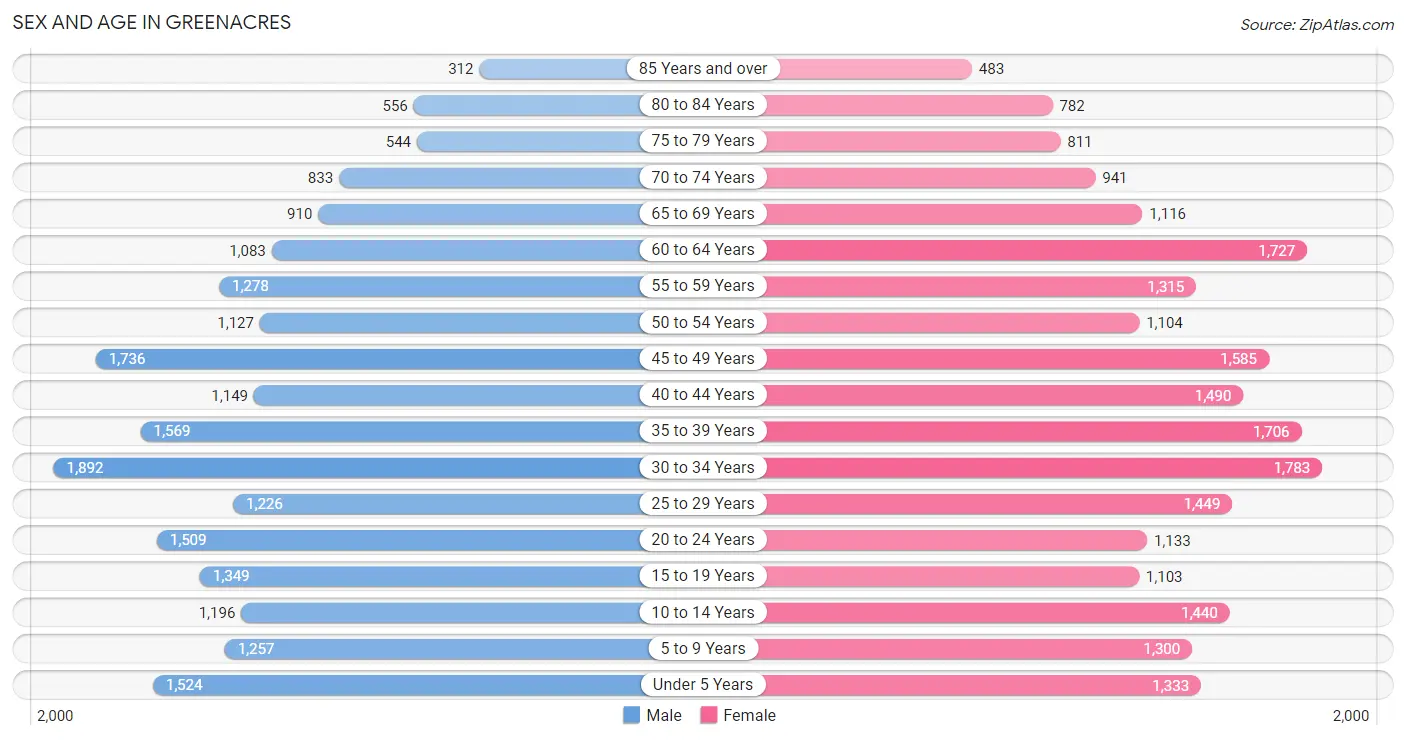
Sex and Age in Greenacres
Sex and Age in Greenacres
The most populous age groups in Greenacres are 30 to 34 Years (1,892 | 9.0%) for men and 30 to 34 Years (1,783 | 7.9%) for women.
| Age Bracket | Male | Female |
| Under 5 Years | 1,524 (7.2%) | 1,333 (5.9%) |
| 5 to 9 Years | 1,257 (6.0%) | 1,300 (5.8%) |
| 10 to 14 Years | 1,196 (5.7%) | 1,440 (6.4%) |
| 15 to 19 Years | 1,349 (6.4%) | 1,103 (4.9%) |
| 20 to 24 Years | 1,509 (7.2%) | 1,133 (5.0%) |
| 25 to 29 Years | 1,226 (5.8%) | 1,449 (6.4%) |
| 30 to 34 Years | 1,892 (9.0%) | 1,783 (7.9%) |
| 35 to 39 Years | 1,569 (7.4%) | 1,706 (7.5%) |
| 40 to 44 Years | 1,149 (5.5%) | 1,490 (6.6%) |
| 45 to 49 Years | 1,736 (8.3%) | 1,585 (7.0%) |
| 50 to 54 Years | 1,127 (5.3%) | 1,104 (4.9%) |
| 55 to 59 Years | 1,278 (6.1%) | 1,315 (5.8%) |
| 60 to 64 Years | 1,083 (5.1%) | 1,727 (7.6%) |
| 65 to 69 Years | 910 (4.3%) | 1,116 (4.9%) |
| 70 to 74 Years | 833 (4.0%) | 941 (4.2%) |
| 75 to 79 Years | 544 (2.6%) | 811 (3.6%) |
| 80 to 84 Years | 556 (2.6%) | 782 (3.5%) |
| 85 Years and over | 312 (1.5%) | 483 (2.1%) |
| Total | 21,050 (100.0%) | 22,601 (100.0%) |
Families and Households in Greenacres
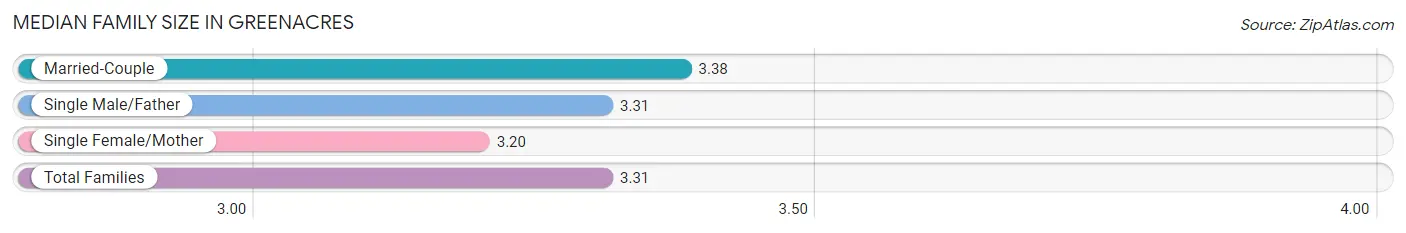
Median Family Size in Greenacres
The median family size in Greenacres is 3.31 persons per family, with married-couple families (6,377 | 59.3%) accounting for the largest median family size of 3.38 persons per family. On the other hand, single female/mother families (3,394 | 31.5%) represent the smallest median family size with 3.20 persons per family.
| Family Type | # Families | Family Size |
| Married-Couple | 6,377 (59.3%) | 3.38 |
| Single Male/Father | 990 (9.2%) | 3.31 |
| Single Female/Mother | 3,394 (31.5%) | 3.20 |
| Total Families | 10,761 (100.0%) | 3.31 |
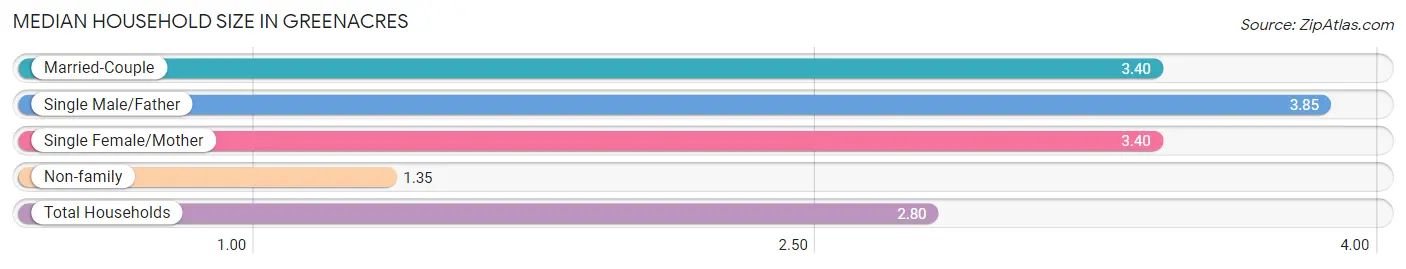
Median Household Size in Greenacres
The median household size in Greenacres is 2.80 persons per household, with single male/father households (990 | 6.4%) accounting for the largest median household size of 3.85 persons per household. non-family households (4,774 | 30.7%) represent the smallest median household size with 1.35 persons per household.
| Household Type | # Households | Household Size |
| Married-Couple | 6,377 (41.0%) | 3.40 |
| Single Male/Father | 990 (6.4%) | 3.85 |
| Single Female/Mother | 3,394 (21.8%) | 3.40 |
| Non-family | 4,774 (30.7%) | 1.35 |
| Total Households | 15,535 (100.0%) | 2.80 |
Household Size by Marriage Status in Greenacres
Out of a total of 15,535 households in Greenacres, 10,761 (69.3%) are family households, while 4,774 (30.7%) are nonfamily households. The most numerous type of family households are 2-person households, comprising 4,473, and the most common type of nonfamily households are 1-person households, comprising 3,849.
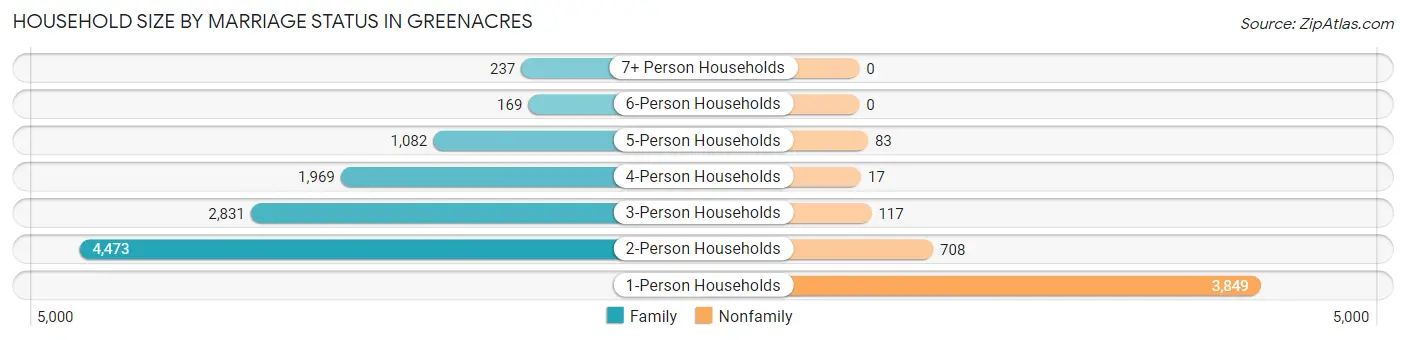
| Household Size | Family Households | Nonfamily Households |
| 1-Person Households | - | 3,849 (24.8%) |
| 2-Person Households | 4,473 (28.8%) | 708 (4.6%) |
| 3-Person Households | 2,831 (18.2%) | 117 (0.7%) |
| 4-Person Households | 1,969 (12.7%) | 17 (0.1%) |
| 5-Person Households | 1,082 (7.0%) | 83 (0.5%) |
| 6-Person Households | 169 (1.1%) | 0 (0.0%) |
| 7+ Person Households | 237 (1.5%) | 0 (0.0%) |
| Total | 10,761 (69.3%) | 4,774 (30.7%) |
Female Fertility in Greenacres
Fertility by Age in Greenacres
Average fertility rate in Greenacres is 48.0 births per 1,000 women. Women in the age bracket of 20 to 34 years have the highest fertility rate with 85.0 births per 1,000 women. Women in the age bracket of 20 to 34 years acount for 72.9% of all women with births.
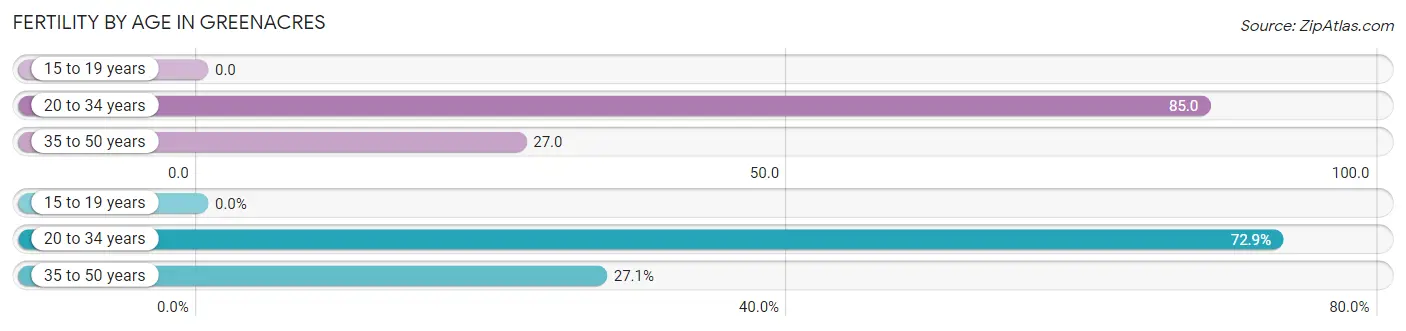
| Age Bracket | Women with Births | Births / 1,000 Women |
| 15 to 19 years | 0 (0.0%) | 0.0 |
| 20 to 34 years | 372 (72.9%) | 85.0 |
| 35 to 50 years | 138 (27.1%) | 27.0 |
| Total | 510 (100.0%) | 48.0 |
Fertility by Age by Marriage Status in Greenacres
51.2% of women with births (510) in Greenacres are married. The highest percentage of unmarried women with births falls into 20 to 34 years age bracket with 57.8% of them unmarried at the time of birth, while the lowest percentage of unmarried women with births belong to 35 to 50 years age bracket with 24.6% of them unmarried.
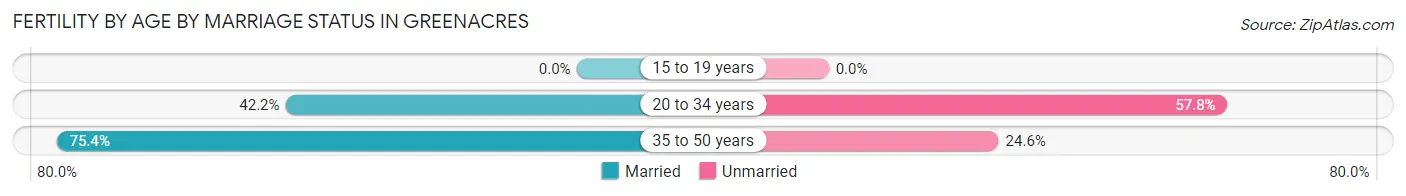
| Age Bracket | Married | Unmarried |
| 15 to 19 years | 0 (0.0%) | 0 (0.0%) |
| 20 to 34 years | 157 (42.2%) | 215 (57.8%) |
| 35 to 50 years | 104 (75.4%) | 34 (24.6%) |
| Total | 261 (51.2%) | 249 (48.8%) |
Fertility by Education in Greenacres
Average fertility rate in Greenacres is 48.0 births per 1,000 women. Women with the education attainment of graduate degree have the highest fertility rate of 99.0 births per 1,000 women, while women with the education attainment of high school diploma have the lowest fertility at 27.0 births per 1,000 women. Women with the education attainment of college or associate's degree represent 31.0% of all women with births.
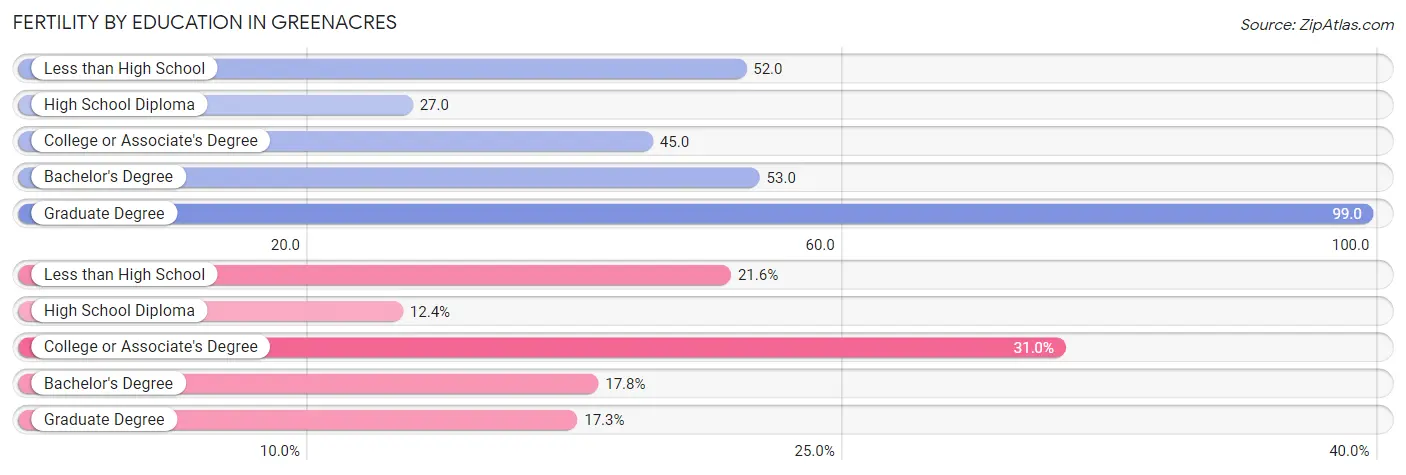
| Educational Attainment | Women with Births | Births / 1,000 Women |
| Less than High School | 110 (21.6%) | 52.0 |
| High School Diploma | 63 (12.3%) | 27.0 |
| College or Associate's Degree | 158 (31.0%) | 45.0 |
| Bachelor's Degree | 91 (17.8%) | 53.0 |
| Graduate Degree | 88 (17.2%) | 99.0 |
| Total | 510 (100.0%) | 48.0 |
Fertility by Education by Marriage Status in Greenacres
48.8% of women with births in Greenacres are unmarried. Women with the educational attainment of bachelor's degree are most likely to be married with 100.0% of them married at childbirth, while women with the educational attainment of less than high school are least likely to be married with 88.2% of them unmarried at childbirth.
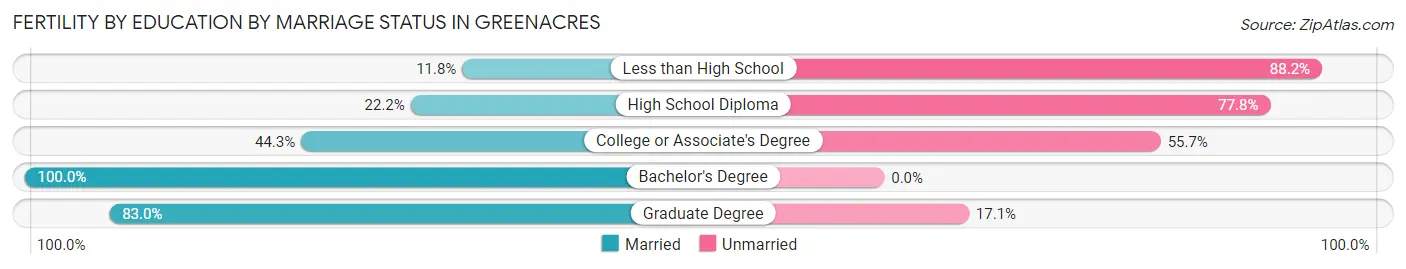
| Educational Attainment | Married | Unmarried |
| Less than High School | 13 (11.8%) | 97 (88.2%) |
| High School Diploma | 14 (22.2%) | 49 (77.8%) |
| College or Associate's Degree | 70 (44.3%) | 88 (55.7%) |
| Bachelor's Degree | 91 (100.0%) | 0 (0.0%) |
| Graduate Degree | 73 (83.0%) | 15 (17.1%) |
| Total | 261 (51.2%) | 249 (48.8%) |
Employment Characteristics in Greenacres
Employment by Class of Employer in Greenacres
Among the 21,315 employed individuals in Greenacres, private company employees (14,978 | 70.3%), self-employed (not incorporated) (1,914 | 9.0%), and local government employees (1,534 | 7.2%) make up the most common classes of employment.
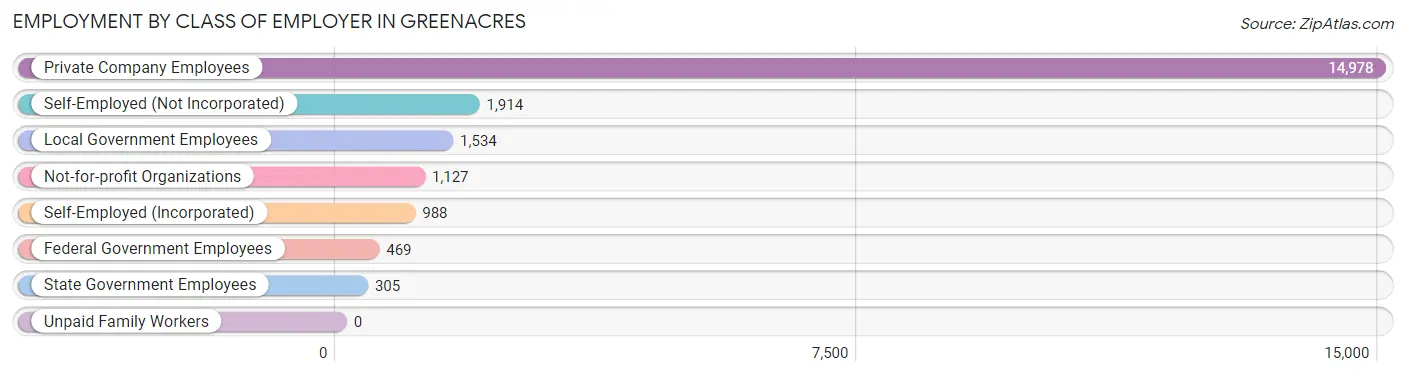
| Employer Class | # Employees | % Employees |
| Private Company Employees | 14,978 | 70.3% |
| Self-Employed (Incorporated) | 988 | 4.6% |
| Self-Employed (Not Incorporated) | 1,914 | 9.0% |
| Not-for-profit Organizations | 1,127 | 5.3% |
| Local Government Employees | 1,534 | 7.2% |
| State Government Employees | 305 | 1.4% |
| Federal Government Employees | 469 | 2.2% |
| Unpaid Family Workers | 0 | 0.0% |
| Total | 21,315 | 100.0% |
Employment Status by Age in Greenacres
According to the labor force statistics for Greenacres, out of the total population over 16 years of age (35,133), 65.4% or 22,977 individuals are in the labor force, with 5.4% or 1,241 of them unemployed. The age group with the highest labor force participation rate is 45 to 54 years, with 89.0% or 4,941 individuals in the labor force. Within the labor force, the 20 to 24 years age range has the highest percentage of unemployed individuals, with 12.3% or 237 of them being unemployed.
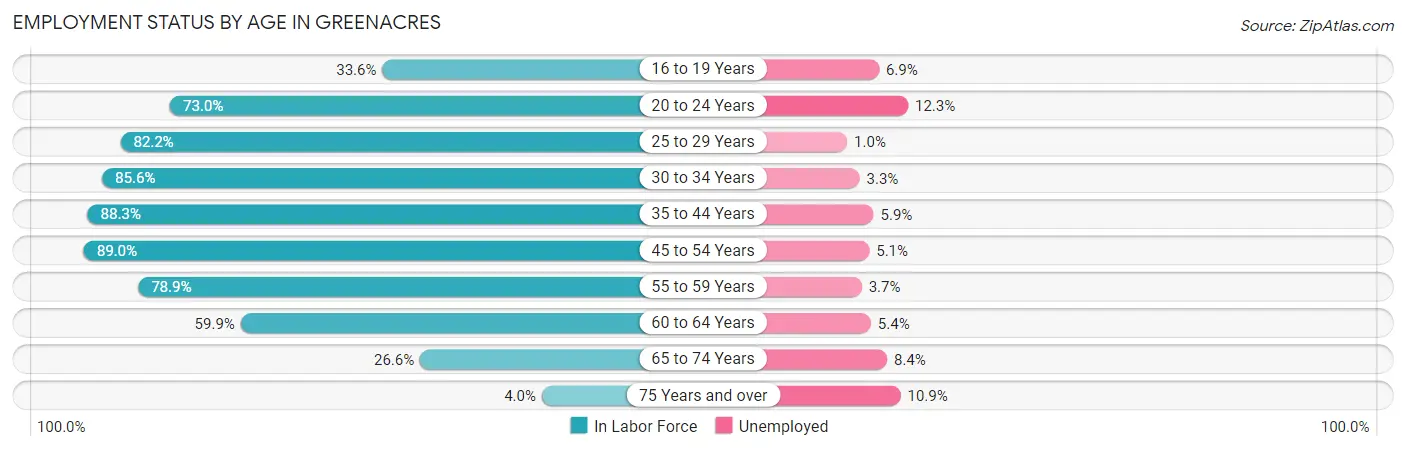
| Age Bracket | In Labor Force | Unemployed |
| 16 to 19 Years | 667 (33.6%) | 46 (6.9%) |
| 20 to 24 Years | 1,929 (73.0%) | 237 (12.3%) |
| 25 to 29 Years | 2,199 (82.2%) | 22 (1.0%) |
| 30 to 34 Years | 3,146 (85.6%) | 104 (3.3%) |
| 35 to 44 Years | 5,222 (88.3%) | 308 (5.9%) |
| 45 to 54 Years | 4,941 (89.0%) | 252 (5.1%) |
| 55 to 59 Years | 2,046 (78.9%) | 76 (3.7%) |
| 60 to 64 Years | 1,683 (59.9%) | 91 (5.4%) |
| 65 to 74 Years | 1,011 (26.6%) | 85 (8.4%) |
| 75 Years and over | 140 (4.0%) | 15 (10.9%) |
| Total | 22,977 (65.4%) | 1,241 (5.4%) |
Employment Status by Educational Attainment in Greenacres
According to labor force statistics for Greenacres, 82.8% of individuals (19,225) out of the total population between 25 and 64 years of age (23,219) are in the labor force, with 4.4% or 846 of them being unemployed. The group with the highest labor force participation rate are those with the educational attainment of college / associate degree, with 87.7% or 6,320 individuals in the labor force. Within the labor force, individuals with bachelor's degree or higher education have the highest percentage of unemployment, with 5.0% or 240 of them being unemployed.
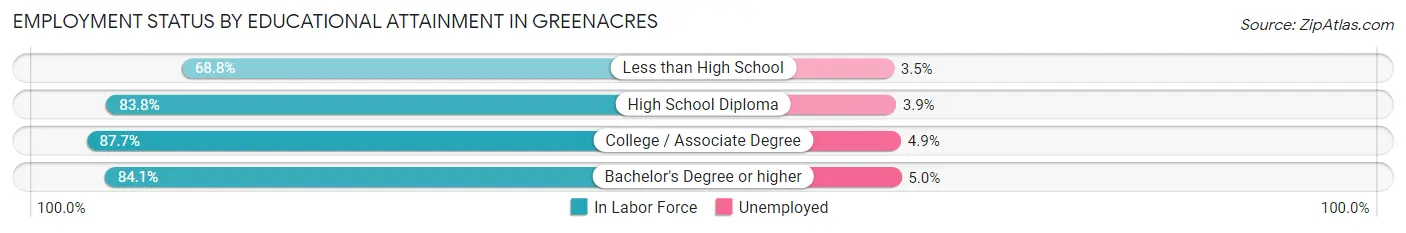
| Educational Attainment | In Labor Force | Unemployed |
| Less than High School | 2,381 (68.8%) | 121 (3.5%) |
| High School Diploma | 5,744 (83.8%) | 267 (3.9%) |
| College / Associate Degree | 6,320 (87.7%) | 353 (4.9%) |
| Bachelor's Degree or higher | 4,791 (84.1%) | 285 (5.0%) |
| Total | 19,225 (82.8%) | 1,022 (4.4%) |
Employment Occupations by Sex in Greenacres
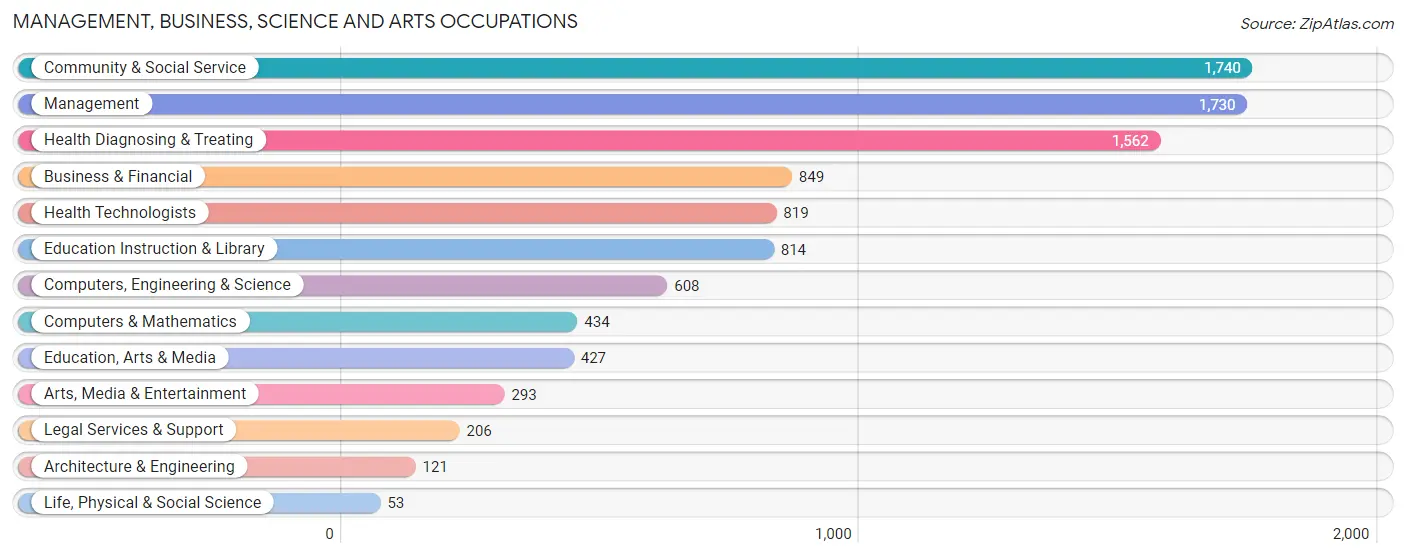
Management, Business, Science and Arts Occupations
The most common Management, Business, Science and Arts occupations in Greenacres are Community & Social Service (1,740 | 8.0%), Management (1,730 | 8.0%), Health Diagnosing & Treating (1,562 | 7.2%), Business & Financial (849 | 3.9%), and Health Technologists (819 | 3.8%).
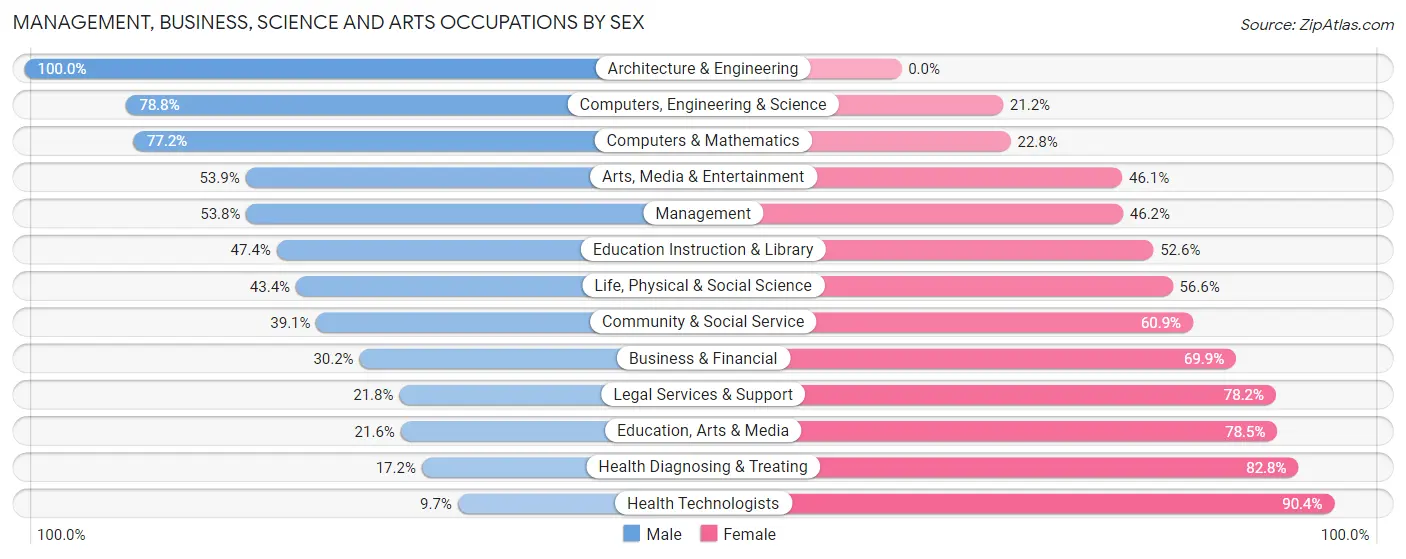
Management, Business, Science and Arts Occupations by Sex
Within the Management, Business, Science and Arts occupations in Greenacres, the most male-oriented occupations are Architecture & Engineering (100.0%), Computers, Engineering & Science (78.8%), and Computers & Mathematics (77.2%), while the most female-oriented occupations are Health Technologists (90.3%), Health Diagnosing & Treating (82.8%), and Education, Arts & Media (78.4%).
| Occupation | Male | Female |
| Management | 930 (53.8%) | 800 (46.2%) |
| Business & Financial | 256 (30.1%) | 593 (69.9%) |
| Computers, Engineering & Science | 479 (78.8%) | 129 (21.2%) |
| Computers & Mathematics | 335 (77.2%) | 99 (22.8%) |
| Architecture & Engineering | 121 (100.0%) | 0 (0.0%) |
| Life, Physical & Social Science | 23 (43.4%) | 30 (56.6%) |
| Community & Social Service | 681 (39.1%) | 1,059 (60.9%) |
| Education, Arts & Media | 92 (21.5%) | 335 (78.4%) |
| Legal Services & Support | 45 (21.8%) | 161 (78.2%) |
| Education Instruction & Library | 386 (47.4%) | 428 (52.6%) |
| Arts, Media & Entertainment | 158 (53.9%) | 135 (46.1%) |
| Health Diagnosing & Treating | 268 (17.2%) | 1,294 (82.8%) |
| Health Technologists | 79 (9.7%) | 740 (90.3%) |
| Total (Category) | 2,614 (40.3%) | 3,875 (59.7%) |
| Total (Overall) | 11,021 (50.7%) | 10,722 (49.3%) |
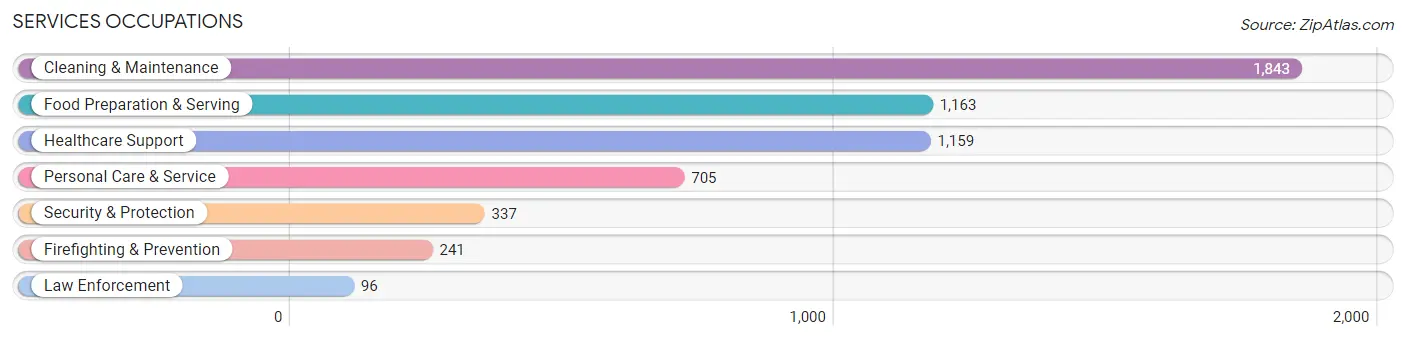
Services Occupations
The most common Services occupations in Greenacres are Cleaning & Maintenance (1,843 | 8.5%), Food Preparation & Serving (1,163 | 5.3%), Healthcare Support (1,159 | 5.3%), Personal Care & Service (705 | 3.2%), and Security & Protection (337 | 1.5%).
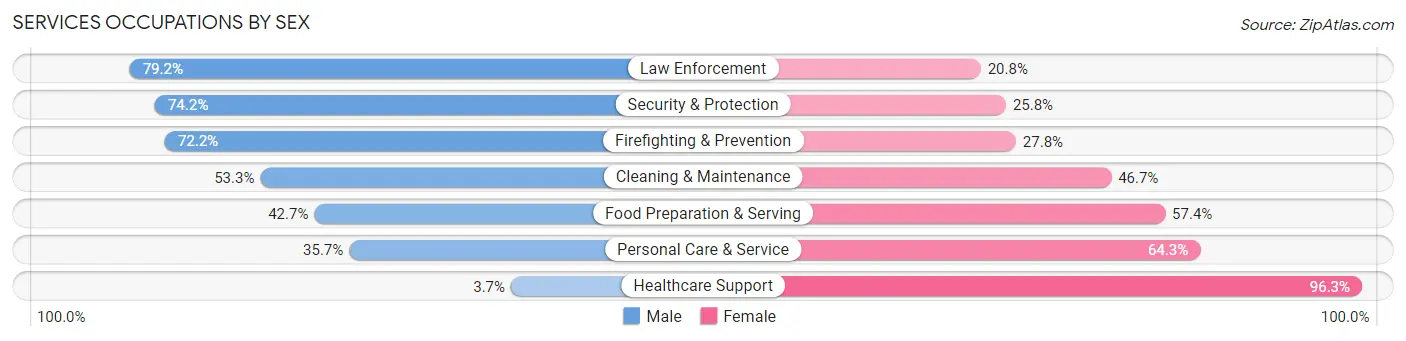
Services Occupations by Sex
Within the Services occupations in Greenacres, the most male-oriented occupations are Law Enforcement (79.2%), Security & Protection (74.2%), and Firefighting & Prevention (72.2%), while the most female-oriented occupations are Healthcare Support (96.3%), Personal Care & Service (64.3%), and Food Preparation & Serving (57.4%).
| Occupation | Male | Female |
| Healthcare Support | 43 (3.7%) | 1,116 (96.3%) |
| Security & Protection | 250 (74.2%) | 87 (25.8%) |
| Firefighting & Prevention | 174 (72.2%) | 67 (27.8%) |
| Law Enforcement | 76 (79.2%) | 20 (20.8%) |
| Food Preparation & Serving | 496 (42.6%) | 667 (57.4%) |
| Cleaning & Maintenance | 983 (53.3%) | 860 (46.7%) |
| Personal Care & Service | 252 (35.7%) | 453 (64.3%) |
| Total (Category) | 2,024 (38.9%) | 3,183 (61.1%) |
| Total (Overall) | 11,021 (50.7%) | 10,722 (49.3%) |
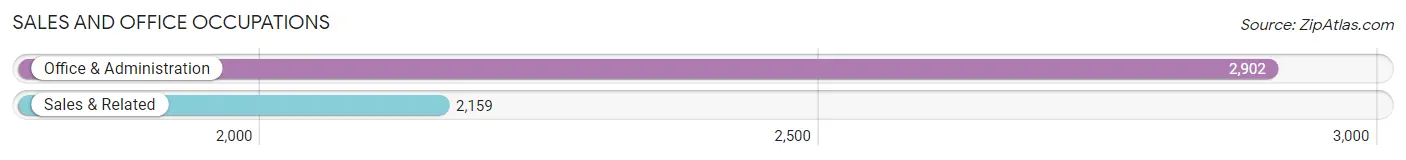
Sales and Office Occupations
The most common Sales and Office occupations in Greenacres are Office & Administration (2,902 | 13.4%), and Sales & Related (2,159 | 9.9%).
Sales and Office Occupations by Sex
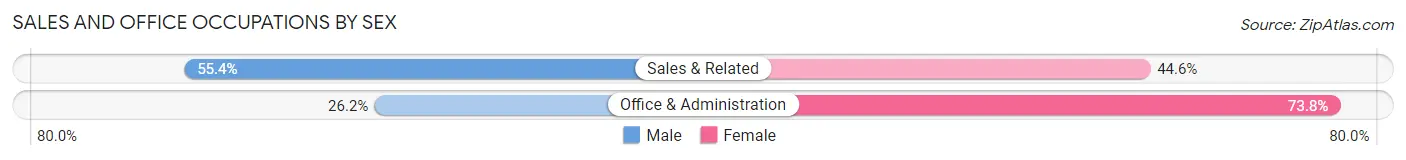
| Occupation | Male | Female |
| Sales & Related | 1,197 (55.4%) | 962 (44.6%) |
| Office & Administration | 761 (26.2%) | 2,141 (73.8%) |
| Total (Category) | 1,958 (38.7%) | 3,103 (61.3%) |
| Total (Overall) | 11,021 (50.7%) | 10,722 (49.3%) |
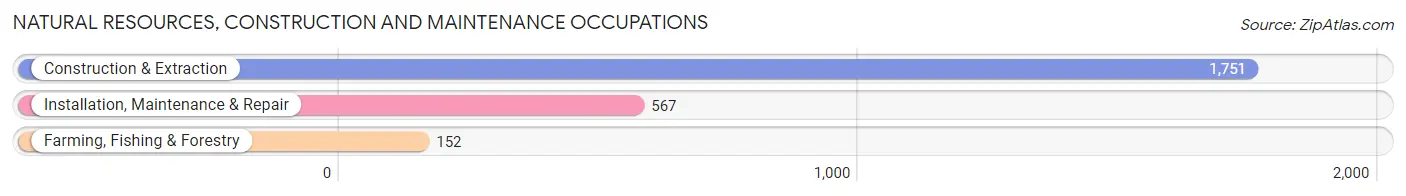
Natural Resources, Construction and Maintenance Occupations
The most common Natural Resources, Construction and Maintenance occupations in Greenacres are Construction & Extraction (1,751 | 8.1%), Installation, Maintenance & Repair (567 | 2.6%), and Farming, Fishing & Forestry (152 | 0.7%).
Natural Resources, Construction and Maintenance Occupations by Sex
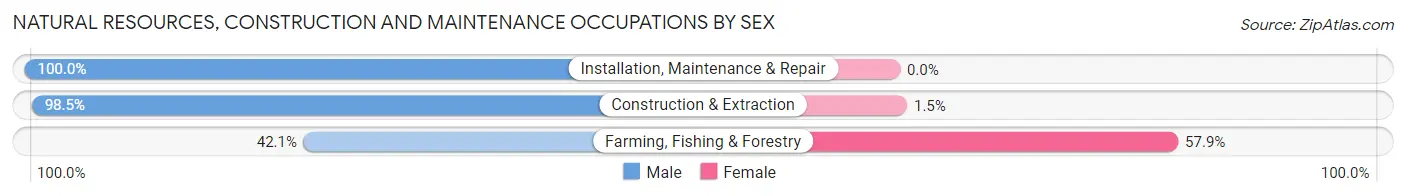
| Occupation | Male | Female |
| Farming, Fishing & Forestry | 64 (42.1%) | 88 (57.9%) |
| Construction & Extraction | 1,725 (98.5%) | 26 (1.5%) |
| Installation, Maintenance & Repair | 567 (100.0%) | 0 (0.0%) |
| Total (Category) | 2,356 (95.4%) | 114 (4.6%) |
| Total (Overall) | 11,021 (50.7%) | 10,722 (49.3%) |
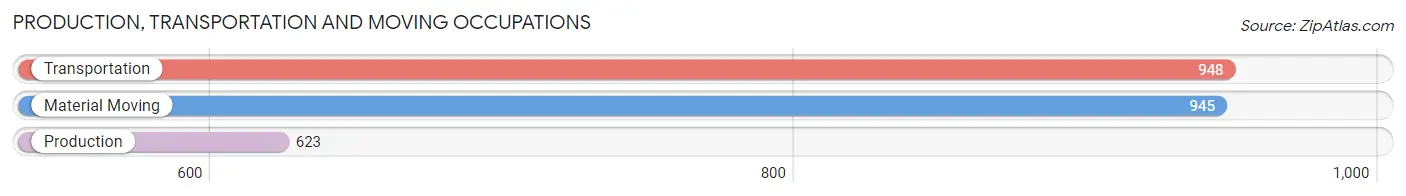
Production, Transportation and Moving Occupations
The most common Production, Transportation and Moving occupations in Greenacres are Transportation (948 | 4.4%), Material Moving (945 | 4.3%), and Production (623 | 2.9%).
Production, Transportation and Moving Occupations by Sex
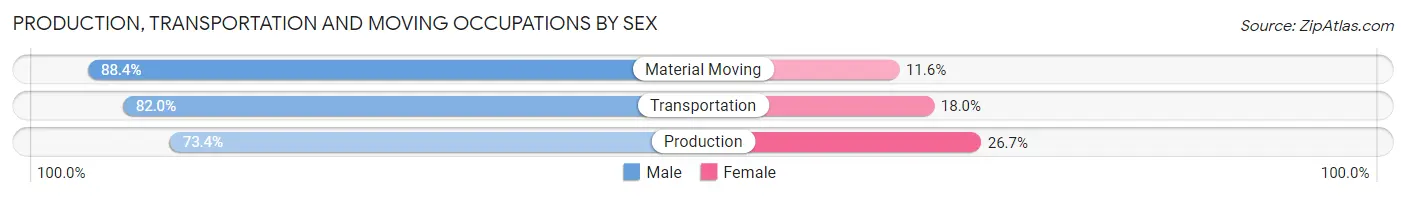
| Occupation | Male | Female |
| Production | 457 (73.4%) | 166 (26.7%) |
| Transportation | 777 (82.0%) | 171 (18.0%) |
| Material Moving | 835 (88.4%) | 110 (11.6%) |
| Total (Category) | 2,069 (82.2%) | 447 (17.8%) |
| Total (Overall) | 11,021 (50.7%) | 10,722 (49.3%) |
Employment Industries by Sex in Greenacres
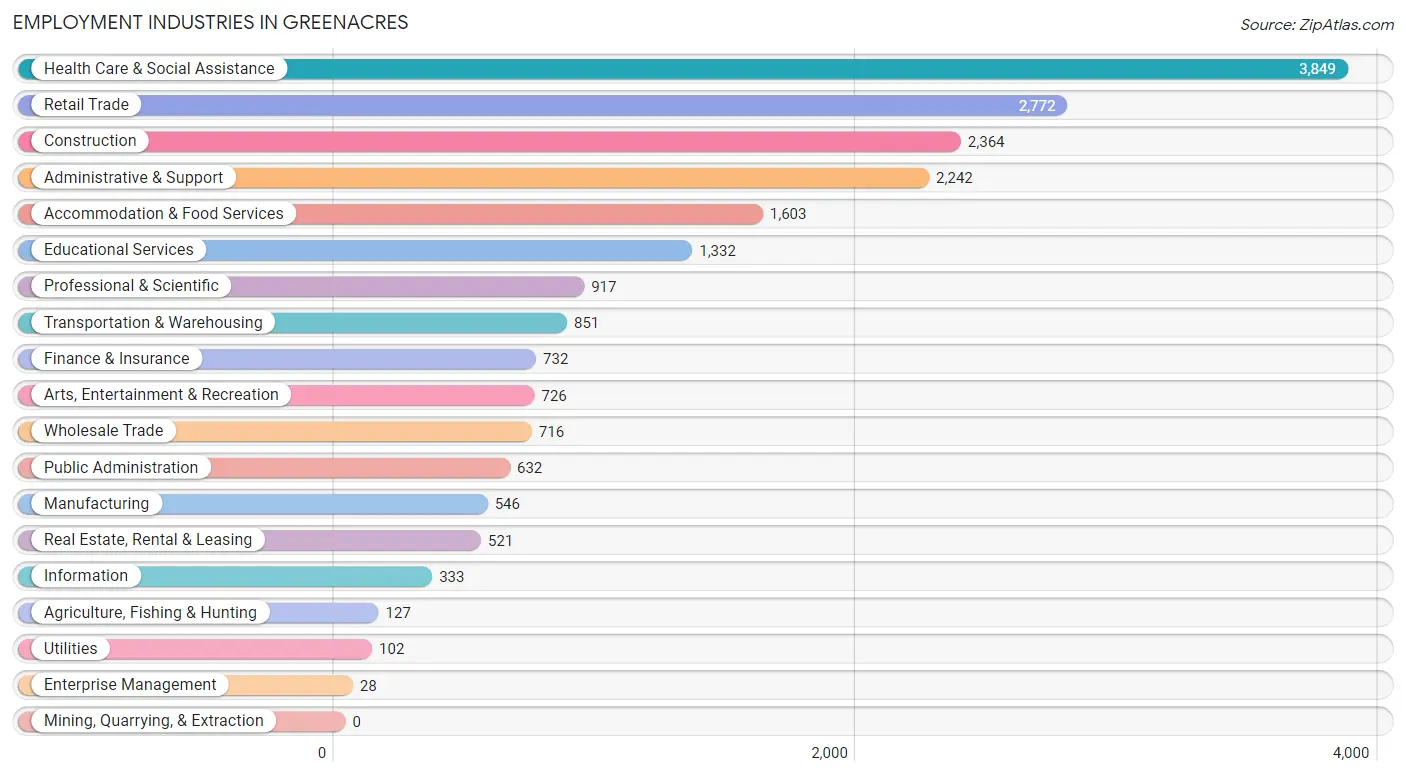
Employment Industries in Greenacres
The major employment industries in Greenacres include Health Care & Social Assistance (3,849 | 17.7%), Retail Trade (2,772 | 12.8%), Construction (2,364 | 10.9%), Administrative & Support (2,242 | 10.3%), and Accommodation & Food Services (1,603 | 7.4%).
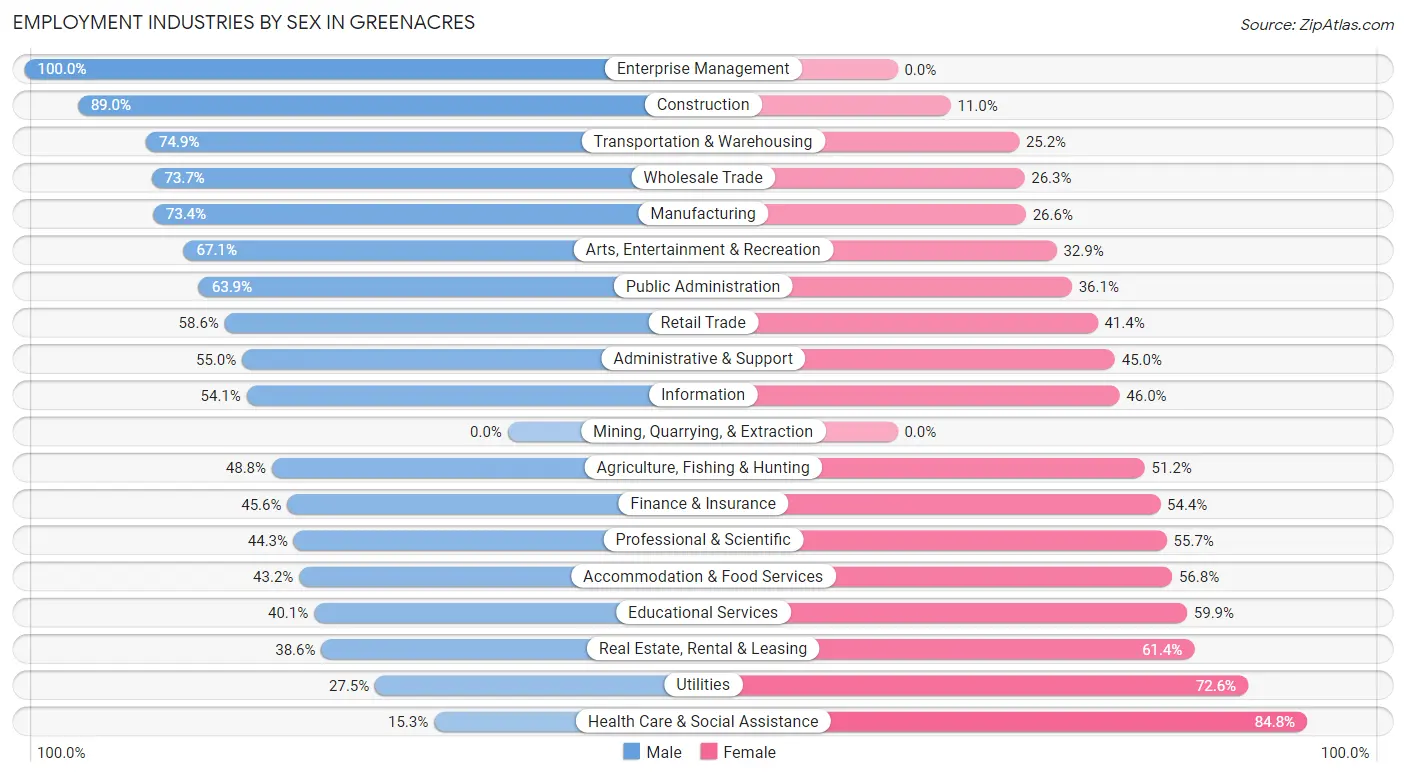
Employment Industries by Sex in Greenacres
The Greenacres industries that see more men than women are Enterprise Management (100.0%), Construction (89.0%), and Transportation & Warehousing (74.9%), whereas the industries that tend to have a higher number of women are Health Care & Social Assistance (84.8%), Utilities (72.6%), and Real Estate, Rental & Leasing (61.4%).
| Industry | Male | Female |
| Agriculture, Fishing & Hunting | 62 (48.8%) | 65 (51.2%) |
| Mining, Quarrying, & Extraction | 0 (0.0%) | 0 (0.0%) |
| Construction | 2,104 (89.0%) | 260 (11.0%) |
| Manufacturing | 401 (73.4%) | 145 (26.6%) |
| Wholesale Trade | 528 (73.7%) | 188 (26.3%) |
| Retail Trade | 1,624 (58.6%) | 1,148 (41.4%) |
| Transportation & Warehousing | 637 (74.9%) | 214 (25.2%) |
| Utilities | 28 (27.5%) | 74 (72.6%) |
| Information | 180 (54.0%) | 153 (46.0%) |
| Finance & Insurance | 334 (45.6%) | 398 (54.4%) |
| Real Estate, Rental & Leasing | 201 (38.6%) | 320 (61.4%) |
| Professional & Scientific | 406 (44.3%) | 511 (55.7%) |
| Enterprise Management | 28 (100.0%) | 0 (0.0%) |
| Administrative & Support | 1,233 (55.0%) | 1,009 (45.0%) |
| Educational Services | 534 (40.1%) | 798 (59.9%) |
| Health Care & Social Assistance | 587 (15.2%) | 3,262 (84.8%) |
| Arts, Entertainment & Recreation | 487 (67.1%) | 239 (32.9%) |
| Accommodation & Food Services | 692 (43.2%) | 911 (56.8%) |
| Public Administration | 404 (63.9%) | 228 (36.1%) |
| Total | 11,021 (50.7%) | 10,722 (49.3%) |
Education in Greenacres
School Enrollment in Greenacres
The most common levels of schooling among the 10,140 students in Greenacres are elementary school (2,545 | 25.1%), college / undergraduate (2,388 | 23.5%), and high school (1,805 | 17.8%).
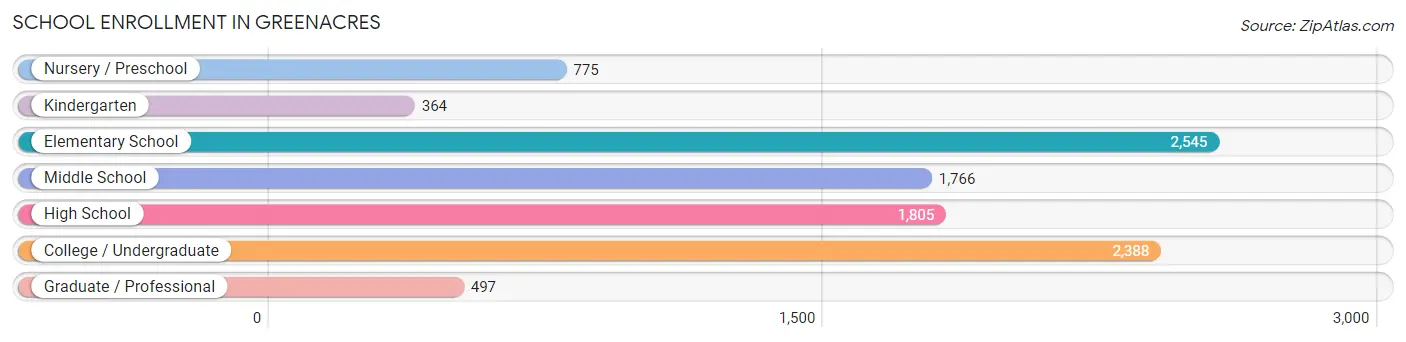
| School Level | # Students | % Students |
| Nursery / Preschool | 775 | 7.6% |
| Kindergarten | 364 | 3.6% |
| Elementary School | 2,545 | 25.1% |
| Middle School | 1,766 | 17.4% |
| High School | 1,805 | 17.8% |
| College / Undergraduate | 2,388 | 23.5% |
| Graduate / Professional | 497 | 4.9% |
| Total | 10,140 | 100.0% |
School Enrollment by Age by Funding Source in Greenacres
Out of a total of 10,140 students who are enrolled in schools in Greenacres, 1,409 (13.9%) attend a private institution, while the remaining 8,731 (86.1%) are enrolled in public schools. The age group of 25 to 34 year olds has the highest likelihood of being enrolled in private schools, with 267 (37.3% in the age bracket) enrolled. Conversely, the age group of 15 to 17 year olds has the lowest likelihood of being enrolled in a private school, with 1,226 (94.4% in the age bracket) attending a public institution.
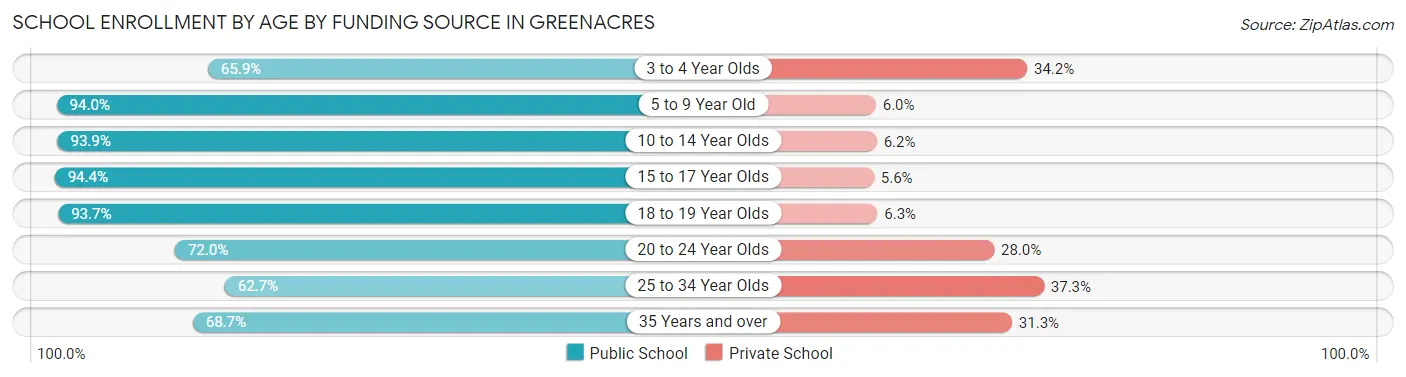
| Age Bracket | Public School | Private School |
| 3 to 4 Year Olds | 428 (65.8%) | 222 (34.2%) |
| 5 to 9 Year Old | 2,296 (94.0%) | 146 (6.0%) |
| 10 to 14 Year Olds | 2,413 (93.9%) | 158 (6.1%) |
| 15 to 17 Year Olds | 1,226 (94.4%) | 73 (5.6%) |
| 18 to 19 Year Olds | 733 (93.7%) | 49 (6.3%) |
| 20 to 24 Year Olds | 704 (72.0%) | 274 (28.0%) |
| 25 to 34 Year Olds | 449 (62.7%) | 267 (37.3%) |
| 35 Years and over | 482 (68.7%) | 220 (31.3%) |
| Total | 8,731 (86.1%) | 1,409 (13.9%) |
Educational Attainment by Field of Study in Greenacres
Business (1,941 | 24.7%), science & technology (987 | 12.5%), education (771 | 9.8%), psychology (695 | 8.8%), and engineering (600 | 7.6%) are the most common fields of study among 7,870 individuals in Greenacres who have obtained a bachelor's degree or higher.
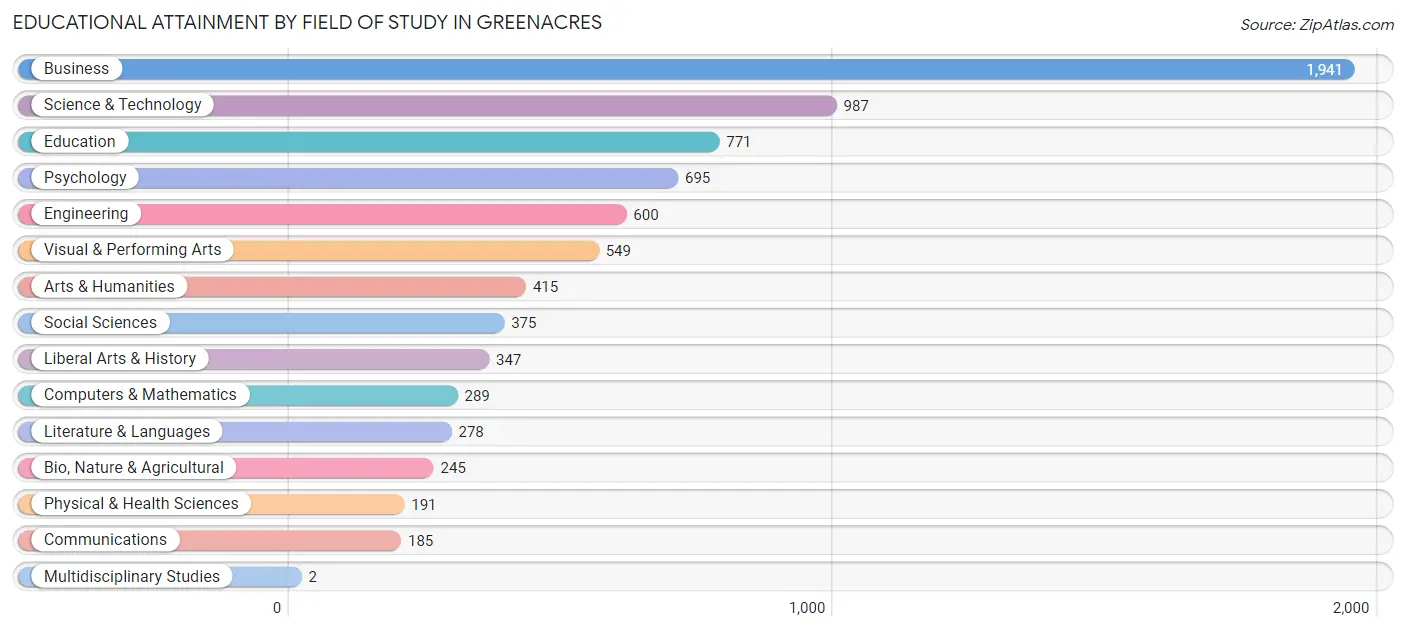
| Field of Study | # Graduates | % Graduates |
| Computers & Mathematics | 289 | 3.7% |
| Bio, Nature & Agricultural | 245 | 3.1% |
| Physical & Health Sciences | 191 | 2.4% |
| Psychology | 695 | 8.8% |
| Social Sciences | 375 | 4.8% |
| Engineering | 600 | 7.6% |
| Multidisciplinary Studies | 2 | 0.0% |
| Science & Technology | 987 | 12.5% |
| Business | 1,941 | 24.7% |
| Education | 771 | 9.8% |
| Literature & Languages | 278 | 3.5% |
| Liberal Arts & History | 347 | 4.4% |
| Visual & Performing Arts | 549 | 7.0% |
| Communications | 185 | 2.4% |
| Arts & Humanities | 415 | 5.3% |
| Total | 7,870 | 100.0% |
Transportation & Commute in Greenacres
Vehicle Availability by Sex in Greenacres
The most prevalent vehicle ownership categories in Greenacres are males with 2 vehicles (5,480, accounting for 50.3%) and females with 2 vehicles (4,687, making up 52.7%).
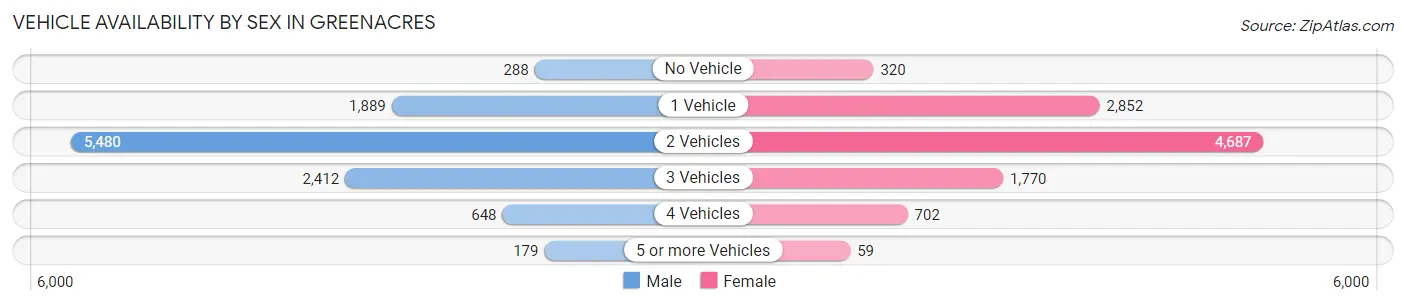
| Vehicles Available | Male | Female |
| No Vehicle | 288 (2.6%) | 320 (3.1%) |
| 1 Vehicle | 1,889 (17.3%) | 2,852 (27.5%) |
| 2 Vehicles | 5,480 (50.3%) | 4,687 (45.1%) |
| 3 Vehicles | 2,412 (22.1%) | 1,770 (17.0%) |
| 4 Vehicles | 648 (5.9%) | 702 (6.8%) |
| 5 or more Vehicles | 179 (1.6%) | 59 (0.6%) |
| Total | 10,896 (100.0%) | 10,390 (100.0%) |
Commute Time in Greenacres
The most frequently occuring commute durations in Greenacres are 30 to 34 minutes (4,469 commuters, 21.9%), 20 to 24 minutes (3,308 commuters, 16.2%), and 25 to 29 minutes (2,394 commuters, 11.7%).
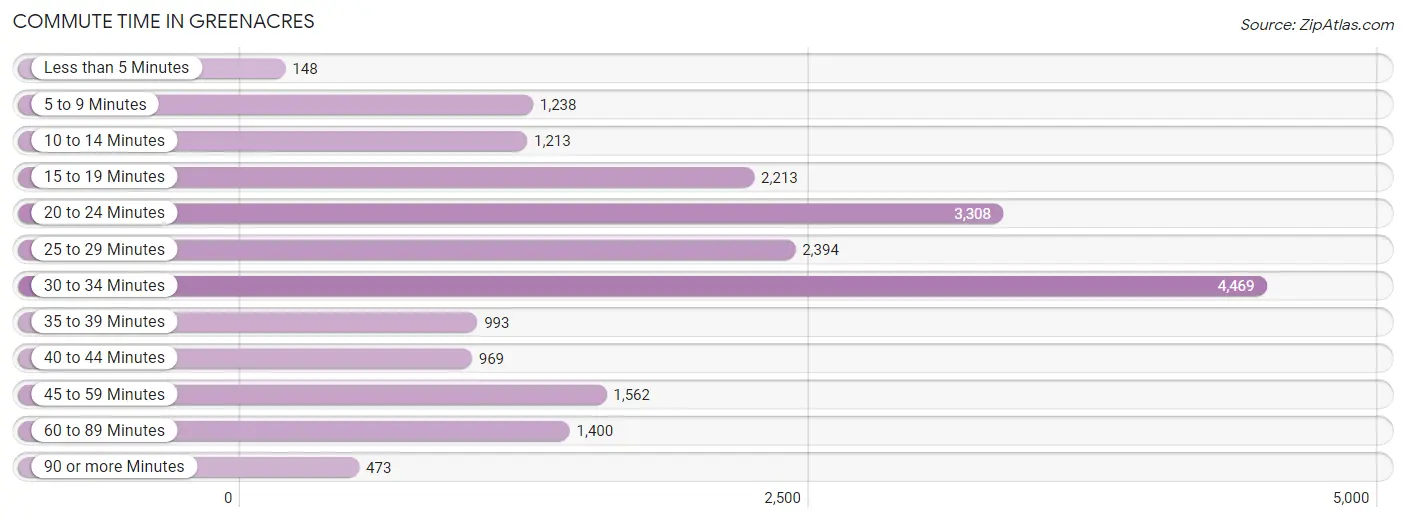
| Commute Time | # Commuters | % Commuters |
| Less than 5 Minutes | 148 | 0.7% |
| 5 to 9 Minutes | 1,238 | 6.1% |
| 10 to 14 Minutes | 1,213 | 5.9% |
| 15 to 19 Minutes | 2,213 | 10.9% |
| 20 to 24 Minutes | 3,308 | 16.2% |
| 25 to 29 Minutes | 2,394 | 11.7% |
| 30 to 34 Minutes | 4,469 | 21.9% |
| 35 to 39 Minutes | 993 | 4.9% |
| 40 to 44 Minutes | 969 | 4.8% |
| 45 to 59 Minutes | 1,562 | 7.7% |
| 60 to 89 Minutes | 1,400 | 6.9% |
| 90 or more Minutes | 473 | 2.3% |
Commute Time by Sex in Greenacres
The most common commute times in Greenacres are 30 to 34 minutes (1,967 commuters, 19.0%) for males and 30 to 34 minutes (2,502 commuters, 25.0%) for females.
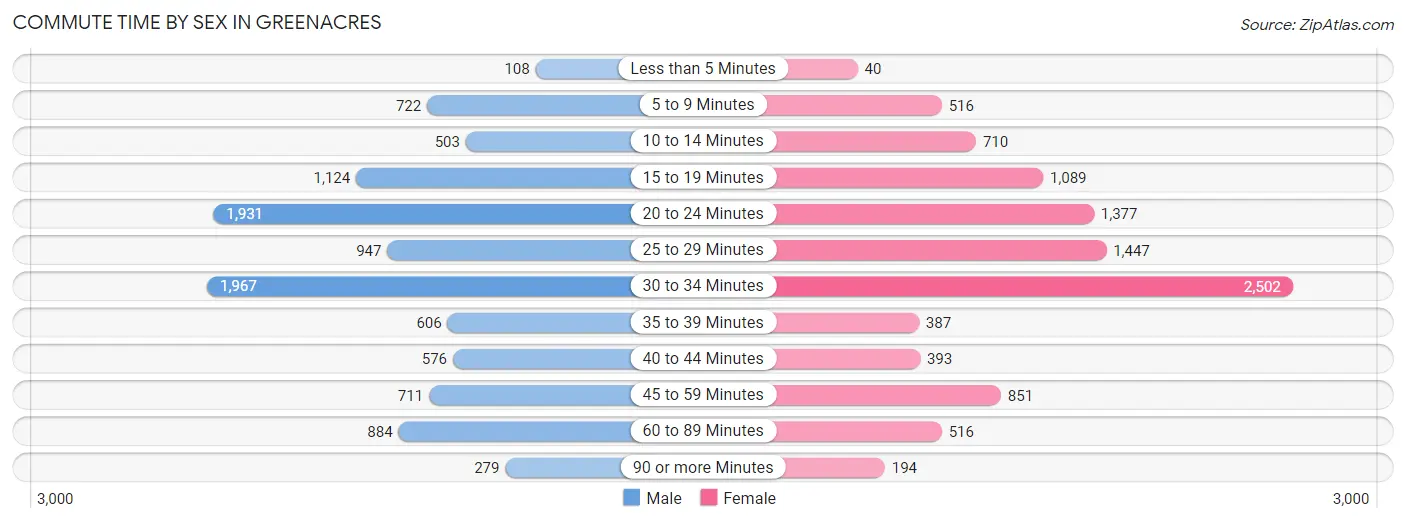
| Commute Time | Male | Female |
| Less than 5 Minutes | 108 (1.0%) | 40 (0.4%) |
| 5 to 9 Minutes | 722 (7.0%) | 516 (5.1%) |
| 10 to 14 Minutes | 503 (4.9%) | 710 (7.1%) |
| 15 to 19 Minutes | 1,124 (10.8%) | 1,089 (10.9%) |
| 20 to 24 Minutes | 1,931 (18.6%) | 1,377 (13.7%) |
| 25 to 29 Minutes | 947 (9.1%) | 1,447 (14.4%) |
| 30 to 34 Minutes | 1,967 (19.0%) | 2,502 (25.0%) |
| 35 to 39 Minutes | 606 (5.9%) | 387 (3.9%) |
| 40 to 44 Minutes | 576 (5.6%) | 393 (3.9%) |
| 45 to 59 Minutes | 711 (6.9%) | 851 (8.5%) |
| 60 to 89 Minutes | 884 (8.5%) | 516 (5.1%) |
| 90 or more Minutes | 279 (2.7%) | 194 (1.9%) |
Time of Departure to Work by Sex in Greenacres
The most frequent times of departure to work in Greenacres are 7:00 AM to 7:29 AM (1,662, 16.1%) for males and 7:00 AM to 7:29 AM (2,008, 20.0%) for females.
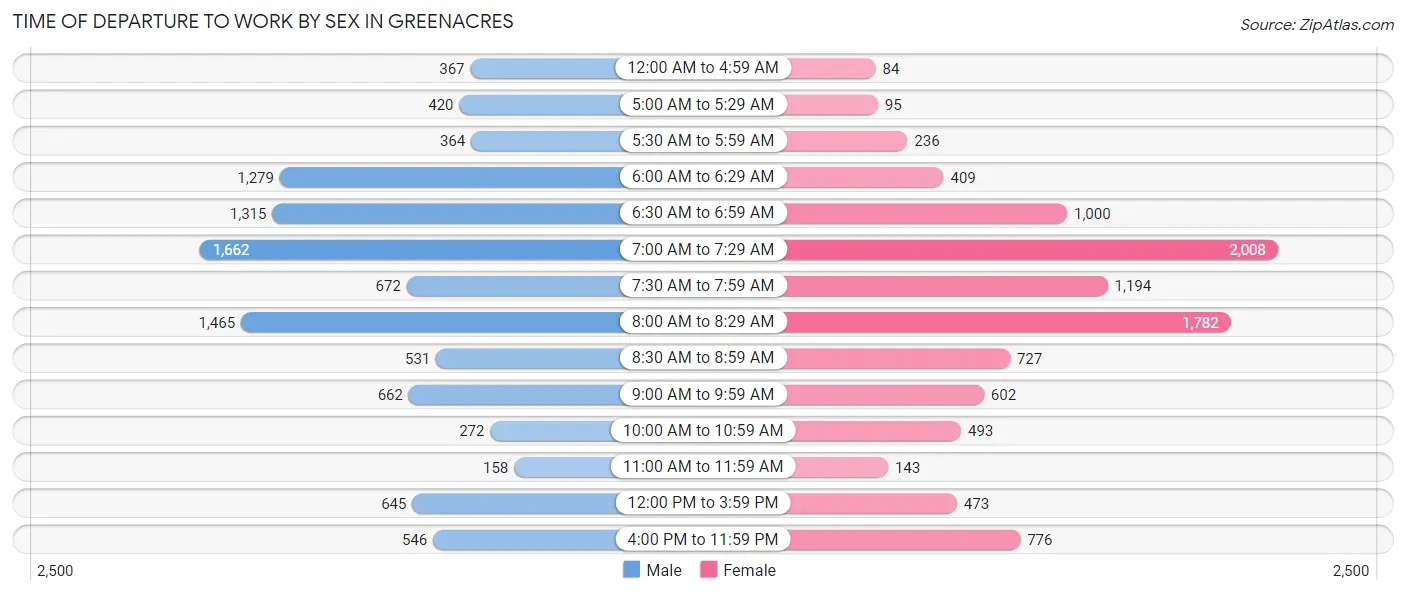
| Time of Departure | Male | Female |
| 12:00 AM to 4:59 AM | 367 (3.5%) | 84 (0.8%) |
| 5:00 AM to 5:29 AM | 420 (4.1%) | 95 (0.9%) |
| 5:30 AM to 5:59 AM | 364 (3.5%) | 236 (2.4%) |
| 6:00 AM to 6:29 AM | 1,279 (12.3%) | 409 (4.1%) |
| 6:30 AM to 6:59 AM | 1,315 (12.7%) | 1,000 (10.0%) |
| 7:00 AM to 7:29 AM | 1,662 (16.1%) | 2,008 (20.0%) |
| 7:30 AM to 7:59 AM | 672 (6.5%) | 1,194 (11.9%) |
| 8:00 AM to 8:29 AM | 1,465 (14.1%) | 1,782 (17.8%) |
| 8:30 AM to 8:59 AM | 531 (5.1%) | 727 (7.2%) |
| 9:00 AM to 9:59 AM | 662 (6.4%) | 602 (6.0%) |
| 10:00 AM to 10:59 AM | 272 (2.6%) | 493 (4.9%) |
| 11:00 AM to 11:59 AM | 158 (1.5%) | 143 (1.4%) |
| 12:00 PM to 3:59 PM | 645 (6.2%) | 473 (4.7%) |
| 4:00 PM to 11:59 PM | 546 (5.3%) | 776 (7.7%) |
| Total | 10,358 (100.0%) | 10,022 (100.0%) |
Housing Occupancy in Greenacres
Occupancy by Ownership in Greenacres
Of the total 15,535 dwellings in Greenacres, owner-occupied units account for 9,898 (63.7%), while renter-occupied units make up 5,637 (36.3%).
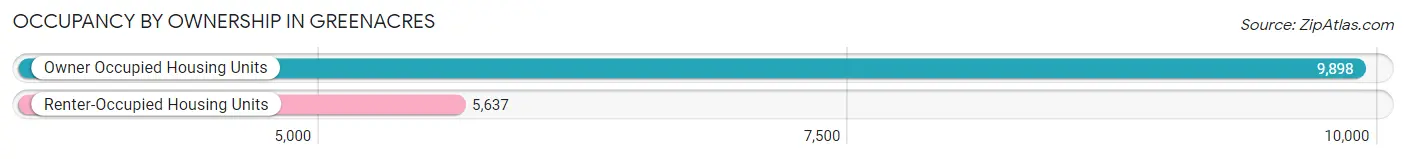
| Occupancy | # Housing Units | % Housing Units |
| Owner Occupied Housing Units | 9,898 | 63.7% |
| Renter-Occupied Housing Units | 5,637 | 36.3% |
| Total Occupied Housing Units | 15,535 | 100.0% |
Occupancy by Household Size in Greenacres
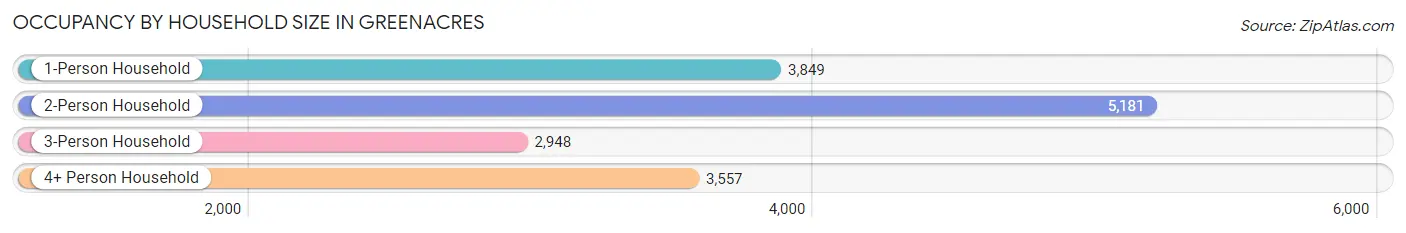
| Household Size | # Housing Units | % Housing Units |
| 1-Person Household | 3,849 | 24.8% |
| 2-Person Household | 5,181 | 33.4% |
| 3-Person Household | 2,948 | 19.0% |
| 4+ Person Household | 3,557 | 22.9% |
| Total Housing Units | 15,535 | 100.0% |
Occupancy by Ownership by Household Size in Greenacres
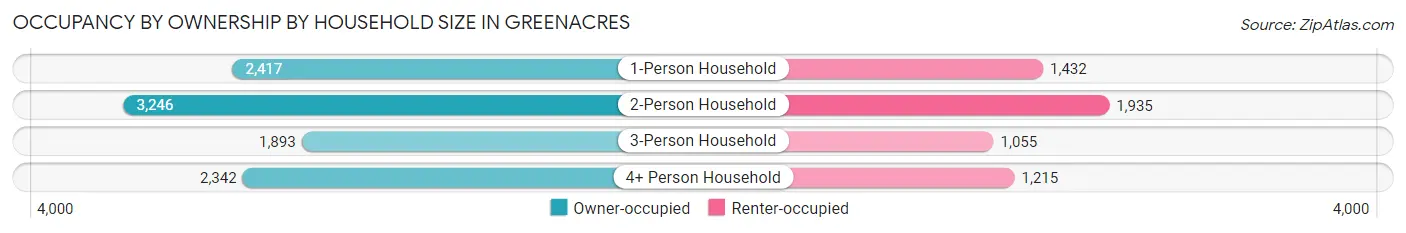
| Household Size | Owner-occupied | Renter-occupied |
| 1-Person Household | 2,417 (62.8%) | 1,432 (37.2%) |
| 2-Person Household | 3,246 (62.6%) | 1,935 (37.3%) |
| 3-Person Household | 1,893 (64.2%) | 1,055 (35.8%) |
| 4+ Person Household | 2,342 (65.8%) | 1,215 (34.2%) |
| Total Housing Units | 9,898 (63.7%) | 5,637 (36.3%) |
Occupancy by Educational Attainment in Greenacres
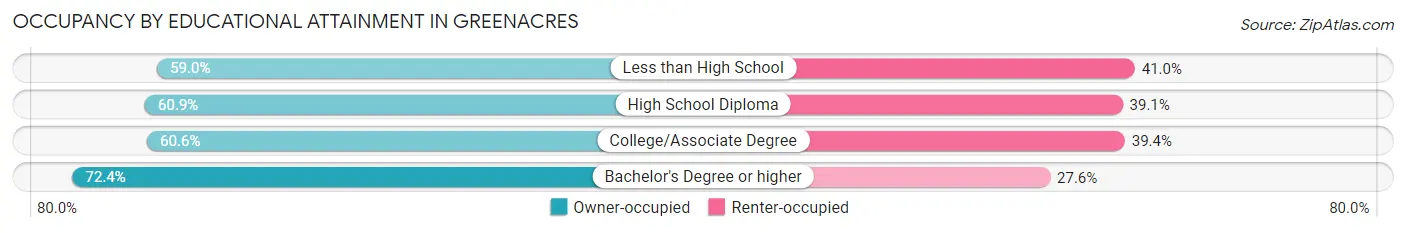
| Household Size | Owner-occupied | Renter-occupied |
| Less than High School | 1,159 (59.0%) | 806 (41.0%) |
| High School Diploma | 2,650 (60.9%) | 1,701 (39.1%) |
| College/Associate Degree | 2,998 (60.6%) | 1,952 (39.4%) |
| Bachelor's Degree or higher | 3,091 (72.4%) | 1,178 (27.6%) |
Occupancy by Age of Householder in Greenacres
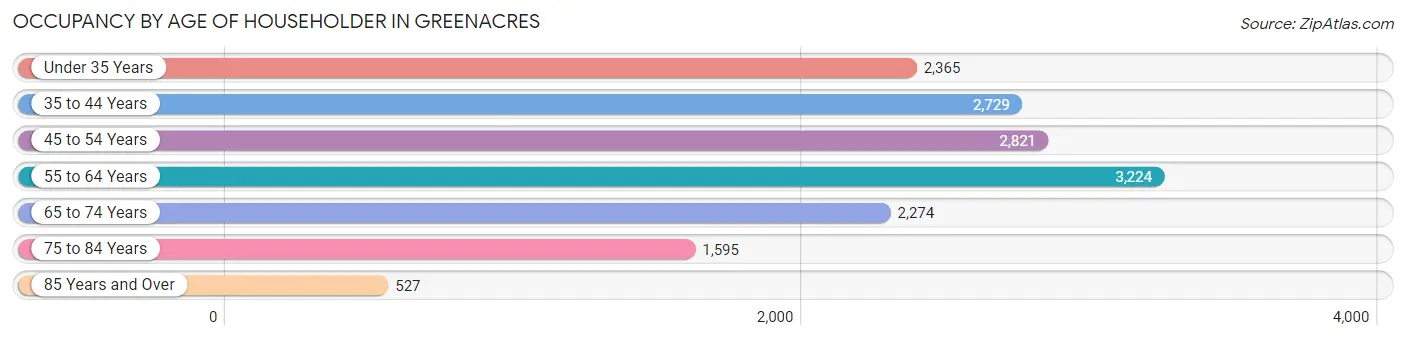
| Age Bracket | # Households | % Households |
| Under 35 Years | 2,365 | 15.2% |
| 35 to 44 Years | 2,729 | 17.6% |
| 45 to 54 Years | 2,821 | 18.2% |
| 55 to 64 Years | 3,224 | 20.7% |
| 65 to 74 Years | 2,274 | 14.6% |
| 75 to 84 Years | 1,595 | 10.3% |
| 85 Years and Over | 527 | 3.4% |
| Total | 15,535 | 100.0% |
Housing Finances in Greenacres
Median Income by Occupancy in Greenacres
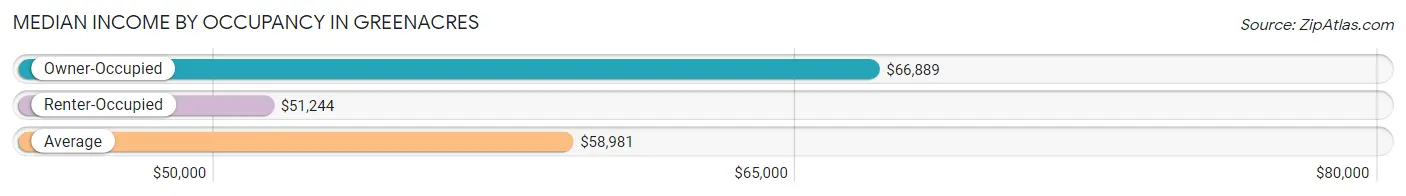
| Occupancy Type | # Households | Median Income |
| Owner-Occupied | 9,898 (63.7%) | $66,889 |
| Renter-Occupied | 5,637 (36.3%) | $51,244 |
| Average | 15,535 (100.0%) | $58,981 |
Occupancy by Householder Income Bracket in Greenacres
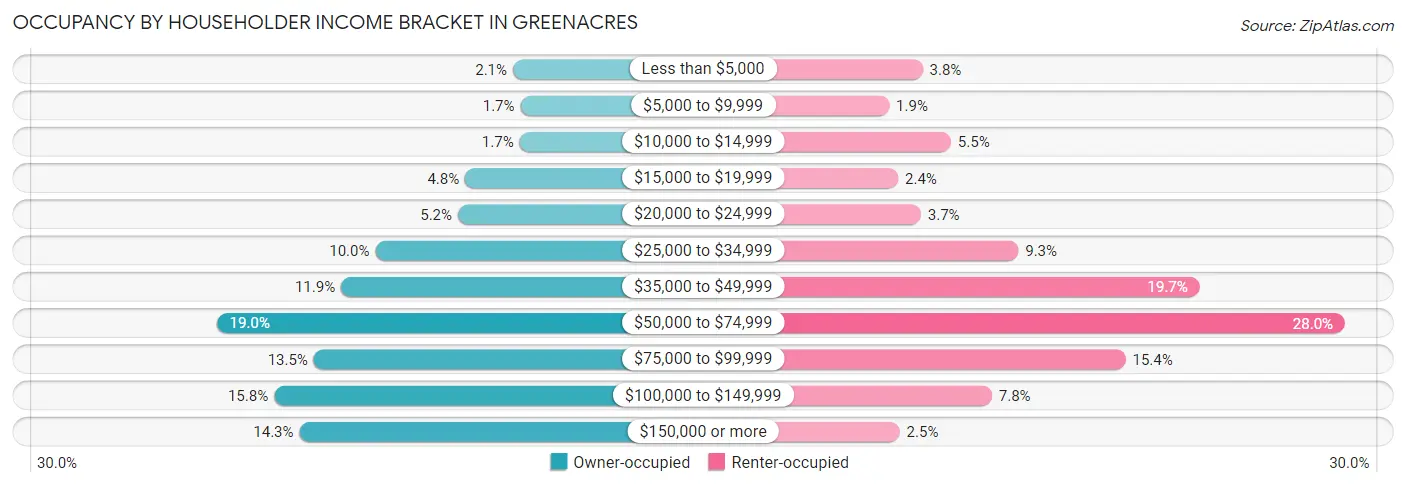
| Income Bracket | Owner-occupied | Renter-occupied |
| Less than $5,000 | 208 (2.1%) | 216 (3.8%) |
| $5,000 to $9,999 | 165 (1.7%) | 108 (1.9%) |
| $10,000 to $14,999 | 170 (1.7%) | 307 (5.4%) |
| $15,000 to $19,999 | 478 (4.8%) | 137 (2.4%) |
| $20,000 to $24,999 | 519 (5.2%) | 210 (3.7%) |
| $25,000 to $34,999 | 986 (10.0%) | 524 (9.3%) |
| $35,000 to $49,999 | 1,180 (11.9%) | 1,108 (19.7%) |
| $50,000 to $74,999 | 1,884 (19.0%) | 1,576 (28.0%) |
| $75,000 to $99,999 | 1,334 (13.5%) | 870 (15.4%) |
| $100,000 to $149,999 | 1,559 (15.8%) | 439 (7.8%) |
| $150,000 or more | 1,415 (14.3%) | 142 (2.5%) |
| Total | 9,898 (100.0%) | 5,637 (100.0%) |
Monthly Housing Cost Tiers in Greenacres
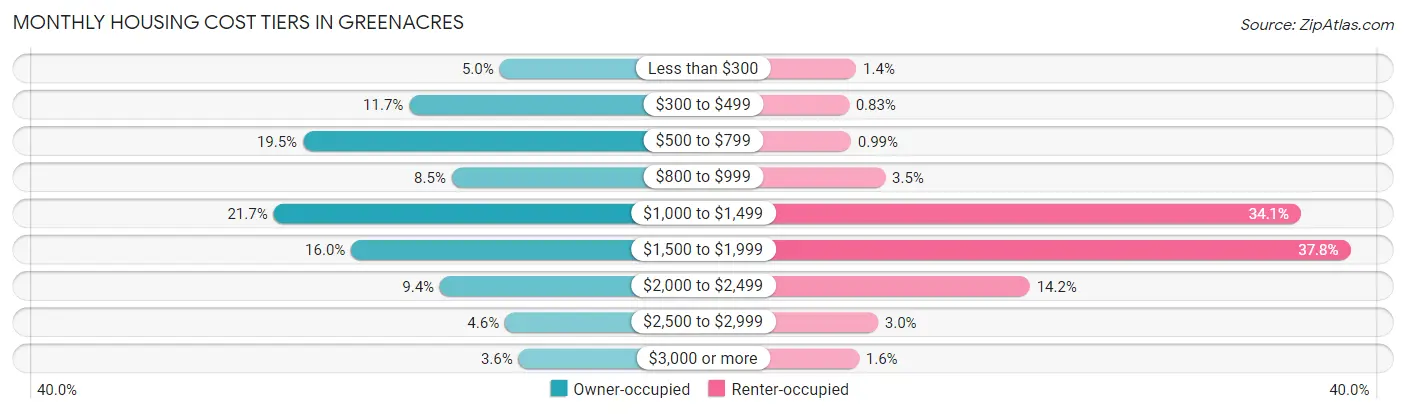
| Monthly Cost | Owner-occupied | Renter-occupied |
| Less than $300 | 497 (5.0%) | 78 (1.4%) |
| $300 to $499 | 1,156 (11.7%) | 47 (0.8%) |
| $500 to $799 | 1,930 (19.5%) | 56 (1.0%) |
| $800 to $999 | 845 (8.5%) | 198 (3.5%) |
| $1,000 to $1,499 | 2,145 (21.7%) | 1,924 (34.1%) |
| $1,500 to $1,999 | 1,579 (16.0%) | 2,129 (37.8%) |
| $2,000 to $2,499 | 931 (9.4%) | 798 (14.2%) |
| $2,500 to $2,999 | 457 (4.6%) | 168 (3.0%) |
| $3,000 or more | 358 (3.6%) | 89 (1.6%) |
| Total | 9,898 (100.0%) | 5,637 (100.0%) |
Physical Housing Characteristics in Greenacres
Housing Structures in Greenacres
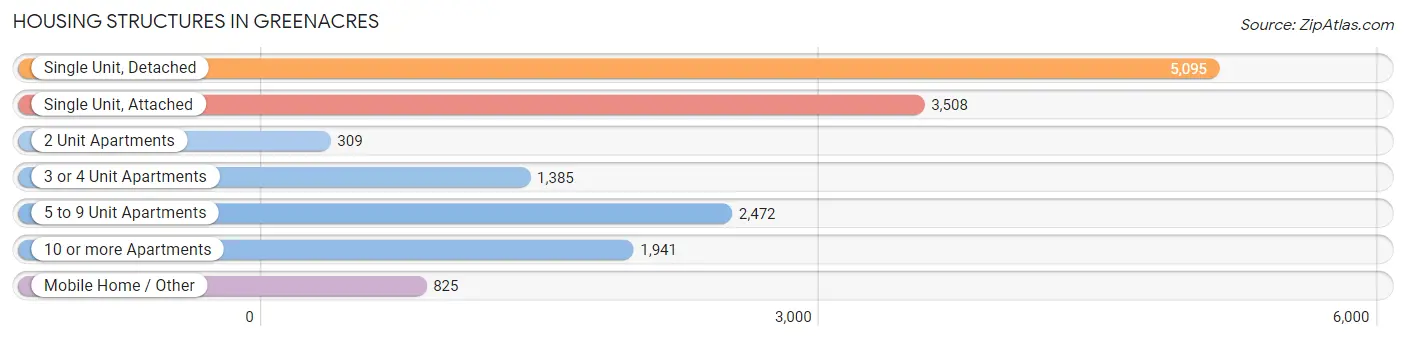
| Structure Type | # Housing Units | % Housing Units |
| Single Unit, Detached | 5,095 | 32.8% |
| Single Unit, Attached | 3,508 | 22.6% |
| 2 Unit Apartments | 309 | 2.0% |
| 3 or 4 Unit Apartments | 1,385 | 8.9% |
| 5 to 9 Unit Apartments | 2,472 | 15.9% |
| 10 or more Apartments | 1,941 | 12.5% |
| Mobile Home / Other | 825 | 5.3% |
| Total | 15,535 | 100.0% |
Housing Structures by Occupancy in Greenacres
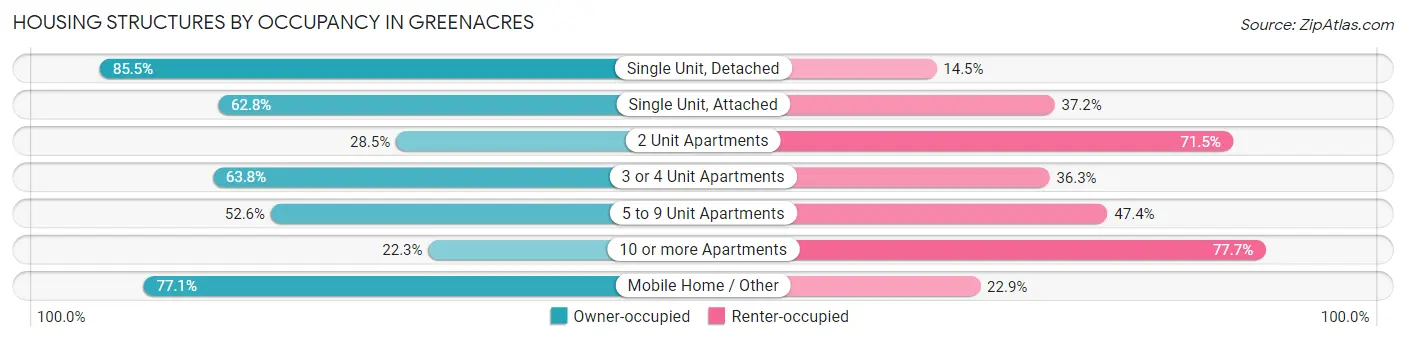
| Structure Type | Owner-occupied | Renter-occupied |
| Single Unit, Detached | 4,357 (85.5%) | 738 (14.5%) |
| Single Unit, Attached | 2,202 (62.8%) | 1,306 (37.2%) |
| 2 Unit Apartments | 88 (28.5%) | 221 (71.5%) |
| 3 or 4 Unit Apartments | 883 (63.7%) | 502 (36.2%) |
| 5 to 9 Unit Apartments | 1,300 (52.6%) | 1,172 (47.4%) |
| 10 or more Apartments | 432 (22.3%) | 1,509 (77.7%) |
| Mobile Home / Other | 636 (77.1%) | 189 (22.9%) |
| Total | 9,898 (63.7%) | 5,637 (36.3%) |
Housing Structures by Number of Rooms in Greenacres
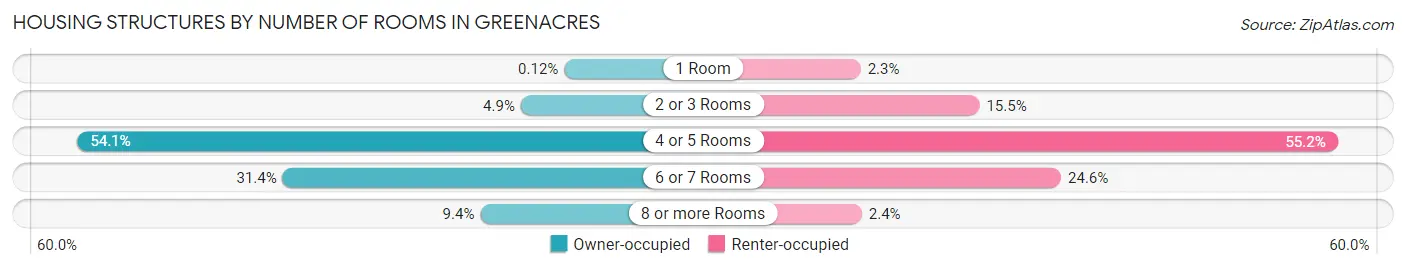
| Number of Rooms | Owner-occupied | Renter-occupied |
| 1 Room | 12 (0.1%) | 130 (2.3%) |
| 2 or 3 Rooms | 489 (4.9%) | 873 (15.5%) |
| 4 or 5 Rooms | 5,359 (54.1%) | 3,113 (55.2%) |
| 6 or 7 Rooms | 3,105 (31.4%) | 1,384 (24.5%) |
| 8 or more Rooms | 933 (9.4%) | 137 (2.4%) |
| Total | 9,898 (100.0%) | 5,637 (100.0%) |
Housing Structure by Heating Type in Greenacres
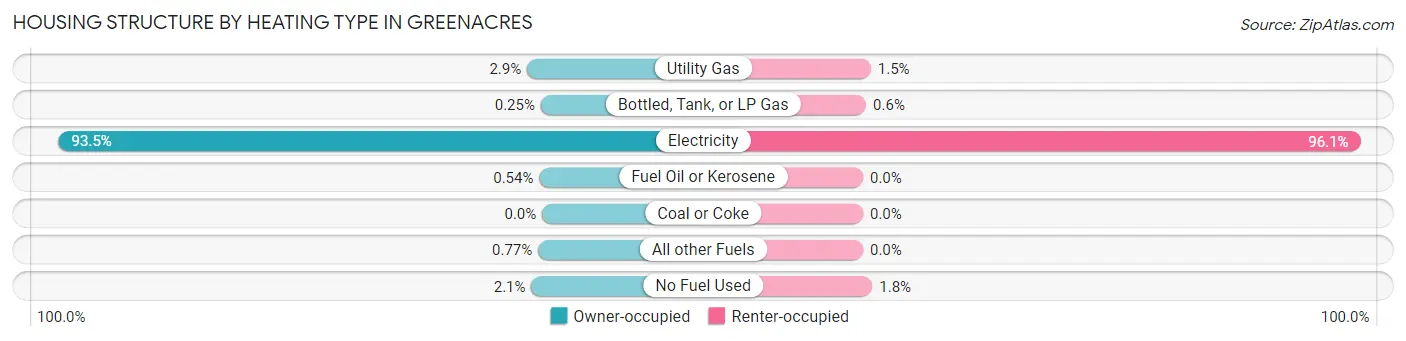
| Heating Type | Owner-occupied | Renter-occupied |
| Utility Gas | 288 (2.9%) | 85 (1.5%) |
| Bottled, Tank, or LP Gas | 25 (0.3%) | 34 (0.6%) |
| Electricity | 9,251 (93.5%) | 5,417 (96.1%) |
| Fuel Oil or Kerosene | 53 (0.5%) | 0 (0.0%) |
| Coal or Coke | 0 (0.0%) | 0 (0.0%) |
| All other Fuels | 76 (0.8%) | 0 (0.0%) |
| No Fuel Used | 205 (2.1%) | 101 (1.8%) |
| Total | 9,898 (100.0%) | 5,637 (100.0%) |
Household Vehicle Usage in Greenacres
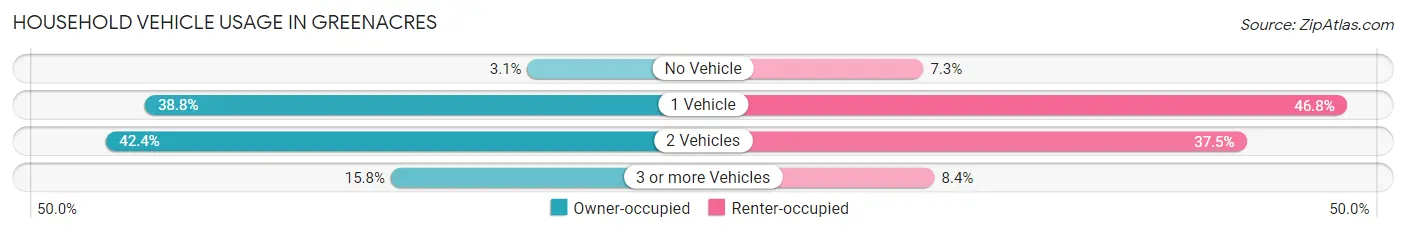
| Vehicles per Household | Owner-occupied | Renter-occupied |
| No Vehicle | 303 (3.1%) | 414 (7.3%) |
| 1 Vehicle | 3,836 (38.8%) | 2,639 (46.8%) |
| 2 Vehicles | 4,193 (42.4%) | 2,112 (37.5%) |
| 3 or more Vehicles | 1,566 (15.8%) | 472 (8.4%) |
| Total | 9,898 (100.0%) | 5,637 (100.0%) |
Real Estate & Mortgages in Greenacres
Real Estate and Mortgage Overview in Greenacres
| Characteristic | Without Mortgage | With Mortgage |
| Housing Units | 4,022 | 5,876 |
| Median Property Value | $180,300 | $248,100 |
| Median Household Income | $44,982 | $899 |
| Monthly Housing Costs | $580 | $358 |
| Real Estate Taxes | $1,275 | $315 |
Property Value by Mortgage Status in Greenacres
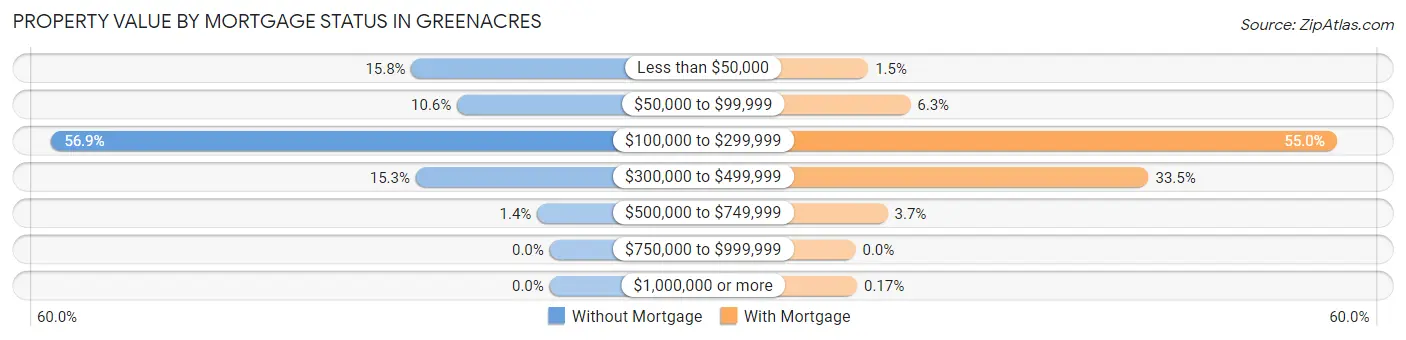
| Property Value | Without Mortgage | With Mortgage |
| Less than $50,000 | 635 (15.8%) | 85 (1.5%) |
| $50,000 to $99,999 | 425 (10.6%) | 368 (6.3%) |
| $100,000 to $299,999 | 2,290 (56.9%) | 3,230 (55.0%) |
| $300,000 to $499,999 | 615 (15.3%) | 1,968 (33.5%) |
| $500,000 to $749,999 | 57 (1.4%) | 215 (3.7%) |
| $750,000 to $999,999 | 0 (0.0%) | 0 (0.0%) |
| $1,000,000 or more | 0 (0.0%) | 10 (0.2%) |
| Total | 4,022 (100.0%) | 5,876 (100.0%) |
Household Income by Mortgage Status in Greenacres
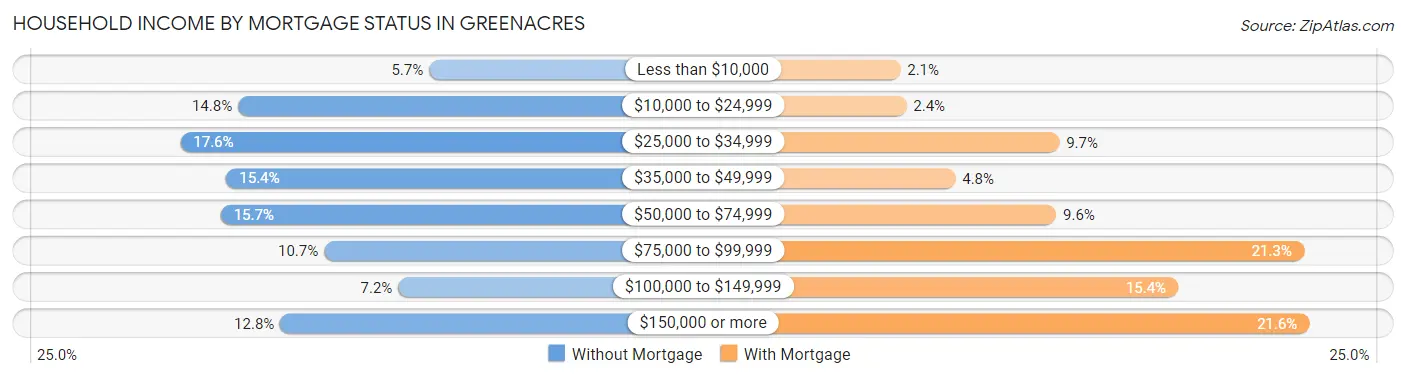
| Household Income | Without Mortgage | With Mortgage |
| Less than $10,000 | 231 (5.7%) | 125 (2.1%) |
| $10,000 to $24,999 | 597 (14.8%) | 142 (2.4%) |
| $25,000 to $34,999 | 707 (17.6%) | 570 (9.7%) |
| $35,000 to $49,999 | 619 (15.4%) | 279 (4.8%) |
| $50,000 to $74,999 | 630 (15.7%) | 561 (9.6%) |
| $75,000 to $99,999 | 432 (10.7%) | 1,254 (21.3%) |
| $100,000 to $149,999 | 290 (7.2%) | 902 (15.3%) |
| $150,000 or more | 516 (12.8%) | 1,269 (21.6%) |
| Total | 4,022 (100.0%) | 5,876 (100.0%) |
Property Value to Household Income Ratio in Greenacres
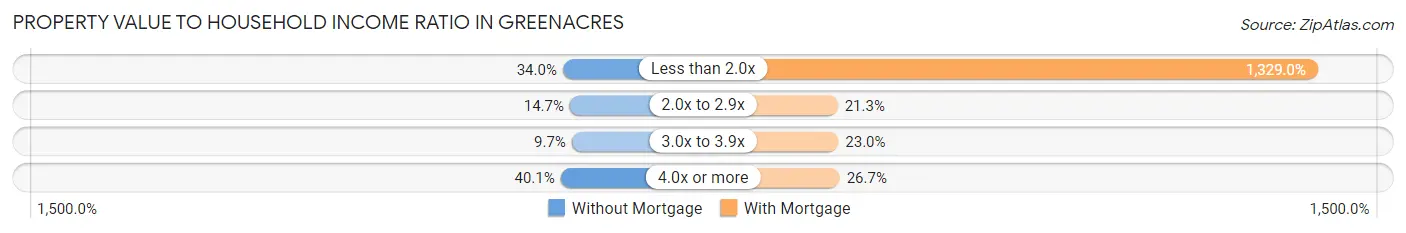
| Value-to-Income Ratio | Without Mortgage | With Mortgage |
| Less than 2.0x | 1,367 (34.0%) | 78,090 (1,329.0%) |
| 2.0x to 2.9x | 592 (14.7%) | 1,252 (21.3%) |
| 3.0x to 3.9x | 391 (9.7%) | 1,353 (23.0%) |
| 4.0x or more | 1,613 (40.1%) | 1,569 (26.7%) |
| Total | 4,022 (100.0%) | 5,876 (100.0%) |
Real Estate Taxes by Mortgage Status in Greenacres
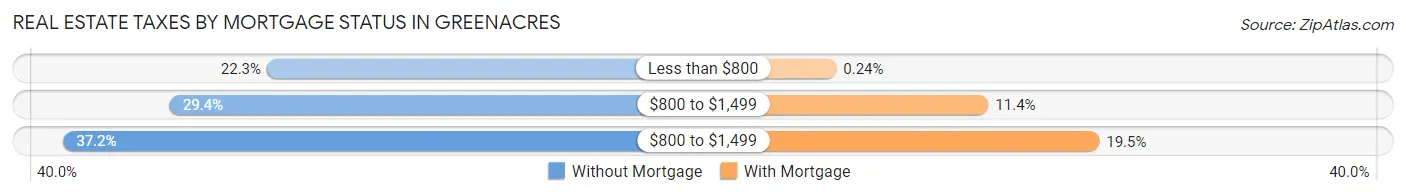
| Property Taxes | Without Mortgage | With Mortgage |
| Less than $800 | 897 (22.3%) | 14 (0.2%) |
| $800 to $1,499 | 1,182 (29.4%) | 667 (11.4%) |
| $800 to $1,499 | 1,495 (37.2%) | 1,143 (19.5%) |
| Total | 4,022 (100.0%) | 5,876 (100.0%) |
Health & Disability in Greenacres
Health Insurance Coverage by Age in Greenacres
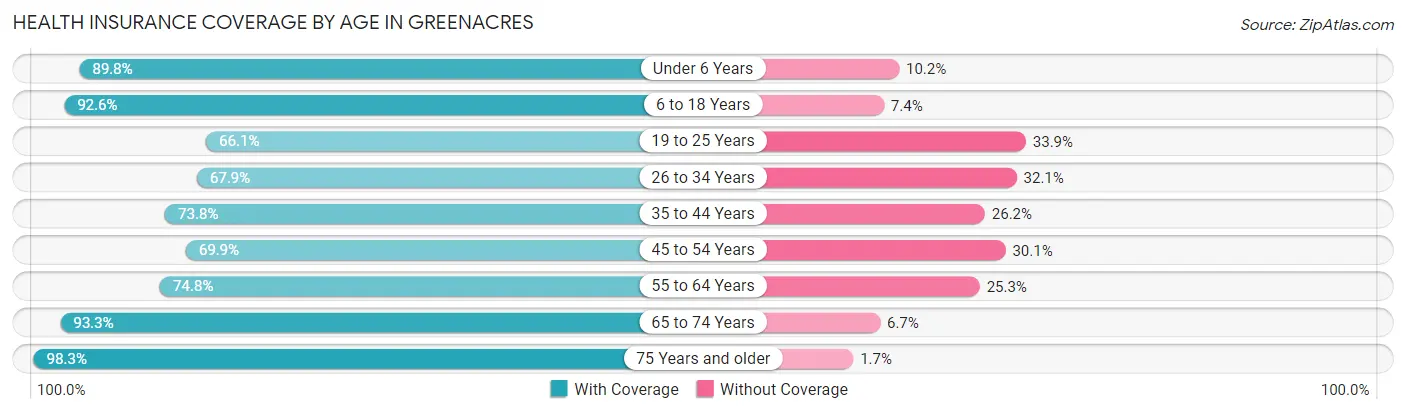
| Age Bracket | With Coverage | Without Coverage |
| Under 6 Years | 2,788 (89.8%) | 317 (10.2%) |
| 6 to 18 Years | 6,262 (92.6%) | 500 (7.4%) |
| 19 to 25 Years | 2,711 (66.1%) | 1,388 (33.9%) |
| 26 to 34 Years | 3,752 (67.9%) | 1,776 (32.1%) |
| 35 to 44 Years | 4,364 (73.8%) | 1,550 (26.2%) |
| 45 to 54 Years | 3,883 (69.9%) | 1,669 (30.1%) |
| 55 to 64 Years | 4,032 (74.8%) | 1,362 (25.3%) |
| 65 to 74 Years | 3,547 (93.3%) | 253 (6.7%) |
| 75 Years and older | 3,405 (98.3%) | 58 (1.7%) |
| Total | 34,744 (79.7%) | 8,873 (20.3%) |
Health Insurance Coverage by Citizenship Status in Greenacres
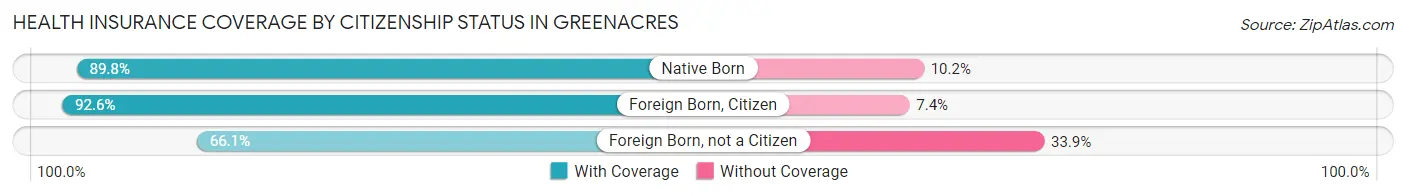
| Citizenship Status | With Coverage | Without Coverage |
| Native Born | 2,788 (89.8%) | 317 (10.2%) |
| Foreign Born, Citizen | 6,262 (92.6%) | 500 (7.4%) |
| Foreign Born, not a Citizen | 2,711 (66.1%) | 1,388 (33.9%) |
Health Insurance Coverage by Household Income in Greenacres
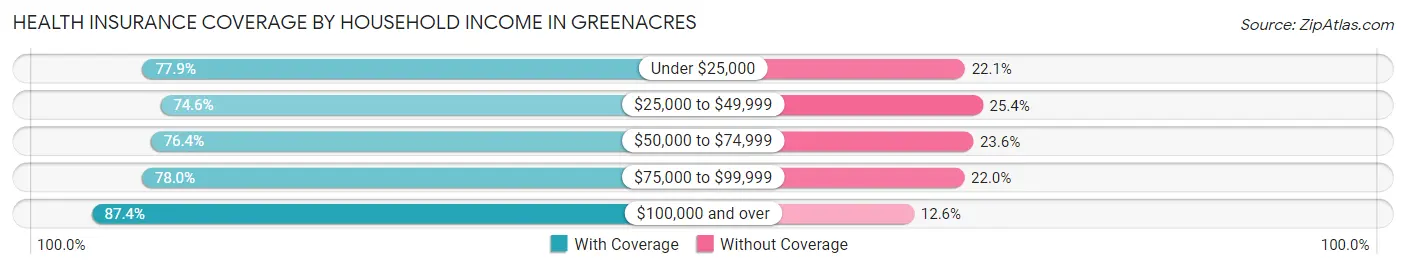
| Household Income | With Coverage | Without Coverage |
| Under $25,000 | 4,349 (77.9%) | 1,233 (22.1%) |
| $25,000 to $49,999 | 6,501 (74.6%) | 2,217 (25.4%) |
| $50,000 to $74,999 | 7,191 (76.4%) | 2,226 (23.6%) |
| $75,000 to $99,999 | 5,540 (78.0%) | 1,561 (22.0%) |
| $100,000 and over | 11,091 (87.4%) | 1,593 (12.6%) |
Public vs Private Health Insurance Coverage by Age in Greenacres
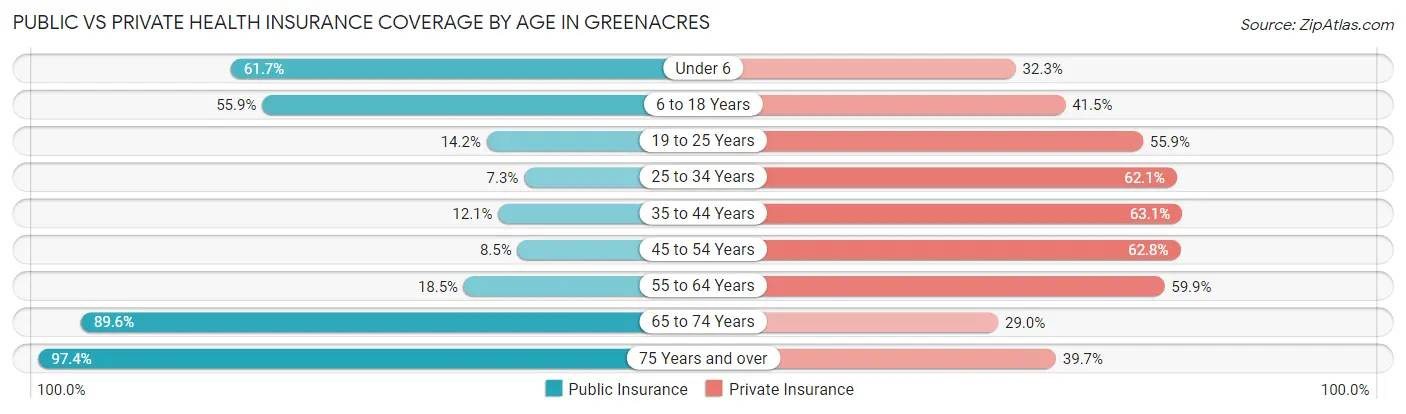
| Age Bracket | Public Insurance | Private Insurance |
| Under 6 | 1,916 (61.7%) | 1,002 (32.3%) |
| 6 to 18 Years | 3,779 (55.9%) | 2,804 (41.5%) |
| 19 to 25 Years | 583 (14.2%) | 2,290 (55.9%) |
| 25 to 34 Years | 402 (7.3%) | 3,434 (62.1%) |
| 35 to 44 Years | 713 (12.1%) | 3,734 (63.1%) |
| 45 to 54 Years | 472 (8.5%) | 3,488 (62.8%) |
| 55 to 64 Years | 995 (18.4%) | 3,229 (59.9%) |
| 65 to 74 Years | 3,403 (89.5%) | 1,102 (29.0%) |
| 75 Years and over | 3,374 (97.4%) | 1,376 (39.7%) |
| Total | 15,637 (35.8%) | 22,459 (51.5%) |
Disability Status by Sex by Age in Greenacres
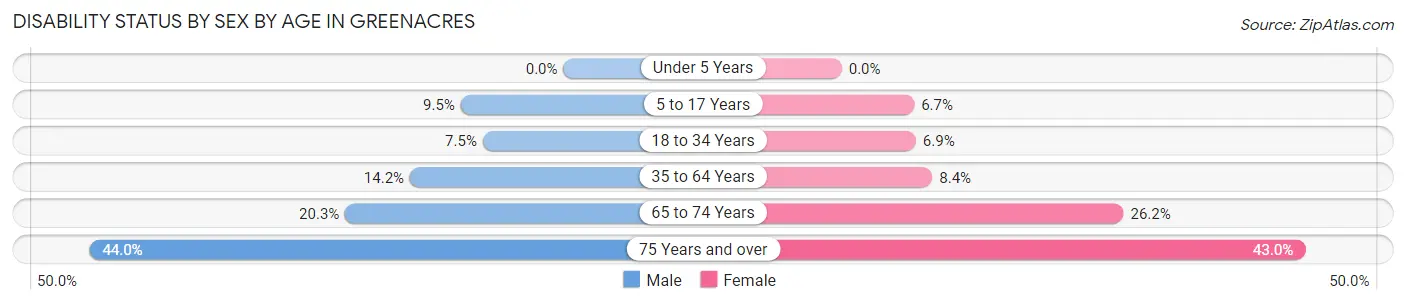
| Age Bracket | Male | Female |
| Under 5 Years | 0 (0.0%) | 0 (0.0%) |
| 5 to 17 Years | 295 (9.5%) | 232 (6.7%) |
| 18 to 34 Years | 399 (7.5%) | 327 (6.9%) |
| 35 to 64 Years | 1,131 (14.2%) | 749 (8.4%) |
| 65 to 74 Years | 353 (20.3%) | 538 (26.2%) |
| 75 Years and over | 621 (44.0%) | 882 (43.0%) |
Disability Class by Sex by Age in Greenacres
Disability Class: Hearing Difficulty
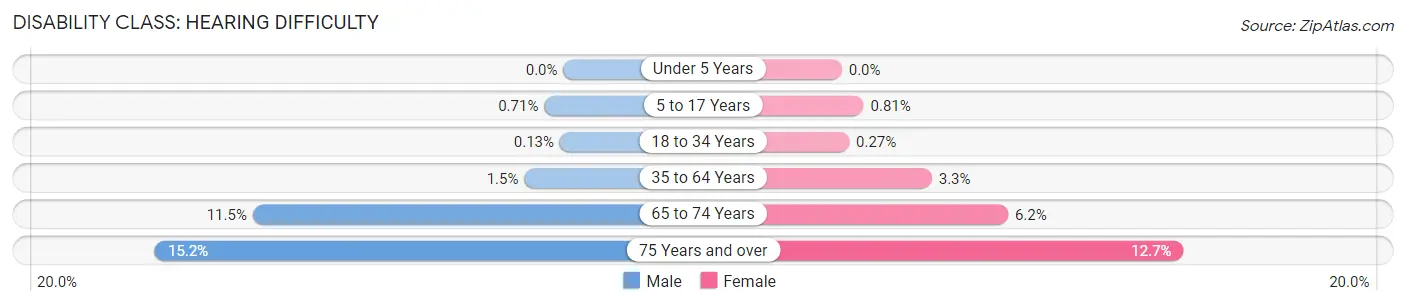
| Age Bracket | Male | Female |
| Under 5 Years | 0 (0.0%) | 0 (0.0%) |
| 5 to 17 Years | 22 (0.7%) | 28 (0.8%) |
| 18 to 34 Years | 7 (0.1%) | 13 (0.3%) |
| 35 to 64 Years | 115 (1.5%) | 298 (3.3%) |
| 65 to 74 Years | 201 (11.5%) | 127 (6.2%) |
| 75 Years and over | 214 (15.2%) | 260 (12.7%) |
Disability Class: Vision Difficulty
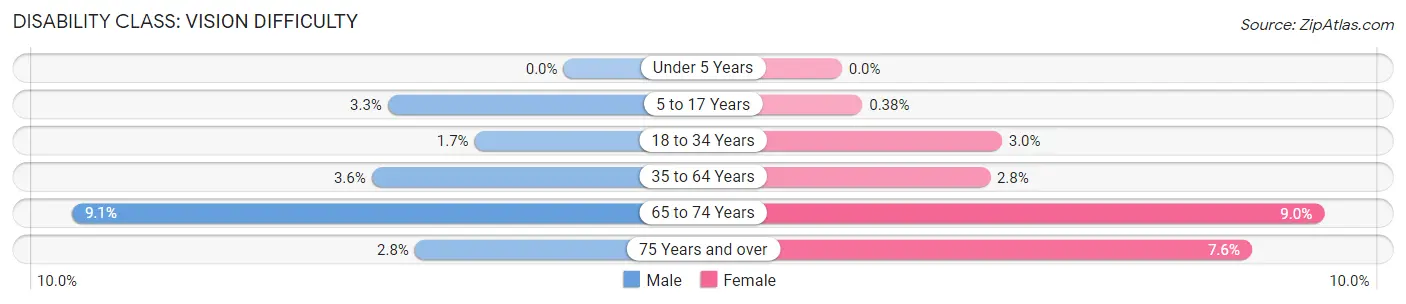
| Age Bracket | Male | Female |
| Under 5 Years | 0 (0.0%) | 0 (0.0%) |
| 5 to 17 Years | 101 (3.3%) | 13 (0.4%) |
| 18 to 34 Years | 88 (1.7%) | 141 (3.0%) |
| 35 to 64 Years | 283 (3.6%) | 245 (2.8%) |
| 65 to 74 Years | 159 (9.1%) | 184 (8.9%) |
| 75 Years and over | 39 (2.8%) | 156 (7.6%) |
Disability Class: Cognitive Difficulty
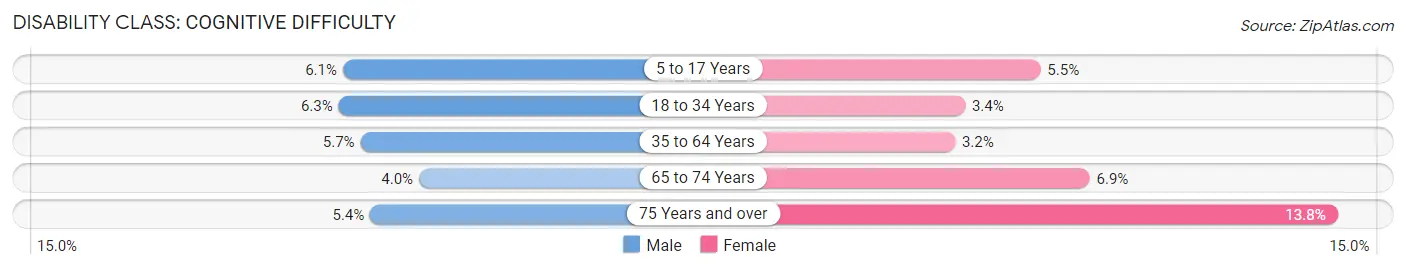
| Age Bracket | Male | Female |
| 5 to 17 Years | 190 (6.1%) | 191 (5.5%) |
| 18 to 34 Years | 334 (6.3%) | 163 (3.4%) |
| 35 to 64 Years | 449 (5.7%) | 281 (3.2%) |
| 65 to 74 Years | 70 (4.0%) | 142 (6.9%) |
| 75 Years and over | 76 (5.4%) | 283 (13.8%) |
Disability Class: Ambulatory Difficulty
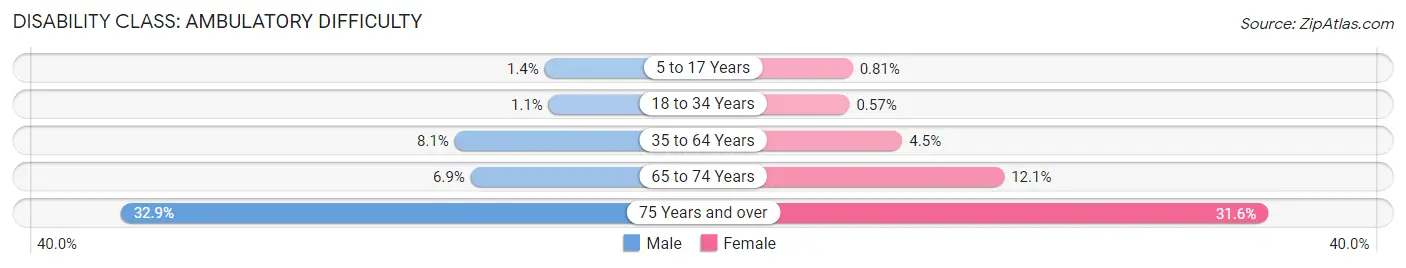
| Age Bracket | Male | Female |
| 5 to 17 Years | 43 (1.4%) | 28 (0.8%) |
| 18 to 34 Years | 58 (1.1%) | 27 (0.6%) |
| 35 to 64 Years | 641 (8.1%) | 401 (4.5%) |
| 65 to 74 Years | 120 (6.9%) | 248 (12.1%) |
| 75 Years and over | 464 (32.9%) | 649 (31.6%) |
Disability Class: Self-Care Difficulty
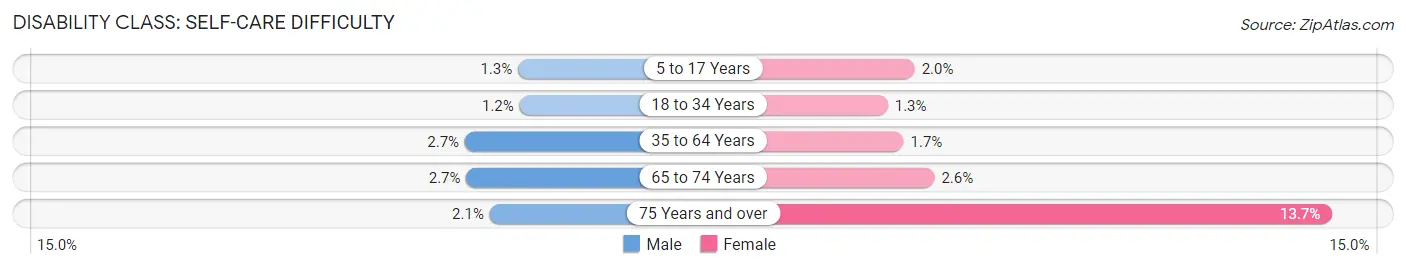
| Age Bracket | Male | Female |
| 5 to 17 Years | 39 (1.3%) | 70 (2.0%) |
| 18 to 34 Years | 65 (1.2%) | 61 (1.3%) |
| 35 to 64 Years | 218 (2.7%) | 153 (1.7%) |
| 65 to 74 Years | 47 (2.7%) | 53 (2.6%) |
| 75 Years and over | 29 (2.1%) | 280 (13.7%) |
Technology Access in Greenacres
Computing Device Access in Greenacres
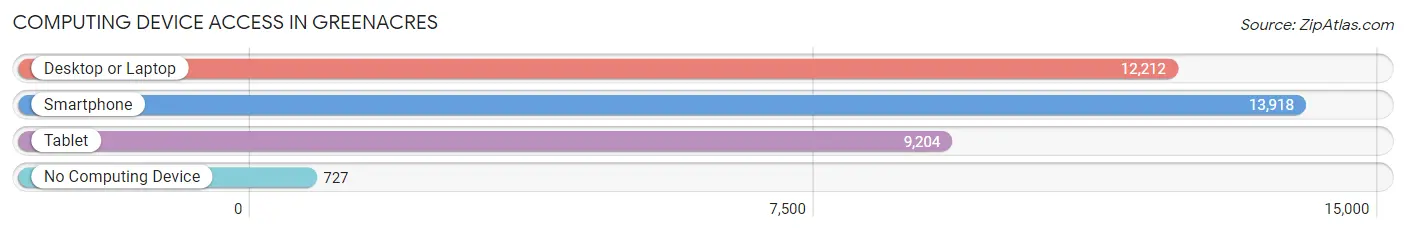
| Device Type | # Households | % Households |
| Desktop or Laptop | 12,212 | 78.6% |
| Smartphone | 13,918 | 89.6% |
| Tablet | 9,204 | 59.3% |
| No Computing Device | 727 | 4.7% |
| Total | 15,535 | 100.0% |
Internet Access in Greenacres
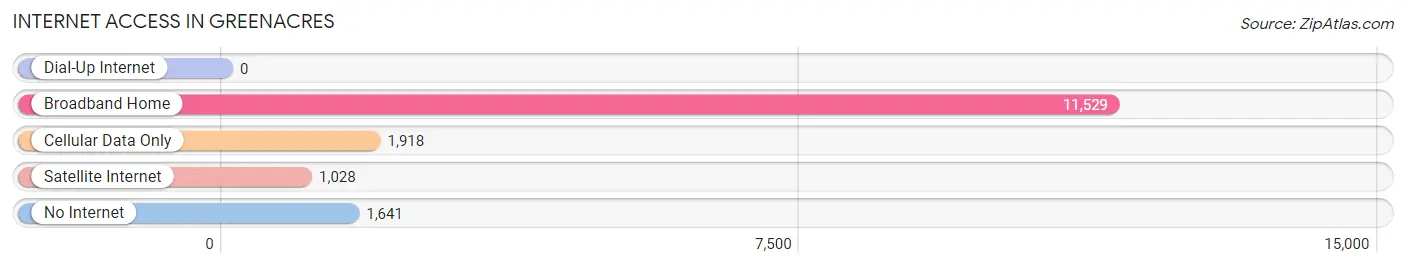
| Internet Type | # Households | % Households |
| Dial-Up Internet | 0 | 0.0% |
| Broadband Home | 11,529 | 74.2% |
| Cellular Data Only | 1,918 | 12.3% |
| Satellite Internet | 1,028 | 6.6% |
| No Internet | 1,641 | 10.6% |
| Total | 15,535 | 100.0% |
Greenacres Summary
Geography
Greenacres is a city located in Palm Beach County, Florida. It is situated in the southeastern part of the state, approximately 15 miles inland from the Atlantic Ocean. The city is bordered by Lake Worth to the east, West Palm Beach to the south, and Lantana to the west. The city covers an area of 4.2 square miles, with a population of 37,566 as of the 2010 census.
The city is located in the Miami metropolitan area, which is the most populous metropolitan area in the state of Florida. The city is situated on a flat coastal plain, with an elevation of just 10 feet above sea level. The city is located in the subtropical climate zone, with hot, humid summers and mild winters. The average annual temperature is 75.2 degrees Fahrenheit, with an average annual precipitation of 59.3 inches.
History
Greenacres was originally part of the unincorporated area of Palm Beach County, known as the “Lakes Region”. The area was first settled in the late 19th century by settlers from the Bahamas, who established small farms and citrus groves. In the early 20th century, the area was developed as a residential community, with the construction of the first homes in the area in the 1920s.
In the 1950s, the area was incorporated as the City of Greenacres, with the first mayor being elected in 1956. The city was named after the Greenacres Country Club, which was established in the area in the early 1900s. The city experienced rapid growth in the 1960s and 1970s, with the population increasing from just over 1,000 in 1960 to over 37,000 in 2010.
Economy
Greenacres is a primarily residential city, with a strong economy based on tourism and retail. The city is home to several large shopping centers, including the Greenacres Shopping Center, the Greenacres Mall, and the Greenacres Marketplace. The city is also home to several large employers, including the Palm Beach County School District, the City of Greenacres, and the Palm Beach County Sheriff’s Office.
The city is also home to several large medical facilities, including the JFK Medical Center, the Palm Beach County Health Department, and the Palm Beach County Mental Health Center. The city is also home to several large manufacturing and industrial facilities, including the Greenacres Industrial Park and the Greenacres Technology Park.
Demographics
As of the 2010 census, the population of Greenacres was 37,566, with a population density of 8,945 people per square mile. The racial makeup of the city was 64.3% White, 20.2% African American, 0.4% Native American, 3.2% Asian, 0.1% Pacific Islander, 8.7% from other races, and 3.1% from two or more races. Hispanic or Latino of any race were 18.2% of the population.
The median income for a household in the city was $41,945, and the median income for a family was $50,945. The per capita income for the city was $21,945. About 11.2% of families and 14.2% of the population were below the poverty line, including 19.2% of those under age 18 and 8.2% of those age 65 or over.
Common Questions
What is Per Capita Income in Greenacres?
Per Capita income in Greenacres is $34,117.
What is the Median Family Income in Greenacres?
Median Family Income in Greenacres is $65,993.
What is the Median Household income in Greenacres?
Median Household Income in Greenacres is $58,981.
What is Income or Wage Gap in Greenacres?
Income or Wage Gap in Greenacres is 6.7%.
Women in Greenacres earn 93.3 cents for every dollar earned by a man.
What is Inequality or Gini Index in Greenacres?
Inequality or Gini Index in Greenacres is 0.52.
What is the Total Population of Greenacres?
Total Population of Greenacres is 43,651.
What is the Total Male Population of Greenacres?
Total Male Population of Greenacres is 21,050.
What is the Total Female Population of Greenacres?
Total Female Population of Greenacres is 22,601.
What is the Ratio of Males per 100 Females in Greenacres?
There are 93.14 Males per 100 Females in Greenacres.
What is the Ratio of Females per 100 Males in Greenacres?
There are 107.37 Females per 100 Males in Greenacres.
What is the Median Population Age in Greenacres?
Median Population Age in Greenacres is 38.7 Years.
What is the Average Family Size in Greenacres
Average Family Size in Greenacres is 3.3 People.
What is the Average Household Size in Greenacres
Average Household Size in Greenacres is 2.8 People.
How Large is the Labor Force in Greenacres?
There are 22,977 People in the Labor Forcein in Greenacres.
What is the Percentage of People in the Labor Force in Greenacres?
65.4% of People are in the Labor Force in Greenacres.
What is the Unemployment Rate in Greenacres?
Unemployment Rate in Greenacres is 5.4%.