Golden Gate, FL Map & Demographics
Golden Gate Map
Golden Gate Overview
$25,610
PER CAPITA INCOME
$68,802
AVG FAMILY INCOME
$61,905
AVG HOUSEHOLD INCOME
15.2%
WAGE / INCOME GAP [ % ]
84.8¢/ $1
WAGE / INCOME GAP [ $ ]
$9,320
FAMILY INCOME DEFICIT
0.42
INEQUALITY / GINI INDEX
29,400
TOTAL POPULATION
15,242
MALE POPULATION
14,158
FEMALE POPULATION
107.66
MALES / 100 FEMALES
92.89
FEMALES / 100 MALES
35.6
MEDIAN AGE
3.9
AVG FAMILY SIZE
3.4
AVG HOUSEHOLD SIZE
16,970
LABOR FORCE [ PEOPLE ]
72.6%
PERCENT IN LABOR FORCE
4.5%
UNEMPLOYMENT RATE
Income in Golden Gate
Income Overview in Golden Gate
Per Capita Income in Golden Gate is $25,610, while median incomes of families and households are $68,802 and $61,905 respectively.
| Characteristic | Number | Measure |
| Per Capita Income | 29,400 | $25,610 |
| Median Family Income | 6,347 | $68,802 |
| Mean Family Income | 6,347 | $85,868 |
| Median Household Income | 8,538 | $61,905 |
| Mean Household Income | 8,538 | $80,032 |
| Income Deficit | 6,347 | $9,320 |
| Wage / Income Gap (%) | 29,400 | 15.24% |
| Wage / Income Gap ($) | 29,400 | 84.76¢ per $1 |
| Gini / Inequality Index | 29,400 | 0.42 |
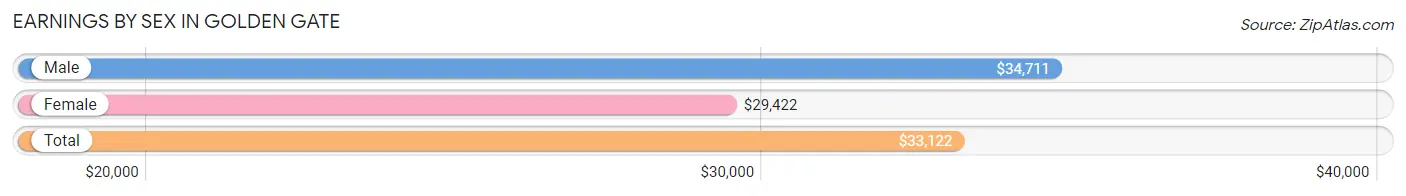
Earnings by Sex in Golden Gate
Average Earnings in Golden Gate are $33,122, $34,711 for men and $29,422 for women, a difference of 15.2%.
| Sex | Number | Average Earnings |
| Male | 10,110 (58.9%) | $34,711 |
| Female | 7,066 (41.1%) | $29,422 |
| Total | 17,176 (100.0%) | $33,122 |
Earnings by Sex by Income Bracket in Golden Gate
The most common earnings brackets in Golden Gate are $30,000 to $34,999 for men (1,141 | 11.3%) and $30,000 to $34,999 for women (716 | 10.1%).
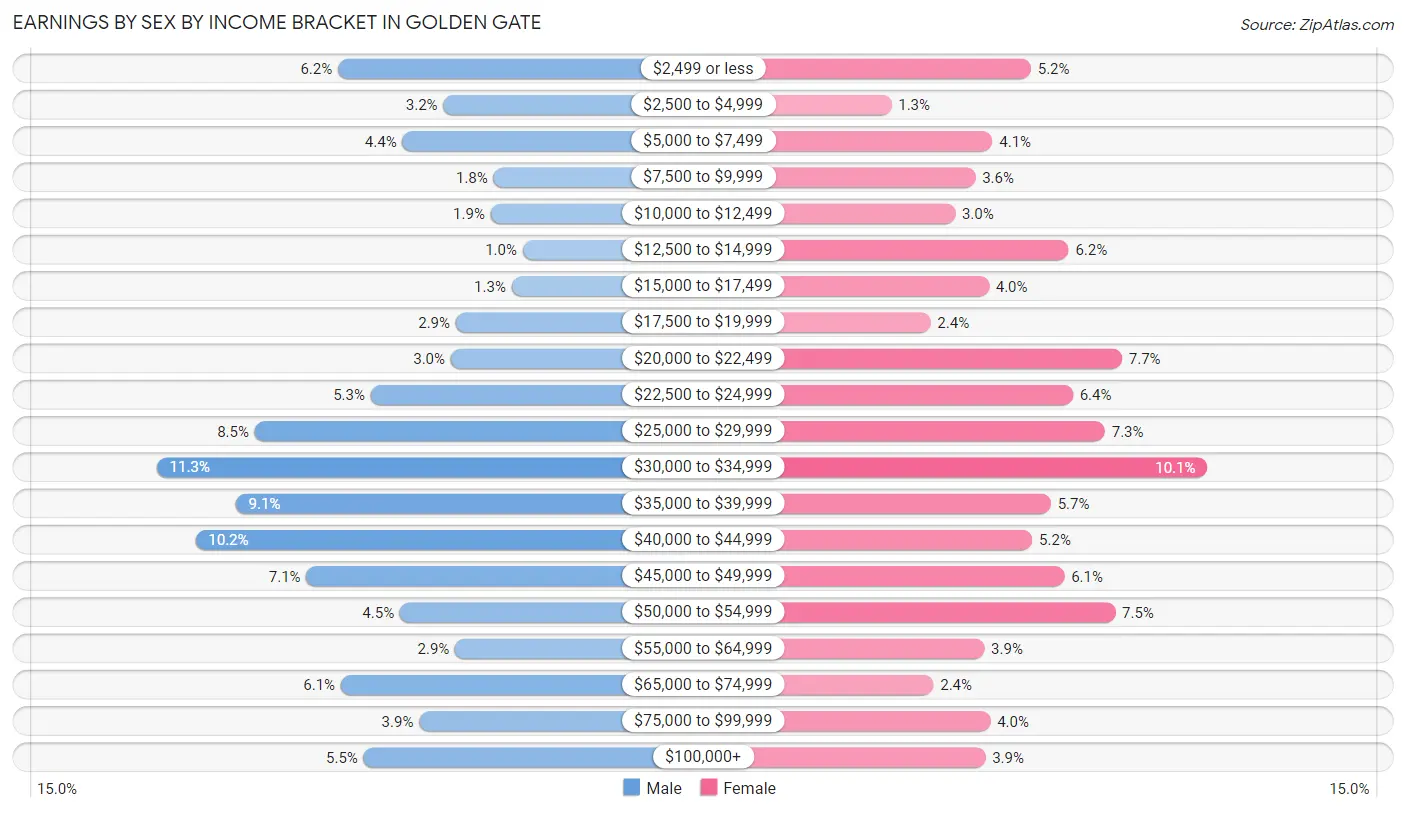
| Income | Male | Female |
| $2,499 or less | 626 (6.2%) | 365 (5.2%) |
| $2,500 to $4,999 | 327 (3.2%) | 88 (1.3%) |
| $5,000 to $7,499 | 443 (4.4%) | 289 (4.1%) |
| $7,500 to $9,999 | 184 (1.8%) | 255 (3.6%) |
| $10,000 to $12,499 | 192 (1.9%) | 215 (3.0%) |
| $12,500 to $14,999 | 101 (1.0%) | 440 (6.2%) |
| $15,000 to $17,499 | 132 (1.3%) | 282 (4.0%) |
| $17,500 to $19,999 | 291 (2.9%) | 166 (2.4%) |
| $20,000 to $22,499 | 305 (3.0%) | 546 (7.7%) |
| $22,500 to $24,999 | 533 (5.3%) | 449 (6.4%) |
| $25,000 to $29,999 | 862 (8.5%) | 512 (7.2%) |
| $30,000 to $34,999 | 1,141 (11.3%) | 716 (10.1%) |
| $35,000 to $39,999 | 917 (9.1%) | 405 (5.7%) |
| $40,000 to $44,999 | 1,031 (10.2%) | 368 (5.2%) |
| $45,000 to $49,999 | 716 (7.1%) | 432 (6.1%) |
| $50,000 to $54,999 | 450 (4.4%) | 533 (7.5%) |
| $55,000 to $64,999 | 293 (2.9%) | 273 (3.9%) |
| $65,000 to $74,999 | 618 (6.1%) | 172 (2.4%) |
| $75,000 to $99,999 | 395 (3.9%) | 285 (4.0%) |
| $100,000+ | 553 (5.5%) | 275 (3.9%) |
| Total | 10,110 (100.0%) | 7,066 (100.0%) |
Earnings by Sex by Educational Attainment in Golden Gate
Average earnings in Golden Gate are $36,442 for men and $31,770 for women, a difference of 12.8%. Men with an educational attainment of college or associate's degree enjoy the highest average annual earnings of $44,802, while those with graduate degree education earn the least with $32,941. Women with an educational attainment of bachelor's degree earn the most with the average annual earnings of $50,287, while those with less than high school education have the smallest earnings of $22,304.
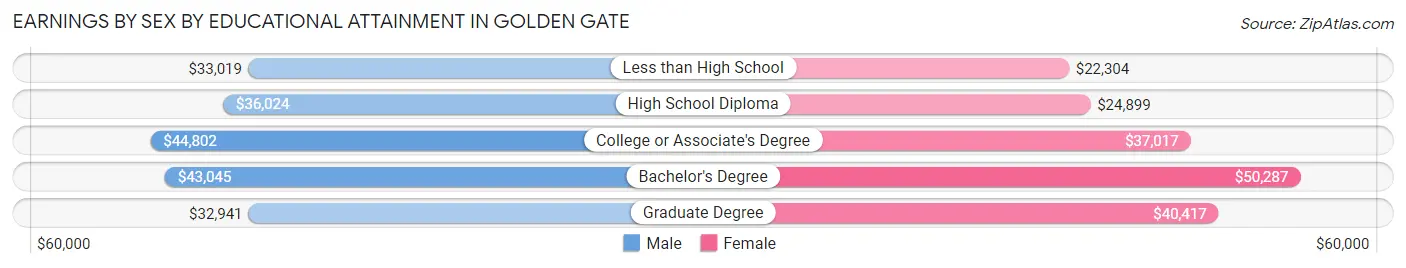
| Educational Attainment | Male Income | Female Income |
| Less than High School | $33,019 | $22,304 |
| High School Diploma | $36,024 | $24,899 |
| College or Associate's Degree | $44,802 | $37,017 |
| Bachelor's Degree | $43,045 | $50,287 |
| Graduate Degree | $32,941 | $40,417 |
| Total | $36,442 | $31,770 |
Family Income in Golden Gate
Family Income Brackets in Golden Gate
According to the Golden Gate family income data, there are 1,441 families falling into the $50,000 to $74,999 income range, which is the most common income bracket and makes up 22.7% of all families. Conversely, the $10,000 to $14,999 income bracket is the least frequent group with only 121 families (1.9%) belonging to this category.
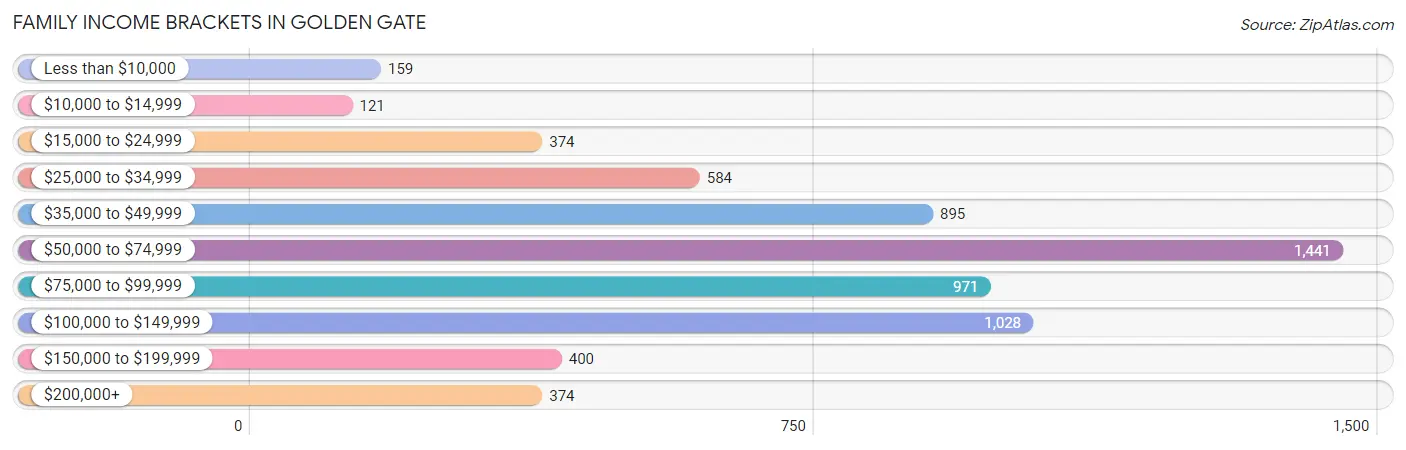
| Income Bracket | # Families | % Families |
| Less than $10,000 | 159 | 2.5% |
| $10,000 to $14,999 | 121 | 1.9% |
| $15,000 to $24,999 | 374 | 5.9% |
| $25,000 to $34,999 | 584 | 9.2% |
| $35,000 to $49,999 | 895 | 14.1% |
| $50,000 to $74,999 | 1,441 | 22.7% |
| $75,000 to $99,999 | 971 | 15.3% |
| $100,000 to $149,999 | 1,028 | 16.2% |
| $150,000 to $199,999 | 400 | 6.3% |
| $200,000+ | 374 | 5.9% |
Family Income by Famaliy Size in Golden Gate
7+ person families (83 | 1.3%) account for the highest median family income in Golden Gate with $111,219 per family, while 2-person families (1,761 | 27.8%) have the highest median income of $28,038 per family member.
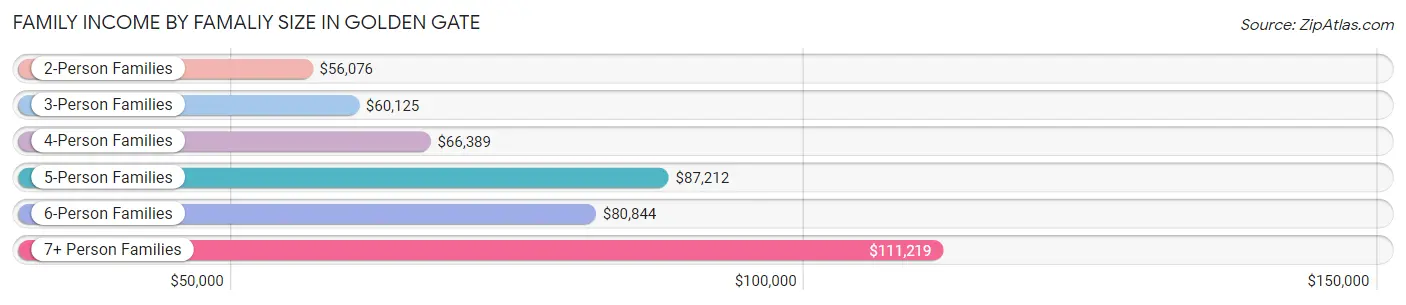
| Income Bracket | # Families | Median Income |
| 2-Person Families | 1,761 (27.8%) | $56,076 |
| 3-Person Families | 1,722 (27.1%) | $60,125 |
| 4-Person Families | 1,464 (23.1%) | $66,389 |
| 5-Person Families | 989 (15.6%) | $87,212 |
| 6-Person Families | 328 (5.2%) | $80,844 |
| 7+ Person Families | 83 (1.3%) | $111,219 |
| Total | 6,347 (100.0%) | $68,802 |
Family Income by Number of Earners in Golden Gate
The median family income in Golden Gate is $68,802, with families comprising 3+ earners (1,780) having the highest median family income of $116,375, while families with no earners (429) have the lowest median family income of $19,141, accounting for 28.0% and 6.8% of families, respectively.
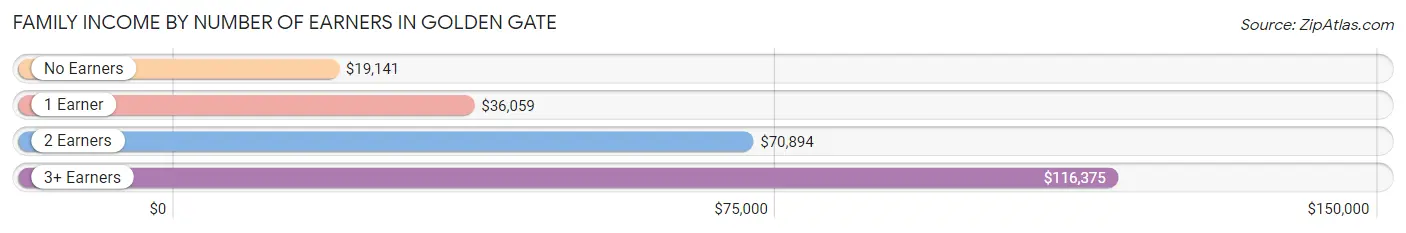
| Number of Earners | # Families | Median Income |
| No Earners | 429 (6.8%) | $19,141 |
| 1 Earner | 1,475 (23.2%) | $36,059 |
| 2 Earners | 2,663 (42.0%) | $70,894 |
| 3+ Earners | 1,780 (28.0%) | $116,375 |
| Total | 6,347 (100.0%) | $68,802 |
Household Income in Golden Gate
Household Income Brackets in Golden Gate
With 1,656 households falling in the category, the $50,000 to $74,999 income range is the most frequent in Golden Gate, accounting for 19.4% of all households. In contrast, only 231 households (2.7%) fall into the $10,000 to $14,999 income bracket, making it the least populous group.
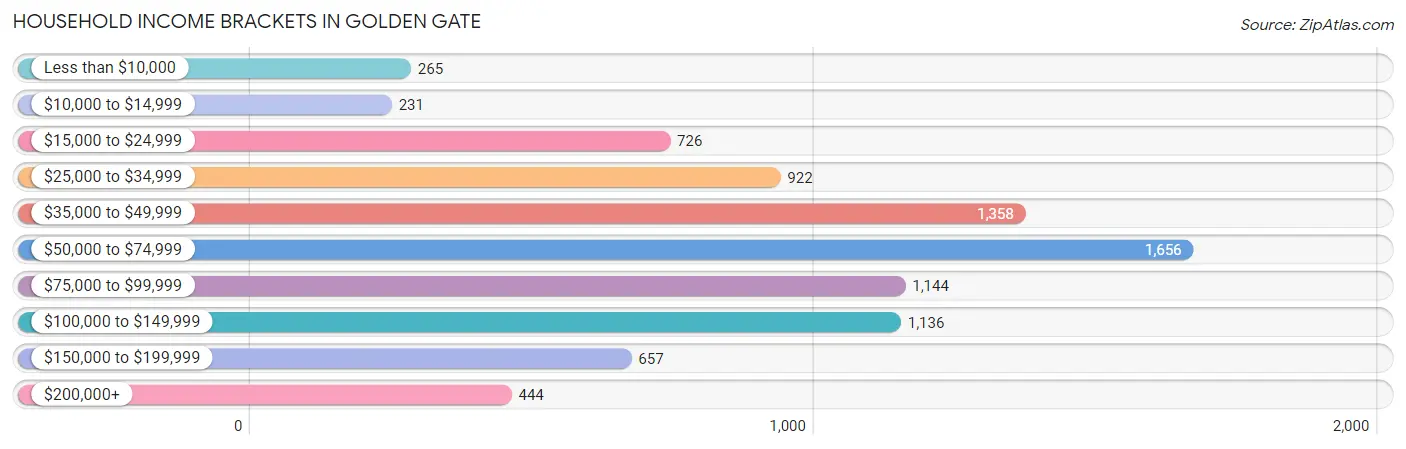
| Income Bracket | # Households | % Households |
| Less than $10,000 | 265 | 3.1% |
| $10,000 to $14,999 | 231 | 2.7% |
| $15,000 to $24,999 | 726 | 8.5% |
| $25,000 to $34,999 | 922 | 10.8% |
| $35,000 to $49,999 | 1,358 | 15.9% |
| $50,000 to $74,999 | 1,656 | 19.4% |
| $75,000 to $99,999 | 1,144 | 13.4% |
| $100,000 to $149,999 | 1,136 | 13.3% |
| $150,000 to $199,999 | 657 | 7.7% |
| $200,000+ | 444 | 5.2% |
Household Income by Householder Age in Golden Gate
The median household income in Golden Gate is $61,905, with the highest median household income of $72,198 found in the 45 to 64 years age bracket for the primary householder. A total of 3,807 households (44.6%) fall into this category. Meanwhile, the 65+ years age bracket for the primary householder has the lowest median household income of $29,710, with 1,377 households (16.1%) in this group.
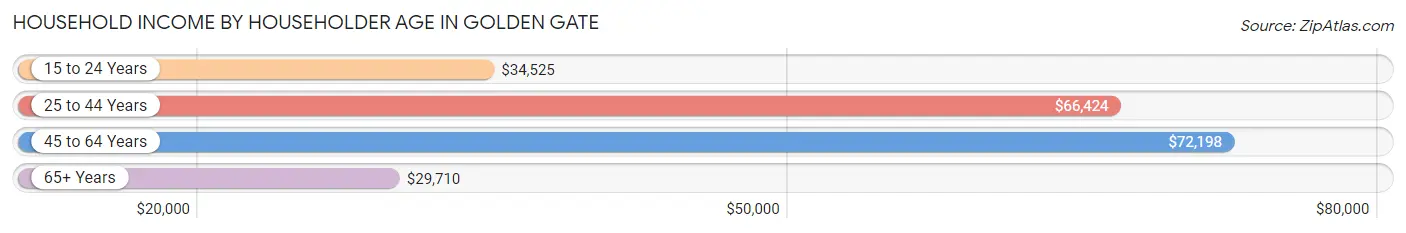
| Income Bracket | # Households | Median Income |
| 15 to 24 Years | 312 (3.6%) | $34,525 |
| 25 to 44 Years | 3,042 (35.6%) | $66,424 |
| 45 to 64 Years | 3,807 (44.6%) | $72,198 |
| 65+ Years | 1,377 (16.1%) | $29,710 |
| Total | 8,538 (100.0%) | $61,905 |
Poverty in Golden Gate
Income Below Poverty by Sex and Age in Golden Gate
With 12.5% poverty level for males and 15.0% for females among the residents of Golden Gate, 16 and 17 year old males and 16 and 17 year old females are the most vulnerable to poverty, with 284 males (53.2%) and 88 females (24.0%) in their respective age groups living below the poverty level.
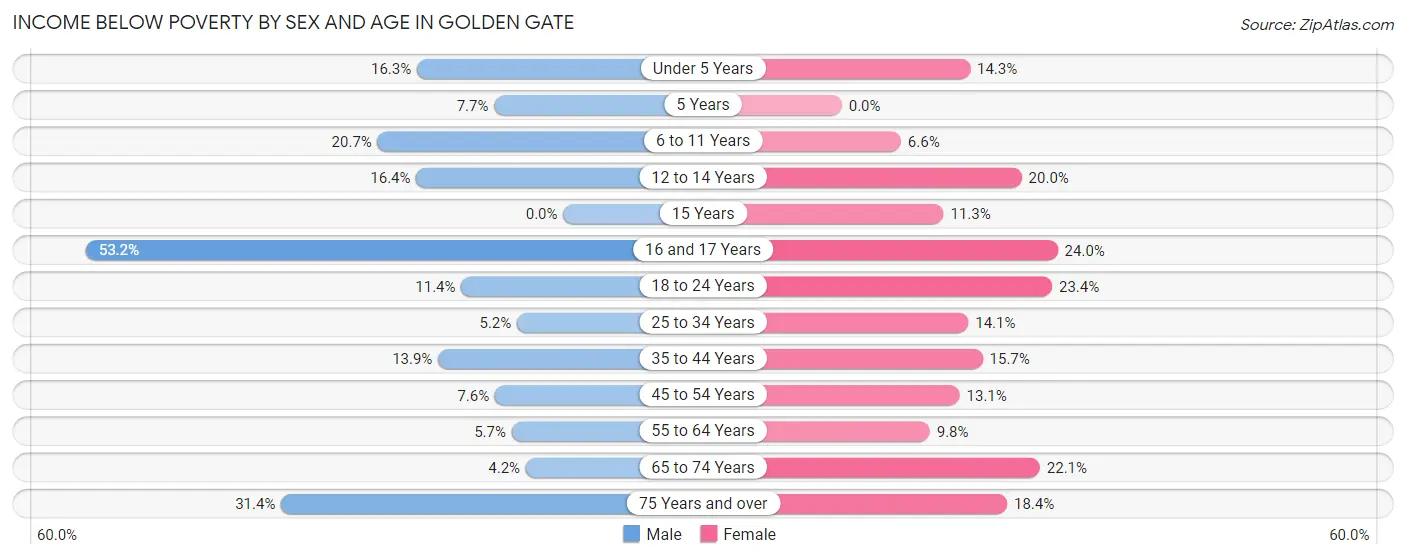
| Age Bracket | Male | Female |
| Under 5 Years | 129 (16.3%) | 195 (14.3%) |
| 5 Years | 19 (7.7%) | 0 (0.0%) |
| 6 to 11 Years | 153 (20.7%) | 63 (6.6%) |
| 12 to 14 Years | 109 (16.4%) | 117 (20.0%) |
| 15 Years | 0 (0.0%) | 23 (11.3%) |
| 16 and 17 Years | 284 (53.2%) | 88 (24.0%) |
| 18 to 24 Years | 217 (11.4%) | 329 (23.4%) |
| 25 to 34 Years | 106 (5.1%) | 299 (14.1%) |
| 35 to 44 Years | 424 (13.9%) | 254 (15.7%) |
| 45 to 54 Years | 178 (7.6%) | 281 (13.1%) |
| 55 to 64 Years | 81 (5.7%) | 162 (9.8%) |
| 65 to 74 Years | 30 (4.2%) | 180 (22.1%) |
| 75 Years and over | 181 (31.4%) | 122 (18.4%) |
| Total | 1,911 (12.5%) | 2,113 (15.0%) |
Income Above Poverty by Sex and Age in Golden Gate
According to the poverty statistics in Golden Gate, males aged 15 years and females aged 5 years are the age groups that are most secure financially, with 100.0% of males and 100.0% of females in these age groups living above the poverty line.
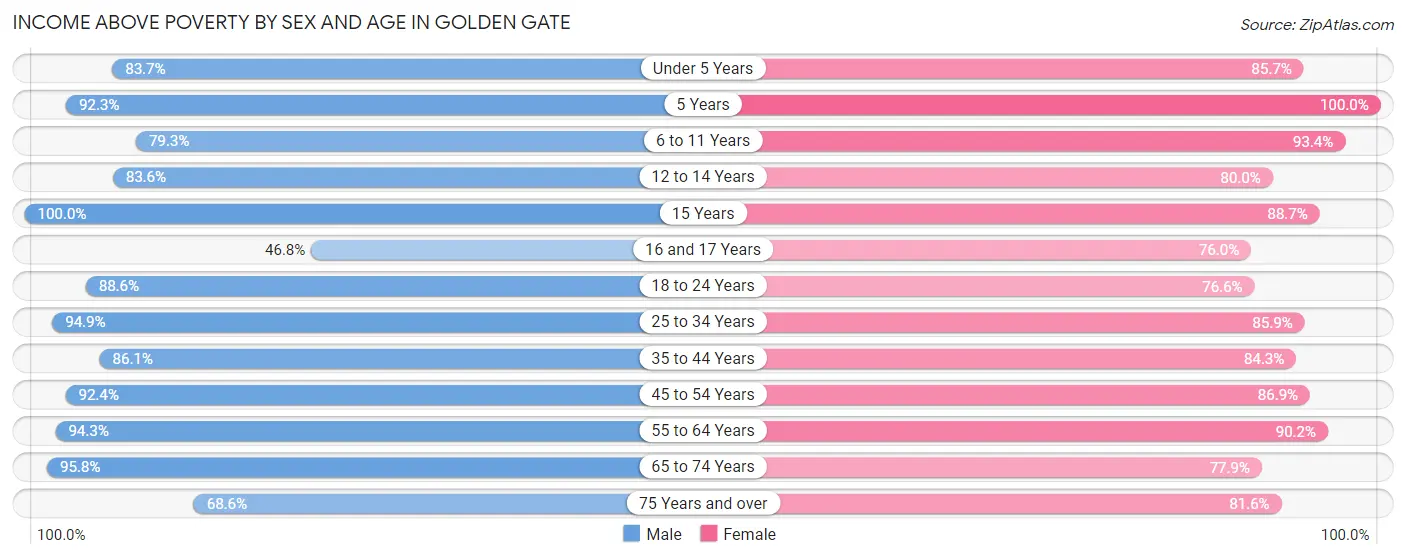
| Age Bracket | Male | Female |
| Under 5 Years | 663 (83.7%) | 1,171 (85.7%) |
| 5 Years | 228 (92.3%) | 215 (100.0%) |
| 6 to 11 Years | 587 (79.3%) | 895 (93.4%) |
| 12 to 14 Years | 557 (83.6%) | 467 (80.0%) |
| 15 Years | 208 (100.0%) | 180 (88.7%) |
| 16 and 17 Years | 250 (46.8%) | 278 (76.0%) |
| 18 to 24 Years | 1,693 (88.6%) | 1,076 (76.6%) |
| 25 to 34 Years | 1,953 (94.9%) | 1,823 (85.9%) |
| 35 to 44 Years | 2,618 (86.1%) | 1,366 (84.3%) |
| 45 to 54 Years | 2,161 (92.4%) | 1,860 (86.9%) |
| 55 to 64 Years | 1,329 (94.3%) | 1,491 (90.2%) |
| 65 to 74 Years | 689 (95.8%) | 636 (77.9%) |
| 75 Years and over | 395 (68.6%) | 541 (81.6%) |
| Total | 13,331 (87.5%) | 11,999 (85.0%) |
Income Below Poverty Among Married-Couple Families in Golden Gate
The poverty statistics for married-couple families in Golden Gate show that 7.7% or 326 of the total 4,233 families live below the poverty line. Families with 3 or 4 children have the highest poverty rate of 10.5%, comprising of 43 families. On the other hand, families with 1 or 2 children have the lowest poverty rate of 5.7%, which includes 109 families.
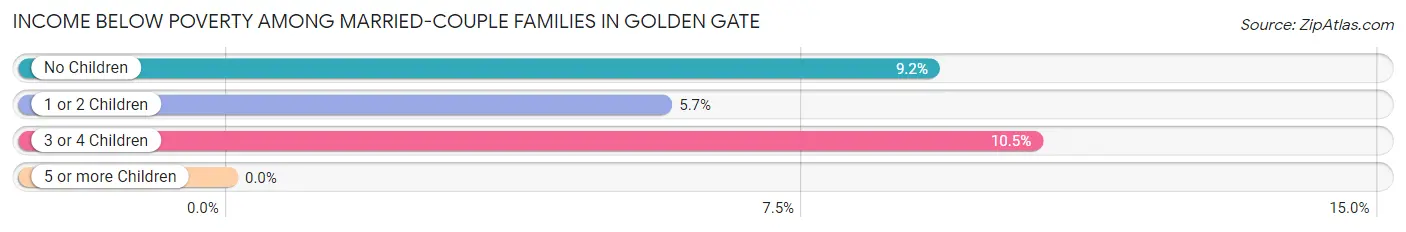
| Children | Above Poverty | Below Poverty |
| No Children | 1,726 (90.8%) | 174 (9.2%) |
| 1 or 2 Children | 1,815 (94.3%) | 109 (5.7%) |
| 3 or 4 Children | 366 (89.5%) | 43 (10.5%) |
| 5 or more Children | 0 (0.0%) | 0 (0.0%) |
| Total | 3,907 (92.3%) | 326 (7.7%) |
Income Below Poverty Among Single-Parent Households in Golden Gate
According to the poverty data in Golden Gate, 7.6% or 65 single-father households and 19.9% or 251 single-mother households are living below the poverty line. Among single-father households, those with 1 or 2 children have the highest poverty rate, with 65 households (28.0%) experiencing poverty. Likewise, among single-mother households, those with 3 or 4 children have the highest poverty rate, with 46 households (31.3%) falling below the poverty line.
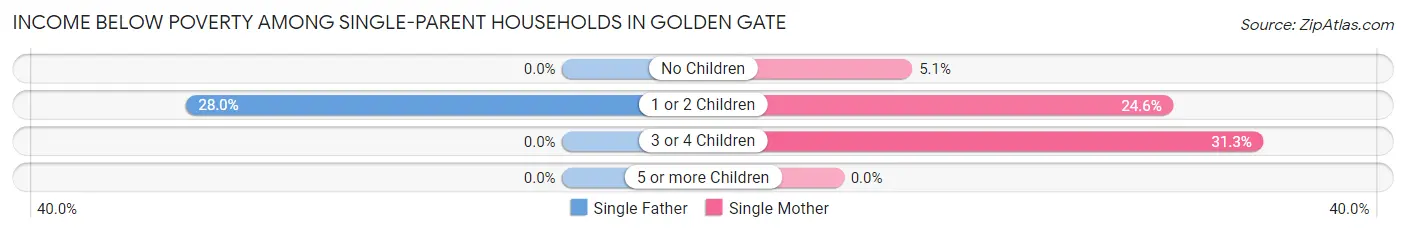
| Children | Single Father | Single Mother |
| No Children | 0 (0.0%) | 18 (5.1%) |
| 1 or 2 Children | 65 (28.0%) | 187 (24.6%) |
| 3 or 4 Children | 0 (0.0%) | 46 (31.3%) |
| 5 or more Children | 0 (0.0%) | 0 (0.0%) |
| Total | 65 (7.6%) | 251 (19.9%) |
Income Below Poverty Among Married-Couple vs Single-Parent Households in Golden Gate
The poverty data for Golden Gate shows that 326 of the married-couple family households (7.7%) and 316 of the single-parent households (14.9%) are living below the poverty level. Within the married-couple family households, those with 3 or 4 children have the highest poverty rate, with 43 households (10.5%) falling below the poverty line. Among the single-parent households, those with 3 or 4 children have the highest poverty rate, with 46 household (28.2%) living below poverty.
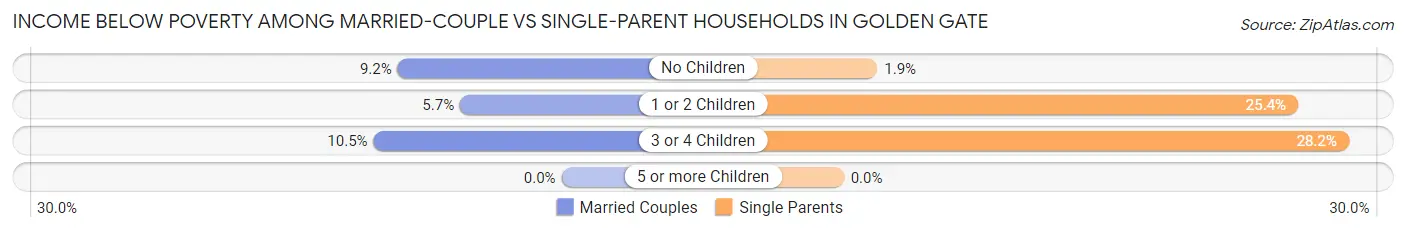
| Children | Married-Couple Families | Single-Parent Households |
| No Children | 174 (9.2%) | 18 (1.9%) |
| 1 or 2 Children | 109 (5.7%) | 252 (25.4%) |
| 3 or 4 Children | 43 (10.5%) | 46 (28.2%) |
| 5 or more Children | 0 (0.0%) | 0 (0.0%) |
| Total | 326 (7.7%) | 316 (14.9%) |
Race in Golden Gate
The most populous races in Golden Gate are Hispanic or Latino (19,514 | 66.4%), White / Caucasian (13,132 | 44.7%), and Two or more Races (9,233 | 31.4%).
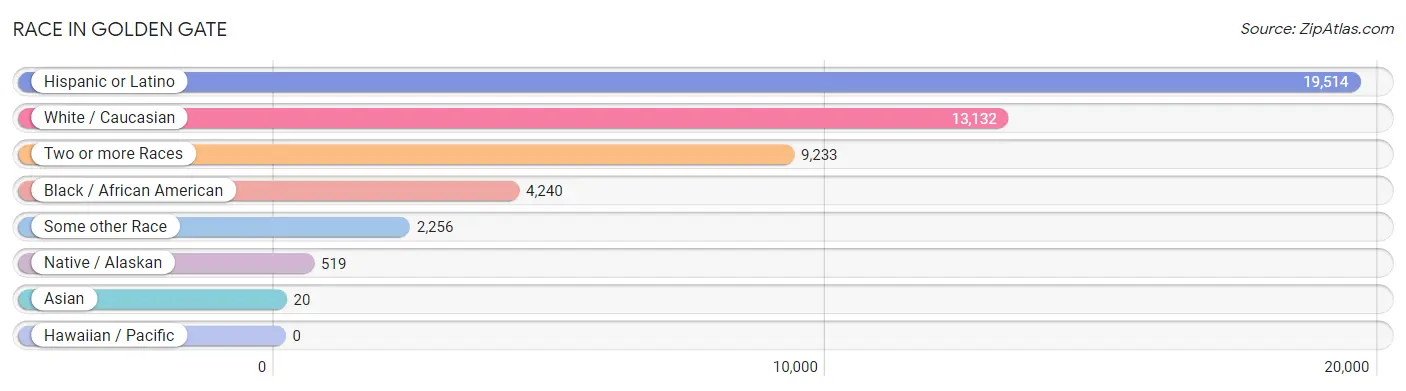
| Race | # Population | % Population |
| Asian | 20 | 0.1% |
| Black / African American | 4,240 | 14.4% |
| Hawaiian / Pacific | 0 | 0.0% |
| Hispanic or Latino | 19,514 | 66.4% |
| Native / Alaskan | 519 | 1.8% |
| White / Caucasian | 13,132 | 44.7% |
| Two or more Races | 9,233 | 31.4% |
| Some other Race | 2,256 | 7.7% |
| Total | 29,400 | 100.0% |
Ancestry in Golden Gate
The most populous ancestries reported in Golden Gate are Cuban (5,584 | 19.0%), Mexican (5,536 | 18.8%), Central American (2,973 | 10.1%), South American (2,740 | 9.3%), and Haitian (2,414 | 8.2%), together accounting for 65.5% of all Golden Gate residents.
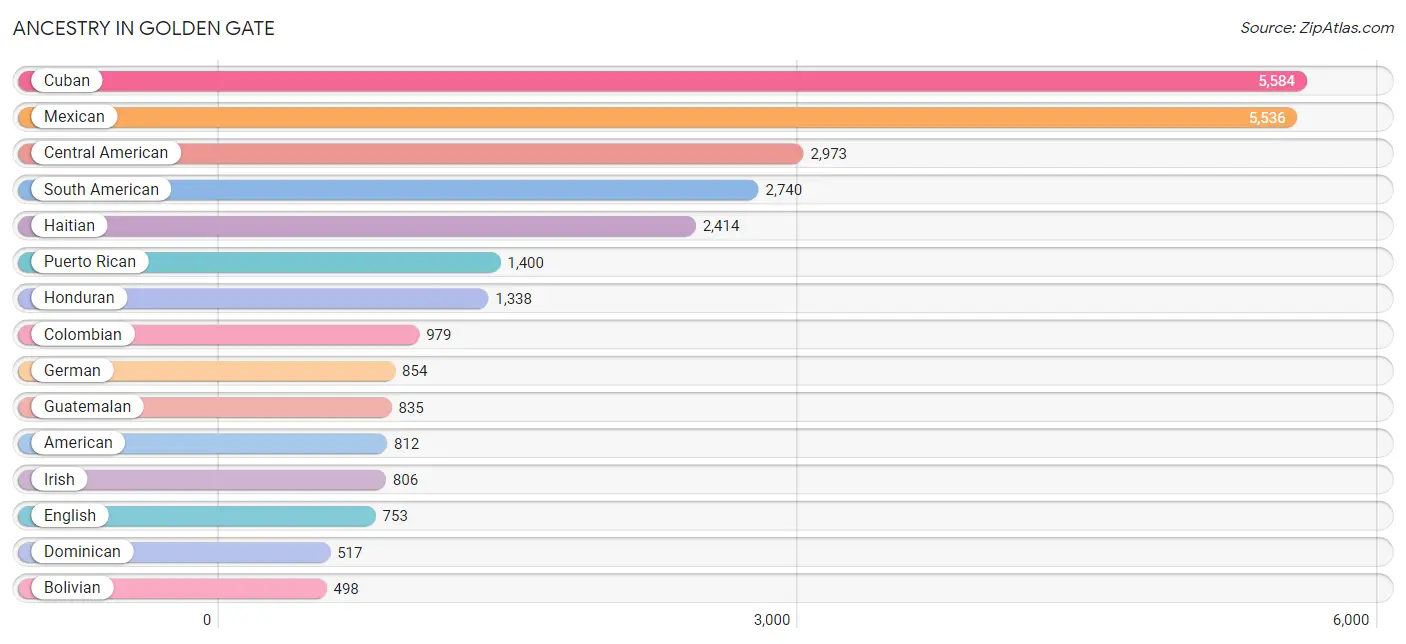
| Ancestry | # Population | % Population |
| African | 10 | 0.0% |
| American | 812 | 2.8% |
| Arab | 10 | 0.0% |
| Argentinean | 24 | 0.1% |
| Belizean | 51 | 0.2% |
| Bolivian | 498 | 1.7% |
| Brazilian | 122 | 0.4% |
| British | 10 | 0.0% |
| Central American | 2,973 | 10.1% |
| Central American Indian | 319 | 1.1% |
| Chilean | 91 | 0.3% |
| Colombian | 979 | 3.3% |
| Costa Rican | 53 | 0.2% |
| Cuban | 5,584 | 19.0% |
| Czech | 15 | 0.1% |
| Czechoslovakian | 15 | 0.1% |
| Danish | 16 | 0.1% |
| Dominican | 517 | 1.8% |
| Dutch | 88 | 0.3% |
| Eastern European | 35 | 0.1% |
| Ecuadorian | 345 | 1.2% |
| English | 753 | 2.6% |
| European | 26 | 0.1% |
| French | 188 | 0.6% |
| French Canadian | 34 | 0.1% |
| German | 854 | 2.9% |
| Greek | 36 | 0.1% |
| Guatemalan | 835 | 2.8% |
| Guyanese | 35 | 0.1% |
| Haitian | 2,414 | 8.2% |
| Honduran | 1,338 | 4.5% |
| Hungarian | 59 | 0.2% |
| Icelander | 8 | 0.0% |
| Irish | 806 | 2.7% |
| Israeli | 14 | 0.1% |
| Italian | 440 | 1.5% |
| Jamaican | 54 | 0.2% |
| Korean | 3 | 0.0% |
| Mexican | 5,536 | 18.8% |
| Nicaraguan | 269 | 0.9% |
| Norwegian | 76 | 0.3% |
| Panamanian | 52 | 0.2% |
| Pennsylvania German | 232 | 0.8% |
| Peruvian | 325 | 1.1% |
| Polish | 107 | 0.4% |
| Portuguese | 16 | 0.1% |
| Puerto Rican | 1,400 | 4.8% |
| Romanian | 97 | 0.3% |
| Salvadoran | 426 | 1.5% |
| Scotch-Irish | 27 | 0.1% |
| Scottish | 242 | 0.8% |
| Serbian | 20 | 0.1% |
| Slovak | 39 | 0.1% |
| South American | 2,740 | 9.3% |
| South American Indian | 206 | 0.7% |
| Spaniard | 128 | 0.4% |
| Spanish | 43 | 0.2% |
| Subsaharan African | 10 | 0.0% |
| Swedish | 103 | 0.4% |
| Swiss | 18 | 0.1% |
| Syrian | 10 | 0.0% |
| Thai | 254 | 0.9% |
| Trinidadian and Tobagonian | 20 | 0.1% |
| Turkish | 12 | 0.0% |
| U.S. Virgin Islander | 48 | 0.2% |
| Ukrainian | 16 | 0.1% |
| Uruguayan | 12 | 0.0% |
| Venezuelan | 466 | 1.6% |
| Yugoslavian | 18 | 0.1% | View All 69 Rows |
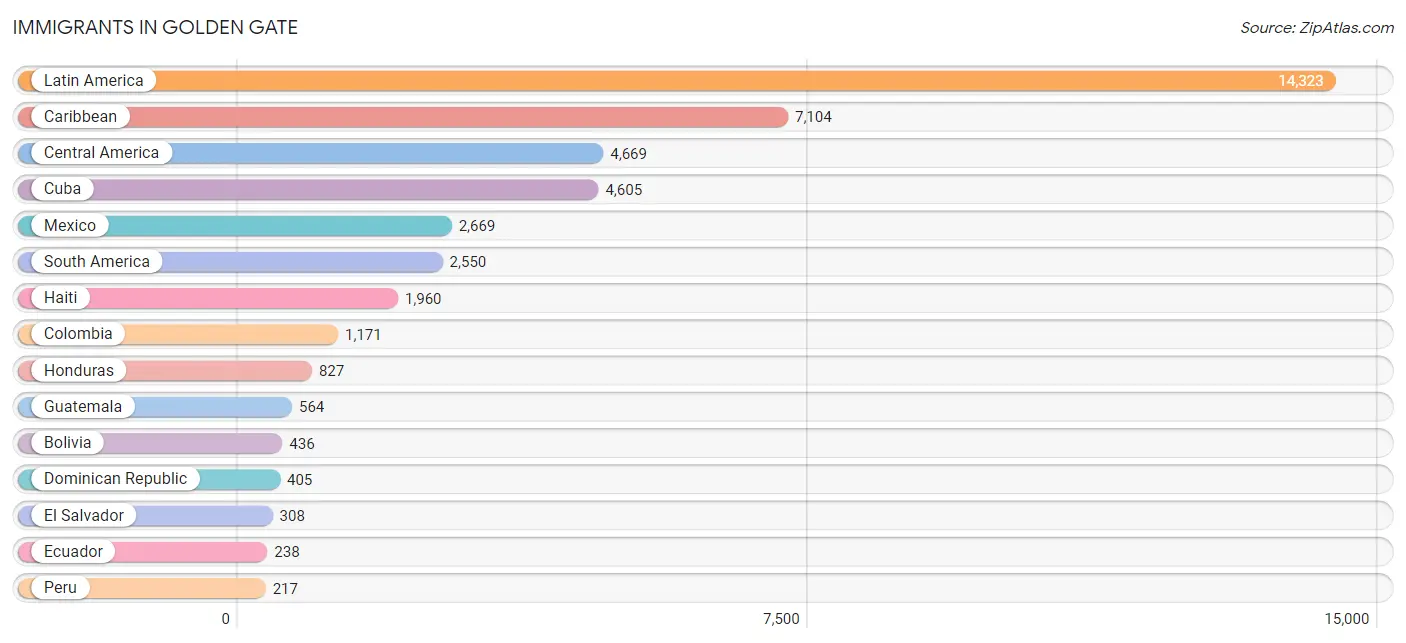
Immigrants in Golden Gate
The most numerous immigrant groups reported in Golden Gate came from Latin America (14,323 | 48.7%), Caribbean (7,104 | 24.2%), Central America (4,669 | 15.9%), Cuba (4,605 | 15.7%), and Mexico (2,669 | 9.1%), together accounting for 113.5% of all Golden Gate residents.
| Immigration Origin | # Population | % Population |
| Argentina | 104 | 0.4% |
| Asia | 12 | 0.0% |
| Belize | 53 | 0.2% |
| Bolivia | 436 | 1.5% |
| Brazil | 98 | 0.3% |
| Canada | 53 | 0.2% |
| Caribbean | 7,104 | 24.2% |
| Central America | 4,669 | 15.9% |
| Chile | 72 | 0.2% |
| Colombia | 1,171 | 4.0% |
| Costa Rica | 12 | 0.0% |
| Cuba | 4,605 | 15.7% |
| Dominica | 60 | 0.2% |
| Dominican Republic | 405 | 1.4% |
| Eastern Europe | 43 | 0.2% |
| Ecuador | 238 | 0.8% |
| El Salvador | 308 | 1.1% |
| England | 20 | 0.1% |
| Europe | 159 | 0.5% |
| Guatemala | 564 | 1.9% |
| Guyana | 68 | 0.2% |
| Haiti | 1,960 | 6.7% |
| Honduras | 827 | 2.8% |
| Italy | 45 | 0.2% |
| Jamaica | 54 | 0.2% |
| Latin America | 14,323 | 48.7% |
| Mexico | 2,669 | 9.1% |
| Nicaragua | 160 | 0.5% |
| Northern Europe | 30 | 0.1% |
| Panama | 76 | 0.3% |
| Peru | 217 | 0.7% |
| Romania | 43 | 0.2% |
| South America | 2,550 | 8.7% |
| Southern Europe | 45 | 0.2% |
| Trinidad and Tobago | 20 | 0.1% |
| Turkey | 12 | 0.0% |
| Uruguay | 12 | 0.0% |
| Venezuela | 134 | 0.5% |
| Western Asia | 12 | 0.0% | View All 39 Rows |
Sex and Age in Golden Gate
Sex and Age in Golden Gate
The most populous age groups in Golden Gate are 35 to 39 Years (1,553 | 10.2%) for men and Under 5 Years (1,412 | 10.0%) for women.
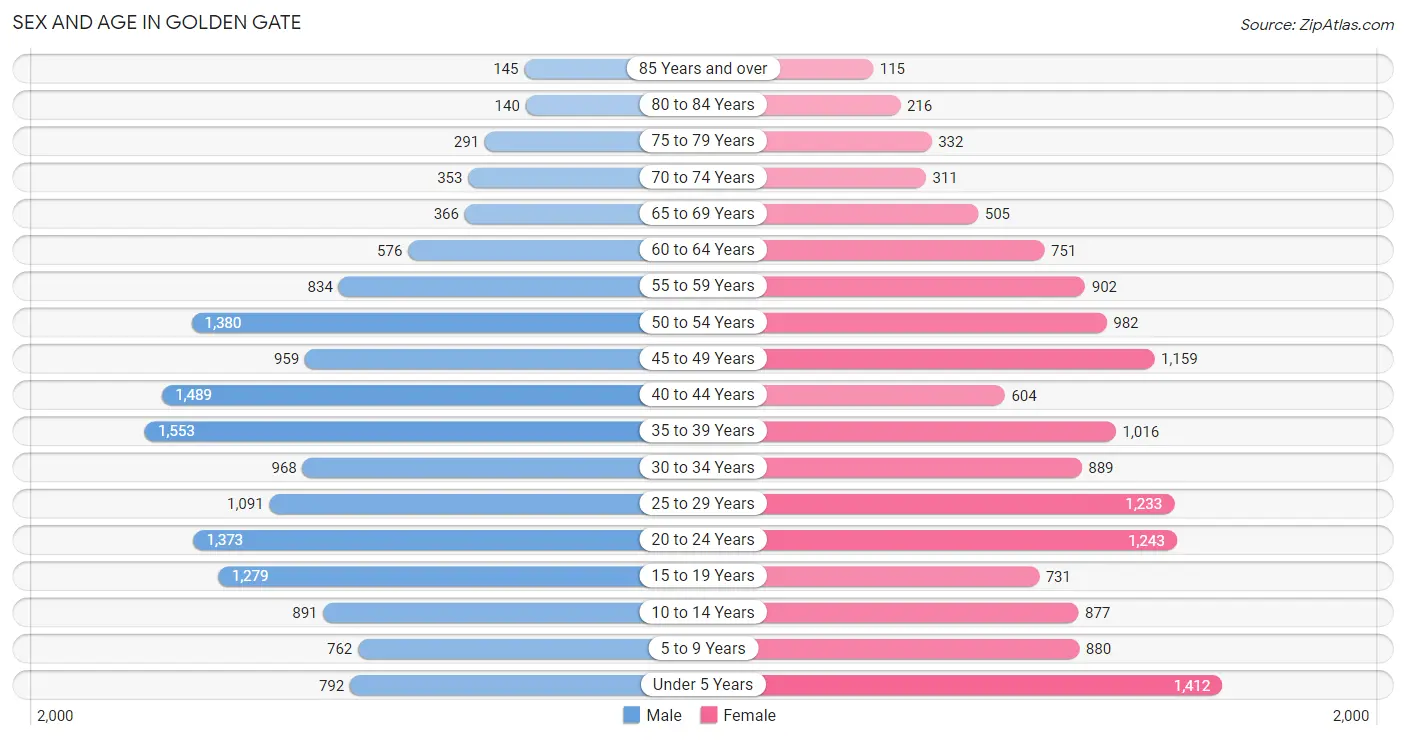
| Age Bracket | Male | Female |
| Under 5 Years | 792 (5.2%) | 1,412 (10.0%) |
| 5 to 9 Years | 762 (5.0%) | 880 (6.2%) |
| 10 to 14 Years | 891 (5.9%) | 877 (6.2%) |
| 15 to 19 Years | 1,279 (8.4%) | 731 (5.2%) |
| 20 to 24 Years | 1,373 (9.0%) | 1,243 (8.8%) |
| 25 to 29 Years | 1,091 (7.2%) | 1,233 (8.7%) |
| 30 to 34 Years | 968 (6.4%) | 889 (6.3%) |
| 35 to 39 Years | 1,553 (10.2%) | 1,016 (7.2%) |
| 40 to 44 Years | 1,489 (9.8%) | 604 (4.3%) |
| 45 to 49 Years | 959 (6.3%) | 1,159 (8.2%) |
| 50 to 54 Years | 1,380 (9.0%) | 982 (6.9%) |
| 55 to 59 Years | 834 (5.5%) | 902 (6.4%) |
| 60 to 64 Years | 576 (3.8%) | 751 (5.3%) |
| 65 to 69 Years | 366 (2.4%) | 505 (3.6%) |
| 70 to 74 Years | 353 (2.3%) | 311 (2.2%) |
| 75 to 79 Years | 291 (1.9%) | 332 (2.3%) |
| 80 to 84 Years | 140 (0.9%) | 216 (1.5%) |
| 85 Years and over | 145 (0.9%) | 115 (0.8%) |
| Total | 15,242 (100.0%) | 14,158 (100.0%) |
Families and Households in Golden Gate
Median Family Size in Golden Gate
The median family size in Golden Gate is 3.87 persons per family, with single female/mother families (1,260 | 19.9%) accounting for the largest median family size of 4.28 persons per family. On the other hand, single male/father families (854 | 13.5%) represent the smallest median family size with 3.02 persons per family.
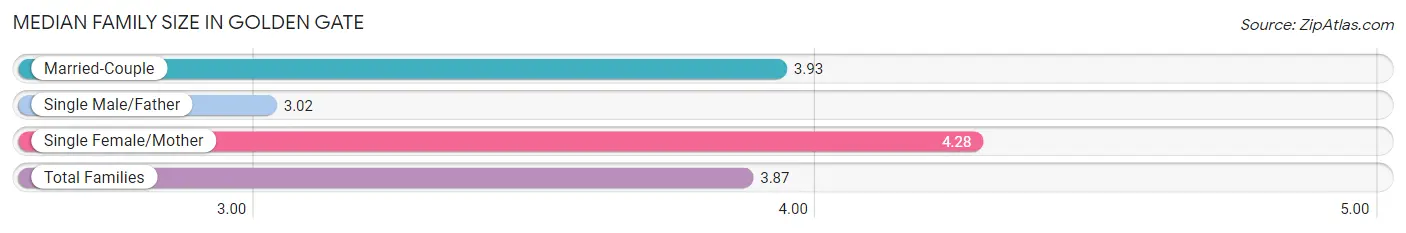
| Family Type | # Families | Family Size |
| Married-Couple | 4,233 (66.7%) | 3.93 |
| Single Male/Father | 854 (13.5%) | 3.02 |
| Single Female/Mother | 1,260 (19.9%) | 4.28 |
| Total Families | 6,347 (100.0%) | 3.87 |
Median Household Size in Golden Gate
The median household size in Golden Gate is 3.44 persons per household, with single female/mother households (1,260 | 14.8%) accounting for the largest median household size of 4.68 persons per household. non-family households (2,191 | 25.7%) represent the smallest median household size with 1.64 persons per household.
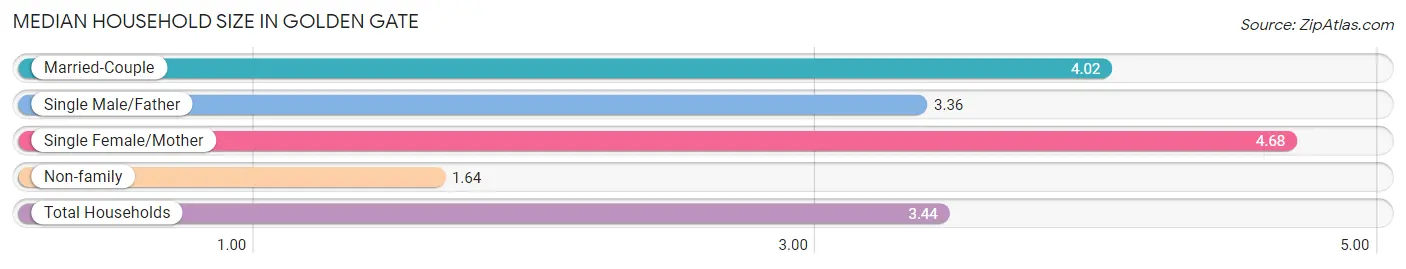
| Household Type | # Households | Household Size |
| Married-Couple | 4,233 (49.6%) | 4.02 |
| Single Male/Father | 854 (10.0%) | 3.36 |
| Single Female/Mother | 1,260 (14.8%) | 4.68 |
| Non-family | 2,191 (25.7%) | 1.64 |
| Total Households | 8,538 (100.0%) | 3.44 |
Household Size by Marriage Status in Golden Gate
Out of a total of 8,538 households in Golden Gate, 6,347 (74.3%) are family households, while 2,191 (25.7%) are nonfamily households. The most numerous type of family households are 3-person households, comprising 1,726, and the most common type of nonfamily households are 1-person households, comprising 1,631.
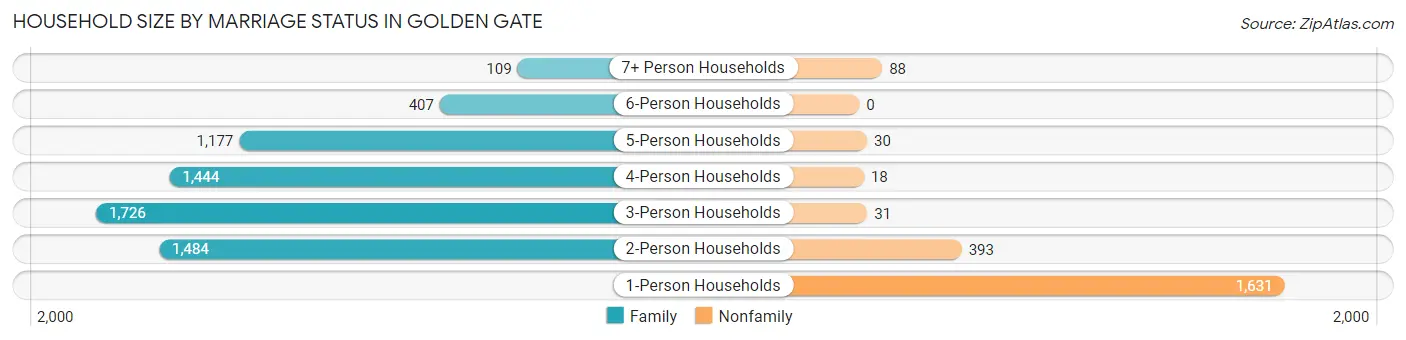
| Household Size | Family Households | Nonfamily Households |
| 1-Person Households | - | 1,631 (19.1%) |
| 2-Person Households | 1,484 (17.4%) | 393 (4.6%) |
| 3-Person Households | 1,726 (20.2%) | 31 (0.4%) |
| 4-Person Households | 1,444 (16.9%) | 18 (0.2%) |
| 5-Person Households | 1,177 (13.8%) | 30 (0.4%) |
| 6-Person Households | 407 (4.8%) | 0 (0.0%) |
| 7+ Person Households | 109 (1.3%) | 88 (1.0%) |
| Total | 6,347 (74.3%) | 2,191 (25.7%) |
Female Fertility in Golden Gate
Fertility by Age in Golden Gate
Average fertility rate in Golden Gate is 74.0 births per 1,000 women. Women in the age bracket of 20 to 34 years have the highest fertility rate with 146.0 births per 1,000 women. Women in the age bracket of 20 to 34 years acount for 93.9% of all women with births.
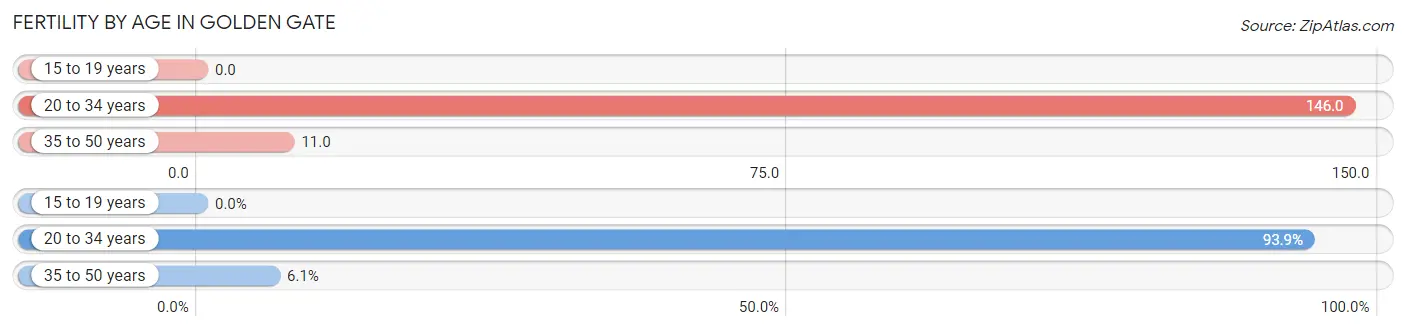
| Age Bracket | Women with Births | Births / 1,000 Women |
| 15 to 19 years | 0 (0.0%) | 0.0 |
| 20 to 34 years | 492 (93.9%) | 146.0 |
| 35 to 50 years | 32 (6.1%) | 11.0 |
| Total | 524 (100.0%) | 74.0 |
Fertility by Age by Marriage Status in Golden Gate
42.6% of women with births (524) in Golden Gate are married. The highest percentage of unmarried women with births falls into 20 to 34 years age bracket with 61.2% of them unmarried at the time of birth, while the lowest percentage of unmarried women with births belong to 35 to 50 years age bracket with 0.0% of them unmarried.
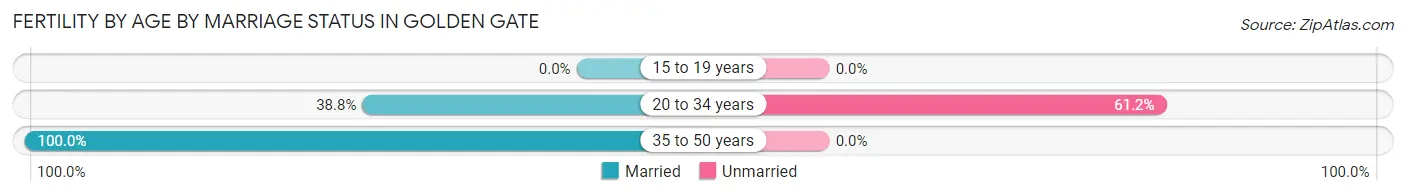
| Age Bracket | Married | Unmarried |
| 15 to 19 years | 0 (0.0%) | 0 (0.0%) |
| 20 to 34 years | 191 (38.8%) | 301 (61.2%) |
| 35 to 50 years | 32 (100.0%) | 0 (0.0%) |
| Total | 223 (42.6%) | 301 (57.4%) |
Fertility by Education in Golden Gate
Average fertility rate in Golden Gate is 74.0 births per 1,000 women. Women with the education attainment of graduate degree have the highest fertility rate of 174.0 births per 1,000 women, while women with the education attainment of college or associate's degree have the lowest fertility at 58.0 births per 1,000 women. Women with the education attainment of high school diploma represent 32.6% of all women with births.
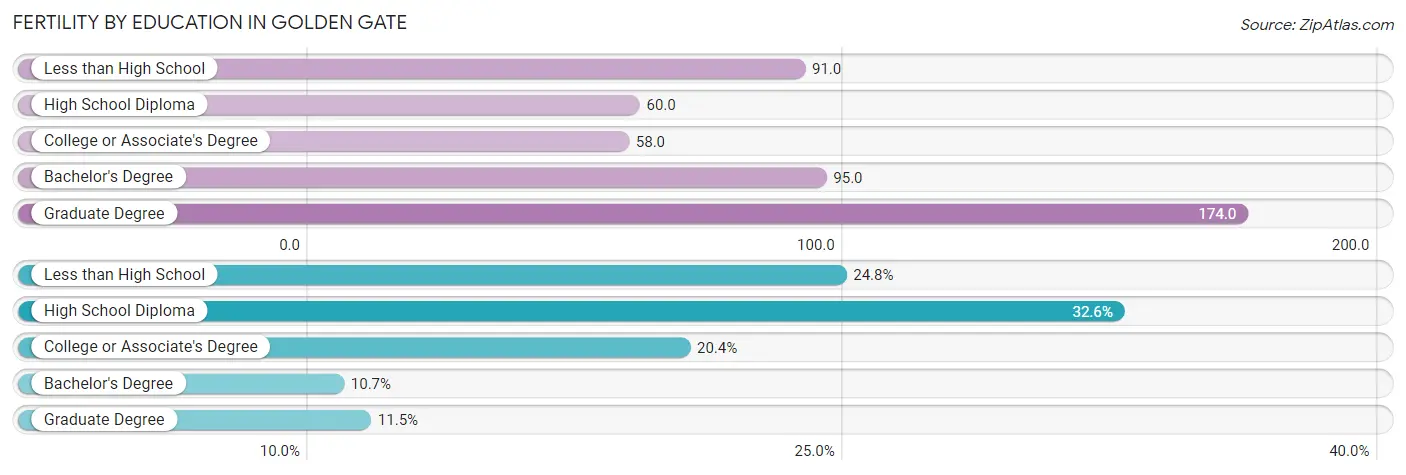
| Educational Attainment | Women with Births | Births / 1,000 Women |
| Less than High School | 130 (24.8%) | 91.0 |
| High School Diploma | 171 (32.6%) | 60.0 |
| College or Associate's Degree | 107 (20.4%) | 58.0 |
| Bachelor's Degree | 56 (10.7%) | 95.0 |
| Graduate Degree | 60 (11.5%) | 174.0 |
| Total | 524 (100.0%) | 74.0 |
Fertility by Education by Marriage Status in Golden Gate
57.4% of women with births in Golden Gate are unmarried. Women with the educational attainment of bachelor's degree are most likely to be married with 100.0% of them married at childbirth, while women with the educational attainment of less than high school are least likely to be married with 99.2% of them unmarried at childbirth.
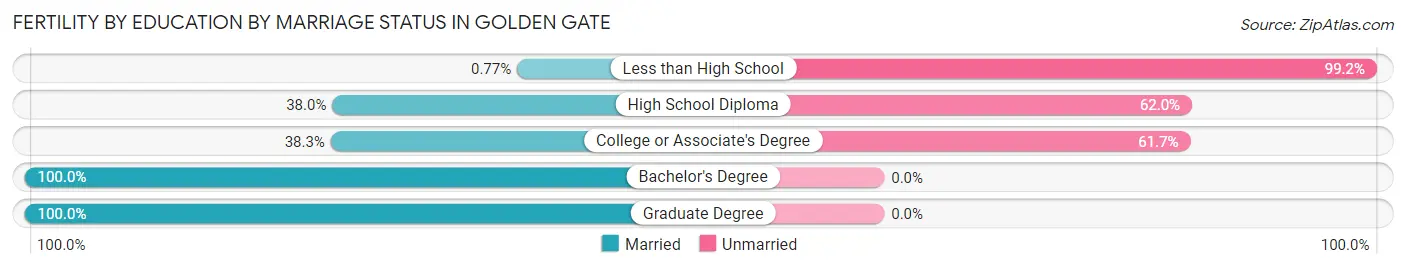
| Educational Attainment | Married | Unmarried |
| Less than High School | 1 (0.8%) | 129 (99.2%) |
| High School Diploma | 65 (38.0%) | 106 (62.0%) |
| College or Associate's Degree | 41 (38.3%) | 66 (61.7%) |
| Bachelor's Degree | 56 (100.0%) | 0 (0.0%) |
| Graduate Degree | 60 (100.0%) | 0 (0.0%) |
| Total | 223 (42.6%) | 301 (57.4%) |
Employment Characteristics in Golden Gate
Employment by Class of Employer in Golden Gate
Among the 16,037 employed individuals in Golden Gate, private company employees (12,062 | 75.2%), self-employed (not incorporated) (1,119 | 7.0%), and local government employees (914 | 5.7%) make up the most common classes of employment.
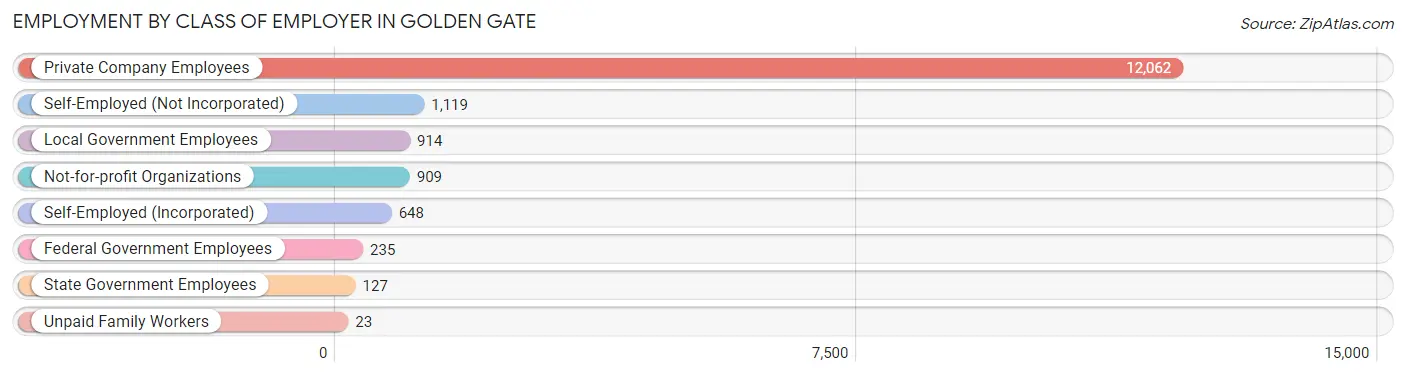
| Employer Class | # Employees | % Employees |
| Private Company Employees | 12,062 | 75.2% |
| Self-Employed (Incorporated) | 648 | 4.0% |
| Self-Employed (Not Incorporated) | 1,119 | 7.0% |
| Not-for-profit Organizations | 909 | 5.7% |
| Local Government Employees | 914 | 5.7% |
| State Government Employees | 127 | 0.8% |
| Federal Government Employees | 235 | 1.5% |
| Unpaid Family Workers | 23 | 0.1% |
| Total | 16,037 | 100.0% |
Employment Status by Age in Golden Gate
According to the labor force statistics for Golden Gate, out of the total population over 16 years of age (23,375), 72.6% or 16,970 individuals are in the labor force, with 4.5% or 764 of them unemployed. The age group with the highest labor force participation rate is 35 to 44 years, with 90.6% or 4,224 individuals in the labor force. Within the labor force, the 30 to 34 years age range has the highest percentage of unemployed individuals, with 12.2% or 199 of them being unemployed.
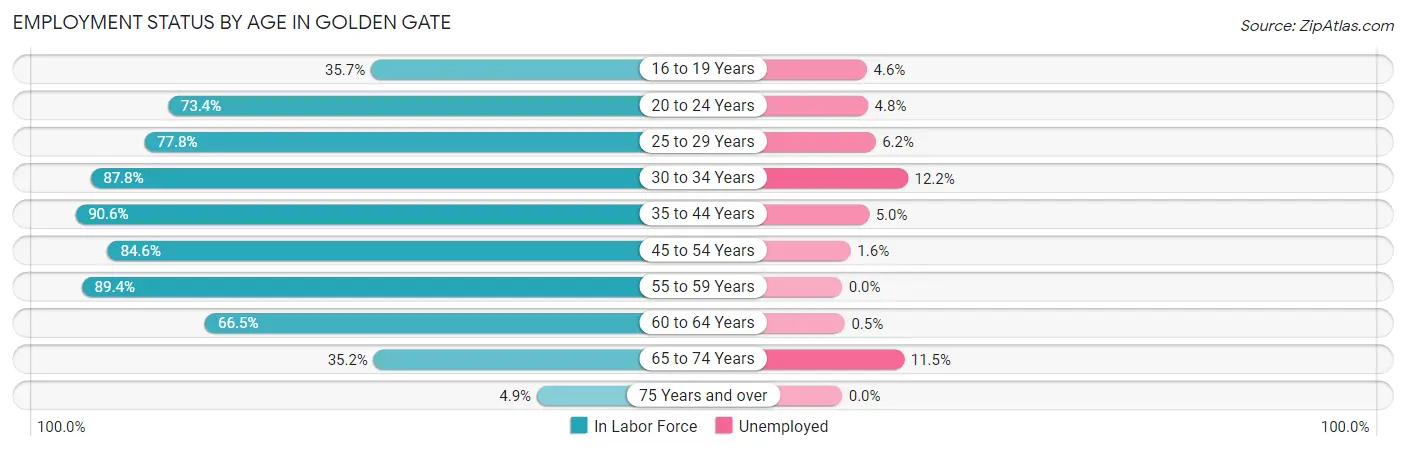
| Age Bracket | In Labor Force | Unemployed |
| 16 to 19 Years | 571 (35.7%) | 26 (4.6%) |
| 20 to 24 Years | 1,920 (73.4%) | 92 (4.8%) |
| 25 to 29 Years | 1,808 (77.8%) | 112 (6.2%) |
| 30 to 34 Years | 1,630 (87.8%) | 199 (12.2%) |
| 35 to 44 Years | 4,224 (90.6%) | 211 (5.0%) |
| 45 to 54 Years | 3,790 (84.6%) | 61 (1.6%) |
| 55 to 59 Years | 1,552 (89.4%) | 0 (0.0%) |
| 60 to 64 Years | 882 (66.5%) | 4 (0.5%) |
| 65 to 74 Years | 540 (35.2%) | 62 (11.5%) |
| 75 Years and over | 61 (4.9%) | 0 (0.0%) |
| Total | 16,970 (72.6%) | 764 (4.5%) |
Employment Status by Educational Attainment in Golden Gate
According to labor force statistics for Golden Gate, 84.8% of individuals (13,895) out of the total population between 25 and 64 years of age (16,386) are in the labor force, with 4.2% or 584 of them being unemployed. The group with the highest labor force participation rate are those with the educational attainment of college / associate degree, with 90.3% or 3,446 individuals in the labor force. Within the labor force, individuals with high school diploma education have the highest percentage of unemployment, with 6.2% or 354 of them being unemployed.
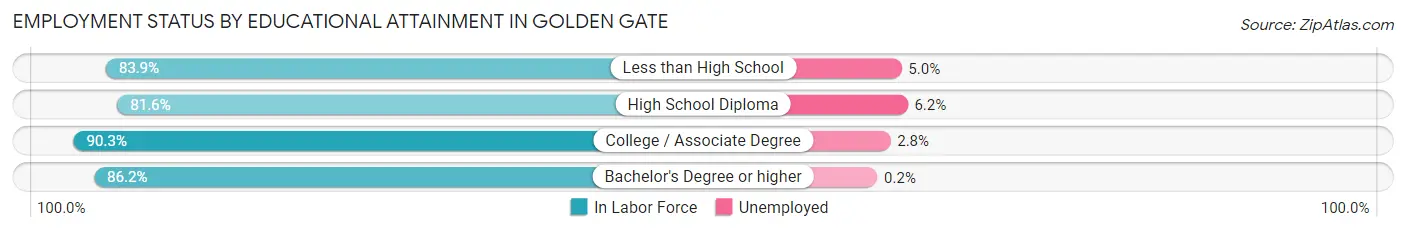
| Educational Attainment | In Labor Force | Unemployed |
| Less than High School | 2,757 (83.9%) | 164 (5.0%) |
| High School Diploma | 5,713 (81.6%) | 434 (6.2%) |
| College / Associate Degree | 3,446 (90.3%) | 107 (2.8%) |
| Bachelor's Degree or higher | 1,968 (86.2%) | 5 (0.2%) |
| Total | 13,895 (84.8%) | 688 (4.2%) |
Employment Occupations by Sex in Golden Gate
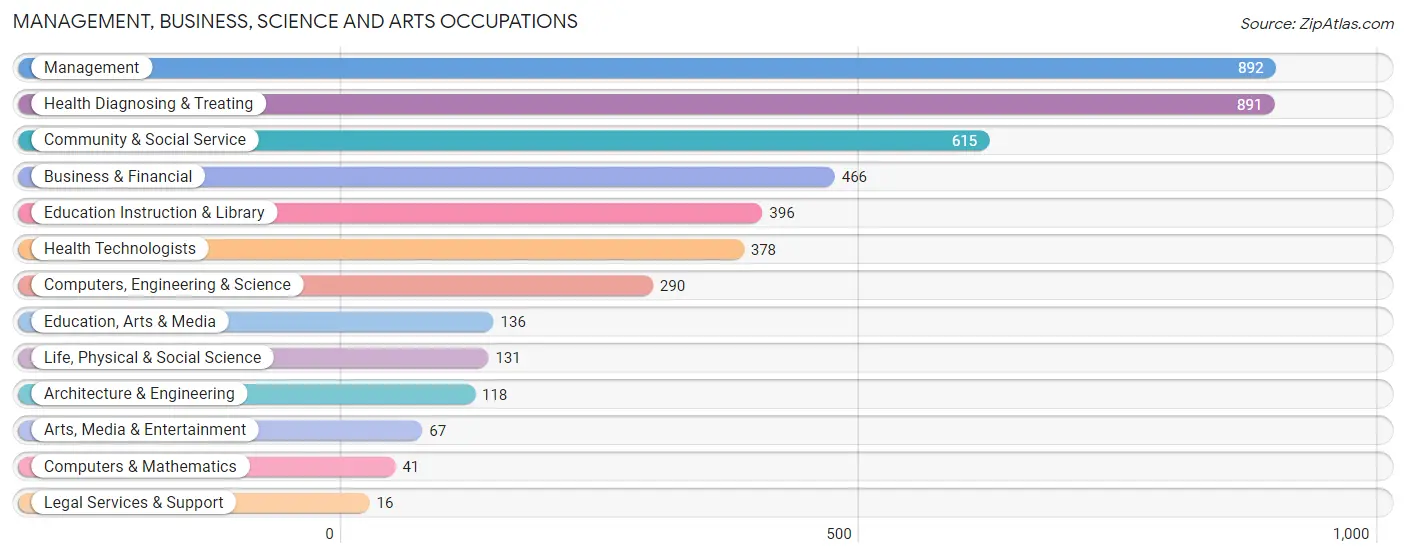
Management, Business, Science and Arts Occupations
The most common Management, Business, Science and Arts occupations in Golden Gate are Management (892 | 5.5%), Health Diagnosing & Treating (891 | 5.5%), Community & Social Service (615 | 3.8%), Business & Financial (466 | 2.9%), and Education Instruction & Library (396 | 2.4%).
Management, Business, Science and Arts Occupations by Sex
Within the Management, Business, Science and Arts occupations in Golden Gate, the most male-oriented occupations are Computers & Mathematics (100.0%), Architecture & Engineering (84.8%), and Business & Financial (79.8%), while the most female-oriented occupations are Legal Services & Support (100.0%), Health Technologists (89.7%), and Education Instruction & Library (79.3%).
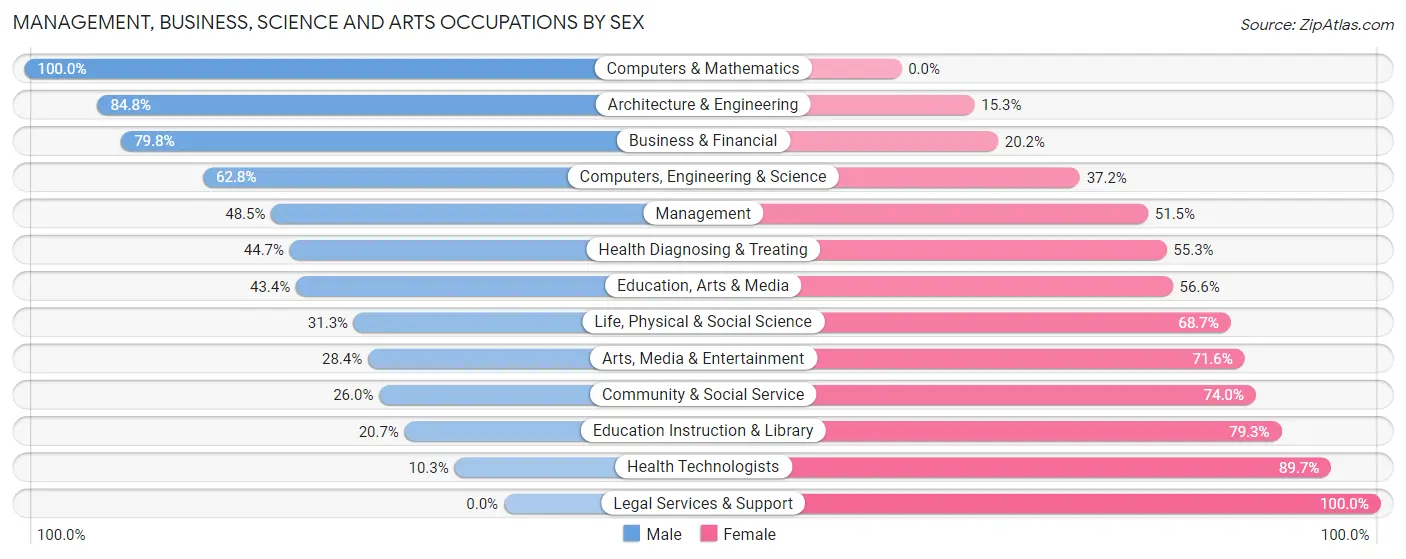
| Occupation | Male | Female |
| Management | 433 (48.5%) | 459 (51.5%) |
| Business & Financial | 372 (79.8%) | 94 (20.2%) |
| Computers, Engineering & Science | 182 (62.8%) | 108 (37.2%) |
| Computers & Mathematics | 41 (100.0%) | 0 (0.0%) |
| Architecture & Engineering | 100 (84.8%) | 18 (15.2%) |
| Life, Physical & Social Science | 41 (31.3%) | 90 (68.7%) |
| Community & Social Service | 160 (26.0%) | 455 (74.0%) |
| Education, Arts & Media | 59 (43.4%) | 77 (56.6%) |
| Legal Services & Support | 0 (0.0%) | 16 (100.0%) |
| Education Instruction & Library | 82 (20.7%) | 314 (79.3%) |
| Arts, Media & Entertainment | 19 (28.4%) | 48 (71.6%) |
| Health Diagnosing & Treating | 398 (44.7%) | 493 (55.3%) |
| Health Technologists | 39 (10.3%) | 339 (89.7%) |
| Total (Category) | 1,545 (49.0%) | 1,609 (51.0%) |
| Total (Overall) | 9,631 (59.4%) | 6,579 (40.6%) |
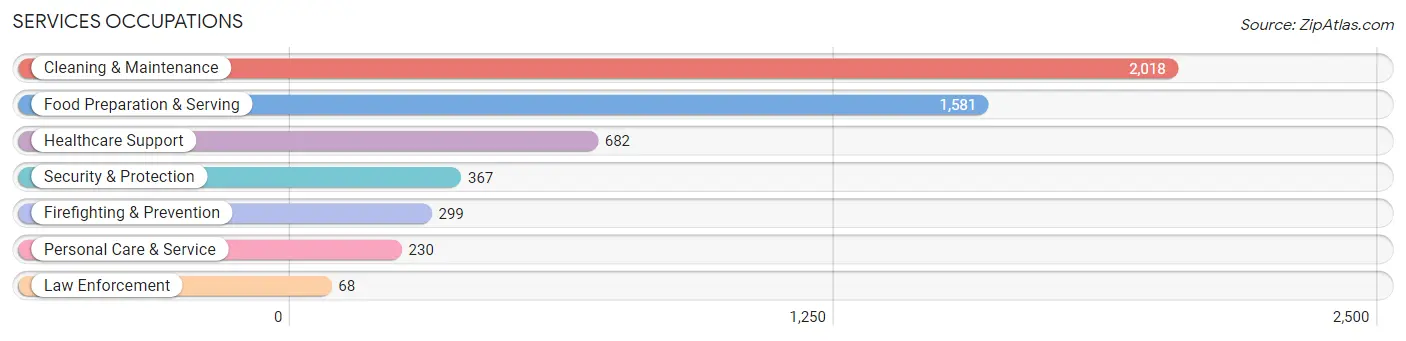
Services Occupations
The most common Services occupations in Golden Gate are Cleaning & Maintenance (2,018 | 12.4%), Food Preparation & Serving (1,581 | 9.8%), Healthcare Support (682 | 4.2%), Security & Protection (367 | 2.3%), and Firefighting & Prevention (299 | 1.8%).
Services Occupations by Sex
Within the Services occupations in Golden Gate, the most male-oriented occupations are Firefighting & Prevention (79.3%), Security & Protection (74.4%), and Food Preparation & Serving (55.0%), while the most female-oriented occupations are Healthcare Support (97.5%), Personal Care & Service (78.3%), and Cleaning & Maintenance (50.0%).
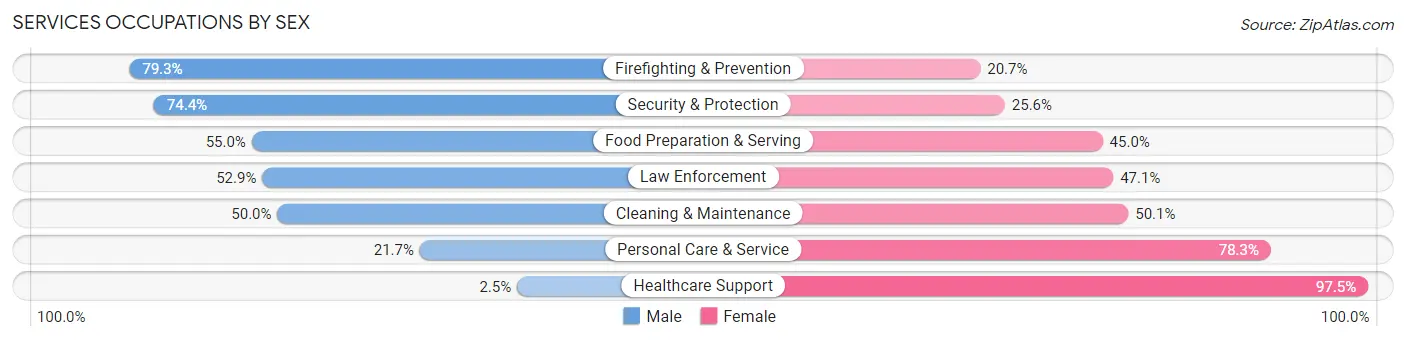
| Occupation | Male | Female |
| Healthcare Support | 17 (2.5%) | 665 (97.5%) |
| Security & Protection | 273 (74.4%) | 94 (25.6%) |
| Firefighting & Prevention | 237 (79.3%) | 62 (20.7%) |
| Law Enforcement | 36 (52.9%) | 32 (47.1%) |
| Food Preparation & Serving | 870 (55.0%) | 711 (45.0%) |
| Cleaning & Maintenance | 1,008 (49.9%) | 1,010 (50.0%) |
| Personal Care & Service | 50 (21.7%) | 180 (78.3%) |
| Total (Category) | 2,218 (45.5%) | 2,660 (54.5%) |
| Total (Overall) | 9,631 (59.4%) | 6,579 (40.6%) |
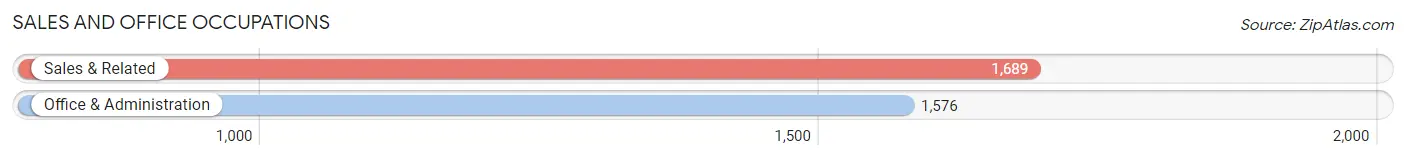
Sales and Office Occupations
The most common Sales and Office occupations in Golden Gate are Sales & Related (1,689 | 10.4%), and Office & Administration (1,576 | 9.7%).
Sales and Office Occupations by Sex
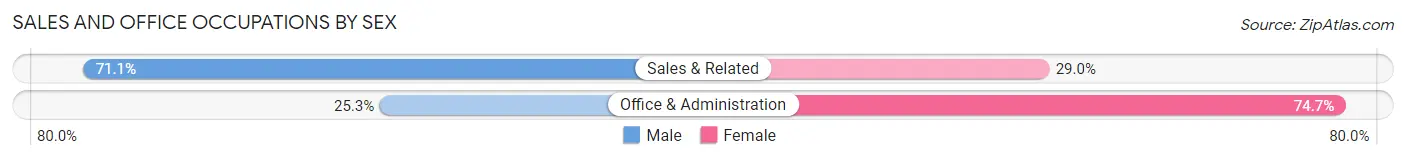
| Occupation | Male | Female |
| Sales & Related | 1,200 (71.1%) | 489 (28.9%) |
| Office & Administration | 399 (25.3%) | 1,177 (74.7%) |
| Total (Category) | 1,599 (49.0%) | 1,666 (51.0%) |
| Total (Overall) | 9,631 (59.4%) | 6,579 (40.6%) |
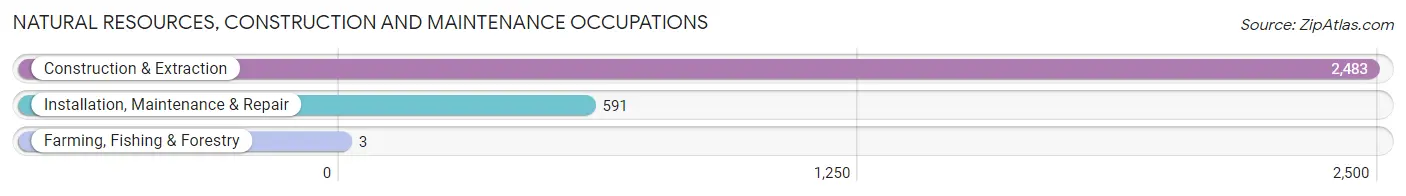
Natural Resources, Construction and Maintenance Occupations
The most common Natural Resources, Construction and Maintenance occupations in Golden Gate are Construction & Extraction (2,483 | 15.3%), Installation, Maintenance & Repair (591 | 3.6%), and Farming, Fishing & Forestry (3 | 0.0%).
Natural Resources, Construction and Maintenance Occupations by Sex
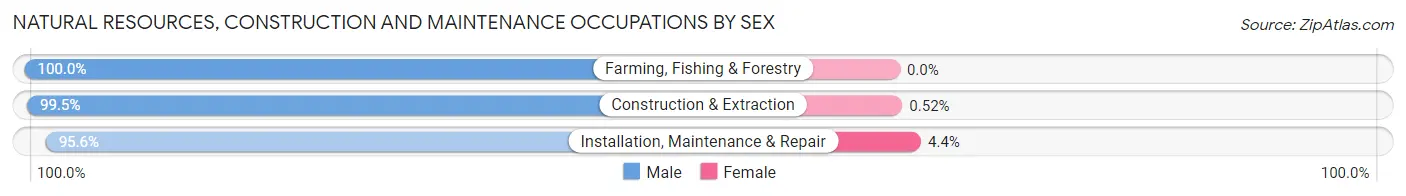
| Occupation | Male | Female |
| Farming, Fishing & Forestry | 3 (100.0%) | 0 (0.0%) |
| Construction & Extraction | 2,470 (99.5%) | 13 (0.5%) |
| Installation, Maintenance & Repair | 565 (95.6%) | 26 (4.4%) |
| Total (Category) | 3,038 (98.7%) | 39 (1.3%) |
| Total (Overall) | 9,631 (59.4%) | 6,579 (40.6%) |
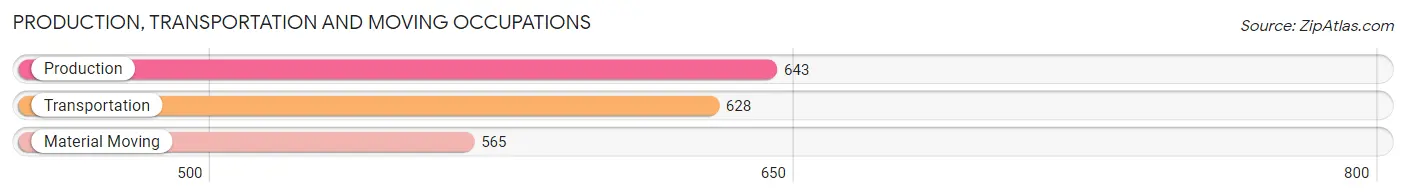
Production, Transportation and Moving Occupations
The most common Production, Transportation and Moving occupations in Golden Gate are Production (643 | 4.0%), Transportation (628 | 3.9%), and Material Moving (565 | 3.5%).
Production, Transportation and Moving Occupations by Sex
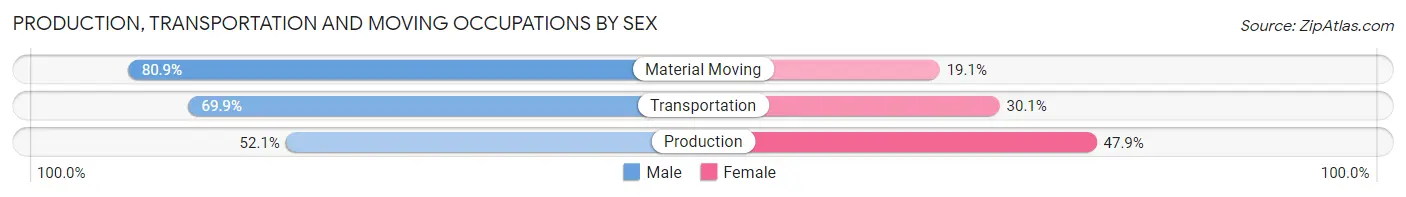
| Occupation | Male | Female |
| Production | 335 (52.1%) | 308 (47.9%) |
| Transportation | 439 (69.9%) | 189 (30.1%) |
| Material Moving | 457 (80.9%) | 108 (19.1%) |
| Total (Category) | 1,231 (67.0%) | 605 (33.0%) |
| Total (Overall) | 9,631 (59.4%) | 6,579 (40.6%) |
Employment Industries by Sex in Golden Gate
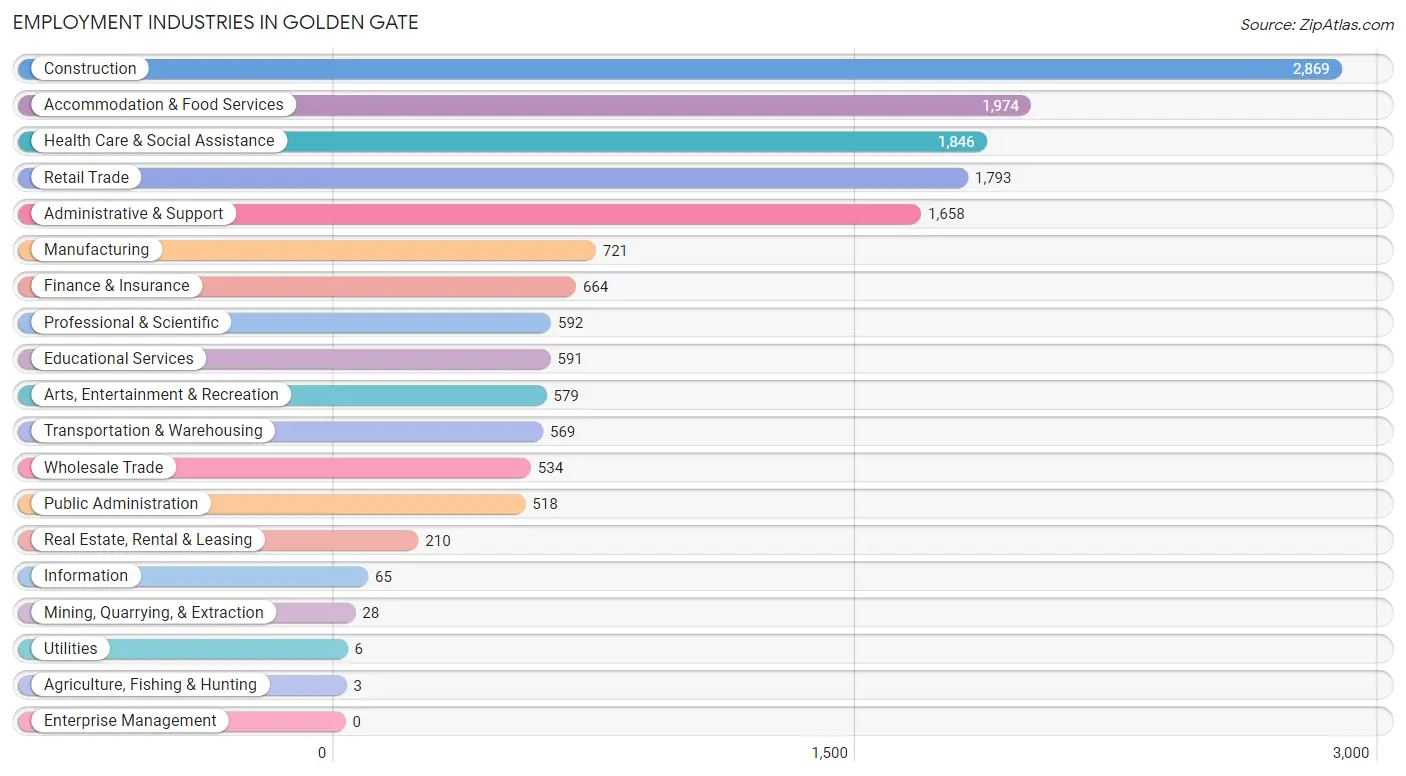
Employment Industries in Golden Gate
The major employment industries in Golden Gate include Construction (2,869 | 17.7%), Accommodation & Food Services (1,974 | 12.2%), Health Care & Social Assistance (1,846 | 11.4%), Retail Trade (1,793 | 11.1%), and Administrative & Support (1,658 | 10.2%).
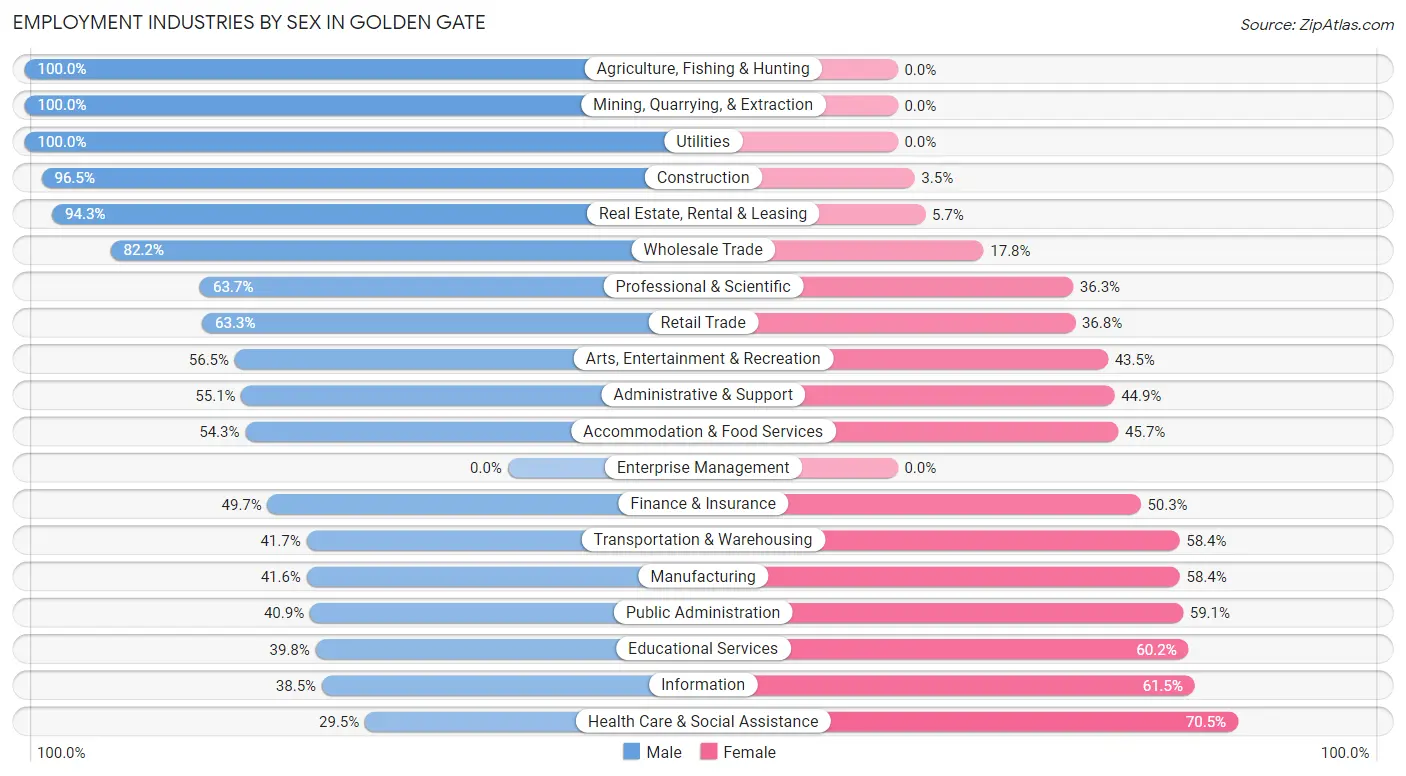
Employment Industries by Sex in Golden Gate
The Golden Gate industries that see more men than women are Agriculture, Fishing & Hunting (100.0%), Mining, Quarrying, & Extraction (100.0%), and Utilities (100.0%), whereas the industries that tend to have a higher number of women are Health Care & Social Assistance (70.5%), Information (61.5%), and Educational Services (60.2%).
| Industry | Male | Female |
| Agriculture, Fishing & Hunting | 3 (100.0%) | 0 (0.0%) |
| Mining, Quarrying, & Extraction | 28 (100.0%) | 0 (0.0%) |
| Construction | 2,768 (96.5%) | 101 (3.5%) |
| Manufacturing | 300 (41.6%) | 421 (58.4%) |
| Wholesale Trade | 439 (82.2%) | 95 (17.8%) |
| Retail Trade | 1,134 (63.2%) | 659 (36.7%) |
| Transportation & Warehousing | 237 (41.6%) | 332 (58.4%) |
| Utilities | 6 (100.0%) | 0 (0.0%) |
| Information | 25 (38.5%) | 40 (61.5%) |
| Finance & Insurance | 330 (49.7%) | 334 (50.3%) |
| Real Estate, Rental & Leasing | 198 (94.3%) | 12 (5.7%) |
| Professional & Scientific | 377 (63.7%) | 215 (36.3%) |
| Enterprise Management | 0 (0.0%) | 0 (0.0%) |
| Administrative & Support | 914 (55.1%) | 744 (44.9%) |
| Educational Services | 235 (39.8%) | 356 (60.2%) |
| Health Care & Social Assistance | 545 (29.5%) | 1,301 (70.5%) |
| Arts, Entertainment & Recreation | 327 (56.5%) | 252 (43.5%) |
| Accommodation & Food Services | 1,072 (54.3%) | 902 (45.7%) |
| Public Administration | 212 (40.9%) | 306 (59.1%) |
| Total | 9,631 (59.4%) | 6,579 (40.6%) |
Education in Golden Gate
School Enrollment in Golden Gate
The most common levels of schooling among the 7,293 students in Golden Gate are college / undergraduate (1,765 | 24.2%), high school (1,707 | 23.4%), and middle school (1,337 | 18.3%).
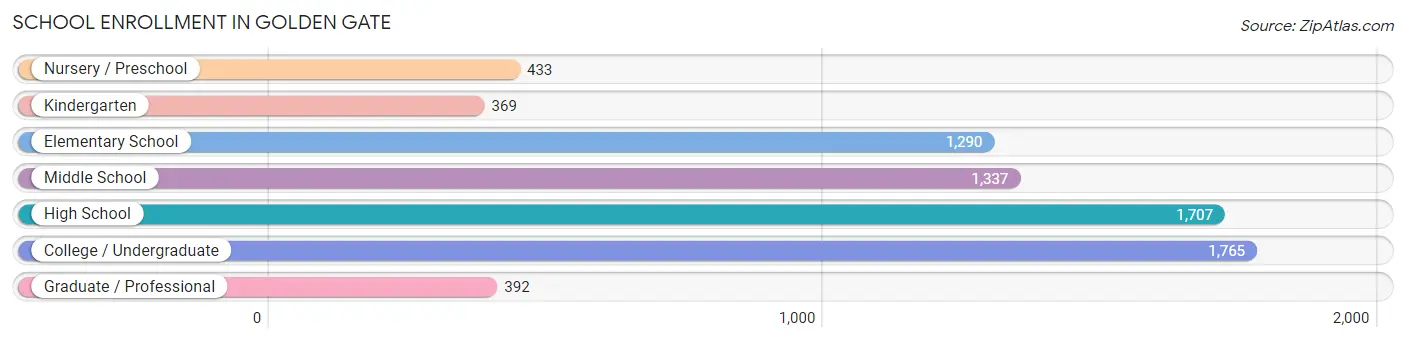
| School Level | # Students | % Students |
| Nursery / Preschool | 433 | 5.9% |
| Kindergarten | 369 | 5.1% |
| Elementary School | 1,290 | 17.7% |
| Middle School | 1,337 | 18.3% |
| High School | 1,707 | 23.4% |
| College / Undergraduate | 1,765 | 24.2% |
| Graduate / Professional | 392 | 5.4% |
| Total | 7,293 | 100.0% |
School Enrollment by Age by Funding Source in Golden Gate
Out of a total of 7,293 students who are enrolled in schools in Golden Gate, 1,233 (16.9%) attend a private institution, while the remaining 6,060 (83.1%) are enrolled in public schools. The age group of 20 to 24 year olds has the highest likelihood of being enrolled in private schools, with 437 (46.6% in the age bracket) enrolled. Conversely, the age group of 15 to 17 year olds has the lowest likelihood of being enrolled in a private school, with 1,235 (98.0% in the age bracket) attending a public institution.
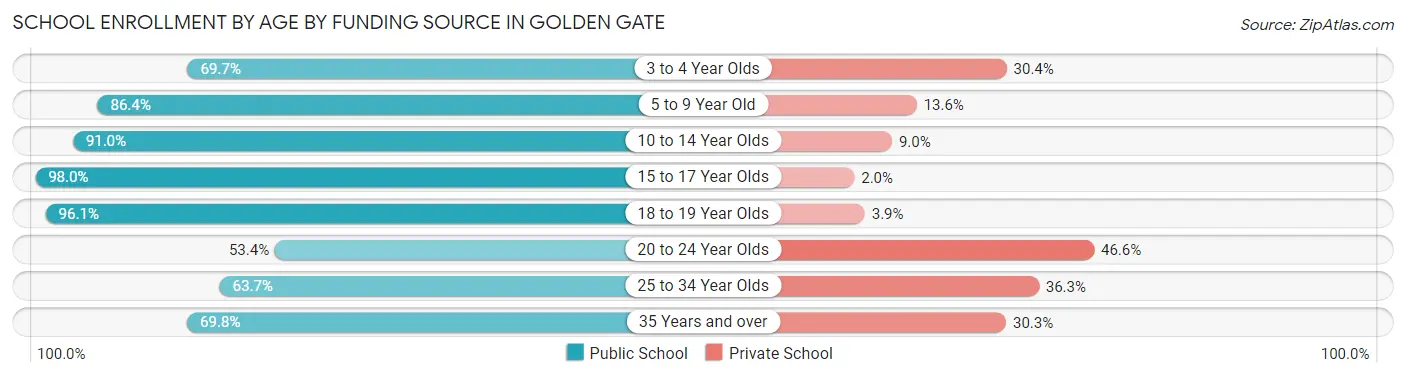
| Age Bracket | Public School | Private School |
| 3 to 4 Year Olds | 218 (69.7%) | 95 (30.3%) |
| 5 to 9 Year Old | 1,359 (86.4%) | 214 (13.6%) |
| 10 to 14 Year Olds | 1,609 (91.0%) | 159 (9.0%) |
| 15 to 17 Year Olds | 1,235 (98.0%) | 25 (2.0%) |
| 18 to 19 Year Olds | 586 (96.1%) | 24 (3.9%) |
| 20 to 24 Year Olds | 500 (53.4%) | 437 (46.6%) |
| 25 to 34 Year Olds | 254 (63.7%) | 145 (36.3%) |
| 35 Years and over | 302 (69.8%) | 131 (30.2%) |
| Total | 6,060 (83.1%) | 1,233 (16.9%) |
Educational Attainment by Field of Study in Golden Gate
Business (877 | 29.3%), arts & humanities (335 | 11.2%), science & technology (320 | 10.7%), psychology (310 | 10.3%), and education (300 | 10.0%) are the most common fields of study among 2,994 individuals in Golden Gate who have obtained a bachelor's degree or higher.
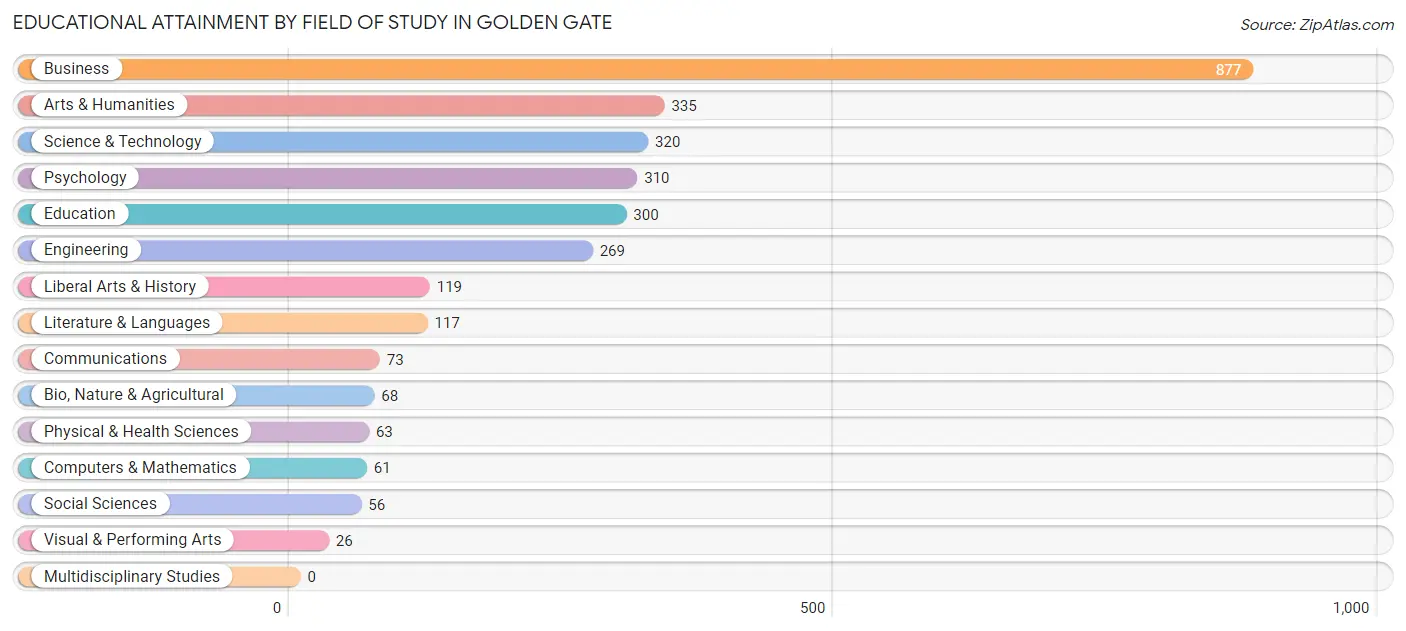
| Field of Study | # Graduates | % Graduates |
| Computers & Mathematics | 61 | 2.0% |
| Bio, Nature & Agricultural | 68 | 2.3% |
| Physical & Health Sciences | 63 | 2.1% |
| Psychology | 310 | 10.3% |
| Social Sciences | 56 | 1.9% |
| Engineering | 269 | 9.0% |
| Multidisciplinary Studies | 0 | 0.0% |
| Science & Technology | 320 | 10.7% |
| Business | 877 | 29.3% |
| Education | 300 | 10.0% |
| Literature & Languages | 117 | 3.9% |
| Liberal Arts & History | 119 | 4.0% |
| Visual & Performing Arts | 26 | 0.9% |
| Communications | 73 | 2.4% |
| Arts & Humanities | 335 | 11.2% |
| Total | 2,994 | 100.0% |
Transportation & Commute in Golden Gate
Vehicle Availability by Sex in Golden Gate
The most prevalent vehicle ownership categories in Golden Gate are males with 2 vehicles (3,047, accounting for 31.9%) and females with 2 vehicles (1,778, making up 47.0%).
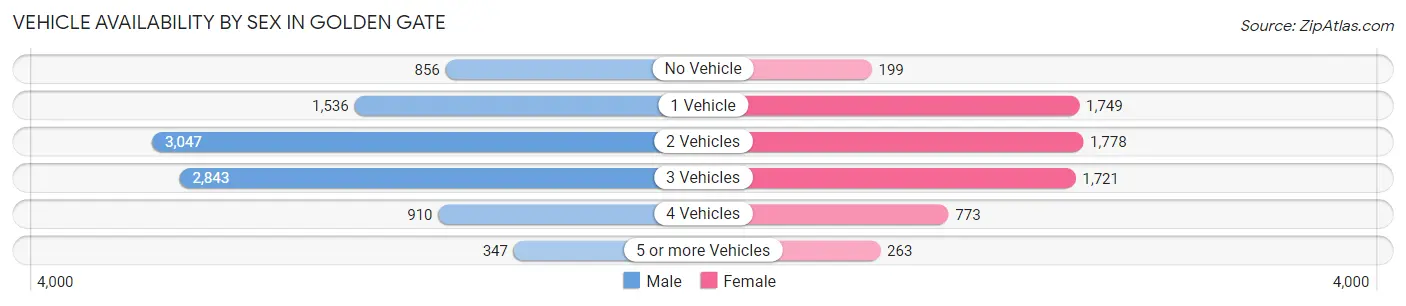
| Vehicles Available | Male | Female |
| No Vehicle | 856 (9.0%) | 199 (3.1%) |
| 1 Vehicle | 1,536 (16.1%) | 1,749 (27.0%) |
| 2 Vehicles | 3,047 (31.9%) | 1,778 (27.4%) |
| 3 Vehicles | 2,843 (29.8%) | 1,721 (26.6%) |
| 4 Vehicles | 910 (9.5%) | 773 (11.9%) |
| 5 or more Vehicles | 347 (3.6%) | 263 (4.1%) |
| Total | 9,539 (100.0%) | 6,483 (100.0%) |
Commute Time in Golden Gate
The most frequently occuring commute durations in Golden Gate are 20 to 24 minutes (3,810 commuters, 24.8%), 15 to 19 minutes (3,541 commuters, 23.1%), and 30 to 34 minutes (2,647 commuters, 17.3%).
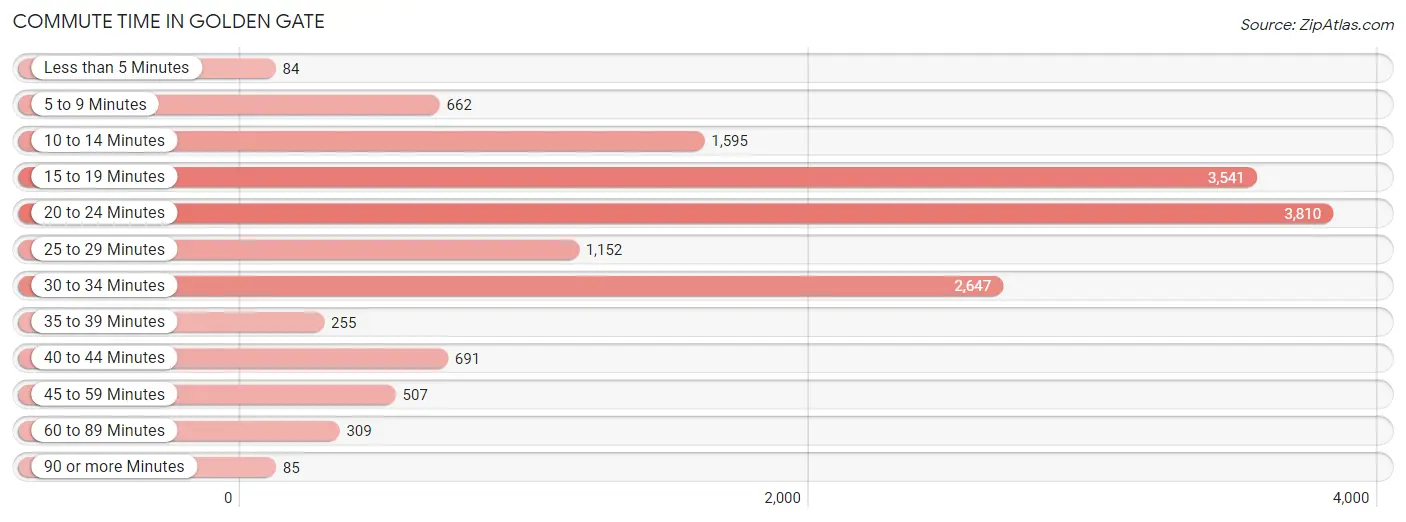
| Commute Time | # Commuters | % Commuters |
| Less than 5 Minutes | 84 | 0.5% |
| 5 to 9 Minutes | 662 | 4.3% |
| 10 to 14 Minutes | 1,595 | 10.4% |
| 15 to 19 Minutes | 3,541 | 23.1% |
| 20 to 24 Minutes | 3,810 | 24.8% |
| 25 to 29 Minutes | 1,152 | 7.5% |
| 30 to 34 Minutes | 2,647 | 17.3% |
| 35 to 39 Minutes | 255 | 1.7% |
| 40 to 44 Minutes | 691 | 4.5% |
| 45 to 59 Minutes | 507 | 3.3% |
| 60 to 89 Minutes | 309 | 2.0% |
| 90 or more Minutes | 85 | 0.5% |
Commute Time by Sex in Golden Gate
The most common commute times in Golden Gate are 20 to 24 minutes (2,404 commuters, 26.1%) for males and 15 to 19 minutes (1,565 commuters, 25.6%) for females.
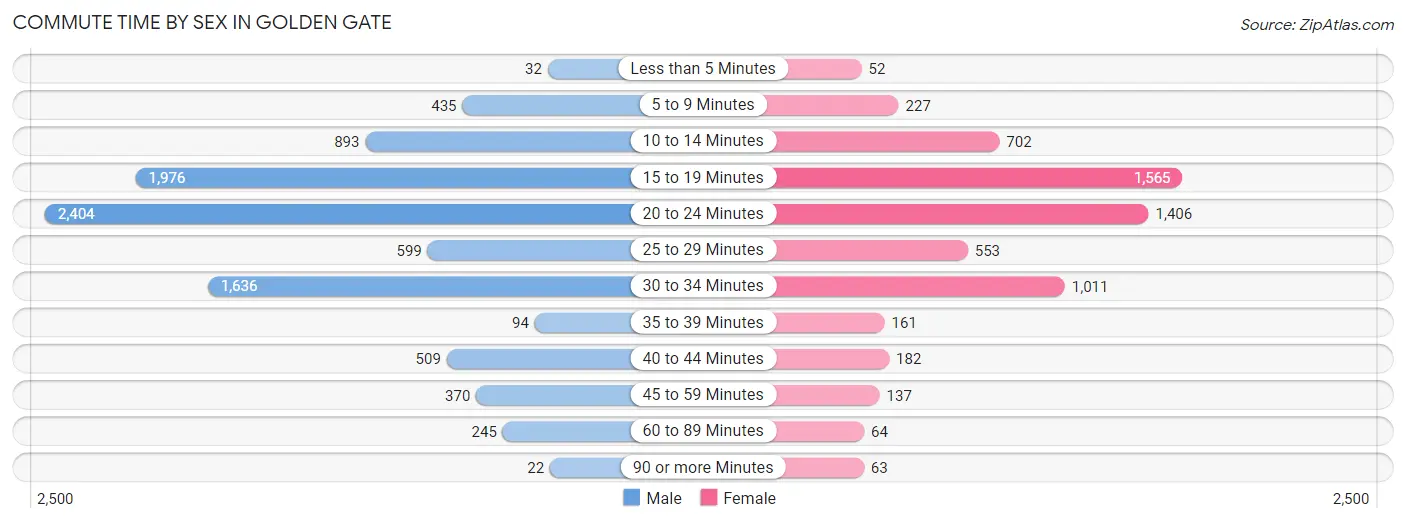
| Commute Time | Male | Female |
| Less than 5 Minutes | 32 (0.4%) | 52 (0.9%) |
| 5 to 9 Minutes | 435 (4.7%) | 227 (3.7%) |
| 10 to 14 Minutes | 893 (9.7%) | 702 (11.5%) |
| 15 to 19 Minutes | 1,976 (21.4%) | 1,565 (25.6%) |
| 20 to 24 Minutes | 2,404 (26.1%) | 1,406 (23.0%) |
| 25 to 29 Minutes | 599 (6.5%) | 553 (9.0%) |
| 30 to 34 Minutes | 1,636 (17.7%) | 1,011 (16.5%) |
| 35 to 39 Minutes | 94 (1.0%) | 161 (2.6%) |
| 40 to 44 Minutes | 509 (5.5%) | 182 (3.0%) |
| 45 to 59 Minutes | 370 (4.0%) | 137 (2.2%) |
| 60 to 89 Minutes | 245 (2.7%) | 64 (1.1%) |
| 90 or more Minutes | 22 (0.2%) | 63 (1.0%) |
Time of Departure to Work by Sex in Golden Gate
The most frequent times of departure to work in Golden Gate are 7:00 AM to 7:29 AM (2,013, 21.8%) for males and 8:00 AM to 8:29 AM (1,132, 18.5%) for females.
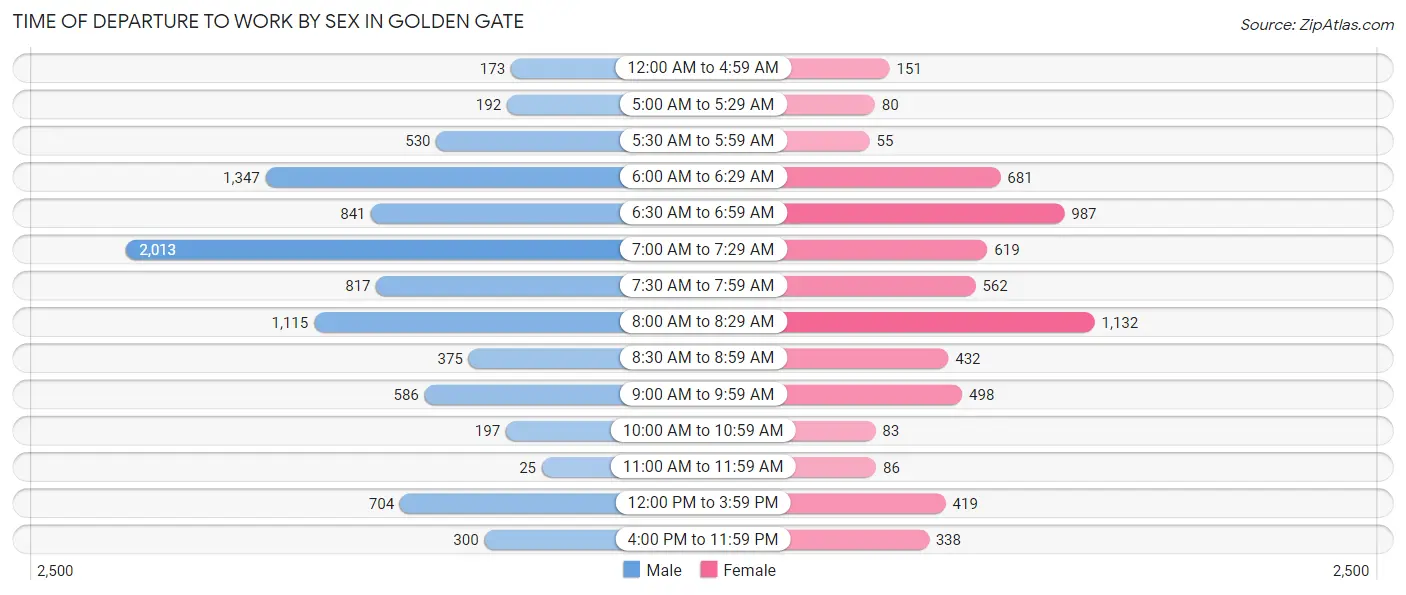
| Time of Departure | Male | Female |
| 12:00 AM to 4:59 AM | 173 (1.9%) | 151 (2.5%) |
| 5:00 AM to 5:29 AM | 192 (2.1%) | 80 (1.3%) |
| 5:30 AM to 5:59 AM | 530 (5.8%) | 55 (0.9%) |
| 6:00 AM to 6:29 AM | 1,347 (14.6%) | 681 (11.1%) |
| 6:30 AM to 6:59 AM | 841 (9.1%) | 987 (16.1%) |
| 7:00 AM to 7:29 AM | 2,013 (21.8%) | 619 (10.1%) |
| 7:30 AM to 7:59 AM | 817 (8.9%) | 562 (9.2%) |
| 8:00 AM to 8:29 AM | 1,115 (12.1%) | 1,132 (18.5%) |
| 8:30 AM to 8:59 AM | 375 (4.1%) | 432 (7.1%) |
| 9:00 AM to 9:59 AM | 586 (6.4%) | 498 (8.1%) |
| 10:00 AM to 10:59 AM | 197 (2.1%) | 83 (1.4%) |
| 11:00 AM to 11:59 AM | 25 (0.3%) | 86 (1.4%) |
| 12:00 PM to 3:59 PM | 704 (7.6%) | 419 (6.8%) |
| 4:00 PM to 11:59 PM | 300 (3.3%) | 338 (5.5%) |
| Total | 9,215 (100.0%) | 6,123 (100.0%) |
Housing Occupancy in Golden Gate
Occupancy by Ownership in Golden Gate
Of the total 8,538 dwellings in Golden Gate, owner-occupied units account for 4,513 (52.9%), while renter-occupied units make up 4,025 (47.1%).
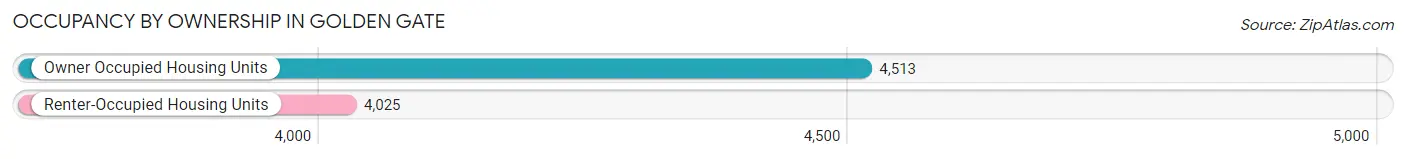
| Occupancy | # Housing Units | % Housing Units |
| Owner Occupied Housing Units | 4,513 | 52.9% |
| Renter-Occupied Housing Units | 4,025 | 47.1% |
| Total Occupied Housing Units | 8,538 | 100.0% |
Occupancy by Household Size in Golden Gate
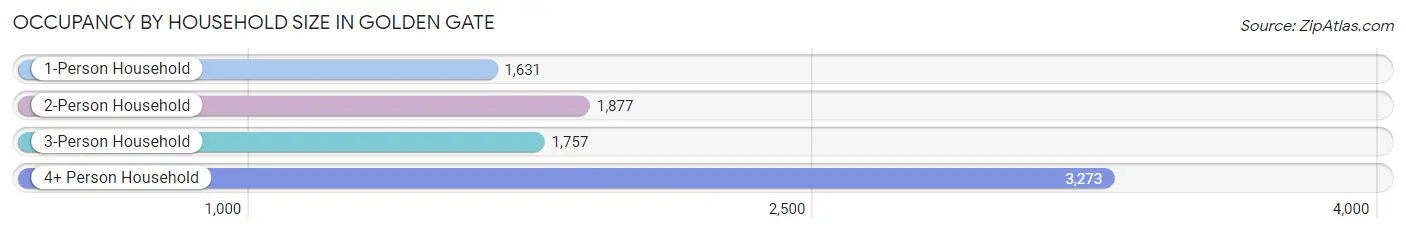
| Household Size | # Housing Units | % Housing Units |
| 1-Person Household | 1,631 | 19.1% |
| 2-Person Household | 1,877 | 22.0% |
| 3-Person Household | 1,757 | 20.6% |
| 4+ Person Household | 3,273 | 38.3% |
| Total Housing Units | 8,538 | 100.0% |
Occupancy by Ownership by Household Size in Golden Gate
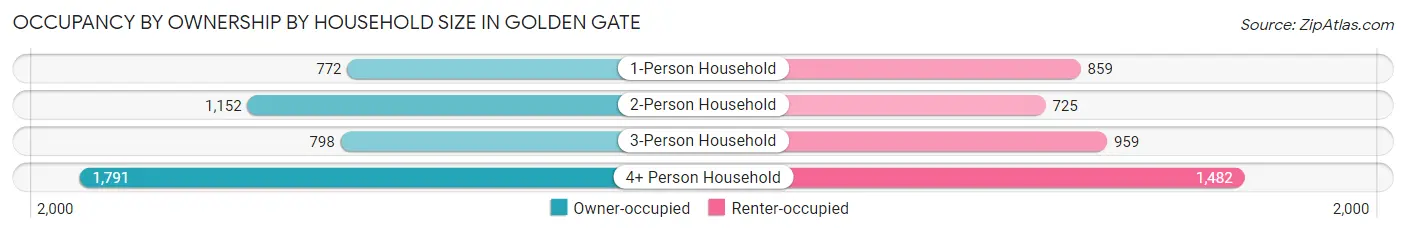
| Household Size | Owner-occupied | Renter-occupied |
| 1-Person Household | 772 (47.3%) | 859 (52.7%) |
| 2-Person Household | 1,152 (61.4%) | 725 (38.6%) |
| 3-Person Household | 798 (45.4%) | 959 (54.6%) |
| 4+ Person Household | 1,791 (54.7%) | 1,482 (45.3%) |
| Total Housing Units | 4,513 (52.9%) | 4,025 (47.1%) |
Occupancy by Educational Attainment in Golden Gate
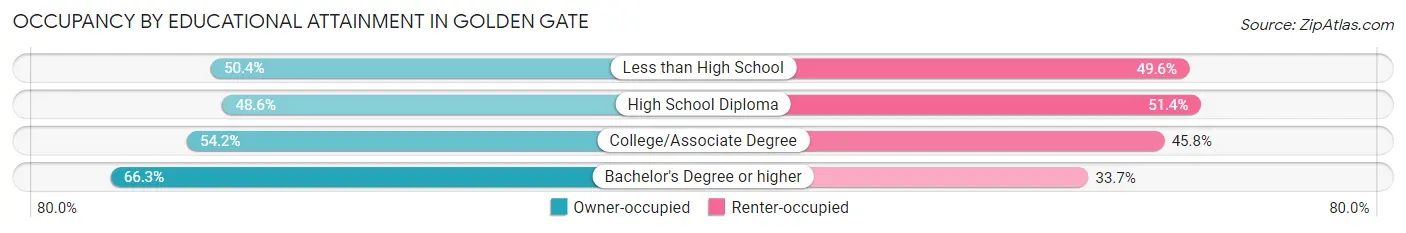
| Household Size | Owner-occupied | Renter-occupied |
| Less than High School | 803 (50.4%) | 790 (49.6%) |
| High School Diploma | 1,842 (48.6%) | 1,948 (51.4%) |
| College/Associate Degree | 1,006 (54.2%) | 849 (45.8%) |
| Bachelor's Degree or higher | 862 (66.3%) | 438 (33.7%) |
Occupancy by Age of Householder in Golden Gate
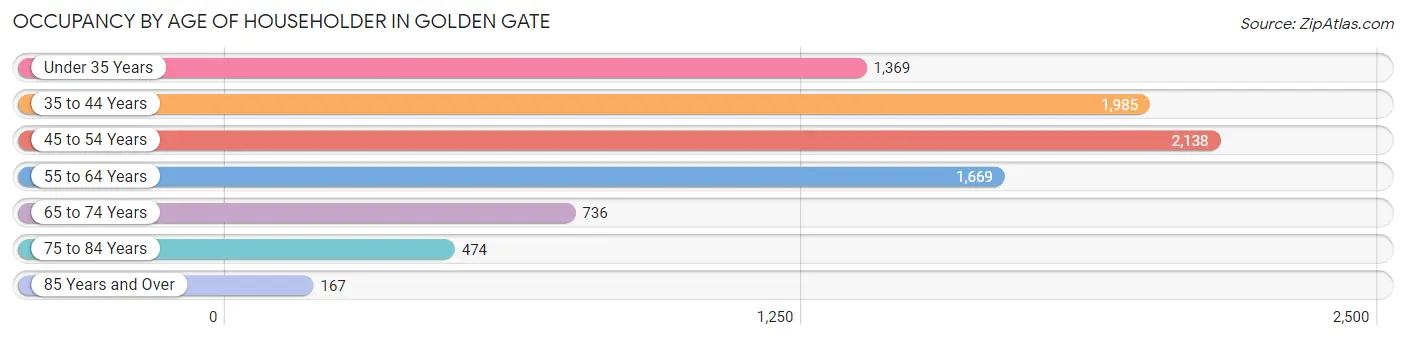
| Age Bracket | # Households | % Households |
| Under 35 Years | 1,369 | 16.0% |
| 35 to 44 Years | 1,985 | 23.3% |
| 45 to 54 Years | 2,138 | 25.0% |
| 55 to 64 Years | 1,669 | 19.6% |
| 65 to 74 Years | 736 | 8.6% |
| 75 to 84 Years | 474 | 5.6% |
| 85 Years and Over | 167 | 2.0% |
| Total | 8,538 | 100.0% |
Housing Finances in Golden Gate
Median Income by Occupancy in Golden Gate
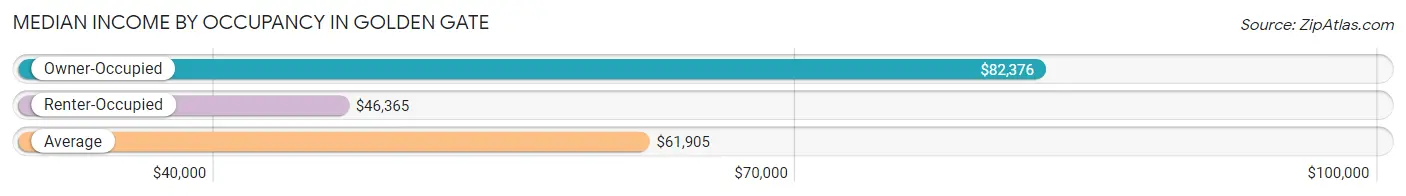
| Occupancy Type | # Households | Median Income |
| Owner-Occupied | 4,513 (52.9%) | $82,376 |
| Renter-Occupied | 4,025 (47.1%) | $46,365 |
| Average | 8,538 (100.0%) | $61,905 |
Occupancy by Householder Income Bracket in Golden Gate
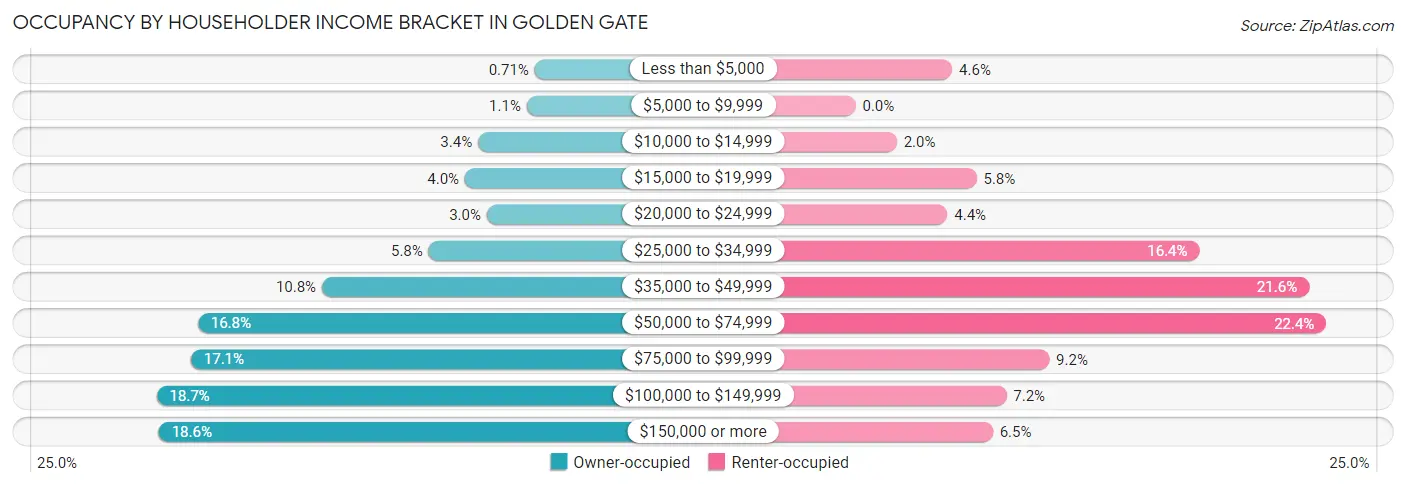
| Income Bracket | Owner-occupied | Renter-occupied |
| Less than $5,000 | 32 (0.7%) | 185 (4.6%) |
| $5,000 to $9,999 | 49 (1.1%) | 0 (0.0%) |
| $10,000 to $14,999 | 154 (3.4%) | 79 (2.0%) |
| $15,000 to $19,999 | 182 (4.0%) | 232 (5.8%) |
| $20,000 to $24,999 | 135 (3.0%) | 176 (4.4%) |
| $25,000 to $34,999 | 260 (5.8%) | 659 (16.4%) |
| $35,000 to $49,999 | 489 (10.8%) | 869 (21.6%) |
| $50,000 to $74,999 | 756 (16.8%) | 902 (22.4%) |
| $75,000 to $99,999 | 771 (17.1%) | 371 (9.2%) |
| $100,000 to $149,999 | 845 (18.7%) | 289 (7.2%) |
| $150,000 or more | 840 (18.6%) | 263 (6.5%) |
| Total | 4,513 (100.0%) | 4,025 (100.0%) |
Monthly Housing Cost Tiers in Golden Gate
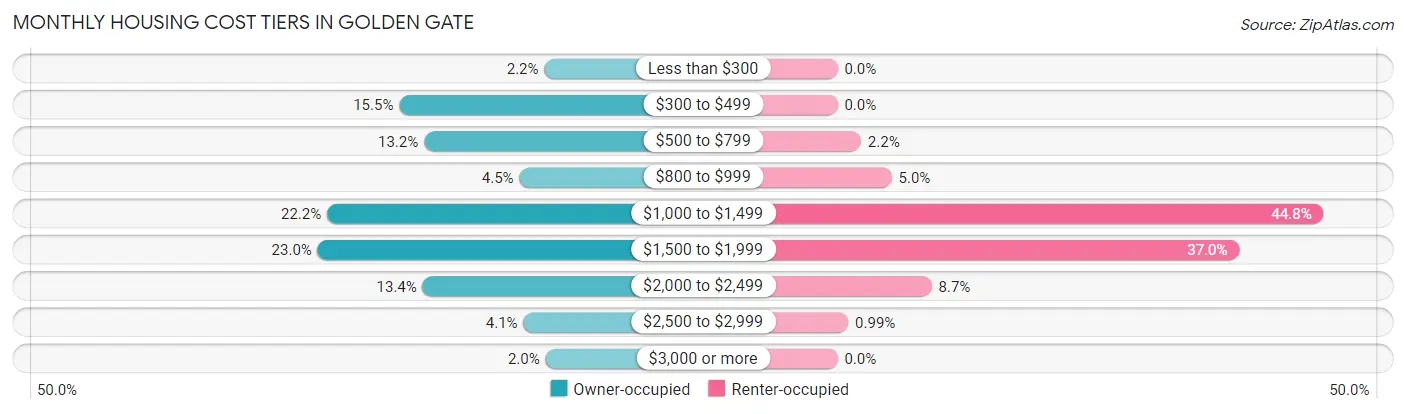
| Monthly Cost | Owner-occupied | Renter-occupied |
| Less than $300 | 97 (2.1%) | 0 (0.0%) |
| $300 to $499 | 700 (15.5%) | 0 (0.0%) |
| $500 to $799 | 597 (13.2%) | 87 (2.2%) |
| $800 to $999 | 201 (4.4%) | 201 (5.0%) |
| $1,000 to $1,499 | 1,000 (22.2%) | 1,801 (44.8%) |
| $1,500 to $1,999 | 1,039 (23.0%) | 1,489 (37.0%) |
| $2,000 to $2,499 | 603 (13.4%) | 349 (8.7%) |
| $2,500 to $2,999 | 184 (4.1%) | 40 (1.0%) |
| $3,000 or more | 92 (2.0%) | 0 (0.0%) |
| Total | 4,513 (100.0%) | 4,025 (100.0%) |
Physical Housing Characteristics in Golden Gate
Housing Structures in Golden Gate
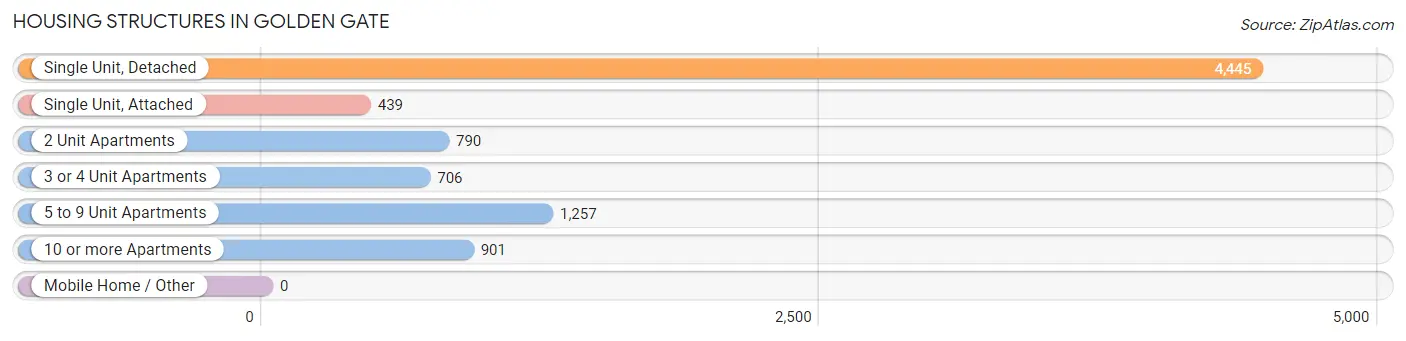
| Structure Type | # Housing Units | % Housing Units |
| Single Unit, Detached | 4,445 | 52.1% |
| Single Unit, Attached | 439 | 5.1% |
| 2 Unit Apartments | 790 | 9.2% |
| 3 or 4 Unit Apartments | 706 | 8.3% |
| 5 to 9 Unit Apartments | 1,257 | 14.7% |
| 10 or more Apartments | 901 | 10.5% |
| Mobile Home / Other | 0 | 0.0% |
| Total | 8,538 | 100.0% |
Housing Structures by Occupancy in Golden Gate
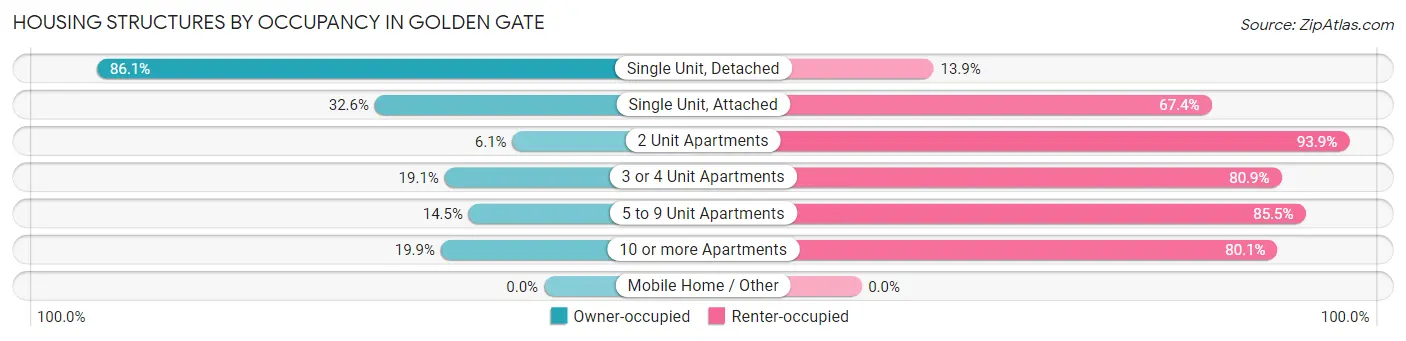
| Structure Type | Owner-occupied | Renter-occupied |
| Single Unit, Detached | 3,826 (86.1%) | 619 (13.9%) |
| Single Unit, Attached | 143 (32.6%) | 296 (67.4%) |
| 2 Unit Apartments | 48 (6.1%) | 742 (93.9%) |
| 3 or 4 Unit Apartments | 135 (19.1%) | 571 (80.9%) |
| 5 to 9 Unit Apartments | 182 (14.5%) | 1,075 (85.5%) |
| 10 or more Apartments | 179 (19.9%) | 722 (80.1%) |
| Mobile Home / Other | 0 (0.0%) | 0 (0.0%) |
| Total | 4,513 (52.9%) | 4,025 (47.1%) |
Housing Structures by Number of Rooms in Golden Gate
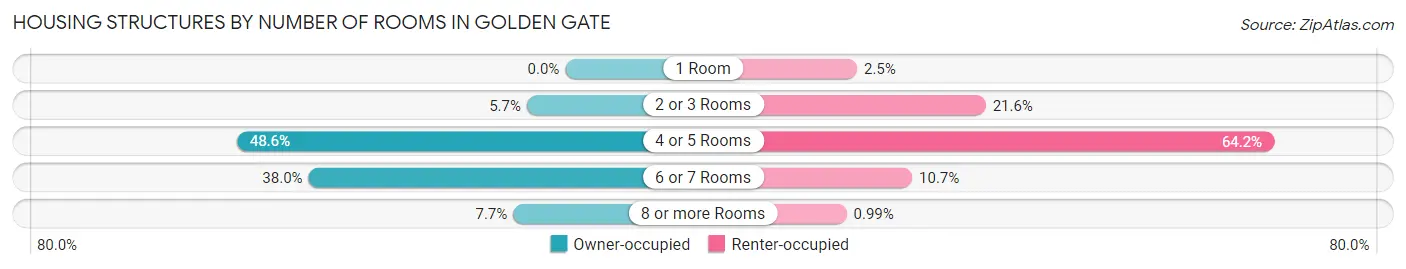
| Number of Rooms | Owner-occupied | Renter-occupied |
| 1 Room | 0 (0.0%) | 102 (2.5%) |
| 2 or 3 Rooms | 257 (5.7%) | 868 (21.6%) |
| 4 or 5 Rooms | 2,193 (48.6%) | 2,585 (64.2%) |
| 6 or 7 Rooms | 1,715 (38.0%) | 430 (10.7%) |
| 8 or more Rooms | 348 (7.7%) | 40 (1.0%) |
| Total | 4,513 (100.0%) | 4,025 (100.0%) |
Housing Structure by Heating Type in Golden Gate
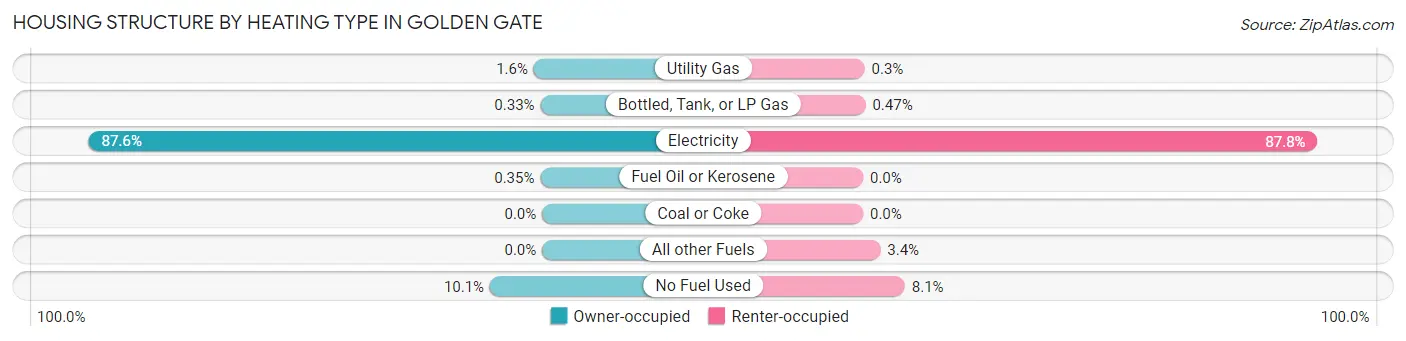
| Heating Type | Owner-occupied | Renter-occupied |
| Utility Gas | 72 (1.6%) | 12 (0.3%) |
| Bottled, Tank, or LP Gas | 15 (0.3%) | 19 (0.5%) |
| Electricity | 3,955 (87.6%) | 3,534 (87.8%) |
| Fuel Oil or Kerosene | 16 (0.4%) | 0 (0.0%) |
| Coal or Coke | 0 (0.0%) | 0 (0.0%) |
| All other Fuels | 0 (0.0%) | 135 (3.4%) |
| No Fuel Used | 455 (10.1%) | 325 (8.1%) |
| Total | 4,513 (100.0%) | 4,025 (100.0%) |
Household Vehicle Usage in Golden Gate
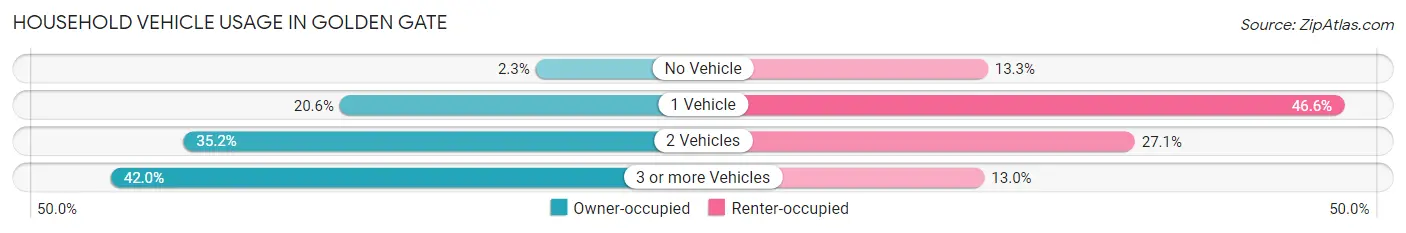
| Vehicles per Household | Owner-occupied | Renter-occupied |
| No Vehicle | 104 (2.3%) | 537 (13.3%) |
| 1 Vehicle | 929 (20.6%) | 1,875 (46.6%) |
| 2 Vehicles | 1,587 (35.2%) | 1,089 (27.1%) |
| 3 or more Vehicles | 1,893 (41.9%) | 524 (13.0%) |
| Total | 4,513 (100.0%) | 4,025 (100.0%) |
Real Estate & Mortgages in Golden Gate
Real Estate and Mortgage Overview in Golden Gate
| Characteristic | Without Mortgage | With Mortgage |
| Housing Units | 1,293 | 3,220 |
| Median Property Value | $318,100 | $325,100 |
| Median Household Income | $84,554 | $503 |
| Monthly Housing Costs | $476 | $92 |
| Real Estate Taxes | $1,277 | $92 |
Property Value by Mortgage Status in Golden Gate
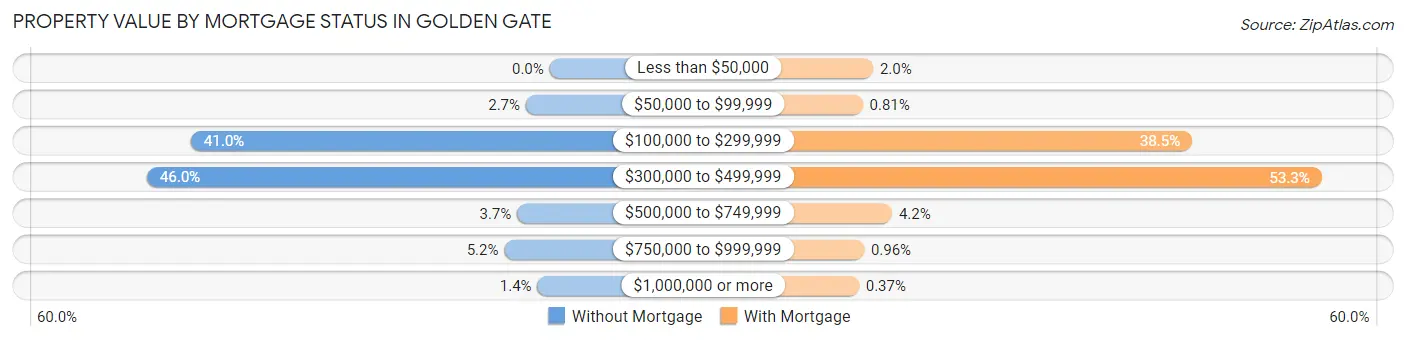
| Property Value | Without Mortgage | With Mortgage |
| Less than $50,000 | 0 (0.0%) | 64 (2.0%) |
| $50,000 to $99,999 | 35 (2.7%) | 26 (0.8%) |
| $100,000 to $299,999 | 530 (41.0%) | 1,238 (38.5%) |
| $300,000 to $499,999 | 595 (46.0%) | 1,715 (53.3%) |
| $500,000 to $749,999 | 48 (3.7%) | 134 (4.2%) |
| $750,000 to $999,999 | 67 (5.2%) | 31 (1.0%) |
| $1,000,000 or more | 18 (1.4%) | 12 (0.4%) |
| Total | 1,293 (100.0%) | 3,220 (100.0%) |
Household Income by Mortgage Status in Golden Gate
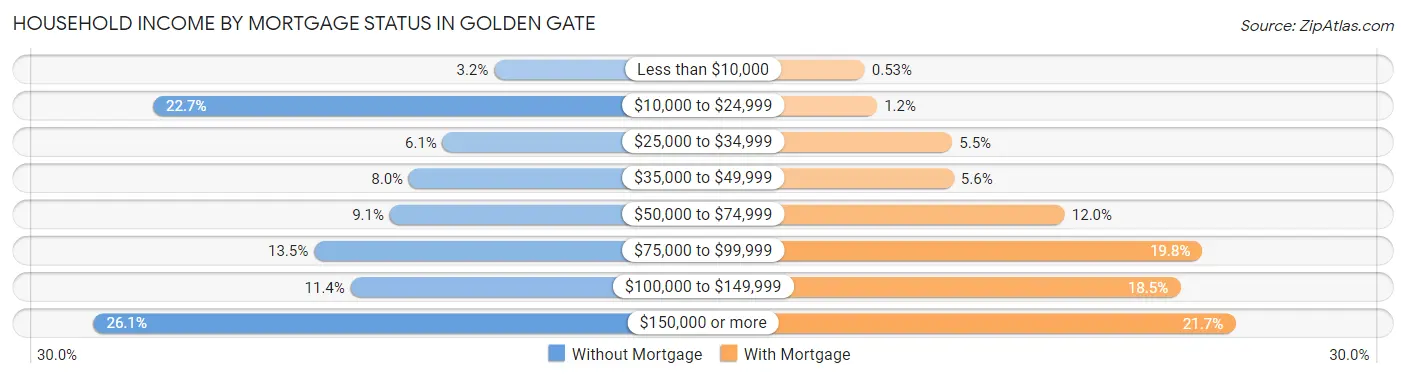
| Household Income | Without Mortgage | With Mortgage |
| Less than $10,000 | 41 (3.2%) | 17 (0.5%) |
| $10,000 to $24,999 | 293 (22.7%) | 40 (1.2%) |
| $25,000 to $34,999 | 79 (6.1%) | 178 (5.5%) |
| $35,000 to $49,999 | 104 (8.0%) | 181 (5.6%) |
| $50,000 to $74,999 | 118 (9.1%) | 385 (12.0%) |
| $75,000 to $99,999 | 174 (13.5%) | 638 (19.8%) |
| $100,000 to $149,999 | 147 (11.4%) | 597 (18.5%) |
| $150,000 or more | 337 (26.1%) | 698 (21.7%) |
| Total | 1,293 (100.0%) | 3,220 (100.0%) |
Property Value to Household Income Ratio in Golden Gate
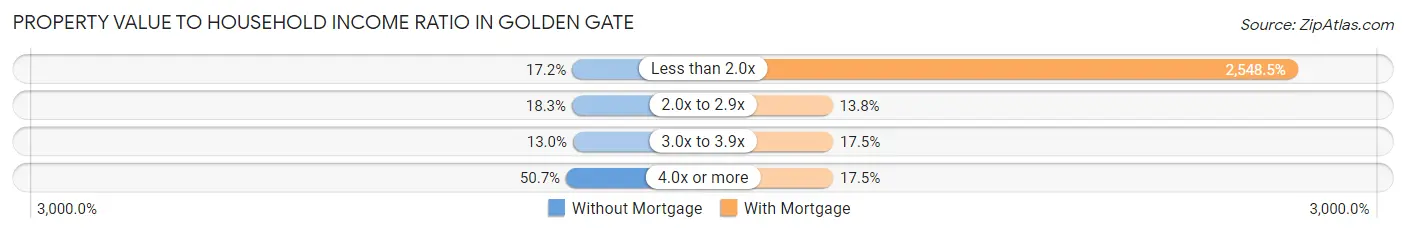
| Value-to-Income Ratio | Without Mortgage | With Mortgage |
| Less than 2.0x | 222 (17.2%) | 82,060 (2,548.5%) |
| 2.0x to 2.9x | 237 (18.3%) | 445 (13.8%) |
| 3.0x to 3.9x | 168 (13.0%) | 563 (17.5%) |
| 4.0x or more | 656 (50.7%) | 562 (17.4%) |
| Total | 1,293 (100.0%) | 3,220 (100.0%) |
Real Estate Taxes by Mortgage Status in Golden Gate
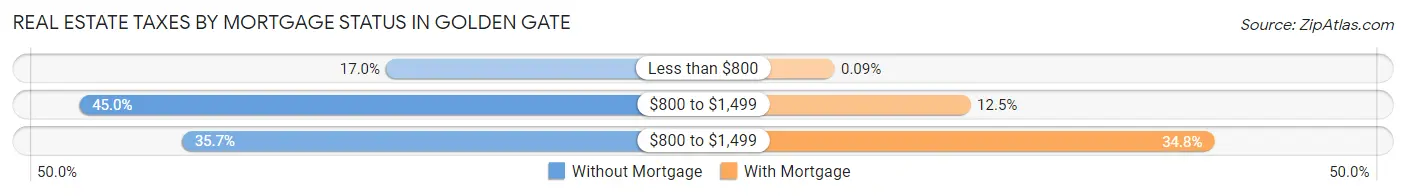
| Property Taxes | Without Mortgage | With Mortgage |
| Less than $800 | 220 (17.0%) | 3 (0.1%) |
| $800 to $1,499 | 582 (45.0%) | 403 (12.5%) |
| $800 to $1,499 | 461 (35.6%) | 1,121 (34.8%) |
| Total | 1,293 (100.0%) | 3,220 (100.0%) |
Health & Disability in Golden Gate
Health Insurance Coverage by Age in Golden Gate
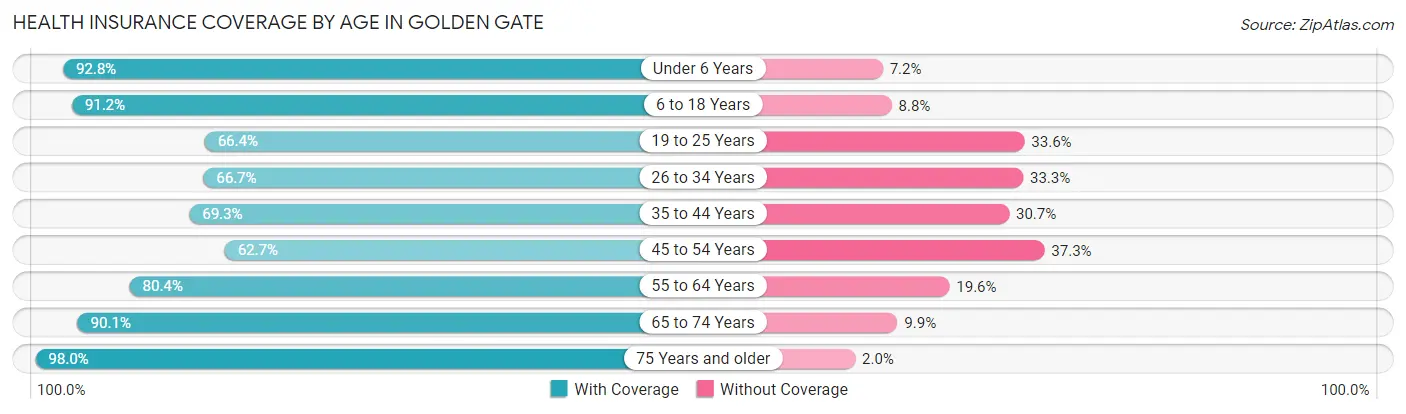
| Age Bracket | With Coverage | Without Coverage |
| Under 6 Years | 2,475 (92.8%) | 191 (7.2%) |
| 6 to 18 Years | 4,127 (91.2%) | 399 (8.8%) |
| 19 to 25 Years | 2,542 (66.4%) | 1,286 (33.6%) |
| 26 to 34 Years | 2,267 (66.7%) | 1,134 (33.3%) |
| 35 to 44 Years | 3,230 (69.3%) | 1,432 (30.7%) |
| 45 to 54 Years | 2,808 (62.7%) | 1,672 (37.3%) |
| 55 to 64 Years | 2,463 (80.4%) | 600 (19.6%) |
| 65 to 74 Years | 1,383 (90.1%) | 152 (9.9%) |
| 75 Years and older | 1,214 (98.0%) | 25 (2.0%) |
| Total | 22,509 (76.6%) | 6,891 (23.4%) |
Health Insurance Coverage by Citizenship Status in Golden Gate
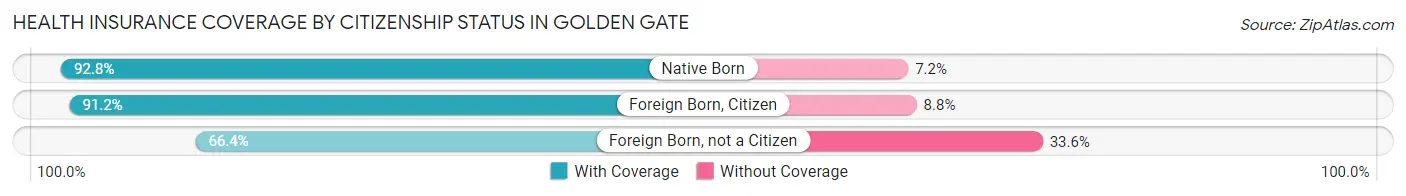
| Citizenship Status | With Coverage | Without Coverage |
| Native Born | 2,475 (92.8%) | 191 (7.2%) |
| Foreign Born, Citizen | 4,127 (91.2%) | 399 (8.8%) |
| Foreign Born, not a Citizen | 2,542 (66.4%) | 1,286 (33.6%) |
Health Insurance Coverage by Household Income in Golden Gate
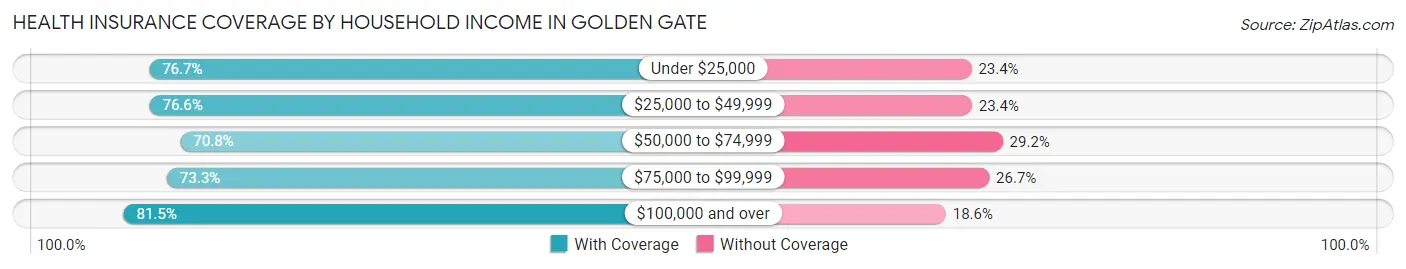
| Household Income | With Coverage | Without Coverage |
| Under $25,000 | 1,970 (76.6%) | 600 (23.4%) |
| $25,000 to $49,999 | 4,822 (76.6%) | 1,475 (23.4%) |
| $50,000 to $74,999 | 3,993 (70.8%) | 1,647 (29.2%) |
| $75,000 to $99,999 | 3,533 (73.3%) | 1,285 (26.7%) |
| $100,000 and over | 8,177 (81.5%) | 1,862 (18.5%) |
Public vs Private Health Insurance Coverage by Age in Golden Gate
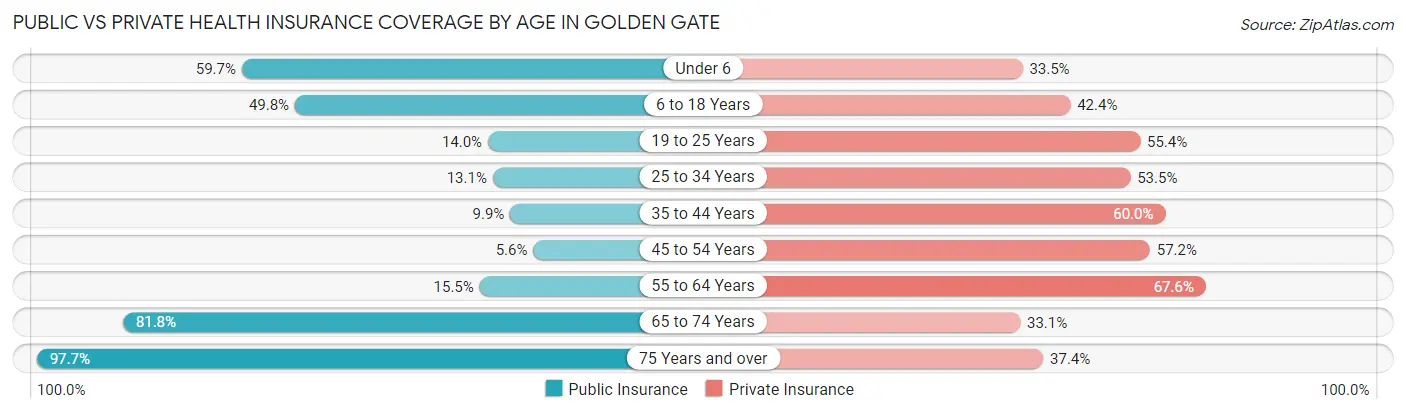
| Age Bracket | Public Insurance | Private Insurance |
| Under 6 | 1,591 (59.7%) | 894 (33.5%) |
| 6 to 18 Years | 2,255 (49.8%) | 1,919 (42.4%) |
| 19 to 25 Years | 536 (14.0%) | 2,119 (55.4%) |
| 25 to 34 Years | 446 (13.1%) | 1,821 (53.5%) |
| 35 to 44 Years | 460 (9.9%) | 2,799 (60.0%) |
| 45 to 54 Years | 250 (5.6%) | 2,561 (57.2%) |
| 55 to 64 Years | 476 (15.5%) | 2,069 (67.5%) |
| 65 to 74 Years | 1,255 (81.8%) | 508 (33.1%) |
| 75 Years and over | 1,211 (97.7%) | 463 (37.4%) |
| Total | 8,480 (28.8%) | 15,153 (51.5%) |
Disability Status by Sex by Age in Golden Gate
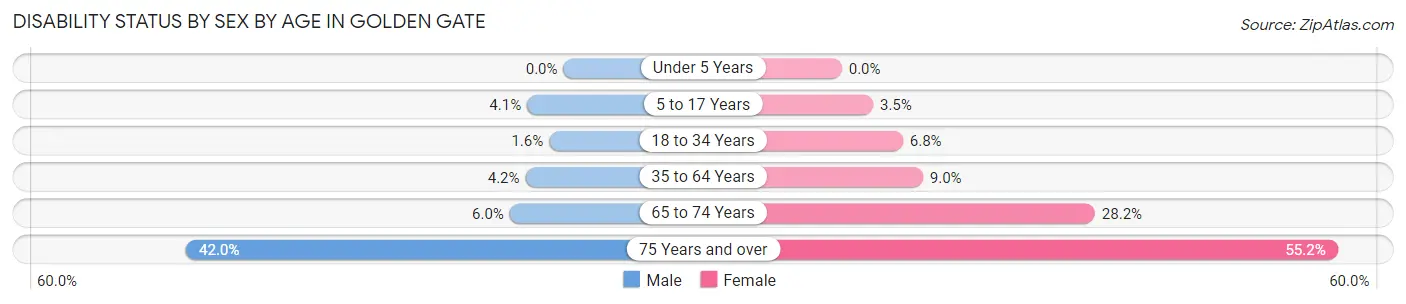
| Age Bracket | Male | Female |
| Under 5 Years | 0 (0.0%) | 0 (0.0%) |
| 5 to 17 Years | 97 (4.1%) | 81 (3.5%) |
| 18 to 34 Years | 63 (1.6%) | 240 (6.8%) |
| 35 to 64 Years | 287 (4.2%) | 489 (9.0%) |
| 65 to 74 Years | 43 (6.0%) | 230 (28.2%) |
| 75 Years and over | 242 (42.0%) | 366 (55.2%) |
Disability Class by Sex by Age in Golden Gate
Disability Class: Hearing Difficulty
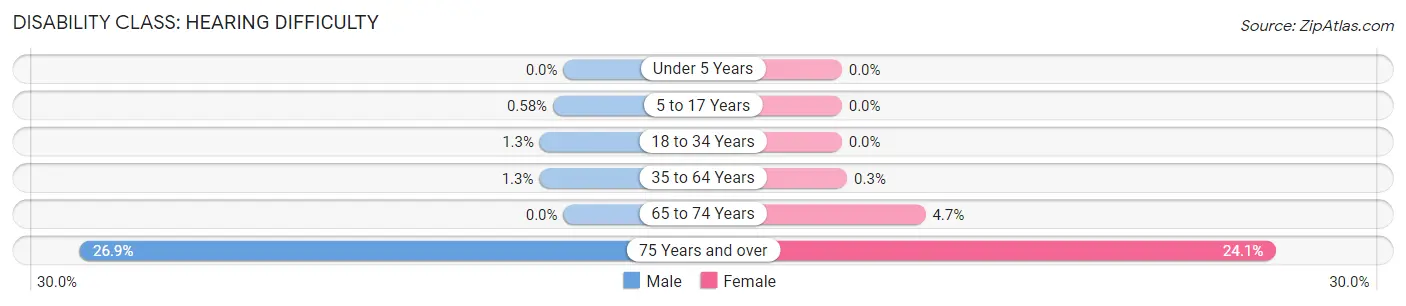
| Age Bracket | Male | Female |
| Under 5 Years | 0 (0.0%) | 0 (0.0%) |
| 5 to 17 Years | 14 (0.6%) | 0 (0.0%) |
| 18 to 34 Years | 52 (1.3%) | 0 (0.0%) |
| 35 to 64 Years | 91 (1.3%) | 16 (0.3%) |
| 65 to 74 Years | 0 (0.0%) | 38 (4.7%) |
| 75 Years and over | 155 (26.9%) | 160 (24.1%) |
Disability Class: Vision Difficulty
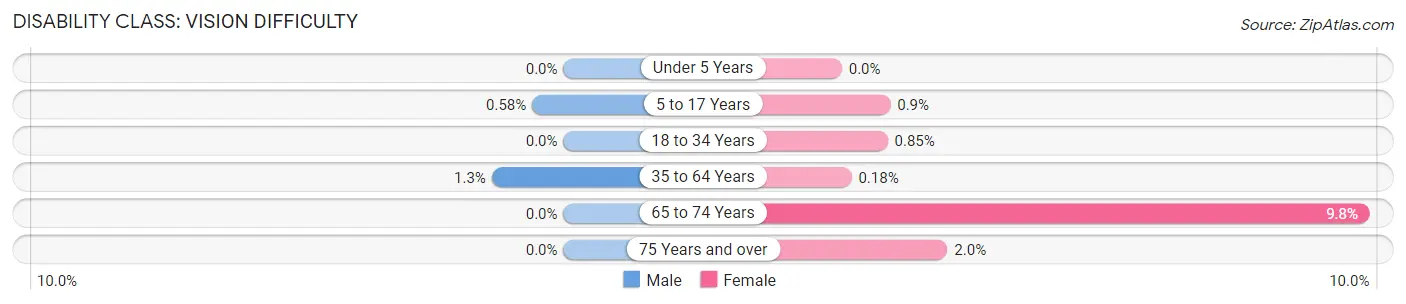
| Age Bracket | Male | Female |
| Under 5 Years | 0 (0.0%) | 0 (0.0%) |
| 5 to 17 Years | 14 (0.6%) | 21 (0.9%) |
| 18 to 34 Years | 0 (0.0%) | 30 (0.9%) |
| 35 to 64 Years | 90 (1.3%) | 10 (0.2%) |
| 65 to 74 Years | 0 (0.0%) | 80 (9.8%) |
| 75 Years and over | 0 (0.0%) | 13 (2.0%) |
Disability Class: Cognitive Difficulty
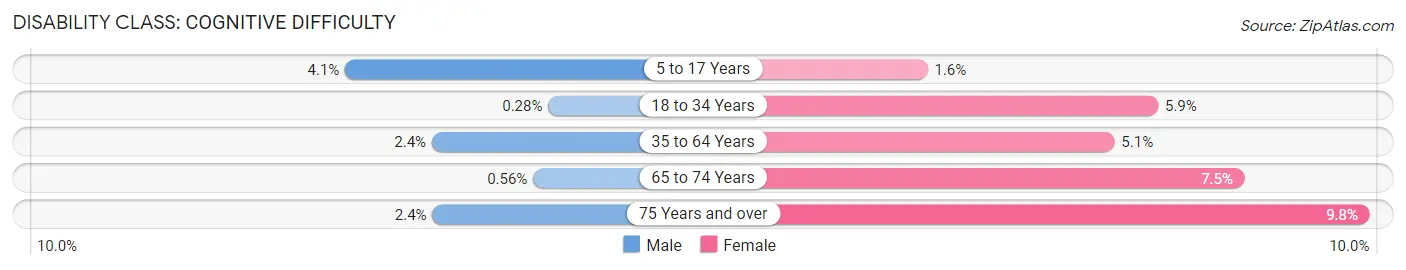
| Age Bracket | Male | Female |
| 5 to 17 Years | 97 (4.1%) | 37 (1.6%) |
| 18 to 34 Years | 11 (0.3%) | 207 (5.9%) |
| 35 to 64 Years | 166 (2.4%) | 274 (5.1%) |
| 65 to 74 Years | 4 (0.6%) | 61 (7.5%) |
| 75 Years and over | 14 (2.4%) | 65 (9.8%) |
Disability Class: Ambulatory Difficulty
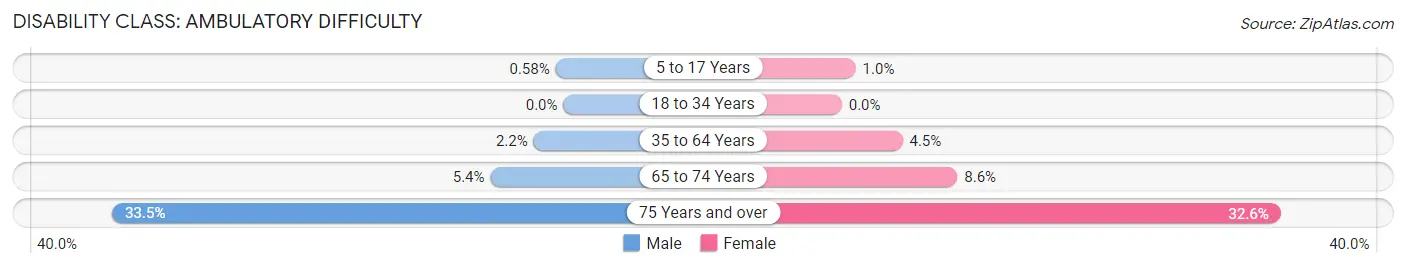
| Age Bracket | Male | Female |
| 5 to 17 Years | 14 (0.6%) | 24 (1.0%) |
| 18 to 34 Years | 0 (0.0%) | 0 (0.0%) |
| 35 to 64 Years | 150 (2.2%) | 244 (4.5%) |
| 65 to 74 Years | 39 (5.4%) | 70 (8.6%) |
| 75 Years and over | 193 (33.5%) | 216 (32.6%) |
Disability Class: Self-Care Difficulty
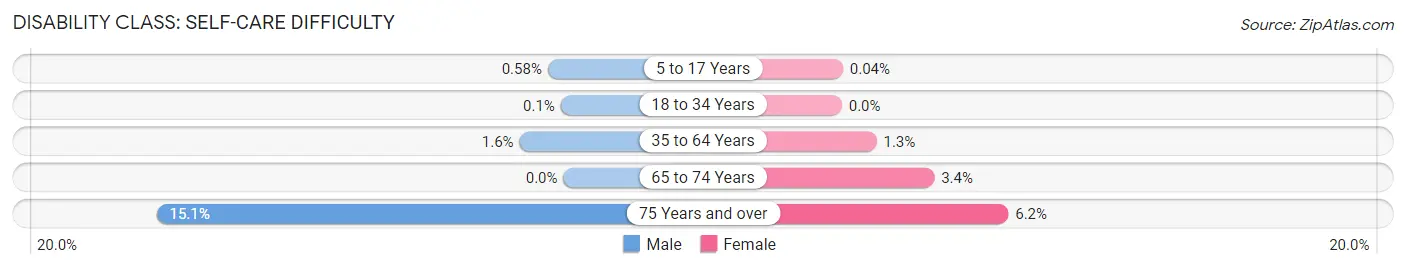
| Age Bracket | Male | Female |
| 5 to 17 Years | 14 (0.6%) | 1 (0.0%) |
| 18 to 34 Years | 4 (0.1%) | 0 (0.0%) |
| 35 to 64 Years | 111 (1.6%) | 70 (1.3%) |
| 65 to 74 Years | 0 (0.0%) | 28 (3.4%) |
| 75 Years and over | 87 (15.1%) | 41 (6.2%) |
Technology Access in Golden Gate
Computing Device Access in Golden Gate
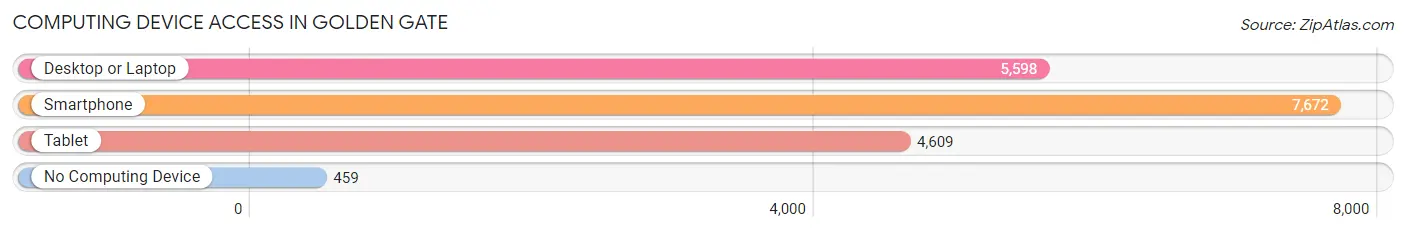
| Device Type | # Households | % Households |
| Desktop or Laptop | 5,598 | 65.6% |
| Smartphone | 7,672 | 89.9% |
| Tablet | 4,609 | 54.0% |
| No Computing Device | 459 | 5.4% |
| Total | 8,538 | 100.0% |
Internet Access in Golden Gate
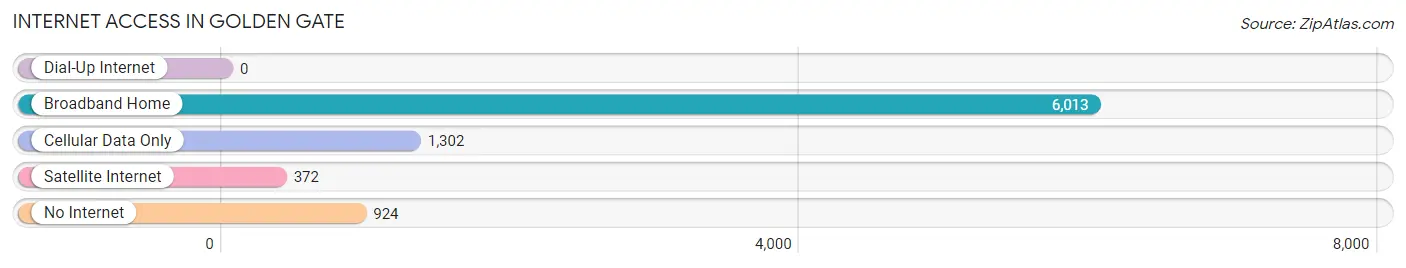
| Internet Type | # Households | % Households |
| Dial-Up Internet | 0 | 0.0% |
| Broadband Home | 6,013 | 70.4% |
| Cellular Data Only | 1,302 | 15.2% |
| Satellite Internet | 372 | 4.4% |
| No Internet | 924 | 10.8% |
| Total | 8,538 | 100.0% |
Golden Gate Summary
Geography
Golden Gate is a census-designated place (CDP) located in Collier County, Florida, United States. It is situated in the southwestern part of the county, approximately 20 miles east of Naples. The CDP has a total area of 4.2 square miles, all of which is land. The terrain is mostly flat, with some areas of low hills. The highest point in the CDP is located at an elevation of 20 feet.
The climate in Golden Gate is classified as humid subtropical, with hot, humid summers and mild winters. The average annual temperature is 75°F, with an average high of 87°F in July and an average low of 63°F in January. The average annual precipitation is 54 inches, with the wettest month being June, when an average of 8.5 inches of rain falls.
History
The area that is now Golden Gate was originally inhabited by the Calusa Indians. The first European settlers arrived in the area in the late 19th century, and the town was officially founded in 1925. The town was named after the Golden Gate Bridge in San Francisco, California, which was built in the same year.
The town grew slowly over the years, and by the 1950s, it had become a popular tourist destination. The town was incorporated in 1959, and the population had grown to over 1,000 by the 1970s.
Economy
The economy of Golden Gate is largely based on tourism. The town is home to several resorts and hotels, as well as a variety of restaurants and shops. The town also has a number of golf courses, which attract visitors from all over the world.
In addition to tourism, Golden Gate is also home to a number of light manufacturing and service businesses. The town is also home to a number of government offices, including the Collier County Sheriff's Office and the Collier County Tax Collector's Office.
Demographics
As of the 2010 census, there were 5,945 people, 2,541 households, and 1,637 families residing in the CDP. The population density was 1,417.3 people per square mile. The racial makeup of the CDP was 87.2% White, 5.2% African American, 0.4% Native American, 1.2% Asian, 0.1% Pacific Islander, 3.7% from other races, and 2.2% from two or more races. Hispanic or Latino of any race were 11.3% of the population.
The median income for a household in the CDP was $41,944, and the median income for a family was $50,917. Males had a median income of $35,938 versus $27,917 for females. The per capita income for the CDP was $20,945. About 8.2% of families and 10.3% of the population were below the poverty line, including 14.2% of those under age 18 and 6.2% of those age 65 or over.
Common Questions
What is Per Capita Income in Golden Gate?
Per Capita income in Golden Gate is $25,610.
What is the Median Family Income in Golden Gate?
Median Family Income in Golden Gate is $68,802.
What is the Median Household income in Golden Gate?
Median Household Income in Golden Gate is $61,905.
What is Income or Wage Gap in Golden Gate?
Income or Wage Gap in Golden Gate is 15.2%.
Women in Golden Gate earn 84.8 cents for every dollar earned by a man.
What is Family Income Deficit in Golden Gate?
Family Income Deficit in Golden Gate is $9,320.
Families that are below poverty line in Golden Gate earn $9,320 less on average than the poverty threshold level.
What is Inequality or Gini Index in Golden Gate?
Inequality or Gini Index in Golden Gate is 0.42.
What is the Total Population of Golden Gate?
Total Population of Golden Gate is 29,400.
What is the Total Male Population of Golden Gate?
Total Male Population of Golden Gate is 15,242.
What is the Total Female Population of Golden Gate?
Total Female Population of Golden Gate is 14,158.
What is the Ratio of Males per 100 Females in Golden Gate?
There are 107.66 Males per 100 Females in Golden Gate.
What is the Ratio of Females per 100 Males in Golden Gate?
There are 92.89 Females per 100 Males in Golden Gate.
What is the Median Population Age in Golden Gate?
Median Population Age in Golden Gate is 35.6 Years.
What is the Average Family Size in Golden Gate
Average Family Size in Golden Gate is 3.9 People.
What is the Average Household Size in Golden Gate
Average Household Size in Golden Gate is 3.4 People.
How Large is the Labor Force in Golden Gate?
There are 16,970 People in the Labor Forcein in Golden Gate.
What is the Percentage of People in the Labor Force in Golden Gate?
72.6% of People are in the Labor Force in Golden Gate.
What is the Unemployment Rate in Golden Gate?
Unemployment Rate in Golden Gate is 4.5%.