Kendall, FL Map & Demographics
Kendall Map
Kendall Overview
$47,981
PER CAPITA INCOME
$106,639
AVG FAMILY INCOME
$84,026
AVG HOUSEHOLD INCOME
11.6%
WAGE / INCOME GAP [ % ]
88.4¢/ $1
WAGE / INCOME GAP [ $ ]
$8,594
FAMILY INCOME DEFICIT
0.49
INEQUALITY / GINI INDEX
78,402
TOTAL POPULATION
37,214
MALE POPULATION
41,188
FEMALE POPULATION
90.35
MALES / 100 FEMALES
110.68
FEMALES / 100 MALES
42.0
MEDIAN AGE
3.1
AVG FAMILY SIZE
2.6
AVG HOUSEHOLD SIZE
42,296
LABOR FORCE [ PEOPLE ]
65.1%
PERCENT IN LABOR FORCE
3.2%
UNEMPLOYMENT RATE
Income in Kendall
Income Overview in Kendall
Per Capita Income in Kendall is $47,981, while median incomes of families and households are $106,639 and $84,026 respectively.
| Characteristic | Number | Measure |
| Per Capita Income | 78,402 | $47,981 |
| Median Family Income | 20,074 | $106,639 |
| Mean Family Income | 20,074 | $147,406 |
| Median Household Income | 29,810 | $84,026 |
| Mean Household Income | 29,810 | $124,217 |
| Income Deficit | 20,074 | $8,594 |
| Wage / Income Gap (%) | 78,402 | 11.58% |
| Wage / Income Gap ($) | 78,402 | 88.42¢ per $1 |
| Gini / Inequality Index | 78,402 | 0.49 |
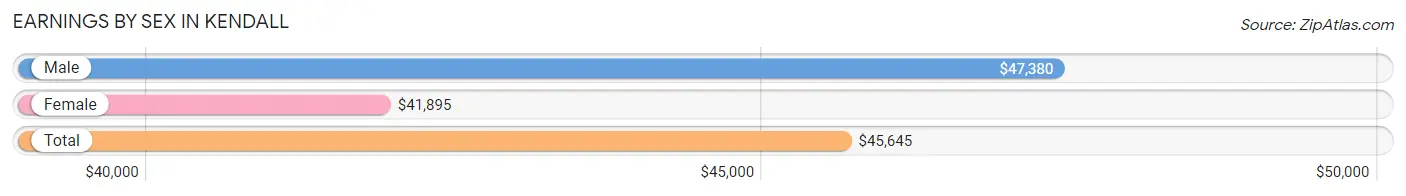
Earnings by Sex in Kendall
Average Earnings in Kendall are $45,645, $47,380 for men and $41,895 for women, a difference of 11.6%.
| Sex | Number | Average Earnings |
| Male | 22,443 (51.5%) | $47,380 |
| Female | 21,145 (48.5%) | $41,895 |
| Total | 43,588 (100.0%) | $45,645 |
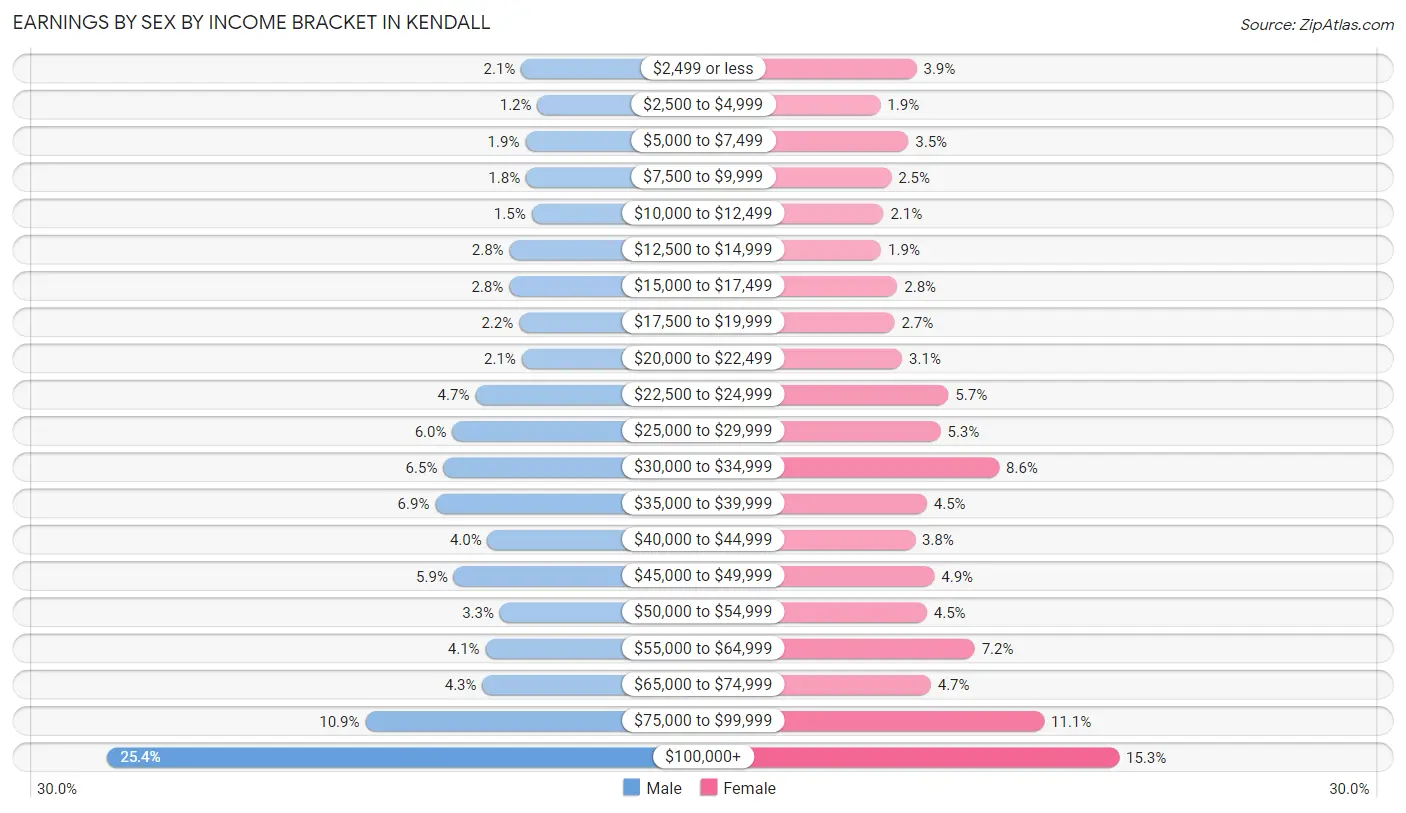
Earnings by Sex by Income Bracket in Kendall
The most common earnings brackets in Kendall are $100,000+ for men (5,690 | 25.4%) and $100,000+ for women (3,236 | 15.3%).
| Income | Male | Female |
| $2,499 or less | 470 (2.1%) | 829 (3.9%) |
| $2,500 to $4,999 | 265 (1.2%) | 400 (1.9%) |
| $5,000 to $7,499 | 417 (1.9%) | 731 (3.5%) |
| $7,500 to $9,999 | 409 (1.8%) | 529 (2.5%) |
| $10,000 to $12,499 | 340 (1.5%) | 435 (2.1%) |
| $12,500 to $14,999 | 617 (2.8%) | 409 (1.9%) |
| $15,000 to $17,499 | 621 (2.8%) | 600 (2.8%) |
| $17,500 to $19,999 | 497 (2.2%) | 567 (2.7%) |
| $20,000 to $22,499 | 462 (2.1%) | 657 (3.1%) |
| $22,500 to $24,999 | 1,048 (4.7%) | 1,208 (5.7%) |
| $25,000 to $29,999 | 1,337 (6.0%) | 1,115 (5.3%) |
| $30,000 to $34,999 | 1,451 (6.5%) | 1,811 (8.6%) |
| $35,000 to $39,999 | 1,554 (6.9%) | 951 (4.5%) |
| $40,000 to $44,999 | 894 (4.0%) | 809 (3.8%) |
| $45,000 to $49,999 | 1,319 (5.9%) | 1,041 (4.9%) |
| $50,000 to $54,999 | 738 (3.3%) | 951 (4.5%) |
| $55,000 to $64,999 | 921 (4.1%) | 1,521 (7.2%) |
| $65,000 to $74,999 | 958 (4.3%) | 999 (4.7%) |
| $75,000 to $99,999 | 2,435 (10.8%) | 2,346 (11.1%) |
| $100,000+ | 5,690 (25.4%) | 3,236 (15.3%) |
| Total | 22,443 (100.0%) | 21,145 (100.0%) |
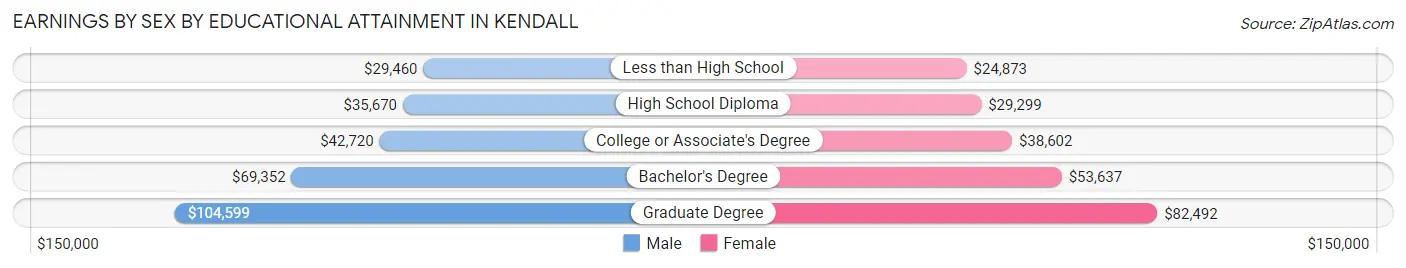
Earnings by Sex by Educational Attainment in Kendall
Average earnings in Kendall are $51,461 for men and $46,800 for women, a difference of 9.1%. Men with an educational attainment of graduate degree enjoy the highest average annual earnings of $104,599, while those with less than high school education earn the least with $29,460. Women with an educational attainment of graduate degree earn the most with the average annual earnings of $82,492, while those with less than high school education have the smallest earnings of $24,873.
| Educational Attainment | Male Income | Female Income |
| Less than High School | $29,460 | $24,873 |
| High School Diploma | $35,670 | $29,299 |
| College or Associate's Degree | $42,720 | $38,602 |
| Bachelor's Degree | $69,352 | $53,637 |
| Graduate Degree | $104,599 | $82,492 |
| Total | $51,461 | $46,800 |
Family Income in Kendall
Family Income Brackets in Kendall
According to the Kendall family income data, there are 4,617 families falling into the $200,000+ income range, which is the most common income bracket and makes up 23.0% of all families. Conversely, the $10,000 to $14,999 income bracket is the least frequent group with only 161 families (0.8%) belonging to this category.
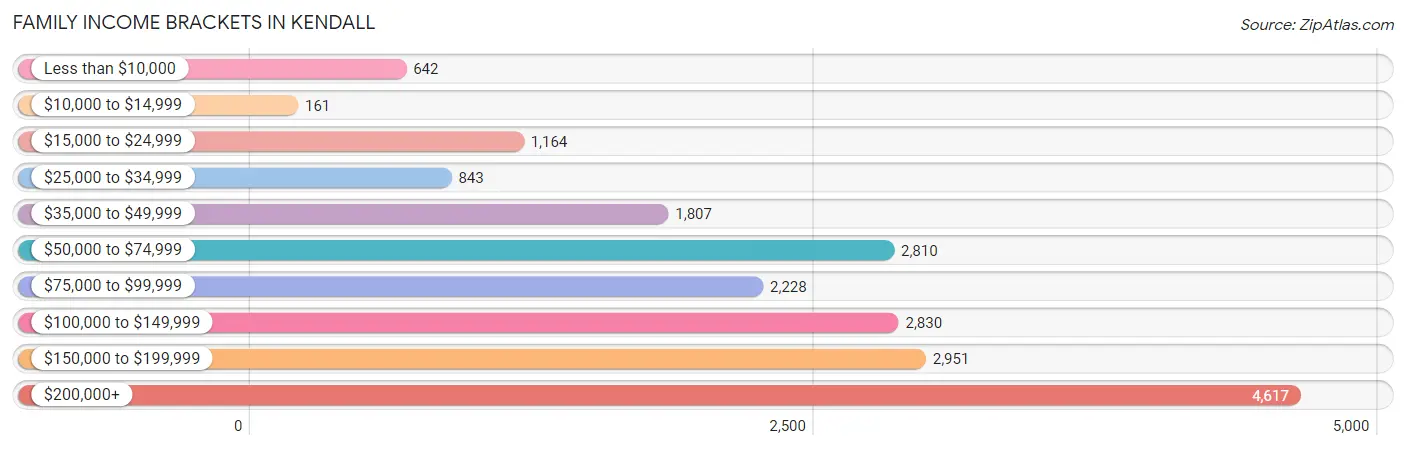
| Income Bracket | # Families | % Families |
| Less than $10,000 | 642 | 3.2% |
| $10,000 to $14,999 | 161 | 0.8% |
| $15,000 to $24,999 | 1,164 | 5.8% |
| $25,000 to $34,999 | 843 | 4.2% |
| $35,000 to $49,999 | 1,807 | 9.0% |
| $50,000 to $74,999 | 2,810 | 14.0% |
| $75,000 to $99,999 | 2,228 | 11.1% |
| $100,000 to $149,999 | 2,830 | 14.1% |
| $150,000 to $199,999 | 2,951 | 14.7% |
| $200,000+ | 4,617 | 23.0% |
Family Income by Famaliy Size in Kendall
7+ person families (114 | 0.6%) account for the highest median family income in Kendall with $197,000 per family, while 2-person families (9,164 | 45.7%) have the highest median income of $46,260 per family member.
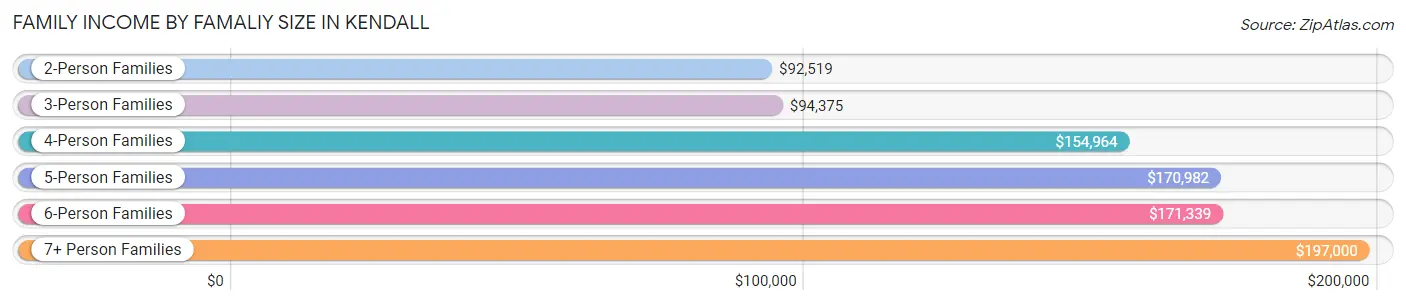
| Income Bracket | # Families | Median Income |
| 2-Person Families | 9,164 (45.7%) | $92,519 |
| 3-Person Families | 5,171 (25.8%) | $94,375 |
| 4-Person Families | 4,301 (21.4%) | $154,964 |
| 5-Person Families | 1,149 (5.7%) | $170,982 |
| 6-Person Families | 175 (0.9%) | $171,339 |
| 7+ Person Families | 114 (0.6%) | $197,000 |
| Total | 20,074 (100.0%) | $106,639 |
Family Income by Number of Earners in Kendall
The median family income in Kendall is $106,639, with families comprising 3+ earners (2,535) having the highest median family income of $164,650, while families with no earners (2,135) have the lowest median family income of $30,466, accounting for 12.6% and 10.6% of families, respectively.
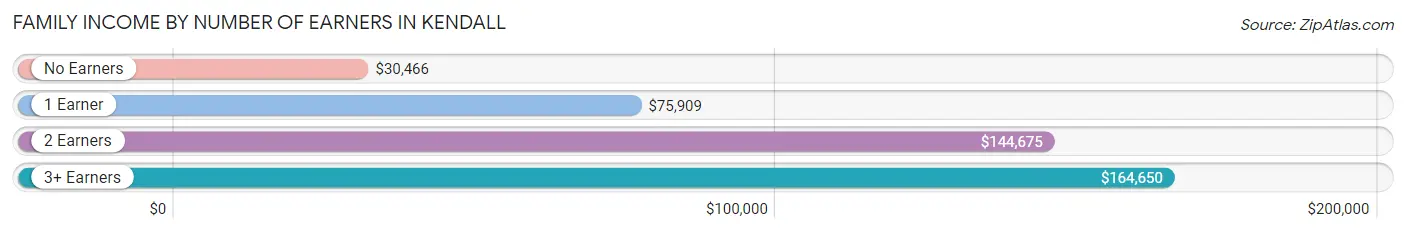
| Number of Earners | # Families | Median Income |
| No Earners | 2,135 (10.6%) | $30,466 |
| 1 Earner | 6,166 (30.7%) | $75,909 |
| 2 Earners | 9,238 (46.0%) | $144,675 |
| 3+ Earners | 2,535 (12.6%) | $164,650 |
| Total | 20,074 (100.0%) | $106,639 |
Household Income in Kendall
Household Income Brackets in Kendall
With 5,127 households falling in the category, the $200,000+ income range is the most frequent in Kendall, accounting for 17.2% of all households. In contrast, only 954 households (3.2%) fall into the $10,000 to $14,999 income bracket, making it the least populous group.
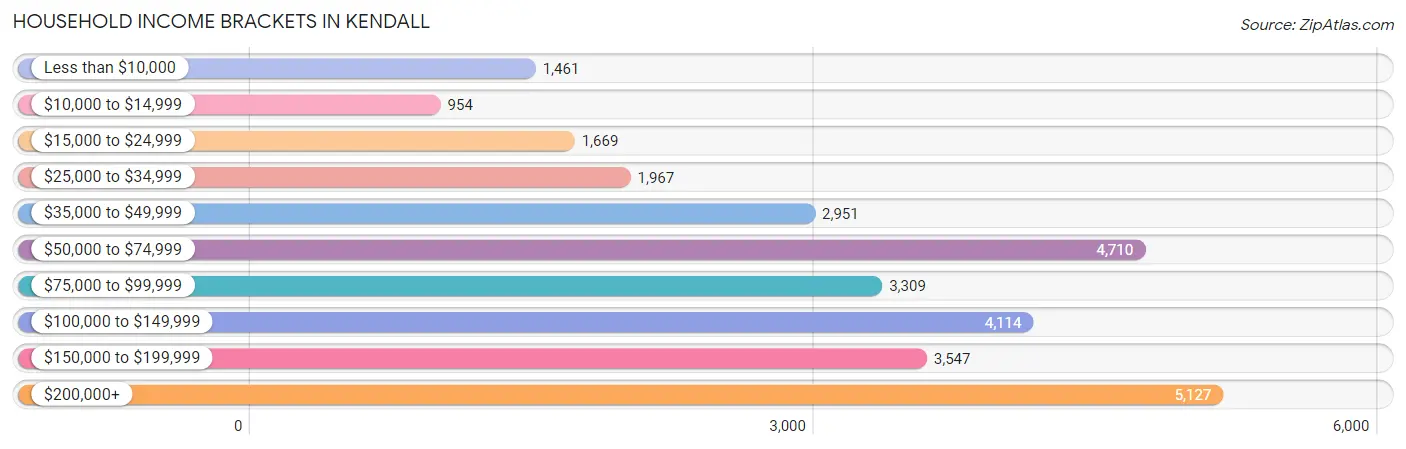
| Income Bracket | # Households | % Households |
| Less than $10,000 | 1,461 | 4.9% |
| $10,000 to $14,999 | 954 | 3.2% |
| $15,000 to $24,999 | 1,669 | 5.6% |
| $25,000 to $34,999 | 1,967 | 6.6% |
| $35,000 to $49,999 | 2,951 | 9.9% |
| $50,000 to $74,999 | 4,710 | 15.8% |
| $75,000 to $99,999 | 3,309 | 11.1% |
| $100,000 to $149,999 | 4,114 | 13.8% |
| $150,000 to $199,999 | 3,547 | 11.9% |
| $200,000+ | 5,127 | 17.2% |
Household Income by Householder Age in Kendall
The median household income in Kendall is $84,026, with the highest median household income of $101,117 found in the 45 to 64 years age bracket for the primary householder. A total of 11,690 households (39.2%) fall into this category. Meanwhile, the 65+ years age bracket for the primary householder has the lowest median household income of $51,667, with 8,396 households (28.2%) in this group.
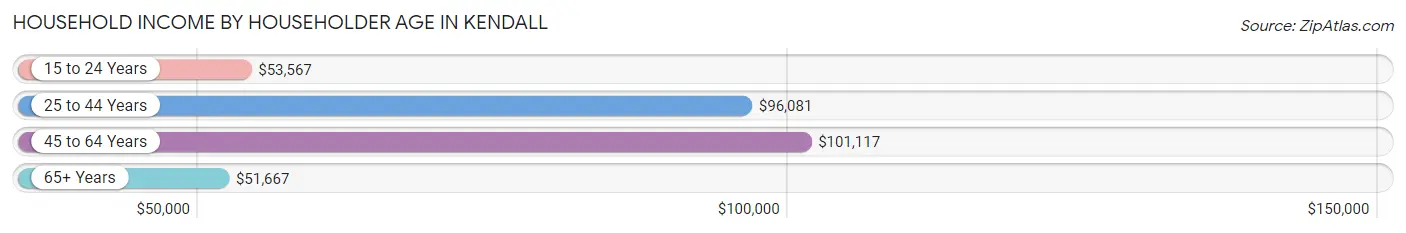
| Income Bracket | # Households | Median Income |
| 15 to 24 Years | 805 (2.7%) | $53,567 |
| 25 to 44 Years | 8,919 (29.9%) | $96,081 |
| 45 to 64 Years | 11,690 (39.2%) | $101,117 |
| 65+ Years | 8,396 (28.2%) | $51,667 |
| Total | 29,810 (100.0%) | $84,026 |
Poverty in Kendall
Income Below Poverty by Sex and Age in Kendall
With 10.1% poverty level for males and 11.6% for females among the residents of Kendall, 15 year old males and 16 and 17 year old females are the most vulnerable to poverty, with 450 males (68.9%) and 549 females (40.9%) in their respective age groups living below the poverty level.
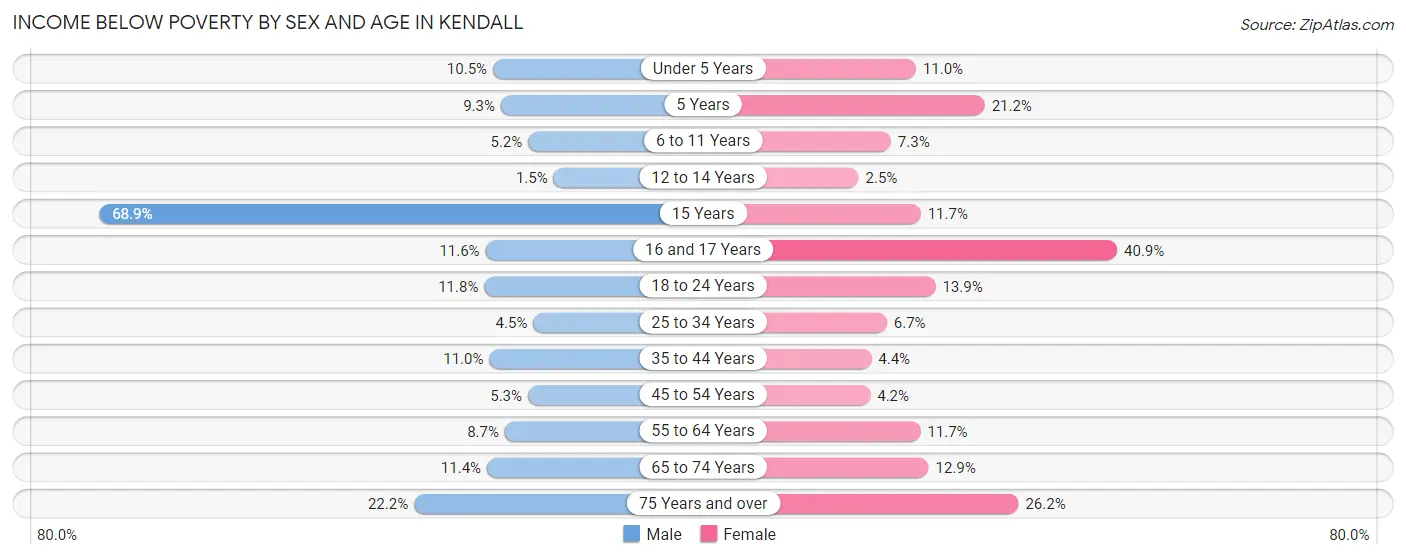
| Age Bracket | Male | Female |
| Under 5 Years | 195 (10.5%) | 220 (11.0%) |
| 5 Years | 38 (9.3%) | 52 (21.2%) |
| 6 to 11 Years | 108 (5.2%) | 179 (7.3%) |
| 12 to 14 Years | 21 (1.5%) | 29 (2.5%) |
| 15 Years | 450 (68.9%) | 47 (11.7%) |
| 16 and 17 Years | 106 (11.6%) | 549 (40.9%) |
| 18 to 24 Years | 339 (11.7%) | 386 (13.9%) |
| 25 to 34 Years | 263 (4.5%) | 319 (6.7%) |
| 35 to 44 Years | 556 (11.0%) | 223 (4.4%) |
| 45 to 54 Years | 243 (5.3%) | 226 (4.2%) |
| 55 to 64 Years | 444 (8.7%) | 704 (11.7%) |
| 65 to 74 Years | 362 (11.4%) | 546 (12.9%) |
| 75 Years and over | 575 (22.2%) | 1,226 (26.2%) |
| Total | 3,700 (10.1%) | 4,706 (11.6%) |
Income Above Poverty by Sex and Age in Kendall
According to the poverty statistics in Kendall, males aged 12 to 14 years and females aged 12 to 14 years are the age groups that are most secure financially, with 98.5% of males and 97.5% of females in these age groups living above the poverty line.
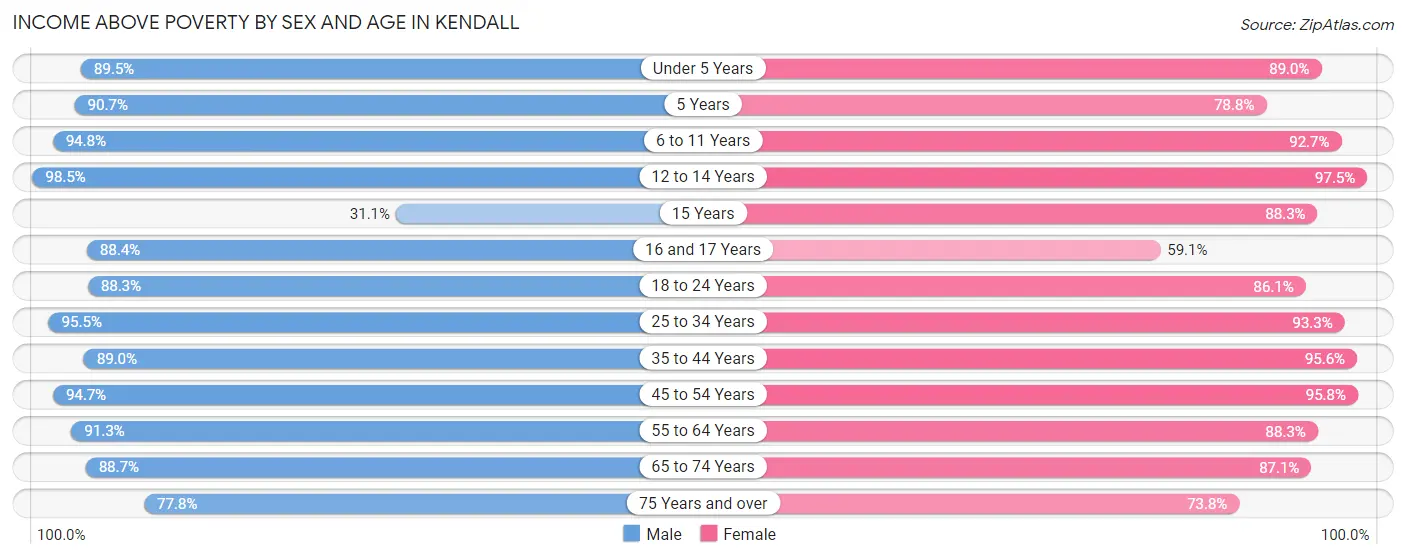
| Age Bracket | Male | Female |
| Under 5 Years | 1,670 (89.5%) | 1,778 (89.0%) |
| 5 Years | 371 (90.7%) | 193 (78.8%) |
| 6 to 11 Years | 1,958 (94.8%) | 2,278 (92.7%) |
| 12 to 14 Years | 1,419 (98.5%) | 1,137 (97.5%) |
| 15 Years | 203 (31.1%) | 354 (88.3%) |
| 16 and 17 Years | 810 (88.4%) | 794 (59.1%) |
| 18 to 24 Years | 2,546 (88.2%) | 2,388 (86.1%) |
| 25 to 34 Years | 5,616 (95.5%) | 4,450 (93.3%) |
| 35 to 44 Years | 4,498 (89.0%) | 4,851 (95.6%) |
| 45 to 54 Years | 4,369 (94.7%) | 5,122 (95.8%) |
| 55 to 64 Years | 4,667 (91.3%) | 5,321 (88.3%) |
| 65 to 74 Years | 2,827 (88.6%) | 3,694 (87.1%) |
| 75 Years and over | 2,018 (77.8%) | 3,447 (73.8%) |
| Total | 32,972 (89.9%) | 35,807 (88.4%) |
Income Below Poverty Among Married-Couple Families in Kendall
The poverty statistics for married-couple families in Kendall show that 5.4% or 776 of the total 14,401 families live below the poverty line. Families with no children have the highest poverty rate of 6.2%, comprising of 553 families. On the other hand, families with 5 or more children have the lowest poverty rate of 0.0%, which includes 0 families.
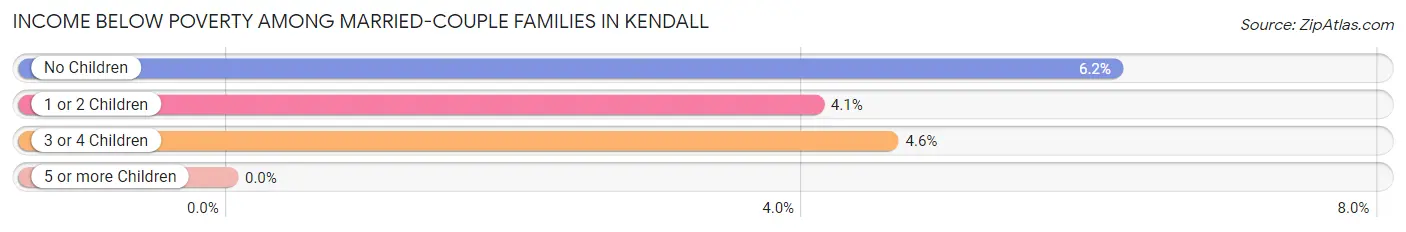
| Children | Above Poverty | Below Poverty |
| No Children | 8,426 (93.8%) | 553 (6.2%) |
| 1 or 2 Children | 4,634 (95.9%) | 197 (4.1%) |
| 3 or 4 Children | 539 (95.4%) | 26 (4.6%) |
| 5 or more Children | 26 (100.0%) | 0 (0.0%) |
| Total | 13,625 (94.6%) | 776 (5.4%) |
Income Below Poverty Among Single-Parent Households in Kendall
According to the poverty data in Kendall, 20.8% or 291 single-father households and 12.0% or 514 single-mother households are living below the poverty line. Among single-father households, those with 1 or 2 children have the highest poverty rate, with 280 households (49.8%) experiencing poverty. Likewise, among single-mother households, those with 1 or 2 children have the highest poverty rate, with 420 households (22.2%) falling below the poverty line.
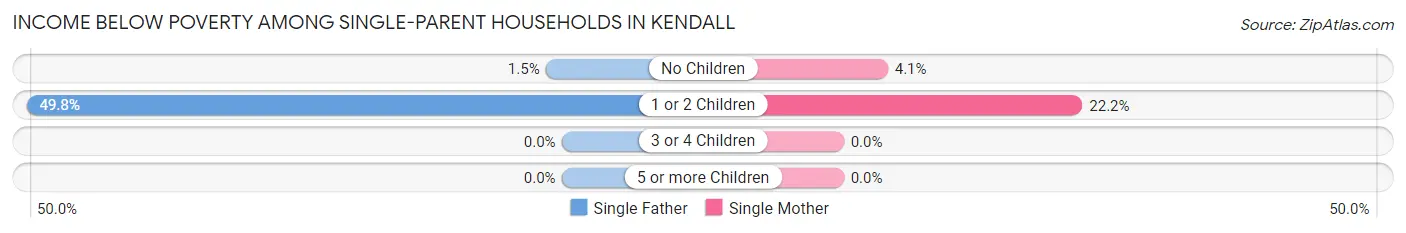
| Children | Single Father | Single Mother |
| No Children | 11 (1.5%) | 94 (4.1%) |
| 1 or 2 Children | 280 (49.8%) | 420 (22.2%) |
| 3 or 4 Children | 0 (0.0%) | 0 (0.0%) |
| 5 or more Children | 0 (0.0%) | 0 (0.0%) |
| Total | 291 (20.8%) | 514 (12.0%) |
Income Below Poverty Among Married-Couple vs Single-Parent Households in Kendall
The poverty data for Kendall shows that 776 of the married-couple family households (5.4%) and 805 of the single-parent households (14.2%) are living below the poverty level. Within the married-couple family households, those with no children have the highest poverty rate, with 553 households (6.2%) falling below the poverty line. Among the single-parent households, those with 1 or 2 children have the highest poverty rate, with 700 household (28.6%) living below poverty.
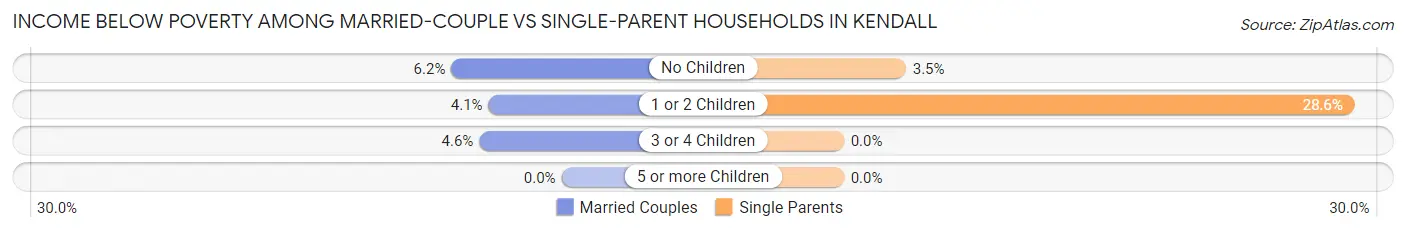
| Children | Married-Couple Families | Single-Parent Households |
| No Children | 553 (6.2%) | 105 (3.5%) |
| 1 or 2 Children | 197 (4.1%) | 700 (28.6%) |
| 3 or 4 Children | 26 (4.6%) | 0 (0.0%) |
| 5 or more Children | 0 (0.0%) | 0 (0.0%) |
| Total | 776 (5.4%) | 805 (14.2%) |
Race in Kendall
The most populous races in Kendall are Hispanic or Latino (51,811 | 66.1%), White / Caucasian (46,028 | 58.7%), and Two or more Races (22,144 | 28.2%).
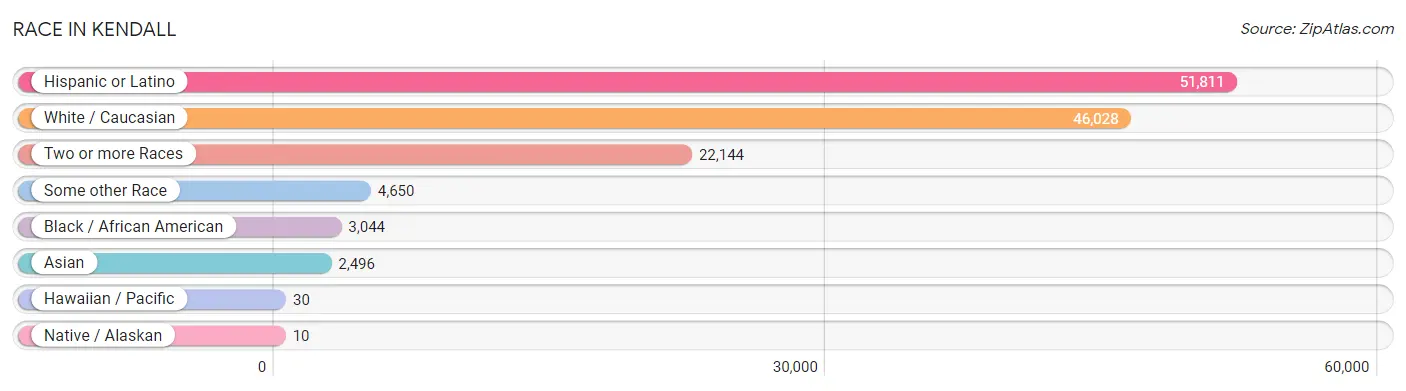
| Race | # Population | % Population |
| Asian | 2,496 | 3.2% |
| Black / African American | 3,044 | 3.9% |
| Hawaiian / Pacific | 30 | 0.0% |
| Hispanic or Latino | 51,811 | 66.1% |
| Native / Alaskan | 10 | 0.0% |
| White / Caucasian | 46,028 | 58.7% |
| Two or more Races | 22,144 | 28.2% |
| Some other Race | 4,650 | 5.9% |
| Total | 78,402 | 100.0% |
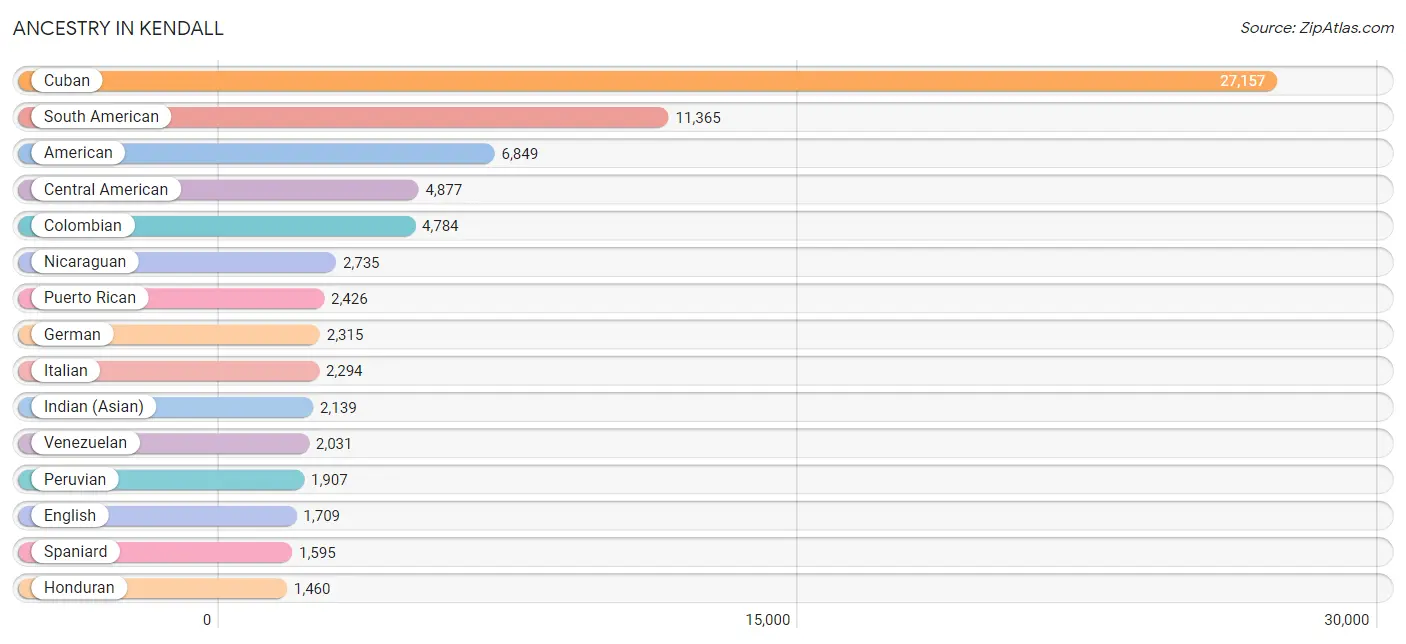
Ancestry in Kendall
The most populous ancestries reported in Kendall are Cuban (27,157 | 34.6%), South American (11,365 | 14.5%), American (6,849 | 8.7%), Central American (4,877 | 6.2%), and Colombian (4,784 | 6.1%), together accounting for 70.2% of all Kendall residents.
| Ancestry | # Population | % Population |
| African | 48 | 0.1% |
| Albanian | 10 | 0.0% |
| American | 6,849 | 8.7% |
| Arab | 1,012 | 1.3% |
| Argentinean | 975 | 1.2% |
| Armenian | 12 | 0.0% |
| Australian | 11 | 0.0% |
| Austrian | 124 | 0.2% |
| Bahamian | 32 | 0.0% |
| Barbadian | 10 | 0.0% |
| Basque | 86 | 0.1% |
| Belgian | 132 | 0.2% |
| Bermudan | 33 | 0.0% |
| Bhutanese | 215 | 0.3% |
| Bolivian | 346 | 0.4% |
| Brazilian | 413 | 0.5% |
| British | 281 | 0.4% |
| British West Indian | 90 | 0.1% |
| Bulgarian | 78 | 0.1% |
| Burmese | 38 | 0.1% |
| Canadian | 52 | 0.1% |
| Celtic | 9 | 0.0% |
| Central American | 4,877 | 6.2% |
| Central American Indian | 58 | 0.1% |
| Cherokee | 85 | 0.1% |
| Chilean | 402 | 0.5% |
| Colombian | 4,784 | 6.1% |
| Costa Rican | 205 | 0.3% |
| Croatian | 16 | 0.0% |
| Cuban | 27,157 | 34.6% |
| Czech | 28 | 0.0% |
| Czechoslovakian | 50 | 0.1% |
| Danish | 161 | 0.2% |
| Dominican | 1,456 | 1.9% |
| Dutch | 218 | 0.3% |
| Dutch West Indian | 4 | 0.0% |
| Eastern European | 546 | 0.7% |
| Ecuadorian | 766 | 1.0% |
| English | 1,709 | 2.2% |
| European | 249 | 0.3% |
| Filipino | 111 | 0.1% |
| Finnish | 77 | 0.1% |
| French | 1,079 | 1.4% |
| French Canadian | 132 | 0.2% |
| German | 2,315 | 2.9% |
| Greek | 254 | 0.3% |
| Guatemalan | 74 | 0.1% |
| Guyanese | 39 | 0.1% |
| Haitian | 270 | 0.3% |
| Honduran | 1,460 | 1.9% |
| Hungarian | 154 | 0.2% |
| Icelander | 56 | 0.1% |
| Indian (Asian) | 2,139 | 2.7% |
| Iranian | 374 | 0.5% |
| Irish | 1,429 | 1.8% |
| Israeli | 44 | 0.1% |
| Italian | 2,294 | 2.9% |
| Jamaican | 805 | 1.0% |
| Kenyan | 20 | 0.0% |
| Korean | 98 | 0.1% |
| Latvian | 10 | 0.0% |
| Lebanese | 876 | 1.1% |
| Lithuanian | 77 | 0.1% |
| Mexican | 1,323 | 1.7% |
| Mexican American Indian | 84 | 0.1% |
| Moroccan | 6 | 0.0% |
| New Zealander | 24 | 0.0% |
| Nicaraguan | 2,735 | 3.5% |
| Northern European | 23 | 0.0% |
| Norwegian | 278 | 0.4% |
| Pakistani | 147 | 0.2% |
| Palestinian | 33 | 0.0% |
| Panamanian | 165 | 0.2% |
| Paraguayan | 84 | 0.1% |
| Peruvian | 1,907 | 2.4% |
| Polish | 1,029 | 1.3% |
| Portuguese | 187 | 0.2% |
| Puerto Rican | 2,426 | 3.1% |
| Romanian | 172 | 0.2% |
| Russian | 892 | 1.1% |
| Salvadoran | 238 | 0.3% |
| Samoan | 30 | 0.0% |
| Scandinavian | 34 | 0.0% |
| Scotch-Irish | 35 | 0.0% |
| Scottish | 367 | 0.5% |
| Serbian | 13 | 0.0% |
| Slavic | 6 | 0.0% |
| Slovak | 68 | 0.1% |
| South African | 21 | 0.0% |
| South American | 11,365 | 14.5% |
| South American Indian | 57 | 0.1% |
| Spaniard | 1,595 | 2.0% |
| Spanish | 55 | 0.1% |
| Sri Lankan | 202 | 0.3% |
| Subsaharan African | 133 | 0.2% |
| Swedish | 271 | 0.4% |
| Swiss | 73 | 0.1% |
| Syrian | 37 | 0.1% |
| Thai | 606 | 0.8% |
| Trinidadian and Tobagonian | 131 | 0.2% |
| Turkish | 58 | 0.1% |
| U.S. Virgin Islander | 17 | 0.0% |
| Ukrainian | 214 | 0.3% |
| Uruguayan | 70 | 0.1% |
| Venezuelan | 2,031 | 2.6% |
| Welsh | 49 | 0.1% |
| West Indian | 41 | 0.1% | View All 107 Rows |
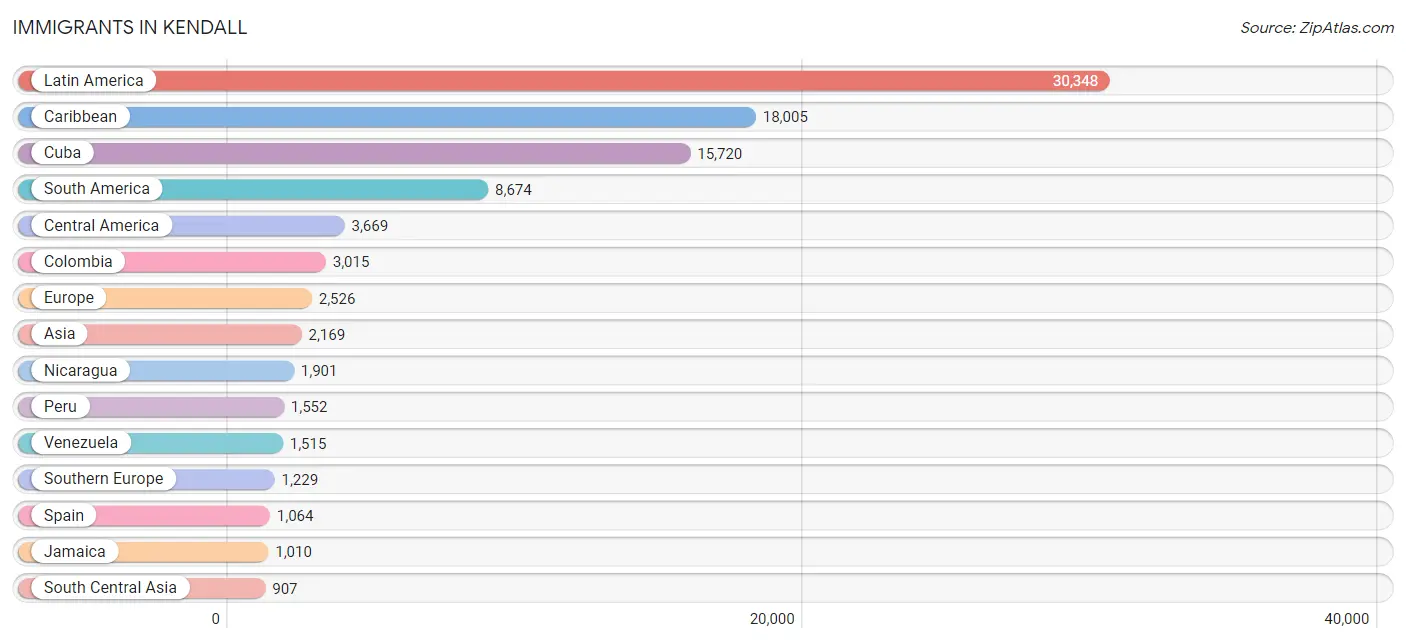
Immigrants in Kendall
The most numerous immigrant groups reported in Kendall came from Latin America (30,348 | 38.7%), Caribbean (18,005 | 23.0%), Cuba (15,720 | 20.1%), South America (8,674 | 11.1%), and Central America (3,669 | 4.7%), together accounting for 97.5% of all Kendall residents.
| Immigration Origin | # Population | % Population |
| Africa | 53 | 0.1% |
| Albania | 10 | 0.0% |
| Argentina | 606 | 0.8% |
| Asia | 2,169 | 2.8% |
| Australia | 5 | 0.0% |
| Austria | 11 | 0.0% |
| Bahamas | 44 | 0.1% |
| Barbados | 10 | 0.0% |
| Belarus | 5 | 0.0% |
| Belgium | 11 | 0.0% |
| Bolivia | 452 | 0.6% |
| Brazil | 455 | 0.6% |
| Bulgaria | 62 | 0.1% |
| Canada | 123 | 0.2% |
| Caribbean | 18,005 | 23.0% |
| Central America | 3,669 | 4.7% |
| Chile | 272 | 0.4% |
| China | 732 | 0.9% |
| Colombia | 3,015 | 3.8% |
| Costa Rica | 126 | 0.2% |
| Cuba | 15,720 | 20.1% |
| Denmark | 25 | 0.0% |
| Dominican Republic | 742 | 0.9% |
| Eastern Africa | 34 | 0.0% |
| Eastern Asia | 825 | 1.1% |
| Eastern Europe | 613 | 0.8% |
| Ecuador | 617 | 0.8% |
| El Salvador | 102 | 0.1% |
| Europe | 2,526 | 3.2% |
| France | 334 | 0.4% |
| Germany | 115 | 0.2% |
| Greece | 41 | 0.1% |
| Guatemala | 21 | 0.0% |
| Guyana | 66 | 0.1% |
| Haiti | 205 | 0.3% |
| Honduras | 637 | 0.8% |
| Hong Kong | 31 | 0.0% |
| Hungary | 14 | 0.0% |
| India | 547 | 0.7% |
| Indonesia | 8 | 0.0% |
| Iran | 223 | 0.3% |
| Iraq | 11 | 0.0% |
| Ireland | 50 | 0.1% |
| Israel | 13 | 0.0% |
| Italy | 103 | 0.1% |
| Jamaica | 1,010 | 1.3% |
| Japan | 79 | 0.1% |
| Kenya | 20 | 0.0% |
| Korea | 14 | 0.0% |
| Laos | 24 | 0.0% |
| Latin America | 30,348 | 38.7% |
| Latvia | 10 | 0.0% |
| Lebanon | 110 | 0.1% |
| Mexico | 759 | 1.0% |
| Morocco | 6 | 0.0% |
| Netherlands | 39 | 0.1% |
| Nicaragua | 1,901 | 2.4% |
| Nigeria | 2 | 0.0% |
| Northern Africa | 7 | 0.0% |
| Northern Europe | 154 | 0.2% |
| Oceania | 87 | 0.1% |
| Pakistan | 137 | 0.2% |
| Panama | 123 | 0.2% |
| Peru | 1,552 | 2.0% |
| Philippines | 72 | 0.1% |
| Poland | 55 | 0.1% |
| Portugal | 21 | 0.0% |
| Romania | 48 | 0.1% |
| Russia | 323 | 0.4% |
| Saudi Arabia | 100 | 0.1% |
| Scotland | 29 | 0.0% |
| Singapore | 49 | 0.1% |
| South Africa | 10 | 0.0% |
| South America | 8,674 | 11.1% |
| South Central Asia | 907 | 1.2% |
| South Eastern Asia | 191 | 0.2% |
| Southern Europe | 1,229 | 1.6% |
| Spain | 1,064 | 1.4% |
| Sweden | 12 | 0.0% |
| Switzerland | 20 | 0.0% |
| Taiwan | 54 | 0.1% |
| Thailand | 10 | 0.0% |
| Trinidad and Tobago | 179 | 0.2% |
| Turkey | 12 | 0.0% |
| Ukraine | 86 | 0.1% |
| Uruguay | 80 | 0.1% |
| Venezuela | 1,515 | 1.9% |
| Vietnam | 28 | 0.0% |
| Western Africa | 2 | 0.0% |
| Western Asia | 246 | 0.3% |
| Western Europe | 530 | 0.7% |
| Zimbabwe | 14 | 0.0% | View All 92 Rows |
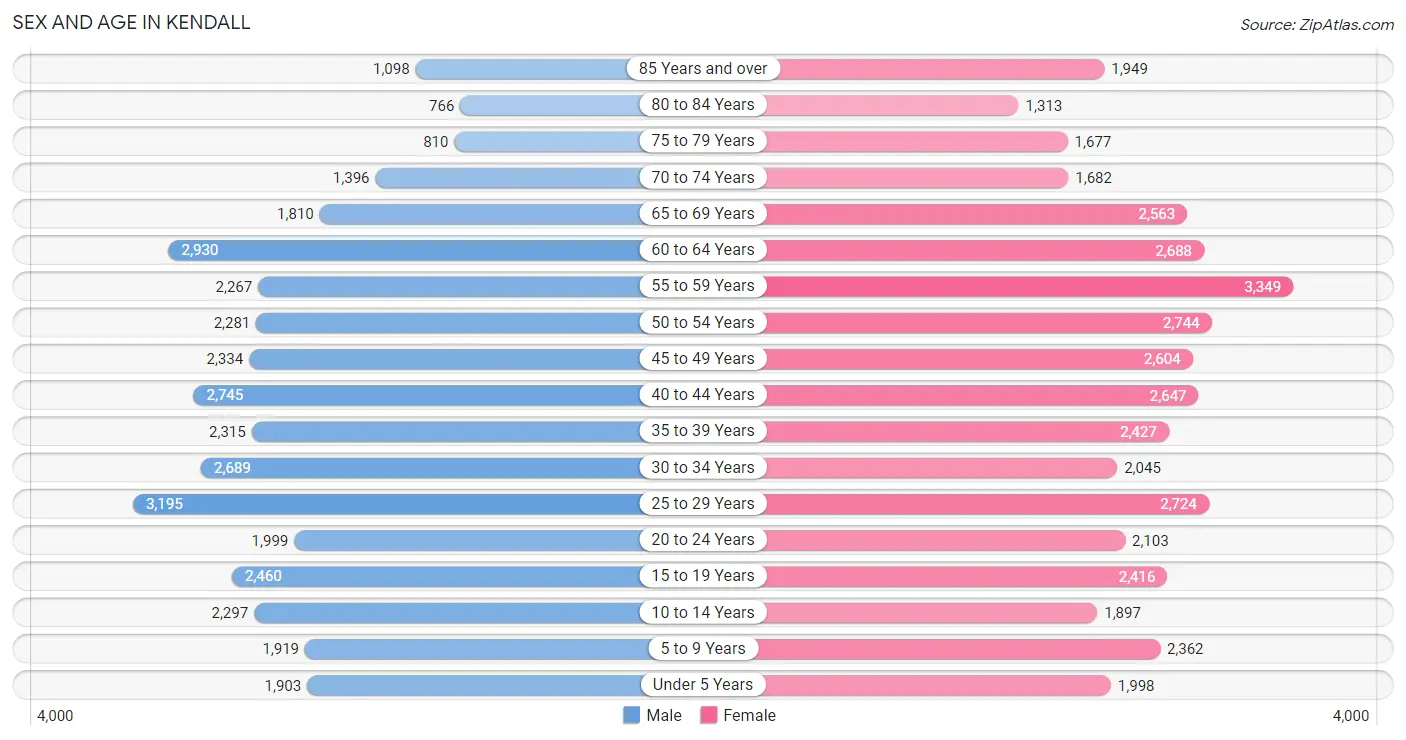
Sex and Age in Kendall
Sex and Age in Kendall
The most populous age groups in Kendall are 25 to 29 Years (3,195 | 8.6%) for men and 55 to 59 Years (3,349 | 8.1%) for women.
| Age Bracket | Male | Female |
| Under 5 Years | 1,903 (5.1%) | 1,998 (4.9%) |
| 5 to 9 Years | 1,919 (5.2%) | 2,362 (5.7%) |
| 10 to 14 Years | 2,297 (6.2%) | 1,897 (4.6%) |
| 15 to 19 Years | 2,460 (6.6%) | 2,416 (5.9%) |
| 20 to 24 Years | 1,999 (5.4%) | 2,103 (5.1%) |
| 25 to 29 Years | 3,195 (8.6%) | 2,724 (6.6%) |
| 30 to 34 Years | 2,689 (7.2%) | 2,045 (5.0%) |
| 35 to 39 Years | 2,315 (6.2%) | 2,427 (5.9%) |
| 40 to 44 Years | 2,745 (7.4%) | 2,647 (6.4%) |
| 45 to 49 Years | 2,334 (6.3%) | 2,604 (6.3%) |
| 50 to 54 Years | 2,281 (6.1%) | 2,744 (6.7%) |
| 55 to 59 Years | 2,267 (6.1%) | 3,349 (8.1%) |
| 60 to 64 Years | 2,930 (7.9%) | 2,688 (6.5%) |
| 65 to 69 Years | 1,810 (4.9%) | 2,563 (6.2%) |
| 70 to 74 Years | 1,396 (3.7%) | 1,682 (4.1%) |
| 75 to 79 Years | 810 (2.2%) | 1,677 (4.1%) |
| 80 to 84 Years | 766 (2.1%) | 1,313 (3.2%) |
| 85 Years and over | 1,098 (2.9%) | 1,949 (4.7%) |
| Total | 37,214 (100.0%) | 41,188 (100.0%) |
Families and Households in Kendall
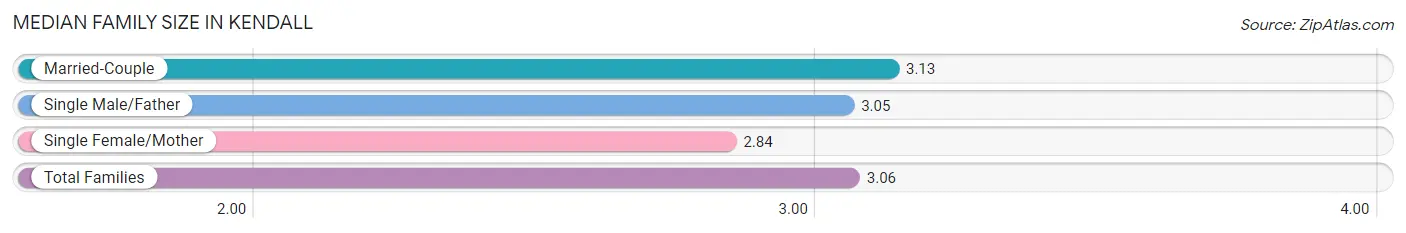
Median Family Size in Kendall
The median family size in Kendall is 3.06 persons per family, with married-couple families (14,401 | 71.7%) accounting for the largest median family size of 3.13 persons per family. On the other hand, single female/mother families (4,271 | 21.3%) represent the smallest median family size with 2.84 persons per family.
| Family Type | # Families | Family Size |
| Married-Couple | 14,401 (71.7%) | 3.13 |
| Single Male/Father | 1,402 (7.0%) | 3.05 |
| Single Female/Mother | 4,271 (21.3%) | 2.84 |
| Total Families | 20,074 (100.0%) | 3.06 |
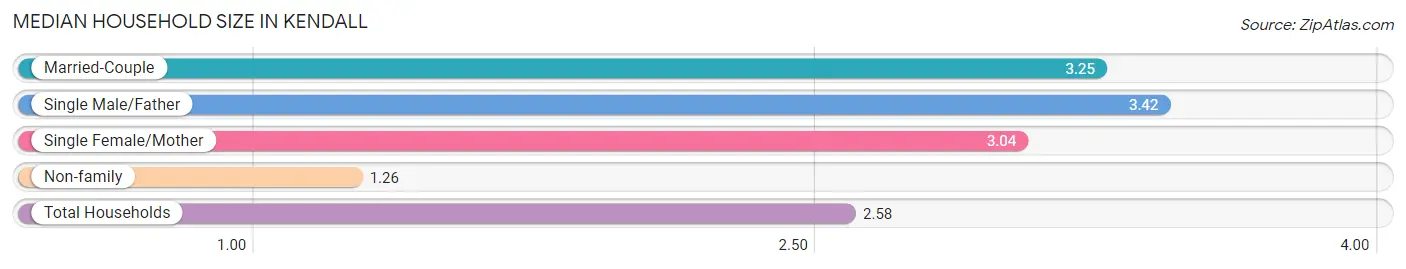
Median Household Size in Kendall
The median household size in Kendall is 2.58 persons per household, with single male/father households (1,402 | 4.7%) accounting for the largest median household size of 3.42 persons per household. non-family households (9,736 | 32.7%) represent the smallest median household size with 1.26 persons per household.
| Household Type | # Households | Household Size |
| Married-Couple | 14,401 (48.3%) | 3.25 |
| Single Male/Father | 1,402 (4.7%) | 3.42 |
| Single Female/Mother | 4,271 (14.3%) | 3.04 |
| Non-family | 9,736 (32.7%) | 1.26 |
| Total Households | 29,810 (100.0%) | 2.58 |
Household Size by Marriage Status in Kendall
Out of a total of 29,810 households in Kendall, 20,074 (67.3%) are family households, while 9,736 (32.7%) are nonfamily households. The most numerous type of family households are 2-person households, comprising 8,368, and the most common type of nonfamily households are 1-person households, comprising 7,838.
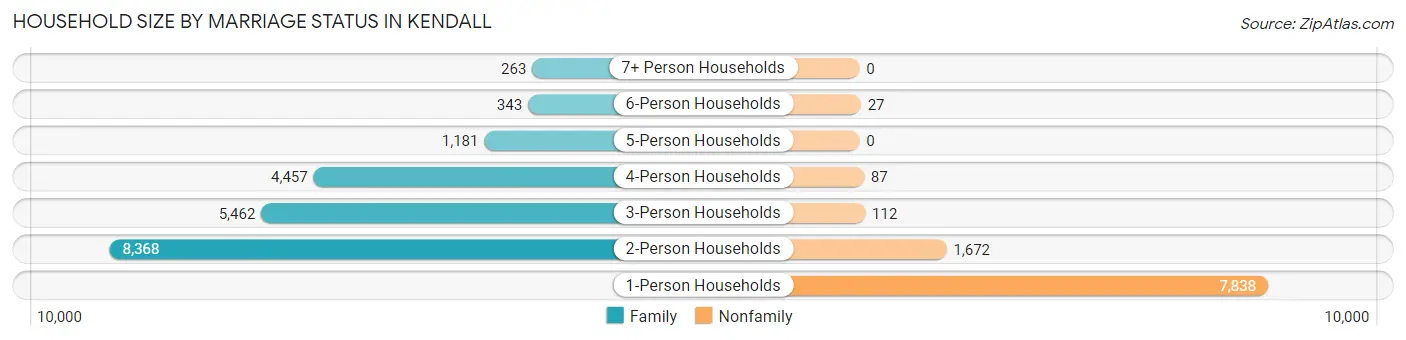
| Household Size | Family Households | Nonfamily Households |
| 1-Person Households | - | 7,838 (26.3%) |
| 2-Person Households | 8,368 (28.1%) | 1,672 (5.6%) |
| 3-Person Households | 5,462 (18.3%) | 112 (0.4%) |
| 4-Person Households | 4,457 (14.9%) | 87 (0.3%) |
| 5-Person Households | 1,181 (4.0%) | 0 (0.0%) |
| 6-Person Households | 343 (1.1%) | 27 (0.1%) |
| 7+ Person Households | 263 (0.9%) | 0 (0.0%) |
| Total | 20,074 (67.3%) | 9,736 (32.7%) |
Female Fertility in Kendall
Fertility by Age in Kendall
Average fertility rate in Kendall is 44.0 births per 1,000 women. Women in the age bracket of 20 to 34 years have the highest fertility rate with 52.0 births per 1,000 women. Women in the age bracket of 35 to 50 years acount for 54.5% of all women with births.
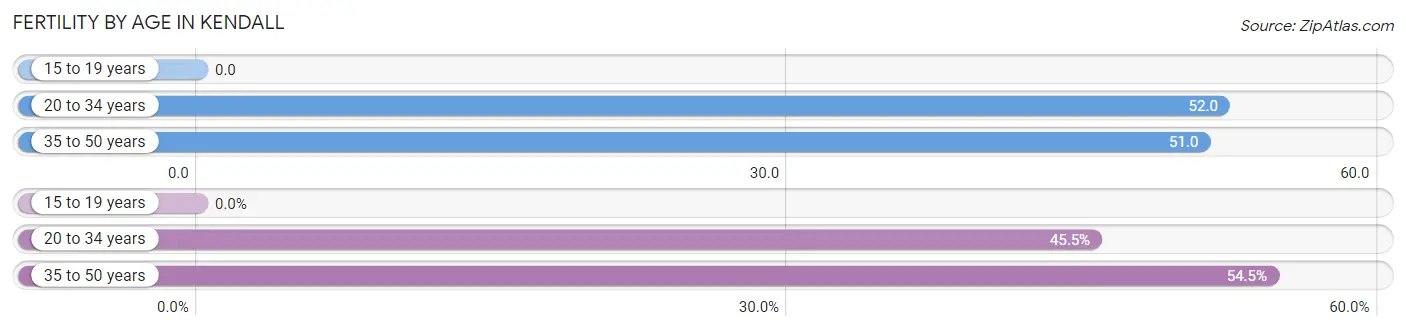
| Age Bracket | Women with Births | Births / 1,000 Women |
| 15 to 19 years | 0 (0.0%) | 0.0 |
| 20 to 34 years | 354 (45.5%) | 52.0 |
| 35 to 50 years | 424 (54.5%) | 51.0 |
| Total | 778 (100.0%) | 44.0 |
Fertility by Age by Marriage Status in Kendall
73.0% of women with births (778) in Kendall are married. The highest percentage of unmarried women with births falls into 20 to 34 years age bracket with 33.9% of them unmarried at the time of birth, while the lowest percentage of unmarried women with births belong to 35 to 50 years age bracket with 21.2% of them unmarried.
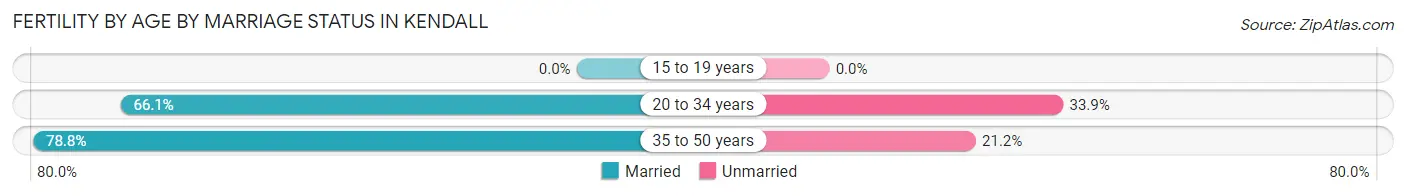
| Age Bracket | Married | Unmarried |
| 15 to 19 years | 0 (0.0%) | 0 (0.0%) |
| 20 to 34 years | 234 (66.1%) | 120 (33.9%) |
| 35 to 50 years | 334 (78.8%) | 90 (21.2%) |
| Total | 568 (73.0%) | 210 (27.0%) |
Fertility by Education in Kendall
Average fertility rate in Kendall is 44.0 births per 1,000 women. Women with the education attainment of graduate degree have the highest fertility rate of 91.0 births per 1,000 women, while women with the education attainment of less than high school have the lowest fertility at 26.0 births per 1,000 women. Women with the education attainment of graduate degree represent 37.9% of all women with births.
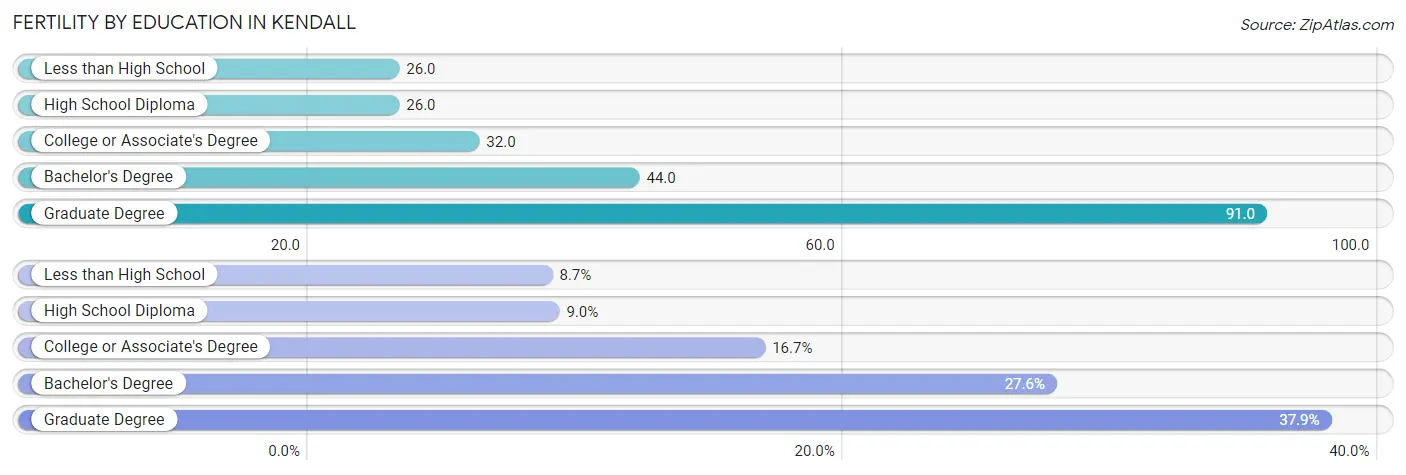
| Educational Attainment | Women with Births | Births / 1,000 Women |
| Less than High School | 68 (8.7%) | 26.0 |
| High School Diploma | 70 (9.0%) | 26.0 |
| College or Associate's Degree | 130 (16.7%) | 32.0 |
| Bachelor's Degree | 215 (27.6%) | 44.0 |
| Graduate Degree | 295 (37.9%) | 91.0 |
| Total | 778 (100.0%) | 44.0 |
Fertility by Education by Marriage Status in Kendall
27.0% of women with births in Kendall are unmarried. Women with the educational attainment of bachelor's degree are most likely to be married with 100.0% of them married at childbirth, while women with the educational attainment of less than high school are least likely to be married with 79.4% of them unmarried at childbirth.
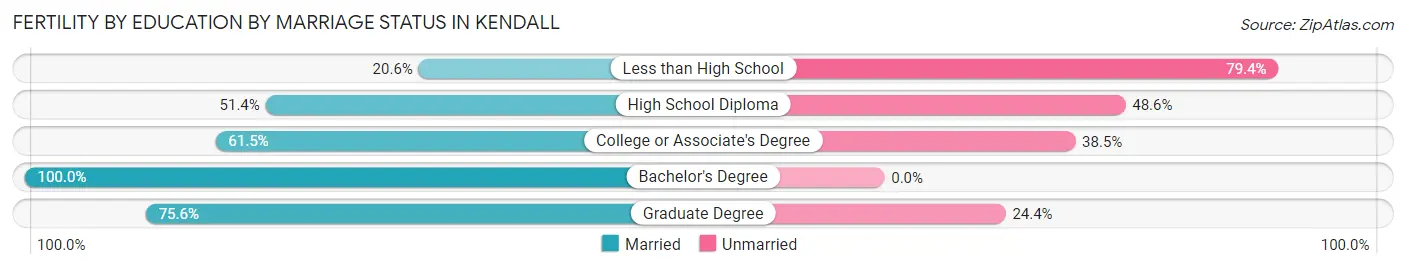
| Educational Attainment | Married | Unmarried |
| Less than High School | 14 (20.6%) | 54 (79.4%) |
| High School Diploma | 36 (51.4%) | 34 (48.6%) |
| College or Associate's Degree | 80 (61.5%) | 50 (38.5%) |
| Bachelor's Degree | 215 (100.0%) | 0 (0.0%) |
| Graduate Degree | 223 (75.6%) | 72 (24.4%) |
| Total | 568 (73.0%) | 210 (27.0%) |
Employment Characteristics in Kendall
Employment by Class of Employer in Kendall
Among the 40,345 employed individuals in Kendall, private company employees (27,578 | 68.4%), self-employed (incorporated) (3,359 | 8.3%), and not-for-profit organizations (3,168 | 7.9%) make up the most common classes of employment.
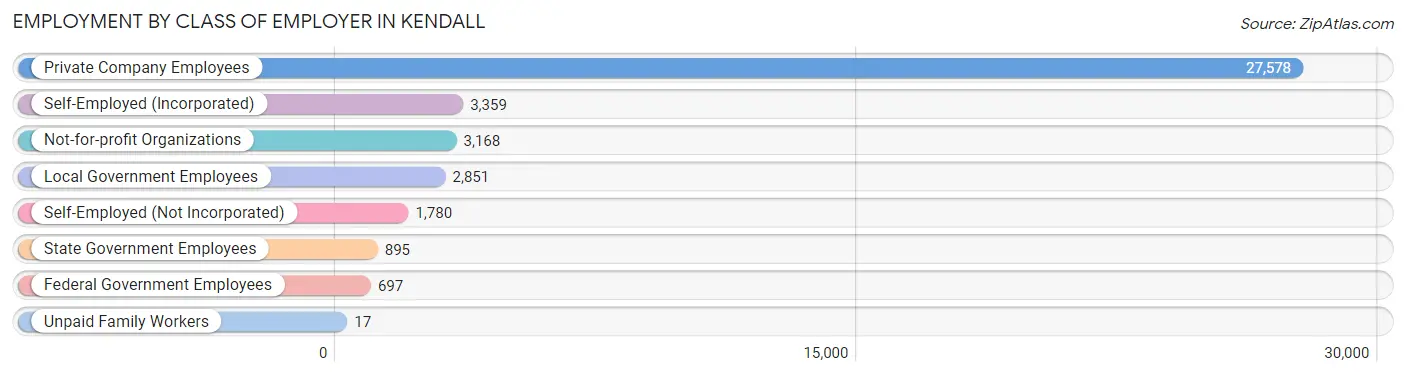
| Employer Class | # Employees | % Employees |
| Private Company Employees | 27,578 | 68.4% |
| Self-Employed (Incorporated) | 3,359 | 8.3% |
| Self-Employed (Not Incorporated) | 1,780 | 4.4% |
| Not-for-profit Organizations | 3,168 | 7.9% |
| Local Government Employees | 2,851 | 7.1% |
| State Government Employees | 895 | 2.2% |
| Federal Government Employees | 697 | 1.7% |
| Unpaid Family Workers | 17 | 0.0% |
| Total | 40,345 | 100.0% |
Employment Status by Age in Kendall
According to the labor force statistics for Kendall, out of the total population over 16 years of age (64,971), 65.1% or 42,296 individuals are in the labor force, with 3.2% or 1,353 of them unemployed. The age group with the highest labor force participation rate is 35 to 44 years, with 90.3% or 9,151 individuals in the labor force. Within the labor force, the 16 to 19 years age range has the highest percentage of unemployed individuals, with 9.2% or 81 of them being unemployed.
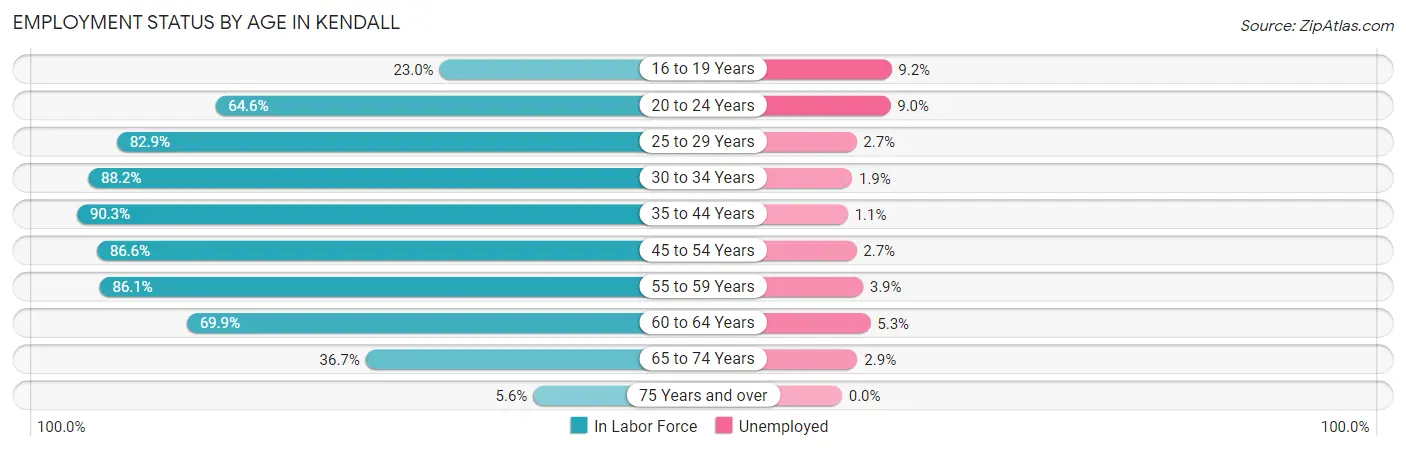
| Age Bracket | In Labor Force | Unemployed |
| 16 to 19 Years | 879 (23.0%) | 81 (9.2%) |
| 20 to 24 Years | 2,650 (64.6%) | 238 (9.0%) |
| 25 to 29 Years | 4,907 (82.9%) | 132 (2.7%) |
| 30 to 34 Years | 4,175 (88.2%) | 79 (1.9%) |
| 35 to 44 Years | 9,151 (90.3%) | 101 (1.1%) |
| 45 to 54 Years | 8,628 (86.6%) | 233 (2.7%) |
| 55 to 59 Years | 4,835 (86.1%) | 189 (3.9%) |
| 60 to 64 Years | 3,927 (69.9%) | 208 (5.3%) |
| 65 to 74 Years | 2,735 (36.7%) | 79 (2.9%) |
| 75 Years and over | 426 (5.6%) | 0 (0.0%) |
| Total | 42,296 (65.1%) | 1,353 (3.2%) |
Employment Status by Educational Attainment in Kendall
According to labor force statistics for Kendall, 84.9% of individuals (35,644) out of the total population between 25 and 64 years of age (41,984) are in the labor force, with 2.6% or 927 of them being unemployed. The group with the highest labor force participation rate are those with the educational attainment of bachelor's degree or higher, with 90.2% or 18,919 individuals in the labor force. Within the labor force, individuals with less than high school education have the highest percentage of unemployment, with 5.1% or 72 of them being unemployed.
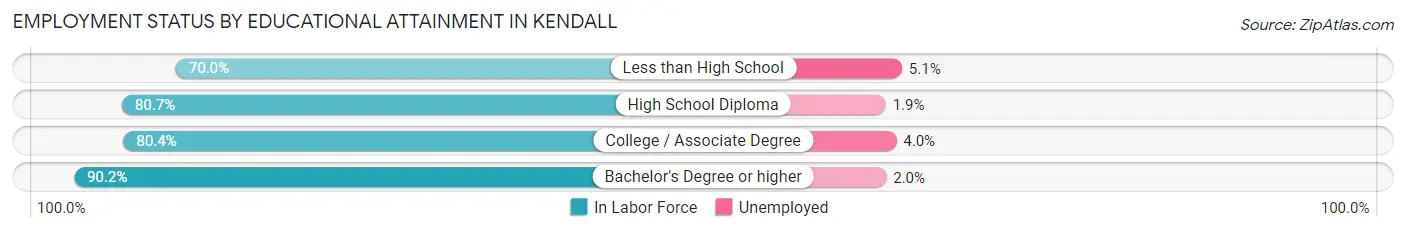
| Educational Attainment | In Labor Force | Unemployed |
| Less than High School | 1,404 (70.0%) | 102 (5.1%) |
| High School Diploma | 6,143 (80.7%) | 145 (1.9%) |
| College / Associate Degree | 9,159 (80.4%) | 456 (4.0%) |
| Bachelor's Degree or higher | 18,919 (90.2%) | 419 (2.0%) |
| Total | 35,644 (84.9%) | 1,092 (2.6%) |
Employment Occupations by Sex in Kendall
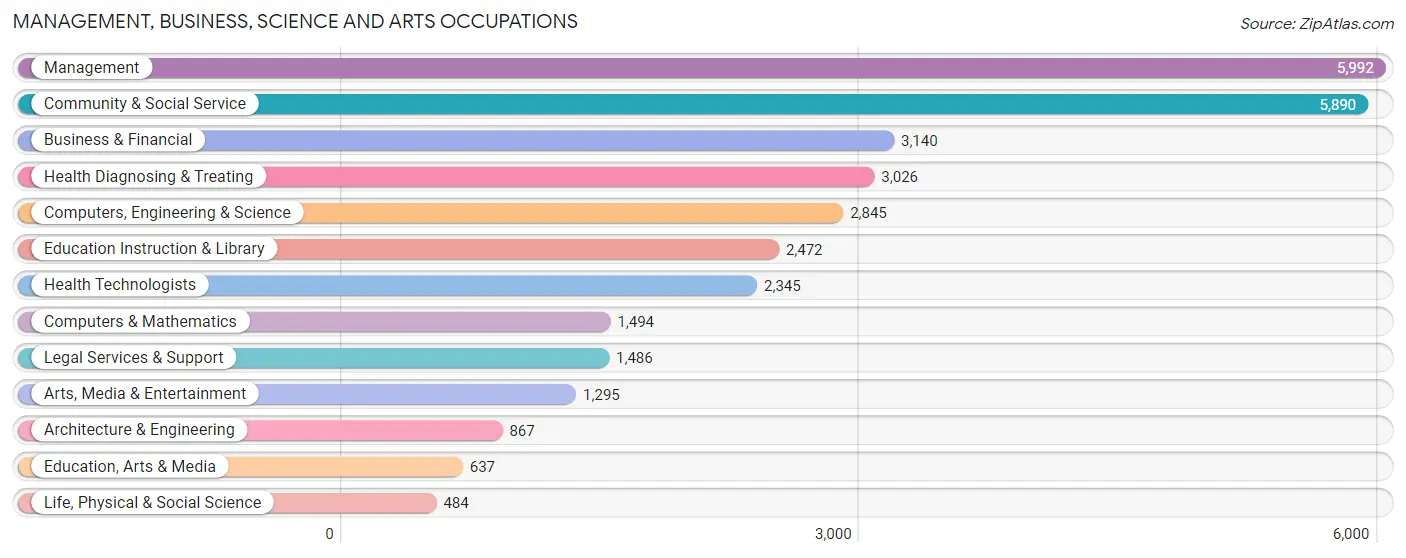
Management, Business, Science and Arts Occupations
The most common Management, Business, Science and Arts occupations in Kendall are Management (5,992 | 14.7%), Community & Social Service (5,890 | 14.4%), Business & Financial (3,140 | 7.7%), Health Diagnosing & Treating (3,026 | 7.4%), and Computers, Engineering & Science (2,845 | 7.0%).
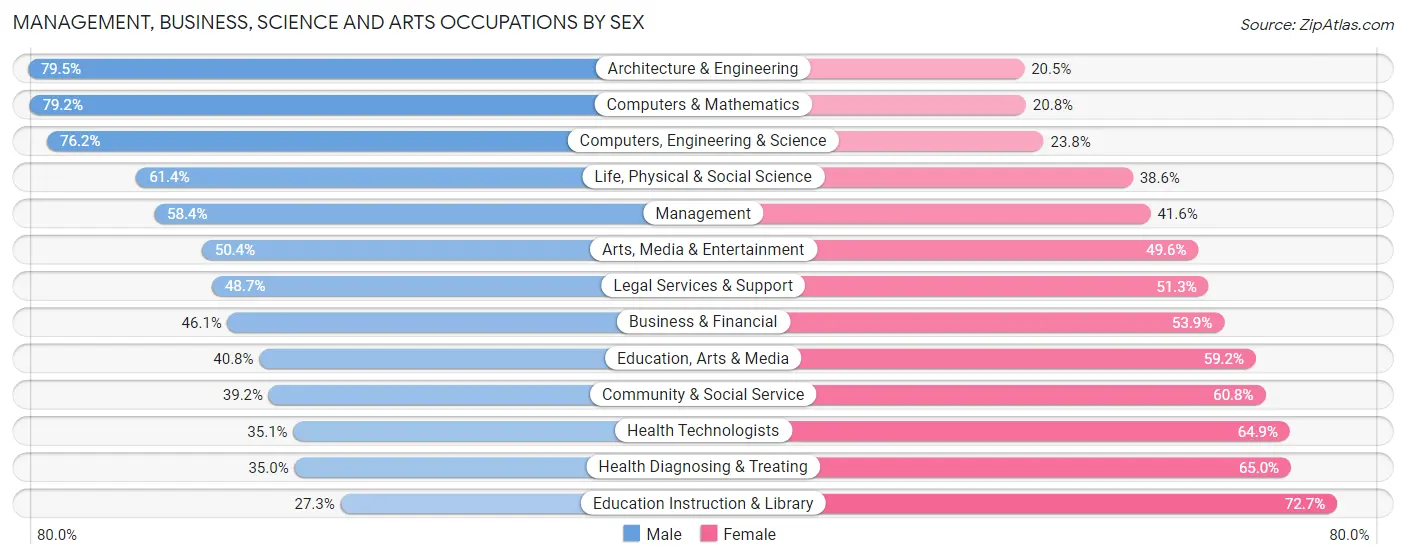
Management, Business, Science and Arts Occupations by Sex
Within the Management, Business, Science and Arts occupations in Kendall, the most male-oriented occupations are Architecture & Engineering (79.5%), Computers & Mathematics (79.2%), and Computers, Engineering & Science (76.2%), while the most female-oriented occupations are Education Instruction & Library (72.7%), Health Diagnosing & Treating (65.0%), and Health Technologists (64.9%).
| Occupation | Male | Female |
| Management | 3,499 (58.4%) | 2,493 (41.6%) |
| Business & Financial | 1,448 (46.1%) | 1,692 (53.9%) |
| Computers, Engineering & Science | 2,169 (76.2%) | 676 (23.8%) |
| Computers & Mathematics | 1,183 (79.2%) | 311 (20.8%) |
| Architecture & Engineering | 689 (79.5%) | 178 (20.5%) |
| Life, Physical & Social Science | 297 (61.4%) | 187 (38.6%) |
| Community & Social Service | 2,311 (39.2%) | 3,579 (60.8%) |
| Education, Arts & Media | 260 (40.8%) | 377 (59.2%) |
| Legal Services & Support | 724 (48.7%) | 762 (51.3%) |
| Education Instruction & Library | 674 (27.3%) | 1,798 (72.7%) |
| Arts, Media & Entertainment | 653 (50.4%) | 642 (49.6%) |
| Health Diagnosing & Treating | 1,058 (35.0%) | 1,968 (65.0%) |
| Health Technologists | 824 (35.1%) | 1,521 (64.9%) |
| Total (Category) | 10,485 (50.2%) | 10,408 (49.8%) |
| Total (Overall) | 21,007 (51.4%) | 19,865 (48.6%) |
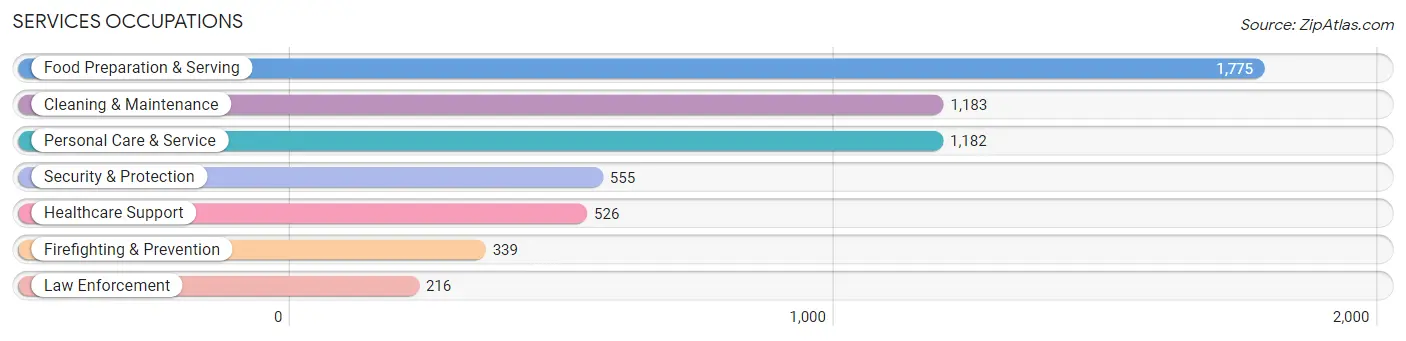
Services Occupations
The most common Services occupations in Kendall are Food Preparation & Serving (1,775 | 4.3%), Cleaning & Maintenance (1,183 | 2.9%), Personal Care & Service (1,182 | 2.9%), Security & Protection (555 | 1.4%), and Healthcare Support (526 | 1.3%).
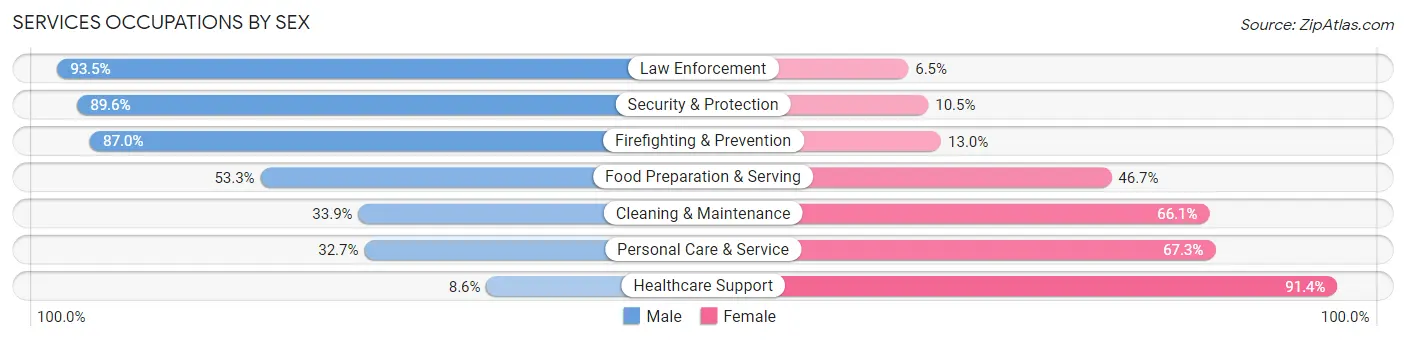
Services Occupations by Sex
Within the Services occupations in Kendall, the most male-oriented occupations are Law Enforcement (93.5%), Security & Protection (89.5%), and Firefighting & Prevention (87.0%), while the most female-oriented occupations are Healthcare Support (91.4%), Personal Care & Service (67.3%), and Cleaning & Maintenance (66.1%).
| Occupation | Male | Female |
| Healthcare Support | 45 (8.6%) | 481 (91.4%) |
| Security & Protection | 497 (89.5%) | 58 (10.4%) |
| Firefighting & Prevention | 295 (87.0%) | 44 (13.0%) |
| Law Enforcement | 202 (93.5%) | 14 (6.5%) |
| Food Preparation & Serving | 946 (53.3%) | 829 (46.7%) |
| Cleaning & Maintenance | 401 (33.9%) | 782 (66.1%) |
| Personal Care & Service | 387 (32.7%) | 795 (67.3%) |
| Total (Category) | 2,276 (43.6%) | 2,945 (56.4%) |
| Total (Overall) | 21,007 (51.4%) | 19,865 (48.6%) |
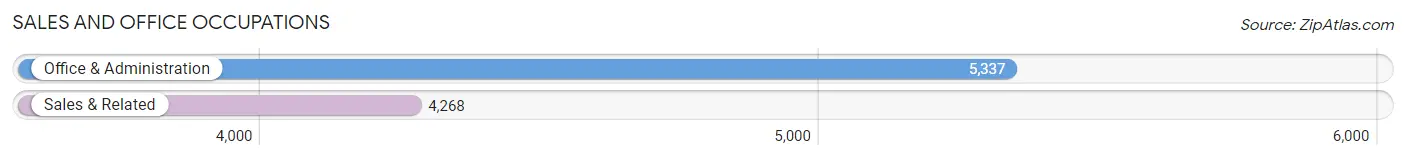
Sales and Office Occupations
The most common Sales and Office occupations in Kendall are Office & Administration (5,337 | 13.1%), and Sales & Related (4,268 | 10.4%).
Sales and Office Occupations by Sex
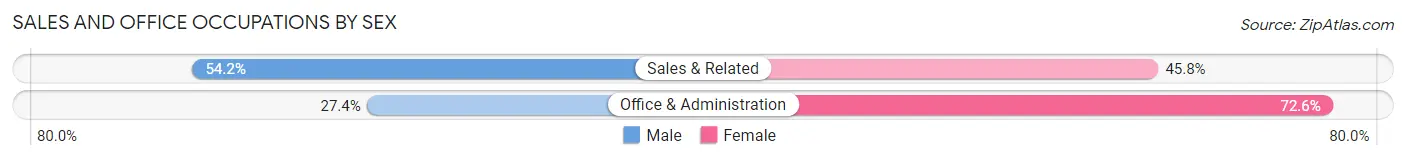
| Occupation | Male | Female |
| Sales & Related | 2,312 (54.2%) | 1,956 (45.8%) |
| Office & Administration | 1,462 (27.4%) | 3,875 (72.6%) |
| Total (Category) | 3,774 (39.3%) | 5,831 (60.7%) |
| Total (Overall) | 21,007 (51.4%) | 19,865 (48.6%) |
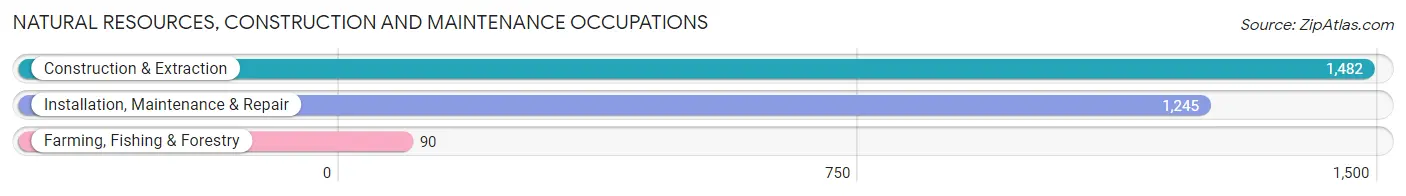
Natural Resources, Construction and Maintenance Occupations
The most common Natural Resources, Construction and Maintenance occupations in Kendall are Construction & Extraction (1,482 | 3.6%), Installation, Maintenance & Repair (1,245 | 3.0%), and Farming, Fishing & Forestry (90 | 0.2%).
Natural Resources, Construction and Maintenance Occupations by Sex
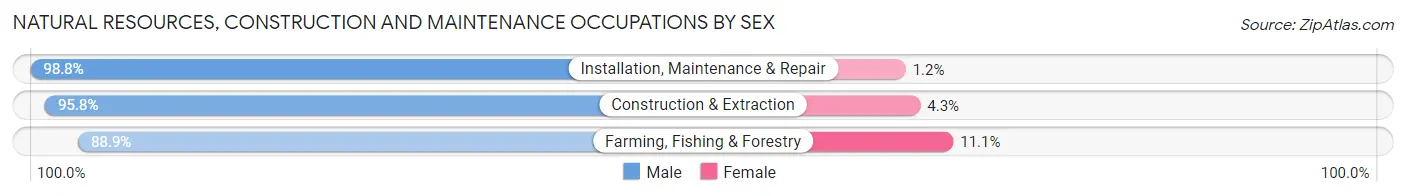
| Occupation | Male | Female |
| Farming, Fishing & Forestry | 80 (88.9%) | 10 (11.1%) |
| Construction & Extraction | 1,419 (95.8%) | 63 (4.3%) |
| Installation, Maintenance & Repair | 1,230 (98.8%) | 15 (1.2%) |
| Total (Category) | 2,729 (96.9%) | 88 (3.1%) |
| Total (Overall) | 21,007 (51.4%) | 19,865 (48.6%) |
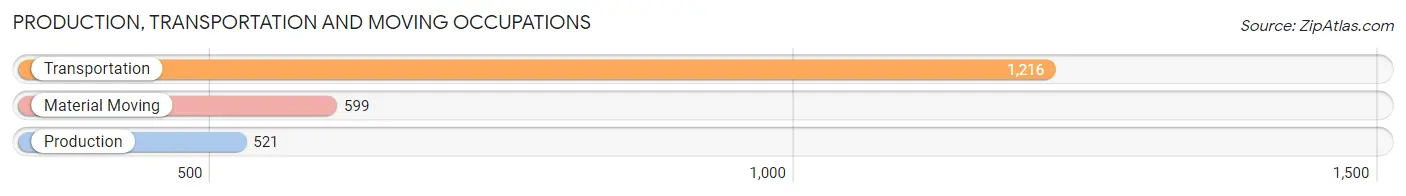
Production, Transportation and Moving Occupations
The most common Production, Transportation and Moving occupations in Kendall are Transportation (1,216 | 3.0%), Material Moving (599 | 1.5%), and Production (521 | 1.3%).
Production, Transportation and Moving Occupations by Sex
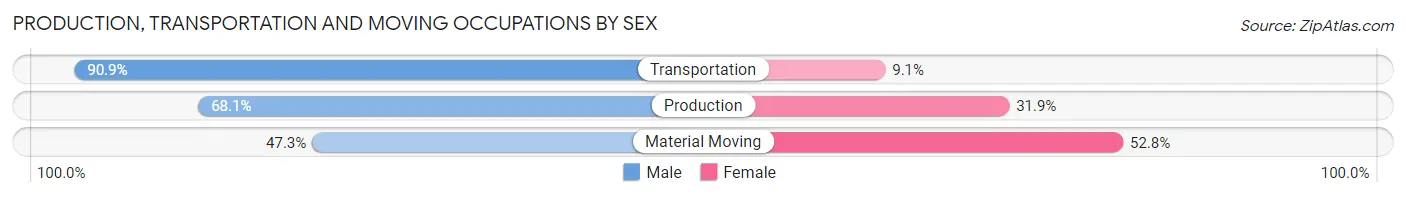
| Occupation | Male | Female |
| Production | 355 (68.1%) | 166 (31.9%) |
| Transportation | 1,105 (90.9%) | 111 (9.1%) |
| Material Moving | 283 (47.2%) | 316 (52.7%) |
| Total (Category) | 1,743 (74.6%) | 593 (25.4%) |
| Total (Overall) | 21,007 (51.4%) | 19,865 (48.6%) |
Employment Industries by Sex in Kendall
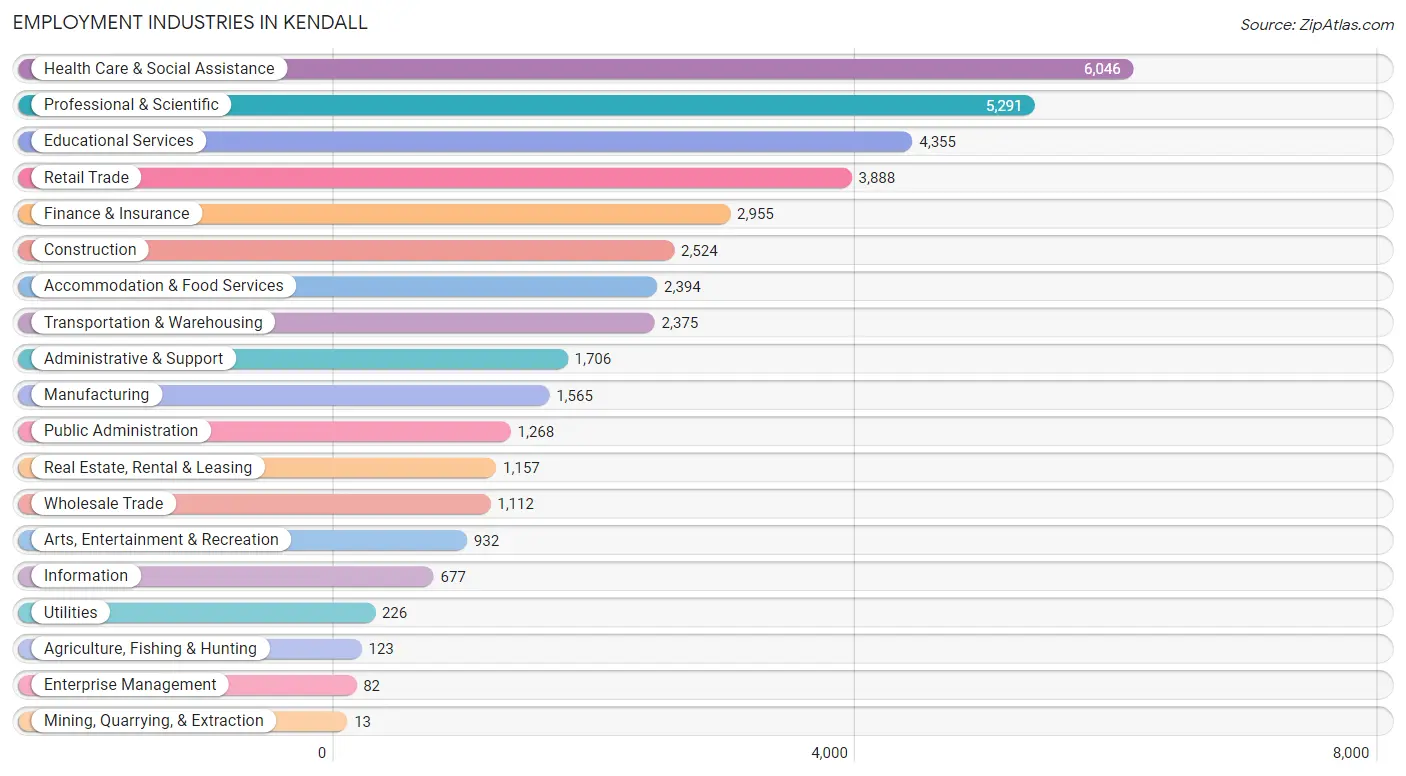
Employment Industries in Kendall
The major employment industries in Kendall include Health Care & Social Assistance (6,046 | 14.8%), Professional & Scientific (5,291 | 13.0%), Educational Services (4,355 | 10.7%), Retail Trade (3,888 | 9.5%), and Finance & Insurance (2,955 | 7.2%).
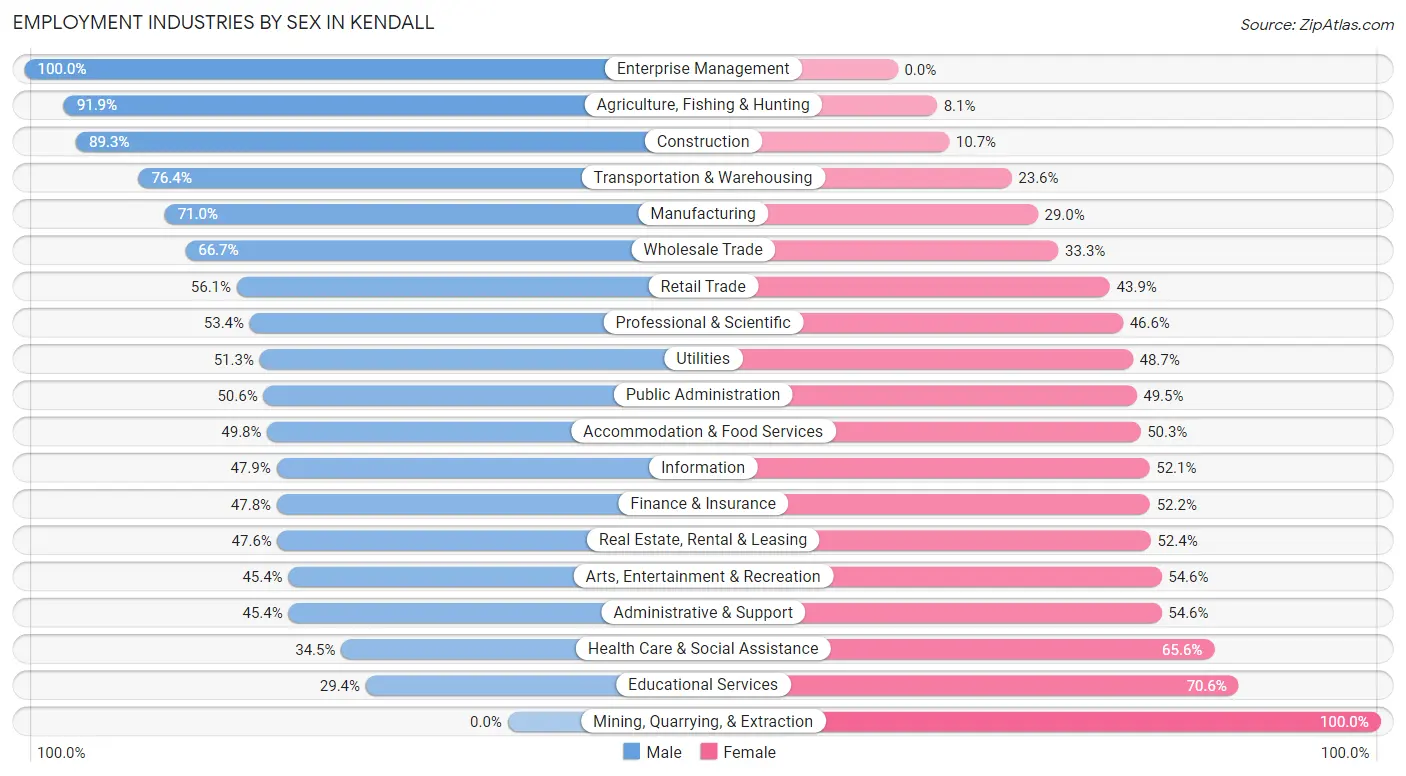
Employment Industries by Sex in Kendall
The Kendall industries that see more men than women are Enterprise Management (100.0%), Agriculture, Fishing & Hunting (91.9%), and Construction (89.3%), whereas the industries that tend to have a higher number of women are Mining, Quarrying, & Extraction (100.0%), Educational Services (70.6%), and Health Care & Social Assistance (65.5%).
| Industry | Male | Female |
| Agriculture, Fishing & Hunting | 113 (91.9%) | 10 (8.1%) |
| Mining, Quarrying, & Extraction | 0 (0.0%) | 13 (100.0%) |
| Construction | 2,255 (89.3%) | 269 (10.7%) |
| Manufacturing | 1,111 (71.0%) | 454 (29.0%) |
| Wholesale Trade | 742 (66.7%) | 370 (33.3%) |
| Retail Trade | 2,180 (56.1%) | 1,708 (43.9%) |
| Transportation & Warehousing | 1,815 (76.4%) | 560 (23.6%) |
| Utilities | 116 (51.3%) | 110 (48.7%) |
| Information | 324 (47.9%) | 353 (52.1%) |
| Finance & Insurance | 1,412 (47.8%) | 1,543 (52.2%) |
| Real Estate, Rental & Leasing | 551 (47.6%) | 606 (52.4%) |
| Professional & Scientific | 2,824 (53.4%) | 2,467 (46.6%) |
| Enterprise Management | 82 (100.0%) | 0 (0.0%) |
| Administrative & Support | 774 (45.4%) | 932 (54.6%) |
| Educational Services | 1,279 (29.4%) | 3,076 (70.6%) |
| Health Care & Social Assistance | 2,083 (34.4%) | 3,963 (65.5%) |
| Arts, Entertainment & Recreation | 423 (45.4%) | 509 (54.6%) |
| Accommodation & Food Services | 1,191 (49.7%) | 1,203 (50.2%) |
| Public Administration | 641 (50.5%) | 627 (49.4%) |
| Total | 21,007 (51.4%) | 19,865 (48.6%) |
Education in Kendall
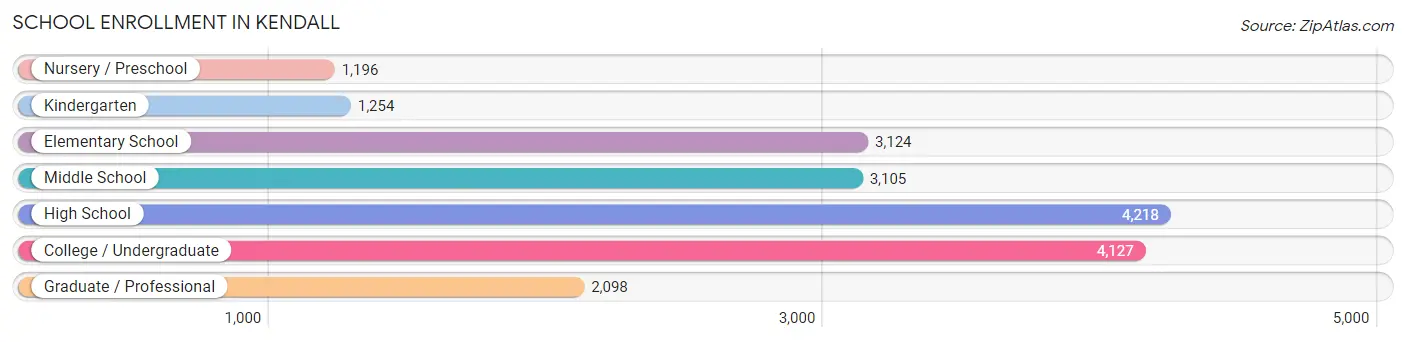
School Enrollment in Kendall
The most common levels of schooling among the 19,122 students in Kendall are high school (4,218 | 22.1%), college / undergraduate (4,127 | 21.6%), and elementary school (3,124 | 16.3%).
| School Level | # Students | % Students |
| Nursery / Preschool | 1,196 | 6.2% |
| Kindergarten | 1,254 | 6.6% |
| Elementary School | 3,124 | 16.3% |
| Middle School | 3,105 | 16.2% |
| High School | 4,218 | 22.1% |
| College / Undergraduate | 4,127 | 21.6% |
| Graduate / Professional | 2,098 | 11.0% |
| Total | 19,122 | 100.0% |
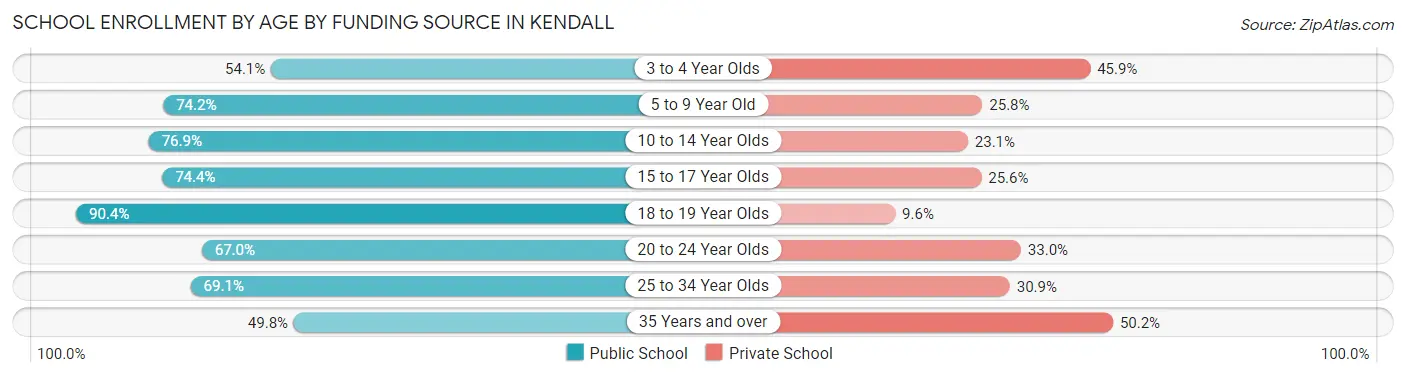
School Enrollment by Age by Funding Source in Kendall
Out of a total of 19,122 students who are enrolled in schools in Kendall, 5,373 (28.1%) attend a private institution, while the remaining 13,749 (71.9%) are enrolled in public schools. The age group of 35 years and over has the highest likelihood of being enrolled in private schools, with 619 (50.2% in the age bracket) enrolled. Conversely, the age group of 18 to 19 year olds has the lowest likelihood of being enrolled in a private school, with 1,273 (90.4% in the age bracket) attending a public institution.
| Age Bracket | Public School | Private School |
| 3 to 4 Year Olds | 583 (54.1%) | 495 (45.9%) |
| 5 to 9 Year Old | 2,987 (74.2%) | 1,040 (25.8%) |
| 10 to 14 Year Olds | 3,178 (76.9%) | 956 (23.1%) |
| 15 to 17 Year Olds | 2,242 (74.4%) | 773 (25.6%) |
| 18 to 19 Year Olds | 1,273 (90.4%) | 135 (9.6%) |
| 20 to 24 Year Olds | 1,601 (67.0%) | 789 (33.0%) |
| 25 to 34 Year Olds | 1,268 (69.1%) | 568 (30.9%) |
| 35 Years and over | 615 (49.8%) | 619 (50.2%) |
| Total | 13,749 (71.9%) | 5,373 (28.1%) |
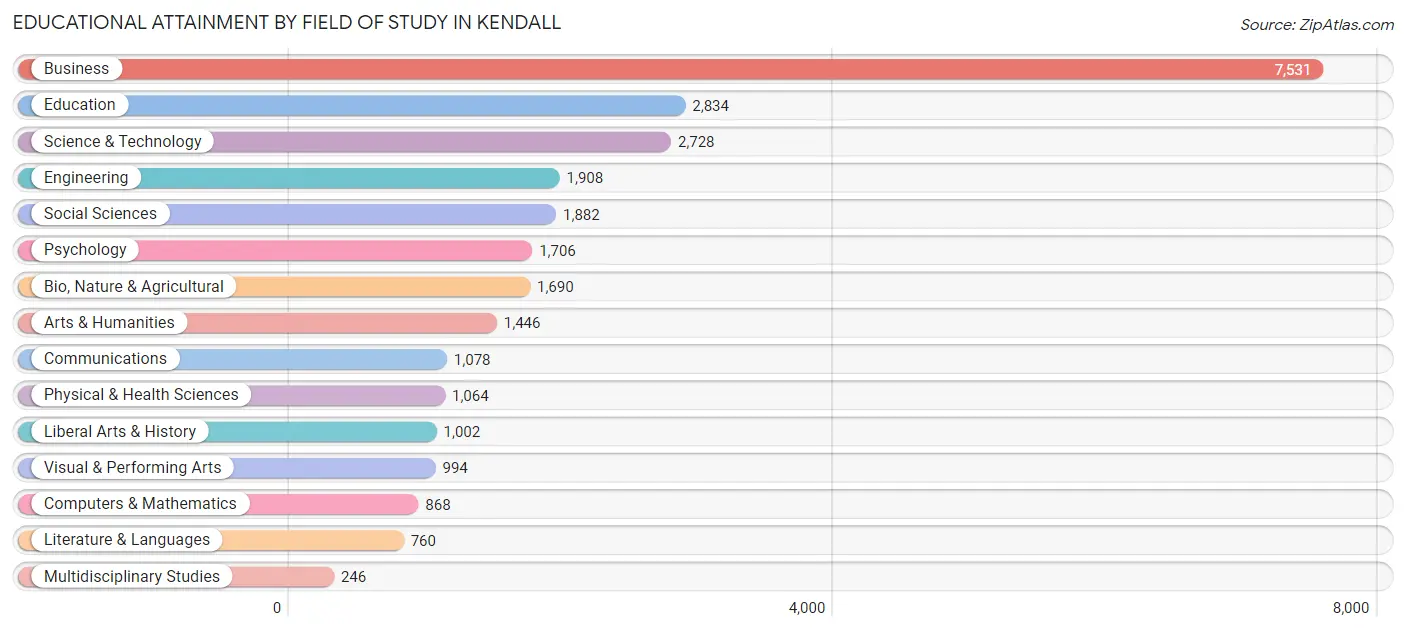
Educational Attainment by Field of Study in Kendall
Business (7,531 | 27.2%), education (2,834 | 10.2%), science & technology (2,728 | 9.8%), engineering (1,908 | 6.9%), and social sciences (1,882 | 6.8%) are the most common fields of study among 27,737 individuals in Kendall who have obtained a bachelor's degree or higher.
| Field of Study | # Graduates | % Graduates |
| Computers & Mathematics | 868 | 3.1% |
| Bio, Nature & Agricultural | 1,690 | 6.1% |
| Physical & Health Sciences | 1,064 | 3.8% |
| Psychology | 1,706 | 6.1% |
| Social Sciences | 1,882 | 6.8% |
| Engineering | 1,908 | 6.9% |
| Multidisciplinary Studies | 246 | 0.9% |
| Science & Technology | 2,728 | 9.8% |
| Business | 7,531 | 27.2% |
| Education | 2,834 | 10.2% |
| Literature & Languages | 760 | 2.7% |
| Liberal Arts & History | 1,002 | 3.6% |
| Visual & Performing Arts | 994 | 3.6% |
| Communications | 1,078 | 3.9% |
| Arts & Humanities | 1,446 | 5.2% |
| Total | 27,737 | 100.0% |
Transportation & Commute in Kendall
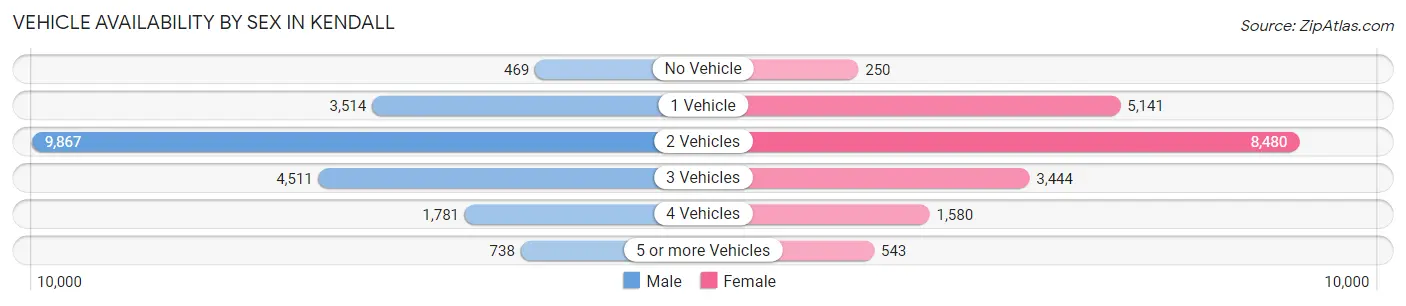
Vehicle Availability by Sex in Kendall
The most prevalent vehicle ownership categories in Kendall are males with 2 vehicles (9,867, accounting for 47.3%) and females with 2 vehicles (8,480, making up 50.8%).
| Vehicles Available | Male | Female |
| No Vehicle | 469 (2.2%) | 250 (1.3%) |
| 1 Vehicle | 3,514 (16.8%) | 5,141 (26.5%) |
| 2 Vehicles | 9,867 (47.3%) | 8,480 (43.6%) |
| 3 Vehicles | 4,511 (21.6%) | 3,444 (17.7%) |
| 4 Vehicles | 1,781 (8.5%) | 1,580 (8.1%) |
| 5 or more Vehicles | 738 (3.5%) | 543 (2.8%) |
| Total | 20,880 (100.0%) | 19,438 (100.0%) |
Commute Time in Kendall
The most frequently occuring commute durations in Kendall are 30 to 34 minutes (6,268 commuters, 17.6%), 15 to 19 minutes (5,250 commuters, 14.8%), and 20 to 24 minutes (5,070 commuters, 14.2%).
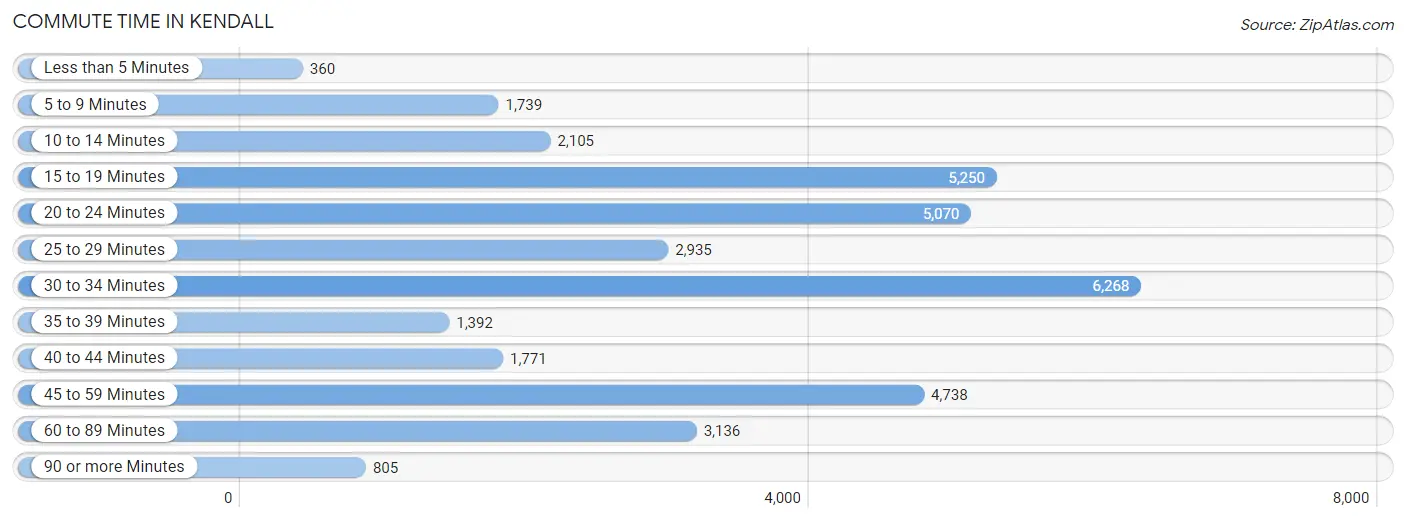
| Commute Time | # Commuters | % Commuters |
| Less than 5 Minutes | 360 | 1.0% |
| 5 to 9 Minutes | 1,739 | 4.9% |
| 10 to 14 Minutes | 2,105 | 5.9% |
| 15 to 19 Minutes | 5,250 | 14.8% |
| 20 to 24 Minutes | 5,070 | 14.2% |
| 25 to 29 Minutes | 2,935 | 8.3% |
| 30 to 34 Minutes | 6,268 | 17.6% |
| 35 to 39 Minutes | 1,392 | 3.9% |
| 40 to 44 Minutes | 1,771 | 5.0% |
| 45 to 59 Minutes | 4,738 | 13.3% |
| 60 to 89 Minutes | 3,136 | 8.8% |
| 90 or more Minutes | 805 | 2.3% |
Commute Time by Sex in Kendall
The most common commute times in Kendall are 30 to 34 minutes (3,402 commuters, 18.3%) for males and 30 to 34 minutes (2,866 commuters, 16.9%) for females.
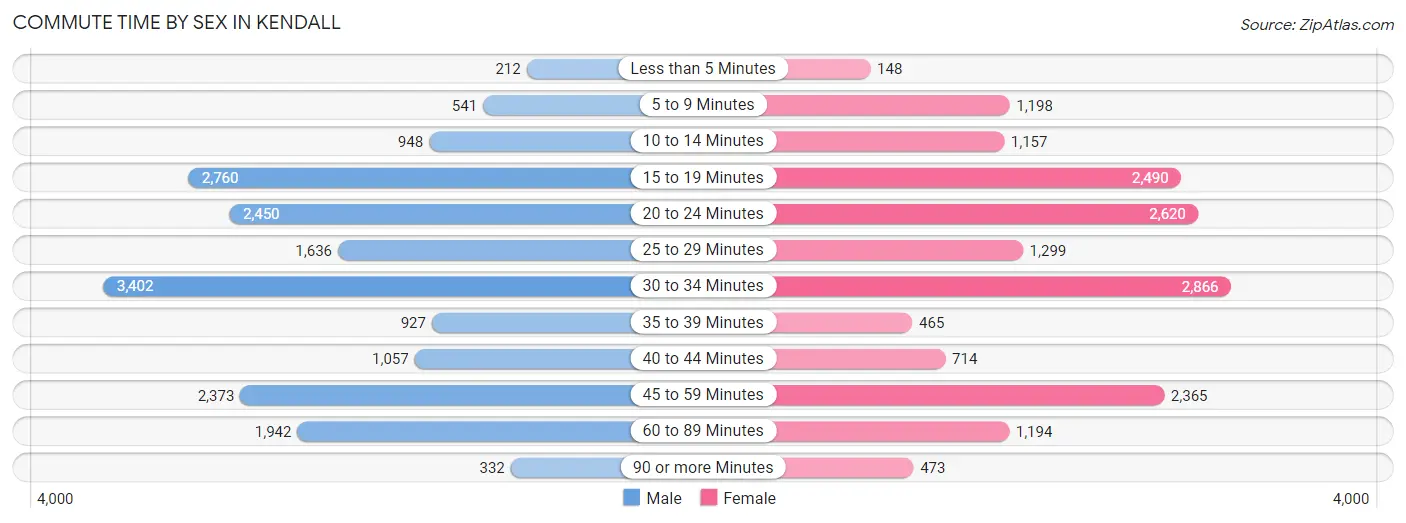
| Commute Time | Male | Female |
| Less than 5 Minutes | 212 (1.1%) | 148 (0.9%) |
| 5 to 9 Minutes | 541 (2.9%) | 1,198 (7.0%) |
| 10 to 14 Minutes | 948 (5.1%) | 1,157 (6.8%) |
| 15 to 19 Minutes | 2,760 (14.8%) | 2,490 (14.7%) |
| 20 to 24 Minutes | 2,450 (13.2%) | 2,620 (15.4%) |
| 25 to 29 Minutes | 1,636 (8.8%) | 1,299 (7.6%) |
| 30 to 34 Minutes | 3,402 (18.3%) | 2,866 (16.9%) |
| 35 to 39 Minutes | 927 (5.0%) | 465 (2.7%) |
| 40 to 44 Minutes | 1,057 (5.7%) | 714 (4.2%) |
| 45 to 59 Minutes | 2,373 (12.8%) | 2,365 (13.9%) |
| 60 to 89 Minutes | 1,942 (10.4%) | 1,194 (7.0%) |
| 90 or more Minutes | 332 (1.8%) | 473 (2.8%) |
Time of Departure to Work by Sex in Kendall
The most frequent times of departure to work in Kendall are 8:00 AM to 8:29 AM (3,443, 18.5%) for males and 9:00 AM to 9:59 AM (2,884, 17.0%) for females.
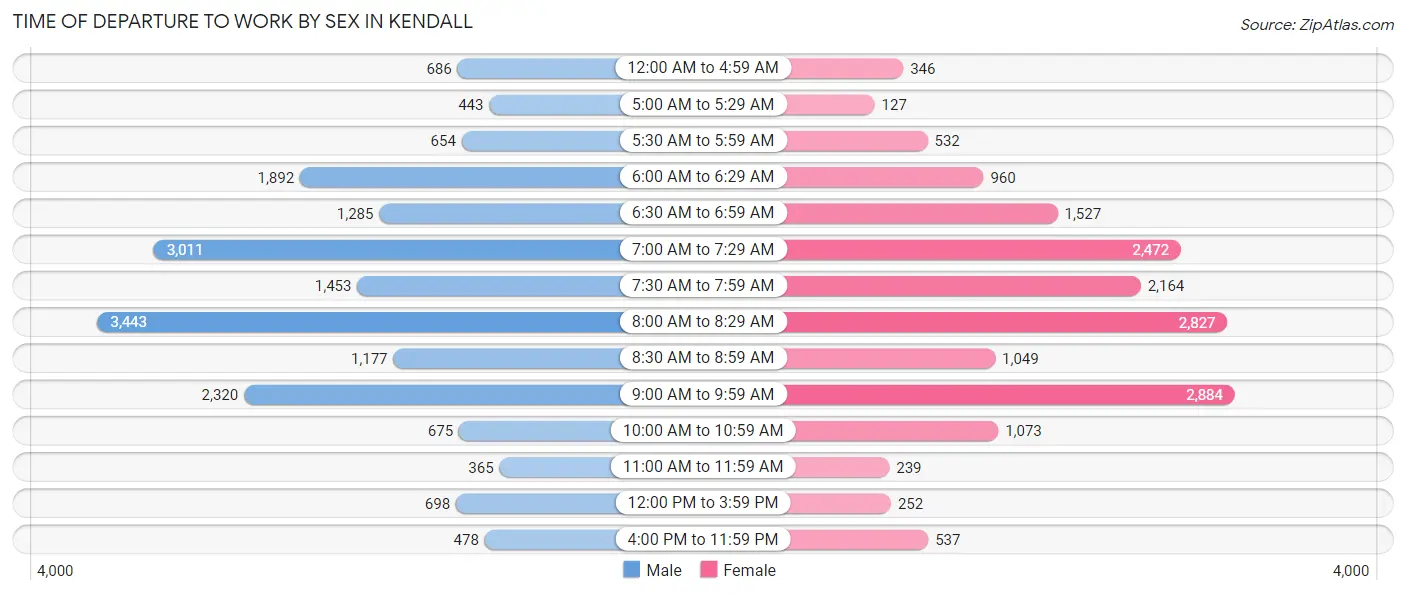
| Time of Departure | Male | Female |
| 12:00 AM to 4:59 AM | 686 (3.7%) | 346 (2.0%) |
| 5:00 AM to 5:29 AM | 443 (2.4%) | 127 (0.7%) |
| 5:30 AM to 5:59 AM | 654 (3.5%) | 532 (3.1%) |
| 6:00 AM to 6:29 AM | 1,892 (10.2%) | 960 (5.7%) |
| 6:30 AM to 6:59 AM | 1,285 (6.9%) | 1,527 (9.0%) |
| 7:00 AM to 7:29 AM | 3,011 (16.2%) | 2,472 (14.5%) |
| 7:30 AM to 7:59 AM | 1,453 (7.8%) | 2,164 (12.7%) |
| 8:00 AM to 8:29 AM | 3,443 (18.5%) | 2,827 (16.6%) |
| 8:30 AM to 8:59 AM | 1,177 (6.3%) | 1,049 (6.2%) |
| 9:00 AM to 9:59 AM | 2,320 (12.5%) | 2,884 (17.0%) |
| 10:00 AM to 10:59 AM | 675 (3.6%) | 1,073 (6.3%) |
| 11:00 AM to 11:59 AM | 365 (2.0%) | 239 (1.4%) |
| 12:00 PM to 3:59 PM | 698 (3.8%) | 252 (1.5%) |
| 4:00 PM to 11:59 PM | 478 (2.6%) | 537 (3.2%) |
| Total | 18,580 (100.0%) | 16,989 (100.0%) |
Housing Occupancy in Kendall
Occupancy by Ownership in Kendall
Of the total 29,810 dwellings in Kendall, owner-occupied units account for 18,298 (61.4%), while renter-occupied units make up 11,512 (38.6%).
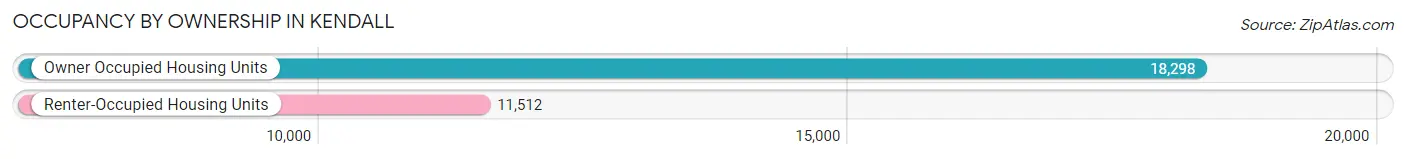
| Occupancy | # Housing Units | % Housing Units |
| Owner Occupied Housing Units | 18,298 | 61.4% |
| Renter-Occupied Housing Units | 11,512 | 38.6% |
| Total Occupied Housing Units | 29,810 | 100.0% |
Occupancy by Household Size in Kendall
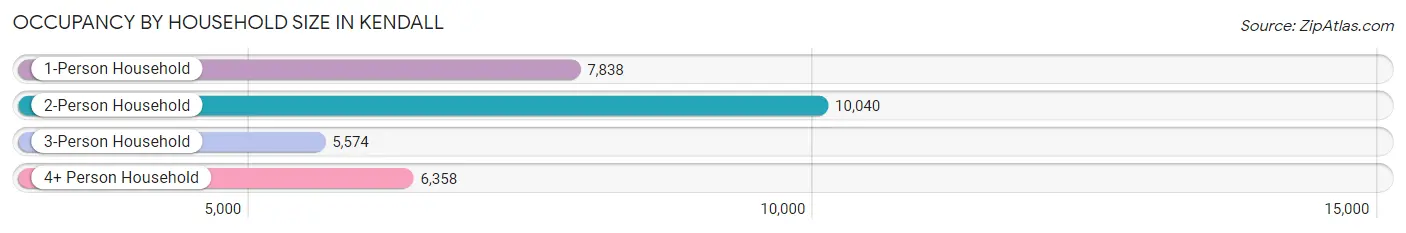
| Household Size | # Housing Units | % Housing Units |
| 1-Person Household | 7,838 | 26.3% |
| 2-Person Household | 10,040 | 33.7% |
| 3-Person Household | 5,574 | 18.7% |
| 4+ Person Household | 6,358 | 21.3% |
| Total Housing Units | 29,810 | 100.0% |
Occupancy by Ownership by Household Size in Kendall
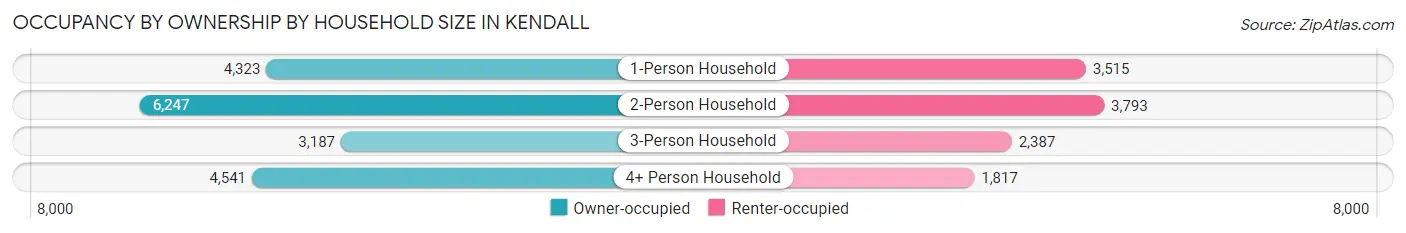
| Household Size | Owner-occupied | Renter-occupied |
| 1-Person Household | 4,323 (55.1%) | 3,515 (44.9%) |
| 2-Person Household | 6,247 (62.2%) | 3,793 (37.8%) |
| 3-Person Household | 3,187 (57.2%) | 2,387 (42.8%) |
| 4+ Person Household | 4,541 (71.4%) | 1,817 (28.6%) |
| Total Housing Units | 18,298 (61.4%) | 11,512 (38.6%) |
Occupancy by Educational Attainment in Kendall
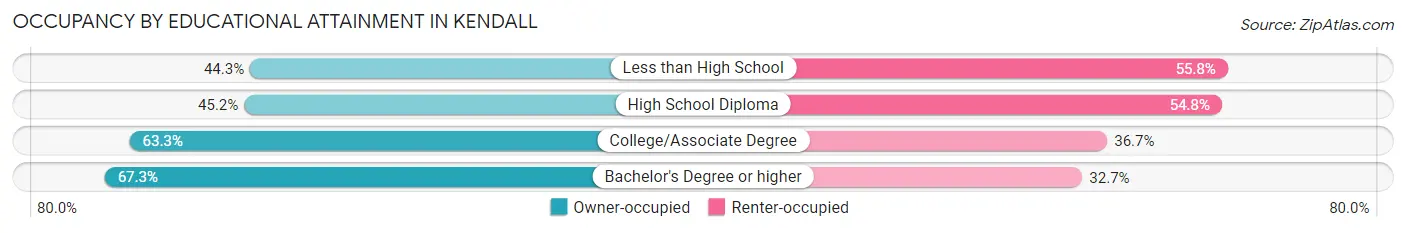
| Household Size | Owner-occupied | Renter-occupied |
| Less than High School | 670 (44.3%) | 844 (55.7%) |
| High School Diploma | 2,167 (45.2%) | 2,629 (54.8%) |
| College/Associate Degree | 5,659 (63.3%) | 3,275 (36.7%) |
| Bachelor's Degree or higher | 9,802 (67.3%) | 4,764 (32.7%) |
Occupancy by Age of Householder in Kendall
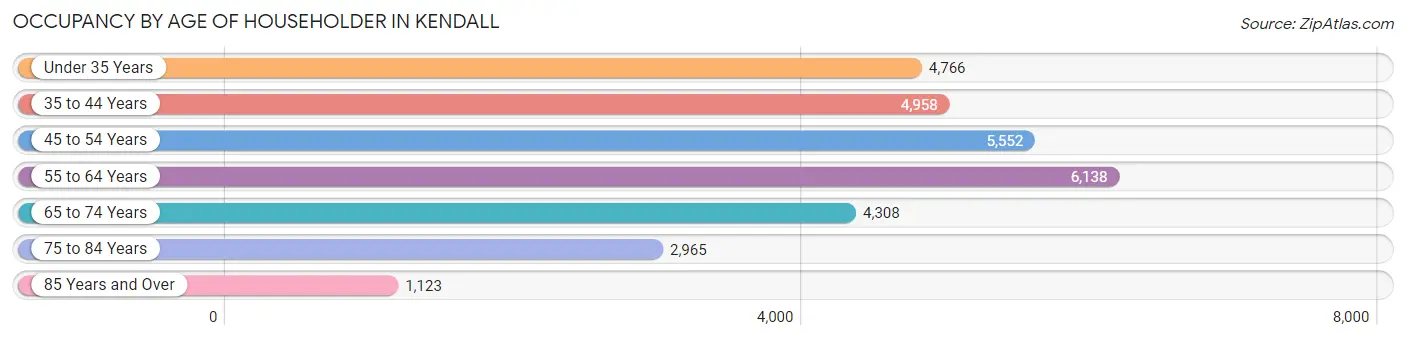
| Age Bracket | # Households | % Households |
| Under 35 Years | 4,766 | 16.0% |
| 35 to 44 Years | 4,958 | 16.6% |
| 45 to 54 Years | 5,552 | 18.6% |
| 55 to 64 Years | 6,138 | 20.6% |
| 65 to 74 Years | 4,308 | 14.4% |
| 75 to 84 Years | 2,965 | 10.0% |
| 85 Years and Over | 1,123 | 3.8% |
| Total | 29,810 | 100.0% |
Housing Finances in Kendall
Median Income by Occupancy in Kendall
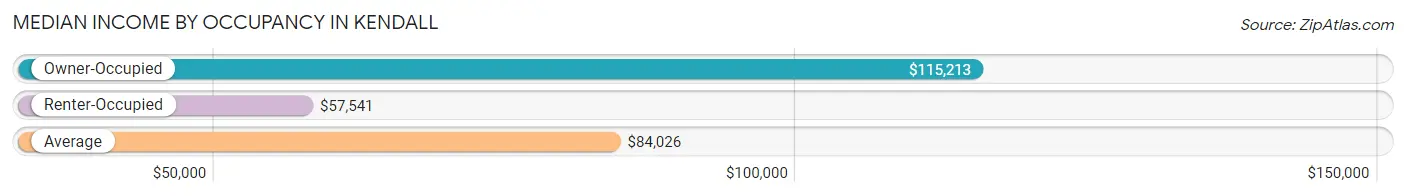
| Occupancy Type | # Households | Median Income |
| Owner-Occupied | 18,298 (61.4%) | $115,213 |
| Renter-Occupied | 11,512 (38.6%) | $57,541 |
| Average | 29,810 (100.0%) | $84,026 |
Occupancy by Householder Income Bracket in Kendall
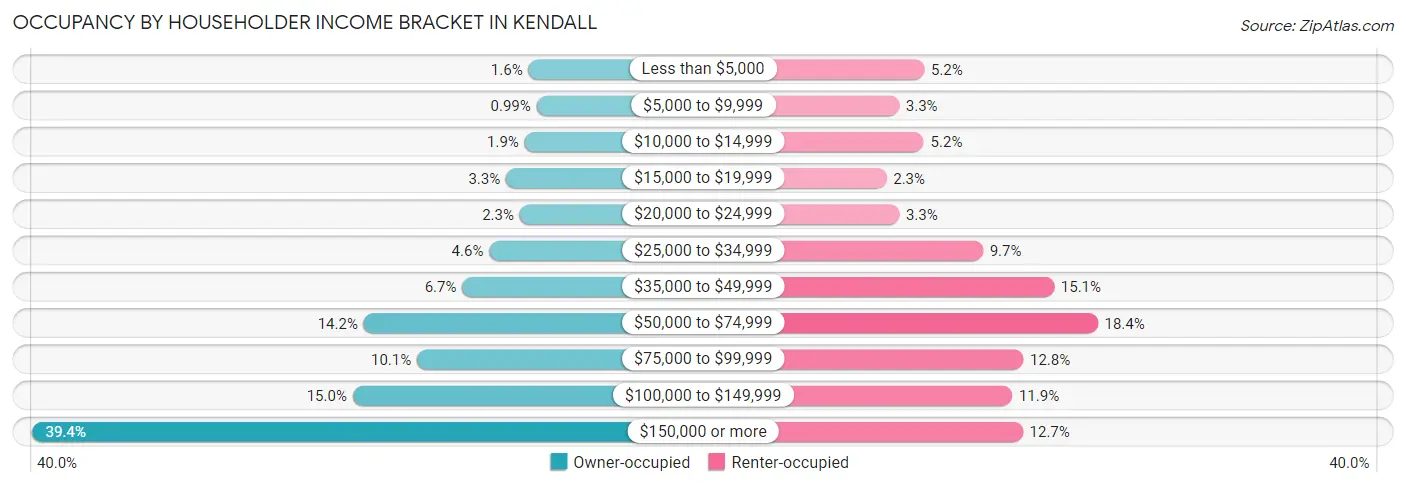
| Income Bracket | Owner-occupied | Renter-occupied |
| Less than $5,000 | 294 (1.6%) | 601 (5.2%) |
| $5,000 to $9,999 | 182 (1.0%) | 380 (3.3%) |
| $10,000 to $14,999 | 348 (1.9%) | 598 (5.2%) |
| $15,000 to $19,999 | 607 (3.3%) | 269 (2.3%) |
| $20,000 to $24,999 | 415 (2.3%) | 381 (3.3%) |
| $25,000 to $34,999 | 842 (4.6%) | 1,115 (9.7%) |
| $35,000 to $49,999 | 1,217 (6.7%) | 1,739 (15.1%) |
| $50,000 to $74,999 | 2,591 (14.2%) | 2,123 (18.4%) |
| $75,000 to $99,999 | 1,849 (10.1%) | 1,469 (12.8%) |
| $100,000 to $149,999 | 2,745 (15.0%) | 1,372 (11.9%) |
| $150,000 or more | 7,208 (39.4%) | 1,465 (12.7%) |
| Total | 18,298 (100.0%) | 11,512 (100.0%) |
Monthly Housing Cost Tiers in Kendall
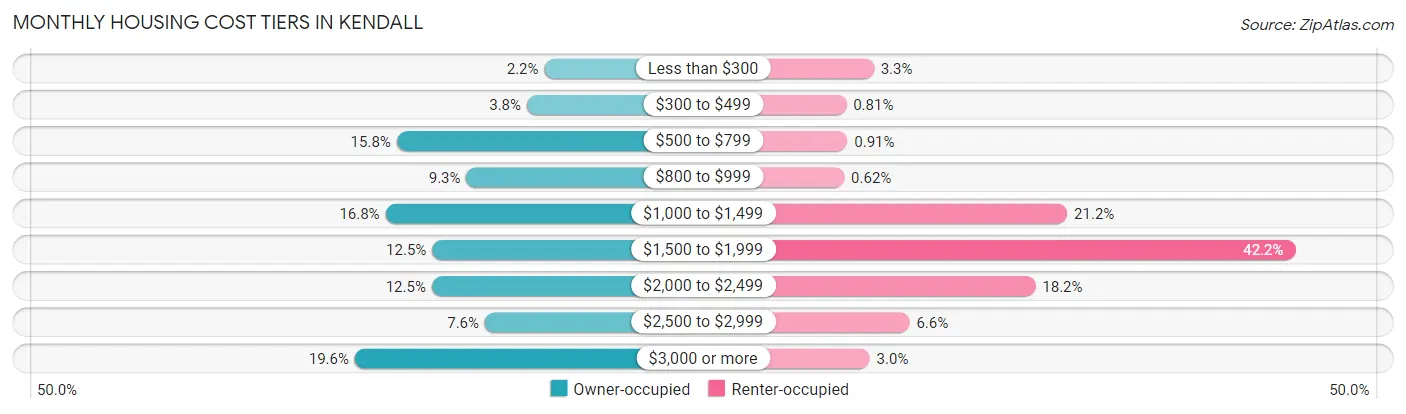
| Monthly Cost | Owner-occupied | Renter-occupied |
| Less than $300 | 393 (2.1%) | 384 (3.3%) |
| $300 to $499 | 688 (3.8%) | 93 (0.8%) |
| $500 to $799 | 2,882 (15.8%) | 105 (0.9%) |
| $800 to $999 | 1,708 (9.3%) | 71 (0.6%) |
| $1,000 to $1,499 | 3,070 (16.8%) | 2,435 (21.1%) |
| $1,500 to $1,999 | 2,283 (12.5%) | 4,852 (42.1%) |
| $2,000 to $2,499 | 2,291 (12.5%) | 2,098 (18.2%) |
| $2,500 to $2,999 | 1,396 (7.6%) | 763 (6.6%) |
| $3,000 or more | 3,587 (19.6%) | 342 (3.0%) |
| Total | 18,298 (100.0%) | 11,512 (100.0%) |
Physical Housing Characteristics in Kendall
Housing Structures in Kendall
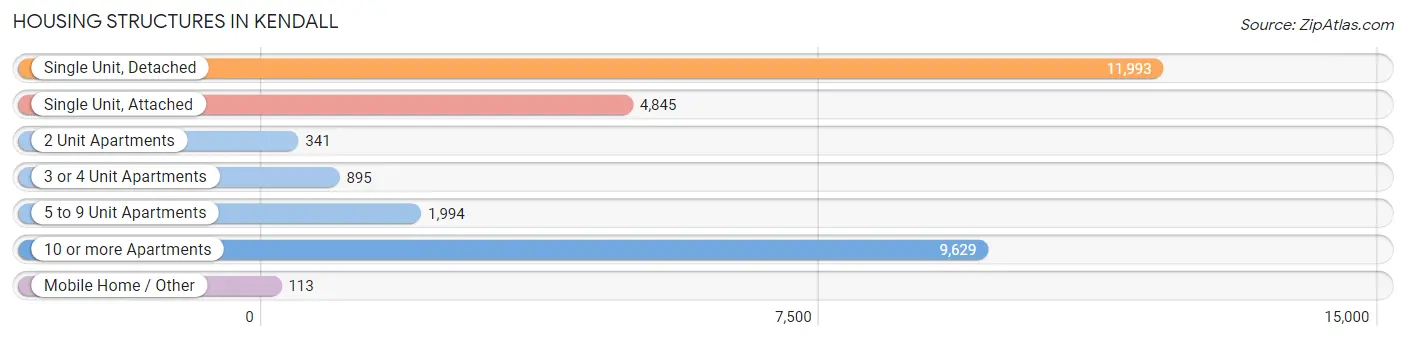
| Structure Type | # Housing Units | % Housing Units |
| Single Unit, Detached | 11,993 | 40.2% |
| Single Unit, Attached | 4,845 | 16.3% |
| 2 Unit Apartments | 341 | 1.1% |
| 3 or 4 Unit Apartments | 895 | 3.0% |
| 5 to 9 Unit Apartments | 1,994 | 6.7% |
| 10 or more Apartments | 9,629 | 32.3% |
| Mobile Home / Other | 113 | 0.4% |
| Total | 29,810 | 100.0% |
Housing Structures by Occupancy in Kendall
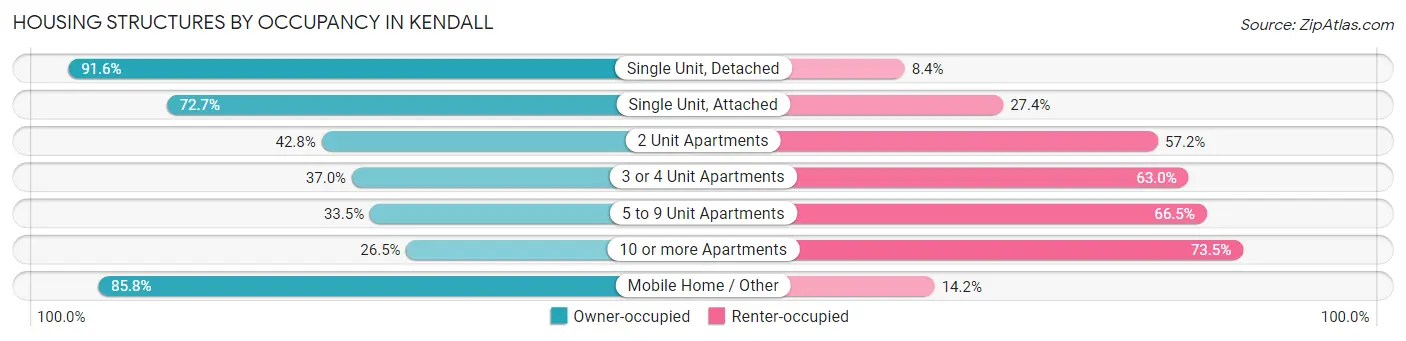
| Structure Type | Owner-occupied | Renter-occupied |
| Single Unit, Detached | 10,985 (91.6%) | 1,008 (8.4%) |
| Single Unit, Attached | 3,520 (72.7%) | 1,325 (27.4%) |
| 2 Unit Apartments | 146 (42.8%) | 195 (57.2%) |
| 3 or 4 Unit Apartments | 331 (37.0%) | 564 (63.0%) |
| 5 to 9 Unit Apartments | 668 (33.5%) | 1,326 (66.5%) |
| 10 or more Apartments | 2,551 (26.5%) | 7,078 (73.5%) |
| Mobile Home / Other | 97 (85.8%) | 16 (14.2%) |
| Total | 18,298 (61.4%) | 11,512 (38.6%) |
Housing Structures by Number of Rooms in Kendall
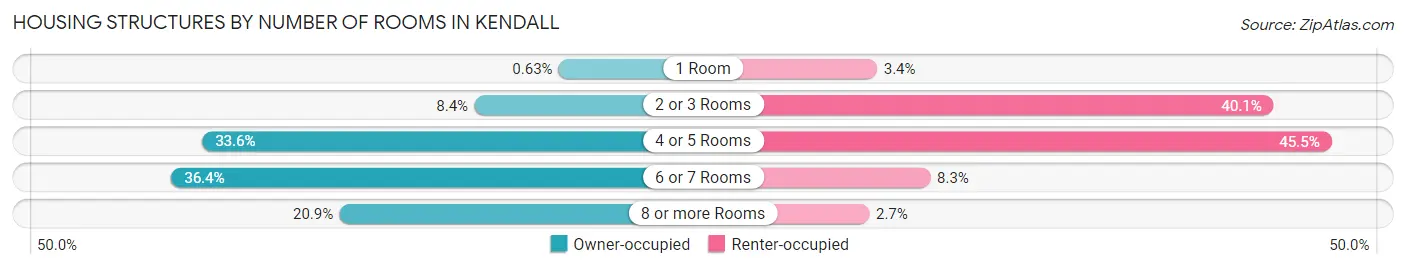
| Number of Rooms | Owner-occupied | Renter-occupied |
| 1 Room | 116 (0.6%) | 392 (3.4%) |
| 2 or 3 Rooms | 1,545 (8.4%) | 4,617 (40.1%) |
| 4 or 5 Rooms | 6,143 (33.6%) | 5,233 (45.5%) |
| 6 or 7 Rooms | 6,666 (36.4%) | 960 (8.3%) |
| 8 or more Rooms | 3,828 (20.9%) | 310 (2.7%) |
| Total | 18,298 (100.0%) | 11,512 (100.0%) |
Housing Structure by Heating Type in Kendall
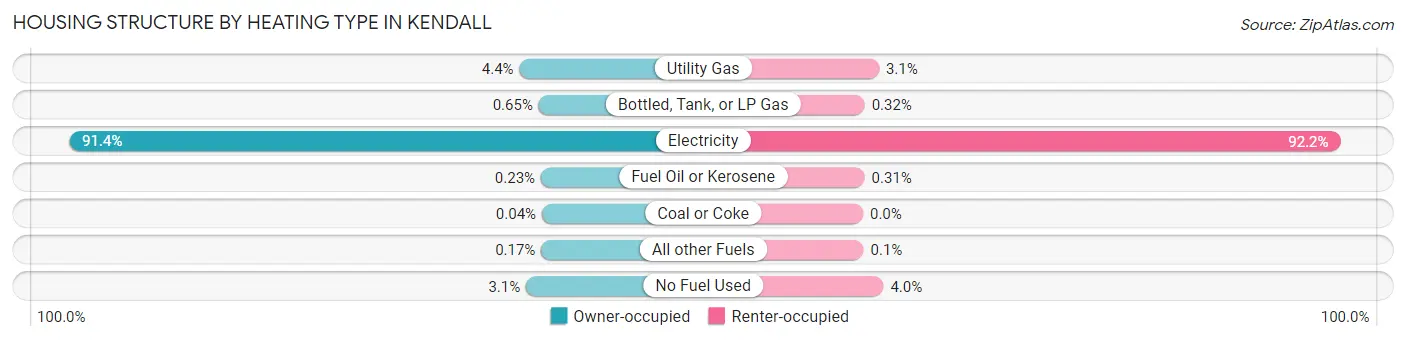
| Heating Type | Owner-occupied | Renter-occupied |
| Utility Gas | 802 (4.4%) | 355 (3.1%) |
| Bottled, Tank, or LP Gas | 119 (0.6%) | 37 (0.3%) |
| Electricity | 16,727 (91.4%) | 10,617 (92.2%) |
| Fuel Oil or Kerosene | 43 (0.2%) | 36 (0.3%) |
| Coal or Coke | 8 (0.0%) | 0 (0.0%) |
| All other Fuels | 31 (0.2%) | 12 (0.1%) |
| No Fuel Used | 568 (3.1%) | 455 (4.0%) |
| Total | 18,298 (100.0%) | 11,512 (100.0%) |
Household Vehicle Usage in Kendall
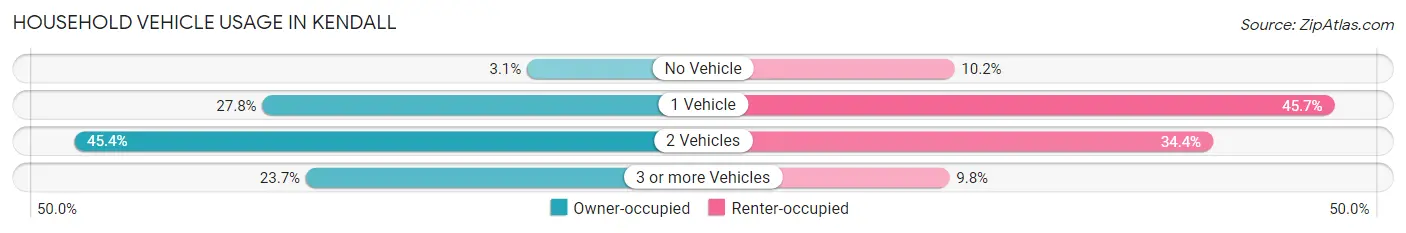
| Vehicles per Household | Owner-occupied | Renter-occupied |
| No Vehicle | 566 (3.1%) | 1,176 (10.2%) |
| 1 Vehicle | 5,087 (27.8%) | 5,260 (45.7%) |
| 2 Vehicles | 8,301 (45.4%) | 3,954 (34.4%) |
| 3 or more Vehicles | 4,344 (23.7%) | 1,122 (9.8%) |
| Total | 18,298 (100.0%) | 11,512 (100.0%) |
Real Estate & Mortgages in Kendall
Real Estate and Mortgage Overview in Kendall
| Characteristic | Without Mortgage | With Mortgage |
| Housing Units | 7,498 | 10,800 |
| Median Property Value | $455,800 | $486,300 |
| Median Household Income | $84,864 | $4,864 |
| Monthly Housing Costs | $811 | $3,576 |
| Real Estate Taxes | $3,614 | $96 |
Property Value by Mortgage Status in Kendall
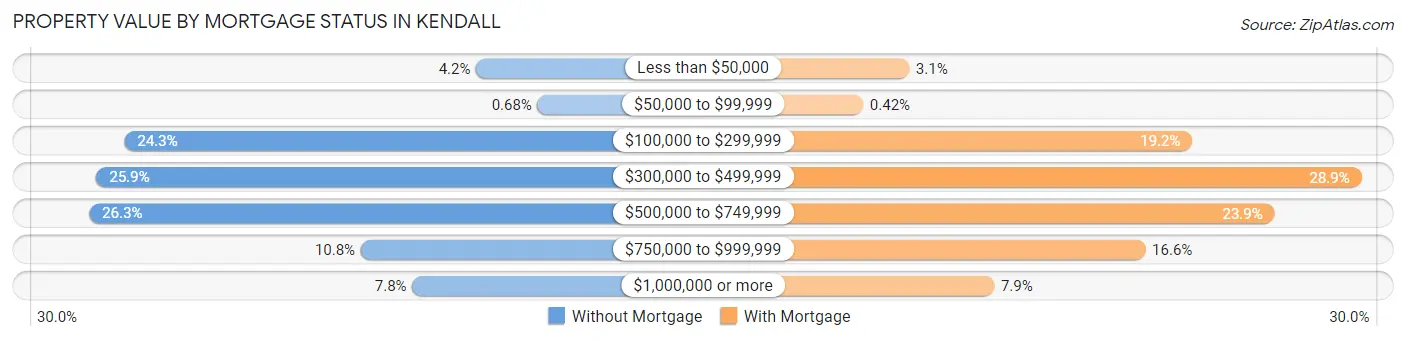
| Property Value | Without Mortgage | With Mortgage |
| Less than $50,000 | 314 (4.2%) | 329 (3.0%) |
| $50,000 to $99,999 | 51 (0.7%) | 45 (0.4%) |
| $100,000 to $299,999 | 1,822 (24.3%) | 2,078 (19.2%) |
| $300,000 to $499,999 | 1,942 (25.9%) | 3,122 (28.9%) |
| $500,000 to $749,999 | 1,973 (26.3%) | 2,585 (23.9%) |
| $750,000 to $999,999 | 808 (10.8%) | 1,787 (16.6%) |
| $1,000,000 or more | 588 (7.8%) | 854 (7.9%) |
| Total | 7,498 (100.0%) | 10,800 (100.0%) |
Household Income by Mortgage Status in Kendall
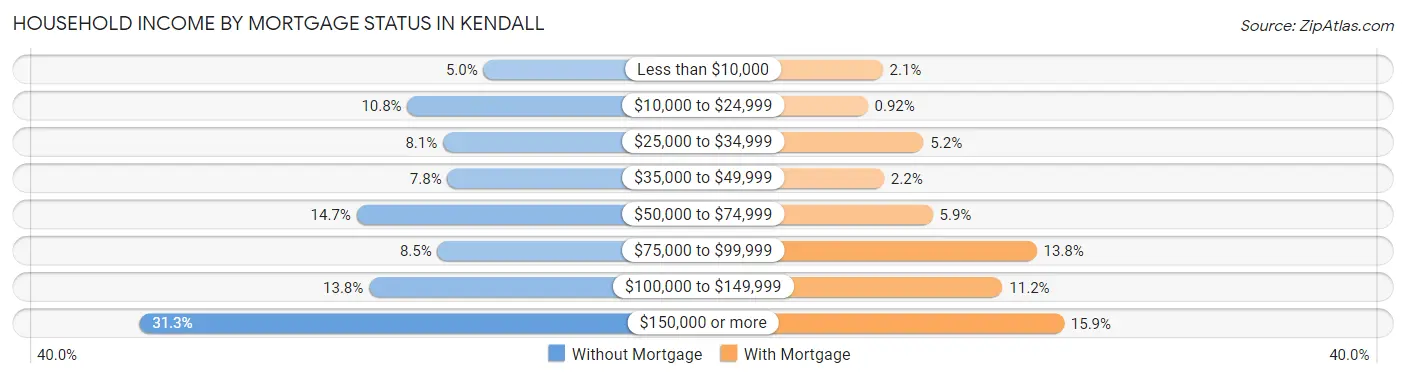
| Household Income | Without Mortgage | With Mortgage |
| Less than $10,000 | 377 (5.0%) | 222 (2.1%) |
| $10,000 to $24,999 | 812 (10.8%) | 99 (0.9%) |
| $25,000 to $34,999 | 609 (8.1%) | 558 (5.2%) |
| $35,000 to $49,999 | 583 (7.8%) | 233 (2.2%) |
| $50,000 to $74,999 | 1,102 (14.7%) | 634 (5.9%) |
| $75,000 to $99,999 | 640 (8.5%) | 1,489 (13.8%) |
| $100,000 to $149,999 | 1,031 (13.8%) | 1,209 (11.2%) |
| $150,000 or more | 2,344 (31.3%) | 1,714 (15.9%) |
| Total | 7,498 (100.0%) | 10,800 (100.0%) |
Property Value to Household Income Ratio in Kendall
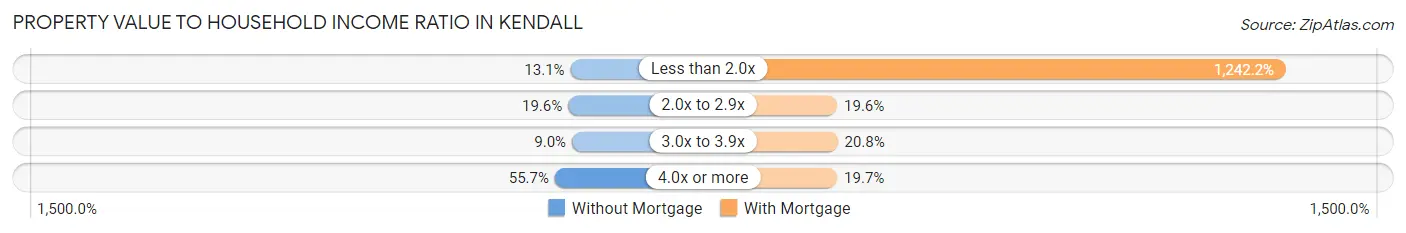
| Value-to-Income Ratio | Without Mortgage | With Mortgage |
| Less than 2.0x | 984 (13.1%) | 134,156 (1,242.2%) |
| 2.0x to 2.9x | 1,471 (19.6%) | 2,114 (19.6%) |
| 3.0x to 3.9x | 675 (9.0%) | 2,244 (20.8%) |
| 4.0x or more | 4,179 (55.7%) | 2,123 (19.7%) |
| Total | 7,498 (100.0%) | 10,800 (100.0%) |
Real Estate Taxes by Mortgage Status in Kendall
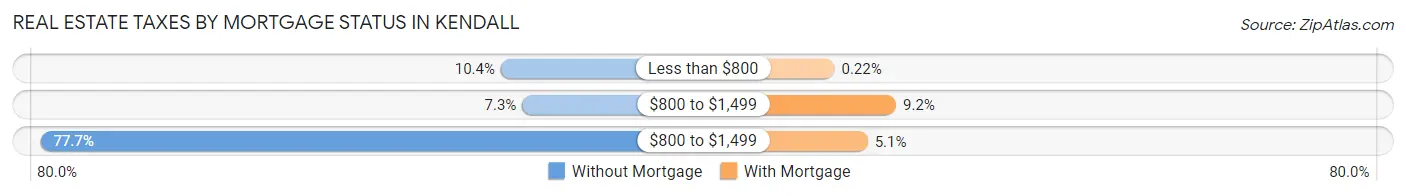
| Property Taxes | Without Mortgage | With Mortgage |
| Less than $800 | 781 (10.4%) | 24 (0.2%) |
| $800 to $1,499 | 547 (7.3%) | 995 (9.2%) |
| $800 to $1,499 | 5,824 (77.7%) | 546 (5.1%) |
| Total | 7,498 (100.0%) | 10,800 (100.0%) |
Health & Disability in Kendall
Health Insurance Coverage by Age in Kendall
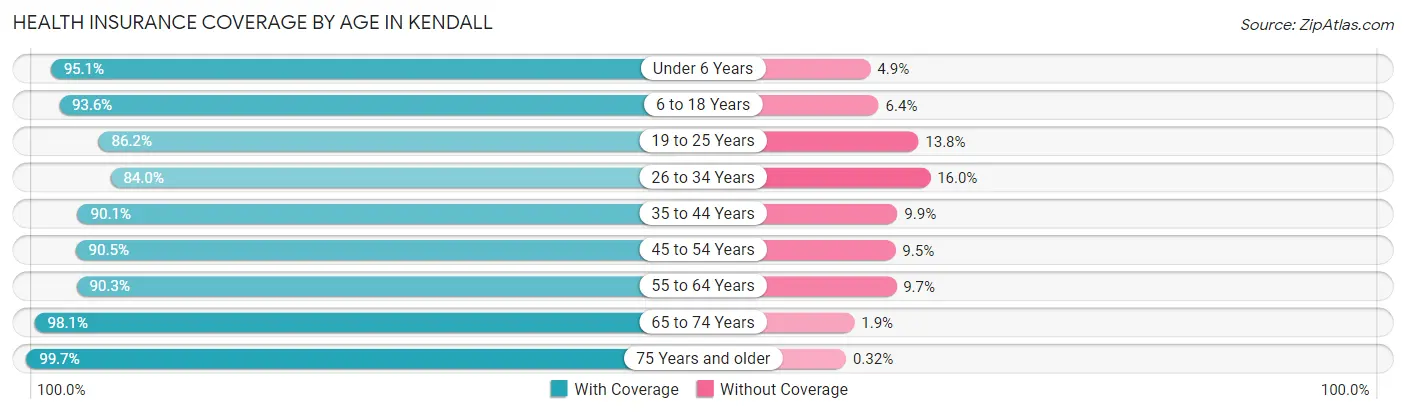
| Age Bracket | With Coverage | Without Coverage |
| Under 6 Years | 4,686 (95.1%) | 240 (4.9%) |
| 6 to 18 Years | 10,997 (93.6%) | 753 (6.4%) |
| 19 to 25 Years | 5,423 (86.2%) | 869 (13.8%) |
| 26 to 34 Years | 7,492 (84.0%) | 1,429 (16.0%) |
| 35 to 44 Years | 9,125 (90.1%) | 1,003 (9.9%) |
| 45 to 54 Years | 9,011 (90.5%) | 949 (9.5%) |
| 55 to 64 Years | 10,058 (90.3%) | 1,078 (9.7%) |
| 65 to 74 Years | 7,290 (98.1%) | 139 (1.9%) |
| 75 Years and older | 7,243 (99.7%) | 23 (0.3%) |
| Total | 71,325 (91.7%) | 6,483 (8.3%) |
Health Insurance Coverage by Citizenship Status in Kendall
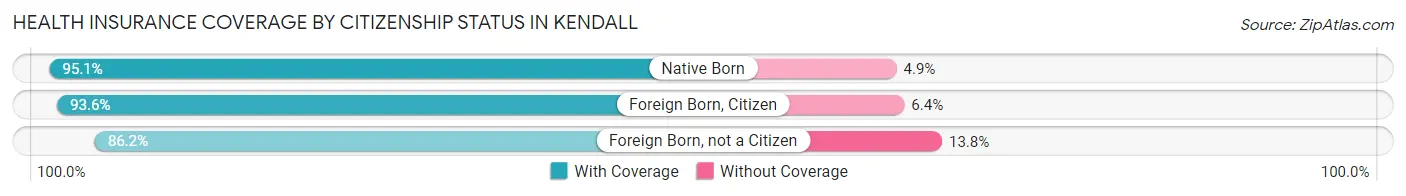
| Citizenship Status | With Coverage | Without Coverage |
| Native Born | 4,686 (95.1%) | 240 (4.9%) |
| Foreign Born, Citizen | 10,997 (93.6%) | 753 (6.4%) |
| Foreign Born, not a Citizen | 5,423 (86.2%) | 869 (13.8%) |
Health Insurance Coverage by Household Income in Kendall
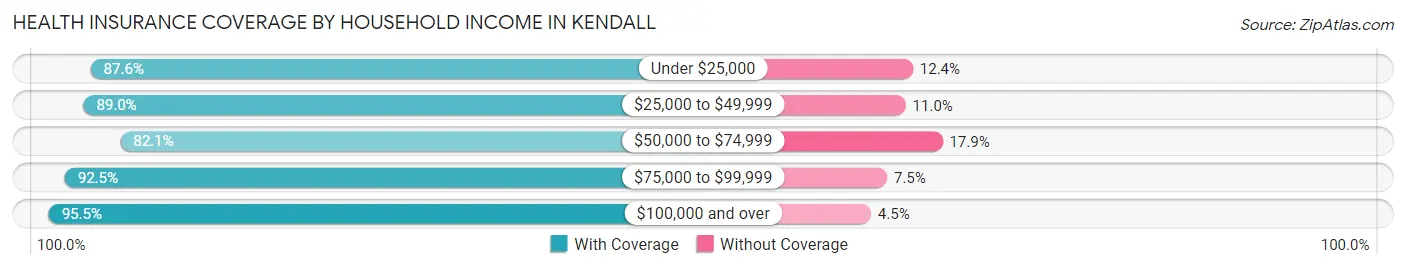
| Household Income | With Coverage | Without Coverage |
| Under $25,000 | 5,569 (87.6%) | 787 (12.4%) |
| $25,000 to $49,999 | 9,197 (89.0%) | 1,140 (11.0%) |
| $50,000 to $74,999 | 9,441 (82.1%) | 2,063 (17.9%) |
| $75,000 to $99,999 | 7,645 (92.5%) | 623 (7.5%) |
| $100,000 and over | 38,488 (95.5%) | 1,820 (4.5%) |
Public vs Private Health Insurance Coverage by Age in Kendall
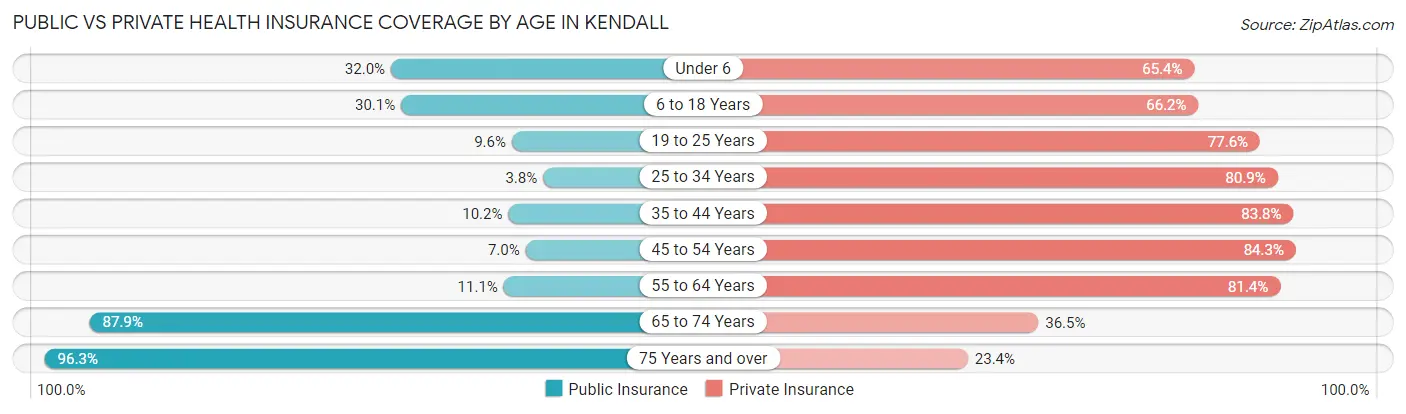
| Age Bracket | Public Insurance | Private Insurance |
| Under 6 | 1,577 (32.0%) | 3,223 (65.4%) |
| 6 to 18 Years | 3,540 (30.1%) | 7,776 (66.2%) |
| 19 to 25 Years | 602 (9.6%) | 4,883 (77.6%) |
| 25 to 34 Years | 336 (3.8%) | 7,216 (80.9%) |
| 35 to 44 Years | 1,035 (10.2%) | 8,488 (83.8%) |
| 45 to 54 Years | 698 (7.0%) | 8,391 (84.3%) |
| 55 to 64 Years | 1,234 (11.1%) | 9,059 (81.4%) |
| 65 to 74 Years | 6,533 (87.9%) | 2,709 (36.5%) |
| 75 Years and over | 6,996 (96.3%) | 1,700 (23.4%) |
| Total | 22,551 (29.0%) | 53,445 (68.7%) |
Disability Status by Sex by Age in Kendall
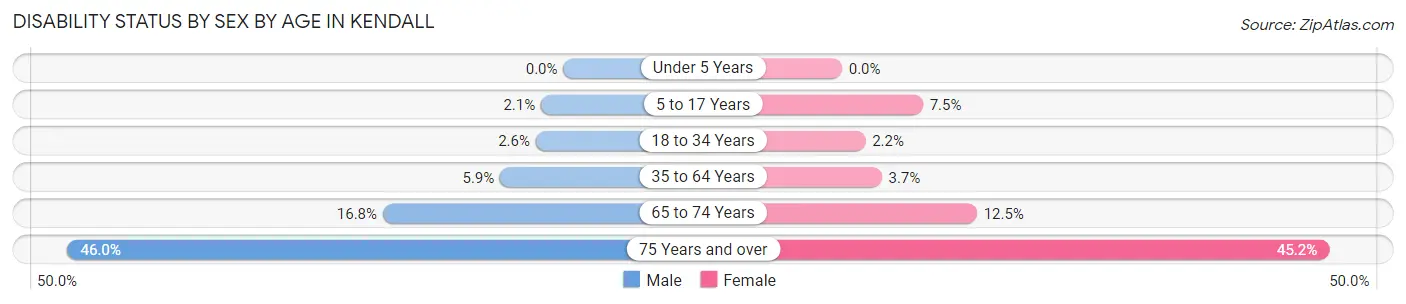
| Age Bracket | Male | Female |
| Under 5 Years | 0 (0.0%) | 0 (0.0%) |
| 5 to 17 Years | 120 (2.1%) | 451 (7.5%) |
| 18 to 34 Years | 222 (2.6%) | 164 (2.2%) |
| 35 to 64 Years | 867 (5.9%) | 607 (3.7%) |
| 65 to 74 Years | 534 (16.8%) | 531 (12.5%) |
| 75 Years and over | 1,193 (46.0%) | 2,113 (45.2%) |
Disability Class by Sex by Age in Kendall
Disability Class: Hearing Difficulty
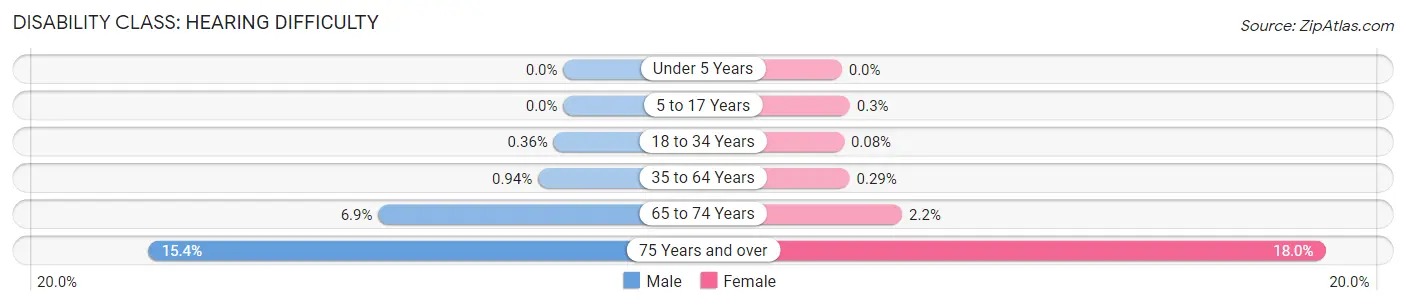
| Age Bracket | Male | Female |
| Under 5 Years | 0 (0.0%) | 0 (0.0%) |
| 5 to 17 Years | 0 (0.0%) | 18 (0.3%) |
| 18 to 34 Years | 31 (0.4%) | 6 (0.1%) |
| 35 to 64 Years | 139 (0.9%) | 48 (0.3%) |
| 65 to 74 Years | 219 (6.9%) | 95 (2.2%) |
| 75 Years and over | 399 (15.4%) | 839 (17.9%) |
Disability Class: Vision Difficulty
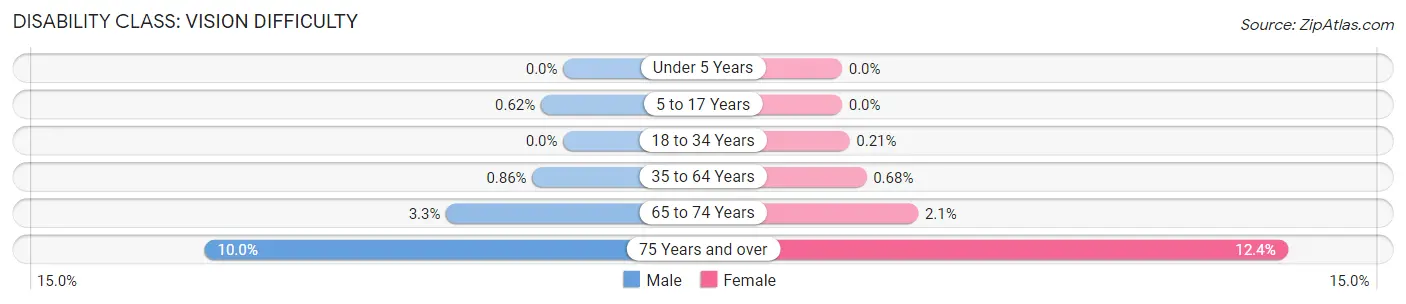
| Age Bracket | Male | Female |
| Under 5 Years | 0 (0.0%) | 0 (0.0%) |
| 5 to 17 Years | 36 (0.6%) | 0 (0.0%) |
| 18 to 34 Years | 0 (0.0%) | 16 (0.2%) |
| 35 to 64 Years | 127 (0.9%) | 112 (0.7%) |
| 65 to 74 Years | 104 (3.3%) | 90 (2.1%) |
| 75 Years and over | 259 (10.0%) | 580 (12.4%) |
Disability Class: Cognitive Difficulty
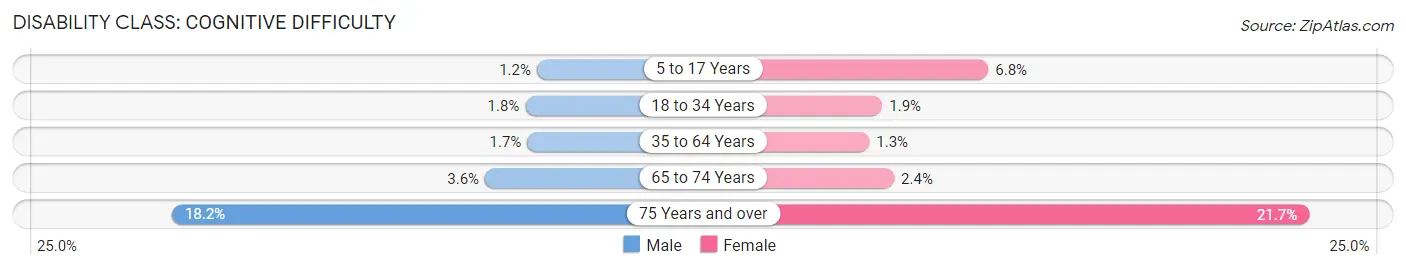
| Age Bracket | Male | Female |
| 5 to 17 Years | 71 (1.2%) | 408 (6.8%) |
| 18 to 34 Years | 153 (1.8%) | 142 (1.9%) |
| 35 to 64 Years | 248 (1.7%) | 210 (1.3%) |
| 65 to 74 Years | 116 (3.6%) | 103 (2.4%) |
| 75 Years and over | 471 (18.2%) | 1,013 (21.7%) |
Disability Class: Ambulatory Difficulty
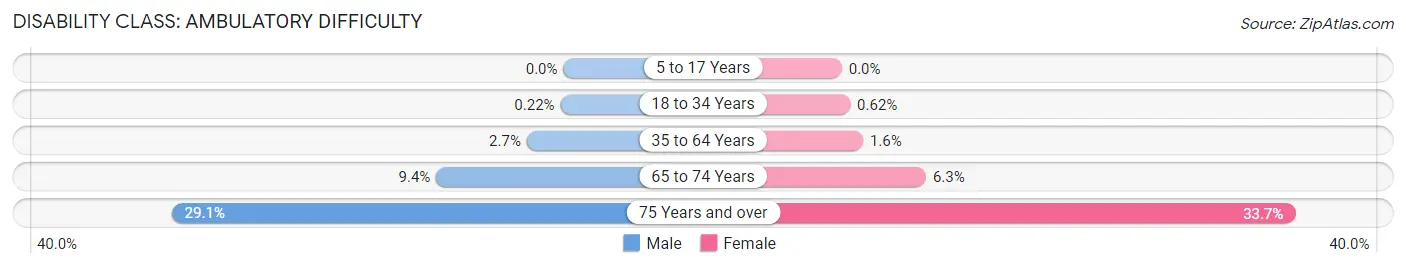
| Age Bracket | Male | Female |
| 5 to 17 Years | 0 (0.0%) | 0 (0.0%) |
| 18 to 34 Years | 19 (0.2%) | 47 (0.6%) |
| 35 to 64 Years | 402 (2.7%) | 258 (1.6%) |
| 65 to 74 Years | 301 (9.4%) | 265 (6.2%) |
| 75 Years and over | 754 (29.1%) | 1,573 (33.7%) |
Disability Class: Self-Care Difficulty
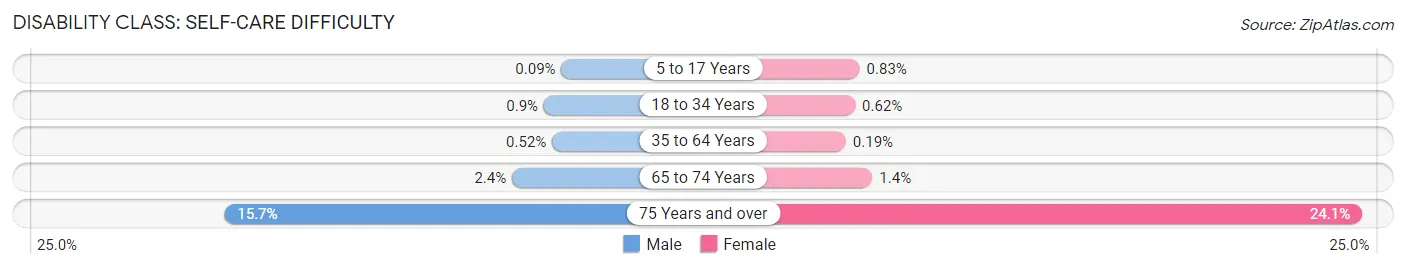
| Age Bracket | Male | Female |
| 5 to 17 Years | 5 (0.1%) | 50 (0.8%) |
| 18 to 34 Years | 78 (0.9%) | 47 (0.6%) |
| 35 to 64 Years | 77 (0.5%) | 31 (0.2%) |
| 65 to 74 Years | 76 (2.4%) | 60 (1.4%) |
| 75 Years and over | 408 (15.7%) | 1,128 (24.1%) |
Technology Access in Kendall
Computing Device Access in Kendall
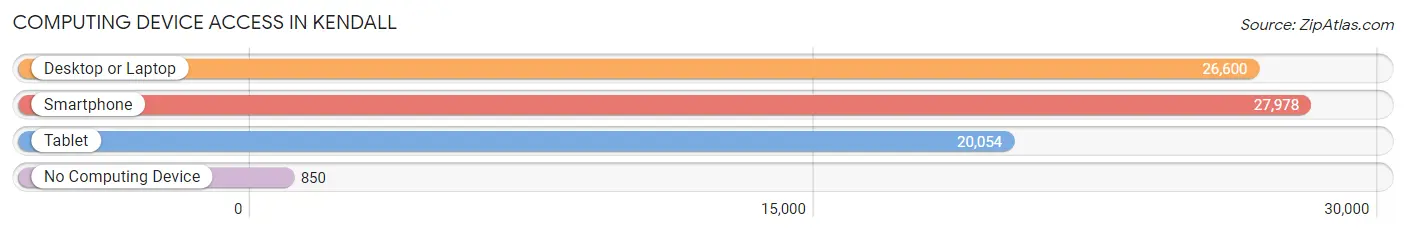
| Device Type | # Households | % Households |
| Desktop or Laptop | 26,600 | 89.2% |
| Smartphone | 27,978 | 93.9% |
| Tablet | 20,054 | 67.3% |
| No Computing Device | 850 | 2.9% |
| Total | 29,810 | 100.0% |
Internet Access in Kendall
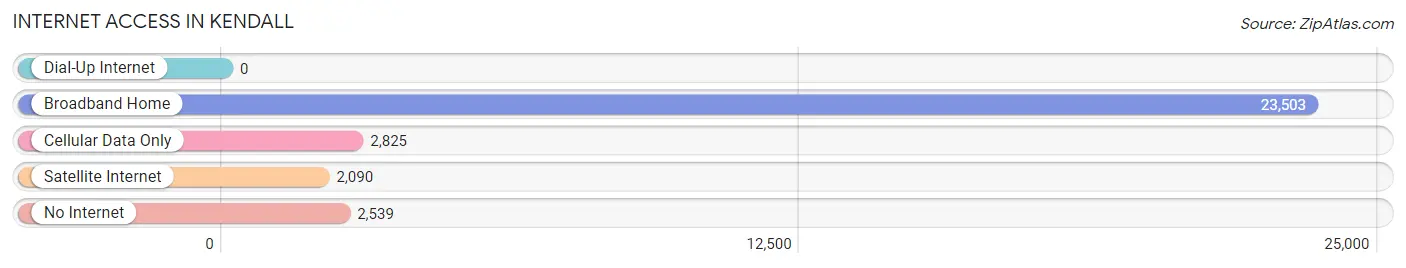
| Internet Type | # Households | % Households |
| Dial-Up Internet | 0 | 0.0% |
| Broadband Home | 23,503 | 78.8% |
| Cellular Data Only | 2,825 | 9.5% |
| Satellite Internet | 2,090 | 7.0% |
| No Internet | 2,539 | 8.5% |
| Total | 29,810 | 100.0% |
Kendall Summary
Kendall is an unincorporated community located in Miami-Dade County, Florida. It is located in the southern part of the county, just south of Miami. The area is known for its diverse population, with a mix of Hispanic, African American, and Caucasian residents. It is also home to a large number of immigrants from Latin America, the Caribbean, and other parts of the world.
Geography
Kendall is located in the southern part of Miami-Dade County, just south of Miami. It is bordered by the cities of Miami, Coral Gables, and South Miami. The area is mostly flat, with some low hills in the northern part of the community. The area is known for its lush vegetation, with many trees and shrubs. The area is also home to several lakes, including Lake Osceola, Lake Palmetto, and Lake Okeechobee.
Economy
Kendall is home to a variety of businesses, including retail stores, restaurants, and professional services. The area is also home to several large employers, including Baptist Health South Florida, Miami-Dade County Public Schools, and the University of Miami. The area is also home to several shopping centers, including The Falls, Dadeland Mall, and Kendall Town Center.
Demographics
As of the 2010 census, Kendall had a population of 75,371. The racial makeup of the community was 57.3% Hispanic, 22.2% White, 15.2% African American, and 5.3% other. The median household income was $50,945, and the median home value was $232,000.
Kendall is a diverse community, with a mix of cultures and backgrounds. The area is home to a large number of immigrants from Latin America, the Caribbean, and other parts of the world. The area is also home to a large number of young professionals and families.
History
Kendall was originally part of a large tract of land owned by the Florida East Coast Railway. The area was developed in the 1950s and 1960s as a residential community. The area was named after Henry Kendall, a former president of the Florida East Coast Railway. The area has grown significantly since then, and is now home to a variety of businesses, shopping centers, and other amenities.
Kendall has become a popular destination for tourists and residents alike. The area is home to a variety of attractions, including the Miami Seaquarium, Zoo Miami, and the Miami Metrozoo. The area is also home to several parks, including Kendall Indian Hammocks Park and Kendall Lakes Park. The area is also home to a variety of restaurants, shops, and other amenities.
Common Questions
What is Per Capita Income in Kendall?
Per Capita income in Kendall is $47,981.
What is the Median Family Income in Kendall?
Median Family Income in Kendall is $106,639.
What is the Median Household income in Kendall?
Median Household Income in Kendall is $84,026.
What is Income or Wage Gap in Kendall?
Income or Wage Gap in Kendall is 11.6%.
Women in Kendall earn 88.4 cents for every dollar earned by a man.
What is Family Income Deficit in Kendall?
Family Income Deficit in Kendall is $8,594.
Families that are below poverty line in Kendall earn $8,594 less on average than the poverty threshold level.
What is Inequality or Gini Index in Kendall?
Inequality or Gini Index in Kendall is 0.49.
What is the Total Population of Kendall?
Total Population of Kendall is 78,402.
What is the Total Male Population of Kendall?
Total Male Population of Kendall is 37,214.
What is the Total Female Population of Kendall?
Total Female Population of Kendall is 41,188.
What is the Ratio of Males per 100 Females in Kendall?
There are 90.35 Males per 100 Females in Kendall.
What is the Ratio of Females per 100 Males in Kendall?
There are 110.68 Females per 100 Males in Kendall.
What is the Median Population Age in Kendall?
Median Population Age in Kendall is 42.0 Years.
What is the Average Family Size in Kendall
Average Family Size in Kendall is 3.1 People.
What is the Average Household Size in Kendall
Average Household Size in Kendall is 2.6 People.
How Large is the Labor Force in Kendall?
There are 42,296 People in the Labor Forcein in Kendall.
What is the Percentage of People in the Labor Force in Kendall?
65.1% of People are in the Labor Force in Kendall.
What is the Unemployment Rate in Kendall?
Unemployment Rate in Kendall is 3.2%.