North Bay Village, FL Map & Demographics
North Bay Village Map
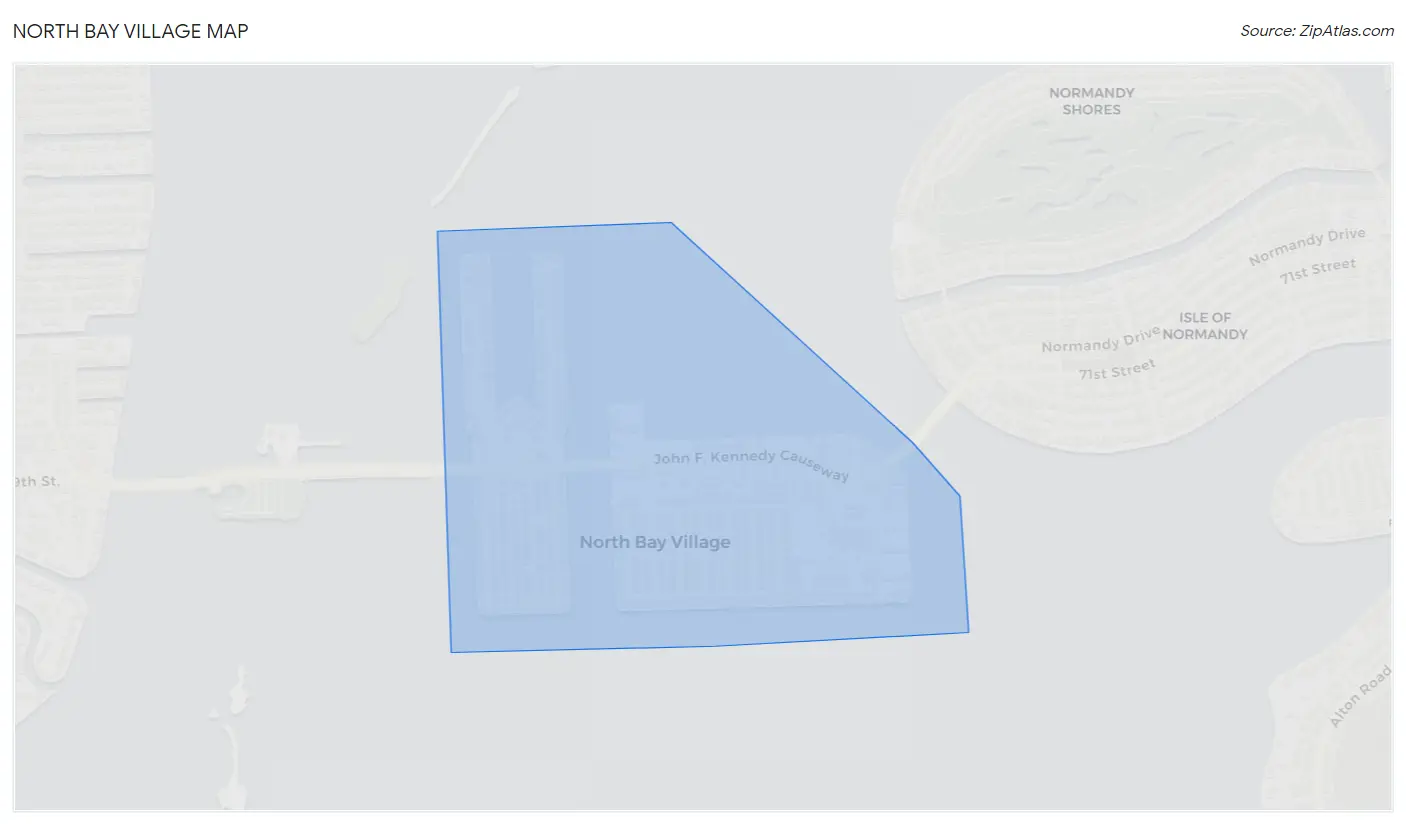
North Bay Village Overview
$40,567
PER CAPITA INCOME
$68,594
AVG FAMILY INCOME
$76,815
AVG HOUSEHOLD INCOME
34.6%
WAGE / INCOME GAP [ % ]
65.4¢/ $1
WAGE / INCOME GAP [ $ ]
$7,208
FAMILY INCOME DEFICIT
0.39
INEQUALITY / GINI INDEX
8,024
TOTAL POPULATION
4,031
MALE POPULATION
3,993
FEMALE POPULATION
100.95
MALES / 100 FEMALES
99.06
FEMALES / 100 MALES
45.3
MEDIAN AGE
2.8
AVG FAMILY SIZE
2.3
AVG HOUSEHOLD SIZE
5,341
LABOR FORCE [ PEOPLE ]
75.1%
PERCENT IN LABOR FORCE
4.3%
UNEMPLOYMENT RATE
Income in North Bay Village
Income Overview in North Bay Village
Per Capita Income in North Bay Village is $40,567, while median incomes of families and households are $68,594 and $76,815 respectively.
| Characteristic | Number | Measure |
| Per Capita Income | 8,024 | $40,567 |
| Median Family Income | 2,083 | $68,594 |
| Mean Family Income | 2,083 | $94,892 |
| Median Household Income | 3,395 | $76,815 |
| Mean Household Income | 3,395 | $92,809 |
| Income Deficit | 2,083 | $7,208 |
| Wage / Income Gap (%) | 8,024 | 34.56% |
| Wage / Income Gap ($) | 8,024 | 65.44¢ per $1 |
| Gini / Inequality Index | 8,024 | 0.39 |
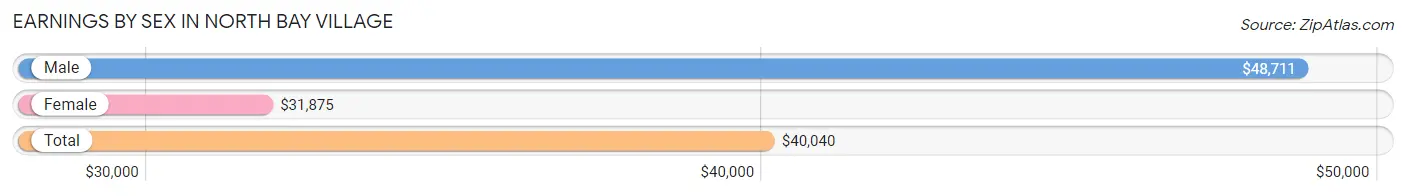
Earnings by Sex in North Bay Village
Average Earnings in North Bay Village are $40,040, $48,711 for men and $31,875 for women, a difference of 34.6%.
| Sex | Number | Average Earnings |
| Male | 2,853 (52.5%) | $48,711 |
| Female | 2,579 (47.5%) | $31,875 |
| Total | 5,432 (100.0%) | $40,040 |
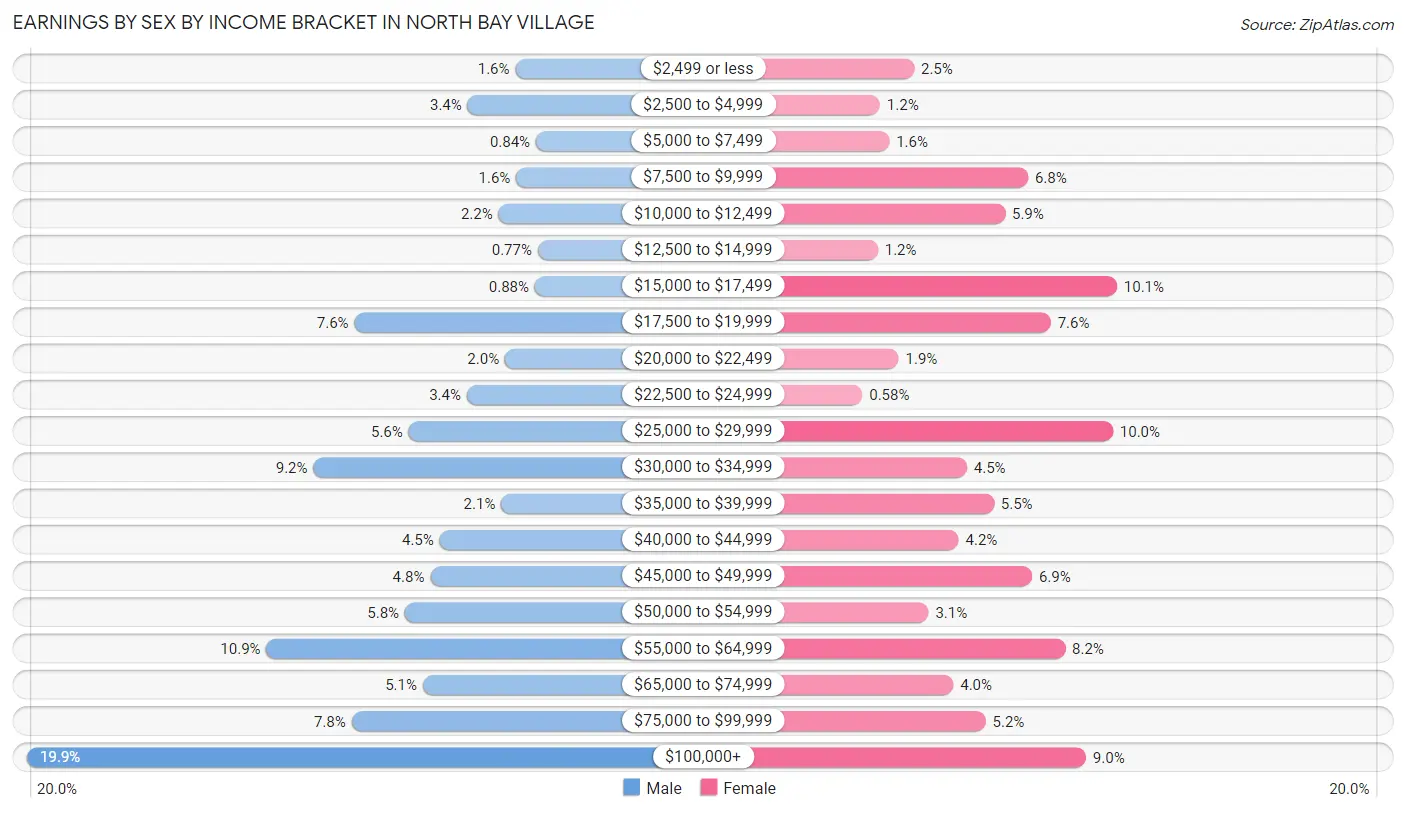
Earnings by Sex by Income Bracket in North Bay Village
The most common earnings brackets in North Bay Village are $100,000+ for men (568 | 19.9%) and $15,000 to $17,499 for women (261 | 10.1%).
| Income | Male | Female |
| $2,499 or less | 46 (1.6%) | 65 (2.5%) |
| $2,500 to $4,999 | 97 (3.4%) | 32 (1.2%) |
| $5,000 to $7,499 | 24 (0.8%) | 41 (1.6%) |
| $7,500 to $9,999 | 45 (1.6%) | 175 (6.8%) |
| $10,000 to $12,499 | 64 (2.2%) | 153 (5.9%) |
| $12,500 to $14,999 | 22 (0.8%) | 30 (1.2%) |
| $15,000 to $17,499 | 25 (0.9%) | 261 (10.1%) |
| $17,500 to $19,999 | 218 (7.6%) | 197 (7.6%) |
| $20,000 to $22,499 | 57 (2.0%) | 50 (1.9%) |
| $22,500 to $24,999 | 98 (3.4%) | 15 (0.6%) |
| $25,000 to $29,999 | 160 (5.6%) | 257 (10.0%) |
| $30,000 to $34,999 | 262 (9.2%) | 116 (4.5%) |
| $35,000 to $39,999 | 61 (2.1%) | 142 (5.5%) |
| $40,000 to $44,999 | 127 (4.4%) | 108 (4.2%) |
| $45,000 to $49,999 | 137 (4.8%) | 179 (6.9%) |
| $50,000 to $54,999 | 164 (5.8%) | 79 (3.1%) |
| $55,000 to $64,999 | 312 (10.9%) | 211 (8.2%) |
| $65,000 to $74,999 | 145 (5.1%) | 103 (4.0%) |
| $75,000 to $99,999 | 221 (7.7%) | 134 (5.2%) |
| $100,000+ | 568 (19.9%) | 231 (9.0%) |
| Total | 2,853 (100.0%) | 2,579 (100.0%) |
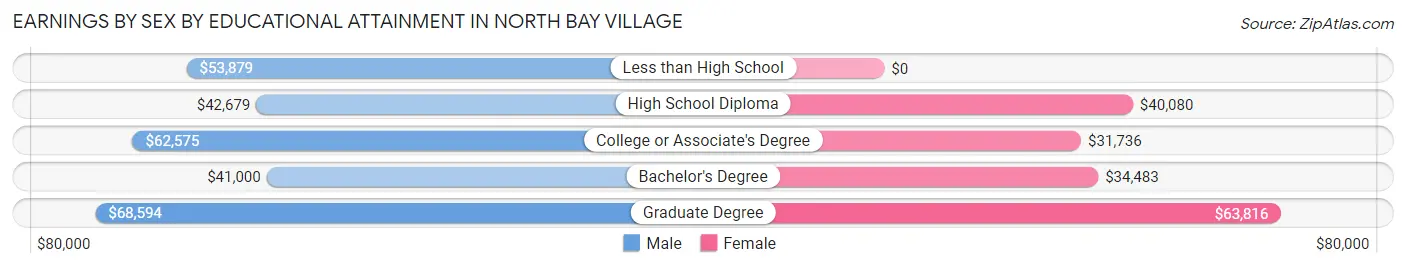
Earnings by Sex by Educational Attainment in North Bay Village
Average earnings in North Bay Village are $51,194 for men and $39,000 for women, a difference of 23.8%. Men with an educational attainment of graduate degree enjoy the highest average annual earnings of $68,594, while those with bachelor's degree education earn the least with $41,000. Women with an educational attainment of graduate degree earn the most with the average annual earnings of $63,816, while those with college or associate's degree education have the smallest earnings of $31,736.
| Educational Attainment | Male Income | Female Income |
| Less than High School | $53,879 | $0 |
| High School Diploma | $42,679 | $40,080 |
| College or Associate's Degree | $62,575 | $31,736 |
| Bachelor's Degree | $41,000 | $34,483 |
| Graduate Degree | $68,594 | $63,816 |
| Total | $51,194 | $39,000 |
Family Income in North Bay Village
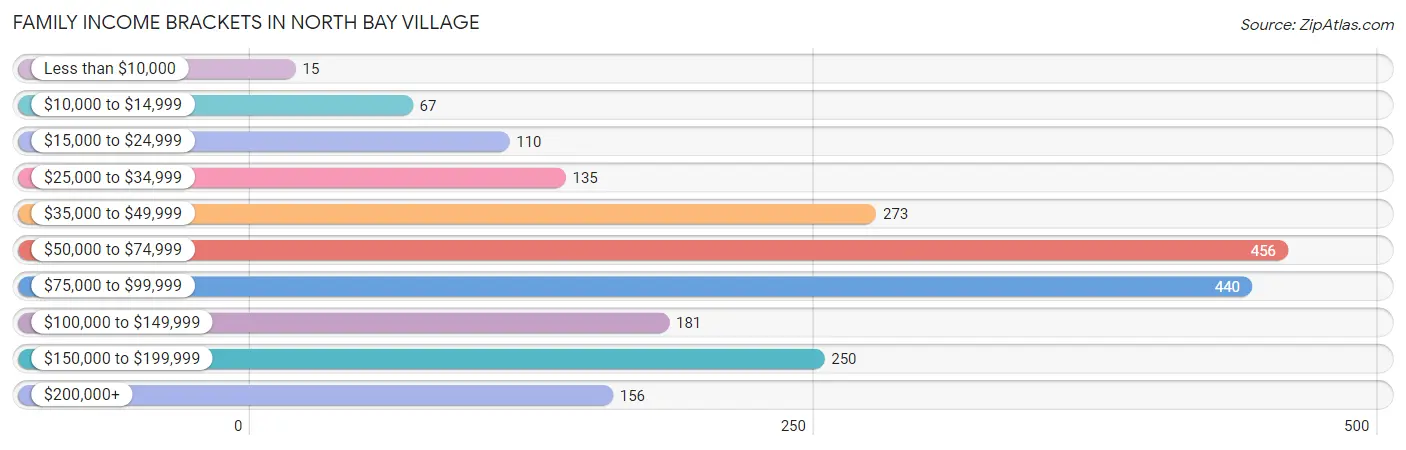
Family Income Brackets in North Bay Village
According to the North Bay Village family income data, there are 456 families falling into the $50,000 to $74,999 income range, which is the most common income bracket and makes up 21.9% of all families. Conversely, the less than $10,000 income bracket is the least frequent group with only 15 families (0.7%) belonging to this category.
| Income Bracket | # Families | % Families |
| Less than $10,000 | 15 | 0.7% |
| $10,000 to $14,999 | 67 | 3.2% |
| $15,000 to $24,999 | 110 | 5.3% |
| $25,000 to $34,999 | 135 | 6.5% |
| $35,000 to $49,999 | 273 | 13.1% |
| $50,000 to $74,999 | 456 | 21.9% |
| $75,000 to $99,999 | 440 | 21.1% |
| $100,000 to $149,999 | 181 | 8.7% |
| $150,000 to $199,999 | 250 | 12.0% |
| $200,000+ | 156 | 7.5% |
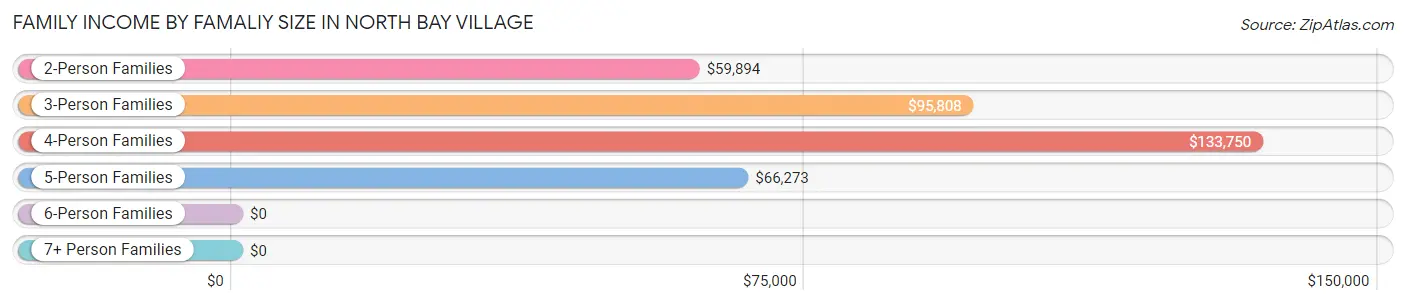
Family Income by Famaliy Size in North Bay Village
4-person families (262 | 12.6%) account for the highest median family income in North Bay Village with $133,750 per family, while 4-person families (262 | 12.6%) have the highest median income of $33,438 per family member.
| Income Bracket | # Families | Median Income |
| 2-Person Families | 1,248 (59.9%) | $59,894 |
| 3-Person Families | 481 (23.1%) | $95,808 |
| 4-Person Families | 262 (12.6%) | $133,750 |
| 5-Person Families | 92 (4.4%) | $66,273 |
| 6-Person Families | 0 (0.0%) | $0 |
| 7+ Person Families | 0 (0.0%) | $0 |
| Total | 2,083 (100.0%) | $68,594 |
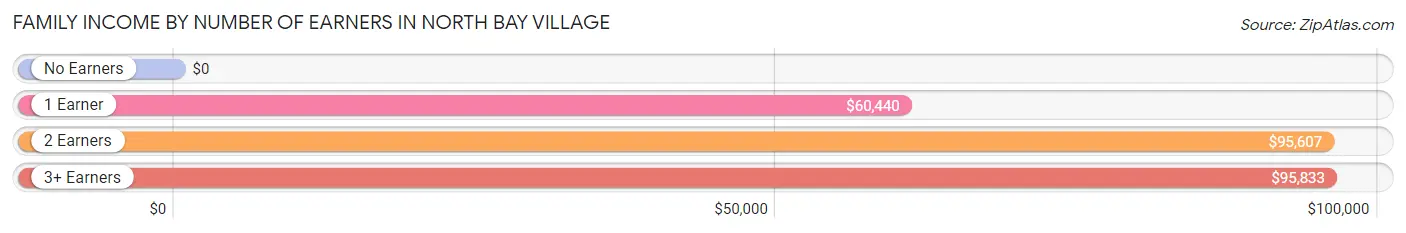
Family Income by Number of Earners in North Bay Village
| Number of Earners | # Families | Median Income |
| No Earners | 66 (3.2%) | $0 |
| 1 Earner | 790 (37.9%) | $60,440 |
| 2 Earners | 929 (44.6%) | $95,607 |
| 3+ Earners | 298 (14.3%) | $95,833 |
| Total | 2,083 (100.0%) | $68,594 |
Household Income in North Bay Village
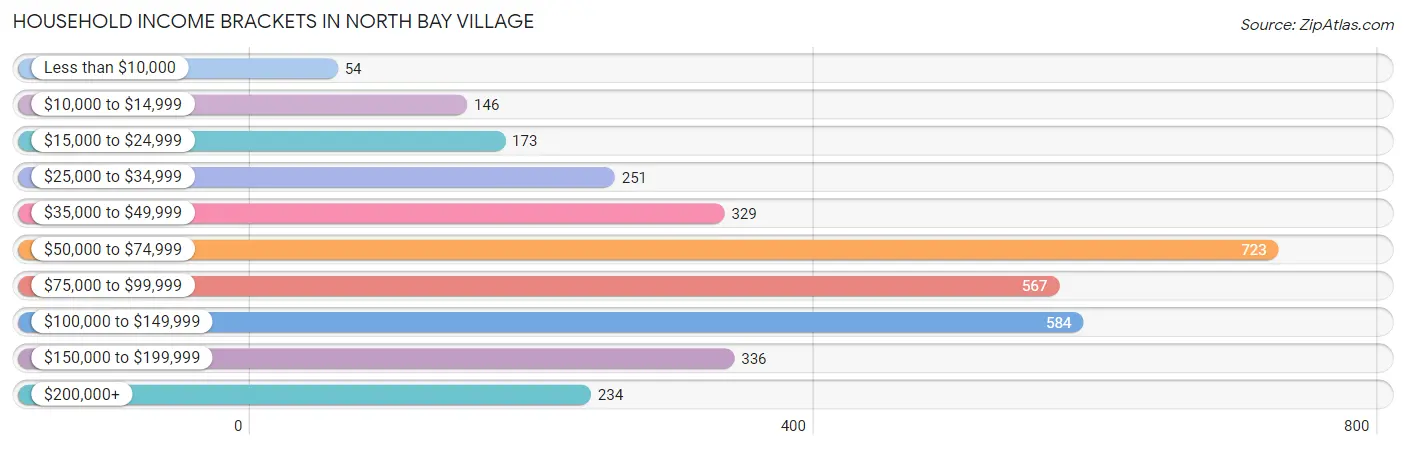
Household Income Brackets in North Bay Village
With 723 households falling in the category, the $50,000 to $74,999 income range is the most frequent in North Bay Village, accounting for 21.3% of all households. In contrast, only 54 households (1.6%) fall into the less than $10,000 income bracket, making it the least populous group.
| Income Bracket | # Households | % Households |
| Less than $10,000 | 54 | 1.6% |
| $10,000 to $14,999 | 146 | 4.3% |
| $15,000 to $24,999 | 173 | 5.1% |
| $25,000 to $34,999 | 251 | 7.4% |
| $35,000 to $49,999 | 329 | 9.7% |
| $50,000 to $74,999 | 723 | 21.3% |
| $75,000 to $99,999 | 567 | 16.7% |
| $100,000 to $149,999 | 584 | 17.2% |
| $150,000 to $199,999 | 336 | 9.9% |
| $200,000+ | 234 | 6.9% |
Household Income by Householder Age in North Bay Village
The median household income in North Bay Village is $76,815, with the highest median household income of $95,478 found in the 45 to 64 years age bracket for the primary householder. A total of 1,437 households (42.3%) fall into this category. Meanwhile, the 15 to 24 years age bracket for the primary householder has the lowest median household income of $50,313, with 86 households (2.5%) in this group.
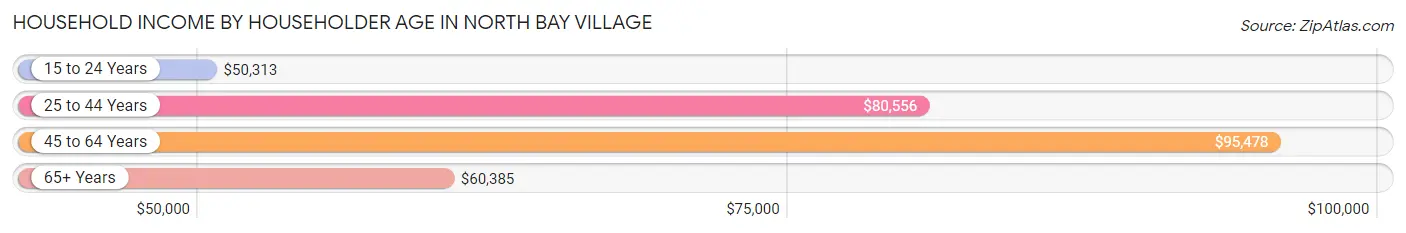
| Income Bracket | # Households | Median Income |
| 15 to 24 Years | 86 (2.5%) | $50,313 |
| 25 to 44 Years | 1,242 (36.6%) | $80,556 |
| 45 to 64 Years | 1,437 (42.3%) | $95,478 |
| 65+ Years | 630 (18.6%) | $60,385 |
| Total | 3,395 (100.0%) | $76,815 |
Poverty in North Bay Village
Income Below Poverty by Sex and Age in North Bay Village
With 8.1% poverty level for males and 10.8% for females among the residents of North Bay Village, 75 year old and over males and 5 year old females are the most vulnerable to poverty, with 41 males (35.3%) and 7 females (100.0%) in their respective age groups living below the poverty level.
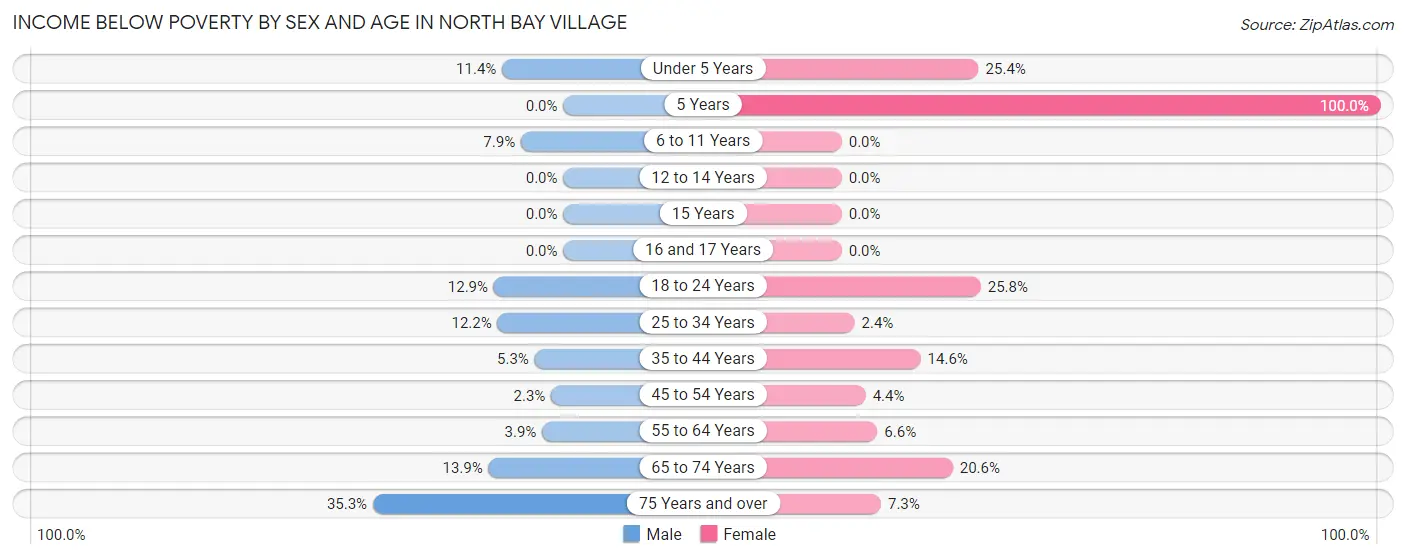
| Age Bracket | Male | Female |
| Under 5 Years | 25 (11.4%) | 32 (25.4%) |
| 5 Years | 0 (0.0%) | 7 (100.0%) |
| 6 to 11 Years | 18 (7.9%) | 0 (0.0%) |
| 12 to 14 Years | 0 (0.0%) | 0 (0.0%) |
| 15 Years | 0 (0.0%) | 0 (0.0%) |
| 16 and 17 Years | 0 (0.0%) | 0 (0.0%) |
| 18 to 24 Years | 20 (12.9%) | 137 (25.8%) |
| 25 to 34 Years | 76 (12.2%) | 15 (2.4%) |
| 35 to 44 Years | 28 (5.3%) | 70 (14.6%) |
| 45 to 54 Years | 12 (2.3%) | 35 (4.4%) |
| 55 to 64 Years | 38 (3.9%) | 32 (6.6%) |
| 65 to 74 Years | 60 (13.9%) | 82 (20.6%) |
| 75 Years and over | 41 (35.3%) | 11 (7.3%) |
| Total | 318 (8.1%) | 421 (10.8%) |
Income Above Poverty by Sex and Age in North Bay Village
According to the poverty statistics in North Bay Village, males aged 5 years and females aged 6 to 11 years are the age groups that are most secure financially, with 100.0% of males and 100.0% of females in these age groups living above the poverty line.
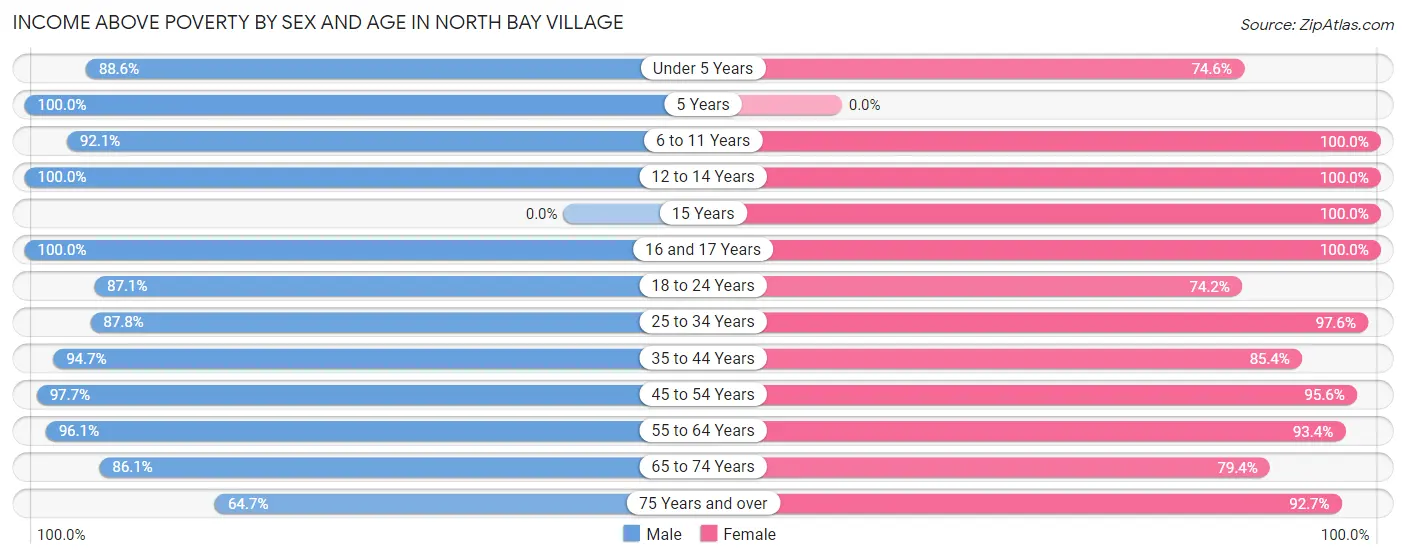
| Age Bracket | Male | Female |
| Under 5 Years | 195 (88.6%) | 94 (74.6%) |
| 5 Years | 6 (100.0%) | 0 (0.0%) |
| 6 to 11 Years | 211 (92.1%) | 47 (100.0%) |
| 12 to 14 Years | 46 (100.0%) | 190 (100.0%) |
| 15 Years | 0 (0.0%) | 41 (100.0%) |
| 16 and 17 Years | 66 (100.0%) | 20 (100.0%) |
| 18 to 24 Years | 135 (87.1%) | 394 (74.2%) |
| 25 to 34 Years | 546 (87.8%) | 616 (97.6%) |
| 35 to 44 Years | 498 (94.7%) | 408 (85.4%) |
| 45 to 54 Years | 518 (97.7%) | 754 (95.6%) |
| 55 to 64 Years | 928 (96.1%) | 452 (93.4%) |
| 65 to 74 Years | 372 (86.1%) | 316 (79.4%) |
| 75 Years and over | 75 (64.7%) | 140 (92.7%) |
| Total | 3,596 (91.9%) | 3,472 (89.2%) |
Income Below Poverty Among Married-Couple Families in North Bay Village
The poverty statistics for married-couple families in North Bay Village show that 6.0% or 92 of the total 1,521 families live below the poverty line. Families with 1 or 2 children have the highest poverty rate of 9.0%, comprising of 32 families. On the other hand, families with no children have the lowest poverty rate of 5.1%, which includes 60 families.
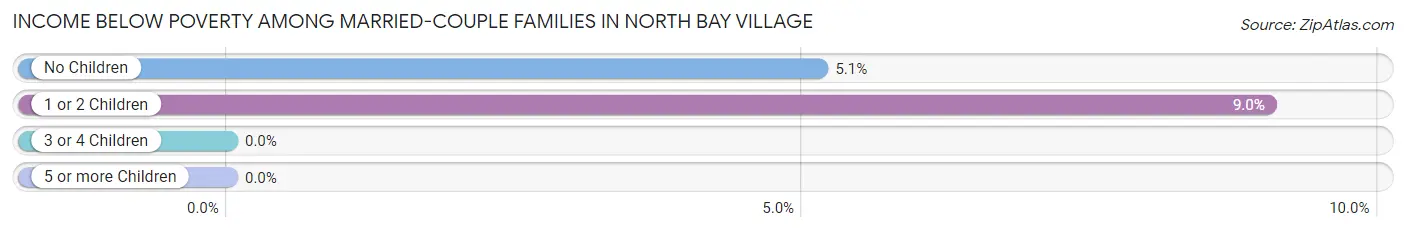
| Children | Above Poverty | Below Poverty |
| No Children | 1,107 (94.9%) | 60 (5.1%) |
| 1 or 2 Children | 322 (91.0%) | 32 (9.0%) |
| 3 or 4 Children | 0 (0.0%) | 0 (0.0%) |
| 5 or more Children | 0 (0.0%) | 0 (0.0%) |
| Total | 1,429 (94.0%) | 92 (6.0%) |
Income Below Poverty Among Single-Parent Households in North Bay Village
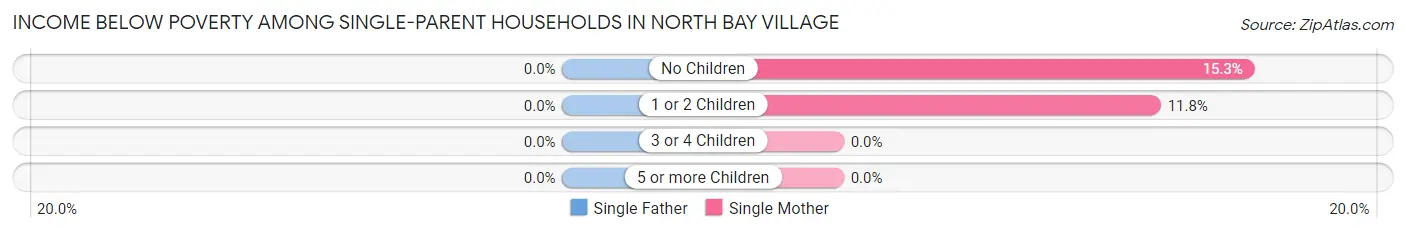
| Children | Single Father | Single Mother |
| No Children | 0 (0.0%) | 32 (15.3%) |
| 1 or 2 Children | 0 (0.0%) | 15 (11.8%) |
| 3 or 4 Children | 0 (0.0%) | 0 (0.0%) |
| 5 or more Children | 0 (0.0%) | 0 (0.0%) |
| Total | 0 (0.0%) | 47 (14.0%) |
Income Below Poverty Among Married-Couple vs Single-Parent Households in North Bay Village
The poverty data for North Bay Village shows that 92 of the married-couple family households (6.0%) and 47 of the single-parent households (8.4%) are living below the poverty level. Within the married-couple family households, those with 1 or 2 children have the highest poverty rate, with 32 households (9.0%) falling below the poverty line. Among the single-parent households, those with no children have the highest poverty rate, with 32 household (9.6%) living below poverty.
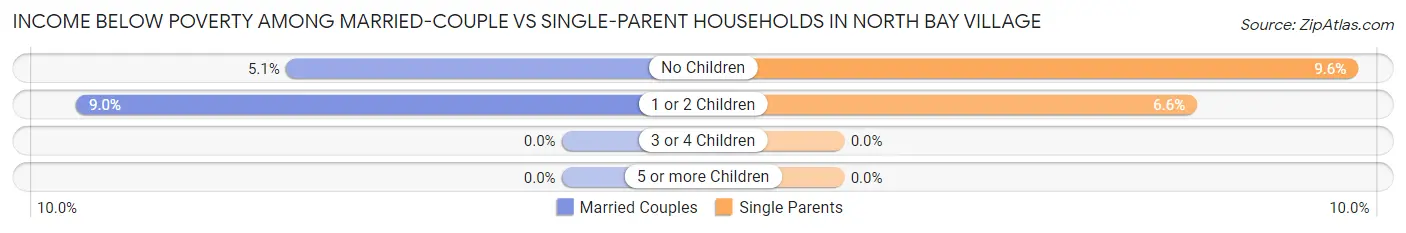
| Children | Married-Couple Families | Single-Parent Households |
| No Children | 60 (5.1%) | 32 (9.6%) |
| 1 or 2 Children | 32 (9.0%) | 15 (6.6%) |
| 3 or 4 Children | 0 (0.0%) | 0 (0.0%) |
| 5 or more Children | 0 (0.0%) | 0 (0.0%) |
| Total | 92 (6.0%) | 47 (8.4%) |
Race in North Bay Village
The most populous races in North Bay Village are Hispanic or Latino (4,958 | 61.8%), White / Caucasian (3,746 | 46.7%), and Two or more Races (2,187 | 27.3%).
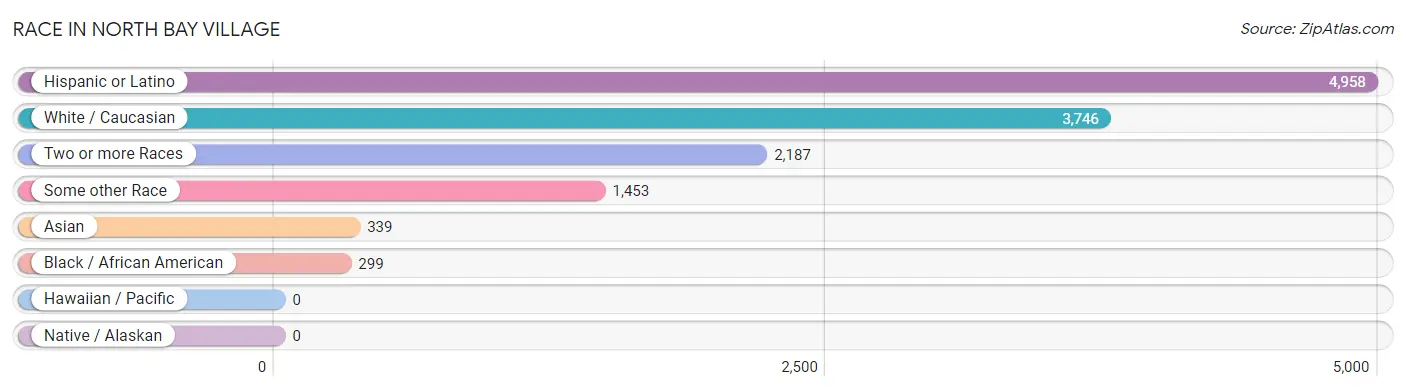
| Race | # Population | % Population |
| Asian | 339 | 4.2% |
| Black / African American | 299 | 3.7% |
| Hawaiian / Pacific | 0 | 0.0% |
| Hispanic or Latino | 4,958 | 61.8% |
| Native / Alaskan | 0 | 0.0% |
| White / Caucasian | 3,746 | 46.7% |
| Two or more Races | 2,187 | 27.3% |
| Some other Race | 1,453 | 18.1% |
| Total | 8,024 | 100.0% |
Ancestry in North Bay Village
The most populous ancestries reported in North Bay Village are South American (2,324 | 29.0%), Cuban (1,778 | 22.2%), Colombian (937 | 11.7%), Venezuelan (548 | 6.8%), and Arab (510 | 6.4%), together accounting for 76.0% of all North Bay Village residents.
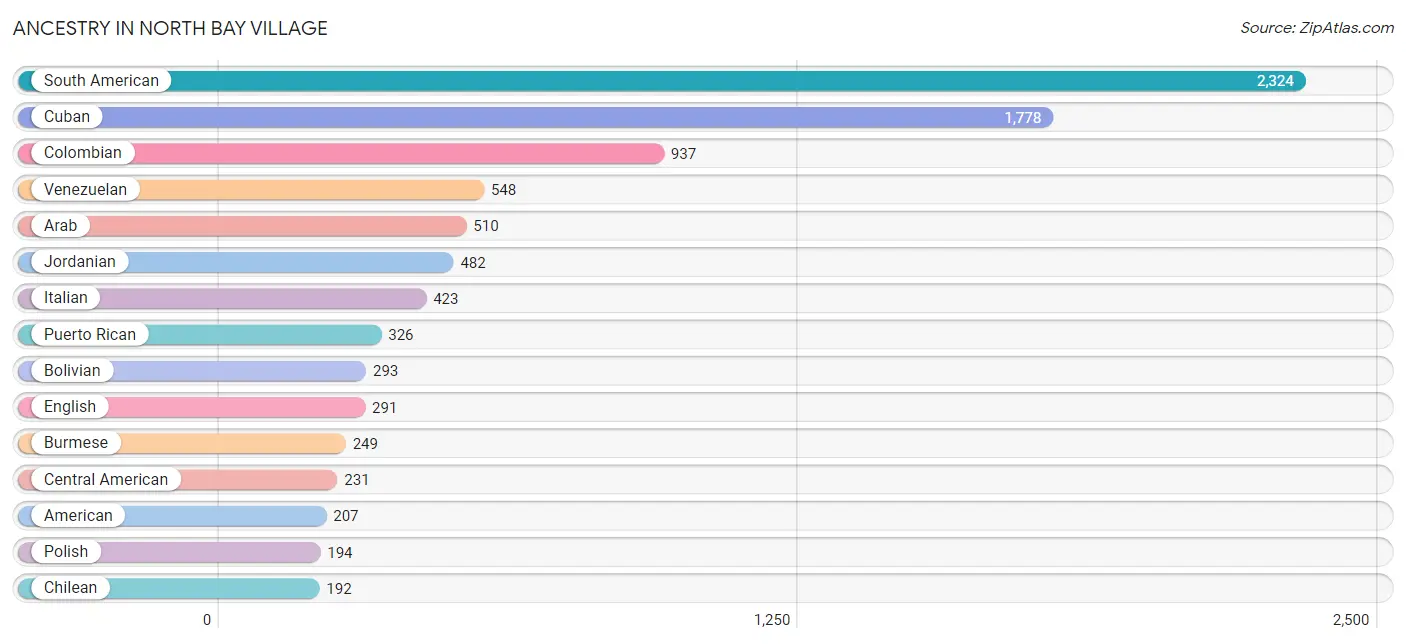
| Ancestry | # Population | % Population |
| African | 58 | 0.7% |
| American | 207 | 2.6% |
| Arab | 510 | 6.4% |
| Argentinean | 143 | 1.8% |
| Armenian | 8 | 0.1% |
| Basque | 5 | 0.1% |
| Bolivian | 293 | 3.6% |
| Brazilian | 100 | 1.3% |
| Burmese | 249 | 3.1% |
| Canadian | 24 | 0.3% |
| Central American | 231 | 2.9% |
| Chilean | 192 | 2.4% |
| Colombian | 937 | 11.7% |
| Costa Rican | 8 | 0.1% |
| Cuban | 1,778 | 22.2% |
| Danish | 7 | 0.1% |
| Dominican | 40 | 0.5% |
| Ecuadorian | 64 | 0.8% |
| Egyptian | 9 | 0.1% |
| English | 291 | 3.6% |
| European | 12 | 0.2% |
| French | 88 | 1.1% |
| German | 163 | 2.0% |
| Haitian | 101 | 1.3% |
| Honduran | 122 | 1.5% |
| Hungarian | 24 | 0.3% |
| Indian (Asian) | 46 | 0.6% |
| Irish | 114 | 1.4% |
| Italian | 423 | 5.3% |
| Jordanian | 482 | 6.0% |
| Korean | 76 | 0.9% |
| Lebanese | 19 | 0.2% |
| Lithuanian | 10 | 0.1% |
| Mexican | 51 | 0.6% |
| Nicaraguan | 32 | 0.4% |
| Nigerian | 33 | 0.4% |
| Panamanian | 50 | 0.6% |
| Peruvian | 147 | 1.8% |
| Polish | 194 | 2.4% |
| Portuguese | 113 | 1.4% |
| Puerto Rican | 326 | 4.1% |
| Romanian | 21 | 0.3% |
| Russian | 105 | 1.3% |
| Salvadoran | 19 | 0.2% |
| Scandinavian | 30 | 0.4% |
| Scotch-Irish | 11 | 0.1% |
| Scottish | 43 | 0.5% |
| South American | 2,324 | 29.0% |
| Spaniard | 76 | 0.9% |
| Spanish | 43 | 0.5% |
| Subsaharan African | 91 | 1.1% |
| Swedish | 44 | 0.5% |
| Swiss | 6 | 0.1% |
| Thai | 113 | 1.4% |
| Trinidadian and Tobagonian | 9 | 0.1% |
| Turkish | 43 | 0.5% |
| Ukrainian | 10 | 0.1% |
| Venezuelan | 548 | 6.8% |
| Welsh | 10 | 0.1% | View All 59 Rows |
Immigrants in North Bay Village
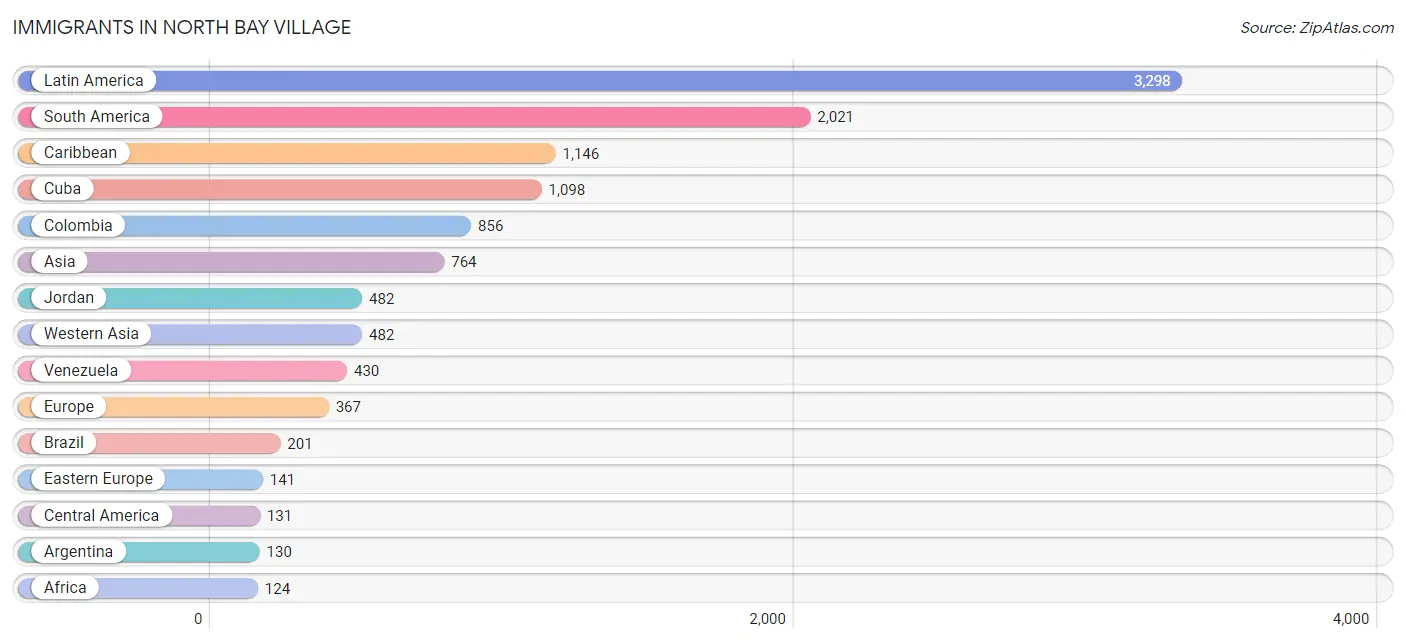
The most numerous immigrant groups reported in North Bay Village came from Latin America (3,298 | 41.1%), South America (2,021 | 25.2%), Caribbean (1,146 | 14.3%), Cuba (1,098 | 13.7%), and Colombia (856 | 10.7%), together accounting for 104.9% of all North Bay Village residents.
| Immigration Origin | # Population | % Population |
| Africa | 124 | 1.5% |
| Argentina | 130 | 1.6% |
| Asia | 764 | 9.5% |
| Bolivia | 116 | 1.5% |
| Brazil | 201 | 2.5% |
| Canada | 12 | 0.2% |
| Caribbean | 1,146 | 14.3% |
| Central America | 131 | 1.6% |
| Chile | 105 | 1.3% |
| China | 46 | 0.6% |
| Colombia | 856 | 10.7% |
| Cuba | 1,098 | 13.7% |
| Eastern Asia | 97 | 1.2% |
| Eastern Europe | 141 | 1.8% |
| Ecuador | 64 | 0.8% |
| Egypt | 17 | 0.2% |
| El Salvador | 13 | 0.2% |
| England | 9 | 0.1% |
| Europe | 367 | 4.6% |
| France | 32 | 0.4% |
| Germany | 45 | 0.6% |
| Haiti | 39 | 0.5% |
| Honduras | 64 | 0.8% |
| India | 113 | 1.4% |
| Indonesia | 6 | 0.1% |
| Italy | 105 | 1.3% |
| Jordan | 482 | 6.0% |
| Korea | 51 | 0.6% |
| Latin America | 3,298 | 41.1% |
| Mexico | 21 | 0.3% |
| Moldova | 20 | 0.3% |
| Netherlands | 10 | 0.1% |
| Nicaragua | 9 | 0.1% |
| Northern Africa | 17 | 0.2% |
| Northern Europe | 30 | 0.4% |
| Panama | 24 | 0.3% |
| Peru | 119 | 1.5% |
| Philippines | 58 | 0.7% |
| Russia | 107 | 1.3% |
| South Africa | 74 | 0.9% |
| South America | 2,021 | 25.2% |
| South Central Asia | 121 | 1.5% |
| South Eastern Asia | 64 | 0.8% |
| Southern Europe | 109 | 1.4% |
| Spain | 4 | 0.1% |
| Sweden | 21 | 0.3% |
| Taiwan | 9 | 0.1% |
| Trinidad and Tobago | 9 | 0.1% |
| Uzbekistan | 8 | 0.1% |
| Venezuela | 430 | 5.4% |
| Western Asia | 482 | 6.0% |
| Western Europe | 87 | 1.1% | View All 52 Rows |
Sex and Age in North Bay Village
Sex and Age in North Bay Village
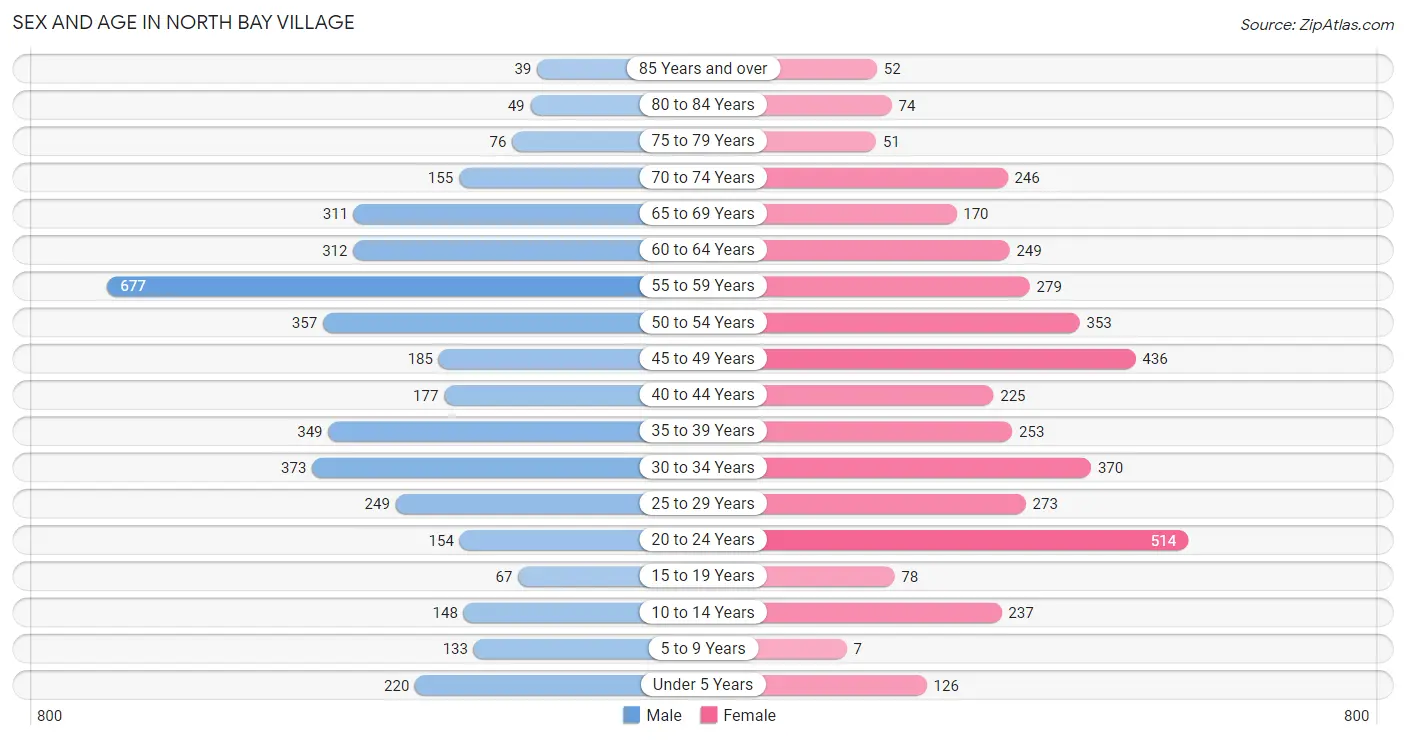
The most populous age groups in North Bay Village are 55 to 59 Years (677 | 16.8%) for men and 20 to 24 Years (514 | 12.9%) for women.
| Age Bracket | Male | Female |
| Under 5 Years | 220 (5.5%) | 126 (3.2%) |
| 5 to 9 Years | 133 (3.3%) | 7 (0.2%) |
| 10 to 14 Years | 148 (3.7%) | 237 (5.9%) |
| 15 to 19 Years | 67 (1.7%) | 78 (1.9%) |
| 20 to 24 Years | 154 (3.8%) | 514 (12.9%) |
| 25 to 29 Years | 249 (6.2%) | 273 (6.8%) |
| 30 to 34 Years | 373 (9.2%) | 370 (9.3%) |
| 35 to 39 Years | 349 (8.7%) | 253 (6.3%) |
| 40 to 44 Years | 177 (4.4%) | 225 (5.6%) |
| 45 to 49 Years | 185 (4.6%) | 436 (10.9%) |
| 50 to 54 Years | 357 (8.9%) | 353 (8.8%) |
| 55 to 59 Years | 677 (16.8%) | 279 (7.0%) |
| 60 to 64 Years | 312 (7.7%) | 249 (6.2%) |
| 65 to 69 Years | 311 (7.7%) | 170 (4.3%) |
| 70 to 74 Years | 155 (3.8%) | 246 (6.2%) |
| 75 to 79 Years | 76 (1.9%) | 51 (1.3%) |
| 80 to 84 Years | 49 (1.2%) | 74 (1.8%) |
| 85 Years and over | 39 (1.0%) | 52 (1.3%) |
| Total | 4,031 (100.0%) | 3,993 (100.0%) |
Families and Households in North Bay Village
Median Family Size in North Bay Village
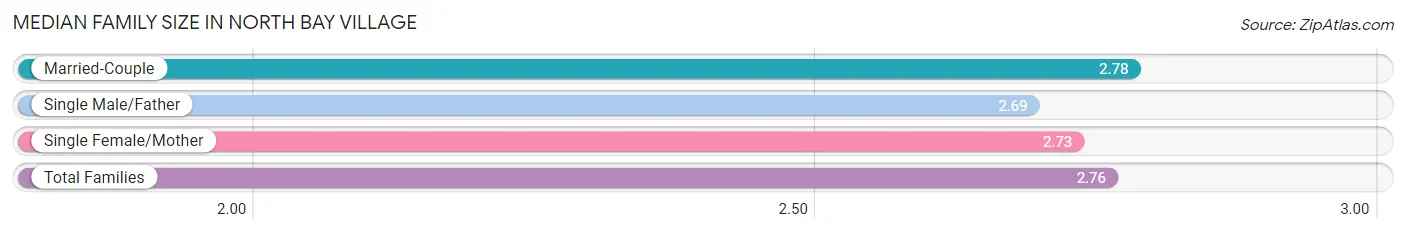
The median family size in North Bay Village is 2.76 persons per family, with married-couple families (1,521 | 73.0%) accounting for the largest median family size of 2.78 persons per family. On the other hand, single male/father families (226 | 10.8%) represent the smallest median family size with 2.69 persons per family.
| Family Type | # Families | Family Size |
| Married-Couple | 1,521 (73.0%) | 2.78 |
| Single Male/Father | 226 (10.8%) | 2.69 |
| Single Female/Mother | 336 (16.1%) | 2.73 |
| Total Families | 2,083 (100.0%) | 2.76 |
Median Household Size in North Bay Village
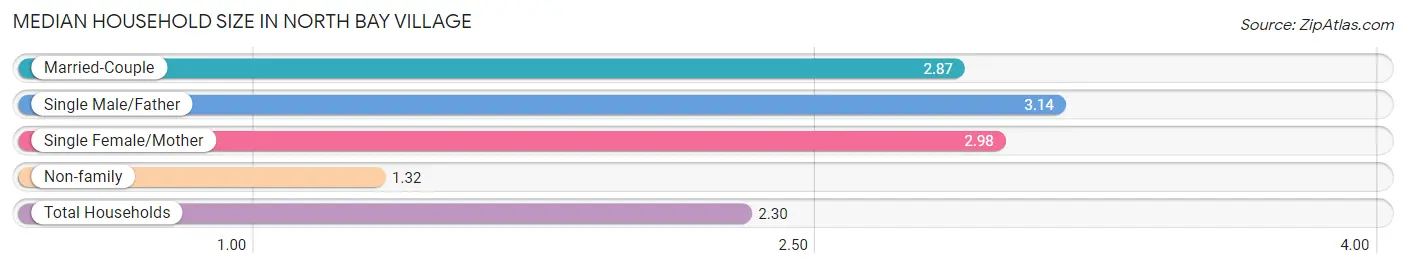
The median household size in North Bay Village is 2.30 persons per household, with single male/father households (226 | 6.7%) accounting for the largest median household size of 3.14 persons per household. non-family households (1,312 | 38.7%) represent the smallest median household size with 1.32 persons per household.
| Household Type | # Households | Household Size |
| Married-Couple | 1,521 (44.8%) | 2.87 |
| Single Male/Father | 226 (6.7%) | 3.14 |
| Single Female/Mother | 336 (9.9%) | 2.98 |
| Non-family | 1,312 (38.7%) | 1.32 |
| Total Households | 3,395 (100.0%) | 2.30 |
Household Size by Marriage Status in North Bay Village
Out of a total of 3,395 households in North Bay Village, 2,083 (61.4%) are family households, while 1,312 (38.7%) are nonfamily households. The most numerous type of family households are 2-person households, comprising 1,122, and the most common type of nonfamily households are 1-person households, comprising 938.
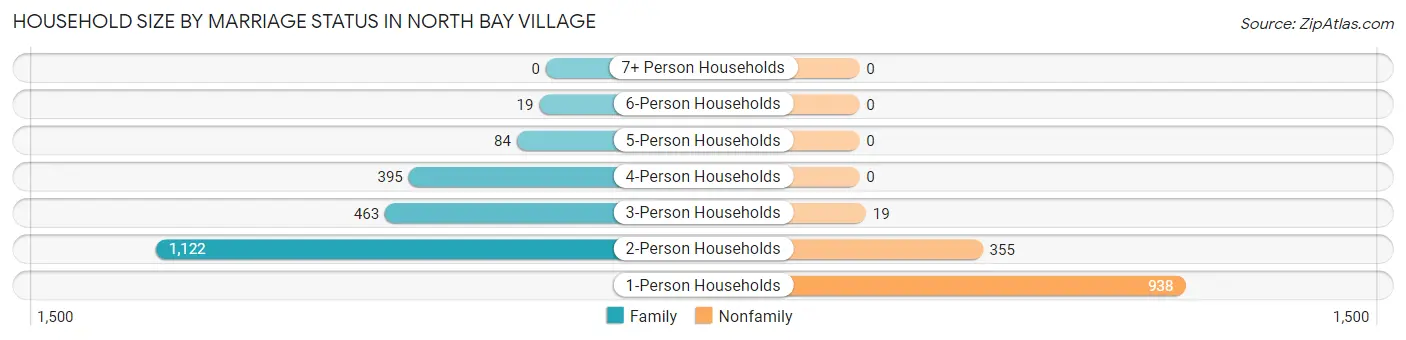
| Household Size | Family Households | Nonfamily Households |
| 1-Person Households | - | 938 (27.6%) |
| 2-Person Households | 1,122 (33.1%) | 355 (10.5%) |
| 3-Person Households | 463 (13.6%) | 19 (0.6%) |
| 4-Person Households | 395 (11.6%) | 0 (0.0%) |
| 5-Person Households | 84 (2.5%) | 0 (0.0%) |
| 6-Person Households | 19 (0.6%) | 0 (0.0%) |
| 7+ Person Households | 0 (0.0%) | 0 (0.0%) |
| Total | 2,083 (61.4%) | 1,312 (38.7%) |
Female Fertility in North Bay Village
Fertility by Age in North Bay Village
Average fertility rate in North Bay Village is 26.0 births per 1,000 women. Women in the age bracket of 20 to 34 years have the highest fertility rate with 49.0 births per 1,000 women. Women in the age bracket of 20 to 34 years acount for 100.0% of all women with births.
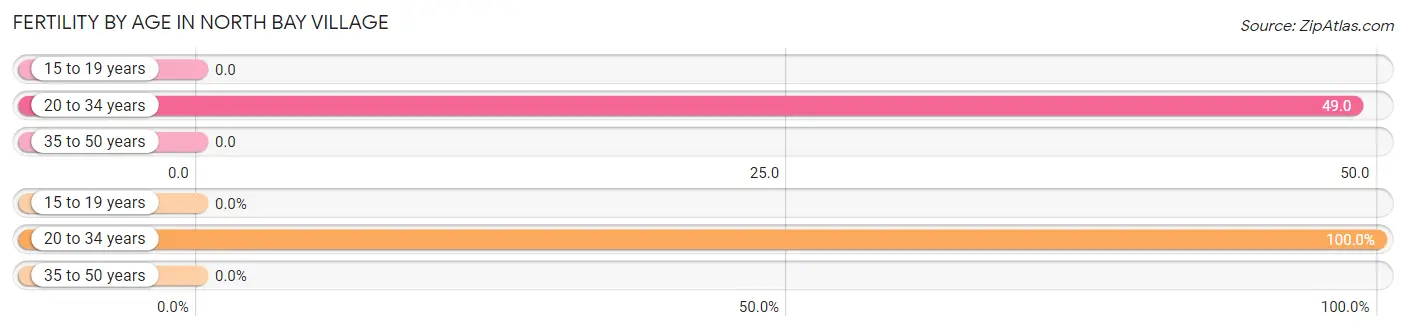
| Age Bracket | Women with Births | Births / 1,000 Women |
| 15 to 19 years | 0 (0.0%) | 0.0 |
| 20 to 34 years | 57 (100.0%) | 49.0 |
| 35 to 50 years | 0 (0.0%) | 0.0 |
| Total | 57 (100.0%) | 26.0 |
Fertility by Age by Marriage Status in North Bay Village
61.4% of women with births (57) in North Bay Village are married. The highest percentage of unmarried women with births falls into 20 to 34 years age bracket with 38.6% of them unmarried at the time of birth, while the lowest percentage of unmarried women with births belong to 20 to 34 years age bracket with 38.6% of them unmarried.
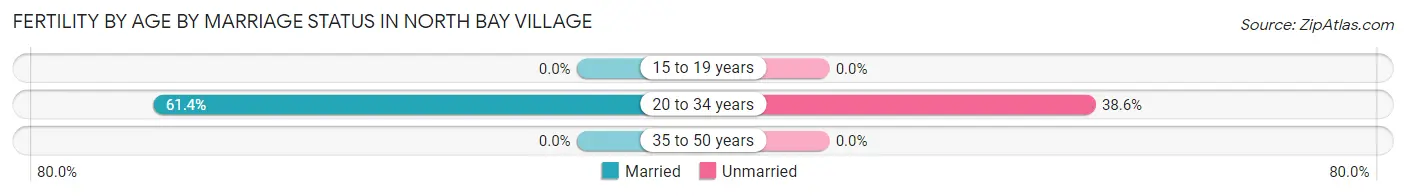
| Age Bracket | Married | Unmarried |
| 15 to 19 years | 0 (0.0%) | 0 (0.0%) |
| 20 to 34 years | 35 (61.4%) | 22 (38.6%) |
| 35 to 50 years | 0 (0.0%) | 0 (0.0%) |
| Total | 35 (61.4%) | 22 (38.6%) |
Fertility by Education in North Bay Village
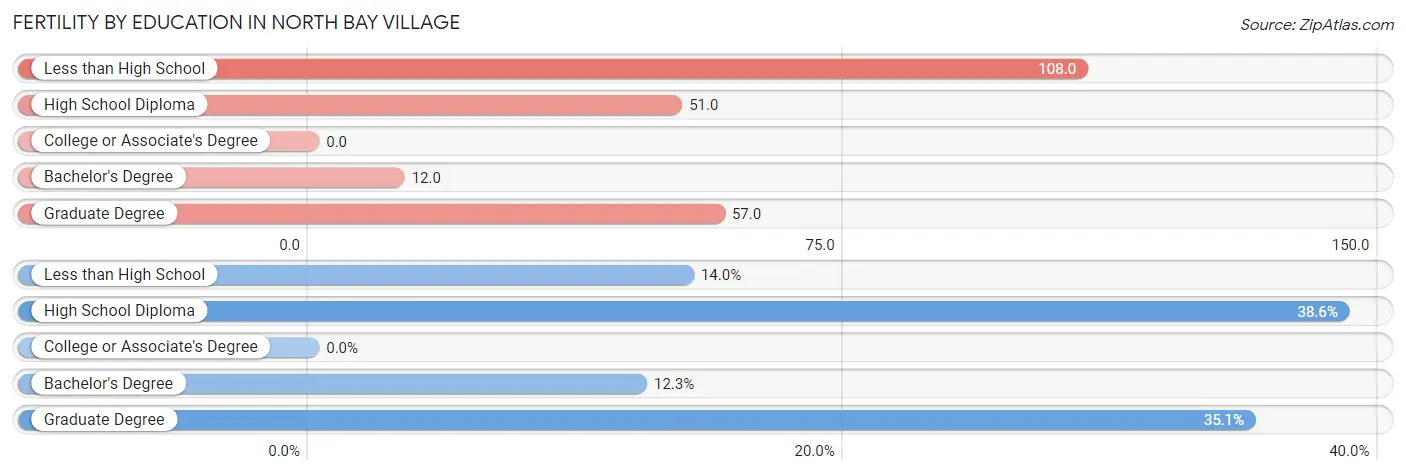
| Educational Attainment | Women with Births | Births / 1,000 Women |
| Less than High School | 8 (14.0%) | 108.0 |
| High School Diploma | 22 (38.6%) | 51.0 |
| College or Associate's Degree | 0 (0.0%) | 0.0 |
| Bachelor's Degree | 7 (12.3%) | 12.0 |
| Graduate Degree | 20 (35.1%) | 57.0 |
| Total | 57 (100.0%) | 26.0 |
Fertility by Education by Marriage Status in North Bay Village
38.6% of women with births in North Bay Village are unmarried. Women with the educational attainment of less than high school are most likely to be married with 100.0% of them married at childbirth, while women with the educational attainment of high school diploma are least likely to be married with 100.0% of them unmarried at childbirth.
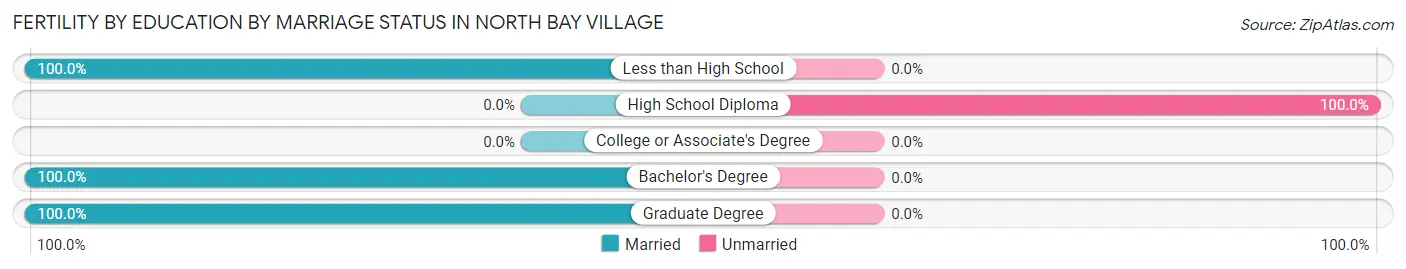
| Educational Attainment | Married | Unmarried |
| Less than High School | 8 (100.0%) | 0 (0.0%) |
| High School Diploma | 0 (0.0%) | 22 (100.0%) |
| College or Associate's Degree | 0 (0.0%) | 0 (0.0%) |
| Bachelor's Degree | 7 (100.0%) | 0 (0.0%) |
| Graduate Degree | 20 (100.0%) | 0 (0.0%) |
| Total | 35 (61.4%) | 22 (38.6%) |
Employment Characteristics in North Bay Village
Employment by Class of Employer in North Bay Village
Among the 4,969 employed individuals in North Bay Village, private company employees (3,365 | 67.7%), self-employed (not incorporated) (622 | 12.5%), and self-employed (incorporated) (493 | 9.9%) make up the most common classes of employment.
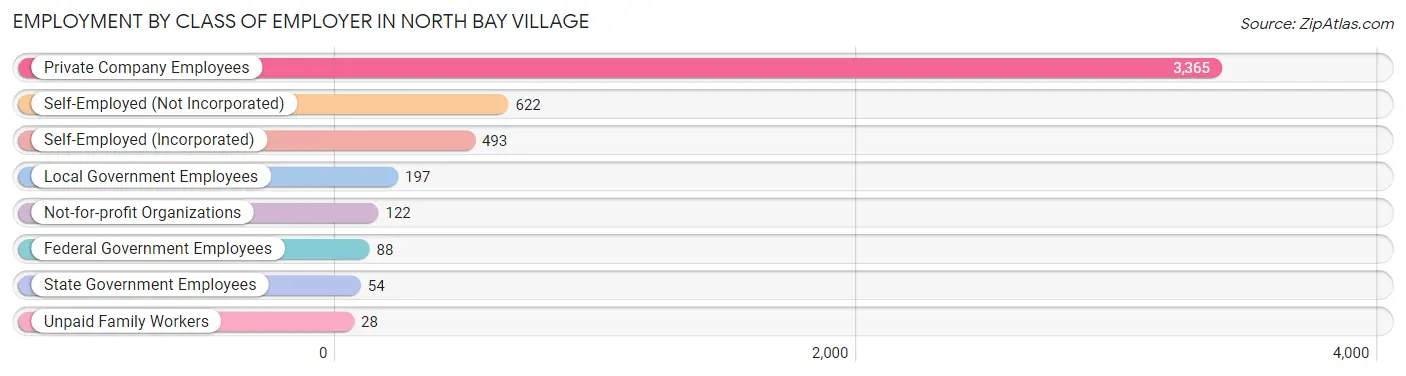
| Employer Class | # Employees | % Employees |
| Private Company Employees | 3,365 | 67.7% |
| Self-Employed (Incorporated) | 493 | 9.9% |
| Self-Employed (Not Incorporated) | 622 | 12.5% |
| Not-for-profit Organizations | 122 | 2.5% |
| Local Government Employees | 197 | 4.0% |
| State Government Employees | 54 | 1.1% |
| Federal Government Employees | 88 | 1.8% |
| Unpaid Family Workers | 28 | 0.6% |
| Total | 4,969 | 100.0% |
Employment Status by Age in North Bay Village
According to the labor force statistics for North Bay Village, out of the total population over 16 years of age (7,112), 75.1% or 5,341 individuals are in the labor force, with 4.3% or 230 of them unemployed. The age group with the highest labor force participation rate is 25 to 29 years, with 93.3% or 487 individuals in the labor force. Within the labor force, the 16 to 19 years age range has the highest percentage of unemployed individuals, with 35.1% or 13 of them being unemployed.
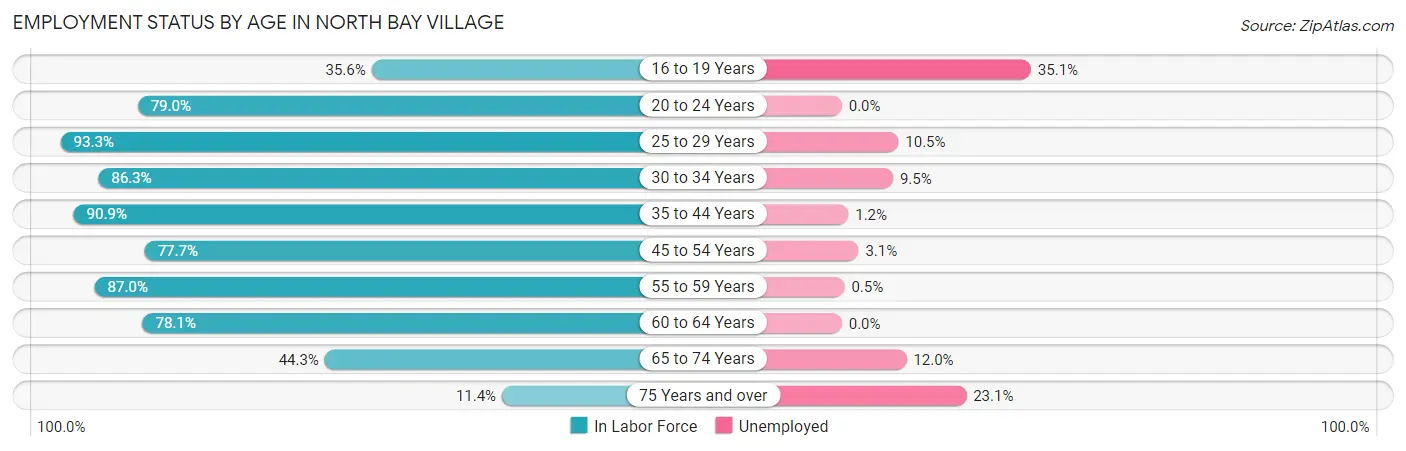
| Age Bracket | In Labor Force | Unemployed |
| 16 to 19 Years | 37 (35.6%) | 13 (35.1%) |
| 20 to 24 Years | 528 (79.0%) | 0 (0.0%) |
| 25 to 29 Years | 487 (93.3%) | 51 (10.5%) |
| 30 to 34 Years | 641 (86.3%) | 61 (9.5%) |
| 35 to 44 Years | 913 (90.9%) | 11 (1.2%) |
| 45 to 54 Years | 1,034 (77.7%) | 32 (3.1%) |
| 55 to 59 Years | 832 (87.0%) | 4 (0.5%) |
| 60 to 64 Years | 438 (78.1%) | 0 (0.0%) |
| 65 to 74 Years | 391 (44.3%) | 47 (12.0%) |
| 75 Years and over | 39 (11.4%) | 9 (23.1%) |
| Total | 5,341 (75.1%) | 230 (4.3%) |
Employment Status by Educational Attainment in North Bay Village
According to labor force statistics for North Bay Village, 84.9% of individuals (4,344) out of the total population between 25 and 64 years of age (5,117) are in the labor force, with 3.7% or 161 of them being unemployed. The group with the highest labor force participation rate are those with the educational attainment of college / associate degree, with 92.1% or 1,565 individuals in the labor force. Within the labor force, individuals with college / associate degree education have the highest percentage of unemployment, with 6.3% or 99 of them being unemployed.
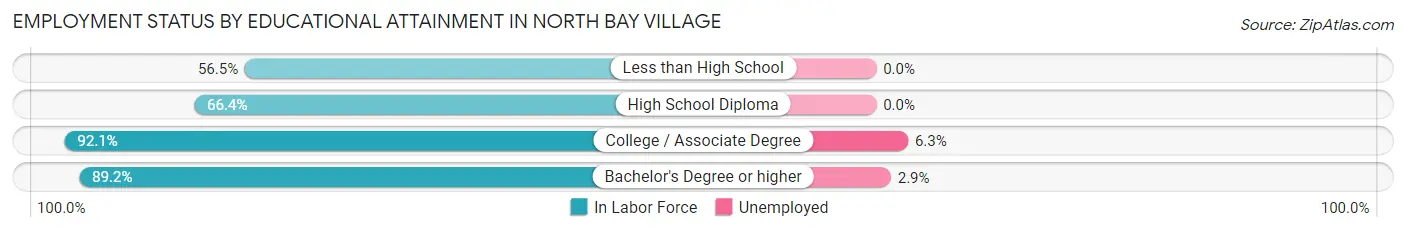
| Educational Attainment | In Labor Force | Unemployed |
| Less than High School | 104 (56.5%) | 0 (0.0%) |
| High School Diploma | 606 (66.4%) | 0 (0.0%) |
| College / Associate Degree | 1,565 (92.1%) | 107 (6.3%) |
| Bachelor's Degree or higher | 2,070 (89.2%) | 67 (2.9%) |
| Total | 4,344 (84.9%) | 189 (3.7%) |
Employment Occupations by Sex in North Bay Village
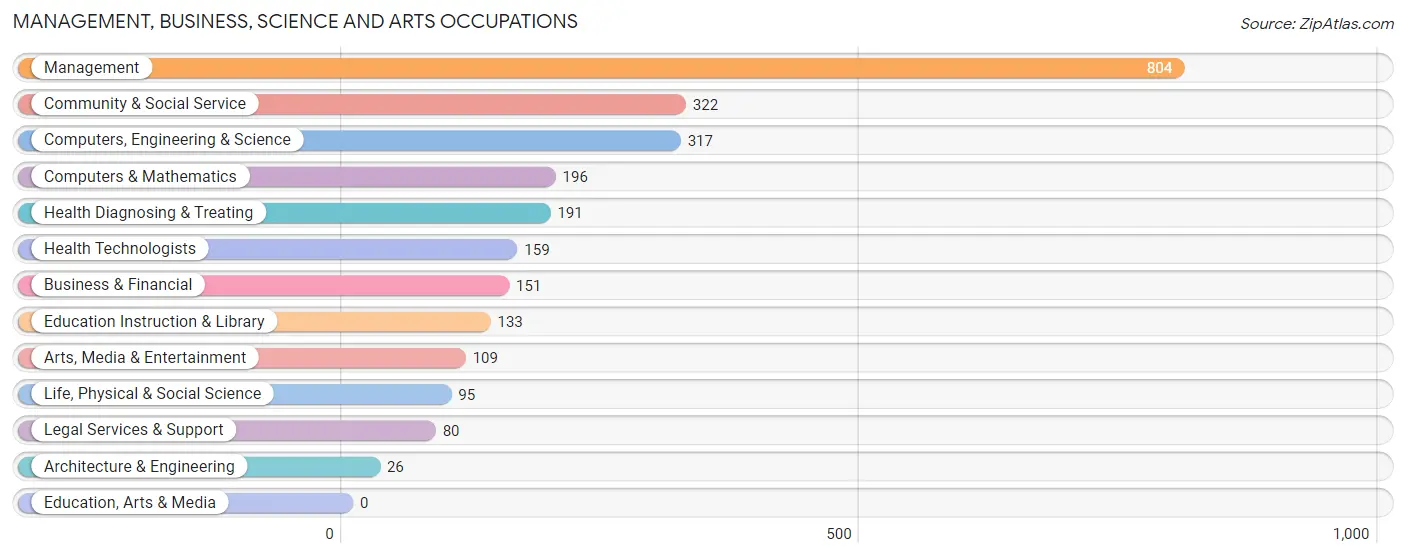
Management, Business, Science and Arts Occupations
The most common Management, Business, Science and Arts occupations in North Bay Village are Management (804 | 15.7%), Community & Social Service (322 | 6.3%), Computers, Engineering & Science (317 | 6.2%), Computers & Mathematics (196 | 3.8%), and Health Diagnosing & Treating (191 | 3.7%).
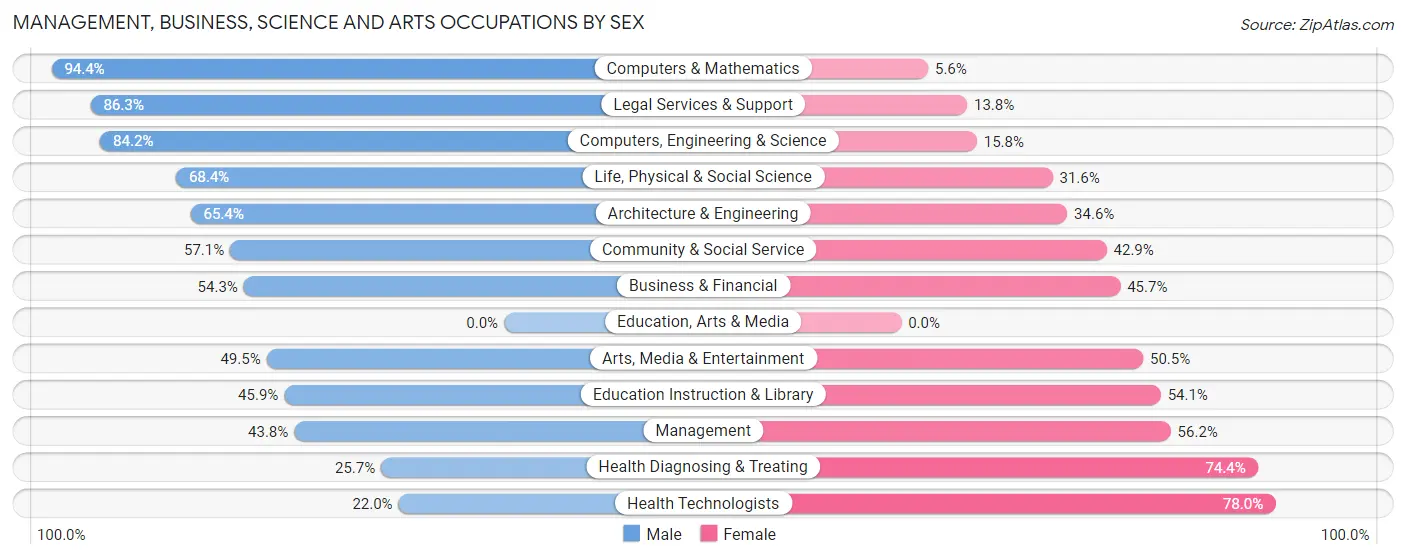
Management, Business, Science and Arts Occupations by Sex
Within the Management, Business, Science and Arts occupations in North Bay Village, the most male-oriented occupations are Computers & Mathematics (94.4%), Legal Services & Support (86.3%), and Computers, Engineering & Science (84.2%), while the most female-oriented occupations are Health Technologists (78.0%), Health Diagnosing & Treating (74.4%), and Management (56.2%).
| Occupation | Male | Female |
| Management | 352 (43.8%) | 452 (56.2%) |
| Business & Financial | 82 (54.3%) | 69 (45.7%) |
| Computers, Engineering & Science | 267 (84.2%) | 50 (15.8%) |
| Computers & Mathematics | 185 (94.4%) | 11 (5.6%) |
| Architecture & Engineering | 17 (65.4%) | 9 (34.6%) |
| Life, Physical & Social Science | 65 (68.4%) | 30 (31.6%) |
| Community & Social Service | 184 (57.1%) | 138 (42.9%) |
| Education, Arts & Media | 0 (0.0%) | 0 (0.0%) |
| Legal Services & Support | 69 (86.3%) | 11 (13.8%) |
| Education Instruction & Library | 61 (45.9%) | 72 (54.1%) |
| Arts, Media & Entertainment | 54 (49.5%) | 55 (50.5%) |
| Health Diagnosing & Treating | 49 (25.7%) | 142 (74.4%) |
| Health Technologists | 35 (22.0%) | 124 (78.0%) |
| Total (Category) | 934 (52.3%) | 851 (47.7%) |
| Total (Overall) | 2,735 (53.5%) | 2,377 (46.5%) |
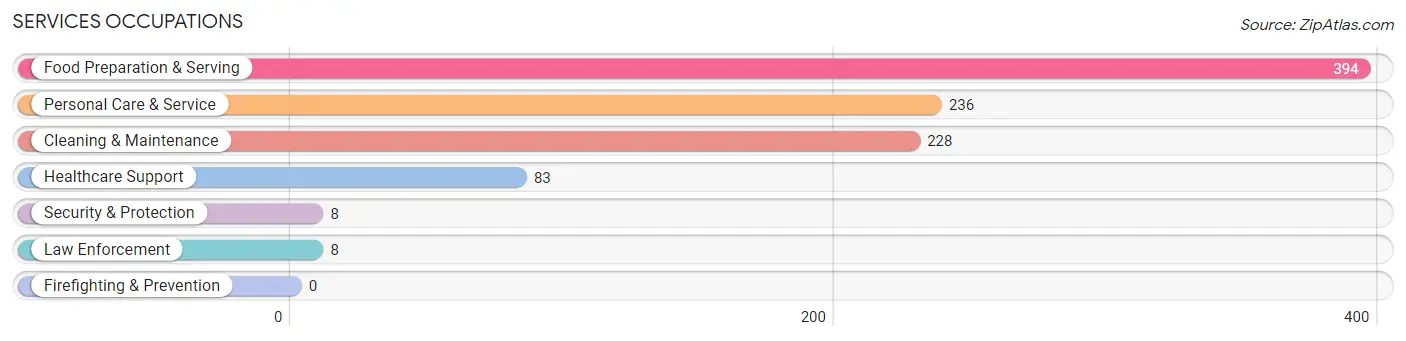
Services Occupations
The most common Services occupations in North Bay Village are Food Preparation & Serving (394 | 7.7%), Personal Care & Service (236 | 4.6%), Cleaning & Maintenance (228 | 4.5%), Healthcare Support (83 | 1.6%), and Security & Protection (8 | 0.2%).
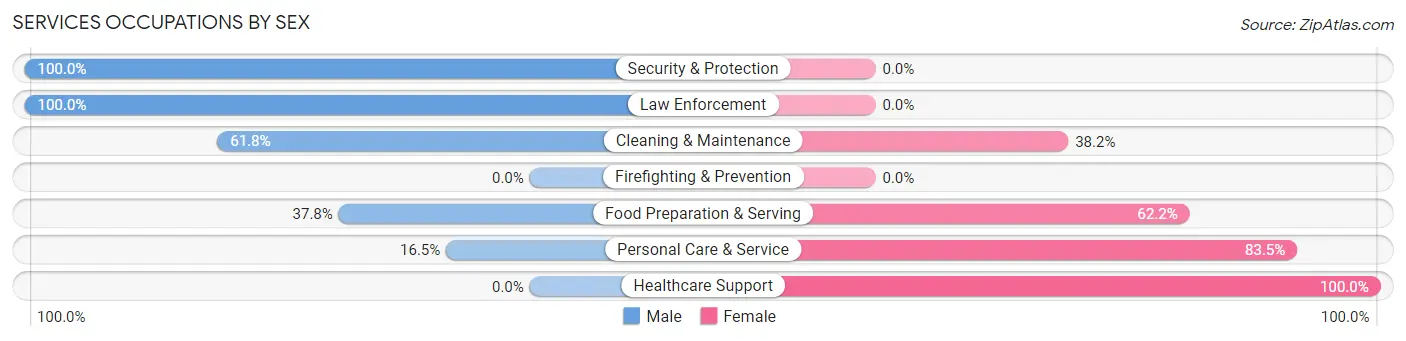
Services Occupations by Sex
Within the Services occupations in North Bay Village, the most male-oriented occupations are Security & Protection (100.0%), Law Enforcement (100.0%), and Cleaning & Maintenance (61.8%), while the most female-oriented occupations are Healthcare Support (100.0%), Personal Care & Service (83.5%), and Food Preparation & Serving (62.2%).
| Occupation | Male | Female |
| Healthcare Support | 0 (0.0%) | 83 (100.0%) |
| Security & Protection | 8 (100.0%) | 0 (0.0%) |
| Firefighting & Prevention | 0 (0.0%) | 0 (0.0%) |
| Law Enforcement | 8 (100.0%) | 0 (0.0%) |
| Food Preparation & Serving | 149 (37.8%) | 245 (62.2%) |
| Cleaning & Maintenance | 141 (61.8%) | 87 (38.2%) |
| Personal Care & Service | 39 (16.5%) | 197 (83.5%) |
| Total (Category) | 337 (35.5%) | 612 (64.5%) |
| Total (Overall) | 2,735 (53.5%) | 2,377 (46.5%) |
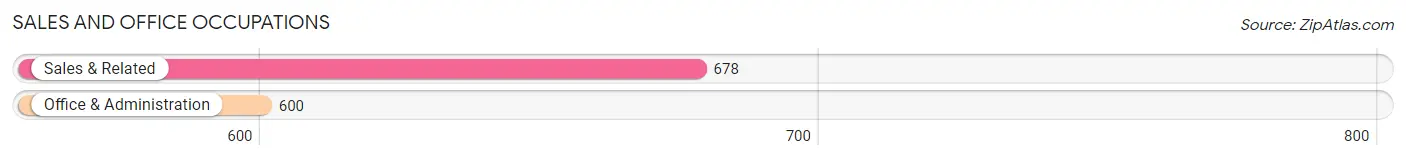
Sales and Office Occupations
The most common Sales and Office occupations in North Bay Village are Sales & Related (678 | 13.3%), and Office & Administration (600 | 11.7%).
Sales and Office Occupations by Sex
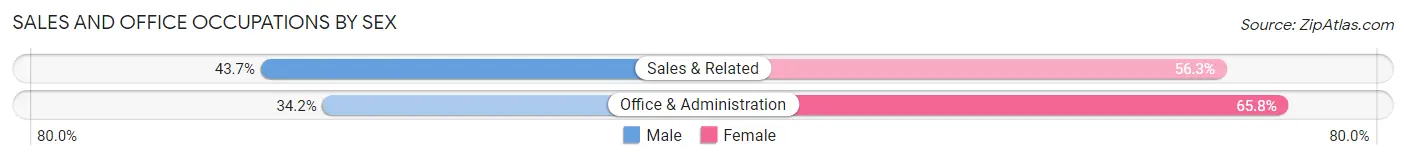
| Occupation | Male | Female |
| Sales & Related | 296 (43.7%) | 382 (56.3%) |
| Office & Administration | 205 (34.2%) | 395 (65.8%) |
| Total (Category) | 501 (39.2%) | 777 (60.8%) |
| Total (Overall) | 2,735 (53.5%) | 2,377 (46.5%) |
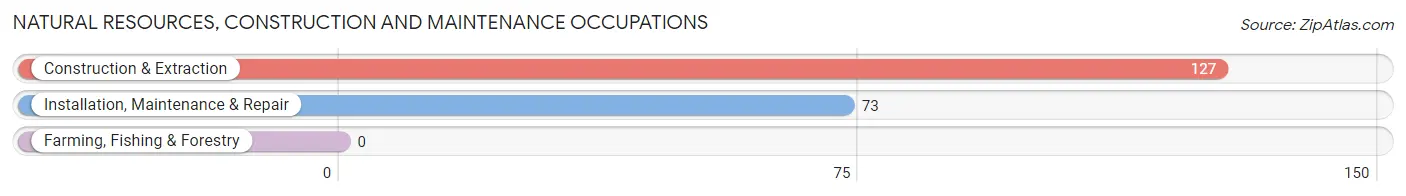
Natural Resources, Construction and Maintenance Occupations
The most common Natural Resources, Construction and Maintenance occupations in North Bay Village are Construction & Extraction (127 | 2.5%), and Installation, Maintenance & Repair (73 | 1.4%).
Natural Resources, Construction and Maintenance Occupations by Sex
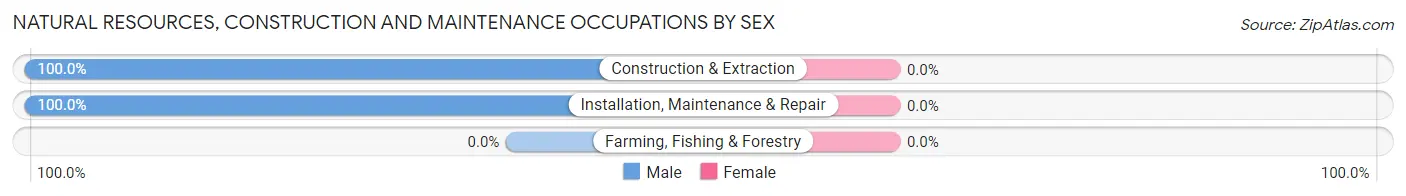
| Occupation | Male | Female |
| Farming, Fishing & Forestry | 0 (0.0%) | 0 (0.0%) |
| Construction & Extraction | 127 (100.0%) | 0 (0.0%) |
| Installation, Maintenance & Repair | 73 (100.0%) | 0 (0.0%) |
| Total (Category) | 200 (100.0%) | 0 (0.0%) |
| Total (Overall) | 2,735 (53.5%) | 2,377 (46.5%) |
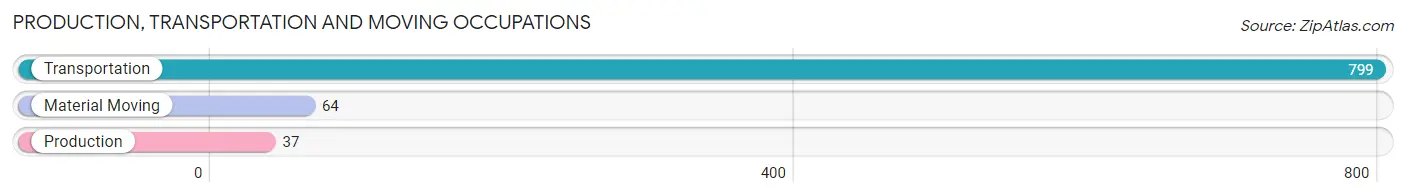
Production, Transportation and Moving Occupations
The most common Production, Transportation and Moving occupations in North Bay Village are Transportation (799 | 15.6%), Material Moving (64 | 1.3%), and Production (37 | 0.7%).
Production, Transportation and Moving Occupations by Sex
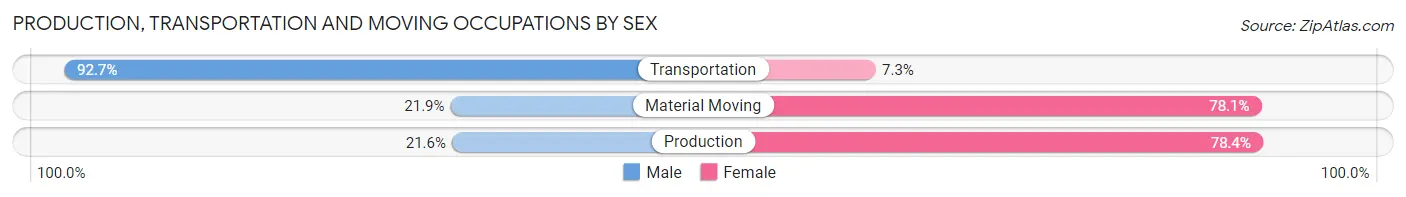
| Occupation | Male | Female |
| Production | 8 (21.6%) | 29 (78.4%) |
| Transportation | 741 (92.7%) | 58 (7.3%) |
| Material Moving | 14 (21.9%) | 50 (78.1%) |
| Total (Category) | 763 (84.8%) | 137 (15.2%) |
| Total (Overall) | 2,735 (53.5%) | 2,377 (46.5%) |
Employment Industries by Sex in North Bay Village
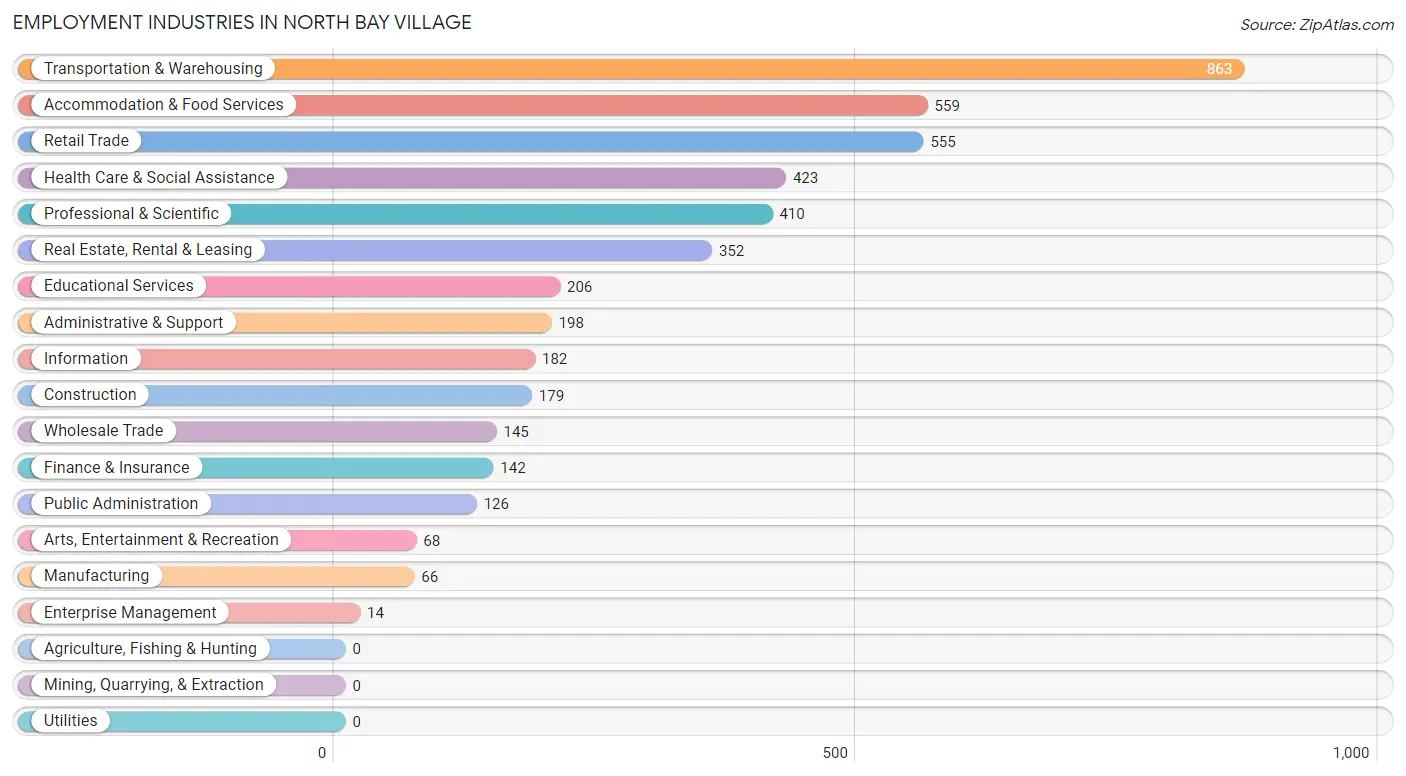
Employment Industries in North Bay Village
The major employment industries in North Bay Village include Transportation & Warehousing (863 | 16.9%), Accommodation & Food Services (559 | 10.9%), Retail Trade (555 | 10.9%), Health Care & Social Assistance (423 | 8.3%), and Professional & Scientific (410 | 8.0%).
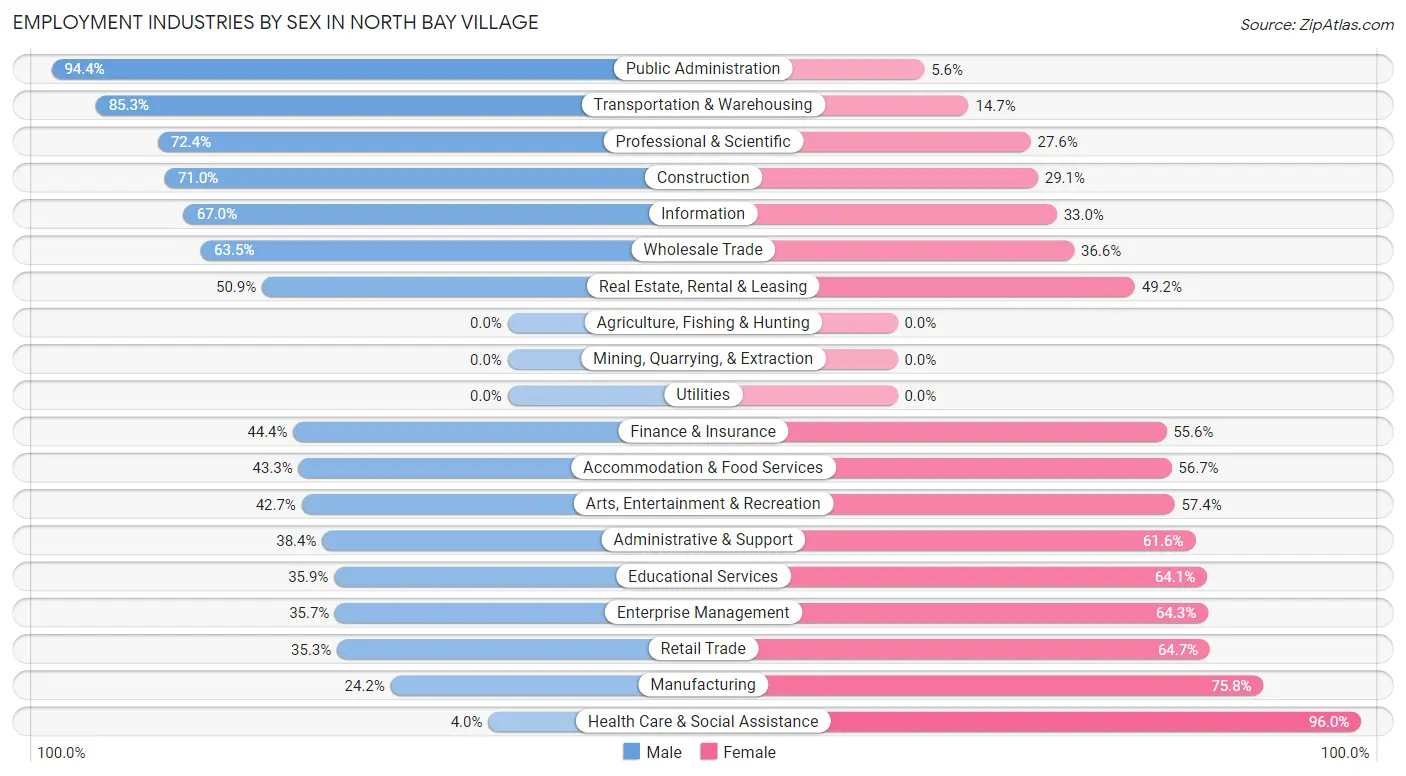
Employment Industries by Sex in North Bay Village
The North Bay Village industries that see more men than women are Public Administration (94.4%), Transportation & Warehousing (85.3%), and Professional & Scientific (72.4%), whereas the industries that tend to have a higher number of women are Health Care & Social Assistance (96.0%), Manufacturing (75.8%), and Retail Trade (64.7%).
| Industry | Male | Female |
| Agriculture, Fishing & Hunting | 0 (0.0%) | 0 (0.0%) |
| Mining, Quarrying, & Extraction | 0 (0.0%) | 0 (0.0%) |
| Construction | 127 (71.0%) | 52 (29.0%) |
| Manufacturing | 16 (24.2%) | 50 (75.8%) |
| Wholesale Trade | 92 (63.4%) | 53 (36.5%) |
| Retail Trade | 196 (35.3%) | 359 (64.7%) |
| Transportation & Warehousing | 736 (85.3%) | 127 (14.7%) |
| Utilities | 0 (0.0%) | 0 (0.0%) |
| Information | 122 (67.0%) | 60 (33.0%) |
| Finance & Insurance | 63 (44.4%) | 79 (55.6%) |
| Real Estate, Rental & Leasing | 179 (50.8%) | 173 (49.1%) |
| Professional & Scientific | 297 (72.4%) | 113 (27.6%) |
| Enterprise Management | 5 (35.7%) | 9 (64.3%) |
| Administrative & Support | 76 (38.4%) | 122 (61.6%) |
| Educational Services | 74 (35.9%) | 132 (64.1%) |
| Health Care & Social Assistance | 17 (4.0%) | 406 (96.0%) |
| Arts, Entertainment & Recreation | 29 (42.6%) | 39 (57.4%) |
| Accommodation & Food Services | 242 (43.3%) | 317 (56.7%) |
| Public Administration | 119 (94.4%) | 7 (5.6%) |
| Total | 2,735 (53.5%) | 2,377 (46.5%) |
Education in North Bay Village
School Enrollment in North Bay Village
The most common levels of schooling among the 1,353 students in North Bay Village are college / undergraduate (573 | 42.3%), middle school (301 | 22.3%), and elementary school (152 | 11.2%).
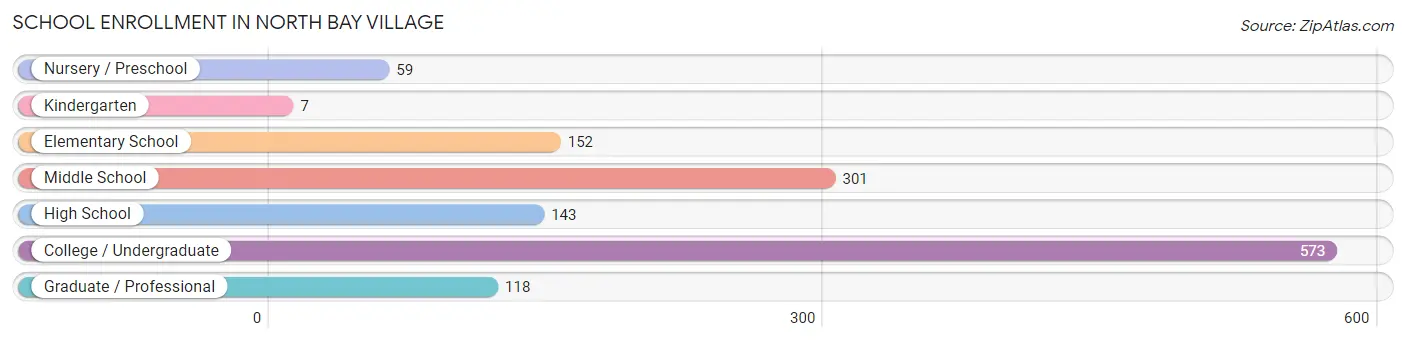
| School Level | # Students | % Students |
| Nursery / Preschool | 59 | 4.4% |
| Kindergarten | 7 | 0.5% |
| Elementary School | 152 | 11.2% |
| Middle School | 301 | 22.3% |
| High School | 143 | 10.6% |
| College / Undergraduate | 573 | 42.3% |
| Graduate / Professional | 118 | 8.7% |
| Total | 1,353 | 100.0% |
School Enrollment by Age by Funding Source in North Bay Village
Out of a total of 1,353 students who are enrolled in schools in North Bay Village, 258 (19.1%) attend a private institution, while the remaining 1,095 (80.9%) are enrolled in public schools. The age group of 35 years and over has the highest likelihood of being enrolled in private schools, with 106 (75.2% in the age bracket) enrolled. Conversely, the age group of 3 to 4 year olds has the lowest likelihood of being enrolled in a private school, with 53 (100.0% in the age bracket) attending a public institution.
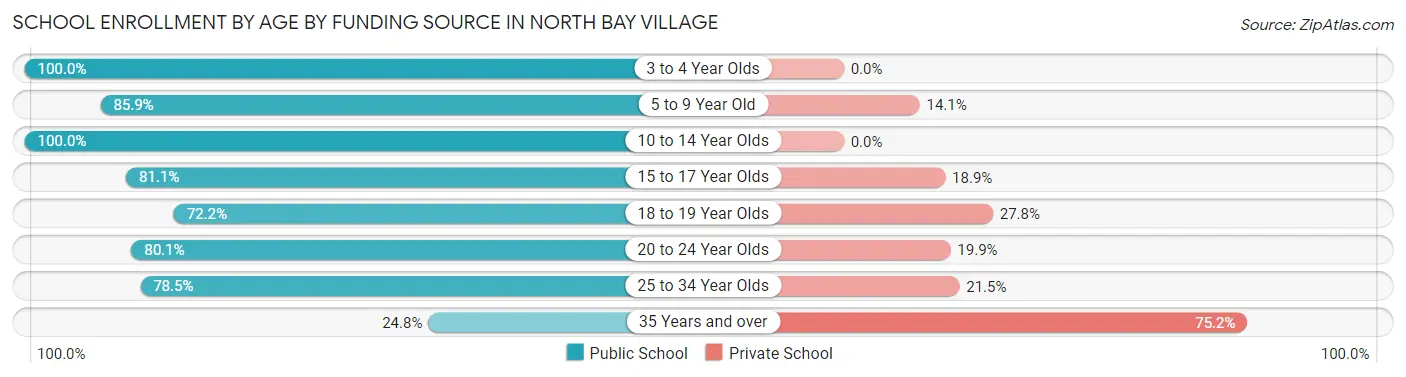
| Age Bracket | Public School | Private School |
| 3 to 4 Year Olds | 53 (100.0%) | 0 (0.0%) |
| 5 to 9 Year Old | 79 (85.9%) | 13 (14.1%) |
| 10 to 14 Year Olds | 385 (100.0%) | 0 (0.0%) |
| 15 to 17 Year Olds | 103 (81.1%) | 24 (18.9%) |
| 18 to 19 Year Olds | 13 (72.2%) | 5 (27.8%) |
| 20 to 24 Year Olds | 274 (80.1%) | 68 (19.9%) |
| 25 to 34 Year Olds | 153 (78.5%) | 42 (21.5%) |
| 35 Years and over | 35 (24.8%) | 106 (75.2%) |
| Total | 1,095 (80.9%) | 258 (19.1%) |
Educational Attainment by Field of Study in North Bay Village
Business (1,021 | 35.4%), education (299 | 10.4%), communications (285 | 9.9%), psychology (253 | 8.8%), and science & technology (250 | 8.7%) are the most common fields of study among 2,886 individuals in North Bay Village who have obtained a bachelor's degree or higher.
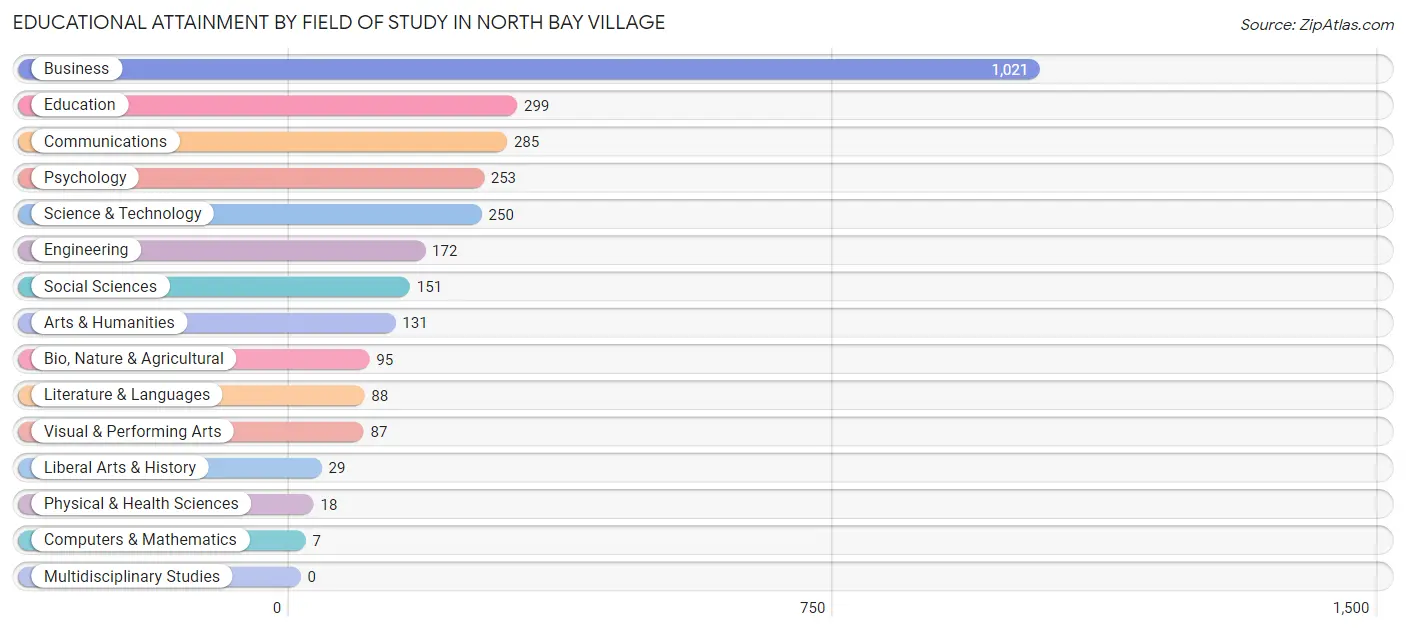
| Field of Study | # Graduates | % Graduates |
| Computers & Mathematics | 7 | 0.2% |
| Bio, Nature & Agricultural | 95 | 3.3% |
| Physical & Health Sciences | 18 | 0.6% |
| Psychology | 253 | 8.8% |
| Social Sciences | 151 | 5.2% |
| Engineering | 172 | 6.0% |
| Multidisciplinary Studies | 0 | 0.0% |
| Science & Technology | 250 | 8.7% |
| Business | 1,021 | 35.4% |
| Education | 299 | 10.4% |
| Literature & Languages | 88 | 3.0% |
| Liberal Arts & History | 29 | 1.0% |
| Visual & Performing Arts | 87 | 3.0% |
| Communications | 285 | 9.9% |
| Arts & Humanities | 131 | 4.5% |
| Total | 2,886 | 100.0% |
Transportation & Commute in North Bay Village
Vehicle Availability by Sex in North Bay Village
The most prevalent vehicle ownership categories in North Bay Village are males with 2 vehicles (1,450, accounting for 55.1%) and females with 2 vehicles (1,122, making up 62.1%).
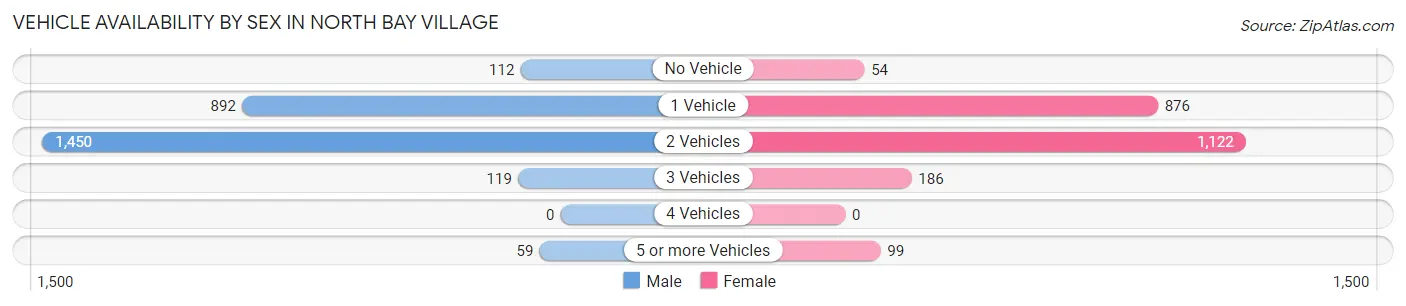
| Vehicles Available | Male | Female |
| No Vehicle | 112 (4.3%) | 54 (2.3%) |
| 1 Vehicle | 892 (33.9%) | 876 (37.5%) |
| 2 Vehicles | 1,450 (55.1%) | 1,122 (48.0%) |
| 3 Vehicles | 119 (4.5%) | 186 (8.0%) |
| 4 Vehicles | 0 (0.0%) | 0 (0.0%) |
| 5 or more Vehicles | 59 (2.2%) | 99 (4.2%) |
| Total | 2,632 (100.0%) | 2,337 (100.0%) |
Commute Time in North Bay Village
The most frequently occuring commute durations in North Bay Village are 30 to 34 minutes (876 commuters, 21.4%), 45 to 59 minutes (567 commuters, 13.8%), and 10 to 14 minutes (553 commuters, 13.5%).
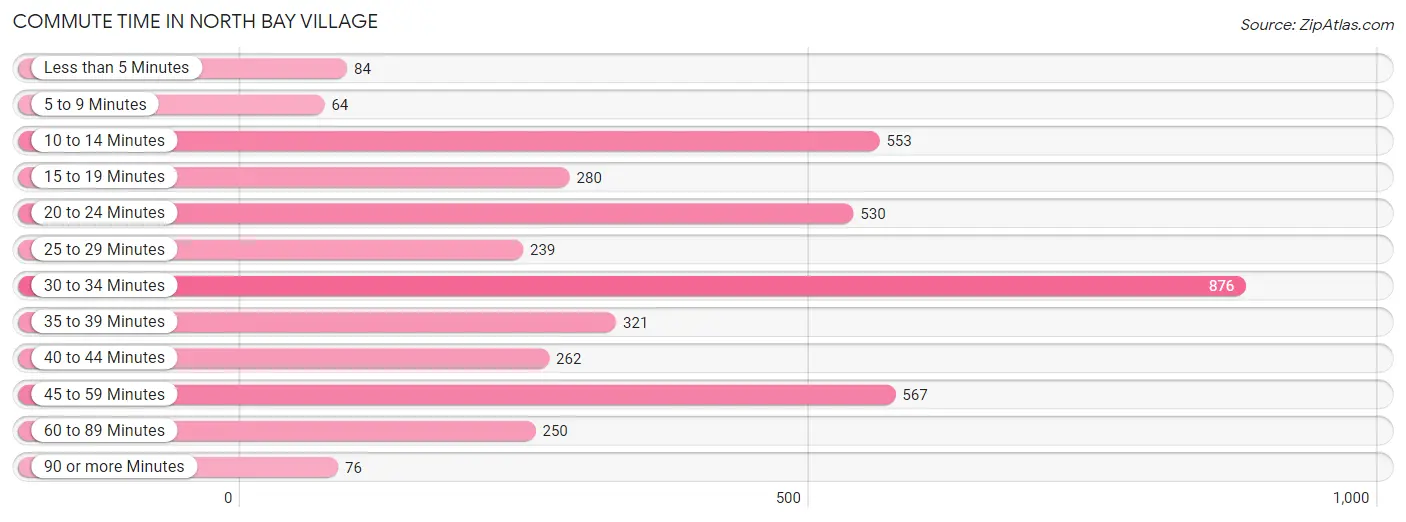
| Commute Time | # Commuters | % Commuters |
| Less than 5 Minutes | 84 | 2.1% |
| 5 to 9 Minutes | 64 | 1.6% |
| 10 to 14 Minutes | 553 | 13.5% |
| 15 to 19 Minutes | 280 | 6.8% |
| 20 to 24 Minutes | 530 | 12.9% |
| 25 to 29 Minutes | 239 | 5.8% |
| 30 to 34 Minutes | 876 | 21.4% |
| 35 to 39 Minutes | 321 | 7.8% |
| 40 to 44 Minutes | 262 | 6.4% |
| 45 to 59 Minutes | 567 | 13.8% |
| 60 to 89 Minutes | 250 | 6.1% |
| 90 or more Minutes | 76 | 1.8% |
Commute Time by Sex in North Bay Village
The most common commute times in North Bay Village are 30 to 34 minutes (390 commuters, 19.0%) for males and 30 to 34 minutes (486 commuters, 23.7%) for females.
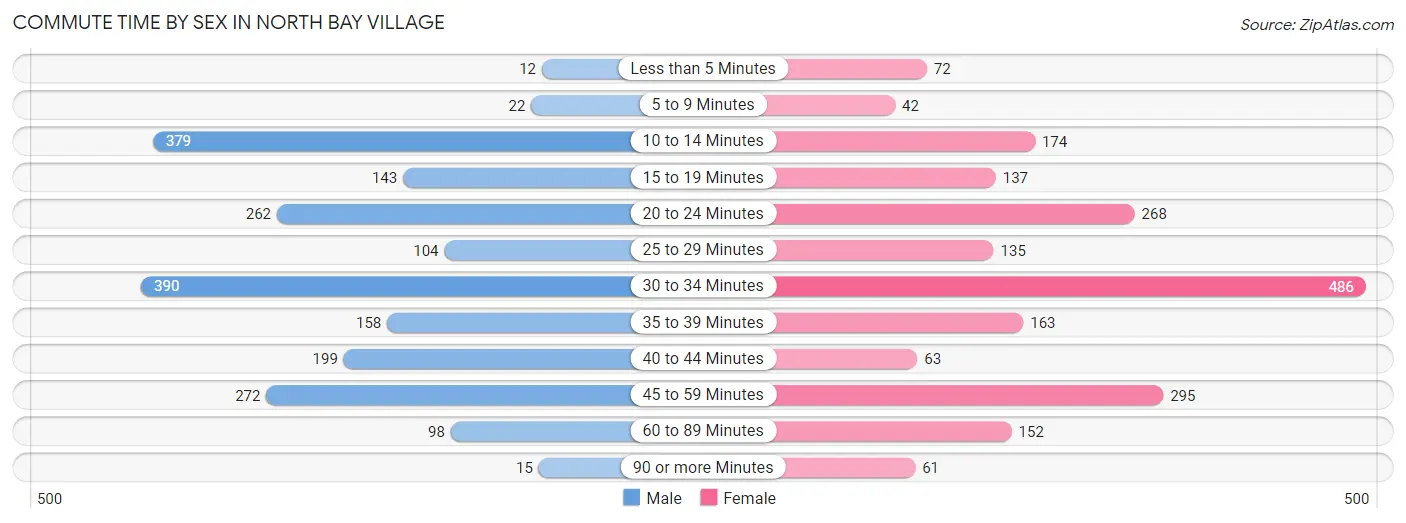
| Commute Time | Male | Female |
| Less than 5 Minutes | 12 (0.6%) | 72 (3.5%) |
| 5 to 9 Minutes | 22 (1.1%) | 42 (2.1%) |
| 10 to 14 Minutes | 379 (18.4%) | 174 (8.5%) |
| 15 to 19 Minutes | 143 (7.0%) | 137 (6.7%) |
| 20 to 24 Minutes | 262 (12.8%) | 268 (13.1%) |
| 25 to 29 Minutes | 104 (5.1%) | 135 (6.6%) |
| 30 to 34 Minutes | 390 (19.0%) | 486 (23.7%) |
| 35 to 39 Minutes | 158 (7.7%) | 163 (8.0%) |
| 40 to 44 Minutes | 199 (9.7%) | 63 (3.1%) |
| 45 to 59 Minutes | 272 (13.2%) | 295 (14.4%) |
| 60 to 89 Minutes | 98 (4.8%) | 152 (7.4%) |
| 90 or more Minutes | 15 (0.7%) | 61 (3.0%) |
Time of Departure to Work by Sex in North Bay Village
The most frequent times of departure to work in North Bay Village are 8:00 AM to 8:29 AM (304, 14.8%) for males and 12:00 PM to 3:59 PM (384, 18.8%) for females.
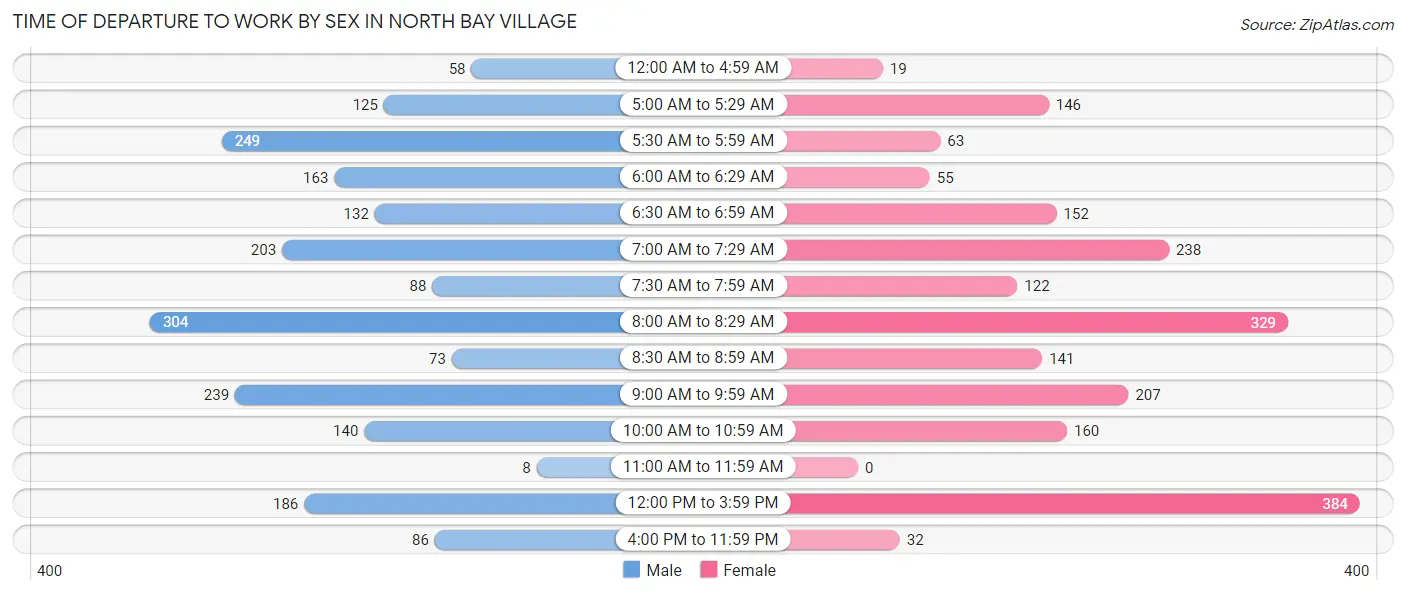
| Time of Departure | Male | Female |
| 12:00 AM to 4:59 AM | 58 (2.8%) | 19 (0.9%) |
| 5:00 AM to 5:29 AM | 125 (6.1%) | 146 (7.1%) |
| 5:30 AM to 5:59 AM | 249 (12.1%) | 63 (3.1%) |
| 6:00 AM to 6:29 AM | 163 (7.9%) | 55 (2.7%) |
| 6:30 AM to 6:59 AM | 132 (6.4%) | 152 (7.4%) |
| 7:00 AM to 7:29 AM | 203 (9.9%) | 238 (11.6%) |
| 7:30 AM to 7:59 AM | 88 (4.3%) | 122 (6.0%) |
| 8:00 AM to 8:29 AM | 304 (14.8%) | 329 (16.1%) |
| 8:30 AM to 8:59 AM | 73 (3.5%) | 141 (6.9%) |
| 9:00 AM to 9:59 AM | 239 (11.6%) | 207 (10.1%) |
| 10:00 AM to 10:59 AM | 140 (6.8%) | 160 (7.8%) |
| 11:00 AM to 11:59 AM | 8 (0.4%) | 0 (0.0%) |
| 12:00 PM to 3:59 PM | 186 (9.1%) | 384 (18.8%) |
| 4:00 PM to 11:59 PM | 86 (4.2%) | 32 (1.6%) |
| Total | 2,054 (100.0%) | 2,048 (100.0%) |
Housing Occupancy in North Bay Village
Occupancy by Ownership in North Bay Village
Of the total 3,395 dwellings in North Bay Village, owner-occupied units account for 1,240 (36.5%), while renter-occupied units make up 2,155 (63.5%).
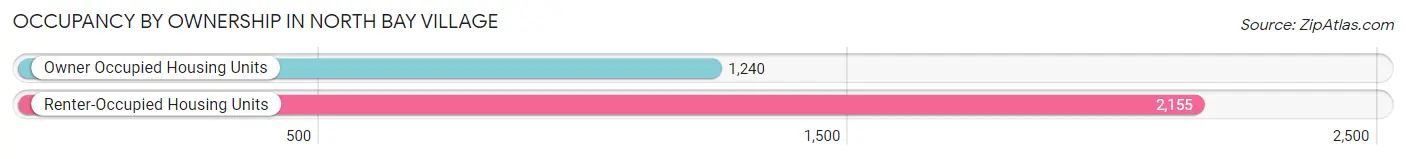
| Occupancy | # Housing Units | % Housing Units |
| Owner Occupied Housing Units | 1,240 | 36.5% |
| Renter-Occupied Housing Units | 2,155 | 63.5% |
| Total Occupied Housing Units | 3,395 | 100.0% |
Occupancy by Household Size in North Bay Village
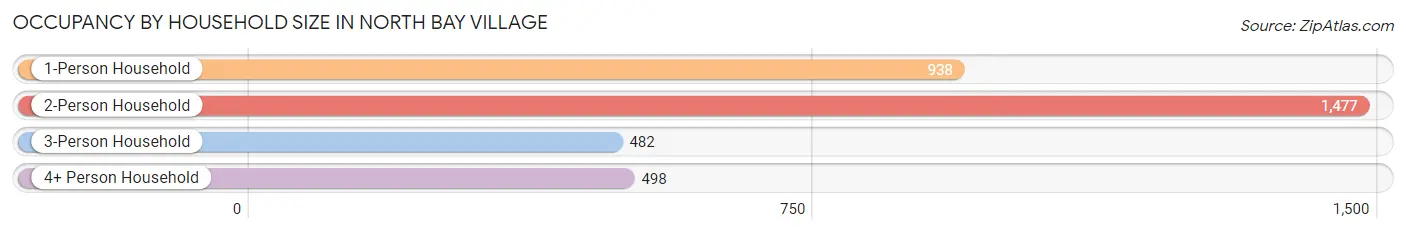
| Household Size | # Housing Units | % Housing Units |
| 1-Person Household | 938 | 27.6% |
| 2-Person Household | 1,477 | 43.5% |
| 3-Person Household | 482 | 14.2% |
| 4+ Person Household | 498 | 14.7% |
| Total Housing Units | 3,395 | 100.0% |
Occupancy by Ownership by Household Size in North Bay Village
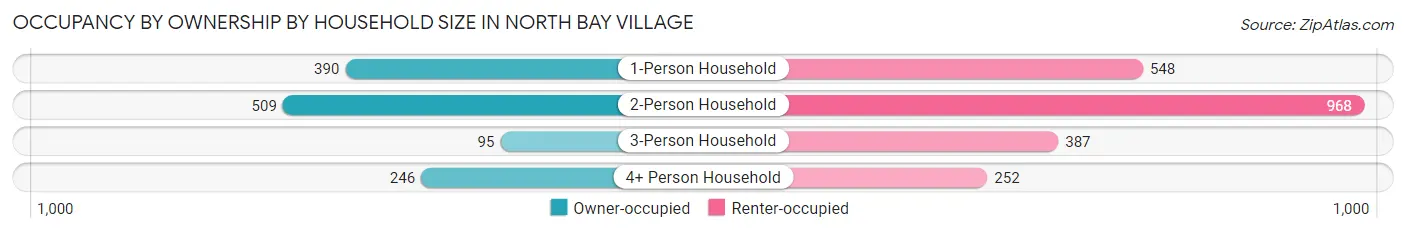
| Household Size | Owner-occupied | Renter-occupied |
| 1-Person Household | 390 (41.6%) | 548 (58.4%) |
| 2-Person Household | 509 (34.5%) | 968 (65.5%) |
| 3-Person Household | 95 (19.7%) | 387 (80.3%) |
| 4+ Person Household | 246 (49.4%) | 252 (50.6%) |
| Total Housing Units | 1,240 (36.5%) | 2,155 (63.5%) |
Occupancy by Educational Attainment in North Bay Village
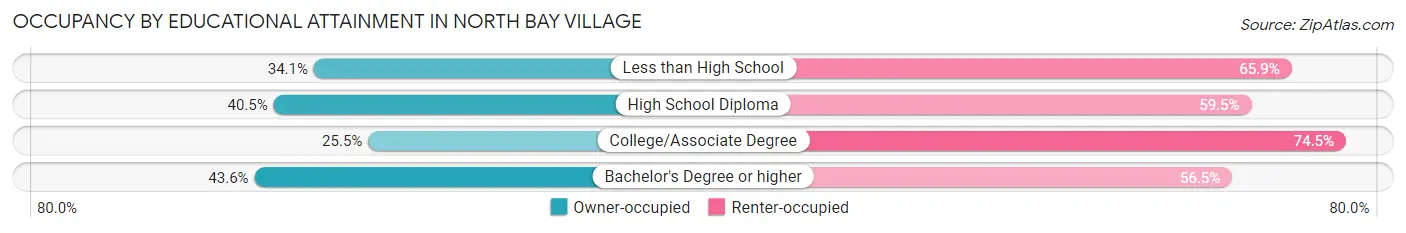
| Household Size | Owner-occupied | Renter-occupied |
| Less than High School | 43 (34.1%) | 83 (65.9%) |
| High School Diploma | 162 (40.5%) | 238 (59.5%) |
| College/Associate Degree | 303 (25.5%) | 885 (74.5%) |
| Bachelor's Degree or higher | 732 (43.5%) | 949 (56.5%) |
Occupancy by Age of Householder in North Bay Village
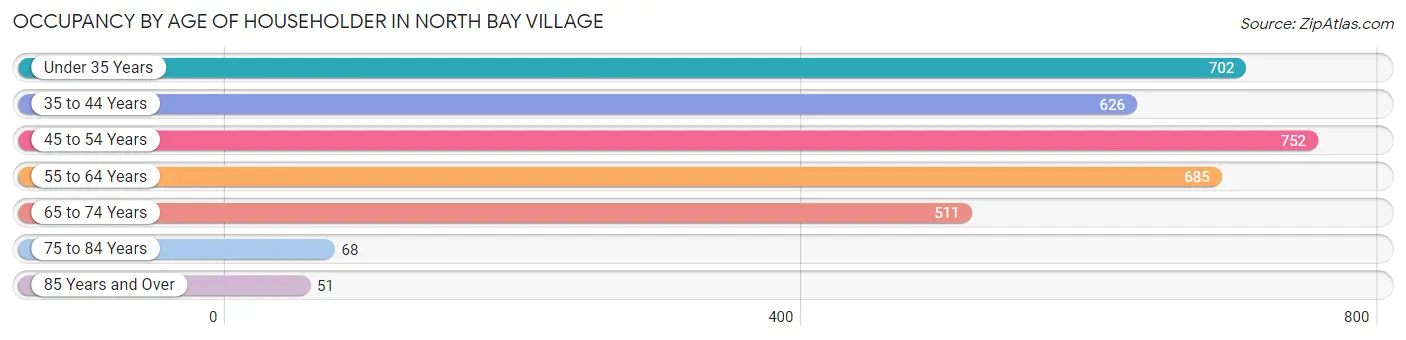
| Age Bracket | # Households | % Households |
| Under 35 Years | 702 | 20.7% |
| 35 to 44 Years | 626 | 18.4% |
| 45 to 54 Years | 752 | 22.2% |
| 55 to 64 Years | 685 | 20.2% |
| 65 to 74 Years | 511 | 15.0% |
| 75 to 84 Years | 68 | 2.0% |
| 85 Years and Over | 51 | 1.5% |
| Total | 3,395 | 100.0% |
Housing Finances in North Bay Village
Median Income by Occupancy in North Bay Village
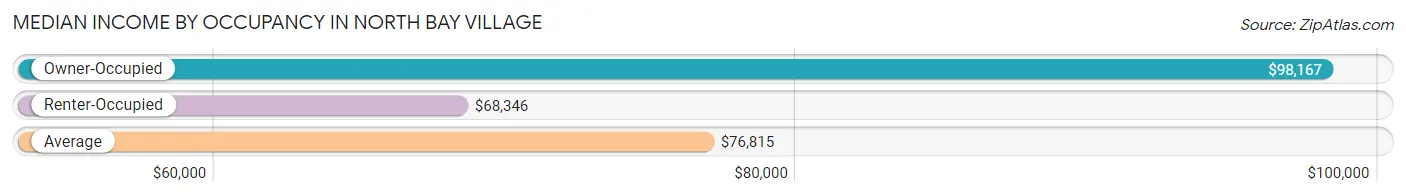
| Occupancy Type | # Households | Median Income |
| Owner-Occupied | 1,240 (36.5%) | $98,167 |
| Renter-Occupied | 2,155 (63.5%) | $68,346 |
| Average | 3,395 (100.0%) | $76,815 |
Occupancy by Householder Income Bracket in North Bay Village
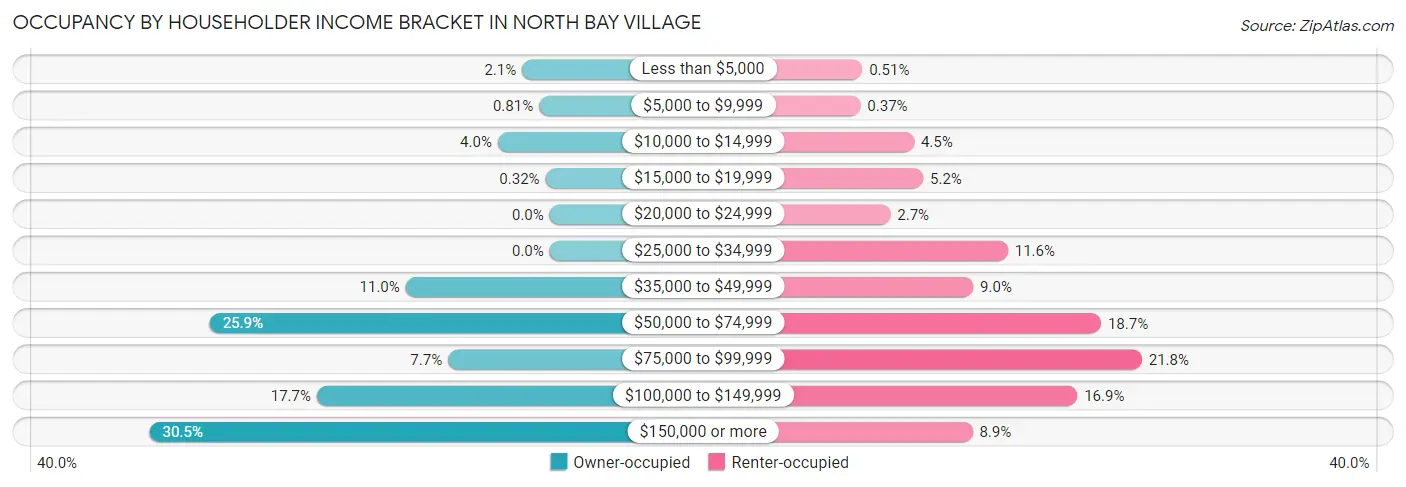
| Income Bracket | Owner-occupied | Renter-occupied |
| Less than $5,000 | 26 (2.1%) | 11 (0.5%) |
| $5,000 to $9,999 | 10 (0.8%) | 8 (0.4%) |
| $10,000 to $14,999 | 49 (4.0%) | 96 (4.4%) |
| $15,000 to $19,999 | 4 (0.3%) | 111 (5.1%) |
| $20,000 to $24,999 | 0 (0.0%) | 57 (2.6%) |
| $25,000 to $34,999 | 0 (0.0%) | 250 (11.6%) |
| $35,000 to $49,999 | 136 (11.0%) | 193 (9.0%) |
| $50,000 to $74,999 | 321 (25.9%) | 403 (18.7%) |
| $75,000 to $99,999 | 96 (7.7%) | 470 (21.8%) |
| $100,000 to $149,999 | 220 (17.7%) | 364 (16.9%) |
| $150,000 or more | 378 (30.5%) | 192 (8.9%) |
| Total | 1,240 (100.0%) | 2,155 (100.0%) |
Monthly Housing Cost Tiers in North Bay Village
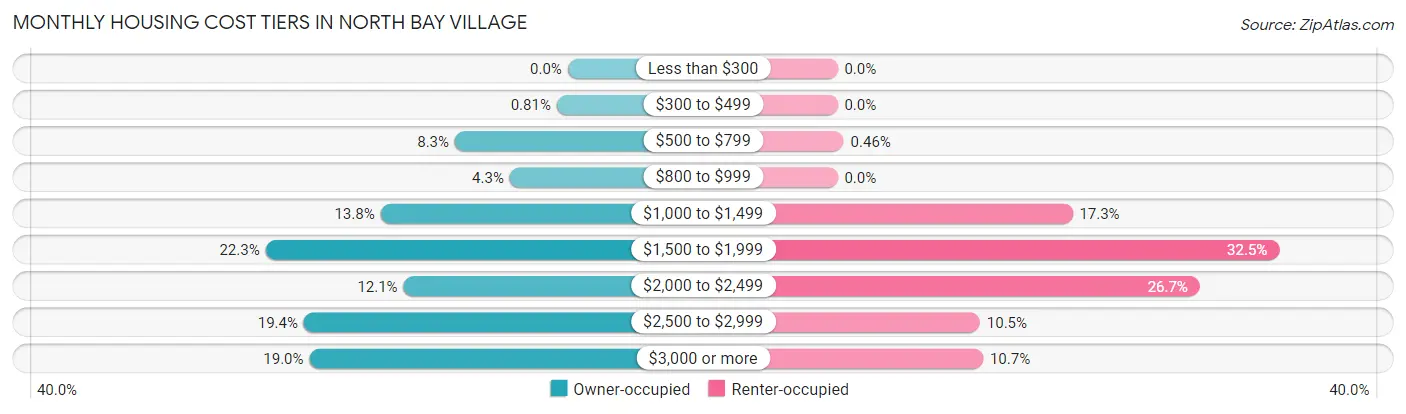
| Monthly Cost | Owner-occupied | Renter-occupied |
| Less than $300 | 0 (0.0%) | 0 (0.0%) |
| $300 to $499 | 10 (0.8%) | 0 (0.0%) |
| $500 to $799 | 103 (8.3%) | 10 (0.5%) |
| $800 to $999 | 53 (4.3%) | 0 (0.0%) |
| $1,000 to $1,499 | 171 (13.8%) | 373 (17.3%) |
| $1,500 to $1,999 | 276 (22.3%) | 701 (32.5%) |
| $2,000 to $2,499 | 150 (12.1%) | 575 (26.7%) |
| $2,500 to $2,999 | 241 (19.4%) | 226 (10.5%) |
| $3,000 or more | 236 (19.0%) | 231 (10.7%) |
| Total | 1,240 (100.0%) | 2,155 (100.0%) |
Physical Housing Characteristics in North Bay Village
Housing Structures in North Bay Village
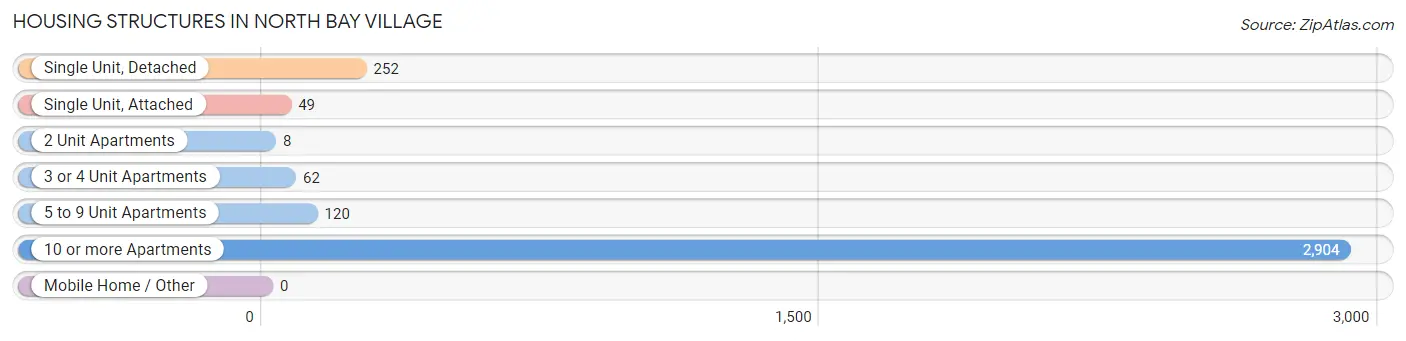
| Structure Type | # Housing Units | % Housing Units |
| Single Unit, Detached | 252 | 7.4% |
| Single Unit, Attached | 49 | 1.4% |
| 2 Unit Apartments | 8 | 0.2% |
| 3 or 4 Unit Apartments | 62 | 1.8% |
| 5 to 9 Unit Apartments | 120 | 3.5% |
| 10 or more Apartments | 2,904 | 85.5% |
| Mobile Home / Other | 0 | 0.0% |
| Total | 3,395 | 100.0% |
Housing Structures by Occupancy in North Bay Village
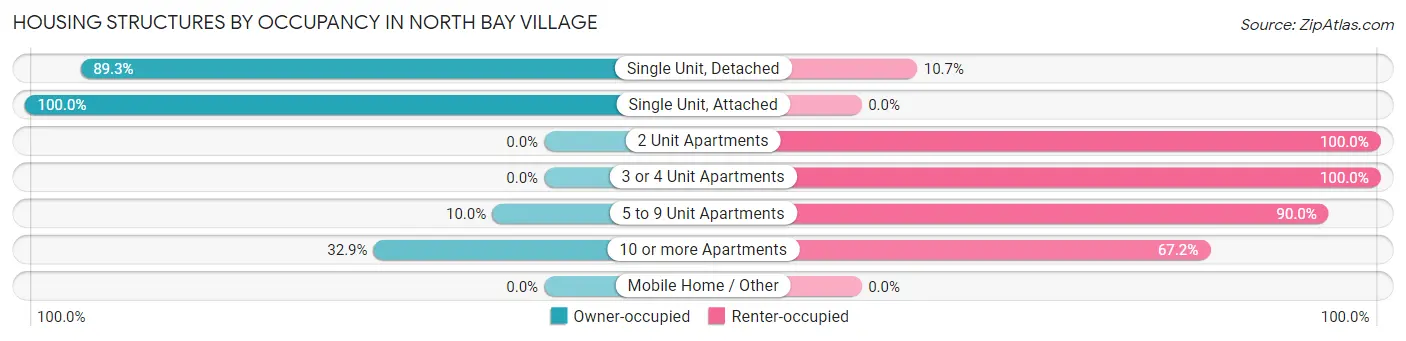
| Structure Type | Owner-occupied | Renter-occupied |
| Single Unit, Detached | 225 (89.3%) | 27 (10.7%) |
| Single Unit, Attached | 49 (100.0%) | 0 (0.0%) |
| 2 Unit Apartments | 0 (0.0%) | 8 (100.0%) |
| 3 or 4 Unit Apartments | 0 (0.0%) | 62 (100.0%) |
| 5 to 9 Unit Apartments | 12 (10.0%) | 108 (90.0%) |
| 10 or more Apartments | 954 (32.9%) | 1,950 (67.1%) |
| Mobile Home / Other | 0 (0.0%) | 0 (0.0%) |
| Total | 1,240 (36.5%) | 2,155 (63.5%) |
Housing Structures by Number of Rooms in North Bay Village
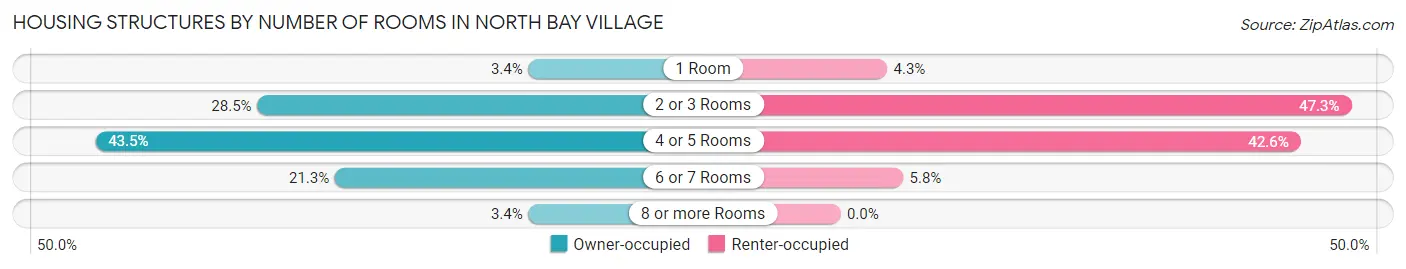
| Number of Rooms | Owner-occupied | Renter-occupied |
| 1 Room | 42 (3.4%) | 93 (4.3%) |
| 2 or 3 Rooms | 353 (28.5%) | 1,019 (47.3%) |
| 4 or 5 Rooms | 539 (43.5%) | 918 (42.6%) |
| 6 or 7 Rooms | 264 (21.3%) | 125 (5.8%) |
| 8 or more Rooms | 42 (3.4%) | 0 (0.0%) |
| Total | 1,240 (100.0%) | 2,155 (100.0%) |
Housing Structure by Heating Type in North Bay Village
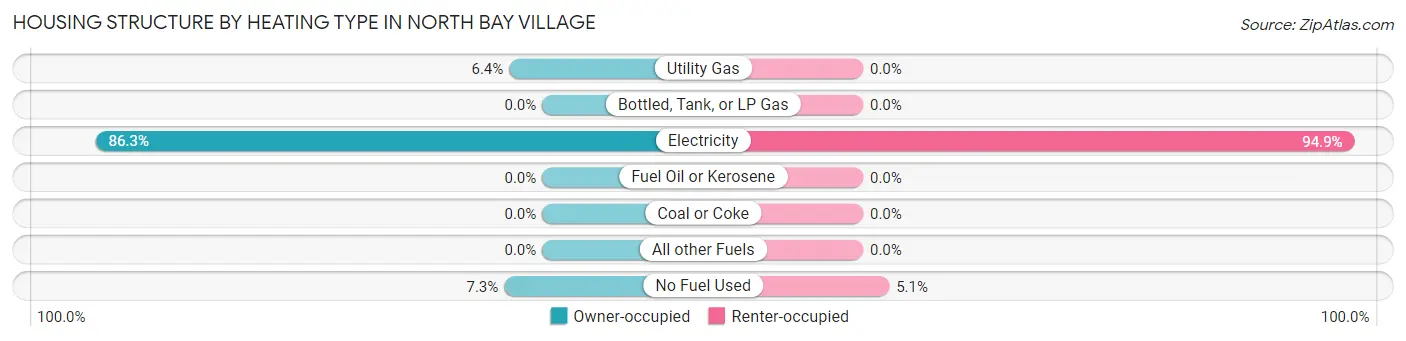
| Heating Type | Owner-occupied | Renter-occupied |
| Utility Gas | 79 (6.4%) | 0 (0.0%) |
| Bottled, Tank, or LP Gas | 0 (0.0%) | 0 (0.0%) |
| Electricity | 1,070 (86.3%) | 2,046 (94.9%) |
| Fuel Oil or Kerosene | 0 (0.0%) | 0 (0.0%) |
| Coal or Coke | 0 (0.0%) | 0 (0.0%) |
| All other Fuels | 0 (0.0%) | 0 (0.0%) |
| No Fuel Used | 91 (7.3%) | 109 (5.1%) |
| Total | 1,240 (100.0%) | 2,155 (100.0%) |
Household Vehicle Usage in North Bay Village
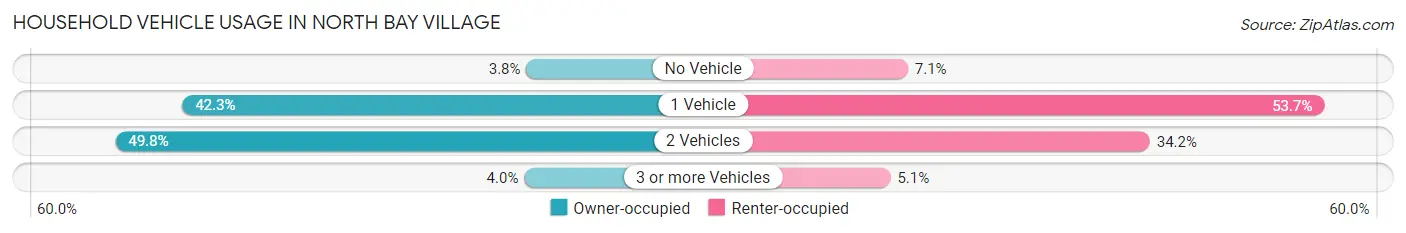
| Vehicles per Household | Owner-occupied | Renter-occupied |
| No Vehicle | 47 (3.8%) | 152 (7.0%) |
| 1 Vehicle | 525 (42.3%) | 1,157 (53.7%) |
| 2 Vehicles | 618 (49.8%) | 736 (34.2%) |
| 3 or more Vehicles | 50 (4.0%) | 110 (5.1%) |
| Total | 1,240 (100.0%) | 2,155 (100.0%) |
Real Estate & Mortgages in North Bay Village
Real Estate and Mortgage Overview in North Bay Village
| Characteristic | Without Mortgage | With Mortgage |
| Housing Units | 549 | 691 |
| Median Property Value | $515,600 | $394,200 |
| Median Household Income | $99,125 | $219 |
| Monthly Housing Costs | $1,463 | $230 |
| Real Estate Taxes | $5,787 | $7 |
Property Value by Mortgage Status in North Bay Village
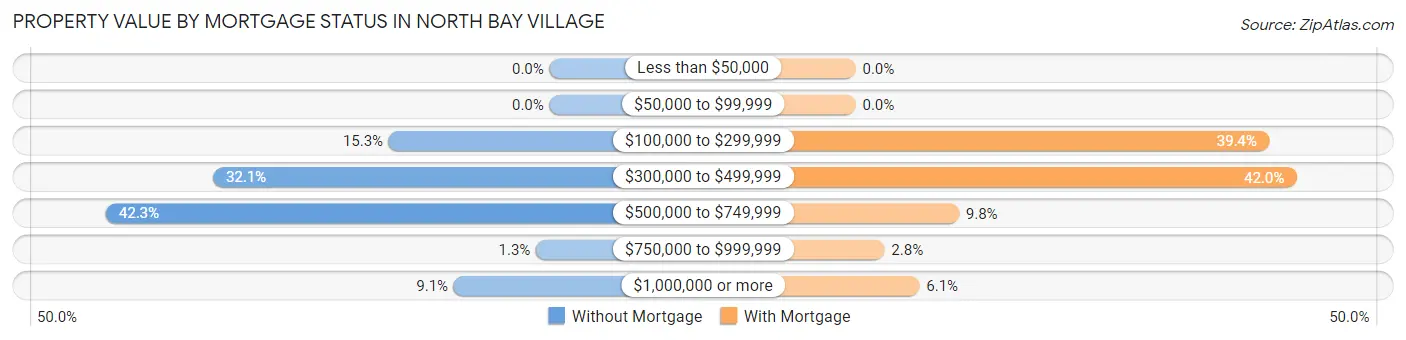
| Property Value | Without Mortgage | With Mortgage |
| Less than $50,000 | 0 (0.0%) | 0 (0.0%) |
| $50,000 to $99,999 | 0 (0.0%) | 0 (0.0%) |
| $100,000 to $299,999 | 84 (15.3%) | 272 (39.4%) |
| $300,000 to $499,999 | 176 (32.1%) | 290 (42.0%) |
| $500,000 to $749,999 | 232 (42.3%) | 68 (9.8%) |
| $750,000 to $999,999 | 7 (1.3%) | 19 (2.8%) |
| $1,000,000 or more | 50 (9.1%) | 42 (6.1%) |
| Total | 549 (100.0%) | 691 (100.0%) |
Household Income by Mortgage Status in North Bay Village
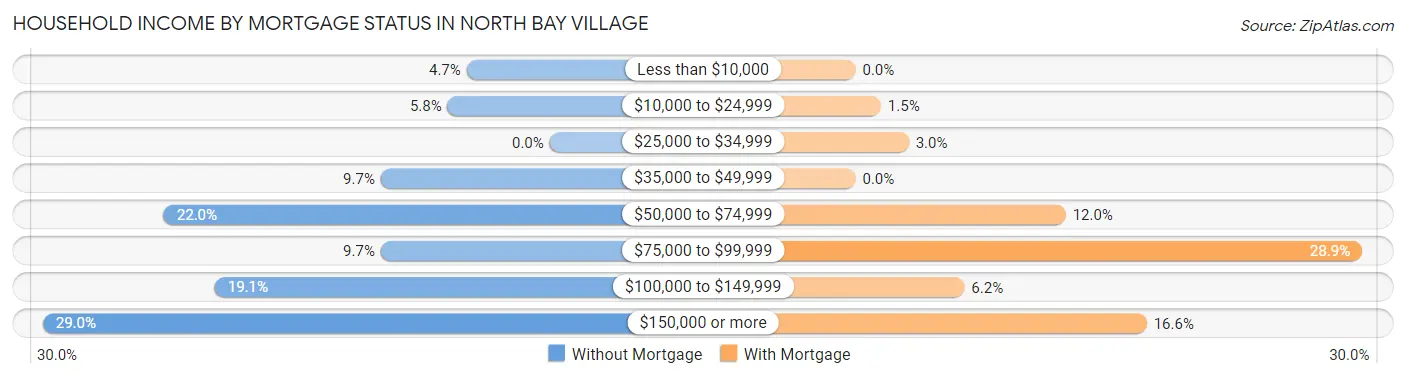
| Household Income | Without Mortgage | With Mortgage |
| Less than $10,000 | 26 (4.7%) | 0 (0.0%) |
| $10,000 to $24,999 | 32 (5.8%) | 10 (1.5%) |
| $25,000 to $34,999 | 0 (0.0%) | 21 (3.0%) |
| $35,000 to $49,999 | 53 (9.7%) | 0 (0.0%) |
| $50,000 to $74,999 | 121 (22.0%) | 83 (12.0%) |
| $75,000 to $99,999 | 53 (9.7%) | 200 (28.9%) |
| $100,000 to $149,999 | 105 (19.1%) | 43 (6.2%) |
| $150,000 or more | 159 (29.0%) | 115 (16.6%) |
| Total | 549 (100.0%) | 691 (100.0%) |
Property Value to Household Income Ratio in North Bay Village
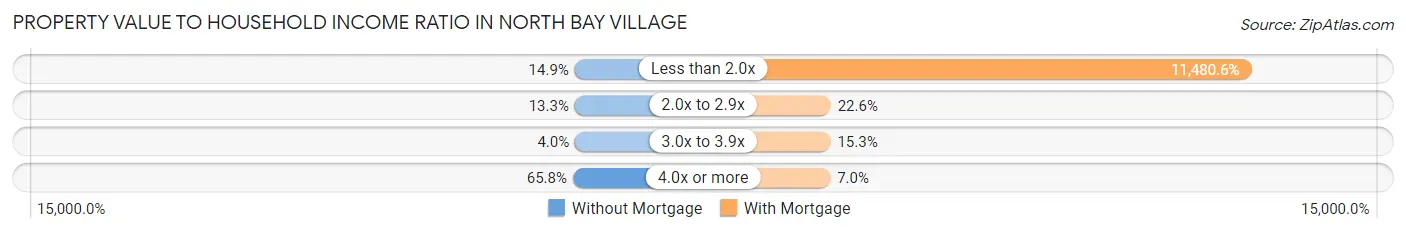
| Value-to-Income Ratio | Without Mortgage | With Mortgage |
| Less than 2.0x | 82 (14.9%) | 79,331 (11,480.6%) |
| 2.0x to 2.9x | 73 (13.3%) | 156 (22.6%) |
| 3.0x to 3.9x | 22 (4.0%) | 106 (15.3%) |
| 4.0x or more | 361 (65.8%) | 48 (7.0%) |
| Total | 549 (100.0%) | 691 (100.0%) |
Real Estate Taxes by Mortgage Status in North Bay Village
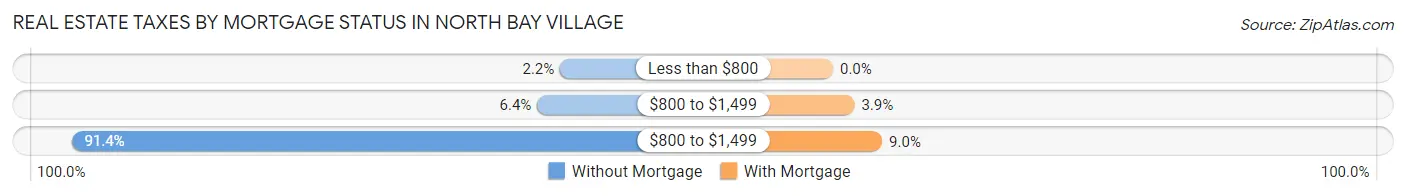
| Property Taxes | Without Mortgage | With Mortgage |
| Less than $800 | 12 (2.2%) | 0 (0.0%) |
| $800 to $1,499 | 35 (6.4%) | 27 (3.9%) |
| $800 to $1,499 | 502 (91.4%) | 62 (9.0%) |
| Total | 549 (100.0%) | 691 (100.0%) |
Health & Disability in North Bay Village
Health Insurance Coverage by Age in North Bay Village
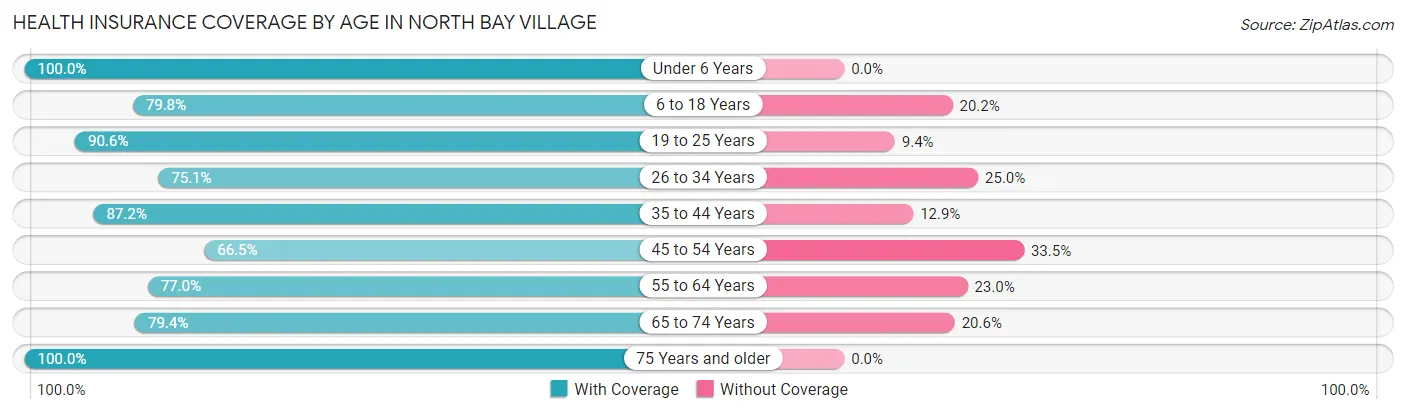
| Age Bracket | With Coverage | Without Coverage |
| Under 6 Years | 359 (100.0%) | 0 (0.0%) |
| 6 to 18 Years | 514 (79.8%) | 130 (20.2%) |
| 19 to 25 Years | 808 (90.6%) | 84 (9.4%) |
| 26 to 34 Years | 782 (75.0%) | 260 (24.9%) |
| 35 to 44 Years | 875 (87.2%) | 129 (12.9%) |
| 45 to 54 Years | 877 (66.5%) | 442 (33.5%) |
| 55 to 64 Years | 1,117 (77.0%) | 333 (23.0%) |
| 65 to 74 Years | 659 (79.4%) | 171 (20.6%) |
| 75 Years and older | 267 (100.0%) | 0 (0.0%) |
| Total | 6,258 (80.2%) | 1,549 (19.8%) |
Health Insurance Coverage by Citizenship Status in North Bay Village
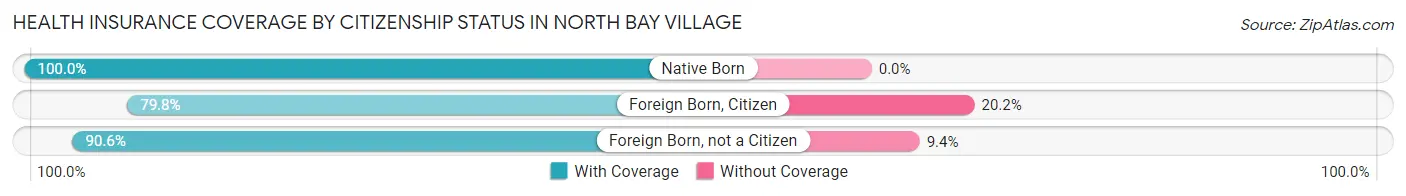
| Citizenship Status | With Coverage | Without Coverage |
| Native Born | 359 (100.0%) | 0 (0.0%) |
| Foreign Born, Citizen | 514 (79.8%) | 130 (20.2%) |
| Foreign Born, not a Citizen | 808 (90.6%) | 84 (9.4%) |
Health Insurance Coverage by Household Income in North Bay Village
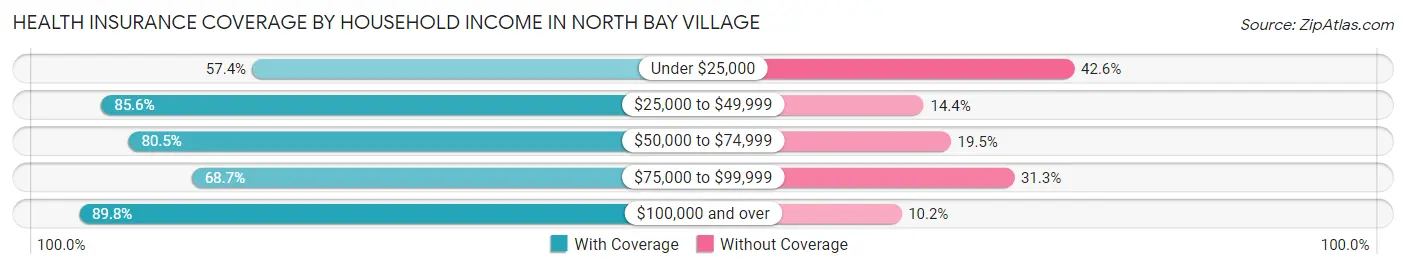
| Household Income | With Coverage | Without Coverage |
| Under $25,000 | 341 (57.4%) | 253 (42.6%) |
| $25,000 to $49,999 | 1,096 (85.6%) | 184 (14.4%) |
| $50,000 to $74,999 | 1,221 (80.5%) | 295 (19.5%) |
| $75,000 to $99,999 | 1,193 (68.7%) | 544 (31.3%) |
| $100,000 and over | 2,407 (89.8%) | 273 (10.2%) |
Public vs Private Health Insurance Coverage by Age in North Bay Village
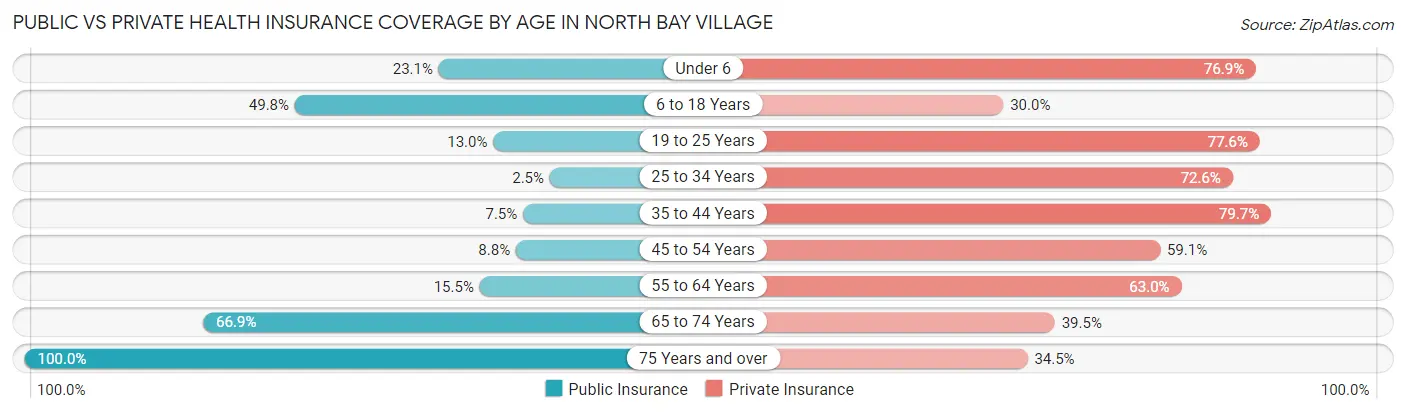
| Age Bracket | Public Insurance | Private Insurance |
| Under 6 | 83 (23.1%) | 276 (76.9%) |
| 6 to 18 Years | 321 (49.8%) | 193 (30.0%) |
| 19 to 25 Years | 116 (13.0%) | 692 (77.6%) |
| 25 to 34 Years | 26 (2.5%) | 756 (72.6%) |
| 35 to 44 Years | 75 (7.5%) | 800 (79.7%) |
| 45 to 54 Years | 116 (8.8%) | 779 (59.1%) |
| 55 to 64 Years | 225 (15.5%) | 914 (63.0%) |
| 65 to 74 Years | 555 (66.9%) | 328 (39.5%) |
| 75 Years and over | 267 (100.0%) | 92 (34.5%) |
| Total | 1,784 (22.9%) | 4,830 (61.9%) |
Disability Status by Sex by Age in North Bay Village
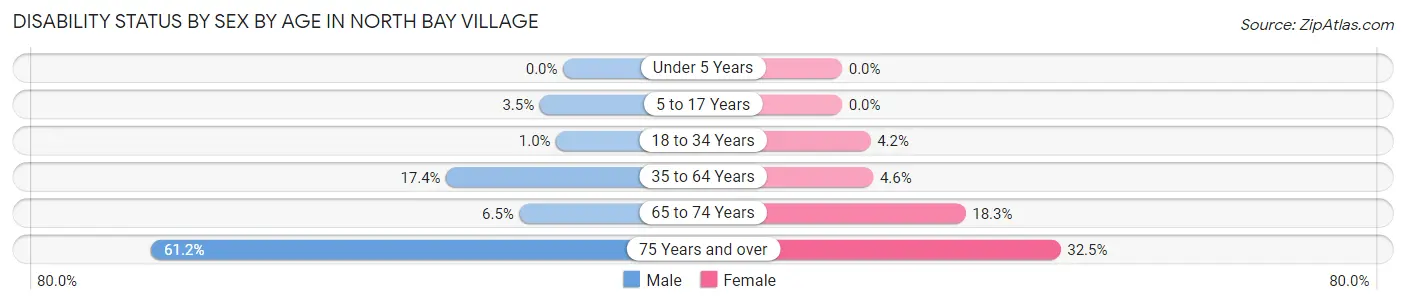
| Age Bracket | Male | Female |
| Under 5 Years | 0 (0.0%) | 0 (0.0%) |
| 5 to 17 Years | 12 (3.5%) | 0 (0.0%) |
| 18 to 34 Years | 8 (1.0%) | 49 (4.2%) |
| 35 to 64 Years | 351 (17.4%) | 81 (4.6%) |
| 65 to 74 Years | 28 (6.5%) | 73 (18.3%) |
| 75 Years and over | 71 (61.2%) | 49 (32.5%) |
Disability Class by Sex by Age in North Bay Village
Disability Class: Hearing Difficulty
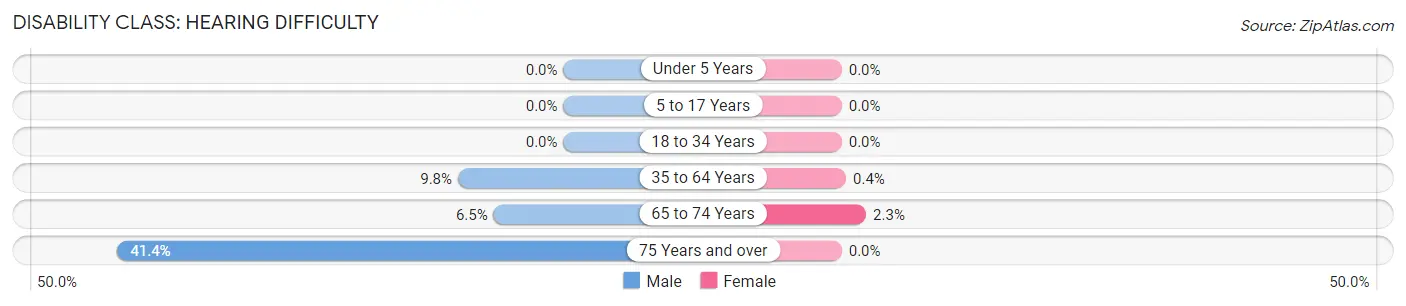
| Age Bracket | Male | Female |
| Under 5 Years | 0 (0.0%) | 0 (0.0%) |
| 5 to 17 Years | 0 (0.0%) | 0 (0.0%) |
| 18 to 34 Years | 0 (0.0%) | 0 (0.0%) |
| 35 to 64 Years | 198 (9.8%) | 7 (0.4%) |
| 65 to 74 Years | 28 (6.5%) | 9 (2.3%) |
| 75 Years and over | 48 (41.4%) | 0 (0.0%) |
Disability Class: Vision Difficulty
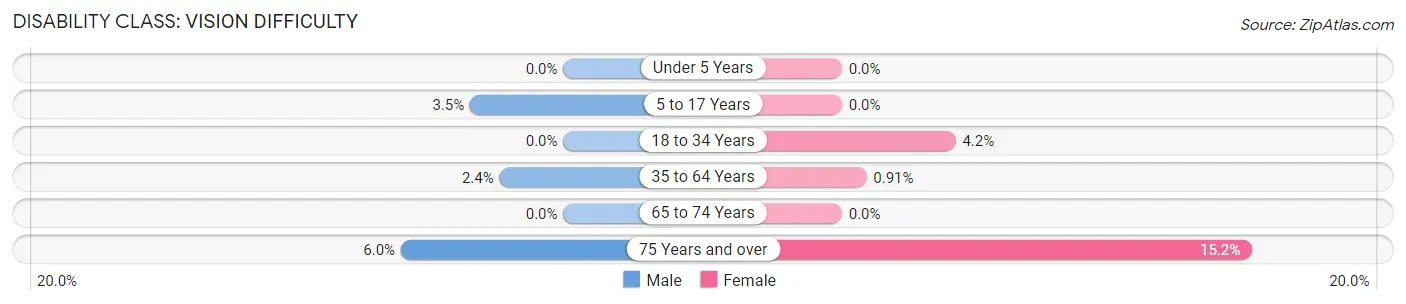
| Age Bracket | Male | Female |
| Under 5 Years | 0 (0.0%) | 0 (0.0%) |
| 5 to 17 Years | 12 (3.5%) | 0 (0.0%) |
| 18 to 34 Years | 0 (0.0%) | 49 (4.2%) |
| 35 to 64 Years | 48 (2.4%) | 16 (0.9%) |
| 65 to 74 Years | 0 (0.0%) | 0 (0.0%) |
| 75 Years and over | 7 (6.0%) | 23 (15.2%) |
Disability Class: Cognitive Difficulty
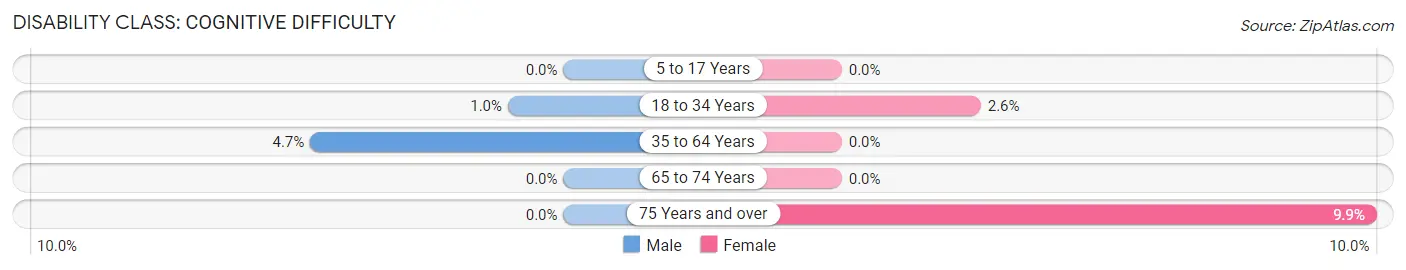
| Age Bracket | Male | Female |
| 5 to 17 Years | 0 (0.0%) | 0 (0.0%) |
| 18 to 34 Years | 8 (1.0%) | 30 (2.6%) |
| 35 to 64 Years | 95 (4.7%) | 0 (0.0%) |
| 65 to 74 Years | 0 (0.0%) | 0 (0.0%) |
| 75 Years and over | 0 (0.0%) | 15 (9.9%) |
Disability Class: Ambulatory Difficulty
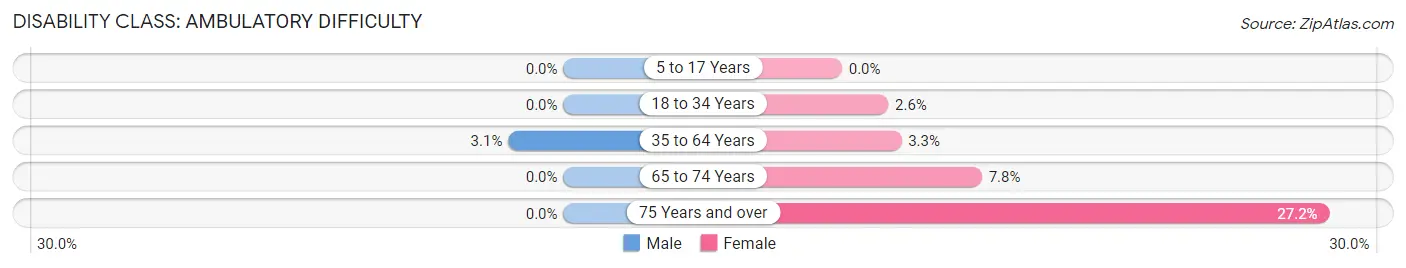
| Age Bracket | Male | Female |
| 5 to 17 Years | 0 (0.0%) | 0 (0.0%) |
| 18 to 34 Years | 0 (0.0%) | 30 (2.6%) |
| 35 to 64 Years | 62 (3.1%) | 58 (3.3%) |
| 65 to 74 Years | 0 (0.0%) | 31 (7.8%) |
| 75 Years and over | 0 (0.0%) | 41 (27.2%) |
Disability Class: Self-Care Difficulty
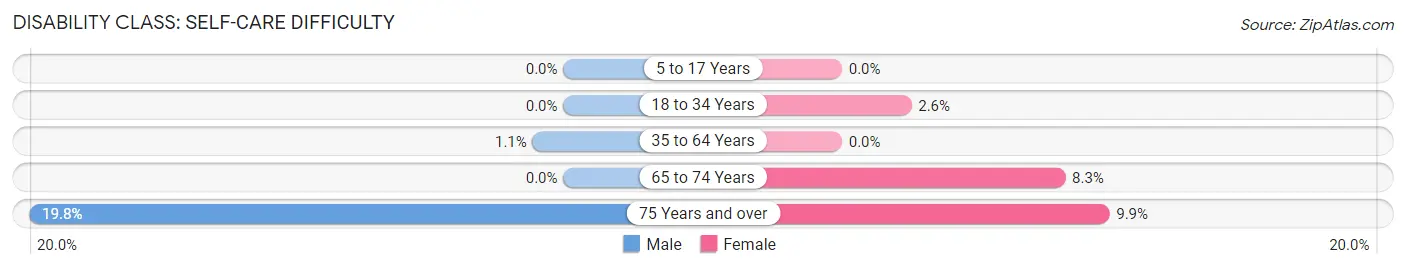
| Age Bracket | Male | Female |
| 5 to 17 Years | 0 (0.0%) | 0 (0.0%) |
| 18 to 34 Years | 0 (0.0%) | 30 (2.6%) |
| 35 to 64 Years | 23 (1.1%) | 0 (0.0%) |
| 65 to 74 Years | 0 (0.0%) | 33 (8.3%) |
| 75 Years and over | 23 (19.8%) | 15 (9.9%) |
Technology Access in North Bay Village
Computing Device Access in North Bay Village
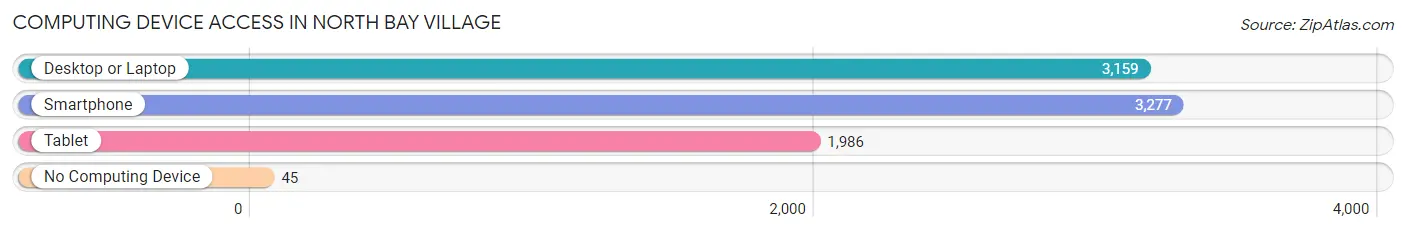
| Device Type | # Households | % Households |
| Desktop or Laptop | 3,159 | 93.0% |
| Smartphone | 3,277 | 96.5% |
| Tablet | 1,986 | 58.5% |
| No Computing Device | 45 | 1.3% |
| Total | 3,395 | 100.0% |
Internet Access in North Bay Village
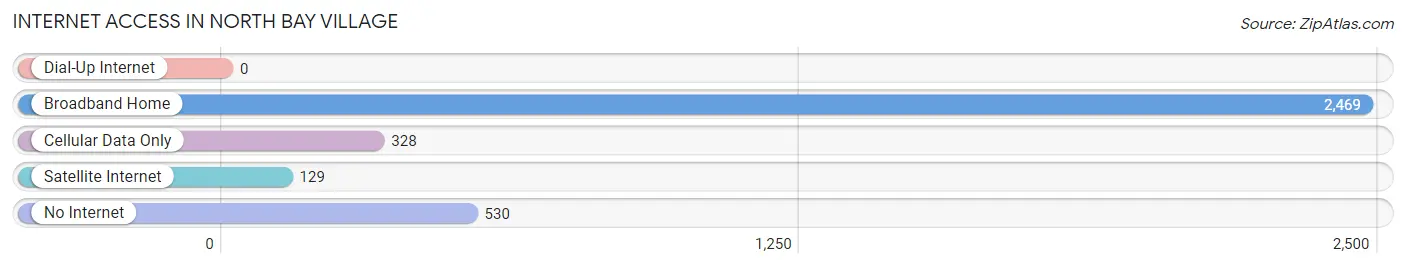
| Internet Type | # Households | % Households |
| Dial-Up Internet | 0 | 0.0% |
| Broadband Home | 2,469 | 72.7% |
| Cellular Data Only | 328 | 9.7% |
| Satellite Internet | 129 | 3.8% |
| No Internet | 530 | 15.6% |
| Total | 3,395 | 100.0% |
North Bay Village Summary
North Bay Village is a small city located in Miami-Dade County, Florida. It is situated between the cities of Miami and Miami Beach, and is bordered by Biscayne Bay to the east. The city is comprised of three islands, North Bay Island, Harbor Island, and Treasure Island, and is home to approximately 6,700 residents.
History
North Bay Village was originally inhabited by the Tequesta Indians, who were the first Native American tribe to inhabit the area. The Tequesta Indians were a peaceful tribe that lived off the land and the bounty of the sea. They were known for their fishing and hunting skills, and were also skilled in pottery and basket weaving.
In the late 1800s, the area was developed by a group of developers from New York, who built a series of canals and bridges to connect the three islands. The developers named the area North Bay Village, and it quickly became a popular destination for tourists and locals alike.
In the early 1900s, the area was further developed with the construction of a number of hotels, restaurants, and other businesses. The area was also home to a number of celebrities, including Al Capone, who owned a home on North Bay Island.
In the 1950s, the area was further developed with the construction of a number of high-rise buildings, including the iconic Fontainebleau Hotel. The area also became a popular destination for celebrities, including Frank Sinatra, who owned a home on North Bay Island.
In the 1970s, the area was further developed with the construction of a number of condominiums and apartment buildings. The area also became a popular destination for retirees, and the population of North Bay Village began to grow.
Geography
North Bay Village is located in Miami-Dade County, Florida. It is situated between the cities of Miami and Miami Beach, and is bordered by Biscayne Bay to the east. The city is comprised of three islands, North Bay Island, Harbor Island, and Treasure Island.
The city has a total area of 1.2 square miles, all of which is land. The city is located at an elevation of 6 feet above sea level.
Economy
The economy of North Bay Village is largely based on tourism and real estate. The city is home to a number of hotels, restaurants, and other businesses that cater to tourists and locals alike. The city is also home to a number of condominiums and apartment buildings, which provide housing for both tourists and locals.
The city is also home to a number of marinas, which provide docking and storage for boats and other watercraft. The city is also home to a number of boat repair and maintenance businesses.
Demographics
As of the 2010 census, the population of North Bay Village was 6,719. The population is comprised of a diverse mix of ethnicities, including White (54.2%), Hispanic or Latino (25.2%), African American (14.2%), and Asian (3.2%).
The median household income in North Bay Village is $41,945, and the median family income is $50,945. The per capita income in North Bay Village is $25,945.
Conclusion
North Bay Village is a small city located in Miami-Dade County, Florida. It is situated between the cities of Miami and Miami Beach, and is bordered by Biscayne Bay to the east. The city is comprised of three islands, North Bay Island, Harbor Island, and Treasure Island, and is home to approximately 6,700 residents. The economy of North Bay Village is largely based on tourism and real estate, and the population is comprised of a diverse mix of ethnicities.
Common Questions
What is Per Capita Income in North Bay Village?
Per Capita income in North Bay Village is $40,567.
What is the Median Family Income in North Bay Village?
Median Family Income in North Bay Village is $68,594.
What is the Median Household income in North Bay Village?
Median Household Income in North Bay Village is $76,815.
What is Income or Wage Gap in North Bay Village?
Income or Wage Gap in North Bay Village is 34.6%.
Women in North Bay Village earn 65.4 cents for every dollar earned by a man.
What is Family Income Deficit in North Bay Village?
Family Income Deficit in North Bay Village is $7,208.
Families that are below poverty line in North Bay Village earn $7,208 less on average than the poverty threshold level.
What is Inequality or Gini Index in North Bay Village?
Inequality or Gini Index in North Bay Village is 0.39.
What is the Total Population of North Bay Village?
Total Population of North Bay Village is 8,024.
What is the Total Male Population of North Bay Village?
Total Male Population of North Bay Village is 4,031.
What is the Total Female Population of North Bay Village?
Total Female Population of North Bay Village is 3,993.
What is the Ratio of Males per 100 Females in North Bay Village?
There are 100.95 Males per 100 Females in North Bay Village.
What is the Ratio of Females per 100 Males in North Bay Village?
There are 99.06 Females per 100 Males in North Bay Village.
What is the Median Population Age in North Bay Village?
Median Population Age in North Bay Village is 45.3 Years.
What is the Average Family Size in North Bay Village
Average Family Size in North Bay Village is 2.8 People.
What is the Average Household Size in North Bay Village
Average Household Size in North Bay Village is 2.3 People.
How Large is the Labor Force in North Bay Village?
There are 5,341 People in the Labor Forcein in North Bay Village.
What is the Percentage of People in the Labor Force in North Bay Village?
75.1% of People are in the Labor Force in North Bay Village.
What is the Unemployment Rate in North Bay Village?
Unemployment Rate in North Bay Village is 4.3%.