Zip Codes with the Highest Percentage of Population with a Degree in Liberal Arts and History in Winchester, VA
RELATED REPORTS & OPTIONS
Liberal Arts and History
Winchester
Compare Zip Codes
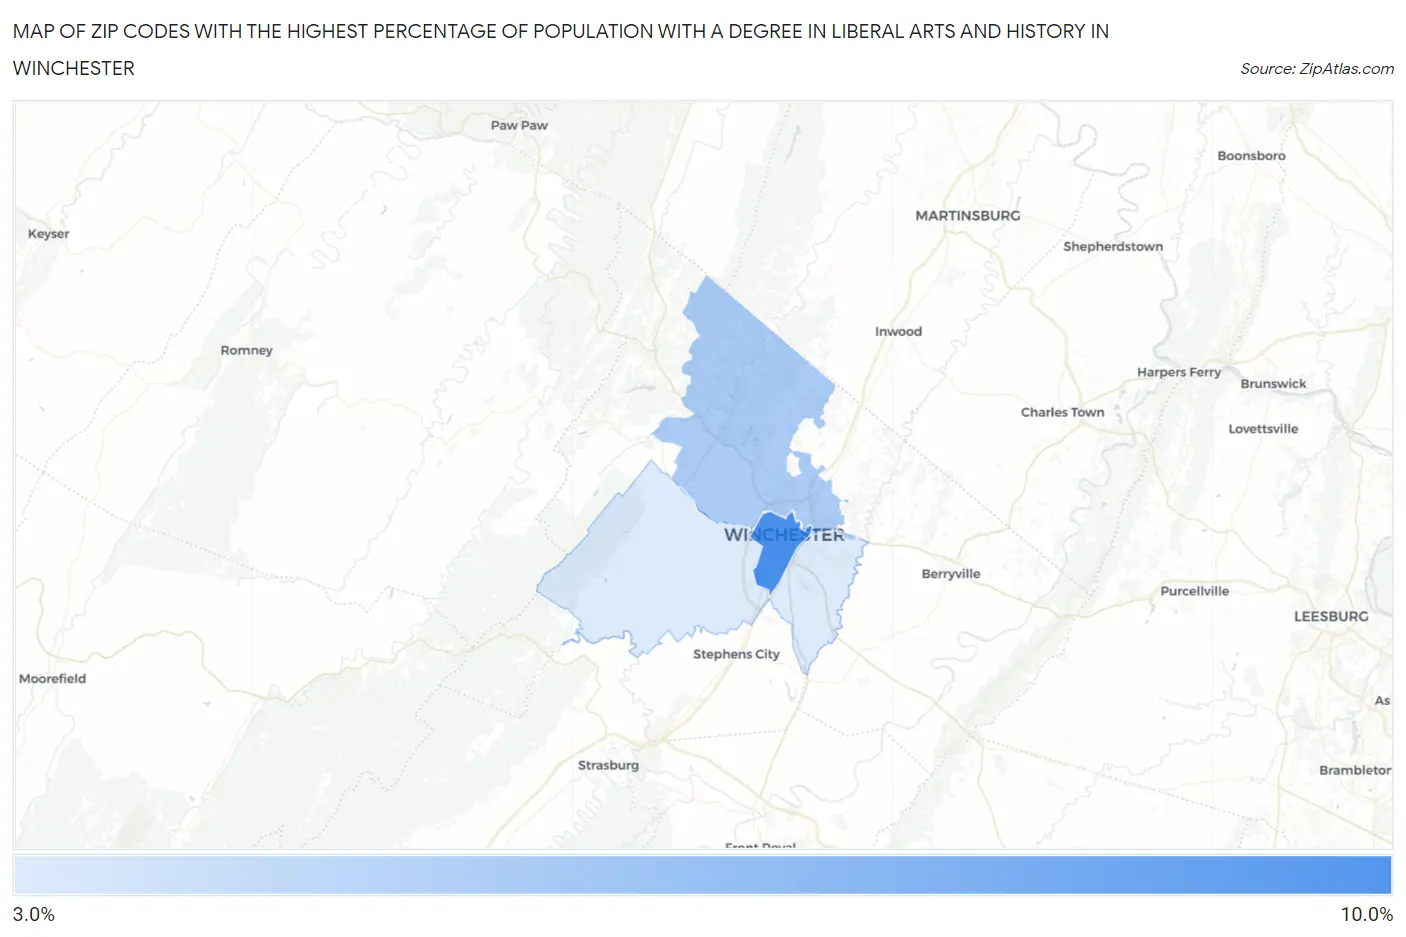
Map of Zip Codes with the Highest Percentage of Population with a Degree in Liberal Arts and History in Winchester
3.6%
8.7%
Zip Codes with the Highest Percentage of Population with a Degree in Liberal Arts and History in Winchester, VA
| Zip Code | % Graduates | vs State | vs National | |
| 1. | 22601 | 8.7% | 5.9%(+2.89)#169 | 4.9%(+3.87)#4,083 |
| 2. | 22603 | 5.3% | 5.9%(-0.547)#387 | 4.9%(+0.436)#10,413 |
| 3. | 22602 | 3.6% | 5.9%(-2.24)#525 | 4.9%(-1.26)#16,209 |
1
Common Questions
What are the Top Zip Codes with the Highest Percentage of Population with a Degree in Liberal Arts and History in Winchester, VA?
Top Zip Codes with the Highest Percentage of Population with a Degree in Liberal Arts and History in Winchester, VA are:
What zip code has the Highest Percentage of Population with a Degree in Liberal Arts and History in Winchester, VA?
22601 has the Highest Percentage of Population with a Degree in Liberal Arts and History in Winchester, VA with 8.7%.
What is the Percentage of Population with a Degree in Liberal Arts and History in Winchester, VA?
Percentage of Population with a Degree in Liberal Arts and History in Winchester is 9.1%.
What is the Percentage of Population with a Degree in Liberal Arts and History in Virginia?
Percentage of Population with a Degree in Liberal Arts and History in Virginia is 5.9%.
What is the Percentage of Population with a Degree in Liberal Arts and History in the United States?
Percentage of Population with a Degree in Liberal Arts and History in the United States is 4.9%.